Embed Size (px)
Citation preview

UNIVERS ITY AT BUFFALO FOUNDATION, INC .
ANNUAL REPORT
2001-2002
Foundation 11/6/02 9:17 AM Page 1
FINANCIAL REPORT 2001/2002 |2
Dear Friends:
As this report is being prepared for publication, we enter thefinal phase of The Campaign for UB: Generation to Generation.Two years ago this fall, we publicly launched a campaign whosegoal and scope were unparalleled in the history of UB and thehistory of the State University of New York system. Now wehead into the home stretch, having reached over 80% of our$250 million goal, and with every confidence that we willmeet and exceed that ambitious mark.
Thomas Jefferson once said, “A nation that rests on the will of the people must also depend on individuals to support itsinstitutions in whatever ways are appropriate if it is to flourish.” The Campaign for UB is flourishing because of thededicated service of its volunteer leadership team, the schooland program-based campaign chairs, and all of the other alumni and friends who have committed their time and talents on behalf of the campaign.
At the UB Foundation, we pledge our continuingsupport of The Campaign for UB and the university’songoing programs and activities through wise stewardship of the resources
entrusted to our care. The UBFoundation is fortunate to enjoy theactive and focused engagement of itsboard of trustees, who represent awide variety of professions, and whoapply their expertise to such objec-tives as expanding student scholarship programs, facilitating faculty researchendeavors, and enriching the qualityof student life. Our volunteers’ generous commitment of their energy,time, and skill has achieved tangibleresults, which have earned widespreadrecognition. In summer 2002, forexample, the UB Foundation wasnamed by Moody’s InvestmentServices in a best practice case studyfor its guidance and assistance in theconstruction of on-campus student apartments. In all of our efforts, themembers of the foundation aspire toperform our best on behalf of UB.
The University at Buffalo concluded the 20th century with a decade of dynamic change. With the support of volunteers,alumni, and friends, The Campaign for UB positions the university to continue on this path of innovation and accomplishment towards an even more extraordinary future.Our sincere thanks to all of you whose generosity and servicehelp to make that future a reality.
Sincerely,R E G I N A L D B . N E W M A N I IPresident, NOCO Energy Corp.
Chair of the UBF Board of Trustees
Foundation 11/6/02 9:17 AM Page 2
FINANCIAL REPORT 2001/2002 |3
Dear Alumni and Friends of the University at Buffalo:
The University at Buffalo is changing dramaticallyeach year, continuing to evolve as the StateUniversity of New York’s comprehensive flagshipinstitution. But the scope of our University atBuffalo community can’t simply be measured by the size of our student population, the number ofour buildings, programs, and facilities, or the spaceoccupied by our two campuses. The real measure of UB is determined by our impact on the communities we serve, and, ultimately, by the lives we change through our partnerships with other research, education, and business institutionsin our region.
As the largest and most comprehensive publicresearch university in New York State, UB is
committed to public outreach, which begins with our immediate Buffalo-Niagara region and ultimately extends toour global community. UB’s economic impact is a key index to our role in the communities we serve. In Western New Yorkalone, our university fuels over a billion dollars in economicactivity each year.
One vital area of growth, for example,is our leadership in the emerging fieldof bioinformatics, which focuses onthe analysis of biological data at the molecular level to developrevolutionary methods of gene-based disease diagnosis, treat-ment, and drug therapy. Our bioinformatics initiatives alsooffer an excellent example of the educational, research andbusiness partnerships that make UB strong—and help us toshare our strengths to benefit the larger communities we serve. As you will see, these and other initiatives at UB are changing not only our university, but our region for the better, and achieving significant results at the state, national, and international levels as well.
Your support for our university community through The Campaign for UB: Generation to Generation helps us continue to strive for greater excellence in all that we do atUB. The following report offers an overview of the exciting developments that have taken place at our university over the past year, as well as insight into the less tangible ideas and resources that make UB’s continued growth possible. We are grateful for the support of our university alumni andfriends who have made these achievements possible, and welook forward to continuing to work with you to build on theseaccomplishments in the years ahead.
Sincerely, W I L L I A M R . G R E I N E RPresident, University at Buffalo
President, University at Buffalo
Foundation 11/6/02 9:17 AM Page 3
FINANCIAL REPORT 2001/2002 |4
Dear Friends,
This past year was one of powerful events, significantchallenges and tremendous changes, not only for ouruniversity, but for the world. While the events ofSeptember 11 are more than a year old, their impactstill remains. The world has changed dramatically, ashave our university and the communities in which we live. While some of these changes are a reflectionof global events, UB has also aggressively pursued dramatic change—marked by some of its most significant accomplishments, further fueling the university’s growing prominence and stature.
During the past decade, through strategic planningand innovative leadership, the University at Buffalohas emerged as one of the nation’s best research-intensive public universities, while also being a leaderin its missions of teaching and public service. Thechange at UB has encompassed dramatic scientific discoveries, striking physical improvements to thecampus, innovative teaching technologies, andimproved measures of student quality. And UB’s transformation on campus is acting as a catalyst forfurther transformation of our region. Accomplishments
featured in this report point to the renewed promise of vitalityfor our local community, the State of New York and the nation.
In large measure, the vision for UB continues to become areality thanks to the thousands of alumni and friends who support the university’s achievements through their donationsto The Campaign for UB:Generation to Generation.UB has a creative and ambi-tious agenda, and we expectmany new opportunities andchallenges as we strive to balance tradition with the opportunity to sustain our excellence well into the future. Each gift mentioned in thisreport is an important contribution to UB’s journey towardcontinued success. These gifts are a vote of confidence for theincredibly talented faculty and staff, and the high standards of education that this university embraces.
In times of uncertainty, your continued generosity helps theUniversity at Buffalo remain anchored in excellence. We knowthat the university’s ambitious agenda will require even greatersupport from alumni and friends. The university is truly on thebrink of greatness and now, more than ever, we must be poisedto support its drive for success. As alumni and friends, we havebeen part of its history and we must be dedicated to being partof its future. On behalf of the leadership of The Campaign forUB: Generation to Generation, you have my deepest apprecia-tion for your continued confidence in UB’s future and supportof this outstanding, world-class institution.
Sincerely,J E R E M Y M . J A C O B SChairman and CEO, Delaware North Companies, Inc.
Chair of the UB Council and Honorary Co-Chair of The Campaign for UB: Generation to Generation
Foundation 11/6/02 9:17 AM Page 4

FINANCIAL REPORT 2001/2002 |5
The trustees and directors of the University at Buffalo Foundation,Inc., are selected for their distinguished achievements in business,industry, and the professions, as well as for their commitment to theadvancement of the university. They provide advice and counsel, while helping present the university’s needs to the larger political and business communities. The trustees and directors also oversee the foundation’s operating investment policies, and approve all budgets and major expenditures of the foundation.
2001-2002
Foundation BoardBoard of Trustees
William R. GreinerPresidentUniversity at Buffalo
Reginald B. Newman IIChair, Board of TrusteesPresidentNOCO Energy Corp.
Sal H. AlfieroChairman & ChiefExecutive Officer Protective Industries,LLC
Dianne Bennett, Esq. ’75Co-ChairHodgson, Russ LLP
Robert T. BradyPresident & ChiefExecutive OfficerMoog, Inc.
William M. E. ClarksonFormer Chairman andChief Executive OfficerGraphic ControlsCorporation
Mark J. Czarnecki ’77Executive Vice President M&T InvestmentGroup, M&T Bank
Beverly Foit-Albert ’75PresidentFoit-Albert Associates,P.C.
Mark E. HamisterChairman & ChiefExecutive OfficerNational Health CareAffiliates, Inc.
Marsha S. Henderson ’73PresidentKey Bank, N.A.
Jeremy M. Jacobs ’60Chairman & ChiefExecutive OfficerDelaware NorthCompanies, Inc.
Luiz F. KahlPresidentThe Vector Group, LLC
Ross B. KenzieRetired ChairmanGoldome
Northrup R. Knox, Jr.PrincipalNoonmark Capital
Jordan A. Levy ’77Managing PartnerSeed Capital Partners
Frank J. McGuire ’53ChairmanThe McGuire Group
William L. McHugh ’79Executive Vice President Independent Health Corp.
Delbert W. Mullens ‘74PresidentWesley Industries
Jonathan W. ReynoldsSenior Vice President HSBC Bank USA
Arthur A. Russ, Jr., Esq. ’67 PartnerPhillips, Lytle,Hitchcock, Blaine and Huber LLP
Ronald M. Schreiber ’75ChairmanReciprocal, Inc.
Barry M. Snyder ’91Tuxedo Junction
John N. Walsh IIIChairman & ChiefExecutive OfficerWalsh DuffieldCompanies, Inc.
Elizabeth D. Capaldi,Ph. D.ProvostUniversity at Buffalo
Jennifer A. McDonoughVice President forUniversity AdvancementUniversity at Buffalo
Edward P. Schneider ’80Executive DirectorUniversity at BuffaloFoundation, Inc.
Robert J. Wagner ’67Senior Vice PresidentUniversity at BuffaloN
on-V
otin
g
Foundation 11/6/02 9:17 AM Page 5

FINANCIAL REPORT 2001/2002 |6
Sheldon M. BerlowChairmanBerlow Real Estate, Inc.
Lawrence P. CastellaniCEO Advance Auto Parts
Paul F. Ciminelli ’87PresidentCiminelli DevelopmentCompany, Inc.
Richard E. Heath, Esq.Hodgson, Russ LLP
Stephen S. Marks ’65PresidentSilhouette Hanover Direct
2001-2002
FoundationBoardTrustees Emeriti
2001-2002
Foundation BoardBoard of Directors
Melissa W. Banta, Ph.D. ‘66
Randall I. Benderson‘79
Ellen E. Grant Bishop,Ph.D. ‘79
Frank L. Ciminelli Pasquale A. Greco, MD ‘41
Howard L. Meyer II, JD ‘56
Louis R. Reif ‘48 Robert E. Rich, Jr. William I. Schapiro,Esq.
Philip B. Wels, MD ‘41Girard A. Gugino, DDS ‘61
Gerald S. Lippes, Esq. ‘64
Foundation 11/6/02 9:17 AM Page 6
FINANCIAL REPORT 2001/2002 |7
Officers 2 0 0 1 - 2 0 0 2
Mission Statement
The mission of the University at Buffalo
Foundation, Inc., is to support and promote
the activities and programs of the University
at Buffalo, State University of New York.
This is accomplished by providing advice and
counsel regarding philanthropy and fund
raising, managing gifts and grants on behalf
of the university, providing a wide range of
financial services for the various units of
the university, developing and managing
real property on behalf of the university,
and providing a strong base of private-
sector support for the university
through the foundation’s
trustees and directors.
Reginald B. Newman II, Chair
John N. Walsh III, Vice Chair
Richard E. Heath, Secretary
William L. McHugh, Treasurer
Importance to the University at BuffaloWith the University at Buffalo in the ranks of the nation’s leading institutions, the strongsupport of private philanthropy is increasinglyimportant. In the years ahead, the foundationwill become an even more vital link betweenthe university and the many sources of private gifts.
The quality and intensity of effort put forth by the foundation’s trustees and directors willalso remain crucial, especially in light of theincreasing level of endowments and otherforms of philanthropic support coming to theuniversity. The oversight of the trustees anddirectors will continue to reassure donors that the funds entrusted to the university are managed with the utmost regard for fiscal prudence and fiduciary responsibility.
The Portfolio and Its ManagementAt June 30, 2002, the market value for total investments of the University atBuffalo Foundation amounted to $222.7 million, as compared to $233.3 million in2001. These funds are managed under the supervision of the foundation’s trusteeinvestment committee. Sixteen professional investment managers currently sharein the administration of the portfolio, with performance monitored by the trustees.Included in this total are certain investments, known as the Endowment Portfolio,having a market value of $187.9 million at June 30, 2002, which are managed andadministered on a pooled basis.
Investment StrategyThe primary investment objective is to maximize total investment return whilepreserving the inflation-adjusted purchasing power of the portfolio. This shouldprovide a relatively predictable, constant and stable (in real terms) stream of funds for current use. Total investment return is the sum of interest, dividends and capital appreciation.
JUNE 30, 2002I N V E S T M E N T P E R F O R M A N C E A N D P O L I C I E S
Foundation 11/6/02 9:17 AM Page 7
FINANCIAL REPORT 2001/2002 |8
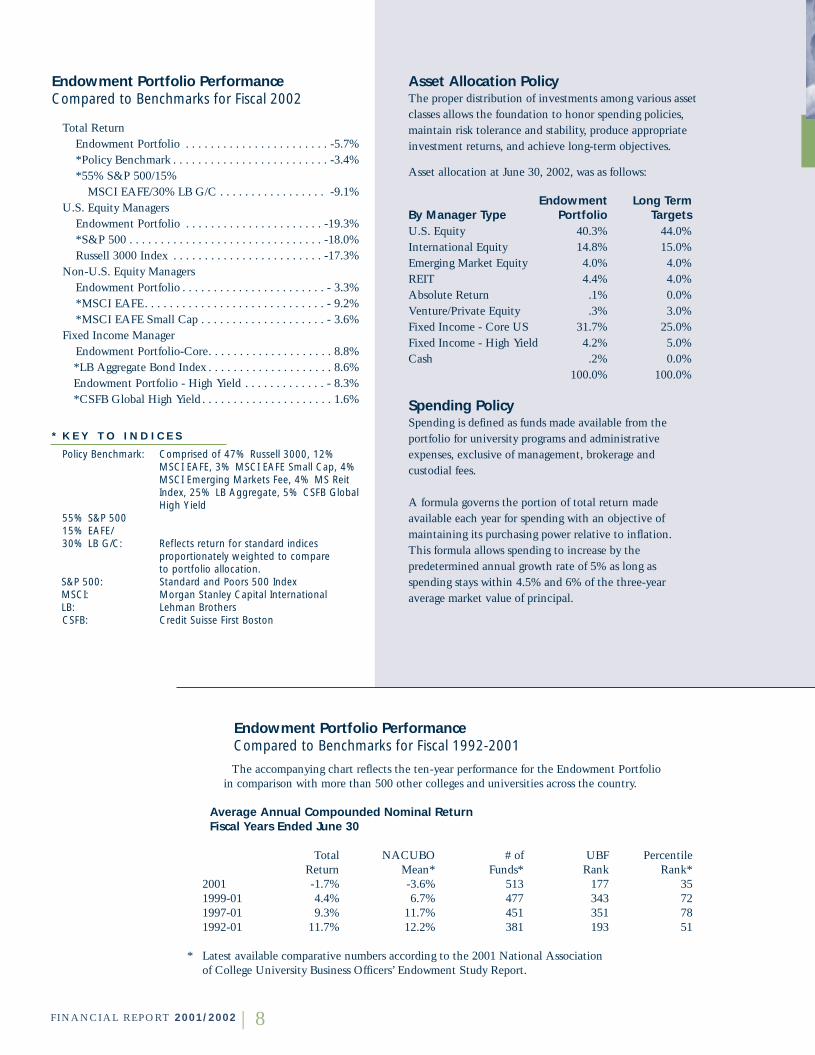
Asset Allocation PolicyThe proper distribution of investments among various assetclasses allows the foundation to honor spending policies,maintain risk tolerance and stability, produce appropriateinvestment returns, and achieve long-term objectives.
Asset allocation at June 30, 2002, was as follows:
Endowment Long TermBy Manager Type Portfolio TargetsU.S. Equity 40.3% 44.0%International Equity 14.8% 15.0%Emerging Market Equity 4.0% 4.0%REIT 4.4% 4.0%Absolute Return .1% 0.0%Venture/Private Equity .3% 3.0%Fixed Income - Core US 31.7% 25.0%Fixed Income - High Yield 4.2% 5.0%Cash .2% 0.0%
100.0% 100.0%
Spending PolicySpending is defined as funds made available from the portfolio for university programs and administrativeexpenses, exclusive of management, brokerage and custodial fees.
A formula governs the portion of total return made available each year for spending with an objective of maintaining its purchasing power relative to inflation.This formula allows spending to increase by the predetermined annual growth rate of 5% as long as spending stays within 4.5% and 6% of the three-year average market value of principal.
Endowment Portfolio Performance Compared to Benchmarks for Fiscal 2002
Total ReturnEndowment Portfolio . . . . . . . . . . . . . . . . . . . . . . . -5.7%*Policy Benchmark . . . . . . . . . . . . . . . . . . . . . . . . . -3.4% *55% S&P 500/15%
MSCI EAFE/30% LB G/C . . . . . . . . . . . . . . . . . -9.1%U.S. Equity Managers
Endowment Portfolio . . . . . . . . . . . . . . . . . . . . . . -19.3%*S&P 500 . . . . . . . . . . . . . . . . . . . . . . . . . . . . . . . -18.0%Russell 3000 Index . . . . . . . . . . . . . . . . . . . . . . . . -17.3%
Non-U.S. Equity ManagersEndowment Portfolio . . . . . . . . . . . . . . . . . . . . . . . - 3.3%*MSCI EAFE. . . . . . . . . . . . . . . . . . . . . . . . . . . . . - 9.2%*MSCI EAFE Small Cap . . . . . . . . . . . . . . . . . . . . - 3.6%
Fixed Income ManagerEndowment Portfolio-Core. . . . . . . . . . . . . . . . . . . . 8.8%*LB Aggregate Bond Index . . . . . . . . . . . . . . . . . . . . 8.6%Endowment Portfolio - High Yield . . . . . . . . . . . . . - 8.3%*CSFB Global High Yield . . . . . . . . . . . . . . . . . . . . . 1.6%
* K E Y T O I N D I C E S
Policy Benchmark: Comprised of 47% Russell 3000, 12%MSCI EAFE, 3% MSCI EAFE Small Cap, 4%MSCI Emerging Markets Fee, 4% MS ReitIndex, 25% LB Aggregate, 5% CSFB GlobalHigh Yield
55% S&P 50015% EAFE/ 30% LB G/C: Reflects return for standard indices
proportionately weighted to compare to portfolio allocation.
S&P 500: Standard and Poors 500 IndexMSCI: Morgan Stanley Capital InternationalLB: Lehman BrothersCSFB: Credit Suisse First Boston
Endowment Portfolio Performance Compared to Benchmarks for Fiscal 1992-2001
The accompanying chart reflects the ten-year performance for the Endowment Portfolio in comparison with more than 500 other colleges and universities across the country.
Average Annual Compounded Nominal ReturnFiscal Years Ended June 30
Total NACUBO # of UBF PercentileReturn Mean* Funds* Rank Rank*
2001 -1.7% -3.6% 513 177 351999-01 4.4% 6.7% 477 343 721997-01 9.3% 11.7% 451 351 781992-01 11.7% 12.2% 381 193 51
* Latest available comparative numbers according to the 2001 National Associationof College University Business Officers’ Endowment Study Report.
Foundation 11/6/02 9:17 AM Page 8

FINANCIAL REPORT 2001/2002 |9
Independent Auditors’ Report
The Board of TrusteesUniversity at Buffalo Foundation, Inc.:
We have audited the accompanying consolidated statements of financial position of
University at Buffalo Foundation, Inc. and affiliates (the Foundation) as of June 30,
2002 and 2001, and the related consolidated statements of activities, and cash flows
for the years then ended. These consolidated financial statements are the responsibility
of the Foundation’s management. Our responsibility is to express an opinion on these
consolidated financial statements based on our audits.
We conducted our audits in accordance with auditing standards generally accepted in
the United States of America. Those standards require that we plan and perform the
audit to obtain reasonable assurance about whether the financial statements are free of
material misstatement. An audit includes examining, on a test basis, evidence support-
ing the amounts and disclosures in the financial statements. An audit also includes
assessing the accounting principles used and significant estimates made by manage-
ment, as well as evaluating the overall financial statement presentation. We believe
that our audits provide a reasonable basis for our opinion.
In our opinion, the consolidated financial statements referred to above present fairly,
in all material respects, the financial position of University at Buffalo Foundation, Inc.
and affiliates as of June 30, 2002 and 2001, and the changes in their net assets and
their cash flows for the years then ended in conformity with accounting principles
generally accepted in the United States of America.
August 16, 2002, except for note 9, which is as of August 31, 2002
Foundation 11/6/02 9:17 AM Page 9
FINANCIAL REPORT 2001/2002 |10
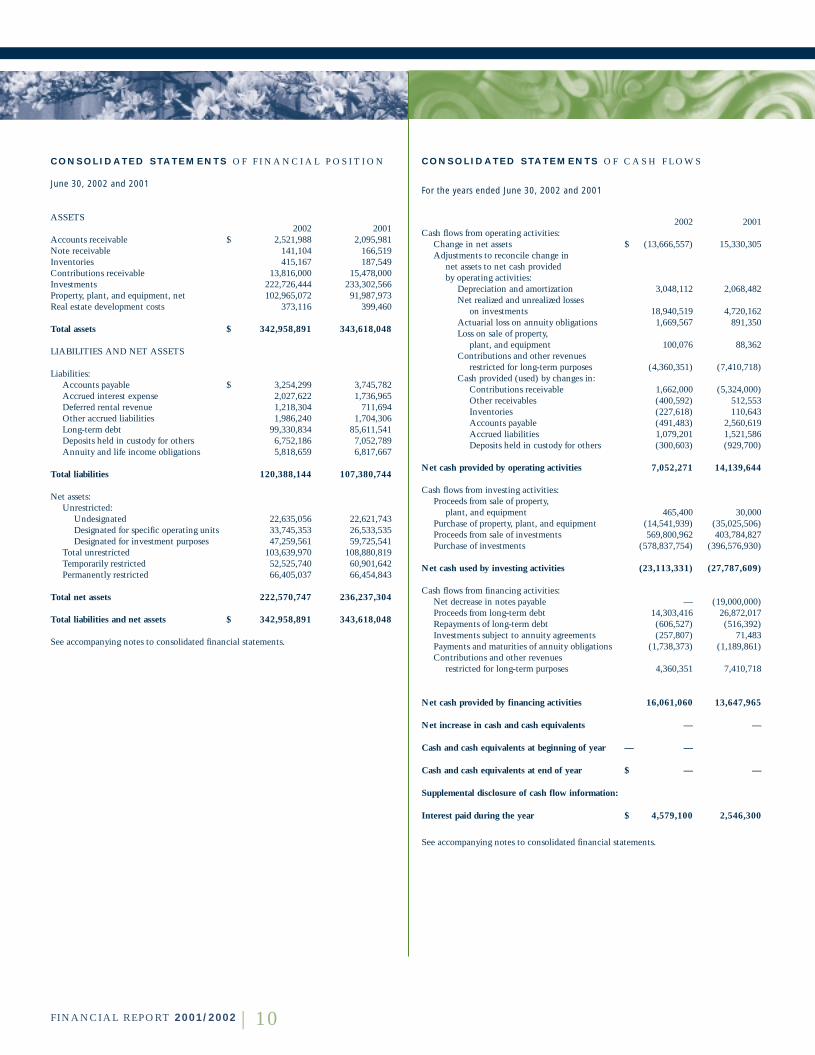
C O N S O L I D AT E D S TAT E M E N T S O F C A S H F L O W S
For the years ended June 30, 2002 and 2001
2002 2001Cash flows from operating activities:
Change in net assets $ (13,666,557) 15,330,305Adjustments to reconcile change in
net assets to net cash provided by operating activities:
Depreciation and amortization 3,048,112 2,068,482Net realized and unrealized losses
on investments 18,940,519 4,720,162Actuarial loss on annuity obligations 1,669,567 891,350Loss on sale of property,
plant, and equipment 100,076 88,362Contributions and other revenues
restricted for long-term purposes (4,360,351) (7,410,718) Cash provided (used) by changes in:
Contributions receivable 1,662,000 (5,324,000) Other receivables (400,592) 512,553Inventories (227,618) 110,643Accounts payable (491,483) 2,560,619Accrued liabilities 1,079,201 1,521,586Deposits held in custody for others (300,603) (929,700)
Net cash provided by operating activities 7,052,271 14,139,644
Cash flows from investing activities:Proceeds from sale of property,
plant, and equipment 465,400 30,000Purchase of property, plant, and equipment (14,541,939) (35,025,506) Proceeds from sale of investments 569,800,962 403,784,827Purchase of investments (578,837,754) (396,576,930)
Net cash used by investing activities (23,113,331) (27,787,609)
Cash flows from financing activities:Net decrease in notes payable — (19,000,000) Proceeds from long-term debt 14,303,416 26,872,017Repayments of long-term debt (606,527) (516,392) Investments subject to annuity agreements (257,807) 71,483Payments and maturities of annuity obligations (1,738,373) (1,189,861) Contributions and other revenues
restricted for long-term purposes 4,360,351 7,410,718
Net cash provided by financing activities 16,061,060 13,647,965
Net increase in cash and cash equivalents — —
Cash and cash equivalents at beginning of year — —
Cash and cash equivalents at end of year $ — —
Supplemental disclosure of cash flow information:
Interest paid during the year $ 4,579,100 2,546,300
See accompanying notes to consolidated financial statements.
C O N S O L I D AT E D S TAT E M E N T S O F F I N A N C I A L P O S I T I O N
June 30, 2002 and 2001
ASSETS2002 2001
Accounts receivable $ 2,521,988 2,095,981Note receivable 141,104 166,519Inventories 415,167 187,549Contributions receivable 13,816,000 15,478,000Investments 222,726,444 233,302,566Property, plant, and equipment, net 102,965,072 91,987,973Real estate development costs 373,116 399,460
Total assets $ 342,958,891 343,618,048
LIABILITIES AND NET ASSETS
Liabilities:Accounts payable $ 3,254,299 3,745,782Accrued interest expense 2,027,622 1,736,965Deferred rental revenue 1,218,304 711,694Other accrued liabilities 1,986,240 1,704,306Long-term debt 99,330,834 85,611,541Deposits held in custody for others 6,752,186 7,052,789Annuity and life income obligations 5,818,659 6,817,667
Total liabilities 120,388,144 107,380,744
Net assets:Unrestricted:
Undesignated 22,635,056 22,621,743Designated for specific operating units 33,745,353 26,533,535Designated for investment purposes 47,259,561 59,725,541
Total unrestricted 103,639,970 108,880,819Temporarily restricted 52,525,740 60,901,642Permanently restricted 66,405,037 66,454,843
Total net assets 222,570,747 236,237,304
Total liabilities and net assets $ 342,958,891 343,618,048
See accompanying notes to consolidated financial statements.
Foundation 11/6/02 9:18 AM Page 10

FINANCIAL REPORT 2001/2002 |11
C O N S O L I D AT E D S TAT E M E N T S O F A C T I V I T I E S
June 30, 2001Temporarily Permanently
Unrestricted restricted restricted(note 1c) (note 1c) (note 1c) Totals
Revenues and other additions:Gifts, bequests, and
private grants $ 8,913,351 13,360,601 6,236,260 28,510,212Investment income 2,934,194 2,209,781 135,176 5,279,151Net realized and unrealized losses
on investments (2,501,675) (2,218,487) — (4,720,162)Other revenues:
Faculty practice 4,502,973 — — 4,502,973Rental 7,988,112 — — 7,988,112Continuing education 4,135,511 — — 4,135,511Computer store sales 3,712,638 — — 3,712,638Uniform Data Systems 5,271,933 — — 5,271,933Intercollegiate athletics program 1,917,225 — — 1,917,225Nuclear medicine 928,354 — — 928,354Center for Applied
Technology in Education 24,300 — — 24,300Student orientation 757,605 — — 757,605Other activities and services 7,618,191 235,097 — 7,853,288Adjustment to annuity funds — — (908,773) (908,773)
Net assets released from restrictions 11,215,123 (11,215,123) — —
Total revenues and other additions 57,417,835 2,371,869 5,462,663 65,252,367
Expenses:University support:
Academic divisions 24,265,856 — — 24,265,856Administrative divisions 10,728,797 — — 10,728,797Development expense 1,375,402 — — 1,375,402Other 2,941,876 — — 2,941,876
Total university support 39,311,931 — — 39,311,931
Administration and other:Business office administration 1,332,624 — — 1,332,624Property expense 8,394,796 — — 8,394,796Asset management fees 882,711 — — 882,711
Total administration and other 10,610,131 — — 10,610,131
Total expenses 49,922,062 — — 49,922,062
Change in net assets 7,495,773 2,371,869 5,462,663 15,330,305
Net assets at beginning of year 101,385,046 58,529,773 60,992,180 220,906,999
Net assets at end of year $ 108,880,819 60,901,642 66,454,843 236,237,304
See accompanying notes to consolidated financial statements.
C O N S O L I D AT E D S TAT E M E N T S O F A C T I V I T I E S
June 30, 2002Temporarily Permanently
Unrestricted restricted restricted(note 1c) (note 1c) (note 1c) Totals
Revenues and other additions:Gifts, bequests, and
private grants $ 2,268,618 8,004,559 3,460,677 13,733,854Investment income 3,765,603 3,154,166 99,232 7,019,001Net realized and unrealized losses
on investments (10,435,827) (8,504,692) — (18,940,519) Other revenues:
Faculty practice 5,997,342 — — 5,997,342Rental 11,208,125 — — 11,208,125Continuing education 5,182,940 — — 5,182,940Computer store sales 4,822,332 — — 4,822,332Uniform Data Systems 6,882,001 — — 6,882,001Intercollegiate athletics program 159,390 — — 159,390Nuclear medicine 1,717,392 — — 1,717,392Center for Applied Technology
in Education 749,664 — — 749,664Student orientation 775,377 — — 775,377Other activities and services 8,202,374 185,457 — 8,387,831Adjustment to annuity funds 75 1,940,073 (3,609,715) (1,669,567)
Net assets released from restrictions 13,155,465 (13,155,465) — —
Total revenues and other additions 54,450,871 (8,375,902) (49,806) 46,025,163
Expenses:University support:
Academic divisions 28,188,743 — — 28,188,743Administrative divisions 11,565,912 — — 11,565,912Development expense 1,452,962 — — 1,452,962Merit scholarships 2,453,758 — — 2,453,758Library acquisitions 1,000,000 — — 1,000,000Other 976,598 — — 976,598
Total university support 45,637,973 — — 45,637,973
Administration and other:Business office administration 1,467,447 — — 1,467,447Property expense 11,464,790 — — 11,464,790Asset management fees 1,121,510 — — 1,121,510
Total administration and other 14,053,747 — — 14,053,747
Total expenses 59,691,720 — — 59,691,720
Change in net assets (5,240,849) (8,375,902) (49,806) (13,666,557)
Net assets at beginning of year 108,880,819 60,901,642 66,454,843 236,237,304
Net assets at end of year $ 103,639,970 52,525,740 66,405,037 222,570,747
See accompanying notes to consolidated financial statements.
Foundation 11/6/02 9:18 AM Page 11
FINANCIAL REPORT 2001/2002 |12
Notes to Consolidated Financial Statements(1) Organization and Summary of Significant
Accounting Policies
(a) OrganizationUniversity at Buffalo Foundation, Inc. (UBF) was chartered in 1962 to promote the educational, research,and public service mission of State University of NewYork at Buffalo (the University). UBF solicits and admin-isters support for the University and operates in University facilities.
(b) Basis of PresentationUBF consolidates its financial statements with those of its affiliated entities to reflect all activities supportingUBF. The accompanying consolidated financial state-ments include the accounts of: UBF; UBF Corporation;FNUB, Inc.; University at Buffalo Foundation Incubator,Inc. (UBFI); UBF Faculty-Student Housing Corp. (UBFHousing); UB Foundation Activities, Inc. (UBFA); andUB Foundation Services, Inc. (UBFS), collectivelyreferred to herein as the “Foundation.” All significantintercompany balances and transactions have been elim-inated in consolidation.
The preparation of financial statements in conformitywith accounting principles generally accepted in theUnited States of America requires management to makeestimates and judgments that affect the reported amountsof assets and liabilities and disclosures of contingencies atthe date of the financial statements and revenues andexpenses recognized during the reporting period. Actualresults could differ from those estimates.
(c) Classifications of Net AssetsThe Foundation classifies its net assets and changestherein in the categories described below.
UnrestrictedUnrestricted net assets represent resources whose use arenot restricted by donor-imposed stipulations, thus, theseresources are available for the general support of theFoundation’s activities.
Unrestricted net assets are further classified as undesig-nated and designated resources. Undesignated net assetsrepresent the Foundation’s net investment in property,plant, and equipment and amounts set aside for mainte-nance of properties. Designated net assets representamounts set aside by the Foundation to be used (1) forthe support of specific operating units of the Universityand (2) for investment purposes in order to maintain thepurchasing power of the Foundation’s resources.
Temporarily RestrictedTemporarily restricted net assets represent resourceswhose use is limited by donor-imposed stipulations thateither expire by the passage of time or are removed byspecific actions of the Foundation. Specific actions most
often involve completion of expenditures for purposesconsistent with the donor’s stipulations. Temporarilyrestricted net assets of the Foundation are comprisedprincipally of resources that must be expended to support specific academic divisions of the University.When such donor-imposed stipulations are met, temporarily restricted net assets are reclassified to unrestricted net assets and reported in the statement of activities as net assets released from restrictions.
The Foundation uses temporarily restricted net assets before unrestricted net assets are used for the same purpose.
Permanently RestrictedPermanently restricted net assets, including split interest agreements represent resources that donors have stipulated must be maintained permanently. TheFoundation is permitted to expend part or all of theincome derived from the donated assets, restricted only by the donors’ wishes.
Donor restrictions placed on the use of income derivedfrom permanently restricted net assets relate principallyto the use of the income to support specific academicdivisions of the University.
(d) ContributionsContributions received, including unconditional promises to give, are generally recognized as revenues inthe period received at their fair values. Unconditionalpromises to give that are expected to be collected infuture years are recorded at the present value of their esti-mated future cash flows. The discounts on those amountsare computed using risk-free interest rates applicable tothe years in which the promises are received. Discountrates ranged from 1.75% to 3.6% and from 3.4% to 4.6%for 2002 and 2001, respectively.
(e) Cash and Cash EquivalentsCash and cash equivalents held for investment purposesare included in investments on the statement of financial position.
(f) InvestmentsInvestment securities are recorded at fair value based on exchange or third-party quoted market prices. Theabsolute return and venture/private equity fair value is based on information provided by the partners of thegeneral partnerships.
New York State law permits the use of gains on invest-ments of permanently restricted net assets, absent explic-it donor stipulations that all or a portion of such gains bemaintained in perpetuity. Accordingly, such realized andunrealized gains and losses, as well as gains and losses ontemporarily restricted and unrestricted net assets, are
Foundation 11/6/02 9:18 AM Page 12
FINANCIAL REPORT 2001/2002 |13
Notes to Consolidated Financial Statementsreported as temporarily restricted or unrestricted, basedon the presence or absence of donor stipulations as to their use.
(g) InventoriesInventories consist of computer store inventory and arerecorded at the lower of cost, using the FIFO method ofvaluation, or market.
(h) Real Estate Development CostsCosts incurred in connection with the development ofreal estate projects are capitalized and amortized on thestraight-line method over the life of the related asset orthe term of the lease that provides for the Foundation’suse of that asset. Amortization expense was $26,344 in2002 and 2001, and accumulated amortization was$430,934 and $404,590 at June 30, 2002 and 2001,respectively.
(i) Property, Plant, and EquipmentProperty, plant, and equipment are recorded at cost or at the fair value at the date of donation. Depreciation is recorded on the straight-line method over estimateduseful lives of 20 to 30 years for real property and 5 to 8years for office equipment. Fine arts have been capitalizedfrom inception at fair value at the date of donation. Thefine art collection is not depreciated.
The Foundation reports gifts of property, plant, andequipment as unrestricted support unless explicit donorstipulations specify how the donated assets must be used.Gifts of long-lived assets with explicit restrictions thatspecify how the assets are to be used and gifts of cash orother assets that must be used to acquire long-lived assetsare reported as temporarily restricted support. Absentexplicit donor stipulations about how long those long-lived assets must be maintained, the Foundation reportsexpirations of donor restrictions when the donated oracquired long-lived assets are placed in service.
(j) Split Interest AgreementsThe Foundation’s split interest agreements with donorsconsist primarily of gift annuities, lead trusts and charitable remainder unitrusts and annuity trusts. Assetsheld under these agreements are included in investments.Generally, contribution revenues are recognized on thedates of payment transfers to the annuities or trusts andare established after recording liabilities for the presentvalue of the estimated future payments to be made to thebeneficiaries. The liabilities, reflected as annuity lifeincome obligations on the statements of financial posi-tion, are adjusted during the term of the trusts and annu-ities for changes in the value of the assets and otherchanges in the estimates of future benefits.
(k) Other Activities and ServicesOther activities and services revenue, included in theconsolidated statement of activities, reflects amountsgenerated from educational and training programs, various student activities, laboratory testing and othereducational related initiatives, and administrative
support provided through the Foundation. Revenue related to other activities and services is recognized as earned.
(l) ReclassificationsCertain reclassifications have been made to the 2001financial statements to conform to the 2002 presentation.
(m) Financial InstrumentsManagement believes that the recorded value of financialinstruments approximates their fair value.
(2) ContributionsContributions receivable, representing unconditional promises to give, as of June 30, 2002 and 2001, are summarized below:
2002 2001Unconditional promises expected to be collected in:
Less than one year $ 5,511,300 5,482,800One year to five years 8,385,900 10,603,000Over five years 560,100 355,300
14,457,300 16,441,100
Less:Discount (441,300) (913,100)Allowance for uncollectible receivables (200,000) (50,000)
$ 13,816,000 15,478,000
As of June 30, 2002, the Foundation had also received bequestintentions and revocable trusts that management estimateswill exceed $53,000,000. These intentions and conditional promises to give are not recognized as assets in theaccompanying financial statements. Amounts received willgenerally be restricted for specific purposes stipulated by the donors, primarily endowments for faculty support,scholarships, and general operating support of particulardepartments and divisions of the University.
(3) InvestmentsInvestments at June 30, 2002 and 2001 are composed of the following:
2002 2001
U.S. cash and cash equivalents $ 20,988,860 39,545,331U.S. fixed income 70,824,211 71,865,681Non-U.S. fixed income — 154,617U.S. equity 85,293,403 89,263,871Non-U.S. equity 36,315,863 26,265,680Real Estate Investment Trust 8,305,369 —Absolute return 251,766 5,619,941Venture/private equity 578,173 421,318Other 168,799 166,127
$222,726,444 233,302,566
Investments held in trust under split interest agreements wereapproximately $13,550,000 and $21,909,000 at June 30, 2002and 2001, respectively.
Foundation 11/6/02 9:18 AM Page 13

FINANCIAL REPORT 2001/2002 |14
Notes to Consolidated Financial Statements(4) Property, Plant, and Equipment
and Operating LeasesInvestment in plant at June 30, 2002 and 2001 is composedof the following:
2002 2001Real property, principally rental property $ 95,516,031 71,056,041Less accumulated depreciation 9,348,710 6,825,532
86,167,321 64,230,509
Office equipment 1,803,008 1,713,193Less accumulated depreciation 1,447,364 1,369,348
355,644 343,845
Real estate held for investment 285,881 290,917Fine art collection 5,595,879 5,922,790Construction in progress 10,560,347 21,199,912
$102,965,072 91,987,973
Construction in progress consists of expenditures related to thevarious UBF Housing student housing projects. At June 30,2002, construction-in-progress related to the Creekside Villageprojects which are comprised of 116 apartment style units andwere completed in August 2002. At June 30, 2001, construc-tion-in-progress related to the Flint Village projects which arecomprised of 236 apartment style units and were completed inAugust 2001. A summary of the construction and permanentfinancing relating to the student housing projects is providedin note 5. Amounts set aside for the maintenance of propertieswere approximately $4,531,000 and $2,293,000 at June 30,2002 and 2001, respectively, and are primarily included in designated net assets for specific operating units in the statements of financial position. Amounts set aside for debtservice were approximately $6,552,000 and $5,611,000 at June 30, 2002 and 2001, respectively, and are included in designated net assets for specific operating units in the statements of financial position.
UBF Corporation leases land from State University of NewYork under an operating lease agreement with an initial termexpiring in 2021, renewable to 2037. The base annual rent is approximately $20,764, adjustable based on the UBFCorporation’s net cash flow from this parcel, as defined in the agreement.
Interest of $811,732 and $716,636 was capitalized in 2002 and2001, respectively.
UB Foundation Activities, Inc. leases office space under anoperating lease expiring in 2012. The base annual rent is$156,904 for the first five years and $168,281 per year for theremaining term.
Rental expense incurred under both operating leases was$102,294 in 2002 and $97,293 in 2001.
FNUB, Inc., UBF Corporation, UBF Housing and UBFI arethe lessor or sublessor under several real estate operating leases. Minimum future rental revenues under operating leases with original terms in excess of one year as of June 30,2002 are as follows:
AmountYear ending June 30:
2003 $ 322,9332004 243,4522005 202,8422006 46,8252007 11,810Thereafter 354,327
Total revenue and expense related to UBF Housing wasapproximately $10,463,000 and $9,924,000, respectively, in2002 and approximately $7,510,000 and $6,460,000, respec-tively, in 2001. Included in UBF Housing revenue is investment income of approximately $907,000 and $1,095,000in 2002 and 2001, respectively.
(5) Debt FinancingA summary of long-term debt at June 30, 2002 and 2001 follows:
2002 2001
Village of Kenmore Housing Authority bonds payable in monthly installments of $47,516 through 2027 including interest at 4.95%. (Flickinger Project) $ 8,203,196 8,356,242
Village of Kenmore Housing Authority bonds payable in annual principal installments that escalate through maturity in August 2024, plus interest ranging from 4.25% to 5.50% adjusted annually. (Hadley Village Project) 20,790,514 21,213,719
Town of Amherst Industrial Development Agency bonds payable in annual principal installments that escalate through maturity in August 2030, plus interest ranging from 4.80% to 5.75% adjusted annually. (South Lake Village Projects) 29,110,811 29,103,340
Town of Amherst Industrial Development Agency bonds payable in annual principal installments that escalate through maturity in August 2031, plus interest ranging from 4.30% to 5.25% adjusted annually. (Flint Village Projects) 26,875,155 26,872,017
Town of Amherst Industrial Development Agency bonds payable in annual principal installments that escalate through maturity in August 2032, plus interest ranging from 3.00% to 5.00% adjusted annually (Creekside Village Projects) 14,303,416 -
Other 47,742 66,223
$99,330,834 85,611,541
Foundation 11/6/02 9:18 AM Page 14
FINANCIAL REPORT 2001/2002 |15
Notes to Consolidated Financial StatementsInterest expense was $4,058,016 and $3,245,782 in 2002 and2001, respectively.
The student housing project bonds are secured by first mort-gage interests in the respective properties and the assignmentof all related leases, subleases, and rentals. UBF Housing isrequired to make payments under leasing arrangements withthe bond issuers sufficient to service the bonds. Ownership ofthe properties and related equipment will be transferred toUBF Housing at maturity.
Aggregate maturities of long-term debt at June 30, 2002 are asfollows: 2003 - $777,617; 2004 - $1,480,075; 2005 -$1,631,226; 2006 - $1,764,649, 2007 - $1,879,325, and$91,797,942 thereafter.
UBF has guaranteed the payment of Town of AmherstIndustrial Development Agency Civic Facility revenue bondspayable from the Faculty Student Association of the StateUniversity of New York at Buffalo, Inc., which had an outstanding principal balance of $6,050,000 at June 30, 2002.
(6) Retirement PlanThe Foundation has a defined contribution retirement plancovering all employees meeting certain years of servicerequirements. Benefits are provided by purchase of retirementannuity contracts based upon a percentage of the participant’ssalary. Expense under the plan was $844,261 and $801,630 in2002 and 2001, respectively. Expense related to the UBF business office administrative employees was $81,550 and$76,327 in 2002 and 2001, respectively.
(7) Income TaxesThe Internal Revenue Service has ruled that UBF and its affiliates are each generally qualified under Section 501(c) ofthe Internal Revenue Code and are, therefore, not subject totax on related income under present Federal income tax laws,and also are not private foundations within the meaning ofSection 509(a)(3) of the Internal Revenue Code.
(8) Related Party TransactionsUBF operates in University facilities at no charge. UBFA provides certain accounting and billing services to nonconsol-idated affiliated entities. UBFA receives a fee for these services which is included in other activities and services inthe statement of activities. These fees amounted to $214,249and $190,976 in 2002 and 2001, respectively. UBFS holdsfunds for certain research projects of the University. Thesefunds are reflected as deposits held in custody for others in thestatements of financial position.
(9) Subsequent Event - Change in Market ValueSubsequent to June 30, 2002, volatility experienced in thefinancial markets has resulted in a significant decline in themarket value of certain investments. As of August 31, 2002,the market value of the investment portfolio declined byapproximately $9,500,000 from June 30, 2002.
Foundation 11/6/02 9:18 AM Page 15
University at Buffalo Foundation, Inc. | P.O. Box 900 Buffalo, NY 14226-0900 | 716.645.3013
Foundation 11/6/02 9:18 AM Page 16