Embed Size (px)
Citation preview
1466 Journal of Chemical Education • Vol. 86 No. 12 December 2009 • www.JCE.DivCHED.org • © Division of Chemical Education
On the Web
Historically the two highest levels in the cognitive domain of Bloom’s Taxonomy in increasing hierarchical order were syn-thesis and evaluation (1). In the mid 1990s Lorin Anderson, a former student of Bloom, renamed and reordered the levels so that synthesis and evaluation are now reversed in the cognitive hierarchy and are called evaluating and creating (2).
The classic definition of synthesis is characterized by someone who (1): “Builds a structure or pattern from diverse elements. Puts parts together to form a whole, with emphasis on creating a new meaning or structure.” Being creative—creating a new vision or cognitive structure that demonstrates deeper understanding—is precisely what was meant by synthesis in the original cognitive domain. Creating is an important aspect of both teaching and learning.
What teachers create bears directly on teaching and learn-ing and directs how teachers should think about the creation of learning environments and tools. What teachers create should awaken in students the thrill of exploring their own visions and ideas about scientific concepts and the power of articulating their understanding through creation of reports or other arti-facts that show building and putting together visions through precise and logical explanations with lucid mathematical rea-soning. The thrill of exploring and articulating one’s vision and understanding is fundamental to fostering intellectual growth among students and for ourselves.
Using symbolic mathematics (SymMath) in teaching upper-level courses provides an opportunity to set the stage for the creative process. SymMath tools should go beyond mere pre-sentation of information in a format similar to a textbook. These tools should also go beyond the level of simple manipulation of variables to see how plots or computed values change. To har-ness creativity in the service of learning, SymMath instructional documents should bring students to higher levels of thinking by providing insight into concepts in a way not possible in a text or a wiki page. Teaching tools should enable students to create their personal scaffold of concepts, construct links between concepts, and then articulate these in precisely written artifacts that can be used to assess learning and the level or maturity of understanding achieved by the student. SymMath documents need to have this creative building potential imbedded in their design.
Thus the goal is to create and use documents that allow students to take a “leap of imagination” (3), a new visualization of how concepts fit together. The order that we as scientists see in nature and the laws of nature cannot be given to students. Students must re-create through discovery and exploration the order that we see. Students need to experience the “ah-ha” excite-ment of discovery and comprehension.
In this SymMath column we introduce four new documents. These documents focus on entropy and the third law of thermo-dynamics, excess thermodynamic functions and phase equilibria, intermolecular forces, and the rotational spectrum of CO. Each document provides students with the opportunity to explore and discover in the process of building their conceptual scaffold.
Conventional Entropies and the Third Law of Thermodynamics
In Conventional Entropies and the Third Law of Thermo-dynamics, Hamilton and Zielinski use Mathcad to present an overview of the third law of thermodynamics. The first part of the document provides a detailed analysis of the heat capacity of silver as a function of temperature from 0 to 300 K. Polynomial curve fitting leads to calculation of the S0 at 298.15 K. Students repeat the process and compute the S0 for beryllium, reinforcing learning and adding to their conceptual framework. Students then proceed to compute S0 for SO 2(g) at 298.15 K. In this case solid, liquid, and gas phase heat capacity data are treated sepa-rately. Results for the three phases are combined to produce a complete third law plot like those found in most texts, effectively removing the mystery of how these text figures are produced. This document provides a complete hands-on development of the third law entropy plots. Embedded exercises foster critical thinking. A master exercise at the end allows for student creativ-ity and discovery about the third law. This document is suitable for undergraduate physical chemistry courses.
Effect of Activity Coefficients on Excess Functions and Phase Equilibria
In Effect of Activity Coefficients on Excess Functions and Phase Equilibria, Suárez and Coto use Maple to enable students
JCE SymMath: Symbolic Mathematics in Chemistry
Fostering Creativity and Learning Using Instructional Symbolic Mathematics DocumentsTheresa Julia ZielinskiDepartment of Chemistry, Medical Technology, and Physics, Monmouth University, West Long Branch, NJ 07746; [email protected]
edited byTheresa Julia Zielinski
Monmouth UniversityWest Long Branch, NJ 07764-1898
JCE SymMath—a dynamic feature column
http://www.jce.divched.org/JCEDLib/SymMath/
© Division of Chemical Education • www.JCE.DivCHED.org • Vol. 86 No. 12 December 2009 • Journal of Chemical Education 1467
On the Web
to explore how some thermodynamic functions deviate from the ‘ideal’ and result in complex vapor-liquid phase equilibria. Using Maple, students evaluate the excess thermodynamic func-tions, solve the equations for complex equilibria, and display the isobaric and isothermal binary phase diagrams. The document begins with a review of activity and activity coefficient concepts. The van Laar equation is used to find the activity coefficients for the components of a binary mixture. These in turn are used to compute the excess Gibbs energy and Gibbs energy of mixing. Finally the vapor-liquid equations are solved and the isobaric and isothermal binary phase diagrams are plotted. From plots of activity and activity coefficient as a function of composition, students can clearly see the Raoult’s and Henry’s law limits. The excess Gibbs energy and Gibbs energy of mixing are plot-ted together to compare to the ideal Gibbs energy of mixing. Throughout the document there are guided inquiry questions to focus student learning and critical thinking. Exercises at the end provide students with the opportunity to create documents demonstrating their mastery of the concepts. This document is appropriate for physical chemistry and chemical engineering courses.
Intermolecular Interactions: Dipole–Dipole, Dipole–Induced Dipole, and London Dispersion Forces
In Intermolecular Interactions: Dipole–Dipole, Dipole–Induced Dipole, and London Dispersion Forces, Kuntzleman and Shibata use Mathcad to provide a detailed analysis of the components of the potential function describing the interac-tion between diatomic molecules. Each contribution to the total interaction is capped with questions that foster student development of a vision of the significance of the mathematical treatment and the relative strengths of these interactions. This permits students to explore the interactions quantitatively at a level that reaches beyond the qualitative treatment given at earlier levels in the curriculum. The document ends with an analysis of the Lennard -Jones potential. In this last section stu-dents examine the connection between the attractive portion of the Lennard-Jones potential and the sum of the dipole-dipole, dipole-induced dipole, and London dispersion interactions (4). Finally the authors present a mastery exercise through which students can create and demonstrate a deeper understanding of the topic. This document is suitable for use in undergraduate physical chemistry and higher level courses.
Rotational States of Carbon Monoxide
In the Mathcad document Rotational States of Carbon Monoxide, Hanson and Zielinski provide a tool for students to explore the factors that determine the rotational spectrum of a diatomic molecule. They begin with background information and a review of concepts associated with rotational spectra. Then students are guided to compute the rotational energy levels and to systematically build the rotational spectrum of carbon mon-oxide. Through use of the template, students explore the effect of each factor that contributes to the spectral structure, such as the rotational constant, rotation-vibration interaction, the rela-tive Boltzmann population of rotational energy levels, the role of the partition function, and the molecular dipole moment. A Lorentzian function is used to model the shape of the spectral peaks. By using the document students discover why a rotational
spectrum has its characteristic structure of line separation and peak intensities. Throughout the document students are led to create their vision of a rotational spectrum by exercises that focus their thinking. The document ends with a choice of two mastery exercises in which students build a model for either the HCl or ClO rotational spectrum. The former complements common laboratory experiments in which the rotation-vibration spectrum of HCl is obtained, and the latter connects with the landmark observations that documented the role chlorine oxide plays in the catalytic destruction of ozone in the upper atmo-sphere. This template is suitable for use in physical chemistry and spectroscopy courses.
Literature Cited
1. Bloom’s Taxonomy, the Cognitive Domain. http://www.nwlink.com/~donclark/hrd/bloom.html#cognitive (accessed Oct 2009).
2. Bloom’s Revised Taxonomy. http://www.nwlink.com/~donclark/hrd/bloom.html#revised (accessed Oct 2009).
3. The argument for the importance of creativity and imagination in the sciences is made persuasively by J. Bronowski in Science and Human Values (revised edition with a new dialogue, The Abacus and the Rose); Perennial Library, Harper & Row Publishers: New York, 1972. In “The Abacus and the Rose, A New Dialogue on Two World Systems”, Bronowski stresses the importance of the personal illumination and vision for learning and discovery in science. In the essay “The Creative Mind” he points out the need for personal exploration and discovery, namely, creating and re-creating, taking a leap of imagination, reaching beyond the facts, to create understanding and re-create nature in the scientist and student.
4. Simon, D. A.; McQuarrie, J. D. Physical Chemistry: A Molecular Approach; University Science Books: Sausalito, CA, 1997; pp 665–670 and problem 16-53, p 681.
Supporting JCE Online Materialhttp://www.jce.divched.org/Journal/Issues/2009/Dec/abs1466.html
Abstract and keywords
Full text (PDF) with links to cited URLs and JCE articles
Supplements
Find each document and translation of previously published documents mentioned here along with their summaries in the SymMath collection of the JCE Digital Library at http://www.jce.divched.org/JCEDLib/SymMath/collection/index.php
Conventional Entropies and the Third Law of Thermodynamics summary and Mathcad document at http://www.jce.divched.org/JCEDLib/SymMath/collection/article.php?id=63
Effect of Activity Coefficients on Excess Functions and Phase Equilibria summary and Mathcad document at http://www.jce.divched.org/JCEDLib/SymMath/collection/article.php?id=64
Intermolecular Interactions: Dipole–Dipole, Dipole–Induced Dipole, and London Dispersion Forces summary and Mathcad document at http://www.jce.divched.org/JCEDLib/SymMath/collection/article.php?id=65
Rotational States of Carbon Monoxide summary and Mathcad document at http://www.jce.divched.org/JCEDLib/SymMath/collection/article.php?id=66
1468 Journal of Chemical Education • Vol. 86 No. 12 December 2009 • www.JCE.DivCHED.org • © Division of Chemical Education
On the Web
Conventional Entropies and the Third Law of Thermodynamics
Todd M. Hamilton, Department of Chemistry, George-town College, Georgetown, KY 40324; [email protected]
Theresa Julia Zielinski, Department of Chemistry, Medical Technology, and Physics, Monmouth University, West Long Branch, NJ 07746; [email protected]
File Names: ThirdLawEntropy.xmcd; silver.csv; Be.csv; sulfurdioxide.csv; sulfurdioxidegas.csv; sulfurdioxideliquid.csv; ice.csv; H2O.csv; ThirdLawEntropy.pdf; and fitting.pdf
Key Words: Upper-Division Undergraduate; Physical Chemistry; Computer-Based Learning; Mathematics/Symbolic Mathematics; Thermodynamics
Requires: Mathcad 13 or higher
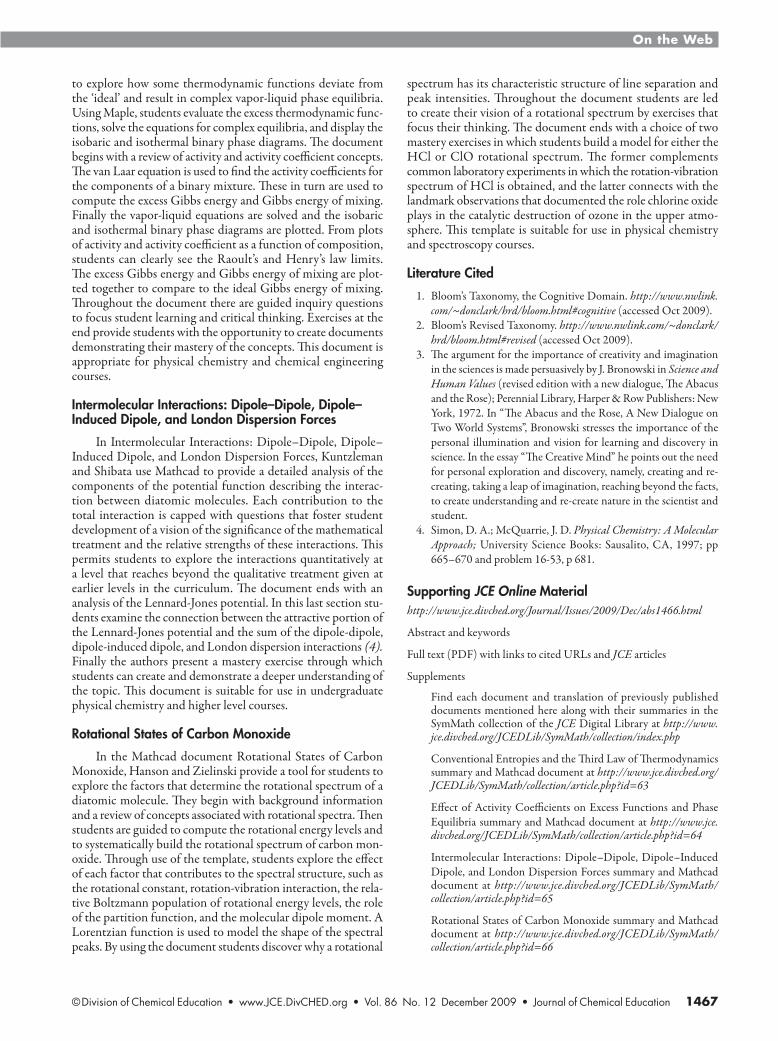
In this document, conventional entropies for several sub-stances are calculated using the third law of thermodynamics and heat capacity data (Figure 1). Students explore the contri-butions of different phases to the total entropy of a substance by integrating the heat capacity within each phase and adding the individual entropy components together with the phase change contributions to the total entropy. Students also learn a method for fitting a polynomial to the heat capacity values at different temperatures.
This document can be used in a standard physical chem-istry course as a lecture demonstration tool or as a student activity when discussing conventional entropies and the third law of thermodynamics.
Figure 1. The heat capacity as a function of temperature for SO2. This graph shows the experimental points ( • ) and the curves ( — ) obtained by polynomial fitting to the experimental data values. The curves from left to right are for solid, liquid, and vapor, respectively.
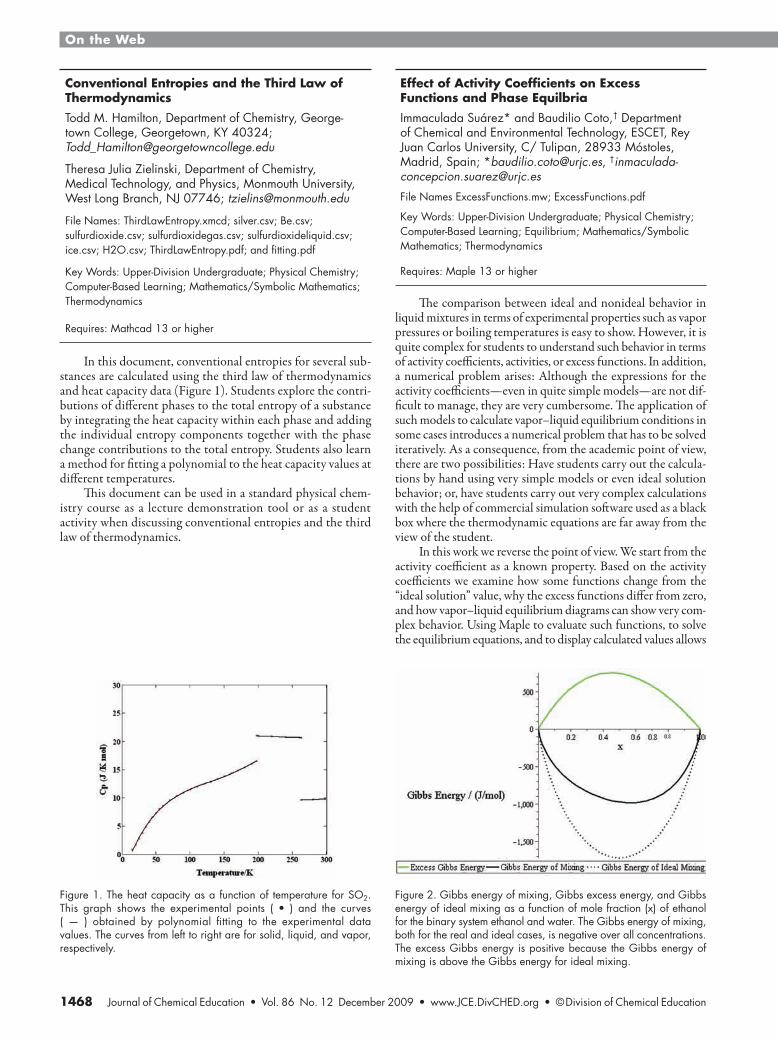
Figure 2. Gibbs energy of mixing, Gibbs excess energy, and Gibbs energy of ideal mixing as a function of mole fraction (x) of ethanol for the binary system ethanol and water. The Gibbs energy of mixing, both for the real and ideal cases, is negative over all concentrations. The excess Gibbs energy is positive because the Gibbs energy of mixing is above the Gibbs energy for ideal mixing.
Effect of Activity Coefficients on Excess Functions and Phase Equilbria
Immaculada Suárez* and Baudilio Coto,† Department of Chemical and Environmental Technology, ESCET, Rey Juan Carlos University, C/ Tulipan, 28933 Móstoles, Madrid, Spain; *[email protected], †[email protected]
File Names ExcessFunctions.mw; ExcessFunctions.pdf
Key Words: Upper-Division Undergraduate; Physical Chemistry; Computer-Based Learning; Equilibrium; Mathematics/Symbolic Mathematics; Thermodynamics
Requires: Maple 13 or higher
The comparison between ideal and nonideal behavior in liquid mixtures in terms of experimental properties such as vapor pressures or boiling temperatures is easy to show. However, it is quite complex for students to understand such behavior in terms of activity coefficients, activities, or excess functions. In addition, a numerical problem arises: Although the expressions for the activity coefficients—even in quite simple models—are not dif-ficult to manage, they are very cumbersome. The application of such models to calculate vapor–liquid equilibrium conditions in some cases introduces a numerical problem that has to be solved iteratively. As a consequence, from the academic point of view, there are two possibilities: Have students carry out the calcula-tions by hand using very simple models or even ideal solution behavior; or, have students carry out very complex calculations with the help of commercial simulation software used as a black box where the thermodynamic equations are far away from the view of the student.
In this work we reverse the point of view. We start from the activity coefficient as a known property. Based on the activity coefficients we examine how some functions change from the “ideal solution” value, why the excess functions differ from zero, and how vapor–liquid equilibrium diagrams can show very com-plex behavior. Using Maple to evaluate such functions, to solve the equilibrium equations, and to display calculated values allows
© Division of Chemical Education • www.JCE.DivCHED.org • Vol. 86 No. 12 December 2009 • Journal of Chemical Education 1469
On the Web
Jones potential. Students can also learn the role of short-range repulsive interactions in determination of equilibrium distance of interacting systems.
Rotational States of Carbon Monoxide
David M. Hanson, State University of New York at Stony Brook, Stony Brook, NY 11794-3400; [email protected]
Theresa Julia Zielinski, Department of Chemistry, Medical Technology, and Physics, Monmouth University, West Long Branch, NJ 07746; [email protected]
File Names: CO_Rotational_States.xmcd; CO_Rotational_States.pdf
Key Words: Upper-Division Undergraduate; Physical Chemistry; Computer-Based Learning; Mathematics/Symbolic Mathematics; Quantum Chemistry; Spectroscopy
Requires Mathcad 13 or higher.
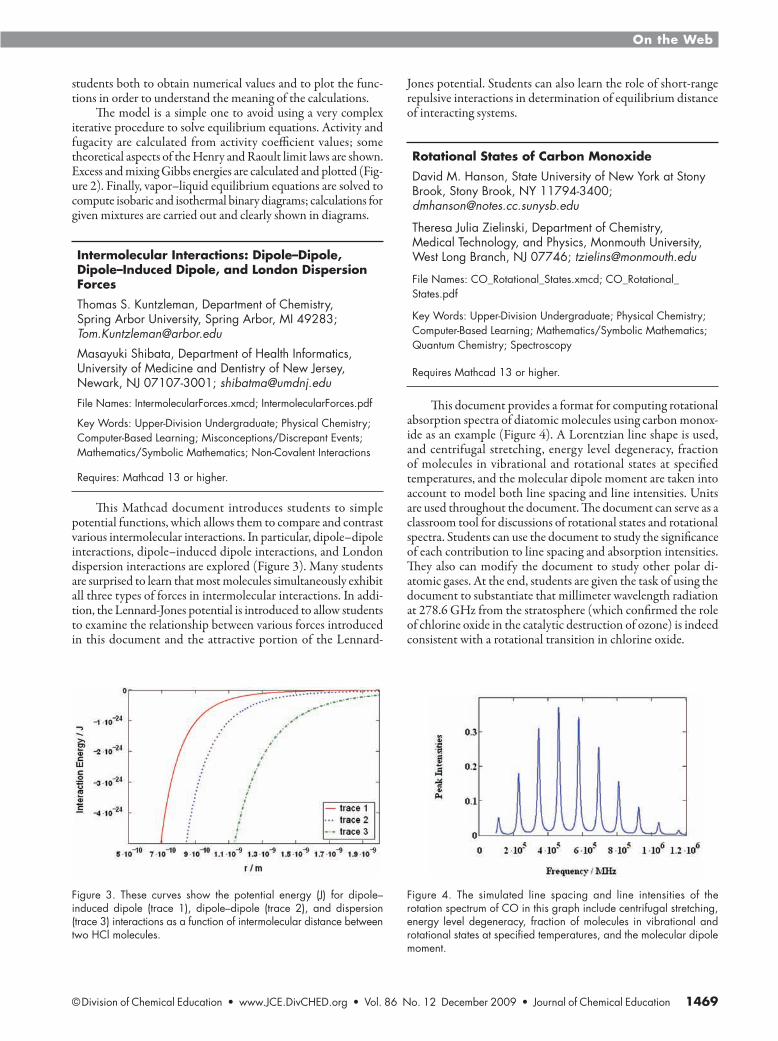
This document provides a format for computing rotational absorption spectra of diatomic molecules using carbon monox-ide as an example (Figure 4). A Lorentzian line shape is used, and centrifugal stretching, energy level degeneracy, fraction of molecules in vibrational and rotational states at specified temperatures, and the molecular dipole moment are taken into account to model both line spacing and line intensities. Units are used throughout the document. The document can serve as a classroom tool for discussions of rotational states and rotational spectra. Students can use the document to study the significance of each contribution to line spacing and absorption intensities. They also can modify the document to study other polar di-atomic gases. At the end, students are given the task of using the document to substantiate that millimeter wavelength radiation at 278.6 GHz from the stratosphere (which confirmed the role of chlorine oxide in the catalytic destruction of ozone) is indeed consistent with a rotational transition in chlorine oxide.
Figure 3. These curves show the potential energy (J) for dipole–induced dipole (trace 1), dipole–dipole (trace 2), and dispersion (trace 3) interactions as a function of intermolecular distance between two HCl molecules.
Figure 4. The simulated line spacing and line intensities of the rotation spectrum of CO in this graph include centrifugal stretching, energy level degeneracy, fraction of molecules in vibrational and rotational states at specified temperatures, and the molecular dipole moment.
students both to obtain numerical values and to plot the func-tions in order to understand the meaning of the calculations.
The model is a simple one to avoid using a very complex iterative procedure to solve equilibrium equations. Activity and fugacity are calculated from activity coefficient values; some theoretical aspects of the Henry and Raoult limit laws are shown. Excess and mixing Gibbs energies are calculated and plotted (Fig-ure 2). Finally, vapor–liquid equilibrium equations are solved to compute isobaric and isothermal binary diagrams; calculations for given mixtures are carried out and clearly shown in diagrams.
Intermolecular Interactions: Dipole–Dipole, Dipole–Induced Dipole, and London Dispersion Forces
Thomas S. Kuntzleman, Department of Chemistry, Spring Arbor University, Spring Arbor, MI 49283; [email protected]
Masayuki Shibata, Department of Health Informatics, University of Medicine and Dentistry of New Jersey, Newark, NJ 07107-3001; [email protected]
File Names: IntermolecularForces.xmcd; IntermolecularForces.pdf
Key Words: Upper-Division Undergraduate; Physical Chemistry; Computer-Based Learning; Misconceptions/Discrepant Events; Mathematics/Symbolic Mathematics; Non-Covalent Interactions
Requires: Mathcad 13 or higher.
This Mathcad document introduces students to simple potential functions, which allows them to compare and contrast various intermolecular interactions. In particular, dipole–dipole interactions, dipole–induced dipole interactions, and London dispersion interactions are explored (Figure 3). Many students are surprised to learn that most molecules simultaneously exhibit all three types of forces in intermolecular interactions. In addi-tion, the Lennard-Jones potential is introduced to allow students to examine the relationship between various forces introduced in this document and the attractive portion of the Lennard-