Embed Size (px)
Citation preview
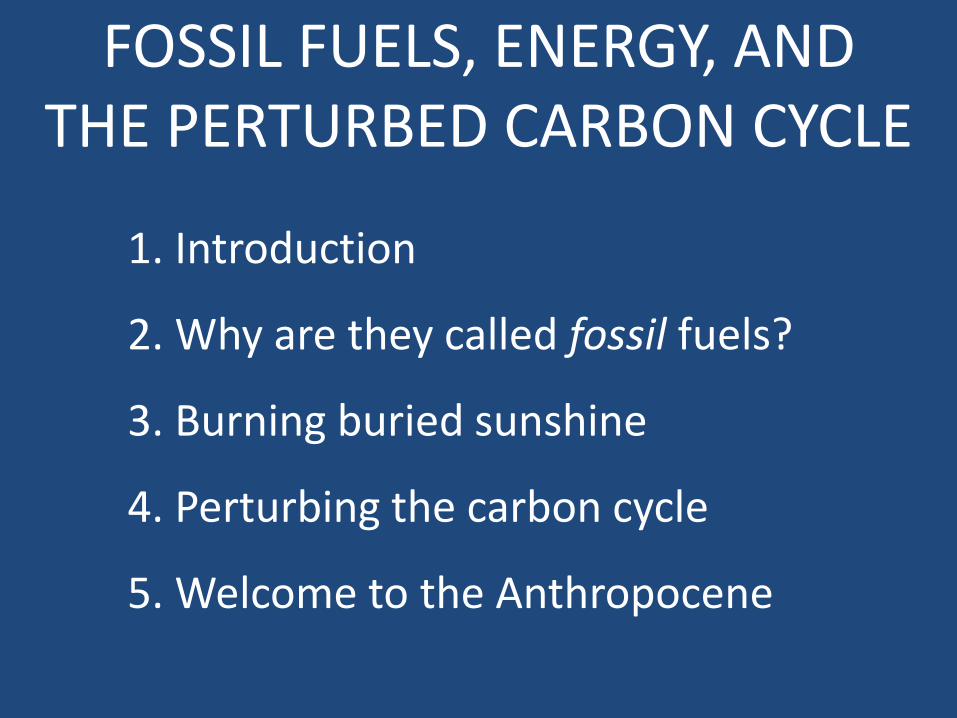
FOSSIL FUELS, ENERGY, AND THE PERTURBED CARBON CYCLE
1. Introduction
2. Why are they called fossil fuels?
3. Burning buried sunshine
4. Perturbing the carbon cycle
5. Welcome to the Anthropocene
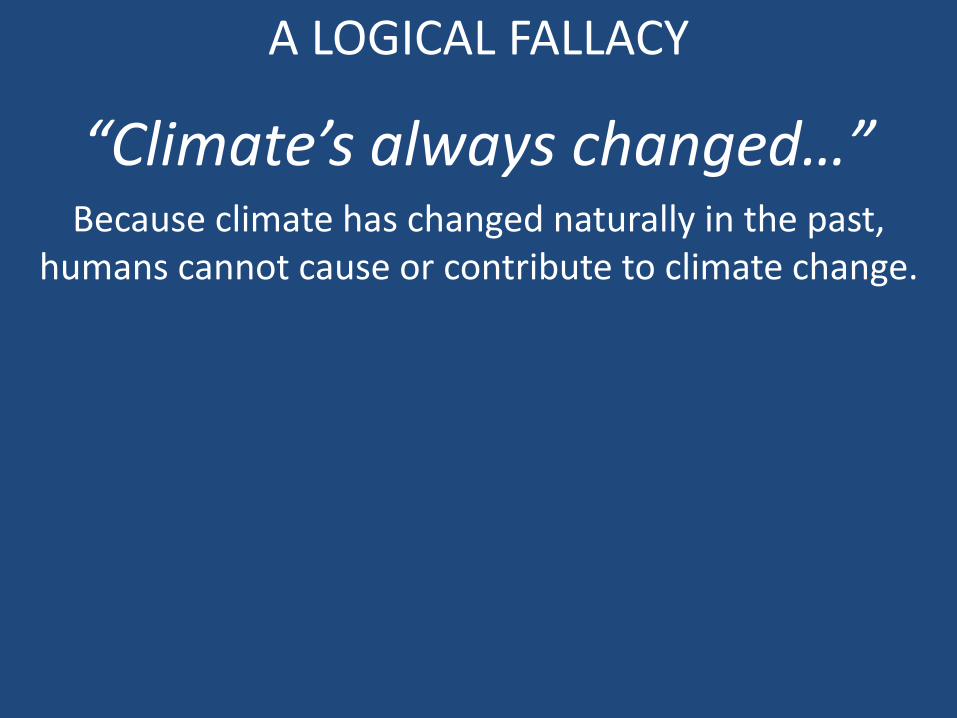
“Climate’s always changed…” Because climate has changed naturally in the past,
humans cannot cause or contribute to climate change.
A LOGICAL FALLACY
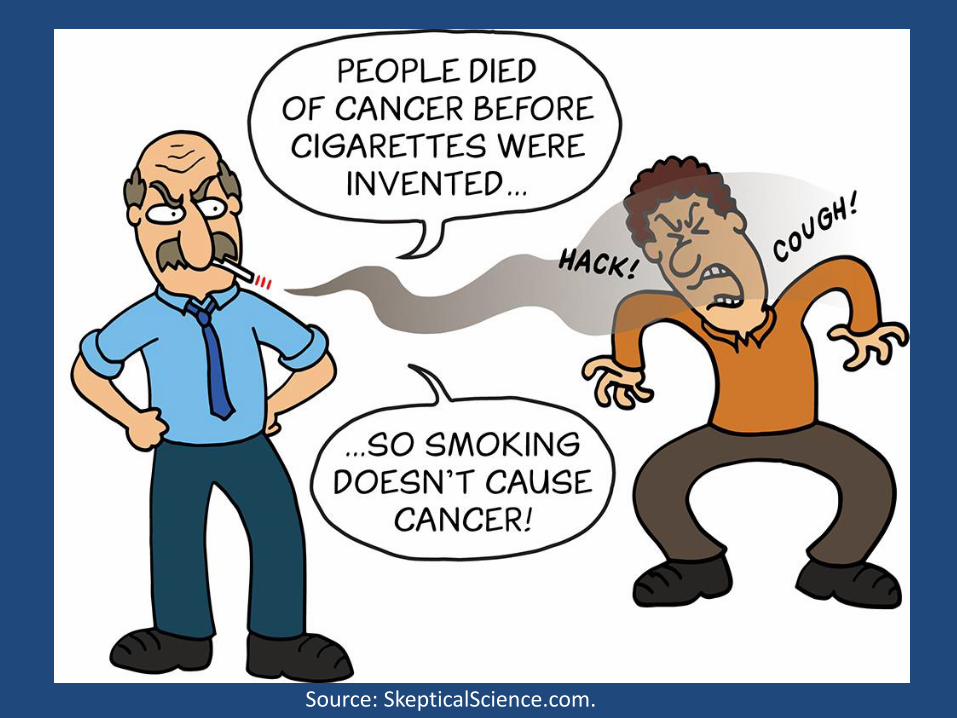
Source: SkepticalScience.com.
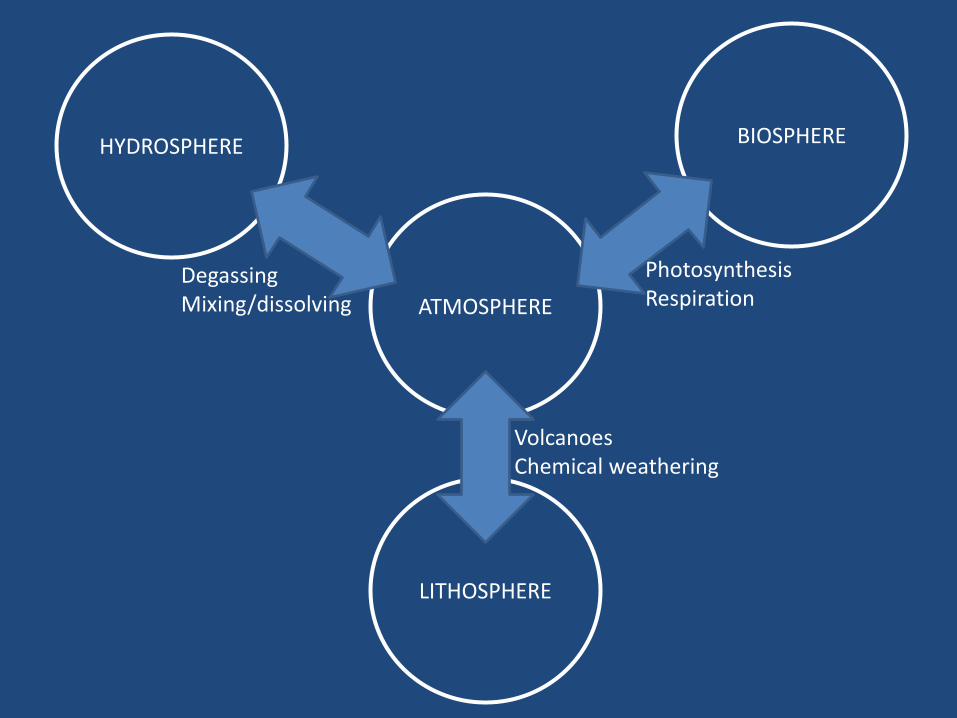
ATMOSPHERE
BIOSPHERE
LITHOSPHERE
HYDROSPHERE
Photosynthesis Respiration
Volcanoes Chemical weathering
Degassing Mixing/dissolving
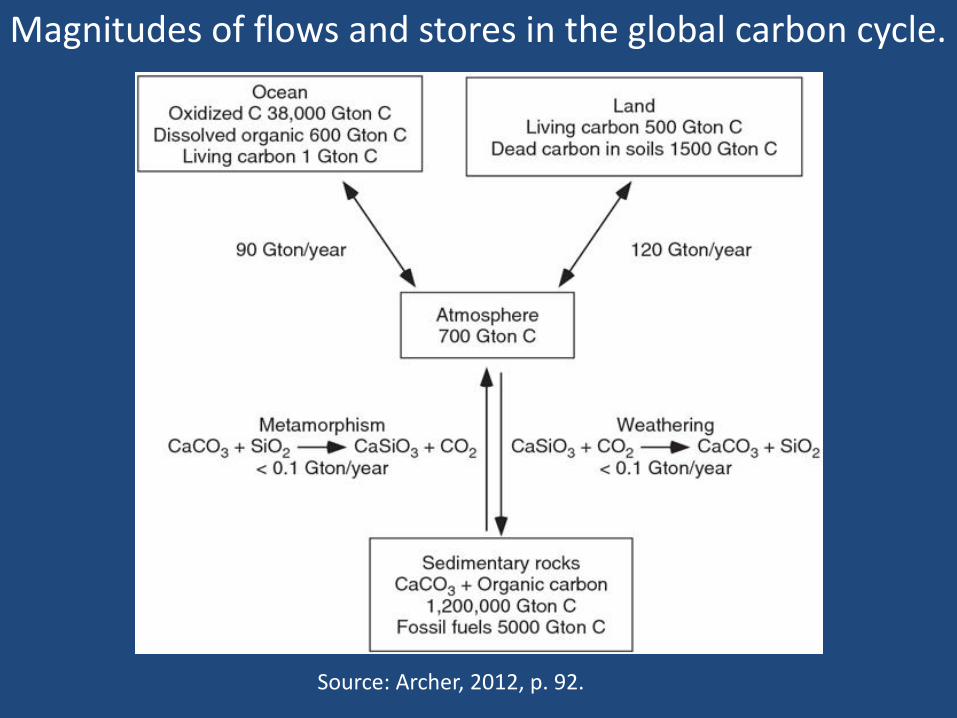
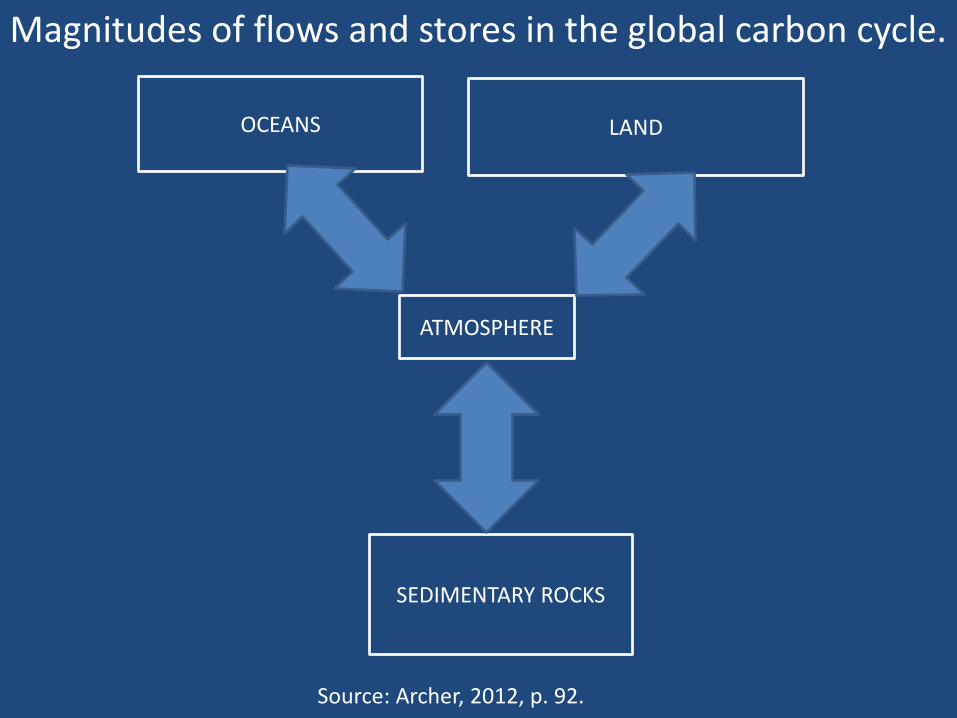
Magnitudes of flows and stores in the global carbon cycle.
Source: Archer, 2012, p. 92.
Magnitudes of flows and stores in the global carbon cycle.
Source: Archer, 2012, p. 92.
OCEANS LAND
ATMOSPHERE
SEDIMENTARY ROCKS
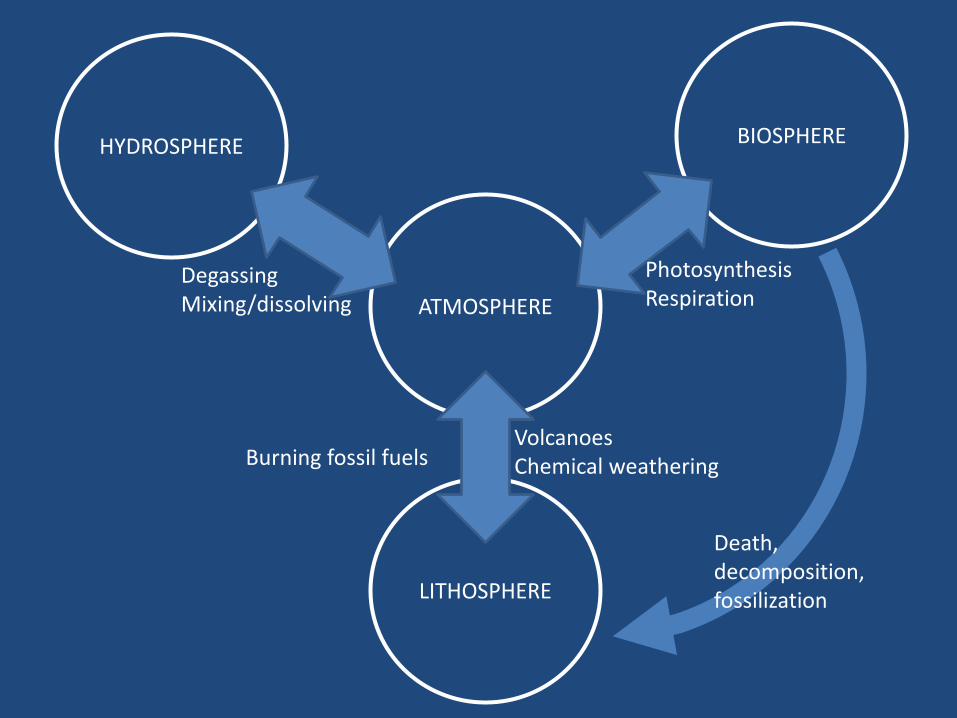
ATMOSPHERE
BIOSPHERE
LITHOSPHERE
HYDROSPHERE
Photosynthesis Respiration
Volcanoes Chemical weathering
Degassing Mixing/dissolving
Death, decomposition, fossilization
Burning fossil fuels

Magnitudes of flows and stores in the global carbon cycle.
Source: Archer, 2012, p. 92.
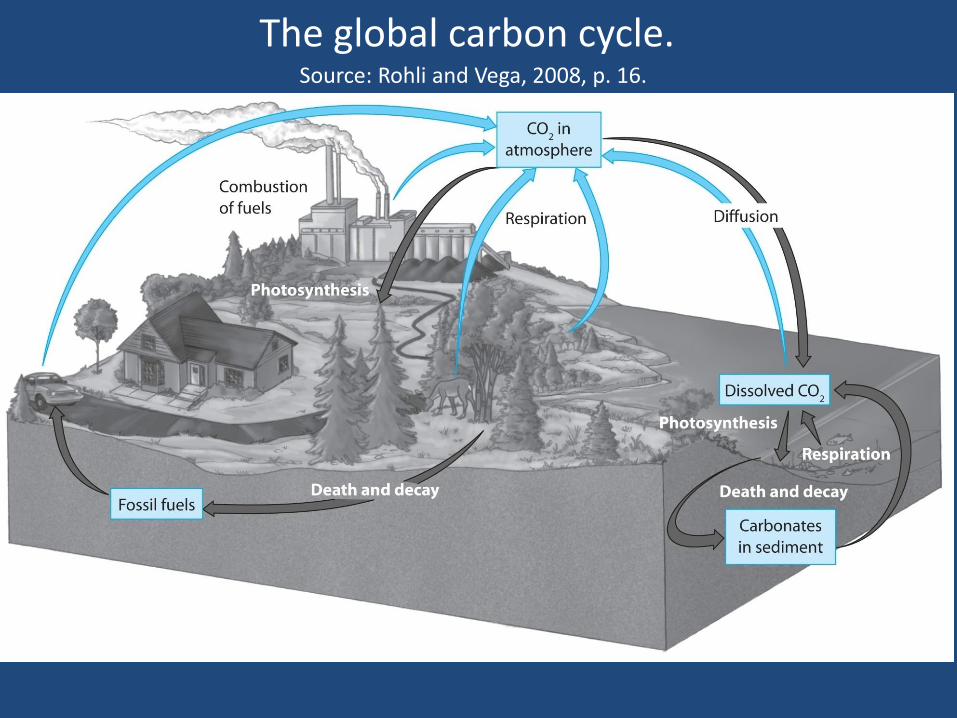
The global carbon cycle. Source: Rohli and Vega, 2008, p. 16.

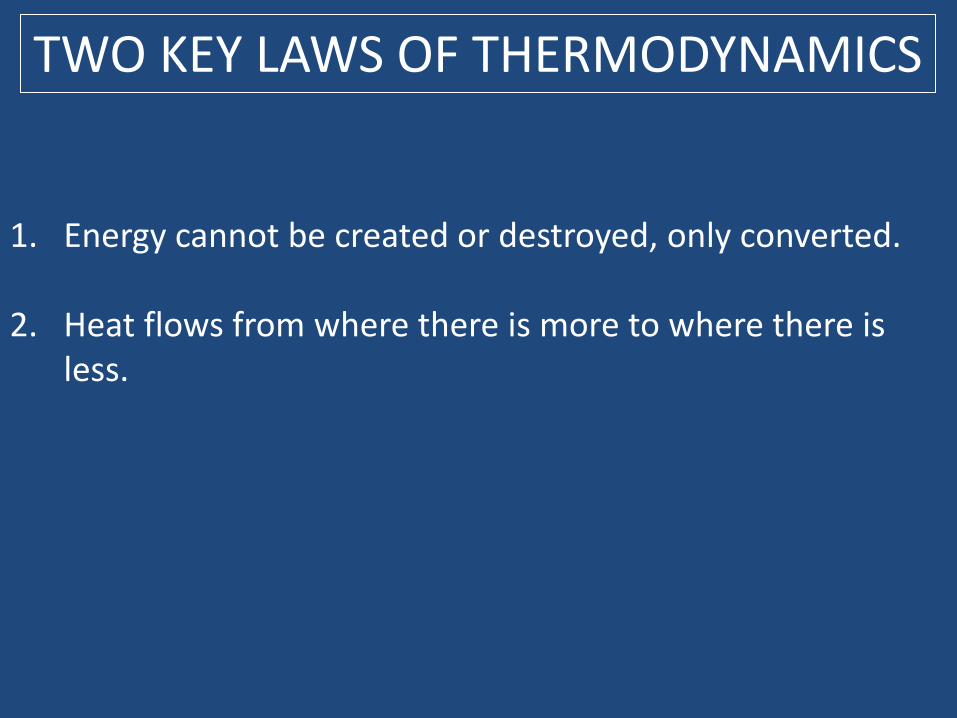
TWO KEY LAWS OF THERMODYNAMICS
1. Energy cannot be created or destroyed, only converted.
2. Heat flows from where there is more to where there is less.
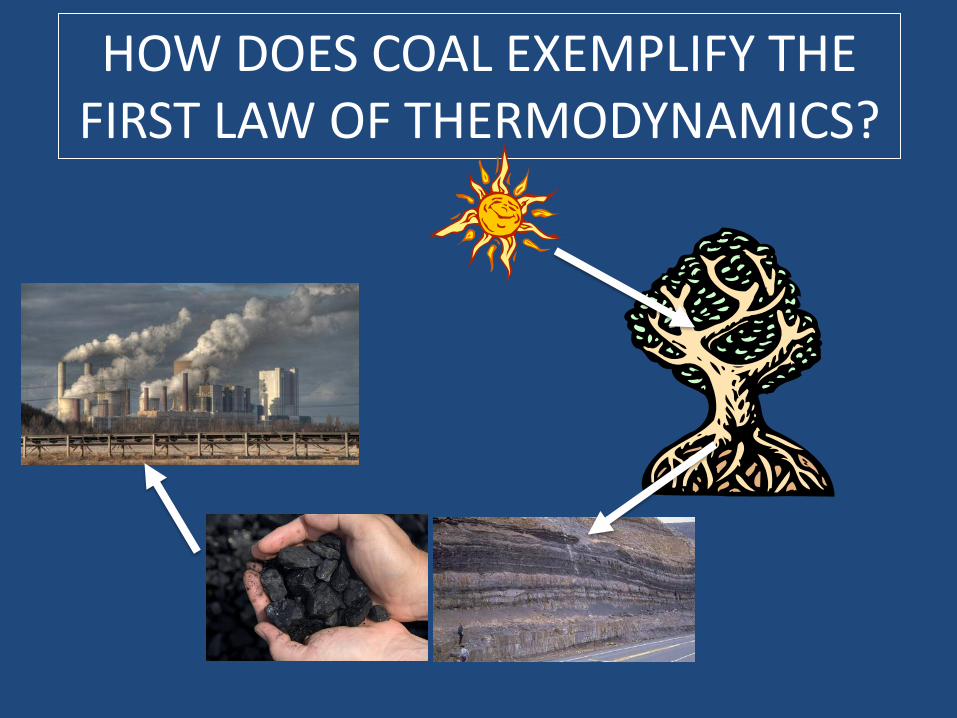
HOW DOES COAL EXEMPLIFY THE FIRST LAW OF THERMODYNAMICS?
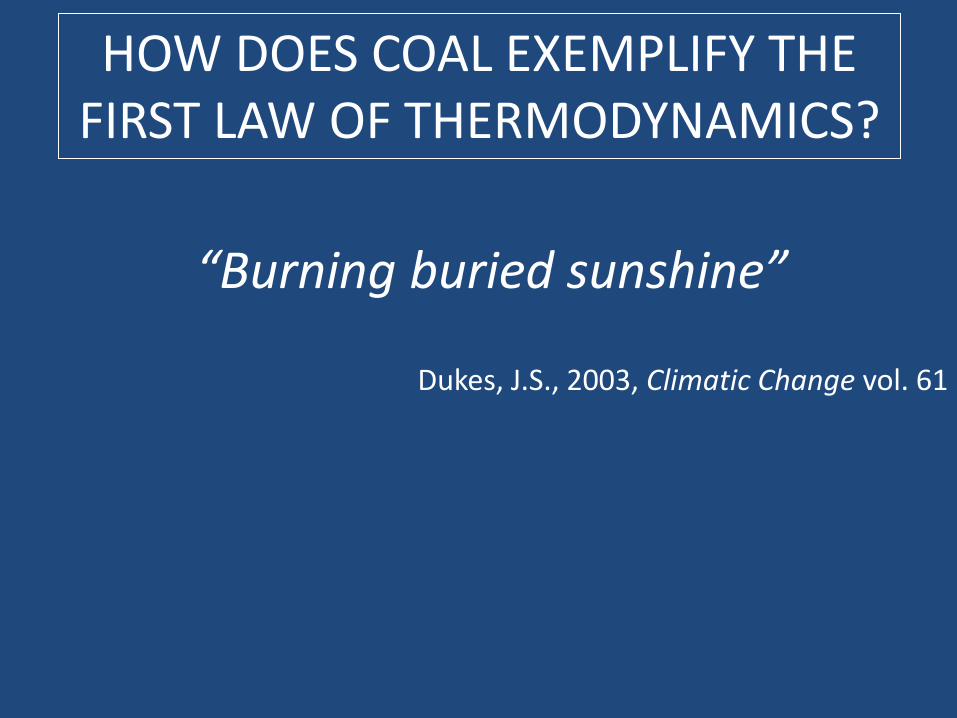
HOW DOES COAL EXEMPLIFY THE FIRST LAW OF THERMODYNAMICS?
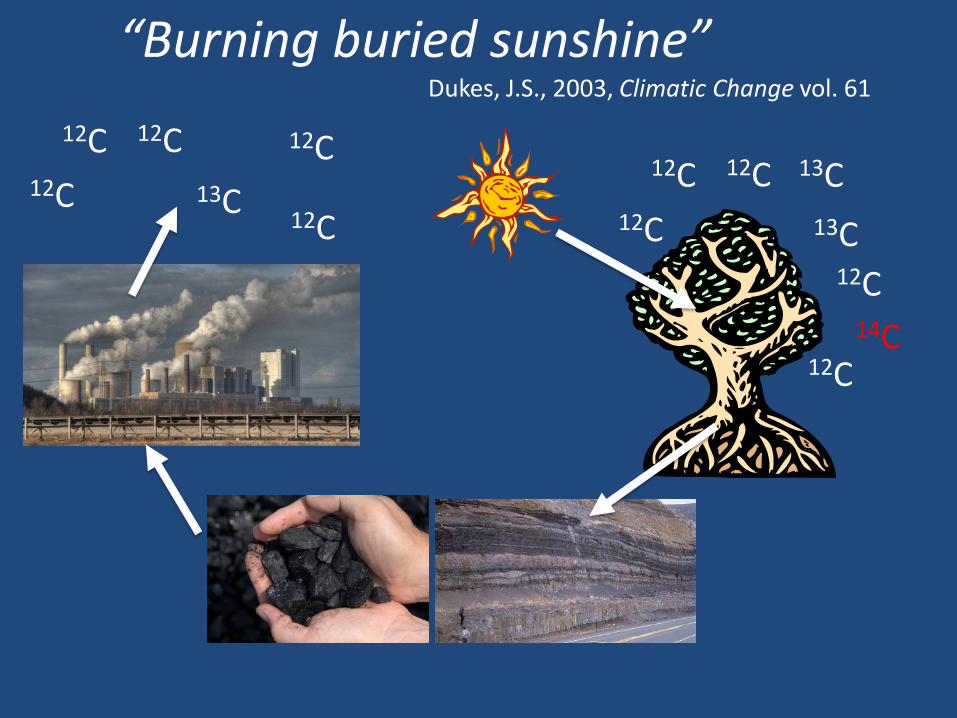
“Burning buried sunshine”
Dukes, J.S., 2003, Climatic Change vol. 61
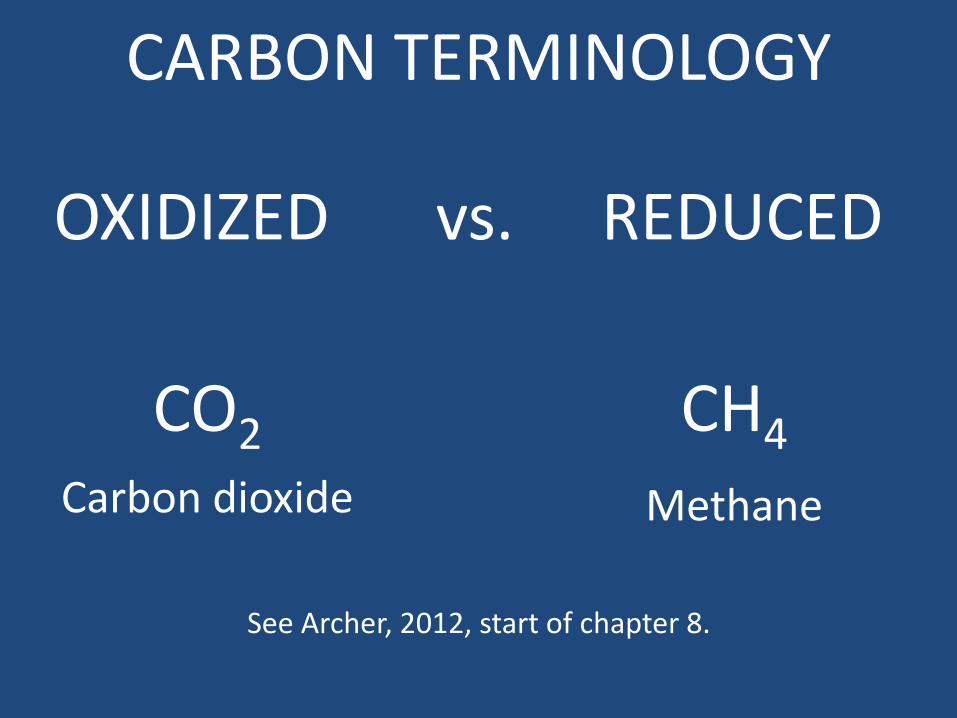
OXIDIZED REDUCED vs.
CO2 CH4 Carbon dioxide Methane
CARBON TERMINOLOGY
See Archer, 2012, start of chapter 8.
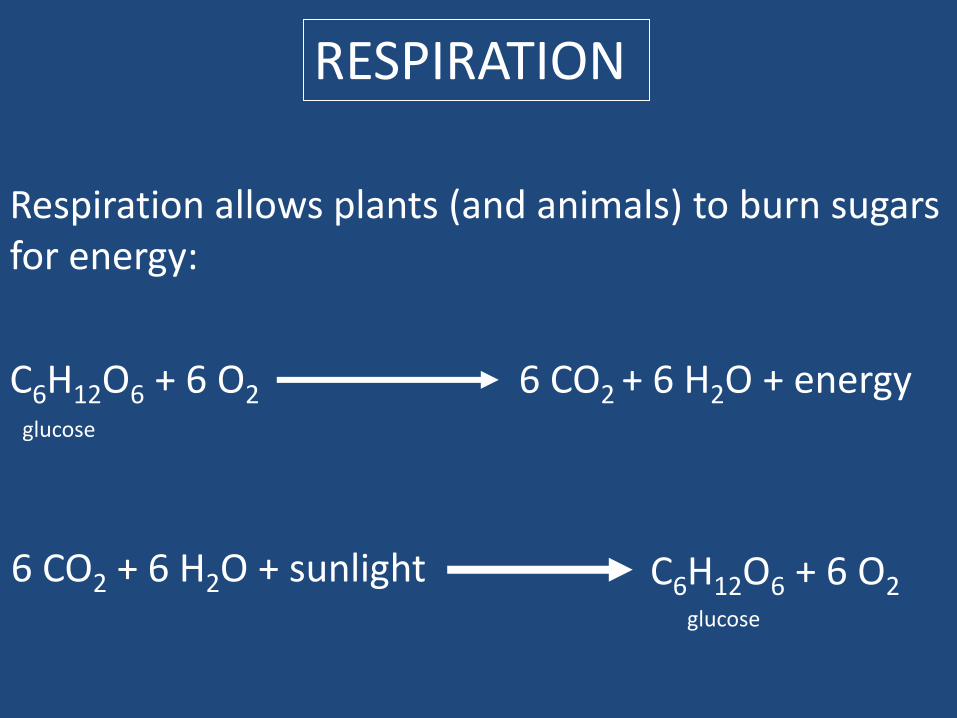
C6H12O6 + 6 O2 glucose
RESPIRATION
6 CO2 + 6 H2O + energy
Respiration allows plants (and animals) to burn sugars for energy:
6 CO2 + 6 H2O + sunlight glucose
C6H12O6 + 6 O2
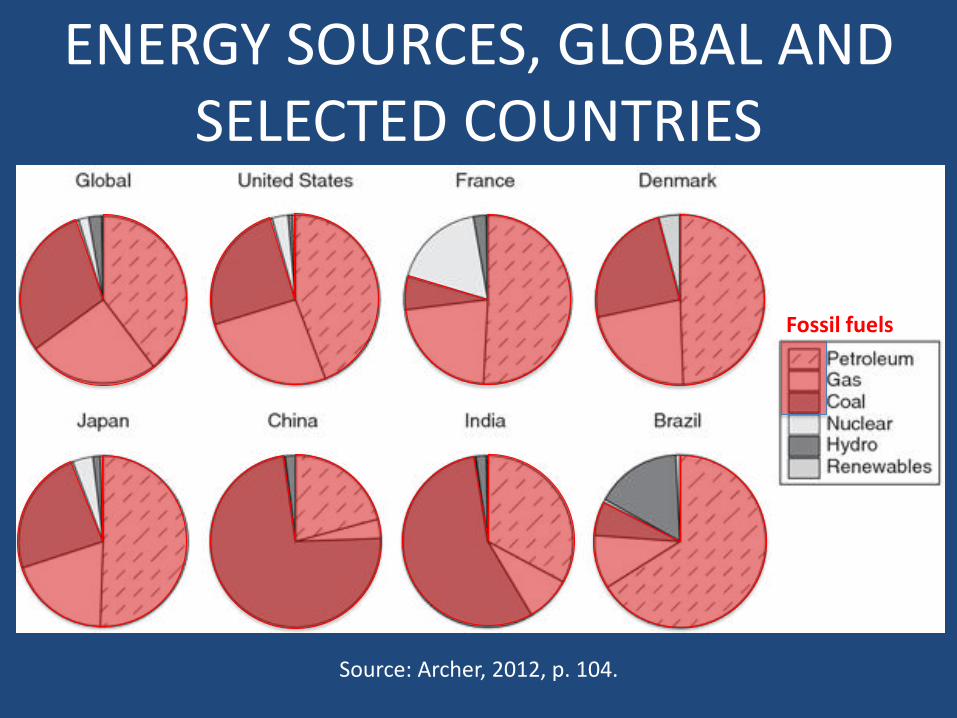
Source: Archer, 2012, p. 104.
ENERGY SOURCES, GLOBAL AND SELECTED COUNTRIES
Fossil fuels
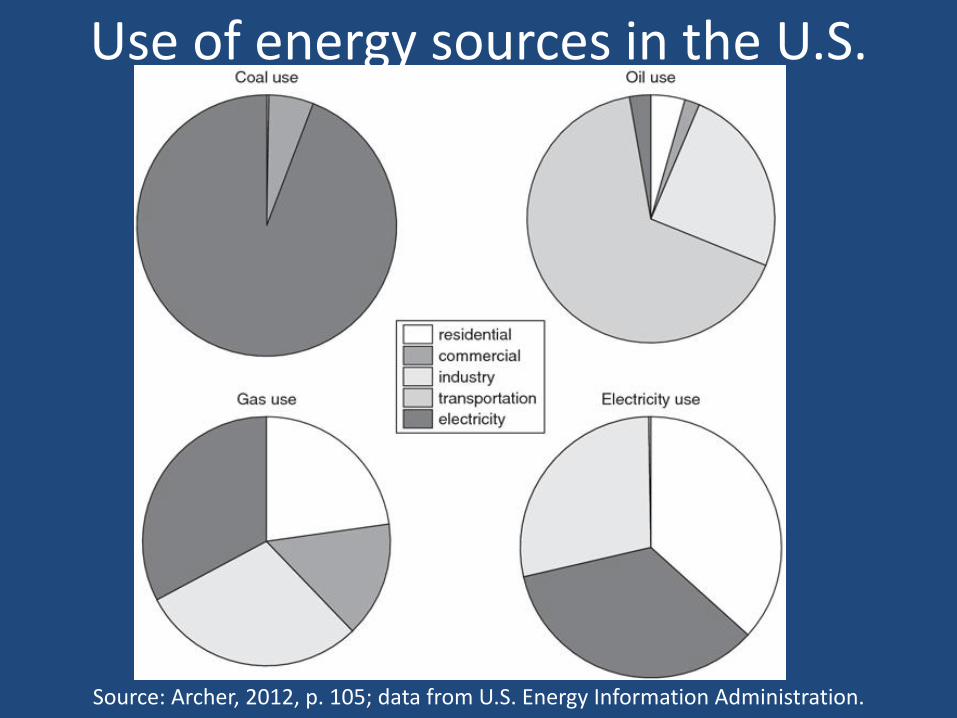
Use of energy sources in the U.S.
Source: Archer, 2012, p. 105; data from U.S. Energy Information Administration.
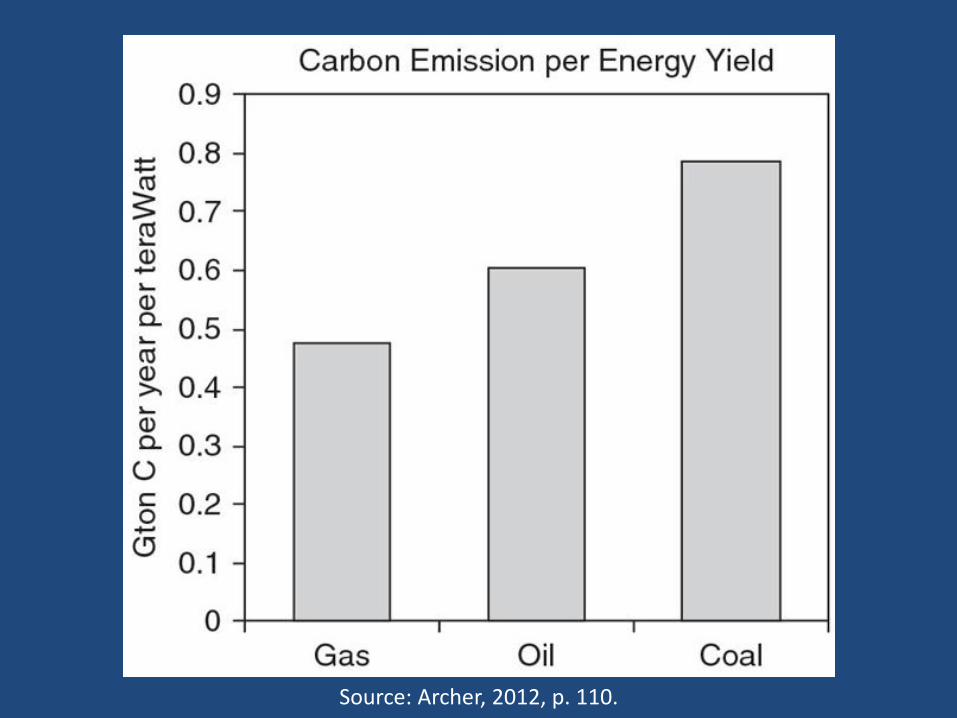
Source: Archer, 2012, p. 110.
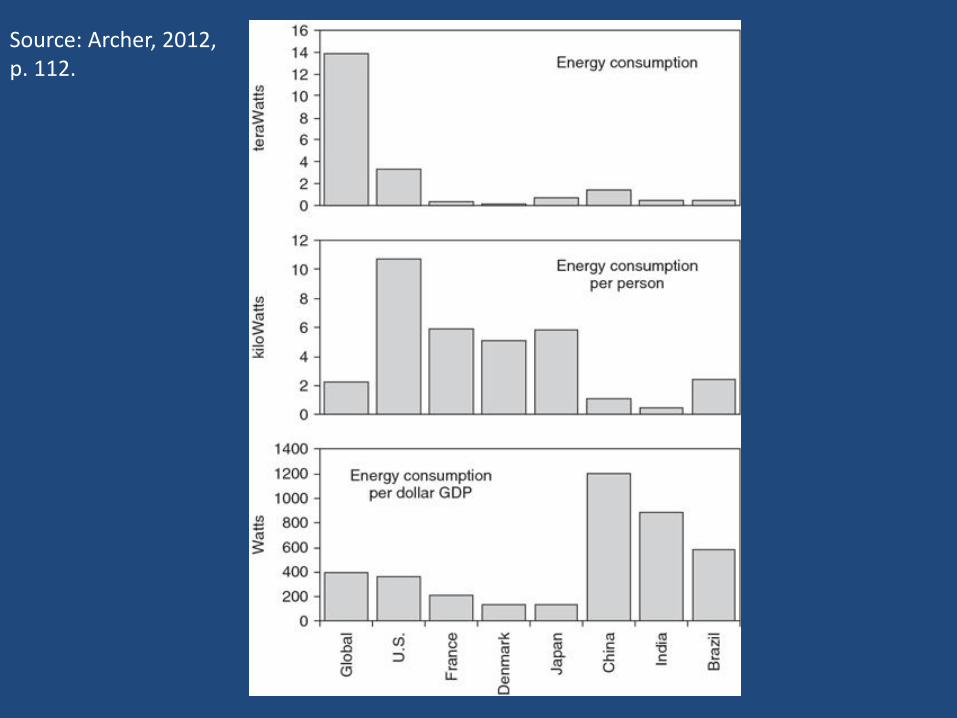
Source: Archer, 2012, p. 112.
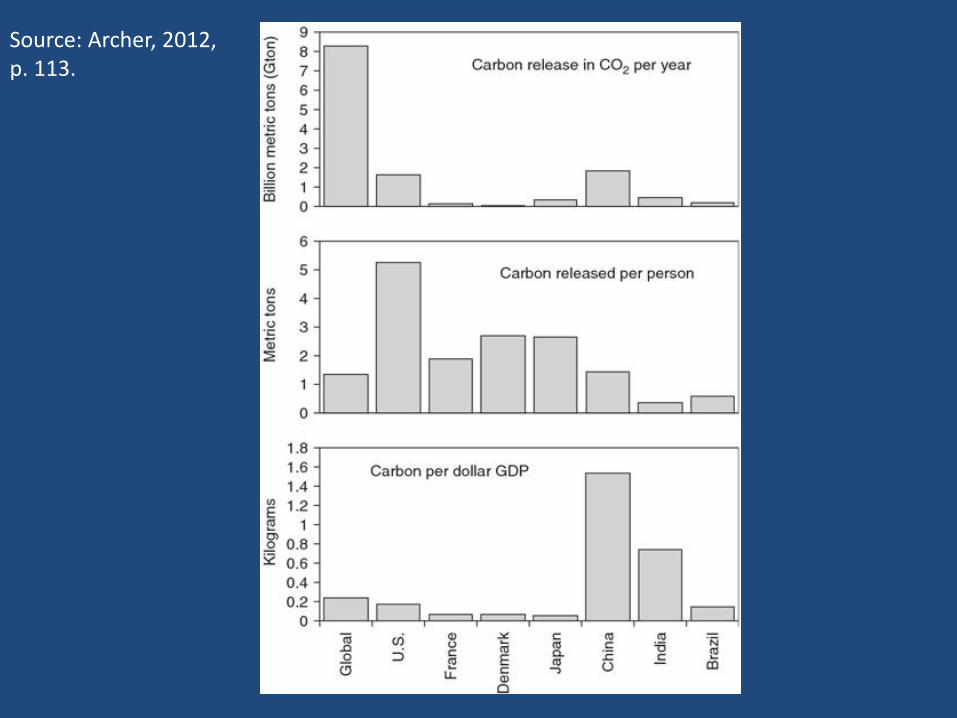
Source: Archer, 2012, p. 113.


Magnitudes of flows and stores in the global carbon cycle.
Source: Archer, 2012, p. 92.

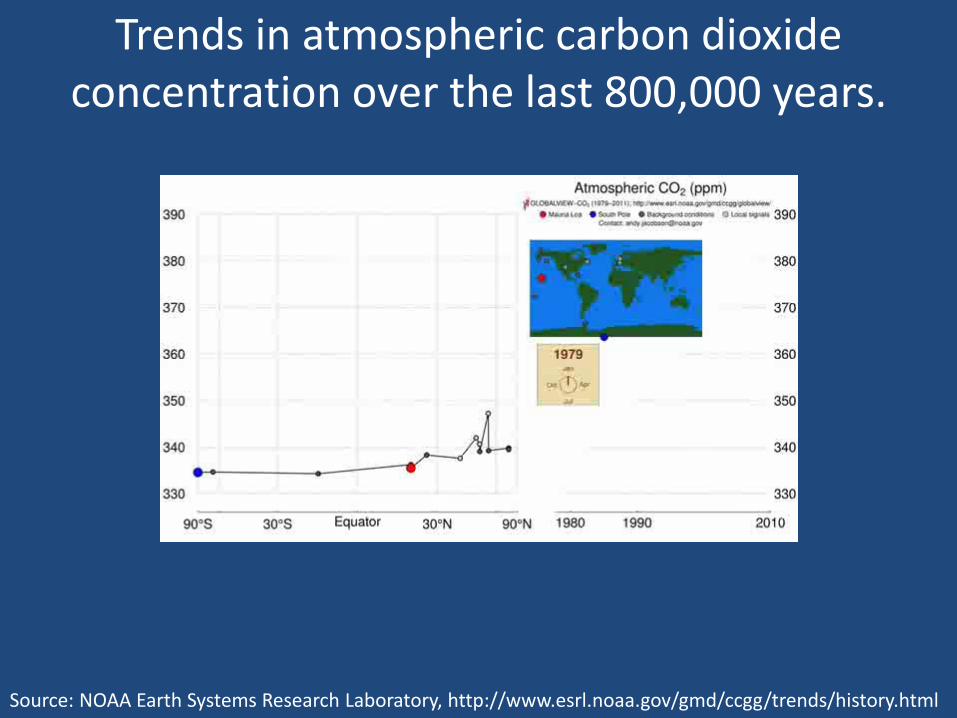
Trends in atmospheric carbon dioxide concentration over the last 800,000 years.
Source: NOAA Earth Systems Research Laboratory, http://www.esrl.noaa.gov/gmd/ccgg/trends/history.html

Changes in carbon dioxide concentrations in the atmosphere, 10,000 years ago to 2005 AD.
Source: Houghton, 2009, p. 39.
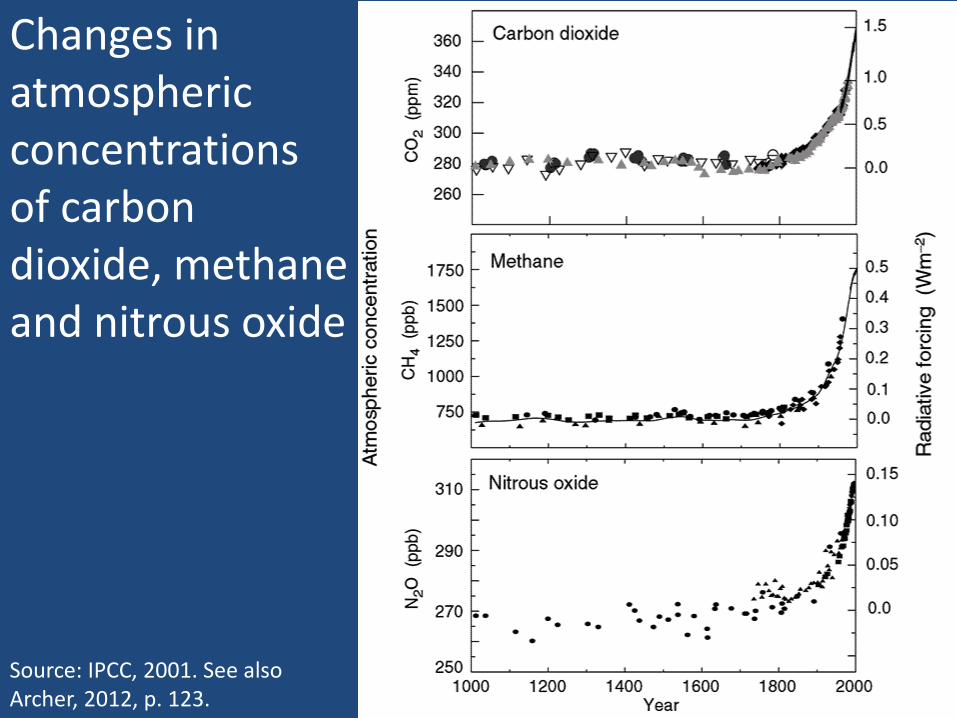
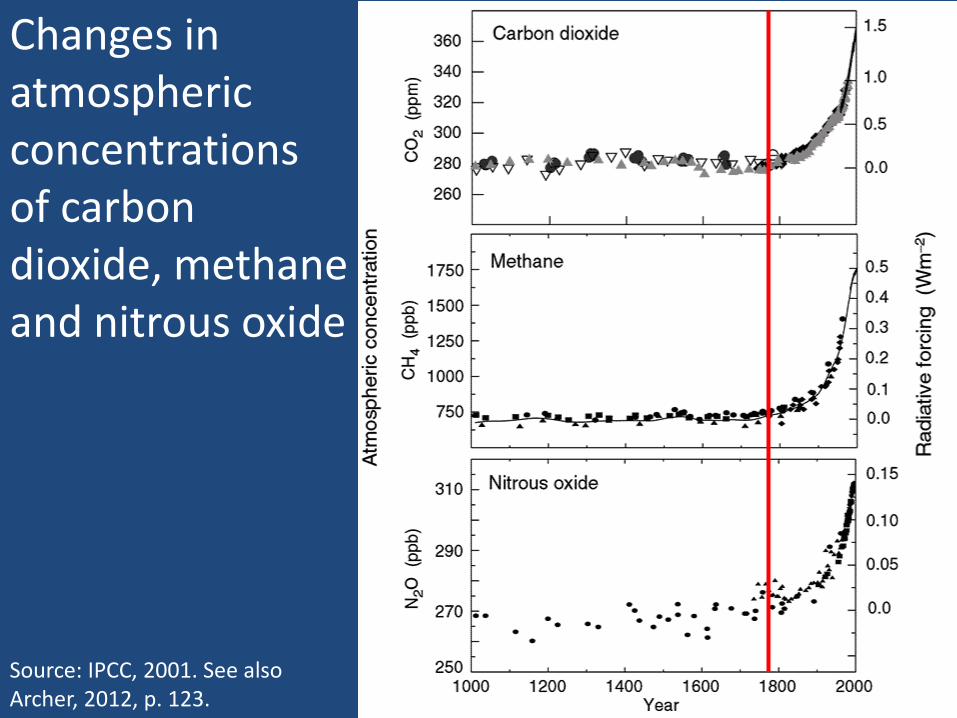
Changes in atmospheric concentrations of carbon dioxide, methane and nitrous oxide
Source: IPCC, 2001. See also Archer, 2012, p. 123.
Car
bo
n d
ioxi
de
con
cen
trat
ion
(p
pm
)
Years before present
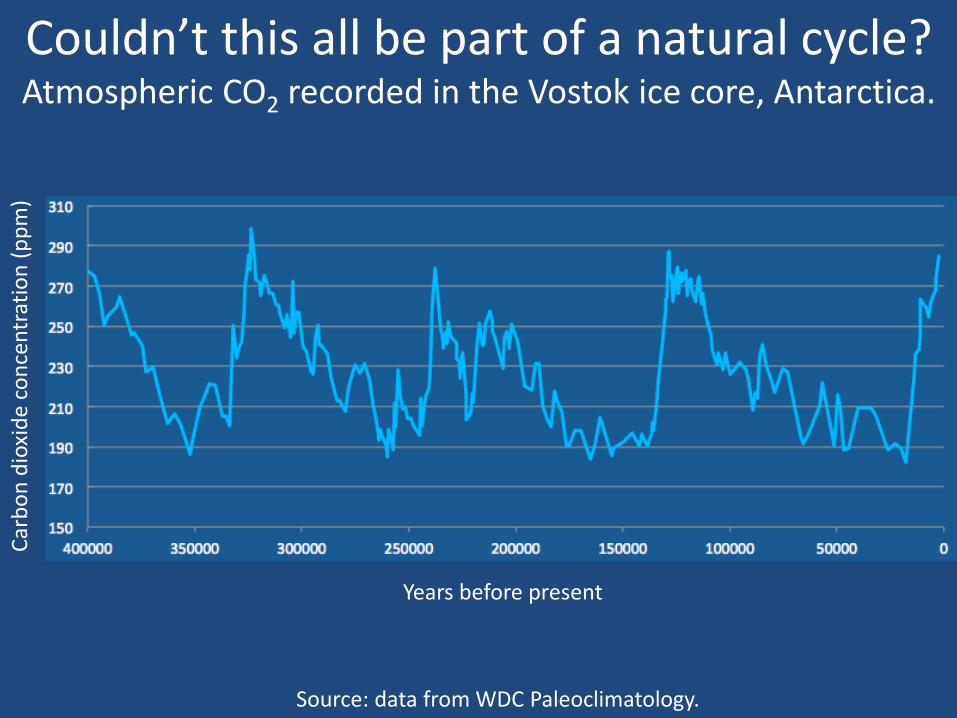
Couldn’t this all be part of a natural cycle? Atmospheric CO2 recorded in the Vostok ice core, Antarctica.
Source: data from WDC Paleoclimatology.
HYPOTHESIS: The recent spike in CO2 is anthropogenic, not natural.
OR:
The recent spike in CO2 is natural, not anthropogenic.
WHAT EVIDENCE COULD WE LOOK FOR?
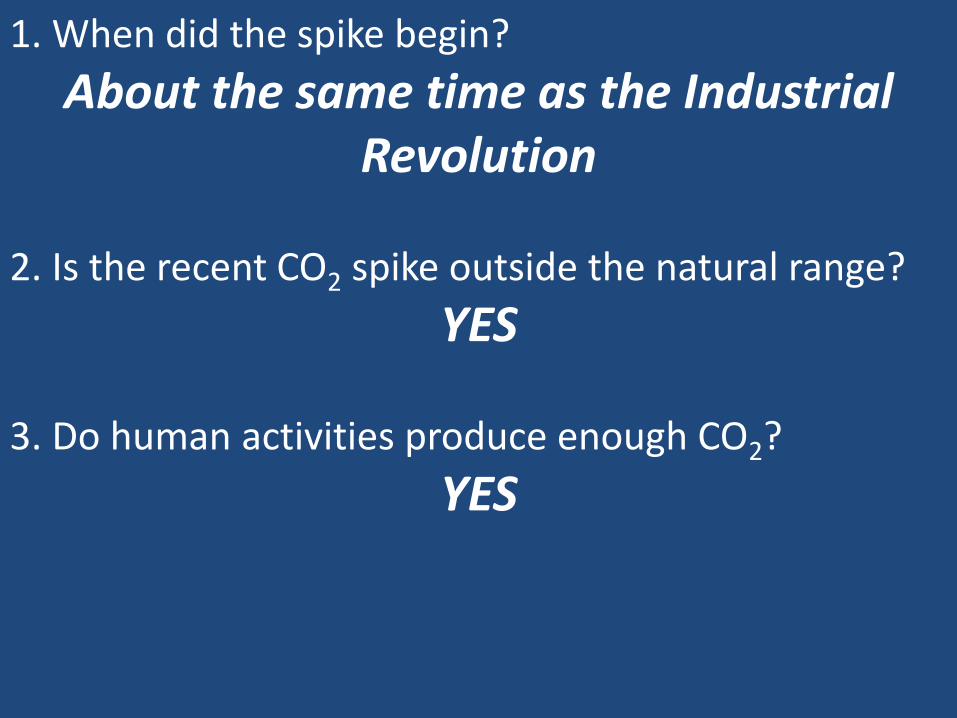
1. When did the spike begin?
About the same time as the Industrial Revolution
Changes in atmospheric concentrations of carbon dioxide, methane and nitrous oxide
Source: IPCC, 2001. See also Archer, 2012, p. 123.
1. When did the spike begin?
About the same time as the Industrial Revolution
2. Is the recent CO2 spike outside the natural range?
YES
Car
bo
n d
ioxi
de
con
cen
trat
ion
(p
pm
)
Years before present
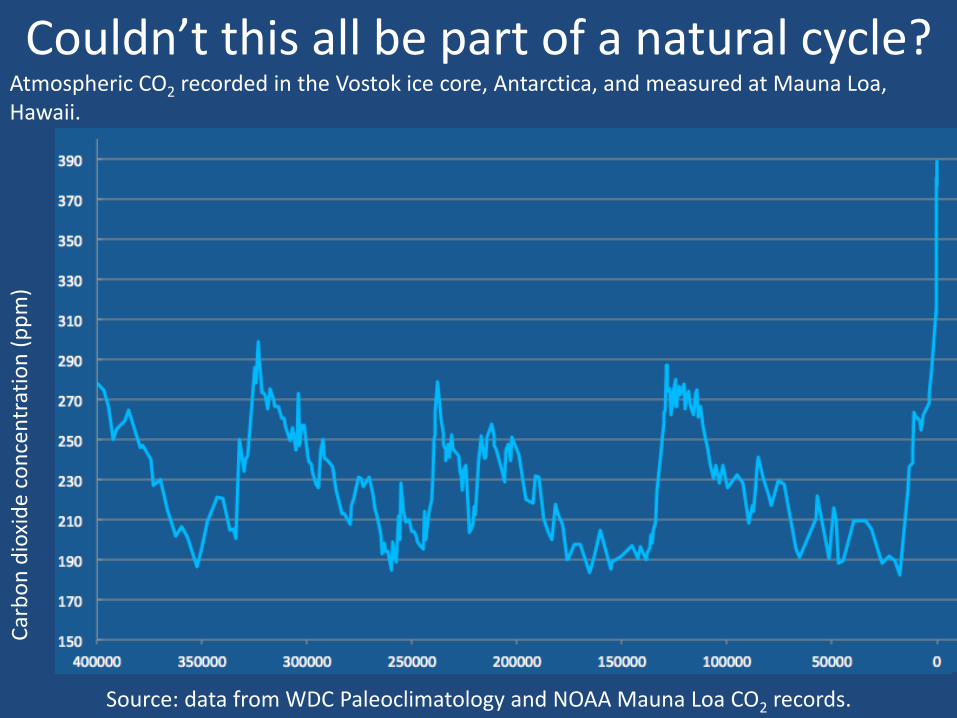
Couldn’t this all be part of a natural cycle? Atmospheric CO2 recorded in the Vostok ice core, Antarctica, and measured at Mauna Loa, Hawaii.
Source: data from WDC Paleoclimatology and NOAA Mauna Loa CO2 records.
Trends in atmospheric carbon dioxide concentration over the last 800,000 years.
Source: NOAA Earth Systems Research Laboratory, http://www.esrl.noaa.gov/gmd/ccgg/trends/history.html
1. When did the spike begin?
About the same time as the Industrial Revolution
2. Is the recent CO2 spike outside the natural range?
YES 3. Do human activities produce enough CO2?
YES
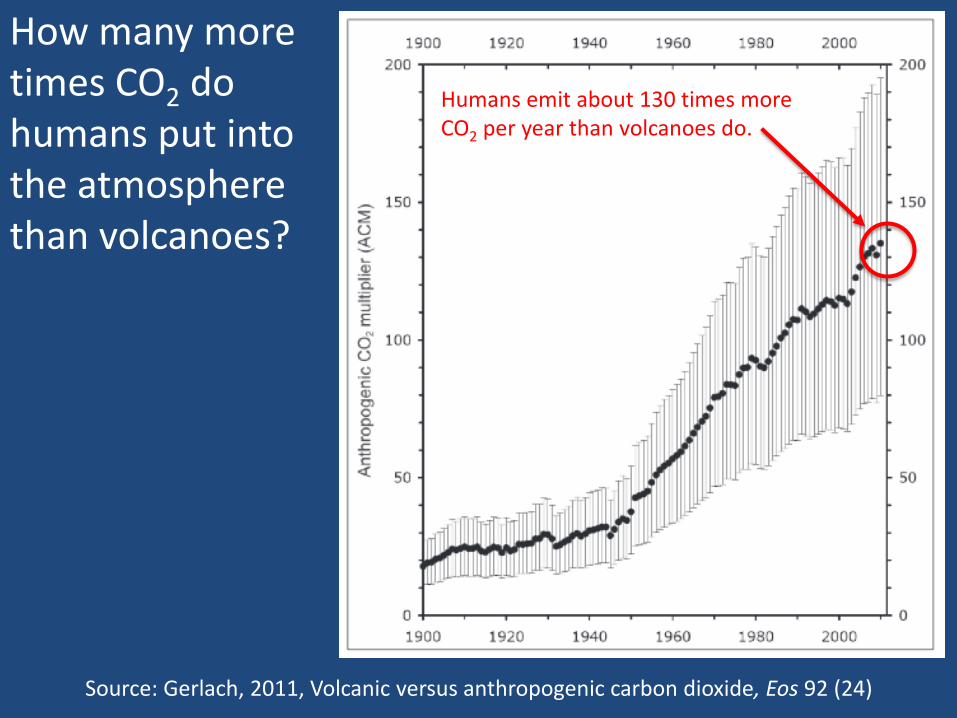
Source: Gerlach, 2011, Volcanic versus anthropogenic carbon dioxide, Eos 92 (24)
How many more times CO2 do humans put into the atmosphere than volcanoes?
Humans emit about 130 times more CO2 per year than volcanoes do.
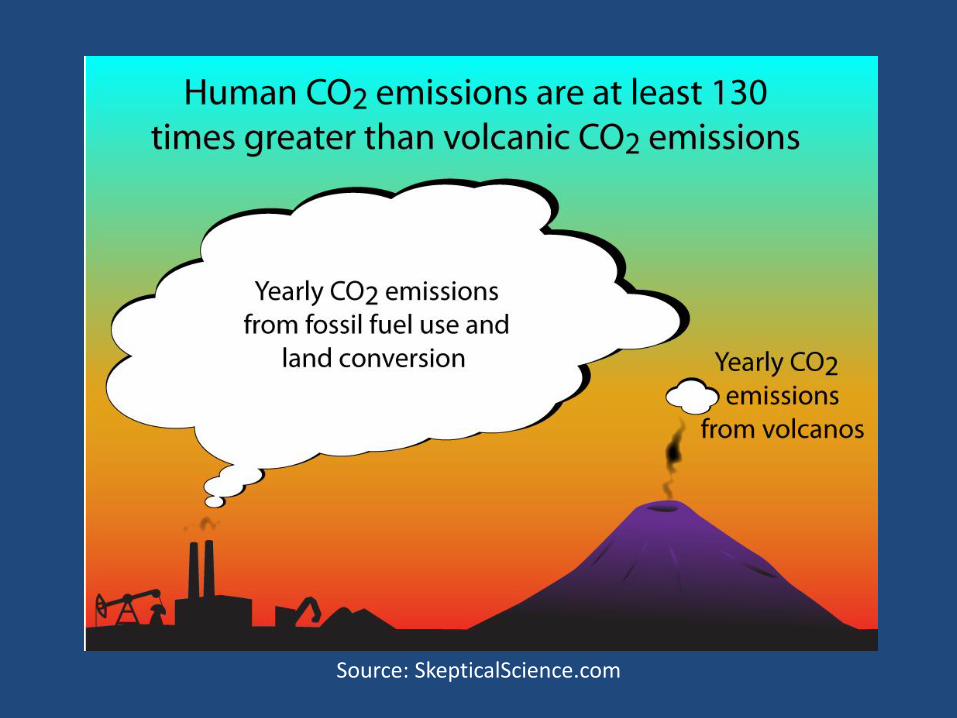
Source: SkepticalScience.com
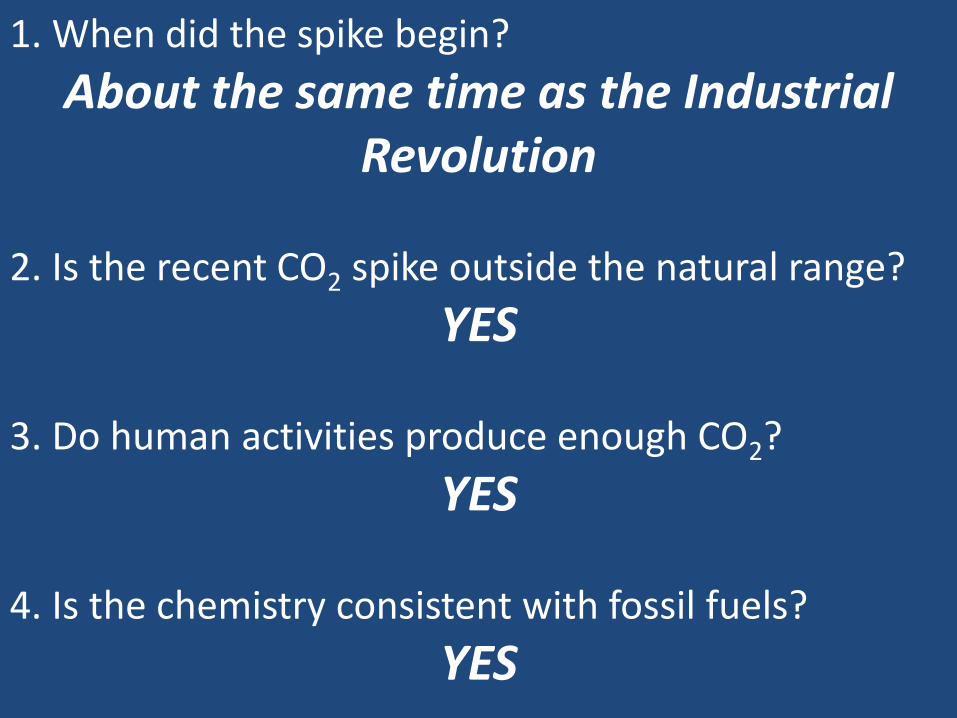
1. When did the spike begin?
About the same time as the Industrial Revolution
2. Is the recent CO2 spike outside the natural range?
YES 3. Do human activities produce enough CO2?
YES 4. Is the chemistry consistent with fossil fuels?
YES
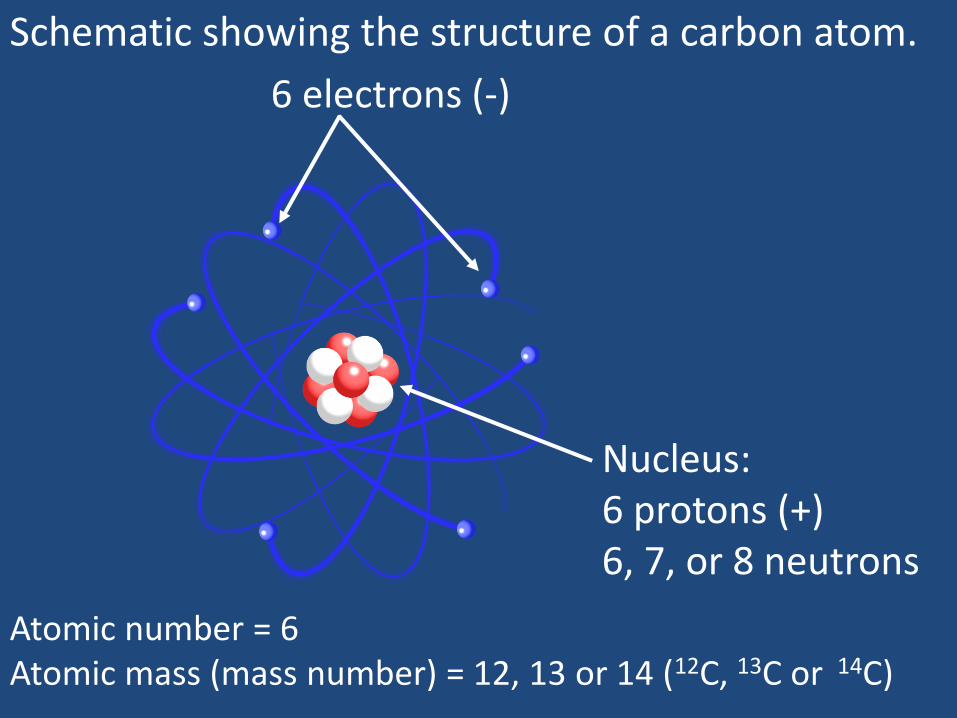
Schematic showing the structure of a carbon atom.
6 electrons (-)
Nucleus: 6 protons (+) 6, 7, or 8 neutrons
Atomic number = 6 Atomic mass (mass number) = 12, 13 or 14 (12C, 13C or 14C)
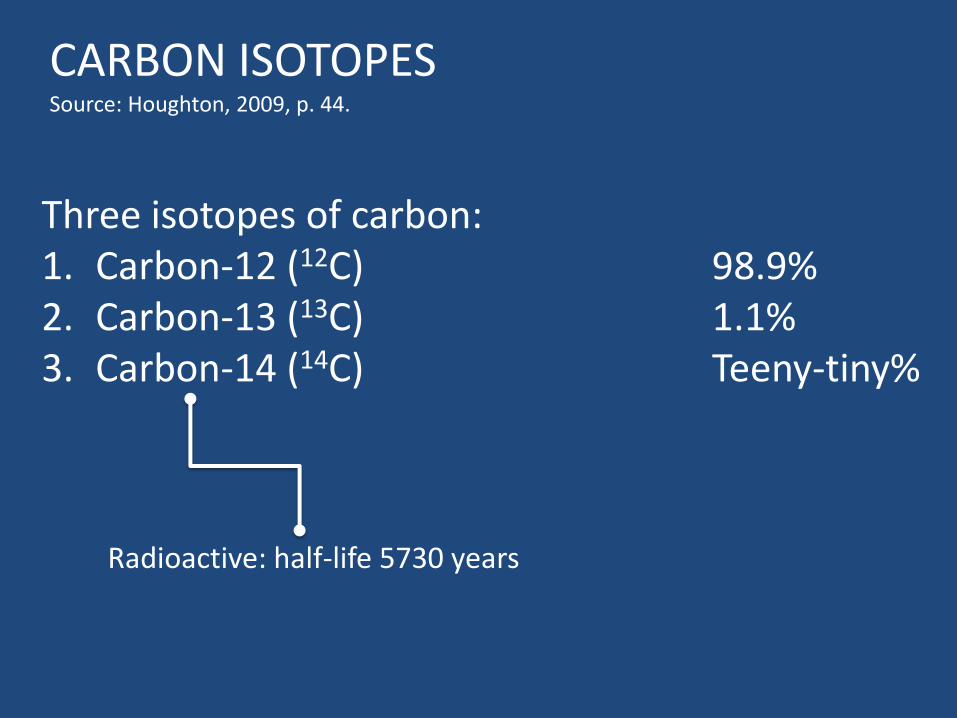
CARBON ISOTOPES Source: Houghton, 2009, p. 44.
Three isotopes of carbon: 1. Carbon-12 (12C) 98.9% 2. Carbon-13 (13C) 1.1% 3. Carbon-14 (14C) Teeny-tiny%
Radioactive: half-life 5730 years
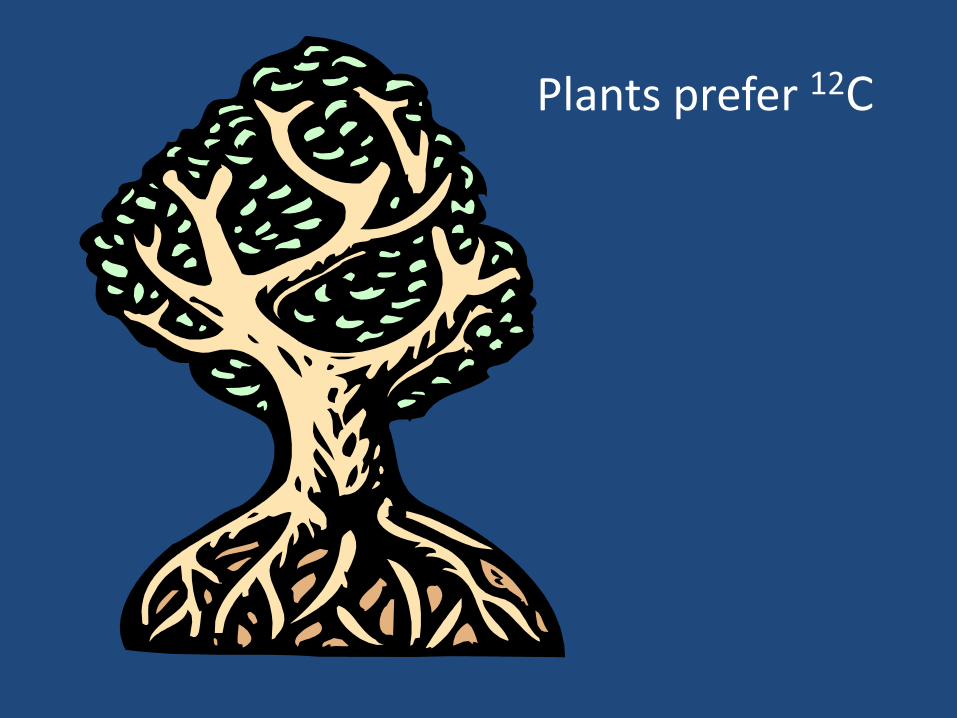
Plants prefer 12C
“Burning buried sunshine” Dukes, J.S., 2003, Climatic Change vol. 61
12C 12C
12C
13C
13C
12C
14C
12C 12C 12C
12C
13C
12C 12C
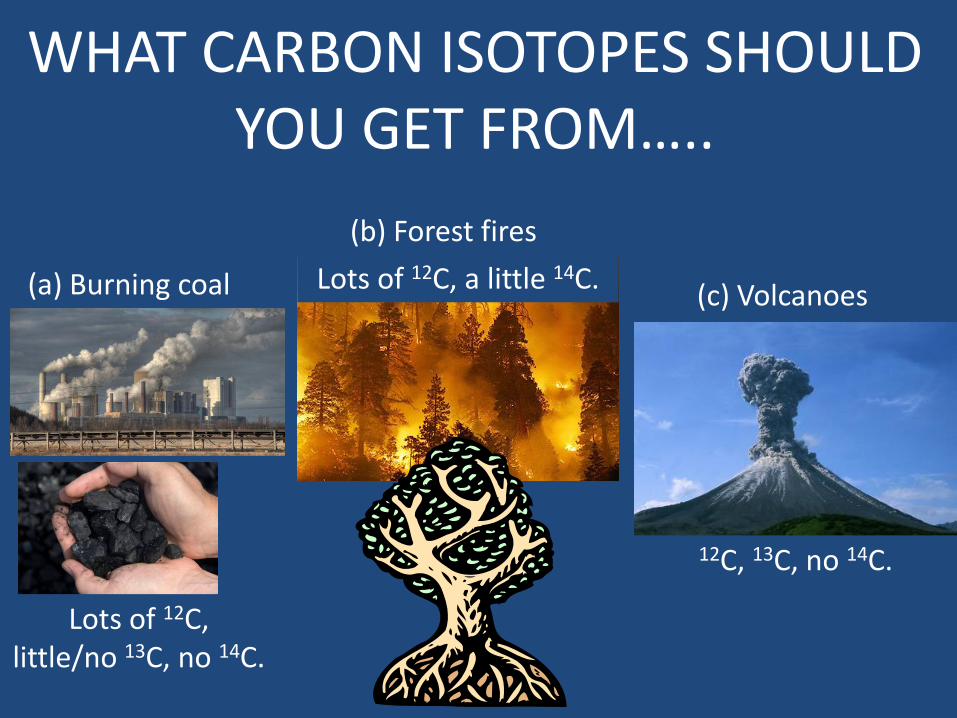
WHAT CARBON ISOTOPES SHOULD YOU GET FROM…..
(a) Burning coal
(b) Forest fires
(c) Volcanoes
Lots of 12C, little/no 13C, no 14C.
Lots of 12C, a little 14C.
12C, 13C, no 14C.
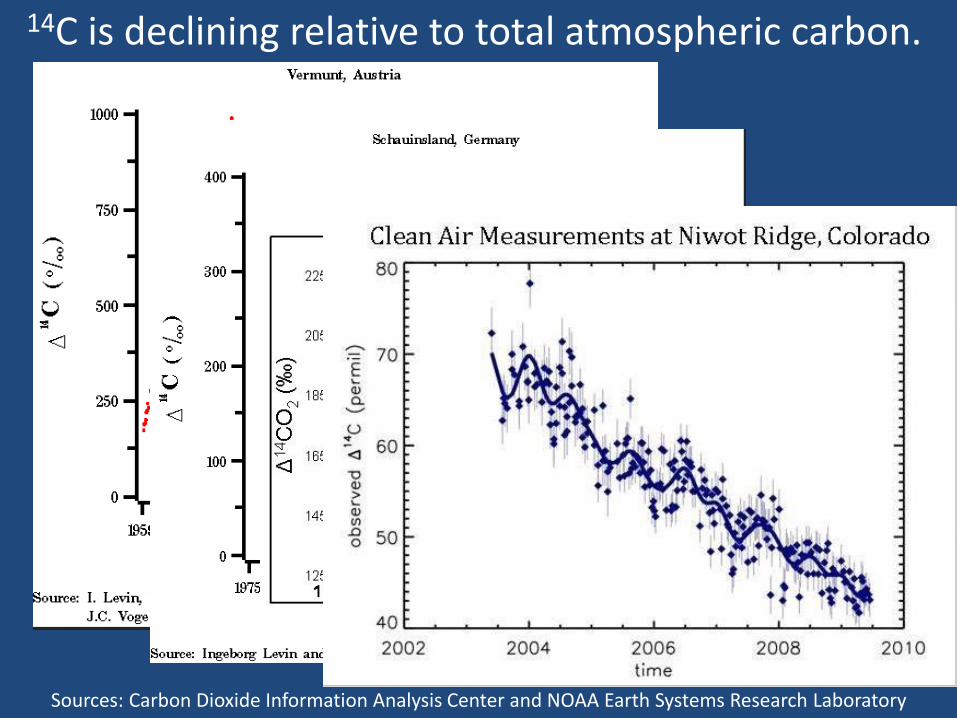
Sources: Carbon Dioxide Information Analysis Center and NOAA Earth Systems Research Laboratory
14C is declining relative to total atmospheric carbon.
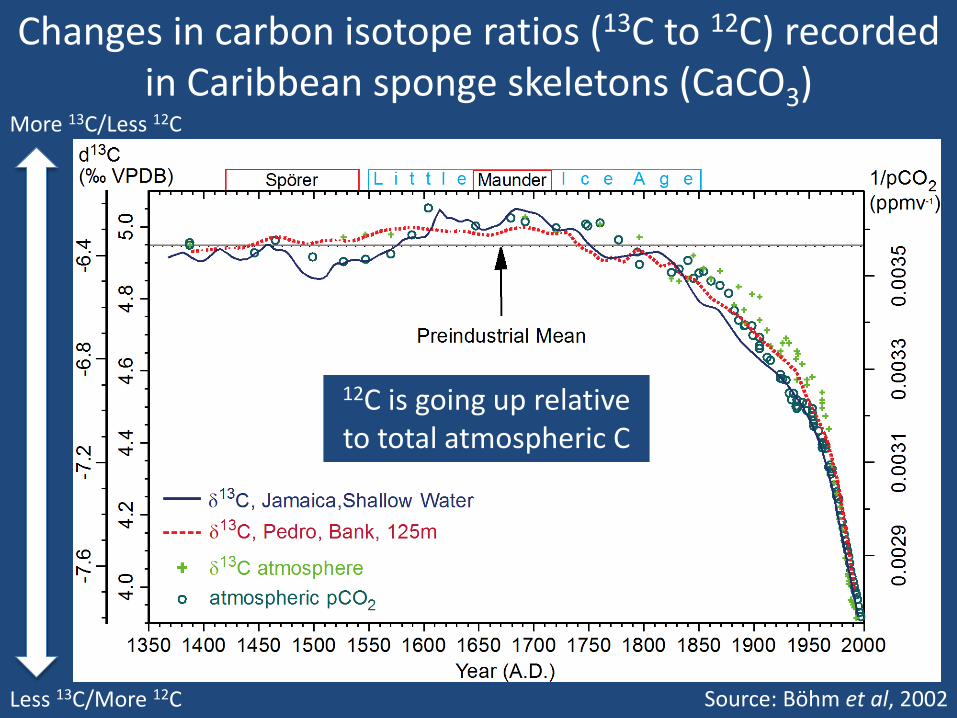
Changes in carbon isotope ratios (13C to 12C) recorded in Caribbean sponge skeletons (CaCO3)
More 13C/Less 12C
Less 13C/More 12C Source: Böhm et al, 2002
12C is going up relative to total atmospheric C
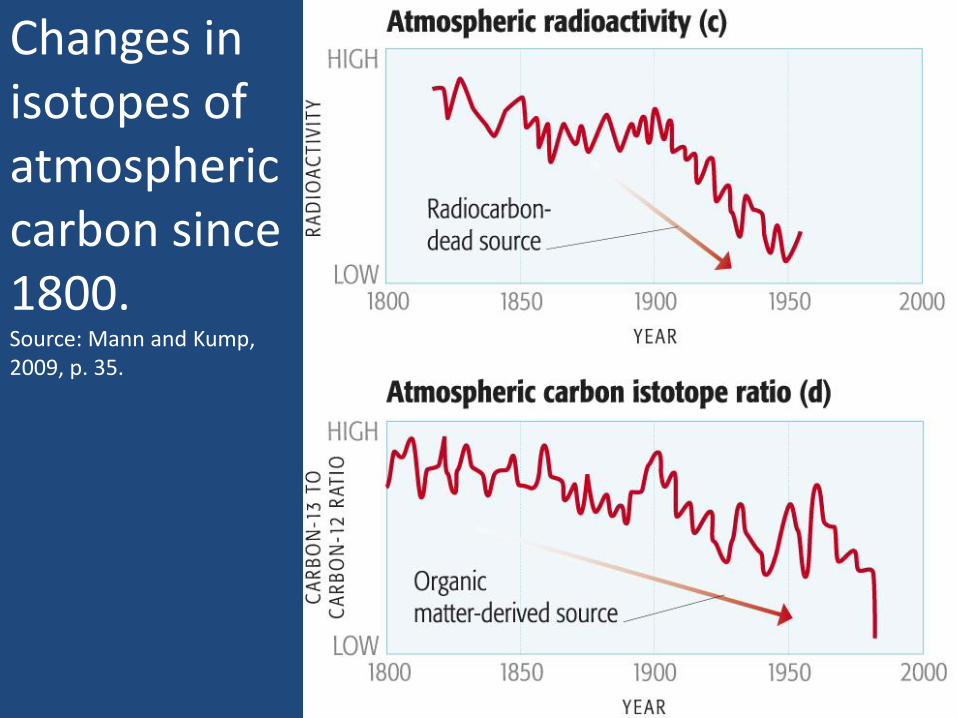
Changes in isotopes of atmospheric carbon since 1800. Source: Mann and Kump, 2009, p. 35.

1. When did the spike begin?
About the same time as the Industrial Revolution
2. Is the recent CO2 spike outside the natural range?
YES 3. Do human activities produce enough CO2?
YES 4. Is the chemistry consistent with fossil fuels?
YES
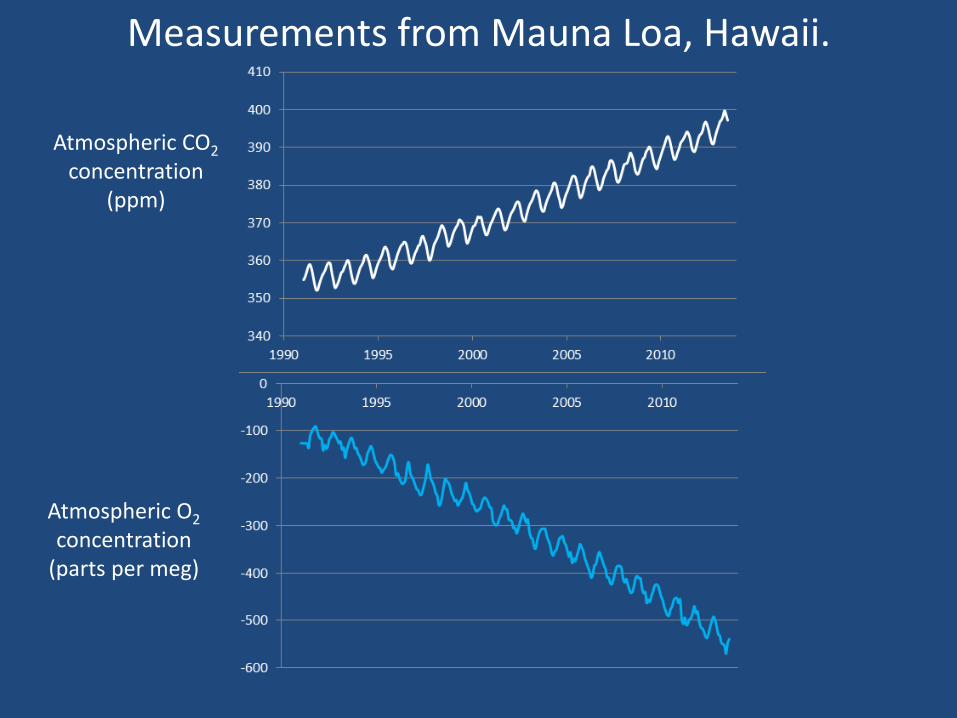
Atmospheric CO2 concentration
(ppm)
Atmospheric O2 concentration
(parts per meg)
Measurements from Mauna Loa, Hawaii.

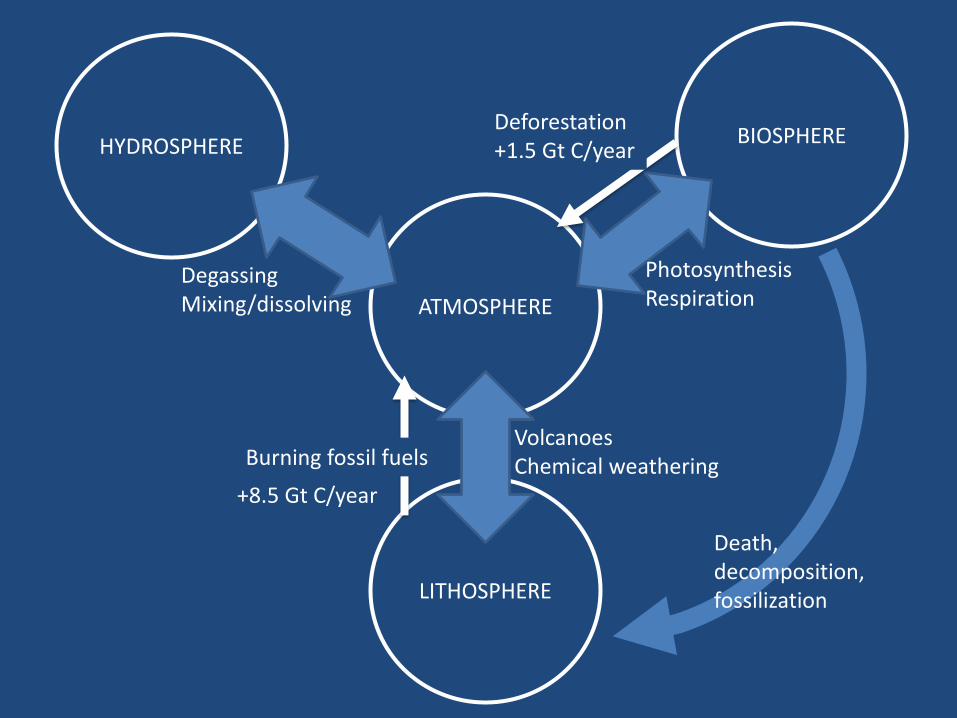
ATMOSPHERE
BIOSPHERE
LITHOSPHERE
HYDROSPHERE
Photosynthesis Respiration
Volcanoes Chemical weathering
Degassing Mixing/dissolving
Death, decomposition, fossilization
Burning fossil fuels
ATMOSPHERE
BIOSPHERE
LITHOSPHERE
HYDROSPHERE
Photosynthesis Respiration
Volcanoes Chemical weathering
Degassing Mixing/dissolving
Death, decomposition, fossilization
Burning fossil fuels
+8.5 Gt C/year
Deforestation+1.5 Gt C/year
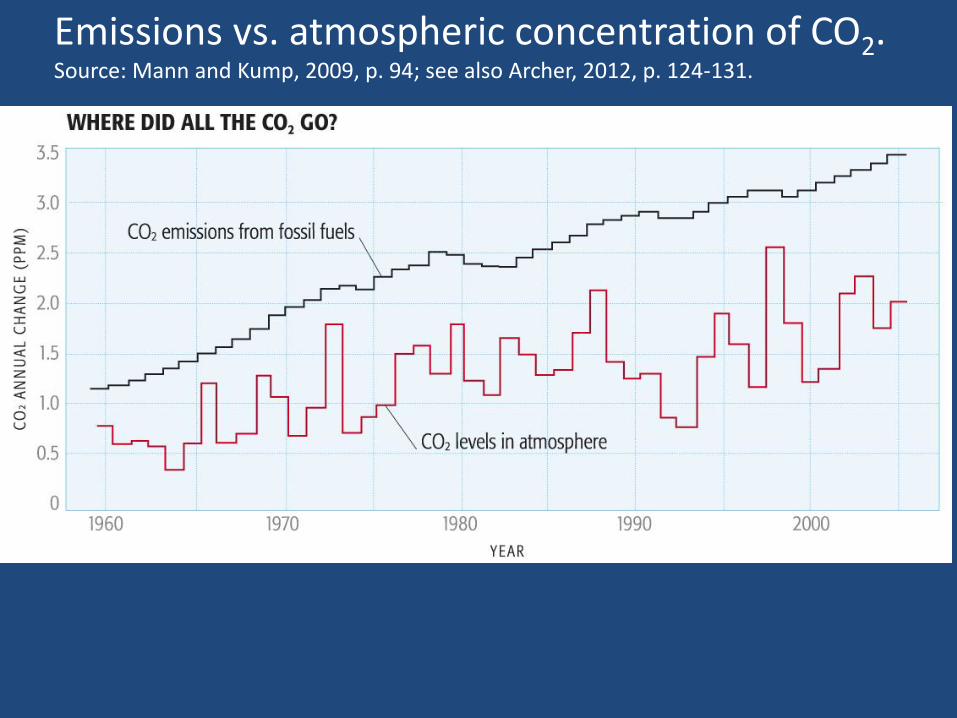
Emissions vs. atmospheric concentration of CO2. Source: Mann and Kump, 2009, p. 94; see also Archer, 2012, p. 124-131.
ATMOSPHERE
BIOSPHERE
LITHOSPHERE
HYDROSPHERE
Photosynthesis Respiration
Volcanoes Chemical weathering
Degassing Mixing/dissolving
Death, decomposition, fossilization
Burning fossil fuels
+8.5 Gt C/year
Deforestation+1.5 Gt C/year
+10 Gt C/year
+4 Gt C/year
Source: Winner, 2011, The socioeconomic costs of ocean
acidification, Oceanus March 21 2011, available
http://www.whoi.edu/oceanus/viewArticle.do?id=65266
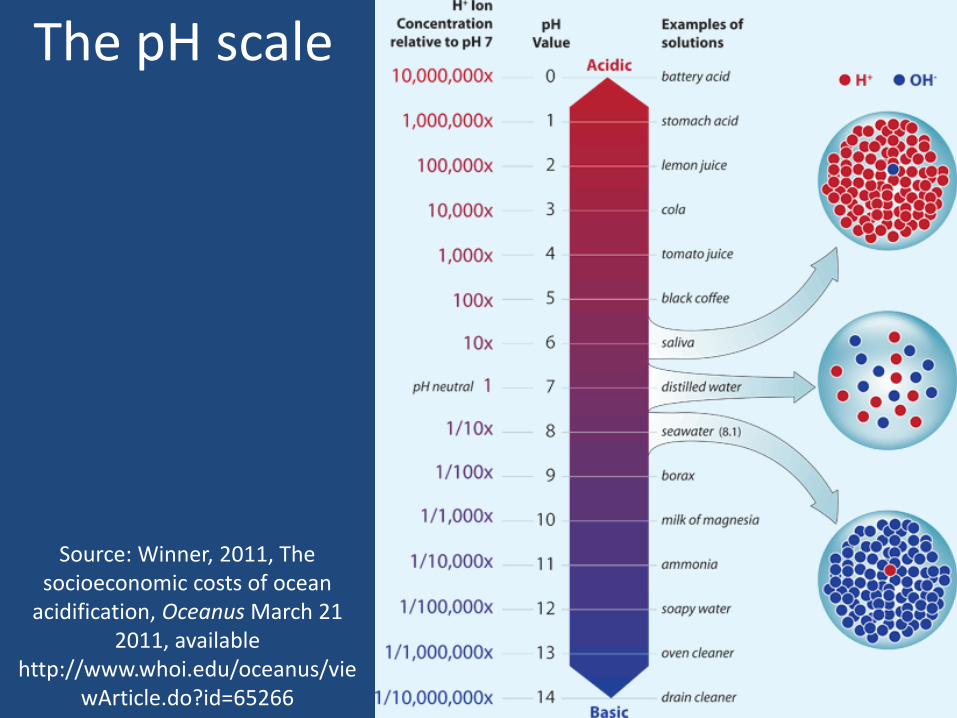
The pH scale
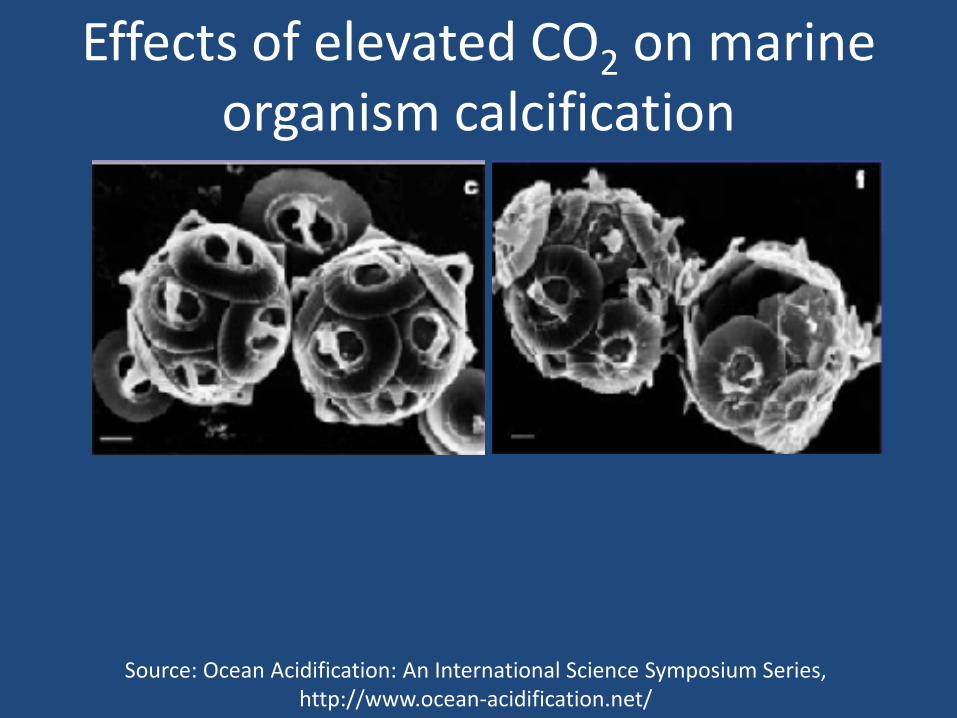
Effects of elevated CO2 on marine organism calcification
Source: Ocean Acidification: An International Science Symposium Series, http://www.ocean-acidification.net/
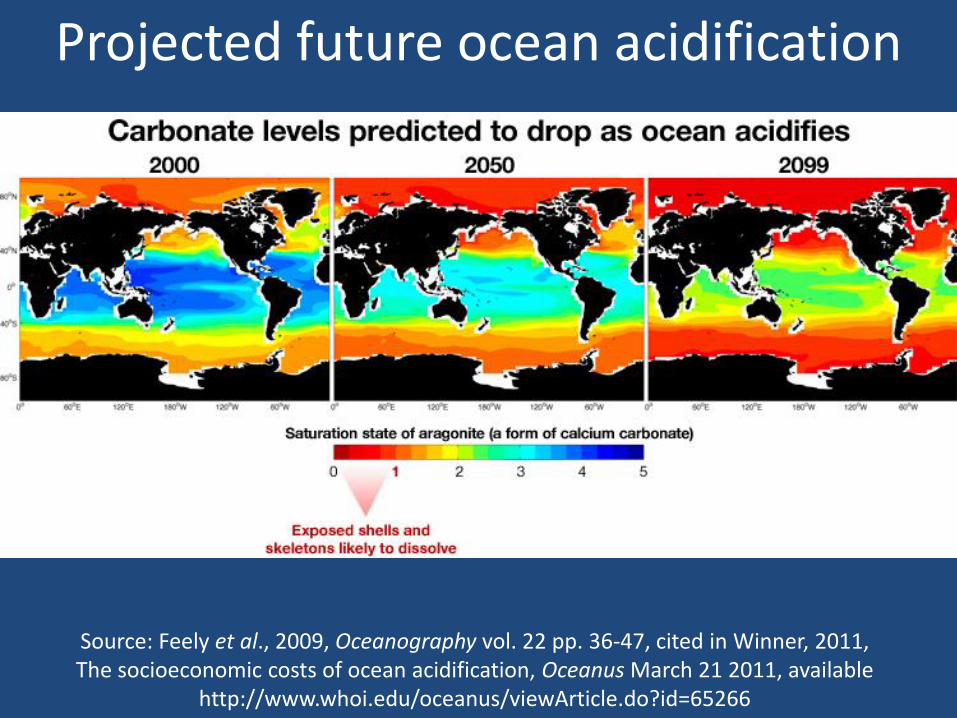
Source: Feely et al., 2009, Oceanography vol. 22 pp. 36-47, cited in Winner, 2011, The socioeconomic costs of ocean acidification, Oceanus March 21 2011, available
http://www.whoi.edu/oceanus/viewArticle.do?id=65266
Projected future ocean acidification
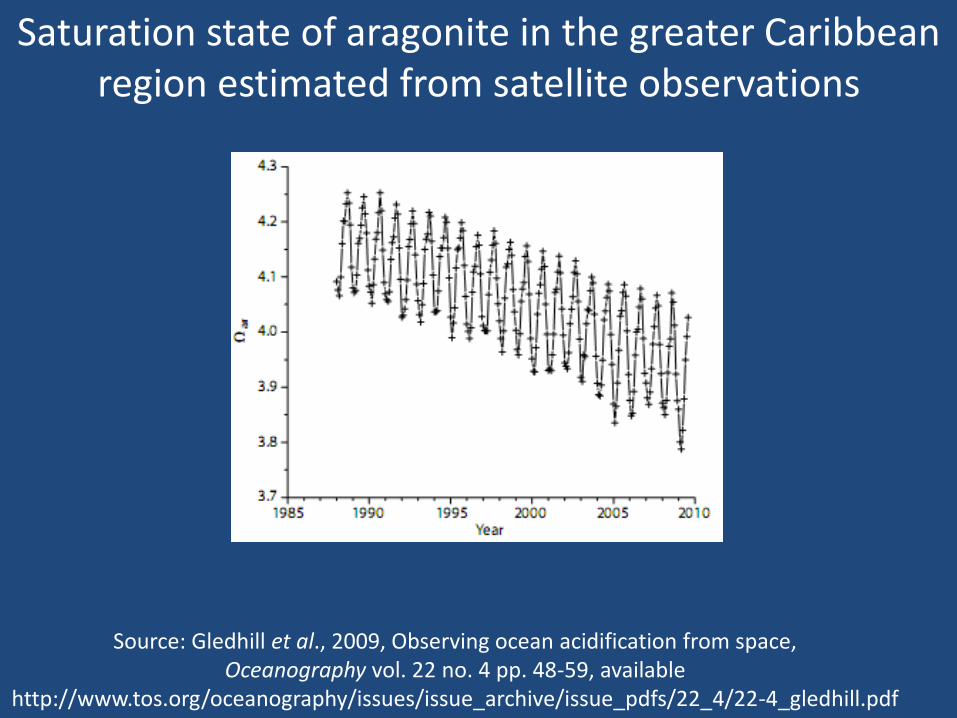
Saturation state of aragonite in the greater Caribbean region estimated from satellite observations
Source: Gledhill et al., 2009, Observing ocean acidification from space, Oceanography vol. 22 no. 4 pp. 48-59, available
http://www.tos.org/oceanography/issues/issue_archive/issue_pdfs/22_4/22-4_gledhill.pdf
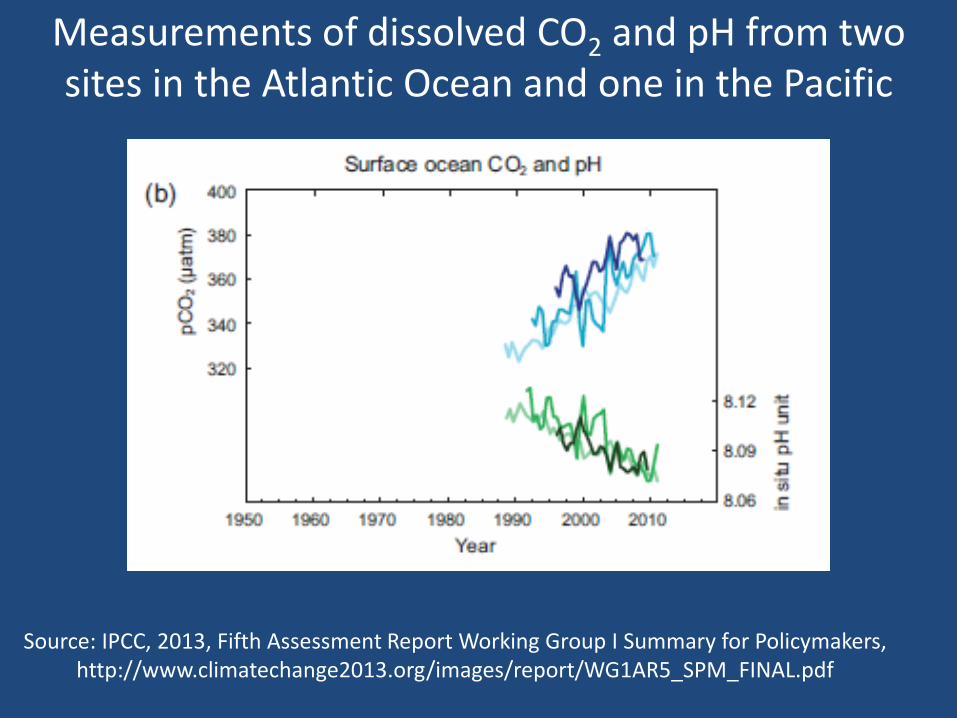
Measurements of dissolved CO2 and pH from two sites in the Atlantic Ocean and one in the Pacific
Source: IPCC, 2013, Fifth Assessment Report Working Group I Summary for Policymakers, http://www.climatechange2013.org/images/report/WG1AR5_SPM_FINAL.pdf
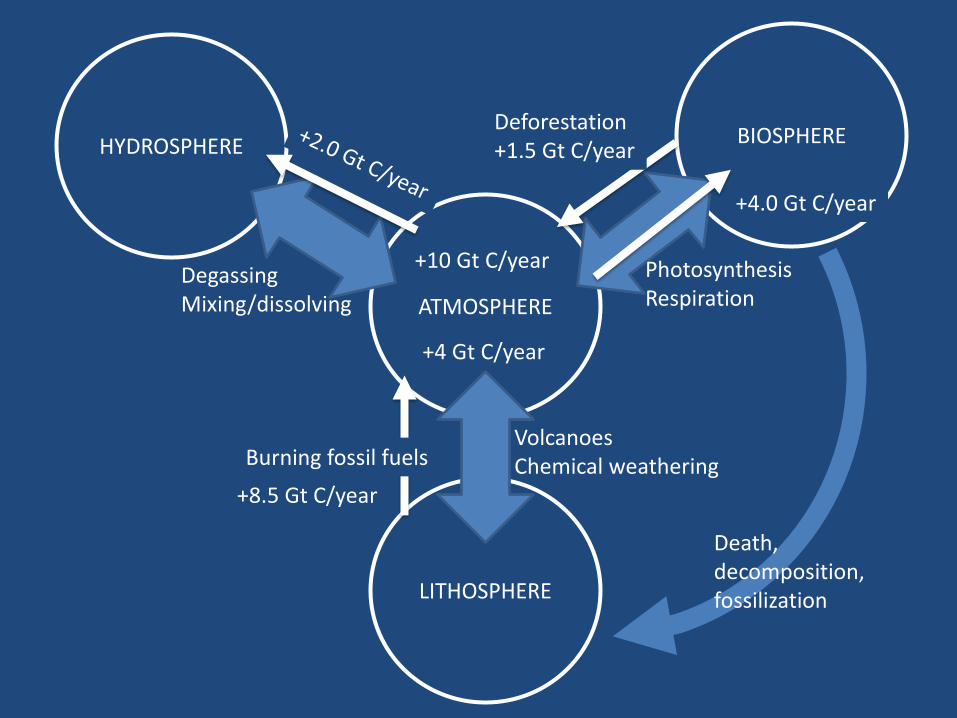
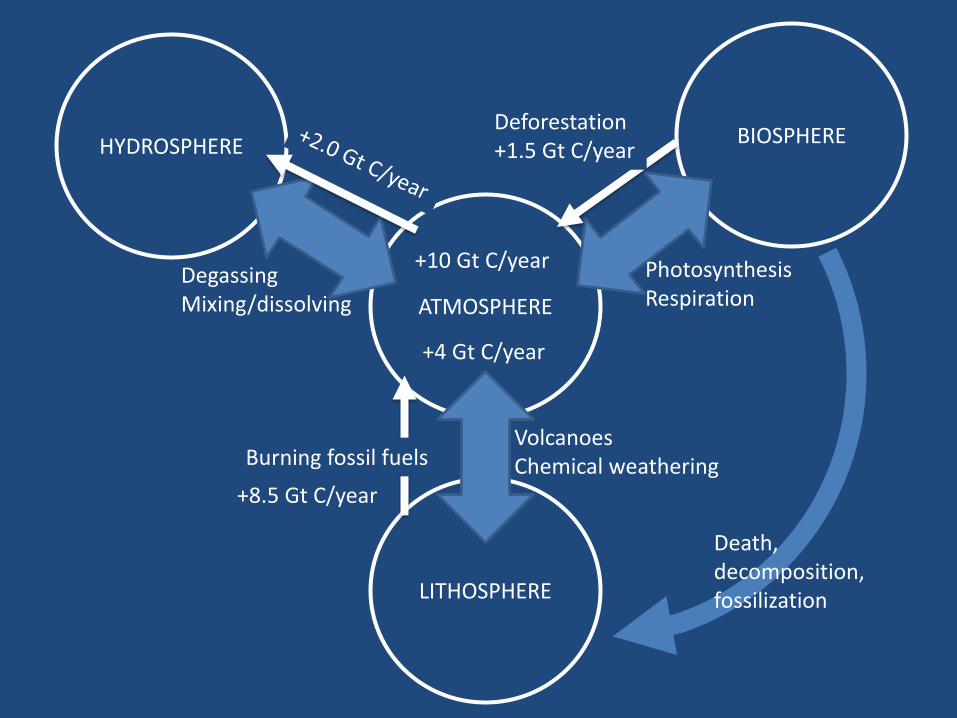
ATMOSPHERE
BIOSPHERE
LITHOSPHERE
HYDROSPHERE
Photosynthesis Respiration
Volcanoes Chemical weathering
Degassing Mixing/dissolving
Death, decomposition, fossilization
Burning fossil fuels
+8.5 Gt C/year
Deforestation+1.5 Gt C/year
+10 Gt C/year
+4 Gt C/year
+4.0 Gt C/year
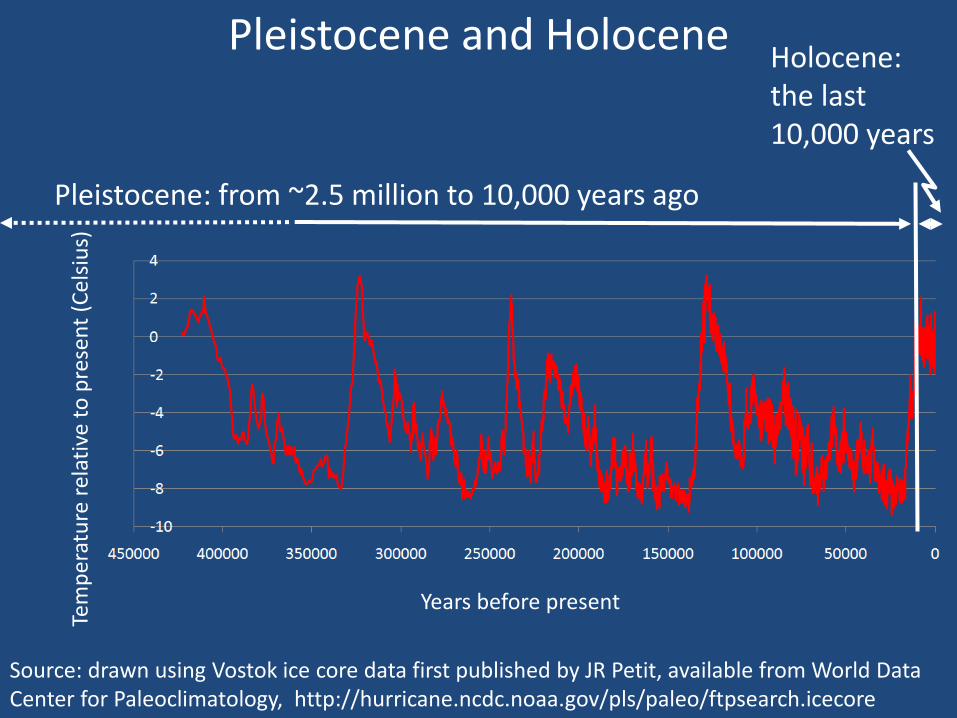
Years before present
Tem
per
atu
re r
elat
ive
to p
rese
nt
(Cel
siu
s)
Pleistocene and Holocene
Source: drawn using Vostok ice core data first published by JR Petit, available from World Data Center for Paleoclimatology, http://hurricane.ncdc.noaa.gov/pls/paleo/ftpsearch.icecore
Pleistocene: from ~2.5 million to 10,000 years ago
Holocene: the last 10,000 years
COLD
WARM
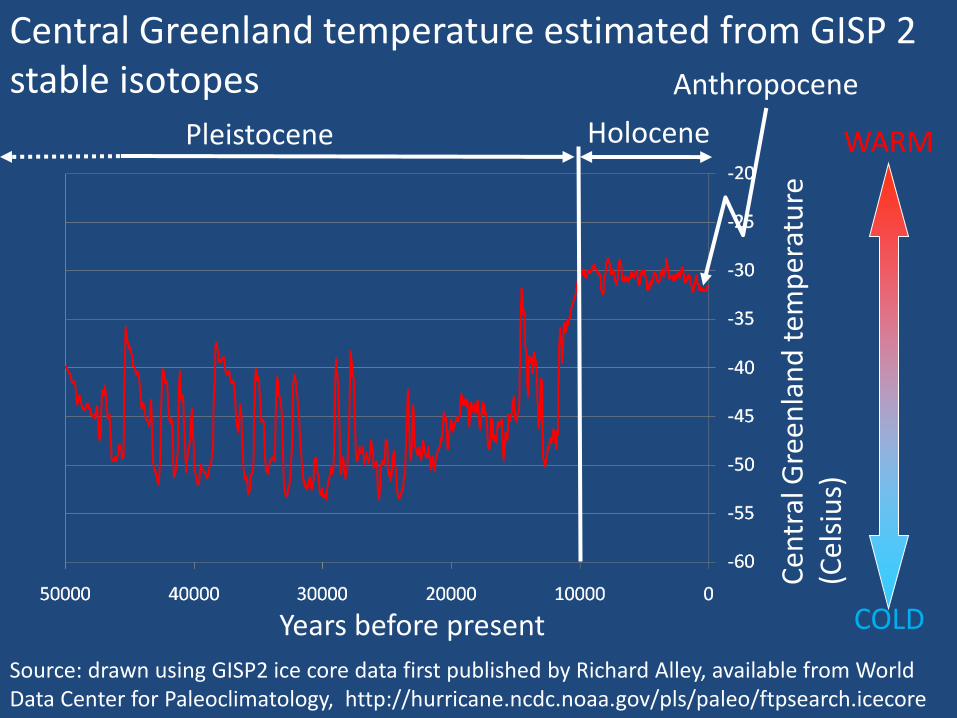
Years before present
Ce
ntr
al G
ree
nla
nd
tem
per
atu
re
(Cel
siu
s)
Pleistocene Holocene
Source: drawn using GISP2 ice core data first published by Richard Alley, available from World Data Center for Paleoclimatology, http://hurricane.ncdc.noaa.gov/pls/paleo/ftpsearch.icecore
Central Greenland temperature estimated from GISP 2 stable isotopes Anthropocene
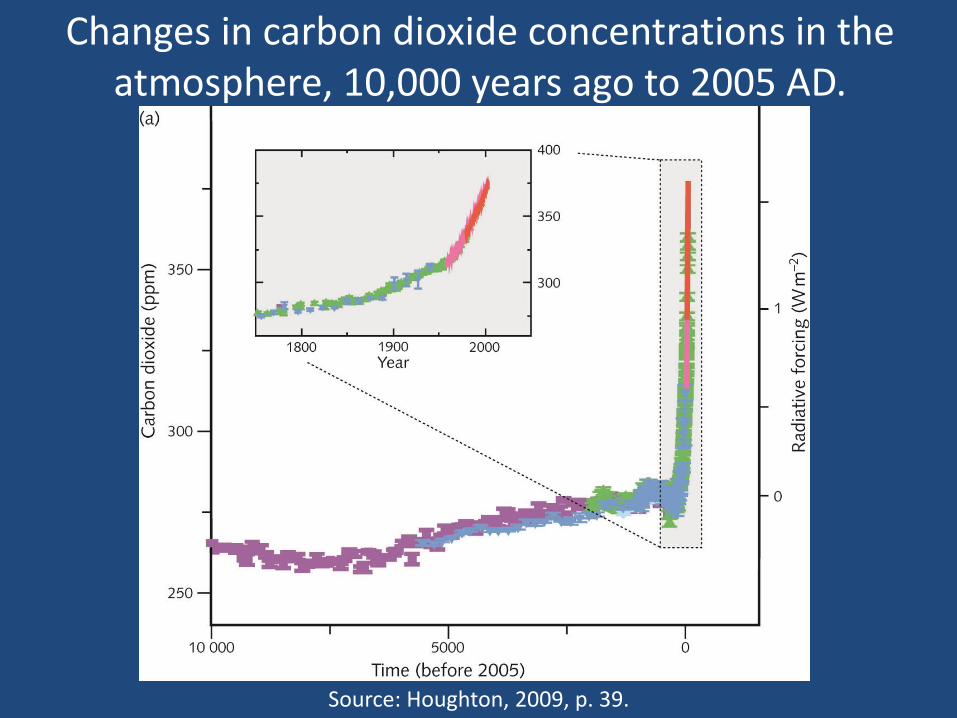
Changes in carbon dioxide concentrations in the atmosphere, 10,000 years ago to 2005 AD.
Source: Houghton, 2009, p. 39.
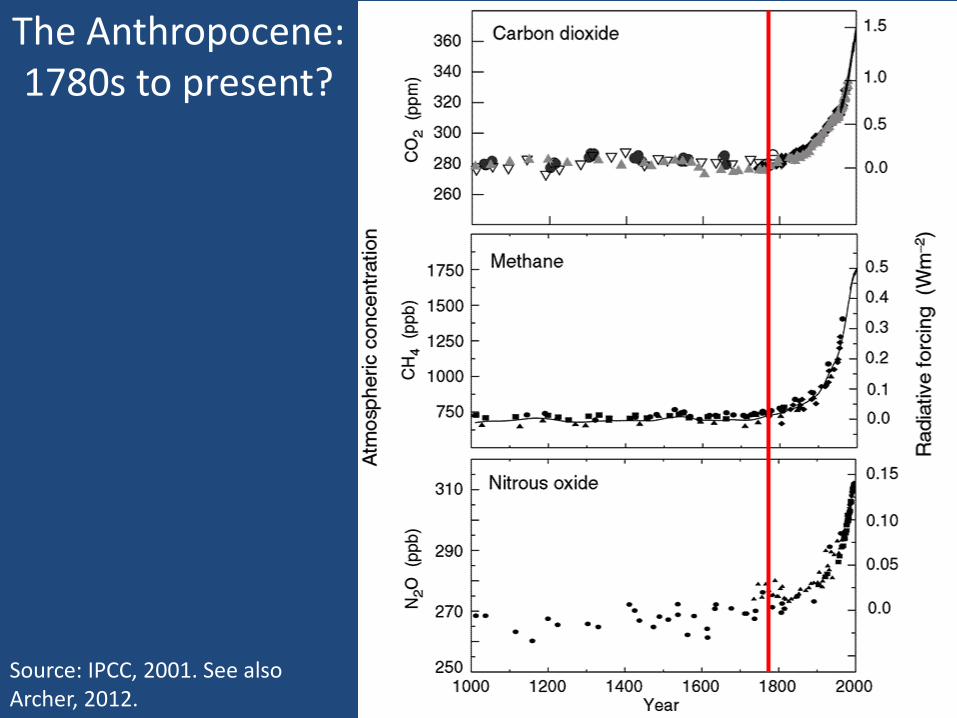
The Anthropocene: 1780s to present?
Source: IPCC, 2001. See also Archer, 2012.