Embed Size (px)
Citation preview
FORT PECK RESERVATIONList of Topics ?
BACKGROUND
Reservation Overview
Regional Geologic Overview
GEOLOGIC OVERVIEW
Geologic History
Summary of Play types
CONVENTIONAL PLAY TYPES
Play 1 - Folded Structure Mississippian Carbonate Play
Play 2 - Ordovician Red River Play
Play 3 - Devonian Nisku-Salt Collapse Play
CONVENTIONAL / UNCONVENTIONAL PLAY TYPES
Plays 4,5,6 - Pre-Prairie (Winnipegois/Interlake), Pre-Red River Gas, Bakken Fairway
Play 7 - Cretaceous Sands-Biogenic Gas (Muddy, Judith River, Eagle)
REFERENCES
MontanaFort Peck Reservation
OVERVIEW
FORT PECK INDIAN RESERVATIONThe Assiniboine and Sioux Tribes
Tribal Headquarters Poplar, MontanaGeologic Setting Western Williston Basin
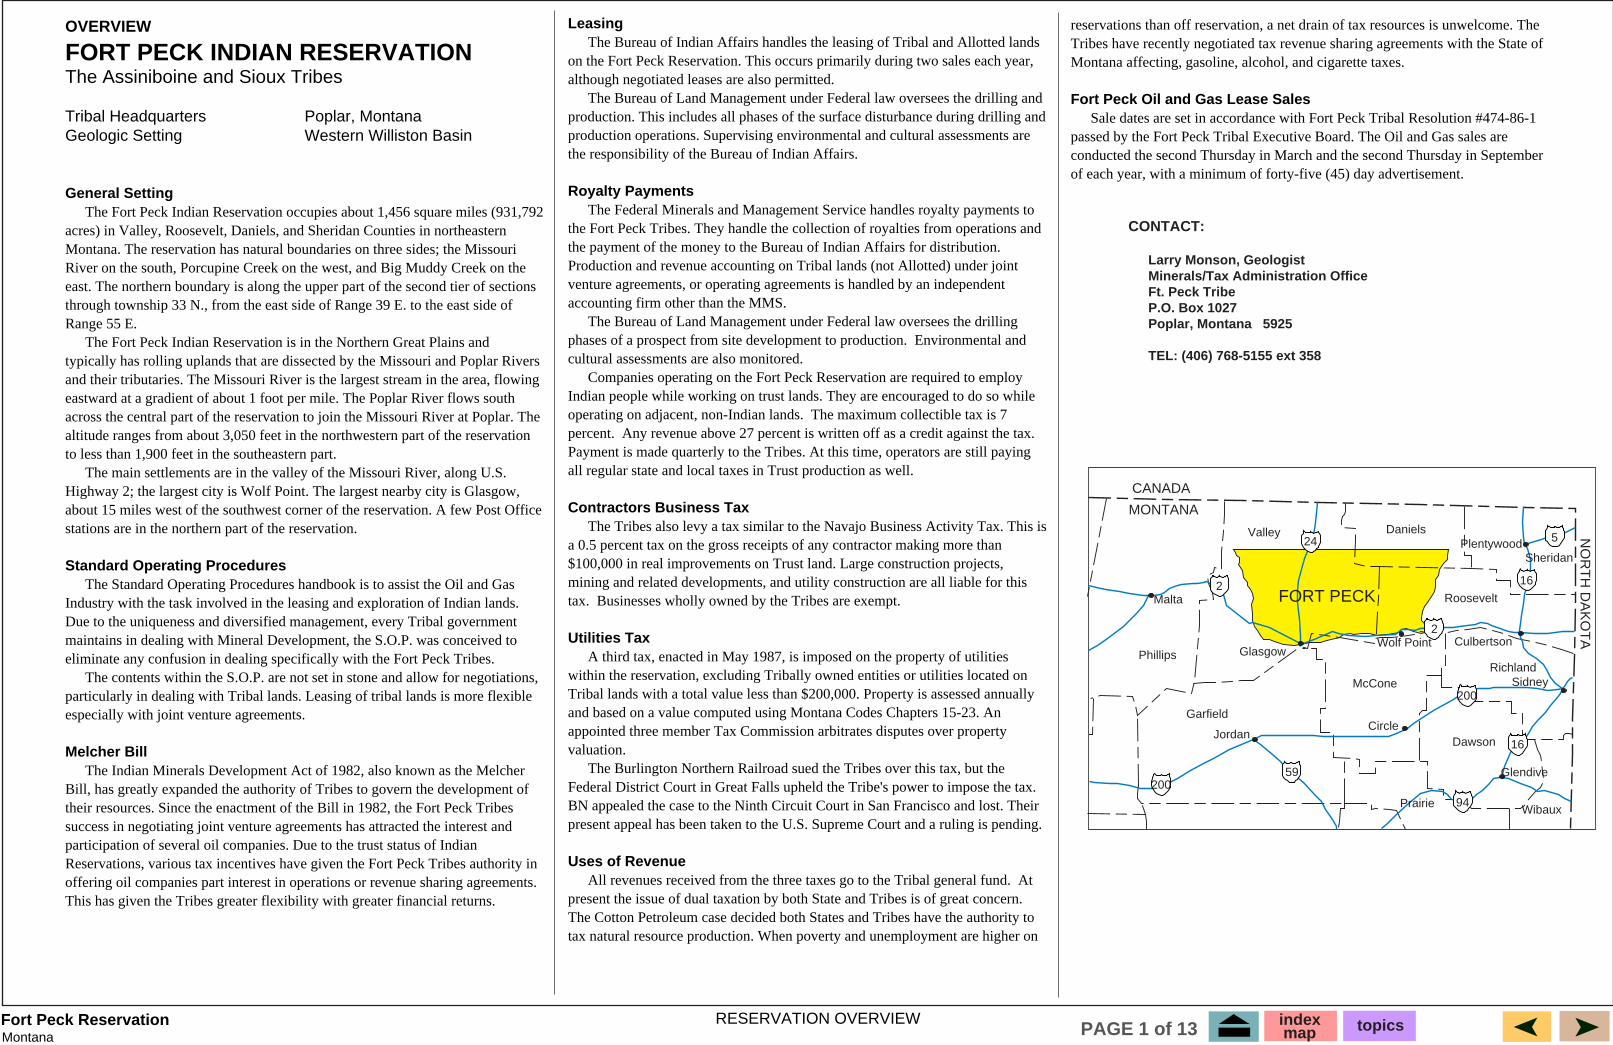
General Setting The Fort Peck Indian Reservation occupies about 1,456 square miles (931,792 acres) in Valley, Roosevelt, Daniels, and Sheridan Counties in northeastern Montana. The reservation has natural boundaries on three sides; the Missouri River on the south, Porcupine Creek on the west, and Big Muddy Creek on the east. The northern boundary is along the upper part of the second tier of sections through township 33 N., from the east side of Range 39 E. to the east side of Range 55 E. The Fort Peck Indian Reservation is in the Northern Great Plains and typically has rolling uplands that are dissected by the Missouri and Poplar Rivers and their tributaries. The Missouri River is the largest stream in the area, flowing eastward at a gradient of about 1 foot per mile. The Poplar River flows south across the central part of the reservation to join the Missouri River at Poplar. The altitude ranges from about 3,050 feet in the northwestern part of the reservation to less than 1,900 feet in the southeastern part. The main settlements are in the valley of the Missouri River, along U.S. Highway 2; the largest city is Wolf Point. The largest nearby city is Glasgow, about 15 miles west of the southwest corner of the reservation. A few Post Office stations are in the northern part of the reservation.
Standard Operating Procedures The Standard Operating Procedures handbook is to assist the Oil and Gas Industry with the task involved in the leasing and exploration of Indian lands. Due to the uniqueness and diversified management, every Tribal government maintains in dealing with Mineral Development, the S.O.P. was conceived to eliminate any confusion in dealing specifically with the Fort Peck Tribes. The contents within the S.O.P. are not set in stone and allow for negotiations, particularly in dealing with Tribal lands. Leasing of tribal lands is more flexible especially with joint venture agreements.
Melcher Bill The Indian Minerals Development Act of 1982, also known as the Melcher Bill, has greatly expanded the authority of Tribes to govern the development of their resources. Since the enactment of the Bill in 1982, the Fort Peck Tribes success in negotiating joint venture agreements has attracted the interest and participation of several oil companies. Due to the trust status of Indian Reservations, various tax incentives have given the Fort Peck Tribes authority in offering oil companies part interest in operations or revenue sharing agreements. This has given the Tribes greater flexibility with greater financial returns.
Leasing The Bureau of Indian Affairs handles the leasing of Tribal and Allotted lands on the Fort Peck Reservation. This occurs primarily during two sales each year, although negotiated leases are also permitted. The Bureau of Land Management under Federal law oversees the drilling and production. This includes all phases of the surface disturbance during drilling and production operations. Supervising environmental and cultural assessments are the responsibility of the Bureau of Indian Affairs.
Royalty Payments The Federal Minerals and Management Service handles royalty payments to the Fort Peck Tribes. They handle the collection of royalties from operations and the payment of the money to the Bureau of Indian Affairs for distribution. Production and revenue accounting on Tribal lands (not Allotted) under joint venture agreements, or operating agreements is handled by an independent accounting firm other than the MMS. The Bureau of Land Management under Federal law oversees the drilling phases of a prospect from site development to production. Environmental and cultural assessments are also monitored. Companies operating on the Fort Peck Reservation are required to employ Indian people while working on trust lands. They are encouraged to do so while operating on adjacent, non-Indian lands. The maximum collectible tax is 7 percent. Any revenue above 27 percent is written off as a credit against the tax. Payment is made quarterly to the Tribes. At this time, operators are still paying all regular state and local taxes in Trust production as well.
Contractors Business Tax The Tribes also levy a tax similar to the Navajo Business Activity Tax. This is a 0.5 percent tax on the gross receipts of any contractor making more than $100,000 in real improvements on Trust land. Large construction projects, mining and related developments, and utility construction are all liable for this tax. Businesses wholly owned by the Tribes are exempt.
Utilities Tax A third tax, enacted in May 1987, is imposed on the property of utilities within the reservation, excluding Tribally owned entities or utilities located on Tribal lands with a total value less than $200,000. Property is assessed annually and based on a value computed using Montana Codes Chapters 15-23. An appointed three member Tax Commission arbitrates disputes over property valuation. The Burlington Northern Railroad sued the Tribes over this tax, but the Federal District Court in Great Falls upheld the Tribe's power to impose the tax. BN appealed the case to the Ninth Circuit Court in San Francisco and lost. Their present appeal has been taken to the U.S. Supreme Court and a ruling is pending.
Uses of Revenue All revenues received from the three taxes go to the Tribal general fund. At present the issue of dual taxation by both State and Tribes is of great concern. The Cotton Petroleum case decided both States and Tribes have the authority to tax natural resource production. When poverty and unemployment are higher on
reservations than off reservation, a net drain of tax resources is unwelcome. The Tribes have recently negotiated tax revenue sharing agreements with the State of Montana affecting, gasoline, alcohol, and cigarette taxes.
Fort Peck Oil and Gas Lease Sales Sale dates are set in accordance with Fort Peck Tribal Resolution #474-86-1 passed by the Fort Peck Tribal Executive Board. The Oil and Gas sales are conducted the second Thursday in March and the second Thursday in September of each year, with a minimum of forty-five (45) day advertisement.
Phillips
Garfield
Malta
59
200
24
2
94
16
5
16
Glasgow
JordanCircle
Wolf Point
Plentywood
Culbertson
Sidney
Glendive
Valley
McCone
Prairie
Dawson
Daniels
Roosevelt
Sheridan
Richland
Wibaux
2
200
CANADA
MONTANA
NO
RT
H D
AK
OT
A
RESERVATION OVERVIEW
FORT PECK
CONTACT:
Larry Monson, Geologist Minerals/Tax Administration Office Ft. Peck Tribe P.O. Box 1027 Poplar, Montana 5925
TEL: (406) 768-5155 ext 358
indexmap topicsPAGE 1 of 13
MontanaFort Peck Reservation
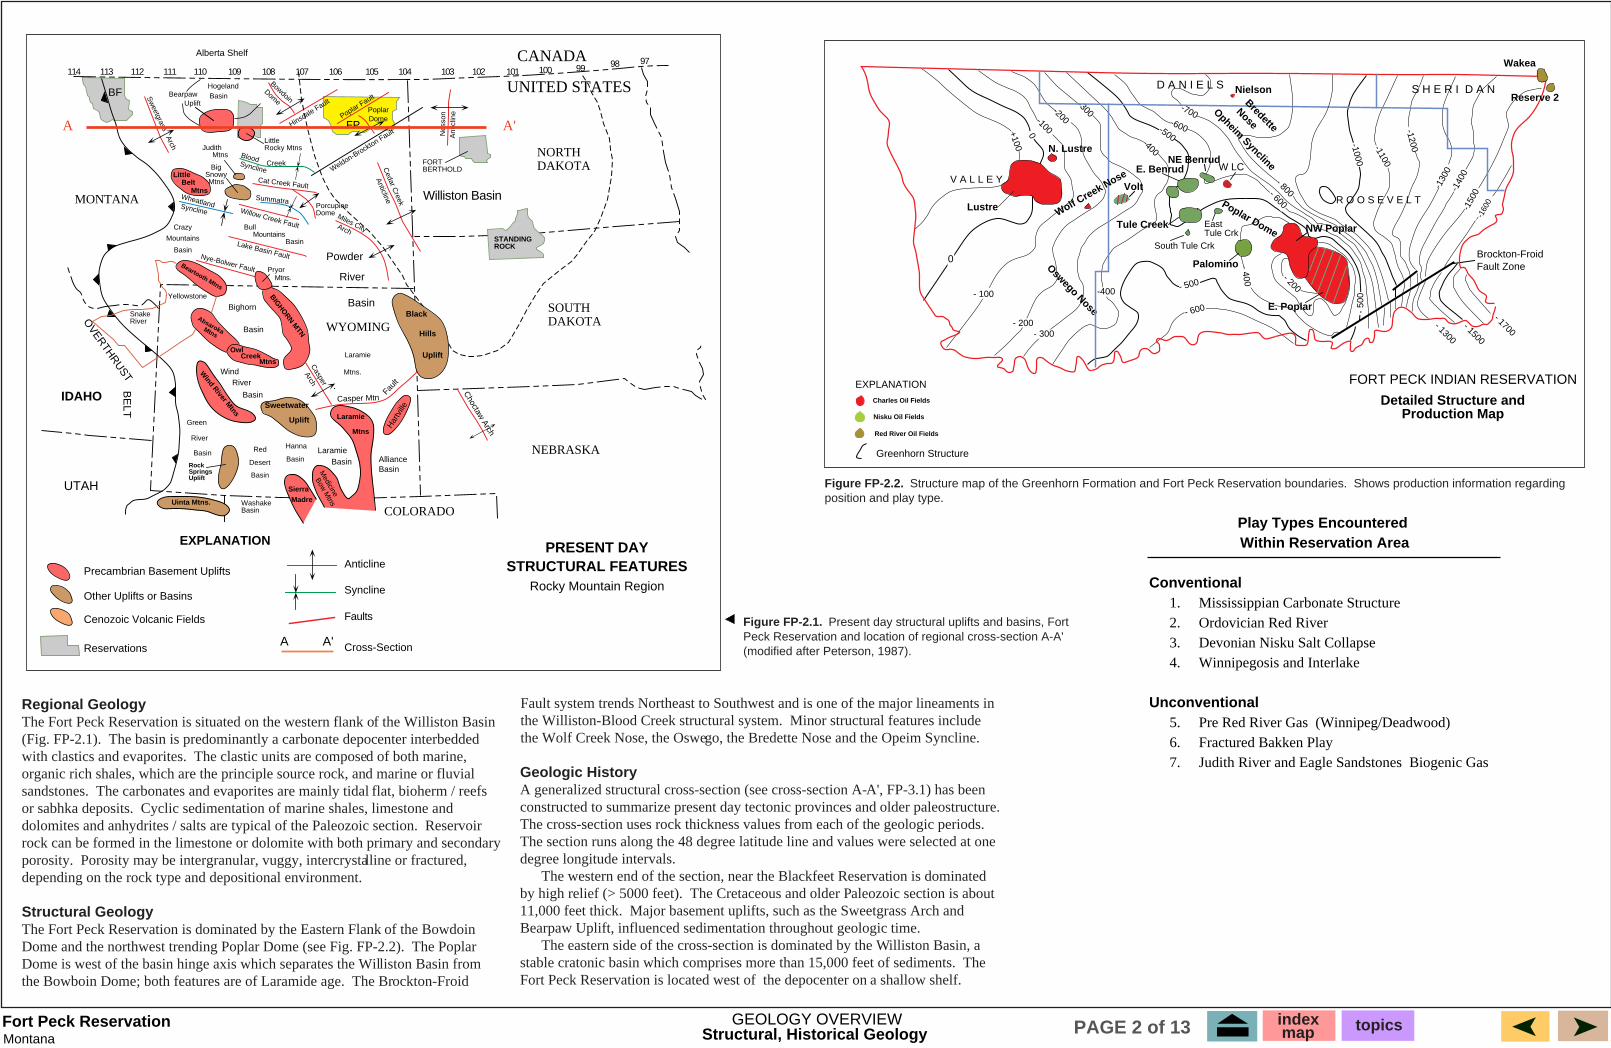
Figure FP-2.1. Present day structural uplifts and basins, Fort Peck Reservation and location of regional cross-section A-A' (modified after Peterson, 1987).
Regional GeologyThe Fort Peck Reservation is situated on the western flank of the Williston Basin (Fig. FP-2.1). The basin is predominantly a carbonate depocenter interbedded with clastics and evaporites. The clastic units are composed of both marine, organic rich shales, which are the principle source rock, and marine or fluvial sandstones. The carbonates and evaporites are mainly tidal flat, bioherm / reefs or sabhka deposits. Cyclic sedimentation of marine shales, limestone and dolomites and anhydrites / salts are typical of the Paleozoic section. Reservoir rock can be formed in the limestone or dolomite with both primary and secondary porosity. Porosity may be intergranular, vuggy, intercrystalline or fractured, depending on the rock type and depositional environment.
Structural GeologyThe Fort Peck Reservation is dominated by the Eastern Flank of the Bowdoin Dome and the northwest trending Poplar Dome (see Fig. FP-2.2). The Poplar Dome is west of the basin hinge axis which separates the Williston Basin from the Bowboin Dome; both features are of Laramide age. The Brockton-Froid
Fault system trends Northeast to Southwest and is one of the major lineaments in the Williston-Blood Creek structural system. Minor structural features include the Wolf Creek Nose, the Oswego, the Bredette Nose and the Opeim Syncline.
Geologic HistoryA generalized structural cross-section (see cross-section A-A', FP-3.1) has been constructed to summarize present day tectonic provinces and older paleostructure. The cross-section uses rock thickness values from each of the geologic periods. The section runs along the 48 degree latitude line and values were selected at one degree longitude intervals. The western end of the section, near the Blackfeet Reservation is dominated by high relief (> 5000 feet). The Cretaceous and older Paleozoic section is about 11,000 feet thick. Major basement uplifts, such as the Sweetgrass Arch and Bearpaw Uplift, influenced sedimentation throughout geologic time.� The eastern side of the cross-section is dominated by the Williston Basin, a stable cratonic basin which comprises more than 15,000 feet of sediments. The Fort Peck Reservation is located west of the depocenter on a shallow shelf.
PRESENT DAYSTRUCTURAL FEATURES
Rocky Mountain RegionPrecambrian Basement Uplifts
Other Uplifts or Basins
Cenozoic Volcanic Fields
Anticline
Syncline
Faults
Cross-Section
BearpawUplift
HogelandBasin
Little
Creek
PorcupineDome
Crazy
Mountains
Basin
BullMountains
Basin
PoplarDome
FP
BF
Yellowstone
Bighorn
Basin
WindRiver
BasinSweetwater
UpliftGreen
River
Basin Red
Desert
Basin
Hanna
Basin
Laramie
Mtns.
Laramie
Mtns
Black
Uplift
SierraMadre
RockSpringsUplift
Uinta Mtns. WashakeBasin
SnakeRiver
OwlCreek
Mtns
Powder
River
Basin
MONTANA
IDAHO
UTAH
WYOMING
COLORADO
NEBRASKA
SOUTHDAKOTA
NORTHDAKOTA
EXPLANATION
A A'
PryorMtns.
114 113 112 111 110 109 108 107 106 105 104 103 102 101 100 99 98 97Alberta Shelf
Williston Basin
Lake Basin FaultNye-Bolwer Fault
BIGHO
RN MTN
Willow Creek Fault
Judith Mtns
BeltMtns
BigSnowyMtns
Beartooth Mtns
Absaroka Mtns
AllianceBasin
Har
tville
Medicine
Bow M
tns
Fault
Choctaw
Arch
Casper Mtn
LaramieBasin
Wind River M
tns
Casper
Arch
Hills
Miles City
Cedar C
reek
Weldon-Brockton Fault
Arch
Anticline
Poplar Fault
FORTBERTHOLD
Nes
son
Ant
iclin
e
STANDINGROCK
Hinsdale Fault
BowdoinDome
LittleRocky Mtns
WheatlandSyncline
BloodSyncline
Sw
eetgrass Arch
Cat Creek Fault
Summatra
UNITED STATES
CANADA
OVER
THR
UST
BE
LT
Reservations
A A'
V A L L E Y
Lustre
E. Benrud
- 300
Oswego Nose
-400
Volt
-300 Opheim Syncline
- 800Poplar Dome
W LCNE Benrud
D A N I E L S
-700
- 1300
- 1500
Brockton-FroidFault Zone
S H E R I D A NNielson
-150
0
R O O S E V E L T
-130
0
N. Lustre
FORT PECK INDIAN RESERVATION
Detailed Structure andProduction Map
EXPLANATION
Charles Oil Fields
Nisku Oil Fields
Red River Oil Fields
Greenhorn Structure
-400
-200
- 400
Palomino
EastTule Crk
E. Poplar
NW PoplarTule Creek
0
- 200
+100
0
-100
- 50
0
-1000
-1200-1100
- 600
- 500
- 600
South Tule Crk
- 200
-140
0
-160
0
Wakea
Reserve 2
-600-500
Bredette
Nose
Wolf Creek Nose
- 100
- 1700
Figure FP-2.2. Structure map of the Greenhorn Formation and Fort Peck Reservation boundaries. Shows production information regarding position and play type.
Play Types Encountered Within Reservation Area
Conventional 1. Mississippian Carbonate Structure 2. Ordovician Red River 3. Devonian Nisku Salt Collapse 4. Winnipegosis and Interlake
Unconventional 5. Pre Red River Gas (Winnipeg/Deadwood) 6. Fractured Bakken Play 7. Judith River and Eagle Sandstones Biogenic Gas
GEOLOGY OVERVIEWStructural, Historical Geology
indexmap topicsPAGE 2 of 13
Geologic HistoryFort Peck ReservationMontana
0
0
0
10
15
12
10
0
2
26
12 1015
8
10
8
10
Cambrian and older rocksexposed at land surface
Shale, Sandstone and MinorLimestone Facies
Green Shale Facies
Sandstone Facies
EXPLANATION
NEBRASKAOil Field, CambrianReservoir
12
0
AA'
Blackfeet
Ft. Belknap Ft. Peck
Ft.Berthold
Standing Rock
MONTANA
WYOMING
SOUTHDAKOTA
NORTHDAKOTA
10
84
6
4
2
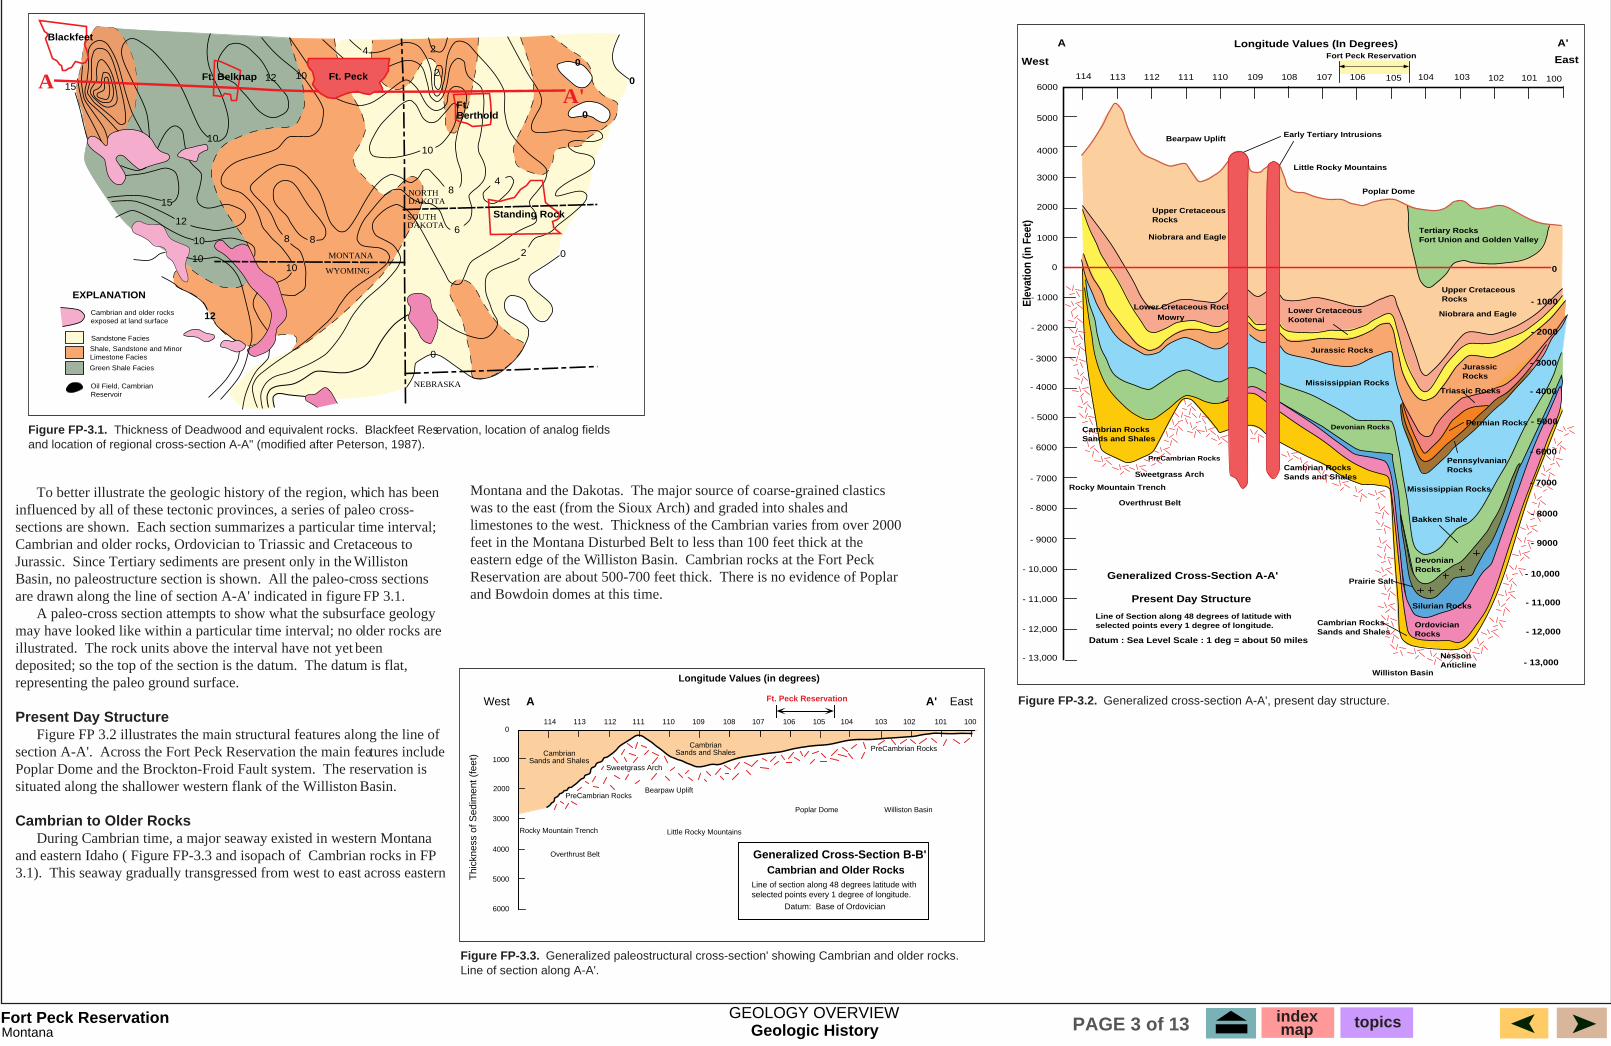
Figure FP-3.1. Thickness of Deadwood and equivalent rocks. Blackfeet Reservation, location of analog fields and location of regional cross-section A-A" (modified after Peterson, 1987).
Williston Basin
PreCambrian Rocks
Poplar Dome
Little Rocky Mountains
Bearpaw Uplift
Cambrian Sands and Shales
Sweetgrass Arch
PreCambrian Rocks2000
3000
4000
5000
6000
1000
0
Rocky Mountain Trench
Overthrust Belt
Thi
ckne
ss o
f Sed
imen
t (fe
et)
Generalized Cross-Section B-B'
West A
114 113 112 111 110 109 108 107 106 105 104 103 102 101 100
Cambrian Sands and Shales
Line of section along 48 degrees latitude withselected points every 1 degree of longitude.
Cambrian and Older Rocks
Datum: Base of Ordovician
Ft. Peck Reservation
Longitude Values (in degrees)
A' East
Figure FP-3.3. Generalized paleostructural cross-section' showing Cambrian and older rocks. Line of section along A-A'.
Niobrara and Eagle
Jurassic Rocks
Mississippian Rocks
Niobrara and Eagle
Upper CretaceousRocks
JurassicRocks
Triassic Rocks
Permian RocksDevonian Rocks
Cambrian RocksSands and Shales
Prairie Salt
DevonianRocks
Silurian Rocks
Mississippian Rocks
PennsylvanianRocks
OrdovicianRocks
Williston Basin
Cambrian RocksSands and Shales
Bakken Shale
Tertiary RocksFort Union and Golden Valley
Poplar Dome
Little Rocky Mountains
Early Tertiary Intrusions
Upper CretaceousRocks
Bearpaw Uplift
Lower CretaceousKootenai
Overthrust Belt
Rocky Mountain Trench
Sweetgrass Arch
Lower Cretaceous RocksMowry
NessonAnticline
- 6000
- 7000
- 8000
PreCambrian Rocks
Cambrian RocksSands and Shales
0
- 1000
- 4000
- 5000
- 2000
- 3000
- 9000
- 10,000
- 11,000
- 12,000
- 13,000
114 113 112 111 110 109 108 107 106 105 104 103 102 101 1006000
5000
4000
3000
2000
1000
0
- 1000
- 2000
- 3000
- 8000
- 9000
- 10,000
- 11,000
- 12,000
- 13,000
- 4000
- 5000
- 6000
- 7000
Longitude Values (In Degrees) A'
EastWest
A
Elev
atio
n (in
Fee
t)
Generalized Cross-Section A-A'
Present Day Structure
Line of Section along 48 degrees of latitude withselected points every 1 degree of longitude.
Datum : Sea Level Scale : 1 deg = about 50 miles
Fort Peck Reservation
Figure FP-3.2. Generalized cross-section A-A', present day structure.
To better illustrate the geologic history of the region, which has been influenced by all of these tectonic provinces, a series of paleo cross-sections are shown. Each section summarizes a particular time interval; Cambrian and older rocks, Ordovician to Triassic and Cretaceous to Jurassic. Since Tertiary sediments are present only in the Williston Basin, no paleostructure section is shown. All the paleo-cross sections are drawn along the line of section A-A' indicated in figure FP 3.1. A paleo-cross section attempts to show what the subsurface geology may have looked like within a particular time interval; no older rocks are illustrated. The rock units above the interval have not yet been deposited; so the top of the section is the datum. The datum is flat, representing the paleo ground surface.
Present Day Structure Figure FP 3.2 illustrates the main structural features along the line of section A-A'. Across the Fort Peck Reservation the main features include Poplar Dome and the Brockton-Froid Fault system. The reservation is situated along the shallower western flank of the Williston Basin.
Cambrian to Older Rocks During Cambrian time, a major seaway existed in western Montana and eastern Idaho ( Figure FP-3.3 and isopach of Cambrian rocks in FP 3.1). This seaway gradually transgressed from west to east across eastern
Montana and the Dakotas. The major source of coarse-grained clastics was to the east (from the Sioux Arch) and graded into shales and limestones to the west. Thickness of the Cambrian varies from over 2000 feet in the Montana Disturbed Belt to less than 100 feet thick at the eastern edge of the Williston Basin. Cambrian rocks at the Fort Peck Reservation are about 500-700 feet thick. There is no evidence of Poplar and Bowdoin domes at this time.
GEOLOGY OVERVIEW indexmap topicsPAGE 3 of 13
MontanaFort Peck Reservation
Triassic Rocks
Permian Rocks
Prairie Salt
Silurian Rocks
Cambrian RocksSands and Shales
Ordovician Rocks
Poplar Dome
Ordovician Rocks
Cambrian RocksSands and Shales
Little Rocky Mountains
Pennsylvanian Rocks
Mississippian Rocks
Bakken Shale
Devonian Rocks
Bakken Shale
Bearpaw Uplift
Sweetgrass ArchPreCambrian Rocks
114 113 112 111 110 109 108 107 106 105
AWEST
104 103 102 101 100
Generalized Cross-Section A-A'Triassic through Ordovician
Line of cross section along 48 degreeslatitude with selected points every 1degree of longitude
DATUM: Base of Jurassic - Permian missing
Rocky Mountain Trench
Overthrust Belt
0
1000
2000
3000
4000
5000
6000Thi
ckne
ss o
f Sed
imen
t (in
ft)
7000
8000
EASTA'Longitude Values (in Degrees)
Williston Basin
Ft. Peck Reservation
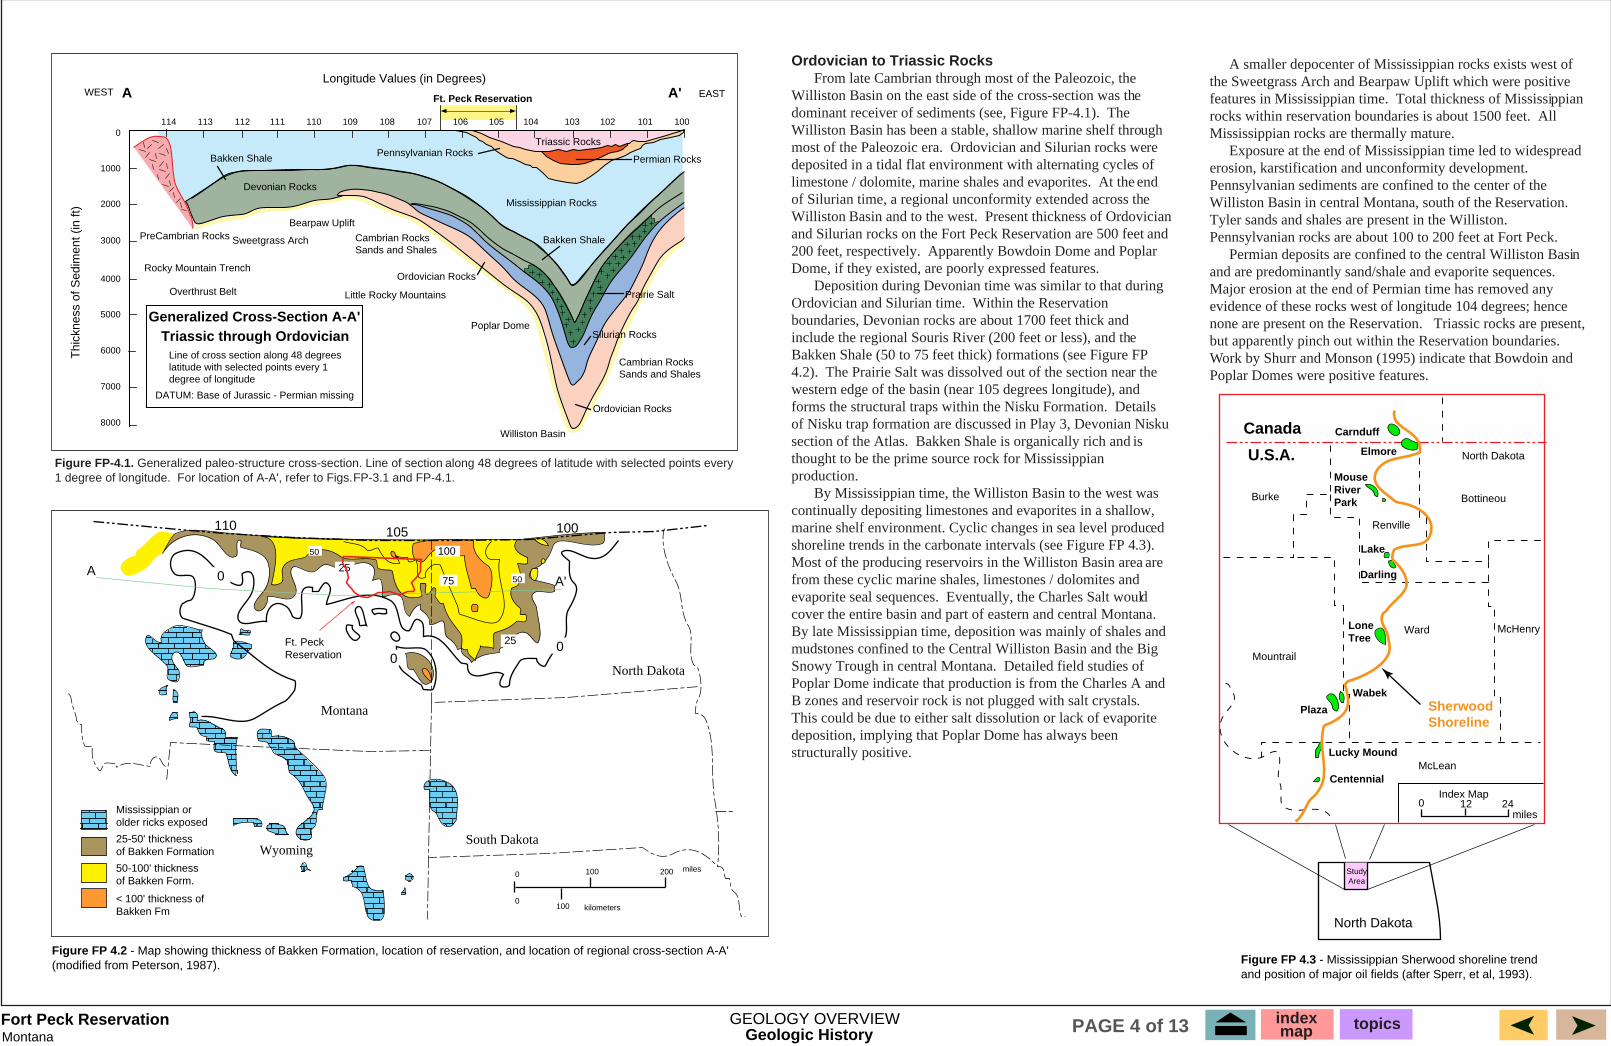
Figure FP-4.1. Generalized paleo-structure cross-section. Line of section along 48 degrees of latitude with selected points every 1 degree of longitude. For location of A-A', refer to Figs. FP-3.1 and FP-4.1.
North Dakota
South DakotaWyoming
Montana
0
0
100
100
200 miles
kilometers
0
00
25
2550
50
Mississippian orolder ricks exposed
25-50' thicknessof Bakken Formation
50-100' thicknessof Bakken Form.
< 100' thickness ofBakken Fm
110 105 100
AA'
Ft. PeckReservation
75
100
Ordovician to Triassic Rocks From late Cambrian through most of the Paleozoic, the Williston Basin on the east side of the cross-section was the dominant receiver of sediments (see, Figure FP-4.1). The Williston Basin has been a stable, shallow marine shelf through most of the Paleozoic era. Ordovician and Silurian rocks were deposited in a tidal flat environment with alternating cycles of limestone / dolomite, marine shales and evaporites. At the end of Silurian time, a regional unconformity extended across the Williston Basin and to the west. Present thickness of Ordovician and Silurian rocks on the Fort Peck Reservation are 500 feet and 200 feet, respectively. Apparently Bowdoin Dome and Poplar Dome, if they existed, are poorly expressed features. Deposition during Devonian time was similar to that during Ordovician and Silurian time. Within the Reservation boundaries, Devonian rocks are about 1700 feet thick and include the regional Souris River (200 feet or less), and the Bakken Shale (50 to 75 feet thick) formations (see Figure FP 4.2). The Prairie Salt was dissolved out of the section near the western edge of the basin (near 105 degrees longitude), and forms the structural traps within the Nisku Formation. Details of Nisku trap formation are discussed in Play 3, Devonian Nisku section of the Atlas. Bakken Shale is organically rich and is thought to be the prime source rock for Mississippian production. By Mississippian time, the Williston Basin to the west was continually depositing limestones and evaporites in a shallow, marine shelf environment. Cyclic changes in sea level produced shoreline trends in the carbonate intervals (see Figure FP 4.3). Most of the producing reservoirs in the Williston Basin area are from these cyclic marine shales, limestones / dolomites and evaporite seal sequences. Eventually, the Charles Salt would cover the entire basin and part of eastern and central Montana. By late Mississippian time, deposition was mainly of shales and mudstones confined to the Central Williston Basin and the Big Snowy Trough in central Montana. Detailed field studies of Poplar Dome indicate that production is from the Charles A and B zones and reservoir rock is not plugged with salt crystals. This could be due to either salt dissolution or lack of evaporite deposition, implying that Poplar Dome has always been structurally positive.
A smaller depocenter of Mississippian rocks exists west of the Sweetgrass Arch and Bearpaw Uplift which were positive features in Mississippian time. Total thickness of Mississippian rocks within reservation boundaries is about 1500 feet. All Mississippian rocks are thermally mature.� Exposure at the end of Mississippian time led to widespread erosion, karstification and unconformity development. Pennsylvanian sediments are confined to the center of the Williston Basin in central Montana, south of the Reservation. Tyler sands and shales are present in the Williston. Pennsylvanian rocks are about 100 to 200 feet at Fort Peck. Permian deposits are confined to the central Williston Basin and are predominantly sand/shale and evaporite sequences. Major erosion at the end of Permian time has removed any evidence of these rocks west of longitude 104 degrees; hence none are present on the Reservation. Triassic rocks are present, but apparently pinch out within the Reservation boundaries. Work by Shurr and Monson (1995) indicate that Bowdoin and Poplar Domes were positive features.
Canada
U.S.A.
Carnduff
Elmore
MouseRiverPark
Lake
Darling
LoneTree
Wabek
Plaza
Lucky Mound
Centennial
SherwoodShoreline
Burke
North Dakota
Renville
Bottineou
Mountrail
Ward McHenry
McLean
Index Map0 12 24
miles
North Dakota
StudyArea
Figure FP 4.3 - Mississippian Sherwood shoreline trend and position of major oil fields (after Sperr, et al, 1993).
Figure FP 4.2 - Map showing thickness of Bakken Formation, location of reservation, and location of regional cross-section A-A' (modified from Peterson, 1987).
GEOLOGY OVERVIEWGeologic History
indexmap topicsPAGE 4 of 13
MontanaFort Peck Reservation
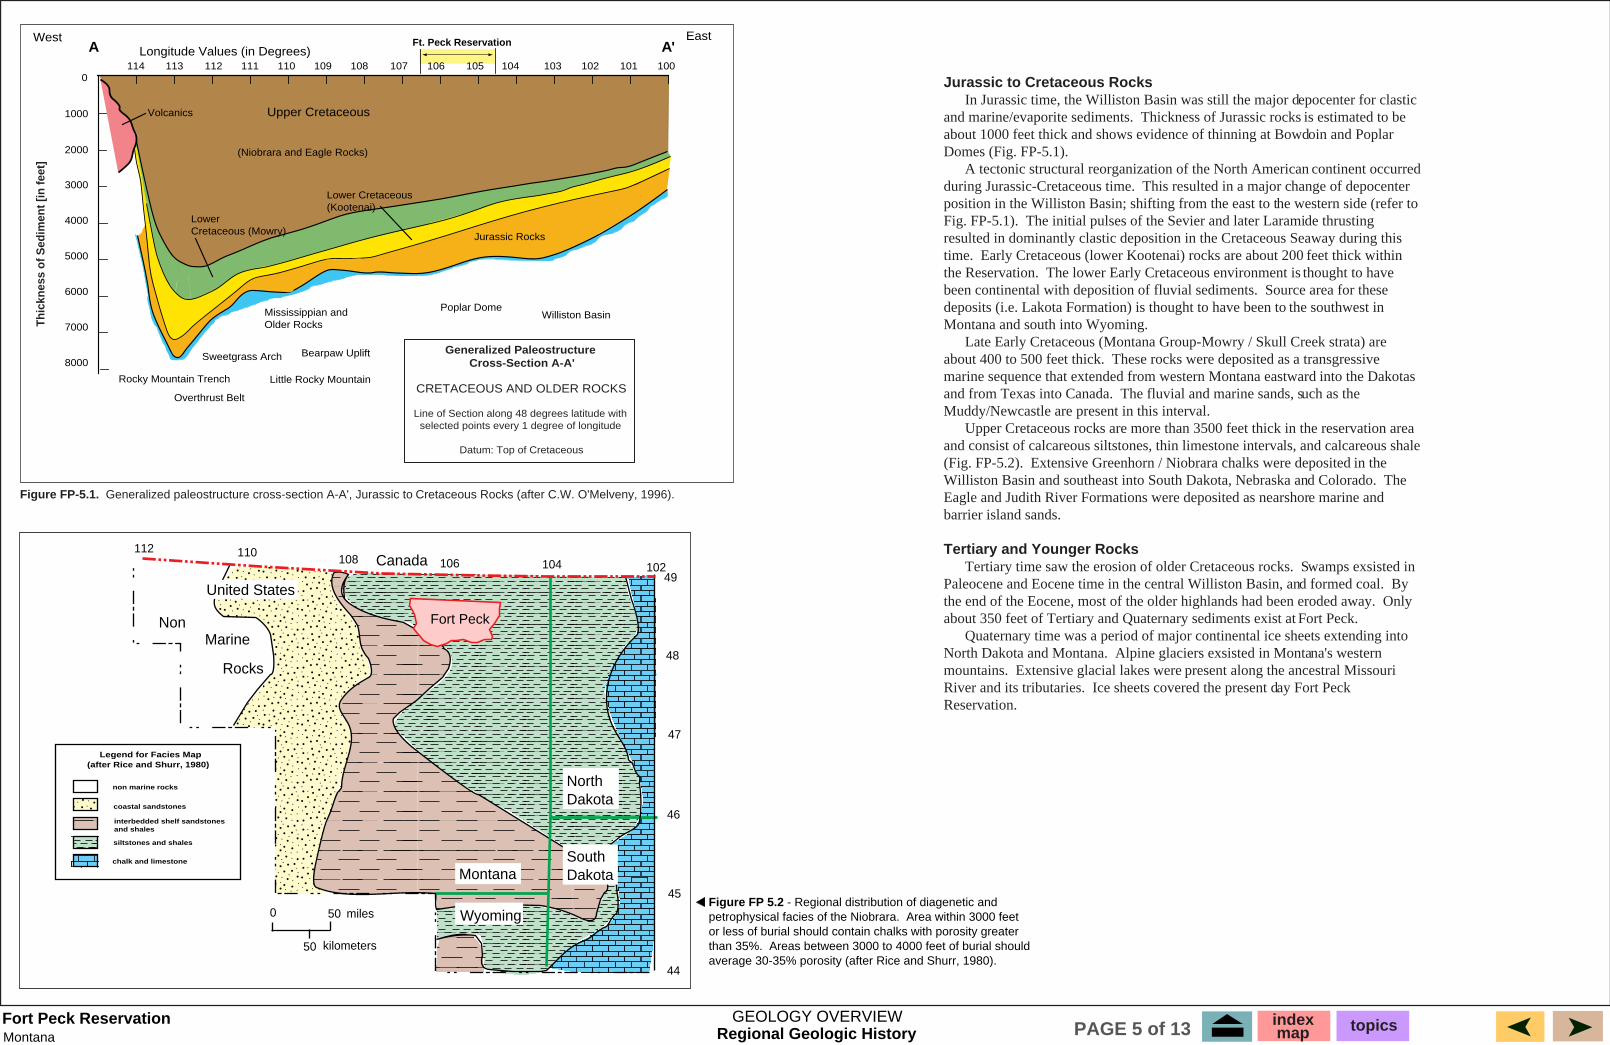
Jurassic to Cretaceous Rocks In Jurassic time, the Williston Basin was still the major depocenter for clastic and marine/evaporite sediments. Thickness of Jurassic rocks is estimated to be about 1000 feet thick and shows evidence of thinning at Bowdoin and Poplar Domes (Fig. FP-5.1).� A tectonic structural reorganization of the North American continent occurred during Jurassic-Cretaceous time. This resulted in a major change of depocenter position in the Williston Basin; shifting from the east to the western side (refer to Fig. FP-5.1). The initial pulses of the Sevier and later Laramide thrusting resulted in dominantly clastic deposition in the Cretaceous Seaway during this time. Early Cretaceous (lower Kootenai) rocks are about 200 feet thick within the Reservation. The lower Early Cretaceous environment is thought to have been continental with deposition of fluvial sediments. Source area for these deposits (i.e. Lakota Formation) is thought to have been to the southwest in Montana and south into Wyoming. Late Early Cretaceous (Montana Group-Mowry / Skull Creek strata) are about 400 to 500 feet thick. These rocks were deposited as a transgressive marine sequence that extended from western Montana eastward into the Dakotas and from Texas into Canada. The fluvial and marine sands, such as the Muddy/Newcastle are present in this interval. Upper Cretaceous rocks are more than 3500 feet thick in the reservation area and consist of calcareous siltstones, thin limestone intervals, and calcareous shale (Fig. FP-5.2). Extensive Greenhorn / Niobrara chalks were deposited in the Williston Basin and southeast into South Dakota, Nebraska and Colorado. The Eagle and Judith River Formations were deposited as nearshore marine and barrier island sands.
Tertiary and Younger Rocks Tertiary time saw the erosion of older Cretaceous rocks. Swamps exsisted in Paleocene and Eocene time in the central Williston Basin, and formed coal. By the end of the Eocene, most of the older highlands had been eroded away. Only about 350 feet of Tertiary and Quaternary sediments exist at Fort Peck. Quaternary time was a period of major continental ice sheets extending into North Dakota and Montana. Alpine glaciers exsisted in Montana's western mountains. Extensive glacial lakes were present along the ancestral Missouri River and its tributaries. Ice sheets covered the present day Fort Peck Reservation.
Ft. Peck Reservation
Upper Cretaceous
Little Rocky Mountain
Poplar Dome
Jurassic Rocks
Sweetgrass Arch
Overthrust Belt
Bearpaw Uplift
Rocky Mountain Trench
Mississippian andOlder Rocks
LowerCretaceous (Mowry)
Lower Cretaceous(Kootenai)
0
1000
2000
3000
4000
5000
6000
7000
8000
Longitude Values (in Degrees)
(Niobrara and Eagle Rocks)
Volcanics
114 113 112 111 110 109 108 107 106 105 104 103 102 101 100
EastA'A
West
Williston Basin
Generalized Paleostructure Cross-Section A-A'
CRETACEOUS AND OLDER ROCKS
Line of Section along 48 degrees latitude with selected points every 1 degree of longitude
Datum: Top of Cretaceous
Thic
knes
s of
Sed
imen
t [in
feet
]
Figure FP-5.1. Generalized paleostructure cross-section A-A', Jurassic to Cretaceous Rocks (after C.W. O'Melveny, 1996).
Figure FP 5.2 - Regional distribution of diagenetic and petrophysical facies of the Niobrara. Area within 3000 feet or less of burial should contain chalks with porosity greater than 35%. Areas between 3000 to 4000 feet of burial should average 30-35% porosity (after Rice and Shurr, 1980).
NonMarine
Rocks
NorthDakota
SouthDakotaMontana
Wyoming
United States
Canada112 110
108 106 104 10249
48
47
46
45
44
0 50 miles
50 kilometers
Legend for Facies Map(after Rice and Shurr, 1980)
non marine rocks
coastal sandstones
interbedded shelf sandstones and shales
siltstones and shales
chalk and limestone
Fort Peck
GEOLOGY OVERVIEWRegional Geologic History
indexmap topicsPAGE 5 of 13
23
Fort Peck ReservationMontana
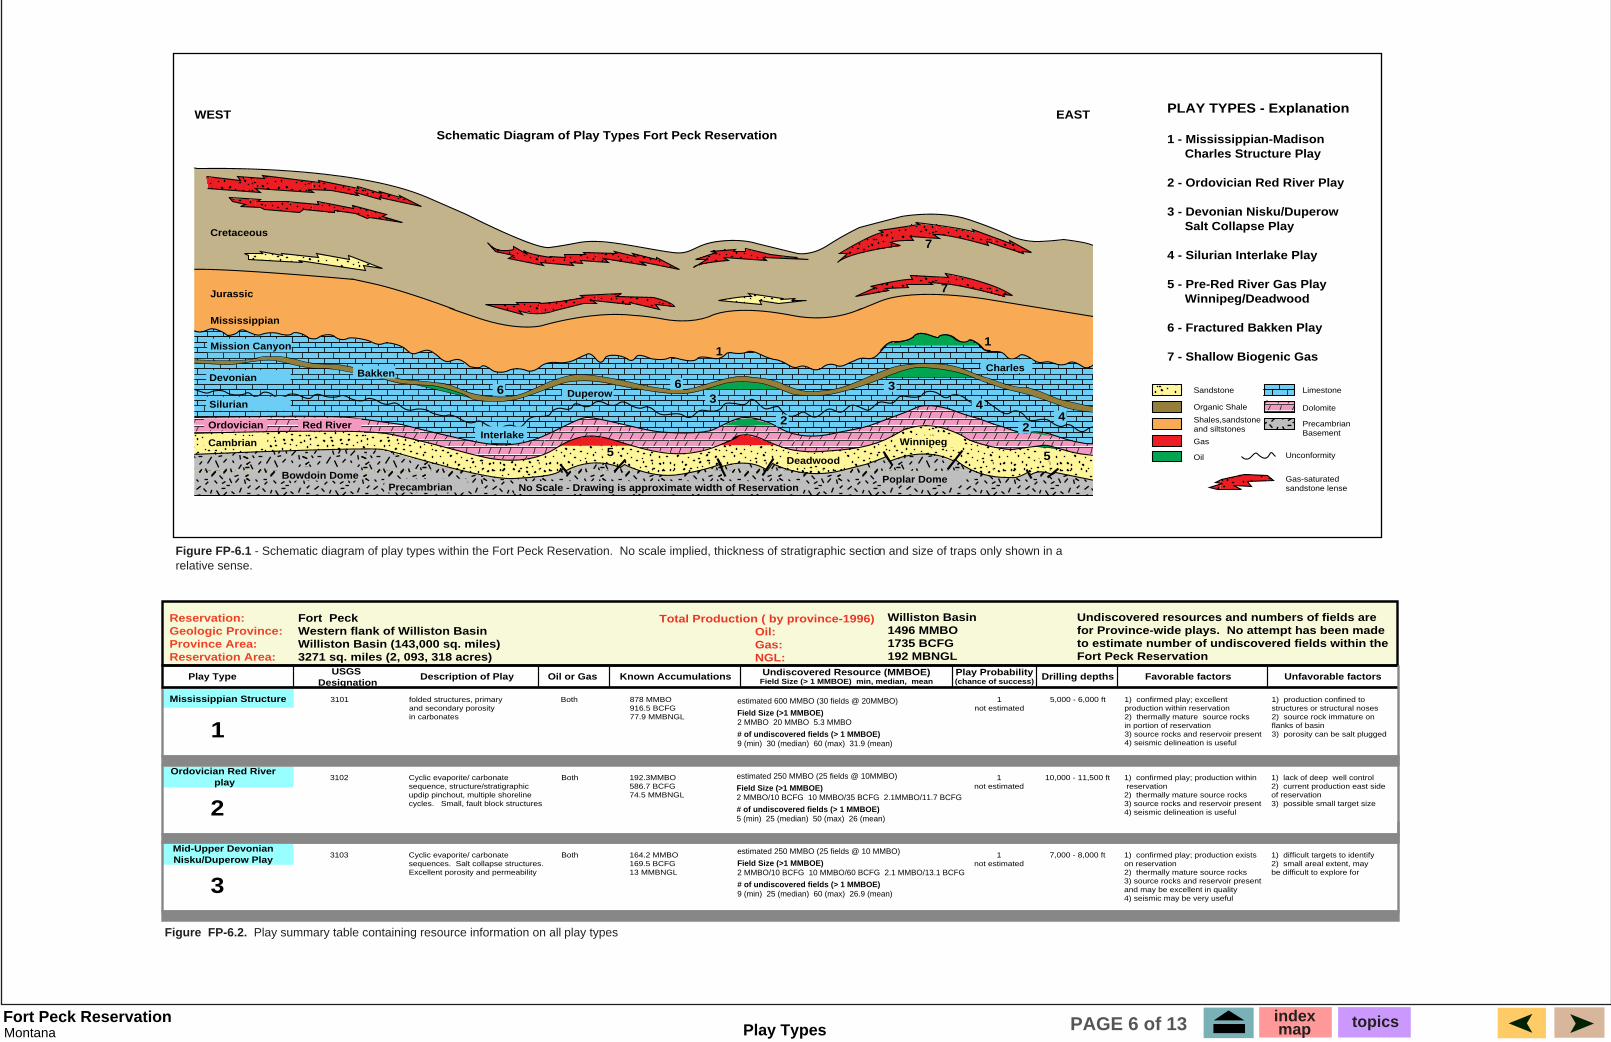
Figure FP-6.2. Play summary table containing resource information on all play types
PLAY TYPES - Explanation
1 - Mississippian-Madison Charles Structure Play
2 - Ordovician Red River Play
3 - Devonian Nisku/Duperow Salt Collapse Play
4 - Silurian Interlake Play
5 - Pre-Red River Gas Play Winnipeg/Deadwood
6 - Fractured Bakken Play
7 - Shallow Biogenic Gas Sandstone Limestone
Dolomite
PrecambrianBasement
Unconformity
Gas-saturatedsandstone lense
Gas
Oil
Organic Shale
Shales,sandstoneand siltstones
Cretaceous
Jurassic
Mississippian
Mission Canyon
Devonian Bakken
Silurian
Interlake
Duperow
Charles
Ordovician
Cambrian
Deadwood
Winnipeg
Red River
Bowdoin DomePrecambrian
Poplar DomeNo Scale - Drawing is approximate width of Reservation
7
7
11
3
2
366
2
44
5 5
WEST EAST
Schematic Diagram of Play Types Fort Peck Reservation
Reservation:Geologic Province:Province Area:Reservation Area:
Fort PeckWestern flank of Williston BasinWilliston Basin (143,000 sq. miles)3271 sq. miles (2, 093, 318 acres)
Total Production ( by province-1996) Oil: Gas: NGL:
Williston Basin1496 MMBO1735 BCFG192 MBNGL
Undiscovered resources and numbers of fields arefor Province-wide plays. No attempt has been madeto estimate number of undiscovered fields within theFort Peck Reservation
Play Type USGS Designation
Unfavorable factorsFavorable factorsDrilling depthsPlay Probability(chance of success)
Undiscovered Resource (MMBOE)Field Size (> 1 MMBOE) min, median, meanKnown AccumulationsOil or GasDescription of Play
Mississippian Structure
1
3101 folded structures, primaryand secondary porosityin carbonates
1not estimated
878 MMBO916.5 BCFG77.9 MMBNGL
5,000 - 6,000 ft 1) confirmed play; excellentproduction within reservation2) thermally mature source rocksin portion of reservation3) source rocks and reservoir present4) seismic delineation is useful
1) production confined tostructures or structural noses2) source rock immature onflanks of basin3) porosity can be salt plugged
Both
Ordovician Red River play
2
3102 Cyclic evaporite/ carbonatesequence, structure/stratigraphicupdip pinchout, multiple shorelinecycles. Small, fault block structures
1not estimated
192.3MMBO586.7 BCFG74.5 MMBNGL
10,000 - 11,500 ft 1) confirmed play; production within reservation2) thermally mature source rocks3) source rocks and reservoir present4) seismic delineation is useful
1) lack of deep well control2) current production east sideof reservation3) possible small target size
Both
Mid-Upper DevonianNisku/Duperow Play
3
3103 Cyclic evaporite/ carbonatesequences. Salt collapse structures.Excellent porosity and permeability
1not estimated
164.2 MMBO169.5 BCFG13 MMBNGL
7,000 - 8,000 ft 1) confirmed play; production existson reservation2) thermally mature source rocks3) source rocks and reservoir presentand may be excellent in quality4) seismic may be very useful
1) difficult targets to identify2) small areal extent, maybe difficult to explore for
Both
Figure FP-6.1 - Schematic diagram of play types within the Fort Peck Reservation. No scale implied, thickness of stratigraphic section and size of traps only shown in a relative sense.
Play Types
estimated 600 MMBO (30 fields @ 20MMBO)
Field Size (>1 MMBOE)2 MMBO 20 MMBO 5.3 MMBO
# of undiscovered fields (> 1 MMBOE)9 (min) 30 (median) 60 (max) 31.9 (mean)
estimated 250 MMBO (25 fields @ 10 MMBO)
Field Size (>1 MMBOE)2 MMBO/10 BCFG 10 MMBO/60 BCFG 2.1 MMBO/13.1 BCFG
# of undiscovered fields (> 1 MMBOE)9 (min) 25 (median) 60 (max) 26.9 (mean)
estimated 250 MMBO (25 fields @ 10MMBO)
Field Size (>1 MMBOE)2 MMBO/10 BCFG 10 MMBO/35 BCFG 2.1MMBO/11.7 BCFG
# of undiscovered fields (> 1 MMBOE)5 (min) 25 (median) 50 (max) 26 (mean)
indexmap topicsPAGE 6 of 13
MontanaFort Peck Reservation
1not estimated
1not estimated
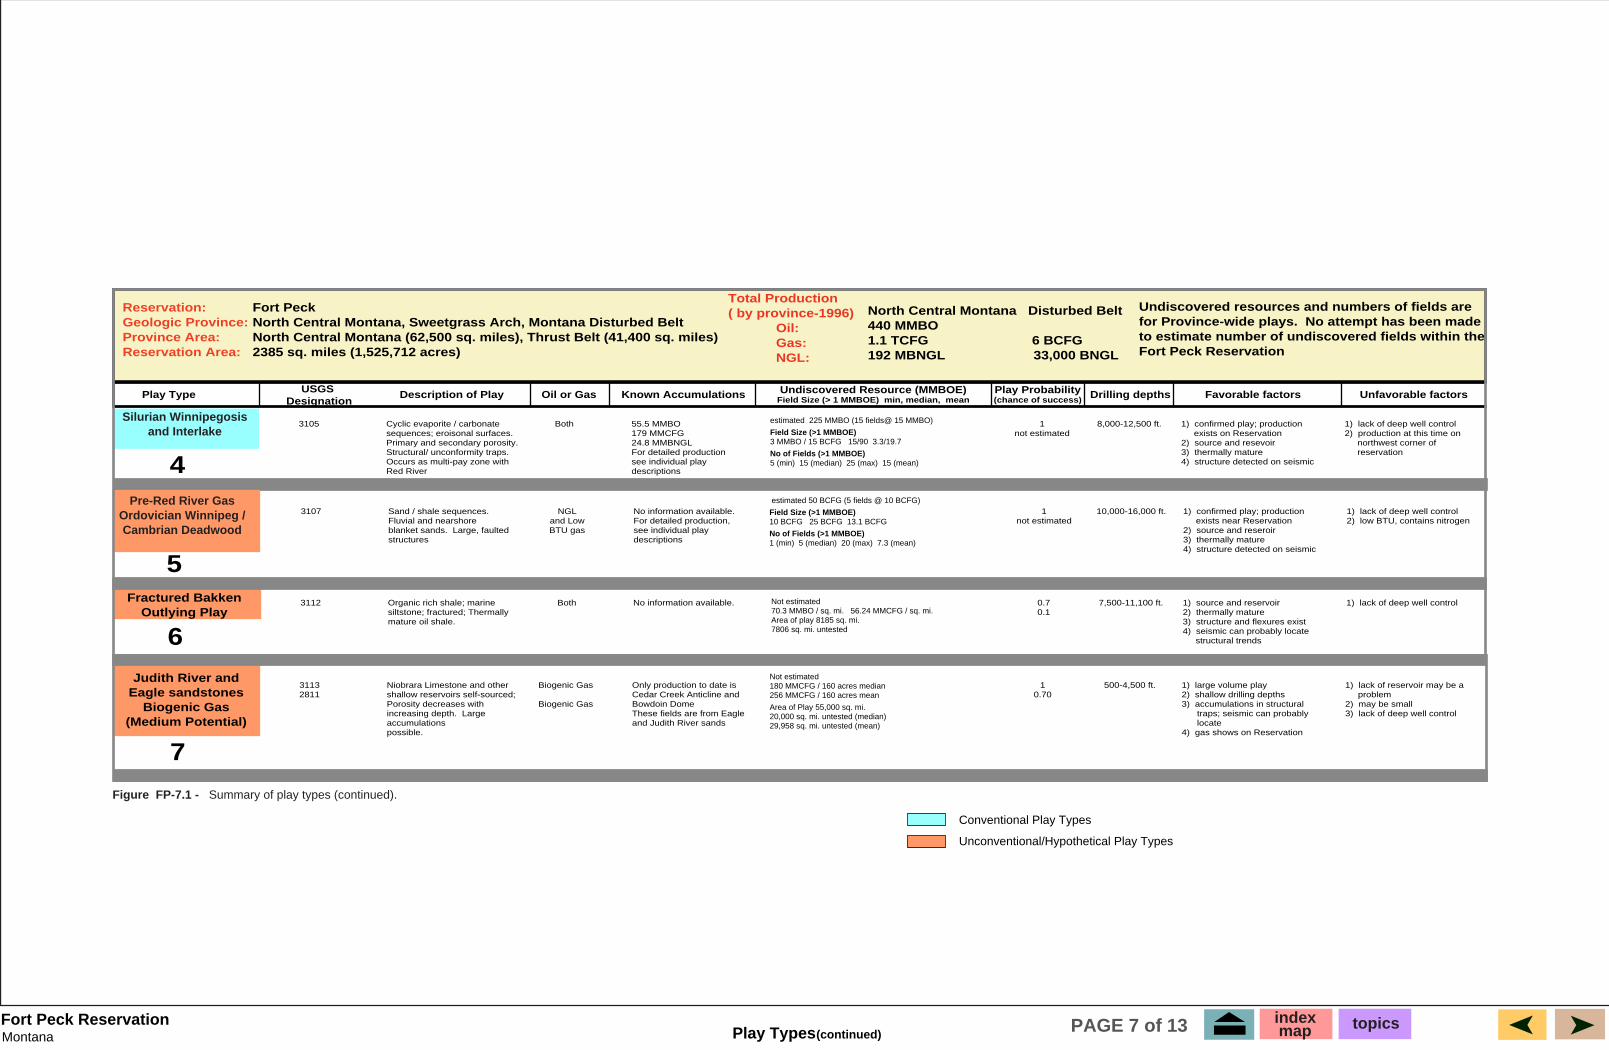
10,000-16,000 ft. 1) confirmed play; production exists near Reservation2) source and reseroir3) thermally mature4) structure detected on seismic
1) lack of deep well control2) low BTU, contains nitrogen
8,000-12,500 ft. 1) confirmed play; production exists on Reservation2) source and resevoir 3) thermally mature4) structure detected on seismic
1) lack of deep well control2) production at this time on northwest corner of reservation
Reservation:Geologic Province:Province Area:Reservation Area:
Fort PeckNorth Central Montana, Sweetgrass Arch, Montana Disturbed BeltNorth Central Montana (62,500 sq. miles), Thrust Belt (41,400 sq. miles)2385 sq. miles (1,525,712 acres)
Total Production ( by province-1996) Oil: Gas: NGL:
North Central Montana Disturbed Belt440 MMBO 1.1 TCFG 6 BCFG192 MBNGL 33,000 BNGL
Undiscovered resources and numbers of fields arefor Province-wide plays. No attempt has been madeto estimate number of undiscovered fields within theFort Peck Reservation
Play Type USGS Designation
Unfavorable factorsFavorable factorsDrilling depthsPlay Probability(chance of success)
Undiscovered Resource (MMBOE)Field Size (> 1 MMBOE) min, median, meanKnown AccumulationsOil or GasDescription of Play
5
3107 Sand / shale sequences.Fluvial and nearshoreblanket sands. Large, faultedstructures
No information available. For detailed production,see individual play descriptions
NGLand LowBTU gas
Fractured BakkenOutlying Play
6
3112 Organic rich shale; marinesiltstone; fractured; Thermally mature oil shale.
0.70.1
No information available. Not estimated 70.3 MMBO / sq. mi. 56.24 MMCFG / sq. mi.Area of play 8185 sq. mi.7806 sq. mi. untested
7,500-11,100 ft. 1) source and reservoir 2) thermally mature3) structure and flexures exist4) seismic can probably locate structural trends
1) lack of deep well controlBoth
4
3105 Cyclic evaporite / carbonate sequences; eroisonal surfaces.Primary and secondary porosity. Structural/ unconformity traps. Occurs as multi-pay zone with Red River
55.5 MMBO179 MMCFG24.8 MMBNGLFor detailed productionsee individual play descriptions
BothSilurian Winnipegosis
and Interlake
Judith River andEagle sandstones
Biogenic Gas(Medium Potential)
7
31132811
Niobrara Limestone and othershallow reservoirs self-sourced;Porosity decreases with increasing depth. Large accumulationspossible.
10.70
Only production to date isCedar Creek Anticline andBowdoin DomeThese fields are from Eagle and Judith River sands
500-4,500 ft. 1) large volume play 2) shallow drilling depths3) accumulations in structural traps; seismic can probably locate4) gas shows on Reservation
1) lack of reservoir may be a problem2) may be small3) lack of deep well control
Biogenic Gas
Biogenic Gas
Pre-Red River GasOrdovician Winnipeg /Cambrian Deadwood
Figure FP-7.1 - Summary of play types (continued).
Conventional Play Types
Unconventional/Hypothetical Play Types
Play Types (continued)
estimated 225 MMBO (15 fields@ 15 MMBO)
Field Size (>1 MMBOE)3 MMBO / 15 BCFG 15/90 3.3/19.7
No of Fields (>1 MMBOE)5 (min) 15 (median) 25 (max) 15 (mean)
Not estimated 180 MMCFG / 160 acres median256 MMCFG / 160 acres mean
Area of Play 55,000 sq. mi.20,000 sq. mi. untested (median)29,958 sq. mi. untested (mean)
estimated 50 BCFG (5 fields @ 10 BCFG)
Field Size (>1 MMBOE)10 BCFG 25 BCFG 13.1 BCFG
No of Fields (>1 MMBOE)1 (min) 5 (median) 20 (max) 7.3 (mean)
indexmap topicsPAGE 7 of 13
Montana Folded Structure Mississippian Carbonate PlayFort Peck Reservation
-4600
VOLT FIELDROOSEVELT COUNTY, MONTANA
STRUCTURE MAPTOP NISKU POROSITY
C.I. : 20 ft
-4680
-4560
R 46 E
-4660-4640
-4600
-4660
-4640
-4620
-4680
-4700
T30N
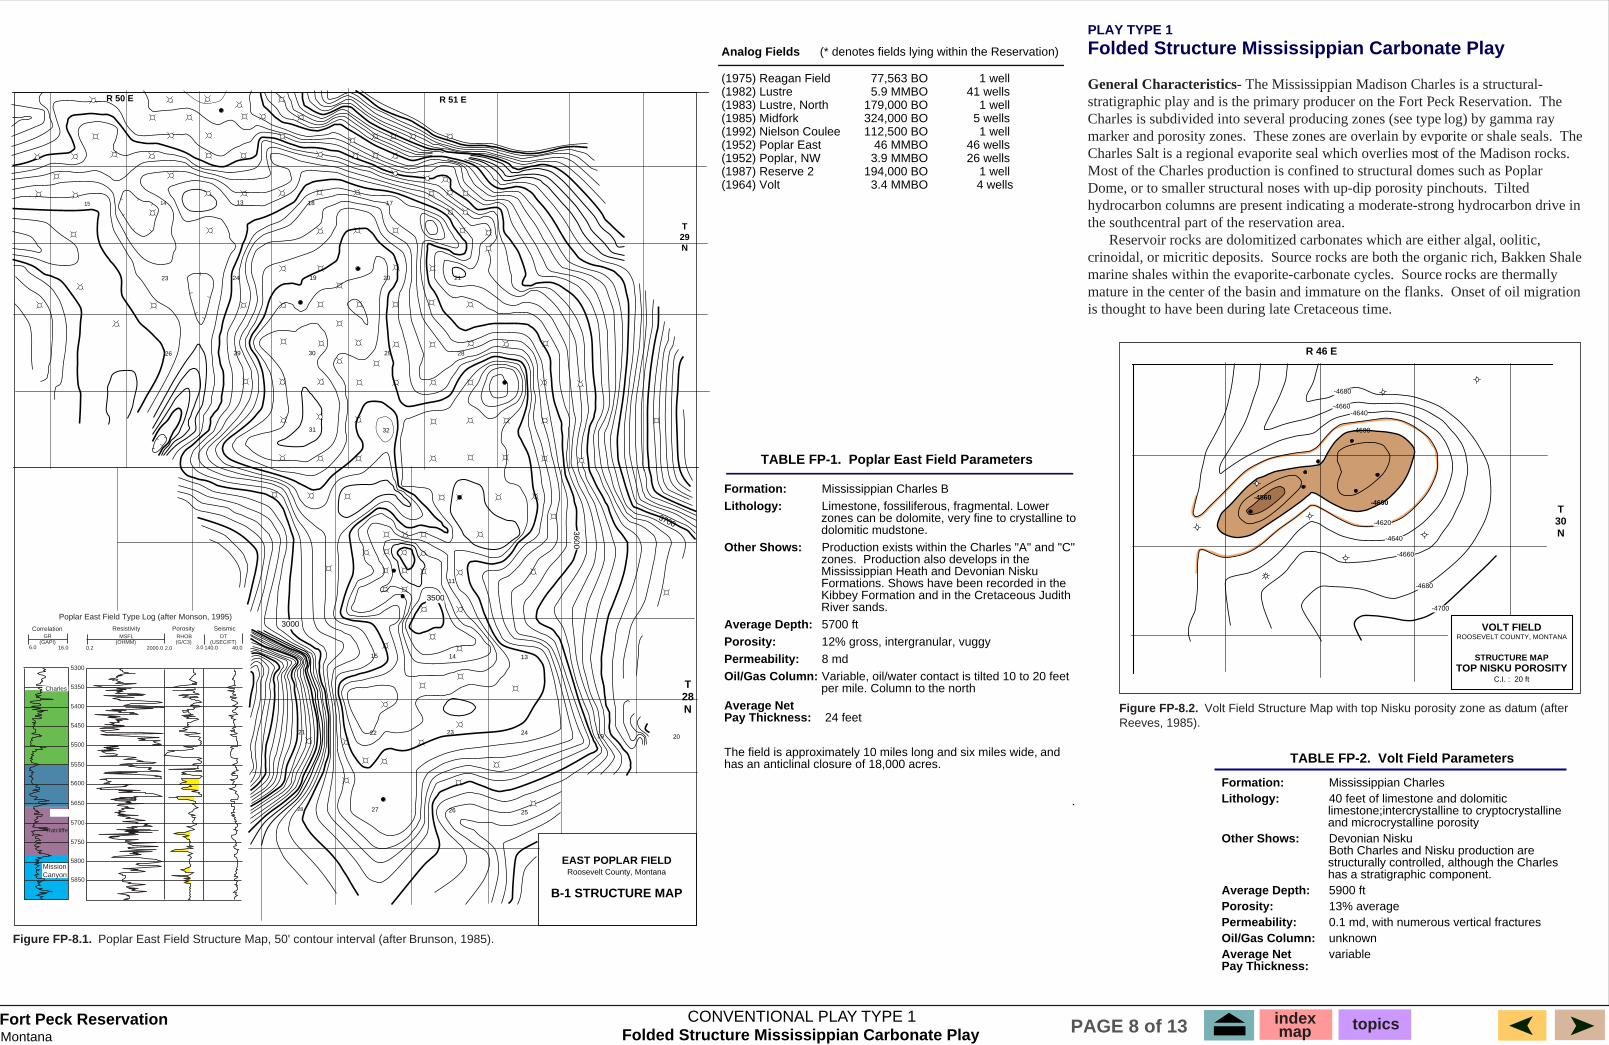
Figure FP-8.2. Volt Field Structure Map with top Nisku porosity zone as datum (after Reeves, 1985).
Figure FP-8.1. Poplar East Field Structure Map, 50' contour interval (after Brunson, 1985).
Analog Fields (* denotes fields lying within the Reservation)
(1975) Reagan Field 77,563 BO 1 well(1982) Lustre 5.9 MMBO 41 wells(1983) Lustre, North 179,000 BO 1 well(1985) Midfork 324,000 BO 5 wells(1992) Nielson Coulee 112,500 BO 1 well(1952) Poplar East 46 MMBO 46 wells(1952) Poplar, NW 3.9 MMBO 26 wells(1987) Reserve 2 194,000 BO 1 well(1964) Volt 3.4 MMBO 4 wells
PLAY TYPE 1
Folded Structure Mississippian Carbonate Play
General Characteristics- The Mississippian Madison Charles is a structural- stratigraphic play and is the primary producer on the Fort Peck Reservation. The Charles is subdivided into several producing zones (see type log) by gamma ray marker and porosity zones. These zones are overlain by evporite or shale seals. The Charles Salt is a regional evaporite seal which overlies most of the Madison rocks. Most of the Charles production is confined to structural domes such as Poplar Dome, or to smaller structural noses with up-dip porosity pinchouts. Tilted hydrocarbon columns are present indicating a moderate-strong hydrocarbon drive in the southcentral part of the reservation area. Reservoir rocks are dolomitized carbonates which are either algal, oolitic, crinoidal, or micritic deposits. Source rocks are both the organic rich, Bakken Shale marine shales within the evaporite-carbonate cycles. Source rocks are thermally mature in the center of the basin and immature on the flanks. Onset of oil migration is thought to have been during late Cretaceous time.
15 14
R 50 E
3029
31 32
14 13
23 24
25
T28N
3700
3600
23 24
26
13
19
18
20
17
21
29 28
3500
11
15
2221
3000
27 2628
19 20
R 51 E
T29N
EAST POPLAR FIELDRoosevelt County, Montana
B-1 STRUCTURE MAP
Poplar East Field Type Log (after Monson, 1995)Correlation Resistivity Porosity Seismic
Charles
MissionCanyon
5300
5350
5400
5450
5500
5550
5600
5650
5700
5750
5800
5850
GR MSFL RHOB DT(GAPI) (OHMM) (G/C3) (USEC/FT)
6.0 16.0 0.2 2000.0 2.0 3.0 140.0 40.0
TABLE FP-1. Poplar East Field Parameters
Formation: Mississippian Charles BLithology: Limestone, fossiliferous, fragmental. Lower
zones can be dolomite, very fine to crystalline to dolomitic mudstone.
Other Shows: Production exists within the Charles "A" and "C" zones. Production also develops in the Mississippian Heath and Devonian Nisku Formations. Shows have been recorded in the Kibbey Formation and in the Cretaceous Judith River sands.
Average Depth: 5700 ftPorosity: 12% gross, intergranular, vuggyPermeability: 8 mdOil/Gas Column:Variable, oil/water contact is tilted 10 to 20 feet
per mile. Column to the northAverage Net Pay Thickness: 24 feet
The field is approximately 10 miles long and six miles wide, and has an anticlinal closure of 18,000 acres.
CONVENTIONAL PLAY TYPE 1
TABLE FP-2. Volt Field Parameters
Formation: Mississippian CharlesLithology: 40 feet of limestone and dolomitic
limestone;intercrystalline to cryptocrystalline and microcrystalline porosity
Other Shows: Devonian Nisku Both Charles and Nisku production are
structurally controlled, although the Charles has a stratigraphic component.
Average Depth: 5900 ftPorosity: 13% averagePermeability: 0.1 md, with numerous vertical fracturesOil/Gas Column: unknownAverage Net variablePay Thickness:
Ratcliffe
indexmap topicsPAGE 8 of 13
MontanaFort Peck Reservation
13
24
18
-9000
CENEX13-3 ANDERSON
T33N
T32N
R 56 E
RESERVE FIELDSHERIDAN COUNTY, MONTANA
STRUCTURE ONRED RIVER (ORDOVICIAN)
RESERVE FIELDDELINEATED AREA
24
17 16
20 21 22
15
30
32
CENEX3-SHORT
CENEX6-4 PEDERSEN
CENEX22-31 ANGVICK
CENEX43X-30 NELSON
HOUSTON34-28 WILLIAMS
DOME2-34 WILLIAMS
PATRICK1-34 WILLIAMS
PATRICK1-27 HOLMBARD
GULF1-21-3C STRAND
CENEX23X-20 UNIT
CENEX31-20 CHRISTENSEN
CENEX31X-17 FOLSOM
MOSBACHER1 NELSON
33
23
19
29
SUNMARK1-36 STATE
- 9000
SUNMARK1 ANDERSON
4
9 10 11 12
- 9100
8
5
-8900
SUNMARK1 LARSON
MOSBACHER1 LODAHL
34
27
-880
0
HOUSTON1-28 WILLIAMS
GULF1 STRAND
GULF1 BREKKE
OIL WELL
ABANDONED OIL WELL
DRY HOLE
4-29 NELSON
11225 TD
11500
11539
11438
11448
11450
11337
HICKERSON1 ANGVICK
6-28 ANGVICK
CENEX21-29 FOLSON
16-30 NELSON
ENERGETICS41-31 HANCOCK
CENEX41X-29
11330
11257
11400
11322
11380
PUBCO4-28 ANGVICK
11210
11179
R 56 ER 55 E
S o u t h Da k o t a
Approximate limit ofthe Red River Fm.Explanation
Ordovician or olderrocks exposed atland surface
Thickness in feet ofRed River FormationDolomite facies
Limestone and Dolomite facies
Oil field, Red River reservoir
110 105
100 300
300
300
700
N o r t h D a k o t a
100
30050050
0
W y o m i n g
M o n t a n a
N e b r a s k a
AA'
Blackfeet
Ft. Belknap Ft. Peck
Ft.Berthold
Standing Rock
Wakea Field
8660
8680
MURRAY JJCHASE DJ
MURRAY 1
MEIDSNESS
7
612
11 12
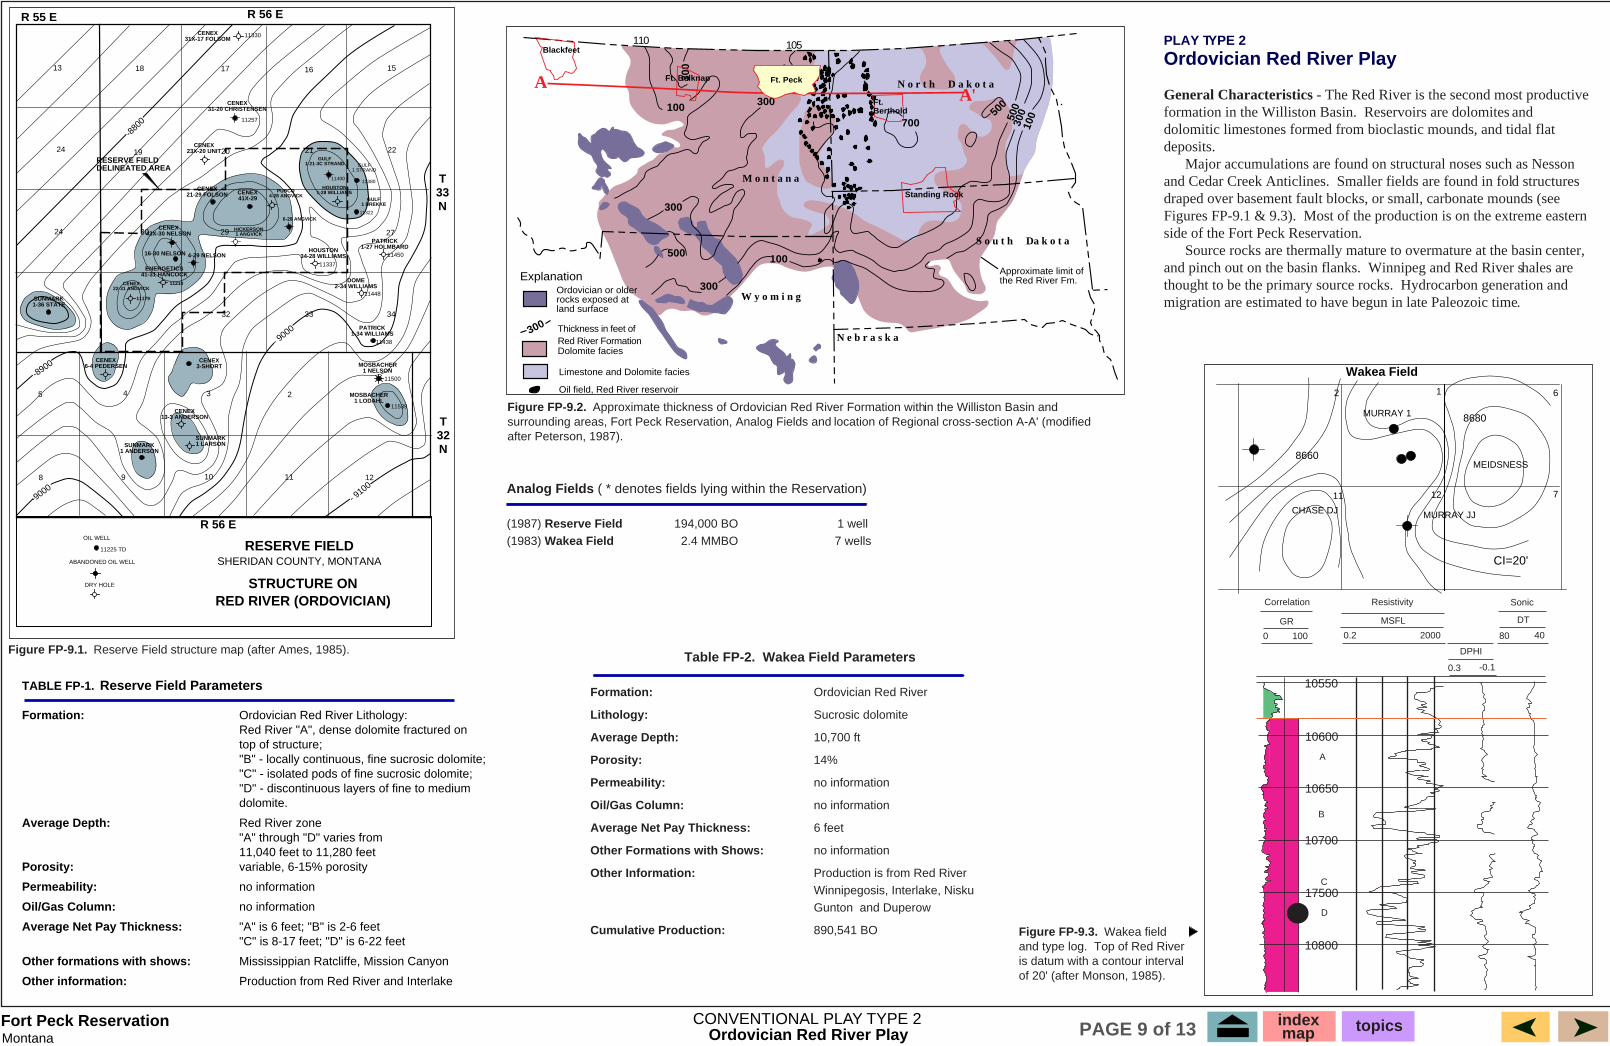
Figure FP-9.1. Reserve Field structure map (after Ames, 1985).
Figure FP-9.2. Approximate thickness of Ordovician Red River Formation within the Williston Basin and surrounding areas, Fort Peck Reservation, Analog Fields and location of Regional cross-section A-A' (modified after Peterson, 1987).
Figure FP-9.3. Wakea field and type log. Top of Red River is datum with a contour interval of 20' (after Monson, 1985).
10550
10600
10650
10700
17500
10800
B
A
C
D
Correlation
GR
0 100
Resistivity Sonic
MSFL
20000.2 80 40
DT
DPHI
0.3 -0.1
TABLE FP-1. Reserve Field Parameters
Formation: Ordovician Red River Lithology: Red River "A", dense dolomite fractured on top of structure; "B" - locally continuous, fine sucrosic dolomite; "C" - isolated pods of fine sucrosic dolomite; "D" - discontinuous layers of fine to medium dolomite.
Average Depth: Red River zone "A" through "D" varies from 11,040 feet to 11,280 feetPorosity: variable, 6-15% porosity
Permeability: no information
Oil/Gas Column: no information
Average Net Pay Thickness: "A" is 6 feet; "B" is 2-6 feet "C" is 8-17 feet; "D" is 6-22 feet
Other formations with shows: Mississippian Ratcliffe, Mission Canyon
Other information: Production from Red River and Interlake
Analog Fields ( * denotes fields lying within the Reservation)
(1987) Reserve Field 194,000 BO 1 well(1983) Wakea Field 2.4 MMBO 7 wells
Table FP-2. Wakea Field Parameters
Formation: Ordovician Red River
Lithology: Sucrosic dolomite
Average Depth: 10,700 ft
Porosity: 14%
Permeability: no information
Oil/Gas Column: no information
Average Net Pay Thickness: 6 feet
Other Formations with Shows: no information
Other Information: Production is from Red River Winnipegosis, Interlake, Nisku Gunton and Duperow
Cumulative Production: 890,541 BO
CI=20'
PLAY TYPE 2
Ordovician Red River Play
General Characteristics - The Red River is the second most productive formation in the Williston Basin. Reservoirs are dolomites and dolomitic limestones formed from bioclastic mounds, and tidal flat deposits. Major accumulations are found on structural noses such as Nesson and Cedar Creek Anticlines. Smaller fields are found in fold structures draped over basement fault blocks, or small, carbonate mounds (see Figures FP-9.1 & 9.3). Most of the production is on the extreme eastern side of the Fort Peck Reservation. Source rocks are thermally mature to overmature at the basin center, and pinch out on the basin flanks. Winnipeg and Red River shales are thought to be the primary source rocks. Hydrocarbon generation and migration are estimated to have begun in late Paleozoic time.
CONVENTIONAL PLAY TYPE 2Ordovician Red River Play
300
100500
300
indexmap topicsPAGE 9 of 13
MontanaFort Peck Reservation
CRETACEOUS
JURASSIC
MISS.
S A S K A T C H E W A N
Present Solutional Zero Edge Prairie Salt
InferredDepositional Zero
Prairie Salt
NISKU FIELDS
Mm
Dn
Dd
Dn
Dd
Dsr
Ddb
Stage 4 - Stratigraphic diagram showing effects ofsecond-stage solution and regional removal ofsalts of Prairie Formation.
FRACTURE ZONERELATED TO BASEMENTZONE OF WEAKNESS
Stage 2 - Stratigraphic diagram showing first stageof salt solution which created local solutional sink.
Stage 3 - Stratigraphic diagram showing post-solutioninfill of sink with carbonates of Souris River Formation. Map showing position of (1) present-day solutional
edge of Prairie salt, and (2) inferred depositionaledge of Prairie Salt.
Dw
Ddb
Dpe
Si
Dpe
Ddb
Dw
Si
Si
Dw
Stage 1 - Stratigraphic diagram showing pre-solution disposition of lower Paleozoic beds inTule Creek Field Area.
M O
N T
A N
A
N O
R T
H
D A
K O
T A
Dsr
DdbDpe
Dw
Si
TULE CREEK FIELDRoosevelt County, Montana
STRUCTURE MAPTop of 1st Lobe Porosity - Nisku Formation
23
-4920
-4930 -4
960
-4940 -49
50
-4960
R 47 E R 48 E
T30N
24
-497
0-4
980
-501
0-5
020
-503
0
-5040
-500
0
-498
0
-496
0
-499
0
7700
Res
istiv
ity
Son
ic
Con
duct
ivity
OILWATER
60 40100
INTERVAL TRANSIT TIMEmicroseconds per foot
Company HUMBLE OIL & REFINING COWell No. 2 J.H. BARACKERField TULE CREEKCounty ROOSEVELT State MONTANA
CONDUCTIVITY
LATEROLOG
RESISTIVITY
GAMMA RAY
0 40
40 80
80 120
API Units
7600
DUPEROWFORMATION
NISKUFORMATION
Perf: 7641' - 7651'IPF 450 BOPD0 WATER3/62
THREE FORKSFORMATION
TULE CREEK
TYPE LOG
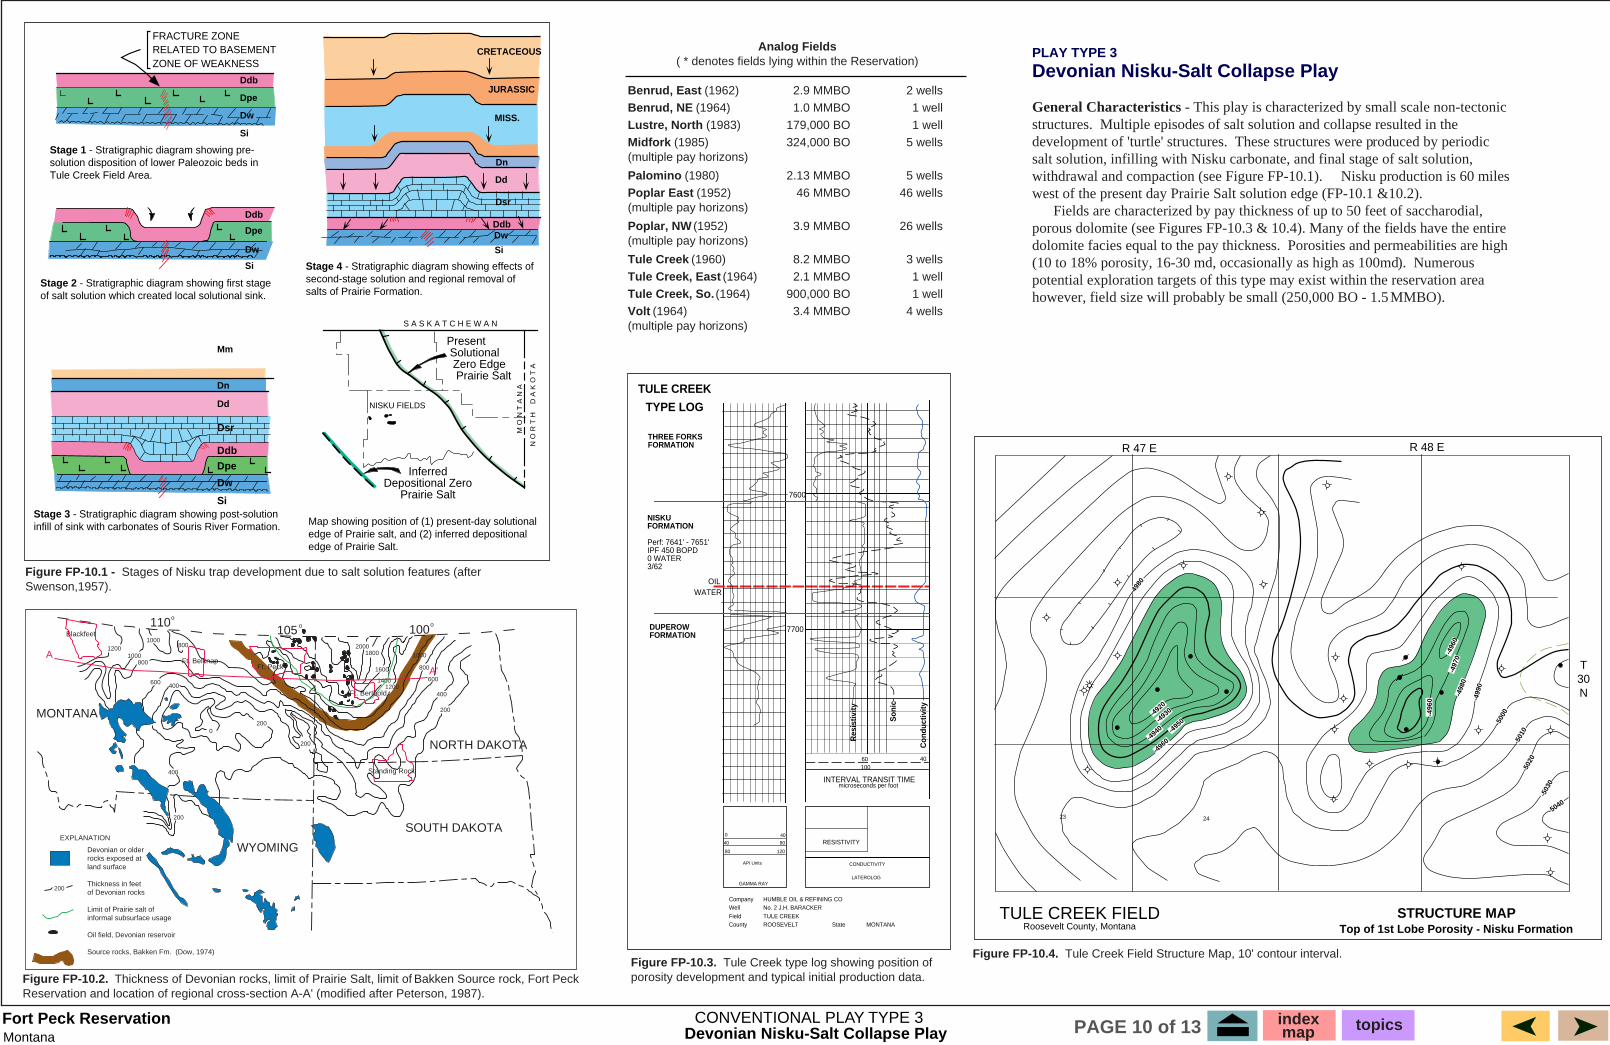
Figure FP-10.4. Tule Creek Field Structure Map, 10' contour interval.Figure FP-10.3. Tule Creek type log showing position of porosity development and typical initial production data.
SOUTH DAKOTA
NORTH DAKOTA
MONTANA
EXPLANATION
12001000
800
1000800
600 400
2000
400
200
20001800
1600
14001200
800
600
400
200
Devonian or olderrocks exposed atland surface
Thickness in feet of Devonian rocks
Limit of Prairie salt of informal subsurface usage
Oil field, Devonian reservoir
Source rocks, Bakken Fm. (Dow, 1974)
WYOMING
200
1000
105 o 100o110o
Ft. BelknapFt. Peck
Standing Rock
Ft. Berthold
Blackfeet
A
A'
200
PLAY TYPE 3
Devonian Nisku-Salt Collapse Play
General Characteristics - This play is characterized by small scale non-tectonic structures. Multiple episodes of salt solution and collapse resulted in the development of 'turtle' structures. These structures were produced by periodic salt solution, infilling with Nisku carbonate, and final stage of salt solution, withdrawal and compaction (see Figure FP-10.1). Nisku production is 60 miles west of the present day Prairie Salt solution edge (FP-10.1 &10.2). Fields are characterized by pay thickness of up to 50 feet of saccharodial, porous dolomite (see Figures FP-10.3 & 10.4). Many of the fields have the entire dolomite facies equal to the pay thickness. Porosities and permeabilities are high (10 to 18% porosity, 16-30 md, occasionally as high as 100md). Numerous potential exploration targets of this type may exist within the reservation area however, field size will probably be small (250,000 BO - 1.5 MMBO).
Figure FP-10.1 - Stages of Nisku trap development due to salt solution features (after Swenson,1957).
Figure FP-10.2. Thickness of Devonian rocks, limit of Prairie Salt, limit of Bakken Source rock, Fort Peck Reservation and location of regional cross-section A-A' (modified after Peterson, 1987).
Analog Fields�( * denotes fields lying within the Reservation)
Benrud, East (1962) 2.9 MMBO 2 wellsBenrud, NE (1964) 1.0 MMBO 1 wellLustre, North (1983) 179,000 BO 1 wellMidfork (1985) 324,000 BO 5 wells�(multiple pay horizons)
Palomino (1980) 2.13 MMBO 5 wellsPoplar East (1952) 46 MMBO 46 wells�(multiple pay horizons)
Poplar, NW (1952) 3.9 MMBO 26 wells�(multiple pay horizons)
Tule Creek (1960) 8.2 MMBO 3 wellsTule Creek, East (1964) 2.1 MMBO 1 wellTule Creek, So. (1964) 900,000 BO 1 wellVolt (1964) 3.4 MMBO 4 wells(multiple pay horizons)
CONVENTIONAL PLAY TYPE 3Devonian Nisku-Salt Collapse Play
indexmap topicsPAGE 10 of 13
MontanaFort Peck Reservation
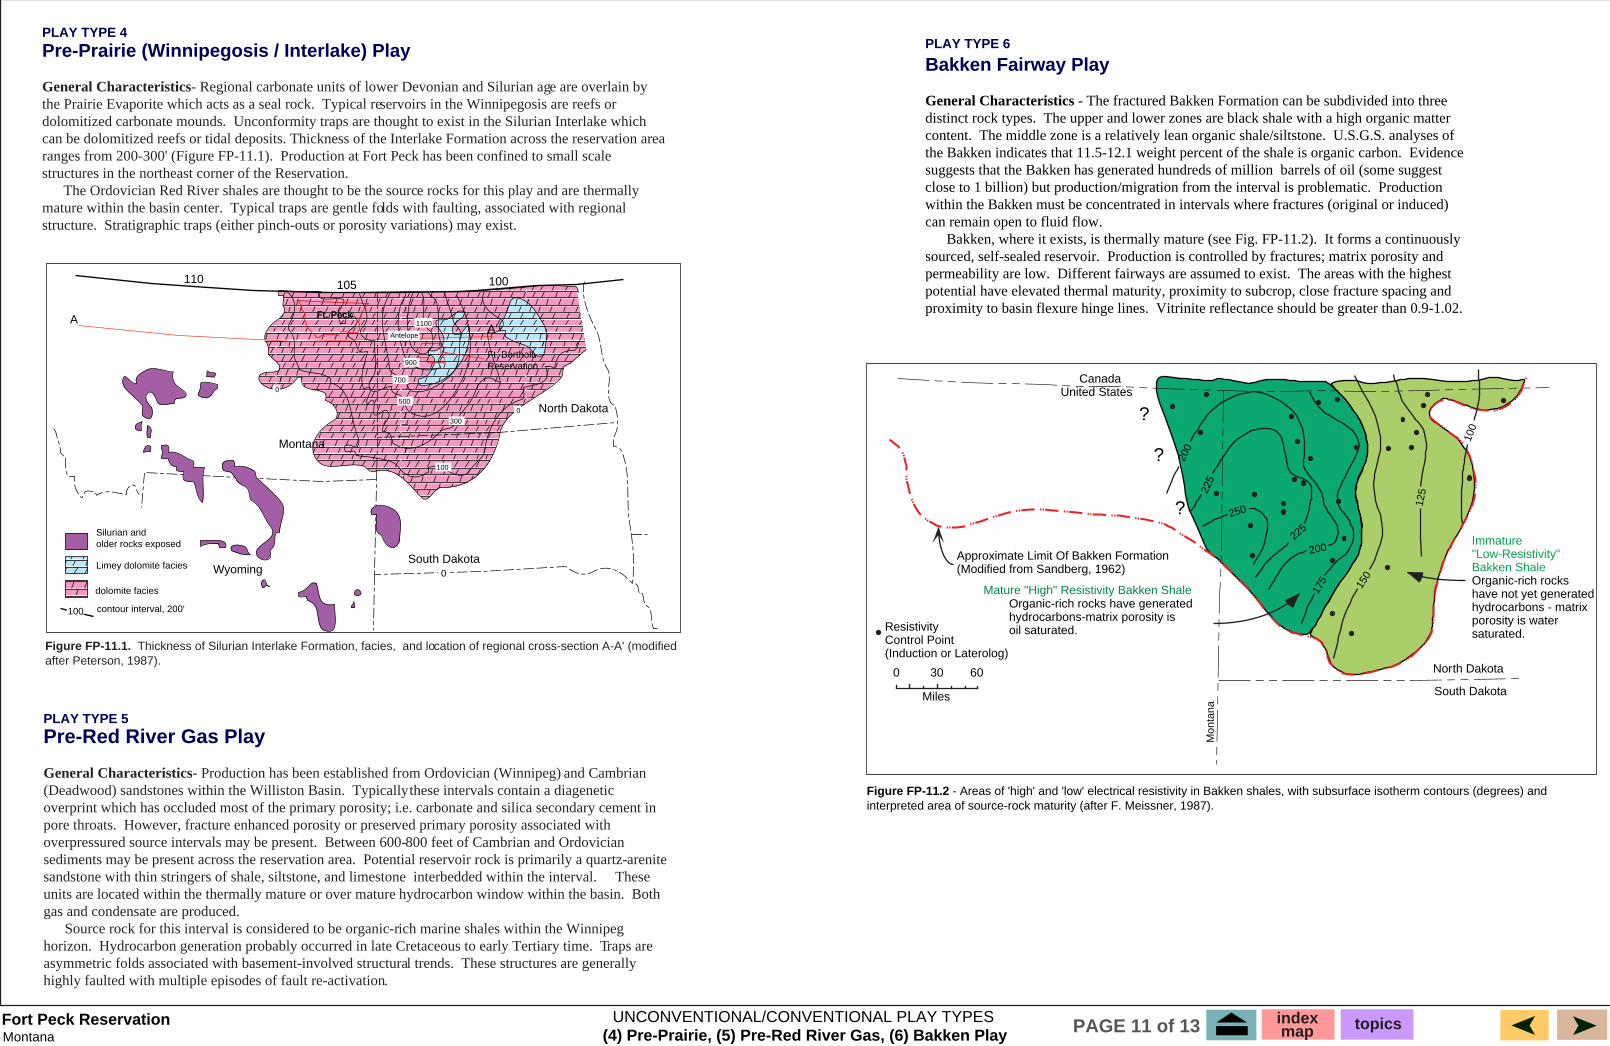
Figure FP-11.1. Thickness of Silurian Interlake Formation, facies, and location of regional cross-section A-A' (modified after Peterson, 1987).
North Dakota
Wyoming
Silurian and older rocks exposed
Limey dolomite facies
dolomite facies
110 105 100
AA'
South Dakota
Ft. BertholdReservation
Montana
0
contour interval, 200'
100
300
500
700
900
1100
0
0
Antelope
100
Ft. Peck
PLAY TYPE 4 Pre-Prairie (Winnipegosis / Interlake) Play
General Characteristics- Regional carbonate units of lower Devonian and Silurian age are overlain by the Prairie Evaporite which acts as a seal rock. Typical reservoirs in the Winnipegosis are reefs or dolomitized carbonate mounds. Unconformity traps are thought to exist in the Silurian Interlake which can be dolomitized reefs or tidal deposits. Thickness of the Interlake Formation across the reservation area ranges from 200-300' (Figure FP-11.1). Production at Fort Peck has been confined to small scale structures in the northeast corner of the Reservation. The Ordovician Red River shales are thought to be the source rocks for this play and are thermally mature within the basin center. Typical traps are gentle folds with faulting, associated with regional structure. Stratigraphic traps (either pinch-outs or porosity variations) may exist.
PLAY TYPE 5
Pre-Red River Gas Play
General Characteristics- Production has been established from Ordovician (Winnipeg) and Cambrian (Deadwood) sandstones within the Williston Basin. Typically these intervals contain a diagenetic overprint which has occluded most of the primary porosity; i.e. carbonate and silica secondary cement in pore throats. However, fracture enhanced porosity or preserved primary porosity associated with overpressured source intervals may be present. Between 600-800 feet of Cambrian and Ordovician sediments may be present across the reservation area. Potential reservoir rock is primarily a quartz-arenite sandstone with thin stringers of shale, siltstone, and limestone interbedded within the interval. These units are located within the thermally mature or over mature hydrocarbon window within the basin. Both gas and condensate are produced. Source rock for this interval is considered to be organic-rich marine shales within the Winnipeg horizon. Hydrocarbon generation probably occurred in late Cretaceous to early Tertiary time. Traps are asymmetric folds associated with basement-involved structural trends. These structures are generally highly faulted with multiple episodes of fault re-activation.
PLAY TYPE 6
Bakken Fairway Play
General Characteristics - The fractured Bakken Formation can be subdivided into three distinct rock types. The upper and lower zones are black shale with a high organic matter content. The middle zone is a relatively lean organic shale/siltstone. U.S.G.S. analyses of the Bakken indicates that 11.5-12.1 weight percent of the shale is organic carbon. Evidence suggests that the Bakken has generated hundreds of million barrels of oil (some suggest close to 1 billion) but production/migration from the interval is problematic. Production within the Bakken must be concentrated in intervals where fractures (original or induced) can remain open to fluid flow.� Bakken, where it exists, is thermally mature (see Fig. FP-11.2). It forms a continuously sourced, self-sealed reservoir. Production is controlled by fractures; matrix porosity and permeability are low. Different fairways are assumed to exist. The areas with the highest potential have elevated thermal maturity, proximity to subcrop, close fracture spacing and proximity to basin flexure hinge lines. Vitrinite reflectance should be greater than 0.9-1.02.
?
?
?
CanadaUnited States
Mature "High" Resistivity Bakken Shale
North Dakota
South Dakota
0 6030
Miles
200
200
225
225
250
175 150
125
100
Mon
tana
UNCONVENTIONAL/CONVENTIONAL PLAY TYPES
Figure FP-11.2 - Areas of 'high' and 'low' electrical resistivity in Bakken shales, with subsurface isotherm contours (degrees) and interpreted area of source-rock maturity (after F. Meissner, 1987).
Approximate Limit Of Bakken Formation(Modified from Sandberg, 1962)
ResistivityControl Point(Induction or Laterolog)
Organic-rich rocks have generatedhydrocarbons-matrix porosity isoil saturated.
Immature"Low-Resistivity"Bakken ShaleOrganic-rich rockshave not yet generatedhydrocarbons - matrixporosity is watersaturated.
(4) Pre-Prairie, (5) Pre-Red River Gas, (6) Bakken Playindexmap topicsPAGE 11 of 13
MontanaFort Peck Reservation
BEARPAWMTNS
DOME
FOX HILLS SS
BEARPAW SHALE
ST MARY RIVER FM
JUDITH RIVER FM
ARDMORE BENTONITE BED
PIERRESHALE
WEST FLANKWILLISTON BASIN
HELL CREEK FM.
CLAGGETT SHALE
EAGLE SS
VIRGELLE SS
MARIAS RIVER SHALE
TELEGRAPHCREEK FM.
GAMMONSHALE
NIOBRARA FM
MOWRY SHALE
CARLILE SHALEBELLE FOURCHE SH
BLACKLEAF FM
VAUGHNMBR
MUDDY SS
SKULLCREEK SHALE
Upper CretaceousLower Cretaceous
GREENHORN FM
TW
O M
ED
ICIN
E F
OR
MA
TIO
N
BEARPAW SHALEHORSETHIEFSANDSTONE FOX
HILLS SS
WILLOW CREEKFM (PART)
NONMARINE ROCKS
COASTAL SANDSTONE
CALCAREOUS SHALECHALK & LIMESTONE
MARINE SHALE &SILTSTONE
90 Mi 150 Mi180 Mi
GLACIER NAT'L PARK
A A'
CretaceousEpeiric Seaway
United States
Mexico Cuba
Canada
Alaska Greenland
CretaceousEpeiric Seaway
CretaceousEpeiric Seaway
0
POPLARDOME
CEDAR CREEKANTICLINE
NESSON ANTICLINE
UNITED STATESCANADA
PRYORUPLIFT BIG
HORNMTNS
MT
WY
BLACK HILLSUPLIFT
ND
SD
106
NORTHERN LIMIT -POWDER RIVER BASIN
WILLISTON BASIN
OF
48
47
46
45
44
48104 102
BEARPAW MTNS
CAT CREEK ANTICLINE
SWEETGRASSHILLS
BOWDOINDOME
LITTLE ROCKYMTNS
PORCUPINEDOME
CENTRAL MONTANAUPLIFT
A A'
108
WE
STE
RN
LIMIT
110112
Figure FP-12.2. Major structural elements of the area, showing location of cross-section A-A' (after Rice and Shurr, 1980).
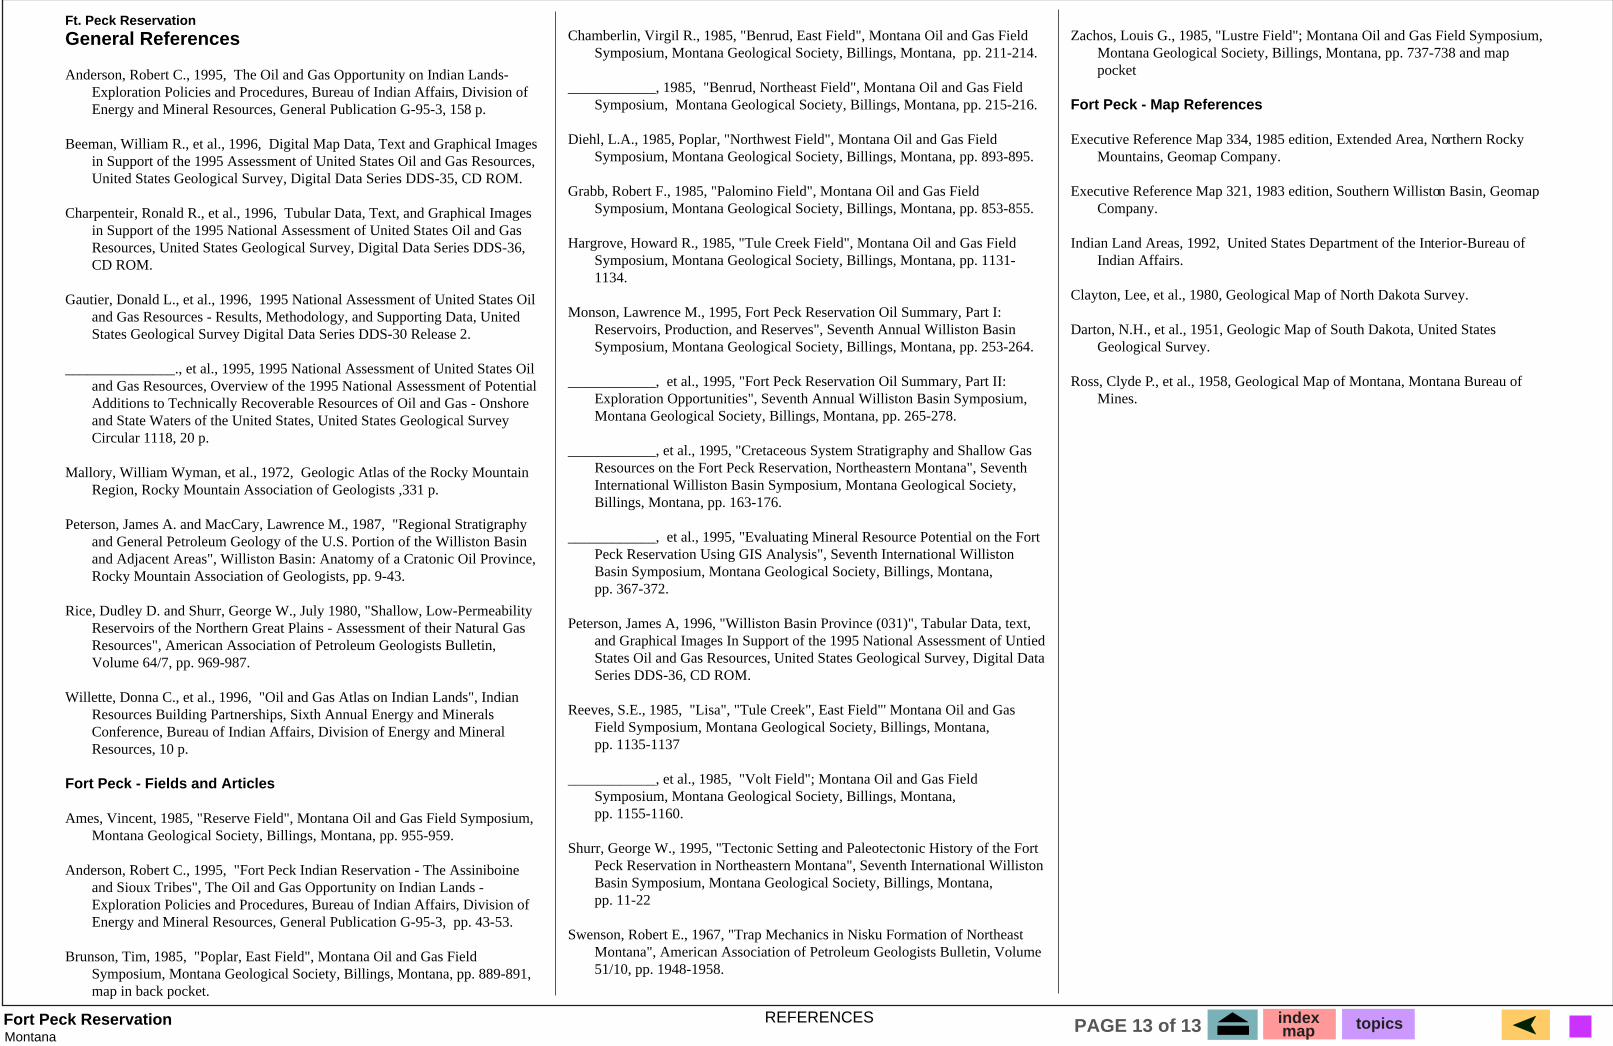
Table FP-12.1: Cretaceous Gas Shows, Fort Peck Reservation
Well Name Location Kjr Kea Knb Kgh Kmw Kmd Kd Source
BEST WELLS
W.P. Tribal 1 8-29-49 x x x x x GLProbe Tribal 1 16-31-48 x x x x x x GLChaske 42-32 32-30-50 x x x x x GLFranz 1 30-31-45 x x x x GLTweten 1-19 19-31-44 x x x x x GL,RTovas 21-34 34-30-47 x x x x GLTreasure St. Farms 31-32-46 x x x GL
EPU WELLSShows 28,29-50,51 15 1 CEPU 10 G 30-29-51 x PT-630EPU 5 G 29-29-51 x PT-650EPU 4 G 33-29-51 x PT-180
OTHER WELLSMultiple Shows Reservation 3 2 2 1 2 1 1 GL,SJudith River Reservation 11 C,DST,SMultiple Shows Near Reserv. 3 4 4 4 GL
Total Shows 42 16 12 12 6 2 1
GL=Gas Log, R=Geologist, C=Completion Report, PT=Production IP mcfgpdDST=Drill Stem Test, S=Sample Log, Kjr=Judith River, Kea=Eagle, Knb=Niobrara,Kgh=Greenhorn, Kmw=Mowry, Kmd=Muddy, Kd=Dakota
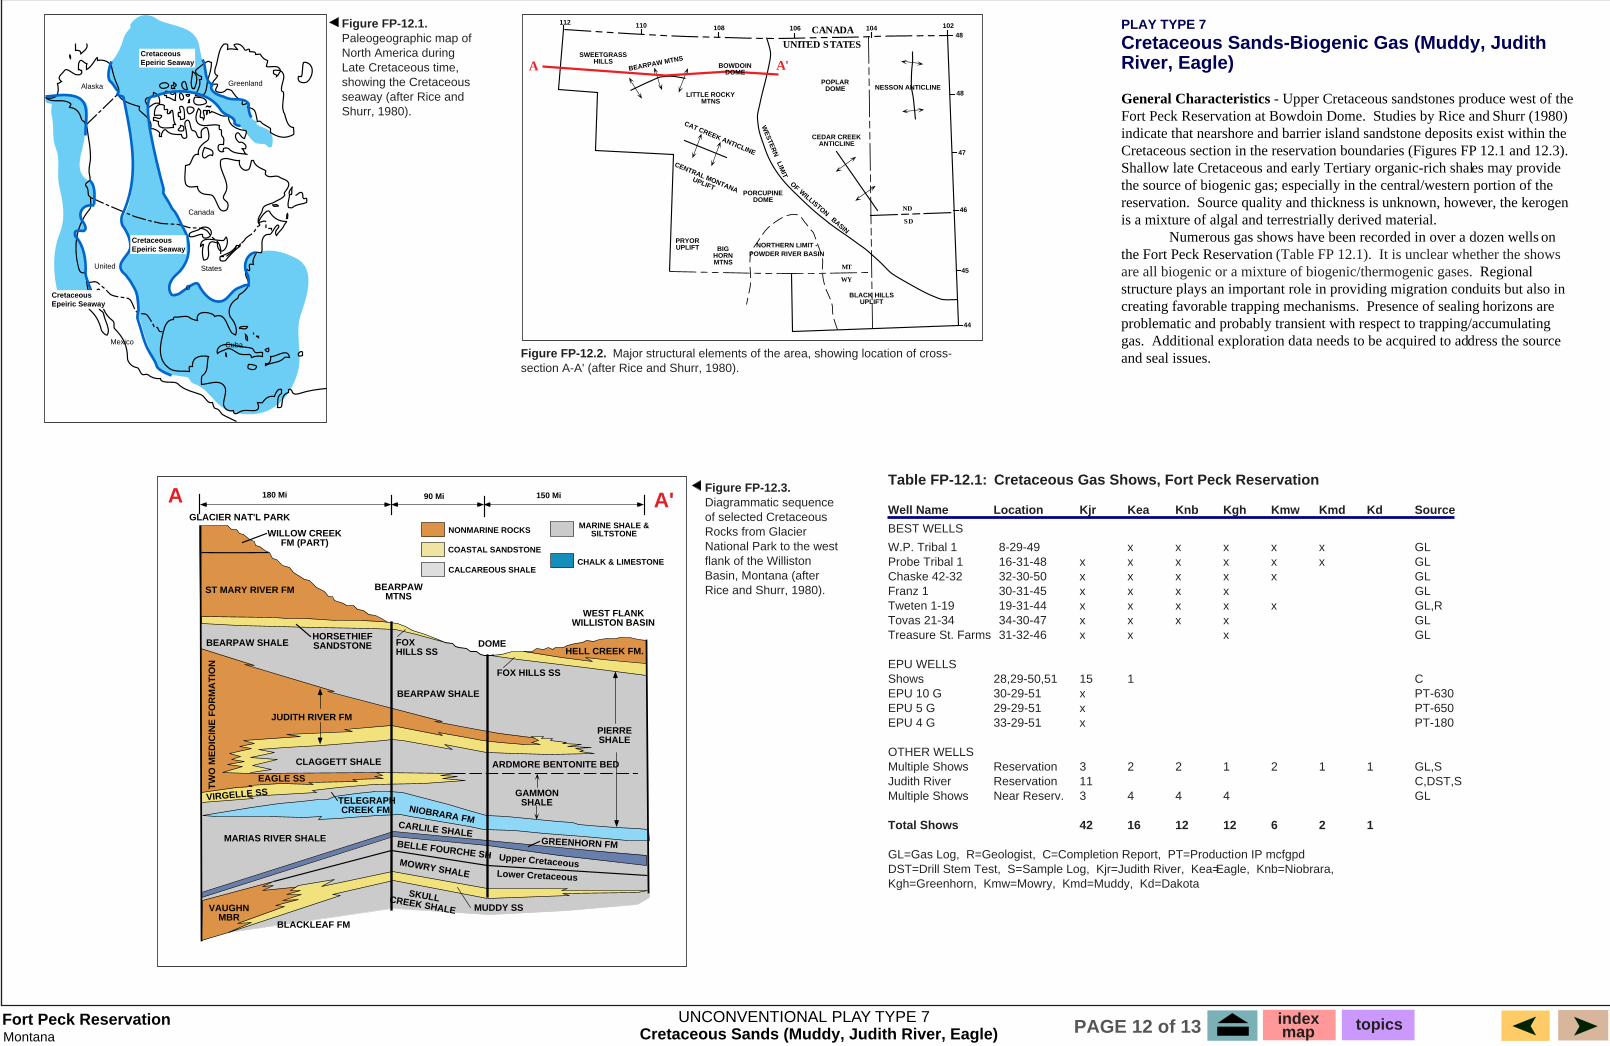
Figure FP-12.1. Paleogeographic map of North America during Late Cretaceous time, showing the Cretaceous seaway (after Rice and Shurr, 1980).
Figure FP-12.3. Diagrammatic sequence of selected Cretaceous Rocks from Glacier National Park to the west flank of the Williston Basin, Montana (after Rice and Shurr, 1980).
UNCONVENTIONAL PLAY TYPE 7
PLAY TYPE 7
Cretaceous Sands-Biogenic Gas (Muddy, Judith River, Eagle)
General Characteristics - Upper Cretaceous sandstones produce west of the Fort Peck Reservation at Bowdoin Dome. Studies by Rice and Shurr (1980) indicate that nearshore and barrier island sandstone deposits exist within the Cretaceous section in the reservation boundaries (Figures FP 12.1 and 12.3). Shallow late Cretaceous and early Tertiary organic-rich shales may provide the source of biogenic gas; especially in the central/western portion of the reservation. Source quality and thickness is unknown, however, the kerogen is a mixture of algal and terrestrially derived material. Numerous gas shows have been recorded in over a dozen wells on the Fort Peck Reservation (Table FP 12.1). It is unclear whether the shows are all biogenic or a mixture of biogenic/thermogenic gases. Regional structure plays an important role in providing migration conduits but also in creating favorable trapping mechanisms. Presence of sealing horizons are problematic and probably transient with respect to trapping/accumulating gas. Additional exploration data needs to be acquired to address the source and seal issues.
Cretaceous Sands (Muddy, Judith River, Eagle)indexmap topicsPAGE 12 of 13
MontanaFort Peck Reservation
Ft. Peck Reservation
General References
Anderson, Robert C., 1995, The Oil and Gas Opportunity on Indian Lands-Exploration Policies and Procedures, Bureau of Indian Affairs, Division of Energy and Mineral Resources, General Publication G-95-3, 158 p.
Beeman, William R., et al., 1996, Digital Map Data, Text and Graphical Images in Support of the 1995 Assessment of United States Oil and Gas Resources, United States Geological Survey, Digital Data Series DDS-35, CD ROM.
Charpenteir, Ronald R., et al., 1996, Tubular Data, Text, and Graphical Images in Support of the 1995 National Assessment of United States Oil and Gas Resources, United States Geological Survey, Digital Data Series DDS-36, CD ROM.
Gautier, Donald L., et al., 1996, 1995 National Assessment of United States Oil and Gas Resources - Results, Methodology, and Supporting Data, United States Geological Survey Digital Data Series DDS-30 Release 2.
_______________., et al., 1995, 1995 National Assessment of United States Oil and Gas Resources, Overview of the 1995 National Assessment of Potential Additions to Technically Recoverable Resources of Oil and Gas - Onshore and State Waters of the United States, United States Geological Survey Circular 1118, 20 p.
Mallory, William Wyman, et al., 1972, Geologic Atlas of the Rocky Mountain Region, Rocky Mountain Association of Geologists ,331 p.
Peterson, James A. and MacCary, Lawrence M., 1987, "Regional Stratigraphy and General Petroleum Geology of the U.S. Portion of the Williston Basin and Adjacent Areas", Williston Basin: Anatomy of a Cratonic Oil Province, Rocky Mountain Association of Geologists, pp. 9-43.
Rice, Dudley D. and Shurr, George W., July 1980, "Shallow, Low-Permeability Reservoirs of the Northern Great Plains - Assessment of their Natural Gas Resources", American Association of Petroleum Geologists Bulletin, Volume 64/7, pp. 969-987.
Willette, Donna C., et al., 1996, "Oil and Gas Atlas on Indian Lands", Indian Resources Building Partnerships, Sixth Annual Energy and Minerals Conference, Bureau of Indian Affairs, Division of Energy and Mineral Resources, 10 p.
Fort Peck - Fields and Articles
Ames, Vincent, 1985, "Reserve Field", Montana Oil and Gas Field Symposium, Montana Geological Society, Billings, Montana, pp. 955-959.
Anderson, Robert C., 1995, "Fort Peck Indian Reservation - The Assiniboine and Sioux Tribes", The Oil and Gas Opportunity on Indian Lands - Exploration Policies and Procedures, Bureau of Indian Affairs, Division of Energy and Mineral Resources, General Publication G-95-3, pp. 43-53.
Brunson, Tim, 1985, "Poplar, East Field", Montana Oil and Gas Field Symposium, Montana Geological Society, Billings, Montana, pp. 889-891, map in back pocket.
Chamberlin, Virgil R., 1985, "Benrud, East Field", Montana Oil and Gas Field Symposium, Montana Geological Society, Billings, Montana, pp. 211-214.
____________, 1985, "Benrud, Northeast Field", Montana Oil and Gas Field Symposium, Montana Geological Society, Billings, Montana, pp. 215-216.
Diehl, L.A., 1985, Poplar, "Northwest Field", Montana Oil and Gas Field Symposium, Montana Geological Society, Billings, Montana, pp. 893-895.
Grabb, Robert F., 1985, "Palomino Field", Montana Oil and Gas Field Symposium, Montana Geological Society, Billings, Montana, pp. 853-855.
Hargrove, Howard R., 1985, "Tule Creek Field", Montana Oil and Gas Field Symposium, Montana Geological Society, Billings, Montana, pp. 1131-1134.
Monson, Lawrence M., 1995, Fort Peck Reservation Oil Summary, Part I: Reservoirs, Production, and Reserves", Seventh Annual Williston Basin Symposium, Montana Geological Society, Billings, Montana, pp. 253-264.
____________, et al., 1995, "Fort Peck Reservation Oil Summary, Part II: Exploration Opportunities", Seventh Annual Williston Basin Symposium, Montana Geological Society, Billings, Montana, pp. 265-278.
____________, et al., 1995, "Cretaceous System Stratigraphy and Shallow Gas Resources on the Fort Peck Reservation, Northeastern Montana", Seventh International Williston Basin Symposium, Montana Geological Society, Billings, Montana, pp. 163-176.
____________, et al., 1995, "Evaluating Mineral Resource Potential on the Fort Peck Reservation Using GIS Analysis", Seventh International Williston Basin Symposium, Montana Geological Society, Billings, Montana, pp. 367-372.
Peterson, James A, 1996, "Williston Basin Province (031)", Tabular Data, text, and Graphical Images In Support of the 1995 National Assessment of Untied States Oil and Gas Resources, United States Geological Survey, Digital Data Series DDS-36, CD ROM.
Reeves, S.E., 1985, "Lisa", "Tule Creek", East Field"' Montana Oil and Gas Field Symposium, Montana Geological Society, Billings, Montana, pp. 1135-1137
____________, et al., 1985, "Volt Field"; Montana Oil and Gas Field Symposium, Montana Geological Society, Billings, Montana, pp. 1155-1160.
Shurr, George W., 1995, "Tectonic Setting and Paleotectonic History of the Fort Peck Reservation in Northeastern Montana", Seventh International Williston Basin Symposium, Montana Geological Society, Billings, Montana, pp. 11-22
Swenson, Robert E., 1967, "Trap Mechanics in Nisku Formation of Northeast Montana", American Association of Petroleum Geologists Bulletin, Volume 51/10, pp. 1948-1958.
Zachos, Louis G., 1985, "Lustre Field"; Montana Oil and Gas Field Symposium, Montana Geological Society, Billings, Montana, pp. 737-738 and map pocket
Fort Peck - Map References
Executive Reference Map 334, 1985 edition, Extended Area, Northern Rocky Mountains, Geomap Company.
Executive Reference Map 321, 1983 edition, Southern Williston Basin, Geomap Company.
Indian Land Areas, 1992, United States Department of the Interior-Bureau of Indian Affairs.
Clayton, Lee, et al., 1980, Geological Map of North Dakota Survey.
Darton, N.H., et al., 1951, Geologic Map of South Dakota, United States Geological Survey.
Ross, Clyde P., et al., 1958, Geological Map of Montana, Montana Bureau of Mines.
REFERENCES indexmap topicsPAGE 13 of 13


![Fort Ripley: The post and military reservation [by] F. Paul Prucha](https://img.pdfslide.us/doc/110x75/586a22151a28ab427d8bd2d1/fort-ripley-the-post-and-military-reservation-by-f-paul-prucha.jpg)