Embed Size (px)
Citation preview

1
Persistence of moist plumes from overshooting convection in the Asian monsoon anticyclone
Sergey M. Khaykin1, Elizabeth Moyer2, Martina Krämer3, Benjamin Clouser2, Silvia Bucci4,a, Bernard Legras4, Alexey Lykov5, Armin Afchine3, Francesco Cairo6, Ivan Formanyuk5, Valentin Mitev7, Renaud Matthey8, Christian Rolf3, Clare Singer2,b, Nicole Spelten3, Vasiliy Volkov5, Vladimir Yushkov5 and Fred 5 Stroh3 1 Laboratoire Atmosphères, Observations Spatiales (LATMOS), UVSQ, Sorbonne Université, CNRS, IPSL, Guyancourt, France 2 Dept. of the Geophysical Sciences, University of Chicago, Chicago, IL, USA 3 Forschungszentrum Jülich, Institut für Energie und Klimaforschung (IEK-7), Germany 10 4 Laboratoire de Météorologie Dynamique (LMD), CNRS, IPSL, ENS-PSL, École Polytechnique, Sorbonne Université, Paris, France 5 Central Aerological Observatory of RosHydroMet, Dolgoprudny, Russian Federation 6 National Research Council of Italy, Institute of Atmospheric Sciences and Climate (CNR-ISAC), Rome, Italy 7 Centre Suisse d’Electronique et de Microtechnique Neuchâtel, Switzerland. 15 8 University of Neuchâtel, Neuchâtel, Switzerland a Now at Institut für Meteorologie und Geophysik, University of Vienna, Vienna, Austria b Now at Dept. of Environmental Science and Engineering, California Institute of Technology, Pasadena, CA, USA
Correspondence to: Sergey M. Khaykin ([email protected]) 20
Abstract. The Asian Monsoon Anticyclone (AMA) represents the wettest region in the lower stratosphere (LS) and is the key
contributor to the global annual maximum in LS water vapour. While the AMA wet pool is linked with persistent convection in
the region and horizontal confinement of the anticyclone, there remain ambiguities regarding the role of tropopause-overshooting
convection in maintaining the regional LS water vapour maximum. This study tackles this issue using a unique set of observations
from onboard the high-altitude M55-Geophysica aircraft deployed in Nepal in Summer 2017 within the EU StratoClim project. 25
We use a combination of airborne measurements (water vapour, ice water, water isotopes, cloud backscatter) together with
ensemble trajectory modeling coupled with satellite observations to characterize the processes controlling water vapour and clouds
in the confined lower stratosphere (CLS) of AMA. Our analysis puts in evidence the dual role of overshooting convection, which
may lead to hydration or dehydration depending on the synoptic-scale tropopause temperatures in AMA. We show that all of the
observed CLS water vapour enhancements are traceable to convective events within AMA and furthermore bear an isotopic 30
signature of the overshooting process. A surprising result is that the plumes of moist air with mixing ratios nearly twice the
background level can persist for weeks whilst recirculating within the anticyclone, without being subject to irreversible dehydration
through ice settling. Our findings highlight the importance of convection and recirculation within AMA for the transport of water
into the stratosphere.
1 Introduction 35
Water vapour in the lower stratosphere has a direct impact on surface climate and stratospheric ozone chemistry (e.g. Dessler
et al., 2013, Dvortsov and Solomon, 2001). The variability of global lower stratospheric water vapour is, to first order, regulated
by the minimum temperature in the Tropical Tropopause Layer (TTL) – the main gateway for stratospheric entry of tropospheric
moisture (e.g., Fueglistaler et al., 2009, and references therein). This way, the variation of stratospheric water vapour follows the
https://doi.org/10.5194/acp-2021-653Preprint. Discussion started: 31 August 2021c© Author(s) 2021. CC BY 4.0 License.

2
annual cycle of TTL temperatures experiencing the minimum during Austral summer, when the TTL is coldest and driest above 40
the western Pacific region (e.g. Randel and Jensen, 2013). During Boreal summer, the primary contributor to the annual maximum
of lower stratospheric water vapour is the Asian monsoon (e.g. Bannister et al., 2004; Fueglistaler et al., 2005; Ueyama et al.,
2018) and the associated Asian summer monsoon anticyclone (AMA).
The AMA is one of the largest atmospheric circulation features on Earth, owing its existence to frequent deep convection above
Southern Asia and the Bay of Bengal, strong surface heating over the Tibetan plateau and orographic updrafts at the Southern 45
slopes of Himalayas (e.g., Hoskins and Rodwell, 1995). The AMA is characterized by a persistent maximum of water vapour
extending up to 68 hPa level (Park et al., 2007; Santee et al., 2017), which makes it the wettest region in the Boreal summer lower
stratosphere. Generally, this large-scale maximum is conditioned by convective uplift of moist air in the Asian monsoon region
and its horizontal confinement within the anticyclone (Dethof et al., 1999; Ploeger et al., 2015).
The transport of moist air into the stratosphere occurs via different pathways: slow radiatively-driven ascent (e.g. Garny and 50
Randel, 2016), fast convective overshooting (e.g. Fu et al., 2006) and adiabatic transport across the horizontal boundaries of AMA
(e.g. Pan et al., 2016) into the tropical and midlatitude stratosphere (Randel et al., 2010; Wright et al., 2011; Dethof et al., 1999;
Vogel et al., 2016; Rolf et al., 2018; Nutzel et al., 2019). The role of different transport pathways, particularly of the convective
overshooting and its predominant source regions, is subject of ongoing debate.
A relatively small impact of overshooting convection on AMA humidity is found by James et al. (2008), Wright et al. (2011), 55
Randel et al. (2015) and Zhang et al. (2016), whereas Fu et al. (2006), Ueyama et al. (2018) and Brunamonti et al. (2018) suggest
that this process can be an important contributor to the total water in the Asian TTL. The convective impact of different source
regions (e.g., Bay of Bengal, Tibetan Plateau, Southern slopes of Himalayas or Sichuan basin) is also under debate (Bannister et
al., 2004; Bergman et al., 2012; Fu et al., 2006; Lelieveld et al., 2007; Wright et al., 2011; Devasthale & Fueglistaler, 2010; James
et al., 2008; Park et al., 2007; Tissier & Legras, 2016; Legras & Bucci, 2020). 60
Notably, most of the observational evidence regarding the mechanisms controlling AMA water is derived from passive satellite
measurements, which due to their coarse vertical resolution cannot resolve the small-scale processes such as moistening produced
by localized injections of ice. The high-resolution measurements of water vapour within AMA using small balloons and research
aircrafts have only recently become available (Bian et al., 2012; Gottschaldt et al., 2018; Vernier et al., 2018; Brunamonti et al.,
2018). The most extensive set of high-resolution measurements including water vapour, ice water, water isotopic ratio, aerosols 65
and various tracers is provided by the StratoClim aircraft campaign, which was held in July-August 2017 and involved the high-
altitude M55-Geophysica aircraft deployed in Kathmandu, Nepal (Stroh et al., 2021, in prep. same issue; Kr̟ämer et al., 2020).
In this study, we combine local airborne measurements with global satellite observations to characterize the mechanisms of
convective impact on water vapour and clouds through both mass and energy transport above the cold point tropopause. We provide
observational evidence of convectively-induced lower stratosphere hydration and dehydration of both irreversible and reversible 70
types. The link between the local variations and phase transitions of water with deep convection across the Asian anticyclone is
investigated using ensemble trajectory modeling constrained by satellite detections of convective cloud tops. Section 2 of this
article describes the experimental and modeling setup, Section 3 provides the satellite view of synoptic-scale development in the
TTL during the campaign period and presents the ensemble of airborne measurements. The convective source regions and their
AMA-wide effects on water vapour are analyzed in Sect. 4. Section 5 documents and analyzes the observed processes controlling 75
water vapour above the tropopause, and is followed by the discussion and summary in Sect. 6.
https://doi.org/10.5194/acp-2021-653Preprint. Discussion started: 31 August 2021c© Author(s) 2021. CC BY 4.0 License.
3
2 Data and methods
2.1 StratoClim campaign and airborne instruments
The main experiment of the EU FP7 StratoClim project was the deployment of the Russian high-altitude M55-Geophysica
aircraft in Kathmandu, Nepal during July-August 2017. The campaign included eight flights (hereinafter referred to as Fx, where 80
x is the flight number) performed every second day during the period 27 July – 10 August in both the morning and afternoon hours.
Three of the flights were performed within the Nepali borders, whereas in the other flights the airplane flew out to southwest, south
and southeast from Nepal reaching the Bay of Bengal (see Fig. S1 of the Supplement). The Geophysica aircraft hosted a large
number of in situ and remote sensors for measuring gaseous and particulate UTLS composition. A full description of the campaign
is provided by Stroh et al. (2021, in prep. same issue). In this study, we use in situ measurements of water vapour, total water and 85
water isotopologues respectively by FLASH, FISH and ChiWIS instruments as well as particle backscatter measurements by the
onboard MAS scatterometer and MAL lidar.
2.1.1 In situ water measurements
FLASH-A (Fluorescent Lyman-Alpha Stratospheric Hygrometer for Aircraft) is an airborne instrument of the FLASH
hygrometer family designed specifically for the M55-Geophysica aircraft (Sitnikov et al, 2007). The instrument was redesigned in 90
2009 (Khaykin et al., 2013) for the RECONCILE campaign (von Hobe et al., 2013) and then substantially improved for the
StratoClim experiment. FLASH-A is mounted inside a gondola under the right wing of Geophysica and has a rear-facing inlet,
enabling water vapour measurements. With the aspiration rate of 470 cm3/s, the air samples in a 90 cm3 measurement chamber are
fully exchanged every 0.19 s. The chamber is maintained at constant temperature (24 °C) and pressure (36 hPa). Before a flight,
the instrument is ventilated for several hours using dry air (< 1 ppmv) whereas the inlet tube, heated to 30 °C, is kept sealed before 95
the aircraft climbs to 250 hPa level to avoid chamber contamination by moist tropospheric air.
Unlike the previous airborne versions of FLASH-A with transverse optical setup, the StratoClim FLASH-A rendition has a
coaxial optics similar to that of the FLASH-B balloon-borne instrument (Yushkov et al., 1998). The water vapour mixing ratio is
detected by sensing the fluorescence light yielded by photodissociation of water molecules after their exposure to Lyman-alpha
radiation. A near Lyman-α line (123.6 nm), is produced by a krypton lamp whereas the hydroxyl fluorescence at 300 – 325 nm 100
wavelength range is detected by a photomultiplier operating in photon-counting mode. The accuracy of water vapour measurements
in 1 – 100 ppmv range is estimated at 8%, whereas the precision of 1 Hz data in the stratosphere is 0.6 ppmv with a detection limit
of 0.1 ppmv for 5 s integration time. FLASH-A was calibrated against a reference MBW-373L frost-point hygrometer before and
after the aircraft deployment as well as during the campaign using FISH calibration facility. During StratoClim campaign, FLASH-
A operated in all the eight scientific flights as well as during the transfer flight to Kathmandu. 105
ChiWIS (Chicago Water Isotope Spectrometer) is an airborne implementation of the ChiWIS-lab instrument (Sarkozy et al.,
2020) designed for atmospheric chamber measurements of water vapour and water isotopologues under UTLS conditions. The
new version of the instrument is a tunable diode laser (TDL), off-axis integrated cavity output spectrometer (Clouser et al., 2021,
in prep. same issue). The spectrometer scans absorption lines of both H2O and HDO near 2.647 µm wavelength in a single current
sweep. With a 90 cm-long multi-pass cell, the effective path length amounts to more than 7 km. During the airborne campaign, the 110
instrument has demonstrated measurement precision for ten second integration times of 18 ppbv and 80 pptv in H2O and HDO,
respectively. The measurements were reported at 0.2 – 0.5 Hz frequency depending on the ambient mixing ratio and the desired
signal-to-noise ratio. Periods of the flights where the internal cell pressure of ChiWIS was below 30 hPa are not reported because
https://doi.org/10.5194/acp-2021-653Preprint. Discussion started: 31 August 2021c© Author(s) 2021. CC BY 4.0 License.

4
of the large influence of vapour desorption from the cavity walls. ChiWIS reported measurements for all the StratoClim flights
except F1 and F5. 115
FISH (Fast In situ Stratospheric Hygrometer) is a closed-path Lyman-α fluorescence hygrometer with a forward-facing inlet,
which enables measurement of total water (sum of gas phase water and sublimated ice crystals). The measurement accuracy is
6 % – 8 % whereas the precision of 1 Hz data is estimated at 0.3 ppmv (Zöger et al., 1999; Meyer et al., 2015). Inside the cirrus
clouds, the ice water content (IWC) is calculated by subtracting the FLASH-A gas-phase water from the total water measured by
FISH, as described by Afchine et al. (2018). The minimum detectable IWC is 3×10⁻² ppmv (∼3×10⁻³ mg m−3). FISH instrument 120
has provided measurements in flight F2, F4, F6, F7 and F8.
The point-by-point intercomparison between FLASH-A, ChiWIS and FISH clear-air measurements reported by Singer et al.
(2021, in prep. same issue) revealed a remarkable degree of agreement and an equally-high capacity of all hygrometers to resolve
fine-scale spatial structures in UTLS water vapour. In clear-sky periods at mixing ratios below 10 ppmv, the mean bias between
FISH and FLASH-A was -1.47% with an r2 value of 0.930. For ChiWIS and FLASH-A, the mean bias was -1.42% and +0.74% 125
with r2 values of 0.928 and 0.930 for clear-sky and in-cloud periods at mixing ratios below 10 ppmv, respectively. They also found
good agreement of the airborne measurements with the collocated MLS water vapour profiles as well as with concomitant balloon
soundings in Dhulikhel, Nepal (Brunamonti et al., 2018) using a cryogenic frost point hygrometer (CFH) instrument. Altogether,
this provides a high degree of confidence in the StratoClim water vapour measurement.
2.1.2 In situ temperature and cloud measurements 130
The temperature was measured by TDC (ThermoDynamic Complex), a modified Rosemount 5-hole probe that provides an
accuracy of 0.5 K and precision of 0.1 K for temperature measurements at 1 Hz frequency (Shur et al., 2007). We used TDC
measurements of temperature and pressure to convert FLASH-A water vapour mixing ratio into relative humidity over ice (RHi)
as well as to compute the saturation mixing ratio using the saturation vapour pressure equation by Murphy and Koop (2005). The
accuracy of TDC measurements is discussed by Singer et al. and Stroh et al. (2021, in prep, same issue) 135
NIXE-CAPS (New Ice eXpEriment: Cloud and Aerosol Particle Spectrometer) is mounted under the right wing of Geophysica
and measures the cloud particle number size distribution in the size range of 3–930 µm diameter at a time resolution of 1 Hz (Meyer,
2012). The IWC derived from particle size distribution are found to be in good agreement with those derived from FISH total water
measurements (Afchine et al., 2018). The lower detection limit of the instrument is 0.05 ppmv (≈0.005 mg m−3). NIXE-CAPS
provided measurements in all the flights. 140
In situ measurements of cloud/aerosol backscatter and with a time constant of 10 s were provided by the forward-looking
backscatter probe MAS (Multiwavelength Aerosol Scattersonde) described by Buontempo et al. (2006). To distinguish between
clear-sky and in-cloud measurements, here we use a threshold of 1.2 units of backscatter ratio at 532 nm together with a 2.5%
threshold in the volume depolarization (corresponding to particle depolarization of 8-10%). MAS instruments operated in all the
flights except F1, for which we used NIXE-CAPS data (Afchine et al., 2018) to detect the clouds. Singer et al. (2021, in prep. same 145
issue) showed good agreement between the cloud detections by both of these instruments.
Remote measurements of cloud backscatter below and above the aircraft were conducted by Miniature Aerosol Lidar (MAL)
(Mitev et al., 2002). Backscatter ratios at 532 nm are derived after applying a noise filter, range correction and correction for
incomplete overlap in the near range, allowing observations as close as 40 meters from the aircraft.
150
https://doi.org/10.5194/acp-2021-653Preprint. Discussion started: 31 August 2021c© Author(s) 2021. CC BY 4.0 License.

5
2.2 Satellite observations
The Microwave Limb Sounder (MLS) instrument, operating onboard the NASA Aura satellite, measures various chemical
species and temperature and provides over 3500 vertical profiles per day evenly distributed between 82° S to 82° N. Here we use
the version 4.2 water vapour profiles described by Livesey et al. (2017), who report for the lower-middle stratosphere a vertical
resolution of 2.8 – 3.2 km and an accuracy of 4 – 9%. The data screening criteria specified by Livesey et al. (2017) have been 155
applied to the data. To interpolate the water vapour profiles onto a common potential temperature grid, we use the MLS temperature
product provided at the same pressure levels.
Cloud-Aerosol Lidar with Orthogonal Polarization (CALIOP) is a primary instrument onboard the CALIPSO satellite,
operational since 2006 (Winker et al., 2009) and providing backscatter coefficients at 532 and 1064 nm with a vertical resolution
of 30 m in the UTLS. Here we use CALIOP 532 nm level 1B version 4.0 product for diagnosing the cloud vertical cross-sections 160
and for quantifying the cloud top altitude. To enhance the sampling of clouds, we also use level 1 backscatter product at 1064 nm
provided by NASA’s Cloud-Aerosol Transport System (CATS) lidar operating onboard International Space Station (Yorks et al.,
2016). The CATS 1064 nm backscatter is converted to 532 nm using CALIOP color ratio.
The GPS Radio Occultation (RO) technique provides vertical profiles of atmospheric variables with high vertical resolution
(~0.5 km around the tropopause), global geographical and full diurnal coverage, and high accuracy (<1 K) (Steiner et al., 1999). 165
We use RO “dry” temperature profiles from COSMIC (Anthes et al., 2008); GRACE (Beyerle et al., 2005) and Metop A/B missions
(Luntama et al., 2008) for analyzing the temperature and minimum saturation mixing ratio within AMA during July and August
2017.
2.3 Definitions
The vertical boundaries of the tropical tropopause transition layer (TTL) can be defined using two different approaches 170
reviewed by Pan et al. (2014). The mass-flux approach (Fueglistaler et al., 2009) defines the lower boundary as the tropically-
averaged level of all-sky zero net radiative heating (14 km, 355 K) and the upper boundary as 18.5 km (425 K), where the local
mass flux becomes comparable to that of the Brewer‐Dobson circulation (Fu et al., 2007). Another approach is based on the TTL
thermal structure, where the lower and upper boundaries are defined respectively as the level of minimum stability and the cold
point tropopause (CPT) (Gettelman and Forster, 2002). In this study, we adopt the thermal definition of the TTL as in this case the 175
boundaries can be derived from the local instantaneous measurements provided by the Geophysica. Pan et al. (2014) found that
the thermally-defined TTL boundaries are consistent with those derived from the ozone-water vapour relationship, which renders
the thermal approach to TTL definition most suitable for this study.
Since the location of the Geophysica deployment is not tropical in the geographical sense, we refer to the TTL in this region as
the Asian tropopause transition layer (ATTL) with an upper boundary at the CPT derived from ERA5 temperature profiles 180
collocated with the flight tracks and using airborne temperature profiles. Following Brunamonti et al. (2018), we refer to the upper
layer of the Asian anticyclone as confined lower stratosphere (CLS) with a lower boundary at the CPT level and an upper boundary
corresponding to the top level of confinement, which they estimate as 63.5 hPa (~440 K) for the 2017 AMA season.
A convective overshoot (also termed “ice geyser” by Khaykin et al. (2009)) is defined as detrainment of ice crystals above the
local CPT. Depending on the relative humidity at the level of detrainment, this process can lead either to CLS moistening by rapid 185
ice sublimation, or to irreversible dehydration via uptake of vapour by the injected ice crystals, their growth and sedimentation.
The clouds that have formed in the CLS as a result of local cooling are termed in situ cirrus. A secondary cloud refers to an in situ
cirrus cloud that has nucleated from an air mass enhanced in water vapour as a result of convective overshoot.
https://doi.org/10.5194/acp-2021-653Preprint. Discussion started: 31 August 2021c© Author(s) 2021. CC BY 4.0 License.
6
2.4 Ensemble trajectory modeling and convective cloud top data
For investigating the link between the variations in water vapour observed locally by the Geophysica and the deep convection 190
upwind detected using satellite IR imagery, we use the TRACZILLA Lagrangian model (Pisso and Legras, 2008), a modified
version of FLEXPART (Stohl et al., 2005). The simulation was designed to release an ensemble of 1000 back trajectories every
second along the aircraft flight path, travelling back in time for 30 d. The calculation of back trajectories was performed using the
European Centre for Medium-Range Weather Forecasts (ECMWF) ERA5 reanalysis horizontal winds and diabatic heating rates
provided at hourly frequency and 31 km horizontal resolution. The vertical diffusion was represented by a random walk equivalent 195
to D=0.1 m2 s−1 as in Bucci et al. (2020).
For detection of convective cloud encounters (convective hits) along the diffusive back trajectories we use cloud top
information from geostationary satellites (MSG1 and HIMAWARI -8). To cover the entire AMA region, we make use of the cloud
top product from both the MSG1 images for longitudes west of 90° E and the HIMAWARI-8 images for longitudes east of 90° E.
The MSG1 satellite operated by EUMETSAT carries the Spinning Enhanced Visible and Infrared Imager (SEVIRI), providing 200
multi-wavelength image collection with spatial resolution of 1 - 3 km and temporal resolution of 15 min (Schmetz et al., 2002). The
Himawari-8 geostationary satellite, launched by the Japan Meteorological Agency (JMA), carries the Advanced Himawari Imager
(AHI), providing the images at 0.5 - 2 km spatial resolution with 10 min intervals. For computational reasons, we use one image
every 20 min.
The cloud top height data was taken from the European Organization for the Exploitation of Meteorological Satellites 205
(EUMETSAT) Satellite Application Facility (SAF) on Support to Nowcasting and Very Short Range Forecasting (NWC)
products (Schulz et al., 2009; Derrien et al., 2010, Sèze et al., 2015). Here we use a specific version of product based on the version
2018.1 of the algorithm where the meteorological data are taken from ERA-5 at hourly resolution and using the full vertical
resolution of ERA-5 between 650 hPa and 50 hPa. This version is updated with respect to that used in Bucci et al., 2020 and
provides a significantly larger number of cloud tops above 100 hPa. The analysis was restricted to the highest and opaque cloud 210
classes that are representative of deep convection. In this study, we consider the convective hits above 100 hPa only, corresponding
to the cloud tops potentially overshooting the tropopause. They constitute 24.3% of the total number of convective hits identified
by this analysis. The convective origin of the sampled parcels is statistically diagnosed in terms of the fraction of convective hits
per 1 s sample as well as the convective age of parcel, i.e. the time since convective hit. A detailed description of the trajectory
modeling setup and geostationary satellite products is provided by Bucci et al. (2020). 215
3 Evolution of AMA conditions: two modes
3.1 Satellite perspective
The 2017 Asian monsoon season was characterized by a stable anticyclone with the strongest convective activity above the
Southern slopes of Himalayas and the Tibetan plateau during late July and early August as can be inferred from the low Outgoing 220
Longwave Radiation (OLR) sown as dashed contours in Fig. 1a. The OLR distribution in July-August 2017 is very similar to its
climatological pattern reported by Randel et al. (2015) (cf. their Fig. 5). The thermal conditions across the Asian TTL (ATTL)
exhibit a remarkable variability with minimum saturation mixing ratios between 14-18 ppmv in the warmer Northern part of AMA
and 2 ppmv above the colder Southern slopes where the Geophysica flights took place. The horizontal distribution of CLS water
https://doi.org/10.5194/acp-2021-653Preprint. Discussion started: 31 August 2021c© Author(s) 2021. CC BY 4.0 License.
7
vapour (390-420 K layer) averaged over 3 weeks before and during the Geophysica flights (Fig. 1b) reveals a pool of moist air 225
with two maxima near the center of the anticyclone.
The time evolution of temperature in terms of H2O saturation mixing ratio (Fig. 1c) and water vapour (Fig. 1d) within the
flight domain shows an interesting development of the UTLS conditions before and during the campaign period. In mid-July, a
humid layer in the ATTL starts to build up and propagates above CPT up to about 410 K by early August. The first four Geophysica
flights were conducted during this moisture build-up period, characterized by relatively warm CPT temperatures (Fig. 1c), which 230
we term “warm/wet” period. It should be noted that the 2017 AMA season was marked by a strong positive anomaly in water
vapour ranging 1 – 2 ppmv but without a significant tropopause temperature anomaly (Supplementary Fig. S2). The positive water
vapour anomaly is not specific to AMA region and reflects the global wet anomaly in the tropics and subtropics, as revealed by
MLS observations (not shown).
In early August, after the warm/wet period, the ATTL experienced a rapid cooling and the last four flights sampled a colder 235
and drier ATTL. This “cold/dry” period is marked by stronger convective activity in the region reflected by low OLR (Fig. 1c) and
higher carbon monoxide (Fig. 1d), indicative of an enhanced flux into the stratosphere. This period is also marked by a widespread
occurrence of ice clouds above the CPT (377 – 390 K) and as high as 415 K level according to high-resolution cloud profiling by
CALIOP and CATS satellite lidars (Fig. 1d). We note that the cold convective period had a transient effect on the CLS water
vapour, which mostly recovers the late July values, after the cease of convective activity and tropopause warming in the flight 240
domain. A similar inference was reported by Brunamonti et al. (2018) on the basis of balloon soundings in Nepal during the
airborne campaign.
3.2 Airborne perspective
The airborne measurements of water vapour and temperature shown in Fig. 2 reflect the satellite-derived development of the 245
UTLS conditions. The ensemble of water vapour profiles obtained using the FLASH hygrometer during the eight StratoClim flights
is shown in Fig. 2a. The H2O vertical profiles at and above the CPT level show a striking variability over the two-week campaign
period with mixing ratios ranging from 2.8 to 10.2 ppmv. On average, the warm/wet period yielded an L-shaped mean H2O profile
(solid curve), which is characteristic of the Boreal subtropical conditions, although with notable enhancements at and above the
CPT. In contrast, the cold convective period revealed the vertical distribution more typical for the tropical tropopause conditions, 250
with the hygropause at the CPT level. The airborne measurements during both synoptic periods show an accumulation of sharp
moist layers above the CPT and up to 410 K level which are diagnosed in the following section. These layers constitute the CLS
wet pool seen by MLS, although their sharp vertical structures of sub-kilometer scale can hardly be resolved by the satellite.
The large variability of water vapour is consistent with the tropopause temperature variability, showing minimum saturation
mixing ratio between 2.5 and 6.5 ppm and highly variable CPT vertical structure (Fig. 2b), presumably modulated by gravity 255
waves. The CPT potential temperature varied between 370 – 391 K, which is fully consistent with the GPS-RO data.
The highly-variable thermal conditions led to a remarkable dispersion of RHi around the CPT. The clear-sky measurements
reveal both a subsaturated and strongly supersaturated environment with RHi spanning 40 – 175 % (Fig. 3a). The credibility of
RHi data is ensured by an excellent agreement across the three airborne hygrometers and temperature sensors (TDC and UCSE)
(Singer et al., in prep. same issue). In the presence of ice crystals (Fig. 3b), the RHi is generally well above 100% although the 260
subsaturated cloud occurrences were also observed in both dry and wet parts of the water vapour spectrum. Those are mainly
caused by short excursions of temperature above the frost point, which does not necessarily lead to permanent evaporation and
depends on the Lagrangian temperature history. The occurrence of ice crystals was recorded at levels 15 K (~1 km) above the local
https://doi.org/10.5194/acp-2021-653Preprint. Discussion started: 31 August 2021c© Author(s) 2021. CC BY 4.0 License.
8
CPT. The highest-level clouds were detected by the upward-looking MAL lidar at 412 K (18.5 km), which is consistent with NIXE-
CAPS detection of cloud particles up to 415 K (Krämer et al., 2020, their Fig. 11) as well as with the maximum cloud altitudes 265
inferred from satellite lidars (415 K). The presence of ice in supersaturated air is more specific to the cold dry parcels (see also
Krämer et al., 2020, their Figure 10d), which suggests a local dehydration during the cold/dry period.
A different perspective on the environmental conditions of cloud occurrence around the CPT is provided in Fig. 3c, showing
the distribution of IWC as a function of RHi. The binned ensemble is restricted to the samples, for which both MAS and NIXE-
CAPS data indicate the presence of ice particles. The ice crystals found in the subsaturated air above the local CPT are likely to be 270
in the process of sublimation and therefore have a potential for a permanent CLS hydration. Conversely, the crystals in the
supersaturated environment will retain their aggregate state and the largest ones (characterized by higher IWC) will sediment down
below the tropopause thereby causing permanent dehydration of the CLS. We note that the ice particles in the subsaturated
environment account for 14% of the particles detected above the local CPT.
4 Convective influence on CLS water vapour 275
The influence of overshooting convection on the observed water vapour variability was investigated using TRACZILLA
ensemble trajectory modeling constrained by satellite cloud imaging and ERA5 reanalysis (see Sect. 2.4). Figure 4a displays a
binned ensemble of the measured water vapour mixing ratios color-coded by the convective hits fraction. The results for the
individual flights are provided in Fig. S3 of the Supplement. The trajectory analysis suggests that the convective origin is
characteristic to anomalously wet and anomalously dry parcels, which points out the dual role of overshooting convection on the 280
AMA water vapour, i.e. hydration/dehydration. The link to overshooting convection is particularly obvious for a strong water
vapour enhancement peaking at 399 K level, which corresponds to F2 of the warm/wet period (see Sect. 5.1 for detailed analysis
of this flight) and for a smaller enhancement at 403 K, corresponding to F7 (see Sect. 5.2).
The elevated convective hits fraction is also characteristic to the driest bins between 370 – 400 K corresponding to F8 of the
cold/dry period with large-scale convection in the flight domain. While the driest parcels are linked with the local or nearby 285
convective events, the wettest ones are traced back to distant convective events all along the circulation pattern of the anticyclone,
that occurred several days before their outflows have been sampled by Geophysica. The only exception is F6, which was influenced
by a young outflow of a large convective system in the vicinity of the flight (see Sect. 4.2 and Fig. S4 of the Supplement).
4.1 Isotopic composition of convective plumes
The relation of moist layers with overshooting convection can be reliably diagnosed using the isotopic ratio of water 290
(HDO/H2O), which is enhanced for water vapour molecules sublimated from ice. Figure 4b clearly shows that the wetter parcels
in the lower stratosphere are isotopically enhanced, and the wettest of them bear the strongest isotopic signature. This
unambiguously points out that the hydrated layers have been produced by overshooting ice geysers. Remarkably, the wet and
isotopically enhanced pixels in Fig. 4b are found as high as 420 K level, that is 30 – 50 K above the cold point. Given the diabatic
heating rate of 1.1 K/day in AMA and the average recirculation time of 16 days within the anticyclone (Legras and Bucci, 2020), 295
these hydrated parcels could, in principle, have recirculated twice before being sampled by the aircraft.
https://doi.org/10.5194/acp-2021-653Preprint. Discussion started: 31 August 2021c© Author(s) 2021. CC BY 4.0 License.

9
4.2 Geographical distribution of convective sources
Figure 5 shows the composited map of convective clouds (highest cloud classes), which are linked by trajectories with the
observed hydrated and isotopically-enhanced “wet and heavy” parcels and thereby represent the most probable sources of the
convectively-processed CLS air sampled by the aircraft. The wet and heavy parcels are defined as those with water mixing ratios 300
exceeding one standard deviation from the median (dashed curve in Fig. 4b) at a given potential temperature level and with isotopic
ratios above -400 per mill (except for F1 and F5 where the HDO measurements are not available and the selection is done based
on H2O only).
The composited map suggests a broad geographical scatter of the convective clouds across the Asian anticyclone. The lifetime
of hydrated parcels, as inferred from the back trajectories, ranges from ~12 hours (F6) to about 12.7 days (F7) (see Supplementary 305
Figure S4 for convective age in individual flights). The wet and heavy parcels sampled during the warm/wet period (F1 through
F4) originate from various convective systems in the Northeastern China and Korean peninsula, all of them occurring North of 35
N. The convective age for these parcels varies between 2.6 and 9.9 days. Sensibly, the shortest age corresponds to the lower-height
moist layer at 390 K level (F2), whereas the longest age is found for the wet and heavy parcels detected as high as at 410 K in F4.
The moist features in the flight F2 (A2 and B2, see Sect. 5), found at 390 and 399 K levels, are sourced to different convective 310
events that occurred 2.6 and 4.7 days before being sampled by Geophysica.
While the warm/wet period flights were largely influenced by convection in the Northeastern part of AMA, the wet and heavy
parcels sampled during flights F5 – F7 are sourced to various different locations. A large convective system over North-Eastern
India in the vicinity of the flight on the same day is responsible for the hydration feature in F6 at 380 K level. The convective
source of the wet air sampled by F5 is found above Western India, although we note that no isotopic data are available for this 315
flight, whereas the number of parcels with mixing ratio exceeding one standard deviation is small for this flight. In flight F7, the
enhanced water vapour features above 400 K (A7 and B7, see Sect. 5) originate from two different sources: the lower-level feature
(A7) is traced back to a group of relatively small systems along the Eastern Chinese coast that occurred 3.9 days before the
measurement, whereas the upper one (B7) originates from a large cluster of small-scale convective systems in the center of Asian
anticyclone above the northern foothills of Himalayas. We note that this particular region is marked by enhanced water vapour 320
amount according to MLS averages over the campaign period (cf. Fig. 1b). The B7 parcels have thus followed the anticyclonic
circulation path for nearly a full loop before arriving to the flight domain, which took 12.7 days.
The potential for a vapour-rich parcel travelling within AMA CLS to permanently hydrate the stratosphere is determined by
the Lagrangian temperature history. We did not analyze the RHi variation along the trajectories, however we quantified the
minimum temperatures encountered across AMA using high-resolution GPS-RO profiling. As follows from Fig. 1a, the subtropical 325
part of AMA has never cooled below the H2O saturation mixing ratios of around 8 ppmv in July-August 2017, enabling the vapour-
rich patches to travel along the northern flank of the anticyclone without freezing. Remarkably, the majority of convective systems
identified as the most probable sources of wet and heavy parcels (shown in Fig. 5 and marked by black pixels in Fig. 1a) have
occurred within the warm tropopause environment in the northern subtropical part of AMA.
It is noteworthy that the probed wet and heavy parcels (shown along the flight tracks in Fig. 5) are all located in the 330
northernmost part of the flight domain, i.e. nearer the center of AMA. This is consistent with the spatial distribution of AMA CLS
water vapour inferred from MLS (Fig. 1b), showing the maxima above the Tibetan plateau and Sichuan region, that is around the
center of the anticyclone. With that, the air circulating near the outer edge of the anticyclone is bound to pass the colder TTL above
central India and the Southern slopes, where the organized large-scale convection occurring during the second part of the campaign
https://doi.org/10.5194/acp-2021-653Preprint. Discussion started: 31 August 2021c© Author(s) 2021. CC BY 4.0 License.

10
(cf. Fig. 1) has led to cooling and dehydration at around the CPT level. The efficiency of the convectively-induced dehydration, 335
counteracting with the convective moistening in the warmer TTL regions of AMA is considered on a case by case basis in the next
section.
5 Long-range transport and evolution of moist convective plumes
The hydrated layers in the CLS characteristic of elevated convective hits fraction and/or isotopic enhancement (wet and
heavy) were detected at altitudes between 16.9 – 19.0 km (380 – 415 K) in all the flights except F8 with the magnitude of mixing 340
ratio enhancement between 0.9 – 5 ppmv (see Supplementary Fig. S3). The largest enhancement (5 ppmv) was observed in F2 at
399 K (B2 feature), whereas the highest altitude of hydrated layer centered at 18.9 km (411 K) was sampled in F7 (B7 feature).
The flights F2 and F7 represent respectively warm/wet and cold/dry regimes (see Sect. 3), however in both of these flights the
observed moist layers originated from distant convective events. In this section, we provide further insight into the results of F2
and F7 and describe the evolution of the respective moist convective plumes using airborne and satellite measurements. 345
5.1 Warm and wet regime: Flight 2
During the warm/wet regime, the mean CPT-level water vapour mixing ratio was 7.2 ppmv, whereas the minimum
saturation mixing ratio ranged from 5.5 to 6.9 ppmv. During F2, the aircraft was cruising side to side along the Himalayan foothills
within Nepali borders gaining altitude in 500 m steps before climbing to 21 km (Fig. 6c). The water vapour vertical profile in Fig.
6a,b reveals two layers above the CPT (marked A2 and B2) with water mixing ratio peaking at 10.2 ppmv, twice the campaign-350
median value at this level. It should be noted that all the three airborne hygrometers report identical spatial structures and absolute
values of humidity for these layers, providing full confidence in this observation (see Fig. 3 in Singer et al. (2021), in prep., same
issue).
The upper layer (B2) topping at 399 K (~18 km) is characterized by very large fraction of convective hits reaching 0.9
(Fig. 6a) with an average age of 4.7 days (cf. Fig. 5). The convective origin of B2 is unambiguously confirmed by a strong 355
enhancement in the HDO/H2O ratio of -340 per mill. This is substantially higher than the isotopic ratio found for the equivalent-
humidity air below the CPT (about -480 per mill at 373 K level). The enhanced isotopic ratio in this layer clearly indicates that the
water vapour enhancement was produced by sublimation of ice. It is remarkable that after nearly 5 days, the convective plume
responsible for B2 feature has retained such an amount of moisture.
The underlying wet layer (A2) at ~390 K (~17.5 km) is traced back to a different convective event aging 2.4 days (cf. Fig. 360
5). However, given that the magnitude of enhancement is nearly the same as that of its upper-level twin, it is conceivable that both
A2 and B2 represent the outflow of the same convective event in Northeastern China, and the lower-level A2 feature is a result of
gravitational settling of ice crystals shortly after injection.
5.1.1 Secondary cloud formation
For an air parcel at 82 hPa bearing 10 ppmv of water vapour (as reported for B2), the saturation is achieved at -78.5 °C. 365
The B2 feature was characterized by the maximum RHi of 116% (Fig. 6c) at -79 °C. At these conditions, a local cooling of 2 °C,
which can be produced by a gravity wave (e.g. Kim and Alexander, 2015), would boost the RHi to 165%. This corresponds to the
homogeneous freezing threshold at this temperature, hence such a cooling would almost certainly lead to formation of a secondary
https://doi.org/10.5194/acp-2021-653Preprint. Discussion started: 31 August 2021c© Author(s) 2021. CC BY 4.0 License.

11
cloud. Such a cloud was detected by the upward looking MAL lidar at 18 – 18.5 km (398 – 412 K) in F2 with the maximum
scattering ratio of 8.1 (marked C2 in Fig. 6c). 370
Interestingly, the bottom of this cloud is found at the same potential temperature level as the hydrated layer B2 and only
about 350 km away from it. Nevertheless, these features appear to have different convective sources. Figure 7a shows the back
trajectories released from this cloud intersecting a large convective system above Northeast China on 21 July, 8 days before F2. In
an attempt to investigate the evolution of humidity of this air mass, we searched for the MLS swaths collocated in space and time
(within 500 km and 1 hour) with the tracked parcels. A perfect match was found on 24 July: the MLS swath lies precisely across 375
the cluster of the tracked parcels as shown in Fig. 7b. The nearest MLS profile reports 8 ppmv at the parcel level, which is 2 – 3
ppmv wetter than the neighboring measurements along the same orbit. This suggests that the moist plume remained compact up to
3 days after the convective event.
The Lagrangian temperature history of this air mass (Fig. 7c) suggests that since the convective encounter, the parcels
remained subsaturated most of the time and, in particular, during the collocated measurement by MLS. The RHi was estimated 380
from the ERA5 temperature and pressure along the back trajectories, whereas the mixing ratio was assumed to be constant 12
ppmv. The episodes of moderate supersaturation with RHi reaching 140% were encountered between about 144 to 170 h before
the sampling and it is conceivable that cirrus could have formed around that time and some water was lost to sedimentation.
However, the episodes of strong supersaturation with RHi reaching the homogeneous freezing threshold were encountered only
during the last day before the measurement, when the parcels were entering the colder CLS above the Southern slopes. The RHi 385
along the back trajectories during the last day was reaching 160%, which would enable ice nucleation and repartitioning of the
excessive vapour into a secondary cloud.
5.2 Cold and dry regime: Flight 7
The cold/dry regime was marked by a synoptic-scale cooling throughout the 370 – 400 K layer extending across the CPT.
The largest vertical extent of the cold layer was observed in F7, where the saturation mixing ratio dropped below 4 ppmv throughout 390
370 – 397 K layer (cf. Fig. 2b). The northbound flight leg of F7 (see flight track in Supplementary Fig. S1) included several
porpoises across the CPT level (varying between 375 – 383 K) as shown in Fig. 8a. The time series of potential temperature is
marked with ice particle occurrence detected by MAS, which shows the presence of subvisible cirrus clouds with scattering ratio
below 6 extending up to 400 K level.
The water vapour time series in Fig. 8a reveals a remarkably large horizontal variation of mixing ratio in this layer, spanning 395
3.0 to 6.2 ppmv on a horizontal scale of hundred kilometers. Almost the entire CPT-porpoising segment of F7 shown in Fig. 8a
(20000 – 22200 s) is supersaturated with RHi reaching 155%, whereas the water vapour variation follows the saturation mixing
ratio with a high degree of correlation (r = 0.97). The occurrence of ice particles detected by MAS is reflected by enhancements in
IWC shown as blue shading in Fig. 8a,b. The magnitude of IWC enhancements (up to 3.3 ppmv) is comparable to the magnitude
of water vapour reduction, which suggests that these ice crystals have formed in situ as a result of synoptic-scale CPT cooling. 400
Indeed, as shown in Fig. 8b, the total water does not exceed the background level represented by the mean water vapour from the
previous flights. This does not however rule out that some of these crystals were produced by overshooting as suggested by Lee et
al. (2019) for this particular flight.
Above the layer of thin cirrus reaching 400 K level, the water vapour profiles in F7 reveal two enhancements, marked in
Fig. 8 as A7 and B7. The B7 feature is characterized by a maximum enhancement of 1.9 ppmv at 410 K in a layer extending 405
https://doi.org/10.5194/acp-2021-653Preprint. Discussion started: 31 August 2021c© Author(s) 2021. CC BY 4.0 License.

12
between 405 – 415 K (18.5 – 19 km). Both A7 and B7 moist features are characteristic of significant isotopic enhancement (Fig.
8c), whereas the B7 is also marked by an enhanced fraction of convective hits (cf. Fig 4a and Supplementary Fig. S3). From the
convective sources’ analysis in Sect. 4.2, we know that the hydrated feature B7 has a convective age of 12.7 days during which
the moist convective plume has made a nearly complete circle within AMA. During this time, the mixing within the moist layer is
expected to smoothen its vertical structure, however the B7 enhancement reveals a rather sharp vertical structure. Such a sharp 410
structure is normally associated with recently sublimated ice crystals from a nearby overshoot (e.g. Khaykin et al., 2009; 2016).
The absence of recent (< 5 days) convective events (see Supplementary animation) upwind of B7 has led us to investigate the
satellite cloud measurements and temperature history along the corresponding backward trajectories.
5.2.1 Secondary cloud sublimation
Figure 9a shows an ensemble of back trajectories released from B7 together with the ground tracks of CALIPSO and CATS 415
nighttime orbits nearest in time and space with the location of the sampled air parcels along their trajectories. The locations and
timing of satellite lidar transects were favorably close to the locations of the tracked parcels at each given time: the largest temporal
offset between the trajectory time and a lidar transect is only about 3 hours. This warrants investigation of the Lagrangian evolution
of cloud occurrence in the B7 parcel.
On 6 August, neither CATS nor CALIOP transects (marked as T1 and T2 in Fig. 9a) show the presence of clouds above 18 420
km, which is consistent with the parcel’s temperature history in Fig. 9c showing sub-saturated conditions before T1. After passing
the T2 point, the parcel has experienced a strong cooling episode, boosting the maximum RHi above the homogeneous freezing
threshold. The next collocated lidar overpass (T3) took place on 7 August when the parcel’s temperatures have just relaxed down
to saturation levels. The lidar curtains labeled T3 and T4 (Fig. 9b) show evidence of partial evaporation of the cirrus cloud cross-
sampled by CATS at 17 UT (T3) and by CALIOP three hours later (T4). The location of the tracked parcels (marked by a white 425
rectangle in Fig. 9b and Supplementary Fig. S5b), matches precisely the evaporating fraction of the cloud. Thus, the final
sublimation of this secondary cloud has occurred about 13 hours before B7 sampling, which can explain its sharp vertical structure.
At the time of B7 sampling, the parcel’s RHi – computed from ERA5 temperatures and FLASH peak value of 7.3 ppmv in
the hydrated layer – amounts to nearly 100%, which is consistent with the airborne temperature measurement. Downwind of the
flight track there are two transects (T5 and T6), not necessarily collocated in time with the westward progression of B7 parcel, but 430
showing an absence of ice particles at the respective level (Fig. 9 and Supplementary Fig. S5).
The above led us to conclude that while the B7 water vapour enhancement was produced by a 12.7-days old convective
plume that circumnavigated AMA, its vertical structure was modified by strong yet transient cooling episodes that acted to
temporally repartition the vapour into ice on a scale of several hours. As inferred from NIXE-CAPS particle size distribution
measurements in F8, a freshly nucleated in situ cirrus at around the CPT level is dominated by very small ice crystals with effective 435
diameter of 4 -10 μm (Supplementary Fig. S6). According to Muller and Peter (1992) such crystals would sediment at a rate of 0.6
- 2 cm/s. Assuming the onset of ice crystals nucleation at B7 - 20 h (corresponding to the onset of the strong cooling episode) and
their evaporation at T4 point, the cloud particles should have sedimented by less than 200 - 700 meters during their lifetime.
With this case we point out that the homogeneously-nucleated crystals smaller than 10 μm occurring in the CLS as a result
of convectively-induced radiative cooling and/or gravity waves-induced temperature perturbations do not last long enough to 440
sediment out from the stratosphere and therefore have limited potential to dehydrate the CLS.
https://doi.org/10.5194/acp-2021-653Preprint. Discussion started: 31 August 2021c© Author(s) 2021. CC BY 4.0 License.

13
6 Discussion and summary
The occurrence of water vapour enhancements in the lower stratosphere associated with overshooting convection has been
reported in several studies based on in situ measurements in the deep tropics over Western Africa (Khaykin et al., 2009; Schiller
et al., 2009), Northern Australia (Kley et al., 1993; Corti et al., 2008), South America (Khaykin et al., 2013), Central America 445
(Sargent et al., 2014), Western Pacific (Jensen et al., 2020) as well as at midlatitudes over North American monsoon (Hanisco et
al., 2007; Weinstock et al., 2007; Smith et al., 2017) and Asian monsoon (Vernier et al., 2018; Brunamonti et al., 2018; Krämer et
al., 2020). We note that the reported cases represent a small fraction of in situ measurements acquired; there is typically no more
than one case of water vapour enhancement above the tropopause detected during a field campaign.
Compared to other field campaigns, the StratoClim aircraft deployment in Nepal provided a lot of evidence for moist layers 450
above the tropopause. Their convective overshooting origin is unambiguously supported by both the enhanced isotopic ratios in
the moist plumes and by their traceability to convective events. Notably, the occurrence of lower stratospheric moist plumes above
the monsoon regions is also supported by satellite observations (Fu et al., 2006; Schwartz et al., 2013; Werner et al., 2020), whereas
the enhanced water isotopic ratios observed over these regions (Hanisco et al., 2007; Randel et al., 2012) support the role of
overshooting convection in maintaining the water vapour maximum in the summer monsoon anticyclones. This process adds to 455
the radiatively-driven slow ascent of wet air through the warm tropopause in the northern part of AMA. Another possible pathway
of water into the CLS in addition to the slow ascent and overshooting may be the isentropic transport across the CPT from the
Tibetan plateau (characterized by highest CPT) to the southern slopes of Himalayas.
Using MLS observations and OLR data, Randel et al. (2015) concluded that stronger convection in the Asian monsoon
region leads to colder and drier lower stratosphere whereas the opposite is true for the weaker convection. They also pointed out 460
the importance of subseasonal variations of deep convection driving the water vapour amount near the tropopause. Interestingly,
the composited maps of OLR anomalies for wet and dry regimes (Fig. 5 in Randel et al. (2015)) reveal an east-west dipole and in
both cases this dipole is centered exactly on the StratoClim flight domain. Furthermore, the evolution of the UTLS conditions in
the flight domain, switching from warm/wet to cold/dry regime over the course of the campaign, allowed for sampling the opposite-
sign effects of deep convection on the water vapour above the tropopause. 465
Our analysis confirms the conclusion of Randel et al. (2015) regarding the strong relation between convectively-modulated
temperature and water vapour around the tropopause. Indeed, the second (cold/dry) period of the campaign with organized
convection in the region led to synoptic-scale CPT cooling and a drastic drop of water vapour by ~30% around the tropopause. We
note though that the dehydration layer did not extend above 395 K. A similar conclusion was made by Brunamonti et al. (2018) on
the basis of balloon soundings of water vapour and ozone in Nepal as part of StratoClim campaign in 2017. They argued that 470
overshooting convection is responsible for an isolated maximum of H2O in the CLS observed in July 2017, whereas the water
vapour minimum at the CPT level is caused by synoptic-scale cold anomaly above the southern slopes that maximized around 9
August.
Our trajectory analysis suggests that the convective origin is characteristic of the wettest and the driest parcels (Fig. 4a),
which points out the dual role of overshooting convection on the AMA water vapour. With that, we note that the probability of 475
dehydration decreases with the age of convective outflow, ascending within AMA at an average 1.1 K/day rate in potential
temperature (Legras and Bucci, 2020). This way, a hydrated air mass, circulating within the confined anticyclone, progressively
moves up and away from the tropopause and becomes less likely to encounter permanent dehydration. A similar inference was
made by Ueyama et al., (2018) on the basis of trajectory-based microphysical simulations. Although, as we showed here, the
https://doi.org/10.5194/acp-2021-653Preprint. Discussion started: 31 August 2021c© Author(s) 2021. CC BY 4.0 License.

14
secondary clouds can form as high as 410-415 K level, their lifetime is limited to a fraction of day, which does not enable a 480
permanent removal of water vapour from the CLS. Thus, a hydrated plume that survived a full turnover within AMA would retain
its moisture and eventually loft it into the free stratosphere.
The question on the role of different AMA sub-regions in the cross-tropopause transport of water has been addressed by a
number of studies quoted in the introduction however there appears to be no consensus regarding the dominance of a particular
sub-region. In this study, the majority of the observed wet plumes in the CLS are traced back to convective events in the 485
northeastern part of AMA, which influenced the flights during the first (warm/wet) period of the campaign. The other flights have
sampled wet air originating from convection above the Tibetan plateau as well as northeastern and northwestern India. Given the
limited time period of the campaign and the large subseasonal variability of the Asian monsoon, this inference may not be fully
representative of the climatological convective source regions. Nevertheless, it can be concluded that convection occurring in the
northern and northeastern parts of AMA, characterized by a warmer tropopause, is more likely to produce persistent moistening of 490
the lower stratosphere.
The airborne measurements in AMA within StratoClim have revealed the abundance of moist convective plumes in the
CLS. In this respect, the Asian anticyclone is very similar to its North American counterpart. Indeed, both anticyclones extend well
into the extratropics, where a warmer tropopause enables unimpeded transport of large amounts of water vapour. An important
finding of our study is the persistence and recirculation of moist convective plumes in the confined LS of AMA. To our knowledge, 495
such phenomena were never before observed in the deep tropics. The recirculation of water vapour-enhanced air masses was
reported in the Antarctic and Arctic vortices (Voemel et al., 1995; Khaykin et al., 2013) where the hydration of lower stratosphere
occurs through sedimentation of ice PSCs.
Overall, our results suggest a complexity of processes controlling water abundance and its aggregate state in the lower
stratosphere of AMA. The strong isotopic enhancements specific to the moist layers in the CLS and their traceability to convective 500
events consistently suggest that overshooting convection is an important contributor to the seasonal maximum of water vapour in
the AMA lower stratosphere. At the same time, the large-scale organized convection in the southern part of AMA is shown to
cause synoptic-scale dehydration around the tropopause through radiative cooling. Another mechanism of dehydration is the
overshooting of ice crystals into the supersaturated environment above the tropopause, which leads to their rapid growth and
sedimentation. The evidence of such a process was obtained in a particular flight (F8) and will be a subject of a separate study. 505
Acknowledgements
We gratefully thank the StratoClim coordination team, and the Myasishchev Design Bureau for successfully conducting the
field campaign. This work was supported by the StratoClim project by the European Community’s Seventh Framework Programme
(FP7/2007–2013) under grant agreement no. 603557 and the TTL-Xing ANR-17-CE01-0015 projects. Meteorological analysis 510
data are provided by the European Centre for Medium-Range Weather Forecasts. ERA-5 trajectory computations are generated
using Copernicus Climate Change Service Information. We also thank the AERIS/ICARE data and service centre for providing
access to the MSG1 and Himawari data and computer resources for the production of the cloud top product using SAFNWC GEO-
v2018.1 algorithm.
Author contributions 515
SK performed the airborne and satellite data analysis and wrote the draft. EM and BC provided airborne water isotopes data. SB
and BL performed trajectory calculation and geostationary satellite data analysis. AL, IF and VY provided airborne water vapour
https://doi.org/10.5194/acp-2021-653Preprint. Discussion started: 31 August 2021c© Author(s) 2021. CC BY 4.0 License.
15
data. MK, AA, CR and NS provided airborne total water and ice particles size data. FC provided airborne particle backscatter in
situ data. VM and RM provided airborne lidar data. VV provided airborne temperature data. EM, CS, BC, MK, CR, BL and FS
provided useful comments and participated in the redaction of the paper. 520
Data availability
The airborne data will be available from the HALO database at https://halo-db.pa.op.dlr.de/mission/101 (last access:
30 July 2021) (German Aerospace Center, 2021), in the meantime they may be provided by respective PI upon request.
TRACZILLA data are available upon request. MLS data are publicly available at http://disc.sci.gsfc.nasa.gov/Aura/data-525
holdings/MLS; GNSS-RO data at https://www.romsaf.org/product_archive.php; CALIOP data
at https://doi.org/10.5067/CALIOP/CALIPSO/CAL_LID_L1-VALSTAGE1-V3-40; CATS data at
https://cats.gsfc.nasa.gov/data/
Competing interests
The authors declare that they have no conflict of interest. 530
References
Afchine, A., Rolf, C., Costa, A., Spelten, N., Riese, M., Buchholz, B., Ebert, V., Heller, R., Kaufmann, S., Minikin, A., Voigt,
C., Zöger, M., Smith, J., Lawson, P., Lykov, A., Khaykin, S., and Krämer, M.: Ice particle sampling from aircraft – influence of
the probing position on the ice water content, Atmos. Meas. Tech., 11, 4015–4031, https://doi.org/10.5194/amt-11-4015-2018, 535
2018.
Anthes, R. A., et al. (2008), The COSMIC/FORMOSAT‐3 mission: Early results, Bull. Am. Meteorol. Soc., 89, 313–333,
doi:10.1175/BAMS-89-3-313.
Bannister, R. N., A. O’Neill, A. R. Gregory, and K. M. Nissen (2004), The role of the South-East Asian monsoon and other
seasonal features in creating the “tape recorder” signal in the unified model, Q. J. R. Meteorol. Soc., 130, 1531–1554, 540
doi:10.1256/qj.03.106.
Bannister, R. N., O’Neill, A., Gregory, A. R., and Nissen, K. M.: The role of the south-east Asian monsoon and other seasonal
features in creating the “tape-recorder” signal in the Unified Model, Q. J. Roy. Meteor. Soc., 130, 1531–1554, 2004.
Bergman, J.W., Jensen, E. J., Pfister, L., and Yang, Q.: Seasonal differences of vertical-transport efficiency in the tropical
tropopause layer: On the interplay between tropical deep convection, largescale vertical ascent, and horizontal circulations, J. 545
Geophys. Res., 117, D05302, https://doi.org/10.1029/2011JD016992, 2012.
Beyerle, G., T. Schmidt, G. Michalak, S. Heise, J. Wickert, and C. Reigber (2005), GPS radio occultation with GRACE:
Atmospheric profiling utilizing the zero difference technique, Geophys. Res. Lett., 32, L13806, doi:10.1029/2005GL023109.
Bian, J., Pan, L. L., Paulik, L., Vömel, H., Chen, H., and Lu, D.: In situ water vapor measurements in Lhasa and Kunming
during the Asian summer monsoon, Geophys. Res. Lett., 39, L19808, https://doi.org/10.1029/2012GL052996, 2012. 550
Brunamonti, S., Jorge, T., Oelsner, P., Hanumanthu, S., Singh, B. B., Kumar, K. R., Sonbawne, S., Meier, S., Singh, D.,
Wienhold, F. G., Luo, B. P., Boettcher, M., Poltera, Y., Jauhiainen, H., Kayastha, R., Karmacharya, J., Dirksen, R., Naja, M., Rex,
M., Fadnavis, S., and Peter, T.: Balloon-borne measurements of temperature, water vapor, ozone and aerosol backscatter on the
southern slopes of the Himalayas during StratoClim 2016–2017, Atmos. Chem. Phys., 18, 15937–15957,
https://doi.org/10.5194/acp-18-15937-2018, 2018. 555
https://doi.org/10.5194/acp-2021-653Preprint. Discussion started: 31 August 2021c© Author(s) 2021. CC BY 4.0 License.

16
Bucci, S., Legras, B., Sellitto, P., D'Amato, F., Viciani, S., Montori, A., Chiarugi, A., Ravegnani, F., Ulanovsky, A., Cairo, F.,
and Stroh, F.: Deep-convective influence on the upper troposphere–lower stratosphere composition in the Asian monsoon
anticyclone region: 2017 StratoClim campaign results, Atmos. Chem. Phys., 20, 12193–12210, https://doi.org/10.5194/acp-20-
12193-2020, 2020.
Buontempo, C., Cairo, F., Di Donfrancesco, G., Morbidini, R., Viterbini, M., and Adriani, A.: Optical measurements of 560
atmospheric particles from airborne platforms: in situ and remote sensing instruments for balloons and aircrafts, Ann. Geophys.,
49, 57–64, 2006, http://www.ann-geophys.net/49/57/2006/
Corti, T., Luo, B. P., de Reus, M., Brunner, D., Cairo, F., Mahoney, M. J., Martucci, G., Matthey, R., Mitev, V., dos Santos, F.
H., Schiller, C., Shur, G., Sitnikov, N. M., Spelten, N., Vossing, H. J., Borrmann, S., and Peter, T.: Unprecedented evidence for
deep convection hydrating the tropical stratosphere, Geophys. Res. Lett., 35, L10810, doi:10.1029/2008GL033641, 2008. 565
Dessler, A. E., Schoeberl, M. R.,Wang, T., Davis, S. M. & Rosenlof, K. H. Stratospheric water vapor feedback. Proc. Natl
Acad. Sci. USA 110, 18087_18091 (2013).
Dethof, A., O’Neill, A., Slingo, J. M., and Smit, H. G. J.: A mechanism for moistening the lower stratosphere involving the
Asian summer monsoon, Q. J. Roy. Meteorol. Soc., 125, 1079–1106, 1999.
Devasthale, A. and Fueglistaler, S.: A climatological perspective of deep convection penetrating the TTL during the Indian 570
summer monsoon from the AVHRR and MODIS instruments, Atmos. Chem. Phys., 10, 4573–4582, doi:10.5194/acp-10-4573-
2010, 2010.
Dvortsov, V. L. & Solomon, S. Response of the stratospheric temperatures and ozone to past and future increases in
stratospheric humidity. J. Geophys. Res. 106, 7505_7514 (2001).
Fu, R., Hu, Y., Wright, J. S., Jiang, J. E., Dickinson, R. E., Chen, M., Filipiak, M., Read,W. G.,Waters, J.W., andWu, D. L.: 575
Short circuit of water vapor and polluted air to the global stratosphere by convective transport over the Tibetan plateau, P. Natl.
Acad. Sci. USA, 103, 5664, https://doi.org/10.1073_pnas.0601584103, 2006.
Fueglistaler, S., and P. H. Haynes (2005), Control of interannual and longer-term variability of stratospheric water vapor, J.
Geophys. Res., 110, D24108, doi:10.1029/2005JD006019.
Fueglistaler, S., Dessler, A. E., Dunkerton, T. J., Folkins, I., Fu, Q., and Mote, P. W.: Tropical tropopause layer, Rev. Geophys., 580
47, RG1004, https://doi.org/10.1029/2008RG000267, 2009.
Garny, H. and Randel, W.: Dynamic variability of the Asian monsoon anticyclone observed in potential vorticity and
correlations with tracer distributions, J. Geophys. Res.-Atmos., 118, 13421– 13433, https://doi.org/10.1002/2013JD020908, 2013.
Gettelman, A. and de F. Forster, P. M.: A climatology of the Tropical Tropopause Layer, J. Meteorol. Soc. Jpn., 80, 911–924,
2002. 585
Gottschaldt, K.-D., Schlager, H., Baumann, R., Sinh Cai, D., Eyring, V., Graf, P., Grewe, V., Jöckel, P., Jurkat-Witschas, T.,
Voigt, C., Zahn, A., and Ziereis, H.: Dynamics and composition of the Asian summer monsoon anticyclone, Atmos. Chem. Phys.,
18, 5655–5675, https://doi.org/10.5194/acp-18-5655-2018, 2018.
Hanisco, T. F., Moyer, E. J., Weinstock, E. M., St. Clair, J. M., Sayres, D. S., Smith, J. B., Lockwood, R., Anderson, J. G.,
Dessler, A. E., Keutsch, F. N., Spackman, J. R., Read, W. G. and Bui, T. P.: Observations of deep convective influence on 590
stratospheric water vapor and its isotopic composition, Geophys. Res. Lett., 34, L04814, doi:10.1029/2006GL027899, 2007.
Hoskins, B. J. and Rodwell, M. J.: A Model of the Asian Summer Monsoon. Part I: The Global Scale, J. Atmos. Sci., 52, 1329–
1340, 1995.
James, R., M. Bonazzola, B. Legras, K. Surbled, and S. Fueglistaler (2008), Water vapor transport and dehydration above
convective outflow during Asian monsoon, Geophys. Res. Lett., 35, L20810, doi:10.1029/2008GL035441. 595
https://doi.org/10.5194/acp-2021-653Preprint. Discussion started: 31 August 2021c© Author(s) 2021. CC BY 4.0 License.
17
Jensen, E. J., Pan, L. L., Honomichl, S., Diskin, G. S., Krämer, M., & Spelten, N., et al. (2020). Assessment of observational
evidence for direct convective hydration of the lower stratosphere. Journal of Geophysical Research: Atmospheres, 125,
e2020JD032793. https://doi.org/10.1029/2020JD032793
Khaykin, S., Pommereau, J.-P., Korshunov, L., Yushkov, V., Nielsen, J., Larsen, N., Christensen, T., Garnier, A., Lukyanov,
A., and Williams, E.: Hydration of the lower stratosphere by ice crystal geysers over land convective systems, Atmos. Chem. Phys., 600
9, 2275–2287, https://doi.org/10.5194/acp-9-2275-2009, 2009.
Khaykin, S. M., Engel, I., Vömel, H., Formanyuk, I. M., Kivi, R., Korshunov, L. I., Krämer, M., Lykov, A. D., Meier, S.,
Naebert, T., Pitts, M. C., Santee, M. L., Spelten, N., Wienhold, F. G., Yushkov, V. A., and Peter, T.: Arctic stratospheric
dehydration – Part 1: Unprecedented observation of vertical redistribution of water, Atmos. Chem. Phys., 13, 11503–11517,
https://doi.org/10.5194/acp-13-11503-2013, 2013. 605
Khaykin, S. M., Pommereau, J.-P., Riviere, E. D., Held, G., Ploeger, F., Ghysels, M., Amarouche, N., Vernier, J.-P., Wienhold,
F. G., and Ionov, D.: Evidence of horizontal and vertical transport of water in the Southern Hemisphere tropical tropopause layer
(TTL) from high-resolution balloon observations, Atmos. Chem. Phys., 16, 12273–12286, https://doi.org/10.5194/acp-16-12273-
2016, 2016.
Kley, D., Schmeltekopf, A. L., Kelly, K., Winkler, R. H., Thomson, T. L., and MacFarland, M.: Transport of water through the 610
tropical tropopause, Geophys. Res. Lett., 9, 617–620, 1982.
Krämer, M., Rolf, C., Spelten, N., Afchine, A., Fahey, D., Jensen, E., Khaykin, S., Kuhn, T., Lawson, P., Lykov, A., Pan, L.
L., Riese, M., Rollins, A., Stroh, F., Thornberry, T., Wolf, V., Woods, S., Spichtinger, P., Quaas, J., and Sourdeval, O.: A
microphysics guide to cirrus – Part 2: Climatologies of clouds and humidity from observations, Atmos. Chem. Phys., 20, 12 569–
12 608, https://doi.org/10.5194/acp-20-12569-2020, 2020 615
Lee, K.-O., Dauhut, T., Chaboureau, J.-P., Khaykin, S., Krämer, M., and Rolf, C.: Convective hydration in the tropical
tropopause layer during the StratoClim aircraft campaign: pathway of an observed hydration patch, Atmos. Chem. Phys., 19,
11803–11820, https://doi.org/10.5194/acp-19-11803-2019, 2019.
Legras, B. and Bucci, S.: Confinement of air in the Asian monsoon anticyclone and pathways of convective air to the
stratosphere during the summer season, Atmos. Chem. Phys., 20, 11045–11064, https://doi.org/10.5194/acp-20-11045-2020, 2020. 620
Lelieveld, J., Brühl, C., Jöckel, P., Steil, B., Crutzen, P. J., Fischer, H., Giorgetta, M. A., Hoor, P., Lawrence, M. G., Sausen,
R., and Tost, H.: Stratospheric dryness: model simulations and satellite observations, Atmos. Chem. Phys., 7, 1313–1332,
https://doi.org/10.5194/acp-7-1313-2007, 2007.
Livesey, N. J., et al. (2017), Version 4.2x Level 2 data quality and description document, Tech. Rep. JPL D-33509 Rev. C, Jet
Propulsion Lab. 625
Luntama, J.-P., G. Kirchengast, M. Borsche, U. Foelsche, A. Steiner, S. Healy, A. von Engeln, E. O’Clerigh, and C. Marquardt,
Prospects of the EPS GRAS mission for operational atmospheric applications, Bull. Amer. Meteor. Soc., 89(12), 1863–1875, 2008.
Manney, G. L., M. I. Hegglin, W. H. Daffer, M. J. Schwartz, M. L. Santee, and S. Pawson (2014), Climatology of upper
tropospheric–lower stratospheric (UTLS) jets and tropopauses in MERRA, J. Clim., 27, 3248–3271.
Meyer, J.: Ice Crystal Measurements with the New Particle Spectrometer NIXE-CAPS, Schriften des Forschungszentrums 630
Jülich. Reihe Energie und Umwelt/Energy and Environment, 160, ISBN:9783893368402, 2012
Meyer, J., Rolf, C., Schiller, C., Rohs, S., Spelten, N., Afchine, A., Zöger, M., Sitnikov, N., Thornberry, T. D., Rollins, A. W.,
Bozóki, Z., Tátrai, D., Ebert, V., Kühnreich, B., Mackrodt, P., Möhler, O., Saathoff, H., Rosenlof, K. H., and Krämer, M.: Two
decades of water vapor measurements with the FISH fluorescence hygrometer: a review, Atmos. Chem. Phys., 15, 8521–8538,
https://doi.org/10.5194/acp-15-8521-2015, 2015 635
https://doi.org/10.5194/acp-2021-653Preprint. Discussion started: 31 August 2021c© Author(s) 2021. CC BY 4.0 License.
18
Mitev, V., R. Matthey, and V. Makarov (2002), Miniature backscatter lidar for cloud and aerosol observation from high altitude
aircraft, Recent Res. Dev. Geophys., 4, 207–223.
Murphy, D.M. and Koop, T. (2005), Review of the vapour pressures of ice and supercooled water for atmospheric applications.
Q.J.R. Meteorol. Soc., 131: 1539-1565. https://doi.org/10.1256/qj.04.94
Nützel, M., Podglajen, A., Garny, H., and Ploeger, F.: Quantification of water vapour transport from the Asian monsoon to the 640
stratosphere, Atmos. Chem. Phys., 19, 8947–8966, https://doi.org/10.5194/acp-19-8947-2019, 2019.
Pan, L. L., Honomichl, S. B., Kinnison, D. E., Abalos, M., Randel, W. J., Bergman, J. W., and Bian, J.: Transport of chemical
tracers from the boundary layer to stratosphere associated with the dynamics of the Asian summer monsoon, J. Geophys. Res.-
Atmos., 121, 14159–14174, https://doi.org/10.1002/2016JD025616, 2016.
Pan, L. L., Paulik, L. C., Honomichl, S. B., Munchak, L. A., Bian, J., Selkirk, H. B., and Vömel, H.: Identification of the 645
tropical tropopause transition layer using the ozone – water vapor relationship, J. Geophys. Res.-Atmos., 119, 3586–3599,
https://doi.org/10.1002/2013JD020558, 2014.
Park, M., Randel, W. J., Gettelman, A., Massie, S. T., and Jiang, J. H.: Transport above the Asian summer monsoon anticyclone
inferred from Aura Microwave Limb Sounder tracers, J. Geophys. Res., 112, D16309, https://doi.org/10.1029/2006JD008294,
2007. 650
Pisso, I. and Legras, B.: Turbulent vertical diffusivity in the sub-tropical stratosphere, Atmos. Chem. Phys., 8, 697–707,
https://doi.org/10.5194/acp-8-697-2008, 2008.
Ploeger, F., Gottschling, C., Griessbach, S., Gross, J.-U., Guenther G., Konopka, P., Müller, R., Riese, M., Stroh, F., Tao, M.,
Ungermann, J., Vogel, B., and von Hobe, M.: A potential vorticitybased determination of the transport barrier in the Asian summer
monsoon anticyclone, Atmos. Chem. Phys., 15, 13145–13159, https://doi.org/10.5194/acp-15-13145-2015, 2015. 655
Randel, W. J. and Jensen, E. J.: Physical processes in the tropical tropopause layer and their roles in a changing climate, Nat.
Geosci., 6, 169–176, https://doi.org/10.1038/NGEO1733, 2013.
Randel, W. J., Moyer, E., Park, M., Jensen, E. J., Bernath, P., Walker, K. A., & Boone, C. (2012). Global variations of HDO
and HDO/H2O ratios in the upper troposphere and lower stratosphere derived from ACE‐FTS satellite measurements. Journal of
Geophysical Research, 117, D06303. https://doi.org/10.1029/2011JD016632 660
Randel, W. J., Park, M., Emmons, L., Kinnison, D., Bernath, P., Walker, K. A., Boone, C., and Pumphrey, H.: Asian Monsoon
Transport of Pollution to the Stratosphere, Science, 328, 611– 613, https://doi.org/10.1126/science.1182274, 2010.
Randel, W. J., Zhang, K., and Fu, R.: What controls stratospheric water vapor in the NH summer monsoon regions?, J. Geophys.
Res.-Atmos., 120, 7988–8001, https://doi.org/10.1002/2015JD023622, 2015.
Rolf, C., Vogel, B., Hoor, P., Afchine, A., Günther, G., Krämer, M., Müller, R., Müller, S., Spelten, N., and Riese, M.: 665
Watervapor increase in the lower stratosphere of the Northern Hemisphere due to the Asian monsoon anticyclone observed during
the TACTS/ESMVal campaigns, Atmos. Chem. Phys., 18, 2973– 2983, https://doi.org/10.5194/acp-18-2973-2018, 2018.
Santee, M. L., Manney, G. L., Livesey, N. J., Schwartz, M. J., Neu, J. L., and Read, W. G.: A comprehensive overview of the
climatological composition of the Asian summer monsoon anticyclone based on 10 years of Aura Microwave Limb Sounder
measurements, J. Geophys. Res.-Atmos., 122, 5491– 5514, https://doi.org/10.1002/2016JD026408, 2017. 670
Sargent, M. R., J. B. Smith, D. S. Sayres, and J. G. Anderson (2014), The roles of deep convection and extratropical mixing in
the tropical tropopause layer: An in situ measurement perspective, J. Geophys. Res. Atmos., 119, 12,355–12,371,
doi:10.1002/2014JD022157.
Sarkozy, L. C., Clouser, B. W., Lamb, K. D., Stutz, E. J., Saathoff, H., Ebert, V., Wagner, S., Kühnreich, B., and Moyer, E. J.:
The Chicago Water Isotope Spectrometer (ChiWIS-lab): a tunable diode laser spectrometer for chamber-based measurements of 675
https://doi.org/10.5194/acp-2021-653Preprint. Discussion started: 31 August 2021c© Author(s) 2021. CC BY 4.0 License.

19
water vapor isotopic evolution during cirrus formation, Review of Scientific Instruments, 91, 4, 45-120,
https://doi.org/10.1063/1.5139244, 2020
Schiller, C., Grooß, J.-U., Konopka, P., Plöger, F., Silva dos Santos, F. H., and Spelten, N.: Hydration and dehydration at the
tropical tropopause, Atmos. Chem. Phys., 9, 9647–9660, doi:10.5194/acp-9-9647-2009, 2009.
Schwartz, M. J., Read, W. G., Santee, M. L., Livesey, N. J., Froidevaux, L., Lambert, A., Manney, G. L. (2013). Convectively 680
injected water vapor in the North American summer lowermost stratosphere. Geophysical Research Letters, 40, 2316–2321.
https://doi.org/10.1002/ grl.50421
Sèze, G., Pelon, J., Derrien, M., Le Gléau, H., Six, B.: Evaluation against CALIPSO lidar observations of the multi-
geostationary cloud cover and type dataset assembled in the framework of the Megha-Tropiques mission: Evaluation of a Multi-
Geostationary Cloud Cover Set using CALIOP Data, Quart. J. Roy. Meteor. Soc., 141, 774-795, doi: 10.1002/qj.2392, 2015. 685
Sitnikov, N. M., Yushkov, V. A., Afchine, A. A., Korshunov, L. I., Astakhov, V. I., Ulanovskii, A. E., Kramer, M., Mangold,
A., Schiller, C., and Ravegnani, F.: The FLASH instrument for water vapour measurements on board the high-altitude airplane,
Instrum. Exp. Tech., 50, 113–121, doi:10.1134/S0020441207010174, 2007.
Smith, J. B., Wilmouth, D. M., Bedka, K. M., Bowman, K. P., Homeyer, C. R., Dykema, J. A., Sargent, M. R., Clapp, C. E.,
Leroy, S. S., Sayres, D. S., Dean-Day, J. M., Bui, T. P., and Anderson, J. G.: A case study of convectively sourced water vapor 690
observed in the overworld stratosphere over the United States, J. Geophys. Res., 122, 9529–9554,
https://doi.org/10.1002/2017JD026831, 2017.
Steiner, A. K., G. Kirchengast, and H. P. Ladreiter (1999), Inversion, error analysis, and validation of GPS/MET occultation
data, Ann. Geophys., 17, 122– 138, doi:10.1007/s00585-999-0122-5.
Stohl, A., Forster, C., Frank, A., Seibert, P., and Wotawa, G.: Technical note: The Lagrangian particle dispersion model 695
FLEXPART version 6.2, Atmos. Chem. Phys., 5, 2461–2474, https://doi.org/10.5194/acp-5-2461-2005, 2005.
Shur, G. H., Sitnikov, N. M., and Drynkov, A. V.: A mesoscale structure of meteorological fields in the tropopause layer and
in the lower stratosphere over the Southern tropics (Brazil), Russ. Meteorol. Hydrol., 32, 487–494,
doi:10.3103/S106837390708002X, 2007.
Tissier, A.-S. and Legras, B.: Convective sources of trajectories traversing the tropical tropopause layer, Atmos. Chem. Phys., 700
16, 3383–3398, https://doi.org/10.5194/acp-16-3383-2016, 2016.
Tissier, A.-S. and Legras, B.: Convective sources of trajectories traversing the tropical tropopause layer, Atmos. Chem. Phys.,
16, 3383–3398, https://doi.org/10.5194/acp-16-3383-2016, 2016.
Ueyama, R., Jensen, E. J., and Pfister, L.: Convective Influence on the Humidity and Clouds in the Tropical Tropopause Layer
During Boreal Summer, J. Geophys. Res.-Atmos., 123, 7576–7593, https://doi.org/10.1029/2018JD028674, 2018. 705
Vernier, J.-P., Fairlie, T. D., Deshler, T., Venkat Ratnam, M., Gadhavi, H., Kumar, B. S., Natarajan, M., Pandit, A. K., Akhil
Raj, S. T., Hemanth Kumar, A., Jayaraman, A., Singh, A. K., Rastogi, N., Sinha, P. R., Kumar, S., Tiwari, S., Wegner, T., Baker,
N., Vignelles, D., Stenchikov, G., Shevchenko, I., Smith, J., Bedka, K., Kesarkar, A., Singh, V., Bhate, J., Ravikiran, V., Durga
Rao, M., Ravindrababu, S., Patel, A., Vernier, H., Wienhold, F. G., Liu, H., Knepp, T. N., Thomason, L., Crawford, J., Ziemba,
L.,Moore, J., Crumeyrolle, S., Williamson, M., Berthet, G., Jégou, F., and Renard, J.-B.: BATAL The Balloon Measurement 710
Campaigns of the Asian Tropopause Aerosol Layer, B. Am. Meteor. Soc., May 2018, 955–973, https://doi.org/10.1175/BAMS-D-
17-0014.1, 2018.
Vogel, B., Günther, G., Müller, R., Grooß, J.-U., Afchine, A., Bozem, H., Hoor, P., Krämer, M., Müller, S., Riese, M., Rolf,
C., Spelten, N., Stiller, G. P., Ungermann, J., and Zahn, A.: Long-range transport pathways of tropospheric source gases originating
https://doi.org/10.5194/acp-2021-653Preprint. Discussion started: 31 August 2021c© Author(s) 2021. CC BY 4.0 License.

20
in Asia into the northern lower stratosphere during the Asian monsoon season 2012, Atmos. Chem. Phys., 16, 15301–15325, 715
https://doi.org/10.5194/acp-16-15301-2016, 2016.
Vömel, H., S. J. Oltmans, D. J. Hofmann, T. Deshler, and J. M. Rosen.: The evolution of the dehydration in the Antarctic
stratospheric vortex, J. Geophys. Res., 100, 13,919– 13,926, 1995.
von Hobe, M., Bekki, S., Borrmann, S., Cairo, F., D’Amato, F., Di Donfrancesco, G., Dörnbrack, A., Ebersoldt, A., Ebert, M.,
Emde, C., Engel, I., Ern, M., Frey, W., Genco, S., Griessbach, S., Grooß, J.-U., Gulde, T., Günther, G., Hösen, E., Hoffmann, L., 720
Homonnai, V., Hoyle, C. R., Isaksen, I. S. A., Jackson, D. R., Jánosi, I. M., Jones, R. L., Kandler, K., Kalicinsky, C., Keil, A.,
Khaykin, S. M., Khosrawi, F., Kivi, R., Kuttippurath, J., Laube, J. C., Lefèvre, F., Lehmann, R., Ludmann, S., Luo, B. P.,
Marchand, M., Meyer, J., Mitev, V., Molleker, S., Müller, R., Oelhaf, H., Olschewski, F., Orsolini, Y., Peter, T., Pfeilsticker, K.,
Piesch, C., Pitts, M. C., Poole, L. R., Pope, F. D., Ravegnani, F., Rex, M., Riese, M., Röckmann, T., Rognerud, B., Roiger, A.,
Rolf, C., Santee, M. L., Scheibe, M., Schiller, C., Schlager, H., Siciliani de Cumis, M., Sitnikov, N., Søvde, O. A., Spang, R., 725
Spelten, N., Stordal, F., Sumin’ska-Ebersoldt, O., Ulanovski, A., Ungermann, J., Viciani, S., Volk, C. M., vom Scheidt, M., von
der Gathen, P., Walker, K., Wegner, T., Weigel, R., Weinbruch, S., Wetzel, G., Wienhold, F. G., Wohltmann, I., Woiwode, W.,
Young, I. A. K., Yushkov, V., Zobrist, B., and Stroh, F.: Reconciliation of essential process parameters for an enhanced
predictability of Arctic stratospheric ozone loss and its climate interactions (RECONCILE): activities and results, Atmos. Chem.
Phys., 13, 9233– 9268, doi:10.5194/acp-13-9233-2013, 2013. 730
Weinstock, E. M., Pittman, J. V., Sayres, D. S., Smith, J. B., Anderson, J. G., Wofsy, S. C., Xueref, I., Gerbig, C., Daube, B.
C., Pfister, L., Richard, E. C., Ridley, B. A., Weinheimer, A. J., Jost, H.-J., Lopez, J. P., Loewenstein, M., and Thompson, T. L.:
Quantifying the impact of the North American monsoon and deep midlatitude convection on the subtropical lowermost stratosphere
using in situ measurements, J. Geophys. Res., 112, D18310, https://doi.org/10.1029/2007JD008554, 2007.
Werner, F., Schwartz, M. J., Livesey, N. J., Read, W. G., & Santee, M. L. (2020). Extreme outliers in lower stratospheric water 735
vapor over North America observed by MLS: Relation to overshooting convection diagnosed from collocated Aqua-MODIS data.
Geophysical Research Letters, 47 , e2020GL090131. https://doi.org/10.1029/2020GL090131
Winker, D. M., Vaughan, M. A., Omar, A. H., Hu, Y., Powell, K. A., Liu, Z., Hunt, W. H., and Young, S. A.: Overview of the
CALIPSO Mission and CALIOP Data Processing Algorithms, J. Atmos. Oceanic Technol., 26, 2310–2323,
doi:10.1175/2009JTECHA1281.1, 2009. 740
Wright, J. S., Fu, R., Fueglistaler, S., Liu, Y. S., and Zhang, Y.: The influence of summertime convection over Southeast Asia
on water vapor in the tropical stratosphere, J. Geophys. Res., 116, D12302, https://doi.org/10.1029/2010JD015416, 2011.
Yorks, J. E., M. J. McGill, S. P. Palm, D. L. Hlavka, P. A. Selmer, E. P. Nowottnick, M. A. Vaughan, S. D. Rodier, and W. D.
Hart (2016), An overview of the CATS level 1 processing algorithms and data products, Geophys. Res. Lett., 43,4632–46 39,
doi:10.1002/20 16GL0 68006. 745
Yushkov, V., Merkulov, S., and Astakhov, V.: Optical balloon hygrometer for upper stratosphere and stratosphere water vapour
measurements, in Optical remote sensing of the atmosphere and clouds edited by: J. Wang, B. Wu, T.Ogawa, and Z.-H. Guans,
Proc. SPIE, 3501, 439–445, 1998.
Zhang, K., Fu, R., Wang, T., and Liu, Y.: Impact of geographic variations of the convective and dehydration center on
stratospheric water vapor over the Asian monsoon region, Atmos. Chem. Phys., 16, 7825–7835, https://doi.org/10.5194/acp-16-750
7825-2016, 2016.
Zöger, M., Afchine, A., Eicke, N., Gerhards, M.-T., Klein, E., McKenna, D. S., Mörschel, U., Schmidt, U., Tan, V., Tuitjer,
F., Woyke, T., and Schiller, C.: Fast in situ stratospheric hygrometers: A new family of balloonborne and airborne Lyman α
photofragment fluorescence hygrometers, J. Geophys. Res., 104, 1807–1816, 1999.
https://doi.org/10.5194/acp-2021-653Preprint. Discussion started: 31 August 2021c© Author(s) 2021. CC BY 4.0 License.

21
755
760
765
770
Figure 1. Overview and evolution of AMA UTLS conditions during July-August 2017 from satellite observations. (a) Color map shows GPS-RO minimum saturation mixing ratio (ppmv) encountered within 360 – 420 K layer during 20 July – 10 August period. Dashed contours indicate NCEP OLR (W/m2) in the range 190 – 210 W/m2 (contour interval 10 W/m2). White arrows are wind velocity vectors (ERA5, 70 – 100 hPa average for the campaign period). Black pixels mark the most probable sources of the hydrated features (see. Sect. 775 4.2). White rectangle indicates the flight domain. (b) Horizontal distribution of MLS water vapour in the confined LS (390-420 K layer) averaged over 20 July – 10 August period with the date-colored flight tracks superimposed (see Fig. 2 for color definition). Black contour depicts Montgomery stream function of 367,100 m-2s-2, which is used to define the horizontal boundaries of AMA at 390 K level (Santee et al., 2016). (c) Evolution of GPS-RO minimum saturation mixing ratio profile within the flight domain (78 °E – 92 °E, 20 °N – 30 °N). Dark orange curve plotted versus right-hand axis depicts the domain-mean OLR. (d) Evolution of MLS water vapour profile within the 780 flight domain. The solid black curve depicts the maximum level of cloud tops detected using CALIOP and CATS satellite lidars. The red curve indicates MLS carbon monoxide (68 – 100 hPa mean). The vertical dashed lines indicate the flight dates and their vertical extent, the dashed curve marks the average CPT potential temperature level (GPS-RO) in both (c) and (d).
785
790
a) b)
c) d)
https://doi.org/10.5194/acp-2021-653Preprint. Discussion started: 31 August 2021c© Author(s) 2021. CC BY 4.0 License.

22
795
800
805
Figure 2. (a) Water vapour mixing ratio profiles taken by FLASH hygrometer. The flight dates are shown in the legend. The dashed rectangle marks the CPT vertical range. The white solid and dashed lines depict the mean water vapour profile for the warm/wet and cold/dry periods respectively (see Fig. 1c, d). (b) Saturation mixing ratio profiles computed form TDC measurements of temperature and pressure. The horizontal dashed lines in both panels mark the vertical range of CPT level encountered during the campaign. Note the 810 strong variability of water vapour at the CPT level and accumulation of sharp enhancements in the lower stratosphere.
815
820
Figure 3. (a) and (b) Binned distribution of maximum RHi (computed from FLASH and TDC measurements) as a function of FLASH water vapour and potential temperature relative to the local CPT level for (a) clear sky conditions and (b) cloud occurrence detected by MAS (see Sect. 2.1.2). (c) Binned distribution of ice water content (IWC) exceeding 0.1 ppmv from NIXE-CAPS instrument inside clouds 825 detected by MAS as a function of relative humidity over ice (RHi) and potential temperature relative to the local CPT level. The presence of ice crystals in subsaturated air (RHi<100%) above the cold point tropopause potentially leads to permanent hydration of the CLS, whereas in supersaturated air the ice crystals are expected to sediment out of the CLS, thereby leading to its dehydration.
830
a) b) c)
a) b)
https://doi.org/10.5194/acp-2021-653Preprint. Discussion started: 31 August 2021c© Author(s) 2021. CC BY 4.0 License.
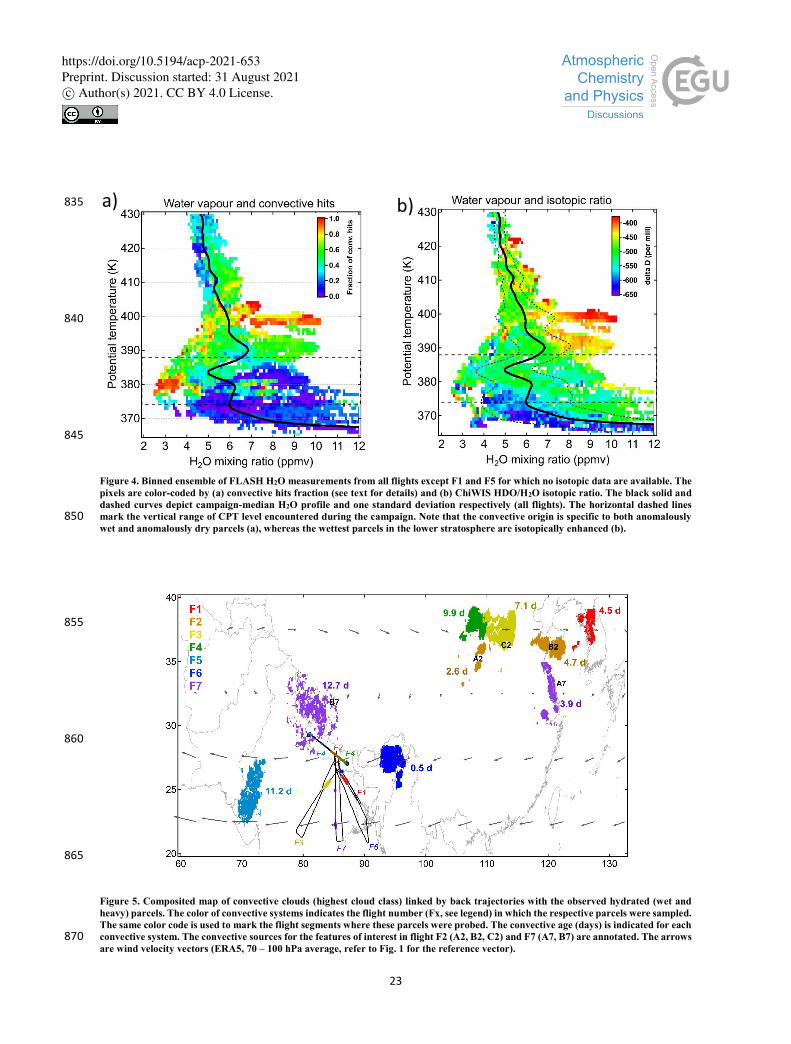
23
835
840
845
Figure 4. Binned ensemble of FLASH H2O measurements from all flights except F1 and F5 for which no isotopic data are available. The pixels are color-coded by (a) convective hits fraction (see text for details) and (b) ChiWIS HDO/H2O isotopic ratio. The black solid and dashed curves depict campaign-median H2O profile and one standard deviation respectively (all flights). The horizontal dashed lines mark the vertical range of CPT level encountered during the campaign. Note that the convective origin is specific to both anomalously 850 wet and anomalously dry parcels (a), whereas the wettest parcels in the lower stratosphere are isotopically enhanced (b).
855
860
865
Figure 5. Composited map of convective clouds (highest cloud class) linked by back trajectories with the observed hydrated (wet and heavy) parcels. The color of convective systems indicates the flight number (Fx, see legend) in which the respective parcels were sampled. The same color code is used to mark the flight segments where these parcels were probed. The convective age (days) is indicated for each convective system. The convective sources for the features of interest in flight F2 (A2, B2, C2) and F7 (A7, B7) are annotated. The arrows 870 are wind velocity vectors (ERA5, 70 – 100 hPa average, refer to Fig. 1 for the reference vector).
a) b)
https://doi.org/10.5194/acp-2021-653Preprint. Discussion started: 31 August 2021c© Author(s) 2021. CC BY 4.0 License.

24
875
880
885
890
895
Figure 6. Results of F2 measurements (29 July) with the features of interest marked A2, B2 and C2. (a) water vapour profile (FLASH) color-coded by convective hits density (see text for details). (b) same as (a) but color-coded by ChiWIS HDO/H2O isotopic ratio. The black solid and dashed curves depict campaign-median H2O profile and two standard deviation respectively. (c) Time series of flight altitude (black curve), water vapour (color-coded by convective hits density) and RHi (right-hand axis) computed from FLASH and TDC measurements. The color map shows scattering ratio measured by MAL (upward-looking). 900
905
a) b)
c)
https://doi.org/10.5194/acp-2021-653Preprint. Discussion started: 31 August 2021c© Author(s) 2021. CC BY 4.0 License.
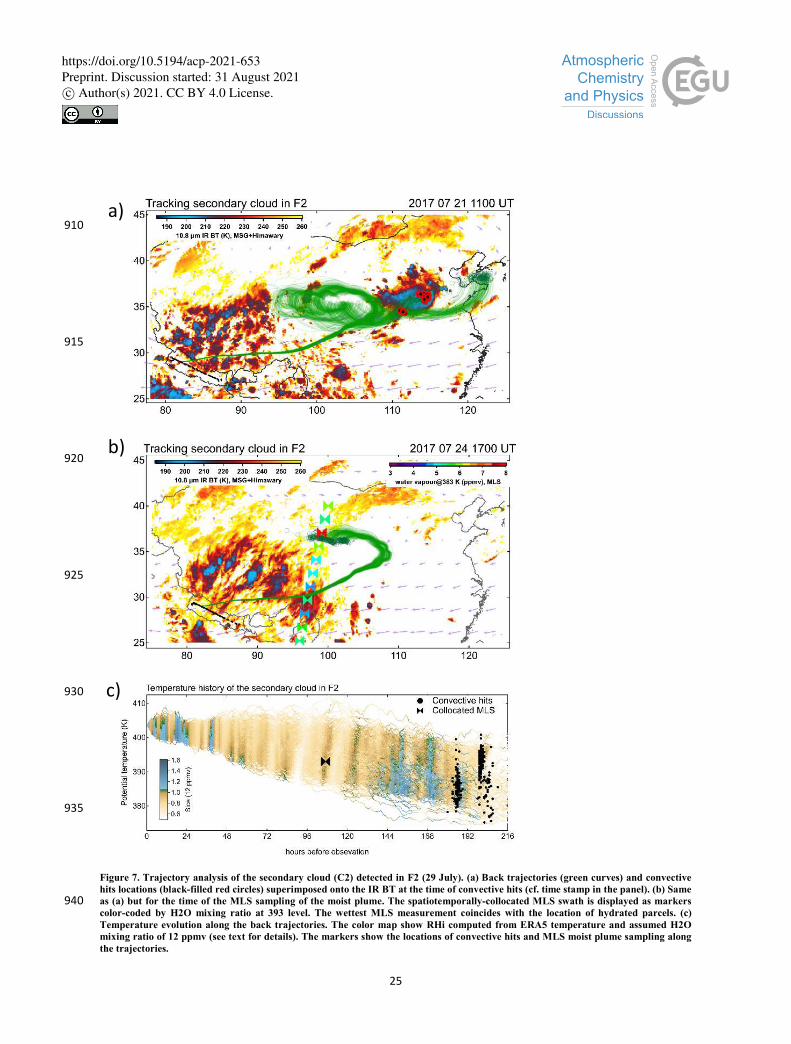
25
910
915
920
925
930
935
Figure 7. Trajectory analysis of the secondary cloud (C2) detected in F2 (29 July). (a) Back trajectories (green curves) and convective hits locations (black-filled red circles) superimposed onto the IR BT at the time of convective hits (cf. time stamp in the panel). (b) Same as (a) but for the time of the MLS sampling of the moist plume. The spatiotemporally-collocated MLS swath is displayed as markers 940 color-coded by H2O mixing ratio at 393 level. The wettest MLS measurement coincides with the location of hydrated parcels. (c) Temperature evolution along the back trajectories. The color map show RHi computed from ERA5 temperature and assumed H2O mixing ratio of 12 ppmv (see text for details). The markers show the locations of convective hits and MLS moist plume sampling along the trajectories.
a)
b)
c)
https://doi.org/10.5194/acp-2021-653Preprint. Discussion started: 31 August 2021c© Author(s) 2021. CC BY 4.0 License.
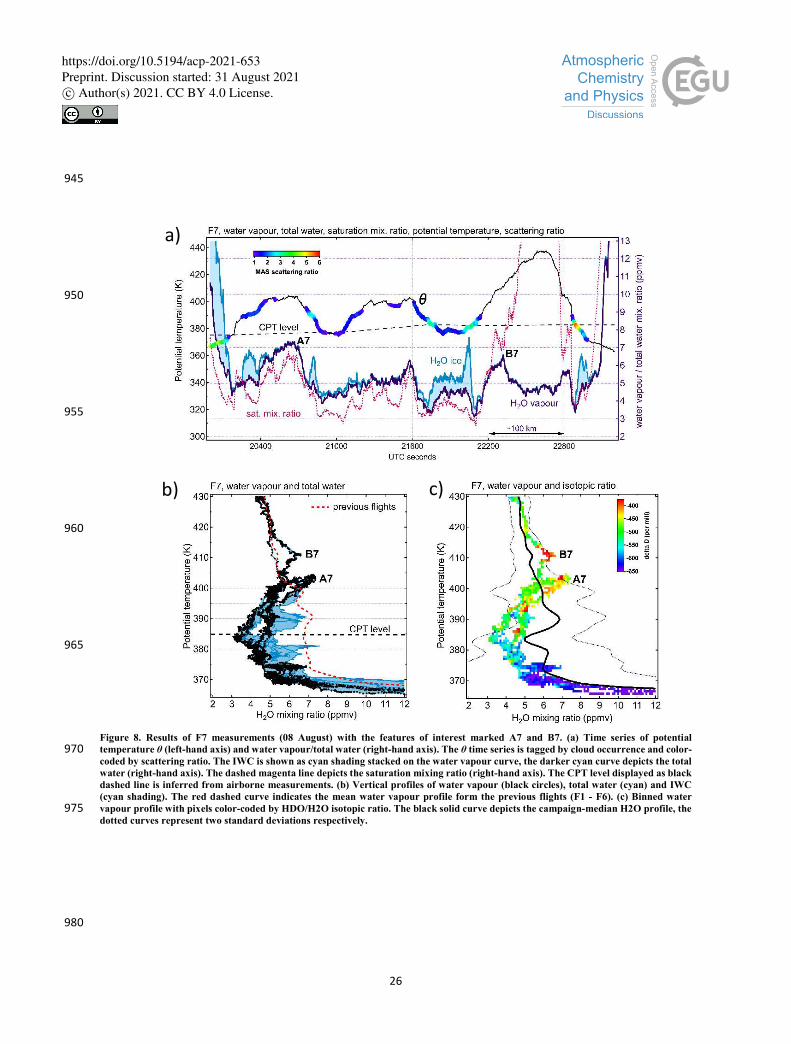
26
945
950
955
960
965
Figure 8. Results of F7 measurements (08 August) with the features of interest marked A7 and B7. (a) Time series of potential temperature θ (left-hand axis) and water vapour/total water (right-hand axis). The θ time series is tagged by cloud occurrence and color-970 coded by scattering ratio. The IWC is shown as cyan shading stacked on the water vapour curve, the darker cyan curve depicts the total water (right-hand axis). The dashed magenta line depicts the saturation mixing ratio (right-hand axis). The CPT level displayed as black dashed line is inferred from airborne measurements. (b) Vertical profiles of water vapour (black circles), total water (cyan) and IWC (cyan shading). The red dashed curve indicates the mean water vapour profile form the previous flights (F1 - F6). (c) Binned water vapour profile with pixels color-coded by HDO/H2O isotopic ratio. The black solid curve depicts the campaign-median H2O profile, the 975 dotted curves represent two standard deviations respectively.
980
a)
b) c)
https://doi.org/10.5194/acp-2021-653Preprint. Discussion started: 31 August 2021c© Author(s) 2021. CC BY 4.0 License.
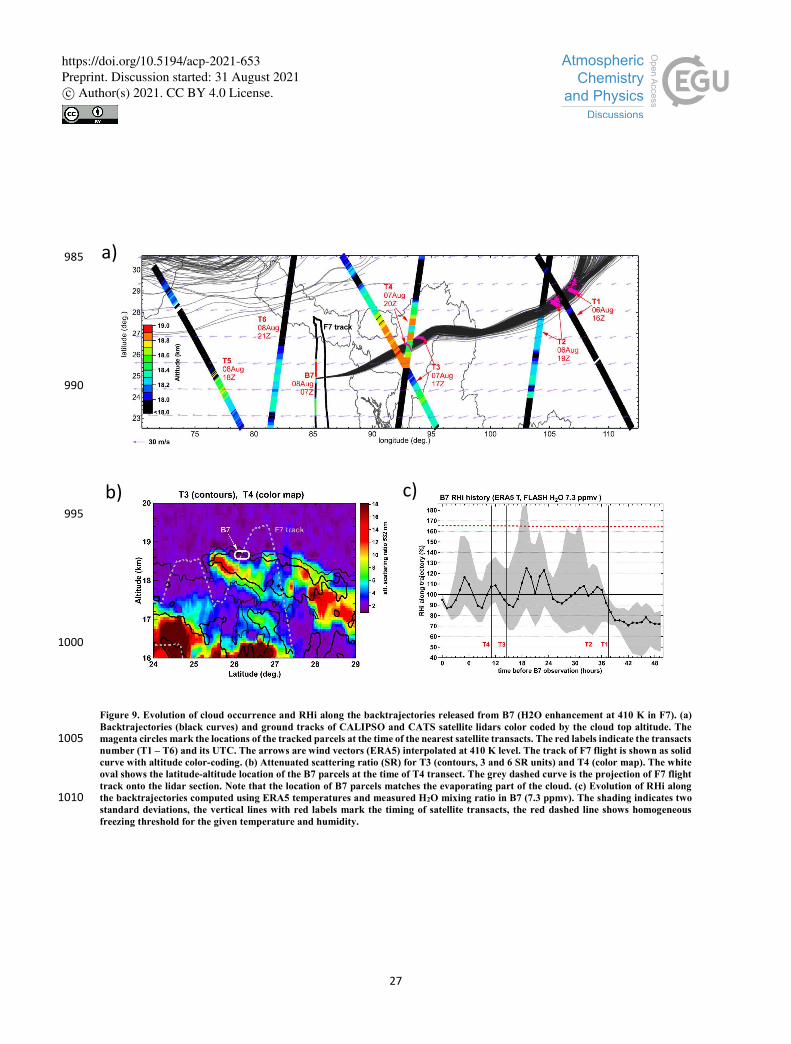
27
985
990
995
1000
Figure 9. Evolution of cloud occurrence and RHi along the backtrajectories released from B7 (H2O enhancement at 410 K in F7). (a) Backtrajectories (black curves) and ground tracks of CALIPSO and CATS satellite lidars color coded by the cloud top altitude. The magenta circles mark the locations of the tracked parcels at the time of the nearest satellite transacts. The red labels indicate the transacts 1005 number (T1 – T6) and its UTC. The arrows are wind vectors (ERA5) interpolated at 410 K level. The track of F7 flight is shown as solid curve with altitude color-coding. (b) Attenuated scattering ratio (SR) for T3 (contours, 3 and 6 SR units) and T4 (color map). The white oval shows the latitude-altitude location of the B7 parcels at the time of T4 transect. The grey dashed curve is the projection of F7 flight track onto the lidar section. Note that the location of B7 parcels matches the evaporating part of the cloud. (c) Evolution of RHi along the backtrajectories computed using ERA5 temperatures and measured H2O mixing ratio in B7 (7.3 ppmv). The shading indicates two 1010 standard deviations, the vertical lines with red labels mark the timing of satellite transacts, the red dashed line shows homogeneous freezing threshold for the given temperature and humidity.
a)
b) c)
https://doi.org/10.5194/acp-2021-653Preprint. Discussion started: 31 August 2021c© Author(s) 2021. CC BY 4.0 License.