Embed Size (px)
Citation preview
8/8/2019 Forms Capacity Planning
http://slidepdf.com/reader/full/forms-capacity-planning 1/22
Oracle Application ServerForms Services 10g (9.0.4)
Capacity Planning Guide
A n Oracle W hite Paper
N ovember 20 04

8/8/2019 Forms Capacity Planning
http://slidepdf.com/reader/full/forms-capacity-planning 2/22
Oracle Application Server Forms Services 10g (9.0.4) – Capacity Planning Guide Page 2
Oracle Application Server Forms Services 10g (9.0.4)
Capacity Planning Guide
What is in this guide?......................................................................... 3 Recommended Reading..................................................................... 3 Conventions....................................................................................... 3 Summary of Results ........................................................................... 4 1.1 Why is this important to me?................................................. 5 1.2 Who should read this document?...........................................5
2 Methodology.................................................................................. 6 2.1 Overview............................................................................... 6
2.1.1 Performance Degradation .................................................. 7 2.1.2 Number of users ................................................................ 7 2.1.3 Response time.................................................................... 7 2.1.4 Test Completion ................................................................ 7
2.2 Two types of tests.................................................................. 8 2.2.1 Memory-bound Test .......................................................... 8 2.2.2 CPU-bound Test................................................................ 9
2.3 Application Complexity......................................................... 9 2.3.1 Small Application .............................................................. 9 2.3.2 Medium Application .......................................................... 9 2.3.3 Large Application ............................................................ 10
2.4 Scenarios.............................................................................. 10 2.5 Software and Hardware ....................................................... 10 2.5.1 Client Simulation Software .............................................. 10 2.6 The Wrong Approach ........... Error! Bookmark not defined .
2.6.1 Memory Consumption ..................................................... 11 2.6.2 Define a Realistic Scenario .............................................. 12
3 Scalability Testing Results........................................................... 14 3.1 Disclaimer............................................................................ 14 3.2 Calculations ......................................................................... 15
3.2.1 Example........................................................................... 15 3.2.2 Drawing the correct conclusion ....................................... 16
3.3 Analysis ............................................................................... 16 3.3.1
Response Time ................................................................ 18
3.3.2 Comparing Forms 10g to Forms 6i................................... 18
3.4 Hardware Decisions............................................................. 18 3.4.1 Combining hardware........................................................ 18 3.4.2 Larger servers versus smaller servers ............................... 19
3.5 Conclusion........................................................................... 19

8/8/2019 Forms Capacity Planning
http://slidepdf.com/reader/full/forms-capacity-planning 3/22
Oracle Application Server Forms Services 10g (9.0.4) – Capacity Planning Guide Page 3
Oracle Application Server Forms Services 10g (9.0.4)
Capacity Planning Guide
INTRODUCTION
This whitepaper is designed to help IT managers, consultants, and system
administrators understand the scalability features of Oracle Application Server
Forms Services10g (9.0.4). For those people responsible for implementing and
maintaining Oracle Application Server Forms Services, it is important to know in
advance the environment and hardware commitments and requirements to deploy
to their systems. It is equally important that there is confidence that the system
can grow in a scalable manner to meet business growth and future demands.
What is in this guide?
This whitepaper summarizes the results of Oracle Corporation’s own scalability
testing of OracleAS Forms Services. Scalability is defined, followed by a
description of the testing methodology used by Oracle Corporation, as well as a
discussion on common mistakes that many people make when conducting their
own testing. Finally, the results are examined in depth.
Appendix 1 contains information on one of the applications used for testing by
Oracle Corporation.
Recommended Reading
There were two web architectures available in Oracle Forms Services 6i, so the
Forms 6 i Capacity Planning Guide1 contains some more in-depth discussion about
sizing and scalability. Much of the information in this document is a subset of the
Forms 6 i Capacity Planning Guide because in OracleAS Forms Services 10g (9.0.4)
there is only the one Forms Listener Servlet Architecture.
Conventions
For the sake of brevity, 10g (9.0.4) has been abbreviated to simply 10g in this
document.
1 http:/ / www.oracle.com/ technology/ products/ forms/ pdf/ 6iscalability.pdf

8/8/2019 Forms Capacity Planning
http://slidepdf.com/reader/full/forms-capacity-planning 4/22
Oracle Application Server Forms Services 10g (9.0.4) – Capacity Planning Guide Page 4
Summary of Results
The results of the benchmark tests appear in Table 1. A detailed analysis of the
results appear in Scalability Testing Results , on page 14.
In summary, the results confirm that OracleAS Forms Services is an extremely
scalable application deployment platform that scales linearly on various operating
systems and hardware.
SolarisSun 450R
Up to 4 CPUs @ 450 MHz each
Up to 4 GB RAM
Small Medium
200 users /
CPU
2.8 Mb / user
150 users /
CPU
5.3 Mb / user
Table 1: Results summary of Forms 10g scalability testing

8/8/2019 Forms Capacity Planning
http://slidepdf.com/reader/full/forms-capacity-planning 5/22
Oracle Application Server Forms Services 10g (9.0.4) – Capacity Planning Guide Page 5
Scalability Defined
Within the context of this guide, scalability refers to the ability to accommodate an
ever-increasing user population on a single system by simply adding more
hardware resources and not having to change any of the underlying software.
1.1 Why is this important to me?
A CIO or an Information Systems Manager will benefit greatly from knowing if the investment that they are making in an enterprise system will be technology
relevant in the future. In other words, understanding how an enterprise system
scales enables you to make an informed decision about a significant investment.
The most common questions asked when considering a deployment platform are:
1. How much memory will each user consume?
2. How many concurrent users per CPU can I run?
3. What hardware will I need for n concurrent users?
4. What happens if I add more users in the future?
Figure 1: Common questions when deploying a Forms application
While there are many variables to consider in answering these questions, a scalable
architecture allows you to plan confidently because it exhibits a known and reliable
behavior.
1.2 Who should read this document?
This whitepaper is aimed at helping business decision makers, consultants, and
application or system administrators realistically determine their hardware
requirements for OracleAS Forms Services based on their user communities, and
their needs.
It is assumed that the reader is familiar with the Oracle Forms Services
architecture.
8/8/2019 Forms Capacity Planning
http://slidepdf.com/reader/full/forms-capacity-planning 6/22
Oracle Application Server Forms Services 10g (9.0.4) – Capacity Planning Guide Page 6
2 METHODOLOGY
This chapter describes the methodology used for the Oracle Forms scalability
testing, the hardware that was used, plus common mistakes people make when
benchmarking.
The aim of the tests was not to “obtain numbers”, or see how many users may be
locked into a platform, but rather to establish a pattern of behavior for thescalability of Oracle Forms. This information allows companies to determine the
number of users that may be supported with acceptable performance for a given
environment. Any numbers obtained would only be relevant for the specific
applications that run in specific environments. See the results chapter for a full
explanation.
2.1 Overview
The following steps are an overview of the methodology that was used:
1. Define a realistic scenario.
2. Record the scenario.
3. Playback the scenario to simulate concurrent users, each time simulating
more users.
4. When performance is degraded beyond usability, you have reached the
maximum number of users.
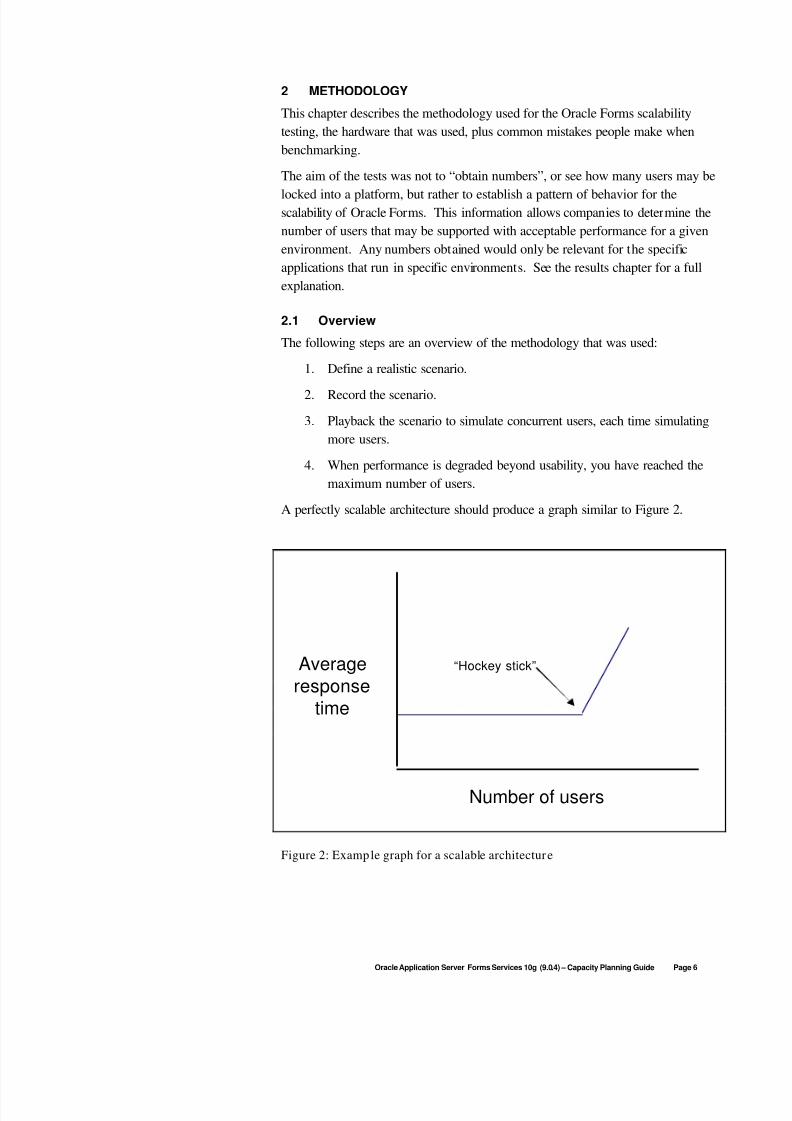
A perfectly scalable architecture should produce a graph similar to Figure 2.
Figure 2: Example graph for a scalable architecture
Number of users
Average
response
time
“Hockey stick”

8/8/2019 Forms Capacity Planning
http://slidepdf.com/reader/full/forms-capacity-planning 7/22
Oracle Application Server Forms Services 10g (9.0.4) – Capacity Planning Guide Page 7
2.1.1 Performance Degradation
Rather than performance slowly degrading as more users are added, it should
remain constant until the machine is saturated: the “hockey stick” or “knee” point
on the graph. Once the saturation point is reached, performance degrades
drastically.
A simple analogy might be playing an audio cassette tape using older alkaline
batteries versus more modern lithium batteries. With alkaline batteries, the tape
would play at normal speed for a while, then it would begin to play slower and
slower as the batteries drained, until it eventually stopped. With new lithium
batteries, the tape would play at full speed right up until the batteries were
drained, and then stop suddenly.
2.1.2 Number of users
For the scalability tests conducted on Forms, the number of simulated concurrent
users run were in steps of 50. The first test was run with 50 users, the secondwith 100 users, the third with 150, and so on.
2.1.3 Response time
An acceptable average response time was defined as up to twice the average
response time for 1 user. For example, if the average response time for 1 user
was 30 milliseconds, then an average response time of up to 60 milliseconds was
deemed acceptable.
Note: The response time is defined as the time it takes to send a “Forms
message” (not a TCP/ IP packet) from the client to the server, and get a response.
It is not the time an action takes, as perceived by the user. There is a
relationship, though, between the two. Namely, if individual network packets take
a longer time to make a roundtrip, the user’s perceived response time will be
longer.
2.1.4 Test Completion
Tests were run until performance degraded sharply, indicating that the server had
reached saturation point. The saturation point may or may not be within an
acceptable average response time. Table 2 contains an example result set.
The saturation point clearly occurred somewhere between 250 and 300 users,
since the average response time jumped drastically to 602.87 milliseconds. In this
case, the saturation occurred while the response time was within an acceptable
limit: less than 2 x 111.12 = 222.24.

8/8/2019 Forms Capacity Planning
http://slidepdf.com/reader/full/forms-capacity-planning 8/22
Oracle Application Server Forms Services 10g (9.0.4) – Capacity Planning Guide Page 8
Number of
Users
Average Response Time (ms)
1 110.97
50 111.12
100 112.25
150 115.22
200 120.73
250 128.49
300 602.87
Table 2: Example table of response times and the saturation point
As a point of interest, for the test results shown in Table 2, it would be stated that
the scalability limit was 250 users. Often, there was no drilling down to determine
a more exact number. This means that the results in this document are
understated and the actual results would be better.
For instance, in the example of Table 2, the real scalability limit might be 295
users (versus the 250 stated) or it could be 255 users. When you benchmark your
application in your environment, once you broadly work out the saturation point,
you may want to conduct finer-grained tests to determine a more accurate figure.
2.2 Two types of tests
In order to determine the memory consumption per user, and the number of
concurrent users per CPU that can be run (see Figure 1, on page 5), the following
tests were used:
• Memory-bound Test
• CPU-bound Test
The results and experience from running the tests not only answer those
questions, but establish a pattern of behavior for the scalability of Oracle Forms
so that extrapolations can be made. This will help in answering questions 3 and 4
in Figure 1.
2.2.1 Memory-bound Test
This test is used to determine the amount of memory consumed per user. It isconducted by forcing the memory to be the bottleneck by saturating it. When the
server becomes saturated, then you know that it was because of memory.
In practice, this saturation occurs by configuring a machine with far more
available CPU power than memory. In the case of the tests conducted by Oracle
8/8/2019 Forms Capacity Planning
http://slidepdf.com/reader/full/forms-capacity-planning 9/22
Oracle Application Server Forms Services 10g (9.0.4) – Capacity Planning Guide Page 9
Corporation, a machine with 4 CPUs and 1 Gb of memory was used. This
configuration ensures that all of the memory will be used before the CPU is fully
utilized.
For example, you run tests using the configuration just described, and determine
the scalability limit to be 300 users. Then you can conclude that you can run 300
users per Gb. A more useful metric for many people is the amount of memory
consumed per user. Divide 300 users by 1 gigabyte and you get 3.4 Mb per user.
2.2.2 CPU-bou nd Test
This test is opposite of the memory-bound test. In this case, a machine with 4 Gb
RAM and only 1 CPU was configured. Thus, the CPU is fully utilized before all
of the memory is consumed, therefore saturating the server. For example, you
run tests using the configuration just described and determine the scalability limit
to be 250 users. Then you can conclude that you are able to run 250 users per
CPU.
2.3 Application Complexity
Two differently sized applications were used in the Forms scalability
benchmarking tests: small and medium. For large forms, the results of Oracle’s
E-Business suite of applications were used since they conduct independent
benchmarking.
2.3.1 Small Application
A small application is defined as having:
• Less than 1 Mb of files opened concurrently (.FMX, .PLX, etc)
• Less than 10 blocks, 5 canvases, and 3 windows
• Maximum of 2 forms opened concurrently
The small application that was used is called the Summit application, and is based
on the application used by Oracle Education in their Oracle Forms training
courses. Information on this application may be found in Appendix 1.
2.3.2 Medium Application
A medium application is defined as having:
• Between 1-3 Mb of files opened concurrently (.FMX, .PLX, etc)
• 10-20 blocks, 5-15 canvases, and 3-10 windows
• Maximum of 3-5 forms opened concurrently
An Oracle customer (who cannot be named for legal reasons) donated their
Forms application to be used as a sample medium application. It is a “real-life”
help-desk and customer support application, designed and used by this customer.

8/8/2019 Forms Capacity Planning
http://slidepdf.com/reader/full/forms-capacity-planning 10/22
Oracle Application Server Forms Services 10g (9.0.4) – Capacity Planning Guide Page 10
2.3.3 Large Application
A large application is defined as having:
• Greater than 3 Mb of files opened concurrently (.FMX, .PLX, etc)
• More than 20 blocks, more than 15 canvases, and more than 10
windows
• Greater than 5 forms opened concurrently
2.4 Scenarios
The scenarios used included common actions performed by users, such as:
• Querying data
• Inserting, updating, and deleting data
• Navigating between fields and canvases within a form
• Navigating between forms
• And so on…
In the benchmarking performed by Oracle, the scenario recorded was of a user
working relatively intensively. The number of actions performed by users can
significantly affect scalability.
2.5 Software and Hardware
The application server used was Oracle Application Server 10g (9.0.4). The
database used was an Oracle 9.2 RDBMS.
The Oracle Application Server, the database, and the client simulation software
were each run on different hosts, which were the following:
• Sun 450R
• Solaris 2.8 operating system
• 4 CPUs @ 450 MHz each
• 4 Gb RAM
For the memory-bound tests, memory was physically removed. For the CPU-
bound tests, OS software was used to control the number of CPUs used.
2.5.1 Client Simulation Software
In a benchmark scenario, it is impractical to configure a number of client
machines and end users that accurately represent a live application environment.
Therefore, load simulators are used to simulate actual users that perform
transactions.

8/8/2019 Forms Capacity Planning
http://slidepdf.com/reader/full/forms-capacity-planning 11/22
Oracle Application Server Forms Services 10g (9.0.4) – Capacity Planning Guide Page 11
The simulation software utilized in these tests was LoadRunner from Mercury. If
you wish to conduct your own benchmarking, there are third party load simulation
products on the market, including LoadRunner.
2.6 Common Mistakes
Having a correct testing methodology is essential to obtaining accurate results.
The section discusses some common mistakes that people make when conductingtheir own tests.
2.6.1 Memory Consumption
The only true way to determine the scalability limit is to push the server past the
saturation point so that accurate figures be obtained. Here is a real-world
example that illustrates common mistakes.
Bob sets up Oracle Forms Services on a server with 4 CPUs and 1 Gb RAM,
running Windows NT – this is the middle tier. The database is on a separate
server. On a third machine, Bob launches his (fairly small) Oracle Forms
application in a Web browser.On the middle tier, Bob opens the Task Manager, clicks on the Processes tab, and
observes that the ifweb90 process is consuming 15 Mb. His initial thought -- as
would be many people’s -- is, “What! Forms is using 15 Mb per user? That
means my 1 Gb machine can only run 68 users!”
This is misleading and incorrect.
Bob then starts up his simulation software and simulates 50 users. He looks at
the memory usage on the middle tier and calculates that Forms is using an
average of 6.2 Mb per user.
“With 6.2 Mb per user,” he thinks, “I can run 165 users. That’s better than 68,but I’m only using a small Forms application.”
Again, these results are misleading.
Bob then runs several tests to stress his middle tier server until performance
degrades sharply and he has determined the saturation point. H e then
calculates that O racle Forms, when the machine was fully utilized, was
consuming only 2.8 Mb per user.
This is the correct result. Why is this?
Simply measuring the memory consumption using the operating system memory
tool can lead to misleading results. Often, the tool doesn’t even report the correctfigure because the OS has not released the memory, or not updated its internal
tables, for instance.
More importantly, a lot of work has gone into optimizing Oracle Forms -- and the
way it manages memory, for example, cannot be determined by simply running
8/8/2019 Forms Capacity Planning
http://slidepdf.com/reader/full/forms-capacity-planning 12/22
Oracle Application Server Forms Services 10g (9.0.4) – Capacity Planning Guide Page 12
one or two processes and looking at memory consumption. Oracle Forms may
grab more memory than it really needs in anticipation of needing more in the near
future. So while the memory manager reports that 15 Mb is consumed, Oracle
Forms may only be using 5 Mb of it, say.
In addition, Oracle Forms processes are able to share executable code and the
application image. If 200 users open the same form, there are many objects in
memory that can be shared. Even if different forms are opened concurrently,
there are still many objects in memory that can be shared.
Therefore, when you have only one process, there is nothing to share with, so that
process appears bloated. Moreover, when Forms is finished with some memory,
it may choose not to release it immediately. Allocating memory is a relatively
expensive operation so it may retain the memory until it absolutely has to be
released.
That is why it is extremely important, when benchmarking, to stress the server
past the saturation point. Just running 1, 10, 50, or even 100 users, and
extrapolating your figures from that will yield misleading results.
2.6.2 Define a Realistic Scenario
When you record a scenario that is to be played back, there will be potentially
hundreds of simulated users playing that scenario concurrently. It is important
that the scenario is representative of the actions of your user population. The
scenario should perform the same types of operations as your users – this is
obvious to most people – but also at the same speed your users would.
Often, testers will carefully research what actions their users perform. Satisfied,
they will then record a scenario, but record the actions in quick succession,
thinking that it’s the only the transactions themselves that are important. Equally
important is the think time, the time between operations.
For example, your application might be a help desk system that your users use
while on the phone to customers. An average phone call might last 5 minutes,
and the users perform an average of 10 transactions in that time, which is 2
transactions per minute. (A transaction may be a set of operations, such as
inserting or updating, navigating between fields, canvases, forms, etc.)
If you then record a scenario that performs those same types of transactions, but
instead does 5 transactions per minute, then, when you simulate many users, the
Oracle Forms server and database are working harder than they normally would.
You will obtain inaccurate results.
8/8/2019 Forms Capacity Planning
http://slidepdf.com/reader/full/forms-capacity-planning 13/22
Oracle Application Server Forms Services 10g (9.0.4) – Capacity Planning Guide Page 13
Although you may have 200 concurrent users, the Oracle Forms server isn’t really
doing 200 “things” at exactly the same time. People pause when they work; they
look something up in a book, or write on a piece of paper; they talk to a customer
on the phone; they think. These gaps are a long time to a computer, even for
data entry users who type fairly constantly. By recording a scenario without
realistic think time – without those gaps – your server is working harder than
usual and you will get misleading results.
Therefore, when defining and recording your scenario, it is critical to not only
record the type of actions that your users would perform, but also at the same
speed. That will yield more accurate benchmarking results.
8/8/2019 Forms Capacity Planning
http://slidepdf.com/reader/full/forms-capacity-planning 14/22
Oracle Application Server Forms Services 10g (9.0.4) – Capacity Planning Guide Page 14
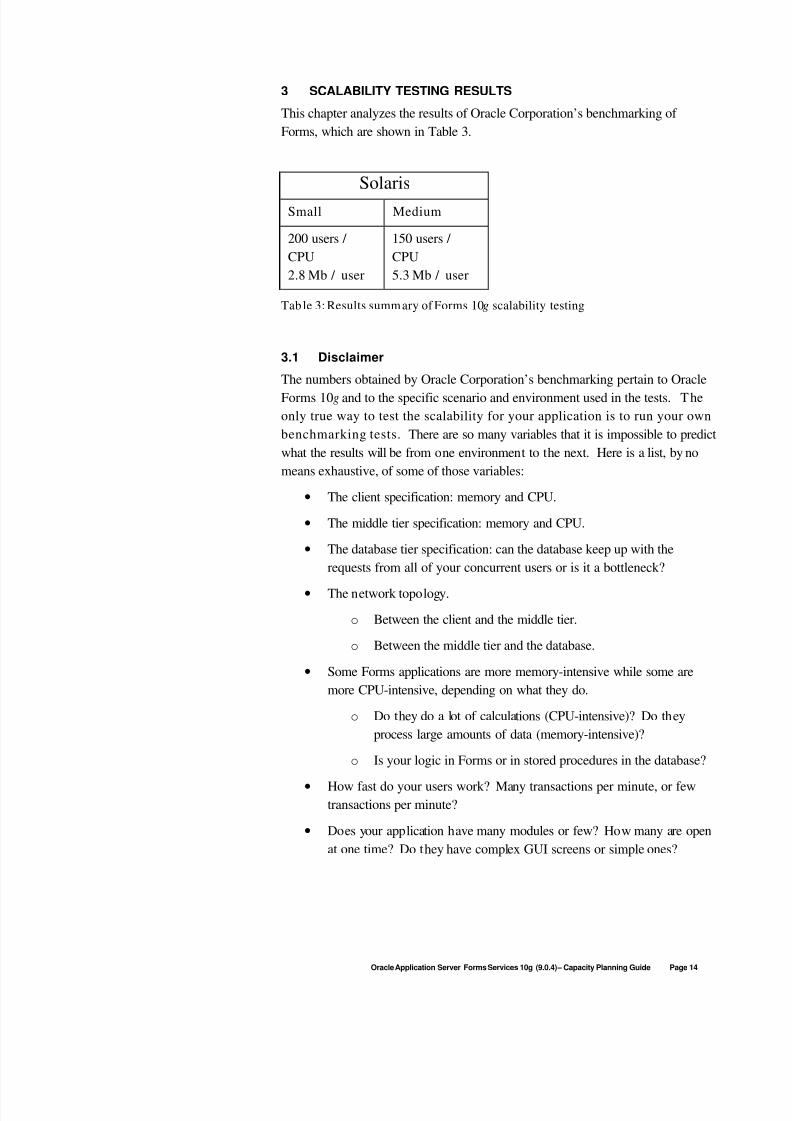
3 SCALABILITY TESTING RESULTS
This chapter analyzes the results of Oracle Corporation’s benchmarking of
Forms, which are shown in Table 3.
Solaris
Small Medium
200 users /
CPU
2.8 Mb / user
150 users /
CPU
5.3 Mb / user
Table 3: Results summary of Forms 10g scalability testing
3.1 Disclaimer
The numbers obtained by Oracle Corporation’s benchmarking pertain to Oracle
Forms 10g and to the specific scenario and environment used in the tests. The
only true way to test the scalability for your application is to run your own
benchmarking tests. There are so many variables that it is impossible to predict
what the results will be from one environment to the next. Here is a list, by no
means exhaustive, of some of those variables:
• The client specification: memory and CPU.
• The middle tier specification: memory and CPU.
• The database tier specification: can the database keep up with the
requests from all of your concurrent users or is it a bottleneck?
• The network topology.
o Between the client and the middle tier.
o Between the middle tier and the database.
• Some Forms applications are more memory-intensive while some are
more CPU-intensive, depending on what they do.
o Do they do a lot of calculations (CPU-intensive)? Do they
process large amounts of data (memory-intensive)?
o Is your logic in Forms or in stored procedures in the database?
• How fast do your users work? Many transactions per minute, or fewtransactions per minute?
• Does your application have many modules or few? How many are open
at one time? Do they have complex GUI screens or simple ones?
8/8/2019 Forms Capacity Planning
http://slidepdf.com/reader/full/forms-capacity-planning 15/22
Oracle Application Server Forms Services 10g (9.0.4) – Capacity Planning Guide Page 15
• Do your users run the one application all day, or are they stopping and
starting it several times a day?
• What other software runs on your server?
• What features and functionality of the Oracle Application Server do you
use, such as Portal, Single Sign-On, security, etc.
All of these variables, and many more, combine to produce different actualscalability numbers for each system. However, the way that Oracle Forms scales
remains consistent, as will be shown in the next section.
The methodology used, while more realistic than purely empirical, introduces a
degree of subjective qualification to the test. What may be acceptable to one
group of users may not be acceptable to another. If the complexity of your
application matches the small or medium application used in these tests, then you
may be able to use the results as a rough estimate. There is no substitute for
conducting your own tests, though.
3.2 CalculationsFor the memory results, only the memory actually consumed from running the
Oracle Forms application is reported in this document. In reality you cannot
simply multiply the numbers reported by the amount of users to predict the
memory requirements for your server. You need to take into account the
operating system and other software running on the machine. Below are the
calculations that were used.
Total memory = Memory for the operating system +
Base Application Server memory +
Memory consumed per user * # of Users +
Average free memoryEquation 1: Total Mem ory calculation
During your tests, all of those variables except for memory consumed per user is
known. So re-arranging Equation 1 we get:
Memory consumed per user = ( Total Memory -
Memory for the operating system -
Base Application Server memory -
Average free memory ) /
# of Users
Equation 2: Memory per user calculation
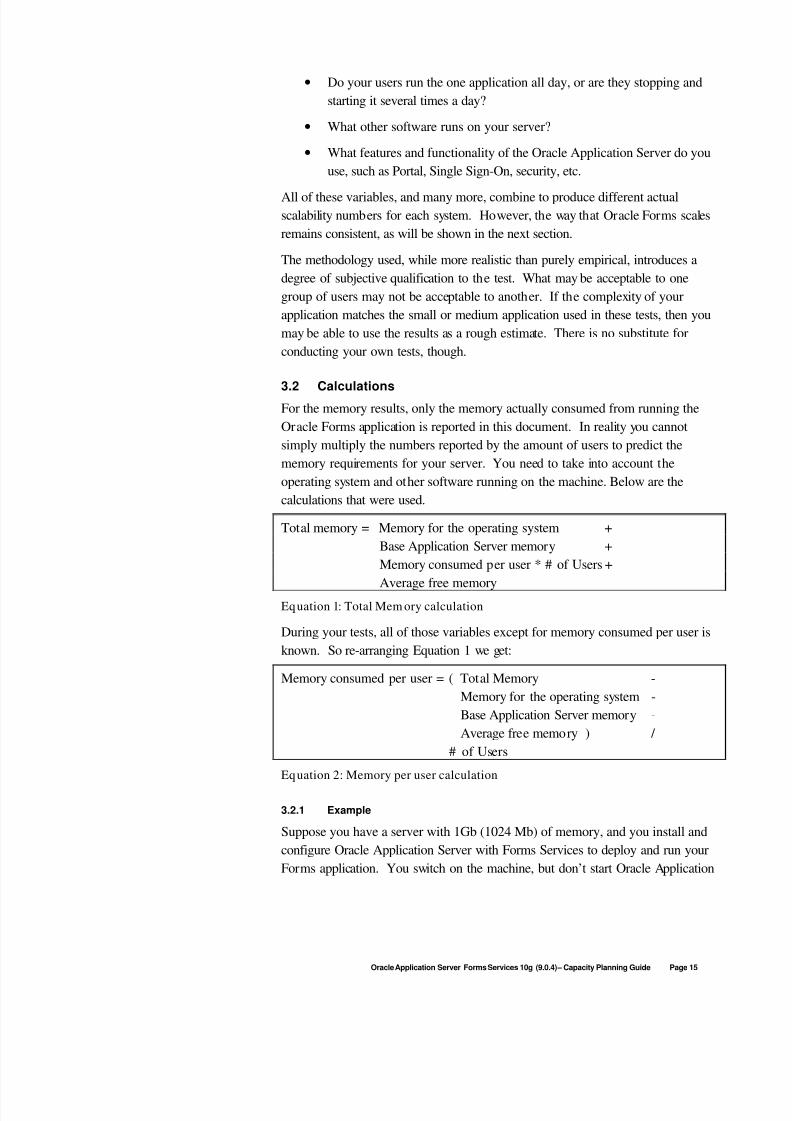
3.2.1 Example
Suppose you have a server with 1Gb (1024 Mb) of memory, and you install and
configure Oracle Application Server with Forms Services to deploy and run your
Forms application. You switch on the machine, but don’t start Oracle Application

8/8/2019 Forms Capacity Planning
http://slidepdf.com/reader/full/forms-capacity-planning 16/22
Oracle Application Server Forms Services 10g (9.0.4) – Capacity Planning Guide Page 16
Server. Inspect the memory and say you have 930 Mb free. You can conclude
that the operating system consumes 94 Mb.
Then, you start Oracle Application Server but not any of the applications.
Inspect the memory again and now perhaps you have 780 Mb free. Thus you
can conclude that the base processes for OracleAS consume 150 Mb (930 Mb –
780 Mb) of RAM.
The next step is to run your load test simulations. From these simlations you
determine that you can run a maximum of 175 users. You also know that during
the test (the “steady state”) that free memory averaged 50 Mb.
Now it is easy to calculate that running the Forms application consumed 730 Mb
of RAM (1024 - 94 - 150 - 50). Since we could run 175 users where each user
consumed 4.2 Mb (730 / 175).
3.2.2 Drawing the correct conclusion
Another way to report memory consumption is to divide the number of simulated
users by the total amount of physical memory for that machine. However, this
method combines the memory consumption of the operating system and Oracle
AS with the Forms memory consumption.
It makes sense to report the memory the way because it is independent of other
applications and represents Forms only. For instance, you may have a large
server running Oracle Application Server for other applications. You know that it
usually has 2 Gb of available RAM. Continuing with the example above, now you
know you can run 2 Gb / 3.7 Mb per user users, since the 3.7 Mb per user
number doesn’t include the operating system or Oracle Application Server.
3.3 Analysis
The significance from the benchmarking is not the numbers themselves, but the
scalability behavior of Oracle Forms.
The scalability testing has shown that Forms scales linearly. If you
double the hardware, you roughly double the number of users.
Therefore:
• If you are deploying for the first time, you can run benchmarks and then
be able to predict with accuracy your hardware requirements.
• If you wish to add more users to your current deployment, you can
predict with accuracy your hardware requirements.
These conclusions are shown in the following graph. Figure 3 shows the results of
a memory-bound test for 1 Gb and 2 Gb, using 4 CPU’s, thus eliminating CPU as
a factor in the test. With 1 Gb, approximately 200 concurrent users were
supported, and when the memory was doubled, the number of users was able to
approximately double to 400.
8/8/2019 Forms Capacity Planning
http://slidepdf.com/reader/full/forms-capacity-planning 17/22
Oracle Application Server Forms Services 10g (9.0.4) – Capacity Planning Guide Page 17
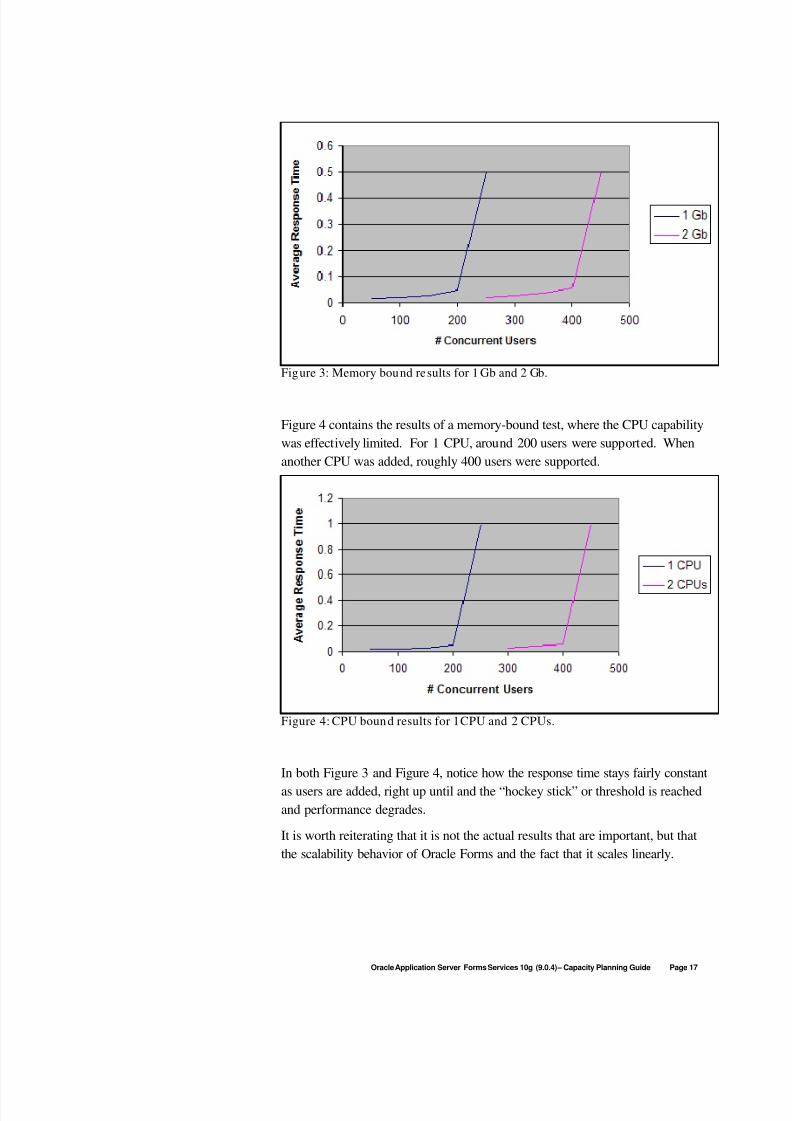
Figure 3: Memory bound results for 1 Gb and 2 Gb.
Figure 4 contains the results of a memory-bound test, where the CPU capability
was effectively limited. For 1 CPU, around 200 users were supported. When
another CPU was added, roughly 400 users were supported.
Figure 4: CPU bound results for 1 CPU and 2 CPUs.
In both Figure 3 and Figure 4, notice how the response time stays fairly constant
as users are added, right up until and the “hockey stick” or threshold is reached
and performance degrades.
It is worth reiterating that it is not the actual results that are important, but that
the scalability behavior of Oracle Forms and the fact that it scales linearly.

8/8/2019 Forms Capacity Planning
http://slidepdf.com/reader/full/forms-capacity-planning 18/22
Oracle Application Server Forms Services 10g (9.0.4) – Capacity Planning Guide Page 18
How is this useful in making predictions? For example, Company 1 and
Company 2 both have Forms applications. Company 1, given their hardware,
environment, and scenario, are able to run 200 concurrent users. Company 2,
with a different system and application, are able to run 900 concurrent users.
If Company 1 and Company 2 double their hardware, then they will be able to
support roughly 400 and 1800 users, respectively. i.e. Even though the actual
scalability numbers obtained by Company 1 and Company 2 are different, the
scalability behavior of Oracle Forms remains the same.
3.3.1 Response Time
The tests showed that an acceptable response time was always within plus-or-
minus ten percent of the machine’s saturation point. This is another indication
that Oracle Forms scales well because the average response time stayed fairly
level until the server was overloaded.
3.3.2 Comparing Oracle Forms 10g to Forms 6i
The numbers shown in Table 3 are not directly comparable to the results in theForms 6 i Capacity Planning Guide. In these results, only the actual memory
consumption used by Oracle Forms is reported.
The new features and services of Oracle Forms and the underlying Oracle
Application Server, result in a small increase in memory usage. Depending on
your application, the amount of additional memory required may be between 5%
– 15%. Larger applications are likely to fall on lower end of that range, because a
significant portion of the increased memory usage is a one-time, up-front cost.
However, the CPU usage of Oracle Forms 10g remains comparable to Forms 6i.
In fact, it’s not unusual to find that the CPU consumption of Forms 10g is lower
than that of Forms 6i.
3.4 Hardware Decisions
While in-depth discussion on hardware architecture is beyond the scope of this
whitepaper, a small mention is in order. Once you know your memory and CPU
requirements, it does not mean you need to have all of that memory in a single
machine.
3.4.1 Com bining hardware
For example, suppose you complete your sizing testing and determine that each
user consumes 8.7 Mb RAM, and you can support 110 users per CPU. Now
further suppose that you will have 1,500 concurrent users. That comes to a total
of 13,050 Mb RAM and 13.6 CPUs. For sake of simplicity, let’s say that it’s 13
Gb RAM and 14 CPUs. (Actually, you would need more. Remember, these
numbers do not include the memory for the operating system or for the base
8/8/2019 Forms Capacity Planning
http://slidepdf.com/reader/full/forms-capacity-planning 19/22
Oracle Application Server Forms Services 10g (9.0.4) – Capacity Planning Guide Page 19
processes of Oracle Application Server or any other software you use, they are
just for Oracle Forms.)
You do not need to use a single server that contains 13 Gb of memory and 14
CPUs. The requirement is that your environment as a whole has 13Gb and 14
CPUs available for Forms, not that it be contained in a single machine. You could
use a single server if you wished, as long as it did have enough memory and CPU
resources.
An alternative is to load balance over several smaller machines. Perhaps you have
four 4-CPU machines each with 4 GB of memory. Depending on the operating
system and Oracle Application Server resource consumption, these may very well
suffice.
If your application grows, or your user population grows, or for whatever reason
your existing hardware is not sufficient, it is relatively easy to add an additional
server. You configure it with Oracle Application Server and your Oracle Forms
application and add it to the load balancing pool.
In fact, you can combine hardware in any manner you need. You don’tnecessarily have to have all of your machines of the same type. Perhaps you have
one large server which is running at full capacity. You want to add some more
users, but not enough to justify another large server. Then simply use another
machine of an appropriate size and load balance between your existing server and
this new one.
3.4.2 Larger servers versus smaller servers
There are differing philosophies on the topic of whether you should have fewer
larger servers, and more smaller servers, and this document does not seek to
influence your decision either way. Your Forms applications will scale well in
either environment, so the decision is up to you.
In general, fewer larger servers mean less maintenance overhead, but fewer
options if things go wrong. More smaller servers gives you benefit of more
flexibility in terms of load balancing. If a server crashes, the others can keep
running until the damaged server is repaired. Replacing one of these machines is
far cheaper than replacing a large server. However the maintenance overhead is
higher.
3.5 Conclusion
There is absolutely no substitute for conducting your own benchmarking to
determine the scalability of your application. But some general conclusions can bemade.
The results from the benchmark tests show that Oracle Application Server Forms
Services is an extremely scalable application deployment platform which scales

8/8/2019 Forms Capacity Planning
http://slidepdf.com/reader/full/forms-capacity-planning 20/22

8/8/2019 Forms Capacity Planning
http://slidepdf.com/reader/full/forms-capacity-planning 21/22
Oracle Application Server Forms Services 10g (9.0.4) – Capacity Planning Guide Page 21
APPENDIX A – SMALL APPLICATION
The Summit application was used for the Small Application testing scenario.
Oracle Education originally designed it for use in their training courses.
You may download the application from OTN to perform your own
benchmarking and compare your results with those in this document. Point a
browser and go to the following URL:
http:/ / www.oracle.com/ technology/ products/ forms/ files/ summit.zip
From there, you should be able to navigate to the Summit application and
download it. It will contain the necessary Forms modules, database schema,
instructions for installing, plus the scenario used in the Oracle Forms scalability
testing.

8/8/2019 Forms Capacity Planning
http://slidepdf.com/reader/full/forms-capacity-planning 22/22
Oracle Application Server Forms Services 10g (9.0.4) - Capacity Planning Guide
November 2004
Author: Forms Product ManagementContributing Authors: PerfScale Team
Oracle Corporation
World Headquarters
500 Oracle Parkway
Redwood Shores, CA 94065
U.S.A.
Worldwide Inquiries:
Phone: +1.650.506.7000
Fax: +1.650.506.7200
www.oracle.com
Oracle Corporation provides the software
that powers the internet.
Oracle is a registered trademark of Oracle Corporation. Various
product and service names referenced herein may be trademarks
of Oracle Corporation. All other product and service names
mentioned may be trademarks of their respective owners.
Copyright © 2000 Oracle Corporation
All rights reserved.