Embed Size (px)
Citation preview
International Journal of Plasticity 58 (2014) 35–65
Contents lists available at ScienceDirect
International Journal of Plasticity
journal homepage: www.elsevier .com/locate / i jp las
Forming limit criterion for ductile anisotropic sheets as amaterial property and its deformation path insensitivity, Part II:Boundary value problems
http://dx.doi.org/10.1016/j.ijplas.2014.03.0140749-6419/� 2014 The Authors. Published by Elsevier Ltd.This is an open access article under the CC BY-NC-ND license (http://creativecommons.org/licenses/by-nc-nd/3.0/).
⇑ Corresponding author. Tel.: +82 2 880 7189; fax: +82 2 885 1748.E-mail address: [email protected] (K. Chung).
1 Tel.: +82 2 880 7189; fax: +82 2 885 1748.
Kwansoo Chung ⇑, Chulhwan Lee 1, Hyunki Kim 1
Department of Materials Science and Engineering, Research Institute of Advanced Materials, Engineering Research Institute, Seoul National University, 599Gwanak-ro Gwanak-gu, Seoul 151-744, Republic of Korea
a r t i c l e i n f o a b s t r a c t
Article history:Received 2 September 2013Received in final revised form 19 February2014Available online 2 April 2014
Keywords:Sheet metal formingForming limit diagramDeformation path insensitivityx-EPSThe invariance principle for imposedboundary rates
In the common industrial thin sheet metal forming process at room temperature, in whichin-homogenous deformation under the plane stress condition is typically the case, sheetsare so ductile that sheet forming more often fails after abruptly severe strain localization,especially in the thinning mode. In such a case, measuring the fracture property might beimpractical and an alternative criterion to measure sheet proneness to abruptly severestrain localization according to deformation modes, often dubbed as the forming limit cri-terion, replaces the fracture criterion to account for formability of the sheet, assuming thatthe criterion is applicable as a material property. However, severe strain localization is amathematical consequence (of the boundary value problem) of the principle of linearmomentum and the constitutive law; therefore not a part of material properties in princi-ple, regardless of its sensitivity to deformation path. Nonetheless, the assumed applicabil-ity of the forming limit criterion as a material property in approximation for roomtemperature forming under the plane stress condition was partially validated in Part IIin view of regular and modified hemispherical dome stretching and circular cup drawingtests, while its deformation path insensitive formulae were theoretically justified in PartI by examining the isotropic hardening formulation of rigid-plasticity and also theoreticalforming limit models including the Considère (1885), Dorn (1947) and Hill (1952) modelsas well as the M–K (1967) model.� 2014 The Authors. Published by Elsevier Ltd. This is an open access article under the CC
BY-NC-ND license (http://creativecommons.org/licenses/by-nc-nd/3.0/).
1. Introduction
One of main objectives of engineering is to design (or optimize) forming processes. As for efficient metal forming processdesign in particular, computational methods are commonly applied, in which a fracture criterion is characterized as a part ofmaterial properties to predict forming failure. However, in typical industrial thin sheet metal forming processes at roomtemperature, forming is mainly driven by stretching under the plane stress condition (including the case of draw formingfor which sheet draw-in is constrained enough) and fracture more often occurs as a result of abruptly severe strain locali-zation in a thinning mode especially for highly ductile sheets, with a few exceptions such as the case of some advanced highstrength steels including the TWIP (twinning induced plasticity) steel sheet (Chung et al., 2011a,b; Ma et al., 2010). When
36 K. Chung et al. / International Journal of Plasticity 58 (2014) 35–65
sheet splits with fracture accompanying abruptly severe strain localization, characterizing the fracture property might beimpractical and an the forming limit criterion to measure sheet proneness to severe strain localization according to defor-mation modes replaces the fracture criterion to account for sheet formability.
Now, there are two major issues to address as for the forming limit criterion: one is its relevance as a material propertyand the other is on its deformation path insensitive formulae. There are two approaches to address those issues: the onebased on the conventional (or materials) view and the other based on the continuum/computational mechanics view. Theconventional approach is based on an assumption that strain localization observed in experiments is incurred even duringhomogeneous deformation by physical impurities intrinsically existing in the sheet (such as non-uniform distributions ofimpurities, varying texture, different size and orientation of grains and so on), which were represented by the coefficientof geometric in-homogeneity for the M–K model by Marciniak and Kuczynski (1967). Under such an assumption, the forminglimit criterion is intrinsically considered a material property, as taken by other theoretical works on forming limit diagram(FLD) such as the maximum force models including the works by Considère (1885), Dorn and Thomsen (1947), Swift (1952)and Hill (1952) as well as the works based on the bifurcation theory by Stören and Rice (1975). In view of the conventionalapproach, the deformation path insensitive formulae of the forming limit criterion can be addressed for each model individ-ually, as done in Part I for the Dorn and Thomsen (1947), Hill (1952) and M–K (1967) models.
In view of continuum/computational mechanics on the other hand, while the relevance of the fracture criterion as anindependent material property is acceptable without any proof, that of the forming limit criterion which is the pronenessmeasure of the sheet to severe strain localization might need proof or extensive validations if analytical proof is unavailable.This is especially so since strain localization (whether it is severe or not) is in principle the mathematical consequence of theboundary value problem of the linear momentum principle and the constitutive law under typical forming conditions;therefore, the forming limit diagram violates the condition of the local action, which is one of three conditions requiredfor a material property (Malvern, 1969). The relevance of the forming limit criterion as a material property has not beenpreviously validated in view of mechanics; therefore, rather extensive and systematic validation was attempted in Part II,considering various forming conditions computationally, even though validation is still only partial. This validation effortbased on computational methods is legitimate especially for the forming process design procedure, in which computationaltools are applied to predict strain localization for forming failure without imposing any physical impurities (employed in thetheoretical models). If the forming limit criterion is a material property in view of mechanics, the forming condition woulddetermine only the onset location and the deformation mode near the strain localization (or critical) site, while the limitlocal deformation amount near the critical site would be independent of the forming condition in approximation, especiallywhen strain localization is abruptly severe, regardless of the deformation path sensitivity of the forming limit criterion. Forthis validation, the b-EPS formulation was utilized as a deformation path insensitive formula for the forming limit criterion,which was validated in Part I.
For the numerical validation, the property of the DP980 sheet, whose FLD test results were shown in Part I, was consid-ered as an exemplary property. Material properties were characterized following the common practice, involving commonsimplifications: the isotropic hardening of the Hill1948 yield function. Even though a more sophisticated yield functionwould provide better agreement with experiments, one of most popular yield functions was utilized here since agreementwith experiments (therefore, the accuracy of material models used) was not the focal point. Since the strain localization isthe main issue, hardening deterioration (material softening associated with micro-void growth and plastic deformationinduced heat generation) was considered along with the strain rate sensitivity (but not in such a sophisticated manner asin the GTN model). The typical hardening difference measured by the simple tension and bulge tests was also ignored. Asfor room temperature sheet forming, as the first trial of this kind, forming conditions were limited to simple tension testand regular/modified hemispherical dome stretching tests (which are the tools to measure the forming limit criterion) aswell as the circular cup drawing test, all at room temperature, in which the plastic deformation induced heat effect wasignored for simplicity. The numerical simulations were performed using the ABAQUS/EXPLICIT commercial code (ABAQUSInc, 2007) and 3-D continuum elements, along with the Coulomb friction law.
2. Material characterization
The DP980 (Dual Phase) steel sheet (with the thickness of 1.2 mm) is one of advanced high strength steels (AHSS) devel-oped for automotive application, having two phase composite characteristics consisting of ferrite and martensite. Thestrength of DP steels is attributed to the hard martensite phase, which is surrounded by the soft ferrite matrix.
2.1. Simple tension tests
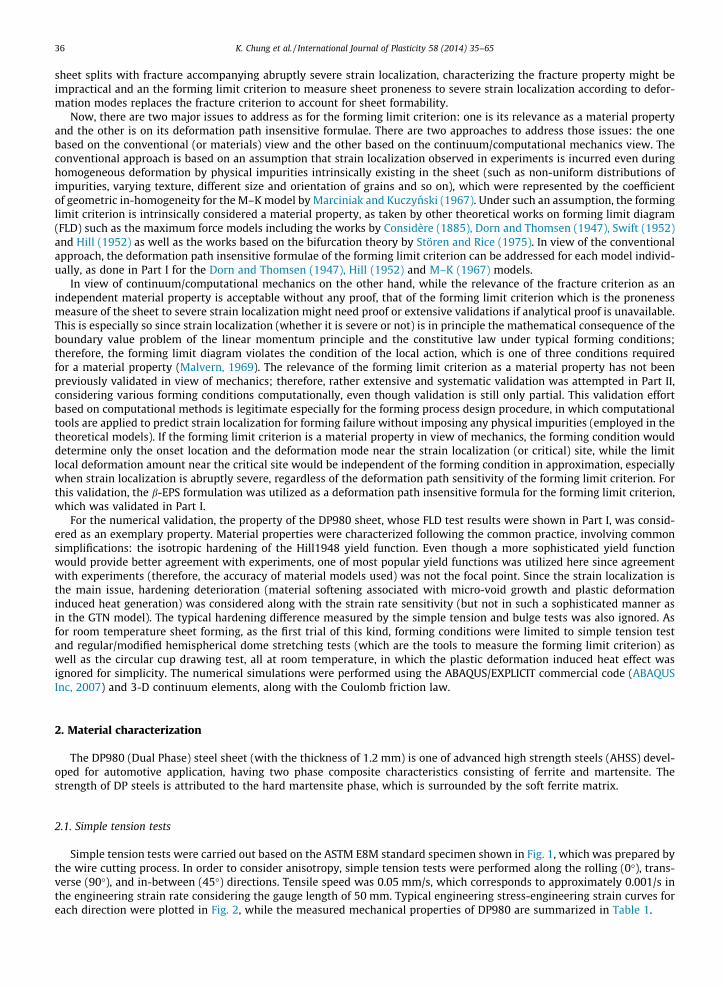
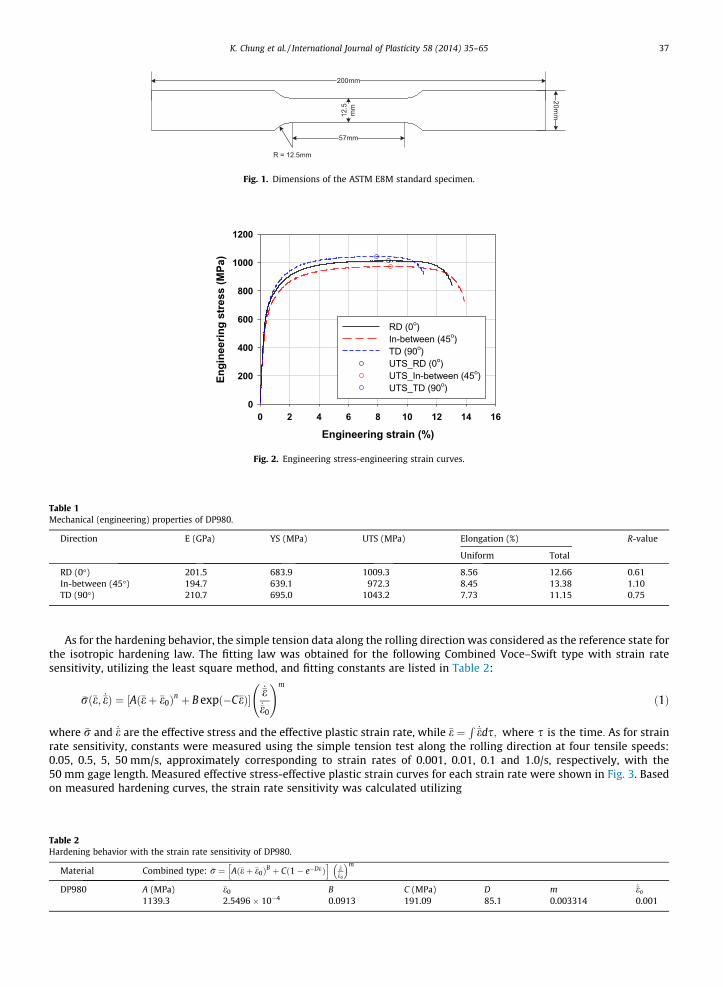
Simple tension tests were carried out based on the ASTM E8M standard specimen shown in Fig. 1, which was prepared bythe wire cutting process. In order to consider anisotropy, simple tension tests were performed along the rolling (0�), trans-verse (90�), and in-between (45�) directions. Tensile speed was 0.05 mm/s, which corresponds to approximately 0.001/s inthe engineering strain rate considering the gauge length of 50 mm. Typical engineering stress-engineering strain curves foreach direction were plotted in Fig. 2, while the measured mechanical properties of DP980 are summarized in Table 1.
200mm
12.5
mm
57mm
20mm
R = 12.5mm
Fig. 1. Dimensions of the ASTM E8M standard specimen.
Engineering strain (%)0 2 4 6 8 10 12 14 16
Engi
neer
ing
stre
ss (M
Pa)
0
200
400
600
800
1000
1200
RD (0o)In-between (45o)TD (90o)UTS_RD (0o)UTS_In-between (45o)UTS_TD (90o)
Fig. 2. Engineering stress-engineering strain curves.
Table 1Mechanical (engineering) properties of DP980.
Direction E (GPa) YS (MPa) UTS (MPa) Elongation (%) R-value
Uniform Total
RD (0�) 201.5 683.9 1009.3 8.56 12.66 0.61In-between (45�) 194.7 639.1 972.3 8.45 13.38 1.10TD (90�) 210.7 695.0 1043.2 7.73 11.15 0.75
K. Chung et al. / International Journal of Plasticity 58 (2014) 35–65 37
As for the hardening behavior, the simple tension data along the rolling direction was considered as the reference state forthe isotropic hardening law. The fitting law was obtained for the following Combined Voce–Swift type with strain ratesensitivity, utilizing the least square method, and fitting constants are listed in Table 2:
Table 2Harden
Mate
DP98
�rð�e; _�eÞ ¼ ½Að�eþ �e0Þn þ B expð�C�eÞ�_�e_�e0
!m
ð1Þ
where �r and _�e are the effective stress and the effective plastic strain rate, while �e ¼R
_�eds; where s is the time: As for strainrate sensitivity, constants were measured using the simple tension test along the rolling direction at four tensile speeds:0.05, 0.5, 5, 50 mm/s, approximately corresponding to strain rates of 0.001, 0.01, 0.1 and 1.0/s, respectively, with the50 mm gage length. Measured effective stress-effective plastic strain curves for each strain rate were shown in Fig. 3. Basedon measured hardening curves, the strain rate sensitivity was calculated utilizing
ing behavior with the strain rate sensitivity of DP980.
rial Combined type: �r ¼ Að�eþ �e0ÞB þ Cð1� e�D�eÞh i
_�e_�eo
� �m
0 A (MPa) �e0 B C (MPa) D m _�eo
1139.3 2.5496 � 10�4 0.0913 191.09 85.1 0.003314 0.001

Fig. 3. Measured effective stress-effective plastic strain curves for four strain rates.
38 K. Chung et al. / International Journal of Plasticity 58 (2014) 35–65
mð�e; _�eÞ ¼ln �rð�e; _�eÞ
�rð�e; _�e0¼0:001Þ
� �ln
_�eð�eÞ_�e0ð�eÞ¼0:001
� � ð2Þ
The strain rate sensitivity variation with different strain rate were plotted in Fig. 4 and the average strain rate sensitivity,m = 0.003314, was obtained as listed in Table 2.
As for the directional difference of R-value (the plastic strain ratio, width-to-thickness strain increment ratio in simpletension), simple tension tests were performed utilizing the ASTM E 517 standard specimen shown in Fig. 5. The tensile speedwas 0.05 mm/s, and incompressibility was considered; i.e.,
R ¼ dep2
dep3
¼ dep2
�ðdep1 þ dep
2Þð3Þ
where 1, 2 and 3 are the longitudinal, width and thickness directions of the specimen, respectively. Measured R-values of thethree directions are plotted in Fig. 6 and summarized in Table 1.
2.2. Inverse calibration of hardening deterioration
The hardening behavior is affected by impediment of dislocation movement, which is attributed to the interaction withdislocations and the grain boundary or second phase particles (Meyers and Chawla, 1998), and formation of twinning (forTWIP and Mg alloys), which plays a role similar to the grain boundary (Salem et al., 2003). However, after certain plasticstrain, hardening deterioration (or material softening) occurs by micro-voids formation, growth and coalescence until itreaches the macro-crack formation point (Hancock and Mackenzie, 1976) and also partially by the plastic deformationinduced heat effect. There were several sophisticated models to account for hardening deterioration such as the GTN modelbased on porous plasticity (Gurson, 1977; Tvergaard, 1982; Tvergaard and Needleman, 1984) and the model based on the
Fig. 4. Strain rate sensitivity variation for four strain rates.
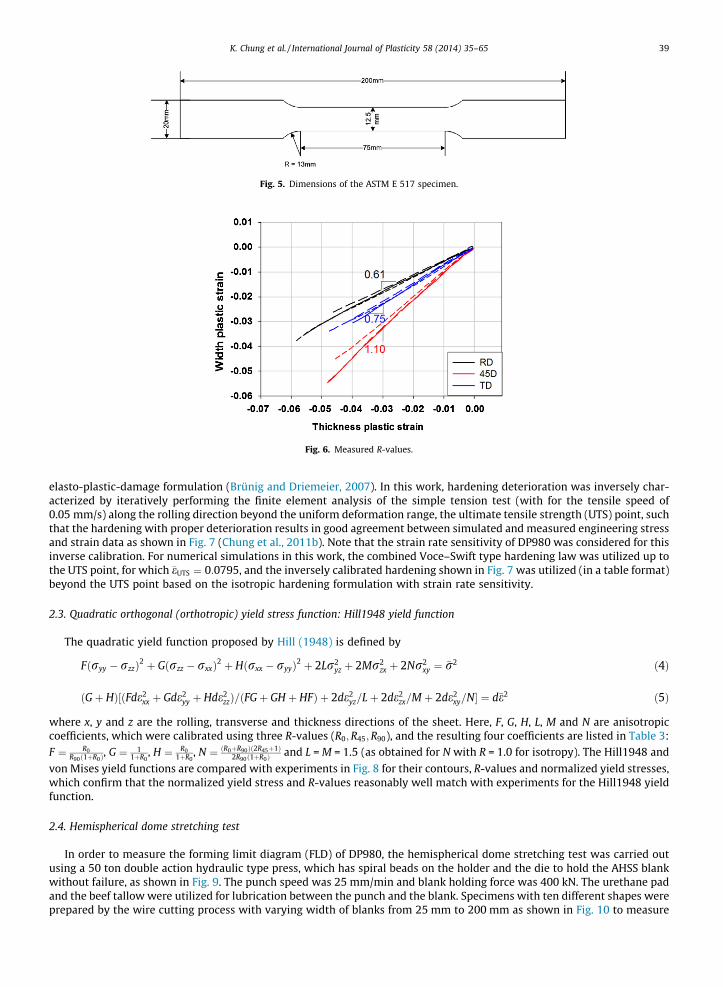
Fig. 5. Dimensions of the ASTM E 517 specimen.
Fig. 6. Measured R-values.
K. Chung et al. / International Journal of Plasticity 58 (2014) 35–65 39
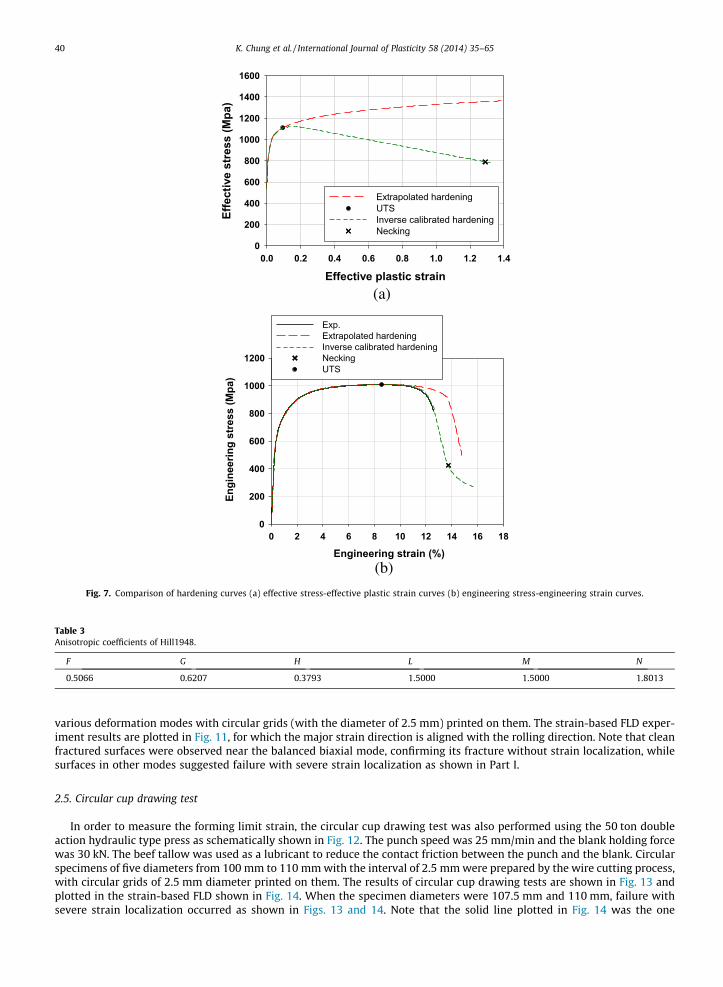
elasto-plastic-damage formulation (Brünig and Driemeier, 2007). In this work, hardening deterioration was inversely char-acterized by iteratively performing the finite element analysis of the simple tension test (with for the tensile speed of0.05 mm/s) along the rolling direction beyond the uniform deformation range, the ultimate tensile strength (UTS) point, suchthat the hardening with proper deterioration results in good agreement between simulated and measured engineering stressand strain data as shown in Fig. 7 (Chung et al., 2011b). Note that the strain rate sensitivity of DP980 was considered for thisinverse calibration. For numerical simulations in this work, the combined Voce–Swift type hardening law was utilized up tothe UTS point, for which �eUTS ¼ 0:0795, and the inversely calibrated hardening shown in Fig. 7 was utilized (in a table format)beyond the UTS point based on the isotropic hardening formulation with strain rate sensitivity.
2.3. Quadratic orthogonal (orthotropic) yield stress function: Hill1948 yield function
The quadratic yield function proposed by Hill (1948) is defined by
Fðryy � rzzÞ2 þ Gðrzz � rxxÞ2 þ Hðrxx � ryyÞ2 þ 2Lr2yz þ 2Mr2
zx þ 2Nr2xy ¼ �r2 ð4Þ
ðGþ HÞ½ðFde2xx þ Gde2
yy þ Hde2zzÞ=ðFGþ GH þ HFÞ þ 2de2
yz=Lþ 2de2zx=M þ 2de2
xy=N� ¼ d�e2 ð5Þ
where x, y and z are the rolling, transverse and thickness directions of the sheet. Here, F, G, H, L, M and N are anisotropiccoefficients, which were calibrated using three R-values (R0;R45;R90), and the resulting four coefficients are listed in Table 3:F ¼ R0
R90ð1þR0Þ, G ¼ 1
1þR0, H ¼ R0
1þR0, N ¼ ðR0þR90Þð2R45þ1Þ
2R90ð1þR0Þand L = M = 1.5 (as obtained for N with R = 1.0 for isotropy). The Hill1948 and
von Mises yield functions are compared with experiments in Fig. 8 for their contours, R-values and normalized yield stresses,which confirm that the normalized yield stress and R-values reasonably well match with experiments for the Hill1948 yieldfunction.
2.4. Hemispherical dome stretching test
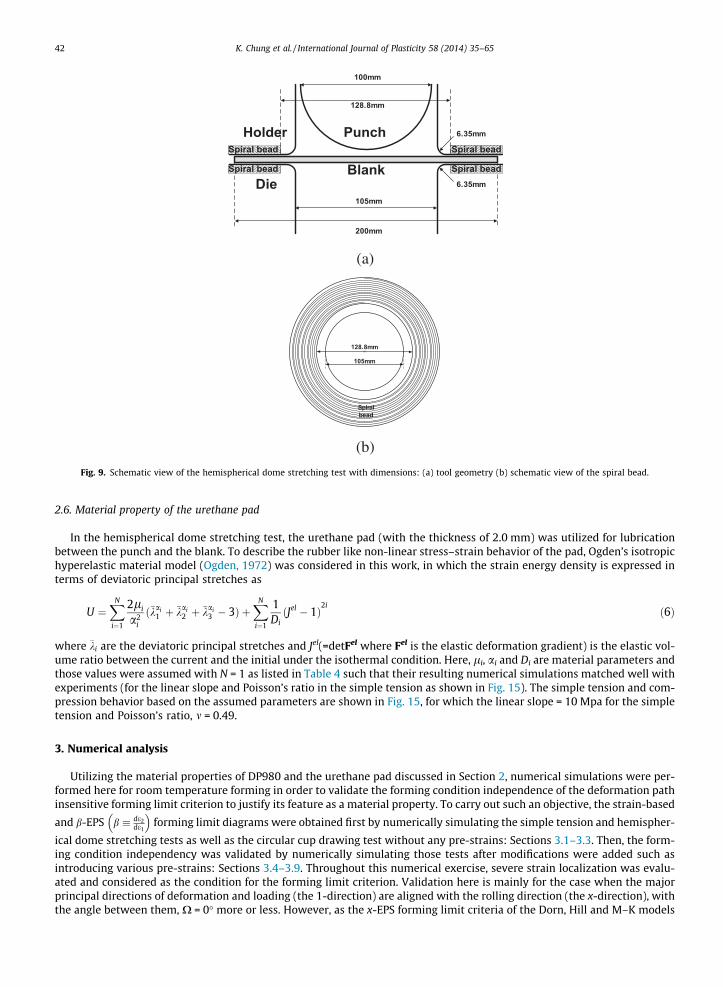
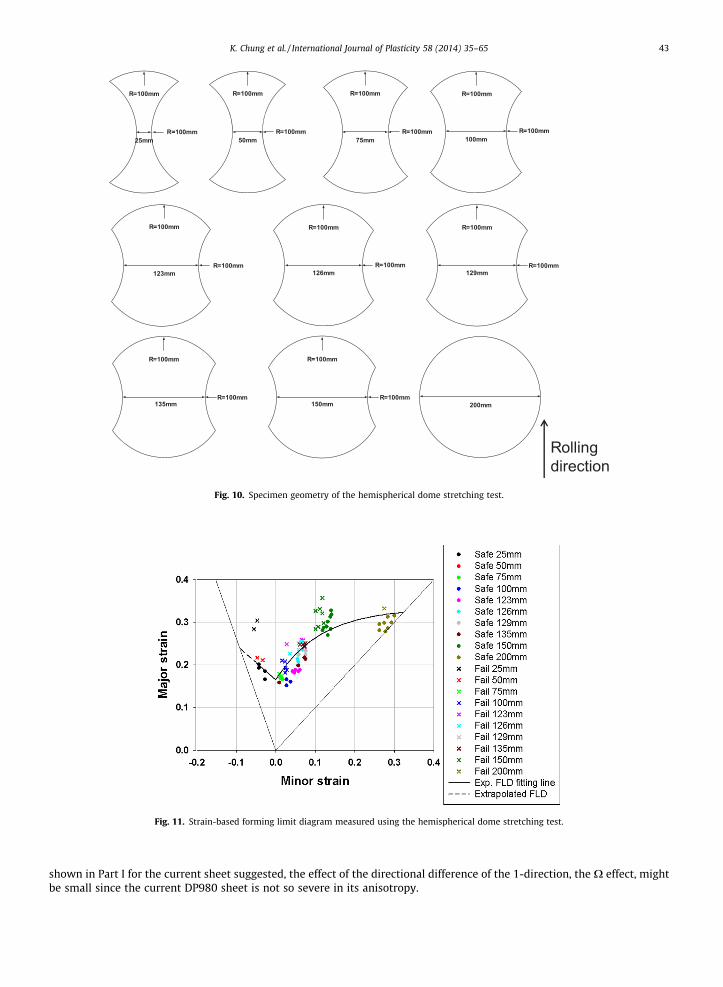
In order to measure the forming limit diagram (FLD) of DP980, the hemispherical dome stretching test was carried outusing a 50 ton double action hydraulic type press, which has spiral beads on the holder and the die to hold the AHSS blankwithout failure, as shown in Fig. 9. The punch speed was 25 mm/min and blank holding force was 400 kN. The urethane padand the beef tallow were utilized for lubrication between the punch and the blank. Specimens with ten different shapes wereprepared by the wire cutting process with varying width of blanks from 25 mm to 200 mm as shown in Fig. 10 to measure
(a)
(b)
Effective plastic strain0.0 0.2 0.4 0.6 0.8 1.0 1.2 1.4
Effe
ctiv
e st
ress
(Mpa
)
0
200
400
600
800
1000
1200
1400
1600
Extrapolated hardeningUTSInverse calibrated hardeningNecking
Engineering strain (%)0 2 4 6 8 10 12 14 16 18
Engi
neer
ing
stre
ss (M
pa)
0
200
400
600
800
1000
1200
Exp.Extrapolated hardeningInverse calibrated hardeningNeckingUTS
Fig. 7. Comparison of hardening curves (a) effective stress-effective plastic strain curves (b) engineering stress-engineering strain curves.
Table 3Anisotropic coefficients of Hill1948.
F G H L M N
0.5066 0.6207 0.3793 1.5000 1.5000 1.8013
40 K. Chung et al. / International Journal of Plasticity 58 (2014) 35–65
various deformation modes with circular grids (with the diameter of 2.5 mm) printed on them. The strain-based FLD exper-iment results are plotted in Fig. 11, for which the major strain direction is aligned with the rolling direction. Note that cleanfractured surfaces were observed near the balanced biaxial mode, confirming its fracture without strain localization, whilesurfaces in other modes suggested failure with severe strain localization as shown in Part I.
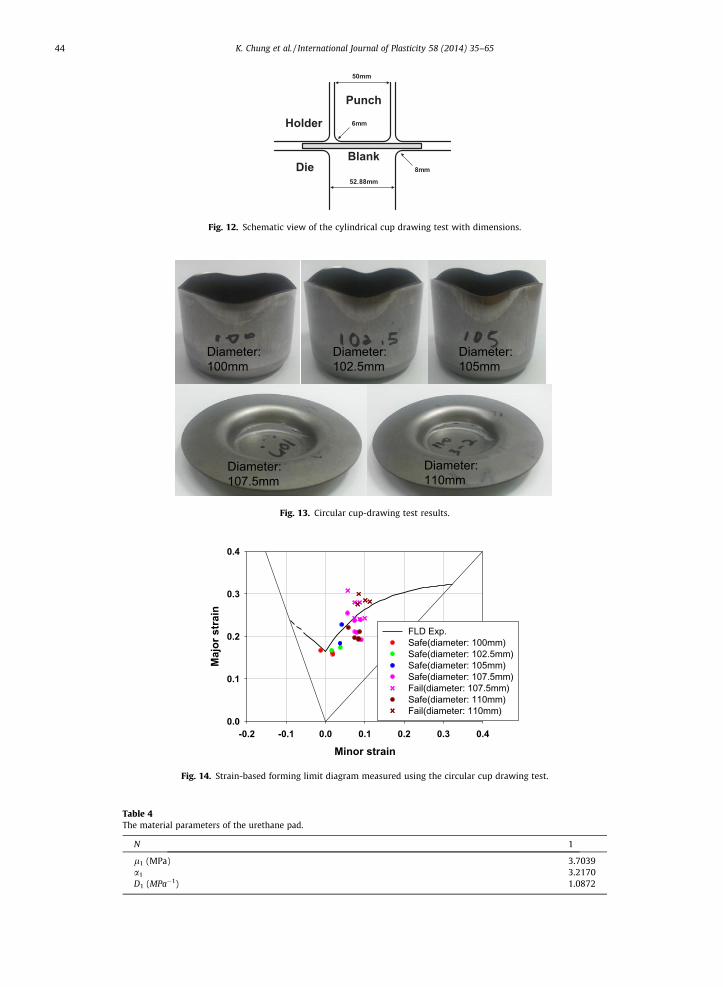
2.5. Circular cup drawing test
In order to measure the forming limit strain, the circular cup drawing test was also performed using the 50 ton doubleaction hydraulic type press as schematically shown in Fig. 12. The punch speed was 25 mm/min and the blank holding forcewas 30 kN. The beef tallow was used as a lubricant to reduce the contact friction between the punch and the blank. Circularspecimens of five diameters from 100 mm to 110 mm with the interval of 2.5 mm were prepared by the wire cutting process,with circular grids of 2.5 mm diameter printed on them. The results of circular cup drawing tests are shown in Fig. 13 andplotted in the strain-based FLD shown in Fig. 14. When the specimen diameters were 107.5 mm and 110 mm, failure withsevere strain localization occurred as shown in Figs. 13 and 14. Note that the solid line plotted in Fig. 14 was the one

(a)
(b)
Normalized yield stress at RD-1.5 -1.0 -0.5 0.0 0.5 1.0 1.5
Nor
mal
ized
yie
ld s
tres
s at
TD
-1.5
-1.0
-0.5
0.0
0.5
1.0
1.5Hill'48 Mises
Loading direction from RD (degree)0 15 30 45 60 75 90
R-v
alue
0.5
0.6
0.7
0.8
0.9
1.0
1.1
1.2
ExperimentsHill'48 Mises
(c) Loading direction from RD (degree)
0 15 30 45 60 75 90
Nor
mal
ized
yie
ld s
tres
s
0.90
0.92
0.94
0.96
0.98
1.00
1.02
1.04
1.06
1.08ExperimentsHill'48Mises
Fig. 8. Comparison of the Hill1948 and von Mises yield functions: (a) the contour (b) R-value (c) normalized yield stress.
K. Chung et al. / International Journal of Plasticity 58 (2014) 35–65 41
obtained from the hemispherical dome stretching test shown in Fig. 11 and it reasonably well complied with the forminglimit measured in the circular cup drawing test as shown in Fig. 14 (therefore, the solid line measured from the hemispher-ical dome stretching test was used as the measured FLD in this work).
(a)
(b)
Punch
Die
Holder
100mm
105mm
200mm
6.35mm
6.35mmBlank Spiral bead
Spiral beadSpiral bead
Spiral bead
128.8mm
128.8mm
105mm
Spiral bead
Fig. 9. Schematic view of the hemispherical dome stretching test with dimensions: (a) tool geometry (b) schematic view of the spiral bead.
42 K. Chung et al. / International Journal of Plasticity 58 (2014) 35–65
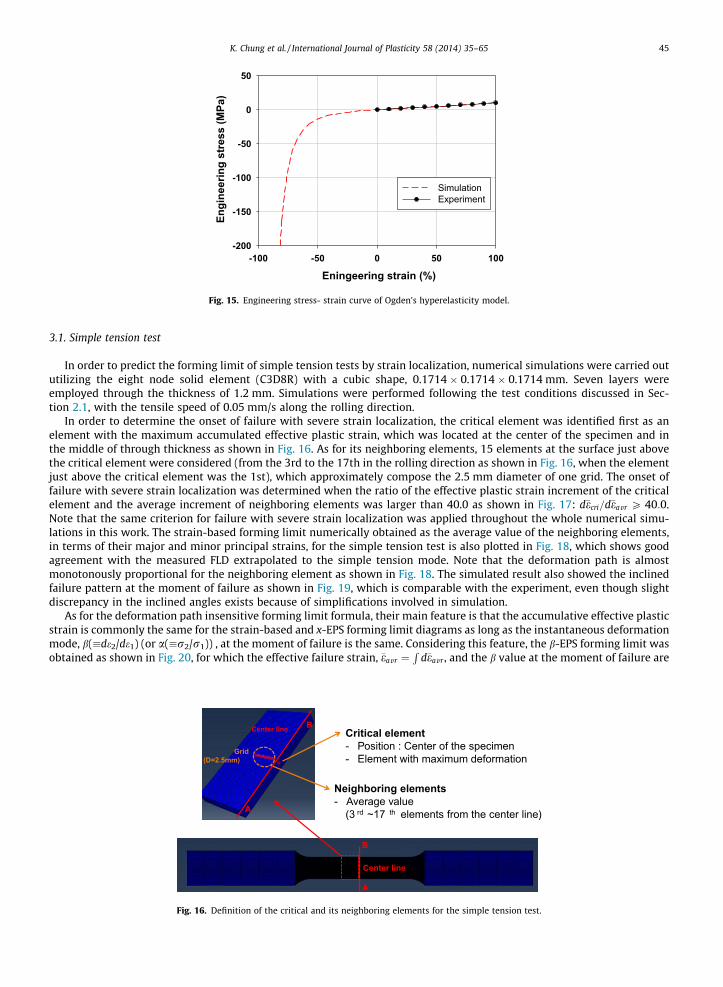
2.6. Material property of the urethane pad
In the hemispherical dome stretching test, the urethane pad (with the thickness of 2.0 mm) was utilized for lubricationbetween the punch and the blank. To describe the rubber like non-linear stress–strain behavior of the pad, Ogden’s isotropichyperelastic material model (Ogden, 1972) was considered in this work, in which the strain energy density is expressed interms of deviatoric principal stretches as
U ¼XN
i¼1
2li
a2i
ð�kai1 þ �kai
2 þ �kai3 � 3Þ þ
XN
i¼1
1DiðJel � 1Þ
2ið6Þ
where �ki are the deviatoric principal stretches and Jel(=detFel where Fel is the elastic deformation gradient) is the elastic vol-ume ratio between the current and the initial under the isothermal condition. Here, li, ai and Di are material parameters andthose values were assumed with N = 1 as listed in Table 4 such that their resulting numerical simulations matched well withexperiments (for the linear slope and Poisson’s ratio in the simple tension as shown in Fig. 15). The simple tension and com-pression behavior based on the assumed parameters are shown in Fig. 15, for which the linear slope = 10 Mpa for the simpletension and Poisson’s ratio, m = 0.49.
3. Numerical analysis
Utilizing the material properties of DP980 and the urethane pad discussed in Section 2, numerical simulations were per-formed here for room temperature forming in order to validate the forming condition independence of the deformation pathinsensitive forming limit criterion to justify its feature as a material property. To carry out such an objective, the strain-based
and b-EPS b � de2de1
� �forming limit diagrams were obtained first by numerically simulating the simple tension and hemispher-
ical dome stretching tests as well as the circular cup drawing test without any pre-strains: Sections 3.1–3.3. Then, the form-ing condition independency was validated by numerically simulating those tests after modifications were added such asintroducing various pre-strains: Sections 3.4–3.9. Throughout this numerical exercise, severe strain localization was evalu-ated and considered as the condition for the forming limit criterion. Validation here is mainly for the case when the majorprincipal directions of deformation and loading (the 1-direction) are aligned with the rolling direction (the x-direction), withthe angle between them, X = 0� more or less. However, as the x-EPS forming limit criteria of the Dorn, Hill and M–K models
R=100mm
R=100mm25mm
R=100mm
R=100mm50mm
R=100mm
R=100mm75mm
R=100mm
R=100mm100mm
R=100mm
R=100mm123mm
R=100mm
R=100mm126mm
R=100mm
R=100mm129mm
R=100mm
R=100mm135mm
R=100mm
R=100mm150mm 200mm
Rolling direction
Fig. 10. Specimen geometry of the hemispherical dome stretching test.
Fig. 11. Strain-based forming limit diagram measured using the hemispherical dome stretching test.
K. Chung et al. / International Journal of Plasticity 58 (2014) 35–65 43
shown in Part I for the current sheet suggested, the effect of the directional difference of the 1-direction, the X effect, mightbe small since the current DP980 sheet is not so severe in its anisotropy.
Punch
Die
Holder
50mm
52.88mm
6mm
8mmBlank
Fig. 12. Schematic view of the cylindrical cup drawing test with dimensions.
Diameter: 100mm
Diameter: 102.5mm
Diameter: 105mm
Diameter: 107.5mm
Diameter: 110mm
Fig. 13. Circular cup-drawing test results.
Minor strain-0.2 -0.1 0.0 0.1 0.2 0.3 0.4
Maj
or s
trai
n
0.0
0.1
0.2
0.3
0.4
FLD Exp.Safe(diameter: 100mm)Safe(diameter: 102.5mm)Safe(diameter: 105mm)Safe(diameter: 107.5mm)Fail(diameter: 107.5mm)Safe(diameter: 110mm)Fail(diameter: 110mm)
Fig. 14. Strain-based forming limit diagram measured using the circular cup drawing test.
Table 4The material parameters of the urethane pad.
N 1
l1 (MPa) 3.7039a1 3.2170D1 (MPa�1) 1.0872
44 K. Chung et al. / International Journal of Plasticity 58 (2014) 35–65
Eningeering strain (%)-100 -50 0 50 100
Engi
neer
ing
stre
ss (M
Pa)
-200
-150
-100
-50
0
50
SimulationExperiment
Fig. 15. Engineering stress- strain curve of Ogden’s hyperelasticity model.
K. Chung et al. / International Journal of Plasticity 58 (2014) 35–65 45
3.1. Simple tension test
In order to predict the forming limit of simple tension tests by strain localization, numerical simulations were carried oututilizing the eight node solid element (C3D8R) with a cubic shape, 0.1714 � 0.1714 � 0.1714 mm. Seven layers wereemployed through the thickness of 1.2 mm. Simulations were performed following the test conditions discussed in Sec-tion 2.1, with the tensile speed of 0.05 mm/s along the rolling direction.
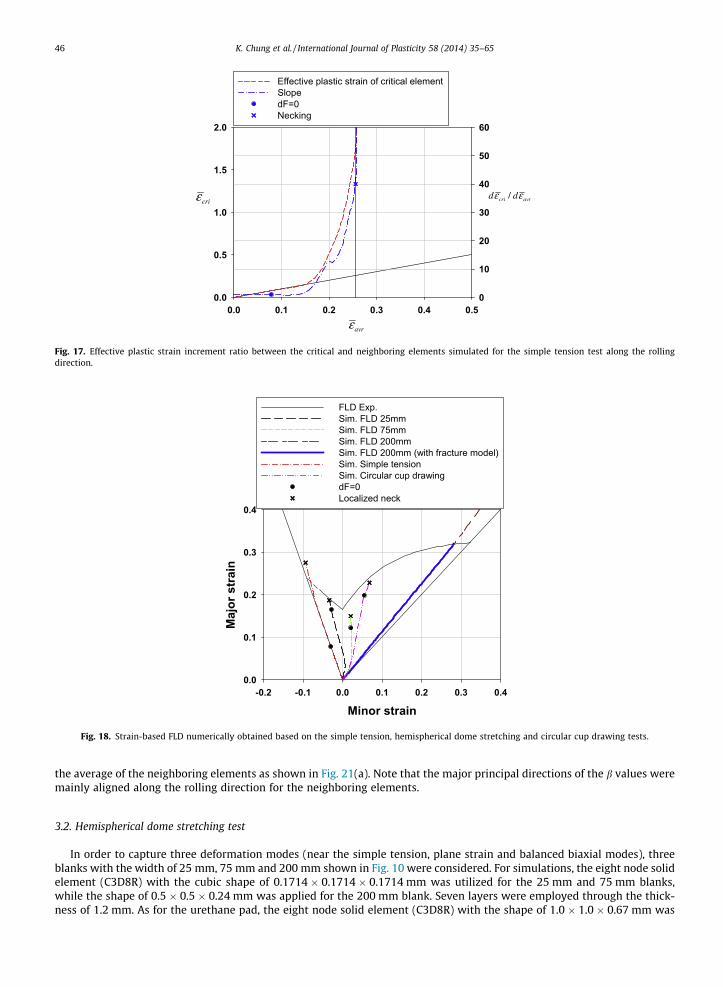
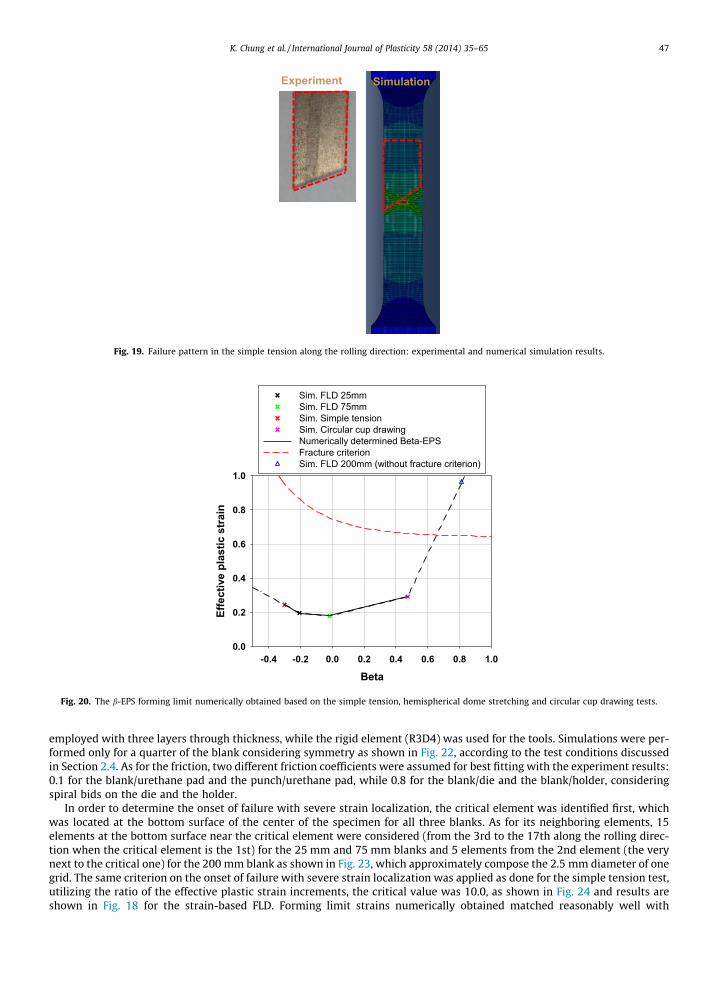
In order to determine the onset of failure with severe strain localization, the critical element was identified first as anelement with the maximum accumulated effective plastic strain, which was located at the center of the specimen and inthe middle of through thickness as shown in Fig. 16. As for its neighboring elements, 15 elements at the surface just abovethe critical element were considered (from the 3rd to the 17th in the rolling direction as shown in Fig. 16, when the elementjust above the critical element was the 1st), which approximately compose the 2.5 mm diameter of one grid. The onset offailure with severe strain localization was determined when the ratio of the effective plastic strain increment of the criticalelement and the average increment of neighboring elements was larger than 40.0 as shown in Fig. 17: d�ecri=d�eavr P 40:0.Note that the same criterion for failure with severe strain localization was applied throughout the whole numerical simu-lations in this work. The strain-based forming limit numerically obtained as the average value of the neighboring elements,in terms of their major and minor principal strains, for the simple tension test is also plotted in Fig. 18, which shows goodagreement with the measured FLD extrapolated to the simple tension mode. Note that the deformation path is almostmonotonously proportional for the neighboring element as shown in Fig. 18. The simulated result also showed the inclinedfailure pattern at the moment of failure as shown in Fig. 19, which is comparable with the experiment, even though slightdiscrepancy in the inclined angles exists because of simplifications involved in simulation.
As for the deformation path insensitive forming limit formula, their main feature is that the accumulative effective plasticstrain is commonly the same for the strain-based and x-EPS forming limit diagrams as long as the instantaneous deformationmode, b(�de2/de1) (or a(�r2/r1)) , at the moment of failure is the same. Considering this feature, the b-EPS forming limit wasobtained as shown in Fig. 20, for which the effective failure strain, �eavr ¼
Rd�eavr , and the b value at the moment of failure are
Critical element- Position : Center of the specimen- Element with maximum deformation
Neighboring elements- Average value
(3 rd ~17 th elements from the center line)
Center line
A
B
A
BCenter line
Grid(D=2.5mm)
Fig. 16. Definition of the critical and its neighboring elements for the simple tension test.
0.0 0.1 0.2 0.3 0.4 0.50.0
0.5
1.0
1.5
2.0
0
10
20
30
40
50
60
Effective plastic strain of critical elementSlopedF=0Necking
criε
avrε
/cri avrd dε ε
Fig. 17. Effective plastic strain increment ratio between the critical and neighboring elements simulated for the simple tension test along the rollingdirection.
Minor strain-0.2 -0.1 0.0 0.1 0.2 0.3 0.4
Maj
or s
trai
n
0.0
0.1
0.2
0.3
0.4
FLD Exp.Sim. FLD 25mmSim. FLD 75mmSim. FLD 200mmSim. FLD 200mm (with fracture model)Sim. Simple tensionSim. Circular cup drawingdF=0Localized neck
Fig. 18. Strain-based FLD numerically obtained based on the simple tension, hemispherical dome stretching and circular cup drawing tests.
46 K. Chung et al. / International Journal of Plasticity 58 (2014) 35–65
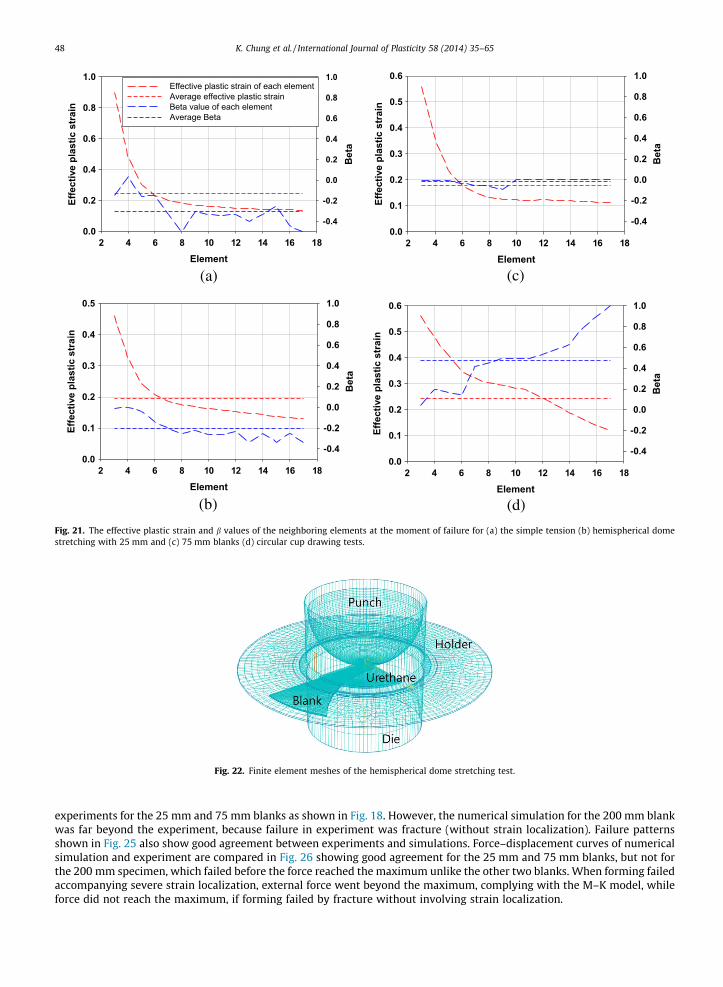
the average of the neighboring elements as shown in Fig. 21(a). Note that the major principal directions of the b values weremainly aligned along the rolling direction for the neighboring elements.
3.2. Hemispherical dome stretching test
In order to capture three deformation modes (near the simple tension, plane strain and balanced biaxial modes), threeblanks with the width of 25 mm, 75 mm and 200 mm shown in Fig. 10 were considered. For simulations, the eight node solidelement (C3D8R) with the cubic shape of 0.1714 � 0.1714 � 0.1714 mm was utilized for the 25 mm and 75 mm blanks,while the shape of 0.5 � 0.5 � 0.24 mm was applied for the 200 mm blank. Seven layers were employed through the thick-ness of 1.2 mm. As for the urethane pad, the eight node solid element (C3D8R) with the shape of 1.0 � 1.0 � 0.67 mm was
SimulationExperiment
Fig. 19. Failure pattern in the simple tension along the rolling direction: experimental and numerical simulation results.
Beta-0.4 -0.2 0.0 0.2 0.4 0.6 0.8 1.0
Effe
ctiv
e pl
astic
str
ain
0.0
0.2
0.4
0.6
0.8
1.0
Sim. FLD 25mmSim. FLD 75mmSim. Simple tensionSim. Circular cup drawingNumerically determined Beta-EPSFracture criterionSim. FLD 200mm (without fracture criterion)
Fig. 20. The b-EPS forming limit numerically obtained based on the simple tension, hemispherical dome stretching and circular cup drawing tests.
K. Chung et al. / International Journal of Plasticity 58 (2014) 35–65 47
employed with three layers through thickness, while the rigid element (R3D4) was used for the tools. Simulations were per-formed only for a quarter of the blank considering symmetry as shown in Fig. 22, according to the test conditions discussedin Section 2.4. As for the friction, two different friction coefficients were assumed for best fitting with the experiment results:0.1 for the blank/urethane pad and the punch/urethane pad, while 0.8 for the blank/die and the blank/holder, consideringspiral bids on the die and the holder.
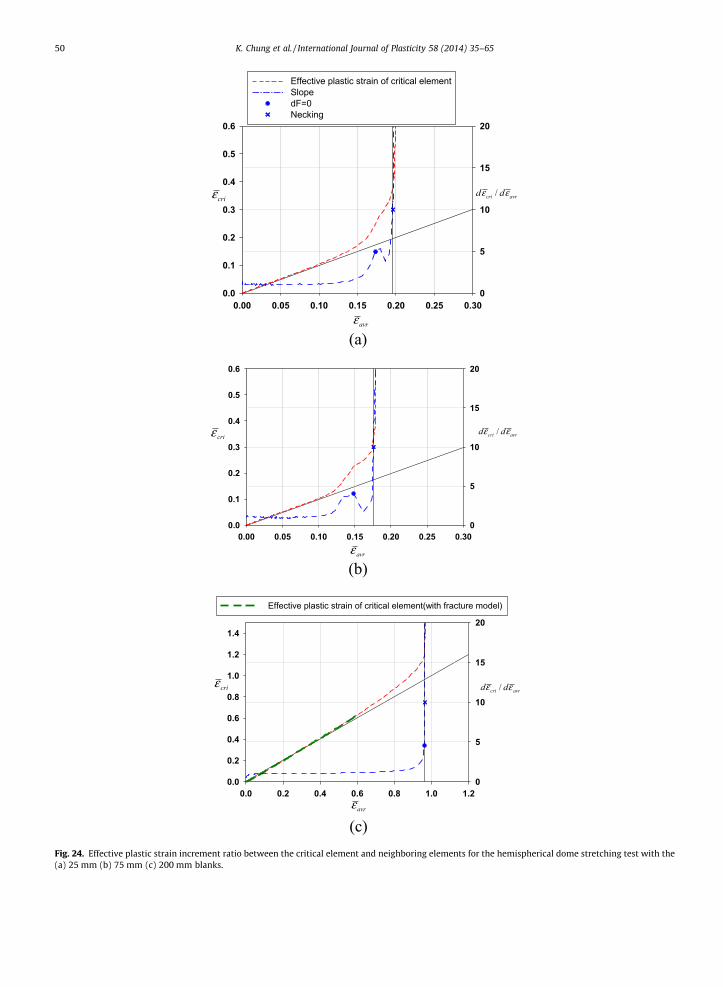
In order to determine the onset of failure with severe strain localization, the critical element was identified first, whichwas located at the bottom surface of the center of the specimen for all three blanks. As for its neighboring elements, 15elements at the bottom surface near the critical element were considered (from the 3rd to the 17th along the rolling direc-tion when the critical element is the 1st) for the 25 mm and 75 mm blanks and 5 elements from the 2nd element (the verynext to the critical one) for the 200 mm blank as shown in Fig. 23, which approximately compose the 2.5 mm diameter of onegrid. The same criterion on the onset of failure with severe strain localization was applied as done for the simple tension test,utilizing the ratio of the effective plastic strain increments, the critical value was 10.0, as shown in Fig. 24 and results areshown in Fig. 18 for the strain-based FLD. Forming limit strains numerically obtained matched reasonably well with
(a)
(b)
Element2 4 6 8 10 12 14 16 18
Effe
ctiv
e pl
astic
str
ain
0.0
0.2
0.4
0.6
0.8
1.0
Bet
a
-0.4
-0.2
0.0
0.2
0.4
0.6
0.8
1.0Effective plastic strain of each elementAverage effective plastic strainBeta value of each elementAverage Beta
Element2 4 6 8 10 12 14 16 18
Effe
ctiv
e pl
astic
str
ain
0.0
0.1
0.2
0.3
0.4
0.5
Bet
a
-0.4
-0.2
0.0
0.2
0.4
0.6
0.8
1.0
(c)Element
2 4 6 8 10 12 14 16 18
Effe
ctiv
e pl
astic
str
ain
0.0
0.1
0.2
0.3
0.4
0.5
0.6
Bet
a
-0.4
-0.2
0.0
0.2
0.4
0.6
0.8
1.0
(d)Element
2 4 6 8 10 12 14 16 18
Effe
ctiv
e pl
astic
str
ain
0.0
0.1
0.2
0.3
0.4
0.5
0.6
Bet
a
-0.4
-0.2
0.0
0.2
0.4
0.6
0.8
1.0
Fig. 21. The effective plastic strain and b values of the neighboring elements at the moment of failure for (a) the simple tension (b) hemispherical domestretching with 25 mm and (c) 75 mm blanks (d) circular cup drawing tests.
Fig. 22. Finite element meshes of the hemispherical dome stretching test.
48 K. Chung et al. / International Journal of Plasticity 58 (2014) 35–65
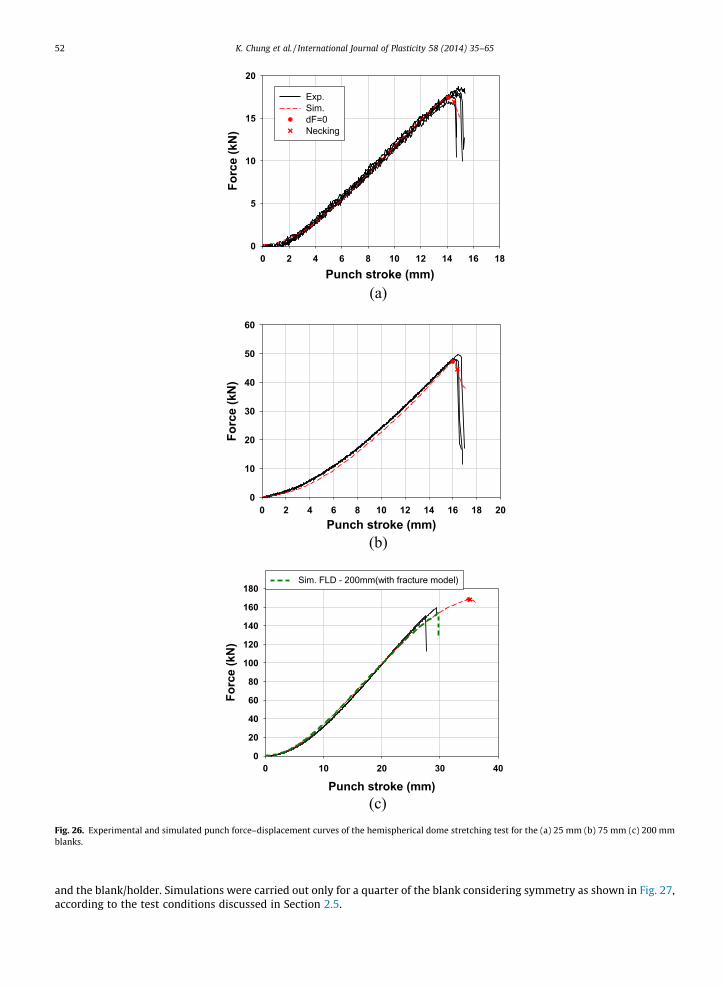
experiments for the 25 mm and 75 mm blanks as shown in Fig. 18. However, the numerical simulation for the 200 mm blankwas far beyond the experiment, because failure in experiment was fracture (without strain localization). Failure patternsshown in Fig. 25 also show good agreement between experiments and simulations. Force–displacement curves of numericalsimulation and experiment are compared in Fig. 26 showing good agreement for the 25 mm and 75 mm blanks, but not forthe 200 mm specimen, which failed before the force reached the maximum unlike the other two blanks. When forming failedaccompanying severe strain localization, external force went beyond the maximum, complying with the M–K model, whileforce did not reach the maximum, if forming failed by fracture without involving strain localization.
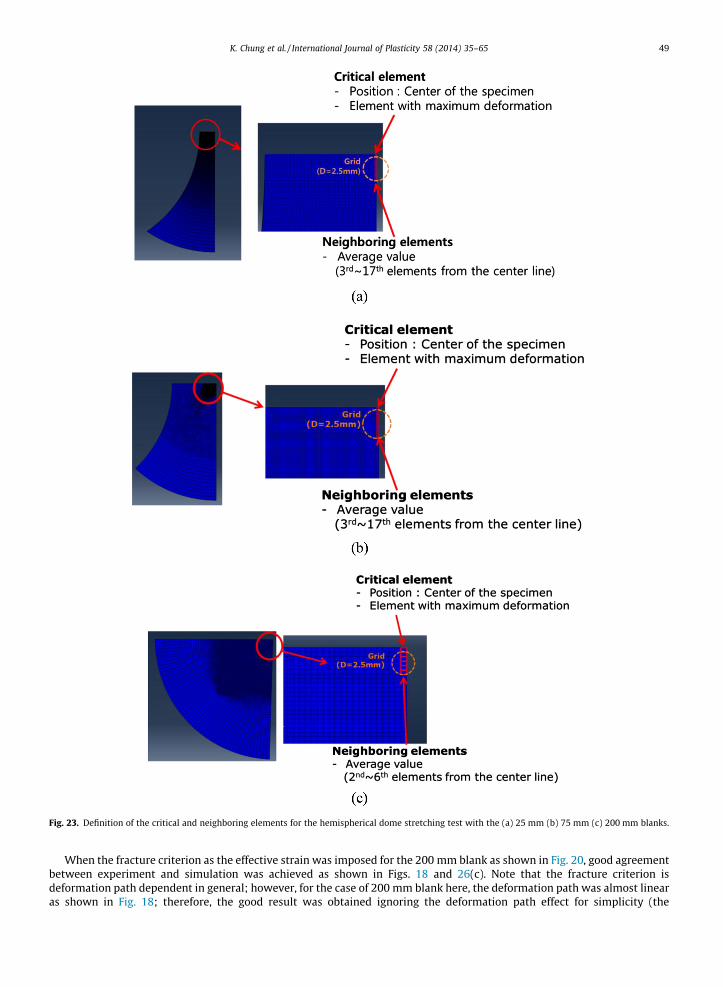
Fig. 23. Definition of the critical and neighboring elements for the hemispherical dome stretching test with the (a) 25 mm (b) 75 mm (c) 200 mm blanks.
K. Chung et al. / International Journal of Plasticity 58 (2014) 35–65 49
When the fracture criterion as the effective strain was imposed for the 200 mm blank as shown in Fig. 20, good agreementbetween experiment and simulation was achieved as shown in Figs. 18 and 26(c). Note that the fracture criterion isdeformation path dependent in general; however, for the case of 200 mm blank here, the deformation path was almost linearas shown in Fig. 18; therefore, the good result was obtained ignoring the deformation path effect for simplicity (the
(a)
(b)
0.00 0.05 0.10 0.15 0.20 0.25 0.300.0
0.1
0.2
0.3
0.4
0.5
0.6
0
5
10
15
20
Effective plastic strain of critical elementSlopedF=0Necking
criε
avrε
/cri avrd d
0.00 0.05 0.10 0.15 0.20 0.25 0.300.0
0.1
0.2
0.3
0.4
0.5
0.6
0
5
10
15
20
cri
avr
/cri avrd d
(c)
0.0 0.2 0.4 0.6 0.8 1.0 1.20.0
0.2
0.4
0.6
0.8
1.0
1.2
1.4
0
5
10
15
20
Effective plastic strain of critical element(with fracture model)
cri
avr
/cri avrd d
ε
ε
ε ε
εε
εε
ε
ε
Fig. 24. Effective plastic strain increment ratio between the critical element and neighboring elements for the hemispherical dome stretching test with the(a) 25 mm (b) 75 mm (c) 200 mm blanks.
50 K. Chung et al. / International Journal of Plasticity 58 (2014) 35–65
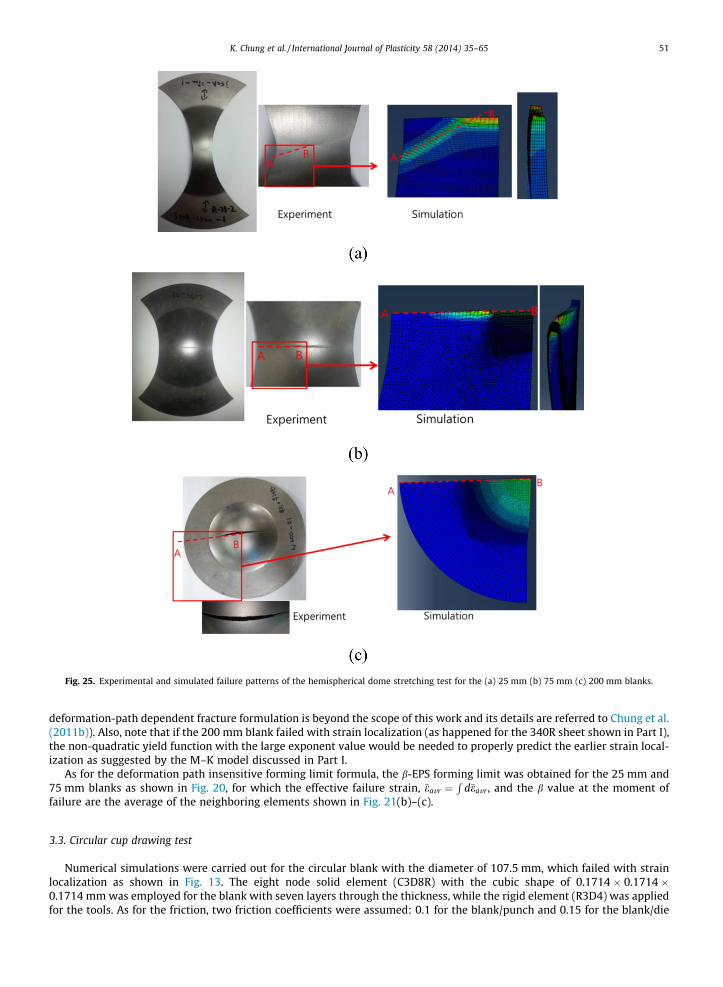
Fig. 25. Experimental and simulated failure patterns of the hemispherical dome stretching test for the (a) 25 mm (b) 75 mm (c) 200 mm blanks.
K. Chung et al. / International Journal of Plasticity 58 (2014) 35–65 51
deformation-path dependent fracture formulation is beyond the scope of this work and its details are referred to Chung et al.(2011b)). Also, note that if the 200 mm blank failed with strain localization (as happened for the 340R sheet shown in Part I),the non-quadratic yield function with the large exponent value would be needed to properly predict the earlier strain local-ization as suggested by the M–K model discussed in Part I.
As for the deformation path insensitive forming limit formula, the b-EPS forming limit was obtained for the 25 mm and75 mm blanks as shown in Fig. 20, for which the effective failure strain, �eavr ¼
Rd�eavr , and the b value at the moment of
failure are the average of the neighboring elements shown in Fig. 21(b)–(c).
3.3. Circular cup drawing test
Numerical simulations were carried out for the circular blank with the diameter of 107.5 mm, which failed with strainlocalization as shown in Fig. 13. The eight node solid element (C3D8R) with the cubic shape of 0.1714 � 0.1714 �0.1714 mm was employed for the blank with seven layers through the thickness, while the rigid element (R3D4) was appliedfor the tools. As for the friction, two friction coefficients were assumed: 0.1 for the blank/punch and 0.15 for the blank/die
(a)
(b)
Punch stroke (mm)0 2 4 6 8 10 12 14 16 18
Forc
e (k
N)
0
5
10
15
20
Exp.Sim. dF=0Necking
Punch stroke (mm)0 2 4 6 8 10 12 14 16 18 20
Forc
e (k
N)
0
10
20
30
40
50
60
(c) Punch stroke (mm)
0 10 20 30 40
Forc
e (k
N)
0
20
40
60
80
100
120
140
160
180Sim. FLD - 200mm(with fracture model)
Fig. 26. Experimental and simulated punch force–displacement curves of the hemispherical dome stretching test for the (a) 25 mm (b) 75 mm (c) 200 mmblanks.
52 K. Chung et al. / International Journal of Plasticity 58 (2014) 35–65
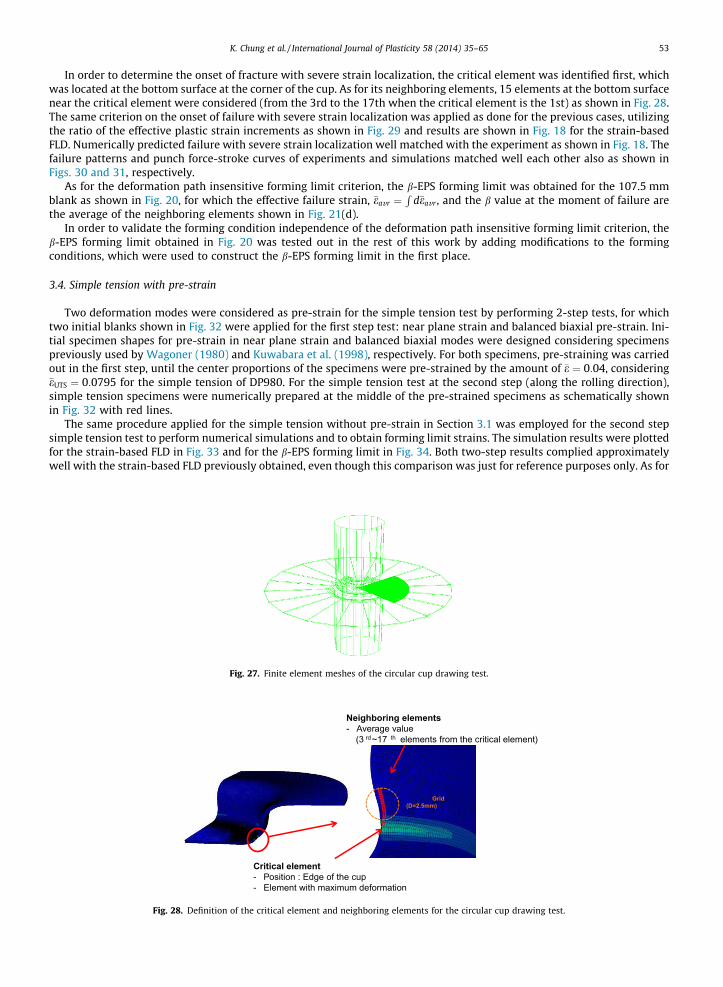
and the blank/holder. Simulations were carried out only for a quarter of the blank considering symmetry as shown in Fig. 27,according to the test conditions discussed in Section 2.5.
K. Chung et al. / International Journal of Plasticity 58 (2014) 35–65 53
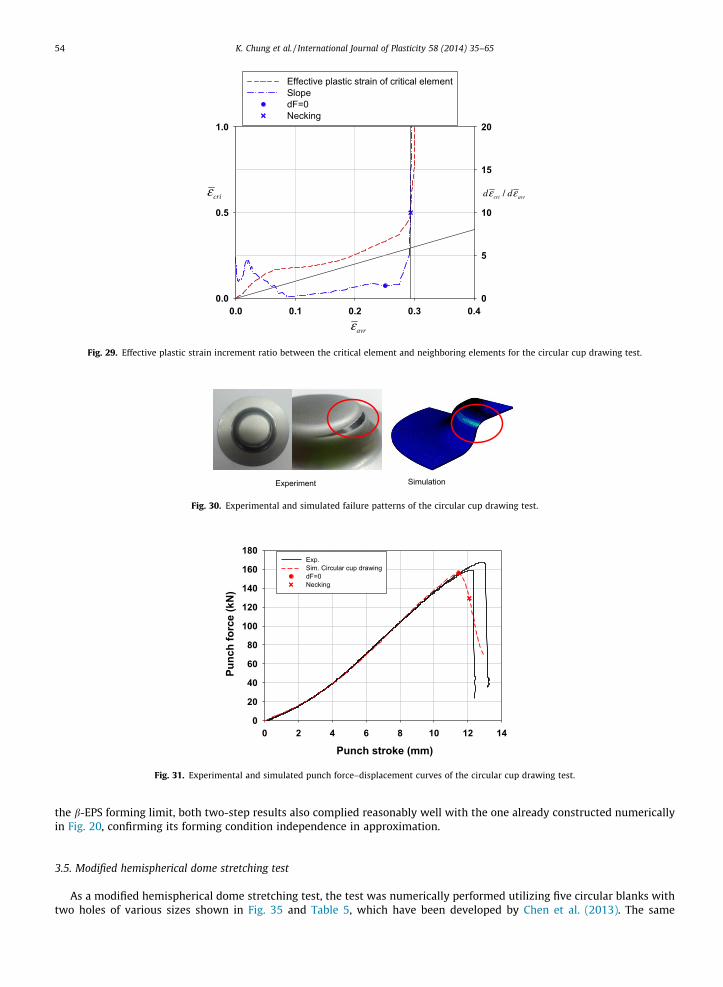
In order to determine the onset of fracture with severe strain localization, the critical element was identified first, whichwas located at the bottom surface at the corner of the cup. As for its neighboring elements, 15 elements at the bottom surfacenear the critical element were considered (from the 3rd to the 17th when the critical element is the 1st) as shown in Fig. 28.The same criterion on the onset of failure with severe strain localization was applied as done for the previous cases, utilizingthe ratio of the effective plastic strain increments as shown in Fig. 29 and results are shown in Fig. 18 for the strain-basedFLD. Numerically predicted failure with severe strain localization well matched with the experiment as shown in Fig. 18. Thefailure patterns and punch force-stroke curves of experiments and simulations matched well each other also as shown inFigs. 30 and 31, respectively.
As for the deformation path insensitive forming limit criterion, the b-EPS forming limit was obtained for the 107.5 mmblank as shown in Fig. 20, for which the effective failure strain, �eavr ¼
Rd�eavr , and the b value at the moment of failure are
the average of the neighboring elements shown in Fig. 21(d).In order to validate the forming condition independence of the deformation path insensitive forming limit criterion, the
b-EPS forming limit obtained in Fig. 20 was tested out in the rest of this work by adding modifications to the formingconditions, which were used to construct the b-EPS forming limit in the first place.
3.4. Simple tension with pre-strain
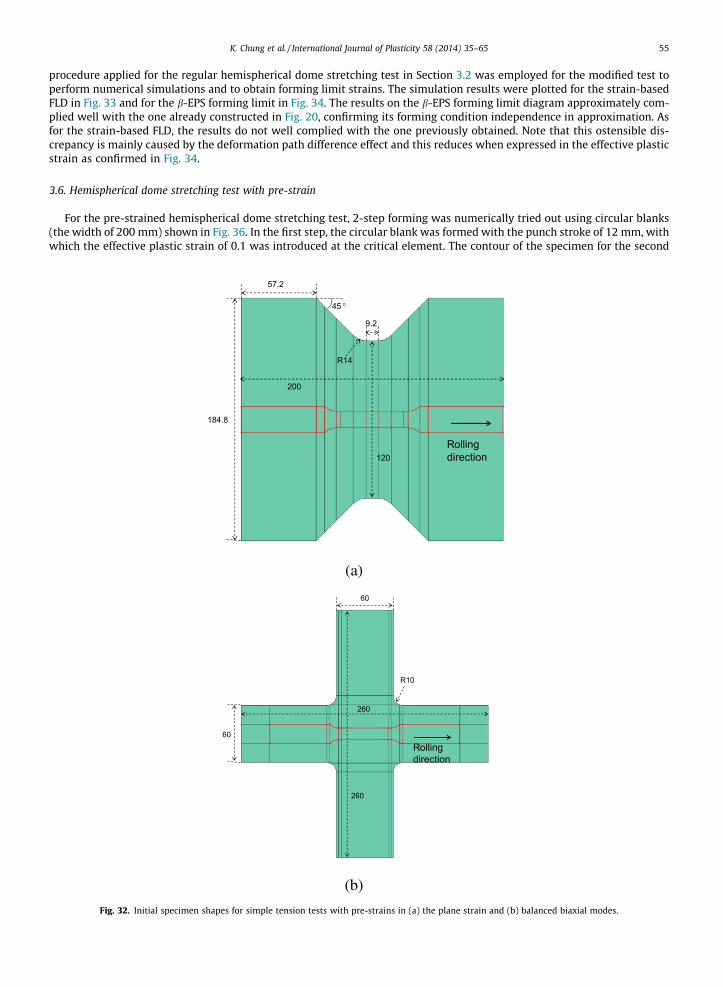
Two deformation modes were considered as pre-strain for the simple tension test by performing 2-step tests, for whichtwo initial blanks shown in Fig. 32 were applied for the first step test: near plane strain and balanced biaxial pre-strain. Ini-tial specimen shapes for pre-strain in near plane strain and balanced biaxial modes were designed considering specimenspreviously used by Wagoner (1980) and Kuwabara et al. (1998), respectively. For both specimens, pre-straining was carriedout in the first step, until the center proportions of the specimens were pre-strained by the amount of �e ¼ 0:04, considering�eUTS ¼ 0:0795 for the simple tension of DP980. For the simple tension test at the second step (along the rolling direction),simple tension specimens were numerically prepared at the middle of the pre-strained specimens as schematically shownin Fig. 32 with red lines.
The same procedure applied for the simple tension without pre-strain in Section 3.1 was employed for the second stepsimple tension test to perform numerical simulations and to obtain forming limit strains. The simulation results were plottedfor the strain-based FLD in Fig. 33 and for the b-EPS forming limit in Fig. 34. Both two-step results complied approximatelywell with the strain-based FLD previously obtained, even though this comparison was just for reference purposes only. As for
Fig. 27. Finite element meshes of the circular cup drawing test.
Critical element- Position : Edge of the cup- Element with maximum deformation
Neighboring elements- Average value
(3 rd~17 th elements from the critical element)
Grid(D=2.5mm)
Fig. 28. Definition of the critical element and neighboring elements for the circular cup drawing test.
0.0 0.1 0.2 0.3 0.40.0
0.5
1.0
0
5
10
15
20
Effective plastic strain of critical elementSlopedF=0Necking
criε
avrε
/cri avrd dε ε
Fig. 29. Effective plastic strain increment ratio between the critical element and neighboring elements for the circular cup drawing test.
Experiment Simulation
Fig. 30. Experimental and simulated failure patterns of the circular cup drawing test.
Punch stroke (mm)0 2 4 6 8 10 12 14
Punc
h fo
rce
(kN
)
0
20
40
60
80
100
120
140
160
180Exp.Sim. Circular cup drawingdF=0Necking
Fig. 31. Experimental and simulated punch force–displacement curves of the circular cup drawing test.
54 K. Chung et al. / International Journal of Plasticity 58 (2014) 35–65
the b-EPS forming limit, both two-step results also complied reasonably well with the one already constructed numericallyin Fig. 20, confirming its forming condition independence in approximation.
3.5. Modified hemispherical dome stretching test
As a modified hemispherical dome stretching test, the test was numerically performed utilizing five circular blanks withtwo holes of various sizes shown in Fig. 35 and Table 5, which have been developed by Chen et al. (2013). The same
K. Chung et al. / International Journal of Plasticity 58 (2014) 35–65 55
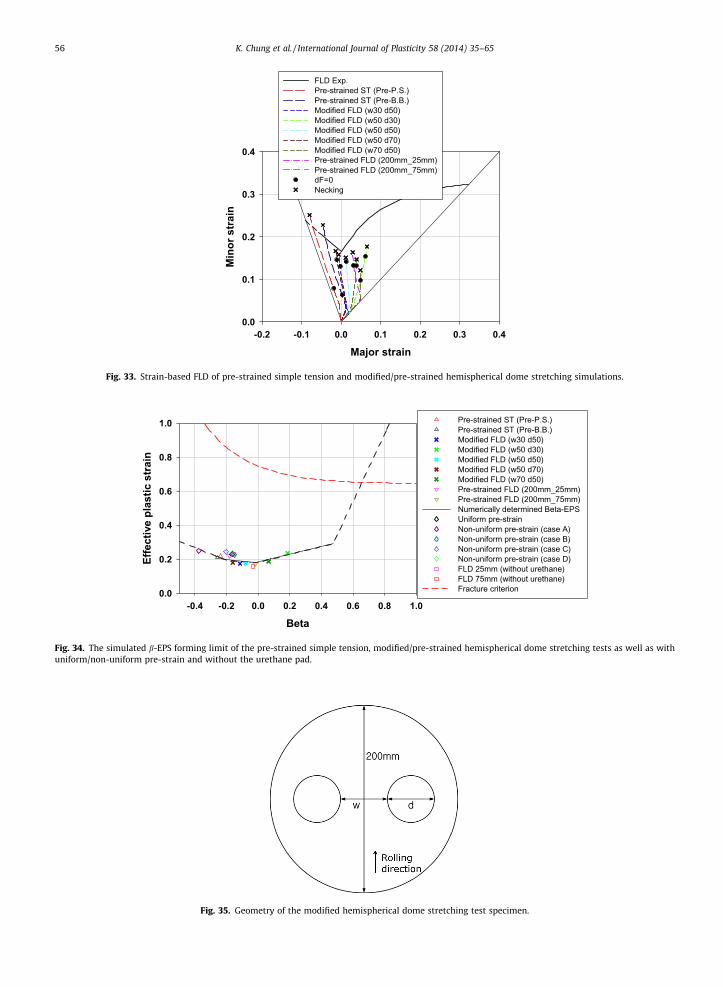
procedure applied for the regular hemispherical dome stretching test in Section 3.2 was employed for the modified test toperform numerical simulations and to obtain forming limit strains. The simulation results were plotted for the strain-basedFLD in Fig. 33 and for the b-EPS forming limit in Fig. 34. The results on the b-EPS forming limit diagram approximately com-plied well with the one already constructed in Fig. 20, confirming its forming condition independence in approximation. Asfor the strain-based FLD, the results do not well complied with the one previously obtained. Note that this ostensible dis-crepancy is mainly caused by the deformation path difference effect and this reduces when expressed in the effective plasticstrain as confirmed in Fig. 34.
3.6. Hemispherical dome stretching test with pre-strain
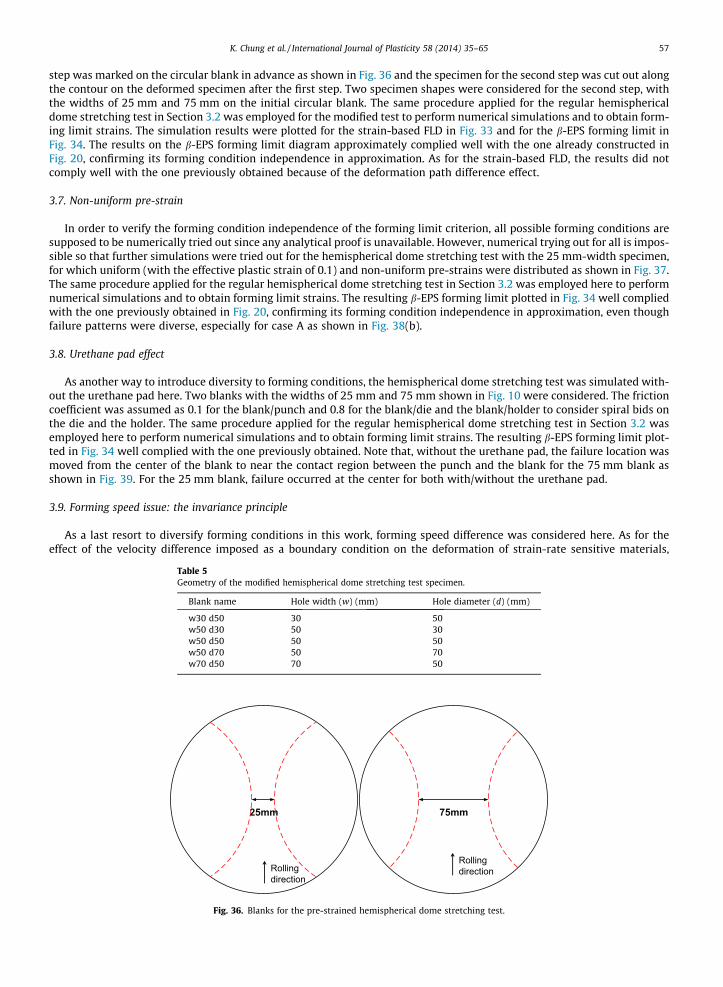
For the pre-strained hemispherical dome stretching test, 2-step forming was numerically tried out using circular blanks(the width of 200 mm) shown in Fig. 36. In the first step, the circular blank was formed with the punch stroke of 12 mm, withwhich the effective plastic strain of 0.1 was introduced at the critical element. The contour of the specimen for the second
(a)
(b)
9.2
200
184.8
R14
57.2
120
45 °
Rolling direction
260
R10
260
60
60
Rolling direction
Fig. 32. Initial specimen shapes for simple tension tests with pre-strains in (a) the plane strain and (b) balanced biaxial modes.
Major strain-0.2 -0.1 0.0 0.1 0.2 0.3 0.4
Min
or s
trai
n
0.0
0.1
0.2
0.3
0.4
FLD Exp.Pre-strained ST (Pre-P.S.)Pre-strained ST (Pre-B.B.)Modified FLD (w30 d50)Modified FLD (w50 d30)Modified FLD (w50 d50)Modified FLD (w50 d70)Modified FLD (w70 d50)Pre-strained FLD (200mm_25mm)Pre-strained FLD (200mm_75mm)dF=0Necking
Fig. 33. Strain-based FLD of pre-strained simple tension and modified/pre-strained hemispherical dome stretching simulations.
Beta-0.4 -0.2 0.0 0.2 0.4 0.6 0.8 1.0
Effe
ctiv
e pl
astic
stra
in
0.0
0.2
0.4
0.6
0.8
1.0 Pre-strained ST (Pre-P.S.)Pre-strained ST (Pre-B.B.)Modified FLD (w30 d50)Modified FLD (w50 d30)Modified FLD (w50 d50)Modified FLD (w50 d70)Modified FLD (w70 d50)Pre-strained FLD (200mm_25mm) Pre-strained FLD (200mm_75mm)Numerically determined Beta-EPSUniform pre-strainNon-uniform pre-strain (case A)Non-uniform pre-strain (case B)Non-uniform pre-strain (case C)Non-uniform pre-strain (case D)FLD 25mm (without urethane)FLD 75mm (without urethane)Fracture criterion
Fig. 34. The simulated b-EPS forming limit of the pre-strained simple tension, modified/pre-strained hemispherical dome stretching tests as well as withuniform/non-uniform pre-strain and without the urethane pad.
Fig. 35. Geometry of the modified hemispherical dome stretching test specimen.
56 K. Chung et al. / International Journal of Plasticity 58 (2014) 35–65
K. Chung et al. / International Journal of Plasticity 58 (2014) 35–65 57
step was marked on the circular blank in advance as shown in Fig. 36 and the specimen for the second step was cut out alongthe contour on the deformed specimen after the first step. Two specimen shapes were considered for the second step, withthe widths of 25 mm and 75 mm on the initial circular blank. The same procedure applied for the regular hemisphericaldome stretching test in Section 3.2 was employed for the modified test to perform numerical simulations and to obtain form-ing limit strains. The simulation results were plotted for the strain-based FLD in Fig. 33 and for the b-EPS forming limit inFig. 34. The results on the b-EPS forming limit diagram approximately complied well with the one already constructed inFig. 20, confirming its forming condition independence in approximation. As for the strain-based FLD, the results did notcomply well with the one previously obtained because of the deformation path difference effect.
3.7. Non-uniform pre-strain
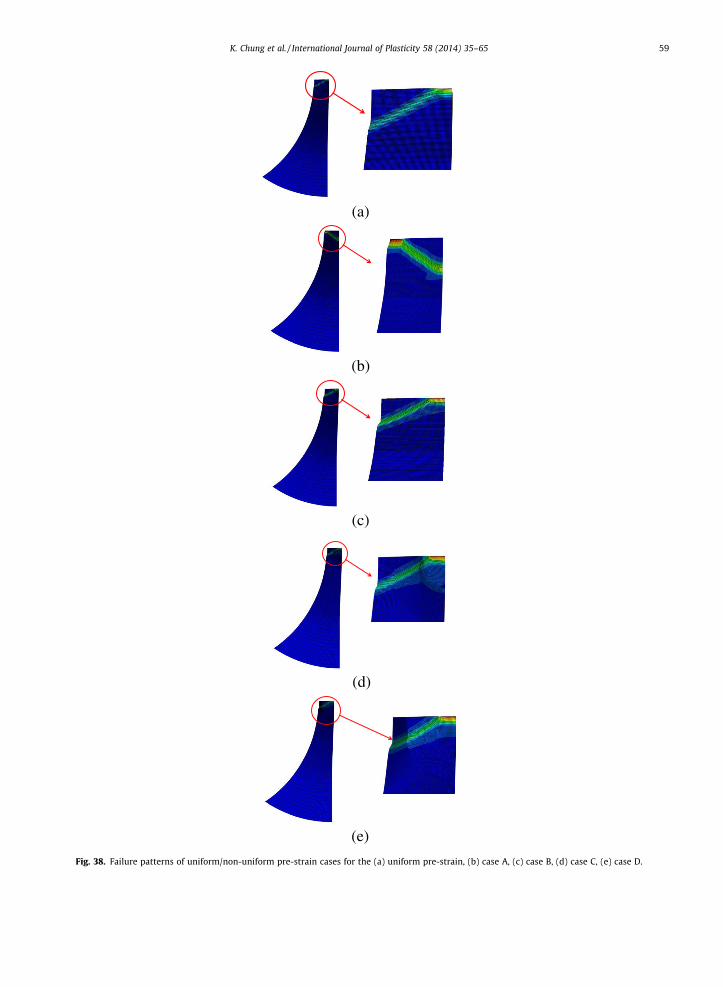
In order to verify the forming condition independence of the forming limit criterion, all possible forming conditions aresupposed to be numerically tried out since any analytical proof is unavailable. However, numerical trying out for all is impos-sible so that further simulations were tried out for the hemispherical dome stretching test with the 25 mm-width specimen,for which uniform (with the effective plastic strain of 0.1) and non-uniform pre-strains were distributed as shown in Fig. 37.The same procedure applied for the regular hemispherical dome stretching test in Section 3.2 was employed here to performnumerical simulations and to obtain forming limit strains. The resulting b-EPS forming limit plotted in Fig. 34 well compliedwith the one previously obtained in Fig. 20, confirming its forming condition independence in approximation, even thoughfailure patterns were diverse, especially for case A as shown in Fig. 38(b).
3.8. Urethane pad effect
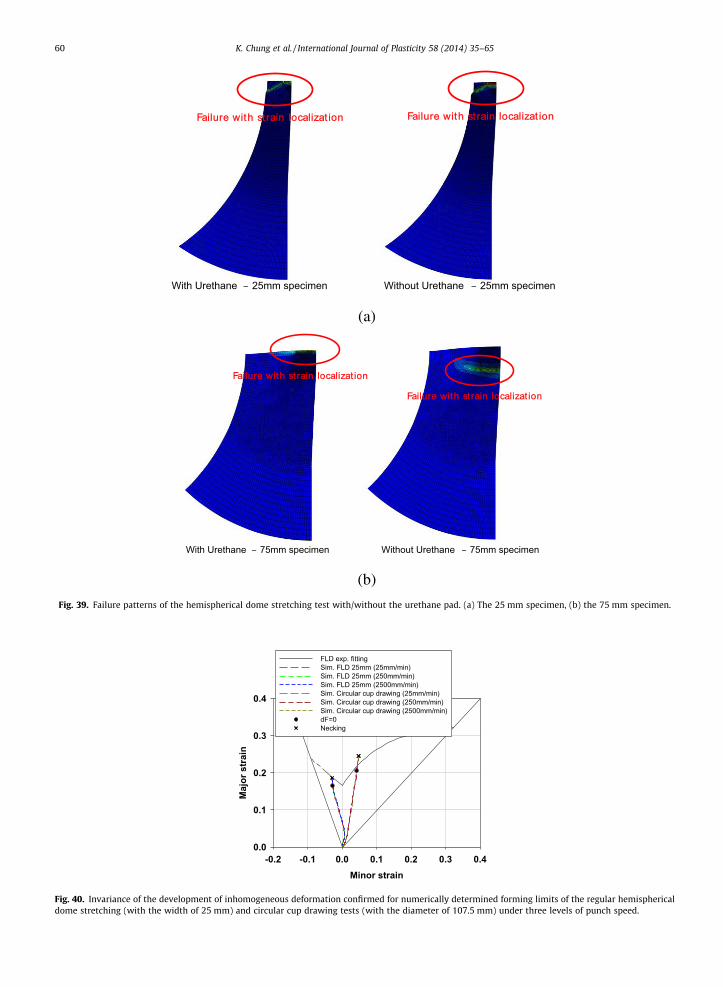
As another way to introduce diversity to forming conditions, the hemispherical dome stretching test was simulated with-out the urethane pad here. Two blanks with the widths of 25 mm and 75 mm shown in Fig. 10 were considered. The frictioncoefficient was assumed as 0.1 for the blank/punch and 0.8 for the blank/die and the blank/holder to consider spiral bids onthe die and the holder. The same procedure applied for the regular hemispherical dome stretching test in Section 3.2 wasemployed here to perform numerical simulations and to obtain forming limit strains. The resulting b-EPS forming limit plot-ted in Fig. 34 well complied with the one previously obtained. Note that, without the urethane pad, the failure location wasmoved from the center of the blank to near the contact region between the punch and the blank for the 75 mm blank asshown in Fig. 39. For the 25 mm blank, failure occurred at the center for both with/without the urethane pad.
3.9. Forming speed issue: the invariance principle
As a last resort to diversify forming conditions in this work, forming speed difference was considered here. As for theeffect of the velocity difference imposed as a boundary condition on the deformation of strain-rate sensitive materials,
Table 5Geometry of the modified hemispherical dome stretching test specimen.
Blank name Hole width (w) (mm) Hole diameter (d) (mm)
w30 d50 30 50w50 d30 50 30w50 d50 50 50w50 d70 50 70w70 d50 70 50
25mm
Rolling direction
75mm
Rolling direction
Fig. 36. Blanks for the pre-strained hemispherical dome stretching test.

58 K. Chung et al. / International Journal of Plasticity 58 (2014) 35–65
Chung and Wagoner (1986, 1998) have developed the invariance principle: even though a material is strain rate and tem-perature sensitive, if their sensitivity is homogenous, the boundary velocity condition difference does not affect the in-homo-geneity of the strain distribution development, if the traction condition is free and the Coulomb friction is assumed (refer toAppendix in Part I for the summary of the invariance principle). Most of common room temperature stretching/drawingsheet metal forming processes satisfies the conditions of the invariance principle. For demonstration purposes, simulations
(a)
(b)
(c)
(d)
5mm(Pre-strain: 0.1)
5mm(Pre-strain: 0.05)
5mm(Pre-strain: 0.01)
Remained region
(Pre-strain: 0)
10mm(Pre-strain: 0.1)
10mm(Pre-strain: 0.05)
10mm(Pre-strain: 0.01)
Remained region
(Pre-strain: 0)
Radius: 5mm(Pre-strain: 0.1)
Radius: 10mm(Pre-strain: 0.05)
Radius: 15mm(Pre-strain: 0.01)
Remained region
(Pre-strain: 0)
Radius: 10mm(Pre-strain: 0.1)
Radius: 20mm(Pre-strain: 0.05)
Radius: 30mm(Pre-strain: 0.01)
Remained region
(Pre-strain: 0)
Fig. 37. Four non-uniform pre-strain distributions for the (a) case A, (b) case B, (c) case C, (d) case D.
(a)
(b)
(c)
(d)
(e)
Fig. 38. Failure patterns of uniform/non-uniform pre-strain cases for the (a) uniform pre-strain, (b) case A, (c) case B, (d) case C, (e) case D.
K. Chung et al. / International Journal of Plasticity 58 (2014) 35–65 59
(a)
(b)
Failure with st rain localizat ion
Without Urethane 25mm specimenWith Urethane 25mm specimen
Failure with st rain localizat ion
Failure with st rain localizat ion
Failure with st rain localizat ion
Without Urethane 75mm specimenWith Urethane 75mm specimen
Fig. 39. Failure patterns of the hemispherical dome stretching test with/without the urethane pad. (a) The 25 mm specimen, (b) the 75 mm specimen.
Minor strain-0.2 -0.1 0.0 0.1 0.2 0.3 0.4
Maj
or s
trai
n
0.0
0.1
0.2
0.3
0.4
FLD exp. fittingSim. FLD 25mm (25mm/min)Sim. FLD 25mm (250mm/min)Sim. FLD 25mm (2500mm/min)Sim. Circular cup drawing (25mm/min)Sim. Circular cup drawing (250mm/min)Sim. Circular cup drawing (2500mm/min)dF=0Necking
Fig. 40. Invariance of the development of inhomogeneous deformation confirmed for numerically determined forming limits of the regular hemisphericaldome stretching (with the width of 25 mm) and circular cup drawing tests (with the diameter of 107.5 mm) under three levels of punch speed.
60 K. Chung et al. / International Journal of Plasticity 58 (2014) 35–65
K. Chung et al. / International Journal of Plasticity 58 (2014) 35–65 61
were performed for the hemispherical dome stretching test with the blank of 25 mm width and the circular cup drawing testwith the blank of 107.5 mm diameter, considering three levels of punch speed, 25 mm/min, 250 mm/min and 2500 mm/min.The same procedures applied for the regular hemispherical dome stretching and circular cup drawing tests discussed in Sec-tions 3.2 and 3.3 were employed here to perform numerical simulations and to obtain forming limit strains, respectively. Asshown in Fig. 40, simulation results show that the boundary velocity change had virtually no effect on strain localizationtherefore also on the forming limit for both cases, following the invariance principle, resulting in lines of three speeds con-verged into one, respectively.
Note that the invariance principle is rigorously valid for the rigid-rate sensitive plastic sheet under the traction freeboundary condition. Both example cases considered here were not traction free with non-zero blank holding force condi-tions. For such cases, modification of blank holding force by a factor of (the velocity ratio)m was necessary for the invarianceprinciple, when the power law type rate sensitivity was considered. However, the factors are 10m = 100.003314 = 1.00766�1.0and 100m = 1000.003314 = 1.01538�1.0; therefore, no modification of the blank holding force was necessary in these examples
(a)
(b)
Beta-0.4 -0.2 0.0 0.2 0.4 0.6 0.8 1.0
Effe
ctiv
e pl
astic
stra
in
0.0
0.2
0.4
0.6
0.8
1.0
Simple tension(with and without pre-strain)FLD Modified FLD Pre-strained FLDUniform/non-uniform pre-strained FLDFLD without urethaneCup drawingNumerically determined Beta-EPS (7 elements)Numerically determined Beta-EPS (15 elements)Fracture criterionFLD 200mm (without fracture model)
Beta-0.4 -0.2 0.0 0.2 0.4 0.6 0.8 1.0
Effe
ctiv
e pl
astic
str
ain
0.0
0.2
0.4
0.6
0.8
1.0
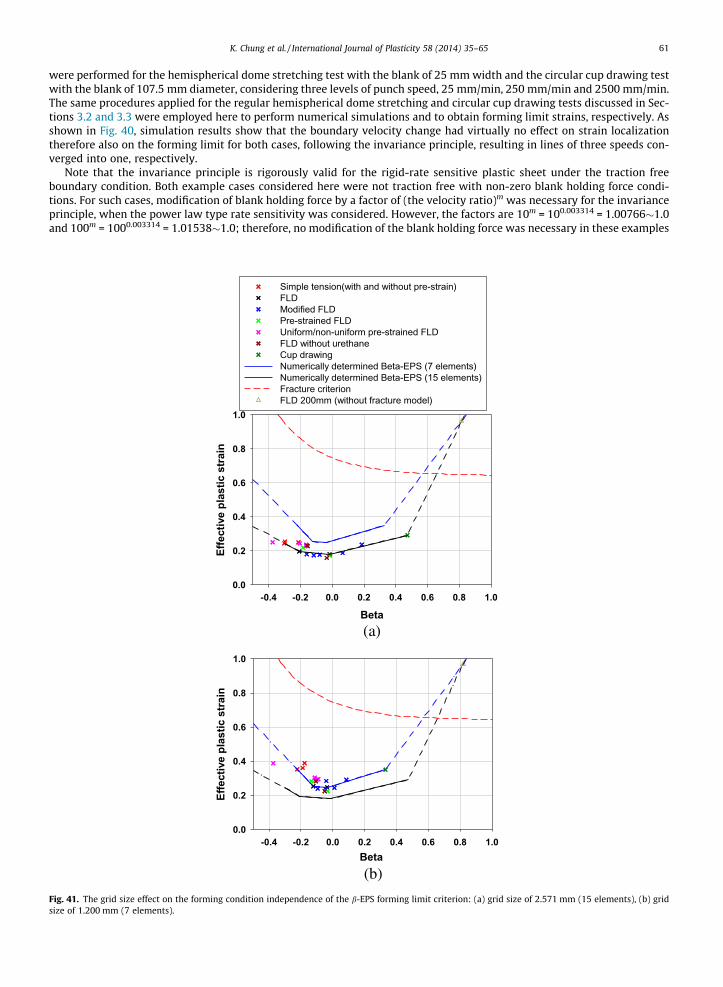
Fig. 41. The grid size effect on the forming condition independence of the b-EPS forming limit criterion: (a) grid size of 2.571 mm (15 elements), (b) gridsize of 1.200 mm (7 elements).

62 K. Chung et al. / International Journal of Plasticity 58 (2014) 35–65
(with the blank holding forces of 400 kN and 30 kN, respectively). As for the effect of the elasticity, it was negligible in theexamples, since the elastic deformation was so small compared to the plastic deformation for metal forming.
3.10. Grid size effect
When severe strain localization occurs, strain localization is concentrated in a very narrow region near the criticalelement. Therefore, measured or simulated forming limit strains are significantly dependent on the grid size used for theaverage strains of the neighboring elements (Casari et al., 2006), while standard ASTM E 2218-02 recommends to use thegrid size of 2.5 mm for the side of a square pattern or the diameter of a circle pattern. Here, the grid size effect on the formingcondition independence of the forming limit criterion was examined for simple tension with/without pre-strain, regular/modified/pre-strained hemispherical dome stretching and circular cup drawing tests, considering two ways to define neigh-boring elements: the first one covering 15 elements (for the grid size of 2.571 mm) and the second one covering 7 elements(for the grid size of 1.200 mm) from the 3rd element from the critical element. The results shown in Fig. 41 confirmed that
0.0 0.5 1.0 1.5 2.00.0
0.5
1.0
1.5
2.0
2.5
3.0
0
5
10
15
20
25
30
Effective plastic strain of critical element(m-value: 0.003314)Effective plastic strain of critical element(m-value: 0.1)Effective plastic strain of critical element(m-value: 0.3314)Slope(m-value: 0.003314)Slope(m-value: 0.1)Slope(m-value: 0.3314)
criε
avrε
/cri avrd dε ε
Fig. 42. Simulated m-value effect on strain localization severity.
Beta-0.4 -0.2 0.0 0.2 0.4 0.6 0.8 1.0
Effe
ctiv
e pl
astic
str
ain
0.0
0.5
1.0
1.5
2.0
Beta-EPSSimple tensionFLD with urethaneCup drawingPre-strained STModified FLDPre-strained FLDNon-uniform pre-strained FLDFLD without urethane
Fig. 43. Deformations of critical elements at the moment of the onset of failure by strain localization.
K. Chung et al. / International Journal of Plasticity 58 (2014) 35–65 63
the smaller the grid size, the larger the forming limit diagram was. In all, the grid size had little effect on the forming con-dition independency of the b-EPS forming limit in approximation. However, keeping a proper grid size would be a reasonablestrategy since if the grid size is too small near the critical element, the deformation, especially its mode of the neighboringelements virtually resembles that of the critical element, which is in the plane strain mode, b � 0 (therefore, leading to moredeviation in Fig. 41(b), compared to Fig. 41(a)). The deformations of the critical elements at the moment of the onset of fail-ure by strain localization were scattered around the plane strain mode as shown in Fig. 43, being consistent with the M–Kmodel discussed in Part I.
3.11. m-value effect and severity of strain localization
As confirmed by the case of the hemispherical dome stretching test with the circular blank (the width of 200 mm), whenforming fails with fracture without strain localization, the fracture surface is typically clean and force does not reach themaximum. For such a case, an explicit fracture strain (or criterion) would be required to predict forming failure and the mea-surement of fracture strain itself would not be so technically difficult in principle. When forming fails with strain localiza-tion, the fracture surface is rough and force goes beyond the maximum. Such a case, the forming limit criterion might bemore useful to predict failure than the fracture criterion, especially since its measurement is so difficult. However, difficultyin measuring the fracture strain which accompanies strain localization (therefore, the usefulness of the forming limit crite-rion also) might be dependent on the development speed of strain localization. In order to examine such an issue, the effectof strain localization development speed on forming limit (the average strain at neighboring elements) was evaluated here,considering three levels of strain rate sensitivity, m = 0.003314 (of DP980), 0.1 and 0.3314. As for the forming process, thehemispherical dome stretching test with the blank of 25 mm width was considered and the same procedure applied forthe regular hemispherical dome stretching test in Section 3.2 was employed here to perform numerical simulations andto obtain forming limit strains.
In view of the simulation results shown in Fig. 42, the critical value imposed for the failure criterion, d�ecrid�eavr
, should satisfytwo conditions: any value beyond that critical value would not affect the resulting forming limit, �eavr (while the exact valueof �ecri is ambiguous), and its corresponding �ecri is low enough to cover all possible fracture strains of highly ductile sheets. Asfor the case of m = 0.003314, the critical value of near 10.0 would be proper since it satisfies the two conditions with its cor-responding �ecri¼ 0:5 (which might be low enough to cover fracture strains of highly ductile sheets as shown in Fig. 42). Theuncertainly of the �ecri value beyond 0.5 however confirms the technical difficulty to identify the fracture strain for the case ofm = 0.003314. As for the case of m = 0.1, for which the strain localization is less abrupt, the critical value should be around10.0 but its corresponding �ecri ¼ 1:0 may or may not be low enough. The situation becomes even more clear for the case ofm = 0.3314, for which the strain localization is gradual and the corresponding �ecri ¼ 2:5 with the critical value of near 25.0might be too large to cover all possible fracture strains of highly ductile sheets. If the fracture strain is lower than 2.5, anexplicit fracture strain �ecri should be used to evaluate forming failure, not the forming limit �eavr , as done for the hemisphericaldome stretching test with the circular blank (the width of 200 mm) in Fig. 24.
The numerical exercise here suggests that fracture criterion is required to evaluate forming failure not only when failureoccurs without strain localization but also when failure occurs with gradual strain localization (with large strain rate sensi-tivity). Since the rate sensitivity becomes large at high temperatures (as with the cases of m = 0.1 and 0.3314 here), choosingbetween forming limit and fracture criteria might need extra care when intended to evaluate forming failure for warm orhigh temperature forming.
4. Conclusions
In typical industrial thin sheet metal forming processes at room temperature, forming is mainly driven by stretchingunder the plane stress condition and fracture more often occurs as a result of abruptly severe strain localization in a thinningmode especially for highly ductile sheets. When sheet splits with fracture accompanying abruptly severe strain localization,characterizing the fracture property might be impractical and the forming limit criterion to measure sheet proneness tosevere strain localization according to deformation modes replaces the fracture criterion to account for sheet formability.As for the forming limit criterion, there are two major issues to address in view of mechanics: one is its relevance as a mate-rial property and the other is on its deformation path insensitive formulae. While the deformation path insensitive formulaeof the forming limit criterion were theoretically justified in Part I by examining the isotropic hardening formulation of rigid-plasticity and also theoretical forming limit models, its relevance as a material property (equivalently, its forming conditionindependence) in approximation for room temperature forming was validated in Part II.
As for the validation of forming condition independence of the deformation path insensitive forming limit criterion, thenumerical analysis was tried out for typical room temperature sheet forming under the plane stress condition, consideringthat strain localization is the mathematical consequence whose general analytical solutions were unavailable. Since numer-ical trials for all forming conditions are impossible, as the first trial of this kind, forming conditions were limited to simpletension test and regular/modified hemispherical dome stretching tests (which are the tools to measure the forming limitcriterion) as well as the circular cup drawing test, all at room temperature, in which the plastic deformation induced heateffect was ignored for simplicity. The mechanical property of the DP980 sheet was considered for simulations, with common

64 K. Chung et al. / International Journal of Plasticity 58 (2014) 35–65
simplifications such as the isotropic hardening of the Hill1948 yield function with the strain rate sensitivity. Exceptions fromthe common practice were to introduce hardening deterioration (based on the isotropic hardening formulation, which wasthe theoretical foundation to validate deformation path insensitivity formulae) and to utilize continuum elements (instead ofshell elements). The numerical simulations were performed using the ABAQUS/EXPLICIT commercial code (ABAQUS Inc,2007) along with the Coulomb friction law.
If the forming limit criterion is a material property, the forming condition would determine only the onset site of local-ization and the deformation mode of near the strain localization, while the limit local deformation behavior near the strainlocalization site would be independent of the forming condition in approximation, especially when the strain localization isabrupt and severe. Numerical results showed that the deformation path insensitive criterion is insensitive to various formingconditions in approximation, partially (since not all forming conditions were tested out) supporting its use as a materialproperty. As for the forming speed, the invariance principle provided a rigorous analytical base to assume that the criterionis independent of forming speeds for typical sheet forming. The numerical exercise also suggested that forming limit criteriamight be useful to evaluate forming failure when strain localization is abruptly severe; however, the fracture criteria arerequired when failure occurs without strain localization or when failure occurs with gradual strain localization (with largestrain rate sensitivity) such as in warm or high temperature forming. Forming conditions beyond the scope of this work werenon-typical room temperature sheet forming including hole expansion, forming involving sharp bending of thick sheets(associated with shear fracture), electro-magnetic and incremental forming. Also note that, as discussed in Part I, the defor-mation path insensitivity of the effective plastic strain based criteria is directly attributed to the isotropic hardening assump-tion, for which any hardening is described by the accumulative effective plastic strain only regardless of deformation history.Therefore, more sophisticated hardening laws to account for anisotropic hardening may introduce some deviation from theinsensitivity; consequently, the insensitivity would be the first order approximation based on the isotropic hardeningassumption, as commonly practiced in formability analysis.
Numerical exercises in this work might have implied that forming failure, if it fails with abruptly severe strain localiza-tion, might be numerically predictable utilizing a criterion for the onset of strain localization only, without imposing anyseparate forming limit criterion. This might be true if numerical solutions are obtainable with ease and good accuracy, whichis unlike in real. Since so many simplifications are employed for material properties and forming conditions, utilizing exper-imentally measured forming limit criteria particularly the deformation path insensitive one for numerical simulations, whileemploying common simplifications such as applying shell elements without considering plastic work induced heat genera-tion, might be a proper engineering practice, whose details might also need further careful study (especially on the propergrid size) in the future.
Acknowledgements
This work was supported by Basic Science Research Program through the National Research Foundation of Korea (NRF)funded by the Ministry of Education, Science and Technology (R11-2005-065) and also by the National Research Foundationof Korea Grant funded by the Korean Government (NRF-2010-220-D00037) as well as by the R&D programs on Co-operativeResearch Project (No. B551179-11-02-00). The authors also greatly appreciate the support of POSCO. The first author wouldlike to thank Prof. R.H. Wagoner for discussions on the conventional view on theoretical FLD models.
References
ABAQUS, 2007. User’s Manual (Version 6.7), Hibbit, Karlsson & Sorensen Inc., USA.Brünig, M., Driemeier, L., 2007. Numerical simulation of Taylor impact tests. Int. J. Plast. 23, 1979–2003.Casari, F., Tassan, M., Messina, A., Molinari, A., 2006. Effect of punch diameter, grid dimension, and lubrication on forming limit diagram. J. Test. Eval. 34, 24–
30.Chen, Y.J., Lee, R.S., Gau, J.T., 2013. Formability evaluation by novel specimen designs in sheet metal forming with two-step strain paths. Proc. Inst. Mech.
Eng. Part B J. Eng. Manuf. 227, 144–152.Chung, K., Wagoner, R.H., 1986. Invariance of neck formation to material strength and strain rate for power-law materials. Metall. Trans. A 17, 1632–1633.Chung, K., Wagoner, R.H., 1998. Invariance of plastic strains with respect to imposed rate at boundary. Met. Mater. Int. 4, 25–31.Chung, K., Ahn, K., Yoo, D.H., Chung, K.H., Seo, M.H., Park, S.H., 2011a. Formability of TWIP (twinning induced plasticity) automotive sheets. Int. J. Plast. 27,
52–81.Chung, K., Ma, N., Park, T., Kim, D., Yoo, D., Kim, C., 2011b. A modified damage model for advanced high strength steel sheets. Int. J. Plast. 27, 1485–1511.Considère, A., 1885. Memoire sur l’emploi du fer et de l’acier dans les constructions. Ann. Ponts Chaussées 9, 575–775.Dorn, J.E., Thomsen, E.G., 1947. The ductility of metals under general conditions of stress and strain. Trans. Am. Soc. Met. 39, 741–772.Gurson, A.L., 1977. Continuum theory of ductile rupture by void nucleation and growth: part 1 – yield criteria and flow rules for porous ductile media. J. Eng.
Mater. Trans. ASME 99, 2–15.Hancock, J.W., Mackenzie, A.C., 1976. On the mechanisms of ductile failure in high-strength steels subjected to multi-axial stress-states. J. Mech. Phys. Solids
24, 147–160.Hill, R., 1948. A theory of the yielding and plastic flow of anisotropic metals. Proc. R. Soc. London 281.Hill, R., 1952. On discontinuous plastic states, with special reference to localized necking in thin sheets. J. Mech. Phys. Solids 1, 19–30.Kuwabara, T., Ikeda, S., Kuroda, K., 1998. Measurement and analysis of differential work hardening in cold-rolled steel sheet under biaxial tension. J. Mater.
Process. Technol. 80–81, 517–523.Ma, N., Park, T., Kim, D., Seok, D.Y., Kim, C., Chung, K., 2010. Evaluation of charpy impact test performance for advanced high-strength steel sheets based on a
damage model. Int. J. Mater. Form. 3, 183–186.Malvern, L.E., 1969. Introduction to the Mechanics of a Continuous Medium. Prentice-Hall, Englewood Cliffs, NJ.Marciniak, Z., Kuczynski, K., 1967. Limit strains in the processes of stretch-forming sheet metal. Int. J. Mech. Sci. 9, 609–612, IN601–IN602, pp. 613–620.Meyers, M.A., Chawla, K.K., 1998. Mechanical Behaviors of Materials. Prentice Hall.

K. Chung et al. / International Journal of Plasticity 58 (2014) 35–65 65
Ogden, R.W., 1972. Large deformation isotropic elasticity – on the correlation of theory and experiment for incompressible rubberlike solids. Proc. R. Soc.London Ser. A Math. Phys. Sci. 326, 565–584.
Salem, A.A., Kalidindi, S.R., Doherty, R.D., 2003. Strain hardening of titanium: role of deformation twinning. Acta Mater. 51, 4225–4237.Stören, S., Rice, J.R., 1975. Localized necking in thin sheets. J. Mech. Phys. Solids 23, 421–441.Swift, H.W., 1952. Plastic Instability under Plane Stress. J Mech Phys Solids 1, 1–18.Tvergaard, V., Needleman, A., 1984. Analysis of the cup-cone fracture in a round tensile bar. Acta Metall. 32, 157–169.Tvergaard, V., 1982. On localization in ductile materials containing spherical voids. Int. J. Fract. 18, 237–252.Wagoner, R.H., 1980. Measurement and analysis of plane-strain work hardening. Metall. Mater. Trans. A 11, 165–175.