Embed Size (px)
Citation preview
MethodologyMethodologyMethodologyMethodology
3
Data sources and adjustments
In 2011, UNICEF and the WHO Department of
Nutrition initiated an annual joint data review
and prepared a global database of national child
prevalence estimates to be used for computing
regional and global averages and examining
regional and global trends in child malnutrition.
UNICEF and WHO receive and review survey
data from the published and grey literature as
well as reports from national authorities on a
continual basis. WHO maintains the WHO Global
Database on Child Growth and Malnutrition
(www.who.int/nutgrowthdb), a repository of
standardized anthropometric child data which has
existed for 20 years (de Onis and Blössner, 2003).
UNICEF maintains a global database populated
in part through its annual data collection exercise
that draws on submissions from more than 150
country offices.
Based on these data, with due consideration to
potential biases and the views of local experts,
UNICEF and WHO developed, and now maintain,
a joint analysis dataset of national child
malnutrition prevalence estimates for children
under-five years of age for all countries or
territories using available survey data since 1985.
Prevalences are based on the WHO Child Growth
Standards (WHO, 2006) median for
• stunting – proportion of children with height-
for-age below –2 standard deviations (SD);
• underweight – proportion of children with
weight-for-age below –2 SD;
• wasting – proportion of children with weight-
for-height below –2 SD; and
• overweight – proportion of children with
weight-for-height above +2 SD.
Because of the different prevalence estimates
obtained using the NCHS/WHO growth reference
and the WHO Child Growth Standards (de Onis et
al, 2006), historical survey estimates based on the
NCHS/WHO growth reference, for which no raw
data are available, have been converted to WHO-
based prevalences using an algorithm developed
by Yang and de Onis, 2008.
Surveys presenting anthropometric data for age
groups other than 0–59 months or 0–60 months
are adjusted using national survey results –
gathered as close in time as possible – from the
same country that include the age range 0–59/60
months. Details of the adjustment process are
available online at www.childinfo.org/files/
Technical_Note_age_adj.pdf.
Measuring standing height in a child above 2 years
of age in the Maldives.
4
National rural estimates are adjusted similarly
using another national survey for the same
country as close in time as possible with available
data on national urban and rural data to derive
an "adjusted national estimate".
In those instances where conversion of a
prevalence estimate based on the NCHS/WHO
growth reference is needed in addition to age
adjustment, the age adjustment is completed first,
followed by conversion to the WHO Child Growth
Standards. All adjustments and conversions are
documented in the analysis dataset. Survey data
extracted from reports for which the raw data are
not yet available are labeled as "pending re-
analysis".
Where multiple survey results exist for the same
country-year combination, preference is given to a
re-analyzed result (using the raw data) over a
converted result; to a survey result with all
available indicators over results for only some
indicators; and to a survey result which includes
the full age range (e.g., 0–59/60 months) over one
which includes a partial age range (e.g., 0–36
months).
Because of the need for re-analysis and/or
adjustments (e.g., for age and/or urban-rural
residence, or conversion from NCHS/WHO growth
reference to the WHO Child Growth Standards),
national malnutrition prevalence estimates
included in the joint UNICEF-WHO analysis
dataset may differ slightly from those in original
reports. Re-analysis and adjustments are
completed for the sole purpose of obtaining
comparable data. The re-analysis or adjustment
does not imply the expression of any opinion
whatsoever on the part of UNICEF or WHO
concerning the integrity of the originally reported
data. Lastly, the mere availability of data on child
malnutrition for a given country-year combination
does not warrant inclusion into the joint analysis
dataset. UNICEF and WHO evaluate survey
estimates for inclusion in the joint analysis
dataset on a case-by-case basis. In some cases,
survey estimates have been excluded due to lack
of comparable data for deriving global and
regional trends.
The joint analysis dataset contains country
classifications for UN regions and sub-regions,
MDG, UNICEF, WHO regions and World Bank
income groups. Estimates are presented for each
of these classifications. An annex to this document
lists the countries included in each of the regional
classifications.
Lastly, the dataset includes the latest under-five
population estimates from the United Nations
Population Division corresponding to the survey
year (variable YEAR1). Survey year is based on
the time period during which a survey was
conducted, except when surveys are conducted
over two or more years, in which case the survey
year is the mean when odd or the nearest year
above the mean when even. For the joint analysis
dataset constructed using survey data available
through May 2012 (UNICEF-WHO Joint Global
Nutrition Database, 2011 revision, completed
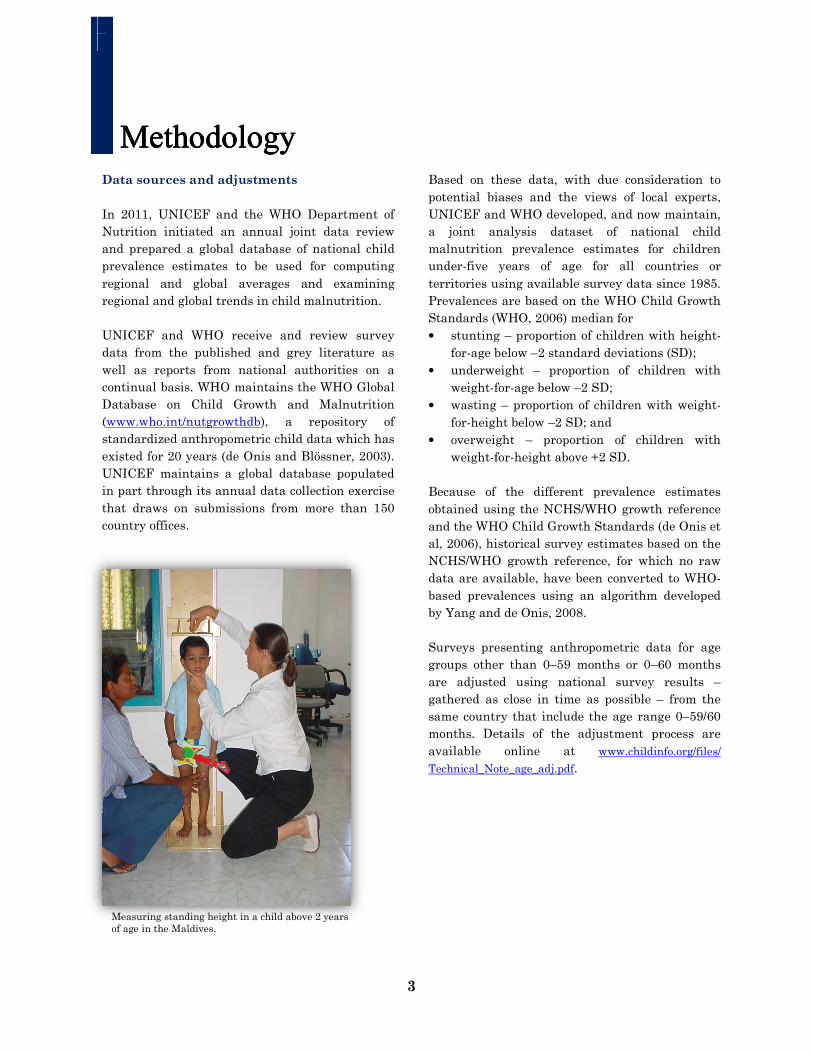
Weighing an infant in India.
5
July 2012), population estimates are from the
2010 revision of the World Population Prospects
released in April 2011 by the United Nations
Department of Economic and Social Affairs,
Population Division.
(N.B. The dataset presents the code of "–1.0" for
prevalence estimates and sample sizes with
missing data. The dataset also includes
information on author and primary reference of
the surveys as well as the reference number
under which the data appear in the WHO Global
Database on Child Growth and Malnutrition.)
Estimating trends multi-level modelling
by regions or income groups
The joint analysis dataset completed in July 2012
includes 639 nationally representative surveys
from 142 countries/territories conducted over the
period 1985 to 2011 (N.B. one exception, a survey
from Papua New Guinea conducted during 1982-
83). For 17 countries, only one national survey
was available; 24 countries had two surveys, and
101 countries had three or more surveys.
About 48% (n=304) of the surveys were conducted
before 2000 and 52% (n=335) were completed
during 2000 or later. Of the 142
countries/territories represented in this dataset,
no survey data was available since 2005 for 28
countries: Afghanistan, Bahrain, Bulgaria, Cape
Verde, Comoros, Cuba, Czech Republic (The),
Ecuador, Equatorial Guinea, Eritrea, Fiji, Gabon,
Iran, Kiribati, Lebanon, Mauritius, Qatar,
Romania, Samoa, Seychelles, Singapore, Tonga,
Trinidad and Tobago, Turkmenistan, Ukraine,
United States of America, Uruguay and Yemen.
Linear mixed-effect modeling is used to estimate
prevalence rates by region or income group from
1990 to 2015. This method has been used in
previous trend analyses and is described in detail
in de Onis et al. (2004). Briefly, for the UN
regions, a single linear mixed-effect model is fit
to the data for each group of sub-regions
belonging to the same region.
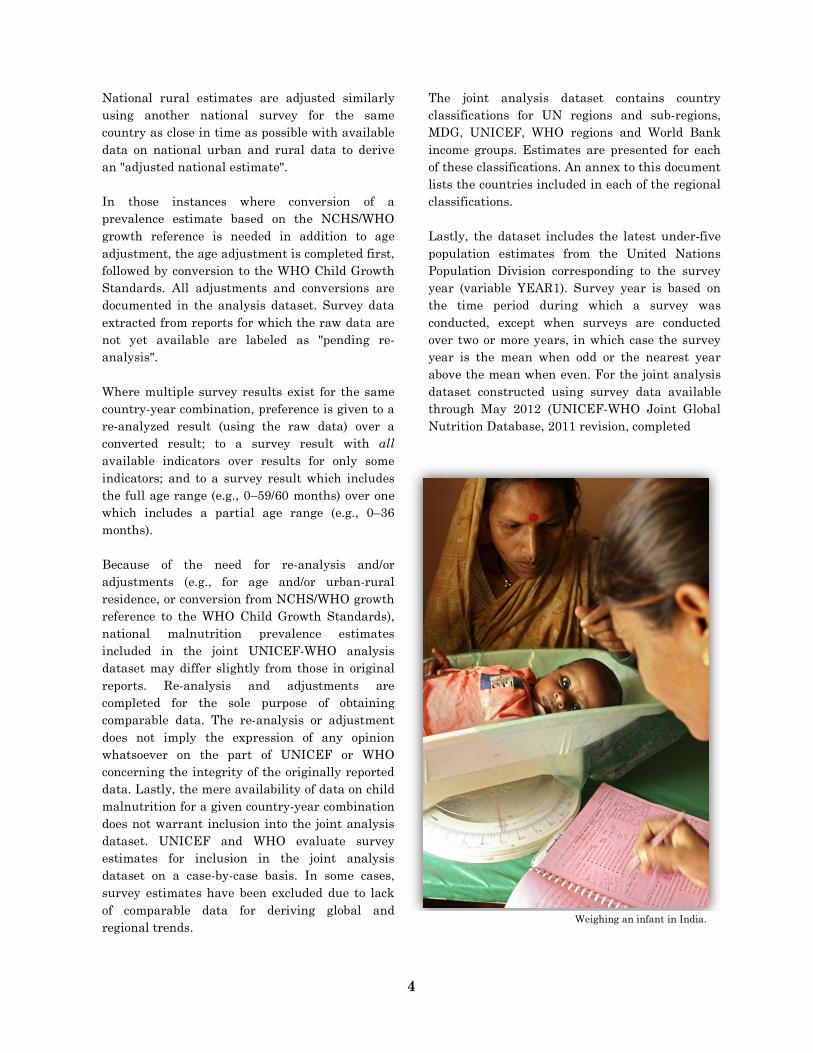
Weighing a toddler in Democratic Republic of the Congo.
6
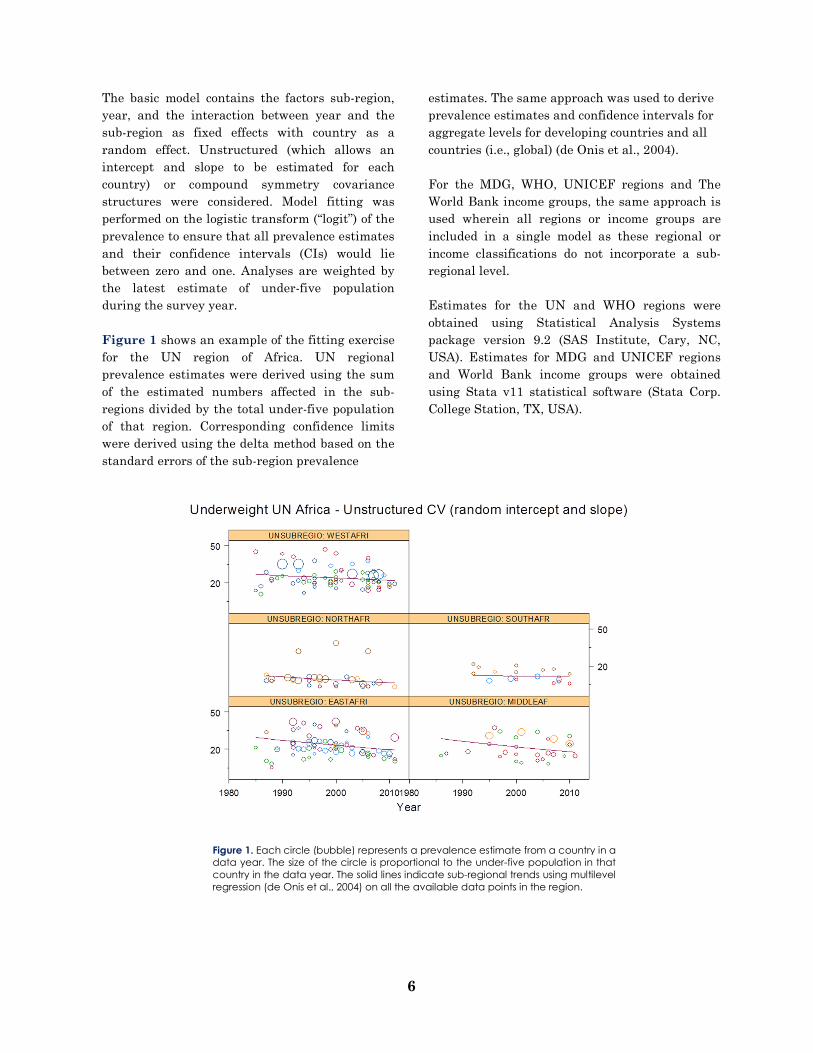
Figure 1. Each circle (bubble) represents a prevalence estimate from a country in a
data year. The size of the circle is proportional to the under-five population in that
country in the data year. The solid lines indicate sub-regional trends using multilevel
regression (de Onis et al., 2004) on all the available data points in the region.
The basic model contains the factors sub-region,
year, and the interaction between year and the
sub-region as fixed effects with country as a
random effect. Unstructured (which allows an
intercept and slope to be estimated for each
country) or compound symmetry covariance
structures were considered. Model fitting was
performed on the logistic transform (“logit”) of the
prevalence to ensure that all prevalence estimates
and their confidence intervals (CIs) would lie
between zero and one. Analyses are weighted by
the latest estimate of under-five population
during the survey year.
Figure 1 shows an example of the fitting exercise
for the UN region of Africa. UN regional
prevalence estimates were derived using the sum
of the estimated numbers affected in the sub-
regions divided by the total under-five population
of that region. Corresponding confidence limits
were derived using the delta method based on the
standard errors of the sub-region prevalence
estimates. The same approach was used to derive
prevalence estimates and confidence intervals for
aggregate levels for developing countries and all
countries (i.e., global) (de Onis et al., 2004).
For the MDG, WHO, UNICEF regions and The
World Bank income groups, the same approach is
used wherein all regions or income groups are
included in a single model as these regional or
income classifications do not incorporate a sub-
regional level.
Estimates for the UN and WHO regions were
obtained using Statistical Analysis Systems
package version 9.2 (SAS Institute, Cary, NC,
USA). Estimates for MDG and UNICEF regions
and World Bank income groups were obtained
using Stata v11 statistical software (Stata Corp.
College Station, TX, USA).
7
Harmonizing country surveys
Harmonizing data in a way that allows for
meaningful comparisons of data poses a major
challenge in generating malnutrition estimates
at the global and regional level. In many
instances, differences across countries and over
time are not amenable to harmonization. In
others, such as in the selection of the survey
target population (both in terms of age and/or
residency), post-survey harmonization may be
possible. In the case of non-standard analysis, for
example, when data processing algorithms do not
use the recommended flag limits (e.g, weight-for-
age z-score –6 / +5 SD), it is necessary to re-
calculate anthropometric prevalence estimates
using a standard method. Further details can be
found at www.who.int/childgrowth/software).
Data quality issues
Increased awareness of problems with
anthropometric data quality in national surveys
has raised consciousness on the importance of
data quality procedures as well as the question of
what is to be done if reported data are of poor
quality. Data quality problems can be eliminated
or minimized through proper survey planning,
thorough training, continuous standardization,
and close field supervision to ensure adherence to
measurement protocols throughout the data
collection process. Even data collected through
large-scale surveys may not be suitable for
inclusion in the joint analysis dataset if data
quality issues exist, but are not identified until
after publication.
WHO and UNICEF are committed to the
collection of high quality data for monitoring the
nutritional status of children and ensuring that
the data included in the agencies’ respective
databases are of the highest quality. To this end,
the WHO Global Database on Child Growth and
Malnutrition maintains a well-established data
quality review for inclusion of survey results (de
Onis and Blössner, 2003) that is closely aligned
with that maintained by UNICEF. The minimum
criteria for inclusion require that a survey:
• employs a cross-sectional population-based
random sample,
• covers the full, or nearly full, age range of
children 0 to 5 years,
• has a minimum sample size of 400,
• utilizes standard measurement techniques
for height and weight (WHO, 2008),
• provides full documentation of survey design,
implementation (including limitations) and
analysis, and
• derives estimates based on the WHO Growth
Standards using the standard indicators and cut-
off points (e.g., for stunting—proportion of
children with height-for-age below –2 standard
deviations (SD); underweight—proportion of
children with weight-for-age below –2 SD;
wasting—proportion of children with weight-for-
height below –2 SD; and overweight—proportion
of children with weight-for-height above +2 SD)(a
standardized data collection form is available
from WHO at: www.who.int/ nutgrowthdb/en),
else raw data is available for re-analysis.
Efforts such as the International Household
Survey Network and the Health Metrics
Network, among others have highlighted
improvements made to-date in health
information systems worldwide. Moreover they
underline the substantial work that remains to
enhance the availability, accessibility and overall
quality of data, as well as their timely analysis
and utilization for evidence-based decision
making.
It is unfortunate when survey data are of
insufficient quality or are of good quality but go
unanalyzed or unreported particularly given the
scarcity of resources for conducting surveys and
the time and effort involved in survey planning,
implementation and dissemination. Scientists,
NGOs and government officials conducting
national surveys are encouraged to contact WHO
and/or UNICEF for technical assistance during
the survey planning and data collection processes

8
in order to improve data quality as well as during
the post-survey period in order to explore
opportunities for increasing the availability of
and access to data for monitoring childhood
nutritional status.
Scarcity of data
Despite dramatic improvements in the number of
population-based, nationally representative
surveys (e.g., UNICEF-supported Multiple
Cluster Indicator Surveys, the USAID-supported
Demographic and Health Surveys, national
nutrition surveys and others) conducted since
1990, many countries do not have high quality
data on anthropometric indicators that allow an
examination of trends over time. In some
instances, surveys have been completed and
reports written but documentation is either sub-
optimal or the reports are not made available.
These deficiencies in data collection, analysis and
dissemination limit national, regional and global
monitoring efforts (e.g., lacking data can lead to
distortions in regional trend analyses). As
previously noted, 28 of the 142
countries/territories represented in the July 2012
joint analysis dataset have had no survey-based
anthropometric estimates available since 2005.
Marasmic-kwashiorkor child in Solomon Islands.