Embed Size (px)
Citation preview

ICF International, 6th floor, Watling House, 33 Cannon Street, London, EC4M 5SB T +44 (0)20 7611 1100icfi.com
Formative Evaluation of NIAF II
18 MARCH 2015
Submitted to :
Department for International Development
Formative Evaluation of NIAF II
2
Document Control Page
Document title Formative Evaluation of NIAF II
Job Number J40253018
Prepared by JA, JG, PBC, NL
Check by RB, NP
Date 18/3/2014
The views expressed in this report are those of the evaluators and not necessarily those of DFID.
This report is the Copyright of ICF Consulting Ltd ("ICF") and has been prepared by ICF under contract to the UK Department for International Development.
ICF has used reasonable skill and care in checking the accuracy and completeness of information supplied by the client or third parties in the course of this project under which the report was produced. ICF is however unable to warrant either the accuracy or completeness of such information supplied by the client or third parties, nor that it is fit for any purpose. ICF does not accept responsibility for any legal, commercial or other consequences that may arise directly or indirectly as a result of the use by ICF of inaccurate or incomplete information supplied by the client or third parties in the course of this project or its inclusion in this project or its inclusion in this report.
Comments or enquiries related to the report should be addressed to [email protected].

ICF International, 6th floor, Watling House, 33 Cannon Street, London, EC4M 5SB T +44 (0)20 7611 1100 icfi.com
Contents
List of acronyms and glossary of terms .............................................................................................. 4
Executive Summary ............................................................................................................................ 6
1 Introduction ........................................................................................................................... 16 Urbanisation and Infrastructure Research and Evaluation Manager (UIREM-Nigeria) ............................ 16 1.1
Nigeria Infrastructure Advisory Facility II .............................................................................................. 16 1.2
Evaluation of the Nigeria Infrastructure Advisory Facility II ................................................................... 17 1.3
Structure of this Report ........................................................................................................................ 18 1.4
2 Evaluation Methodology ........................................................................................................ 20 Evaluation Framework ......................................................................................................................... 20 2.1
Methodology ....................................................................................................................................... 21 2.2Phase 1: Desk and document review .................................................................................................... 21 Phase 2: Stakeholder interviews ........................................................................................................... 22 Phase 3: Field visits .............................................................................................................................. 23 Phase 4: Analysis and reporting ............................................................................................................ 23 Summative Evaluation .......................................................................................................................... 25
Limitations of the Evaluation Methodology .......................................................................................... 26 2.3
3 Background and Context ........................................................................................................ 28 Overview of Nigeria’s Development Challenges .................................................................................... 28 3.1
Response of the Government ............................................................................................................... 29 3.2
DFID’s Operational Plan in Nigeria ........................................................................................................ 31 3.3
4 Literature Review: Infrastructure, Economic Growth & Poverty Reduction ........................... 32
5 Evaluation Findings ................................................................................................................ 34 Performance findings ........................................................................................................................... 34 5.1
5.1.1 Relevance ............................................................................................................................... 34 5.1.2 Efficiency and value for money in resource allocation .............................................................. 37 5.1.3 Effectiveness ........................................................................................................................... 42
Strategic evaluation findings ................................................................................................................ 46 5.25.2.1 Is NIAF II positioned to improve the management of infrastructure development at federal and state level in Nigeria? Is there evidence that this has the potential to a) reduce infrastructure constraints and b) contribute to non-oil growth and reduced poverty? ................................................. 46 5.2.2 Does NIAF II at the programme and project level adequately reflect its strategic principles (demand-responsiveness, flexibility, political economy awareness and influencing); and are these making a difference in bringing about reforms in infrastructure investment?........................................ 52 5.2.3 To what extent has NIAF II support helped to improve the results derived from Nigeria’s spending on infrastructure? Are there common obstacles to achieving this, and how might they be overcome? ........................................................................................................................................... 55 5.2.4 Is NIAF II likely to play a role in increasing public and private sector funds for infrastructure provision in Nigeria? Is there more that NIAF II could do to stimulate investment? ............................... 60 5.2.5 Which interventions within the NIAF II programme are having the greatest effect? Is the balance of investments appropriate to achieving its goals relating to non-oil growth and reduced poverty? .............................................................................................................................................. 64

Formative Evaluation of NIAF II
4
5.2.6 Are there any changes of a) approach or b) procedure that might help NIAF II to be more effective over the second half of the programme?................................................................................ 70 5.2.7 Value for Money ..................................................................................................................... 72
6 Conclusions and Recommendations ....................................................................................... 76 Performance Questions ........................................................................................................................ 76 6.1
6.1.1 Relevance ............................................................................................................................... 76 6.1.2 Efficiency and Value for Money ............................................................................................... 77 6.1.3 Effectiveness ........................................................................................................................... 78
Strategic Evaluation Conclusions & Recommendations ......................................................................... 78 6.26.2.1 Is NIAF II positioned to improve the management of infrastructure development at federal and state level in Nigeria? Is there evidence that this has the potential to a) reduce infrastructure constraints and b) contribute to non-oil growth and reduced poverty? ................................................. 78 6.2.2 Does NIAF II at the programme and project level adequately reflect its strategic principles (demand-responsiveness, flexibility, political economy awareness and influencing); and are these making a difference in bringing about reforms in infrastructure investment?........................................ 79 6.2.3 To what extent has NIAF II support helped to improve the results derived from Nigeria’s spending on infrastructure? Are there common obstacles to achieving this, and how might they be overcome? ........................................................................................................................................... 80 6.2.4 Is NIAF II likely to play a role in increasing public and private sector funds for infrastructure provision in Nigeria? Is there more that NIAF II could do to stimulate investment? ............................... 81 6.2.5 Which interventions within the NIAF II programme are having the greatest effect? Is the balance of investments appropriate to achieving its goals relating to non-oil growth and reduced poverty? .............................................................................................................................................. 82 6.2.6 Are there any changes of a) approach or b) procedure that might help NIAF II to be more effective over the second half of the programme?................................................................................ 83 6.2.7 Is NIAF II providing value for money? ....................................................................................... 84 6.2.8 Under which conditions is the NIAF ‘model’ most likely to be successful? ................................ 84
Summary of Recommendations ............................................................................................................ 86 6.36.3.1 Recommendations for NIAF ..................................................................................................... 86 6.3.2 Recommendations for DFID ..................................................................................................... 88
Appendices (see separate volume) ................................................................................................ 89
List of acronyms and glossary of terms
ADB Asian Development Bank
AfDB African Development Bank
AFD Agence Francaise de Developpement
AR Annual Review
ASI Adam Smith International
BPE Bureau of Public Enterprises
BRT Bus Rapid Transit
CBD Central Business District
CC Climate Change
CDO City Development Office
CEAP Chief Economic Adviser to the President
Formative Evaluation of NIAF II
5
CME Coordinating Minister for the Economy
CP Capital Projects
DAC Development Assistance Committee (OECD)
DFID Department for International Development
DisCos Distribution Companies
DPU Development Planning Unit
EC Effective Cities
FCT Federal Capital Territory
FDI Foundation for Development and Environmental Initiatives
FEC Federal Executive Council
FERMA Federal Roads Maintenance Agency
FGN Federal Government of Nigeria
FMoW Federal Ministry of Works
GDP Gross Domestic Product
GenCos Generation Companies
GIFMIS Government Integrated Financial Management Information Systems
HDM-4 Highway Development and Management Model (software package)
ICG International Crisis Group
IFC International Finance Corporation
LAMATA Lagos Metropolitan Area Transport Authority
LOPPP Lagos Office of Public Private Partnerships
KNUPDA Kano State Urban Planning and Development Authority
KUTPO Kano Urban Transport Project Office
MDAs Ministries, Departments and Agencies
MDB Multilateral Development Bank
MTA Material Transfer Agreement
MW Mega-watt
M&E Monitoring & Evaluation
NASS National Assembly of Nigeria
NEGIP Nigeria Electricity and Gas Improvement Project
NIAF Nigerian Infrastructure Advisory Facility
NIIMP National Integrated Infrastructure Master Plan
NPC National Planning Commission
NSIA Nigerian Sovereign Investment Authority
NV20:2020 Nigeria Vision 20:2020 (policy document)
OBC Outline Business Cases
OCEAP Office of the Chief Economic Adviser of the President
OECD Organisation for Economic Cooperation and Development

Formative Evaluation of NIAF II
6
PHCN Power Holding Company of Nigeria
PMU Project Management Unit
PPA Power Purchase Agreement
PPP Public Private Partnership
PTFP Presidential Task Force on Power
RAMS Road Asset Management System
RBFS Results-Based Funding Structure
RFP Requests for Proposals
PV Photo-voltaic
STDA Satellite Towns Development Agency
SURE-P Re-investment and Empowerment Programme
SWM Solid Waste Management
TA Technical Assistance
TEM Transitional Electricity Market
ToC Theory of Change
TRP Technical Review Panel
UCL University College London
UD Urban Development
UIREM Urbanisation and Infrastructure Research and Evaluation Manager
UN-HABITAT United Nations Human Settlements Programme
UT Urban Transport
UWE University of the West of England
VFM Value-for-Money (analysis)
WB World Bank
Executive Summary
High-level Findings
NIAF II is broadly delivering results according to expectation, with expenditure and physical progress on track to deliver outcomes, although there is significant variation between outputs and workstreams. Feedback from reviews (Annual and Technical), beneficiaries and stakeholders is positive in terms of the quality and timeliness of inputs and outputs.
The evaluation has found that NIAF is helping to make improvements in the results from infrastructure spending, and is well positioned to significantly improve future spending. The programme has played a major role in: (i) attracting significant additional private sector capital into infrastructure development and management; (ii) increasing bi-lateral and multi-lateral agency support to infrastructure development; and probably (iii) increasing the efficiency of Government spending on infrastructure.
This evaluation concludes that with the current satisfactory progress and high level of political support, outcome achievement is possible.
What is working well under NIAF II?

Formative Evaluation of NIAF II
7
The NIAF II programme is highly relevant to the Nigerian context, and to both FGN and DFID policies and priorities. Its performance relies upon the following features of the NIAF II ‘model’:
Activities guided by a strong theory of change, elaborated through specific “sector stories” Adherence to a well-articulated set of approach principles (demand-responsiveness, political
economy-awareness, flexibility and influencing) A results-based remuneration system based on the logical framework which reinforces an
output (and eventually outcome) focus Identifying clear entry points where there is a high-level political support Quick and effective response to client demands Providing a mix of technical assistance built around long-term advisory engagements –
particularly by Nigerian diaspora Use of PPP modalities within a clear, transparent and predictable legislative framework Leveraging additional government, institutional and private sector funding for infrastructure
provision
What could work better?
Regular reviews of the theory of change: ensure assumptions concerning poverty reduction are acted upon and technical approaches are adequately poverty-targeted (geographic and social targeting) and gender sensitive
Apply strategic-level expertise in gender, poverty and social inclusion to infrastructure programmes
Strengthen the programme focus on opportunities for intervention where political support is strong
Maintain a balanced portfolio of support and flexibility among workstreams to mitigate risks to outcome achievement
Deliver projects through workstreams with skilled personnel in the solutions (e.g. market development approaches), rather than the problems (e.g. climate change).
Strengthen focus on building institutional and staff capacity for agencies in which NIAF consultants play a significant role, including explicit exit strategies for each project and/or indicator strategy in order to improve sustainability
Strengthen VFM analysis through more robust measures of value added and analysis of their effect on outcomes
Where NIAF II is working in areas where other donors and IFIs are active, maximise the opportunities for influencing approaches and the attraction of additional funding
Design and establish a systematic learning system to capture and document lessons learned, and widely disseminate lessons of the NIAF II model and experience.
The Nigerian Infrastructure Advisory Facility II (NIAF II)
NIAF II is the second stage of the DFID-funded NIAF technical assistance programme which is intended to support more effective infrastructure investment in Nigeria in order to contribute to economic growth in the non-oil sector and the reduction of poverty. This is captured in the NIAF II log frame impact and outcome statements:
■ Impact: Reduced infrastructure constraints to growth in non-oil gross domestic product and employment, leading to reduced poverty
■ Outcome: Enhanced management of infrastructure development at the federal level and in selected states.

Formative Evaluation of NIAF II
8
NIAF II was originally approved in June 2011 with a budget of £48 million, which was increased to £98 million under an expended Business Case in September 20131. The programme will be executed over a period of five years from December 2011 to 2016, and focuses on six outputs: (i) Power Sector Reform; (ii) Roads and Railways Sectors Reform; (iii) Improved Capital Programme Planning, Financing and Execution; (iv) Effective Cities; (v) Northern Growth (Risk mitigating output); and (vi) Climate Change (Risk mitigating output).
The Evaluation
A consortium led by ICF GHK was commissioned in August 2013 by DFID to carry out the Urbanisation and Infrastructure Research and Evaluation Manager (UIREM) – Nigeria programme. The scope of work includes the provision of evaluation services to DFID on NIAF II, including a mid-term (formative) evaluation which is the subject of this report. The main objective of this formative evaluation is:
■ To assess the progress and impact of the NIAF programme against the objectives set, and specifically with regard to improvement in infrastructure development in Nigeria and its potential to impact on the poor.
In addition, it also seeks to:
■ Promote learning and corrective action during the programme’s lifetime and in any future phases or similar interventions; and
■ Support the work of the Technical Review Panel (TRP) that will be assessing project progress every six months.
The performance of the Facility is evaluated in terms of its design relevance, efficiency, value for money and effectiveness. At the heart of the evaluation are the formative evaluation questions which test the programme logic, assumptions and approach. They seek to assess how well the NIAF II model and design are suited to meeting its objectives, and how well this model is being delivered in practice. These questions are:
■ Is NIAF II positioned to improve the management of infrastructure development at federal and state level in Nigeria?
■ Does NIAF II at the programme and project level adequately reflect its strategic principles (demand-responsiveness, flexibility, political economy awareness and influencing)?
■ To what extent has NIAF II support helped to improve the results derived from Nigeria’s spending on infrastructure?
■ Is NIAF II likely to play a role in increasing public and private sector funds for infrastructure provision in Nigeria?
■ Which interventions within the NIAF II programme are having the greatest effect, and is the balance appropriate?; and
■ Are there any changes of a) approach or b) procedure that might help NIAF II to be more effective over the second half of the programme?
The evaluation methodology is theory-based using an evaluation framework developed from the NIAF theory of change. It is a mixed-method approach using quantitative data and analysis where available (e.g. NIAF programme data and primary data from expanded client consultation and perception survey) and qualitative research from a review of academic and grey literature, in-depth sector case studies, stakeholder interviews, and site visits. Our findings are thus informed by a wide range of data
1 The £98 million funding envelope includes the costs for the Urbanisation and Infrastructure Research and Evaluation Manager (UIREM), and DFID’s contribution to the Urbanisation Review, in addition to the NIAF II TA contract.

Formative Evaluation of NIAF II
9
sources. In drawing conclusions and recommendations we have sought to triangulate evidence and in setting these out we have qualified findings according to the strength of evidence available.
A summative evaluation in 2016 will assess the impact of NIAF through focusing on obtaining evidence of programme outcomes, assessing what has been achieved, and providing understanding of the process of change. It will again examine the theory of change and in particular assumptions concerning the potential of the programme to contribute to poverty reduction. It will also provide lessons learned for future programmes.
The Performance of NIAF II
Relevance
NIAF II is assessed to be highly relevant to both FGN and DFID policies and priorities, and to addressing development obstacles. The Nigeria Vision 20:2020 policy document (NV20:2020) recognises that to achieve its development objectives, Nigeria has to overcome significant socioeconomic, physical and structural challenges that have constrained past economic growth and development: Paramount among these constraints is inadequate, poor quality and decaying infrastructure and services. At the request of the FGN, NIAF is DFID’s response: a flexible Facility intended to assist Government in overcoming major infrastructure constraints to national development and thus contribute to non-oil economic growth and poverty reduction. As a demand-driven programme, NIAF is able to align itself with NV20:2020 objectives. The scope, size and flexible framework of NIAF also enables the facility to tackle issues which are not currently seen as a major priority of Government but are relevant to NIAF and important for DFID’s Nigeria Strategy and its wider development objectives: (i) climate change, and (ii) economic development and poverty reduction in northern Nigeria.
More generally, NIAF falls within DFID’s 2011-2015 Operational Plan for Nigeria which focuses on meeting basic needs of citizens through reducing internal conflicts, deepening democracy and building the confidence of investors. Business surveys and national opinion polls consistently identify inadequate power supply and poor condition of roads and railways as the two greatest constraints to doing business in Nigeria. NIAF also fits well with DFID’s wider strategic approach to infrastructure development.
Design
The NIAF II theory of change is informed by the processes which drive poor infrastructure delivery. It argues that high quality and well-targeted technical assistance can: (i) increase the funds available for infrastructure spending, (ii) strengthen the effectiveness of existing expenditure, and (iii) thus reduce poverty through faster economic development associated with better infrastructure provision. The NIAF theory of change and associated sector stories are valuable in setting out the contextual analysis, the NIAF approach, sector approaches and how the ‘risk-mitigating’ outputs of cities, climate change and Northern growth are addressed. Together they also articulate how NIAF II can achieve the intended impact of economic growth in the non-oil sector and poverty reduction.
The literature review conducted as part of this evaluation generally supports the contention that there is a positive link between improved quantity and quality of infrastructure and economic growth. However, economic growth is a necessary but not sufficient condition for poverty reduction, and simultaneously addressing inequality is critical: growth should be concentrated in the sectors and places where the poor are economically active and live. This supports aspects of the NIAF programme which include focus of the programme on Northern growth, and on services which directly benefit the poor.

Formative Evaluation of NIAF II
10
The design of NIAF is derived from a theory of change which has been elaborated through the business case for the NIAF expansion and more recently by the NIAF PMU. The technical assistance facility combined with a set of change processes based on key principles of approach (demand-responsiveness, political economy awareness, flexibility and influencing) has also been well-articulated. As such the NIAF ‘model’ is an innovative programme design which is highly relevant to the Nigerian context.
Efficiency and value for money
The nature of the programme is demanding on both governance and management, due to: (i) its large size; and (ii) the ambitious and high-risk rating of many of its proposed outputs.The demand-led nature of the programme calls for a careful balance to be drawn between the need to be flexible and act quickly to obtain quality human resources, and the need to achieve good value for money through paying a fair price for the resources used. The efficiency of the programme in converting inputs to outputs is supported by a number of programme features: (i) a system for selecting projects which closely maps them to output indicators; (ii) ToRs which are aligned with logframe outputs and agreed by the PMU, the client and DFID; (iii) the performance-based payment system (RBFS) introduced in 2013; (iv) the role of the AR and TRP in evaluating performance against the logframe; and (v) the flexible nature of the logframe itself.
The share of project costs spent on programme management is an indicator of economy and efficiency. Analysis of cost data from NIAF II indicate PMU costs stabilising at about 7 per cent of total spend since Q4 of 2012 if recent RBFS payments are excluded. Over the entire project to date, the proportion of total spend attributable to PMU costs is about 9.9 per cent. The TRP and AR visits provide important and useful external perspectives with the TRP focused largely on achievement of logframe targets and the AR with a wider remit focusing more on processes. The RBPS ensures a discipline based on the log-frame, an efficient monitoring system and a focus on milestone targets. A disadvantage however is that this discipline does not require the development of a learning system which systematically draws the lessons of experience which can be used for wider application and future programming.
Value for money is supported by cost control achieved through: (i) competitive tender of the management contract; (ii) a pre-agreed fee-rate band; (iii) annual negotiation of costs; and, (iv) the increasing use of local consultants.
Effectiveness
It is too early to assess the effectiveness of NIAF II in delivering against outcomes; the assessment of effectiveness is limited to the performance of the programme in terms of the timeliness and quality of output delivery, and its positioning to deliver outcomes. Expenditure against budget shows that overall physical progress is on track, and feedback from clients, beneficiaries and stakeholders is positive in terms of the quality and timeliness of inputs and outputs. The power, capital projects and effective cities are assessed to have performed particularly well, whereas the roads and climate change workstreams are experiencing difficulties – the former has recently suspended some activities, and the latter is progressing slowly.
The Annual Review in November 2013 was optimistic that, with the satisfactory progress and current level of political support, outcome achievement is possible. The most recent TRP report of April 2014 reinforces these findings but highlights that risks to the programme are high, particularly in the light of the Nigerian election in 2015.This evaluation supports these findings, and notes that a particularly challenging period lies ahead – particularly in respect of completing reforms in the power sector and embedding and institutionalising in MDAs tools developed under NIAF II.
Strategic Evaluation Conclusions

Formative Evaluation of NIAF II
11
Is NIAF II positioned to improve the management of infrastructure development? Has this the potential to reduce infrastructure constraints and contribute to non-oil growth and reduced poverty?
The programmatic design of NIAF II aligns closely to a robust theory of change which has been broadly confirmed by our literature review. Most clients have found NIAF to be moderately or more than moderately responsive to their needs, although the traction obtained by each workstream indicates varying degrees of relevance to clients. In the case of Roads and Climate Change this appears to be due to a lack of political support, and in the case of Effective Cities, due to the complexity of the institutional environment and lack of technical capacity. The significant success of the work in the power sector and capital projects workstreams is seen as demonstrating the importance of understanding the political economy of the sector, of identifying clear entry points, and of enjoying high-level political support.
However it can also be noted that whilst a favourable political economy is a necessary driver of performance, it is not a sufficient condition for sustainability of NIAF results. The progress of the capital projects and effective cities workstreams indicate that more time is needed to embed institutional structures and technical procedures, especially in the light of the presidential election in 2015. It is too early to judge whether NIAF can effect an impact on economic growth that will cause a long-term and indirect, ‘trickle-down’ impact on poverty reduction, or whether there will be improved access to services which will have a beneficial impact for poorer people.
Does NIAF II reflect its strategic principles (demand-responsiveness, flexibility, political economy awareness and influencing)?
NIAF II does apply these strategic principles and application of them appears to be strongly correlated to success: Where the principles have been applied well, successes (or potential successes) are more in evidence than in areas where they have been applied less well.
NIAF’s ability to respond quickly and effectively to client demands is a core strength of the programme, distinguishes it in the eyes of clients, and makes NIAF a partner of choice. A deep awareness of political economy has allowed the NIAF interventions to be targeted at areas where change is possible, particularly where political understanding is strongest (in Power and Capital Projects). The flexibility of the programme has meant that interventions can be led by political opportunities. Although this does leave NIAF open to the risk of opportunism at the expense of long-term strategic change, the evaluation team has found that this is mitigated by strong theories of change and an underlying strategic focus. NIAF has also managed to balance the potentially competing principles of responsiveness and influencing by working closely with government clients to influence their demands for support to reform processes. In addition to these principles, addressing the entire market or supply chain appears to be critical for successful reform.
The perception survey indicates that Nigerians are optimistic about improvements to the power sector, roads and bus transport. Currently approximately 40 per cent of people think that these services are good or very good, and 90 per cent think that they will be good or very good in five years’ time. This level of optimism bodes well for a programme which is rooted in political capital.
Has NIAF II support helped to improve the results from Nigeria’s infrastructure spending?
There is evidence that NIAF is helping to make improvements in the results from infrastructure spending, and is well positioned to significantly improve future spending. So far, improved results are particularly evident in circumstances where an element of private sector participation has been introduced into the infrastructure sector, which has enabled incentive structures to be established which support: (i) cost-efficient use of resources in delivering infrastructure; and (ii) attraction of private sector finance. In areas where there is not strong political and institutional support, as a result of either

Formative Evaluation of NIAF II
12
(i) vested interests which oppose the necessary reforms, or (ii) situations where the weaknesses in policy or institutional framework prevent NIAF achieving traction with client organisations, improved results from infrastructure expenditure are less certain.
The use of PPP modalities within a clear, transparent and predictable legislative framework attracts better international and institutional investors whose demands for high standards of governance and social and environmental performance can introduce a virtuous circle in which investors demand higher standards from government, and NIAF can in turn help government develop a more attractive investment proposition.
Is NIAF II likely to play a role in increasing public and private sector funds for infrastructure provision in Nigeria?
NIAF has shown some success in; (i) leveraging additional private sector funding for infrastructure provision; and (ii) working in collaboration with other donors and IFIs to leverage additional institutional funds into infrastructure sectors. It is too early to assess the full impact that NIAF II is likely to have on additional financial resources being brought into the infrastructure sector, and for those resources already obtained, it is difficult to assess how much of this is attributable to NIAF. However, even if only a small portion of the additional financing identified is attributable to NIAF II, it has clearly played a major role in: (i) attracting significant additional private sector capital into infrastructure development and management; (ii) increasing bi-lateral and multi-lateral agency support to infrastructure development; and probably (iii) increasing the efficiency of Government spending on infrastructure.
By far the most significant quantum of funds raised are those from the private sector for the privatisation of PHCN successor GenCos and DisCos at $2.25bn.In addition private sector investment is committed through binding agreements on the new Discos of US$ 2.5bn, and on the Gencos of between US$ 1.5 and 2.5bn.
Which interventions within the NIAF II programme are having the greatest effect, and is the balance appropriate?
Individual workstreams in the NIAF II programme are largely well aligned to the objective of contributing to non-oil growth but less well aligned to direct poverty reduction. The power sector theory of change provides strong arguments for its promotion of economic growth and an indirect contribution to poverty reduction, with little contribution as yet to the Northern growth output. The roads workstream is similarly aligned, although it has been able to support the poverty-targeted labour-based roads maintenance programme. Whilst alignment of the capital projects workstream is high in terms of non-oil growth, it too is not directly aligned to poverty reduction objectives, with the exception of some pro-poor targeted projects. The effective cities workstream is supporting models of service delivery which can have direct poverty impact although it is too early to show the evidence of this. The climate change workstream contains projects which are directly targeting poverty, but the nature of the projects is unlikely to be transformational in terms of their structural impact on poverty reduction.
NIAF II has spent £48 million to June 2014, of which 40% has gone on the power workstream, 25%, on capital projects, 17% on effective cities, 10%, roads, and 6% on climate change. As a whole, NIAF is broadly delivering results according to expectation, although there is significant variation between outputs and workstreams. The work of the power workstream has surpassed expectation, capital projects is performing above target, roads and effective cities are largely delivering as expected, but climate change is somewhat under-performing. For the remainder of the programme, maintaining a mixed portfolio of investment which balances expected impacts and results, timing of expected impacts, and risk, is important for sustainable outcomes.
Are there any changes of a) approach or b) procedure that might help NIAF II to be more effective over the second half of the programme?

Formative Evaluation of NIAF II
13
The way in which the outputs have been assigned to workstreams means that the implementing workstream does not always have the necessary expertise. As a result, there has been some creative and potentially successful collaboration, particularly where a workstream skilled in market development takes on a technical infrastructure challenge such as in the case of the Labour Based Roads Maintenance programme delivered through the capital projects workstream. It appears that other opportunities are not being exploited as thoroughly as they could be. For example, the cookstoves project being delivered through the climate change workstream calls for the development of a market for clean cooking energy, requiring experience in market development available from other workstreams.
Few of NIAF’s projects are explicitly targeting poverty reduction. Evidence from the literature review suggests that without clear targeting of interventions, benefits may not necessarily reach the poorest or contribute to wider and longer-term poverty reduction.
Some clients have come to rely heavily on NIAF support, and exit strategies are not always a clear part of the project plan. In some projects consultants were effectively building capacity so that activities could be sustained internally with the client’s own staff, but this approach was not always an explicit strategy and seemed not to be driven by a clear exit strategy.
Does NIAF II offer Value for Money?
Overall, the documentary evidence suggests that NIAF II is capable of delivering strong VFM, by using its resources economically, efficiently and effectively, and can be expected to provide a strong return on resources over time. This finding is consistent with the analysis in response to each of the strategic evaluation questions. There are significant challenges relating to quantification and attributability of results, and limitations in the extent to which critical analyses have been undertaken so far.
NIAF II interventions appear to be capable of delivering strong net benefits, although these vary between workstreams. While projections of net benefits provided in the NIAF II business case are plausible, quantitative evidence of the value of benefits achieved to date is patchy. Evidence of the additional effect of interventions in influencing the target outcomes of relevant infrastructure investments is crucial in the assessment of the benefits and hence VFM offered by the programme. There may be scope to strengthen VFM analysis in future, by developing more robust measures of the overall effect of NIAF II activities on the measured outcomes. Greater focus on the outcomes achieved by infrastructure investments compared to a counterfactual scenario involving no NIAF intervention could help to achieve this. Documentary evidence suggests that the processes of delivery are contributing to the economy, efficiency and effectiveness of intervention, although the scope for critical analysis of this is constrained by limitations in evidence.
What are the key conditions for success?
Delivering results through an advisory facility like NIAF requires that: (i) the strategic principles (political economy awareness, flexibility, demand responsiveness and influencing) are applied, and (ii) other conditions for success are in place:
■ A base level of capacity – without which the facility cannot be fully demand driven
■ A skilled and willing consultant diaspora – more effective through their better understanding of context
■ Availability of potential investors – bring both resources and a virtuous circle to deliver higher standards
■ Political impetus - strong leadership and support from the top required to secure reforms
■ Sectors in Crisis – sectors in crisis present opportunities for intervention which are likely to enjoy strong political support

Formative Evaluation of NIAF II
14
■ Institutional clarity - avoid areas with overlapping institutional remits, and potentially competing interests
■ Right mechanism, right contractor – a contractor with the resources to do the job, and the right incentive framework to deliver outcome and impact
■ Address the entire market chain – take a whole of system approach.
Recommendations
Programme Governance and Management
The NIAF PMU should in the short term:
1. Further elaborate the NIAF story and theory of change as drafted by the PMU and add a summary diagram with inclusion of the assumptions made (the external conditions for success) and the causal factors (or drivers of change) along the results path.
2. Regularly review the theory of change to ensure that assumptions concerning poverty reduction are being acted upon and, with the evidence provided by the literature review, ensure that all workstreams are sufficiently proactive to ensure that technical approaches are adequately poverty-targeted (geographic and social targeting) and gender sensitive for direct positive impact wherever possible.
3. Explore the possibility of applying strategic level expertise in gender, poverty and social inclusion to infrastructure programmes. Nascent demand from international investors could be used to leverage this expertise into projects by creating a demand from clients which NIAF is able to respond to.
4. Design and establish a systematic learning system so that the lessons of the NIAF experience are more fully captured and documented.
5. Strengthen VFM analysis, by developing more robust measures of the value added of NIAF interventions – i.e. their overall effect on the measured outcomes.
6. Ensure that projects are delivered by workstreams which are skilled in the solutions (e.g. market development approaches), rather than the problems (e.g. climate change). NIAF’s strong technical experts on problems such as climate change should be brought to bear in an advisory capacity across all workstreams rather than being responsible for delivery.
The NIAF PMU should in the medium term:
7. Maintain a balanced portfolio of support for the remainder of the programme in order to maintain a balance across outputs of risk, long- and short-term achievement of results, and contribution to outcome achievement.
8. Concentrate in areas which are a focus of the NIAF programme and where other donors or IFIs are active. Continue to work with other donors and IFIs in using NIAF inputs to help leverage further funding into the infrastructure sectors to support sector reform or direct investment
9. Learn from experience during the first two years of NIAF II on the best mechanisms to benefit from joint working with other bilaterals and IFIs.
Programme Implementation and Approach
The NIAF PMU should in the short term:
1. Actively seek to embody the NIAF strategic principles within NIAF interventions – where it is not possible to fully embed them, NIAF may not be the best-placed programme to support change.
2. Intervene in an incremental manner, but take a more strategic view of the sector and consider the feasibility of intervening at every stage of the supply chain.

Formative Evaluation of NIAF II
15
3. Continue to focus on opportunities to intervene where political support is strong.
4. Within the Capital Projects workstream, find innovative ways to work around the obstacles which are preventing the introduction of the systems, tools and procedures needed to improve infrastructure investment. Where major obstacles to reform are being encountered through resistance from entrenched vested interests, maintain pressure through existing channels, and make parallel efforts to identify alternative points of entry where there is receptiveness within MDAs to use of these tools.
5. For Effective Cities, focus on:
a. demonstrating the value of initiatives in the pilot cities in terms of improved data and infrastructure efficiency;
b. promoting these achievements; and
c. developing a strategy through which such reforms may be rolled out across other cities in the country.
6. For the Roads workstream, find a new point of entry based on a more favourable political economy.
7. Incorporate explicit exit strategies into each project and/or indicator strategy in order to improve sustainability.
The NIAF PMU should in the medium term:
8. Demonstrate that the PPP approaches that it is effectively piloting in the power sector and through NSIA and selected state governments (such as Lagos) are replicable in other sectors and in other jurisdictions.
9. Continue to support development of PPPs through:
a. a greater focus on building institutional and staff capacity of agencies in which NIAF consultants play a significant role (e.g. NSIA) and developing a clear exit strategy;
b. the development of a unified legislative framework to guide PPPs at the federal level.
Recommendations for DFID
DFID should in the short term:
1. Closely monitor the RBFS over the next year to ensure that: (i) it is not unduly weighted to the benefit of the supplier, and (ii) it does not deflect activities towards quick output wins, while avoiding more difficult work strands which are more critical to achieving outcomes.
2. Dissemination of formative evaluation report – whilst this is entirely a decision for DFID, this formative evaluation must be shared with NIAF, and ideally published for a wider readership. The intended audience would be development professionals with an interest in the role of advisory facilities. This formative report and the data on which it is based will also form the basis of the summative evaluation.
DFID should in the medium term:
3. Enhance the effectiveness of the TRP visits and Annual Reviews by a) including visits outside Abuja and b) obtaining a formal response to their reports from the NIAF PMU.

Formative Evaluation of NIAF II
16
1 Introduction
Urbanisation and Infrastructure Research and Evaluation Manager (UIREM-1.1Nigeria)
A consortium led by ICF GHK was commissioned in August 2013 by DFID to carry out the Urbanisation and Infrastructure Research and Evaluation Manager (UIREM) – Nigeria programme. The consortium included, amongst others, the Foundation for Development and Environmental Initiatives (FDI), Ibadan, the Development Planning Unit (DPU) at University College London (UCL), and the Department of Construction and Property at the University of the West of England (UWE).
UIREM-Nigeria will deliver research on key themes about urbanisation, urban development and the provision of infrastructure – and their impacts on Nigerian economy and society. It will also provide evaluation services to DFID on the Nigerian Infrastructure Advisory Facility II (NIAF II), including an evaluability assessment, evaluation strategy, and the mid-term and summative final evaluation of the programme. The evaluation outputs will support the UIREM-Nigeria’s objective of building an evidence base for better urbanisation strategy, urban policy, and urban programming and management in Nigeria.
UIREM-Nigeria will run over four years, with possible extension for a further two years. The inception period has served as the six-month design phase for the programme, and will be followed by an implementation phase of three-and-a-half years, to August 2017.
Nigeria Infrastructure Advisory Facility II 1.2NIAF is a DFID-funded technical assistance programme that aims to address infrastructure obstacles to economic growth and poverty reduction. The long-term change sought by NIAF II is that more effective infrastructure investment in Nigeria supports growth and the reduction of poverty. This is reflected in the NIAF II log frame impact and outcome statements:
■ Impact Reduced infrastructure constraints to growth in non-oil gross domestic product and employment, leading to reduced poverty
■ Outcome Enhanced management of infrastructure development at the federal level and in selected states
NIAF provides consultancy services to Federal and State governments to improve infrastructure planning and implementation in Nigeria. The first phase of the programme ran from November 2007 to November 2011 and involved a budget of £32.6 million. It was successful in developing a reputation for quality, and managed to transform and influence the Nigerian Government’s approach to infrastructure planning and financing.
The current second phase was originally approved in June 2011 with a budget of £48 million, and an expanded business case was agreed in September 2013, increasing the funds available to NIAF to £98 million. The programme will run for a period of five years from December 2011 to 2016, and has a particular focus on six outputs:
■ Power Sector ■ Roads and Railway Sectors ■ Capital Programme Planning, Financing and Execution ■ Effective Cities ■ Northern Growth (Risk mitigating output) ■ Climate Change (Risk mitigating output)
Power Sector
NIAF has been working in the power sector since 2007 to reduce the degree to which power shortages impede economic development in the country. It assists the privatisation of all eleven distribution companies and all six generation companies through a transparent and competitive process. It also supports the introduction of an electricity market and its sustainability. Finally, it works

Formative Evaluation of NIAF II
17
with the federal government to improve the volume and reliability of power service delivery until the conclusion of the sector reform process.
Roads and Railway Sector
The roads and rail output aims to assist improved planning and management of the federal roads network, including over 1,500 bridges. This includes integration and consolidation of the entire road network data set in one central database, and support to large-scale repair and maintenance of selected local government area roads. It also promotes better roads sector policy, leadership and finance, and institutional and regulatory reforms. The rail component plans to assist the rehabilitation of the Eastern and Western Lines and supports private sector participation in the sector.
Capital Projects
This output aims to address the weaknesses of capital programme planning, budgeting and implementation through supporting the federal government in the development and implementation of a screening framework and better procurement standards for capital projects. It has also been assisting the Federal Government’s Subsidy Re-investment and Empowerment Programme (SURE-P) in the use of effective budgeting tools and in implementing projects in the roads sector adopting labour-intensive techniques. It further promotes the use of innovative forms of financing for infrastructure projects, in particular public-private partnerships (PPP) for both Federal and selected State (particularly Lagos) Governments.
Effective Cities
The Effective Cities output includes two strands of work that focus on enhancing the ability of Nigerian cities to grow in a climate-resilient, pro-poor manner and become effective drivers of economic growth. The Urban Development component focuses on improving urban management and planning through the setting up of City Development Offices to better coordinate investments at the city level and enhance municipal service delivery. The Urban Transport component aims to create reliable, sustainable and affordable transport architectures that fit the needs of rapidly expanding cities and contribute to pro-poor growth and employment generation.
Northern Growth
Poverty in Nigeria is most concentrated in the North, and regional inequality greatly contributes to instability in Northern Nigeria. The Northern Growth output aims to contribute to the reduction of this inequality by ensuring that on-grid electricity supply increases at least the same pace as across the whole country, and by promoting access to electricity via grid, mini-grid, standalone systems or introduction of solar lanterns among households and businesses. It also seeks to improve municipal service delivery in key northern cities and improve the quality of rural roads in key northern locations.
Climate Change
In addition to having strongly climate-friendly objectives in general, NIAF also seeks to add to these through pursuing specific activities to support climate compatibility and the integration of mitigation and adaptation measures into federal and state government development strategies. These include renewable energy services for households and businesses, working with state governments to develop and implement climate change response strategies, promoting photovoltaic systems for schools and clinics, and improving access to clean cooking energy, among others.
NIAF is delivered through an external Project Management Unit (PMU) based in Abuja, Nigeria. The PMU is responsible for contracting and managing TA activities. Both phases of NIAF were tendered and contracted to a consortium led by Adam Smith International (ASI).
Evaluation of the Nigeria Infrastructure Advisory Facility II 1.3The evaluation follows the evaluation framework developed by ICF International during the inception phase, which was informed by a series of preparatory exercises, among them an evaluability assessment, two literature reviews and a field visit to Abuja. The main objective of this evaluation is:
■ To assess the progress and impact of the NIAF programme against the objectives set, and specifically with regard to improvement in infrastructure development in Nigeria and its potential to impact on the poor.

Formative Evaluation of NIAF II
18
In addition, it also seeks to
■ Promote learning and corrective action during the programme’s lifetime and in any future phases or similar interventions; and
■ Support the work of the Technical Review Panel (TRP) that will be assessing project progress every six months.
The evaluations will deliver two main evaluation reports of the NIAF II programme:
■ A formative evaluation which will assess the design and implementation progress to date of NIAF II and consider how NIAF is transitioning to its second phase, particularly with regard to the new approaches and components introduced under NIAF II. The evaluation will identify any changes of approach or process that could improve performance over the second half of the programme.
■ A summative evaluation which will assess the impact of NIAF through focusing on obtaining evidence of programme outcomes, assessing what has been achieved, and providing understanding of the process of change. It will again examine the theory of change and in particular assumptions concerning the potential of the programme to contribute to poverty reduction. It will also provide lessons learned for future programmes.
The evaluation findings will only have an impact if they are understood and used to inform decisions. The findings of this evaluation are of interest to NIAF itself and to the Nigerian Federal and State governments, city-level actors, private sector investors, DFID both inside and outside of Nigeria, and to other programmes engaged in infrastructure investment and technical assistance, as well as ultimately the UK public.
A variety of means of communication and dissemination will be used. Apart from the main report, these will include:
■ Summary Report: Evaluation findings are given in the context of the available evidence on the identified topics
■ Briefing Paper: Non-technical, short briefs for DFID and other key stakeholders. The briefing papers summarise key evaluation findings that are easily digestible with links to more detailed information.
■ Meetings and seminars: Providing evaluation updates to DFID and other key stakeholders and facilitating discussion on key evaluation findings.
Further details of the communication and dissemination strategy and plan for the Formative Evaluation of NIAF II are available upon request.
Structure of this Report 1.4The Report is structured as follows:
■ Chapter 2 presents the evaluation methodology adopted, summarising the evaluation framework, briefly describing the key stages of the evaluation comprising: (i) desk and document review; (ii) stakeholder interviews; (iii) field visits; and (iv) analysing and reporting, and (v) setting out the limitations of the evaluation methodology.
■ Chapter 3 provides the background and context of the NIAF II programme including an overview of Nigeria’s development challenges, Government’s response to these challenges and DFID’s policy framework.
■ Chapter 4 provides a summary of the literature review which examined the relationship between infrastructure development, economic growth and poverty reduction.
■ Chapter 5 sets out the main evaluation findings, covering both the performance of NIAF II in terms of its: (i) relevance; (ii) efficiency; and (iii) effectiveness, and summarising the responses to the six strategic evaluation questions and value for money assessment.
■ Chapter 6 provides conclusions and recommendations from the evaluation, and summarises what are seen as the conditions for success for a facility like NIAF.

Formative Evaluation of NIAF II
19
The Appendices are presented in a separate volume.
Formative Evaluation of NIAF II
20
2 Evaluation Methodology
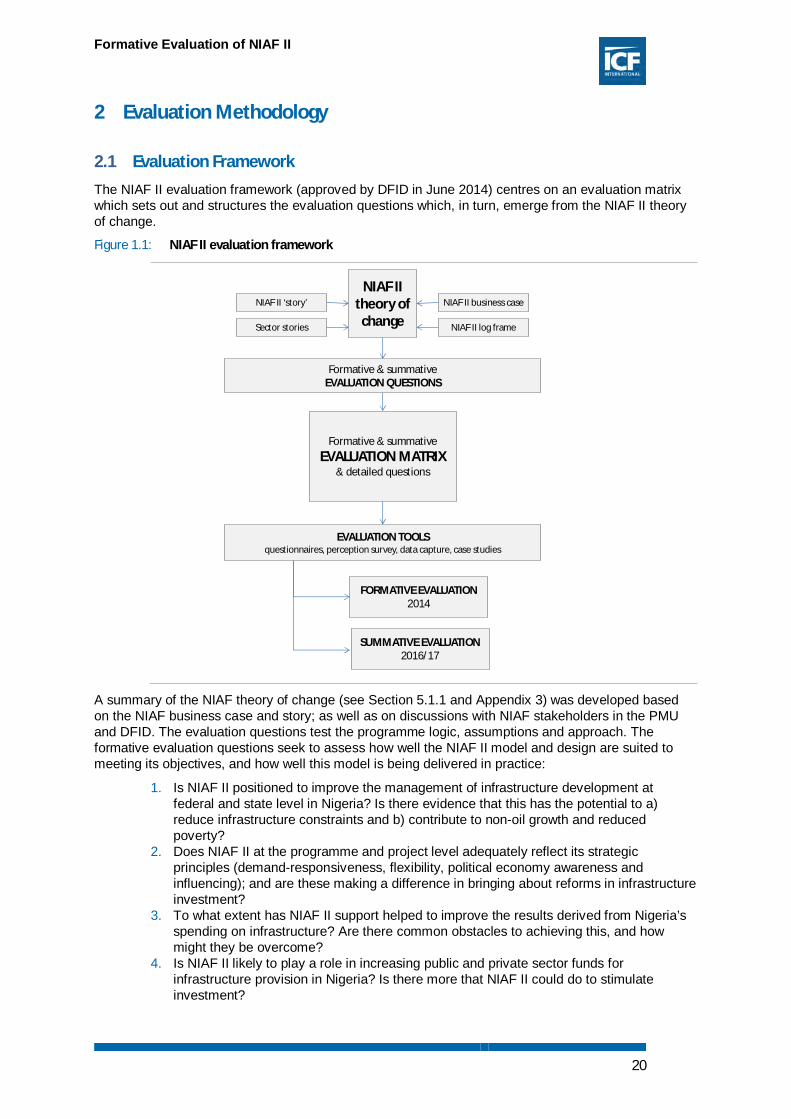
Evaluation Framework 2.1The NIAF II evaluation framework (approved by DFID in June 2014) centres on an evaluation matrix which sets out and structures the evaluation questions which, in turn, emerge from the NIAF II theory of change.
Figure 1.1: NIAF II evaluation framework
A summary of the NIAF theory of change (see Section 5.1.1 and Appendix 3) was developed based on the NIAF business case and story; as well as on discussions with NIAF stakeholders in the PMU and DFID. The evaluation questions test the programme logic, assumptions and approach. The formative evaluation questions seek to assess how well the NIAF II model and design are suited to meeting its objectives, and how well this model is being delivered in practice:
1. Is NIAF II positioned to improve the management of infrastructure development at federal and state level in Nigeria? Is there evidence that this has the potential to a) reduce infrastructure constraints and b) contribute to non-oil growth and reduced poverty?
2. Does NIAF II at the programme and project level adequately reflect its strategic principles (demand-responsiveness, flexibility, political economy awareness and influencing); and are these making a difference in bringing about reforms in infrastructure investment?
3. To what extent has NIAF II support helped to improve the results derived from Nigeria’s spending on infrastructure? Are there common obstacles to achieving this, and how might they be overcome?
4. Is NIAF II likely to play a role in increasing public and private sector funds for infrastructure provision in Nigeria? Is there more that NIAF II could do to stimulate investment?
Formative & summativeEVALUATION QUESTIONS
Formative & summativeEVALUATION MATRIX
& detailed questions
FORMATIVE EVALUATION2014
SUMMATIVE EVALUATION2016/17
NIAF II theory of change
NIAF II ‘story’
Sector stories
NIAF II business case
NIAF II log frame
EVALUATION TOOLSquestionnaires, perception survey, data capture, case studies

Formative Evaluation of NIAF II
21
5. Which interventions within the NIAF II programme are having the greatest effect? Is the balance of investments appropriate to achieving its goals relating to non-oil growth and reduced poverty?
6. Are there any changes of a) approach or b) procedure that might help NIAF II to be more effective over the second half of the programme?
These high-level evaluation questions provide the framework for the evaluations’ more detailed questions as set out in the evaluation matrix provided in Appendix 2. The questions are structured according to the OECD-DAC evaluation criteria of Relevance, Efficiency, Effectiveness, Impact, Sustainability and the three additional criteria of coverage, coherence and coordination. The matrix also provides a summary of the data sources and evaluation methodology to be used to address each question.
Methodology 2.2The evaluation methodology is theory-based using an evaluation framework developed from the NIAF theory of change. It is a mixed-method approach using quantitative data and analysis where available (e.g. NIAF programme data and primary data from expanded client consultation and perception survey) and qualitative research using a review of academic and grey literature, in-depth sector case studies, stakeholder interviews, and site visits. Our findings are thus informed by a wide range of data sources. In drawing conclusions and recommendations we have sought to triangulate evidence and in setting these out we have qualified findings according to the strength of evidence available. We have indicated some limitations to the methodology in section 2.3 below.
The evaluation methodology has been informed by two preliminary exercises: a literature review and comparative study of other approaches to the evaluation of infrastructure technical assistance programmes, and an evaluability assessment (including a one-week visit to Abuja). These were an integral part of our evaluation framework (approved in June 2014) helping to define evaluation questions, identify data gaps and finalise a methodology and work plan.
The original ToRs for the UIREM (research programme and NIAF evaluations) included a data component with provision for a large household survey. This was intended to be a basis of the research programme and to contribute to the evaluation. It was agreed in discussion with DFID and NIAF at the UIREM inception stage and approved in the Inception Report (June 2014) that this large-scale survey should be replaced by other more appropriate and cost-effective research methods.2
The Evaluation Framework and Plan which was reviewed by SEQAS (May 2014) and approved by DFID in June 2014 proposed a perception survey to be conducted at formative and summative evaluation stages to assess progress against outcome- and impact- level indicators.
Following the comments from SEQAS and with further discussion with DFID, the detailed survey design was developed during the initial phase of the formative evaluation. With the intention of including a wider and more structured consultation with clients and in order to measure public perceptions of improvements to infrastructure, the primary data gathering was modified to comprise i) a client consultation survey and ii) a separate public perception telephone survey. The former was with a view to expand the evidence base from NIAF clients, and the latter was to expand on NIAF’s own outcome level survey work to gather data from end-users on the relevance and effects of NIAF. These were discussed and agreed with DFID prior to survey administration. A note of the methodology was included in the Quarterly Report (16 July 2014) and approved 1 August 2014.
The evaluation has four main phases: 1) Desk and document review; 2) Stakeholder interviews; 3) Field visits; and 4) Analysis and reporting.
Phase 1: Desk and document review
This comprised a systematic review of all relevant documentation concerning NIAF including: business cases and log frames; other strategic documents (such as the NIAF and sector stories); contextual 2 These alternative methods comprise a series of (ongoing) research projects which are utilising both existing data sources and, working with data providers as necessary, carrying out specific data collection and analysis integral to the research projects.

Formative Evaluation of NIAF II
22
policy documents (such as DFID’s Operational Plan for Nigeria, relevant policy and sector strategies of the Federal Government of Nigeria); management reports including inception and progress reports; other monitoring and evaluation including the Technical Review Panel and Annual Review reports; NIAF project database and underlying M&E data (measurement against log frame, financial progress data).
The analysis has included a critical analysis of the logic models driving the NIAF at both the programme and the sector levels, and analysis of available quantitative and financial data, including trend analysis where possible. This can be seen at Appendix 8 which provides a portfolio analysis.
Literature Review
Building on the review conducted during inception, the evaluation team undertook a detailed literature review to assess the validity of the critical assumption behind NIAF II’s theory of change (ToC). This included the review of relevant articles in academic journals, reports published by DFID, other donors, international organisations and NGOs, and evaluation reports of similar programmes, among others.
In particular, our analysis focused on the following key links underpinning the ToC:
■ Link between economic growth and poverty reduction
■ Link between improved infrastructure in the power, roads, rail and urban sector and economic growth
■ Link between improved infrastructure in the power, roads, rail and urban sector and poverty reduction
■ Link between privatisation and economic growth
■ Link between green growth and poverty reduction
The findings from this review are summarised in Chapter 4 and detailed in Appendix 7.
Phase 2: Stakeholder interviews
Prior to the field visit to Nigeria, the team completed a stakeholder mapping exercise and held preliminary briefing interviews and confirmed programming arrangements with DFID, London and by telephone and e-mail with DFID, Nigeria and the NIAF PMU. The selection of stakeholders and clients to interview was designed to form a sample which covered all work streams and geographies, as well as types of support (i.e. embedded and short term). The number of interviews was determined by the time and personnel available in the core evaluation team.
During the field visits, as described under Phase 3 below, the interview programme was conducted with in-country programme management staff from DFID Nigeria and NIAF, government partners, other programme partners and beneficiaries, MDB partners and other resource people such academics and researchers. A full list of those interviewed during the field visit is at Appendix 11.
Interviews were conducted according to a semi-structured format, guided by questionnaires developed at the end of the document review stage and tailored to each stakeholder group (see description of methodological tools below).
Additional client consultation
The evaluation team was aware that interviewing only a sample of clients runs a risk that a wider consultation may have elicited different insights. In order to counter this, a wider client consultation was undertaken by e-mail and a follow-up interview conducted in person by senior fellows from our consortium partner organisation, the Foundation for Development and Environmental Initiatives (FDI). The purpose of this consultation was to expand the coverage of the interviews of the 14 clients undertaken during the field visits with a questionnaire interview to cover the full range of NIAF’s 60 clients, and to provide a quantitative analysis of NIAF relevance and effectiveness.
This additional consultation was designed specifically to ensure that the insights from the 14 clients interviewed by the core evaluation team were reflected across the wider client group and to identify any further lessons which could be drawn.

Formative Evaluation of NIAF II
23
For reasons of cost and timeliness, it was decided to design a structured interview based on the semi-structured interview schedule used by the core team in client consultations. This also ensured that the interviewers who were less familiar with the programme were able to collect consistent data.
Analysis indicates differences according to workstream, client and project location; and identifies the areas in which the NIAF model has been most successful, whether and why the TA was effective, and how the modality of support was beneficial or otherwise.
This consultation exercise will be re-applied at the summative evaluation stage. A summary of the wider client consultation report is provided at Appendix 5.
Perception survey
In order to assess progress against outcome- and impact-level indicators including an assessment of the quality of public services assisted by NIAF, the methodology for a telephone public perception survey was developed during the initial phases of the formative evaluation.
The telephone poll was conducted in August 2014 by NOI Polls, Nigeria’s leading polling company using a questionnaire to assess the perceived quality of service provision in power, roads and urban transport over time. It provides useful contextual analysis of NIAF’s relevance for end-users, provides a baseline for a comparison with a repeated poll for the summative evaluation, covers those sectors most likely to be directly experienced by the general population and our literature review shows those sectors most strongly linked to poverty reduction.
The poll is of a sample of 2,500 people made up of 1000 nationally, with 500 additional interviews with people from each of Kano, Lagos and Abuja (where NIAF has a number of urban-focused projects). The design is based on a poll commissioned by NIAF to assess the success of power sector reform and will provide results which will be comparable with NIAF’s own outcome indicators. Whilst mobile phone ownership is increasing rapidly in Nigeria with an estimated coverage of 80% of the adult population in 2015, it is acknowledged that the survey may not be able to capture programme impact amongst the lowest 20% wealth quintile. Other methodologies (including the results of the wider research programme and site-based beneficiary interviews) will be used during the summative evaluation to analyse actual and potential poverty impact.
Full details of the rationale, objectives, methodology, limitations and results can be found in Appendix 6. It should be noted however, that at this stage only descriptive statistics can be presented, a full analysis will only be possible when the results of the summative evaluation are available.
Phase 3: Field visits
The field visit took place over a two-week period from 23 June to 4 July 2014. The full itinerary is at Appendix 10. It included visits to key clients in Abuja, Lagos, Kano and Kaduna and to selected project sites in all of these locations. Clients were interviewed according to a semi-structured interview schedule which is included in Appendix 11.
The visits enabled in-depth discussion with the NIAF PMU and consultants and with the DFID Infrastructure Adviser. It concluded with presentation to DFID Nigeria and NIAF in order to test emerging findings, fill information gaps and clarify any outstanding questions.
Phase 4: Analysis and reporting
The period following the field visit to Nigeria involved the analysis of all evidence gathered across the previous three phases of the evaluation and preparation of key evaluation analyses — from the client consultation, case studies and the perception survey report — prior to aggregation and synthesis of findings and finally preparation of the draft evaluation report.
A number of analytical methods were utilised, aimed at identifying key findings and demonstrating a clear evidence chain.
– Hypothesis building and testing: Throughout the evaluation, the Evaluation Team engaged in an iterative process of building and testing hypotheses. Working hypotheses were developed

Formative Evaluation of NIAF II
24
through interview feedback or desk review and then tested through additional evidence collection, including follow-up interviews and documentary review.
– Critical analysis of logic models: The NIAF sector stories or theories of change were reviewed and analysed according to the checklist to provide a conceptual and visual foundation for understanding the expected activities, outputs and outcomes.
– Project analysis: used the project database to analyse characteristics, performance and, where possible, trends in the NIAF activity.
– Qualitative and qualitative analysis of stakeholder consultation. In addition to the client consultation and perception survey reports described above, information from interviews has been recorded and organised according to the workstreams and evaluation questions;
– Value for money analysis, covering economy, efficiency and effectiveness; – Triangulation: The Evaluation Team held a number of working group sessions bringing
together evidence and hypotheses from the evidence gathering and analytical activities to validate and formulate evaluation findings.
– Feedback analysis: The evaluation processes benefited from feedback from the NIAF PMU and DFID, fact checking, and our internal review process.
Case Studies
In addition to these analytical methods, the evaluation also included three case studies which will be repeated for the summative evaluation, to allow for longitudinal observation. These were included to provide more in-depth exploration of the second evaluation question, which focuses on the role of the NIAF strategic principles in underpinning results and delivery, and to generate lessons for wider learning on flexible, demand-responsive modalities.
They also provided an opportunity to explore the extent to which the NIAF approach needs to be tailored to different sectors and the prospects for success across the NIAF sectors.
The case studies focused on three of the NIAF five workstreams:
■ Power The ‘benchmark’ sector, which is relatively mature and has already reported successes in the application of the NIAF strategic principles.
■ Capital projects Started under phase one of NIAF, but as yet in an earlier stage of development.
■ Effective cities One of the new sectors under NIAF II, with the potential to capitalise on the lessons learned through the better-established sectors.
The cases studies focused on the following questions and followed a standard template to ensure a consistent approach:
■ To what extent is the delivery approach documented (i.e. through strategies and guidance); and to what extent is it possible for it to be communicated through programmatic guidance? To what extent does it depend on personality and individual acuity, either of NIAF consultants, clients or political leaders? Are there particular governance requirements associated with the approach?
■ What is the rationale for the NIAF approach and strategic principles? What constitutes relevant and appropriate programmes and contexts and how are they identified? How is success measured, and how is failure identified and dealt with?
■ What are the implications of the approach for programme planning, forecasting, monitoring and evaluation? What is the appropriate balance between prescriptiveness and discretion? How should discretion be managed?
■ What are the benefits and what are the costs (including transaction and financial costs) – at the individual project level and at the aggregate programme level? What are the associated risks (does this approach imply a higher level of risk)?
The case study reports are provided at Appendix 9.

Formative Evaluation of NIAF II
25
Summative Evaluation
As indicated above, the evaluation programme of NIAF also includes a summative evaluation in 2016.
Our evaluation framework and plan (approved in June 2014) sets out the differences between the formative and summative evaluations. The primary focus of the summative evaluation will be on testing the linkages and assumptions at outcome to impact levels. Specifically it will test the linkages and assumptions at the impact level, i.e. linking the outcome (improved infrastructure management) to the long chain of intended impacts (improved infrastructure leading to non-oil GDP growth leading to employment resulting in reduced poverty).
At outcome level the summative evaluation will examine how the programme has unfolded in practice and on the results of the NIAF approach in leading to changed practice and procedure by government. It will consider the extent to which the programme has been implemented according to plan, the extent to which opportunities and challenges have arisen and the effectiveness of the response to those opportunities and challenges. Specifically it will ask ‘has the NIAF approach led to improved planning and investment in infrastructure and service provision?’
Evidence of impact (growth and potential for poverty reduction) will remain difficult to assess due to the long time required for the NIAF approach to see results on the ground and because of NIAF’s relatively small contribution to the process. At this level we will be testing the NIAF theory of change and seeking evidence of the links from improved infrastructure to poverty reduction.
Evidence of outcome and impact achievement will be sought at two levels:
Firstly, we will use field data to assess changes in practice in infrastructure investment and service provision, including evidence of targeting for poverty impact. Key sources of such data will be: (i) NIAF monitoring data to assess progress and field impact; (ii) the client consultation survey and further stakeholder discussions to test whether NIAF has induced improved practice and whether more targeted approaches as recommended in the formative evaluation have been adopted; (iii) the (telephone) household perceptions survey to examine changes in perceptions of access to infrastructure and services; and (iv) field-level stakeholder and beneficiary interviews and discussions at project intervention level to look at changes in infrastructure and service provision and any observable changes in local economic growth and the potential for poverty reduction.
Secondly, we will use findings of the research programme and literature review to test the theory of change, particularly the impact level assumptions concerning the assumed causal links between infrastructure, growth and poverty (i.e. whether improved infrastructure planning and investment contribute to growth and have potential for poverty reduction).
The independent research component of UIREM-Nigeria is generating new knowledge and evidence on key themes concerning urbanisation, urban development and the provision of infrastructures and their impacts on the Nigerian economy and society. The intention is that this knowledge will also support the evaluation of NIAF II.
A key question for the research is the relationship between urban economic growth, infrastructure and poverty. This will address the key issues of why high rates of economic growth in recent years have not translated into real improvements in employment creation and poverty reduction, and the importance of the contribution of infrastructure investment.
The research relevant to NIAF will attempt to determine the kinds of infrastructural investments (physical and social) that are needed to accommodate and facilitate rapid economic and population growth in both the formal and informal sectors, strengthen job and livelihoods creation, increase income levels and reduce urban poverty.
By researching these questions, the UIREM-Nigeria research will complement the evaluation’s analytical approaches and methodological tools, including its own literature review of the wider evidence on the contribution of infrastructure provision on economic growth and poverty reduction, its qualitative analysis of stakeholder consultations and related surveys.
The methodology for the summative evaluation will be refined and data collection tools developed at the time of the evaluation in 2016.

Formative Evaluation of NIAF II
26
Limitations of the Evaluation Methodology 2.3As indicated in the evaluation framework, the key limitations for the evaluation derive from being able to assess NIAF’s contribution to change especially at outcome and impact levels, and attributing change to NIAF interventions. This is compounded by the long-term nature of the expected impact of NIAF interventions. At this stage of the formative evaluation, the focus is at output level and, based on an assessment the current direction of the programme, the likelihood of the achievement of outputs translating to the achievement of the expected outcome and the intended contribution to impact. It also seeks to draw lessons for the future direction of the programme.
Assessing contribution
In terms of the analysis of contribution, this has been relatively easy to discern at output level. It has been possible to triangulate a variety of sources of evidence (client interviews, client consultation data, programme data and TRP and Annual Review reports) together with an assessment of the theory of change to make a good assessment of cause and effect and thus of NIAF contribution to changes observed.
Conclusions concerning the contribution of NIAF to the higher levels of outcome and impact will continue to be challenging even at the summative stage. This is because NIAF is a small contributor to economic growth and poverty reduction. Repeated review of context, the external factors and programmes that also influence infrastructure, growth and poverty will continue to be a feature of the analysis. Evidence from secondary data, related programmes, the perception survey and stakeholder interviews will again be contributors to this analysis.
Impact assessment
NIAF’s outcome indicators refer to improvements in infrastructure investment and service delivery, whilst impact seeks the removal of constraints to economic growth and poverty reduction. A challenging aspect of the evaluations is to assess NIAF’s impact on poverty – both direct, through improved access to services, and indirect through national or regional economic growth.
Impact assessment is problematic at the time of the formative evaluation, and will continue to be so for the summative evaluation. This is firstly because of the long-term nature of achieving economic growth and poverty reduction (changes in growth and poverty are unlikely to be very evident even at the stage of the summative evaluation); secondly the uncertainty concerning the potential of economic growth to lead to poverty reduction impacts; and thirdly because NIAF is only a small contributor to any economic growth and poverty reduction. Given these challenges, the evaluation will be in a position to measure likely or potential, rather than actual poverty impact.
As indicated in the Evaluation Framework: “the formative evaluation will consider the extent to which processes envisaged in the theory of change are in place and therefore the likely achievement of outcome and impact. The summative evaluation will focus more closely on evidence which tests the impact level assumptions concerning the assumed causal links between infrastructure, growth and poverty”.
The research programme and literature review will be able to contribute to an assessment of the theory of change, and to the likely impact and attribution of NIAF. The formative evaluation has been able to assess whether the NIAF design addresses the theory of change and has examined early progress. It has assessed the NIAF approach and recommended that more emphasis should be given to poverty targeting. The summative evaluation will assess the extent to which the NIAF approach has been practicable and will make early assessments of its impact (or likely impact) on growth and poverty reduction.
NIAF’s own monitoring data contributes to some extent to an assessment of the distribution of the improved infrastructure and services. This evaluation’s literature review provides some insight on its likely impact on poor people. We anticipate that for the summative evaluation an assessment of impact and likely impact will be possible through analysis of monitoring data, and national secondary data on growth and poverty, supported to an extent by our telephone perception survey. The telephone survey will enable an assessment of the perception of improvements to infrastructure and service provision from a cross-section of the population including indirect beneficiaries of the programme (e.g. rural road users). Analysis by geography and occupation will give some indication of

Formative Evaluation of NIAF II
27
the degree to which the poorest are covered by this survey, comparison with census data will indicate the limitations to this form of survey, and these limitations will be made clear. We also anticipate that by the time of the summative evaluation, we will be in a position to use emerging research findings from the UIREM research component (see section on Summative evaluation above) that will help to better assess the NIAF theory of change concerning the causality of infrastructure, economic growth and the potential for poverty reduction.
Security
The heightened levels of security at the time of the field visit limited somewhat our ability to visit project sites in the North. Clearly this limits our ability to verify and observe impact on the ground and to obtain end-user assessment. It was possible to visit other project sites and we were able to meet selected beneficiaries by inviting them to be interviewed in Kano.
This is a potentially more severe limitation for the summative evaluation as ground impact of NIAF activity at this stage of the programme is still limited, especially in the North. We anticipate that for the summative evaluation we may be able to make more use of our local partner teams to visit project sites and to conduct beneficiary interviews.
Reliability and availability of data
The original methodology proposed consultations with a minority of clients during the fieldwork phase. This could have reduced the reliability of the data by restricting the number of consultees. The revised method which incorporates the broader extent of client consultations has increased the coverage to 95 per cent of client organisations. This ensured that client interviews were not limited to a sub-set of clients selected by the NIAF II management team, and means that we can be confident of our findings as reported by clients. The perception survey does have limitations – most notably that perceptions are not always reliable measures of quality, but these are common to all polling methodologies. As far as possible, the sample has been stratified to reflect the relevant populations although it is recognised that a telephone survey is likely to exclude the lowest income population. By using the same methodology as NIAF, the data can be added to NIAF outcome data to increase the chances of detecting a change in perceptions of infrastructure quality. Other methods (including site-based interviews of beneficiaries) will be used to obtain perceptions of the poorest in the population.
The possibility of bias in the evaluation evidence base is limited as far as possible by the use of a full range of data sources including programme documentation, the wider literature, and consultation with programme stakeholders. As indicated above, we have consulted almost all the NIAF clients and we recognise that they have an interest in NIAF engagement. However in addition to the NIAF clients, we have been able to independently select and interview other informants based on our stakeholder mapping exercise, and we have independently selected and visited project sites wherever possible. We recognise that we have been dependent on NIAF’s own monitoring data and reports, although we have also had the benefit of the independent assessments reported in the Annual Reviews and by the semi-annual TRP.

Formative Evaluation of NIAF II
28
3 Background and Context
Overview of Nigeria’s Development Challenges 3.1With its 171 million inhabitants, Nigeria is the most populous country in Africa and the seventh most populous in the world. It also has the largest economy of the continent with an estimated nominal GDP of $510 billion, surpassing South Africa’s $352 billion. Over the last decade, it has maintained a fairly stable growth rate which reached 7.4 per cent in 2013 and has been mainly driven by the expansion of the non-oil sector, especially in agriculture, trade and services (AfDB 2014). It has a positive overall macroeconomic outlook and is likely to sustain its heightened growth rate over the coming years. Yet the country also faces some complex development challenges, including high levels of poverty, unemployment and inequality, weak governance, corruption and instability in various regions, which need urgent attention in order to unlock the country’s full development potential.
Despite the recent positive signs of economic diversification, the oil sector continues to dominate the Nigerian economy and constitutes an estimated 95 per cent of total export earnings and 75 per cent of consolidated Government revenues (World Bank 2014). This makes the country highly vulnerable to oil price shocks and poses a major balance of payment and budgetary risk to the country.
Nigeria’s decade-long sustained growth has also failed to sufficiently address poverty and unemployment – two of the most severe challenges facing the economy. Approximately 64 per cent of Nigerians live on less than $1.25 a day with poverty being particularly concentrated in the North. Unemployment, especially among the youth, is high, already fuelling social tensions and making young men vulnerable to extremism and criminal activities. These problems are directly related to the low productivity and poor diversification of the country’s economy and their solution requires sustained and rapid economic growth in the non-oil sectors.
One of the greatest constraints to growth is poor infrastructure. Business surveys have consistently identified unreliable power supply as the biggest obstacle to doing business in Nigeria, followed by poor roads and weak governance. The current electricity grid supplies approximately 4,300 MW of available generation against the estimated demand of 10,000 MW (World Bank 2014). Users face power outages more than 320 days a year, which is many times higher than in most other African countries, and makes business highly dependent on backup generators. According to some estimates, this results in loss of more than 10 per cent of formal private sector revenues, and the aggregate social cost of power outages add up to approximately 3.7 per cent of the GDP (Foster & Pushak 2011).
Although the density of both paved and unpaved roads in Nigeria is almost twice as high as in similarly resource-rich African countries, the lack of maintenance of the road networks during military rule brought it to close to collapse. According to a survey conducted by NIAF I, almost 50 percent of the Federal Road Network is in a poor or collapsed condition, and the state of rural roads is even worse, with 70 per cent being in a poor or collapsed condition. The latter is especially damaging for the agriculture sector which employs almost 70 percent of the total workforce, as it seriously limits the ability of agricultural products to reach markets, and thus significantly constrains its growth potential.
Nigeria has the second longest national rail network in the continent after South Africa, but as with the road networks, historical neglect has led to its almost complete collapse. Between 1960 and 2005, traffic volumes decreased from 3 million tonnes per annum to 15,000, which is equivalent to about five trucks per day, and passenger traffic declined from 3 million to 500,000 passengers per year, which is equal to about 25 buses per day (Foster & Pushak 2011). As a result, railway now accounts for less than 1 per cent of land transport in Nigeria (Olaseni & Wade 2012).
Being a resource-rich country, the reason behind Nigeria’s infrastructure deficit is not so much the lack of funding, but rather the poor use of funds, which is a result of weak government capacity and corruption. Decades-long authoritarian rule has left the Nigerian civil service significantly weakened. Poor institutional and technical capacities, including public financial management and public procurement, pose a major challenge to effective and efficient delivery of infrastructure projects. This is exaggerated by the dominance of patronage and geo-political considerations in deciding appointments, which make the development of a merit-based civil service difficult. Capacity problems

Formative Evaluation of NIAF II
29
are present at every level of the government, but became even more prevalent at the sub-national levels.
Rapid urbanisation, while being an important opportunity for economic growth, also poses a major challenge to development. Approximately 50 per cent of Nigerians already live in cities, and their number is predicted to grow to 94 million by 2015 and 157 million by 2030. However, the expansion of urban infrastructure is occurring at a much slower pace than population growth. Traffic congestions, poor service coverage and delivery, and low quality infrastructure constitute a pressing challenge and a significant constraint on the economic development of cities. Local governments have limited financial and technical capacities to address these issues, and the lack of city-level coordination has so far prevented the development of coherent and comprehensive urban development strategies.
Climate change is another important challenge that will likely affect Nigeria’s long-term growth potential, as its economy is highly dependent on climate sensitive industries, such as agriculture, forestry and extraction. Some of these negative effects are already felt across the country. The flooding in 2012 was the worst experienced in this century, leading to significant damage to infrastructure and loss of crops and livestock. It is estimated that cropland degradation nationwide accounts for between 1.7 and 6.4 percent of GDP. The already underdeveloped North, where most people are highly dependent on water and land resources, is even more vulnerable to climate change, and high population growth and poverty, resource depletion, rainfall variability, recurrent droughts and floods, soil infertility and erosion and deforestation already threaten around 80 per cent of the population. In the Middle Belt, conflicts between farmers and cattle herders over land are commonly associated with climate change that has caused increased pressure on traditional grazing areas (World Bank 2014).
These challenges are more pronounced at the North of the country which is historically less well-developed than the South. While the national poverty rate is estimated around 64 percent, in some Northern states it reaches 77 per cent. Unemployment is also higher, reaching 21.9 per cent in the North-West as opposed to 8.9 per cent in the South East (World Bank 2014). Similarly, Northern Nigeria falls behind in education and health outcomes. These disparities have greatly contributed to the emergence of the Boko Haram insurgency, which to date has cost more than 4,000 lives, displaced close to half a million people and destroyed hundreds of schools and government buildings, further impeding economic development in the North (ICG 2014). Curbing violence and instability will not be possible without addressing the root causes of the conflict. Among these are regional disparities, to which infrastructure development and the improvement of service delivery are critical contributors.
Response of the Government 3.2The Government is not oblivious to these problems and has recently embarked on several ambitious reforms aimed at addressing the most important constraints to economic growth, including poor infrastructure. The long term strategic policy and developmental direction guiding these reforms is encapsulated in the Nigeria Vision 20:2020 policy document (NV20:2020), which aims to transform Nigeria into one of the 20 largest economies in the world by year 2020 with a GDP growth target of not less than US$900 billion and a per capita income of US$4,000 per annum. This vision is driven towards optimising the human and natural resource potentials of the nation to achieve accelerated and sustained economic growth, as well as translate economic growth into equitable social development that guarantees a dignified and meaningful existence for its citizens.
The policy framework document includes the vision and strategies to achieve stated objectives in the areas of citizenship development and inclusion, healthcare, education, economy, industrialization, democracy and governance, infrastructure and the sustainable management of the natural resource base. It also hopes to achieve "a market-friendly and globally competitive business environment that induces and supports the full mobilisation of all economic sectors and a level of environmental consciousness that enables and supports sustainable management of the nation's God-given natural resource endowments to ensure their preservation for the benefit of present and future generations".
This economic transformation strategy for the NV20:2020 is supported by three overarching pillars of:
1. Creating the platform for success by urgently and immediately addressing the most debilitating constraints to growth and competitiveness;

Formative Evaluation of NIAF II
30
2. Developing the envisioned economy through diversification of the economy, transforming the Nigerian people into catalysts for growth and national renewal and investing to create an enabling environment for the co-existence of sustainable growth and development;
3. Developing and deepening the capacity of government in consistently translating national strategic intent into action and results by instituting evidence-based decision making in Nigeria's public space.
Recognising its importance in overcoming one of the most important constraints to growth, when President Goodluck Jonathan took office, he placed power sector reform on the top of his agenda. He left the Ministerial position vacant and set up the Presidential Committee on Power which he chairs himself and which is supported by the Presidential Task Force on Power.
He also embarked on the most comprehensive and complex power sector reform ever undertaken in Africa. The programme: (a) establishes an independent regulator for the sector, the Nigerian Electricity Regulatory Commission; (b) sets up a commercial framework for the sector, with cost-reflective electricity tariffs; (c) establishes a bulk trader; (d) privatizes the Power Holding Company of Nigeria’s (PHCN) six successor generation companies; (e) privatizes the eleven PHCN successor distribution companies; and (f) continues efforts to strengthen the gas-to-power segment. This reform programme has already achieved some significant progress. In September 2013, the Government officially handed over the 10 distribution companies and 5 generation companies to new core private investors, which is expected to add around $3.3 billion to the federal budget3. In addition, this has delivered tangible improvements in available power supply, grid stability and revenue collection.
In 2013, a National Integrated Infrastructure Master Plan (NIIMP) was approved. This is a 30-year plan for accelerating infrastructure development to be implemented by 10-year operational plans and 5-year medium-term plans. It presents a comprehensive approach to address Nigeria’s infrastructure decay and covers various sectors, including energy, transport, housing, water, social infrastructure, and information and communication technology. The implementation of NIIMP is expected to cost $2.8 trillion, 48 per cent of which will be financed by the private sector.
The Government also set up the Subsidy Reinvestment and Empowerment Programme (SURE-P) to mitigate the impact of reducing petrol subsidy in 2012, especially on the poor. The programme also promotes investment into infrastructure, health, education and social safety net programmes. In particular, it will finance the rehabilitation of key road links, such as the Abuja-Abaji-Lokoja, Benin-Ore-Sagamu, Onitsha-Enugu-Port Harcourt, Kaduna-Maiduguri, and East-West Road links, together covering more than 1,600 km of roads.
The Administration of President Jonathan has also made significant efforts to reform the public sector. In 2012, the Treasury Single Accounting and the Government Integrated Financial Management Information Systems (GIFMIS) were introduced as an attempt to improve public financial management. There are also plans to scale up the Integrated Payroll and Personnel Information System to cover all ministries, departments and agencies to eliminate ghost workers from the government payroll, saving millions of Naira. Finally, the Freedom of Information Act was enacted in 2011, which fosters government transparency through requiring all publicly funded institutions to be open about their operations and expenditures, and grant access to citizens of information about their activities.
The Government is also in the process of finalising the National Climate Change Policy and Response Strategy and the National Adaptation Strategy and Plan of Action for Climate Change in Nigeria. These aim to ensure that climate change considerations are taken into account in the formulation and implementation of government policies, strategies and programmes.
At the same time, it is also important to note that while the Johnathan Administration has shown strong commitment to carry on with these reforms, the upcoming elections in 2015 are likely to limit the space for reform attempts in the next year and a half as policy makers enter in electoral campaign. The
3 This corresponds to the monies paid to the exchequer by the private sector operators for the distribution and generation concessions.

Formative Evaluation of NIAF II
31
reform process is expected to continue once elections are completed and the incoming regime has fully bedded down. DFID Policies and Priorities.
DFID’s Operational Plan in Nigeria 3.3Based on its 2011-2015 Operational Plan, DFID Nigeria works toward a more democratic and prosperous Nigeria that meets the basic needs of its citizens - through reducing internal conflicts, deepening democracy and building the confidence of investors. Critical to this vision are better governance both at Federal and State levels and unleashing the country’s growth potential to create more jobs, raise incomes and reduce poverty. This latter requires removing constraints on businesses, building investor confidence and making markets work for the poor. The Operational Plan also highlights the importance of addressing the root causes of fragility and instability in the North and the Niger Delta, among them unemployment, poor governance and political exclusion.
DFID’s wider strategic approach to infrastructure development that consists of six broad elements4:
■ Direct provision of services to improve access for poor people, including water and sanitation, energy and transport, and infrastructure that enables access to health and education services.
■ Working with the private sector to increase private investment in infrastructure;
■ Strengthening regional trade corridor approaches in Africa;
■ Infrastructure’s role in low-carbon development and improving resilience to climate change;
■ Infrastructure reconstruction in post-conflict states, and
■ Engaging with the multilaterals to ensure the highest development impact from UK taxpayers’ money.
In line with this strategic approach, DFID implements or financially supports various infrastructure programmes similar to NIAF. Examples of these include:
■ India Infrastructure Equity Fund
■ Support to the Private Infrastructure Development Group
■ Support to the ADB managed Afghanistan Infrastructure Trust Fund
■ India Infrastructure Policy Fund
■ Support to the Emerging Africa Infrastructure Fund
■ Support to the Public Private Infrastructure Advisory Facility
4 DFID's Role in Building Infrastructure in Developing Countries: Government Response to the House of Commons International Development Committee's Ninth Report of Session 2010–12. Available at http://www.publications.parliament.uk/pa/cm201012/cmselect/cmintdev/1721/1721.pdf

Formative Evaluation of NIAF II
32
4 Literature Review: Infrastructure, Economic Growth & Poverty Reduction
This section summarises the findings of a literature review of some the key links underpinning the NIAF II theory of change (ToC), namely:
■ Link between economic growth and poverty reduction ■ Link between improved infrastructure in the power, roads, rail and urban sector and economic
growth ■ Link between improved infrastructure in the power, roads, rail and urban sector and poverty
reduction ■ Link between privatisation and economic growth ■ Link between green growth and poverty reduction
The full review can be found at Appendix 7.
There is strong evidence in the literature that economic growth is a key contributor to poverty reduction (Roemer & Gugerty 1997; Ravallion 1994; Ravallion 2001; Adams 2002; AFD 2005). At the same time, some recent studies suggest that growth alone is not sufficient to fight poverty, and much depends on the nature of growth. Sub-Saharan Africa, for instance, exceeded the average annual growth rate of the rest of the developing world (excluding China) by more than 0.9 percentage points in the last decade, but the rate of poverty reduction lags behind other regions (World Bank 2013; and similar findings in Martins 2013; Dulani, Mattes & Logan 2013). The World Bank’s Africa Pulse report argues that the main reason behind this is the continent’s high level of inequality which reduces the growth elasticity of poverty, estimated at -0.7 compared to -2.0 in the rest of the developing world (excluding China) - i.e. increases in GDP per capita have a relatively small impact on poverty reduction. Other authors also highlight that simultaneously addressing inequality is critical (Bhorat & Westhuizen 2008; de Janvry & Sadoulet 2000; Bourguignon 2004), and stress the importance of the pace (AFD 2005) and pattern (Martins 2013; OECD 2006; Hull 2009) of economic growth – i.e. it has to be rapid and sustained, and has to concentrate in the sectors and places where the poor are economically active and live.
There is also significant evidence in the literature of the positive link of infrastructure to economic growth, especially in poor countries (Calderón 2009; Calderón & Servén 2008; UN HABITAT 2011).Calerdón (2009) argues that the growth payoff in Sub-Saharan Africa of it reaching the level of infrastructure development of Mauritius (the African leader in this area), would be 2.3 percent of GDP per year. Similarly, a UN-HABITAT (2011) report found that infrastructure investments accelerated the annual growth convergence rate in Africa by over 13 percent over the last 30 years, with the strongest contribution coming from telecommunications, followed by roads and electricity. Some studies suggest that this positive impact is mainly coming from more, rather than better, infrastructure (Fan & Chan-Kang 2004; Teravaninthorn & Raballand 2009; Calderón 2009).
Evaluations of road investment projects suggest that they contribute to economic growth through improved journey times, both for goods and people, and reduced transport costs (AfDB 2010; ADE 2004; World Bank 2008). Some of these studies also found evidence of increased agricultural and other economic activity along the roads (ADB 2000; World Bank 1997). Similarly, the findings suggest that improvements in urban transportation are also important contributors to economic growth (Cox 2012; Gannon & Liu 1997; Cox 2007; Remy & Lee 1998). Based on data from 99 urban areas, Cox (2007) found that the amount of travel time, along with the extent of economic freedom, is strongly correlated to average gross product per capita. Improvements in urban transport can also: (i) increase the competitiveness of small firms; (ii) ease the entry of new firms; and (iii) increase the efficiency of the labour market, which can together lead to increased urban productivity (Gannon & Liu 1997).
While there is strong evidence that infrastructure development contributes to economic growth, the review findings suggest that the link between improved infrastructure and poverty reduction is more contested. Some argue that improvements in infrastructure can reduce poverty through greater access to services, such as: (i) health; (ii) education: and (iii) markets, providing increased economic opportunities for the poor, especially in the non-farming sector, and time-saving benefits (Brenneman & Kerf 2002; Willoughby 2004). On the other hand, some experts suggest that improved infrastructure is more likely to benefit those closest to the poverty line, while delivering little benefit to the poorest of

Formative Evaluation of NIAF II
33
the poor, at least in the short-term because they often don’t have access to, or cannot afford, infrastructure and services (UN HABITAT 2011). Some even argue that the poorest of the poor can be negatively impacted by infrastructure projects as their livelihoods are dependent on activities such as head-loading or charcoal production, which may be directly or indirectly displaced by these improvements (Cook et al. 2005). The extent to which the poor benefit is also greatly dependent on the way infrastructure is delivered – i.e. with the use of labour- or capital-intensive methods; or depending on the subsidy structures introduced.
In the urban context, the literature suggests that, in the past, transportation development projects often focused on motorised means of transport (Hook 2006; GiZ 2002). These tend to benefit the poor only to a limited extent, mostly due to affordability problems, and they are over-represented among the victims of its adverse impacts that include displacement, health damage and road accidents (Hook 2006; GiZ 2002; Badami, Tiwari & Mohan 2004). The findings, therefore, indicate that in order to be pro-poor, urban transport projects should give greater attention to non-motorised means of transport, such as walking and cycling, on which the poor, especially women and children, rely. Additionally, the literature highlights the importance of affordable public transportation linking peripheral areas to economic centres (Pardo 2012; Hook 2006).
With regard to privatisation in the energy sector, the literature suggests that there is a positive link to the reliability of power supply and the performance of electricity companies (Bacon & Besant-Jones 2002; Katagiri & Ito). At the same time, some authors argue that privatisation alone does not necessary lead to performance improvements, and much depends on the way privatisation and power sector reform are implemented (World Bank 2005). Some studies suggest that it is the introduction of competition rather than privatisation that leads to improvements in power supply (Zhang, Parker & Kirkpatrick 2008; Kessides 2012). It is also clear from the literature that the privatisation of the power sector rarely benefits the poor in the short run. Firstly, because the poor often do not have access to electricity; and secondly because privatisation tends to increase the price of electricity for those that do have access (Galal, Tendon & Vogelsang 1994).
Evidence suggests that the privatisation of rail services in developing countries, especially in Africa, also shows encouraging results. In most cases, the performance of the rail companies, volume of freight traffic and quality of services have increased (World Bank 2003; Bullock 2005; World Bank 2011; Bullock 2009). Lowe (2014) also found evidence of significant beneficial localised impact of rail services on economic activity in Sub-Saharan Africa.
There is also an emerging consensus in the literature that green growth can deliver major benefits to developing countries through both fostering economic growth and human development, and safeguarding the environment (Hallegatte et al. 2011; World Bank 2012; OECD 2013; OECD 2012). According to a report published by the World Bank (2012) green growth is necessary, efficient and affordable and there is substantial scope for growing cleaner without growing slower. Similarly, a recent OECD study (2013) argues that green growth is critical to the sustainable future of developing countries and can lead to great economic and social benefits, including for the poor.At the same time, it is also clear from the literature that the extent to which these benefits can materialise is highly dependent on the way green growth policies are designed, especially with regard to their impact on poverty reduction (Dercon 2012;Hallegatte et al. 2011; World Bank 2012; Huberty et al. 2011; Bowen 2012; Cook, Smith & Utting 2012). Dercon (2012), for instance, suggests that proponents of green growth often ignore important trade-offs between the nature of the growth strategy and the sector and spatial processes behind effective poverty reduction. He argues that if these trade-offs are not adequately addressed in the design of a green growth strategy, they may negatively impact on the poor instead of delivering benefits. Additionally, Cook et al. (2012) stresses the importance of deeper transformation of the social structures, institutions and power relations underpinning vulnerability and inequality in ensuring that growth is not only equitable but also inclusive. Finally, there are various studies looking at the employment generating potential of green growth. Huberty et al. (2011), for example, argue that green growth has the potential to create additional employment opportunities, but it might not be enough to offset the job losses in the “brown” sectors, especially in developing countries that built their industrial development strategies on carbon-based energy. However, Bowen (2012) did find evidence that renewable energy supply is more labour intensive than traditional fossil-fuel-based supply, and also argues that it is not likely to be more labour-intensive than several other activities on which governments could spend in order to generate social benefits.

Formative Evaluation of NIAF II
34
5 Evaluation Findings
This section presents the evaluations findings against the key questions outlined in the evaluation framework.
Performance findings 5.1
5.1.1 Relevance
The design and objectives for NIAF II are set out in the DFID Business case and logframe and more recently in the NIAF PMU’s NIAF overall theory of change5. These are based on a contextual analysis similar to that summarised in section 3 above. This section looks in more detail at the design and relevance of the NIAF II programme in response to that contextual analysis.
The long-term change sought by NIAF II is that more effective infrastructure investment in Nigeria supports growth and the reduction of poverty. This is reflected in the NIAF II log frame impact and outcome statements:
■ Impact Reduced infrastructure constraints to growth in non-oil gross domestic product and employment, leading to reduced poverty
■ Outcome Enhanced management of infrastructure development at the federal level and in selected states
The process of change rests on an approach that is guided by an engagement strategy based on key principles of demand responsiveness, political economy awareness, flexibility and influencing as described in the NIAF PMU’s overall theory of change.
Relevance of NIAF II to Nigeria’s National Policy Goals Since it is a primarily demand driven programme aimed at overcoming the major constraints to economic growth, NIAF is well integrated with the NV20:2020 as well as with other sectoral policy documents in the areas of electricity and power, transportation, urban development and environmental management. In implementing Phase I and now Phase II of the programme, NIAF has developed a closely-knit relationship and the Federal Government of Nigeria as well as participating State governments that have become catalytic to achieve its development objectives. This close relationship has enabled NIAF to pattern its development assistance and technical support to sectors that are the most pressing to government development interests and which conform to national policy measures aimed at enhancing economic development, improving service delivery, reducing unemployment and poverty, and achieving environmentally sustainable development.
While most of the components are tied to the NV20:2020, NIAF also tackles a number of development issues that were not highlighted as main priorities in the document, but are highly important for DFID’s Nigeria Strategy and its wider development objectives. The most important among these are climate change and social and economic development in northern Nigeria.
Relevance of NIAF II to DFID NIAF II plays a central role in realising DFID Nigeria’s 2011-2015 Operational Plan as it seeks to address key infrastructure obstacles to economic growth and poverty reduction. Business surveys and national opinion polls consistently identify inadequate power supply and poor condition of roads and railways as the two greatest constraints on doing business in Nigeria. The power sector, and roads and railway work streams directly address these constraints, while the effective cities work stream specifically targets urban infrastructure and related services to stimulate growth and job creation in rapidly expanding Nigerian cities.
5 NIAF overall story and detailed sector stories: Compilation incorporating NIAF theories of change, NIAF PMU June 2014

Formative Evaluation of NIAF II
35
NIAF’s work is also highly relevant to addressing poor governance - both another important constraint on economic growth and a major development challenge in itself. The capital projects work stream tackles weak governance through strengthening capital programme planning, budgeting, appraisal and execution on the federal level, while the other work streams aim to enhanced governance in their respective sectors. Finally, by improving infrastructure in one of the most deprived region of the country, the Northern Growth work stream contributes to reducing regional inequality and instability in Northern Nigeria.
Through supporting sustainable infrastructure service delivery, promoting public-private partnerships in financing infrastructure projects and incorporating a Climate Change work stream, NIAF also fits well with DFID’s wider strategic approach to infrastructure development.6 It is also closely aligned with DFID’s new strategic framework for economic development which focuses on supporting the global and national environments for trade, investment and private sector growth, and ensuring that growth is inclusive, and benefiting girls and women. To support this, funding for infrastructure will increase and there will be greater attention given to urban issues. DFID recognizes the challenge to ensure effective investment of funds and to optimise the use of resources. It acknowledges the need for specialist expertise in infrastructure that can provide innovative ideas, and for the close engagement of local partners in order to build capacity and make development work sustainable.
Finally, as NIAF II’s overarching objective is to reduce infrastructure constraints to growth in non-oil gross domestic product and employment, it is also consistent with the Strategic Priority 3 of DFID’s overall Business Plan for 2011-2015 that aims to make British international development policy more focussed on boosting economic growth and wealth creation. Its Climate Change work stream and responsiveness to the challenges of climate change across it programmes make the programme highly relevant for DFID sixth Strategic Priority as well, namely to drive urgent action to tackle climate change, and support adaptation and low carbon growth in developing countries.
Design The business case for the (expanded) NIAF II sets out a draft theory of change which has since been built on by the NIAF PMU in the form of NIAF ‘sector stories’: one for NIAF II overall, in addition to individual ‘stories’ for each of NIAF’s six core components or sectors – power, roads and railways, capital projects, effective cities, northern growth and climate change.
The NIAF II business case articulates a theory of change which argues that high quality and well-targeted technical assistance can (i) increase the funds available for infrastructure spending, (ii) strengthen the effectiveness of existing expenditure, and (iii) thus reduce poverty through faster economic development associated with better infrastructure provision. The theory of change is informed by a theory of the processes which drive poor infrastructure delivery.
Figure 1.2:below sets out the diagrammatic theory of change developed by the UIREM evaluation team and Appendix 3 includes a summary of the hypotheses (assumptions and causal factors) deduced by UIREM from the NIAF overall and sector stories.
6 DFID's Role in Building Infrastructure in Developing Countries: Government Response to the House of Commons International Development Committee's Ninth Report of Session 2010–12. Available at http://www.publications.parliament.uk/pa/cm201012/cmselect/cmintdev/1721/1721.pdf

Formative Evaluation of NIAF II
36
Figure 1.2: NIAF II theory of change7
Addressing Nigeria’s infrastructure challenges will require increased and sustained expenditure (Nigeria is well below the accepted benchmark for required investment and current value for money is poor). The capital projects workstream addresses poor quality projects and misallocation of capital resources through the provision of technical assistance for capital works, planning budgeting and evaluation working through key and influential government institutions.
The newer sectors of climate change, effective cities, and the cross-cutting Northern growth were introduced as ‘risk mitigation’ for factors (drought, flood; rapid, unplanned urbanisation; and extreme poverty, conflict and insecurity) which were considered to threaten economic growth. In the case of effective cities, it was also argued that support for the effective functioning of cities (including those in the North) would contribute to economic growth, and that a climate change workstream would also generate ‘green growth’.
Our literature review (Section 4 and Appendix 7) indicates that the main links underpinning NIAF II are valid. In particular, it suggests that the different interventions supported by NIAF have the potential to reduce infrastructure constraints which contribute to economic growth. The review also indicates a strong link between economic growth and poverty reduction. At the same time, it is also important to note that our review suggests that these links are not necessarily automatic and, to maximise their impact, infrastructure interventions should be designed in a way that directly addresses the special needs of the poor.
The NIAF theory of change including the compilation of sector stories is a valuable document setting out the contextual analysis, the NIAF approach, sector approaches and how the ‘risk-mitigating’ outputs of cities, climate change and Northern growth are addressed, and how poverty reduction is also addressed. It describes in some detail NIAF’s influencing and engagement strategies – overall
7 Adapted by UIREM from NIAF overall story and detailed sector stories: Compilation incorporating NIAF theories of change, NIAF PMU June 2014
Impa
ct Reduced infrastructure constraints to growth in non-oil gross domestic product and employment, leading to reduced poverty
Out
com
e
Enhanced management of infrastructure development at the federal level and in selected states
Proc
ess DEMAND DRIVEN
and rapid response
POLITICAL ECONOMY
AWARENESS
FLEXIBILITYto meet evolving
client needs
INFLUENCE, relationships & communication
Out
puts 1.
POWER2. ROADS & RAIL
3.CAPITAL
PROJECTS
4. NORTHERN GROWTH
5. CLIMATE CHANGE
6. EFFECTIVE CITIES

Formative Evaluation of NIAF II
37
and for each output, technical approaches and expected results, and where there are synergies between sectors.
As such the document is a particularly useful tool for programme monitoring and evaluation. It could be improved with the addition of a summary diagram (such as the one developed by UIREM) and a clearer setting out of the assumptions made (the external conditions necessary for success) and the causal factors (or drivers of change) along the results path (input-output-outcome-impact), and in particular the assumptions concerning the linkages between economic growth and poverty reduction .
5.1.2 Efficiency and value for money in resource allocation
The governance and management structure of NIAF II has evolved over the period of execution of the programme. This evaluation agrees with the Annual Review team that this structure now provides an efficient framework for cost-effective delivery of programme inputs and outputs. This conclusion is based upon the data and evidence which the evaluation team has been able to obtain from the NIAF II project management database, documentary review and interviews with clients, stakeholders and beneficiaries. A more thorough assessment of the overall value for money offered by the programme at this stage of implementation is provided at Section 5.2.7 below.
The nature of the programme is demanding on both governance and management, due to: (i) its large size; and (ii) the ambitious and high-risk rating of many of its proposed outputs. The demand-led nature of the programme calls for a careful balance to be drawn between the need to be flexible and act quickly to obtain quality human resources, and the need to achieve good value for money through paying a fair price for the resources used.
The second Annual Review8 provides a section on Economy which evaluates whether the programme manager’s Programme Management Unit (PMU) is providing inputs of the appropriate quality and at the right price. The nature of the programme required that a framework be set up at the outset to ensure that the unit costs of consultancy, in terms of fee rates and related out of pocket expenses, offered good value for money.This is important since: (i) consultant costs are passed directly through to DFID; and (ii) even large projects funded under the facility are not competitively tendered. The fact that the management contract was procured through a process of international competitive tender followed by extensive negotiations between the preferred supplier and DFID provides comfort that a fair price was obtained. Furthermore, it is reported9 that savings were made under NIAF II with respect to NIAF I, and further savings were made in the negotiation of the NIAF II extension. Fee rate calculations for consultants used on NIAF II projects are based on a transparent process under which both the PMU and DFID evaluate CVs10 and, if accepted, apply the scoring to pre-agreed fee-rate bands which correspond to industry norms. However, it has been observed that the procurement process was constrained somewhat by limited effective competition – i.e. a paucity of credible bidders. This reflects both the size and complexity of the programme (which very few suppliers have the capability and depth to carry out successfully), and reflects some of the difficulties of working in Nigeria. It is hard to see what might have been done differently.
During 2013 NIAF II management information suggests that year-on-year average fee rates reduced by six percent from the 2012 level. This is reportedly11 a result of: (i) a one percent reduction in fee rates agreed as part of the programme extension; (ii) the allocation of greater management resources to the recruitment process; (iii) use of the fee rate calculation methodology adopted in 2012; and (iv) the prioritisation of local consultants where appropriate. Furthermore, the Annual Review reports that the fee rates agreed under NIAF II are consistent with market norms, considering the levels of skill and
8 NIAF II Second Annual Review (for 2013) 9 NIAF II Second Annual Review (for 2013) 1010 In terms of Qualifications (20%) Specialism (40%) and Experience (40%) 11 NIAF II Second Annual Review (for 2013)

Formative Evaluation of NIAF II
38
experience required, and are comparable with those applied under similar DFID programmes across Nigeria.
The share of project costs spent on programme management is a key indicator of economy and efficiency.The 2013 Annual Review indicates that the proportion of total project costs disbursed against programme management as a proportion of the whole decreased from about 11 percent in second half of 2012 to just over 7 percent in 2013.This was partly attributed to increases in the volume of spend in 2013 without a commensurate increase in the management costs. A further reason was changes made to the management structure, with a management team of five now responsible for managing the workstream projects, thus allowing workstream leaders to focus on technical matters. However, analysis of recent cost data from NIAF II (see Table 1.2: below) indicates PMU costs increasing in 2014.This is largely due to the inclusion from Q1 2014 of payments due under the Results-Based Funding Structure (RBFS), paid based on the performance of the contractor against logframe output milestones during H2 of 2013.This is charged against PMU cost, but is in reality not a management cost, and so is not reflective of the efficiency of Facility management. If these payments are excluded, project management costs remain at between 4.8 per cent and 7.4 per cent of total expenditure. Over the entire programme, the proportion of total spend attributable to PMU costs is 11.5 per cent including RBFS payments and 9.9 per cent without. This appears to represent a reasonable management cost for the Facility.
Table 1.2: NIAF II Expenditure and PMU Costs
The efficiency of the programme in converting inputs to outputs is supported by a number of programme features: (i) a system for selecting projects which closely maps them to output indicators; (ii) ToRs which are aligned with logframe outputs and agreed by the PMU, the client and DFID; (iii) the RBFS (introduced in 2013); (iv) the role of the TRP in evaluating performance against the logframe; and (v) the flexible nature of the logframe itself.
Project Selection: NIAF’s original ‘commissioning’ model12 for project selection has been refined to provide a more strategic approach under which workstreams are required to develop and maintain Indicator Strategies13 for each output element for which they are responsible. These set out the proposed programme of work and individual projects that will contribute to this, and are approved by the PMU. The individual project Terms of Reference consequently now involve less emphasis on detailing how the particular intervention contributes to achievement of the logframe as this is dealt with in the Indicator Strategy. The original project scoring criteria for projects which have been applied throughout NIAFII remain in place.
The Results-Based Funding Structure (RBFS): The RBFS was introduced as part of the NIAFII cost extension, and provides an innovative approach in linking payments to results achieved. In so doing, it 12 A process whereby Workstreams sought PMU approval for individual projects on a case-by-case basis using a Terms of Reference format that required extensive explanation of how each individual project would contribute to the achievement of NIAF’s logframe. Standard screening criteria and an associated scoring system were applied in establishing project suitability. 13 These sit within the framework set out by the sector stories.
NIAF Expenditure to June 2014
CumulativeQ1'12 Q2'12 Q3'12 Q4'12 Q1'13 Q2'13 Q3'13 Q4'13 Q1'14 Q2'14
Projects (Y) Total 3,009 3,861 4,265 3,816 5,485 5,781 5,717 5,287 5,474 5,309 48,004 9.9 Off-Logframe (O) Total 17 19 15 14 - - - - 163 98 325 8.0 Cross-Cutting (X) Total 513 132 42 1,245 51 59 353 635 262 150 3,442 YOX Total 3,539 4,012 4,322 5,075 5,536 5,841 6,071 5,922 5,898 5,556 51,771 PMU 1,529 740 497 433 470 437 459 398 322 481 5,766 RBFS 492 492 984 Grand Total 5,068 4,751 4,819 5,508 6,006 6,277 6,530 6,320 6,712 6,530 58,521
PMU cost as % of total net of RBFS 30.2% 15.6% 10.3% 7.9% 7.8% 7.0% 7.0% 6.3% 4.8% 7.4% 9.9%Of which RBFS % 7.3% 7.5%PMU cost % including RBFS 30.2% 15.6% 10.3% 7.9% 7.8% 7.0% 7.0% 6.3% 12.1% 14.9% 11.5%
Source: URIEM from NIAF data
2012 2013 2014

Formative Evaluation of NIAF II
39
creates a powerful incentive to focus on the most important programme outputs and related indicators14. The TRP scores achievement against each logframe output and arrives at the weighted average “raw” score for all the Output (and from H2 2014 Outcome) Indicators. Output scores are between 1 and 5, where 3 is meeting expectations. The raw score is then adjusted for NIAF’s 50 per cent achievement target using a formula which produces an overall “final” score of between 1 and 10.This score is then mapped onto sliding scale of -10 per cent to +10 per cent (where a score of 1 equates to a fee adjustment of -10 per cent; 3 to no adjustment15; and 5 and above an adjustment of +10 per cent) which is applied to all fees (but not expenses)16.From a VfM perspective, the RBFS is designed to ensure that any fee increases can only ever be a very small portion of the additional value creation. The system appears to be working well in focussing attention on achieving outputs. So far, with progress against outputs balanced towards successful achievement of targets in many areas, the RBFS is delivering payments at the top end of the adjustment scale. However, it is too early to determine whether the system is well-balanced as there are significant hurdles facing many workstreams in the near future.
There are risks associated with the RBFS. Focusing payments on output indicators could potentially distort activities towards chasing particular indicators which offer a good prospect of success. This could occur at the expense of wider benefits and VFM considerations, and efforts could become focussed on identifying and cherry-picking easy wins. However this risk is mitigated by the evaluation carried out as part of the Annual Review. For the RBFS, median performance is equivalent to a level A score under the Annual Review. There is a provision in the RBFS MOU which specifies that NIAF cannot receive any top up under RBFS if it receives an annual review score worse than an A. The scoring under the RBFS ensures that a weighted average of 3 across all indicators represents significantly better performance than is required to earn an A in the annual review (which could be earned with 3s on 50 per cent of indicators and no delivery on 50 per cent, giving a weighted average across the logframe of 1.5 for RBFS purposes).
The situation with respect to RBFS payments will change from H2 of 2014 with the inclusion of the outcome indicators – although the percentage assigned to Outcomes is relatively small. The system highlights the importance of the selection of robust and comprehensive indicator targets. However if targets are partial and subject to variations in measurement, the approach might not maximise VFM.One question which cannot be answered at this stage is whether the large increase in recorded PMU costs as a result of RBFS payments is reflected by a similar step change in output value. A DFID review of the process is scheduled for October 2014.
The Technical Review Panel (TRP):The TRP plays a critical role in the governance of the programme and in guiding and monitoring programme performance. Through its evaluation of progress against logframe indicators, it is responsible for determining the quantum of payments due to the service provider under the RBFS. The TRP provides semi-annual reports which set out detailed output-by-output analysis of progress and performance against logframe milestones, highlights issues and constraints, and recommends remedial actions. The TRP determines the individual indicator scores which in turn provide the overall project score for the RBFS. Importantly, the TRP takes an overview of the issues facing each workstream, highlights risks and challenges being faced, and sets out clear recommendations on both: (i) mitigating actions to be taken by the workstream; and (ii) where the logframe targets (at both outcome and output level) need to be reviewed. The TRP also plays an important role in providing high quality strategic advice to NIAF and DFID – a role which it was originally established to perform, and which it played prior to the introduction of the RBFS. The evaluation team agrees that having the same sector experts review progress every six months has been of considerable value in identifying: (i) challenges to workstream progress which could compromise achievement of objectives; and (ii) suggesting corrective actions. The role of the TRP in
14 From H2 of 2014 the RBFS applies to outcomes in addition to outputs, as an increasing percentage: from 15% of total in H2 of 2014 to 25% in H1 of 2015. 15 According to the formula, this would occur with an average weighted score against logframe indicators of 2.0. 16 In VfM terms a +10% adjustment would correspond to twice the expected level of logframe achievement; effectively, therefore, the ratio of additional returns for DFID and the SP is 10 to 1 (i.e. if NIAF produces 50% higher returns than estimated in the business case fees are increased by 5%). The original Logframe, all weightings and all subsequent changes and scoring metrics have to be reviewed by the TRP and approved by DFID in advance in order to ensure accountability.
Formative Evaluation of NIAF II
40
evaluating achievement against indicator milestones will become still more challenging with the introduction of outcome level indicators into the RBFS.
Dynamic Logframe: The demand-responsive nature of the programme, and rapidly changing circumstances on the ground demand that the Logframe: (i) provides a clear structure for the achievement of programme outputs, outcomes and impact, and (ii) allows adjustment within this structure to maintain relevance and effectiveness in guiding the programme as circumstances on the ground change. The dynamic logframe appears to have been effective in achieving this as a result of the framework provided through the TRP.A balance needs to be struck between retaining a strategic transformational perspective and at the same time providing highly specified indicators which enable accurate measurement of progress towards programme outcomes and impact –particularly with its role in determining RBFS payments.
Monitoring and Evaluation: The NIAF M&E system is largely driven by the results-based funding structure (RBFS) and the semi-annual visit of the TRP which applies a scoring metric to advise on the achievement of each Output indicator and associated milestone. This has so far focused on Outputs but will, from 2015, start to score Outcome achievement. In its report the TRP discusses success and weaknesses of the programme and, in providing a scoring, suggests corrective action on the part of the NIAF team. From 2015, an increasing graduation of weighting is given to Outcome achievement over Output achievement. The Annual Review process is an additional driver of the monitoring system. This also uses the NIAF monitoring data to score Output-level performance for the wider DFID performance measurement and programme management.
The monitoring system conducted by the NIAF PMU is thus focused on the logframe and on the detailed specification of output indicators, annual milestones and associated TRP scoring metric. It is very much a dynamic logframe adjusted regularly according to performance reviews. As such, outputs and output indicators are carefully weighted to represent their contribution to overall performance. Indicators and milestones are by necessity closely defined in order to be measurable. The sources of monitoring data are identified within the logframe and specified in each TRP report for each logframe indicator being scored. This is again efficiently managed.
The TRP comments on individual Outcome and Output indicators which need adjustment. The increasing focus of the RBFS from next year on Outcomes will undoubtedly improve the definition of outcome indicators and milestones. Some indicators (Capital projects 3, and Cities 5) are currently not possible to measure and, together with the climate change outcome indicator (4) arguably do not adequately represent the ambition of the programme.
Most logframe indicators and scoring metrics do not lend themselves to gender disaggregation but where end-users of infrastructure or service delivery are cited, these are disaggregated.
Overall the NIAF performance monitoring system is very efficient. The RBFS ensures a discipline based on the log-frame and the achievement of targets. A disadvantage however is that this discipline does not require the development of a learning system which systematically draws the lessons of experience which can be used for wider application.
The TRP and Annual Review visits provide important and useful external perspectives. However the TRP has a relatively narrow view based on logframe targets and whilst the AR has a wider remit focusing more on processes, progress towards outcome achievement and VFM, both reviews are based on short visits and do not draw lessons for wider application. In addition, the TRP repeats its findings and recommendations when the situation does not change between assessments.
Within the NIAF PMU there does not seem to be a systematic process which captures the learning of its experience which may be applied for future programming and other initiatives. Whilst the Roads workstream has documented some important technical findings of its work, and the Effective Cities has also documented project-specific lessons, it seems that the lessons of experience from across the workstreams are not being systematically drawn and possible synergies may be lost.
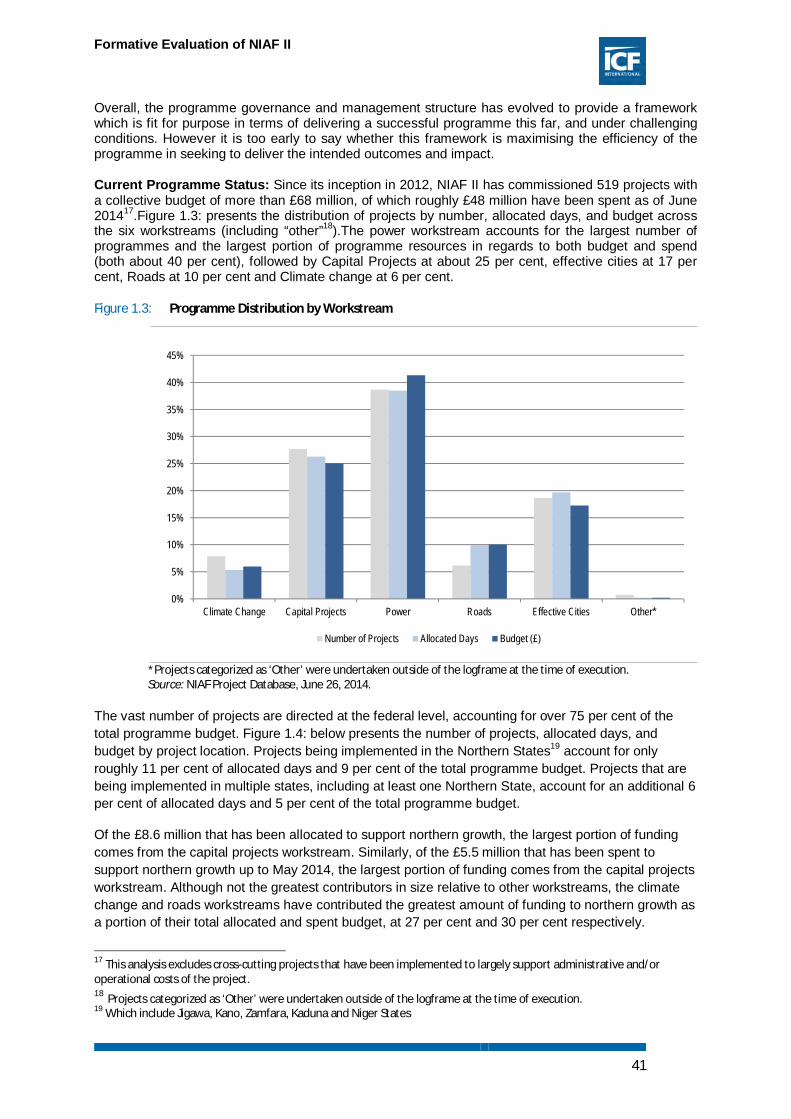
Formative Evaluation of NIAF II
41
Overall, the programme governance and management structure has evolved to provide a framework which is fit for purpose in terms of delivering a successful programme this far, and under challenging conditions. However it is too early to say whether this framework is maximising the efficiency of the programme in seeking to deliver the intended outcomes and impact.
Current Programme Status: Since its inception in 2012, NIAF II has commissioned 519 projects with a collective budget of more than £68 million, of which roughly £48 million have been spent as of June 201417.Figure 1.3: presents the distribution of projects by number, allocated days, and budget across the six workstreams (including “other”18).The power workstream accounts for the largest number of programmes and the largest portion of programme resources in regards to both budget and spend (both about 40 per cent), followed by Capital Projects at about 25 per cent, effective cities at 17 per cent, Roads at 10 per cent and Climate change at 6 per cent.
Figure 1.3: Programme Distribution by Workstream
*Projects categorized as ‘Other’ were undertaken outside of the logframe at the time of execution. Source: NIAF Project Database, June 26, 2014.
The vast number of projects are directed at the federal level, accounting for over 75 per cent of the total programme budget. Figure 1.4: below presents the number of projects, allocated days, and budget by project location. Projects being implemented in the Northern States19 account for only roughly 11 per cent of allocated days and 9 per cent of the total programme budget. Projects that are being implemented in multiple states, including at least one Northern State, account for an additional 6 per cent of allocated days and 5 per cent of the total programme budget.
Of the £8.6 million that has been allocated to support northern growth, the largest portion of funding comes from the capital projects workstream. Similarly, of the £5.5 million that has been spent to support northern growth up to May 2014, the largest portion of funding comes from the capital projects workstream. Although not the greatest contributors in size relative to other workstreams, the climate change and roads workstreams have contributed the greatest amount of funding to northern growth as a portion of their total allocated and spent budget, at 27 per cent and 30 per cent respectively.
17 This analysis excludes cross-cutting projects that have been implemented to largely support administrative and/or operational costs of the project. 18 Projects categorized as ‘Other’ were undertaken outside of the logframe at the time of execution. 19 Which include Jigawa, Kano, Zamfara, Kaduna and Niger States
0%
5%
10%
15%
20%
25%
30%
35%
40%
45%
Climate Change Capital Projects Power Roads Effective Cities Other*
Number of Projects Allocated Days Budget (£)

Formative Evaluation of NIAF II
42
Figure 1.4: Programme Distribution by Location
*Includes projects implemented in multiple states, including Anambra State, which is a Southern state. Source: NIAF Project Database, June 26, 2014.
With regard to individual project duration, projects across the entire programme are scheduled to last an average of 133 days. At the extremes, one project lasted as few as two days and another as long as 759 days. Projects under the roads workstream tend to extend over a longer period of time, with more than 50 per cent of these projects extending over more than 300 days. In contrast projects under the capital projects workstream tend to extend over a relatively shorter period of time with more than 50 per cent of these projects extending over less than 200 days.
Across the programme, 396 projects have been completed while 150 projects are still ongoing. The power workstream has completed the largest portion of its projects while the roads workstream has the largest portion of projects still ongoing. Since January 2012, the distribution of projects by workstream has stayed relatively constant with projects under the effective cities workstream initially representing a slightly larger portion of total projects than they do today, and projects under the climate change, roads, and capital projects workstreams initially representing a slightly smaller portion of total projects than they do today. When looking at the distribution of allocated budgets by workstream the distribution has similarly stayed relatively constant over time. However, projects under the power worksteam initially represented a greater portion of total allocated budget than they do today while projects under the roads workstream initially represented a smaller portion of total allocated budget than they do today.
The daily cost of projects is on average almost £750 based on total spend and total days billed through May 2014.The highest average daily cost is about £1,000 per day for the “other” workstream and the lowest is about £620 per day for the effective cities workstream.
5.1.3 Effectiveness
The effectiveness of the programme relates to how well the inputs and outputs are contributing towards the achievement of outcomes. However, at this stage in programme implementation, it is not possible to determine whether the outputs achieved so far are contributing towards the intended outcomes. Consequently, at this stage, the assessment of effectiveness is limited to the performance of the programme in terms of the delivery of inputs and outputs, the timeliness and quality of outputs, and an assessment of the likelihood that outputs will contribute to, or result in, the anticipated outcomes. The evidence base for this assessment is reasonably strong since it is derived from a variety of sources including an examination of the robustness of the NIAF PMU’s theory of change
0%
10%
20%
30%
40%
50%
60%
70%
80%
90%
Federal Abuja (FCT) Northern* Southern
Number of Projects Allocated Days Budget (£)

Formative Evaluation of NIAF II
43
(section 5.1.1 above), NIAF’s quarterly reports, the independent assessments provided by the Annual Review team and the Technical Review Panel; quantitative data relies on the NIAF PMU monitoring data and qualitative feedback has been obtained from 95% of NIAF clients and other stakeholders.
In general terms, feedback from clients through both: (i) team interviews of NIAF clients, beneficiaries and stakeholders carried out during the formative evaluation field visit; and (ii) the wider client consultation of 27 NIAF clients, was positive in terms of the quality and timeliness of inputs and outputs. The vast majority of those interviewed indicated that NIAF had been efficient and effective in delivering good quality advice in a timely manner, and that activities and outputs met or exceeded expectations. Based on this evidence base, progress and performance by workstream is summarised below.
Power Workstream
Under the Power workstream, which has used almost 40 per cent of the facility budget spent so far, activities are broadly progressing according to plan, with some outputs ahead of target. NIAF II support to private sector power generation and distribution (Output 1.1) has resulted in current levels of 80 per cent of generation and 92 per cent of distribution by the private sector. This is well ahead of the logframe targets of 65 per cent and 45 per cent respectively for H1 of 2014 indicating that sector privatisation is more complete than expected. However, shortfalls in generation are due to the constricted gas supply, which is behind log frame output indicator 1.2 H2 2014 target of 625mmscfd. NIAF has responded to this with attempts to work with the Ministry of Petroleum Resources to address gas shortfalls which are due to lack of investment in infrastructure, vandalism and theft.
The shortfall in available finance in the sector indicates that the sector is not currently a viable market. Despite efforts in this area by NIAF, no Power Purchasing Agreements (PPAs) have been signed between the bulk trader and private Gencos (output indicator 1.3), and the launch of the transitional electricity market (TEM) remains subject to a decision being made on the financial shortfall, which is the key risk. However, interim TEM rules have been signed on time and according to plan (output indicator 1.5). Further details can be found in the power sector case study in Appendix 9.
Capital Projects
The Capital Projects workstream has consumed about 24 per cent of the facility budget utilised so far. It is also progressing according to plan, with some outputs well ahead of targets, but others facing difficulties as systems and tools developed to improve the quality of infrastructure projects and their budgeting need to be institutionalised into the line agencies responsible for infrastructure provision. Tools for project screening for capital projects (output indicator 3.1) are prepared but implementation is not possible before the forthcoming election. Office of Chief Economic Adviser of the President (OCEAP) needs National Planning Commission (NPC) on board to champion implementation, but it remains unclear how likely this is – a key risk. While progress is good, the real challenge of institutionalising the tools remains a critical next step if outcome and impact targets are to be achieved.
Assistance is being provided on systems for effective budgeting of priority projects (Output indicator 3.2): Major project procurements are being reviewed for the president’s office; training materials are prepared for identified Ministries, Departments and Agencies (MDAs); and SURE-P programmes are being supported. The assistance to PPPs is on track and exceeding targets in terms of outline business cases (OBCs) approved (Output indicator 3.3) despite absence of full set of supporting legislation at federal level. However, there are significant challenges ahead in terms of maturing the projects being supported by NIAF to the stage of issuing of requests for proposals (RFPs).
Good progress is also being made on labour-based public works in selected northern states (Output Indicator 4.4) despite lack of progress at Ministry of Works in getting SURE-P agreements in place. Funds have been allocated to the relevant MDAs by two states for labour-based maintenance
Formative Evaluation of NIAF II
44
programmes, but funds are yet to be released. Further details can be found in the Capital Projects case study in Appendix 9.
Roads
To date the roads workstream has consumed a little less than 10 per cent of the facility budget expended to date. While the roads work has made relatively good progress to date, it is now facing delays in achieving key outputs. The road reform bills (to have been passed by June 2014 under the output 2.1 target) have been approved by Federal Executive Council (FEC) but have not been forwarded to the NASS. In addition, the drafts which have emerged from Bureau of Public Enterprise (BPE) and Federal Roads Maintenance Agency (FERMA) do not provide the clarity of function which is needed. Improvements to systems (introduction of Roads Asset Management System (RAMS) and Highway Development Management Model HDM-4), data collection and training are being conducted broadly according to plan and budget is being spent in line with this (Output indicators 2.2, 2.3, 2.4 and 2.5).However the RAMS integration process within the Federal Ministry of Works (FMoW) has been delayed by non-participation from the FMoW, which is awaiting further instruction from the World Bank RAMS advisor. In the absence of a clear way forward, it has been decided to suspend funding work on the RAMS system for the time being, while discussion with the World Bank continues and a decision is made as to whether NIAF II completes this component of the work. This threatens the delivery of H2 milestone for output indicator 2.2, and, given the supporting nature that 2.3, 2.4 & 2.5 play in RAMS, milestones for these output indicators are also being negatively impacted. There are challenges around mainstreaming and institutionalising these systems and learning, suggesting that there are strong vested interests which do not favour clarity and transparency in the sector legislation.
Effective Cities
The Effective Cities workstream combines both the Urban Transport and Urban Development streams of activities, which have together consumed about 16 per cent of the facility budget expended so far. Activities for urban transport (Output indicator 6.1 (cities with mass transit) and Output indicator 6.2 (additional passenger trips)) are broadly on schedule: Eight states have urban location road maps, but delays in achievement are being experienced: (i) Kano State for BRT, largely due to election; (ii) procurement issues (poor procedure and increased bus mechanical failure) has affected LAGBUS; and (iii) the blue line rail in Lagos is delayed due to the Governor not taking LAMATA/NIAF advice. Rehabilitation and privatisation of the rail sector (2.6) has been assigned to the Urban Transport workstream; however, as yet no opportunities relating to rail have been judged sufficiently promising to warrant significant spending on this output.
Under the urban development workstream, output indicator 6.3 sets the target milestone for H1 2014 for four cities to have sites agreed to provide at least 10 ha of serviced land. Sites have been secured in Enugu (as part of redevelopment of the central business district - CBD); in Kano and in Lagos (Alimosho Markets revitalisation); and discussions are ongoing in FCT (with the Satellite Towns Development Agency - STDA) and in Kaduna. City Development Offices (CDOs) have been set up in Enugu (with unique legislation) and Kano (with KNUPDA); a City Development Coordination Office has been set up within the STDA; and a CDO is being pursued in Kaduna.
For the Northern States, output indicator 4.2 (additional people accessing improved municipal service delivery) has an H1 2014 milestone of working schemes in 3 cities, and 140,000 people benefitting. This target is in the process of being met, although the solid waste management (SWM) schemes which provide the benefits (in Kano, Kaduna and Zaria) are as yet in various stages of preparation. Further details can be found in the Effective Cities case study in Appendix 9.
Climate Change
The Climate Change workstream has consumed about 6 per cent of the facility budget expended so far. The workstream struggles to gain strong government support, and as a result has also
Formative Evaluation of NIAF II
45
experienced difficulty in achieving output indicator milestones, although it is on target in terms of activities carried out. For Output indicator 5.1 (number of people with improved access to clean energy) NIAF support to three cookstove programmes20 has exceeded the milestone target of one pilot project by H1 2014, although the target in terms of people with access is accepted as too ambitious and difficult to measure. For Output indicator 5.2 (low carbon infrastructure projects in energy access and energy financing) one proposal submitted against H1 2014 target of two business cases approved. For Output indicator 5.3 (committed climate change funding) the H1 2014 target of £12 million commitments has been exceeded in allocations. Output indicators 5.4 (increase in on-grid electricity using clean energy) and 5.5 (reduction in gas flaring) are facing execution problems and are thus moving more slowly.
Dealing with Failure
In the design of the Facility, and in the fact that success is viewed as achieving more than 50% of the logframe milestone targets, it is recognised that some avenues of work will fail. The key to ensuring that resources are not unnecessarily wasted in pursuing dead ends is to; (i) take an incremental approach to the provision of support in the early stages of engagement with the client (the so-called “daisy chain” approach to providing assistance); and (ii) maintain close monitoring of the degree to which traction is being achieved with clients. The design of the facility lends itself to this approach through its flexibility, but to be successful in this regard also requires that facility management keeps a close monitoring brief on the effectiveness of all project activities. In general, the observation of the evaluation team is that the PMU is effective in dealing with failures. The RBFS also acts a strong incentive for the PMU to be acutely aware of where work is not leading towards the achievement of outputs and to make the changes necessary to bring work back on track.
TRP and Annual Reviews
The Annual Reviews and semi-annual Technical Review Panel reports have largely focused on reporting and evaluating NIAF performance at the output level. Output-level achievement varies between workstreams, but overall is evaluated at, or slightly exceeding expectations. The 2013 Annual Review21 evaluated NIAF II as effective, with overall performance rated as A+ (outputs moderately exceeded expectations).This rating is derived from individual Output performance to date, weighted according to the share of inputs received by each. Output delivery to date by workstream and the weighting accorded to each are as follows
A++: Output substantially exceeded expectation: Power (40 per cent weighting)
A+: Output moderately exceeded expectation: Capital Projects (20 per cent)
A: Output met expectations: Roads / Rail (10 per cent), Effective Cities (10 per cent) and Northern Growth (15 per cent)
B: Output moderately did not meet expectation: Climate Change (5 per cent)
The Review made the following assessment of Outcome achievement: “On balance, it is reasonable to conclude that progress towards this strategic outcome is satisfactory even if achievement of specific outcome indicators have not been strictly achieved…..interview evidence suggests that real progress is being made across most of the outputs in terms of building capacity, improving the evidence base, developing and rolling out decision-making support tools and incrementally changing institutional culture, values and norms…. Whilst the project remains high risk across all work streams, the level of political and institutional support for infrastructure reform leads to a reasonable expectation that the project outcome will be achieved”.
20 The National Clean Cookstoves Programme within the FMoE, the Niger State Clean Stoves programme and the Kaduna Women’s Economic Advancement Forum 21 Annual Review,Stephen Young & Jamie Simpson, December 2013

Formative Evaluation of NIAF II
46
The most recent TRP report22 reinforces these findings. It uses a rating system similar to that set out above, but with scores of between 1 and 5 applied to each programme output, and representing the level of achievement against specific output milestones specified at half-yearly intervals. The logframe specifies the score to be assigned to each level of achievement, with a score of 5 corresponding to full achievement or in excess of the milestone target, and 1 for milestones which are entirely missed. Its overall rating for the programme as of March 2014 is about a 3, which means that on average, the programme has met its output targets to date. As the report notes “(this) is an impressive performance given the fact that DFID considers achievement of half of these targets a “passing grade” for the programme”.
While the TRP notes that progress is good, and that the NIAF team seems well positioned to continue performing well against logframe milestones it highlights that risks to the programme remain high – particularly with the forthcoming elections, and that many challenges lie ahead. It makes some important general points on results so far:
“The NIAF model has been particularly successful in the power sector where there has been a clearly identified set of clients with immediate needs. Using a well-resourced, country-based facility that is able to respond with flexibility and agility to needs as they arise, but also in a programmatic way, has been very positive. As a result, NIAF assistance has been highly effective and is regarded by stakeholders as crucial to the reforms.
Most of the rest of the NIAF project attempts to improve the quality of decisions about infrastructure services by changing institutions and behaviour. The team needs to stay focused on this challenge and be creative in identifying ways of pushing ahead reforms despite election-related turmoil”.
Strategic evaluation findings 5.2This section addresses in turn each of the strategic evaluation questions which were posed in the evaluation framework.
5.2.1 Is NIAF II positioned to improve the management of infrastructure development at federal and state level in Nigeria? Is there evidence that this has the potential to a) reduce infrastructure constraints and b) contribute to non-oil growth and reduced poverty?
The findings on this question indicate that the NIAF programme design is relevant to needs and based on a robust theory of change. However, the political economy of each sector and workstream varies considerably and the programme has had varied success in managing this. Sustainability of NIAF interventions and longer-term impact, particularly a contribution to poverty reduction, are particular challenges for the remainder of the programme. The evidence base for these findings is strong drawing on a variety of sources including literature review, programme data and reporting, independent reviews from the AR and TRP, client and consultant interviews, and our in-depth case studies.
5.2.1.1 Relevance Section 3 above has described the broader context within which NIAF II is working and the wider development objectives of the FGN which it seeks to support. Poor infrastructure investment is judged to be one of the main barriers to faster economic and social development in Nigeria. The long-term change sought by NIAF of more effective infrastructure investment in Nigeria which will support economic growth and the reduction of poverty.
The rationale for the intervention of NIAF is well represented in its theory of change. The analysis in section 5.1.1 of the NIAF theory of change has shown that its intended support is highly relevant to the
22 TRP Report, April 2014

Formative Evaluation of NIAF II
47
problems facing Nigeria. The sector ‘stories’ supporting the overall theory of change provide strong arguments for the inclusion of each sector and workstream.
Our literature review in section 4 above indicates that the type of interventions NIAF II supports are highly relevant to reducing infrastructure constraints. The review of power sector reforms in other developing country contexts indicates that privatisation and the introduction of competition have been effective in improving power supply and the performance of electricity providers (Bacon & Besant-Jones 2002; Katagiri & Ito; Zhang, Parker & Kirkpatrick 2008; Kessides 2012). Similarly, rail concessions across Africa have proved to have improved freight traffic and in some cases passenger traffic, as well as the quality of services (World Bank 2003; Bullock 2005; World Bank 2011; Bullock 2009). Evaluations of road rehabilitation projects implemented by various donors have also indicated reduced journey times and transportation costs as well as improved road safety (AfDB 2010; ADE 2004; World Bank 2008). Finally, the proliferation of infrastructure public-private partnerships (PPPs) in the past decade have shown its great potential to attract additional investment in infrastructure (World Bank 2014, CSA 2011; World Bank 2013),
The literature also stresses economic growth as a necessary condition for poverty reduction (Roemer & Gugerty 1997; Ravallion 1994; Ravallion 2001; Adams 2002; AFD 2005), and suggests an important link between infrastructure development and economic growth (Calderón 2009; Calderón & Servén 2008; UN HABITAT 2011). Although the relationship between infrastructure and poverty reduction is much more debated, the literature highlights potential linkages through greater access to services, increased employment opportunities in the non-farming sector and time-saving benefits, among others (Brenneman & Kerf 2002; Willoughby 2004). At the same time, it is also clear from our review that these linkages are by no means automatic and that infrastructure programmes can maximise their poverty reduction impact through targeted interventions and by ensuring that infrastructure services are both accessible and affordable to the poor (Cook et al. 2005; World Bank 2005; OECD 2006, IFC; Gannon & Liu 1997; Hook 2006; Ravallion 2001; Hull 2009).
NIAF II is positioned in critical sectors for growth and poverty reduction and has a key focus of activity devoted to Northern growth. Optimal relevance to poverty reduction objectives will be obtained through effective targeting of interventions as discussed in 5.2.1.5 below.
As outlined in section 5.1.1 above, NIAF II has largely been relevant to the policies and priorities of the Federal and State governments and positioning has attempted to be such that interventions receive high-level political support. Interviews of NIAF clients undertaken as a part of this formative evaluation all indicate that the support provided by NIAF is relevant to needs and responsive to demand.
The wider client consultation supporting these interviews found that the vast majority of clients felt that NIAF provided support which responded to their needs. 96 per cent of the 27 clients consulted said that NIAF support responded to a moderate extent including over half who said that NIAF responded to their needs to a great or very great extent.
In the case of power, NIAF has maintained a close alignment with the policies and priorities of the FGN largely through close collaboration with and latterly inclusion on the PTFP. The relevance and positioning of the Capital Projects workstream is demonstrated by the strong support provided by the office of the President and key federal agencies, such as the Federal Ministry of Finance and Chief Economic Advisor. At the state level, relevance is borne out by states allocating their own funding to NIAF-supported initiatives – for instance in PPPs (Lagos) and road maintenance (Kano, Zamfara).
Relevance to government priorities is less clear in other sectors: in the case of roads and rail, the division of responsibilities amongst state and federal levels means the priorities are not consistent, and political support for governance reforms, including road maintenance systems, is less evident. The AR 2013 notes that in the case of the Roads “technical quality of the NIAF II support seems very good. However, these interventions are necessary but not sufficient to achieve sector transformation.
Formative Evaluation of NIAF II
48
Progress on policy and institutional development – essential for transformation – has been slower to materialise”.
Similarly for the Effective Cities workstream, the institutional framework is complex with a lack of federal or state interest in urban affairs and very weak local government to manage urban development. In both the roads and rail and cities workstreams, NIAF has been challenged and has taken time to demonstrate relevance to federal and state governments and to develop programme interventions which have been able to gain traction.
In the case of climate change, the component was requested to be included in NIAF II by DFID and it is not a priority of government. The approach therefore has been to promote climate-friendly solutions to infrastructure development in areas which are already priorities for government. The AR 2013 notes that “progress has been limited and the small scale of the work stream suggests limited transformational potential. For example, the focus on cook stoves is quite a limited interpretation of indicator 5.1 and is arguably tangential to the target outcome in a more strategic sense”.
NIAF’s intervention approach seeks to take into account the practicability of intervening in sectors which may be important for economic growth and also the political realities which can make progress difficult. Our case studies have illustrated that NIAF positions itself where political support is achievable and adopts strategic principles of demand responsiveness, flexibility, political economy awareness and influencing. Uneven performance across workstreams highlights the importance of maintaining an awareness of the context for interventions and in particular the political economy surrounding each sector.
The challenge for NIAF is to constantly monitor the effectiveness of the programme to ensure that across the programme, performance within each sector is contributing to the expected outcome and impact. The Annual Review 2013 has commented that “At a strategic level the challenge is to maintain a clear strategic direction… NIAF II must maintain discipline in ensuring core work streams are achieving target results and securing lasting impacts beyond the life of the programme”. The evaluation has found that the NIAF management is highly efficient in maintaining a focus on the achievement of target results and is able to employ flexibility in the support provided to each sector or workstream adjusting resources according to actual and potential achievement ( see section 5.1.2 above on efficiency and VFM). Demonstration of this is the fact that the Roads programme has been put on hold pending resolution of the client’s wishes23 and a scaling back of support to the Light-Up Nigeria programme pending resolution of technical sustainability issues24.
5.2.1.2 Impact Section 5.1.2 above has described the current performance status of NIAF and indicates that output milestones are largely being met. Key challenges remain however in the pathway to achieving outcome level targets (improved infrastructure investment) and translating these into impacts (economic growth and poverty reduction).
NIAF has been highly successful in the first stage of power reform – the privatisation of generation and distribution companies, but increased availability of power has still to be realised, and critical market development hurdles remain to be overcome.
In the case of Roads, the design and introduction of RAMS, the baseline survey and the customisation of HDM-4 are all clear signs of better management of the road network, but resolving institutional complexity and embedding improved technical procedure remains elusive.
From the Capital projects workstream, there is strong evidence that NIAF has improved management of infrastructure development. This has been demonstrated in successful execution of PPP 23 E-mail correspondence Thomas Pascoe 27.08.2014 24 Verbal report from Adam Molleson - feedback meeting 04.07.2014

Formative Evaluation of NIAF II
49
transactions, and recorded savings on infrastructure expenditure (see 0 in Section 5.2.3 below). However, the tools used to bring about these improvements have yet to be fully embedded into the working procedures of the agencies to whom the assistance is being provided. The TRP notes that there is both a need to improve the design quality and use of the tools, and their institutionalisation.
In the case of Effective Cities, the TRP similarly commented in October 2013 on whether the workstream was sufficiently transformational. It cited the ‘disjointed nature of the urban environment… which decreases the ability to address transformational issues at a level which will ensure federal impact’; and the many small projects which are not necessarily engaging or influencing national policy. In March 2014, it was ‘satisfied that both components, urban and transport, can now sufficiently be accommodated in a broader strategic framework (making) … conceptual sense of a seemingly large number of projects, interventions, and activities within a very wide geographical spread’. However, it went on to highlight ‘the importance of the national policy environment albeit currently outside the scope of the logframe ... It can help to contextualize the work of the Effective Cities work stream in the sense that the work can contribute to policy and strategy beyond the narrow confines of technical projects… NIAF can indeed play a very direct role in influencing national policy and strategy. However, this role needs to be defined and managed’. The TRP also questions whether NIAF will have sufficient time to support the legal establishment and therefore the sustainability of the CDOs before the end of the programme in 2016. The view of this evaluation is that, whilst it is too early to be able to show impact in terms of improved infrastructure management, the approach and current status is showing potential.
Whilst the results of NIAF support in terms of more efficient power generation and distribution, improved road conditions, improved public transport and better connected cities will contribute to more climate-friendly development, the specific activities within the climate change workstream are proving slow to show results or to demonstrate that they have the potential to achieve transformational impact. The initiative to influence a reduction in gas-flaring seems to have stalled, the programmes for clean cooking stoves remain under target, and international climate finance has not yet been obtained.
Overall, expected results at outcome and impact levels are considered credible in the case of power, roads and climate change. In the case of the last of these, the TRP has commented that the level of ambition is set too low. The AR 2013 comments that “progress has been limited and the small scale of the work stream suggests limited transformational potential”.
However, for capital projects and cities, the level of ambition may be too high to be successfully achieved by the end of the programme in 2016, and with the probable disruption caused by the election next year.
5.2.1.3 Effectiveness Section 5.1.2 above has indicated that broadly NIAF is delivering according to plan with milestone targets largely being met.
The main drivers of the NIAF performance has been strong support from the most senior levels of government – for example, in the case of power, this has come from the President, and in the case of capital projects from the Office of the Chief Economic Adviser of the President (OCEAP). Strong support has also come from the executive level within State governments for the establishment of LAGBUS and LAMATA where CEOs have provided strong leadership.
Other drivers of performance have been the high quality expertise provided by NIAF consultants, for example in roads maintenance; and also the use of embedded consultants who have been able to establish good working relationships and trust with clients as well as providing a continuity of advice and expertise.

Formative Evaluation of NIAF II
50
Key challenges to performance derive from the political unacceptability of reform or where vested interests oppose it; from a lack of awareness or demand for reform; and from weak or complex institutional environments which complicate or delay interventions to support reform.
The political risks of reform are high and vested interests are strong in, for example, the capital projects and roads maintenance respectively where there is a strong tendency to deflect from the reform path and progress has been slow. In the case of rural electrification (Light Up Nigeria), progress may be rapid but of low quality and thereby risking sustainability. The introduction of processes of privatisation and market rules has been a major challenge to overcome in the power sector; the introduction of RAMS in the road sector confronts an existing lack of transparency and high levels of corruption and progress has now stalled; for the Capital projects workstream, the roll-out to line ministries of tools for project assessment, evaluation and approval has been a major political challenge for the Federal Executive Council.
In the case of the Effective Cities and Climate Change workstreams, it has been difficult to identify client demand and obtain traction from government clients for possible approaches, project interventions and a national policy dialogue. Identification of client demand has been a steady process at State government level for the Effective Cities workstream, understanding the State Governors’ needs and identifying possible approaches and programmes. As the programme has progressed this has also included demonstration of successful approaches by one State to another.
The complex institutional landscape within the urban, power and roads sectors has required awareness and an ability to respond to complexity. Much of NIAF’s success in responding to this challenge has involved working within newly-established institutions outside the mainstream of line ministries (e.g. PFTP, LAMATA, CDOs), often involving engagement of private sector finance or service delivery agents (e.g. the privately operated generation and distribution companies and mass transit operators LAGBUS etc).
Technical and capacity challenges have been dealt with through piloting the use of tools and close collaboration with client stakeholders (e.g. in working with FERMA and FMoW on asset management and RAMS, and with OCEAP and FMoF on tools for project evaluation prioritisation). This has also helped to some extent with political resistance although other responses to this has been to look for alternative approaches or agencies, and/or to focus more on other areas of workstreams where progress faces fewer obstacles and to spend time adjusting approaches where delays are being experienced.
There are clear lessons to be drawn from the experience of NIAF to date: high level political support has been critical to the progress made in the power sector reform, but slow progress is made without such support as shown in the Roads workstream. In the Capital projects workstream a finding from our case study is that high-level political support is a necessary but not sufficient condition for progress to be made. Whilst a tool for project prioritisation has been developed and accepted, the OCEAP has delayed its roll-out to all MDAs until after the election in 2015. A key lesson from the Effective Cities case study is that where the institutional landscape is complex, where demand is undefined, and where technical approaches new and capacity low, more time may be needed to develop and implement the programme, to demonstrate successful models, to build institutional strength and sustain capacity.
5.2.1.4 Sustainability The support NIAF has given to the power sector reforms has been ongoing since 2011. The privatisation of power generation and distribution is in the words of both clients and NIAF consultants ‘very difficult to reverse’. In this sense the privatisation process can be considered to be a sustainable achievement. However, in order to realise the benefits from privatisation, a number of other steps need to succeed including the operation of the market and sustainable gas supply. In the case of the other sectors and workstreams, sustainability is less assured at this mid-point of NIAF II. Despite significant technical advances within FERMA and FMoW, sustainability of the road sector reforms rely

Formative Evaluation of NIAF II
51
on realisation of major institutional and budgeting reforms. Similarly whilst the Capital Projects workstream has introduced new tools, systems and procedures, and the Effective Cities has established new institutions, tools and project approaches, our case studies highlight that there is much work to do before there is sustained capacity in terms of improved skills and knowledge, reformed systems, structures, market development and legal/regulatory frameworks in the client institutions and other MDAs. The climate change workstream is seeking to develop partnerships for programmes amongst government, donor and private sector actors, and is seeking to attract international climate finance for programmes which will sustain beyond NIAF. However, partnerships are proving slow to form and finance is not yet committed.
5.2.1.5 Coverage, coherence & coordination
Coverage The NIAF theory of change infers that it is necessary to tackle reforms in institutions, systems and procedures through which infrastructure and services are delivered before direct pro-poor investment can take place.
In the case of power therefore the reforms have focused on the structure of the industry, rather than the availability of power, let alone distribution to poor communities.
Similarly the core work of the capital projects workstream is focused on improving project selection, budgeting and supporting PPP arrangements which are intended to have indirect benefits in terms of making available money which would otherwise been spent on artificially inflated projects, which may or may not include direct poverty reduction initiatives, and which support economic growth which has the potential to raise living standards for the population including poor people.
A review of literature also shows that the improved infrastructure has a beneficial impact on poorer people provided they have access to and can afford services (UN HABITAT 2011; Cook et al. 2005). It is too early to judge whether either the ‘trickle-down’ approach alone is effective, or whether more managed pro-poor interventions will be needed to deliver the impact level, or the improved access to services will be effective.
NIAF does include some projects which are intended to be targeted for poor communities. The labour-based road maintenance programme is targeted to provide employment and to improve connectivity to markets and employment. The urban transport component is working to achieve efficient and affordable mass transit systems which will benefit poorer populations to reach markets, employment and social services. The urban development component is aiming to improve municipal services (solid waste management, water and sanitation) to include poor communities. However, this objective remains hostage to the State authorities from which commitment is needed to extend services to poorer settlements (an example of where this is at risk is in Kaduna where the NIAF intention for SWM services is to cross-subsidise fee-paying collection in low density areas to include high density areas. The priority of the State government appears to be revenue mobilisation rather than for cross-subsidy and the likelihood appears at present to be that the high density, low-income areas will be excluded from the service improvements).
The projects within the climate change workstream are perhaps the most targeted. The clean cookstoves programme targets those without electricity and those currently using expensive and unhealthy cooking energy. It also targets women beneficiaries (as primary users of cookstoves and marketing through women entrepreneurs). However, as has been commented elsewhere, the ambition of these programmes is quite low. The programmes do not address the structural inequalities in the power sector which programmes such as off-grid rural electrification could address.

Formative Evaluation of NIAF II
52
Coherence The NIAF theory of change represented in the overall NIAF and sector stories25 states that “There are numerous synergies between NIAF’s main outputs which reinforce their collective achievement… More generally, it is clear that the benefits of, for example, improvement in power supply in terms of the removal of related constraints on business growth can only be fully realised if transport systems are strengthened so that access to markets and key facilities is similarly improved. Removing one infrastructural constraint on business development will clearly not be effective if it means only that another constraint very quickly emerges as the binding one”.
There is an evident risk that with a limited amount of formalised learning, and a focus on delivering against logframe indicators and milestones, that this could compromise possible gains from synergies between workstreams, which could potentially be large.
Whilst there is some synergy between climate change, power and capital projects on rural electrification and between roads and capital projects, can there be better synergy between Power and Effective Cities, or Roads and Effective Cities with cross-cutting support from Capital projects and climate change. For example, is there potential for a stronger market approach (through capital projects?) for clean energy generation and use? Is the cookstoves programme sufficient as an entry point here? Is there sufficient collaboration on rural electrification? Is this possible to align with demand responsiveness and complexity and progress of power reforms? Will other sectors miss the dividend to come from access to power? Does this point to a new phase programme when power becomes available?
Coordination with other national, DFID or donor programmes In terms of coordination with other programmes, there is limited evidence of coordination with other DFID or donor programmes. NIAF is supporting the FGN to obtain climate finance from DFID’s International Climate Fund and is cooperating with the World Bank on urban diagnostic research, on support to the Presidential Task Force on Power, and on renewable energy - particularly in the area of primary solar PV. However, within the roads sector there appears to be some conflict with the World Bank over support for road maintenance.
There seems to be more positive experience in coordinating with national programmes. For example, NIAF has taken advantage of the SURE-P to provide funding for the labour-based road maintenance programme, with the National Clean Cookstoves Programme and with Light-Up Nigeria.
In this respect, NIAF positioning within key government ministries and agencies and with its ability to quickly respond to opportunities, makes it particularly effective in being able to identify co-funding and partnering initiatives.
5.2.2 Does NIAF II at the programme and project level adequately reflect its strategic principles (demand-responsiveness, flexibility, political economy awareness and influencing); and are these making a difference in bringing about reforms in infrastructure investment?
Overall there is strong evidence primarily from case studies, NIAF PMU and client interviews that NIAF’s work does reflect its strategic principles, however work streams which have implemented the principles more fully appear to be progressing more successfully along their proposed routes of reform.
5.2.2.1 Effectiveness
These interconnected strategic principles have strongly supported effective implementation.
The majority of clients interviewed reported that NIAF had been responsive to their needs. The wider client consultation indicated that 56 per cent of those interviewed said that NIAF had been responsive to their needs to a great extent or a very great extent. Qualitative interviews supported by our case 25 NIAF overall story and detailed sector stories: Compilation incorporating NIAF theories of change, NIAF PMU June 2014

Formative Evaluation of NIAF II
53
studies strongly supported this with the majority of clients reporting that NIAF’s ability to respond quickly to their requests, and provide high quality staff with the right skills, set NIAF apart as the partner of choice.
The ability of NIAF to respond to client needs is clearly a core strength of the programme, in particular it has meant that NIAF is seen as an alternative to more traditional donor driven institutional reform programmes, this has allowed NIAF to build effective relationships with clients by responding to their needs rather than imposing donor led interventions.
However, the demand responsive nature of this programme is to some extent in tension – albeit sometimes a creative tension – with the remit to influence client activities. We found that NIAF advisors often shaped the demands of clients towards solutions which have been shown to work in other contexts, thus steering the client demands. For example, by providing a ten point power reform programme to the president, NIAF having identified a vaguely held demand was able to refine it into one which was in accordance with international thinking and could be supported by the NIAF programme.
When demands are in line with good practice, or can be developed with the client towards good practice, NIAF is able to respond. However, clients can ask for assistance with projects which NIAF advisors would not recommend. The evaluation team did find examples when NIAF has refused to assist because the demands were not in line with the programme. Interviews with the Kano Urban Transport Project Office (KUTPO), a nascent transport authority in Kano, revealed that embedded advisors were working closely on a bus rapid transport scheme, but would not support the commissioner to develop a light railway network which in their view would not provide a cost effective or sustainable mass transport solution. In this way NIAF has been able to manage the tension between being both demand responsive and influencing, and has not in the most part been distracted by demands which are inconsistent with NIAF’s core strategy and log frame targets.
Another way of guiding client demands has been for NIAF to create, or re-invigorate institutions by skilled Nigerian diaspora as advisors, and then responding to the demands from these institutions for further skills and support. This has proved an effective model in the Capital Projects work stream where the Nigerian sovereign Investment Authority (NSIA) has benefitted from considerable technical assistance, and has been able to make savings on major infrastructure programmes and attract private sector finance. In the same way, the PPP unit in the Ministry of Finance is run by a NIAF consultant who has been able to develop the Federal PPP rules in a programme which has been influenced and supported by NIAF staff and consultants. In this way, providing competent staff who understand and support the NIAF strategy has been an effective way of influencing clients and guiding their demands so that they are coherent and in line with the overall reforms as proposed in each work stream.
The case studies carried out for the evaluation showed that good awareness of political economy has underpinned the successful implementation of a demand responsive, flexible programme which is able to influence clients. The evaluation team noted that the work streams which were more able to discuss the political economy of their sector had made greater progress against log frame targets and appeared from the TRP and annual reviews to be more likely to deliver on the planned reforms.
In some work streams, such as roads, there was less impetus for change from government clients, and consequently NIAF developed a more conventional reform programme which is in line with good practice, but appears to be driven more by NIAF than the clients. Whilst initially the roads programme made progress, the lack of political support and difficulties with donor coordination has resulted in the roads programme being put on hold.
The principles are highly interdependent, with political economy awareness and flexibility being key parts of an effective demand responsive approach. For example, where political support has been secured, or opportunities have been capitalised on, as in the power sector, NIAF has been able to steer the demands towards reforms which are more likely to be successful. At the same time, NIAF prides itself in being flexible and has used this to support projects which may gain them political capital in the future. The example of light up Nigeria – in itself not a project which has been well designed – was supported by NIAF, partly to improve the design, but also possibly to retain the support of the president in power sector reform.

Formative Evaluation of NIAF II
54
Effective implementation of these principles is only possible where there is some level of capacity within government to engage with NIAF. In Lagos, support to the Office of PPP has been successful because it was already a dynamic organisation with some skilled staff who needed support. Building institutions from scratch while applying principles, such as demand responsiveness, is harder. This is one of the key challenges in the North where capacity is lower, government is less able to work effectively with NIAF.
NIAF has also been able to re-allocate resources between work-streams in response to changing political circumstances. This flexibility on the part of both DFID and NIAF has allowed the programme to capitalise on opportunities and build on success, as well as suspend elements of work when they do not appear likely to yield results. For example, increasing investment into the capital projects work stream, while reducing funding for the roads sector directly reflects the degree of political traction gained by each of these work-streams, and consequently the results they have been able to deliver. NIAF has been effective to address projects which are not delivering, and reallocate the funds to those which have a greater chance of success.
Where the key principles have not been applied as thoroughly, particularly in the roads work-stream, and to a lesser extent in climate change, fewer results have been demonstrated, and in the case of roads, the project has been put on hold. There are two possible explanations for this:
i) Applying the principles gives rise to success.
ii) Where the principles cannot be applied, success would be very difficult.
It seems from an examination of the evidence, particularly from case studies, that both possibilities offer some explanation – we can be certain that the political awareness and opportunism has been central to success in the Capital projects and power work-streams. We can also be certain that a failure of political support for railways has meant that no work has been undertaken in this sector.
On balance it seems that the principles of demand responsiveness, political awareness, flexibility and influencing have been necessary to drive the effectiveness of support, but they are not sufficient to result in success; other factors, identified from our case studies, which are needed for effective support are i) Strong senior political support, ii) A degree of capacity within existing clients, iii) An element of luck, where positive factors align, allowing NIAF support to unlock more effective reforms than would have otherwise resulted.
5.2.2.2 Efficiency
Whilst the effectiveness of applying the strategic principles is relatively clear, it is harder to describe the efficiency gains which have been brought about.
Awareness of the prevailing political economy has allowed NIAF to target its work and budgets towards sectors which are more likely to yield successful reforms. Early identification of the power sector and later movements into capital projects have been the result of careful political monitoring. Likewise, the suspension of work on the Road Asset Management System was partly due to a lack of political support which made it clear that results would be less forthcoming than planned. We can therefore say that investment decisions by NIAF guided by political economy analysis have resulted in a programme which has been able to focus on areas which were ready for interventions and has to a large extent avoided long term projects in areas which would have to be abandoned. Timely decisions to suspend projects will always be an area for improvement, but the evaluation team found that NIAF was aware of this and had some systems to identify and act on early indications changes in the political landscape which would affect project delivery.
Demand responsive and flexible programmes have the potential to be side-tracked by client demands which may not align with NIAF’s core strategy; there must be a temptation to undertake some advisory work for a client which is tangential in order to build a relationship towards more fruitful areas of work. However, for the most part NIAF has managed client demands to ensure that most projects remained focussed on their core objectives, and have rarely strayed.

Formative Evaluation of NIAF II
55
5.2.2.3 Sustainability
In the power sector where these principles were developed, they have led to changes which are sustainable - in that they are unlikely to be undone - through a successful privatisation process which has been completed. The power case study showed that NIAF support to this process of privatisation was key to its success, and relied on political economy, and a flexible influencing strategy which could respond to changes in the sector. This change in the structure of the sector will remain in place, but it is only the first part of a truly sustainable power sector which is yet to come; considerable further work will be needed to launch the Transitional Electricity Market (TEM), to secure a reliable gas supply and to set tariffs which are both affordable and profitable.
Long term advisors run the risk of creating a dependency within the client organisation. It was clear from client interviews and case studies that embedded advisors occupied key positions and were central to delivering the core business of a number of agencies. Clear exit strategies were not always in place, although there were examples (e.g. in LAMATA) of embedded consultants who had taken the initiative to develop a cadre of staff who would be able to take over.
NIAF’s model often supports the development of alternative agencies as the key delivery institutions of public services. This institutional framework can be sustainable where division between roles is clear – for example in the Urban Transport work stream, the development of Transport Authorities was seen as a key step to separate policy from delivery and enable more efficient and effective services. However, in other examples, parallel structures have taken over matters of policy from established government departments; in the power sector the Presidential Task Force on Power (PTFP) provided considerable impetus, but faces an uncertain integration into the Ministry of Power as the established policy making body.
Demand responsive and politically aware interventions generally promote sustainable solutions because NIAF can be sure that interventions are both needed and wanted, furthermore, flexibility can minimise exposure to risk.
5.2.3 To what extent has NIAF II support helped to improve the results derived from Nigeria’s spending on infrastructure? Are there common obstacles to achieving this, and how might they be overcome?
In general, it is too early to assess the extent to which NIAF II support has improved the results derived from Nigeria’s spending on infrastructure. However, there is a range of evidence drawn from case studies, NIAF reports, interviews with NIAF personnel and NIAF clients and from the findings of the Annual Reviews and TRP which indicates that the programme has created conditions which should achieve improved results from infrastructure spending, but there are still significant obstacles to be overcome if the conditions created by the project are to achieve these improved results.
5.2.3.1 Impact and Effectiveness
The Drivers of NIAF Performance
The key drivers of the overall performance of NIAF in helping to improve the results derived from infrastructure spending are:
(i) the Government’s strong desire to ensure value for money in infrastructure provision – support for NIAF’s objectives comes from the highest levels of government;
(ii) the strong demand among clients at federal and (to some extent) state level for support in improving infrastructure planning, budgeting and provision – demand for NIAF support exceeds the resources available;
(iii) the ability of the programme to respond in an effective and timely fashion to client requests – the structure and operational framework of the facility enables rapid provision of appropriate good quality technical assistance;
(iv) the performance-driven mechanism for monitoring progress and making payments to the service provider for the facility management contractor – which maintains a clear focus on achieving outputs which support improved infrastructure spending;

Formative Evaluation of NIAF II
56
(v) the governance structure of the programme, and in particular the role of the TRP in providing third party review, monitoring and evaluation of progress, and the use of the dynamic log frame to enable to the programme to respond flexibly to changing circumstances; and
(vi) the application of the four strategic principles in guiding the work:(i) demand driven; (ii) political economy aware; (iii) flexible; and (iv) influencing, have also contributed to the likelihood of improved infrastructure spending.
Other factors which should contribute to the improvement in results from infrastructure spending, and which NIAF II has been able to support and build upon are:
(i) the willingness of the Government to seek to attract private sector finance and expertise into infrastructure provision and management;
(ii) government support for the establishment of suitable policy and planning frameworks, collection of data and establishment of databases and mapping as a basis for decision making on resource allocation; and
(iii) federal and state-level support for the adoption of labour-based construction techniques n public works contracts to improve infrastructure and provide jobs.
Indications of Improved Infrastructure Spending
The workstream sectors are diverse and indications of likely improvement in the quality of spending on infrastructure vary widely between workstreams. Furthermore, at this point in the execution of the programme, any results from workstream activities in terms of improved quality of infrastructure spending have yet to be demonstrated. Much of the work has focussed on: (i) improving the institutional framework and thus incentive structure for improved infrastructure spending; and (ii) supporting infrastructure planning and delivery organisations in establishing new institutional structures, systems and procedures, and developing screening and evaluation tools, which when fully implemented can be expected to result in improved infrastructure spending. In addition there is the problem of attribution: where improved results on infrastructure spending are occurring, it is difficult to determine the proportion of this value which can be attributed to NIAF II.
The workstream which has probably had the greatest impact in terms of improving the results from infrastructure spending to date is Capital Works. Although the elements of infrastructure which the workstream has been able to impact upon have yet to be constructed, there is strong evidence, notably from the case study and client interviews, that the work carried out will improve the effectiveness of this infrastructure and deliver better value for money. In supporting institutions developing and executing PPPs (particularly NSIA and the Office of Public-Private Partnerships of Lagos State) NIAF has been instrumental in creating the conditions which will improve the results from spending on several large infrastructure projects including the Niger Bridge and Lekki Expressway (see 0). NIAF support has been critical in turning troubled projects around and resuscitating stalled flagship infrastructure projects through demonstrating how greater expenditure efficiency can be obtained. In addition, assistance in the preparation of OBCs for potential PPPs: Gurara II Multipurpose Dam; Otukpo Multipurpose Dam; Gurara I Irrigation Scheme Project; and Lokoja-Benin City Road has highlighted a chronic issue of over-costing in feasibility plans originally developed for public procurement. Delivery of these through more cost efficient PPP process will deliver significantly improved infrastructure expenditure efficiency.

Formative Evaluation of NIAF II
57
Table 1.3: Estimated Savings On Government Infrastructure Spending
Source of Savings Saving Amount /$ (based upon: 1£=$ 1.6,1€= $1.32, 1N=$ 0.0062)
Source
Power Power Sector improved delivery US$ 2.4bn Various^ Capital Projects CEA's Office Cost Savings Exercise: 4 projects—confidentiality agreed with DFID.
US$ 264m Various~
Lekki Expressway US$ 77m PPP^ Second Niger Bridge26 US$ 600m PPP* Total US$ 3.344bn
^ Annual Reviews 2012 and 2013
~ Letter from the CEA to Mark Tomlinson (NIAF PMU) accepted by the TRP
* NIAF work with NSIA. Various press releases.
The other key area of work which will result in improved results from Government expenditure in the short term is through the screening of large infrastructure projects for the OECP, resulting in improved estimates and budgeting for major capital works projects. Through this pilot cost screening process the FEC has demonstrated commitment to refer back to ministries projects which are outliers in terms of costing and thus value for money. The development of project screening tools under the CP workstream for use by MDAs will also ensure improved results from expenditure on infrastructure. The President, CME and CEAP have each demonstrated resolve in championing introduction of these screening processes, but this is currently constrained by the delays in roll-out of these tools – in part due to the forthcoming elections. At the local level, according to reports by SURE-P, NIAF support for labour based maintenance of roads under the capital works workstream has resulted in the improved maintenance of 418 km of road in two northern states.
The power workstream is the most mature and the largest in terms of expenditure, and NIAF has been instrumental in power sector reform through: (i) the dismantling and splitting up of the pre-existing and failing state-run monopoly; and (ii) subsequent rebuilding of a market-based power sector. The power case study illustrates that the political support afforded this process has enabled the considerable technical expertise which NIAF II has successfully been able to provide, to support the reform process and deliver the anticipated interim results in terms of a transformed institutional framework for the sector. These interim results provide the foundation for improved quantity and quality of infrastructure spending in the power sector. There is already evidence of improved spending in that more effective investment in generation has resulted is a progressive increase in power output, displacing inefficient and expensive power from diesel generation. The newly privatised gencos and discos are highly incentivised to improve the quality and coverage of power services, and to do so as cost-effectively as possible. Once the market is fully functional, this should ensure that there is a dramatic improvement in the efficiency and effectiveness of expenditure in delivering generation, transmission and delivery infrastructure. Even in advance of full marketization, the power sector reforms have been successful in persuading the private sector to invest in power sector projects. Furthermore, the literature review27 suggests that the main benefits from power sector reform come from the introduction of competition, which deliver increasing benefits once the market becomes established.
In the roads sector, the intervention of NIAF II has been more modest than is the case with either Power or Capital Projects, and with a different emphasis. The focus of support has been less on transformational reform of the key sector institutions, and more on the introduction of: (i) legislation (road sector reform bills); and (ii) road capital works prioritisation and maintenance and management
26 Original tender for the Second Niger Bridge (2012) was $1.6 bn. The FMoW, supported by NIAF (through NSIA, FMoW and FMF (PPP unit)) restructured the project, which with a reduction in approach road length is now valued at $850m. 27 Zhang, Parker and Kirkpatrick 2008; Kessides 2012
Formative Evaluation of NIAF II
58
tools. The passage of the reform bills and adoption of the tools (RAMs and HDM-4) and associated training has the potential to significantly improve the results from infrastructure spending in the federal roads sector. Good quality technical support provided to FERMA and FMOW has allowed these agencies to conduct better surveys, and the information obtained, combined with the application of databases and prioritisation tools, will allow better allocation of resources for capital and maintenance expenditure. However, while the legislation is yet to be passed, and the tools yet to be institutionalised, the benefits from improved spending will not be realised. Recent more intensive engagement with existing road agencies (FMoW and FERMA) to encourage: (i) their early adoption and use of RAMs; and (ii) the early development of a planning strategy and policy document for the Federal road sector has been helpful but this has not provided the traction required to institutionalise these tools and thus start to deliver improved infrastructure spending. As a result of delays in institutionalising and implementing the tools, the Roads workstream has now suspended work on the introduction of the RAMs system. However, work is continuing on traffic counts and axle loading studies, which the Ministry indicates will be used whatever the final outcome on the RAMs system.
Both the Roads and Effective Cities workstreams are helping develop information systems as a basis for improved decision making, which should in turn lead to improved infrastructure spending. In the case of the Effective Cities workstream, the case study concludes that it is still too early to assess the development benefits at this stage of the programme. However early results in both UD and UT look promising based on client reaction and the achievement of early milestones which include the establishment and operationalization of CDOs and MTAs in some cities, and support to the policy and planning frameworks, in particular for urban transport. NIAF supports the creation of spatial databases created through surveys, data compilation and mapping which are the foundation for improved investment decision making. Some results are evident from the support to bus transport in Lagos where a 30 per cent reduction in peak hour journey times has been achieved on the current BRT corridor, together with the doubling of passenger trips over the past 3 years.
The Climate change workstream has yet to achieve results which point to improved results from infrastructure spending. As of June 2014, just over 60,000 people have improved access to cleaner cooking energy, and there are agreements in place for improvements in stove design, and production and delivery of a further 70,000 cookstoves. The Light Up Nigeria programme could potentially provide significant benefits in terms of efficient and sustainable power delivery, but needs clearer evidence of cost-effectiveness and sustainability.
Throughout the Northern Growth portfolio, benefit assessments have yet to be estimated quantitatively. Reducing bottlenecks in providing access to markets for agricultural production to avoid crop wastage alone could achieve very high returns. However, it is unclear what the scale of NIAF II’s support to the rural roads programme is likely to be.
Obstacles to performance
The obstacles to performance vary by sector. In the case of those workstreams which are seeking to address sensitive national-level issues, and which will have a major impact on existing vested interests and incentive structures, the obstacles are those of political sensitivity and push-back against reforms from those whose interests are likely to be damaged or destroyed. This is particularly true of the power, capital projects and roads workstreams. In those programme areas with more diversified clients, the challenge is more one of weak demand for improved infrastructure results in diverse and institutionally weak sectors. This relates particularly to the effective cities and climate change workstreams.
In the power sector, the market required to provide increased investment is not yet operating, and as a consequence it is not yet possible to determine whether the significant reforms achieved will deliver the benefits anticipated. In addition, the gas supply required to increase power production has not been secured. It is fair to say that the power sector is broadly on track to deliver significantly improved infrastructure spending, but the next year will be critical in taking the remaining steps required to delivering these benefits. These are the establishment of the TEM, and the introduction of market reforms. The sustainability of the power sector privatization process is threatened by financial shortfalls as a result of inadequate revenue streams from consumers through to Discos, to the Market Operator and on to the Genco’s and gas suppliers. How these interim financial shortfalls will actually be resolved remains unclear.

Formative Evaluation of NIAF II
59
Further progress towards improving the quality of infrastructure spending through the CP workstream is compromised by the reluctance of key client agencies to roll out the tools and procedures developed under the workstream to executing ministries, departments and agencies (MDAs). This is delaying the realisation of the expected improvements in results from infrastructure spending. Good progress is being made in delivering results where there is an opportunity to “work around” the key MDAs (such as with PPP approaches) but this raises the danger of creating parallel structures.
In the roads sector, a particular challenge to achieving results is the relationship between NIAF and a parallel World Bank-supported intervention in the same sector. While the objectives are the same, there appears to be tension over who is leading the sector reform process.
The obstacles which NIAF faces in the EC and CC workstreams are: (i) political disengagement and a lack of community support; and (ii) absence of the means through which to upscale and institutionalise some of the institutional arrangements and approaches being developed. This will be partly determined by the ability of these workstreams to demonstrate utility and success, and thereby generate demand. It is also likely to be dependent on there being sufficient time to see this process through.
What can be done better?
NIAF has been successful in delivering results where it has been able to identify and exploit political entry points. This is particularly the case with the power sector where NIAF was in the right place at the right time, and with resources and the right skills available at the point where the sector was collapsing, and when Government was open to transformational sector reform. This has given NIAF II immense influence over the reform process and the associated achievement of results. The situation with the power sector was perhaps unique, and this is not the case in the roads sector for instance, where progress is far slower and more difficult as a result. The key challenge is for NIAF II to be able to identify and exploit those entry points where they exist, while still working within the constraints posed by political pressures from those with vested interests which run against the path of reform. In the short-term, innovative ways need to be found to work around the obstacles being thrown up to prevent the introduction of the systems, tools and procedures which will deliver the anticipated benefits.
NIAF needs to be able to demonstrate that the PPP approaches that it is effectively piloting in the power sector and Capital Projects through NSIA and selected state governments (such as Lagos) are replicable in other sectors and in other jurisdictions. The key is to build up sufficient momentum for PPP approaches by end of project, and by that time to have contributed to the establishment of a robust policy and legislative framework for PPPs at the federal level.
For Effective Cities, the challenge for the UD strand in particular is to demonstrate that the CDO is a necessary and appropriate institutional home for city-level planning, and that it gains national recognition. For Climate Change there is benefit to NIAF II seeking a more indirect route to achieving CC objectives through mainstreaming CC through other workstreams and through opportunistic engagement with government on programmes which do not have CC objectives per se but which can achieve or demonstrate climate-friendly approaches.
5.2.3.2 Efficiency
Overall, investments at the project level have been appropriately allocated and delivered to maximise project results. This is certainly the case with the Power sector where NIAF is playing a key role in delivering privatisation of the sector, which should in turn lead to significantly better results from infrastructure expenditure. It is also the case with the Capital Projects stream of work where flexible and innovative responses to potential obstacles have enabled results to be delivered, even though there is still resistance to institutionalisation into the key infrastructure MDA of the procedures and tools developed to improve expenditure efficiency and effectiveness. The Roads workstream can be considered to be less efficient as there currently appear to be major obstacles to be overcome before the legislation and tools required to improve spending efficiency are adopted and mainstreamed into the road MDAs. It is more challenging for the Effective Cities work to demonstrate efficiency in achieving results due to the generally weak institutional framework in which it operates. However, the urban transport strand of work has already shown good results, and the urban development work is beginning to show results – particularly in Solid Waste Management improvements.

Formative Evaluation of NIAF II
60
The CC workstream has committed significant sums to scoping studies, and these are clearly important to be able to identify potential for NIAF engagement. However, where the programme has decided to provide support, there are few tangible results as yet, suggesting a possible change of focus onto the strategic principles and climate proofing of infrastructure.
5.2.3.3 Sustainability
There are significant threats to the sustainability of results achieved so far, and to the realisation of further results, including:(i) political sensitivities to reform; (i) resistance to reform from vested interests; and (iii) lack of capacity. Failure to embed and mainstream systems and processes introduced through NIAF workstream assistance, and failure to adequately plan for NIAF exit from long-term support will severely compromise the realisation of expenditure improvements. It is important that during the second half of the programme efforts are focused on embedding and institutionalising reforms and associated tools, and for embedded consultants to prepare clear exit strategies
The findings in relation to the first strategic evaluation question above (see 5.2.1) show that NIAF II is well positioned to deliver against the programme outcomes and impacts, but the programme needs to be both innovative and flexible to respond to the challenges posed by these threats: particularly the political sensitivity of many of its activities, and the continuing reluctance of the Government to introduce the new ways of working to MDAs. In the Power sector there are questions as to how the remaining project funds will be spent to maximise the likelihood of the sector reform being sustained. Resources will need to be allocated to supporting operationalization of the TEM, achieving full marketization of the sector, and in helping to secure the future gas supply.
The OCEAP is leading the pilot stage of the Capital Project Screening initiative, but since it has neither the mandate nor the capacity to manage the roll-out process, is collaborating with the National Planning Commission (NPC) to broaden implementation of the initiative across MDAs – which is critical to its success. NPC itself lacks capacity, so NIAF will need to ensure that NPC is able to champion the introduction and implementation of the screening tools in MDAs to ensure the potential benefits to infrastructure spending are realised and sustained.
For the EC workstream, sustainability requires that during the second half of the programme: (i) piloting is completed and results demonstrated; and (ii) there are efforts to institutionalise structures (by drafting legislation if needed) and procedure (through documentation and training).This must be achieved through influencing work at both the state and national levels, and where possible with federal government.
For the Roads work, without the approval of the draft legislation and significant institutional reform, it is unlikely that beneficial results from improved surveys and maintenance will be realised or sustained.
There remains a significant risk that key decision-makers will not be prepared to attach priority to climate change issues and initiatives, compromising the sustainability of workstream outputs. Yet without sufficient climate resilient planning, particularly in the energy sector, there are significant threats – particularly for the poorest segments of society. These threats outweigh the individual risks faced by portions of the programme, and provide a basis for action which offers rewards sufficient to justify intervention. Agriculture predominates in the non-oil economy but is highly vulnerable to climate change impacts. Improvements in the resiliency of infrastructure will be of significant importance in reducing the impact of climate change. NIAF can mitigate the risk both by mainstreaming climate change in delivering other programme outputs and by demonstrating the opportunities to raise finance through good climate change practice.
5.2.4 Is NIAF II likely to play a role in increasing public and private sector funds for infrastructure provision in Nigeria? Is there more that NIAF II could do to stimulate investment?
There is evidence of NIAF II having leveraged additional funds from both the public and private sectors for infrastructure provision as a result of its activities. However, in many cases it is difficult to determine the extent to which this funding is additional to that which would have been forthcoming without NIAF, and thus the extent to which it can be attributed to NIAF activities. The figures presented

Formative Evaluation of NIAF II
61
below represent additional funds leveraged, or funds made available in a shorter timeframe than would likely have been the case without NIAF II.
5.2.4.1 Impact
Influencing other Programmes and Leveraging Funding
Evidence from NIAF reports and interviews of the influence of NIAF II on other programmes includes: (i) joint working with development partners (including the WB, AfDB, ICF and KFW) in workstream sectors; and (ii) the reported development by other donors of interventions which use the NIAF approach (mini-NIAFs)28.NIAF is influencing FGN and the World Bank on the use of Clean Technology Funds to attract the private sector for on-grid renewable energy generation. There is collaboration with the WB/Cities Alliance on an urban diagnostic review and on the DFID urban research programme. NIAF is in the process of applying for International Climate Fund support to finance a solar PV programme for schools and clinics. NIAF is also working with the FMoE and the Bank of Industry to establish the BoI as a National Implementing Entity for the UN Adaptation Fund
Improved service delivery in the power sector through the programme to which both NIAFI and NIAF II have contributed is estimated to have already made savings of US$2.4 billion equivalent, primarily from substitution of expensive diesel power generation (see 0 above). More significantly, the sector reforms introduced have been instrumental in leveraging significant additional funding for the sector. The 2013 Annual and VFM Report suggests that the following funds have been leveraged into the power sector as a result of the reform process supported by NIAF:
World Bank funding (from NEGIP facility) to provide support for PTFP communications - US$1m+.
KFW loan for the rehabilitation of Kainji hydro station facilitated by NIAF who supported KFW in developing their support programme - €100m.
AfDB loan financing for transmission projects approved/released through PACP – US$100m
Azura IPP in Edo State - US$400m funding from the private sector.
Privatisation of PHCN successor GenCos and DisCos - US$2.25bn raised from private sector
Investment commitment from private sector binding on new Discos: US$ 2.5bn
Investment commitment from private sector binding on new Gencos: US$ 1.5 – 2.5bn
In addition support has been provided by the Government to the TEM for gas arrears amounting to US$250 mn equivalent.
The TRP29 highlights that the power sector reforms have been very successful in persuading the private sector to invest in the power sector without the need for credit enhancement schemes which are typically needed for this kind of privatisation process. This is interpreted as NIAF having helped create an investable power sector, and thus to have increased the appetite for investment in the sector.
The capital projects workstream has also been instrumental in leveraging funds from the private sector, in addition to savings generated from: (i) the Lekki expressway and second Niger bridge PPPs of US$77 million and US$600 million respectively, and (ii) an estimated US$264 million saved by government as a result of NIAF support to the CEA's office in the screening of four flagship projects30.Based on the support provided by NIAF to the Lagos State Office of PPPs, the estimated funding leveraged from the private sector on PPP projects is:
Lekki Epe International airport – US$ 582 million
Second Niger Bridge – US$ 800 million
28 Reported in interviews with clients, DFID and World Bank. 29 TRP March 2014 30 NIAF agreed with FGN and DFID that these projects should remain confidential

Formative Evaluation of NIAF II
62
Lekki Expressway – US$ 208 million
Ferry Terminals – US$ 1.2 million
Lekki-Ikoyi link bridge O&M – US$ 2.78 million
Alausa Power PPP – US$ 23.5 million
Mainland Power PPP – US$20.29 million
Plycon Power PPP- US$19.07 million
In discussions with the Lagos State Office of PPPs it was acknowledged that NIAF was instrumental in establishing these PPPs and ensuring that the State was able to get good value for money from these transactions. However, the view was expressed that these projects would have happened without NIAF support, although it was recognised that without this support: (i) the process would have taken a lot longer, and (ii) the value obtained by Government in terms price and allocation of risk to the private sector partner would likely not have been as great.
In the case of the Effective Cities workstream, NIAF has assisted in the leveraging of loan funding for: (i) the Lagos Bus Rapid Transit of US$ 240mn from the World Bank; (ii) investment in LAGBUS of US$ 272 million from BNP Paribas. In addition, NIAF has assisted in leveraging US$ 0.9mn from the AfDB for the conceptual design of the BRT corridor from Abuja CDB to Maskara, and US$ 3.72mn equivalent from the FCT minister to support AUMTCO. Under the Urban Management strand of the work, the groundwork has been done for the franchising of solid waste management services, but these have yet to be executed.
Under the climate change workstream NIAF has assisted in leveraging funding for:
The Rural Electrification Fund – US$ 53.6mn equivalent from REA and REF
Light up Nigeria – US$ 5.92mn equivalent from FGN
Solar Projects (see above) – US$ 60mn from ICF.
In the case of the roads sector, the case for funds having been leveraged, or which are likely to be leveraged, as a result of NIAF support in the sector are less clear. For one thing, the World Bank has been and still is active in the sector and would have been likely to follow with funding in the sector anyway. In addition to problems being experienced by the roads workstream in gaining traction within the higher levels of the Ministry of Works, there are now tensions in the complementarity of the approaches being adopted by NIAF and the World Bank in the roads sector31.
5.2.4.2 Effectiveness
It is too early to assess the full impact that NIAF II is likely to have on the additional expenditure being brought into the infrastructure sector. However, even if only a small portion of the additional financing indicated above is attributable to NIAF II, it would appear that NIAF II has been effective in: (i) increasing the likelihood of more efficient Government spending on infrastructure; (ii) increasing, or accelerating, bi-lateral and multi-lateral agency support to infrastructure development; and most significantly (ii) attracting significant additional private sector capital into infrastructure development and management. Furthermore, international experience suggests that once successful PPPs are demonstrated in a country, this acts as a catalyst to attract more private sector investment into PPPs32.
It can also be argued that it is not just the quantity of infrastructure spending which has increased as a result of NIAF II interventions, but also the quality of that spending. One additional benefit of the move towards better regulated and managed PPP transactions is that the proposed developments are attracting the interest of better quality private sector suppliers of finance, management and construction services. These suppliers bring with them international standards of social and environmental safeguards and health and safety practice in project execution. This will contribute to
31 Letter from NIAF to DFID on suspension of road workstream activities 32 Castalia Strategic Advisor 2011
Formative Evaluation of NIAF II
63
pro-poor outcomes (through better labour practices, environmental damage mitigation at project sites etc.)
There is some evidence of activities under NIAF II influencing infrastructure investment in other sectors. The work in the power sector, particularly in attracting private sector finance, has influenced approaches in other sectors – for instance in the PPP focus of the Capital Projects workstream. In turn, the work supported by Capital Projects with NISA in developing business cases for PPPs has led to NISA looking at the possibilities for PPP transactions in sectors other than those which have been the focus of NIAF II support so far. This includes projects in the water resources sector, alternative renewable energy sources, and soft infrastructure sectors such as health33.
Where the CP workstream is involved with selected northern states on introducing labour-based road maintenance techniques, the state governments are allocating their own resources to be applied to support these approaches while the SURE-P resources are still being allocated.
Under the climate change workstream, work with the private sector has been undertaken through an LPG Market Transformation initiative (Dec 12 to Oct 13); and is ongoing through the Clean Cookstoves programme using government subsidies and private marketing. In addition, application is being submitted to ICF for funding solar PV (since 2012).NIAF II is also supporting FGN to access the UN Adaptation Fund.
In the roads sector, there is as yet no evidence of leveraged investment. The World Bank is investing in the sector, but while this work is linked to the NIAF II work, there is no evidence that this work was catalysed by NIAF II, and it seems likely that this funding would have been made available without NIAF II involvement. NIAF II has been instrumental in the introduction of HDM-4 - a tool which if used properly will assist in the making the business case for investment in roads and in maintenance. This could be an important step towards financing infrastructure through for example, BOT contracts with the private sector.
There is evidence that work under NIAF II has been instrumental in creating the conditions which have enabled multilaterals to return to initiatives they had previously deserted due to adverse conditions e.g. the ICF returning to the PV project and the World Bank into the Lagos BRT project.
5.2.4.3 Efficiency
In the Power Sector, and under the Capital Projects workstream, NIAF II resources have been spent principally on creating the conditions for investment and setting up the technical and commercial systems to allow for: (i) a transparent and successful privatisation process (in the case of power), and (ii) successful PPP transactions (in the case of Capital Works). Based on the resources leveraged (and the prospect of further resources being leveraged), the efficiency of expenditure has been high, and the associated transaction costs involved in raising public and private funds for infrastructure investment has been low.
In all sectors investment has also gone into influencing political will and creating the political buy-in necessary for reforms to be introduced. The success, and thus efficiency, of this approach varies across and within workstreams. It can be considered high in the Power sector, but is certainly much lower in the roads sector where resistance has been stronger, and political engagement less effective. In the Capital Projects, Effective Cities and Climate Change workstreams, it has varied between client institutions. Greatest traction (and thus efficiency) appears to be possible where: (i) the sector is in a state of collapse, in which case appetite for reform is strong (power sector); or (ii) where incentives for efficiency are strong and vested interests are weak (NISA and PPP units).
In the area of PPPs in particular clients have indicated that transaction costs would have been far higher without NIAF support34. Overall, the client survey indicated that over 85 per cent of clients surveyed rated the value added to their organisations from NIAF support as being between moderate and very great.
33 Evaluation Team discussion with CEO of NISA. 34 Client survey and client interviews

Formative Evaluation of NIAF II
64
5.2.4.4 Sustainability
The major threats to sustainability of funds leveraged through NIAF II activities are posed by; (i) market failures and (ii) increasing levels of political resistance to reforms. The most vulnerable are funds being put up by the private sector to support the power sector reforms and for large infrastructure projects being transacted through PPP arrangements.
In the power sector there remain serious questions about the operation of the TEM which will be launched in the next year. If the market fails when it opens, this will constitute a significant set-back to the reform process. NIAF II is closely involved in setting the market rules and tariffs to maximise the chances of success. Secondly, there are questions about the sustainability of gas supply. NIAF are just starting to address this, but securing support from inside the Ministry of Petroleum is proving difficult.
Sustaining the success achieved in leveraging private sector funding for PPP transaction will depend on the formulation and adoption of unified legislation and regulations governing PPP transactions at the Federal level. This issue has been highlighted by the TRP and again, NIAF II is looking for ways to address this problem.
For the labour-based road construction programme, sustainability is threated by the absence of the funds promised by Government to support the programme. Budget allocated through SURE-P has failed to materialise to pay beneficiary wages, and although two states (Jigawa and Zamfara) have allocated funds to the relevant MDAs for expenditure on Labour Based Maintenance Programmes, the anticipated releases have not been made.
5.2.5 Which interventions within the NIAF II programme are having the greatest effect? Is the balance of investments appropriate to achieving its goals relating to non-oil growth and reduced poverty?
Section 5.1.1 above has described the relevance of NIAF to meet the objective of non-oil growth leading to reduced poverty. This section looks at the alignment of each workstream to the objectives of non-oil growth and reduced poverty. It goes on to look at the effectiveness of each workstream in delivering results, and the current balance of investments within the overall programme. It draws on the evidence from the NIAF sector stories, from NIAF monitoring data and interviews with NIAF personnel supported by the Annual Review and TRP reports, case study findings and interviews with clients. Whilst each workstream is well-aligned to NIAF goals the impact on poverty reduction is long-term and evidence of impact is currently very limited. The balance of investments reflects the expected impacts of the programme and results so far.
Workstream alignment to objectives
A reformed and more efficient power sector will allow a wide range of industries to grow. The power sector story makes a strong case for the links between upstream power sector reform and poverty reduction albeit an indirect poverty impact through improved economic opportunities and access to social infrastructure afforded by improved power supply. However there is little impact in the North as yet from the power sector activities. It can thus be argued that the power sector improvements do not, as yet, make a significant positive impact on non-oil growth and poverty reduction. However, there is a counter argument which postulates that if power is the most transformational component in terms of Nigeria’s overall development, it will have the greatest long-term impact on poverty, even if the immediate poverty impact is less than in other areas (such as rural roads and effective cities). This may also be true in the North, even if better power supply has yet to be delivered there.
The roads workstream is strongly aligned to the non-oil growth objective supporting national connectivity and access to markets. It is less well-aligned to poverty reduction except in the indirect impact on growth and improved access to and from rural areas. The workstream has supported the labour-based rural roads maintenance programme which has a stronger poverty reduction focus.
Alignment of the capital projects workstream is high in terms of non-oil growth. Improvements in planning and management of infrastructure investment will contribute directly to growth as well as generate savings. The alignment of the workstream to poverty reduction is less clear, although there is potential to provide the technical support for improved targeting of investment for direct poverty

Formative Evaluation of NIAF II
65
reduction impacts. The Capital Projects workstream is responsible for several projects which have an important poverty focus i.e. labour-based roads maintenance which can improve access for poorer communities in rural areas, and solar PV power supply to improve rural schools and clinics.
In the case of Effective Cities, the sector is essential if Nigeria is to achieve non-oil growth and reduced poverty. Unplanned urbanisation and traffic congestion represents a significant constraint to growth (Remy and Lee 1998; Cox 2007) and is a significant source of poverty and vulnerability. The workstream is making efforts to adopt models of service delivery which are pro-poor and gender-conscious. The theory of change supports this and delivery models such as bus rapid transit with fixed fares and solid waste management in high density, low income areas should have significant positive poverty and gender impacts.
The Climate Change sector is important to the objective of non-oil growth, and changes in climate have the greatest effect on the poor. The CC workstream is also closely aligned to poverty reduction through its more targeted programmes for rural electrification and clean cookstoves.
NIAF’s focus on power and roads is consistent with the literature which identifies these two sectors as having the greatest impact on economic development35.
The alignment of each workstream is summarised in Table 1.4: below.
Table 1.4: Alignment of Workstreams to NIAF objectives of non-oil growth and poverty reduction
Workstream Alignment Non-oil growth Poverty reduction
Power Roads Capital Projects Effective Cities Climate Change
Effectiveness and Results
NIAF is broadly delivering according to expectation. Annual Reviews and TRP reports indicate that the power workstream has surpassed its initial expectations, but now the new challenges are becoming greater and more stretching, and a critical period will be the next year when the TEM is launched. Capital projects, roads and effective cities are largely delivering but climate change is somewhat below expectation.
In the case of power, it is generally agreed that the process of privatisation is now irreversible but substantial further reform is required to ensure sustained success. There are significant (external?) risks associated with the future progress of the power sector, namely resolving a sustained gas supply, the risks of the TEM failure and resolving availability of investment finance (?).
In the case of Capital Projects, the risks are associated with the need to maintain high-level political commitment to the reforms proposed. There is a high risk in the area of public capital spending reform due to the difficulty being experienced in embedding and mainstreaming new systems and processes. Sustained success is more likely with the acceleration of infrastructure delivery through PPP – some transactions have already been completed and the NSIA is now using a framework which has already been established to pursue other opportunities. The scale of positive impact is highly dependent on what happens during and after the election period in 2015.
For the roads workstream, the greatest challenge has been the engagement at senior levels of the roads sector, generating and sustaining a demand for reform. Whilst technical inputs have been effective, the completion of reforms requires sustained commitment from senior management and political support. The World Bank has also started a programme of support to RAMS which may provide the long term support beyond the timescale which NIAF can commit to.
35 César Calderón (2009) "Infrastructure and growth in Africa," Policy Research Working Paper Series 4914, The World Bank

Formative Evaluation of NIAF II
66
In the case of Effective Cities, the expectations (scope of activity at Output level and level of ambition at Outcome level) are unclear. Performance measurement is thus also currently unclear. The workstream is constrained by the time required to overcome the political and institutional complexity, the lack of existing capacity for urban planning and management, and the short time within which to be able demonstrate and scale-up successful models. In addition it will be important to ensure that service delivery models achieve the expected impacts, particularly in terms of poverty reduction. Clearly, much political influence and technical design are required to ensure that transport and municipal services do actually reach the poorest settlements and have maximum positive impact for women and girls. The greatest risk to sustainability appears to be that there is insufficient time to complete pilots, embed processes and institutions, demonstrate success and influence replication elsewhere.
In the case of climate change, the key issues seem to relate to the extent to which the workstream as currently defined can have any strategic or transformational impact. It receives little interest from government but also has a limited focus on green growth through partnerships with the private sector.
Table 1.5: below compares logframe impact weighting, the results achieved as assessed by the Annual Review and TRP scores and the allocation of the NIAF budget.
The results assessed by both the Annual Reviews and the Technical Review Panels are largely consistent. They rate Power, Capital Projects and Cities relatively highly with Roads, Northern Growth and Climate Change some way behind.
Table 1.5: Comparison of Impact Weighting, Results and Budget Allocation
Weighting Results Committed Expenditure**
Expansion Business Case
Revised Logframe
AR 2012 AR 2013
TRP 4*
Power 40% 37.4% A++ A++ 60% 39% Roads 10% 13.0% A+ A 56% 10% Capital Projects 20% 17.9% A++ A+ 80% 24% Northern Growth 15% 15.4% A 48% Climate Change 5% 4.5% A B 44% 6% Effective Cities 10% 11.9% A A+ 70% 16% OVERALL 100% 100.1% A+ A+ 58%
* Based on aggregate of TRP scores for each milestone
**Project database (end May 2014), NIAF PMU
The table shows that the expected impact weighting has changed only slightly during the course of the programme. Power is expected to achieve the greatest impact, with Capital Projects, Northern Growth, Roads and Effective Cities some way behind, and Climate Change with a much smaller weighting.
Balance of NIAF Investments
Table 1.5: above shows that the allocation of resources is consistent with both the expected impact and results. The relatively higher budget allocation for Effective Cities reflecting improved results.
From a total project budget at May 2014 of £68 million (funds committed net of cross-cutting projects), about 40 per cent has been allocated to the power workstream, 25 per cent to capital projects, 17 per cent to effective cities, 10 per cent to roads, 6 per cent to climate change and about 2 per cent to other (off logframe) projects. Actual spend to May 2014 standing at almost £50 million shows similar proportions.

Formative Evaluation of NIAF II
67
Figure 1.5: Funds Committed and Expended
*Projects categorized as ‘Other’ were undertaken outside of the logframe at the time of execution. Source: NIAF Project Database, June 26, 2014.
Given the expected impact of each workstream and the results assessments so far, the balance of investment has been appropriate.
Maintaining a balance of investment across all Outputs and workstreams is also implied by NIAF’s theory of change which states that there is a need for successful activity across all workstreams: “Removing one infrastructural constraint on business development will clearly not be effective if it means only that another constraint very quickly emerges as the binding one”.
For the remainder of the programme maintaining a balanced portfolio diversifies risks and potential impact. The Power sector reform, whilst highly successful so far, is inherently risky and returns will be long-term. Other sectors are therefore important.
The Capital Projects workstream is effectively cross-cutting and is intended to improve investment from all sectors. It appears to be achieving major cost saving and attracting significant quantum of additional finance to the infrastructure sector.
The smaller contribution to the NIAF budget to the Effective Cities workstream is appropriate at this stage whilst models are in a piloting phase.
Both Capital Projects and Effective Cities also support essential investment in the North.
The roads workstream is clearly important for connectivity, however limited political support for technical reforms for road maintenance and difficulties in donor coordination mean that the programme has currently been put on hold.
The CC workstream represents a small proportion of the total NIAF budget although expenditure is significant. Thus far, there is little to show in terms of tangible results. Much of the work has
-
5,000,000
10,000,000
15,000,000
20,000,000
25,000,000
30,000,000
Climate Change Capital Projects Power Roads Effective Cities Other*
Budget (£) Spend (£)

Formative Evaluation of NIAF II
68
represented scoping, needs assessment and consultancies to develop strategies etc, and thus many inputs have had minimal long-term commitment.
The proportion of projects being implemented in Northern States, which include Jigawa, Kano, Zamfara, Kaduna and Niger, account for 14 per cent of the total programme budget (see Figure 1.6:and Figure 1.7: below).
Figure 1.6: Programme Distribution by Location
*Includes projects implemented in multiple states, including Anambra State, which is a Southern state. Source: NIAF Project Database, June 26, 2014.
In terms of the contribution to Northern Growth from each workstream, Figure 1.8: below shows that the highest allocated budget and actual expenditure comes from the Capital Projects workstream (36 per cent and 29 per cent respectively) followed by Effective Cities, Roads and Climate Change. Perhaps unsurprisingly the Power workstream has the least resources allocated and spent in the North (9 per cent and 11 per cent).
Figure 1.7: Programme Allocation to Northern States*
Percent of Days Percent of Budget (£)
0%
10%
20%
30%
40%
50%
60%
70%
80%
90%
Federal Abuja (FCT) Northern* Southern
Number of Projects Allocated Days Budget (£)
11%6%
84%
Northern States Multiple State Projects*
9%5%
86%
Northern States Multiple State Projects*

Formative Evaluation of NIAF II
69
*Multiple state projects include projects that are being implemented in both Northern and Southern states. Source: NIAF Project Database, June 26, 2014.
Figure 1.8: Northern Growth Allocated Budget and Spend by Workstream
Allocated Budget Spend through May 2014
Source: NIAF Project Database, June 26, 2014.
As a proportion of workstream Figure 1.9: shows that the Roads workstream has actually overspent on projects in the North with the second highest proportional allocation (24 per cent). The climate change workstream has allocated the highest proportion of its own budget to projects in the North (34 per cent).
Figure 1.9: Portion of Each Workstream Allocated to and Spent on Northern Growth

Formative Evaluation of NIAF II
70
5.2.6 Are there any changes of a) approach or b) procedure that might help NIAF II to be more effective over the second half of the programme?
5.2.6.1 What could improve NIAF’s positioning to influence effective management of infrastructure development
Previous sections have shown that NIAF has positioned itself well to influence more effective management of infrastructure delivery. Our case studies have highlighted that politically aware work in the Effective Cities, Power and Capital Projects work streams have enabled NIAF to hold a unique position of trust for government in designing and delivering critical parts of infrastructure delivery.
Section 5.2.2 in particular has examined the application of NIAF principles of approach has shown a number of strong examples where NIAF has worked politically to build institutions.
There are, however, areas in which the evaluation team felt that positioning could be either improved, or key risks which should be mitigated in order to maintain this strong position. The identified areas are:
Exit strategies
In general it was noted that few of the projects had explicitly stated exit strategies from the core support offered to institutions. This may be a factor of the stage of reform – in many sectors, more support will be needed before the benefits from reforms will be realised and so an exit strategy is not yet needed. However, the evaluation team noted that in some cases for example where funding to the Presidential Task Force on Power was due to end, although there was speculation about what would happen, no clear plan had yet been formed. We recognise that this is heavily influenced by external political factors, and is not always something under NIAF’s control, but nonetheless, a greater and more explicit focus on planning an exit, particularly of embedded consultants, would strengthen projects and assist in handover to government or other donors.
Institutionalising progress
In the Effective Cities work stream, the evaluation team saw good examples of NIAF advisors building appropriate institutions which will be capable of service delivery, while this is a long process, it seemed to be politically sensitive at the state level and, particularly where there was existing capacity (e.g. LAMATA and LOPPP), showed signs of already improving the management of infrastructure. Institutions in the North were starting from a lower base of capacity, and so were not yet showing results, but while progress may be slow, NIAF seemed well positioned to influence change.
The challenge from these state level institutions is how to influence national policy, particularly towards cities. With little constitutional support for the concept of metropolitan authorities, NIAF faces real challenges about how to embed state level progress into an overarching federal and constitutional framework. We recognise that the scale of this challenge, and suggest that perhaps there is a tipping point when a significant number of states have recognised the need for improved urban management through dedicated institutions, others may follow, however, we did not see any evidence of a NIAF strategy to plan or monitor progress towards this tipping point, or to embark on an influencing strategy at the federal level to promote urban management.
It seems likely that the increased research effort which has been commissioned alongside NIAF, coupled with advisors in key states will be able to redress this before the end of the programme.
Supply chain focus
The theories of change are designed to take a full sector perspective, this approach gives NIAF an analytical starting point which maximises the chances of success, and promotes working in parallel at multiple points in the reform process. Working in this way across a whole sector can be transformative. Good examples of this were found in the Urban Transport work stream where project management units were established as nascent transport authorities while the legislation to formalise them was also supported.
Formative Evaluation of NIAF II
71
There were also examples where failure to work at each point in the supply chain has left significant risks to effective initial work. In the power sector, whilst privatisation has been successful, failure as yet to secure a reliable gas supply poses a critical risk to improving power provision. There are real challenges in engaging a new ministry such as the Ministry of Petroleum, and earlier engagement with them may have improved the management of this risk.
Working at different points in the supply chain in parallel –e.g. power – ensuring that gas supply is prepared – NIAF is already doing this to some extent, and has shown it can be transformative when it works. It is most notable in its absence, e.g. the lack of gas supply in the power sector reforms. This is not a direct criticism of the power sector, we appreciate that some points of the supply chain are more challenging than others, and we know that exerting influence on a ministry such as the ministry of petroleum is a significant challenge. What we do note is that where an intervention has failed to work with the full supply chain, outcomes and impacts are jeopardised.
5.2.6.2 Effectiveness: Are there refinements to approach programme management systems and processes that would help to increase effectiveness?
There are a number of areas which the evaluation team noted could improve NIAF’s effective delivery of log frame results.
Strategic focus on poverty reduction
Few of NIAF’s projects are directly targeting poverty reduction; most are supporting improvements to the planning and management of infrastructure, supporting economic growth and poverty reduction. A minority of projects such as the Labour Based Maintenance programme are working directly with the poor communities. The additional client consultations found that less than a third of clients acknowledged that NIAF’s intervention had impacts on poverty reduction.
This approach is in line with the business case and theory of change. However, NIAF does not have any strategic level expertise on poverty, gender and social inclusion, there is instead a reliance on the theory of change to delivery these social benefits as a result of infrastructure improvements. Opportunities to demonstrate poverty, gender and social impacts may have been missed because projects have not directly considered these aspects, or at least have not had sufficient high level expertise in these aspect to maximise these social impacts.
An interview with the Ministry of Finance PPP office revealed that this expertise is something which clients are starting to demand. As the Federal PPP rules have been improved – through NIAF’s support – GoN is able to attract institutional investors who demand high social and environmental standards and are used to investing in accordance with international best practice. This in turn means that Federal PPPs need to comply with these international standards and demonstrate to investors the social benefits.
The fact that this demand is surfacing is in itself a testament to NIAF’s work. It has created a virtuous circle where improvements to regulation have attracted better investors who in turn demand higher standards. NIAF is well positioned to respond to this demand, but will need higher level strategic expertise to provide the same level of advice as it has done in other domains.
Links between work streams
The management of NIAF does not necessarily promote collaboration between work streams beyond informal support. Outcomes and projects are allocated to each work stream, meaning their focus is quite naturally on these perhaps to the exclusion of other related outcomes.
Under Effective Cities, Urban Transport and Urban Development are working in similar locations on similar issues. Both are collecting data on urban management, and this data could potentially be used better if it was integrated at the city level.
Climate change outcomes can be achieved in all work streams, but the climate change work stream itself has been struggling and did not meet its milestone targets in the 2013 Annual Review. It seemed to the evaluation team that the existing climate change expertise would be better deployed by advising other work streams on how to achieve climate outcomes, than by directly running climate change related projects. For example, NIAF has been successful in creating functioning markets around PPP,

Formative Evaluation of NIAF II
72
many of the experts have deep experience in market based interventions – this expertise if deployed into the cook stoves project could create a more effective and sustainable market though supply chain analysis and targeted subsidies. Climate change expertise is not the critical knowledge needed to make this project work.
In the same way, climate change expertise applied to major capital projects could suggest small design changes which could have significant climate related impacts. The current scale and unconnected portfolio of climate change projects means that results will be limited, but if the same expertise could be mainstreamed through other work streams, the scale of outcomes and impacts could improve.
5.2.6.3 Efficiency: Are there refinements to programme management systems and processes that would help to increase VFM?
Interviews with clients, supported by case study findings, show that the NIAF processes to identify and recruit talented diaspora has been highly effective, and the speed at which they have been able to fulfil most needs suggests that the process is also operating efficiently.
The structure of each work stream includes a work stream leader who is an experienced technical expert, often with considerable Nigeria experience and a deep understanding of the political aspects of implementation, and a full time ASI manager is also assigned to manage the day to day administration, recruitment and reporting. This balance of technical and managerial inputs appears to be an efficient distribution of resources, and clients reported positive experiences of the efficiency of dealing with NIAF.
5.2.6.4 Sustainability: Has the programme considered overall sustainability
There is evidence from clients and NIAF personnel that sustainability has been considered in all of the work streams – however, some have dealt with it more effectively than others.
In the Power work stream, a newly privatised industry and institution of a regulator are important first steps in sustaining industry-wide reforms. In the Capital Projects work stream new screening and assessment tools to select projects have been designed and are being used, but mostly by NIAF supported consultants, and not in line agencies/MDAs. The case studies highlight that the challenge for both of these work streams will be to fully institutionalise these changes so that further NIAF support is not needed. In the power sector, further market reforms will be needed which are likely to require NIAF support if they are to be technically successful, and in Capital Projects use of the tools developed need to become a mandated step which would be used by civil servants in project screening and evaluation without NIAF support.
There are also risks, discussed elsewhere, of delivering advice though structures which run in parallel with line ministries, the sustainability of such structures is always limited and work with line ministries might be a more stable platform for change – albeit at a slower rate.
Exit strategies from institutions have been discussed in Section 5.2.2, but there are also important lessons to be learned about collaboration with other donors. In the roads sector, the World Bank had been considering supporting the development of a Roads Asset Management System, but was unable to deliver this support even after a number of years of discussing with the Ministry of Works and FERMA. NIAF however was well placed to move quickly and developed the system with FERMA. This quick response was praised by the client, but led to a situation where the World Bank subsequently appointed its own RAMS advisor who criticised the NIAF supported RAMS. The situation may have been resolved, but it illustrates the risks of progressing rapidly without agreeing complementary roles with other donors. Clearly the risks and benefits of these agreements must be balanced against time taken which could undermine one of NIAF’s key benefits – its speed of delivery.
5.2.7 Value for Money
Approach to assessment of VFM
NIAF documentation demonstrates that VFM considerations have been prominent in the development, monitoring and review of the programme. Significant consideration is given to VFM, for example, in the project completion report of NIAF1, the development of the business case for NIAF II and the
Formative Evaluation of NIAF II
73
subsequent expansion of funding, and in the annual reports of NIAF II, which have been informed by VFM assessments.
Assessment of VFM has been in line with DFID’s “3 Es” framework, taking account of:
■ Economy – procuring the required inputs of sufficient quality at the least cost; ■ Efficiency – maximising the outputs achieved relative to the inputs; and ■ Effectiveness – ensuring that the outputs delivered achieve the target outcomes.
The approach to each of these aspects is set out in the paper on the NIAF VfM Approach36.
VFM assessments of NIAF have involved:
■ Analysis of the costs and benefits of the different workstreams, to assess the overall net returns from the programme; and
■ Qualitative assessments of the processes of procuring inputs (economy) and translating inputs into outputs (efficiency).
The assessment of VFM in this formative evaluation has been based largely on a review of existing evidence and analyses, rather than the collection and analysis of new data. Overall, this evidence suggests that NIAF is well positioned to deliver strong value for money. However, this finding needs to be qualified on the basis that most of the available evidence:
■ relates to the economy and efficiency of processes of delivery, while quantitative evidence of effectiveness, particularly in relation to the value of benefits achieved, is patchy; and
■ is presented in internal NIAF II documentation, rather than through independent external analyses. This tends to provide supporting information on VFM rather than independent, critical analysis, while the evidence, assumptions and workings that underpin available estimates are often lacking, making critical review difficult.
Costs and Benefits of NIAF
Cost benefit analysis is possible because the principal outcomes of NIAF interventions can be measured in money terms. These benefits include reductions in energy costs, transport costs and carbon emissions, and increased rates of return from other infrastructure investments. However, these benefits result from the infrastructure investments themselves, and a significant challenge is in assessing the effect of the NIAF interventions in securing these benefits.
A key factor influencing the assessment of VFM of NIAF is its role in using relatively modest investments in technical assistance to enhance the effectiveness of much larger capital expenditure programmes. Hence the £98m investment in NIAF II aims to enhance the effectiveness of a much larger infrastructure investment programme, estimated at £180 billion between now and 2030.This means that, if it is effective, NIAF has the potential to generate very high rates of return relative to the resources committed. On the other hand, it also raises significant challenges in attribution and the assessment of additionality – it would be misleading to attribute the returns from infrastructure investment overall to NIAF interventions unless there is clear evidence that they have added value to the outcomes achieved.
The review of NIAF I concluded that:
■ Where the outcomes of NIAF influenced infrastructure investments which can be attributed to NIAF interventions, appraisals show that the benefits are substantially greater than the cost of the intervention
■ Rates of return from successful interventions are very high, measured at between 67 per cent and infinity; For example, a power sector intervention costing “a few hundred thousand pounds” produces net benefits valued at £750 million per year.
■ More generally, the outcomes of interventions in the power sector and other workstreams are found to be less tangible but to have laid the framework expected to lead to substantial future improvements.
36 NIAF Value for Money (VFM) Approach, ASI, March 2014

Formative Evaluation of NIAF II
74
■ These long term benefits are subject to substantial risks and uncertainties, but, if realised, will also be expected to deliver very high rates of return.
■ It is found that interventions were often necessary to achieve these successes, though not universally so. The added value of NIAF investments in influencing outcomes was found to be variable between workstreams and types of intervention.
The review provides a general discussion of VFM rather than a comprehensive or structured analysis. No details of the methodology or underlying calculations are given, so these cannot be evaluated, and the analysis is somewhat anecdotal. The VFM analysis shows that – if NIAF interventions are judged to be necessary to achieve the measured benefits – the benefits of these interventions can greatly exceed the costs. This is partly explained by the relatively low costs of the technical assistance provided by NIAF, compared to the overall costs and benefits of the infrastructure investments supported. The claimed rates of return therefore hinge on the ability to be able to attribute the benefits to the NIAF intervention. It is difficult to assess whether an alternative approach to assessing the value added of interventions (rather than an “all or nothing” assessment of benefits) would be possible. For the majority of interventions, it is argued that the benefits will be through the development of longer term capacity and enabling frameworks, and this is given as an argument for continuing ongoing support. While it is argued that large net benefits are expected in the long term, this is uncertain and difficult to appraise. Nevertheless, it is acknowledged that, even if many interventions fail to have an impact, the potentially high benefit: cost ratios of successful interventions mean that only a proportion need to succeed to deliver value for money overall.
The business case for NIAF II employs a series of assumptions about savings in power and transport costs, carbon emissions and increased returns from capital and urban projects to estimate that, with NIAF support, the present-value of benefits from investing more effectively will be almost £6 billion (using a 10 per cent discount rate). Against an initial cost of £48 million, this implies a very high cost-benefit ratio of 1:125. These benefits are dependent on continued political support for reform efforts. The estimates are sensitive to the assumptions employed; however, sensitivity analysis shows that NIAF would need to achieve only a very small proportion of its projected results to deliver net benefits.
The business case for NIAF II projects quantifiable increases in the target outcomes. Additional investment of £50 million is estimated to yield extra economic benefits of more than £1 billion, suggesting a benefit cost ratio of 20:1.
Based on plausible assumptions, the business case demonstrates the potential for NIAF II to yield very strong positive returns, providing the interventions deliver added value in influencing the overall target outcomes of infrastructure investments. These high returns result from the strong leverage effect of NIAF in influencing much larger capital programmes. This means that, even if much less influential than envisaged, the programme can be expected to deliver net benefits.
The Annual Reviews 2012 and 2013 do not attempt to provide an overall assessment of costs and benefits but contain a number of examples where NIAF interventions are said to be contributing to tangible economic returns. These examples demonstrate that NIAF II has the potential to yield high economic benefits relative to the resources committed, but the additional influence of NIAF interventions themselves on the estimated outcomes would need to be critically assessed.
Economy and Efficiency of Delivery Model
The economy and efficiency of the NIAF delivery model has been assessed qualitatively in the programme reviews, and in the paper on the NIAF VFM approach.
On economy, the NIAF VFM Approach paper argues that the delivery model promotes good VFM through economies of scale in administrative costs, attributable to the scale of the programme, which could not be achieved through smaller projects; and by minimising administrative burdens on DFID by internalising some programme management and oversight tasks within the programme. More specifically, examples are given of cost effective procurement and programme operations (e.g. steps to minimise travel and subsistence costs), focused deployment of resources (concentrating tasks among small groups of consultants), exploiting economies of scale across interventions, and achieving cost effective consultant fee rates.

Formative Evaluation of NIAF II
75
It is further argued that the NIAF Facility Model promote exceptional VFM through efficiency by allowing the PMU to scale up and replicate successful interventions (among the large number of relatively small interventions supported), permitting the PMU to respond flexibly and quickly, and providing efficient allocation of project management costs and risks. It is argued that a range of strong project management practices contribute to efficiency. Furthermore, the Results Based Funding Structure varies project fees based on performance against output indicators. Efficiency can be examined in relation to 28 output indicators, for which input costs can also be assessed. These indicators are listed in the paper but no assessment of efficiency is provided.
The NIAF I review found no significant problems with the delivery model, but suggested that greater use of competitive tendering might help to increase value for money, by providing greater certainty that the interests of providers were aligned with those of DFID. However, this is inconsistent with the NIAF II facility model, and the time taken to go through a tender process would preclude the flexibility and responsiveness which is a feature of NIAF II. The discussion highlights the need to find an appropriate balance between the continuity of supply and low transactions costs offered by preferred suppliers, and the use of competitive tendering to maximise the cost effectiveness of individual interventions.
The business case for expansion of NIAF II argues that strong measures have been put in place to secure VFM through NIAF II, including improvements in procurement processes designed to enhance the economy of interventions; strong programme planning, management and control, designed to enhance efficiency, and a strong framework to achieve target outcomes, designed to increase effectiveness. It states that the competitive tender process and subsequent negotiation have reduced costs significantly from Phase 1. This extension will be used to further reduce costs and to utilise scale economies to reduce the share of administrative costs in the overall budget. Project reviews have confirmed not only the strong performance of the programme but also that it is providing value for money, and a robust system is in place to ensure that it continues doing so. The competitive tendering process resulted in a 10 per cent reduction in average fee rates when compared with NIAF 1. A fall in administrative costs has been achieved from 15.7 per cent to 9.1 per cent following the costed extension, reflecting scale economies in administration, and is considered acceptable. Benchmarking work on fees conducted within DFID Nigeria found that NIAF fees are not out of line with others being paid in comparable technical areas. The NIAF II contract also has a significant element of payment by results, allowing for symmetrical increases or decreases from the agreed fee basis for different degrees of over or under performance.
However, some concern is expressed about the limited competition among bidders for NIAF II (only one credible competitive bidder against the incumbent), limiting the ability to maximise VFM through the bidding process.
The Annual Reviews 2012 and 2013, and VFM analyses underpinning them, both conclude that NIAF II is delivering value for money, and point to evidence of economy (cost savings relative to NIAF1, enhanced economies of scale, sound management processes) and efficiency (client satisfaction, QA and management processes, incentives through TRP).
The reviews are generally positive about the contribution of processes to VFM. However, while there have been measured reductions in costs since NIAF1, it is difficult to assess whether or not further cost reductions might be possible. The business case for NIAF II expansion raises some concerns about the degree of competition in the tendering process, limiting its scope to maximise value for money. There are some contradictions between documents in this regard, with the 2012 annual review stating that “NIAF II was tendered in July 2011 and a number of quality bids were received”, while the business case for NIAF II expansion stated that only 3 bids were received for NIAF II, of which “only 2 could be said to be fully competitive”. This raises some concerns about the level of critical analysis of VFM provided by the annual reviews. Similarly, the NIAF VFM Approach paper (written by ASI) makes positive statements about the contribution of processes to economy and efficiency, but these are based only on descriptions of procedures, and no quantitative information, comparative analysis or critical assessment is provided. The paper reads more like a promotional document or brochure than a critical analysis.

Formative Evaluation of NIAF II
76
Conclusions on VFM
Overall, existing documentary evidence suggests that NIAF is capable of delivering strong VFM, by using its resources economically, efficiently and effectively, and can be expected to provide a strong return on resources over time.
This finding is consistent with the analysis in response to each of the research questions, which indicate that, overall, NIAF appears to be delivering strong VFM, though there are significant challenges relating to quantification and attributability of results, and limitations in the extent to which critical analyses have been undertaken.
Overall, we conclude that:
■ NIAF interventions appear to be capable of delivering strong net benefits, although these vary between workstreams. While projections of net benefits in the NIAF2 business case are plausible, quantitative evidence of the value of benefits achieved to date is patchy. Evidence of the additional effect of interventions in influencing the target outcomes of relevant infrastructure investments is crucial in the assessment of the benefits and hence VFM offered by the programme. There may be scope to strengthen VFM analysis in future, by developing more robust measures of the value added of NIAF interventions – i.e. their overall effect on the measured outcomes. Greater focus on the outcomes achieved by infrastructure investments compared to a counterfactual scenario involving no NIAF intervention could help to achieve this.
■ Documentary evidence suggests that the processes of delivery are contributing to the economy, efficiency and effectiveness of intervention, although the scope for critical analysis of this is constrained by limitations in evidence.
6 Conclusions and Recommendations
Performance Questions 6.1
6.1.1 Relevance
The review of the Nigeria development context, government and DFID priorities in sections 3 and 5.1.1 above show that the design of NIAF II is highly relevant to both developmental obstacles and policy priorities. NIAF is well aligned with the FGN’s NV20:2020 and sectoral policy documents for power, infrastructure development and management, transportation and environmental management. It responds well to DFID priorities for good governance, growth and addressing the inequalities which are the root causes of fragility and conflict in the North.
The design of NIAF is derived from a theory of change which has been elaborated through the business case for the NIAF expansion and more recently by the NIAF PMU. The rationale for the programme based on an improvement in infrastructure planning and management as a means to reduce infrastructure constraints to growth and poverty reduction is clearly set out and is largely supported by our own literature review. The technical assistance facility combined with a set of change processes based on key principles of approach (demand-responsiveness, political economy awareness, flexibility and influencing) has also been well-articulated. As such the NIAF ‘model’ is an innovative programme design which is highly relevant to the Nigerian context.
Recommendation
1. The NIAF story and theory of change as drafted by the PMU could be further elaborated and more fully explained with the addition of a summary diagram and inclusion of the assumptions made (the external conditions for success) and the causal factors (or drivers of change) along the results path. The diagram and summary text derived by the evaluation team (Appendix 3) can be improved with the benefit of the NIAF PMU experience, and with reference by NIAF to our literature review. A clearer explanation of assumptions and

Formative Evaluation of NIAF II
77
causal factors, particularly in relation to the outcome and impact linkages, may assist future operational choices and direction.
6.1.2 Efficiency and Value for Money
Programme management: the governance and management structure has evolved to provide an efficient framework for cost-effective delivery of programme inputs and outputs. Section 5.1.2 above has shown that unit costs have been kept low through competitive tender of the management contract, through a pre-agreed fee-rate band, annual negotiation of costs, and the use of local consultants. Programme management costs as a proportion of total costs reduced from 2012 to 2013 although they have increased in 2014 due to the allocation of RBFS payments to PMU costs. If this is excluded management costs average 9.9 per cent of total costs over the programme life so far.
Programme management features include: (i) a system for selecting projects which closely maps them to output indicators; (ii) ToRs which are aligned with logframe outputs and agreed by the PMU, the client and DFID; (iii) the results-based funding structure (RBFS) (introduced in 2013); (iv) the role of the Annual Review in assessing overall programme performance; (v) the role of the TRP in evaluating performance against the logframe; and (vi) the flexible nature of the logframe itself.
Project selection is systematic based on output indicator strategies, selection criteria and individual terms of reference.
The RBFS is an innovative approach to linking payments to results achieved. The system appears to be working well, providing a strong incentive to focus on the most important programme outputs (which will increasingly move towards some measure of outcome).
Monitoring and Evaluation: the NIAF results monitoring system is efficient based on a dynamic logframe which is regularly reviewed for the RBFS. The expected shift of focus of results monitoring from Outputs to Outcome in 2015 will help to improve definition of outcome indicators and sharpen both the direction and the level of ambition of the programme for the programme end in December 2016.
Inputs provided by the TRP and Annual Review give important external perspectives with the former focusing on logframe targets and the latter with more emphasis on process. Visits of both teams would, as highlighted by them, be much improved by visits outside Abuja. Recommendations of the TRP need to be responded to as some of the same recommendations appear to be repeated after each visit.
The discipline of results monitoring focusing on logframe targets whilst efficient, needs to be supplemented with a more systematic process to capture the lessons of the NIAF experience.
Recommendations
2. The RBFS is due for review in October 2014.Good progress made in H2 of 2013 has meant payments to the manager at the upper limit. However, more difficult conditions are likely over the next few months, and performance of the RBFS over this period should be reviewed before changes are made. The TRP needs to be vigilant over tendencies for the programme to focus on those outputs which are “easier” to achieve at the expense of more important transformational projects which might be harder to achieve but provide greater contribution to sustainable outcomes, although there are mechanisms within the RBFS and AR scoring systems which mitigate against this occurring.
3. Continue to monitor the RBFS to ensure it is achieving its objectives by providing an effective incentive structure for delivering logframe outcome and impact, and value for money.
4. Enhance the efficiency of the TRP visits and Annual Reviews by a) including visits outside Abuja and b) with a formal response to their reports from the PMU.
Formative Evaluation of NIAF II
78
5. The NIAF PMU should design and establish a systematic learning system so that the lessons of the NIAF experience are more fully captured and documented.
6.1.3 Effectiveness
Assessment of effectiveness at this stage of the NIAF II programme is limited to the effectiveness of the delivery of inputs and in particular the timeliness and quality of outputs.
Expenditure is largely on-track with small variations amongst workstreams. The vast majority of NIAF II clients report good quality and timely advice. Section 5.1.3 above summarises the progress of each workstream against output indicators. Power, capital projects and effective cities have performed well, whereas the roads and climate change workstreams are experiencing difficulties – the former has recently put on hold, and the latter is progressing slowly.
The Annual Review in November 2013 was optimistic that, with the satisfactory progress and current level of political support, outcome achievement is possible. The most recent TRP report of April 2014 reinforces these findings but highlights that risks to the programme are high, particularly in the light of the Nigerian election in 2015.
Strategic Evaluation Conclusions & Recommendations 6.2
6.2.1 Is NIAF II positioned to improve the management of infrastructure development at federal and state level in Nigeria? Is there evidence that this has the potential to a) reduce infrastructure constraints and b) contribute to non-oil growth and reduced poverty?
The programmatic design of NIAF II aligns closely to a robust theory of change which has been broadly confirmed by our literature review.
Although almost all of NIAF’s clients have found NIAF to be moderately or more than moderately responsive to their needs, the traction obtained by each workstream indicates a varying degree of relevance to clients. In the case of Roads and Climate Change weaker traction appears to be due to a lack of political support, and in the case of Cities, due to the complexity of the institutional environment and lack of technical capacity.
Whilst NIAF seeks to take into account both the importance of intervening in sectors which are critical for economic growth, the varying levels of performance in each sector, demonstrate the importance of understanding the political economy of the sector. The significant success of the work in the power sector and capital projects workstream contrasting with the relative lack of progress in the roads and climate change workstreams are examples of this where political support has proved more difficult.
However it can also be noted that whilst a favourable political economy is a necessary driver of performance, it is not a sufficient condition for sustainability of NIAF results. The progress of the capital projects and effective cities workstreams indicate that more time is needed to embed institutional structures and technical procedures, especially in the light of the presidential election in 2015.
The NIAF theory of change depends largely on a long-term and indirect impact on poverty reduction based on raised incomes and employment through economic growth. It also infers that reforms are necessary in the delivery of infrastructure and services before pro-poor investment can take place. Our literature review finds that improved infrastructure has a beneficial impact on poorer people provided that they have access to services. It is too early to judge whether NIAF can effect an impact on economic growth that will cause an indirect, ‘trickle-down’ impact on poverty reduction, or whether there will be improved access to services which will have a beneficial

Formative Evaluation of NIAF II
79
impact for poorer people. Whilst NIAF does support some targeted programmes (labour-based road maintenance, clean cookstoves, urban solid waste management (planned) and affordable public transport), and it has included a specific output on Northern growth, its overall impact on poverty reduction is assumed rather than currently observable. It is noted that NIAF II is developing a system for measuring pro-poor impacts across the programme, which should be in place with a fist set of numbers available in Q4 of 2014.
The NIAF theory of change also indicates that there are synergies to be gained from individual outputs which can reinforce their collective achievement. There is some evidence of collaboration and synergy between workstreams (primarily capital projects with power, roads and climate change) but also a potential risk that, in the absence of formalised lesson-learning and a focus on logframe targets, that opportunities for synergy may be missed.
Recommendations
6. The NIAF PMU should regularly review its theory of change to ensure that assumptions concerning poverty reduction are being acted upon and, with the evidence provided by the literature review, that all workstreams are sufficiently proactive to ensure that technical approaches are adequately poverty-targeted and gender sensitive.
6.2.2 Does NIAF II at the programme and project level adequately reflect its strategic principles (demand-responsiveness, flexibility, political economy awareness and influencing); and are these making a difference in bringing about reforms in infrastructure investment?
NIAF II does clearly apply the strategic principles (demand-responsiveness, flexibility, political economy awareness and influencing), particularly in the Power, Capital Projects and Effective Cities workstreams. Application of the principles appears to be strongly related to success; where the principles have been applied well, successes (or potential successes) are more in evidence than in areas where they have been applied less well.
The ability of NIAF to respond quickly and effectively to client demands is clearly a core strength of the programme and distinguishes it in the eyes of clients, from other donor programmes. Many clients reported that NIAF was the partner of choice because of their responsiveness.
A deep awareness of political economy has allowed the NIAF interventions to be closely targeted on areas where change is possible. This political understanding is strongest in Power and Capital Projects, and has also been used effectively to some degree in Effective Cities. Roads and Climate change have been less successful in identifying interventions which align well with prevailing political trends, and as a result they have not delivered as successfully as planned.
The flexibility of the programme has meant that interventions can be led by political opportunities. This does leave NIAF open to the risk of opportunism at the expense of long-term strategic change, but the evaluation team found that this risk was largely being mitigated by strong theories of change and an underlying strategic focus often held by the experienced workstream leaders.
NIAF has managed to balance the potentially competing principles of responsiveness and influencing by working closely with government clients to influence their demands for support to reform processes. The Power workstream accomplished this by providing the president with a ten-point plan for power sector reform. Other sectors have sought to emulate this through reforms to PPP rules and transport planning. The roads work stream worked hard to embed an asset management approach to road maintenance, this gained some traction, but has stalled in the face of adverse political incentives.

Formative Evaluation of NIAF II
80
In addition to these principles, addressing the entire market or supply chain appear is critical for success. In the Power workstream, whilst good progress has been made on privatisation, other necessary reforms are not yet in place (TEM and reforms in the gas supply). In Urban Transport there are some good examples of market reform of bus services where a full supply chain approach was taken to service provision.
The perception survey indicates that Nigerians from all over the country are optimistic about improvements to the power sector, roads and bus transport. Currently approximately 40 per cent of people think that these services are good or very good, and 90 per cent think that they will be good or very good in five years’ time. This level of optimism bodes well for a programme which is rooted in political capital.
Recommendations
7. Interventions should actively seek to embody the NIAF strategic principles – where it is not possible to fully embed them, NIAF may not be the best placed programme to support change.
8. Whilst NIAF should intervene in an incremental manner, it needs to take a strategic view of the sector in order to monitor the feasibility of intervening at every stage of the supply chain.
6.2.3 To what extent has NIAF II support helped to improve the results derived from Nigeria’s spending on infrastructure? Are there common obstacles to achieving this, and how might they be overcome?
NIAF has shown some success in delivering improved results from Nigeria’s spending on infrastructure, and is well positioned to deliver further improved results over the balance of the programme.
NIAF success in delivering results, and its prospect of delivering further results, is dependent on its continuing ability to identify and exploit political entry points.
In areas where there is not strong political and institutional support, as a result of either (i) vested interests which oppose the necessary reforms, or (ii) situations where the weaknesses in policy or institutional framework prevent NIAF achieving traction with client organisations, improved results from infrastructure expenditure are unlikely.
The flexibility of the facility, and its ability to put significant resources into areas where there is a strong prospect of gaining political support and thus establishing traction and momentum for reform is critical to its ability to deliver improved results.
Improved results have largely been in circumstances where an element of private sector participation has been introduced into the infrastructure sector, which has enabled incentive structures to be established which support: (i) cost-efficient use of resources in delivering infrastructure; and (ii) attraction of private sector finance This is likely to improve infrastructure quality and thus support economic growth, but not necessarily result in poverty reduction.
The use of PPP modalities within a clear, transparent and predictable legislative framework attracts better quality providers of investment, construction and management services, who demand and introduce the high social and environmental standards which are consistent with international best practice. This improves the quality of results and can have an indirect beneficial impact on social development and poverty reduction.
The use of PPP arrangements to deliver improved results is important, but should not deflect attention from the key objective of ensuring that processes and procedures which deliver better quality infrastructure results are introduced and mainstreamed into the work flows of MDAs.

Formative Evaluation of NIAF II
81
Recommendations
9. NIAF should continue to focus on opportunities to intervene where political support is strong. Experience is showing that the most productive opportunities have been where infrastructure and services are in a state of collapse and thus political incentives are positive, e.g., the power sector or in an urban context where there is public pressure to improve services (poor bus services, poor or inadequate solid waste collection and management).
10. Resistance from entrenched vested interests to introducing and embedding the tools for project screening and appraisal within MDAs is becoming a critical obstacle to achieving broader success in improving FGNs infrastructure spending. While maintaining pressure through existing channels for the embedding and institutionalisation of these tools, it is also important that parallel efforts are made to identify alternative points of entry where there is receptiveness within MDAs to use of these tools.
11. Improving results from Government expenditure on infrastructure means that the tools and approaches which have been developed need to be introduced and mainstreamed into work steams within MDAs which remains a key challenge. In the short-term, within the Capital Projects workstream, innovative ways need to be found to work around the obstacles which are preventing the introduction of the systems, tools and procedures needed to improve infrastructure investment.
12. NIAF needs to be able to demonstrate that the PPP approaches that it is effectively piloting in the power sector and through NSIA and selected state governments (such as Lagos) are replicable in other sectors and in other jurisdictions. The key is to build up sufficient momentum for PPP approaches by end of project, and by that time to have contributed to the establishment of a robust policy and legislative framework for PPPs at the federal level.
13. For Effective Cities, delivering improved results depends upon: (i) demonstrating the value of initiatives in the pilot cities in terms of improved data and infrastructure efficiency; (ii) promoting these achievements; and (iii) developing a strategy through which such reforms may be rolled out across other cities in the country.
14. For Climate Change better results may best be realised by seeking a more indirect route to achieving climate change objectives through: (i) mainstreaming climate change through other workstreams and (ii) opportunistic engagement with government on programmes which do not have climate objectives per se but which can achieve or demonstrate climate-friendly approaches.
15. For the Roads work, a new point of entry needs to be found based on a more favourable political economy. Without the approval of the draft legislation and significant institutional reform, it is unlikely that beneficial results from improved surveys and maintenance will be realised or sustained.
6.2.4 Is NIAF II likely to play a role in increasing public and private sector funds for infrastructure provision in Nigeria? Is there more that NIAF II could do to stimulate investment?
NIAF has shown some success in; (i) leveraging additional funding from the private sector for infrastructure provision; and (ii) working in collaboration with other donors and IFIs to leverage additional funds into infrastructure sectors.
Although it is too early to assess the full impact that NIAF II is likely to have on the additional expenditure being brought into the infrastructure sector, even if only a small portion of the additional financing identified is attributable to NIAF II, it has clearly been effective in: (i) attracting significant additional private sector capital into infrastructure development and management; (ii) increasing bi-lateral and multi-lateral agency support to infrastructure development; and probably (iii) increasing the efficiency of Government spending on infrastructure.

Formative Evaluation of NIAF II
82
By far the most significant quantum of funds raised were from the private sector for the privatisation of PHCN successor GenCos and DisCos at $2.25bn.In addition private sector investment is committed through binding agreements on the new Discos of US$ 2.5bn, and on the Gencos of between US$ 1.5 and 2.5bn.
Recommendations:
16. Continue to work with other donors and IFIs in using NIAF inputs to help leverage further funding into the infrastructure sectors to support sector reform or direct investment
17. Learn from experience during the first two years of NIAF II on the best mechanisms to benefit from joint working with other bilaterals and IFIs (e.g. why did working collaboratively with the World Bank work in the power sector and urban planning and transportation sectors, but fail in the Roads sector?).
18. Continue to support development of PPPs through: a) a greater focus on building institutional and staff capacity of agencies in which
NIAF consultants play a significant role (e.g. NSIA) and developing a clear exit strategy;
b) the development of a unified legislative framework to guide PPPs at the federal level.
19. Concentrate in areas which are a focus of the NIAF programme and where other donors or IFIs are active.The complementarity of support offered by both parties can maximise the opportunity for a successful outcome – for instance in the case of supporting ICF funding in the proposed PV project.
6.2.5 Which interventions within the NIAF II programme are having the greatest effect? Is the balance of investments appropriate to achieving its goals relating to non-oil growth and reduced poverty?
Individual workstreams in the NIAF II programme are largely well aligned to the objective of contributing to non-oil growth but less well-aligned to direct poverty reduction. The power sector theory of change provides strong arguments for its promotion of economic growth and an indirect contribution to poverty reduction, with little contribution as yet to the Northern growth output. The roads workstream is similarly aligned although it has been able to support the poverty-targeted labour-based roads maintenance programme. Whilst alignment of the capital projects workstream is high in terms of non-oil growth, it too is not directly aligned to poverty reduction objectives, although it has the potential to be more so through the provision of technical support for geographical or social targeting of infrastructure investment to directly address poverty reduction. The effective cities workstream is supporting models of service delivery which can have direct poverty impact although it is too early to show the evidence of this. The climate change workstream contains projects which are directly targeting poverty but the nature of the projects is unlikely to be transformational in terms of their structural impact on poverty reduction.
As a whole, NIAF is broadly delivering results according to expectation although there is significant variation between outputs and workstreams. The work of the power workstream has surpassed expectation, capital projects is performing above target, roads and effective cities are largely delivering as expected, but climate change is somewhat under-performing. Key challenges remain: obtaining a reliable gas supply and further market development to sustain the reforms in the power sector, sustaining political support in the capital projects and roads workstreams, time to establish new institutions and to demonstrate success in key projects of the effective cities workstream, and defining a strategic focus and transformational potential for the climate change workstream.

Formative Evaluation of NIAF II
83
The assessment of performance by this evaluation, by Annual Reviews and TRP reports is largely consistent. Allocation of resources is consistent with both the expected impact and results.
For the remainder of the programme, maintaining a mixed portfolio of investment which balances expected impacts and results, timing of expected impacts, and risk is important for sustainable outcomes. Specifically in this regard, whilst the power sector has been successful so far, reforms will continue to be high-risk and returns are long-term. The Capital projects workstream is showing significant short-term cost-saving and investment leverage although sustaining reforms is also high-risk and longer-term. Effective Cities is small-scale so far but has potential to scale-up in the longer term, particularly contributing to the Northern Growth output. In contrast, whilst contributing to Northern Growth, the climate change workstream is showing few tangible or strategic results.
Recommendations
20. The NIAF PMU should review the composition of each workstream to ensure that each is adequately aligned to poverty reduction objectives, including geographic and social targeting for direct positive impact wherever possible.
21. NIAF II should maintain a balanced portfolio of support for the remainder of the programme in order to maintain a balance across outputs of risk, long- and short-term achievement of results, and contribution to outcome achievement.
6.2.6 Are there any changes of a) approach or b) procedure that might help NIAF II to be more effective over the second half of the programme?
Some clients have come to rely heavily on NIAF support, and exit strategies are not always a clear part of the project plan. In some projects, it appeared that consultants were effectively building capacity so that support could be sustained internally with the client’s own staff, but this approach was not always an explicit strategy and seemed to be driven by individuals rather than corporately.
The way in which the outputs have been assigned to workstreams means that the implementing workstream does not always have the necessary expertise. As a result, there have been some creative and potentially successful collaboration, particularly where a workstream skilled in market development takes on a technical infrastructure challenge such as rural roads maintenance. In the case of the Labour Based Roads Maintenance programme, the capital projects workstream has delivered this effectively and has drawn on roads expertise to inform elements of the work, but the overall programme has the characteristics of a politically-aware programme designed to influence and scale. This contrasts with a more conventional roads programme which may have resulted if it had remained under the control of the Roads workstream.
NIAF and the implementing agency clearly has considerable expertise in market based solutions based approaches, and whilst there has been some effective collaboration, it appeared that other opportunities are not being exploited as thoroughly as they could be. For example, the cookstoves project being delivered through the climate change workstream calls for the development of a market for clean cooking energy. However, the experience in market development is less in evidence here.
The Climate workstream has staff with a deep understanding of climate change as it relates to infrastructure, but without the expertise in applying NIAF’s successful approaches, it has struggled to gain traction.
Few of NIAF’s projects are explicitly targeting poverty reduction. Evidence from the literature review suggests that without clear targeting of interventions, benefits may not necessarily reach the poorest. Some evidence from Federal PPP reform suggests that international institutional investors are starting to demand improved standards for social and environmental impact assessments of infrastructure programmes. Such demand from international investors may prompt the client demand for more targeted work on poverty and other social impact, and could potentially offer an opportunity for NIAF to engage positively at a strategic level with these issues.

Formative Evaluation of NIAF II
84
Recommendations
22. Explicit exit strategies should be incorporated into each project and/or indicator strategy in order to improve sustainability.
23. Projects should be delivered by workstreams which are skilled in the solutions (e.g. market development approaches), rather than the problems (e.g. climate change). NIAF’s strong technical experts on problems such as climate change should be brought to bear in an advisory capacity across all workstreams. rather than being responsible for delivery.
24. NIAF should explore the possibility of applying strategic level expertise in gender, poverty and social inclusion to infrastructure programmes. Nascent demand from international investors could be used to leverage this expertise into projects by creating a demand from clients which NIAF is able to respond to.
6.2.7 Is NIAF II providing value for money?
NIAF documentation demonstrates that VFM considerations have been prominent in the development, monitoring and review of the programme. Business cases and reviews of NIAF have all referred to the very high cost-benefit ratio which is possible from the facility. This is explained by the relatively low costs of the technical assistance provided by NIAF, compared to the overall costs and benefits of the infrastructure investments supported. VFM assessment is challenged by assessing the effect of the NIAF interventions in securing benefits – specifically assessing NIAF contribution to investment outcomes.
Section 5.1.2 above and DFID and NIAF documentation also point to the economy and efficiency of programme management including competitive tendering, economies of scale of management, results-based payment and ongoing cost-savings. Comparison (by DFID) with other DFID programmes indicates similar or lower consultant fee rates within NIAF.
Overall, this evaluation concludes that documentary evidence suggests that NIAF is capable of delivering strong VFM by using its resources economically, efficiently and effectively, and with a high expected return on resources over time. However, evidence of the additional effect of NIAF interventions in influencing the target outcomes of relevant infrastructure investments is crucial in the assessment of the benefits and hence VFM offered by the programme.
Recommendation
25. Strengthen VFM analysis in future, by developing more robust measures of the value added of NIAF interventions – i.e. their overall effect on the measured outcomes. Greater focus on the outcomes achieved by infrastructure investments compared to a counterfactual scenario involving no NIAF intervention could help to achieve this.
6.2.8 Under which conditions is the NIAF ‘model’ most likely to be successful?
Delivering results through an advisory facility like NIAF requires that the strategic principles (political economy awareness, flexibility, demand responsiveness and influencing) can be fully applied. In order to apply fully these principles a number of conditions should be in place, without which the impact of the facility will be limited, and other forms of support should be considered. The findings of the evaluation indicate that these are the key conditions which should be in place:
Base level of capacity
Without a basic level of capacity in government clients, the facility cannot be fully demand driven. It was evident from interviews across a wide range of clients that advisors were most effective and

Formative Evaluation of NIAF II
85
efficient working with clients who already had an understanding of the reform programme and an awareness of their own limitations.
Where there was limited capacity, advisors had to work intensively with clients to build a shared understanding of the problem as it was, and a potential route-map for reform. Even where this was possible, clients with low capacity often targeted service reform more towards middle and higher income groups than the poorest.
Where there was an existing level of understanding, for example at the federal level and in larger cities, advisors were able to gain traction more quickly, and clients were more able to take ownership of the changes.
A skilled and willing diaspora
NIAF has made excellent use of the Nigerian diaspora with considerable skills gained overseas and a willingness to return to Nigeria in order to benefit from the high rate of economic growth. Countries with a similar profile, both of diaspora and the conditions needed to attract them to return will have the ready source of skills and understanding which is needed for advisory facilities to work well.
Potential investors
Infrastructure advisory facilities work best where there is a ready supply of investment which would dwarf potential donor investment. Where donor’s direct ability to fund infrastructure is minimal, an advisory facility may be better placed to fund high value added expertise to support private sector investors.
Where major international and institutional investors can be attracted, their demands for high standards of governance and social and environmental considerations can bring about a virtuous circle in which investors demand higher standards from government, and an advisory facility can in turn help government develop a more attractive investment proposition.
Political impetus
Selecting projects which already have political impetus is important. The initial selection of the power sector exploited a particular set of political opportunities and the president’s support and adoption of NIAF’s ten-point plan gave the programme instant traction. Nigeria is a country where political patronage is critical – as a country, strong leadership from the top, both at state and federal level is needed to secure reforms. The selection of projects should be pragmatically based on likely levels of political support rather than simply an objective assessment of needs. The ability to monitor and act politically is critical to take advantage of these opportunities when they arise.
It is possible that in a political system which is less dominated by a few powerful individuals, that political patronage for projects would be less critical.
Crisis
A sector which has reached crisis point, and for which there is the political will to address it would make a good candidate for an advisory facility. The Power sector provided a good example of this, successive reforms had failed, leaving power generation and transmission as a key barrier to economic growth. Governments had tried expensive injections of capital without success, it was clear that new expertise was needed. In contrast, in the roads sector, whilst the sector cannot be said to be functioning well, it has not had successive failed attempts at reform, and has not reached a crisis point, so existing structures and vested interests are still powerful enough to resist change, providing less fertile ground for transformative reform to take hold.
Formative Evaluation of NIAF II
86
Institutional clarity
Where there are a range of institutions with overlapping remits, and potentially competing interests, an advisory facility can become ensnared in unhelpful institutional politics. In this case a higher failure rate should be expected because it is likely that some of the advisors would be attached to institutions which have limited effectiveness.
Right mechanism, right contractor
For a facility of this size and nature, the ability to quickly access and mobilise good quality technical resources across a wide range of skills is critical to success. This requires a managing contractor with the capability to do this – probably a large organisation with good access to large pool of experts with high levels of technical and managerial skills, and preferably a route into the diaspora from the beneficiary country. It also requires a project management and administration set up which allows the contractor to do this (competitive tendering is not practicable as it will take too long) whilst retaining good value for money for the client. This means controlling costs through a robust system for selecting experts and fixing fees within bands; and ensuring effective delivery of outputs and outcomes by incentivising contractor through an innovative payment system (such as the RBFS).
Addressing the entire market chain
For transformational reform to be achieved in a sector requires that an approach which addresses the entire market or supply chain is critical for success. Weakness in one link of the chain can threaten the realisation of the reform (example the TEM in the power sector).
Summary of Recommendations 6.3The following summary of recommendations is drawn from the previous section 6.2 above. They have been clustered into those which should be led by the NIAF PMU and those which are likely to be led by DFID (with the probability that collaboration will be needed). Within these clusters we have suggested a priority sequence of short- and medium-term action.
6.3.1 Recommendations for NIAF
Management & M&E
Short-term
1. The NIAF story and theory of change as drafted by the PMU could be further elaborated and more fully explained with the addition of a summary diagram and inclusion of the assumptions made (the external conditions for success) and the causal factors (or drivers of change) along the results path.
2. The NIAF PMU should a) regularly review its theory of change to ensure that assumptions concerning poverty reduction are being acted upon, and b) with the evidence provided by the literature review, ensure that all workstreams are sufficiently proactive to ensure that technical approaches are adequately poverty-targeted (geographic and social targeting) and gender sensitive for direct positive impact wherever possible.
3. The NIAF PMU should explore the possibility of applying strategic level expertise in gender, poverty and social inclusion to infrastructure programmes. Nascent demand from international investors could be used to leverage this expertise into projects by creating a demand from clients which NIAF is able to respond to.
4. The NIAF PMU should design and establish a systematic learning system so that the lessons of the NIAF experience are more fully captured and documented.
5. The NIAF PMU should strengthen VFM analysis, by developing more robust measures of the value added of NIAF interventions – i.e. their overall effect on the measured outcomes.

Formative Evaluation of NIAF II
87
6. Projects should be delivered by workstreams which are skilled in the solutions (e.g. market development approaches), rather than the problems (e.g. climate change). NIAF’s strong technical experts on problems such as climate change should be brought to bear in an advisory capacity across all workstreams rather than being responsible for delivery.
Medium term
7. NIAF II should maintain a balanced portfolio of support for the remainder of the programme in order to maintain a balance across outputs of risk, long- and short-term achievement of results, and contribution to outcome achievement.
8. NIAF II should concentrate in areas which are a focus of the NIAF programme and where other donors or IFIs are active. Continue to work with other donors and IFIs in using NIAF inputs to help leverage further funding into the infrastructure sectors to support sector reform or direct investment
9. Learn from experience during the first two years of NIAF II on the best mechanisms to benefit from joint working with other bilaterals and IFIs
Implementation & Approach
Short-term
1. Interventions should actively seek to embody the NIAF strategic principles – where it is not possible to fully embed them, NIAF may not be the best-placed programme to support change.
2. Whilst NIAF should intervene in an incremental manner, it needs to take a more strategic view of the sector in order to monitor the feasibility of intervening at every stage of the supply chain.
3. NIAF should continue to focus on opportunities to intervene where political support is strong.
4. Within the Capital Projects workstream, innovative ways need to be found to work around the obstacles which are preventing the introduction of the systems, tools and procedures needed to improve infrastructure investment. Where major obstacles to reform are being encountered through resistance from entrenched vested interests, NIAF II should both maintain pressure through existing channels, and make parallel efforts to identify alternative points of entry where there is receptiveness within MDAs to use of these tools.
5. For Effective Cities, delivering improved results would benefit from a focus on:
c. demonstrating the value of initiatives in the pilot cities in terms of improved data and infrastructure efficiency;
d. promoting these achievements; and
e. developing a strategy through which such reforms may be rolled out across other cities in the country.
6. For the Roads workstream, a new point of entry needs to be found based on a more favourable political economy.
7. Explicit exit strategies should be incorporated into each project and/or indicator strategy in order to improve sustainability.
Medium-term
8. NIAF needs to be able to demonstrate that the PPP approaches that it is effectively piloting in the power sector and through NSIA and selected state governments (such as Lagos) are replicable in other sectors and in other jurisdictions.
9. Continue to support development of PPPs through:
f. a greater focus on building institutional and staff capacity of agencies in which NIAF consultants play a significant role (e.g. NSIA) and developing a clear exit strategy;
g. the development of a unified legislative framework to guide PPPs at the federal level.
Formative Evaluation of NIAF II
88
6.3.2 Recommendations for DFID
Short-term
1. DFID should closely monitor the RBFS over the next year to ensure that: (i) it is not unduly weighted to the benefit of the supplier, and (ii) it does not deflect activities towards quick output wins, while avoiding more difficult work strands which are more critical to achieving outcomes.
2. Dissemination of formative evaluation report – whilst this is entirely a decision for DFID, this formative evaluation must be shared with NIAF, and ideally published for a wider readership. The intended audience would be development professionals with an interest in the role of advisory facilities. This formative report and the data on which it is based will also form the basis of the summative evaluation.
Medium-term
3. DFID should enhance the effectiveness of the TRP visits and Annual Reviews by a) including visits outside Abuja and b) obtain a formal response to their reports from the NIAF PMU.

Formative Evaluation of NIAF II
89
Appendices (see separate volume)
Appendix 1. ................................................................................................................... UIREM ToRs
Appendix 2. ................................................................................. NIAF Formative Evaluation Matrix
Appendix 3. .................................................................................................. NIAF Theory of Change
Appendix 4. ...........................................................................................Checklist for ToC Evaluation
Appendix 5. ............................................................................ Summary of Additional Client Survey
Appendix 6. ...................................................................................... Summary of Perception Survey
Appendix 7. ................................ Literature Review: Infrastructure, Growth and Poverty Reduction
Appendix 8. .............................................................................................. NIAF Programme Analysis
Appendix 9. ........................NIAF Evaluation Case Studies (Power, Capital Projects, Effective Cities)
Appendix 10. ....................................................................................................... Evaluation Itinerary
Appendix 11. ........................................................................................................ List of Interviewees
Appendix 12. ........................................................................................................ Interview Checklist
Appendix 13 ................................................................................................ Additional Client Survey
Appendix 14 .................................................................................. Perception Survey Questionnaire
Appendix 15 ..................................................................................................................... References

ICF International, 6th floor, Watling House, 33 Cannon Street, London, EC4M 5SB T +44 (0)20 7611 1100 icfi.com
Formative Evaluation of NIAF II - Appendices
7 NOVEMBER 2014
Submitted to :
Department for International Development

Formative Evaluation of NIAF II
2
Contents
Appendix 1. UIREM ToRs 3
Appendix 2. NIAF Formative Evaluation Matrix 15
Appendix 3. NIAF Theory of Change 28
Appendix 4. Checklist for ToC Evaluation 32
Appendix 5. Summary of Additional Client Survey 33
Appendix 6. Summary of Perception Survey 44
Appendix 7. Literature Review: Infrastructure, Growth and Poverty Reduction 50
Appendix 8. NIAF Programme Analysis 75
Appendix 9. NIAF Evaluation Case Studies (Power, Capital Projects, Effective Cities) 93
Appendix 10. Evaluation Itinerary 124
Appendix 11. List of Interviewees 125
Appendix 12. Interview Checklist 129
Appendix 13 Additional Client Survey 129
Appendix 14 Perception Survey Questionnaire 131
Appendix 15 References 134

Formative Evaluation of NIAF II
3
Annex 1 Terms of Reference Urbanisation and Infrastructure Research and Evaluation Manager – Nigeria (UIREM)
Terms of Reference
1. Introduction
1.1 DFID Nigeria wishes to appoint a Service Provider (SP) for an Urbanisation and Infrastructure Research and Evaluation Manager (REM) to design and deliver a research programme that will sit alongside the Nigeria Infrastructure Advisory Facility phase II (NIAF II) as well as undertake an evaluation of NIAF II. It is expected that the successful bidder will be a consortium combining international urbanisation researchers, Nigerian research partners, and able to bring in evaluation expertise to research and deliver one formative and one summative evaluation report. NIAF II is a grant of £48m, possibly rising to £100m, over five years that will provide technical assistance to the Government of Nigeria to support investment in power, transport, major infrastructure and cities.
1.2 DFID is seeking proposals that can design and undertake research closely linked to the NIAF II programme as well as developing broader themes on urbanisation in Nigeria. The research programme should deliver international research publications and policy briefings to DFID and other stakeholders. The contract will be focussed on highly rigorous research, but will also be required to bring in evaluation expertise to use data collected by the REM and data collected by NIAF II itself to conduct an evaluation of the NIAF programme.
2. Objective
2.1 DFID is seeking an Independent Research and Evaluation Manager (REM) to:
Design a programme of research that can both address knowledge gaps on urbanisation in Nigeria and answer some operational questions tied to the NIAF II programme ;
Design an evaluation framework, including identifying appropriate data sources and methodologies;
Design and conduct data collection instruments to be agreed, but including a household level-survey and a business perceptions survey. Some data collection will be used to support programme monitoring including perception surveys of infrastructure;
Produce evaluation reports that can (i) promote learning and corrective action during the programme’s lifetime and in any future phases or similar interventions; and (ii) support the work of the Technical Review Panel (TRP) that will be assessing project progress every six months;
Produce research reports and peer reviewed articles that can enhance understanding of urban development in Nigeria, influence policy as well as reports that speak to international research agendas on urbanisation.
2.2 The expected outcomes of this contract will be:
Rigorous research across key themes in urban development which generate new knowledge and evidence on urbanisation for Nigeria and for cities in SSA. This knowledge will inform future urban development policy and programming both in DFID and more widely.
Feedback to the NIAF programme on the progress of interventions and influence future programming on infrastructure and urban projects for DFID-Nigeria

Formative Evaluation of NIAF II
4
3. Recipient
3.1 The recipient of this work will be DFID Nigeria, DFID Research and Evidence Division, the NIAF II programme, Government of Nigeria and other partners and the wider community of infrastructure and urbanisation development professionals.
4 Scope of Work
4.1 Inception period
The REM will be expected to successfully complete a 6 month inception period, during which it will:
Work with the NIAF PMU (Project Management Unit), the NIAF TRP (Technical Review Panel), and DFID managers to refine NIAF II’s theory of change and review the results framework;
Design a framework for urbanisation research on and alongside NIAF II, and as a sub-component of this design an evaluation framework for NIAF II. Key research and evaluation questions should be identified in consultation with the NIAF PMU, DFID managers and other stakeholders. The research framework, and evaluation framework should identify what data collection will be carried out by the REM, and its relationship to monitoring data collected by the NIAF PMU.
Some data collection will be used to support programme monitoring including perception surveys of infrastructural and other constraints to private sector development and levels of employment and incomes in supported cities. The programme will also collect or collate data on actual infrastructure delivery, which may also be useful for research. An exact division of labour in data collection will be finalised in consultation with NIAF, the TRP and DFID managers during phase 1.
Scope and review what we know about urbanisation in Nigeria. This review needs to cover the progress of urbanisation in Nigeria to date and also involve some comparison with cities in other SSA countries and South Asia using secondary data sources.
Within the Inception period we would also anticipate the delivery of one or two meetings to draw out key urban research questions drawing on stakeholders within and beyond DFID.
Design a research programme which will be partly based on the findings of the review conducted above;
Design and conduct data collection instruments relevant to the evaluation and research (see section 7 below for more detail);
Design an evaluation plan that will be required to pass external quality assurance through the DFID Evaluation Department QA facility.
Conduct an interim-evaluation of NIAF II in 2013, draft and disseminate the evaluation report. This first evaluation report will feed into a full formative evaluation in 2014. Please note that DFID are working with the World Bank and Cities Alliance to undertake an urban diagnostic of Nigeria. The details of this programme of work are still to be agreed but we would anticipate a level of cross-over between this research programme and the urban diagnostic and therefore expect the service provider to engage with this work as required.
4.2 Progress to full implementation will be dependent on the successful completion of the inception phase.
Deliverables for Inception period Timing
Review of Nigerian urbanisation scoping and reviewing what we know about urbanisation in Nigeria, with comparisons to cities in SSA and South Asia.
Month 3
Research programme design plan outlining how the research programme will fill knowledge gaps identified in the literature review, defining
Month 5
Formative Evaluation of NIAF II
5
research streams, full design of methods, surveys and timing of data collection, allocating staff to these activities and providing a revised cost estimate for the work.
Evaluation plan developed in consultation with the NIAF II service provider and key stakeholders. The plan will look at and refine NIAF’s programme logic and develop evaluation questions. Research strategies will be outlined, including use of NIAF’s own monitoring data and data collected by the REM, to answer these questions. Timing of evaluation data collection, analysis and reporting will be finalised in this plan.
The plan will be quality assured by DFID’s Evaluation Department QA facility.
Month 5
An interim evaluation study. As NIAF II has begun implementation, and the first year was completed in mid-December 2012, the first evaluation report will be an interim report delivered at the end of the REM’s inception phase.
Month 6
Strategy for analysis and dissemination of evidence gathered. Since the research has the potential to contribute to wider policy discussions on cities in Nigiera and SSA, bidders need to present a research uptake strategy that identifies how they will communicate and disseminate their findings and seek appropriate interfaces with relevant policy and research forums.
Month 6
Inception Report, comprising the research and evaluation plan, the plan for survey and data collection, a dissemination plan and detailed timeline.
Month 6
4.3 The REM will be expected to produce a full work-plan and revised cost estimate for the implementation phase that will be subject to review and internal approvals by DFID.
5 Implementation Phase
5.1 The evaluations will deliver two main evaluation reports of the NIAF II programme to DFID in 2014 and 2017. The evaluation reports should be able to assess the programme’s impacts and the direction of travel towards these impacts. It should unpack the mechanisms of change that link technical assistance and influencing work to real reform and investment in infrastructure, as well as the risks posed to such mechanisms by fluctuations in political will. Whilst the research programme will concentrate on the urbanisation, the evaluation reports will not be restricted to the urban sector components of the NIAF II programme.
Conduct data collection as agreed in the evaluation and research programme design (see section 7 below);
Conduct a formative evaluation of NIAF II in 2014, draft and disseminate the evaluation report. The formative evaluation report will help to incorporate lessons from phase one of NIAF and to assess how the programme is transitioning to the second phase. This will include an

Formative Evaluation of NIAF II
6
assessment of the new approaches and components in NIAF II, for example the climate change component. This report will draw on the interim evaluation report produced at the end of the inception period.
Conduct a summative evaluation of NIAF II in 2017, draft and disseminate the evaluation report;
Produce and disseminate research outputs to different audiences according to the dissemination strategy developed in the Inception plan. Key audiences will include DFID advisers across the countries that DFID operates in, interested urban experts and institutions in other SSA countries and stakeholders in Nigerian government. Please note any publications in peer review journals need to be open access in line with DFID policy (please see section 11.5);
Report to DFID managers and the service provider on the findings of their work and make actionable and prioritized recommendations on how the programme could improve its overall impact.
5.2 Deliverables
Research Deliverables Indicative timing
Disaggregated datasets made available to DFID and NIAF II and made publicly available (anonymised if necessary). Data sets should be made available within an agreed period after successive waves of data collection.
As agreed in the research programme plan
Research reports These should include reports based on new waves of data collection and thematic reports. They should contain executive summaries and recommendations, where appropriate. A shorter research synthesis should be produced of each main research report.
At least one research report per wave of data collection, per research stream. At least three thematic reports over the life of the REM.
Peer reviewed articles. It is expected that each research stream should generate at least one peer reviewed publication per year. These may be versions of the research reports submitted to DFID above in this table.
At least one per research stream, per year.
Evaluation deliverables
Formative evaluation report 2014
Summative evaluation report, containing executive summary and recommendations. This should present the final findings in answer to the main evaluation questions.
2017
Common deliverables
Workshops, presentations and other communications tools Each research report should be accompanied by dissemination and communication events and tools.
At least one tool per research output and evaluation report.
6. Evaluation and Research Questions

Formative Evaluation of NIAF II
7
6.1 We are seeking proposals that can answer formative and summative evaluation questions on the direction of travel and impacts of NIAF as well as research closely linked to the NIAF II programme but that also develops broader themes on urbanisation in Nigeria.
NIAF II programme specific evaluation and research questions:
What is the effect of infrastructure on the livelihoods of urban households in the cities where the NIAF II programme is operating?
Which interventions within the NIAF II programme are having the greatest effect? What are the barriers to implementing interventions in the cities?
6.2 The research component also needs to look at broader issues of urbanisation beyond infrastructure and NIAF offers the opportunity for longitudinal analysis of urban development over the life of the programme. A proposed approach to the research is to produce specific research studies on key issues facing urban development in Nigeria and which can draw out lessons more broadly for other cities in sub-Saharan Africa, utilising data being collected through the household level survey (see section 7). However we are open to proposals on exactly how the research can be designed and undertaken.
6.3 Particular areas of focus could include:
Population
We need to understand the nature of urbanisation in Nigerian cities, reflecting on the debates on whether urbanisation is actually moving at the pace that forecasts predict. What is the mix of urban households that are the result of rural-urban migration, natural increase in the existing urban population, transitory migrants moving to the city for work and returning? What is the pattern of population within cities and how will this affect the future of cities?
Urban Governance
How do local governments respond to the challenges of urbanisation, what role are they playing in city development? Within the sphere of urban governance, how are the poorest engaging in local government processes? What are the levels of trust? What are the networks that exist – both formal and informal?
What is the role of informal businesses, and the regulatory and investment policies towards them? What is the role of informal business in driving economic development and wealth-creation?
Urban Violence
Urban violence – examining the drivers for conflict within cities.
Economic Growth
While agglomeration economies are often highlighted when discussing urbanisation, and the ability for cities to drive economic development, attracting the right mix of skills and businesses, growth in Nigeria is not necessarily keeping in line with this trend.
How do levels of growth within cities impact on urban livelihoods? Beyond the linkages between infrastructure and cities, through analysis of household level data of urban citizens, what is the progress of the urban poor in Nigeria’s cities? How are the urban poor accessing labour markets – both formal and informal?

Formative Evaluation of NIAF II
8
Are infrastructure investments in Nigerian cities leading to job creation or higher incomes? How important are informal businesses to income and employment, and what additional constraints do these businesses face?
Planning
How is planning incorporated into the development and growth of cities in Nigeria? What is the role of the citizen within this sphere of city development?
What are the key issues for urban housing in terms of provision and the status of land tenure amongst the poorest households?
Urbanisation in SSA
Drawing an understanding of urbanisation for SSA from Nigeria is an important part of this research. Therefore a key question will be what parallels and lessons can be drawn from urbanisation in Nigeria for other SSA cities?
6.4 These research themes are deliberately broad given the multi-dimensions to urbanisation and urban poverty in Nigeria. Therefore we encourage bidders to shape a proposal around these themes but we are open to suggestions of more focused questions. We anticipate that once the review of urbanisation in Nigeria has been conducted in the Inception Period key evidence gaps and research questions would be developed from this. We would stress that, understanding urban livelihoods, and therefore developing a picture of urbanisation in Nigeria that goes beyond the impact of physical infrastructure, is important.
7. Data collection
7.1 The data collection and analysis is linked to the surveys being undertaken as part of the evaluation of the NIAF II programme which will start in year one of this programme.
7.2 Household Survey
For this research we require the design and implementation of a household level survey of urban citizens in the cities in which NIAF II is operating in, and at least an additional 2 cities where NIAF is not operating. The survey will be repeated annually. The exact make up of this survey can be discussed but we would want to cover demography, assets, income, employment, education, land tenure and health. The survey needs to gather detailed data on urban households, assessing levels of poverty within cities which acknowledges the multi-dimensional aspects of urban poverty. This survey also needs to be disaggregated by gender in order to understand the impact of the NIAF programme on, for example female headed households as well as understanding the livelihoods of female urban citizens.
7.3 There are a number of household surveys being undertaken in Nigeria, some of them can be accessed through the National Bureau of Statistics37. It would be useful for the REM to review and reference these, and any other household surveys in Nigeria, when developing the design of this household survey.
7.4 Business Perception Survey
37 http://www.nigerianstat.gov.ng/

Formative Evaluation of NIAF II
9
We also require the design of a business perception survey containing questions concerning the relative importance of different issues, including infrastructure and governance quality, as constraints to their growth, investment, and employment creation. We would want this survey to look at accessing informal as well as formal businesses.
7.5 There are a number of business perception surveys that are already undertaken but they do not necessarily fit with the geographic coverage of the NIAF programme. We would expect the REM to review any existing surveys. These include the Business Surveys being conducted by the World Bank including Ease of Doing Business and Investment Climate Assessments.
7.6 As urban research analysis covers multidimensional issues methods of data collection and research also need to include the possible use of participatory research methods that can elicit a finer grain of analysis of particular issues facing urban households.
7.7 The details of the data collection and household and business surveys indicated above will be negotiated during the first phase of the evaluation and research design. We would invite bidders to present an approach to the suggested potential data collection that is realistic within the life-span of the programme and that can support the scope of work and research questions identified above. This would include thinking on sampling strategies and the approach to implementing the surveys.
8. Methodology
8.1 This contract incorporates expert research in urban development issues in SSA, the development and implementation of surveys as well as programme evaluation. Therefore we expect that this contract will require bidders to form a consortium incorporating international academic researchers, Nigerian research partners and experts in evaluation and social research methods who can undertake the evaluation component of this contract.
Please Note - Evaluation independence
8.2 The evaluation outputs under this contract will be expected to meet OECD DAC quality standards for evaluation, including independence from the programme itself. This means that the evaluation leads under this consortium will need to show they are independent of the NIAF II programme.
8.3 Successful bidders must display the following: A strong background in urban development research in cities in the global south, with a
particular focus on urbanisation in sub-Saharan Africa and knowledge of the Nigerian experience.
Experience of working in Nigeria with Nigerian partners. A strong understanding of infrastructure and planning issues in cities A track record in delivering rigorous evaluations, preferably including infrastructure
evaluations, an appreciation of the range of methods that may be appropriate, and the ability to suggest methodological choices from this range that are tailored to this intervention.
Experience of designing and implementing household level surveys with associated knowledge of sampling design and data analysis.
Expertise in the successful application of a purposeful mix of in-depth qualitative and quantitative methods in research and evaluation including the use of participatory research methods.
The analytical capacity to draw implications from evaluation findings, developing evidence-based recommendations for policy and programming approaches.
Proven ability to engage and build relationships with a number of stakeholders, both local and national in Nigeria, and international.
Proven ability to plan and carry out dissemination of research and evaluation findings, sharing information widely, but sensitively.

Formative Evaluation of NIAF II
10
9. Management Arrangements
9.1 The REM will report to DFID Nigeria’s Evaluation Adviser (who will be the Lead Adviser) and the Programme Manager in DFID Nigeria’s Economic Growth Team.
9.2 A steering committee will be established for this programme which will be chaired by DFID. This committee will have oversight of research design and outputs and will also bring in peer review experts when required to review outputs from this contract.
10. Reporting
10.1 The following reports will be prepared and copied to DFID managers for comments:
- Evaluation framework and plan (2013)
- Formative Evaluation report (2014)
- Summative Evaluation report (2016)
- Research framework and plan (2013)
- Research outputs for different audiences (throughout programme)
- Mandatory financial reports:
- Annual forecast of expenditures (the budget) disaggregated monthly – for the financial year April to March. This should be updated at least every 6 months
- Six-monthly comparison of budget with actual expenditure
- External audit report on the annual financial statements
10.2 These financial reports will present data by output as well as by type of expenditures. The outputs include the deliverables in the inception phase as listed at 4.2, the research deliverables listed at 5.2 and the production of the key reports listed above at 10.1. The detailed requirements will be agreed with DFID during the inception phase.
11. Contractual Arrangements
11.1 DFID will issue a contract for the full programme duration however there will be a formal break clause in the contract at the end of the inception period. Progression to the implementation phase will be dependent on strong performance by the SP during the inception period and delivery of all inception outputs, including a revised proposal for implementation period. We expect costs for implementation to remain broadly in line with what was indicated in your original proposal, with costs such as fee rates fixed for contract duration. DFID reserves the right to terminate the contract after the inception phase if it cannot reach agreement with the IEP on the activities, staffing, budget and timelines for the implementation phase.
11.2 DFID reserves the right to scale back or discontinue this programme at any point (in line with our Terms and Conditions) if it is not achieving the results anticipated. Conversely, we may also scale up the programme should it prove to be having a strong impact and has the potential to yield better results.
11.3 DFID is seeking to agree an output based payment plan for this contract, where payment will be explicitly linked to supplier performance and effective delivery of programme outputs as indicated above at 10.2. Service Providers should propose how they best envisage this model to work for both phases. The payment plan for the implementation phase will be finalised during the inception period.

Formative Evaluation of NIAF II
11
11.4 DFID will agree Key Performance Indicators with the service provider and are likely to include: quality and delivery; management, financial; personnel; and innovation indicators. You should propose a suite of KPIs for the inception period as part of your bid. The KPIs for the implementation period will be agreed at the end of inception.
11.5 Please note that DFID operates an open access policy38. This requires that any research dissemination from its programmes that is published in peer reviewed and non-peer reviewed journals must be done as open access. Furthermore all data collected under this programme will be made available within 12 months of the last data collection period in a data repository.
11.6 Suppliers need to account for the associated costs of complying with this policy as part of their budget. These costs will be subject to value for money considerations. Furthermore a plan for how the research programme will comply with the open access policy will also be required as part of this tender. DFID has provided an open access implementation guide that provides further information on how suppliers must comply with this policy. (Please see referenced link).
11.7 DFID will undertake:
An inception review 6 months after award of contract; Annual reviews thereafter; A project completion review.
12 Timing
12.1 This contract will commence in June 2013 for a period of 4 years. The inception phase will be for a period of 6 months. DFID reserves the right to extend the contract for a further 2 years, on basis of continued need, and availability of funding.
13 Duty of Care
13.1 The Service Provider is responsible for the safety and well-being of their personnel and Third Parties affected by their activities under this contract, including appropriate security arrangements. They will also be responsible for the provision of suitable security arrangements for their domestic and business property. 13.2 DFID will share available information with the Supplier on security status and developments in-country where appropriate. DFID will provide the following:
A copy of the DFID visitor notes (and a further copy each time these are updated), which the Supplier may use to brief their Personnel on arrival.
Updates on security developments to the in-country programme manager, which they may use to brief their Personnel.
All such Personnel must register with their respective Embassies to ensure that they are included in emergency procedures.
13.3 The Supplier is responsible for ensuring appropriate safety and security briefings for all of their personnel working under this contract and ensuring, where appropriate that their personnel register and receive briefing as outlined above. Travel advice is also available on the FCO website and the supplier must ensure they (and their personnel) are up to date with the latest position. 13.4 The Supplier is responsible for ensuring that appropriate arrangements, processes and procedures are in place for their personnel, taking into account the environment they will be working in and the level of risk involved in delivery of the Contract (such as working in dangerous, fragile and hostile environments etc.). The Supplier must ensure their personnel receive the required level of security training, relevant to their organisational arrangements. 38 http://www.dfid.gov.uk/What-we-do/Research-and-evidence/DFID-Open-Access-Policy/

Formative Evaluation of NIAF II
12
13.5 Tenderers must develop their bid response on the basis of being fully responsible for Duty of Care in line with the details provided above and must confirm in their bid Response that: They fully accept responsibility for Security and Duty of Care. They understand the potential risks and have the knowledge and experience to develop an effective risk plan. They have the capability to manage their Duty of Care responsibilities throughout the life of the contract. 13.6 If you are unwilling or unable to accept responsibility for Security and Duty of Care as detailed above, your bid will be viewed as non-compliant and excluded from further evaluation. 13.7 Acceptance of responsibility must be supported with evidence of Duty of Care capability and DFID reserves the right to clarify any aspect of this evidence. In providing evidence, interested Suppliers should respond in line with the Duty of Care section of the Questionnaire.
14. Background
14.1 Nigeria is urbanising faster than other African countries with 50% of the population now living in cities. The latest UN figures suggest overall population growth will reach 400 million by 2050. Despite these pressing forecasts there has been a mixed response to the development of cities within Nigeria. Therefore while urbanisation in Nigeria continues to move at pace, and given the dominance of informality within cities, there needs to be a much better understanding of how to respond to the challenges that urbanisation creates, both in Nigeria, and more broadly in sub-Saharan Africa.
14.2 Furthermore the lack of data and evidence on the impacts and progress of urban development in Nigeria and beyond for the rest of sub-Saharan Africa, means that there needs to be a more nuanced and evidence-based understanding that can inform policy responses. This evidence base needs to reflect the multi-dimensional aspects of urbanisation such as planning, housing, infrastructure, urban governance, economic development and climate change. The NIAF II programme provides an opportunity to gather a finer level of data on these issues, both in terms of developing a picture of the progress of urban households in Nigeria, and in terms of answering broader questions about urbanisation in SSA.
14.4 The NIAF II programme in its second phase will be operating in around 15 Nigerian cities, (although this number may vary depending on the future development of the NIAF II programme) providing a menu of interventions to improve infrastructure. These cities are still to be confirmed but potentially will be:
1) Abuja including Satellite Towns
(there are five primary and six secondary designated Satellite Towns) 2) Bauchi 3) Benin City 4) Enugu 5) Gombe 6) Ibadan 7) Jos 8) Kaduna 9) Kano 10) Katsina 11) Lagos 12) Onitsha 13) Port Harcourt

Formative Evaluation of NIAF II
13
14) Yola-Jimeta 15) Zaria The NIAF II programme offers an opportunity to generate new data and analysis about the intermediate and longer term impact of infrastructure investment.
14.5 NIAF II – Programme Results Framework: NIAF’s intended impact is “Stronger growth in non-oil gross domestic product and employment, and reduced poverty”. The intended outcomes of the programme are:
A. Power: An increase in the volume of grid based electricity sales from 20,700 Gigawatt hours in 2010/11 to 54,500 Gigawatt hours in 2014/15
B. Roads: A 15% cut in freight journey times on key routes and an improvement of two points in the average condition of the Federal Road Network, using the International Roughness Index.
C. Capital Spending: An increased present net value of at least 4 percentage points achieved on capital projects supported by NIAF, based on an independent evaluation and compared with a baseline assessment for projects funded from 2005 to 2010.
D. Cities: An improvement of at least 10% in an index of city infrastructure quality for supported cities that will be constructed using survey data the programme will collect.
It should be noted that an amended logframe is under development which may modify some planned outputs and will refine output indicators.
14.6 The Nigeria Infrastructure Advisory Facility (NIAF) will initially be allocated as follows:
- Supporting better planning of Government spending and sector wide reform and privatisation in the power sector (£19.6 million).
- Improving the repair and maintenance of federal and state roads through policy reform and the development of systems to plan and prioritise investment (£9.3 million).
- Improving infrastructure planning and delivery to relieve key constraints to stronger economic growth and job creation in cities, and tackle bottlenecks on key transport corridors (£9.7 million).
- Supporting evaluation, prioritisation and implementation of key capital projects (£5 million). - Exploratory work in other areas of infrastructure reform (£1 million). - Project administration and evaluation, including baseline and follow-up studies (£3.4 million).
14.7 NIAF II is delivered through an Adam Smith International led consortium with a Nigeria-based Project Management Unit (PMU). This contracts, manages and coordinates all activities under the programme, and the management contract was procured through an international competitive tendering process.
7 SUMMARY RISK ASSESSMENT MATRIX
DFID Overall Project/Intervention
Summary Risk Assessment Matrix
Project/intervention title: Urbanisation Research and Evaluation Manager for NIAF2 Programme on
Infrastructure Support

Formative Evaluation of NIAF II
14
Location: Major cities of Nigeria including Lagos, Kano, Kaduna (but NOT Maiduguri or Damaturu)
Date of assessment: 21 November 2012
Assessing official: Simeon Ola
Theme DFID Risk score
OVERALL RATING39 4
FCO travel advice 4
Host nation travel advice -
Transportation 3
Security 4
Civil unrest 2
Violence/crime 4
Espionage 3
Terrorism 4
War 1
Hurricane 1
Earthquake 1
Flood 1
Medical Services 3
Nature of Project/
Intervention
2
1
Very Low risk
2
Low risk
3
Med risk
4
High risk
5
Very High risk
Low
Medium
High Risk
39 The Overall Risk rating is calculated using the MODE function which determines the most frequently occurring value.
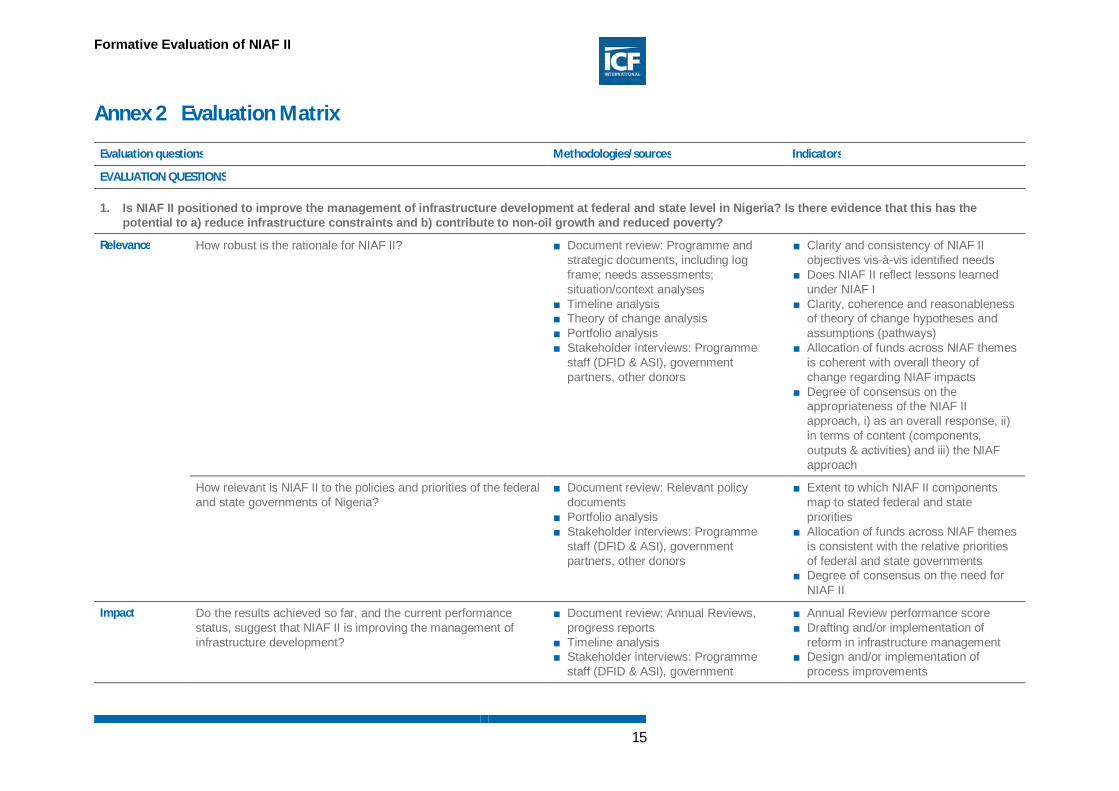
Formative Evaluation of NIAF II
15
Annex 2 Evaluation Matrix
Evaluation questions Methodologies/sources Indicators
EVALUATION QUESTIONS
1. Is NIAF II positioned to improve the management of infrastructure development at federal and state level in Nigeria? Is there evidence that this has the potential to a) reduce infrastructure constraints and b) contribute to non-oil growth and reduced poverty?
Relevance How robust is the rationale for NIAF II? ■ Document review: Programme and strategic documents, including log frame; needs assessments; situation/context analyses
■ Timeline analysis ■ Theory of change analysis ■ Portfolio analysis ■ Stakeholder interviews: Programme
staff (DFID & ASI), government partners, other donors
■ Clarity and consistency of NIAF II objectives vis-à-vis identified needs
■ Does NIAF II reflect lessons learned under NIAF I
■ Clarity, coherence and reasonableness of theory of change hypotheses and assumptions (pathways)
■ Allocation of funds across NIAF themes is coherent with overall theory of change regarding NIAF impacts
■ Degree of consensus on the appropriateness of the NIAF II approach, i) as an overall response, ii) in terms of content (components, outputs & activities) and iii) the NIAF approach
How relevant is NIAF II to the policies and priorities of the federal and state governments of Nigeria?
■ Document review: Relevant policy documents
■ Portfolio analysis ■ Stakeholder interviews: Programme
staff (DFID & ASI), government partners, other donors
■ Extent to which NIAF II components map to stated federal and state priorities
■ Allocation of funds across NIAF themes is consistent with the relative priorities of federal and state governments
■ Degree of consensus on the need for NIAF II
Impact Do the results achieved so far, and the current performance status, suggest that NIAF II is improving the management of infrastructure development?
■ Document review: Annual Reviews, progress reports
■ Timeline analysis ■ Stakeholder interviews: Programme
staff (DFID & ASI), government
■ Annual Review performance score ■ Drafting and/or implementation of
reform in infrastructure management ■ Design and/or implementation of
process improvements

Formative Evaluation of NIAF II
16
Evaluation questions Methodologies/sources Indicators
partners, other donors ■ Perception survey ■ Case studies
■ Progress against log frame indicators (TRP reports)
■ TA input reduces over time (maintaining quality of management)
■ Perception survey results
Are the (expected) results articulated for NIAF II at outcome and impact levels credible?
■ Theory of change analysis ■ Document review: Progress reports ■ Timeline analysis ■ Stakeholder interviews: Programme
staff (DFID & ASI), government partners
■ Clarity, coherence and reasonableness of theory of change hypotheses and assumptions
■ Progress against log frame indicators ■ Expected results correspond to those of
government and/or other donors for similar interventions
What are the drivers of performance of NIAF II? What are the significant obstacles?
■ Document review: Annual Reviews, Progress reports
■ Stakeholder interviews: Programme staff (DFID & ASI), government partners
Do the results being achieved and the development benefits which can be attributed to NIAF II represent good value for money?
■ Document review: Annual Reviews, Progress reports
■ Stakeholder interviews: Programme staff (DFID & ASI), government partners, other donors
■ Benchmarking of programme cost to similar interventions by DFID and other donors
■ Overhead/administration costs as % of total programme costs
■ Alignment of NIAF II results with DFID/HMG priorities
■ Alignment of NIAF II results with federal and state priorities
■ Responsiveness of NIAF II results to identified needs
■ Adherence to Paris Declaration aid effectiveness principles
■ NIAF II programme cost is within range of benchmarked programmes
■ NIAF II delivers exceptional results vs benchmarked programmes
■ Overhead/administration costs are well within DFID acceptable range; or, if high, are justified by exceptional results and/or high level of risk
Effectiveness To what extent is NIAF II delivering according to plan? ■ Document review: Annual Reviews, Progress reports
■ Stakeholder interviews: Programme staff (DFID & ASI), government partners
■ Expenditure against plan ■ Activities delivered on schedule ■ Extent of delays ■ Activities delivering results as expected

Formative Evaluation of NIAF II
17
Evaluation questions Methodologies/sources Indicators
What have been the challenges in delivery? ■ Document review: Annual Reviews, Progress reports
■ Stakeholder interviews: Programme staff (DFID & ASI), government partners
■ Case studies
What has NIAF’s response been? ■ Document review: Annual Reviews, Progress reports
■ Stakeholder interviews: Programme staff (DFID & ASI), government partners
■ Case studies
How effective has this response been? ■ Document review: Annual Reviews, Progress reports
■ Stakeholder interviews: Programme staff (DFID & ASI), government partners
■ Case studies
■ Timeliness of response ■ Relevance of response ■ Consensus around proposed response ■ Activities delivering results as expected
What are the lessons? Are they being learned and captured? ■ Document review: Annual Reviews, Progress reports
■ Stakeholder interviews: Programme staff (DFID & ASI), government partners
■ Case studies
Are the appropriate systems in place to maximise overall impact of NIAF II?
■ Document review: Programme documents, annual reviews and progress reports
■ Stakeholder interviews: Programme staff (DFID & ASI), government partners
■ Case studies
■ Systems are documented and guidelines available
■ Availability of system reporting
Are systems (including M&E) working and robust? ■ Document review: Annual reviews and progress reports
■ Stakeholder interviews: Programme staff (DFID & ASI), government partners
■ Case studies
■ Clear guidelines for processes and procedures
■ General understanding of processes and procedures
■ Extent of delays/bottlenecks
Are indicators appropriate to capture intended results, and could they be improved?
■ Document review: Programme documents, progress reports
■ Stakeholder interviews: Programme staff (DFID & ASI), government partners
■ Extent to which indicators are being reported against
■ Extent to which indicators are perceived as meaningful
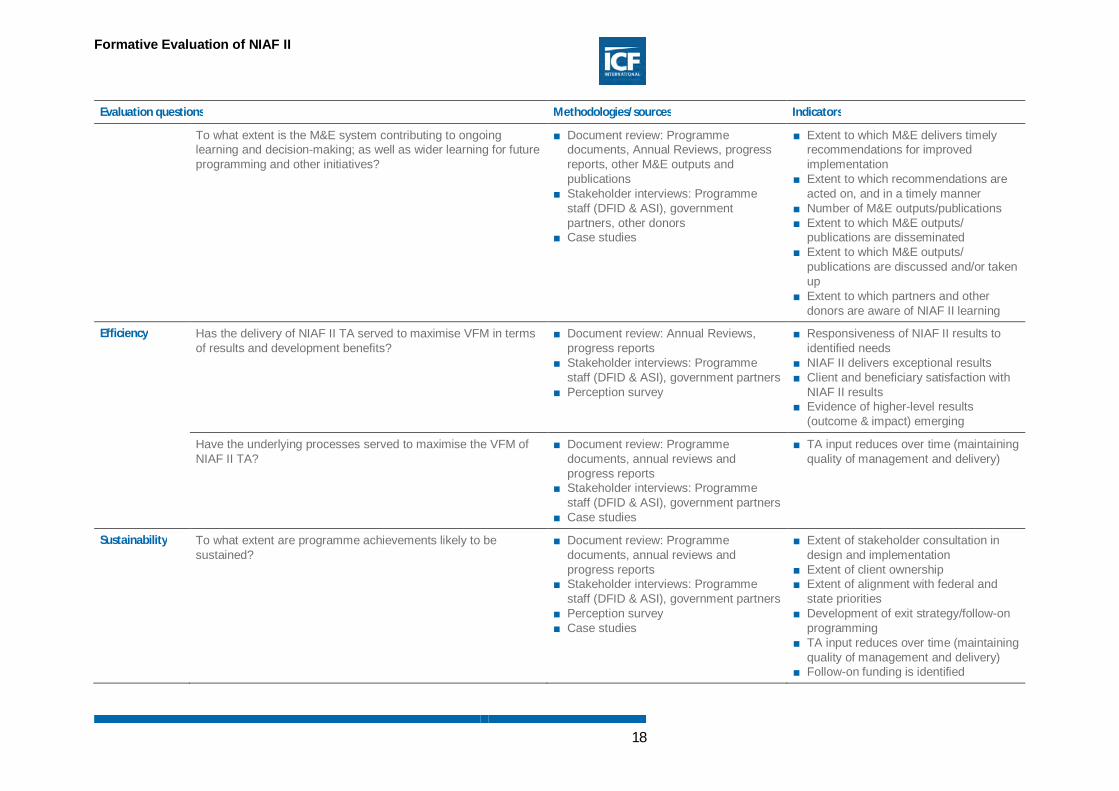
Formative Evaluation of NIAF II
18
Evaluation questions Methodologies/sources Indicators
To what extent is the M&E system contributing to ongoing learning and decision-making; as well as wider learning for future programming and other initiatives?
■ Document review: Programme documents, Annual Reviews, progress reports, other M&E outputs and publications
■ Stakeholder interviews: Programme staff (DFID & ASI), government partners, other donors
■ Case studies
■ Extent to which M&E delivers timely recommendations for improved implementation
■ Extent to which recommendations are acted on, and in a timely manner
■ Number of M&E outputs/publications ■ Extent to which M&E outputs/
publications are disseminated ■ Extent to which M&E outputs/
publications are discussed and/or taken up
■ Extent to which partners and other donors are aware of NIAF II learning
Efficiency Has the delivery of NIAF II TA served to maximise VFM in terms of results and development benefits?
■ Document review: Annual Reviews, progress reports
■ Stakeholder interviews: Programme staff (DFID & ASI), government partners
■ Perception survey
■ Responsiveness of NIAF II results to identified needs
■ NIAF II delivers exceptional results ■ Client and beneficiary satisfaction with
NIAF II results ■ Evidence of higher-level results
(outcome & impact) emerging
Have the underlying processes served to maximise the VFM of NIAF II TA?
■ Document review: Programme documents, annual reviews and progress reports
■ Stakeholder interviews: Programme staff (DFID & ASI), government partners
■ Case studies
■ TA input reduces over time (maintaining quality of management and delivery)
Sustainability To what extent are programme achievements likely to be sustained?
■ Document review: Programme documents, annual reviews and progress reports
■ Stakeholder interviews: Programme staff (DFID & ASI), government partners
■ Perception survey ■ Case studies
■ Extent of stakeholder consultation in design and implementation
■ Extent of client ownership ■ Extent of alignment with federal and
state priorities ■ Development of exit strategy/follow-on
programming ■ TA input reduces over time (maintaining
quality of management and delivery) ■ Follow-on funding is identified

Formative Evaluation of NIAF II
19
Evaluation questions Methodologies/sources Indicators
Coverage, coherence & coordination
To what extent is NIAF II intending to be pro-poor in its design and implementation? How effective is it in achieving poverty reduction objectives?
■ Document review: Programme documents, annual reviews and progress reports
■ Stakeholder interviews: Programme staff (DFID & ASI), government partners
■ Perception survey ■ Case studies
■ Extent of targeting in programme design ■ Extent of consultation with poor
communities ■ % BPL as a share of targeted
beneficiaries (selected interventions) ■ Extent to which interventions reach BPL
population ■ Evidence of material change in living
conditions of of BPL population
2. Does NIAF II at the programme and project level adequately reflect its strategic principles (demand-responsiveness, flexibility, political economy awareness and influencing); and are these making a difference in bringing about reforms in infrastructure investment?
Relevance Which of the principles appears to be the most important in supporting achievement of programme objectives; and how inter-dependent are they?
■ Document review: Programme documents, annual reviews and progress reports
■ Stakeholder interviews: Programme staff (DFID & ASI), government partners
■ Case studies
■
Impact How important have these principles been for the progress made in the power sector?
■ Document review: Annual reviews and progress reports
■ Stakeholder interviews: Programme staff (DFID & ASI), government partners
■ Case studies
■
Is evidence emerging that these principles are having a positive impact on delivery of NIAF II?
■ Document review: Annual reviews and progress reports
■ Stakeholder interviews: Programme staff (DFID & ASI), government partners
■ Case studies
■
Are there issues that are specific to particular principles? ■ Document review: Annual reviews and progress reports
■ Stakeholder interviews: Programme staff (DFID & ASI), government partners
■ Case studies
■
Does the investment of time and human and financial resources associated with this approach represent VFM in the delivery of
■ Document review: Annual reviews and progress reports
■

Formative Evaluation of NIAF II
20
Evaluation questions Methodologies/sources Indicators
programme objectives? ■ Stakeholder interviews: Programme staff (DFID & ASI), government partners
■ Case studies
Effectiveness To what extent have principles been applied across NIAF II, in design and implementation?
■ Document review: Programme documents, annual reviews and progress reports
■ Stakeholder interviews: Programme staff (DFID & ASI), government partners
■ Case studies
■ Principles applied in design documents or other guidance
■ No of cases in which NIAF interventions come as a clear response to an explicit request from government/Nigerian institutions
■ Extent to which small projects have resulted in established, productive partnerships
■ No of occasions on which NIAF interventions have come as a response to a short-term opportunity
■ Documented evidence of political economy understanding informing NIAF decision-making
■ Extent and quality of NIAF relationships and network
■ Extent of advisory and influencing activity
■ No of cases in which relationships have been levered to build new client relationships
How have principles been applied in the power sector, in design and implementation?
■ Document review: Annual reviews and progress reports
■ Stakeholder interviews: Programme staff (DFID & ASI), government partners
■ Case studies
How successfully have principles been applied in the non-power sectors, in design and implementation? What are the reasons for success or failure?
■ Document review: Annual reviews and progress reports
■ Stakeholder interviews: Programme staff (DFID & ASI), government partners
■ Case studies
Efficiency What are the (additional) costs of implementing the NIAF approach; are these reasonable/justifiable?
■ Document review: Annual reviews and progress reports
■ Stakeholder interviews: Programme staff (DFID & ASI), government partners
■ Case studies
Sustainability To what extent do strategic principles support sustainability of programme achievements?
■ Document review: Annual reviews and progress reports
■ Stakeholder interviews: Programme staff (DFID & ASI), government partners
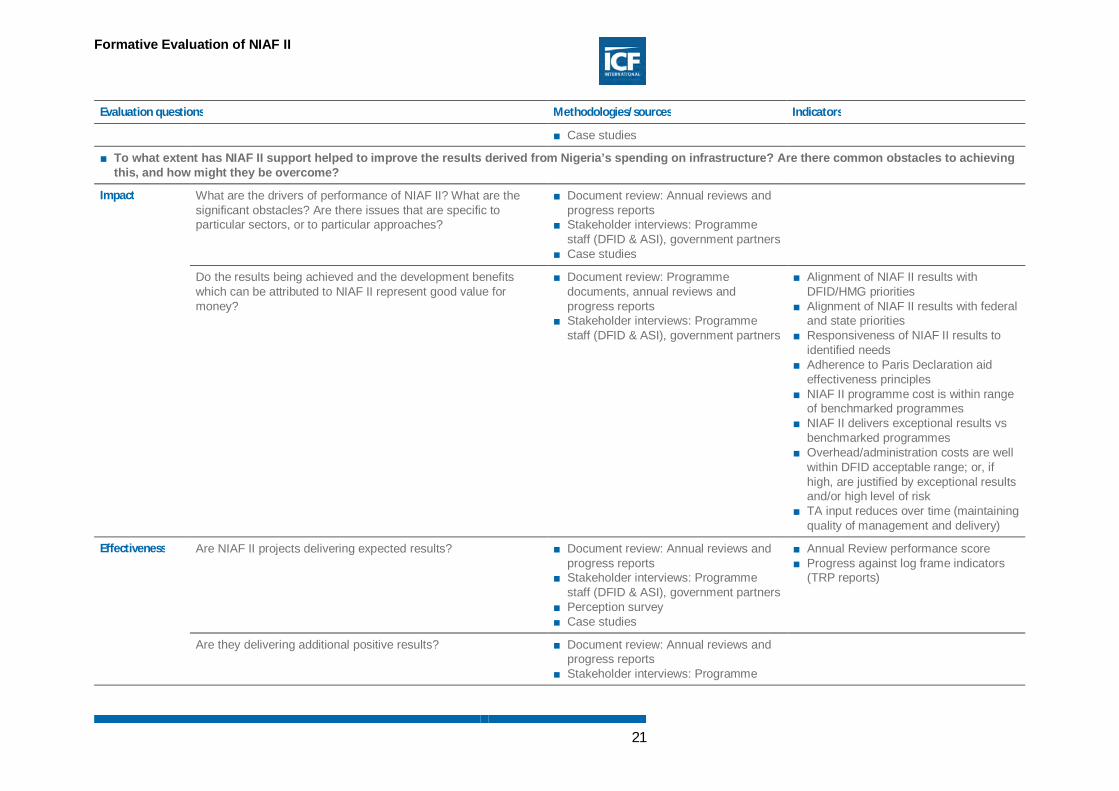
Formative Evaluation of NIAF II
21
Evaluation questions Methodologies/sources Indicators
■ Case studies
■ To what extent has NIAF II support helped to improve the results derived from Nigeria’s spending on infrastructure? Are there common obstacles to achieving this, and how might they be overcome?
Impact What are the drivers of performance of NIAF II? What are the significant obstacles? Are there issues that are specific to particular sectors, or to particular approaches?
■ Document review: Annual reviews and progress reports
■ Stakeholder interviews: Programme staff (DFID & ASI), government partners
■ Case studies
Do the results being achieved and the development benefits which can be attributed to NIAF II represent good value for money?
■ Document review: Programme documents, annual reviews and progress reports
■ Stakeholder interviews: Programme staff (DFID & ASI), government partners
■ Alignment of NIAF II results with DFID/HMG priorities
■ Alignment of NIAF II results with federal and state priorities
■ Responsiveness of NIAF II results to identified needs
■ Adherence to Paris Declaration aid effectiveness principles
■ NIAF II programme cost is within range of benchmarked programmes
■ NIAF II delivers exceptional results vs benchmarked programmes
■ Overhead/administration costs are well within DFID acceptable range; or, if high, are justified by exceptional results and/or high level of risk
■ TA input reduces over time (maintaining quality of management and delivery)
Effectiveness Are NIAF II projects delivering expected results? ■ Document review: Annual reviews and progress reports
■ Stakeholder interviews: Programme staff (DFID & ASI), government partners
■ Perception survey ■ Case studies
■ Annual Review performance score ■ Progress against log frame indicators
(TRP reports)
Are they delivering additional positive results? ■ Document review: Annual reviews and progress reports
■ Stakeholder interviews: Programme

Formative Evaluation of NIAF II
22
Evaluation questions Methodologies/sources Indicators
staff (DFID & ASI), government partners ■ Perception survey ■ Case studies
What are the drivers of performance? ■ Document review: Annual reviews and progress reports
■ Stakeholder interviews: Programme staff (DFID & ASI), government partners
■ Case studies
What are the challenges? ■ Document review: Annual reviews and progress reports
■ Stakeholder interviews: Programme staff (DFID & ASI), government partners
■ Case studies
Efficiency Have investments at the project level been appropriately allocated and delivered to maximise project results?
■ Document review: Selected project documents and progress reports; annual reviews and progress reports
■ Stakeholder interviews: Programme staff (DFID & ASI), government partners
■ Projects delivering against their log frames
■ Evidence of project results contributing to programme results
Sustainability Are results and development benefits sustainable? ■ Document review: Programme documents, annual reviews and progress reports
■ Stakeholder interviews: Programme staff (DFID & ASI), government partners
■ Perception survey ■ Case studies
■ Extent of client ownership ■ Extent of alignment with federal and
state priorities ■ Development of exit strategy/follow-on
programming ■ TA input reduces over time (maintaining
quality of management and delivery) ■ Follow-on funding is identified
3. Is NIAF II likely to play a role in increasing public and private sector funds for infrastructure provision in Nigeria? Is there more that NIAF II could do to stimulate investment?
Impact Has the progress made by NIAF II been influencing other programmes? Is there evidence that this is resulting in improved planning, financing and management elsewhere? Is there evidence of similar approaches to TA being adopted elsewhere in Nigeria or in infrastructure programmes elsewhere?
■ Document review: Annual reviews and progress reports; broader academic and policy literature
■ Stakeholder interviews: Programme staff (DFID & ASI), government partners, other donors
■ NIAF II cited in i) academic and policy literature; ii) programme documents of other governments or donors

Formative Evaluation of NIAF II
23
Evaluation questions Methodologies/sources Indicators
■ Case studies
Does the volume of funding catalysed justify the investment by NIAF? Has NIAF helped to increase public and private sector appetite for infrastructure investment? To what extent does this represent VFM in terms of progress towards NIAF II objectives?
■ Document review: Annual reviews and progress reports
■ National statistics on infrastructure investment
■ Stakeholder interviews: Programme staff (DFID & ASI), government partners, other donors
■ Volume of funding catalysed by NIAF exceeds a given benchmark
■ Accelerated public and private sector investment in the absence of NIAF co-investment
Effectiveness To what extent and how is NIAF II influencing infrastructure investment in other sectors?
■ Document review: Annual reviews and progress reports
■ Stakeholder interviews: Programme staff (DFID & ASI), government partners, other donors
To what extent is NIAF II mobilising domestic, donor or private sector co-funding?
■ Document review: NIAF operational documents; annual reviews and progress reports
■ Stakeholder interviews: Programme staff (DFID & ASI), government partners, other donors
Efficiency What are NIAF’s associated/transaction costs involved in raising public and private funds for infrastructure investment?
■ Document review: NIAF operational documents
Sustainability To what extent is NIAF II mobilising domestic, donor or private sector follow-on funding?
■ Document review: NIAF operational documents; annual reviews and progress reports
■ Stakeholder interviews: Programme staff (DFID & ASI), government partners, other donors
■ Which interventions within the NIAF II programme are having the greatest effect? Is the balance of investments appropriate to achieving its goals relating to non-oil growth and reduced poverty?
Relevance Is the allocation of funding across NIAF II sectors supportive of programme objectives?
■ Document review: Programme documents; annual reviews and progress reports
■ Portfolio analysis ■ Stakeholder interviews: Programme
■ Funding allocated according to stated priority objectives

Formative Evaluation of NIAF II
24
Evaluation questions Methodologies/sources Indicators
staff (DFID & ASI), government partners
How are the sectors positioned differently to respond to the different needs and challenges posed?
■ Document review: Programme documents; annual reviews and progress reports
■ Stakeholder interviews: Programme staff (DFID & ASI), government partners
What is the expected contribution of the new sectors to reaching NIAF’s overall objectives?
■ Document review: Programme documents; annual reviews and progress reports
■ Stakeholder interviews: Programme staff (DFID & ASI), government partners
Impact How relevant and aligned are the NIAF II sectors to the impact objective of non-oil growth and reduced poverty?
■ Document review: Programme documents; annual reviews and progress reports
■ Stakeholder interviews: Programme staff (DFID & ASI), government partners
■ Inclusion of growth and poverty reduction targets
■ BPL population as % of beneficiary population
To what extent are the new sectors contributing to NIAF II objectives? Are there any early-stage issues which need to be addressed?
■ Document review: Programme documents; annual reviews and progress reports
■ Stakeholder interviews: Programme staff (DFID & ASI), government partners
■ Case studies
Does the choice of sectors, and the relative balance between them, represent VFM in terms of maximising NIAF II results and development benefits?
■ Document review: Programme documents; annual reviews and progress reports
■ Stakeholder interviews: Programme staff (DFID & ASI), government partners
■ Funding allocated according to stated priority objectives
Effectiveness To what extent are NIAF II sectors delivering against expectations?
■ Document review: Annual reviews and progress reports
■ Stakeholder interviews: Programme staff (DFID & ASI), government partners
■ Progress against log frame
Are there issues that are specific to particular sectors? ■ Document review: Annual reviews and progress reports
■ Stakeholder interviews: Programme
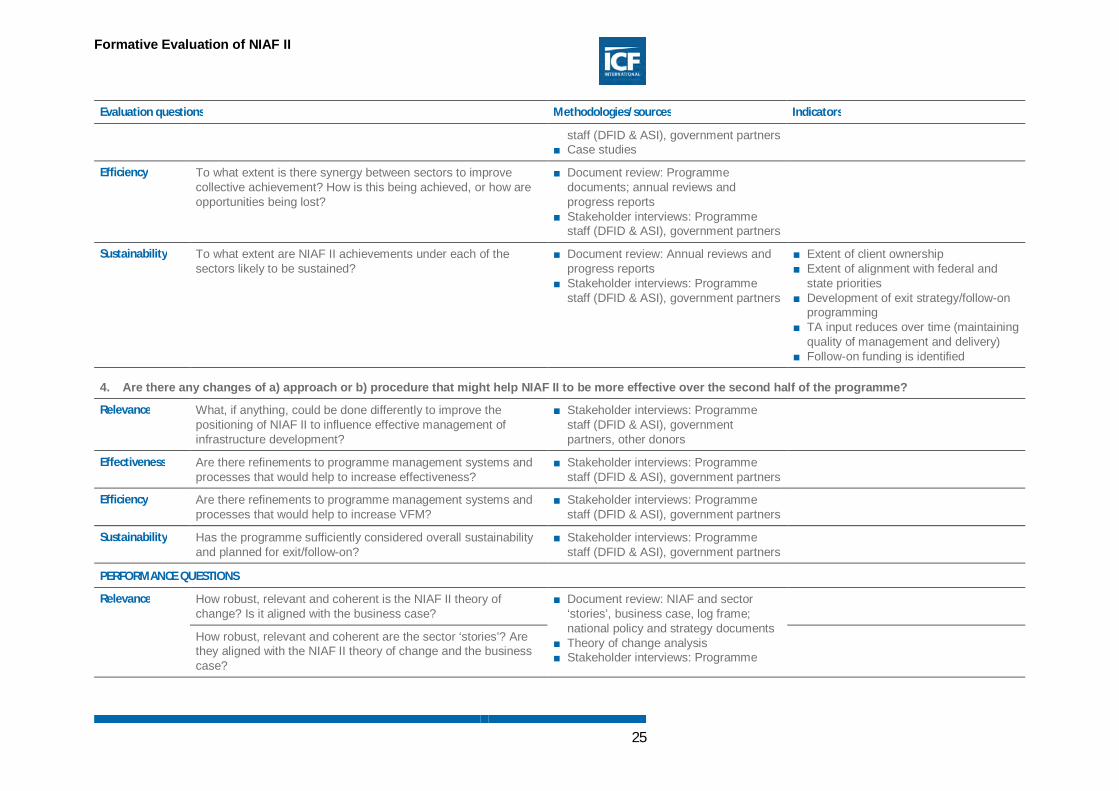
Formative Evaluation of NIAF II
25
Evaluation questions Methodologies/sources Indicators
staff (DFID & ASI), government partners ■ Case studies
Efficiency To what extent is there synergy between sectors to improve collective achievement? How is this being achieved, or how are opportunities being lost?
■ Document review: Programme documents; annual reviews and progress reports
■ Stakeholder interviews: Programme staff (DFID & ASI), government partners
Sustainability To what extent are NIAF II achievements under each of the sectors likely to be sustained?
■ Document review: Annual reviews and progress reports
■ Stakeholder interviews: Programme staff (DFID & ASI), government partners
■ Extent of client ownership ■ Extent of alignment with federal and
state priorities ■ Development of exit strategy/follow-on
programming ■ TA input reduces over time (maintaining
quality of management and delivery) ■ Follow-on funding is identified
4. Are there any changes of a) approach or b) procedure that might help NIAF II to be more effective over the second half of the programme?
Relevance What, if anything, could be done differently to improve the positioning of NIAF II to influence effective management of infrastructure development?
■ Stakeholder interviews: Programme staff (DFID & ASI), government partners, other donors
Effectiveness Are there refinements to programme management systems and processes that would help to increase effectiveness?
■ Stakeholder interviews: Programme staff (DFID & ASI), government partners
Efficiency Are there refinements to programme management systems and processes that would help to increase VFM?
■ Stakeholder interviews: Programme staff (DFID & ASI), government partners
Sustainability Has the programme sufficiently considered overall sustainability and planned for exit/follow-on?
■ Stakeholder interviews: Programme staff (DFID & ASI), government partners
PERFORMANCE QUESTIONS
Relevance How robust, relevant and coherent is the NIAF II theory of change? Is it aligned with the business case?
■ Document review: NIAF and sector ‘stories’, business case, log frame; national policy and strategy documents
■ Theory of change analysis ■ Stakeholder interviews: Programme
How robust, relevant and coherent are the sector ‘stories’? Are they aligned with the NIAF II theory of change and the business case?

Formative Evaluation of NIAF II
26
Evaluation questions Methodologies/sources Indicators
Are the key underlying assumptions clearly articulated? staff (DFID & ASI), government partners
Do activities and outputs correspond to the NIAF II overall objectives?
Effectiveness Are activities being implemented broadly according to plan (in line with budget and on schedule)? If not, why not?
■ Document review: Annual reviews, progress reports
■ Stakeholder interviews: Programme staff (DFID & ASI), government partners
What is the extent of coordination with federal and state governments? Is there clear evidence of demand, and responsiveness to that demand in the NIAF II portfolio of projects?
■ Document review: Programme documents, annual reviews, progress reports
■ Stakeholder interviews: Programme staff (DFID & ASI), government partners
■ Case studies
In what ways is the NIAF II approach demonstrating flexibility; and is the extent of flexibility appropriate?
■ Document review: Annual reviews, progress reports
■ Stakeholder interviews: Programme staff (DFID & ASI), government partners
■ Case studies
What measures are being taken to ensure decision-making is informed by political economy awareness? Are decisions shown to be politically astute, identifying and exploiting opportunities and entry points as they arise?
What form does the NIAF II influencing strategy take? Is it proving effective? Is there anything NIAF could be doing that it currently isn’t?
Efficiency How well has NIAF II been able to allocate resources flexibly (responding to demand and opportunity) and at the same time maintain effective financial planning and reporting?
How robust are NIAF II processes to identify, screen and select the pipeline of projects?
How does decision-making secure high VFM projects?
To what extent are NIAF II projects representing good VFM based on the NIAF II approach, the expected results and value for money indicators?
How efficient and effective is the NIAF II model of many small,

Formative Evaluation of NIAF II
27
Evaluation questions Methodologies/sources Indicators
incremental engagements? Does this represent VFM?
How do administrative costs for the NIAF II compare to similar programmes implemented by other parts of DFID/other donors? What lessons can be learnt?
To what extent is the Output Based Payment System driving improved overall results delivery and VfM?
How efficient are the NIAF II reporting systems? Are they positively or negatively affected by the TRP and AR processes?
Sustainability What is NIAF’s approach to sustaining programme achievements?
What are the drivers of sustainability?
What are the challenges to sustainability?
Coverage, Coherence, Coordination
To what extent is NIAF II intending to be gender-sensitive and socially inclusive? How effective is it in achieving any such objectives?
To what extent do activities include or impact (positively or negatively) vulnerable and marginalised groups?
How effective are the objectives for the Northern Nigeria output being integrated within other sectors?
To what extent is the NIAF II programme coordinated with government programmes and priorities?
To what extent are activities complementary and coordinated with activities of other DFID and donor programmes?

Formative Evaluation of NIAF II
28
Annex 3 NIAF Theory of Change40
The long-term change sought by NIAF II is that more effective infrastructure investment in Nigeria supports growth and the reduction of poverty. This is reflected in the NIAF II log frame impact and outcome statements:
■ Impact Reduced infrastructure constraints to growth in non-oil gross domestic product and employment, leading to reduced poverty
■ Outcome Enhanced management of infrastructure development at the federal level and in selected states
The process of change rests on an approach that is guided by four strategic principles. Together, these strategic principles are expected to drive the NIAF II theory of change and underpin the successful achievement of NIAF objectives. These principles are:
■ Demand responsiveness NIAF II will:
– focus on sectors and processes which are acknowledged by government to require the support of NIAF;
– provide support where there is a clear demand for initiatives from a qualifying Nigerian institution;
– work with clients in a collaborative way to better align client demand with NIAF programme priorities;
– build partnerships incrementally, committing to small project engagements until a productive partnership has been established and then progressively work with clients to identify support priorities.
■ Flexibility NIAF will utilise a high degree of flexibility built into the programme design to:
– foster strong collaborative relationships with clients; – take advantage of windows of opportunity that open up, allowing critical interventions
to be initiated; – provide (primarily locally-based) embedded staffing support to key institutions on a
highly responsive basis in the short window of opportunity following the establishment of new organisational arrangements.
■ Political economy awareness NIAF will ensure it maintains:
– a high level of awareness of political economy issues and their implications for delivering assistance that will lead to action;
– strong engagement at the highest political levels to deliver key messages directly into the heart of decision-making processes.
■ Influencing NIAF will:
– use its key relationships across a network of core federal institutions to deliver consistent and connected advice and build coalitions for reform;
– communicate advice effectively using concise action-oriented summary notes to convey critical advice at the most senior levels;
– use demonstrable success in achieving good development impact while working with one client as the launch pad for engagement with another.
Figure 1.1 presents the outline theory of change for NIAF II. The narrative summary which follows sets out the ‘theories’ in the theory of change thinking – hypotheses about how and why change occurs. These hypotheses41 explain the logic that links the different levels of the theory of change.
40 Adapted by UIREM from NIAF overall story and detailed sector stories: Compilation incorporating NIAF theories of change, NIAF PMU June 2014 41 Ideas about the drivers of change and cause-effect relationships between assumptions are sometimes termed ‘assumptions’ – though here we take assumptions to mean ideas about the context as described below.

Formative Evaluation of NIAF II
29
Figure 1.1 NIAF II theory of change
Impact level
Reduced infrastructure constraints to growth in non-oil gross domestic product and employment, leading to reduced poverty
■ Enhanced management of infrastructure development contributes to increased and more effective infrastructure investment.
■ More effective investment in infrastructure provision will contribute to non-oil growth.
■ The greatest economic impact will be through support for improved performance for power and transport.
■ Better infrastructure in Nigeria’s urban centres can unlock the currently unrealised potential of rapidly growing cities to act as key drivers for economic and employment growth.
■ More effective investment in infrastructure provision will enable access to services by poor people.
■ Infrastructure provision and access to services will contribute to improved livelihoods for poor people.
■ Infrastructure provision in Northern Nigeria will contribute to poverty reduction.
Outcome level
Enhanced management of infrastructure development at the federal level and in selected states
■ Improved government systems for planning, budgeting, executing and overseeing the capital programme can remove obstacles to infrastructure investment.
■ Across a range of infrastructure-related activities, the making available of high quality and independent expertise will increase the funds that can be brought to bear, improve effectiveness of existing expenditure and thus reduce poverty through faster development associated with better infrastructure provision.
Impa
ct Reduced infrastructure constraints to growth in non-oil gross domestic product and employment, leading to reduced poverty
Out
com
e
Enhanced management of infrastructure development at the federal level and in selected states
Proc
ess DEMAND DRIVEN
and rapid response
POLITICAL ECONOMY
AWARENESS
FLEXIBILITYto meet evolving
client needs
INFLUENCE, relationships & communication
Out
puts 1.
POWER2. ROADS & RAIL
3.CAPITAL
PROJECTS
4. NORTHERN GROWTH
5. CLIMATE CHANGE
6. EFFECTIVE CITIES

Formative Evaluation of NIAF II
30
■ High-quality and well-targeted technical assistance substantially improves the results derived from Nigeria’s spending on infrastructure. In doing so it also makes it possible to attract additional funding, including funding from the private sector and other development partners.
Assumptions
The theory of change rests on a number of assumptions. The assumptions describe conditions without which the theory will not hold. They relate primarily to the context within which the intervention is to be implemented, and are usually conditions which are outside of the control of the intervention.
Impact level assumptions
■ Improved funding arrangements and systems to objectively prioritise expenditure—together with better procurement and project management—result in actual delivery of improved infrastructure assets and services.
■ Improved infrastructure assets and infrastructure services support poverty alleviation by promoting significant broad based economic/employment growth and human welfare gains.
■ It will be possible to identify and support interventions that are important to businesses, and the interventions will succeed in outweighing the negative effect on perceptions resulting from greater underlying pressure on infrastructure from rapid urbanisation.
■ The rate of increase in demand for electricity does not outstrip growth in electricity supply resulting in electricity consumers being unable to perceive any improvement in serviced delivered.
Outcome level assumptions
■ Power
a. Investors are willing to commit significant investment to the power sector in Nigeria
b. International capital markets do not suffer shocks that result in financing becoming impossible for potential investors.
c. Government remains committed to a model for the power sector driven largely by the private sector, and does not impose formal or informal constraints that result in participation in the market not being viable.
■ Roads and Rail
d. Supervision of maintenance work will be at a standard that ensures that better prioritised expenditure translates to better average condition.
e. Federal and State Governments fulfil their commitment on district roads restoration and maintenance.
■ Capital Projects
f. Exposure to better analysis will lead to some improvement in project execution by Government or the private sector.
g. Funding from the private sector or other sources other than government will be available for PPP projects.
■ Climate Change
h. Government prioritises the achievement of climate change outputs.
i. Privatisation of generation and distribution occurs, and a regulatory and commercial framework is created that supports investment in capacity and encourages distribution companies to connect new customers.
■ Effective Cities

Formative Evaluation of NIAF II
31
j. Funding commitments to implement agreed sector strategies are honoured.
k. Sufficient human capacity exists at city and State level to implement reforms without a widespread capacity building, or that capacity building funded by Government or other donors can be facilitated where necessary

Formative Evaluation of NIAF II
32
Annex 4 Checklist for Evaluating a Theory of Change
1 Is the purpose of the theory of change clear?
2 Does it make a prediction?
3 Does it provide a summation?
4 Is it understandable?
5 Is the text understandable?
6 Is the theory of change captured visually? If used, is the diagram clear?
7 Is it verifiable?
8 Are the events described in a way that could be verified? (as per Objectively Verifiable Indicators and Means of Verification found in Log Frames)
9 Is it testable?
10 Are there identifiable casual links between the events?
11 Are the linked events parts of an identifiable casual pathway?
12 Is it explained?
13 Are there explanations of how the connections are expected to work?
14 Have the underlying assumptions been made explicit? (also duplicated below)
15 Is it complete?
16 Does the chain of events make a connection between the intervening agent and the intended beneficiaries (target of their actions)
17 Is it specific and well-articulated? Is each step mapped out in the necessary detail?
18 Has it been put together in an inclusive manner?
19 Does the theory of change encompass the diversity of contexts it is meant to cover?
20 Is it aligned with the needs of beneficiaries?
21 Is it gendered in an appropriate manner?
22 Is it aligned with national objectives?
23 Does the theory of change achieve the appropriate balance between inclusion/ participation and verifiability and testability?
24 Is it justifiable?
25 Is there evidence supporting the sequence of events in the theory of change? Either from past studies, previous projects, and/or from a situation analysis/baseline study
26 Is it plausible?
27 Is the sequence of events plausible, given what is known about the intervention and the context?
28 Are the underlying assumptions reasonable and realistic?
29 Have contextual factors been recognised as important mediating variables?
30 Is it owned?
31 Can those responsible for contents of the theory of change be identified?
32 Is the theory of change widely owned by the key stakeholders?
33 Is it embedded?
34 Are the contents of the theory of change are also referred to in other documents that will help ensure that it is operationalised?
35 Do different documents give consistent representations of the same theory of change?
Formative Evaluation of NIAF II
33
Annex 5 Summary of Additional Client Survey
ADDITIONAL SURVEY OF NIAF CLIENTS 2014
SUMMARY REPORT
PREPARED FOR:
PREPARED BY:
FOUNDATION FOR DEVELOPMENT AND ENVIRONMENTAL INITIATIVES (FDI)
[Registered off: 16 Oba Olagbegi Crescent, Bodija, Ibadan, Nigeria]
RD 5, BLOCK J, SUITES J91-92 IKOTA SHOPPING COMPLEX, LAGOS EPE-EXRESSWAY
LAGOS, NIGERIA TEL: +234-802-309-3649/234-803-944-2551
AUGUST 2014
Formative Evaluation of NIAF II
34
ACKNOWLEDGEMENTS The FDI wishes to appreciate the partnership of ICF International and the honour bestowed on it to carry out the NIAF Clients Perception Survey, in furtherance of the ongoing collaborative effort to implement the Urbanisation and Infrastructure Research and Evaluation Manager – Nigeria (UIREM) Project. We remain grateful to DFID for funding the NRN project. The FDI is grateful for the support and guidance it received from the ICF International Team in firming up the methodology and the conduct of the field work for the study. We remain grateful for the guidance, technical and managerial backstopping provided by Robin Bloch, Janet Gardener, Jim Arthur, Phil Bernard-Carter and Nikolaos Papachristodoulou and the staff of NIAF Project who supported the survey in the background by updating the list of Clients and issuing the letter of introduction. Considering the short time it took to carry out this study, the FDI remains grateful to our Experts and resource persons that have been engaged and were prepared to serve and put in their best at such short notice. We also wish to acknowledge and thank all Clients contacted that willingly participated in the study and voiced their opinions about the NIAF project. We ensure that our report reflects the views expressed by NIAF Clients as much as possible and hope that all stakeholders will find it very useful, serving the purpose for which the perception survey was conducted. Professor Johnson Bade Falade Executive Director, FDI

Formative Evaluation of NIAF II
35
NIAF CLIENT SURVEY TEAM
The FDI Team that carried out the NIAF Clients Perception Survey in the various locations is as listed below.
Abuja:
Experts
Dr Oluwemimo Oluwasola
Professor Omolara Olusi
Dr Charles Alonge
Professor Niyi Gbadegesin
Field Assistants:
Mrs. Ruth Bola Fogabi
Mrs. Abosede Ajadi
Mr. Matthew Oladejo
Jigawa/Kano:
Expert
Professor Mohammed Bello Yunusa
Field Assistants:
Muktar Sani
Umar Majia
Zamfara
Expert
Mrs. Hadjara Shibkau
Field Assistant:
Jibril Mohammed
Enugu:
Expert
Dr Francis Azuka Onweluzo
Field Assistant
Engr Okeoma Agu
Lagos:
Experts:
Professor Alex Gboyega
Assistant
Mr Bernard Oluwaseun Idowu
Professor Johnson Bade Falade
Project Coordinator, Reporting and Management
Professor Johnson Bade Falade
Executive Director, FDI
Data Analyst Assistant: Idowu Oluwaseun
Secretary: Tajudeen Akanni
Formative Evaluation of NIAF II
36
SUMMARY REPORT _________________________________________________________________________________
Introduction
Since 2013, FDI, an NGO based in Nigeria, has been partnering with ICF in the implementation of the Urbanisation and Infrastructure Research and Evaluation Manager – Nigeria (URN) project. This project has two components which include the design and delivery of a research programme on urbanization in Nigeria and the evaluation of the Nigeria Infrastructure Advisory Facility (NIAF II) project.
Rationale
ICF contracted FDI to undertake the Client Survey of NIAF. This survey was designed to supplement to the detailed interviews which ICF staff had already completed with a sample of NIAF clients. While the ICF sample was designed and agreed with DFID to provide coverage of the key sectors, workstreams and regions, this study was used to contact all of the remaining clients to ensure as complete coverage as possible. The evaluation team was alert to the possibility that those clients interviewed by the international team (16 out of 50) could offer a skewed view of NIAF performance. In order to counter this possibility, this additional client survey was commissioned to contact all remaining clients to ensure that the detailed information gathered in the semi-structured interviews was reflected in the wider client group. Methodology
The semi-structured interview schedule used by the ICF team (See Annex 12) was abridged and used as the basis for a more structured interview which gathered quantitative as well as qualitative data from the remaining clients, this abridged instrument can be found in Annex 13. The team conducting this additional client survey were not as familiar with the NIAF, and the evaluation team felt that they would need a more structured format to ensure that data was collected consistently and that subjects which were not directly relevant to this evaluation were not discussed. We recognise that by using different formats between client groups means that quantitative data cannot be directly compared, however, the key insights can still be used to validate the more detailed accounts from the semi-structured interviews – and the possibility of a small sample group skewing the findings is almost entirely removed. All NIAF clients which had not already been interviewed by the core evaluation team were contacted by FDI via email and telephone, to arrange a face to face interview. In total, 27 (79 per cent) out of the 34 remaining clients were successfully contacted and participated in the survey. Seven clients did not respond to the approach. This means that the total coverage of clients by the core evaluation team and FDI was 43 out of 50 (86 per cent). Results of Data Analysis Aggregated Data The highlights of the results of the aggregate analyses of the responses of the Clients on the quality of NIAF assistance are summarised below: (i) NIAF Response to Client’s Needs: 26 Clients (96.3 percent) out of 27 accepted that NIAF
responded to their needs to varying degrees, ranging from moderate extent to a very large extent. However, only few Clients expressed concern about NIAF’s assistance. These concerns include the use of incompetent consultants and the rigid nature of NIAF assistance. In these regards, Clients suggested that NIAF needs to use ‘more competent consultants’ and to ‘be more responsive to client's needs rather than trying to re-shape client's programmes to fit its own’.
(ii) NIAF’s Help to Organization and the greatest benefits: Most Clients acknowledged that the assistance provided by NIAF has helped their organizations. A total of 25 (92.6 percent) Clients out of 27 They described such help as either moderate or large or very large in extent. Many Clients appreciated the benefits they have derived from NIAF’s assistance and they willingly expressed their opinions about the helps received. The more frequently mentioned benefits included capacity building in its various forms and the technical assistance received by some organizations to develop and adopt strategic policies and plans.
(iii) Impact of NIAF support on poverty reduction: The result of the analysed data shows a remarkably low perception of the impact of NIAF’s assistance on poverty reduction. Only 12 Clients (29.6 percent) acknowledged that NIAF’s assistance has impacted poverty reduction. The latter comprised 11.1 percent that stated such impact is to a moderate extent; while 18.5 percent

Formative Evaluation of NIAF II
37
affirmed that it is to a great extent. However, a whopping 44.5 percent said that NIAF’s support did not impact poverty reduction at all; while barely over a quarter of all clients contacted (25.9 percent) stated NIAF’s assistance impacted poverty reduction to a small extent. It is interesting to note that many clients contacted declined to comment on how NIAF’s assistance has reduced poverty. Many clients said poverty reduction is not part of their mandates. It is very disturbing to note that many client organizations could not see the linkages between their mandates and the drive to reduce the pervasive poverty plaguing the country. In all only few clients linked NIAF assistance to poverty reduction. The few said NIAF’s assistance impacted on poverty reduction in the areas of improvement in bus transport service, adoption of policies and legislation on water and climate change; and the adoption of pro-poor policies and approaches to promoting development. The low perception of the impact of NIAF assistance on poverty reduction is compounded by the inability of many clients to describe how this was achieved. This situation underscores the need to carry out a more detailed and focussed study on how NIAF assistance has impacted poverty in the country. It is also necessary to mainstream poverty reduction into NIAF’s intervention as a across cutting issue. The agencies involved in economic planning need to be assisted to adopt pro-poor macro-economic policies.
(iv) NIAF Support in capacity building: 18 clients (66.6 percent) out of 27 contacted said that NIAF has helped to build their capacity in various degrees. The latter figure comprised 3 clients (11.1 percent) who rated the capacity built in their organization as moderate; another 14 clients (51.8 percent) that recognized the capacity built as large in extent; while additional two clients (7.4 percent) stated that the built capacity is very large in extent. While 2 clients stated that NIAF’s support did not contribute to capacity building at all; additional 7 clients (25.9 percent) rated NIAF’s contribution as small. Generally, most Clients appreciated and recalled how NIAF has supported capacity building in their organizations through knowledge sharing, provision of tools and documentation, knowledge transfer and experience sharing and through direct engagement with NIAF Consultants. Many Clients who valued NIAF’s assistance in this regard also demanded for more capacity building initiatives.
(v) Positive changes stimulated by NIAF: 21 clients (77.8 percent) out of 27 contacted acknowledged that NIAF’s assistance stimulated positive changes in their organization in varying degrees, which vary from moderate changes to transformative changes. The analysed data show two clients (7.4 percent) that said there was no change stimulated; 4 clients (14.8 percent) that described the changes stimulated as moderate; while a whopping 11 Clients (40 percent) rated these changes as significant; plus one client (3.7 percent) said it is a transformative change. As to what kind of changes that were stimulated, those frequently mentioned by clients include changes in work ethics, increased performance and effectiveness of the various organizations and the new and innovative ways imbibed by these organizations for doing business.
(vi) Added Value of NIAF Assistance: 23 clients (85.2 percent) out of 27 agreed that NIAF assistance added value to their organizations with the ratings of the value added ranging from moderate to a very large extent. In contrast, 2 clients deferred that NIAF assistance did not add value at all; while additional 2 clients also ranked the value added as small. As to the question of how, these Clients said NIAF assistance has been able to add value to their organizations through the use of national experts and international experts (who are in Diaspora) who brought to their organizations new competencies, changes in work ethics and new ways of doing business, which impacted increasing efficiency. According to some clients, NIAF’s assistance positively impacted changes in their organization to adopt strategic planning approaches. Many clients were able to enumerate the added values to their organizations in millions of Naira, dollars and British pounds, which showed the international nature of the various assistance facilitated by NIAF.
(vii) What would have happened without NIAF assistance? This question has three components, and required measuring what would happen in terms of the existence of organization,

Formative Evaluation of NIAF II
38
effectiveness and performance of these organizations without NIAF’s assistance. The results shows: (a) one client (3.7 percent) out of 27 that affirmed that it would not have existed without NIAF’s
assistance. (b) 15 clients (55.6 percent) acknowledged that they would have been less effective without
NIAF’s assistance, when compared with only 1 client (3.7 percent) that said it would still have been as effective without NIAF’s assistance. All the 27 clients (100 percent) accepted that they could not be more effective without NAIF’s assistance.
(c) 16 Clients (59.3 percent) out of 27 accepted that their performance would have been slower without the assistance provided by NIAF. Only 2 clients, representing 7.4 percent of the total clients contacted for the survey, uttered that they could still have operated at the same speed without NIAF’s support. All 27 clients (100 percent) accepted that they would have not been faster without NIAF’s assistance.
The foregoing results showed that NIAF has contributed in no small measure to the improved performance and effectiveness of the benefiting agencies. These results indicate that although NIAF assistance may not necessarily have resulted in the setting up of the various organizations, but as widely acclaimed by all these agencies (100 percent), it has contributed to the effectiveness and performance of the various organizations. These results, however encouraging and good as they may seem, they are of concern in that issues of sustainability of current assistance need to be addressed immediately and frontally so that if and when NIAF’s assistance runs out, we would be confident and be assured that these organizations would still be not only in existence, but must still be as effective and efficient in their performances.
Disaggregated data
The dis-aggregation of the data by Workstreams reveals that the performances of the various client organizations varied by the thematic issues and types of workstream. Details of this and related data are presented in the consolidated report.
The result of the dis-aggregated data by regions reveals that more workstreams are located in northern Nigeria than southern Nigeria. For instance, 23 clients (84.7 percent) out of 27 captured in the study are located in northern Nigeria when compared with 4 Clients (15.3 percent) located in southern Nigeria. By implication NIAF’s assistance has targeted more beneficiaries in northern region when compared with southern Nigeria. The analysis also shows that more beneficiaries of NIAF assistance are in Abuja than other regions. It shows regional imbalances, a sensitive issue in Nigeria which as to be looked into. Conclusions and Recommendations
The observed low perception of the impact of NIAF assistance on poverty reduction by the sampled clients is a cause of major concern, which may be due to many problems. Yet the observed low rating certainly contradicts other findings such as the higher ratings of the assistance of NIAF for capacity building, vale addition, transforming change and improved and effective performance of their organizations.
The inability of clients to explain how this has been done also compounds the problem at hand. Many clients seem not to want to be bothered about the question. The fact that some of the clients said in their comments that poverty reduction is not part of their mandates speak volume, while many decided not to comment on the subject. Considering the veracity and pervasive nature of poverty in the country attracting not less than 50 percent of the total population, it is therefore instructive that these agencies need to accept the fact that their interventions in various forms must contribute to poverty reduction. If the perception of programmatic intervention is this low, there is the need to highly sensitize all clients about their contribution to poverty reduction in the country. In addition, all organizations need to refocus their strategy on poverty reduction. All Client organizations need to adopt a pro-poor approach and mainstream it into their various interventions.
This result cannot give a clear indication whether NIAF assistance has positively impacted poverty reduction or not. This may be an area where a focused research needs to be undertaken to quantify the

Formative Evaluation of NIAF II
39
contribution of NIAF to poverty reduction in the country. This provides a meeting point between the components of the URN project, where research can positively feed into the implementation of NIAF.

Formative Evaluation of NIAF II
40
STATISTICAL ANNEX
TABLE 1: NIAF’S RESPONSE TO CLIENTS
RESPONSE TO NEEDS FREQUENCY PERCENT TO A SMALL EXTENT 1 3.70 TO A MODERATE EXTENT 11 40.74 TO A GREAT EXTENT 13 48.15 TO A VERY GREAT EXTENT 2 7.41 TOTAL 27 100.00
Source: Field Survey by FDI August 2014
TABLE 2: NIAF’S HELP TO ORGANIZATIONS HELP TO ORGANIZATION FREQUENCY PERCENT TO A SMALL EXTENT 2 7.41 TO A MODERATE EXTENT 12 44.44 TO A GREAT EXTENT 11 40.74 TO A VERY GREAT EXTENT 2 7.41 TOTAL 27 100.00
Source: Field Survey by FDI August 2014 TABLE 3: NIAF’S IMPACT ON POVERTY REDUCTION
IMPACT ON POVERTY FREQUENCY PERCENT NO RESPONSE 2 7.41 NOT AT ALL 10 37.04 TO A SMALL EXTENT 7 25.93 TO A MODERATE EXTENT 3 11.11 TO A GREAT EXTENT 5 18.52 TOTAL 27 100.00
Source: Field Survey by FDI August 2014
TABLE 4: CAPACITY BUILT BY NIAF CAPACITY BUILT FREQUENCY PERCENT NO RESPONSE 2 7.41 TO A SMALL EXTENT 7 25.93 TO A MODERATE EXTENT 3 11.11 TO A LARGE EXTENT 14 51.85 TO A VERY LARGE EXTENT 1 3.70 TOTAL 27 100.00
Source: Field Survey by FDI August 2014.
TABLE 5: POSITIVE CHANGE STIMULATED BY NIAF CHANGE STIMULATED FREQUENCY PERCENT NO CHANGE 2 7.41 MARGINAL CHANGE 4 14.81 MODERATE CHANGE 9 33.33 SIGNIFICANT CHANGE 11 40.74 TRANSFORMATIVE CHANGE 1 3.70 TOTAL 27 100.00
Source: Field Survey by FDI August 2014. TABLE 6: VALUED ADDED BY NIAF
VALUE ADDED FREQUENCY PERCENT
NOT AT ALL 2 7.41 TO A SMALL EXTENT 2 7.41 TO A MODERATE EXTENT 7 25.93 TO A LARGE EXTENT 14 51.85 TO A VERY LARGE EXTENT 2 7.41 TOTAL 27 100.00
Source: Field Survey by FDI August 2014.

Formative Evaluation of NIAF II
41
TABLE 7: WHAT WOULD HAVE HAPPENED WITHOUT NIAF SUPPORT?
WITHOUT NIAF SUPPORT NUMBER OF CLIENTS
YES NO
HAVE NOT EXISTED 1 26
HAVE BEEN LESS EFFECTIVE 15 12
HAVE BEEN AS EFFECTIVE 1 26
HAVE BEEN MORE EFFECTIVE 0 27
HAVE BEEN SLOWER 16 11
HAVE BEEN AT SAME SPEED 2 25
HAVE BEEN FAS TER 27 0
Source: Field Survey by FDI August 2014. Table 8: Perception of NIAF’s Response to Needs by Workstreams
Workstreams Response to needs Not at all To a small
extent To a moderate extent
To a great extent To a very great extent
Row Total
Climate Change 0 0 4 2 0 6 Infrastructure delivery and Finance 0 1 2 3 1 7 Power 0 0 1 4 1 6 Urban Transport 0 0 3 0 0 3 Roads 0 0 0 2 0 2 Urban development 0 0 1 2 0 3 Column Total 0 1 11 13 2 27
Source: Field Survey by FDI, August 2014
Table 9: Perception of NIAF’s Help to Organizations by Workstreams
Workstreams Help to organization Row Total
Not at all
To a small extent
To a moderate extent
To a great extent
To a very great extent
Climate Change 0 0 4 2 0 6 Infrastructure delivery and Finance 0 2 2 3 0 7 Power 0 0 3 1 2 6 Urban Transport 0 0 2 1 0 3 Roads 0 0 0 2 0 2 Urban development 0 1 2 0 0 3 Column Total 0 3 13 9 2 27
Source: Filed Survey by FDI, August 2014
Table 10: Perception of impact of NIAF’s Assistance on Poverty Reduction by Workstreams
Workstreams Impact on poverty Row Total
Not at all To a small extent
To a moderate extent
To a great extent
To a very great extent
Climate Change 5 0 0 1 0 6 Infrastructure delivery and Finance 3 3 1 0 0 7 Power 3 1 0 2 0 6 Urban Transport 0 1 1 1 0 3 Roads 1 1 0 0 0 2 Urban development 0 1 1 1 0 3 Column Total 12 7 3 5 0 27
Source: Filed Survey by FDI, August 2014

Formative Evaluation of NIAF II
42
Table 11: NIAF Support to Capacity Building by Workstreams
Workstreams Capacity building
Not at all
To a small extent
To a moderate extent
To a great extent
To a very great extent
Row Total
Climate Change 1 3 1 1 0 6
Infrastructure delivery and Finance
0 3 2 2 0 7
Power 0 0 0 6 0 6
Urban Transport 0 0 0 3 0 3
Roads 1 0 0 1 0 2
Urban development 0 1 0 1 1 3
Col Total 2 7 3 14 1 27
Source: Field Survey by FDI, August 2014.
Table 12: Changes Stimulated by NIAF Assistance by Workstreams Workstreams Changes stimulated Row
Total No change Marginal change Moderate
change Significant change
Transformative change
Climate Change 0 1 2 3 0 6 Infrastructure delivery and Finance 1 1 2 3 0 7 Power 0 0 3 3 0 6 Urban Transport 0 1 1 0 1 3 Roads 1 0 1 0 0 2 Urban development 0 1 0 2 0 3 Col Total 2 4 9 11 1 27
Source: Filed Survey by FDI, August 2014
Table 13: Value Added by NIAF by Workstreams Workstreams Value Added Row
Total Not at
all To a small extent
To a moderate extent
To a great extent
To a very great extent
Climate Change 0 1 2 2 1 6 Infrastructure delivery and Finance 1 0 2 4 0 7 Power 0 0 1 4 1 6 Urban Transport 0 0 2 1 0 3 Roads 1 0 0 1 0 2 Urban development 0 1 0 2 0 3 Col Total 2 2 7 14 2 27
Source: Filed Survey by FDI, August 2014
Table 14: Analysis of What would have happened without NIAF Assistance by Workstreams
WORKSTREAM Would not have existed
Less Effective Just as effective More effective
Been slower Same speed Been faster
Yes No Yes No Yes No Yes No Yes No Yes No Yes No
Climate Change 0 0 3 3 0 6 0 0 3 3 1 5 0 6
Infrastructure delivery and Finance
0 7 4 3 1 6 0 7 5 2 1 6 0 7
Power 1 5 4 2 0 6 0 6 2 4 0 6 0 6
Urban Transport 0 3 1 2 0 3 0 3 3 0 0 3 0 3
Roads 0 2 1 1 0 2 0 2 0 2 0 2 0 2
Urban development
0 3 1 1 0 3 0 3 3 0 0 2 0 3
Source: Filed Survey by FDI, August 2014

Formative Evaluation of NIAF II
43
Table 15: Analyses of Responses by NIAF’s Clients by Regions NIAF’S Response to needs
Region Not at all To a small extent
To a moderate extent To a great extent To a very great extent
Row Total
Northern Region 0 1 9 11 2 23 Southern Region 0 0 2 2 0 4 NIAF’S Help to organization Region Not at all To a small
extent To a moderate extent To a great extent To a very
great extent Row Total
Northern Region 0 2 11 8 2 23 Southern Region 0 0 1 3 0 4 Impact of NIAF’ Assistance on poverty reduction Region Not at all To a small
extent To a moderate extent To a great extent To a very
great extent Row Total
Northern Region 11 6 2 4 0 23 Southern Region 1 1 1 1 0 4 NIAF’s support to Capacity building Region Not at all To a small
extent To a moderate extent To a great extent To a very
great extent Row Total
Northern Region 2 7 3 11 0 23 Southern Region 0 0 0 3 1 4 Positive Changes stimulated by NIAF Region Not at all To a small
extent To a moderate extent To a great extent To a very
great extent Row Total
Northern Region 2 4 8 9 0 23 Southern Region 0 0 1 2 1 4 Value Added by NIAF Region Not at all To a small
extent To a moderate extent To a great extent To a very
great extent Row Total
Northern Region 2 2 6 11 2 23 Southern Region 0 0 1 3 0 4
Source: Field Survey by FDI, August 2014.

Formative Evaluation of NIAF II
44
Annex 6 Summary of Perception Survey Results
Rationale The evaluation framework, which served as the approved design document for this evaluation, did not include any survey based assessment of impact indicators, this decision replaced an earlier intention to conduct an extensive household survey to gather impact data. It was agreed that the costs of a household survey were too high, and the likelihood of detecting impacts through this method which were directly attributable to NIAF was too low to warrant the spending.
One of the challenges of advisory programmes is that the impact on the people of Nigiera is mediated by the response of the beneficiaries of the advice as well as a range of other factors. Detecting and attributing change is therefore difficult. As a consequence of this, the evaluation framework focussed on collecting data from clients and stakeholders who would be more able to make judgements about the impact which the programme was having, rather than the general population who would only be able to comment on the eventual quality of services rather than NIAF’s contribution.
Whilst this rationale is sound, and had been agreed with DFID and NIAF and signed off through an assessment by DFID’s external quality assurance processes, the evaluation team was still aware of the limitations of a purely client and stakeholder based approach. In particular there would be no objective data on whether services were improving or not. Assertions from clients and stakeholders that services had improved, could not be validated without an element of public perception polling.
At this formative stage, improvements to services through from NIAF’s support to planning and design may not be manifest in measureable service improvements, however, understanding the direction of travel – whether improving or deteriorating – will form an important backdrop to the assessment of NIAF’s impact.
Objective The objective of this perception survey was therefore to collect objective data on the public perception of the quality of public services. The poll should be repeated at the summative evaluation and in subsequent years to verify general improvements or otherwise in public services. At this stage the analysis will not be able to present more than descriptive statistics, however a full analysis can be conducted at the summative evaluation when the exercise is repeated and the send round of polling will show how perceptions have changed over the life of the programme.
Design
Telephone poll
A telephone poll was selected because this would be the most cost effective way to maximise the sample size. Telephone polls are used regularly for political and market research polling in Nigeria, and represent the majority of opinion polling currently used. The relatively high proportion of mobile phone ownership and the relative willingness of people to respond to these surveys makes this form of polling suitable for the needs of this survey. The main limitation of this kind of survey is that the poorest 20% of Nigierans do not own a mobile phone and so would be excluded from the results. This clearly has an impact on assessing how the quality of public services is felt by the poorest, and this survey is unable to assess this – only a much more expensive household survey could address this, an approach which was not judged to be cost effective by DFID.
Sample
The poll surveyed 2,500 people made up of 1000 nationally, with 500 additional interviews with people from each of Kano, Lagos and Abuja (where NIAF has a number of urban-focused projects).
The sample followed a proportionate, stratified sampling design. Random telephone numbers from the specified regions were called and the final analysis done on a sample stratified by age, gender and
Formative Evaluation of NIAF II
45
occupation (as a proxy for income) to ensure that the final sample was representative of the region. This sampling method allowed for both national and city-level analysis with less than plus or minus 3% error at the 95% confidence level.
The design is based on a poll commissioned by NIAF to assess the success of power sector reform and will provide results which will be comparable with NIAF’s own outcome indicators.
Questionnaire
The questionnaire was designed to measure people’s perception of quality of public services in power, roads and bus transport. These three were selected because they are subject to NIAF interventions and are three areas where the public are direct consumers and so perceptions will be more closely linked to quality of service than for example climate change or spending on capital projects.
The questionnaire was designed to be short enough to be conducted over the telephone, and to cover the headline measures on these three areas to provide some basic impact data which can be used over time. It was not designed to investigate various sub indicators or qualitative responses which would be more suited to a more elaborate household survey.
The full questionnaire can be found in Appendix 14.
In brief, it covered key biographic data such as age, gender, location and occupation. The subject matter questions were then designed to illicit perceptions of quality of service for each of the sectors (power, roads, bus transport) now, perceptions of how they were 5 years ago, and a measure of optimism which asked what the responded thought quality would be in 5 years’ time.
It was not possible to investigate to disaggregate the various indicators of quality, however, interviewers were instructed to ask people to construct their overall ratings of quality of service based on the factors below:
Power
Quality of power supply was discussed in terms of hours of electricity, promptness of billing, effectiveness of customer service etc.
Bus transport
Quality of bus transport was discussed in terms of the availability of buses, utility of routes and the use of newer buses.
Roads
Quality of bus transport was discussed in terms of number and utility of new roads and maintenance of old roads existing roads
Response rate
For the nationwide survey, a total of 3,071 people were contacted to achieve 1000 responses. This therefore gives a response rate of 33% (about 1 out of every 3 calls).For the sample across the 3 target states, a total of 3,286 were contacted to achieve the expected sample of 1,500. This therefore gives a response rate of 46% (close to about 1 out of every 2.2 Calls).
Limitations
The perception survey does not seek to provide definitive impact measures for the NIAF programme, but it does provide an important context to any analysis of service delivery in power, roads and bus transport.
People’s perception of the quality of service as they see it today will be influenced by immediate factors such as localised power cuts, these will influence perceptions but may not reflect the longer term realities. These variations should be adequately controlled by the relatively large sample size of 2,500.
Perception of quality five years ago does not provide an objective measure of quality, and it should not be used to quantify changes in service quality. However, it does indicate whether services have

Formative Evaluation of NIAF II
46
improved or deteriorated – taken at this level of detail the measure is a useful validation of other findings, but it does not bear more fine grained analysis.
Opinions of future quality of service are even less objective, it is not reasonable to expect people’s opinion about how a service will perform in five years to be an accurate predictor. However, this measure does indicate the degree of optimism about particular services. The level of optimism is likely to be based reporting by local and national media about changes in governance of services. As NIAF is working to improve governance, and the media in Nigeria are active in reporting on governance, we suggest that this level of optimism is reflective of public support for the goals of NIAF, and in the case of the power sector where NIAF has been so instrumental, we would suggest that public optimism for power supply can be used as part of an assessment of NIAF performance.
Peer review
The methodology was peer reviewed by Patrick Sturgis, Professor of Research Methodology at Southampton University. The survey method follows the standards set out by Gallup which partners with NOI Polls to provide public opinion and consumer market polling in Nigeria.
Summary of results Compared to five years ago, the results of the perception survey suggest a significant improvement in the quality of infrastructure services with regard to power, roads and bus transport. The average rating of power provision today is more than 51 percent higher than the rating of power provision five years ago, while roads and bus transport were rated 44.5 and 30.7 percent higher respectively.
The results also suggest great optimism toward the future development of infrastructure in Nigeria, with almost 91 percent of the respondents expecting the quality of power provision and roads to be good or very good in the next five years, and almost 89 percent expecting bus transportation to be good or very good.
This assessment of change to date and optimism for the future does indicate the NIAF is working on sectors which the general public feel are relevant. This optimism may also indicate that the NIAF’s work is politically supported, at least in the general public; translating this mass support into active political support at senior levels will be critical for NIAF’s future success.
Figure 1.1 Average rating of quality of power provision, roads and bus transport 5 years ago, now and 5 years from now
The results show no substantial difference across geo-political zones, with the exception of South South and North West. Respondents from the South South indicated the lowest improvement in the provision of power compared to five years ago, with an average difference of 10 percent in the ratings between 5 years ago and now, compared to the 51 percent overall average. Respondents from the North West rated the current quality of power provision, roads and bus transport somewhat higher than the rest of the country, with a 10, 17.5 and 12 percent difference respectively compared to the overall averages.
1
2
3
4
5
5 years ago now 5 years from nowPower Roads Bus transport
Very good
Very poor

Formative Evaluation of NIAF II
47
1
2
3
4
5
5 years ago now 5 years from now
Power
North Central North East North West
South East South South South West
1
2
3
4
5
5 years ago now 5 years from now
Power
North Central North East North West
South East South South South West
Figure 1.2 Average rating of quality of power provision, roads and bus transport 5 years ago, now and 5 years from now by geo-political zones
1
2
3
4
5
5 years ago now 5 years from now
Bus Transport
North Central North East North West
South East South South South West
Very good
Very good
Very poor
Very good
Very poor
Very good
Very poor

Formative Evaluation of NIAF II
48
The results indicate no significant difference across gender groups. At the same time, age seems to influence the perception of infrastructure, as young people rate its quality higher and this rating tends to deteriorate with age. This difference is the most pronounced in case of power and bus transport.
Figure 1.3 Average rating of quality of power provision and bus transport 5 years ago, now and 5 years from now, by geo-political zones
Links to other polls NOI conducts regular polls on the state of the power sector and is monitoring changes in public perception closely in the run up to the 2015 elections in which power sector reform is a critical electoral issue. These polls on the power sector may be useful to understand the detailed changes in public perceptions and may potentially be used in a summative evaluation to chart NIAF’s impact on the sector.
Broadly these detailed polls support our polling. In 2014 73% of Nigerians were aware that the government was conducting power sector reforms, and 52% reported that in the previous month power supply had improved, 13% reported no change and 35% reported that power had worsened.42
42 NOI Polls http://www.noi-polls.com/index.php?s_id=3&p_id=352&p_pt=1&parent=13#.VFus2fmsV1a
1
2
3
4
5
5 years ago now 5 years from now
Power
18-21 22-29 30-45 46-60 60+
1
2
3
4
5
5 years ago now 5 years from now
Bus Transport
18-21 22-29 30-45 46-60 60+

Formative Evaluation of NIAF II
49
There is a broadly optimistic outlook for the power sector, with 68% of people feeling hopeful or very hopeful about the ongoing power reforms.43
Summary and conclusions The polling indicates that the public perceive that the quality of power, bus transport and roads have increased over the last five years. It is not possible to identify the impact that NIAF has had over this period from this polling, but these data points do show the backdrop against which the programme is working – it is possible that services are improving even without NIAF’s assistance, in which case NIAF will need to show how it is providing additionally to this existing improvement.
Nigerians expect public services to improve – we suggest that this optimism is based on a favourable impression of the reforms to date, and in particular perceived improvements in governance. The summative evaluation should compare levels of perceived quality, and optimism and interpret the results though the kind of detailed consultations as well as other poll data to attribute impacts to NIAF.
43 NOI Polls http://www.noi-polls.com/index.php?s_id=3&p_id=317&p_pt=1#.VFutGfmsV1Z

Formative Evaluation of NIAF II
50
Annex 7 Literature Review: Infrastructure, Growth and Poverty Reduction
Title Source Summary of Relevant Findings Evaluation Question(s) Addressed
Link between economic growth and poverty reduction Michael Roemer and Mary Kay Gugerty (1997) Does Economic Growth Reduce Poverty?
http://pdf.usaid.gov/pdf_docs/Pnaca656.pdf
The study examines the question of whether economic growth tends to reduce poverty. Using the most recent data available, the paper shows that an increase in the rate of GDP growth translates into a direct one-for-one increase in the rate of growth of average incomes of the poorest 40%. GDP growth of ten percent per year is associated with income growth of ten percent for the poorest 40% of the population. For the poorest 20% the elasticity of response is 0.921; GDP growth of 10% is associated with income growth of 9.21%. These results give strong support to the proposition that growth in per capita GDP can be and usually is a powerful force in reducing poverty.
Q1/b
Haroon Bhorat & Carlene van der Westhuizen (2008) Economic Growth, Poverty and Inequality in South Africa: The First Decade of Democracy
file:///C:/Users/32004/Downloads/economic_growth-libre.pdf
The results from the paper suggest firstly, that South Africa has witnessed a significant decline in absolute and relative measures of poverty. This is true by race and gender of household head and is robust for any number of feasible poverty lines. In turn however, the analysis has shown that inequality levels within the society have increased. South Africa’s growth in the 1995-2005 period has been pro-poor in absolute terms, in that the expenditure growth of the poor has been positive over the period. However, notably the growth in expenditure of the rich has far exceeded those at the bottom-end of the distribution. The conclusion of the study’s growth trajectory and pattern since 1995, is one of high returns to individuals at the top-end of the distribution, with gains to those at the 30th percentile and below principally arising out of an expansion in social grants.
Q1/b
Martin Ravallion (1994) Growth and poverty: Evidence for developing countries in the 1980s
ftp://filer.soc.uoc.gr/students/aslanidis/My%20documents/papers/Ravallion%20(1995a).pdf
The results of the paper suggest that measures of absolute consumption-poverty typically respond quite elastically to changes in average living standards. Measured consistently, one finds a strong negative association across developing countries between the levels of poverty incidence and average living standards. The paper finds that a 3% rate of growth in consumption per capita can be expected to result in a 6-10% rate of reduction in the proportion living on less than $1 per day. At the same time, it is also clear from the findings that economic growth is not all that matters to reducing poverty. The regressions used in the paper still leave a sizable unexplained variation in country performance at reducing poverty for a given rate of growth, presumably reflecting differences in initial conditions and in how inequalities changed. There are also other "non-income" aspects of poverty - such as lack of access to schools or health care - which could well be less responsive to changes in aggregate command over commodities.
Q1/b Q5
Alain de Janvry and Elisabeth Sadoulet (2000) Growth, Poverty, and Inequality in Latin America: A Casual Analysis, 1070-1974
http://www.roiw.org/2000/267.pdf
The study found that income growth reduces urban and rural poverty but not inequality. It also found that income growth is more effective in reducing urban poverty if the levels of inequality and poverty are lower, and the levels of secondary education higher. It shows that there is an asymmetry in the impact of growth on poverty and inequality, with recession having strong negative effects on both poverty and inequality. Since growth does not reduce inequality,
Q1/b
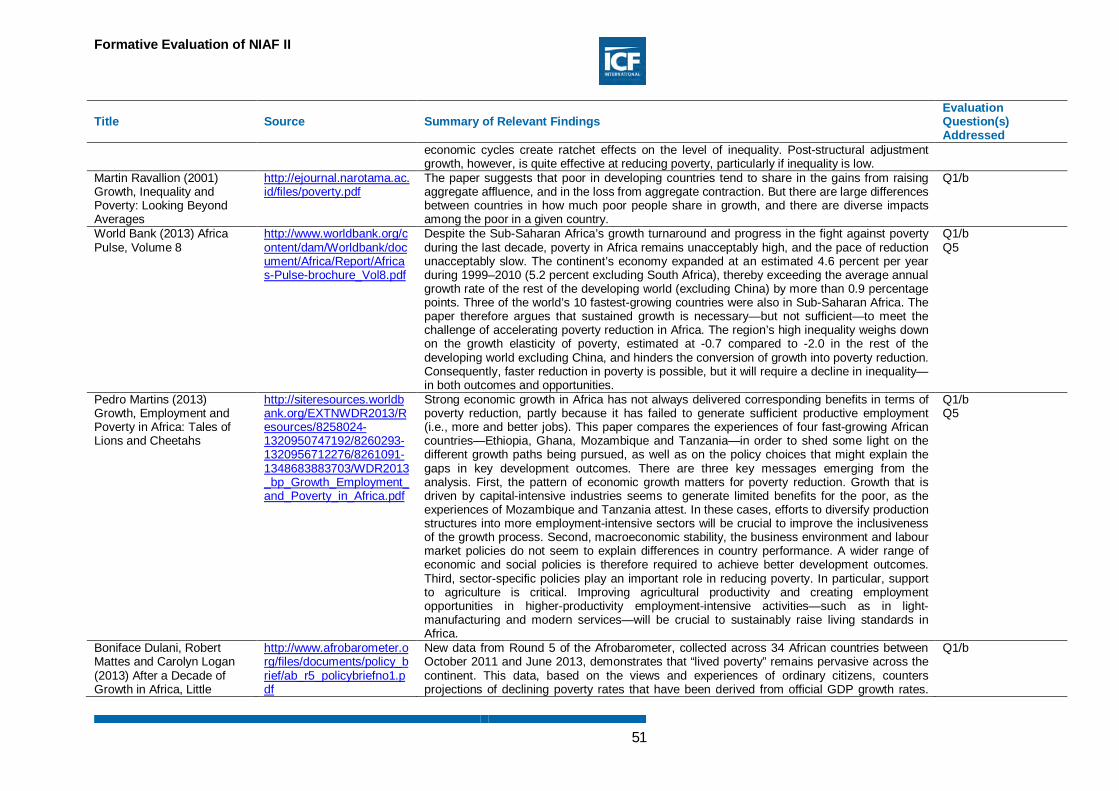
Formative Evaluation of NIAF II
51
Title Source Summary of Relevant Findings Evaluation Question(s) Addressed
economic cycles create ratchet effects on the level of inequality. Post-structural adjustment growth, however, is quite effective at reducing poverty, particularly if inequality is low.
Martin Ravallion (2001) Growth, Inequality and Poverty: Looking Beyond Averages
http://ejournal.narotama.ac.id/files/poverty.pdf
The paper suggests that poor in developing countries tend to share in the gains from raising aggregate affluence, and in the loss from aggregate contraction. But there are large differences between countries in how much poor people share in growth, and there are diverse impacts among the poor in a given country.
Q1/b
World Bank (2013) Africa Pulse, Volume 8
http://www.worldbank.org/content/dam/Worldbank/document/Africa/Report/Africas-Pulse-brochure_Vol8.pdf
Despite the Sub-Saharan Africa’s growth turnaround and progress in the fight against poverty during the last decade, poverty in Africa remains unacceptably high, and the pace of reduction unacceptably slow. The continent’s economy expanded at an estimated 4.6 percent per year during 1999–2010 (5.2 percent excluding South Africa), thereby exceeding the average annual growth rate of the rest of the developing world (excluding China) by more than 0.9 percentage points. Three of the world’s 10 fastest-growing countries were also in Sub-Saharan Africa. The paper therefore argues that sustained growth is necessary—but not sufficient—to meet the challenge of accelerating poverty reduction in Africa. The region’s high inequality weighs down on the growth elasticity of poverty, estimated at -0.7 compared to -2.0 in the rest of the developing world excluding China, and hinders the conversion of growth into poverty reduction. Consequently, faster reduction in poverty is possible, but it will require a decline in inequality—in both outcomes and opportunities.
Q1/b Q5
Pedro Martins (2013) Growth, Employment and Poverty in Africa: Tales of Lions and Cheetahs
http://siteresources.worldbank.org/EXTNWDR2013/Resources/8258024-1320950747192/8260293-1320956712276/8261091-1348683883703/WDR2013_bp_Growth_Employment_and_Poverty_in_Africa.pdf
Strong economic growth in Africa has not always delivered corresponding benefits in terms of poverty reduction, partly because it has failed to generate sufficient productive employment (i.e., more and better jobs). This paper compares the experiences of four fast-growing African countries—Ethiopia, Ghana, Mozambique and Tanzania—in order to shed some light on the different growth paths being pursued, as well as on the policy choices that might explain the gaps in key development outcomes. There are three key messages emerging from the analysis. First, the pattern of economic growth matters for poverty reduction. Growth that is driven by capital-intensive industries seems to generate limited benefits for the poor, as the experiences of Mozambique and Tanzania attest. In these cases, efforts to diversify production structures into more employment-intensive sectors will be crucial to improve the inclusiveness of the growth process. Second, macroeconomic stability, the business environment and labour market policies do not seem to explain differences in country performance. A wider range of economic and social policies is therefore required to achieve better development outcomes. Third, sector-specific policies play an important role in reducing poverty. In particular, support to agriculture is critical. Improving agricultural productivity and creating employment opportunities in higher-productivity employment-intensive activities—such as in light-manufacturing and modern services—will be crucial to sustainably raise living standards in Africa.
Q1/b Q5
Boniface Dulani, Robert Mattes and Carolyn Logan (2013) After a Decade of Growth in Africa, Little
http://www.afrobarometer.org/files/documents/policy_brief/ab_r5_policybriefno1.pdf
New data from Round 5 of the Afrobarometer, collected across 34 African countries between October 2011 and June 2013, demonstrates that “lived poverty” remains pervasive across the continent. This data, based on the views and experiences of ordinary citizens, counters projections of declining poverty rates that have been derived from official GDP growth rates.
Q1/b

Formative Evaluation of NIAF II
52
Title Source Summary of Relevant Findings Evaluation Question(s) Addressed
Change in Poverty at the Grassroots, Afrobarometer Policy Brief No. 1
For the 16 countries where these questions have been asked over the past decade, Afrobaromater finds little evidence for systematic reduction of lived poverty despite average GDP growth rates of 4.8% per year over the same period. While there were reductions in five countries (Cape Verde, Ghana, Malawi, Zambia and Zimbabwe), in five others (Botswana, Mali, Senegal, South Africa and Tanzania) lived poverty.
Kathy Hull (2009) Understanding the Relationship between Economic Growth, Employment and Poverty Reduction
http://www.oecd.org/dac/povertyreduction/43280288.pdf
The paper argues that growth in one sector of the economy will not automatically translate into benefits for the poor: much will depend on the profile of growth (its employment- or productivity-intensity), the sectoral location of the poor, and the extent of mobility across sectors. For employment-intensive growth to translate into poverty reduction it must occur in a “more productive” sector, while “less productive” sectors may require productivity-intensive growth to ensure a decline in headcount poverty.
Q1/b Q5
OECD (2006) Promoting Pro-Poor Growth: Key Policy Messages
http://www.oecd.org/dac/povertyreduction/37852580.pdf
There is clear evidence to show that economic growth is an essential requirement and, frequently, the main contributing factor in reducing income poverty. Rapid and sustained poverty reduction thus requires pro-poor growth, i.e. a pace and pattern of growth that enhances the ability of poor women and men to participate in, contribute to and benefit from growth. Developing countries with similar rates of economic growth have experienced quite different levels of economic poverty reduction, due to initial conditions and whether growth occurs in areas and sectors where the poor live and are economically active. Inequality of assets and opportunity hinders the ability of poor people to participate in and contribute to growth. High and rising levels of income inequality lower the poverty reduction impact of a given rate of growth and can reduce the political stability and social cohesion needed for sustainable growth. The growth experience shows that rising inequality is not an inevitable consequence of the growth process, as long as there is a mix of policies that addresses both growth and distributional objectives, strengthens empowerment and deals with gender and other biases (e.g. race, caste, disability, religion).
Q1/b Q5
François Bourguignon (2004) The Poverty-Growth-Inequality Triangle
http://siteresources.worldbank.org/INTPGI/Resources/342674-1206111890151/15185_ICRIER_paper-final.pdf
The study suggests that redistribution of ‘wealth’ from rich to less-rich people may have a positive impact on growth. This may occur by correcting credit market imperfections that would otherwise prevent some productive investments from taking place, by lowering the tax rate, or by freeing other distortionary income redistribution mechanisms. The important point here is that it is redistribution of wealth, not of income, that may produce this favourable effect on economic efficiency and growth. In fact, income transfers that are not lump-sum would have exactly the opposite effect on growth. Thus, Bourguignon argues that rapidly reducing absolute poverty requires strong, country-specific combinations of growth and distribution policies. (The study also includes an interesting statistics according to which in Ethiopia, growth could have reduced the poverty headcount by some 31 per cent between 1981-95. Yet, because of changes in the income distribution that contributed to a 37 percent increase in poverty, the final effect has been a net increase in poverty of 6 per cent.)
Q1/b
Richard H. Adams, Jr. (2002) Economic Growth, Inequality and Poverty:
http://elibrary.worldbank.org/doi/pdf/10.1596/1813-9450-2972
Economic growth reduces poverty because first and foremost growth has little impact on income inequality. Income distributions do not generally change much over time. Analysis of the 50 countries and the 101 intervals included in the data set shows that income inequality
Q1/b

Formative Evaluation of NIAF II
53
Title Source Summary of Relevant Findings Evaluation Question(s) Addressed
Findings from a New Data Set
rises on average less than 1.0 percent per year. Moreover, econometric analysis shows that economic growth has no statistical effect on income distribution: inequality may rise, fall or remain steady with growth.
AFD (2005) Pro-Poor Growth in the 1990s Lessons and Insights from 14 Countries
http://siteresources.worldbank.org/INTPGI/Resources/342674-1119450037681/Pro-poor_growth_in_the_1990s.pdf
Evidence from the 14 countries in this study confirms that the pace of overall economic growth is the main factor that determines how quickly poverty declines. The incidence of poverty fell in the 11 countries that experienced significant growth during the period, and rose in the three countries that saw little or no growth (Zambia, Indonesia and Romania). On average, a 1 percent increase in GDP per capita for these countries reduced poverty by 1.7 percent during this period. A successful pro-poor growth strategy, thus, should have, at its core, measures to achieve sustained and rapid economic growth.
Q1/b
Link between infrastructure improvements (power, roads/railway) and economic growth César Calderón and Luis Servén (2008) Infrastructure and economic development in Sub-Saharan Africa
http://www.csae.ox.ac.uk/conferences/2008-EdiA/papers/141-Serv%C3%A9n.pdf
Calderón and Servén found robust evidence that infrastructure development – as measured by an increased volume of infrastructure stocks and an improved quality of infrastructure services – has a positive impact on long-run growth and a negative impact on income inequality.
Q1/b Q5
César Calderón (2009) "Infrastructure and growth in Africa," Policy Research Working Paper Series 4914, The World Bank
http://elibrary.worldbank.org/doi/pdf/10.1596/1813-9450-4914
Calderón found that that infrastructure stocks and service quality boost economic growth. The growth payoff of reaching the infrastructure development of the African leader (Mauritius) is 1.1 percent of GDP per year in North Africa and 2.3 percent in Sub-Saharan Africa, with most of the contribution coming from more, rather than better, infrastructure. Across Africa, infrastructure contributed 99 basis points to per capita economic growth, versus 68 points for other structural policies. Most of the contribution came from increases in stocks (89 basis points), versus quality improvements (10 basis points), with the largest payoffs deriving from telephone density, electricity-generating capacity, roadnetwork, length, and road quality. The findings are based on econometric estimates for a sample of 136 countries from 1960–2005, and the three key infrastructure sectors they covered were telecommunications, electricity, and roads.
Q1/b Q5
The Growth Report Strategies for Sustained Growth and Inclusive Development
https://openknowledge.worldbank.org/bitstream/handle/10986/6507/449860PUB0Box3101OFFICIAL0USE0ONLY1.pdf?sequence=1
According to this study, public investment in infrastructure accounts for 5–7 percent of GDP or more In Asia.
Q1/b
Alvaro Escribano, J. Luis Guasch and Jorge Pena (2010) “Assessing the Impact of Infrastructure Quality on Firm Productivity in Africa - Cross-Country Comparisons Based on InvestmentClimate Surveys
http://elibrary.worldbank.org/doi/pdf/10.1596/1813-9450-5191
Looking at 26 African countries, the study found that among countries in the high-income-growth block, infrastructure has a low impact on the total factor productivity (TFP) of manufacturing firms. Red, tape, corruption, and crime dominate over infrastructure in countries such as Mauritius, Egypt, and South Africa. Infrastructure quality has a high impact on TFP in the countries of the low-income-growth block, but the impact is very, identifying important bottlenecks for TFP growth. Poor-quality electricity provision, affects mainly poor countries, including Eritrea, Ethiopia, Mali, Senegal, Uganda, Zambia, and Kenya. It also affects countries that are growing faster, in relative terms, such as Botswana, Namibia, and Swaziland. Losses
Q1/b Q5

Formative Evaluation of NIAF II
54
Title Source Summary of Relevant Findings Evaluation Question(s) Addressed
from 1999 to 2005”, World Bank Policy Research Working Paper
from transport interruptions affect mainly slower-growing countries, including Madagascar, Kenya, Tanzania, and Senegal.
International Finance Corporation: Poverty Literature Review Summary: Infrastructure and Poverty Reduction
http://www.ifc.org/wps/wcm/connect/2d6e46004f4533e69ef7de032730e94e/Infrastructure-Poverty-Summary.docx?MOD=AJPERES
After reviewing relevant literature, they found evidence that: There are positive links between infrastructure investment and economic growth, though
there is debate on the amount and nature of infrastructure investment needed for growth that is sufficient to tackle poverty. Recent studies show that a 1% increase in stock of infrastructure (using public capital as proxy) lifts GDP by 0.08%, although this impact varies by country and region.
The impact of adding any infrastructure stock to growth is usually greater when the country is poorer.
Investments that have significant network effects will have more social benefits (by connecting markets). Specifically, investments in energy infrastructure or power provide most robust evidence in terms of social benefits.
In developing countries, transport investments such as roads and ports are shown to have a strong impact on growth.
Private participation in infrastructure (PPI) helps in efficiency gains which should eventually translate to gains for the users through reduction in user costs, and taxpayers through replacing other tax structures by increased revenues from the concessions. This provides a trickle-down effect through overall growth to poverty. These gains are more pronounced in small and medium infrastructure projects with private participation or in countries where public procurement is poorly organized leading to distortion in competition and markets. For projects large enough to influence the sector as a whole, the efficiency gains are an important link to growth.
While creating infrastructure stock is critical for growth, ensuring that this access is affordable is critical for poverty.
As infrastructure is a capital intensive industry, the direct employees employed per unit of investment is typically not high (though it is acknowledged that this largely depends on the construction technology chosen). However, depending on the boundaries drawn, employment effects can be large considering the indirect and induced jobs. Second order growth effects of removing access to infrastructure constraints are also high.
Q1/b Q4 Q5 Q6
UN HABITAT (2011) Infrastructure for Economic Development and Poverty Reduction in Africa
http://www.uncsd2012.org/content/documents/UN-HabitatReport.pdf
This is also a very good overview of the existing literature, with the following main conclusions relevant to this link: Over the last 30 years, infrastructure investments accelerated the annual growth
convergence rate by over 13 percent in Africa. The strongest impact comes from telecommunications, followed by roads and electricity
There is a positive long-run effect of infrastructure on output, productivity, or their growth rate.
There is increasing consensus on the notion that infrastructure generally matters for
Q1/b Q5

Formative Evaluation of NIAF II
55
Title Source Summary of Relevant Findings Evaluation Question(s) Addressed
growth and production costs, although its impact seems higher at lower levels of income Some evidence suggests that certain types of infrastructure service provision, such as
roads and transport, have a potential contribution to agricultural output, and that infrastructure improvements (in electricity supply, transport and telecommunications) in small towns contribute significantly to industrial growth and employment.
Roads Shenggen Fan and Connie Chan-Kang (2004) Road Development, Economic Growth and Poverty Reduction in China
http://www.ifpri.org/sites/default/files/publications/dsgdp12.pdf
The most significant finding of this study is that low quality (mostly rural) roads have benefit/cost ratios for national GDP that are about four times larger than the benefit/cost ratios for high quality roads. Even in terms of urban GDP, the benefit/cost ratios for low quality roads are much greater than those for high quality roads. In terms of poverty reduction, low quality roads raise far more rural and urban poor above the poverty line per yuan invested than do high quality roads.
Q1/b Q/6
Supee Teravaninthorn and Gaël Raballand (2009) Transport Prices and Costs in Africa - A Review of the International Corridors
https://openknowledge.worldbank.org/bitstream/handle/10986/6610/461810PUB0Box3101OFFICIAL0USE0ONLY1.pdf?sequence=1
The objective of the study is to examine, identify, and quantify the factors behind Africa’s high prices for road transport. It found that poor road conditions along the selected Sub-Saharan Africa corridors do not add much to the operating costs of trucks. The surveys and data simulations using the Highway Development and Maintenance Model (HDM-4), the standard model for analysing road investments, indicated a mixed result. In Central and West Africa, where traffic is low and the truck fleets are old, as long as international corridor routes are paved and in reasonable condition, further improvement of road conditions do not result in significant reduction of transport costs. However, in some East African corridors with higher traffic levels and newer fleets, improving road condition or increasing road capacity has a greater impact on reducing transport costs.
Q1/a Q5 Q6
AfDB Project and Program Evaluation Division (2011) Lesotho: Mpharane-Bela Road Upgrading - Project Performance Evaluation Report (PPER)
http://www.afdb.org/fileadmin/uploads/afdb/Documents/Evaluation-Reports/LESOTHO%20-%20PPER%20-%20Mpharane-Bela%20Bela%20Road%20Upgrading%20Project.pdf
The evaluation found that as a result of the project, travel times were reduced from about one hour to about half an hour. The road is now accessible all year around by all vehicle types, and estimations on Vehicle Operating Costs (VOC) show a reduction of about 40%. Nonetheless, the achievement of long term results i.e. promotion of economic growth and development, socio-economic development; poverty alleviation is not evident at this stage. This can be attributed to the fact that the road was only completed in 2005 and typically, the impact of rural roads takes some time to materialize.
Q1/a&b Q5
AfDB Project and Program Evaluation Division (2010) Benin: Project to Upgrade the Cotonou-Port Novo Road - Project Performance Evaluation Report (PPER)
http://www.afdb.org/fileadmin/uploads/afdb/Documents/Evaluation-Reports/Benin%20-%20PPER%20-%20Project%20to%20Upgrade%20the%20Cotonou-Porto%20Novo%20Road.pdf
The project had a considerable impact on improving traffic fluidity, reducing transport cost, improving road safety (even if more effort is required in this respect), improving partial cost recovery through the toll/weighing station aimed at enhancing the state of the network, improving trade, and stimulating economic activity and the competitiveness of Cotonou Port (PAC). It has also stimulated economic activity, especially along the trunk road.
Q1/a&b Q5

Formative Evaluation of NIAF II
56
Title Source Summary of Relevant Findings Evaluation Question(s) Addressed
World Bank (2011) Project Performance Assessment Report: United Republic of Tanzanian - Second Integrated Roads Project (Credit 2598-TA) and Central Transport Corridor Project; Repoblic of Uganda - Road Sector Institutional Support Technical Assistance Project (Credit 2987-UG), Roads Development Project Phase 1 (Credit 3267-UG)and Roads Development Project Phase 2 (Credit 3544 -UG)
http://ieg.worldbank.org/Data/reports/SECOND_INTEGRATED_ROADS_PROJECT_tanzania_62433.pdf
Taken as a whole, the physical road network improvements resulted in considerable time and cost savings for all road users, improved accessibility for public transport, and enabled people and goods to reach markets more quickly. The Tanzania railway component had problems, however and the concession ultimately failed due to the inability of Government and the concessionaire to work together effectively, after which the government reassumed responsibility.
Q1/a&b Q4 Q5
World Bank (2008) Project Performance Assessment Report: Roads Project (Cr. 3357-GE) and Transport Ministry Restructuring (Cr.3129-GE)
http://ieg.worldbank.org/Data/reports/PPAR-42904-P040556-Georgia_Roads_Transport.pdf
The overall outcome of the Roads Project is rated ‘Moderately Satisfactory’, because several of the institutional improvement components were only completed or finalized after credit closure under subsequent projects. The substantial rehabilitation work was carried out successfully and resulted in considerable vehicle operating cost savings and reduced driving time. A direct road user system was not introduced, but there was a real and very significant increase in the funds for road maintenance, and an evident improvement in general road network condition. In the Transport Ministry Restructuring Project the ministry was re-organized, new statutes were enacted, and staff numbers were reduced. Road transport companies were privatized and appropriate modal oversight agencies were established. However, the failure to link these achievements to measurable indicators of learning progress, which is critical in a Learning and Innovation Project, also led to a ‘Moderately Satisfactory’ rating.
Q1/a Q4 Q5
ADE (2004) Evaluation of the EC interventions in the transport sector in third countries
http://ec.europa.eu/europeaid/evaluation/methodology/examples/exp_gaa_gsu_flr_en.pdf
Although the reduction in transport costs has rarely been displayed as an operational objective of EC interventions in the transport sector, and thus were seldom measured, the evaluation found evidence that in Madagascar and Tanzania passenger fares had been reduced by more than half following rehabilitation of road infrastructure.
Q1/a
ADB (2000) Impact Evaluation Study of the Asian Development Bank Assistance to the Road Sector in Nepal
http://www.oecd.org/countries/nepal/35266282.pdf
As a result of the hill road project components of this project, transport costs were reduced and national integration has been improved. Bus fares and freight rates are lower for sealed roads than for earth and gravel roads, and traffic on the sealed roads has grown faster than the normal rate for Nepal. The movement of people by bus and taxi has grown particularly strongly. The road upgrading also stimulated a noticeable increase in the movement of food and consumer goods into the project areas by encouraging the growth of market centres at strategic points along the roads. In the east, an expansion in cash cropping and dairy production also has paralleled road development, but there is insufficient evidence to quantify the link between road upgrading and the agricultural change. In Far Western Region, the roads had no effect on agriculture. Employment opportunities have increased in both the east and
Q1/a&b Q5

Formative Evaluation of NIAF II
57
Title Source Summary of Relevant Findings Evaluation Question(s) Addressed
Far Western Region. The greater availability of consumer goods, greater mobility through faster and more frequent bus services, and enhanced employment has improved living conditions. Some positive impacts on disadvantaged groups, particularly women and those of lower caste, have also been noted. The improvement in employment and living conditions was greater in the east than Far Western Region due to the changes in agriculture.
ADB (2002) Technical Assistance Performance Audit Report on Institutional Strengthening and Policy Support to the Road Sector in Kazakhstan, Kyrgyz Republic and Mongolia
http://www.adb.org/sites/default/files/TE39.pdf
The programmes studied in this report had numerous objectives ranging from assisting in developing a legal framework for the road sector, building the capacity of line ministries, strengthen the financial and planning capabilities of the road departments and the privatized road construction companies, to improve road fund management. The most relevant findings for this study is that although improving road maintenance was a key objective of all three TAs, allocations for road maintenance have remained inadequate in all three. The primary reason for this failure is that Kazakhstan abolished the road fund, and in the Kyrgyz Republic and Mongolia, the road fund was not primarily used for maintenance.
Q1/a Q5 Q6
ADB (2001) Technical Assistance Performance Audit Report on Advisory Technical Assistance for Institutional Strengthening in Transport Planning and Administration in Cambodia and Vietnam
http://www.adb.org/sites/default/files/in181_01.pdf
Three key issues affected the TAs’ effectiveness. First, PMUs have rapidly proliferated in both countries. While they are justified from the viewpoint of efficient execution of aid projects, PMUs tend to have adverse impacts on the capacities of existing road planning and maintenance agencies by drawing away qualified personnel due to the substantial benefits and other incentives that they offer. Second, road maintenance is underfunded in both countries but severely so in Cambodia. Unless innovative ways of raising domestic resources are initiated to improve the financing of road maintenance, e.g., a fuel tax or increased vehicle registration fees, the weak capacities of the road maintenance agencies, such as VRA, will not be fundamentally improved. Third, bilateral and multilateral aid funding is a major source of investment in the road sector in both countries and, in Cambodia, almost the only source. Aid coordination, including a concerted and focused strategy, is crucial in terms of working with the governments to carry out institutional and policy reforms necessary to achieve better management of the transport sector.
Q1/a Q5 Q6
ADB (2002) Technical Assistance Performance Audit Report on Road Sector Management in Lao People’s Democratic Republic, Papua New Guinea and Philippines
http://www.adb.org/sites/default/files/tpa_reg_200219.pdf
Lao PDR: The privatization momentum initiated in the Lao PDR has been sustained, even though lack of credit remains a constraint for the privatized activities, including contractors, passenger and freight operators, and design companies. Procurement procedures developed under the Lao PDR TA are followed in practice to a large degree. PNG: Although there is considerable client ownership, the sustainability of the TA is assessed less likely because of difficulties in maintaining the RAMS database. Some provincial governments were also reluctant to sign the memorandum of understanding concerning the application of RMSA database. The key issues that have affected the four TAs but were not directly related to their purpose are (i) complex bureaucratic structures and decision making, and a geography prone to natural disasters; (ii) governance issues; (iii) lack of credit facilities for equipment and materials; and (iv) inadequate funding for the road sector in general. In addition, the Philippine and PNG governments have experienced difficulties in retaining qualified engineers, particularly in the provinces, due to low salaries in comparison with the private sector.
Q1/a Q4 Q6

Formative Evaluation of NIAF II
58
Title Source Summary of Relevant Findings Evaluation Question(s) Addressed
World Bank (2008) Project Performance Assessment Report: Belize – Roads and Municipal Drainage Project (LOAN 4575-BEL)
http://ieg.worldbank.org/Data/reports/PPAR-44249-P040150-Belize_Roads_Drainage.pdf
The overall outcome of the Roads and Municipal Drainage Project is moderately unsatisfactory. The following lessons are derived from the project: (i) inadequate attention to local institutions and their governance arrangements may jeopardize achievement of urban development objectives. While it is tempting to think of infrastructure projects as being focused on engineering, the reality in Belize is that little of the infrastructure will be able to function because sound institutions and good governance are weak or absent; (ii) technical assistance in the form of strategies and plans for infrastructure investment may be ineffectual in the absence of government ownership and a defined medium-term fiscal framework within which to situate them. As this framework was missing in Belize the technical assistance was effectively wasted; (iii) simple engineering solutions can deliver substantial development impacts even when there are adverse institutional and political circumstances.
Q1/a Q5 Q6
World Bank (1997) Brazil - Secondary and Feeder Roads Project and the Second Feeder Roads Project
http://lnweb90.worldbank.org/oed/oeddoclib.nsf/DocUNIDViewForJavaSearch/29D2F30DAC89992D852567F5005D5330?OpenDocument
This evaluation examines the impact of feeder roads some 10-15 years after completion of the two projects. It focuses on a sample of 20 of the 63 roads financed by the two projects in the State of Bahia and assesses the economic, social, and environmental impacts. The study found that the improved roads helped expand production of coffee, cocoa, and dairy, especially in the early 1980s when the road works had just been completed. The improved roads also appear to have been an important contributing factor in the regions' diversification strategies.
Q1/b Q5
ADB (1997) Impact Evaluation Study of Bank Operations in the Road Sector in the Philippines
http://www.adb.org/sites/default/files/IE-50.pdf
The traffic volumes were found to be generally less than the levels projected at appraisal for most of the roads examined in the study. Neither was there evidence to suggest that the increase in traffic was directly related to increase in agricultural outputs. This is because increased accessibility was more evident in a rise in per person trips than in goods or commodity trips. At the same time, Bank road projects have generated social benefits to the people in the road influence areas in terms of improved access to health facilities, educational opportunities, and convenience of traveling.
Q1/b Q5
Rails Matt Lowe (2014) Rail Revival in Africa? The Impact of Privatization (IMF and DFID)
http://www.imf.org/external/np/seminars/eng/2014/lic/pdf/Lowe.pdf
The study found that privatization has a positive, significant and localized impact on economic activity, proxied by light density measured by satellites, and that thus effect looks to have increased over time.
Q1/b Q5
Power World Bank (2005) Power Sector Reform in Africa: Assessing Impact on Poor People
http://siteresources.worldbank.org/EXTAFRREGTOPENERGY/Resources/ESMAP_PowerSectorReform_in_Africa.pdf
It looked at power sector reform in six African countries- Ghana, Mali, Namibia, South Africa, Tanzania, and Uganda – and found some evidence to the establishment of new businesses that were the results of more reliable electricity services.
Q1/b Q5
Urban transport Weiping Wu (2010) “Urban Infrastructure financing and economic performance in
http://www.s4.brown.edu/china2012/Papers/UrbanGeography-
An econometric analysis of prefecture-level cities in China found that infrastructure investment is a statistically significant predictor of urban economic development.
Q1/b Q5

Formative Evaluation of NIAF II
59
Title Source Summary of Relevant Findings Evaluation Question(s) Addressed
China”, Urban Geography
InfrastructureFinancing.pdf
Prud’homme, Remy and Chang-Woon Lee (1998) Size, Sprawl, Speed, and the Efficiency of Cities
http://www.rprudhomme.com/resources/Prud$27homme%2B$26%2BLee%2B1999.pdf
The study found that urban policies and transport policies play a significant and measurable role in determining the efficiency of an agglomeration. Containing sprawl, and improving transportation speed in a city both increase the productivity and therefore the output of the city. The authors suggest that increasing speed in a city by 10% increases productivity by 2.9%.
Q1/b Q5
Wendell Cox (2007) Urban Transport and Economic Growth
http://www.publicpurpose.com/db-idb-prod.pdf
When traffic congestion slows personal travel, it also slows the movement of goods. This can slow the rate of economic growth and as a result can slow the alleviation of poverty Econometric analysis of data from the 99 urban areas indicates that average gross product per capita is strongly related to at least two factors --- (1) the extent of economic freedom, and (2) the amount of travel. There is also strong historic relationship between personal transport improvements and economic growth and between a higher number of daily motorized trips per capital and economic output. Thus, the research indicates that the efficiency of urban economies is improved as travel speeds are improved and mobility maximized, whether for people or freight.
Q1/b Q5
Colin Gannon and Zhi Liu (1997) Poverty and Transport
http://siteresources.worldbank.org/INTURBANTRANSPORT/Resources/twu-30.pdf
Because transport cost is a key determinant of locations of urban activities, transport improvements can expand the location choices of both firms and households. In particular, transport improvement can help improve the competitiveness of small firms and can facilitate the entry of new firms into a market. Transport improvement also increases the efficiency of operation of the labor market and labor participation rates. The combination of these factors increases urban productivity and urban household incomes.
Q1/b Q5
ADB and World Bank (2012) Cities at a Crossroads: Unlocking the Potential of Green Urban Transport
http://www-wds.worldbank.org/external/default/WDSContentServer/WDSP/IB/2012/10/23/000333038_20121023052259/Rendered/PDF/733330WP0P13130igh0resolution0final.pdf
Chronic traffic congestion is estimated to cost the equivalent of 3 percent of GDP in cities in the Republic of Korea.
Q1/b Q5
Adam Storeygard (2012) Farther on down the road: transport costs, trade and urban growth in sub-Saharan Africa
file:///C:/Users/32004/Downloads/FartherOnDownTheRoadTransportCost_preview.pdf
This paper provides evidence that transport costs impact urban economic activity in sub-Saharan Africa, by making access to critical core cities more expensive, with recent increases in oil prices removing several percentage points from the size of far hinterland cities in countries where the largest city is on the coast.
Q1/b Q5
Robert Cervero (2009) Urban Development on Railway‐Served Land: Lessons and Opportunities for the Developing World
http://www.its.berkeley.edu/publications/UCB/2009/VWP/UCB-ITS-VWP-2009-13.pdf
Transit investments can powerfully shape cities and regions, including through the redistribution of economic development into specific corridors or nodes, which in congested urban areas can result in net economic growth. This growth is often regarded as a positive in terms of urban development, in that it confers formal-sector employment growth and, with the right regulatory framework, increased revenues for urban administrations.
Q1/b Q5

Formative Evaluation of NIAF II
60
Title Source Summary of Relevant Findings Evaluation Question(s) Addressed
The study also found evidence on strong positive association of rail investments and services on economic performance, though it likely reflects the dominance of European cities in the UITP database used for this study (46 of the 52 observations).
Link between infrastructure improvements (power, roads, rails and urban transport) and poverty reduction Adam Brenneman and Michel Kerf (2002) Infrastructure and Poverty Linkages: A Literature Review
http://www.ilo.org/wcmsp5/groups/public/---ed_emp/---emp_policy/---invest/documents/publication/wcms_asist_8281.pdf
This paper provides a comprehensively review on the evidence on the links between energy and transport (as well as telecom and WASH), and poverty reduction. It found that increased access to energy and transport services significantly increases the productivity of businesses and the employment opportunities of the poor. There is also a strong link (though slightly weaker) between improved energy and transportation services, and increased access to education and health.
Q1/b Q5
Christopher Willoughby (2004) Infrastructure and the Millennium Development Goals
http://www.oecd.org/dac/povertyreduction/36567911.pdf
Reviewing empirical research from the last thirty years, Willaughby found that improvement in transportation infrastructure can make a large contribution to the MDGs through the following mechanisms: Improvements to low-volume local roads and associated networks of village tracks/paths
can significantly reduce poor farmers’ transaction costs and expand their production possibilities (incl. non-farm) (MDG 1)
Availability of competitive transport services on adequately maintained trunk network is critical to the effective participation in national and international markets (MDG 1) and international trade opportunities (MDG 8)
Transportation infrastructure can make a moderate contribution to the MDGs through the following mechanisms: Village roads significantly affect school enrolment and attendance (MDG 2) Girls’ attendance significantly increased by safer roads (MDG 3) Vaccines/drugs supply, visits by more skilled health personnel and emergency
evacuations (MDG 4) Modern energy can make a large contribution to the MDGs through the following mechanisms: Rural electrification often correlates with sharp increase in regional incomes and growth of
non-farm activity. Reliability of modern energy supply strongly affects investment in, and competitiveness of, local enterprises (MDG 1)
Modern energy can make a moderate contribution to the MDGs through the following mechanisms: Modern energy helps families release girls for school: less time collecting fuel-wood and water, and schools improved (MDG 3) Sharply reduces indoor smoke pollution & impurities in water/food consumed, the two major mortality factors (MDG 4) Reduces pressure on land resources (by moving water and reducing fuel-wood need), but care needed to avoid ill-effects of large dams (MDG 7)
Q1/b Q5 Q6
Cynthia C. Cook, Tyrrell http://www.adb.org/sites/de Their main findings – which are underpinned by solid empirical evidence from India, Thailand Q1/b

Formative Evaluation of NIAF II
61
Title Source Summary of Relevant Findings Evaluation Question(s) Addressed
Duncan, Somachai Jitsuchon, Anil Sharma, Wu Guoboa (2005) Accessing the Impact of Transport and Energy on Poverty Reduction, ADB
fault/files/pub/2005/assessing-transport-energy.pdf
and the PRC – are: The poor could see the benefits of reduced transport costs reflected in the price of their
products and of the goods purchase, as well as in the increased presence of traders and other service providers in their communities.
Poor and non-poor people share equally in the benefits of improves access to health care and educations services, increased safety and security, and access to information. Health and education levels are likely to rise as the result of transport and energy improvements, with a long-term feedback effect on poverty
Improvements in transport and energy services are more likely to bring immediate economic benefits to poor households near the poverty line. In the short run, they less likely to benefit the poorest of the poor
Transport improvements have the biggest improvements on the poor, mainly through increased employment opportunities in the non-farming sector
Energy improvements also have an impact on incomes, but in the short run, they are less likely to benefit the poor
The time-saving benefits of energy and transport improvements have a great importance for the poor, implicitly valued at much more than their opportunity cost of labour
Benefits from energy and transport improvements are not automatic, they depend on the quality of services provided and their responsiveness to the needs of the poor
Improvements in energy and transport services may produce net negative welfare effects on poorest of the poor in remote rural areas, as their livelihoods are dependent on activities such as headloading or charcoal production, which may be directly or indirectly displaced by these improvements. They are also less likely to withstand the increased market competition resulting from these improvements
Q5
UN HABITAT (2011) Infrastructure for Economic Development and Poverty Reduction in Africa
http://www.uncsd2012.org/content/documents/UN-HabitatReport.pdf
This is also a very good overview of the existing literature, with the following main conclusions relevant to this link: There is less evidence to support a positive impact on poverty than on economic growth.
The general consensus seems to be that infrastructure development can play a role in poverty reduction, but the relationship is not linear and it has to happen under the right conditions and supported by factors such as improvement in social infrastructure.
Overall, evidence suggests that non-poor households seem to benefit more from public infrastructure investments than poor households. The two main reasons for this is non-availability of services and affordability problems
Q1/b Q5
Power World Bank (2005) Power Sector Reform in Africa: Assessing Impact on Poor People
http://siteresources.worldbank.org/EXTAFRREGTOPENERGY/Resources/ESMAP_PowerSectorReform_in_Africa.pdf
The study looked at power sector reform in six African countries- Ghana, Mali, Namibia, South Africa, Tanzania, and Uganda – and found the following relevant to this link: While access increased, the per capita rates of electricity use have declined in many
countries, indicating that poverty continues to limit the use of electricity services and many poor households continue using other fuels, such as kerosene, wood, or charcoal.
Q1/b Q5

Formative Evaluation of NIAF II
62
Title Source Summary of Relevant Findings Evaluation Question(s) Addressed
Power sector reform is typically associated with price increases aimed at making the utility more financially sound. And indeed, most reform programmes examined here (except Namibia), have included measures to increase tariffs to cost-reflective and commercially profitable levels. This, on the one hand, negatively affects the poor and has to be balanced by the adaption of subsidies, which are not always benefit the poorest of the poorest. On the other end, it also has the potential to create revenue that utilities can use to develop and expand electricity networks that would benefit the poor.
Urban transport World Bank (2002) “Urban Transport and Poverty Reduction”, Chapter 3 from Cities on the Move: A World Bank Urban Transport Strategy Review
http://siteresources.worldbank.org/INTURBANTRANSPORT/Resources/Chapter3.pdf
Main relevant findings: Reforms aimed at improving economic efficiency in urban transport may sometimes have
the immediate effect of reducing employment of the poor or the relatively poor. Constraints on the development or behavior of the informal transport sector may take away the only source of livelihood for some of the very poor. Rail reform has also often been associated with substantial severance of redundant staff, as has occurred in Buenos Aires.
High transport cost is then a symptom of their poverty rather than its fundamental cause. Hence transport policies that improve the general economic viability of the city are very important to poor people. For example, the lot of poor people in Cairo, Egypt, has been improved more through relocation of their residences in order to improve their access to transport links, which are not primarily designed for poverty alleviation, than through poverty-targeted transport investments.
The poverty impact of investment in mass rapid transit (MRT) has been very controversial. It may improve quality of the transport that poor people receive and give them a wider choice of household location, employment, and lifestyle. It can increase their incomes indirectly through its effect on the efficiency of the urban system. But it may concurrently increase the fares that they must pay.
Metros may incidentally serve low-income areas, as in Cairo, but have rarely been designed specifically for that purpose. Even where they are designed to serve low-income areas, the operations of the land market mechanism may result in the benefits passing on to others. Insofar as a metro reduces travel time to central areas of the city, it will tend to increase city-center land values and hence land rents at the newly advantaged locations.
Q1/b Q5
Colin Gannon and Zhi Liu (1997) Poverty and Transport
http://siteresources.worldbank.org/INTURBANTRANSPORT/Resources/twu-30.pdf
The paper argues that urban poor accessibility needs are often overlooked due to the contemporary positioning of transport planning, in which economic efficiency is widely accepted as the primary objective, without sufficient consideration for poverty reduction. This prioritization of economic efficiency results in a bias against the poor through transport planning that is oriented away from projects serving poorer areas [and/or away from] alternatives that service more lower-income individuals than higher-income individuals, as well as a lack of consideration of the spatial impacts that expanded systems may have on the urban poor.
Q1/b Q5
Carlos Felipe Pardo (2012) http://www.un.org/esa/dsd/ Key findings of the study: Q1/b

Formative Evaluation of NIAF II
63
Title Source Summary of Relevant Findings Evaluation Question(s) Addressed
“Chapter 4 – Sustainable urban transport”, Shanghai Manual – A Guide for Sustainable Urban Development in the 21st Century
susdevtopics/sdt_pdfs/shanghaimanual/Chapter%204%20-%20Sustainable%20urban%20transport.pdf
There are many more trips being taken by individuals with higher income than by those of lower income, mostly because low-income groups do not have the capacity (in time or money) to travel more. This weighs heavily on their capacity to access jobs, education, health and all other services that a city can provide, reducing their participation in society as a whole.
There is much less accessibility for lower-income groups (and vulnerable groups in general) due to high/inequitable transport fares, lack of public transport provision to areas where low-income populations live, and lack of safe and high quality infrastructure for these users (including sidewalks, which are often neglected in favour of roads).
There is much less accessibility for lower-income groups (and vulnerable groups in general) due to high/inequitable transport fares, lack of public transport provision to areas where low-income populations live, and lack of safe and high quality infrastructure for these users (including sidewalks, which are often neglected in favour of roads).
Negative impacts from unsustainable transport systems affect the poor disproportionately.
Q5 Q6
GiZ (2002) Urban Transport and Poverty in Developing Countries - Analysis and Options for Transport Policy and Planning
http://www.gtkp.com/assets/uploads/20091127-182046-6236-en-urban-transport-and-poverty.pdf
Transport management in the metropolises is already facing considerable problems owing to non-sustainable transport structures, high local levels of air pollution, noise, traffic jams even outside the peak traffic times as well as decreasing safety levels for non-motorised road-users. In some cities, the external costs of transport have been estimated at more than 10 percent of the urban gross domestic product (e.g. Bangkok); this share is spent year for year on municipal welfare measures. These problems have a particular impact on the poor who rely heavily on non-motorised means of transport and are therefore particularly vulnerable to road accidents. Further disadvantages arise from insufficient or lacking connections of poor settlements to public transport, considerable health hazards owing to settlements being built along roads or on the periphery of urban districts causing high levels of environ-mental pollution and, partly, high individual costs arising from transport expenditures. In the cities of many developing countries, poor families sometimes spend up to 20 per-cent of their income on transport, while the average family does not even require half that sum for its mobility needs. Moreover, lacking or low mobility among the poor reduces their prospects of earning income and access to education and health care. This stifles attempts to attain better living standards, which is why improving urban mobility represents an important step in combating poverty. The report also points out that in the literature the assumption prevails that a trickle-down effect develops, with urban economic growth which has been boosted by a suitable transport infrastructure resulting in new jobs and, ultimately, unqualified “poor” employees finding new sources of income, especially in the service sector. Yet, the authors argue that results over the last 20 years show that, except for cases in a few Southeast Asian take-off countries, the effect has so far hardly occurred. There are various reasons for this: An improved transport infrastructure is a necessary but by no means sufficient condition
for increased economic productivity in the city.
Q1/b Q5 Q6
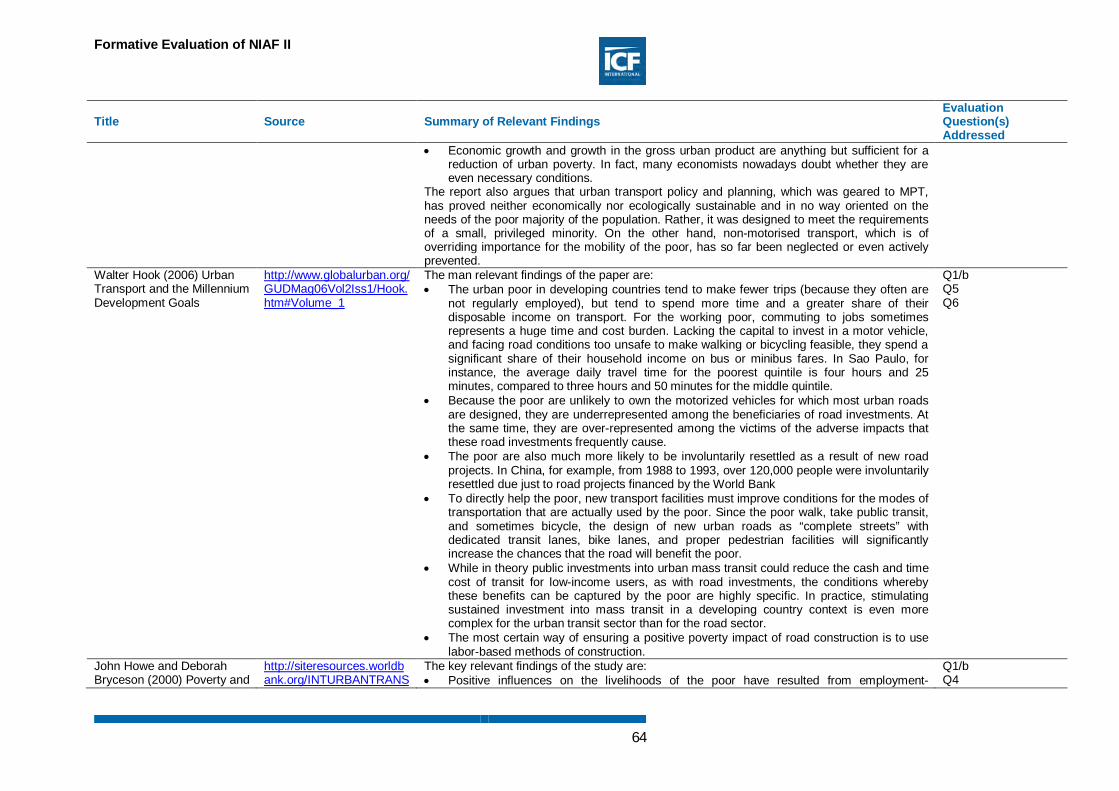
Formative Evaluation of NIAF II
64
Title Source Summary of Relevant Findings Evaluation Question(s) Addressed
Economic growth and growth in the gross urban product are anything but sufficient for a reduction of urban poverty. In fact, many economists nowadays doubt whether they are even necessary conditions.
The report also argues that urban transport policy and planning, which was geared to MPT, has proved neither economically nor ecologically sustainable and in no way oriented on the needs of the poor majority of the population. Rather, it was designed to meet the requirements of a small, privileged minority. On the other hand, non-motorised transport, which is of overriding importance for the mobility of the poor, has so far been neglected or even actively prevented.
Walter Hook (2006) Urban Transport and the Millennium Development Goals
http://www.globalurban.org/GUDMag06Vol2Iss1/Hook.htm#Volume_1
The man relevant findings of the paper are: The urban poor in developing countries tend to make fewer trips (because they often are
not regularly employed), but tend to spend more time and a greater share of their disposable income on transport. For the working poor, commuting to jobs sometimes represents a huge time and cost burden. Lacking the capital to invest in a motor vehicle, and facing road conditions too unsafe to make walking or bicycling feasible, they spend a significant share of their household income on bus or minibus fares. In Sao Paulo, for instance, the average daily travel time for the poorest quintile is four hours and 25 minutes, compared to three hours and 50 minutes for the middle quintile.
Because the poor are unlikely to own the motorized vehicles for which most urban roads are designed, they are underrepresented among the beneficiaries of road investments. At the same time, they are over-represented among the victims of the adverse impacts that these road investments frequently cause.
The poor are also much more likely to be involuntarily resettled as a result of new road projects. In China, for example, from 1988 to 1993, over 120,000 people were involuntarily resettled due just to road projects financed by the World Bank
To directly help the poor, new transport facilities must improve conditions for the modes of transportation that are actually used by the poor. Since the poor walk, take public transit, and sometimes bicycle, the design of new urban roads as “complete streets” with dedicated transit lanes, bike lanes, and proper pedestrian facilities will significantly increase the chances that the road will benefit the poor.
While in theory public investments into urban mass transit could reduce the cash and time cost of transit for low-income users, as with road investments, the conditions whereby these benefits can be captured by the poor are highly specific. In practice, stimulating sustained investment into mass transit in a developing country context is even more complex for the urban transit sector than for the road sector.
The most certain way of ensuring a positive poverty impact of road construction is to use labor-based methods of construction.
Q1/b Q5 Q6
John Howe and Deborah Bryceson (2000) Poverty and
http://siteresources.worldbank.org/INTURBANTRANS
The key relevant findings of the study are: Positive influences on the livelihoods of the poor have resulted from employment-
Q1/b Q4

Formative Evaluation of NIAF II
65
Title Source Summary of Relevant Findings Evaluation Question(s) Addressed
Urban Transport in East Africa: Review of Research and Dutch Donor Experience
PORT/Resources/poverty&ut_eafrica.pdf
intensive, settlement infrastructure upgrading schemes; the privatization of bus passenger services which has generated unskilled employment opportunities; and the new services provided by non-motorized goods vehicles.
In the cities under review, walking, flowed by public transport and cycling were the dominant modes of transport. Presently, for safety reasons, the potential of cycling can only be fulfilled in the secondary cities. The evidence is emphatic - unsafe conditions are the most important single cause of reduction in cycling as a mode of transport. Anecdotal evidence also supports the contention that it is a significant restraint on walking, especially for schoolchildren and women.
All of the modes used by the poor - walking, cycling and public transport – are inadequately provided for. This raises their cost of transport, estimated to be as high as 30 per cent of household income for those in the most remote suburbs. High transport costs reduces the poor’s access to basic needs and erodes the monetary returns and efficiency of their economic activities. It also raises the total cost of urban transport thereby reducing municipal and national economic efficiency.
The most promising interventions have been directed at improving the transport infrastructure in informal settlements, and the SSATP pilot interventions to increase the mobility of low-income inhabitants, both of which have clearly identifiable benefits for the poor.
Road and footpath improvement can be successfully embedded in a diverse program of employment-intensive works.
Improved mobility and facilitation of solid waste collection were immediate effects in the case of Dar es Salaam’s Hanna Nassif program. Short-term employment creation was a significant poverty-alleviating benefit while longer-term skill creation and materials provisioning provided forward and backward linkages.
Q5 Q6
Madhav G. Badami, Geetam Tiwari and Dinesh Mohan (2004) Access and Mobility for the Urban Poor in India – Bidfing the Gap between Policy and Needs
http://www.wilsoncenter.org/sites/default/files/badami.doc
Although low income groups and the poor benefit the least from motor vehicle activity, and contribute the least to environmental pollution, road accidents and other impacts, they are the most exposed to, affected by, and least capable of coping with its impacts. As motor vehicle activity increases and as transport infrastructure increasingly caters for personal motorized vehicles, walking, cycling and public transit, the travel modes that the poor rely on and have access to, are adversely affected. These effects are exacerbated by the fact that many low income people have been forced to live in the urban periphery, in areas poorly served by public transit, which, even in the best circumstances is unreliable, inconvenient and time-consuming. This effect is further aggravated by sprawl.
Q1/b Q5
Link between privatisation and PPPs, and economic growth Power Galal, A., L. Jones, P. tendon, and I. Vogelsang (1994) , Welfare
http://www-wds.worldbank.org/external/default/WDSContentServe
This study looked at the welfare consequences of divestiture across a variety of sectors in Chile, Malaysia, Mexico, and the United Kingdom. They focus on four stakeholder groups: the owners of the enterprises, the consumers, the workers, and the competitors. The study found
Q1/a&b Q4 Q5

Formative Evaluation of NIAF II
66
Title Source Summary of Relevant Findings Evaluation Question(s) Addressed
Consequences of Selling Public Enterprises: An Empirical Analysis
r/WDSP/IB/1994/08/01/000009265_3970128114637/Rendered/PDF/multi_page.pdf
that the net welfare consequences of privatization are almost invariably positive overall. However, the picture in respect of consumers was ambiguous. In about half of the cases consumer welfare improves, and in the other half it deteriorates. The authors attributed the negative impacts primarily to prices being raised to efficient cost-recovery levels.
Q6
Yin-Fang Zhang, David Parker and Colin Kirkpatrick (2008) Electricity Sector Reform in Developing Countries: An Econometric Assessment of the Effects of Privatisation, Competition and Regulation
https://dspace.lib.cranfield.ac.uk/bitstream/1826/4101/1/Electricity_sector_reform_in_developing_countries.pdf
The main conclusions of this study are that on their own privatisation and regulation do not lead to obvious gains in economic performance, though there are some positive interaction effects. By contrast, introducing competition does seem to be effective in stimulating performance improvements. The study was based on the econometric assessment of the effects of privatisation, competition and regulation on the performance of the electricity generation industry using panel data for 36 developing and transitional countries, over the period 1985 to 2003.
Q1/a&b Q4 Q5 Q6
R. W. Bacon and J. Besant-Jones (2002) Global Electric Power Reform, Privatization and Liberalization of the Electric Power Industry in Developing Countries
http://www-wds.worldbank.org/external/default/WDSContentServer/WDSP/IB/2004/03/25/000090341_20040325153106/Rendered/PDF/280850Global0electric0power0EMS0no.02.pdf
Among other things, the paper looked at evidence from the privatisation of distribution companies in Peru, Argentina and Chile, and found that companies showed substantial improvements in performance following the privatisation.
Q1/a&b Q4 Q5
Toshiyuki Katagiri and Yumi Ito, The Effects of Private Sector Participation and Privatization in the electric power sector and the Modality of ODA Loans (External evaluation)
http://www.jica.go.jp/english/our_work/evaluation/oda_loan/post/2007/pdf/te04.pdf
The evaluation found that In the Philippines, the electricity supply has become stable through the boost in transmission capacity, and project effects increased after private sector participation and privatization. Effects of the projects were highly satisfactory in both public and private aspects. In Azerbaijan, the reforms were still in an early stage, so the evaluation couldn’t draw any meaningful conclusion.
Q1/a&b Q4 Q5
World Bank (2005) Power Sector Reform in Africa: Assessing Impact on Poor People
http://siteresources.worldbank.org/EXTAFRREGTOPENERGY/Resources/ESMAP_PowerSectorReform_in_Africa.pdf
The study looked at power sector reform in six African countries- Ghana, Mali, Namibia, South Africa, Tanzania, and Uganda – and found the following relevant to this link: In most of the case study countries, access to electricity has increased significantly.
However, this cannot be definitively attributed to reform initiatives. Instead, it appears to be a result of government policies, programs, and subsidies.
While access increased, the per capita rates of electricity use have declined in many countries, indicating that poverty continues to limit.
Among the case study countries, the quality and reliability of electricity supplied to poor people varies, largely in proportion to the level of private sector involvement. In Mali and Uganda, private investment has been followed by significant improvements in the quality of electricity supply. In contrast, in Ghana and South Africa, where the industry has not yet been restructured and remains almost entirely state-owned, quality still varies regionally.
Q1/a&b Q4 Q5 Q6

Formative Evaluation of NIAF II
67
Title Source Summary of Relevant Findings Evaluation Question(s) Addressed
Ioannis N. Kessides (2012) Electricity Reforms - What Some Countries Did Right and Others Can Do Better (World Bank)
http://siteresources.worldbank.org/EXTFINANCIALSECTOR/Resources/282884-1303327122200/VP332-Electricity-Reforms.pdf
It draws some conclusions from the literature review of cross-country econometric estimation of the effects of electricity reforms. These are: Efficiency gains (higher labour productivity, higher capacity utilization, lower system
losses) from privatization are modest, unstable, and contingent on regulatory efficacy, especially in the absence of competition.
Private sector participation is beneficial only when coupled with an independent regulator. Independent regulation without privatization (in effect, regulation of state-owned utilities) seems to be equally ineffective.
There is strong evidence that introducing competition leads to significant improvements in performance. Part of the efficiency gains may be passed on to consumers, with prices falling for some classes of electricity users. But liberalization does not always lead to lower retail electricity prices. In many developing countries regulated prices were inefficiently low, and in these countries liberalization should lead to higher prices and better incentives.
Q1/a&b Q4 Q5 Q6
Rails World Bank (2005) Tanzania - Secod Port Modernization and Railway Restructuring Projects
http://ieg.worldbank.org/Data/reports/ppar_32659.pdf
The audit confirmed the following lessons. The freedom to operate according to market principles potentially makes the operational efficiency of privately run concessions superior to that of parastatal organizations for ports and railways. Thus, the concentration of investment with high volumes of traffic, lower operational costs, and relative autonomy from government generally makes port concessions a relatively low risk for investors. Yet, if railways are likely to incur losses, and/or are inadequately compensated for uneconomic services, investors will be hard to come, and therefore bidding conditions, and the terms of the concession agreement will need to take this fact into account. The design of projects preparing parastatal companies for privatization should also consider the capacity, and commitment of government, and management to carry through the reform process.
Q1/a&b Q4 Q5 Q6
World Bank (2003) Cote d'Ivoire: Railway Rehabilitation Project
http://ieg.worldbank.org/Data/reports/railway_rehab_ppar.pdf
The privatisation of the Ivorian rail service was the first in in Sub-Saharan African, and one of the early experiences anywhere in the developing world. The concessionaire improved the railways’ performance in the areas of freight traffic, finances and operational performance. At the same time, passenger traffic continued to decline due to increasing competition from international (Burkina and Mali) and domestic bus services, coupled with a reduction in the railway services offered, including reduction in the number of trains and the closure of passenger stations.
Q1/a&b Q4 Q5
Richard Bullock (2005) Results of Railway Privatization in Africa
http://siteresources.worldbank.org/INTTRANSPORT/Resources/336291-1227561426235/5611053-1229359963828/tp-8_africa_rail_concessions_web.pdf
Looking at rail concessions in Africa that have run for more than five years, the study found that: Productive efficiency has clearly improved. Allocative efficiency, generally, also improved. Most African concessions have been associated with substantial investments, principally
in infrastructure, by bilateral and multilateral lending agencies. It is not clear if such investment is sustainable without donor support. The evidence to date is few, and suggest that although most concessions pay substantial concession fees into general government
Q1/a&b Q4 Q5
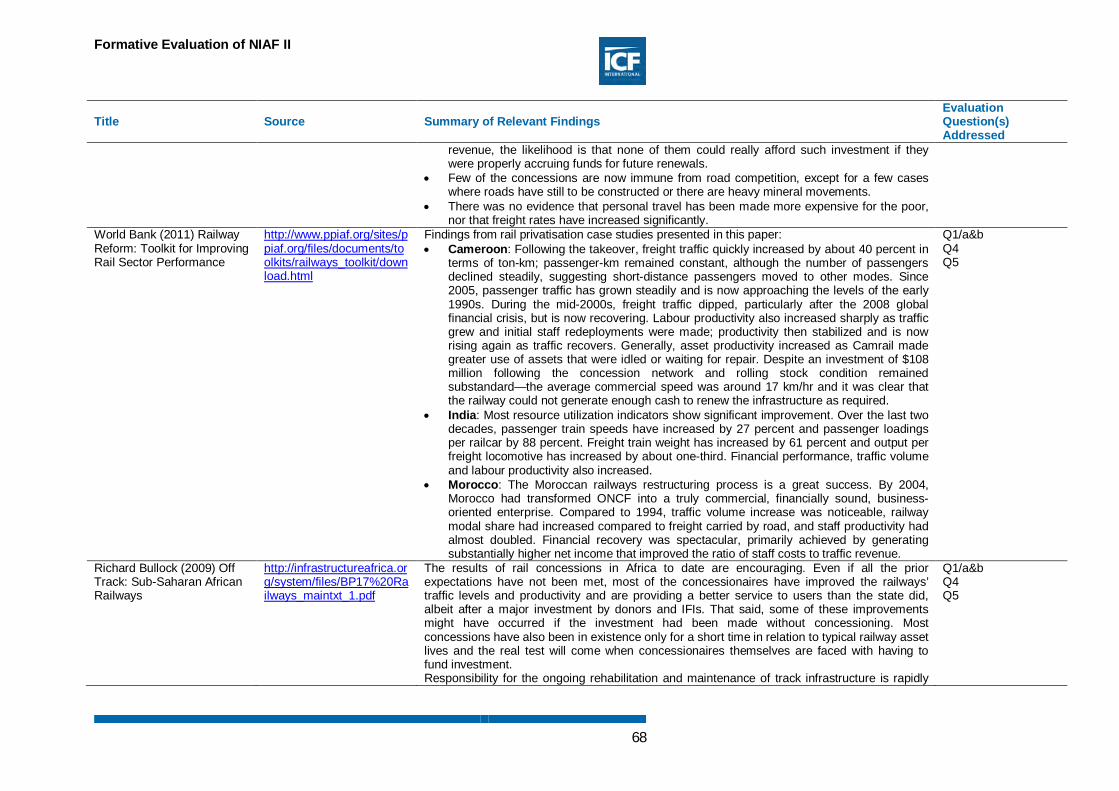
Formative Evaluation of NIAF II
68
Title Source Summary of Relevant Findings Evaluation Question(s) Addressed
revenue, the likelihood is that none of them could really afford such investment if they were properly accruing funds for future renewals.
Few of the concessions are now immune from road competition, except for a few cases where roads have still to be constructed or there are heavy mineral movements.
There was no evidence that personal travel has been made more expensive for the poor, nor that freight rates have increased significantly.
World Bank (2011) Railway Reform: Toolkit for Improving Rail Sector Performance
http://www.ppiaf.org/sites/ppiaf.org/files/documents/toolkits/railways_toolkit/download.html
Findings from rail privatisation case studies presented in this paper: Cameroon: Following the takeover, freight traffic quickly increased by about 40 percent in
terms of ton-km; passenger-km remained constant, although the number of passengers declined steadily, suggesting short-distance passengers moved to other modes. Since 2005, passenger traffic has grown steadily and is now approaching the levels of the early 1990s. During the mid-2000s, freight traffic dipped, particularly after the 2008 global financial crisis, but is now recovering. Labour productivity also increased sharply as traffic grew and initial staff redeployments were made; productivity then stabilized and is now rising again as traffic recovers. Generally, asset productivity increased as Camrail made greater use of assets that were idled or waiting for repair. Despite an investment of $108 million following the concession network and rolling stock condition remained substandard—the average commercial speed was around 17 km/hr and it was clear that the railway could not generate enough cash to renew the infrastructure as required.
India: Most resource utilization indicators show significant improvement. Over the last two decades, passenger train speeds have increased by 27 percent and passenger loadings per railcar by 88 percent. Freight train weight has increased by 61 percent and output per freight locomotive has increased by about one-third. Financial performance, traffic volume and labour productivity also increased.
Morocco: The Moroccan railways restructuring process is a great success. By 2004, Morocco had transformed ONCF into a truly commercial, financially sound, business-oriented enterprise. Compared to 1994, traffic volume increase was noticeable, railway modal share had increased compared to freight carried by road, and staff productivity had almost doubled. Financial recovery was spectacular, primarily achieved by generating substantially higher net income that improved the ratio of staff costs to traffic revenue.
Q1/a&b Q4 Q5
Richard Bullock (2009) Off Track: Sub-Saharan African Railways
http://infrastructureafrica.org/system/files/BP17%20Railways_maintxt_1.pdf
The results of rail concessions in Africa to date are encouraging. Even if all the prior expectations have not been met, most of the concessionaires have improved the railways’ traffic levels and productivity and are providing a better service to users than the state did, albeit after a major investment by donors and IFIs. That said, some of these improvements might have occurred if the investment had been made without concessioning. Most concessions have also been in existence only for a short time in relation to typical railway asset lives and the real test will come when concessionaires themselves are faced with having to fund investment. Responsibility for the ongoing rehabilitation and maintenance of track infrastructure is rapidly
Q1/a&b Q4 Q5

Formative Evaluation of NIAF II
69
Title Source Summary of Relevant Findings Evaluation Question(s) Addressed
emerging as a key issue between concessionaires and governments. Many governments with railway concessions seek to obtain such financing from private sources or IFIs. But for most concessionaires, track rehabilitation and, especially, track renewal are major expenses that can often be deferred. Most concessions thus initially rely heavily on IFI loans and have often been slow to do the required work, and this has limited concession performance.
Brendan Martin (2002) Railway privatisation through concessions - The origins and effects of the experience in Latin America
http://www.publicworld.org/files/larailenglish.pdf
Looking at case studies of rail concessions in Latin America, the study concluded that: To the extent that investments have been delivered – especially in new technology –
efficiency, quality and potentially safety have increased in some cases. Volume of freight and passengers carried has increased in some cases while falling in
others. Some inter-city passenger services have disappeared entirely, while fares have tended to
rise, especially for commuter services.
Q1/a&b Q4 Q5
PPPs World Bank (2014) Overcoming constraints to the financing of infrastructure
https://www.g20.org/sites/default/files/g20_resources/library/WBG%20IIWG%20Success%20Stories%20Overcoming%20Constraints%20to%20the%20Financing%20of%20Infrastructure.pdf
The paper points out that in the past 10 years, PPPs have been on the rise in developing economies and private capital has contributed between 15 and 20 percent of total investment in infrastructure in this period. At the same time, it also discusses a few challenges with PPPs that are relevant to this study: PPPs have negative effects on public budgets because of contingent liabilities not being
adequately assessed, insufficiently reported, or accounted for off-balance sheet. PPPs are generally considered to be more expensive than purely public financing due to
higher private sector borrowing costs and high transaction costs in general. PPPs are likely to produce inadequate risk allocation due to lack of competition during
bidding and be subject to renegotiations which may put the public sector in a weak position and subsequently lead it to accept undue risks.
A country’s PPP engagement also demands high capacity and skill levels from the public sector authorities—or as the G-20 High Level Panel put it, — “PPPs require their own infrastructure”. All these technical skills, however, can only be put into practice when political commitment— often the single most important decisive factor in PPP roll-out—exists and continues to exist throughout the PPP development process and life time.
Countries and markets also need to be sufficiently mature to apply the concept of PPPs wisely. This implies that government authorities need to be sophisticated enough to develop sector reform policies, assess fiscal risks associated with PPPs, base their procurement decisions on comprehensive value-for-money assessments, and have impartial transaction structuring capacity at hand to make PPP deals bankable and sustainable. In contrast, markets also need to be sufficiently liquid, that is, rich in transactions with enough potential investors that have adequate regional experience bidding for PPPs in an economy with available long-term capital.
Q1/a&b Q4 Q5
Castalia Strategic Advisor (2011) Evaluation of the
http://www.google.co.uk/url?sa=t&rct=j&q=&esrc=s&s
The study found evidence that some IFC activities have had clear demonstration effects—in a few cases, contributing to more subsequent private participation in infrastructure (PPI) in the
Q4 Q5

Formative Evaluation of NIAF II
70
Title Source Summary of Relevant Findings Evaluation Question(s) Addressed
Demonstration Effect of IFC’s Involvement in Infrastructure in Africa
ource=web&cd=5&cad=rja&uact=8&ved=0CDwQFjAE&url=http%3A%2F%2Fwww.pidg.org%2Fresource-library%2Fother-documents%2Fevaluation-of-the-demonstration-effect-of-ifc2019s-involvement-in-infrastructure-in-africa%2Fat_download%2Ffile&ei=0TG0U5C7FsWdqAbej4CoAg&usg=AFQjCNHZVrk9OgSnaF-lPL_5NzQCXFCR9w&bvm=bv.70138588,d.b2k
sector, as well as helping build legal and regulatory frameworks and government capacity. On the other hand, it also found cases where opportunities for demonstration effects may have been missed. The most important demonstration effects, according to investors surveyed for the evaluation, flow not through isolated projects, but through effects on legal and regulatory frameworks, and on government capacity. One major power investor told the authors that it will not invest in a country unless there has already been a successful IPP in that country; some investors say that they look for a string of transactions, not a one-off deal, before deciding to invest. This is because the presence of previous deals is part of the evidence showing there is a workable legal, regulatory and institutional framework in place.
Q6
IEG World Bank (2013) Improving Institutional Capability and Financial Viability to Sustain Transport - An Evaluation of World Bank Group Support Since 2002
http://ieg.worldbankgroup.org/Data/reports/Transport_eval.pdf
Some of the relevant findings: In Peru, the technical assistance from PPIAF was influential in helping jump-start the
concessions program, revising tariffs in the transport sectors, and generally propelling reforms in transport.
In India, prominent analytic and advisory activities covered nearly all subsectors and a significant body of this work complemented the large portfolio of projects in the country’s roads sector, covering nine states and a railways project.
With regard to the relevant activities of IFC, the paper suggests that too few projects have yet matured and the evidence base of the recently introduced tracking system is limited to a few post completion reports of which the aggregation of findings is not meaningful. With that in mind, the report found that although 85 percent of the transactions delivered the specific advice for PPPs,14 only about a third resulted in the completion of a successful bidding process and award of a concession, and subsequent financing, a prerequisite for turning into a sustained transport service provider. The volatility of governments has been one reason for the relatively low success rate of IFC advisory services. Lack of public sector support, sometimes required to make public-private partnership transactions lucrative for private investors, was another reason for low success.
Q4 Q5 Q6
Michael Jordan and Associates (2004) Strategic Review of the Public-Private Infrastructure Advisory Facility
http://siteresources.worldbank.org/EXTGLOREGPARPROG/Resources/PPIAF_Strategic_Review.pdf
The evaluation confirmed that PPIAF is contributing to improving the enabling environment for PPI. Of 32 mature projects approved prior to FY 2004, 15 or 48% were assessed as having achieved a fully or mostly satisfactory outcome, but in another 12 cases it was either too early to say or there was not sufficient evidence to make a clear judgment. The evaluation also found that the country environment has a substantial bearing on project outcomes.
Q4 Q5

Formative Evaluation of NIAF II
71
Title Source Summary of Relevant Findings Evaluation Question(s) Addressed
Richard Shediac, Rabih Abouchakra, Mona Hammami, Mazen Ramsay Najjar, Public– Private Partnerships: A New Catalyst for Economic Growth
http://www.strategyand.pwc.com/media/file/Public_Private_Partnerships_A_New_Catalyst_for_Economic_Growth_FINAL.pdf
Most relevant findings: PPP projects launched in a nation, the higher the rate of GDP growth. Notably, countries
with 70 or more PPP infrastructure projects demonstrated a 25 percent GDP growth rate between 1990 and 2003.
1 percent increase in PPP investment will increase GDP per capita by 0.3 percent, implying that consistent investment in PPPs will increase GDP levels sizably. Although the short-term boost to economic growth is relatively small, it has a significant cumulative effect over time.
Countries with a large number of PPP projects that require greater levels of private-sector involvement tend to exhibit a higher grade of infrastructure. Fewer delays, fewer outages, and fewer failures in energy, water, telecom, and transportation service result from the right types of PPPs.
o In Guatemala, public access to electricity increased by 38 percent after the Guatemalan government implemented PPP agreements.
o In the Philippines, the formation of PPPs increased access to water by 34 percent.
o The East Asia Pacific (EAP) region, which has hundreds of PPPs in the energy and water sectors, experiences significantly fewer power delays and water supply failures than the MENA region, which has fewer than 100 such agreements.
Q1/a&b Q4 Q5 Q6
Link between green growth and poverty reduction Stefan Dercon (2012) Is green growth good for the poor?
http://elibrary.worldbank.org/doi/pdf/10.1596/1813-9450-6231
Economic growth is essential for any large-scale poverty reduction. Green growth, a growth process that is sensitive to environmental and climate change concerns, is often seen to be particularly helpful in this respect, leading to a win-win in growth and poverty reduction terms, with additional gains for the cause of greening the planet and avoiding further disastrous environmental change. This paper argues that such a view ignores important trade-offs in the nature of “green growth” strategies, stemming from a poor understanding of the sector and spatial processes behind effective poverty reduction. High labor intensity, declining shares of agriculture in gross domestic product and employment, migration, and urbanization are essential features of poverty-reducing growth. The paper contrasts some common and stylized green-sensitive growth ideas related to agriculture, trade, technology, infrastructure, and urban development with the requirements of poverty-sensitive growth. It finds that they may well cause a slow-down in the effectiveness of growth in reducing poverty. The main lesson therefore is that trade-offs are bound to exist; they increase the social costs of green growth and should be explicitly addressed. If not, green growth may not be good for the poor and the poor should not be asked to pay the price for sustaining growth while greening the planet.
Q1/b Q5 Q6
Stéphane Hallegatte, Geoffrey Heal, Marianne Fay and David Treguer (2011) From Growth to Green
https://openknowledge.worldbank.org/bitstream/handle/10986/3670/WPS5872.pdf?sequence=1
The main relevant findings of the paper are: Green policies are adopted to deliver environmental benefits which should increase
welfare.
Q1/b Q5
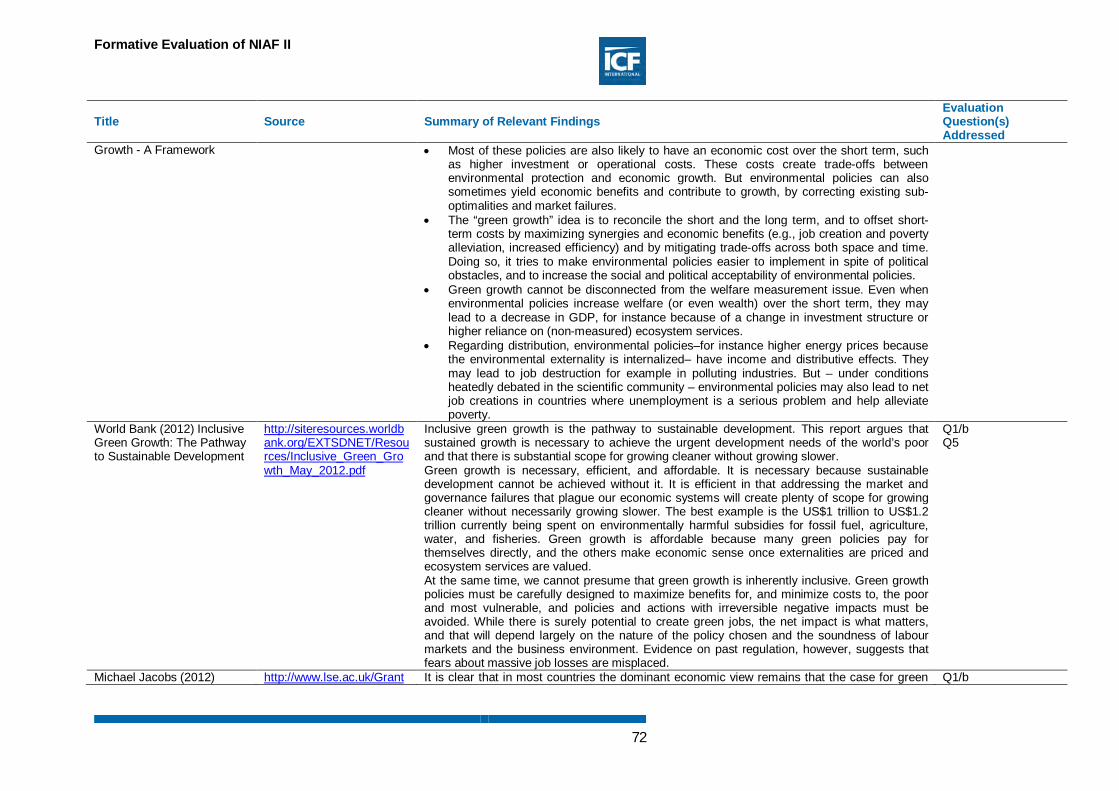
Formative Evaluation of NIAF II
72
Title Source Summary of Relevant Findings Evaluation Question(s) Addressed
Growth - A Framework Most of these policies are also likely to have an economic cost over the short term, such as higher investment or operational costs. These costs create trade-offs between environmental protection and economic growth. But environmental policies can also sometimes yield economic benefits and contribute to growth, by correcting existing sub-optimalities and market failures.
The “green growth” idea is to reconcile the short and the long term, and to offset short-term costs by maximizing synergies and economic benefits (e.g., job creation and poverty alleviation, increased efficiency) and by mitigating trade-offs across both space and time. Doing so, it tries to make environmental policies easier to implement in spite of political obstacles, and to increase the social and political acceptability of environmental policies.
Green growth cannot be disconnected from the welfare measurement issue. Even when environmental policies increase welfare (or even wealth) over the short term, they may lead to a decrease in GDP, for instance because of a change in investment structure or higher reliance on (non-measured) ecosystem services.
Regarding distribution, environmental policies–for instance higher energy prices because the environmental externality is internalized– have income and distributive effects. They may lead to job destruction for example in polluting industries. But – under conditions heatedly debated in the scientific community – environmental policies may also lead to net job creations in countries where unemployment is a serious problem and help alleviate poverty.
World Bank (2012) Inclusive Green Growth: The Pathway to Sustainable Development
http://siteresources.worldbank.org/EXTSDNET/Resources/Inclusive_Green_Growth_May_2012.pdf
Inclusive green growth is the pathway to sustainable development. This report argues that sustained growth is necessary to achieve the urgent development needs of the world’s poor and that there is substantial scope for growing cleaner without growing slower. Green growth is necessary, efficient, and affordable. It is necessary because sustainable development cannot be achieved without it. It is efficient in that addressing the market and governance failures that plague our economic systems will create plenty of scope for growing cleaner without necessarily growing slower. The best example is the US$1 trillion to US$1.2 trillion currently being spent on environmentally harmful subsidies for fossil fuel, agriculture, water, and fisheries. Green growth is affordable because many green policies pay for themselves directly, and the others make economic sense once externalities are priced and ecosystem services are valued. At the same time, we cannot presume that green growth is inherently inclusive. Green growth policies must be carefully designed to maximize benefits for, and minimize costs to, the poor and most vulnerable, and policies and actions with irreversible negative impacts must be avoided. While there is surely potential to create green jobs, the net impact is what matters, and that will depend largely on the nature of the policy chosen and the soundness of labour markets and the business environment. Evidence on past regulation, however, suggests that fears about massive job losses are misplaced.
Q1/b Q5
Michael Jacobs (2012) http://www.lse.ac.uk/Grant It is clear that in most countries the dominant economic view remains that the case for green Q1/b

Formative Evaluation of NIAF II
73
Title Source Summary of Relevant Findings Evaluation Question(s) Addressed
Green Growth: Economic Theory and Political Discourse
hamInstitute/wp-content/uploads/2012/10/WP92-green-growth-economic-theory-political-discourse.pdf
growth is unproven: strong environmental policy continues to be seen largely as a drag on growth rather than a driver of it, particularly in the difficult economic conditions which have prevailed in most of the developed world since the financial crash. But amongst the disagreements, two clear conclusions do emerge. First, that there isn’t a general conclusion that green growth is or is not possible. It will depend on what kind of green growth is in question. Secondly, it is clear that the case for green growth is stronger the further ahead one’s frame of reference looks. Seen over a very short period, the costs of environmental policy loom large, and the output benefits uncertain. But over a longer timeframe, the potential for technological innovation to reduce costs and drive growth becomes greater, while the economic costs of failing to protect the environment becomes larger.
Q5
Mark Huberty, Huan Gao, Juliana Mandell and John Zysman (2011) Shaping The Green Growth Economy - A review of the public debate and the prospects for green growth
http://greengrowthleaders.org/wp-content/uploads/2010/12/110819Shaping-the-Green-Growth-Economy_report_26.6.pdf
Green growth promises that the investments required for emissions reduction can come at minimal cost, and potentially expand both wealth and employment. But as this review has demonstrated, the horizons of the current green growth debate remain somewhat limited. Emissions reductions appear possible at moderate cost. The jobs they generate may be real and even durable, but in many cases may just offset those lost to the declining “brown” sectors. Finally, the possibilities for real economic growth so far identified rely heavily on exports, rather than on improvements to productivity or other more traditional sources of growth. Altogether, this paints a picture of green growth that may be real and achievable, but hardly generalizable or inevitable.
Q1/b Q5
Alex Bowen (2012) ‘Green’ Growth, ‘Green’ Jobs and Labor Markets
https://openknowledge.worldbank.org/bitstream/handle/10986/3277/WPS5990.pdf?sequence=1
Renewable energy supply, an increase in which is a key component of global and local climate-change policies, appears to be likely to be more labour intensive than traditional fossil-fuel-based supply, per megawatt and per dollar, although there are questions about how labour requirements are likely to evolve over a plant’s life and as technological progress takes place. But it is not likely to be more labour intensive than several other activities on which governments could spend in order to generate social benefits. Energy efficiency improvements also appear to be labour-intensive, drawing heavily on relatively unskilled labour in the construction sector. There are many attractive opportunities for developing countries in both these areas. However, the implications of the current lower labour productivity of these activities for public finances, aggregate productivity, energy prices and the profitability of private-sector activity are not generally examined and need to be.
Q1/b Q5
Sarah Cook, Kiah Smith and Peter Utting (2012) Green Economy or Green Society? Contestation and Policies for a Fair Transition
http://www.fes-globalization.org/geneva/documents/2012_11_30_10%20Cook-Smith-Utting.pdf
The paper argues that any transformation must be both green and fair, leading to a green society, not just a green economy. To place “the social” more centrally in green economy and sustainable development debates, critical questions concern how, and at what stage, social dimensions are incorporated into problem definition, analysis and solutions; and whether the goals of equity, poverty reduction and inclusivity are in fact compatible with the policies and transition paths currently being adopted or considered. It highlights the importance of a deeper transformation of the social structures, institutions and power relations underpinning vulnerability and inequality to ensure that development processes are greener and fairer for all.
Q1/b Q5
OECD (2013) Putting Green Growth at the Heart of
http://www.oecd.org/dac/environment-
Governments that put green growth at the heart of development can achieve sustainable economic growth and social stability, safeguard the environment and conserve resources for
Q1/b Q5

Formative Evaluation of NIAF II
74
Title Source Summary of Relevant Findings Evaluation Question(s) Addressed
Development Summary for Policymakers
development/Putting%20Green%20Growth%20at%20the%20Heart%20of%20Development_Summary%20For%20Policymakers.pdf
future generations. Reconciling development with environmental protection and sustainable natural resource management is critical to avoid natural capital depletion, climate change and social insecurity. This is particularly true for developing countries because of their acute exposure and vulnerability to environmental risks such as air, water and soil pollution and climate change, as well as their reliance on natural resources for economic growth. With regards to poverty reduction, it argues that when green growth policies are designed to take into account the interests of the poor and of vulnerable groups, they can have profound impacts on poverty reduction and social equity. For instance: Removing fossil fuel subsidies can improve the living conditions of the poorest if some of
the money is reallocated to providing cheaper public transport or more accessible health care services.
Sustainable certification schemes and eco-labelling programmes can become a new source of income in many developing countries with abundant forests and agricultural production. But the benefits to the poor will be greatest if land tenure is secured, and the certification schemes give special premium to community-managed forests or small landholders.
Payments for ecosystem services programmes can reduce poverty if they explicitly target local communities and include capacity development to boost local households’ ability in negotiating payment contracts.
OECD (2012) Green Growth and Developing Countries - A Summary for Policy Makers
http://www.oecd.org/dac/50526354.pdf
Developing countries are the key to achieving global green growth in two major ways. Firstly, the potential economic and social impacts of environmental degradation are particularly important for developing countries. They are the most vulnerable to climate change and tend to be more dependent than advanced economies on the exploitation of natural resources for economic growth. In addition many developing countries face severe economic, social and ecological threats from energy, food and water insecurity to climate change and extreme weather risks. They also face risks from premature deaths due to pollution, poor water quality and diseases associated with a changing climate. All of these factors undermine their development. Secondly, although today most developing countries contribute only minor shares to global greenhouse gas (GHG) emissions compared to the OECD and major emerging economies, they will increase their emissions if they follow conventional economic growth patterns. Increasingly developing countries are becoming sources of global economic growth, emissions and, with these, more intensive use of natural resources.
Q1/b

Formative Evaluation of NIAF II
75
Annex 8 NIAF Evaluation – Programme Analysis
Since its inception in 2012, NIAF has commissioned 519 projects with a collective budget of more than £68 million, of which roughly £46 million have been spent as of May 2014.44 Figure 1 below presents the total budget and spend to-date for projects under each workstream. Figure 2 presents the distribution of projects by number, allocated days, and budget across the six workstreams. As shown the power workstream accounts for the largest number of programs and the largest portion of programme resources in regards to both budget and spend.
Figure 1: Total Budget (£) and Spend (up to May 2014) by Workstream
*Projects categorized as ‘Other’ were undertaken outside of the logframe at the time of execution.
Source: NIAF Project Database, June 26, 2014.
44 This analysis excludes cross-cutting projects that have been implemented to largely support administrative and/or operational costs of the project.
-
5,000,000
10,000,000
15,000,000
20,000,000
25,000,000
30,000,000
Climate Change Capital Projects Power Roads Effective Cities Other*
Budget (£) Spend (£)

Formative Evaluation of NIAF II
76
Figure 2: Programme Distribution by Workstream
*Projects categorized as ‘Other’ were undertaken outside of the logframe at the time of execution.
Source: NIAF Project Database, June 26, 2014.
The daily cost of projects is on average almost £750 based on total spend and total days billed through May 2014. Figure 3 below presents presents the average daily costs across each workstream as well as the average and range of daily costs across individual projects within each workstream.
0%
5%
10%
15%
20%
25%
30%
35%
40%
45%
Climate Change Capital Projects Power Roads Effective Cities Other*
Number of Projects Allocated Days Budget (£)

Formative Evaluation of NIAF II
77
Figure 3: Daily Costs (Spend per Billed Day through May 2014) by Workstream
Average (£) Average and Range (£)
*Projects categorized as ‘Other’ were undertaken outside of the logframe at the time of execution.
Source: NIAF Project Database, June 26, 2014.
In terms of location, a vast number of projects are federally based, accounting for over 75% of the total programme budget. Figure 4 below presents the number of projects, allocated days, and budget by project location.
-
200
400
600
800
1,000
1,200
-
500
1,000
1,500
2,000
2,500
3,000
3,500
4,000

Formative Evaluation of NIAF II
78
Figure 4: Programme Distribution by Location
*Includes projects implemented in multiple states, including Anambra State, which is a Southern state.
Source: NIAF Project Database, June 26, 2014.
Projects being implemented in the Northern States—which include Jigawa, Kano, Zamfara, Kaduna and Niger—account for roughly 11% of allocated days and 9% of the total programme budget, as shown below in Figure 5. Projects that are being implemented in multiple states, including at least one Northern State, account for an additional 6% of allocated days and 5% of the total programme budget.
0%
10%
20%
30%
40%
50%
60%
70%
80%
90%
Federal Abuja (FCT) Northern* Southern
Number of Projects Allocated Days Budget (£)

Formative Evaluation of NIAF II
79
Figure 5: Programme Allocation to Northern States*
Percent of Days Percent of Budget (£)
*Multiple state projects include projects that are being implemented in both Northern and Southern states.
Source: NIAF Project Database, June 26, 2014.
In total, 493 consultants have been hired to support NIAF projects, with many individuals hired to support more than one project across more than one workstream. Across the programme, roughly four consultants are hired per project on average. Figure 6 below shows the total number of individual consultants and the average number of consultants per project under each workstream. As shown, the capital projects workstream has hired the largest number of individual consultants, while the roads workstream has hired the largest number of consultants on average per project.
11%6%
84%
Northern States Multiple State Projects*
9%5%
86%
Northern States Multiple State Projects*

Formative Evaluation of NIAF II
80
Figure 6: Consultants by Workstream
Total Number of Individual Consultants** Average per Project
* Projects categorized as ‘Other’ were undertaken outside of the logframe at the time of execution.
**Many individuals are hired to work on multiple projects under one or more workstreams.
Source: NIAF Project Database, June 26, 2014.
Funding from each workstream is largely used to support logframe outputs in corresponding areas, with some funding additionally supporting Northern Growth. Figure 7 below shows how funding from each workstream is used to support logframe outputs.
Figure 7: Link between NIAF Workstreams and Logframe Outputs
51
162
141
84
138
11
0
20
40
60
80
100
120
140
160
180
ClimateChange
CapitalProjects
Power Roads EffectiveCities
Other* -
2
4
6
8
10
12
ClimateChange
CapitalProjects
Power Roads EffectiveCities
Other* All
Logframe Outputs Worstream
Climate Change Capital Projects Power Roads Effective Cities
Power
1.1 1.2 1.3 1.4 1.5 1.6 1.7
Roads
2.1 2.2 2.3 2.4 2.5
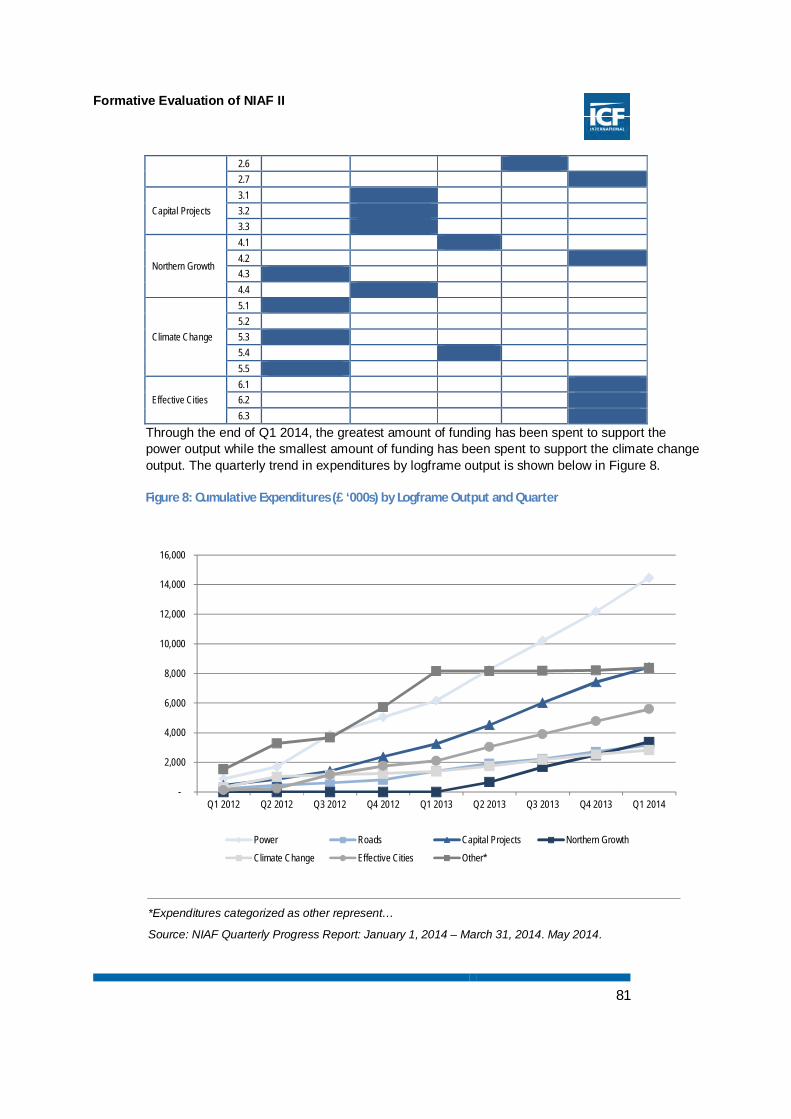
Formative Evaluation of NIAF II
81
Through the end of Q1 2014, the greatest amount of funding has been spent to support the power output while the smallest amount of funding has been spent to support the climate change output. The quarterly trend in expenditures by logframe output is shown below in Figure 8.
Figure 8: Cumulative Expenditures (£ ‘000s) by Logframe Output and Quarter
*Expenditures categorized as other represent…
Source: NIAF Quarterly Progress Report: January 1, 2014 – March 31, 2014. May 2014.
-
2,000
4,000
6,000
8,000
10,000
12,000
14,000
16,000
Q1 2012 Q2 2012 Q3 2012 Q4 2012 Q1 2013 Q2 2013 Q3 2013 Q4 2013 Q1 2014
Power Roads Capital Projects Northern Growth
Climate Change Effective Cities Other*
2.6 2.7
Capital Projects 3.1 3.2 3.3
Northern Growth
4.1 4.2 4.3 4.4
Climate Change
5.1 5.2 5.3 5.4 5.5
Effective Cities 6.1 6.2 6.3
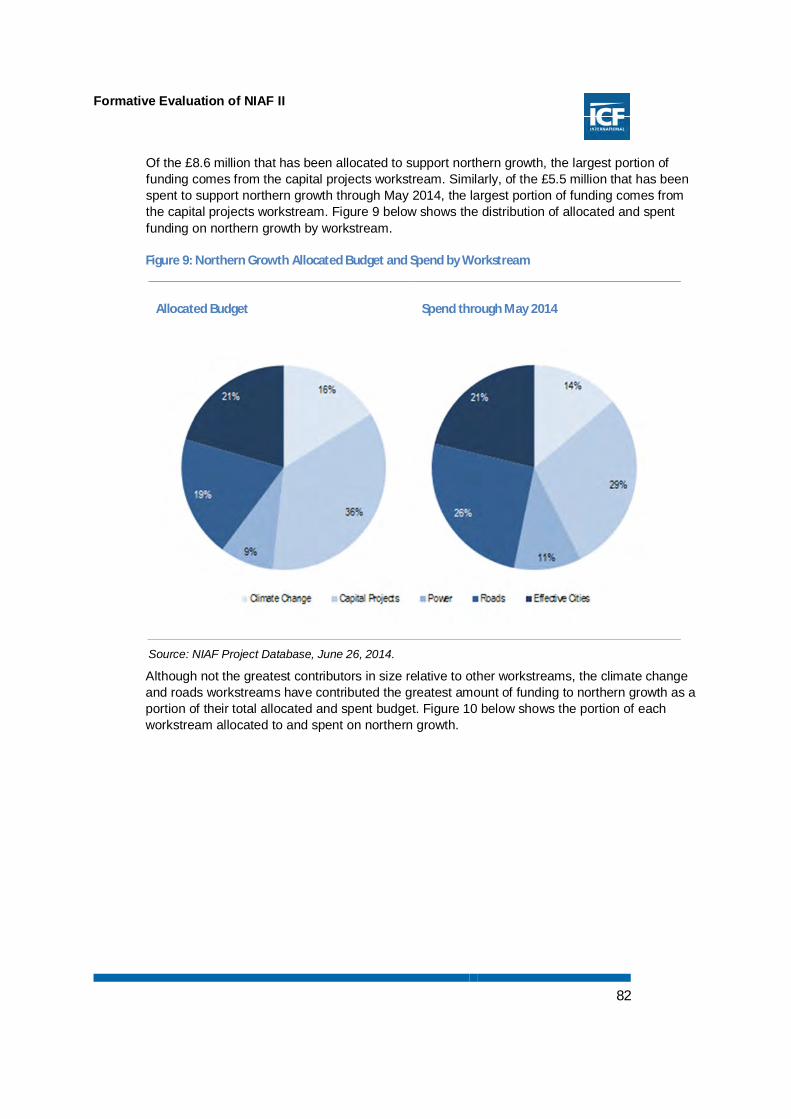
Formative Evaluation of NIAF II
82
Of the £8.6 million that has been allocated to support northern growth, the largest portion of funding comes from the capital projects workstream. Similarly, of the £5.5 million that has been spent to support northern growth through May 2014, the largest portion of funding comes from the capital projects workstream. Figure 9 below shows the distribution of allocated and spent funding on northern growth by workstream.
Figure 9: Northern Growth Allocated Budget and Spend by Workstream
Allocated Budget Spend through May 2014
Source: NIAF Project Database, June 26, 2014.
Although not the greatest contributors in size relative to other workstreams, the climate change and roads workstreams have contributed the greatest amount of funding to northern growth as a portion of their total allocated and spent budget. Figure 10 below shows the portion of each workstream allocated to and spent on northern growth.

Formative Evaluation of NIAF II
83
Figure 10: Portion of Each Workstream Allocated to and Spent on Northern Growth
Source: NIAF Project Database, June 26, 2014.
In regards to size, road projects tend to be relatively larger in size—in terms of both allocated days and total budget—while climate change projects tend to be relatively smaller in size. Figure 11 and * Projects categorized as ‘Other’ were undertaken outside of the logframe at the time of execution.
Source: NIAF Project Database, June 26, 2014.
Figure 12 below show the distribution of projects by project size, in terms of both allocated days and budget.
Figure 13 shows the average number of allocated days and budget per project across the programme and by workstream. Figure 14 similarly shows the average number of allocated days and budget per project across the programme and by workstream as well as the range.
0%
5%
10%
15%
20%
25%
30%
35%
40%
Climate Change Capital Projects Power Roads Effective Cities
Allocated Budget Spend through May 2014

Formative Evaluation of NIAF II
84
Figure 11: Project Size by Workstream: Number of Allocated Days
* Projects categorized as ‘Other’ were undertaken outside of the logframe at the time of execution.
Source: NIAF Project Database, June 26, 2014.
Figure 12: Project Size by Workstream: Allocated Budget
* Projects categorized as ‘Other’ were undertaken outside of the logframe at the time of execution.
0% 10% 20% 30% 40% 50% 60% 70% 80% 90% 100%
Climate Change
Capital Projects
Power
Roads
Effective Cities
Other*
<100 100-199 200-300 >300
0% 10% 20% 30% 40% 50% 60% 70% 80% 90% 100%
Climate Change
Capital Projects
Power
Roads
Effective Cities
Other*
<£50,000 £50,000 - £149,999 £150,000 - £250,000 >£250,000

Formative Evaluation of NIAF II
85
Source: NIAF Project Database, June 26, 2014.
Figure 13: Average Project Size by Workstream
Allocated Days Allocated Budget (£)
* Projects categorized as ‘Other’ were undertaken outside of the logframe at the time of execution.
Source: NIAF Project Database, June 26, 2014.
-
50
100
150
200
250
300
-
50,000
100,000
150,000
200,000
250,000

Formative Evaluation of NIAF II
86
Figure 14: Range and Average Project Size by Workstream
Allocated Days Allocated Budget (£)
* Projects categorized as ‘Other’ were undertaken outside of the logframe at the time of execution.
Source: NIAF Project Database, June 26, 2014.
-
200
400
600
800
1,000
1,200
1,400
1,600
-
200,000
400,000
600,000
800,000
1,000,000
1,200,000
1,400,000

Formative Evaluation of NIAF II
87
In regards to duration, projects across the entire programme are scheduled to last 133 days on average, with one project lasting as few as two days and another project lasting as long as 759 days. Projects under the roads workstream tend to extend over a longer period of time, with more than 50% of these projects extending over more than 300 days. In contrast projects under the capital projects workstream tend to extend over a relatively shorter period of time with more than 50% of these projects extending over less than 200 days. Figure 15 below shows the distribution of projects by project duration.
Figure 16 shows the average and range of project duration in days across the programme and by workstream.
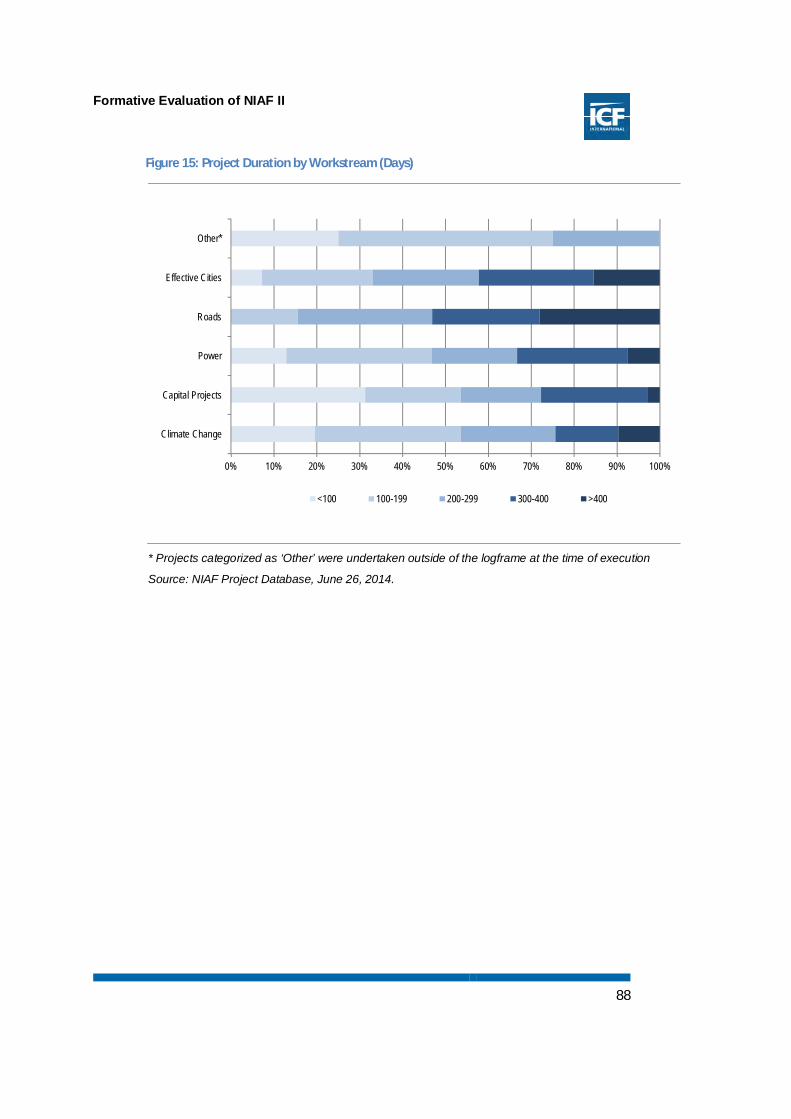
Formative Evaluation of NIAF II
88
Figure 15: Project Duration by Workstream (Days)
* Projects categorized as ‘Other’ were undertaken outside of the logframe at the time of execution
Source: NIAF Project Database, June 26, 2014.
0% 10% 20% 30% 40% 50% 60% 70% 80% 90% 100%
Climate Change
Capital Projects
Power
Roads
Effective Cities
Other*
<100 100-199 200-299 300-400 >400

Formative Evaluation of NIAF II
89
Figure 16: Average and Range of Project Duration by Workstream (Days)
Average Average and Range
* Projects categorized as ‘Other’ were undertaken outside of the logframe at the time of execution
Source: NIAF Project Database, June 26, 2014.
Across the programme, 396 have been completed while 150 projects are still ongoing. Figure 17 below shows the portion of projects that have been completed across the programme and under each workstream. As shown, the power workstream has completed the largest portion of its projects while the roads workstream has the largest portion of projects still ongoing.
-
50
100
150
200
250
300
350
-
100
200
300
400
500
600
700
800

Formative Evaluation of NIAF II
90
Figure 17: Project Status by Workstream
* Projects categorized as ‘Other’ were undertaken outside of the logframe at the time of execution
Source: NIAF Project Database, June 26, 2014.
Since January 2012, the distribution of projects by workstream has stayed relatively constant with projects under the effective cities workstream initially representing a slightly larger portion of total projects than they do today, and projects under the climate change, roads, and capital projects workstreams initially representing a slightly smaller portion of total projects than they do today. Figure 18 below presents the distribution of projects by workstream based on the date of when the project was commissioned.
63%72%
78%
59%65%
57%
71%
37%28%
22%
41%35%
43%
29%
0%
10%
20%
30%
40%
50%
60%
70%
80%
90%
100%
ClimateChange
CapitalProjects
Power Roads EffectiveCities
Other* All
Ongoing Complete

Formative Evaluation of NIAF II
91
Figure 18: Distribution of Projects by Workstream and Date Commissioned By
* Projects categorized as ‘Other’ were undertaken outside of the logframe at the time of execution
Source: NIAF Project Database, June 26, 2014.
When looking at the distribution of allocated budgets by workstream over time the distribution has similarly stayed relatively constant, as shown below in Figure 19. However, projects under the power worksteam initially represented a greater portion of total allocated budget than they do today while projects under the roads workstream initially represented a smaller portion of total allocated budget than they do today.
6% 6% 6% 7% 8%
24% 25% 26% 26% 28%
38% 41% 41% 40% 39%
3%5% 6% 6% 6%
27% 22% 20% 20% 19%
1% 1% 1% 1% 1%
0%
10%
20%
30%
40%
50%
60%
70%
80%
90%
100%
Jun 2012 Dec 2012 Jun 2013 Dec 2013 May 2014
Other* Effective Cities Roads Power Capital Projects Climate Change

Formative Evaluation of NIAF II
92
Figure 19: Distribution of Allocated Budgets by Workstream and Date Commissioned By
* Projects categorized as ‘Other’ were undertaken outside of the logframe at the time of execution
Source: NIAF Project Database, June 26, 2014.
4% 5% 6% 6% 6%
24% 23% 23% 23% 25%
50% 50% 45% 42% 41%
2% 5% 10% 10% 10%
18% 16% 16% 18% 17%
1% 0% 0% 0% 0%
0%
10%
20%
30%
40%
50%
60%
70%
80%
90%
100%
Jun 2012 Dec 2012 Jun 2013 Dec 2013 May 2014
Other* Effective Cities Roads Power Capital Projects Climate Change

Formative Evaluation of NIAF II
93
Annex 9 Case Studies (Power, Capital Projects, Effective Cities)

Formative Evaluation of NIAF II
94
TheNIAFapproach:Powersectorcasestudy 1 Introduction This case study examines in more depth the Power workstream of the NIAF II programme. It focuses on the application of the ‘NIAF approach’ examining how the principles of demand responsiveness, flexibility, political economy awareness and influencing are understood and applied. It considers the expected returns from the approach, investigates the likely overlaps and interdependencies between the four principles.
1.1 Purpose and structure of the study report The purposes of the case study are to:
■ provide in-depth exploration of the second evaluation question, focusing on the role of the NIAF strategic principles in underpinning results and delivery;
■ contribute to evaluation objectives; and ■ generate lessons for wider learning on flexible, demand-responsive modalities.
The Power workstream is one of the original sectors for the NIAF programme, and has been instrumental in developing an approach which has been applied subsequently in other workstreams. The other case studies examine the experience of the Effective Cities and Capital Projects workstreams. All case studies will be repeated for the summative evaluation to allow a longitudinal observation.
The study report considers the NIAF approach and the strategic principles involved; describes in section 2 the Power workstream; and in section 3, how the NIAF approach has been applied in practice within the Power workstream; the implications of such an approach; and lessons to be learnt from the Power experience.
1.2 NIAF approach and strategic principles The NIAF II business case and subsequent refinement by the NIAF PMU articulates a theory of change which argues that high quality and well-targeted technical assistance can (i) increase the funds available for infrastructure spending, (ii) strengthen the effectiveness of existing expenditure, and (iii) thus reduce poverty through faster development associated with better infrastructure provision.
The long-term change sought by NIAF II is that more effective infrastructure investment in Nigeria supports growth and the reduction of poverty. This is reflected in the NIAF II log frame impact and outcome statements:
■ Impact Reduced infrastructure constraints to growth in non-oil gross domestic product and employment, leading to reduced poverty
■ Outcome Enhanced management of infrastructure development at the federal level and in selected states
The process of change rests on an approach that is guided by four strategic principles. Together, these strategic principles are expected to drive the NIAF II theory of change and underpin the successful achievement of NIAF objectives. These principles are:
■ Demand responsiveness – Focus on sectors and processes which are acknowledged by government to
require NIAF support and where there is a clear demand from a qualifying Nigerian institution

Formative Evaluation of NIAF II
95
– Work collaboratively with clients to align client demand with NIAF programme priorities and build partnerships incrementally committing to small project engagements which gradually build to a productive partnership.
■ Flexibility – Take advantage of windows of opportunity to rapidly allow critical
interventions to be effective – Provide different types of support and specialist expertise (short-term, full
time or embedded consultancy inputs) to respond to demands for support. ■ Political economy awareness
– Maintain a high level of awareness of political economy issues and their implications for delivering assistance that will lead to action;
– Ensure strong engagement at the highest political levels to deliver key messages directly into the heart of decision-making processes.
■ Influencing – Establish and use key relationships across a network of core federal
institutions to deliver consistent and connected advice and build coalitions for reform;
– Use concise action-oriented summary notes to convey critical advice at the most senior levels;
– Demonstrate the success of working with one client as the launch pad for engagement with another.
2 Background to Power Sector When NIAF II was commissioned, the power output of Nigeria was among the lowest in the world relative to GDP and per capita was lower than Bangladesh45. Total on grid power consumption for the whole of Nigeria was equal to the consumption of Bradford46 in the UK. As a result of this Nigerians rely on self-generated power mostly using small diesel generators. Self generation is estimated at 6000MW47. Using this kind of power is expensive and environmentally damaging.
Given Nigeria’s position as the largest economy in Africa, it is no surprise that poor power supply was identified in the original NIAF II business case as the single most significant constraint on Nigerian businesses48. Providing reliable on-grid power to satisfy demand could have a transformative effect on the economy of Nigeria, with clear benefits to the poorest being delivered through more cost effective power for small businesses and improved functionality of schools and hospitals.
Earlier attempts to improve power supply were hampered by poor planning and governance. Despite annual injections of $2bn, the state owned sector failed to improve generation above 3000MW for two decades49. In 2005 the National Integrated Power Project (NIPP) was launched which committed $9.7bn and was expected to increase power generation by 2500MW by 2008. Whilst this did increase generating capacity, parallel work to supply gas to the power stations and onward transmission did not deliver and so improvements to generation were not realised.
Since taking office in 2010, President Goodluck Jonathan has led a new drive towards power reform, including electing himself minister of power and creating the President’s Action Committee on Power (PACP) and the a Presidential Task Force on Power (PTFP). 45 CIA World Factbook 2010 46 The Economist, Nigeria’s Prospects: A man and a morass, May 26th 2011 47 Roadmap for Power Sector Reform, August 2010, op. cit. 48 Assessments of the Investment Climate in Nigeria, published by the World Bank, 2008 and 2010, and Business Leader Perceptions of the Investment Climate in Nigeria, published by DFID’s ENABLE programme, 2009. In NIAF 2 Business Case, DFID 20011 49 Roadmap for Power Sector Reform, August 2010, op. cit.

Formative Evaluation of NIAF II
96
NIAF has been instrumental in these structures, providing firstly a ten point reform plan which was adopted by the president and builds on the Power Sector Reform Act (2005); and secondly providing highly qualified staff for these new presidential structures.
The overall sector reform programme involves:
■ Separating generation, transmission and distribution ■ Introduction of a commercial electricity trading market ■ Eliminating the operational role of the state and opening the sector to private
investment ■ Supporting a commercial environment for investment and growth ■ Introducing an independent and transparent regulator ■ Enabling the government to set policy and oversee the development of the
sector whilst minimising the scope for political interference.
3 NIAF’s Approach & Power
3.1 NIAF’s Approach in practice NIAF’s approach to power sector reform is outlined in its Sector Story50. This is summarised below:
1. Privatisation—focused primarily on independent support to the Bureau of Public Enterprises (BPE) in completing the sale of all eleven distribution companies and all six generation companies to private owners following a transparent, competitive process and embracing:
■ support in reaching and implementing an agreement with labour including pensions and
■ severance arrangements; ■ provision of data to support the bidding process; ■ assistance in review and evaluation of bid submissions; and ■ assistance in reviewing and finalising sales agreements;
2. Commercial framework and regulation- focused primarily on:
■ Market design, implementation and governance, with principal focus, initially, on ensuring that all the necessary processes and procedures are in place—including the market rules, grid code, agreements, laws, regulations, contracts, etc.—so that the transitional electricity market (TEM) can be declared and, subsequently, on future market development;
■ Support to the regulator (NERC), as required, in particular on tariff methodology and setting;
■ Highlighting and proposing solutions to key obstacles to be addressed in order to ensure workeable markets; and
■ Organisational development and change management to ensure that key entities—particularly the bulk trader (NBET), the market operator, the systems operator, and the transmission service provider—will be able to perform the parts required of them in the transitional electricity market;
3. Service delivery—focused primarily on:
50 NIAF overall story and detailed sector stories. Compilation incorporating NIAF theories of change. June 2014

Formative Evaluation of NIAF II
97
■ Supporting the Presidential Task Force on Power and the Ministry of Power in improving the volume and reliability of power service delivery in the run-up and transition to the completion of the sector reform process;
■ Monitoring gas to power supply and advising the Ministry of Power on related issues in order to influence increase in supply;
■ Monitoring long term transmission constraints on power delivery and advising on transmission planning and financing;
■ Monitoring system performance and project progress; and ■ Support for provision of an appropriate telecommunications network and
establishment of a supervisory control system SCADA.
3.1.1 How are NIAF strategic principles documented in the Effective Cities ‘story’ or theory of change?
The strategic principles of the NIAF approach were in part developed through lessons learned from the Power sector in NIAF I. They are clearly stated in the Power workstream’s theory of change through the ‘Influencing Strategy’ and discussion of sustainability51.
3.1.2 How have they been applied in practice?
Political Economy Awareness
One of the key success factors of NIAF’s work with the power sector has been the nuanced understanding of the political processes which underpin change in the sector and its ability to capitalise on opportunities when they present themselves.
Initially, with the power sector in crisis, the newly elected president was keen to transform the sector. With successive failures, the president and government were receptive to a ten point reform plan which NIAF was able to present. This formed the basis of the reforms to come, and placed NIAF at the centre of these reforms.
The formation of new structures to drive through reforms can often cause longer term problems as institutional rivalries can emerge, however in this case, such was the level of inertia, and the determination of the president, that fresh structures accountable to the president were a pragmatic institutional response. NIAF has provided support in design and staffing of the Presidential Action Committee on Power (PACP), the Presidential Task Force on Power (PTFP), Ministry of Power (MoP), Bureau of Public Enterprises (BPE), the Nigerian Electricity Regulatory Commission (NERC), Nigerian Bulk Electricity Trading (NBET), the Nigeria Electricity Liability Management Company (NELMCO), and the Transmission Company of Nigeria (TCN), and others.
By providing long term consultants within these key structures as well as the regulator and ministry, NIAF is aware of all the significant developments and is able to coordinate a response.
Demand responsiveness / Influencing
NIAF initially responded to the need for reform by presenting the ten point plan; this was a critical moment. Subsequently with a range of consultants embedded in all of the key institutions, NIAF has been able to identify, and influence demands as well as respond. They have worked closely with the private sector and successfully managed the privatisation process in the face of competing demands.
NIAF’s thought leading position in the reform process is recognised, but this brings risks – the balance of influencing the reforms and responding to demands risks a circularity whereby NIAF consultants are responding to their own demands. This is recognised by NIAF, and their
51 NIAF overall story and detailed sector stories compilation incorporating NIAF theories of change, NIAF, June 2014

Formative Evaluation of NIAF II
98
transparent management of the reform process has is a testament to their ability to manage this tension. However, if the reform process fails, NIAF would be publically criticised.
Flexibility The Power sector currently shows less much evidence of flexibility than other areas of reform. This is perhaps because it is a more established workstream and is now delivering an agreed set of objectives. Initially it is clear that the workstream was highly responsive and innovative in the way it dealt with the institutions.
3.1.3 What has been the experience of applying these principles?
The clearest success to date has been the privatisation of the generating companies (GENCOs) and distribution companies (DISCOs). This was hailed as a major achievement in 2013 annual review, demonstrating that reforms have been institutionalised. It is noteworthy that not a single complaint was lodged during the privatisation process, despite concerns about labour unions, this indicates the transparent and accountable process satisfied private bidders and stakeholders. The Technical Review Panel (TRP) note that “…this is an extraordinary achievement…in most other jurisdictions, these transactions would not be considered bankable”.
The drivers of success, in addition to the political context have been ASI’s ability to recruit and embed high quality consultants with the technical skills and the cultural understanding to deliver effectively. This has been a constant theme throughout NIAF’s workstreams and is clearly a strength of the programme.
There are also significant risks remaining in the power sector reforms which could develop into failures if they are not managed well. Privatisation is only one step of the reform process, it is necessary but not sufficient to improve power supply; without a sustainable gas supply and a functioning electricity market sustainable increases in power availability are unlikely. Currently, the gas supply is in some jeopardy, and NIAF is just starting to work with the Ministry of Petroleum to improve this. Given the challenges of entering and influencing a new ministry, this has significant risks, particularly if there is a change in government and focus on the power sector is lost.
NIAF has been very good at taking advantage of political opportunities – pushing on open doors – but this may have been at the expense of long term work in the gas sector where there was less support, but is still a critical component of the reforms. This may illustrate the need to balance long term strategy with shorter term political pragmatism.
The second necessary condition is a functioning Transitional Electricity Market (TEM). The 2013 Annual review notes that NIAF is behind schedule with this and is working to speed up progress. The timing of the launch of this market is troublesome, coming near an election when there is uncertainty which could damage the potentially fragile early stages of trading.
3.2 Implications of Applying NIAF’s Approach
What have been the implications for governance and management?
Client arrangements
NIAF support has changed the institutional landscape of the power sector in ways which will be hard to undo – this is one of the key achievements so far. Changing the industry from state owned and operated to privatised with an independent regulator and state policy making function is considerable
One challenge to NIAF emerging at the end of 2014 is related to the disbanding of the PACP and the PTFC. These bodies have been critical in the reforms to date, although they have been the source of some competition the line ministries. It seems likely, and is desirable, that staff from these bodies will find work in other institutions in the industry

Formative Evaluation of NIAF II
99
to maintain the knowledge and experience which they have gained. It is also possible that they will remain accessible to NIAF, although not funded by them. It is a risk that without permanently employed embedded consultants in the PTFC, NIAF may have less direct influence on the reform process and consequently may need to revise its influencing strategy.
Monitoring and evaluation; lesson learning
The Power workstream M&E appears to be working (largely due to output-based payment system). The TRP has been able to highlight critical risks, and the log frame indicators have been adjusted fairly to ensure that outputs are focussed where they will have the most benefit.
The lessons of the experiences of the Power workstream are being captured in the Annual review and TRPs as well as in some degree within the sector story, however, with following the launch of the TEM, it might be a good opportunity for a revised sector story which captures the detailed lessons from the sector reform so far.
Has the programme been subject to political capture? If so, how has it dealt with it?
The power sector reforms were called for by the president, and progress so far has reduced state ownership and operation of the sector – in this way political capture has been significantly reduced by the programme.
Has the programme been able to balance the need to meet output indicators and be demand-responsive and flexible? If so, how?
The Power sector has managed this tension well by setting a clear reform programme in motion and building the output indicators around this. The design of the programme was agreed with stakeholders, most notably the president, and the parameters of demand within this were defined to correspond with the strategic objectives.
The programme is on schedule with most logframe indicators – however, due to the nature of the programme, there are a number of necessary outcomes which must be achieved before any increase in power availability will be recognised. One failure so far has been to manage parallel engagement with the Ministry of Petroleum to reform the gas supply – whilst this was part of the output indicators, the politics of engagement with this ministry have proved difficult so far.
Is the approach cost-effective? Are there any additional costs involved? If so, what?
The power workstream is the most expensive of all NIAF’s workstreams (approximately 40% of the budget). However, given the potential economic benefits to a significant increase in power supply, this is thought to be justified by reviewers so far.
The risk to this programme, is not extra cost, but failure of one critical element of reform which would undermine all the results. If the TEM fails, or gas supply is not forthcoming, then power reforms will have failed. Equally if tariffs are not set at appropriate levels, either investment will dry up, or the poorest will not be able to access power. Managing these risks will be the crucial to deliver value from this programme.
3.3 Lessons to be learnt from Effective Cities
What have been the factors determining success?
Unfortunately at this stage is also too early to identify success in terms of increased availability of power, but proximal indicators do suggest that the programme is moving towards this ultimate outcome.
The key factors which have underpinned the successes so far have been:

Formative Evaluation of NIAF II
100
■ Clear demand from the government for power sector reform – crisis point had been reached and the time was right for a new external input
■ A rapid and coherent strategy from NIAF ■ Rapid deployment of high quality consultants, many of who were diaspora, into
the key institutions ■ Continued monitoring of the internal politics of reform through embedded
consultants
Where and why has the approach failed?
Whilst it is too early to identify clear points of failure, there is one areas in which NIAF can improve:
■ Maintaining the balance between long term strategy and political expediency – whilst in the main power sector this has been managed well, NIAF has not yet managed to address the politically challenging aspect of gas supply which is a critical part of the overall reform package.
What does the programme need to have in place in terms of resources, skills and management in order for the NIAF approach to succeed?
For the most part, the Power workstream has had everything in place which it has needed to succeed:
■ High level political support. ■ A sector in crisis which was in need of a fresh approach. ■ A clear strategy and route-map for reform. ■ A ready supply of skilled consultants, many of whom were Nigerian who were
able and willing to take up positions in the key institutions. ■ Flexible Unfortunately at this stage is also too early to identify success in terms
of increased availability of power, but proximal indicators do suggest that the programme is moving towards this ultimate outcome.

Formative Evaluation of NIAF II
101
TheNIAFapproach:CapitalProjectscasestudy
1 Introduction This case study examines the Capital Projects workstream of the NIAF II programme in some depth. It focuses on the application of the ‘NIAF approach’ to the workstream, examining how the principles of demand responsiveness, flexibility, political economy awareness and influencing are understood and applied. It considers the expected returns from the approach, and investigates the likely overlaps and interdependencies between the four principles.
1.1 Purpose and structure of the study report The purposes of this case study are to:
■ provide in-depth exploration of whether the Capital Projects program reflects the NIAF strategic principles, focusing on the role of the NIAF strategic principles in underpinning Capital Projects’ results and delivery;
■ contribute to evaluation objectives; and ■ generate lessons for wider learning on flexible, demand-responsive program
modalities.
The Capital Projects workstream builds upon and broadens the previous support under NIAF I in: (i) operationalising the SURE-P; and (ii) supporting the development of the national PPP policy and PPP toolkit. By definition, it is multi-sectoral in nature and consequently interfaces with other workstreams under the NIAF II programme. However, this case study considers only those activities which are currently managed directly under the Capital Projects workstream. The other case studies examine the experience of the Power and Effective Cities workstreams. All case studies will be repeated for the summative evaluation to allow a longitudinal observation.
This section sets out the NIAF approach and the strategic principles; section 2 describes the Capital Projects workstream; and section 3, how the NIAF approach has been applied in practice within the Capital Projects workstream, the implications of adopting this approach, and lessons to be learnt from the Capital Project workstream experience.
1.2 NIAF approach and strategic principles The NIAF II business case and subsequent refinement by the NIAF PMU articulates a theory of change which argues that high quality and well-targeted technical assistance can: (i) increase the funds available for infrastructure spending; (ii) strengthen the effectiveness of existing expenditure; and (iii) thus reduce poverty through faster development associated with better infrastructure provision. This is reflected in the NIAF II log frame impact and outcome statements:
■ Impact: Reduced infrastructure constraints to growth in non-oil gross domestic product and employment, leading to reduced poverty
■ Outcome: Enhanced management of infrastructure development at the federal level and in selected states
Formative Evaluation of NIAF II
102
The process of change is guided by four strategic principles. Together, these strategic principles are expected to drive the NIAF II theory of change and underpin the successful achievement of NIAF objectives. The principles are:
■ Demand responsiveness – Focus on sectors and processes which are acknowledged by government to
require NIAF support and where there is a clear demand from a qualifying Nigerian institution
– Work collaboratively with clients to align client demand with NIAF programme priorities and build partnerships incrementally, committing to small project engagements which gradually build to a productive partnership.
■ Flexibility – Take advantage of windows of opportunity to provide a rapid response and
hence allow critical interventions to be effective – Provide different types of support and specialist expertise (short-term, full
time or embedded consultancy inputs) to respond to demands for support. ■ Political economy awareness
– Maintain a high level of awareness of political economy issues and their implications for delivering assistance that will lead to action;
– Ensure strong engagement at the highest political levels to deliver key messages directly into the heart of decision-making processes.
■ Influencing – Establish and use key relationships across a network of core federal
institutions to deliver consistent and connected advice and build coalitions for reform;
– Use concise action-oriented summary notes to convey critical advice at the most senior levels;
– Demonstrate the success of working with one client as the launch pad for engagement with another.
2 Background to Capital Projects Workstream The Capital Projects workstream is a response to the challenges posed to infrastructure delivery across all sectors in Nigeria as a result of:
■ Very poor VfM and low development impact of public infrastructure investment; ■ Poor track record and low confidence in infrastructure delivery through PPP; ■ Predominant focus on network infrastructure serving urban and peri-urban
populations; ■ Strong preference for new and large projects to the detriment of maintenance –
negatively impacting on service quality and reliability and asset lifetimes; ■ Deterioration of rural infrastructure through lack of investment, presenting the
main challenge to the largest non-oil sector: agriculture.
Of fundamental importance is that: (i) Nigeria’s limited capital budget should be better aligned to achieving growth and other development objectives; and (ii) the leadership team, which supports the reform process, requires modern tools for economic planning. Without these, VfM in infrastructure capital spend and development impact will remain severely compromised. The current logframe outcome and output targets and level of achievement related to the Capital Projects workstream are:
■ Outcome 3: Significant improvement in the projected average real rate of return for capital projects included in the national budget: No baseline has been established yet; Work needs to be done to operationalise an outcome indicator.

Formative Evaluation of NIAF II
103
■ Output 3.1: 50% of new capital projects (>$25m) screened using approved templates: Progress in line with expectations, but CEAP has decided not to formally roll out the use of the screening tool for the time being.
■ Output 3.2: Government screens budgets for cost variances in selected new projects: Emphasis shifted from SURE-P to the FEC where it is being led by the CEAP, but again, CEAP has decided that this work cannot be formally rolled out until after the elections, due to political sensitivities.
■ Output 3.3: Excluding the power IPPs, RFPs issued under Federal/State PPP process for at least 2 PPP projects across NIAF sectors: progress in line with or exceeding expectations (but difficulty in attribution to NIAF).
■ Output 4.4: Additional jobs on maintenance of rural roads of 1,000 (including trainees), with a minimum of 50 (5%) going to females. At least 500km of rural roads under labour-based maintenance: progress is in line with expectations but faces challenges due to lack of funding.
Both the Annual Review Team and Technical Review Panel (TRP) observe52 that the sector is large and complex, and that the workstream needs to be particularly innovative, politically aware and agile to achieve workstream outcomes and project outputs. However, the TRP notes that: “The capital projects team is …very active, strategic, agile and very responsive to the needs of counterparts”.
3 NIAF’s Approach & Capital Projects
3.1 NIAF’s Approach in practice
How are NIAF strategic principles documented in the Capital Projects ‘story’ or theory of change?
The strategic principles of the NIAF approach are documented within the Capital Projects workstream’s theory of change. They make up the workstream’s ‘Influencing Strategy’ as described in the Capital Projects ‘Story’53. This describes the process approach to the work of the Capital Works workstream and how the strategic principles work together in driving the work.
The theory of change behind the design of the Capital Projects workstream recognises that the challenges being tackled are part of a wide and deep set of multi-faceted governance problems, which will take many years to overcome. The scale of changes required to achieve consensus on what is basically budget reform is enormous, and it is recognised that this process cannot be entirely achieved within the lifetime of NIAF. The underpinning criteria that: (i) the changes NIAF seeks to promote should be sustainable, and (ii) there is an exit path by which NIAF can withdraw without loss of benefit, cannot be fully met by the Capital Projects workstream because of the large and complex set of issues which the workstream is trying to address. Nevertheless, there is a powerful theory of change underlying NIAF’s Capital Projects engagement strategy, which is:
■ There is an open window of opportunity to make significant progress with the governance of capital projects. This is rooted in the enthusiasm and commitment to champion change among key individuals leading cross-cutting federal government institutions (notably FMOF, the OCEAP and CBN), all with strong support of the President;
52 NIAF2 Annual Review November 2013, DFID; NIAF Technical Review Panel reports 3: October 2013, and 4: March 2014, DFID 53 NIAF overall story and detailed sector stories compilation incorporating NIAF theories of change, NIAF, June 2014

Formative Evaluation of NIAF II
104
■ Clearly demonstrating gains achievable from applying improved budget and project prioritisation methods across a subset of the federal capital programmes, provides an opportunity to: (i) build impetus for longer-term and more extensive reforms; and (ii) establish a strong platform from which future interventions by DFID or other development partners can fully institutionalise the changes introduced;
■ A high level of interest in PPP to procure and finance major infrastructure projects provides an opportunity to showcase the rigorous preparation of major public capital projects, and to build project appraisal skills among government officials responsible for PPPs.
Steps can be taken by the Capital Projects workstream to promote the durability of the behavioural changes achieved by:
■ Promoting greater transparency so that commentators and stakeholders outside government can see and challenge the basis for project selection/prioritisation;
■ Providing the leadership team with well supported analyses and arguments which demonstrate the benefits achievable through better capital project screening and project prioritisation;
■ Promoting higher standards of professionalism among government officials responsible for project preparation and appraisal through focused training and capacity development; and
■ Using the preparation of high profile PPP projects, including the involvement of private sector counterparts, to demonstrate the high standards that must be adhered to for such projects to succeed, and which are necessary to ensure public resources are deployed most effectively.
How have they been applied in practice?
Political Economy Awareness
The workstream is engaging closely with Government at a very senior level. The fundamental objective of the workstream – which is to improve the quality of projects, and particularly larger flagship projects of Government – is directly supported by the Office of the President. The capital projects team is working directly with: (i) senior officials in entities that mostly oversee or coordinate the work of line ministries; and (ii) agencies responsible for the preparation and commissioning of infrastructure PPPs.
There is evidence of a high degree of cooperation with key agencies at federal, and to some extent state levels (e.g. Lagos). There is strong political support – and demand – from the President’s office, and focus is on those federal agencies with cross-cutting responsibilities which are strongly supportive of infrastructure planning and expenditure reform (particularly FMOF, and the OCEAP). There is also dialogue with and support from those Ministerial line agencies which show the strongest interest in introduction of the new systems for improved project planning and screening (Power, and to some extent Works).
The TRP notes the particular challenges that the Capital Project team faces in ensuring that the project screening and evaluation tools developed are actually implemented and provide long-term benefit in project planning and execution. There are two issues in this regard. The first is that it is the line ministries which will be responsible for systematising use of the tools – which have been developed by NIAF working through the planning and coordination agencies. Introducing these tools in the line ministries is a challenge as there are understandably areas of resistance to their introduction. An acute understanding and awareness of the political economy, and how to identify and use opportunities for the introduction of the tools will be critical to their adoption.
The second issue is that there is still a need to train potential users of the tools in the line ministries which will be using the tools. This is best done as the tools are introduced into

Formative Evaluation of NIAF II
105
ministerial operations, but again, political awareness and close collaboration with client ministries is required to ensure that opportunities are recognised and exploited effectively.
Under the PPP strand of the work, political economy awareness has again been demonstrated in identifying where the “quick wins” can be made on projects, and with institutions, that are well position for success, and thus to provide success stories which can be promoted and disseminated. This has been demonstrated by the NIAF support for the nascent NISA and in PPP transactions which support critical elements of infrastructure such as the Second Niger Bridge, Lagos-Ibadan expressway and Lekki-Epe expressway.
Demand responsiveness
The principle of demand-responsiveness is critical to the success of the capital projects workstream. The highly politicised and high profile nature of the CP workstream means that is can only be successful if there is a continuing and sustained strong demand for its services to: (i) deliver and support the development and roll-out of project screening and appraisal tools; (ii) develop and operationalise project monitoring and evaluation tools; (iii) support preparation of, and transactions for, quality PPP projects: and (iv) support and systematise labour-intensive rural roads maintenance.
Interviews with clients of the strands of work which support the development of project screening and evaluation tools and PPP projects have with few exceptions praised the responsiveness of NIAF in terms of both the quality and timeliness of responses to requests. Clients record the responsiveness of NIAF, but also the importance of working closely with the workstream management to identify specific support needs. Responding to demands rather than imposing programme approaches seems an appropriate approach to support and enable sustainability. However, a balance needs to be struck between maintaining support in accordance with the need to achieve proposed outputs, and responding to client demands which may not align tightly to NIAF outputs.
In this regard, there is a risk with the demand responsive approach that long-term or embedded consultants can be drawn into work for clients which diverges from their terms of reference, particularly where high-level clients are placed under political pressure to respond to non-NIAF issues and see the NIAF consultant as a good resource to help with matters which are outside the scope of work. However it appears that this risk has been well managed to date. Another risk relates to conflicts being created within the workstream. For instance NIAF is assisting NSIA is assessing opportunities to invest in PPP infrastructure projects and developing outline business cases (OBCs). However one of NSIA’s priorities in pursuing PPPs is to find ways of circumventing ICRC’s many rules for developing and appraising these projects, placing NIAF in the position of working with NSIA as it tries to bypass government rules, while working with FMoF to set up and implement these rules54.
Demand responsiveness means that difficult choices have to be made between competing demands for limited resources. Even so, spending on the capital projects workstream has increased significantly over previous years. Increased expenditure in year 2013/14 was in response to major new opportunities arising in programme areas seen as offering the prospect of delivering benefits that would have high added value both from DFID’s perspective and from the viewpoint of senior Nigerian decision-makers. New areas of work included: engagement on public works rural roads maintenance in Northern Nigeria; core support to the Nigerian Sovereign Investment Authority focused on the development of a high quality investment programme; work with Office of the Chief Economic Adviser on infrastructure/natural resource mapping; and the preparation of a development strategy directed towards reducing regional imbalances. However, the problem with opening up these new streams of work is that additional resources now need to be found to sustain them.
54 NIAF Technical Review Panel report November 2013, DFID

Formative Evaluation of NIAF II
106
The TRP55 notes that while the CP workstream is highly transformational in nature there remain risks including a focus on the immediate needs of clients rather than the achievement of longer-term program goals targeting sustainable institutionalization of reforms. Examples of this include adopting a low profile approach to the development and use of decision making tools – because of political sensitivities – which can compromise their wider acceptance and institutionalisation, and a focus on supporting PPP transactions rather than the more complex and difficult area of assisting in the development of a consistent policy and regulatory framework for PPPs.
The framework for responding to client requests has changed: NIAF’s original ‘commissioning’ model entailed a process whereby workstreams effectively sought PMU approval for individual projects on a case-by-case basis, demanding extensive explanation of Terms of Reference and how each individual project would contribute to the achievement of NIAF’s logframe. A standard screening criteria and scoring system was applied in establishing project suitability. NIAF II has moved away from the ‘commissioning’ model and case-by-case project approval by the PMU to a more strategic approach in which the CP workstream has developed and maintains Indicator Strategies for each output element for which it is responsible. These set out the proposed programme of work going forwards and the individual projects that will contribute to this. PMU approval is now required at the Indicator Strategy level. Sector Stories are intended to provide a higher level framework within which the Indicator Strategies themselves should sit. The requirements for individual project Terms of Reference now involve less emphasis on detailing how the particular intervention contributes to achievement of the logframe as this is dealt with elsewhere.
Flexibility
Flexibility means that NIAF can commit a series of relatively small inputs into what is a complex and highly politically influenced area of work, without having to commit to a long-term engagement or large and long-term programme of inputs. This is particularly important in the CP workstream where there is a high level of political influence and sensitivity among the partner agencies, and where there are major vested interests at play in the sector. Flexibility allows resources to be moved to areas of work where progress is more likely when strands of the work in other areas or with other clients become constrained by political sensitivity. It also allows these strands of work to again be picked up and taken forward once these issues are resolved.
NIAF has committed a number of embedded consultants to newly formed agencies and units (e.g. NISA, Apex PPP unit of MoF). These consultants are on annual rolling contracts and often supported by short-term specialists as required. Other agencies receive specialised long- and short-term inputs, also as required. This approach enables the workstream to respond quickly to changing circumstances, as and when opportunities present themselves which will support progress towards the achievement of program outputs, outcomes and impact.
The CP workstream has used the flexibility of the program well in helping it to be nimble in either slowing or accelerating support as circumstances dictate. Examples of this include the reduction of support to the SURE-P program on effective budgeting of priority projects and the shifting of emphasis from SURE-P to the FEC, where it is being led by the CEAP. A further example is the rapid ramping up of NIAF support to NSIA as it was able to champion transformation in the quality and speed of processing of PPP transactions. Flexibility contributes to cost-effective use of consultancy inputs which is appreciated by clients.
Influencing
The team (in accordance with TRP recommendations) is working to influence national decision-making bodies in order to build support for effective approaches to project
55 NIAF Technical Review Panel report March 2014, DFID

Formative Evaluation of NIAF II
107
prioritisation, evaluation, appraisal and monitoring and to mainstream the tools developed in the operations of key line ministries/MDAs. While there is strong support among client agencies for the tools developed, the real value of their use will only be seen once they are operated and institutionalised in line ministries and other MDAs. This becomes more urgent as the end of the NIAF programme in 2016 approaches and with a possible change in government in 2015.
The CP approach to influencing seems credible – there is a clear understanding among the client group – including the senior management team of FGN - of the value of proper planning, screening, evaluation and appraisal of projects to ensure value for money in infrastructure provision. However, due to the high level of political sensitivity and large numbers of vested interests in maintaining the status quo, the influencing strategy needs to be robust and flexible. There is still much work to be done in this area by the CP workstream, and innovation will be required.
NIAF’s influencing strategy in capital projects combines: (i) embedded staffing support to key institutions: both cross-cutting MDAs such as FMOF, NSIA, OCEAP, and LOPPP and line MDAs such as the FMOW and FMOWR; (ii) the focus of support on providing high quality assistance at senior levels in the short windows of opportunity following establishment of pivotal new institutions (for example NSIA) or the launch of major new initiatives (for example, at OCEAP and the apex PPP Unit in FMOF). (iii) maintaining strong engagement at the highest political levels, significantly facilitated by the above engagements and using this access to deliver key messages directly into the heart of the organisations developing reform processes when difficult decisions and/or urgent action has been required; and (iv) using NIAF presence and relationships across core federal institutions with key responsibilities for capital projects to deliver consistent high quality advice and leverage opportunities to build and support reform coalitions where there is clear alignment of aims, interests and ambition.
What has been the experience of applying these principles?
Success/failure
Overall, the key drivers of performance in the CP workstream appear to be: (i) strong and consistent demand from clients for workstream support which falls within the workstream’s ‘indicator strategy’; (ii) the ongoing, high quality technical support provided by the embedded, long- and short-term consultants, particularly in the newly-formed agencies; and (iii) the contribution made to the quality and timeliness of infrastructure PPPs transacted (for instance through development of OBCs).
There has been considerable success in the application of these principles to the CP workstream as evidenced by the high average score provided to the workstream by the TRP. The ability of the workstream to apply the principles has been instrumental in achieving this success. The high degree of senior management team support for the workstream in is part a function of political economy awareness, and further understanding of the influence of the political economy will be required to ensure that the tools developed under the workstream are embedded and institutionalised in infrastructure implementing institutions/MDAs. This will be partly determined by being able to demonstrate utility and success, and thereby generating demand; and is also likely to be dependent on having sufficient time to see this through. Achievement to date has been good, but ambition for the remainder of the program remains high. While the workstream could be significantly affected by the outcome of the 2015 elections, there will be a need to focus on what is achievable by 2016. Achievement of all planned outputs in the remaining 2.5 years of the programme will be a challenge. There is an acceptance that there are vested interests at play in many MDAs with good reason to attempt to derail adoption of the new tools and processes which would increase transparency.
Demand responsiveness has led to many clients indicating that progress in key areas of reform would have been at best slower, and at worst non-existent, without NIAF.

Formative Evaluation of NIAF II
108
Flexibility has been instrumental in achieving success, in providing the workstream with the ability to switch activities quickly to avoid abortive work, move sideways in order to work around blockages, and to seize opportunities as they arise.
The provision of these tangible and practice-oriented technical inputs has enabled the development of longer-term relationships and an increased likelihood of positive infrastructure and service-delivery outcomes. The main obstacle which NIAF faces in the CP workstream is getting the project scanning and evaluation models accepted, adopted, and systematically implemented by line infrastructure agencies and other MDAs. In terms of achieving the outcome indicator, the most pressing problem is agreeing on a baseline for the EIRR indicator, and getting the baseline established.
ASI seems to be particularly efficient at providing high quality consultants with very little delay from the first request. Of particular benefit, again much appreciated by clients, is the use of Nigerian and Nigerian diaspora consultants, who are widely held to understand the local context better and can work more easily with clients.
The transformational effect and sustainability of work in the CP workstream is likely to rely significantly on NIAF’s ability to get the project screening and evaluation tools embedded into procedures and workflows of a number of infrastructure ministries in order to achieve a critical mass.
How has failure been identified and dealt with?
It is too early to determine whether there have been failures under the CP workstream. However, there have been blind alleys down which the CP workstream has gone, but the flexibility of the approach has enabled other areas of support to be adopted, or other approaches to be used in order to obtain some benefit from the strand of work.
For example, the CP workstream was providing support to SURE-P to develop tools for labour-based construction, and develop the program of labour-based projects. However, the Public Works subcommittee of SURE-P is largely non-functional, and it has consequently been very difficult to get any formal agreements or decisions made regarding expansion of existing pilots. To mitigate this, NIAF have cultivated a direct relationship with Jigawa State, so some work can be salvaged if SURE-P agreements do not materialise. NIAF have started the process of reviewing existing pilots in order to present findings to SURE-P to allow for a controlled exist if SURE-P commitment continues to delay expansion and impact on delivery of 4.4 targets in H2.
How has the programme used successful projects?
The promotion of successful outcomes from the CP workstream is particularly important as many of the tools being developed are designed for application among Ministries and other agencies at both federal and state levels which plan, budget for and implement infrastructure projects. This has yet to happen. On the other hand there are now a number of examples of PPP projects which have achieved successful transactions with support from the CP workstream, and although this is appreciated by the clients, it is unclear how this success is being disseminated. Internally within NIAF, there is strong cross-fertilisation of success within the workstream – and across workstreams in some cases – e.g. between Capital Projects and Power, and Capital Projects and Roads, but this is not systematic.
Proof of successful tools will be their institutionalisation in the MDAs which are responsible for budget formulation and project execution.
Other experiences?
KEY RISK: In seeking to disengage from some clients to focus on other areas, is there a risk that critical mass has not been achieved and that perceived gains will be eroded? How to judge at which point to withdraw support?

Formative Evaluation of NIAF II
109
Where requests for support have been turned down, clients indicate that the response from NIAF has been that there is no financing, they could not find right person etc. It is unclear if these are the real reasons – there is the feeling among some clients that there is another agenda (focus on the North? Move towards certain projects for reasons of political favour or funding constraints?) The focus on the Northern Growth work is of course an issue for clients in the south, and does throw up an issue in terms of effectiveness. If success is generally greater in the south, there might be an incentive (under the RBFS) to continue support to activities in the south rather than redirecting resources to the north where capacity, and thus the conditions for success, are much weaker.
3.2 Implications of Applying NIAF’s Approach
What have been the implications for governance and management?
Client arrangements
Indications for the CP workstream are that the client arrangements work well in achieving intended workstream outputs. Clients value the high level of support and engagement provided by NIAF management, as well as the high quality of advisors provided.
The management of the CP workstream comes in for particular praise by the TRP, which mentions the high level of client responsiveness of CP workstream management.
Monitoring and evaluation; lesson learning
The Results Based Funding Structures (RBFS) combined with the TRP and AR monitoring arrangements appear to work well in ensuring that the performance of the program in achieving outputs is closely monitored and evaluated against the logframe. The programme performance against outcomes is less rigorously monitored, and for the CP workstream the outcome indicator needs to be reviewed in light of the difficulty in establishing a baseline for project EIRRs. With the absence of an appropriate and measurable output indicator, the ability of the programme to measure effectiveness is weakened.
The lessons of the experiences of the EC workstream are not being captured except through the findings of the external reviews of the TRP and ARs. These reviews are largely confined to the logical framework indicators which mitigates against wider lesson-learning. This runs against the expectations of a flexible, demand-led programme where documentation, the identification of success and failure factor and lesson-learning should be a necessary feature of programme management.
Programming for flexibility
Small, incremental engagements appear to work well especially for the CP team where project approaches are in the process of identification or early stage development. However, there are additional costs of implementing this demand-responsive, flexible approaches in the extra costs associated with many short term contracts.
The flexible programming approach in the case of the EC workstream has also taken time to gain traction with governments and to acquire a focused approach. The implications of the approach is that sufficient time should be allowed to embed processes and to achieve tangible impact, let alone transformational impact. The time remaining to the EC workstream to achieve this is a considerable challenge.
Has the programme been subject to political capture? If so, how has it dealt with it?
Demand responsiveness also means that NIAF runs the risk of being drawn into government programmes which may be politically driven, or not cost-effective or sustainable. However, it appears that the CP workstream has largely been able to avoid this, in spite of working in

Formative Evaluation of NIAF II
110
areas where there is strong political influence and vested interests. Where political pressures or sensitivities have been brought to bear on the workstream, the focus or emphasis of the work has been changed without compromising the focus on achieving outputs.
The overall objectives of improving the quality of infrastructure projects implemented by federal and state government agencies depends upon their adoption, institutionalisation and utilisation of the tools developed by NIAF in collaboration with client apex infrastructure planning and budgeting agencies. At least some target MDAs need to be able to adopt these tools and processes for the full outcome and impact to be realised.
Has the programme been able to balance the need to meet output indicators and be demand-responsive and flexible? If so, how?
The programme is broadly on schedule with the logframe milestone targets being met as scheduled or in some cases slightly delayed. The indicators for the CP workstream are quite specific, but in some cases (for instance with the number of PPP projects being transacted) the role of the workstream in achieving these targets is unclear as attribution is difficult. However, in general the workstream has been able to make significant progress in most logframe areas.
Achieving output targets while also being demand responsive and flexible has been possible because the workstream has established good relationships with a number of agencies, work with all of which can contribute to the achievement of output targets. This means that when progress in one area is slowed due to problems with moving project activities forward, there are options to ramp up work with other clients to achieve the project outputs from another direction.
Is the approach cost-effective? Are there any additional costs involved? If so, what?
The demand responsive approach to the programme requires a careful screening and monitoring of projects. The approach could cause the programme to commit to projects which ultimately fail, but the intention is to keep initial financial commitment small and incremental. In the case of the CP workstream, demand has exceeded supply, and the challenge is managing this demand in such a way as to ensure that the focus remains on gaining traction with clients and thus achieving intended outputs and outcomes.
The workstream can be characterised as potentially providing very great benefits, but at a very high level of risk. Based on progress made so far the approach has been cost effective. This is evidenced not just by client responses to the work carried out, but also in terms of money saved, or resources brought back to the sector as a result of NIAF support (e.g. IFC loans to renewables sector – development of PV).
However, whilst this risk exists, the programme analysis shows that the EC workstream is flexible enough, and has activities in enough areas and with enough clients, to be able to achieve intended outputs and outcomes (based on the formula where 50% of outputs need to be achieved, and subject to the ability to adjust Logframe targets as necessary)
The workstream uses a relatively high proportion of the total resources available (27% of projects and 26% of budget). The greatest expenditure is being made on the achievement of Output 3.3 – which is the support to PPP transactions, largely to NSIA.
Other implications?
A key implication of the NIAF approach from the CP workstream experience is (i) the difficulty of mainstreaming the tools and processes in MDAs; and (ii) the need to balance time required to establish the approach, identify client demand and put projects in place. Whilst NIAF has been very efficient in being able to put projects in place once the demand from the client has been articulated, in the case of the EC workstream where the institutional framework is so complex and where federal policy or engagement is almost absent, the preparatory work has

Formative Evaluation of NIAF II
111
required significant time. The programme analysis shows that expenditure has only started to ramp up since the beginning of 2013. Achievement of programme objectives, particularly if this ambition is to be strategic and transformational, will be challenging before the end of the programme in 2016 and with a possible change in government next year.
3.3 Lessons to be learnt from Capital Projects
What have been the factors determining success?
Support from the senior management team of FGN, including from the Office of the President, for the workstream.
Strong Sector Story and Theory of Change – good alignment between workstream objectives and projects supported.
Strong management of workstream with good understanding of political sensitivities of the work.
Close collaboration with clients in identification of areas of support, and in adjusting areas and intensity of support to respond to political sensitivities.
Development of practical approaches which have obvious utility for clients
Rapid deployment of high quality consultants, and particularly deployment of strong candidates from the Nigerian diaspora – especially for long-term embedded consultancies
Demonstration of successful approaches and project models to other clients (MDAs)
Where and why has the approach failed?
So far, the approach has not failed in the capital projects work area. The difficulty which is increasingly being faced is striking the balance between pushing ahead on well focused work strands which are politically sensitive, while also having to maintain the flexibility, and resources, to move into other areas in case the strand reaches a dead end.
It still has to be demonstrated that the CP workstream can mainstream the project screening and evaluation tools being developed into the work flows of key infrastructure agencies.
Which environments are likely to be the most successful?
Both apex institutions and ministries can be successful, but greatest success is likely only if there is a limit to political exposure (support cannot be universal due to vested interests). However, to have the kind of impact which NIAF seeks, a high level of political exposure is inevitable.
The environment most successful so far is work with semi-autonomous bodies which are less subject to political pressures – e.g. NISA – and new entities which do not have direct responsibility for infrastructure development – e.g. apex PPP unit in FMoF.
NIAF has been working successfully to help develop new agencies or units where new approaches are possible e.g. NISA and PPP; and less successfully with MDAs which have well established institutional structures and a related high level of political pressure and vested interests.
What does the programme need to have in place in terms of resources, skills and management in order for the NIAF approach to succeed?
Management needs to be both expert and innovative. For larger projects there is merit in dividing workstream leadership between a workstream leader to provide intellectual and technical leadership and manager (to find people and administer contracts). This is the case under NIAF II and while relatively expensive, appears to be working well in freeing up the workstream leader to focus on building client relationships and dealing with technical matters.

Formative Evaluation of NIAF II
112
The contractor needs to be able to source high-quality, appropriately experienced consultants in short time. The success of NIAF has undoubtedly resulted from: (i) a strong core management team; and (ii) an effective system for access high quality technical experts quickly.
Flexible contract and management arrangements that allows failure and rapid changes to tasks in ToR and redirection of resources as necessary to maintain the overall direction of the work, but adopting a variation on approach, or change in focus with client organisation is critical.
High level political support at both federal and state level (where interventions are at state level)
Strong vision of what is achievable, and the mechanisms to achieve it, among the client organisations, donor and contractor.
Time to develop and showcase successful models to enable upscaling and transformation, and then support to enable these approaches to be institutionalised in client organisations.
Solid framework for reform which has high level support among all client organisations.
Programs of this nature tackling highly politicised issues in an environment where there are deeply entrenched vested interests must have the flexibility to move quickly within the program framework – this also implies a dynamic logframe.
There is a potential danger of output-led driver for performance and Results Based Funding Structures (RBFS) compromising achievement at outcome level, as resources are directed to “easier” outputs..
The TRP provides a mechanism for third party evaluation which should be able to ensure that there are no major departures from program objectives
Other lessons?
The contractor of a similar facility needs to be able to access a wide range of skills at short notice
There needs to be an effective mechanism for keeping downward pressure on fee rates, and if an RBFS is used, that there are systems to ensure that there is a continual focus on achieving outputs across the logframe, insofar as these are necessary to deliver the anticipated outcomes and impact.

Formative Evaluation of NIAF II
113

Formative Evaluation of NIAF II
114
TheNIAFapproach:EffectiveCitiescasestudy
1 Introduction This case study examines in more depth the Effective Cities workstream of the NIAF II programme. It focuses on the application of the ‘NIAF approach’ examining how the principles of demand responsiveness, flexibility, political economy awareness and influencing are understood and applied. It considers the expected returns from the approach, investigates the likely overlaps and interdependencies between the four principles.
1.1 Purpose and structure of the study report The purposes of the case study are to:
■ provide in-depth exploration of the second evaluation question, focusing on the role of the NIAF strategic principles in underpinning results and delivery;
■ contribute to evaluation objectives; and ■ generate lessons for wider learning on flexible, demand-responsive modalities.
The Effective Cities workstream is one of the new sectors for the NIAF II programme. The other case studies examine the experience of the Power and Capital Projects workstreams. All case studies will be repeated for the summative evaluation to allow a longitudinal observation.
The study report considers in the next section the NIAF approach and the strategic principles involved; describes in section 2 the Effective Cities workstream; and in section 3, how the NIAF approach has been applied in practice within the Effective Cities workstream; the implications of such an approach; and lessons to be learnt from the Effective Cities’ experience.
1.2 NIAF approach and strategic principles The NIAF II business case and subsequent refinement by the NIAF PMU articulates a theory of change which argues that high quality and well-targeted technical assistance can (i) increase the funds available for infrastructure spending, (ii) strengthen the effectiveness of existing expenditure, and (iii) thus reduce poverty through faster development associated with better infrastructure provision.
The long-term change sought by NIAF II is that more effective infrastructure investment in Nigeria supports growth and the reduction of poverty. This is reflected in the NIAF II log frame impact and outcome statements:
■ Impact Reduced infrastructure constraints to growth in non-oil gross domestic product and employment, leading to reduced poverty
■ Outcome Enhanced management of infrastructure development at the federal level and in selected states
The process of change rests on an approach that is guided by four strategic principles. Together, these strategic principles are expected to drive the NIAF II theory of change and underpin the successful achievement of NIAF objectives. These principles are:
■ Demand responsiveness – Focus on sectors and processes which are acknowledged by government to
require NIAF support and where there is a clear demand from a qualifying Nigerian institution

Formative Evaluation of NIAF II
115
– Work collaboratively with clients to align client demand with NIAF programme priorities and build partnerships incrementally committing to small project engagements which gradually build to a productive partnership.
■ Flexibility – Take advantage of windows of opportunity to rapidly allow critical
interventions to be effective – Provide different types of support and specialist expertise (short-term, full
time or embedded consultancy inputs) to respond to demands for support. ■ Political economy awareness
– Maintain a high level of awareness of political economy issues and their implications for delivering assistance that will lead to action;
– Ensure strong engagement at the highest political levels to deliver key messages directly into the heart of decision-making processes.
■ Influencing – Establish and use key relationships across a network of core federal
institutions to deliver consistent and connected advice and build coalitions for reform;
– Use concise action-oriented summary notes to convey critical advice at the most senior levels;
– Demonstrate the success of working with one client as the launch pad for engagement with another.
2 Background to Effective Cities The Effective Cities workstream was included in the NIAF II programme as a response to Nigeria’s rapid and increasing rate of urbanisation. This is seen as a threat to Nigeria’s potential growth but also as an opportunity for NIAF to support the improved management and development of urban economic growth. The theory of change behind the design of the Effective Cities workstream is that improved management of urbanisation can fuel national economic growth as has been seen in recently emerging economies. Whilst NIAF is providing essential power and roads infrastructure through work in other sectors, Nigerian cities are currently lacking effective physical infrastructure, public services, effective transport systems for internal movement of goods and people, and for inter-connectedness and serviced land to enable and accelerate growth. Addressing these areas will allow Nigerian cities to become engines of growth, improve access to markets and social infrastructure for the poor, and raise standards of living. Improved management based on data- and evidence-based policy and planning can help to support a diversification of the urban economy and pro-poor development. NIAF is working to improve the institutional capacity for planning and management through new institutions and improved data (including spatial data) and practical skills of government staff, primarily from State governments working at urban level. The workstream comprises two ‘strands’ – urban development aimed at establishing City Development Offices to better coordinate access to serviced land and municipal services; and urban transport focused primarily on developing the technical and financial resources for transport planning including improved and affordable public transport. Implicit in the approach is collaboration with the other NIAF sectors all of which are intended contribute to sustainable, climate-resilient urban economic growth.
The technical approach of the workstream is summarised by NIAF in Figure 1 below.

Formative Evaluation of NIAF II
116
Figure 1: Effective Cities Workstream: Schematic Representation of Technical Approach

Formative Evaluation of NIAF II
117
The Annual Review of 2013 reported progress against the expected results for the Effective Cities (and Northern Growth) outputs (and the associated indicators) to be in line with, or just below expectations as follows:
– 6.1 Number of cities with public mass transit schemes being implemented (beyond the NIAF 1 Lagos scheme) in NIAF supported cities – progress is in line with expectations.
– 6.2 Weighted number of additional passenger trips using formal urban public transport services in NIAF supported cities. (Trip numbers to be based on daily average for month of November) Weightings are included in the NIAF logframe tools – Progress appears to be just below expectations, however there are some measurement issues regarding the indicator.
– 6.3 Area of additional serviced land for expansion of urban economic development in NIAF supported cities – progress is close to expectations with some delays.
– 4.2 Number of additional people accessing improved municipal service delivery (water supply, sanitation, solid waste management) in NIAF supported cities in Northern States. Progress is in line with expectations.
Both the Annual Review team and Technical Review Panel commented (in 2013)56 that further work was required to better define a strategic focus for the Effective Cities work and to draw closer links between the urban development and urban transport work components, and between national policy influence and city-level institutional and project development. The risk foreseen was that the workstream could fail to be sufficiently transformational if work focused on many, scattered projects and was not able to influence the national policy environment. The AR commented that ‘A key challenge … is to set out an overall strategic vision for the sector. This would contribute to better integration of the various work packages – and in particular better integration and linkages between the planning / institutional activities and urban transport – and provide a framework for urbanisation and growth at the national and state levels’. However, work has progressed on these fronts and the TRP commented in the report of its latest visit (March 2014)57 ‘We are satisfied that both components, urban and transport, can now sufficiently be accommodated in a broader strategic framework’. Both the AR team and TRP suggested a change to the logframe to promote work within the national policy environment. The TRP comments that little has so far been done on water and sanitation as was originally intended.
3 NIAF’s Approach & Effective Cities
3.1 NIAF’s Approach in practice
How are NIAF strategic principles documented in the Effective Cities ‘story’ or theory of change?
The strategic principles of the NIAF approach are documented within the Effective Cities workstream’s theory of change. They make up the workstream’s ‘Influencing Strategy’ as described in the Effective Cities ‘Story’58. This describes the process approach to the work of the Effective Cities and how the strategic principles work together.
56 NIAF2 Annual Review November 2013, DFID; NIAF Technical Review Panel report October 2013, DFID 57 NIAF Technical Review Panel report March 2014, DFID 58 NIAF overall story and detailed sector stories compilation incorporating NIAF theories of change, NIAF, June 2014

Formative Evaluation of NIAF II
118
How have they been applied in practice?
Political Economy Awareness
Political economy awareness and influencing are perhaps at the core of the urban development approach – acknowledging the lack of Federal and to a lesser extent State interest in urban management. The TRP noted the importance of engaging at National policy level (more strategic than technical projects). NIAF is now engaging with national councils (transportation, land and housing) and professional associations (urban planners), and with donors working at national level. An Inter-Ministerial Steering and Project Delivery Committee for the Effective Cities Development of Metropolitan Areas has been established at Federal level; and at State level there is close consultation with State Governors, MDs and Directors to seek political buy-in. The workstream has been cognisant of the lack of a power centre at city level and has worked with key State authorities – in doing so, they are also developing new institutions (City Development Offices (CDOs) and Metropolitan Transport Authorities (MTAs)) that are appropriate to carry out the planning and management functions required. There are risks inherent in this approach – a lack of legal status, a change in political support and non-sustainability. It will be key for the EC team to demonstrate the necessity of the new institutions and to promote legislation to ensure their sustainability.
Demand responsiveness
The principle of demand-responsiveness (combined with flexibility) is important for the Effective Cities workstream because of the lack of a clear institutional framework for urban management, and because the urban workstream does not appear to respond to high demand from Federal or State governments. However the NIAF teams have been effective in stimulating demand from specific departments and generating political support, particularly at State level.
It has recognised the need for the workstream to be opportunistic in responding to demands from a range of agencies in the urban environment which can support NIAF objectives; and has now established an approach focusing on the development of new agencies (Metropolitan Transport Authorities - MTAs and City Development Offices - CDOs) and through PPPs for new models of service delivery.
Responding to demands rather than imposing programme approaches seems appropriate to enable sustainability. However, demand responsiveness also means that NIAF is sometimes drawn into government programmes which may be politically driven, or not cost-effective or sustainable. Examples are the proposal by the Kano Urban Transport Office for light rail, and the solid waste management system in Kaduna which is currently proposed to exclude high density, low income areas.
The TRP59 highlights the risk that the Effective Cities workstream may not be sufficiently transformational. It notes the ‘disjointed nature of the urban environment… which decreases the ability to address transformational issues at a level which will ensure federal impact’; and comments that there are many small projects which are not necessarily engaging or influencing national policy influencing. It goes on to comment however that it is satisfied that ‘that both components, urban and transport, can now sufficiently be accommodated in a broader strategic framework’.
Flexibility
Flexibility means that NIAF can commit a series of relatively small inputs into what is a relatively high risk environment without committing to large and long term programme inputs.
NIAF has committed a number of embedded consultants to newly formed agencies (LAMATA, KNUPDA etc). These consultants are on annual rolling contracts and often supported by short-term specialists as required. Other agencies receive specialised long- and short-term inputs also as required. This seems to be a cost-effective use of consultancy inputs which is appreciated by clients. 59 NIAF Technical Review Panel report March 2014, DFID

Formative Evaluation of NIAF II
119
There is perhaps less flexibility in both the Urban Transport and Urban Development approaches as they have now adopted a similar model for all cities. However, this is probably desirable in order to achieve better coherence and a more strategic approach (as recommended by the TRP and AR teams).
Influencing
The team (in accordance with TRP recommendations) is working to influence national decision-making bodies in order to build support for effective approaches and institutional architecture for urban planning and management. It is using pilot projects and city-level successes to influence agencies in other cities.
This becomes more urgent as the end of the NIAF programme in 2016 approaches and with a change in government.
The EC approach to influencing seems credible – to demonstrate why planning and urban management are required and the institutions to achieve it. This can have a national impact by demonstrating success in a series of cities in selected States. The key is to have success to demonstrate and the time to gain influence. The urban development component is starting to show some tangible success to improve service delivery (solid waste management) and in the planning of serviced land. However, these are early days in the development of these projects. Both urban development and urban transport components are now also able to use the success of models and practices developed in some cities (notably Lagos) to assist the institutional and technical work in other cities e.g. Kano and Kaduna.
What has been the experience of applying these principles?
Success/failure
Success is being seen in the activities of the embedded consultants in the MTAs and CDOs. They are able to work responsively and flexibly supporting the needs of the selected agency. Particular success is found where there is strong and visionary leadership of the agency e.g. LAMATA and LAGBUS, or in Enugu CDO.
Client satisfaction is quite mixed. The consultation during the evaluation60 indicated that responsiveness to needs was rated as moderate to a great extent; help provided was largely rated as moderate; capacity building was rated to a great extent for urban transport although quite mixed in urban development (a small to a very great extent); changes brought to the organisation were also rated very mixed in both components – from a small extent to a very great extent; value added by NIAF was largely rated moderate to a great extent.
Interviews also indicated that the support provided by NIAF was of great value to the newly-created agencies.
The drivers of performance in the EC workstream appear to be the ongoing, high quality technical support provided by the embedded consultants in the newly-formed agencies in both urban development (CDOs) and urban transport (MTAs); the policy and planning frameworks in particular for urban transport; and the foundation for these – the spatial databases provided through surveys, data compilation and mapping – most of which were unavailable to these agencies without NIAF support. The provision of these tangible and practice-oriented technical inputs has enabled the development of longer-term relationships and the likelihood of positive infrastructure and service-delivery outcomes.
The obstacles which NIAF faces in the EC workstream are the means through which to upscale and institutionalise some of the approaches and institutional arrangements particularly in the urban development strand. This will be partly determined by being able to demonstrate utility and success, and
60 Client consultation report August 2014

Formative Evaluation of NIAF II
120
thereby generating demand; and is also likely to be dependent on having sufficient time to see this through. Achievement in the remaining 2.5 years of the programme will be a challenge.
ASI seems to be particularly efficient at providing high quality consultants with very little delay from the first request. Of particular benefit, again much appreciated by clients, is the use of Nigerian and Nigerian diaspora consultants, who are widely held to understand the context better and can work more easily with clients.
The team (in accordance with TRP recommendations) is working to influence national decision-making bodies in order to build support for effective approaches and institutional architecture for urban planning and management.
The transformational effect and sustainability of work in the EC workstream is likely to rely significantly on NIAF’s ability to stimulate and influence a national urban policy debate. Whilst this is mentioned in the EC ‘Story’ and ToC, it is does not feature in the NIAF logframe.
Given the short timeframe of the NIAF II programme until its end in 2016, it will be necessary for NIAF to clearly define what it considers to be realistically achievable by the end of the programme and to focus on that level of ambition. This ambition then needs to be reflected in an outcome indicator so that performance may be defined and measured.
How has failure been identified and dealt with?
There have been a number of pilot projects undertaken particularly by the urban development component with a view to demonstrating the use of data or service delivery. It has not been possible to discern failed projects as such although it seems that some have not been followed through (Lagos markets, Enugu CDO) but this has been to changes in programme budgets and a shift of emphasis to the North.
How has the programme used successful projects?
The programme has used successful projects, notably in Lagos (LAMATA and LAGBUS) and Enugu (CDO), to demonstrate possibilities to other cities.
3.2 Implications of Applying NIAF’s Approach
What have been the implications for governance and management?
Client arrangements
The Effective Cities workstream, particularly the UD component has had to work hard to find and engage with demand for technical assistance in the absence of clear institutional arrangements for the governance of urban development and transport. It has meant that clients are primarily (if not all) at State level. The AR and TRP have both commented that this runs the risk of having many scattered projects which may not be transformational. On the other hand, it has allowed the workstream for both UD and UT to be fairly innovative both in the development of an institutional architecture and in new models of service delivery.
The development of new agencies (CDOs and MTAs) for State governments has involved the placement of embedded consultants. This has proved to be successful with clients appreciating the injection of skills and experience into other wise uncharted territory for them; and the consultants being able to provide full-time, long-term support for enthusiastic clients and staff. However, the new agencies also involve risk associated with the lack of a legal and regulatory framework and possible changes in government and political support and non-sustainability.
The absence of federal government demand for engagement in urban management has meant that the programme has sought to stimulate and engage with ongoing discussion of urban issues with a wider

Formative Evaluation of NIAF II
121
range of stakeholders. In accordance with recommendations from the AR team and the TRP reports, the EC workstream is now working to stimulate a national urban policy discussion through engagement with national councils on Transportation, Land and Urban Development, as well as discussions with the national association of town planners.
Monitoring and evaluation; lesson learning
The results-based financing structure means that the monitoring of performance of the Effective Cities, as for the whole of NIAF, is undertaken bi-annually with a thorough review of output indicators and performance milestones.
However, the approach to improved urban development has only recently been defined and results are only just emerging. More time is almost certainly needed to build institutional strength and to sustain a capacity for urban planning and management. The current Output statement and indicators do not adequately align with this approach (there is no indicator to reflect national policy dialogue and serviced land and the only UD indicator does not reflect the more strategic approach now adopted). Furthermore, there is currently no measurable Outcome indicator and that proposed does not reflect an appropriate level of ambition for the end of the programme. Thus, with the absence of appropriate Output indicators or measurable Outcome indicator, the ability of the programme to measure effectiveness is weakened.
The lessons of the experiences of the EC workstream are not being captured except through the findings of the external reviews of the TRP and ARs. These reviews are largely confined to the logical framework indicators which mitigates against wider lesson-learning. This runs against the expectations of a flexible, demand-led programme where documentation, the identification of success and failure factor and lesson-learning should be a necessary feature of programme management.
Programming for flexibility
Small, incremental engagements appear to work well especially for the UD team where project approaches are in the process of identification or early stage development. However, there are additional costs of implementing this demand-responsive, flexible approach in the extra costs associated with many short-term contracts.
The flexible programming approach in the case of the EC workstream has also taken time to gain traction with governments and to acquire a focused approach. The implications of the approach is that sufficient time is required to embed processes and to achieve tangible impact, let alone transformational impact. The time remaining to the EC workstream to achieve this is a considerable challenge.
There is perhaps less flexibility in both the UT and UD approaches as they have now adopted a similar model for all cities. However, this is probably desirable in order to achieve better coherence and a more strategic approach (as recommended by the TRP and AR teams).
Has the programme been subject to political capture? If so, how has it dealt with it?
Demand responsiveness also means that NIAF is sometimes drawn into government programmes which may be politically driven, or not cost-effective or sustainable. Examples are the proposal by the Kano Urban Transport Office for light rail, and the SWM system in Kaduna which is currently proposed to exclude high density, low income areas.
The objectives for improving access to services remain hostage to the State authorities from which commitment is needed to extend services to poorer settlements (an example of where this is at risk is in Kaduna where the NIAF intention for SWM services is to cross-subsidise fee-paying collection in low density areas to include high density areas. The priority of the State government appears to be revenue mobilisation rather than for cross-subsidy and the likelihood appears at present to be that the high density, low-income areas will be excluded from the service improvements). It was not clear at the time of the evaluation visit how the programme might be able to address this.

Formative Evaluation of NIAF II
122
Has the programme been able to balance the need to meet output indicators and be demand-responsive and flexible? If so, how?
The programme is broadly on schedule with the logframe milestone targets met or slightly delayed. The indicators are high-level (cities with mass transit, additional passenger trips, additional serviced land and (in Northern cities) additional people accessing improved service delivery) and do not comprise process indicators or reflect the wider scope of the workstream is doing. To this extent, the AR and TRP scoring systems do not align with the achievements of the programme. However reporting for both the AR and TRP acknowledge this and whilst recommending amendments to the output indicators, are able to take into account the wider activity undertaken within the workstream.
Is the approach cost-effective? Are there any additional costs involved? If so, what?
The demand responsive approach to the programme requires a careful screening and monitoring of projects. The approach could cause the programme to commit to projects which ultimately fail but the intention is to keep financial commitment small and incremental. In the case of the EC workstream, especially the UD component, where demand from clients has been slow to emerge and clients themselves are inexperienced, the identification of successful projects is likely to be more challenging. However, whilst this risk exists, the programme analysis shows that the EC workstream currently has a relatively low share of projects within NIAF and, in terms of allocated budget are below the average size for the programme as a whole. The most costly projects in the EC workstream are those for surveys (e.g. travel demand), for infrastructure investment. A stand-out in the latter is for the Lagos Markets (Iyana Ipaja and Oke Ado) Public Lighting project which is amongst the most costly of NIAF projects. Whilst this investment may be appropriate as a demonstration, the cost to NIAF seems high. A visit to the project also raised questions concerning sustainability (lighting provided within otherwise unimproved market areas and no allowance for cost recovery).
Other implications?
A key implication of the NIAF approach from the EC workstream experience is the time required to establish the strategy and approach, identify client demand and put projects in place. Whilst NIAF has been very efficient in being able to put projects in place once the demand from the client has been articulated, in the case of the EC workstream where the institutional framework is so complex and where federal policy or engagement is almost absent, the preparatory work has required significant time. The programme analysis shows that expenditure has only started to ramp up since the beginning of 2013. Achievement of programme objectives, particularly if this ambition is to be strategic and transformational, will be challenging before the end of the programme in 2016 and with a change in government next year.
3.3 Lessons to be learnt from Effective Cities
What have been the factors determining success?
The key factors determining success for the Effective Cities workstream appear to be the following:
■ Identification of demand and close collaboration with clients ■ Development of practical approaches which have obvious utility for clients ■ Rapid deployment of high quality consultants ■ Use of Nigerian diaspora – especially for long-term consultancies ■ Support of specialised short-term consultants ■ Demonstration of successful approaches and project models to other clients
Where and why has the approach failed?
There are no discernible instances where this approach has failed.

Formative Evaluation of NIAF II
123
Which environments are likely to be the most successful?
NIAF has been working to develop new agencies where new approaches are possible e.g. MTAs and PPP; and new agencies where no institutional framework exists and where new approaches are needed e.g. CDOs.
What does the programme need to have in place in terms of resources, skills and management in order for the NIAF approach to succeed?
The key factors which appear to be determining whether the NIAF approach can succeed are:
■ The ability to source high-quality, appropriately experienced consultants in short time ■ Management needs to be expert and innovative ■ Flexible, short-term contract for project consultants and management allows failure ■ High-level political support for programme interventions ■ Flexible programme management from DFID allied to the results-based payment system ■ Visionary leaders or CEOs of client organisations ■ Time to develop and showcase successful models to enable upscaling and transformation.

Formative Evaluation of NIAF II
124
Annex 10 Evaluation Programme Itinerary

Formative Evaluation of NIAF II
125
Annex 11 List of Interviewees
Stakeholder (Client/NIAF etc)
Workstream Client counterpart
Title Contacted by
Abuja Urban Mass Transport Company
Urban Transport
Abdulrazaq Oniyangi
Managing Director FDI
Bank of Industry Climate Change
Michael Oye Project Manager FDI
Bureau of Public Enterprises
Power Ibrahim Babagana
Ag Director Power Core evaluation team
Bureau of Public Enterprises
Roads Terhemen Andzenge
Infrastructure Regulation
FDI
Central Bank of Nigeria
Climate Change
Paul Nduka Eluhaiwe
Director, Development Finance Department,
FDI
Central Bank of Nigeria
Infrastructure Delivery and Finance
Dr. Kingsley Obiorah
SA to the Governor FDI
UK Department for International Development
N/A Keith Hammond Infrastructure Adviser
Core evaluation team
Enugu Capital Territory Development Authority
Urban Development
Ik Uguwegede Honourable Commissioner
FDI
Satellite Towns Development Agency
Urban Transport
Engr. Ibrahim Tukur Bakori
Director Core evaluation team
FCT-Transport Secretariat
Urban Transport
Engr Jonathan Ivoke
Executive Secretary Core evaluation team
Federal Roads Maintenance Agency
Roads Emeka Agbasi Director FDI
Federal Ministry of Environment
Climate Change
Engr Bahijjahtu Abubakar
Head, Renewable Energy Program
FDI
Federal Ministry of Finance
Infrastructure Delivery and Finance
Hajiya Larai Shuaibu
Director FDI
Federal Ministry of Power
Power Professor Chidebere Onyia
Chief of Staff to Hon. Min of Power
Core evaluation team
Federal Ministry of Special Duties
Infrastructure Delivery and Finance
Mrs. Winifred Oyo-Ita, FCA
Permanent Secretary FDI
Federal Ministry of Works
Infrastructure Delivery and Finance
Engr. Tunde Ekunsumi
Deputy Director PPP FDI

Formative Evaluation of NIAF II
126
Stakeholder (Client/NIAF etc)
Workstream Client counterpart
Title Contacted by
Federal Ministry of Works
Roads Engr Bala Danshehu
Director Planning and Development
FDI
Federal Ministry of Water Resources
Infrastructure Delivery and Finance
Engr. Benson Ajisegiri
Head, Water Sector Reform & PPP Unit
FDI
House Committee on Climate Change
Climate Change
Hon Eziuche Ubani
Chairman, Committee on Climate
FDI
Initial Stakeholder Advisory Panel
Power Abdulkadir Shettima
Head of Secretariat FDI
Jigawa State Alternative Energy Fund
Climate Change
Engr Sani Mohammed
Executive Secretary FDI
Kano Road and Traffic Agency
Urban Transport
Muhammad Diggol
Managing Director FDI
Kaduna Women's Economic Advancement Forum
Climate Change
Aisha Musa Leader Core evaluation team
Kaduna State Environmental Protection Authority
Urban Development
Alh. Aminu Sani General Manager Core evaluation team
Kano State Urban Planning & Development Authority
Urban Development
Isyaku Muhtar Kura
Managing Director Core evaluation team
Kano Urban Transport Project Office
Urban Transport
Najeeb Abdussalam
Director Core evaluation team
LAGBUS Asset Management Limited
Urban Transport
Babatunde Disu Managing Director Core evaluation team
Lagos Metropolitan Area Transport Authority
Urban Transport
Dayo Mobereola
Managing Director FDI
Lagos State Waterways Authority
Urban Transport
Yinka Marinho Managing Director FDI
Lagos State Office of Public Private Partnerships
Infrastructure Delivery and Finance
Ayo Gbeleyi Honorable Commissioner of Finance LaSG
Core evaluation team
Lagos State Electricity Board
Urban Development
Damilola Ogunbiyi
General Manager Core evaluation team
Ministry of Environment and Natural Resources
Urban Development
Ahmed Abdu Zaria
Permanent Secretary Core evaluation team
Market Operator Power Veronica Market Operator FDI

Formative Evaluation of NIAF II
127
Stakeholder (Client/NIAF etc)
Workstream Client counterpart
Title Contacted by
Osuhor (Nigerian Counterpart)
NIAF II PMU N/A David Storey Team Leader Core evaluation team
N/A Adam Molleson Senior Programme Manager
Core evaluation team
N/A Khadijat Baba-Muhammad
M&E Manager Core evaluation team
N/A Matt Uzzell ASI - Director Core evaluation team
Power Joel Leonard Acting Workstream Leader
Core evaluation team
Roads Greg Morosuik Workstream Leader Core evaluation team
IDF Mark Tomlinson Workstream Leader Core evaluation team
Climate Change
Ewah Eleri Workstream Leader Core evaluation team
Urban Development
Mike Mutter Workstream Leader Core evaluation team
Urban Transport
Kayode Khalidson
Workstream Leader Core evaluation team
Power Rosa Stewart Program Manager (Power)
Core evaluation team
Roads and Finance
James Turley Program Manager (Roads, Finance)
Core evaluation team
IDF, Climate Change
Frederik Veldman
Program Manager (IDF, CC)
Core evaluation team
Urban Development, Urban Transport
Thomas Pascoe Program Manager (UD, UT)
Core evaluation team
Sumi Saha Program Manager Core evaluation team
National Alliance for Clean Cookstoves
Climate Change
Precious Onuvae
Market Development Manager
FDI
Nigerian Bulk Electricity Trading Company
Power Rumundaka Wonodi
Chief Executive Officer
FDI
Nigerian Electricity Liability Management
Power Samuel J. Agbogun
Chief Executive Officer
FDI
Nigerian Electricity Power Eyo Ekpo Commissioner Core evaluation

Formative Evaluation of NIAF II
128
Stakeholder (Client/NIAF etc)
Workstream Client counterpart
Title Contacted by
Regulatory Commission
team
National Integrated Power Project
Power Robin Evans Head of Transmission
FDI
Nigerian Integrated Water Resources Management
Infrastructure Delivery and Finance
Mr. Reuben Habu
Director General FDI
Nigerian Railway Corporation
Urban Transport
FDI
Nigeria Sovereign Investment Authority
Infrastructure Delivery and Finance
Uche Orji Chief Executive Officer
Core evaluation team
Office of the Chief Economic Advisor to the President
Infrastructure Delivery and Finance
Dr. Nwanze Okidegbe
Chief Economic Advisor
FDI
Presidential Task Force on Power
Power Engr Beks Dagogo-Jack
Chairman Core evaluation team
Rural Electrification Agency
Climate Change
Engr Ken Achugbu
Managing Director / Chief Executive Officer
FDI
Kano Refuse Management & Sanitation Board
Urban Development
Abdullahi Shehu Bichi
Managing Director FDI
System Operator Power Depak Sharma Executive Director, System Operations
FDI
Subsidy Reinvestment and Empowerment Programme
Infrastructure Delivery and Finance
Femi Bolaji Roads and Bridges PIU (NIAF Consultant)
FDI
Transmission Company of Nigeria
Power Mack Kast Chief Executive Officer
FDI
Transition Steering Group
Power Abdulkadir Shettima
Head of Secretariat FDI
The World Bank Climate Change
Eric Fernstrom Energy Team Lead Core evaluation team
Zamfara State Government
Infrastructure Delivery and Finance
Alhaji Mohammed Muttaka Rini
Commissioner for Local Government
FDI

Formative Evaluation of NIAF II
129
Annex 12 Interview Checklist – Client Organisations
1. Describe NIAF support a) Discuss with the stakeholder how NIAF supported.
- Project details, name of consultant, number of days, outputs, way of working etc. 2. Relevance
a) Present the theory of change – Does this reflect your view of the sector? - Has NIAF support been made at the most effective point in the ToC? - Are the assumptions which underlie this ToC clearly articulated – are there any
others which should be included?
b) How has NIAF made itself relevant to your departmental polices and priorities? - How did you decide on this project? - How did NIAF guide the decision? - Is the NIAF support clearly linked with wider government priorities?
c) How NIAF responded flexibly to demands?
-What are the criteria for acting on a request from govt?
3. Impacts a) What has been the effect of NIAF support? (reference the outcome and outputs on log
frame for each sector) - To what extent were these the planned results? - To what extent (if any) has there been evidence at the outcome level - To what extent (if any) is there evidence of progress at the impact level - What savings have been made as a result of NIAF support – these can be direct, or
indirect, but some quantification would be helpful.
b) How have you and /or NIAF collected data about the effects of their support?
c) Has NIAF explicitly assisted with pro-poor development? - Consultation with poor communities? - Have poor communities been targeted in any other way? - Are there any measures of impacts on poor communities?
d) Has NIAF support to your project influenced other programmes or stakeholders? If so, how?
e) Has NIAF support leveraged further funding? If so how?
f) Are there other areas in which NIAF support could have significant impacts? 4. Effectiveness
a) Has NIAF support been offered according to the plan initiated at the start of the project? If not, how has it differed and why?
b) With hindsight, would you have gone about working with NIAF differently?

Formative Evaluation of NIAF II
130
c) What could NIAF have done better?
d) Do you think that these insights about improvement are known to NIAF? Have they asked you what you would have improved?
5. Efficiency a) How responsive have NIAF been? Has NIAF been flexible in response to your needs?
b) How easy has it been to engage with NIAF processes?
c) To what extent have the small changes made by NIAF led to any larger changes?
d) What have the costs been of working with NIAF? - How do these costs compare with other similar programmes?
6. Sustainability a) How and to what extent will the impacts of NIAF be sustained in the future?
- Is TA support decreasing over time? - Have strategies or plans been developed? - What support is there to the implementation of plans and strategies? - Does NIAF support align well with wider government priorities? - How have skills been embedded into beneficiary organisations - Has NIAF had an explicit exit strategy?
7. Value for Money a) Is NIAF II likely to play a role in increasing public and private sector funds for
infrastructure provision in Nigeria? Is there more that NIAF II could do to stimulate investment
b) How have costs been benchmarked? c) NIAF VfM indicators?

Formative Evaluation of NIAF II
131
Annex 13 Additional Client Survey Questionnaire
1. To what extent has NIAF responded to your needs?
Not at all To a small extent To a moderate extent
To a great extent To a very large extent
Are there ways in which NIAF can improve?
2. To what extent has NIAF helped your organisation?
Not at all To a small extent To a moderate extent
To a great extent To a very large extent
What would you say the greatest benefits have been?
3. To what extent has NIAF support to your organisation impacted on poverty?
Not at all To a small extent To a moderate extent
To a great extent To a very large extent
How has NIAF support reduced poverty?
4. To what extent has NIAF built capacity within your organisation
Not at all To a small extent To a moderate extent
To a large extent To a very large extent
How has NIAF built capacity?
How would you like NIAF to build capacity in the future?
5. What is the degree of positive change has NIAF stimulate
No change Marginal change Moderate change Significant change Transformative change

Formative Evaluation of NIAF II
132
What kind of change was this?
6. To what extent has NIAF added value to your work ?
Not at all To a small extent To a moderate extent
To a large extent To a very large extent
How has NIAF added value?
Can you estimate a value (₦) to your organisation?
7. What would have been happened without NIAF support (please tick all that apply)
The organisation would not have existed
We would have been less effective
We would have been just as effective
We would have been more effective
Performance would have been slower
Performance would have been at the same speed
Performance would have been faster.
8. Do you have any other comments?

Formative Evaluation of NIAF II
133
Annex 14 Perception Survey Questionnaire NOI Poll – Service provision.
Good Morning / Evening, my name is………………… I work for NOIPolls, an Abuja–based opinion polling organisation. We are currently conducting a poll to find out the views of Nigerians regarding the quality of public services. (We retrieved your number from a pool of randomly generated numbers)
Your participation in this poll is completely voluntary. However, your opinion is vital to this poll.
Is this a good time to talk?
1. How would you rate the quality of power provision five years ago? a. Very poor b. Poor c. Acceptable d. Good e. Very good
2. How would you rate the quality of power provision at the current time? a. Very poor b. Poor c. Acceptable d. Good e. Very good
3. What do you expect the quality of power provision to be in 5 years time? a. Very poor b. Poor c. Acceptable d. Good e. Very good
4. How would you rate the quality of roads in your area five years ago? a. Very poor b. Poor c. Acceptable d. Good e. Very good
5. How would you rate the quality of roads in your area at the current time? a. Very poor b. Poor c. Acceptable d. Good

Formative Evaluation of NIAF II
134
e. Very good 6. What do you expect the quality of roads in your area to be in 5 years time?
7. How would you rate the quality of bus transport five years ago? a. Very poor b. Poor c. Acceptable d. Good e. Very good
8. How would you rate the quality of bus transport at the current time? a. Very poor b. Poor c. Acceptable d. Good e. Very good
9. What do you expect the quality of bus transport to be in 5 years time? a. Very poor b. Poor c. Acceptable d. Good e. Very good
10. What State and LGA are you in? 11. What is your occupation?
1) Government Worker / Civil Servant
Employed by a public ministry, agency, board, or commission; either at Federal, State or LGA level.
2) Professional worker Lawyer, Doctor, Teacher, Engineer, Nurse, Accountant, Computer Programmer, Architect, Banker, Pilot etc.
3) Self-Employed Trader Self-employed trader or one-man business owner.
4) Business Man/Woman Owner-Manager of a registered business corporation employing one or more persons.
5) Farmer / Agric. Worker
Farmer, Fisherman, Meat Seller, Agro Dealer, Agric extension worker, tractor operator etc
6) Artisan Carpenter, barber, Plumber, Electrician, Mechanic, Hairdresser, Tailor, Welder etc
7) Religious Leader / Missionary
Full-Time Pastor, Evangelist, Reverend, Imam, Mallam etc
8) Youth Corper Currently Serving
9) Student Currently in Secondary or Tertiary Institutions – Universities,

Formative Evaluation of NIAF II
135
Polytechnics, College of Education and Vocational Schools
10) Unemployed Youth / Adult
Currently has no means of earning an income
11) Others
12. Age: What age category do you fall into? a. 0 – 17 b. 18 – 21 c. 22 – 29 d. 30 – 45 e. 46 – 60 f. 60+ g. Don’t Know/RF
13. What is your gender (if not apparent) a. Female b. Male c. Rather not say

Formative Evaluation of NIAF II
136
Annex 15 References
2009 Annual Report of the Power Project Supervision Unit (Ministry of Power), December 2009, Annual Reviews of the NIAF programme, 2009 and 2011 2010 World Factbook, US Central Intelligence Agency. A. Inocencio, M. Kikuchi, D. Merrey, M. Tonosaki, A. Mauyama, I. De Jong, H. Sally, and F. Penning de Vries (2005): Lessons from Irrigation Investment Experiences: Cost-reducing and Performance-enhancing Options for sub-Saharan Africa. Final Report by International Water Management Institute Adam Brenneman and Michel Kerf (2002) Infrastructure and Poverty Linkages: A Literature Review; ADB (2000) Impact Evaluation Study of the Asian Development Bank Assistance to the Road Sector in Nepal; ADB (2000): Project Performance Audit Reports for Three Integrated Urban Infrastructure Development Projects, Indonesia ADE (2004) Evaluation of the EC interventions in the transport sector in third countries AFD (2005) Pro-Poor Growth in the 1990s Lessons and Insights from 14 Countries AfDB Project and Program Evaluation Division (2010) Benin: Project to Upgrade the Cotonou-Port Novo Road - Project Performance Evaluation Report (PPER) Africa Infrastructure Country Diagnostic, World Bank, June 2008 African Economic Outlook – Nigeria: African Development Bank (2014). Africon (2008): Unit Costs of Infrastructure Projects in Sub-Saharan Africa, Background paper 11 (Phase I) by AICD, Africa Infrastructure Country Diagnostic, World Bank Akaeze, “Arresting a Culture of Neglect”, Newswatch Alain de Janvry and Elisabeth Sadoulet (2000) Growth, Poverty, and Inequality in Latin America: A Casual Analysis, 1070-1974 Alex Bowen (2012) ‘Green’ Growth, ‘Green’ Jobs and Labor Markets ; Andrew Paterson: ‘Costs of information and communication technology in developing country school systems: The experience of Botswana, Namibia and Seychelles’, Human Sciences Research Council, South Africa Annual Review of NIAF, conducted in January 2011 ASI: NIAF Value for Money (VFM) Approach, March 2014 Banerjee, S, and E. Morella (2011): Africa's Water and Sanitation Infrastructure: Access, Affordability and Alternatives, World Bank Banerjee, S. V. Foster, Y. Ying, H. Skilling, Q. Wodon (2008): Cost Recovery, Equity and Efficiency in Water Tariffs: Evidence from African Utilities, AICD Working Paper Banerjee, S., A. Diallo, V. Foster and Q. Wodon (2009): Trends in Household Coverage of Modern Infrastructure Services in Africa, World Bank Policy Research Working Paper 4880

Formative Evaluation of NIAF II
137
Beshir Abdu and Sileshi Bekele: Analysis of irrigation systems using comparative performance indicators: A case study of two large scale irrigation systems in the upper Awash basin; Oromia Water Works Design and Supervision Enterprise Boniface Dulani, Robert Mattes and Carolyn Logan (2013): After a Decade of Growth in Africa, Little Change in Poverty at the Grassroots, Afrobarometer Policy Brief No. 1 C Dunkerley and J Hine (2011): Transport, Trade, and the Benefits of Road Investment Canning and Pedroni (2004): The Effect of Infrastructure on Long Run Economic Growth – CAER II Discussion Paper No. 57. Harvard Institute for International Development, US Carlos Felipe Pardo (2012) “Chapter 4 – Sustainable urban transport”, Castalia (2011): Evaluation of the Demonstration Effect of IFC's Involvement in Infrastructure in Africa César Calderón (2009) "Infrastructure and growth in Africa," World Bank Policy Research Working Paper Series 4914; César Calderón and Luis Servén (2008) Infrastructure and economic development in Sub-Saharan Africa; International Finance Corporation: Poverty Literature Review Summary: Infrastructure and Poverty Reduction Chatham House: “Thirst for African Oil: Asian National Oil Companies in Nigeria and Angola”, p23 Christoph Stork (2007): Sustainable Development and ICT Indicators, International Institute for Sustainable Development Christopher Willoughby (2004) Infrastructure and the Millennium Development Goals Colin Gannon and Zhi Liu (1997) Poverty and Transport Country Economic Memorandum, Volume 2, World Bank (2007), p32 Country Partnership Strategy for the Federal Republic of Nigeria for the period FY2014-FY2017: Annex 8: Country Assistance Framework for the Federal Republic of Nigeria, World Bank (2014) Cynthia C. Cook, Tyrrell Duncan, Somachai Jitsuchon, Anil Sharma, Wu Guoboa (2005): Accessing the Impact of Transport and Energy on Poverty Reduction DFID (2006): Infrastructure and pro-poor growth, Pro-Poor Growth Briefing Note 4 DFID (2008): ERM Impacts of Climate Change on Nigeria’s Economy. Final Report DFID (2009) Business Leader Perceptions of the Investment Climate in Nigeria DFID (2010): Working Effectively in Conflict-affected and Fragile Situations: Briefing Paper 1: Monitoring & Evaluation DFID (2011): How to Note: Guidance of Using the Revised Logical Framework DFID (2011): Spot-Check of Economic Appraisals and Logframes, Evidence presented to Parliamentary Select Committee DFID Nigeria Operational Plan, January 2011 DFID: Managing and Reporting DFID Results (website) DFID’s ENABLE programme (2009) Business Leader Perceptions of the Investment Climate in Nigeria

Formative Evaluation of NIAF II
138
Eberhard, A., O. Rosnes, M. Shkaratan and H. Vennemo (2011): Africa's Power Infrastructure: Investment, Integration Efficiency, World Bank Federal Roads Maintenance Agency (2007) Medium Term Strategy for Road Maintenance Management FGN (2010) Roadmap for Power Sector Reform Foster, V (2008): Overhauling the Engine of Growth: Infrastructure in Africa, AICD Foster, Vivien and Pushak, Nataliya (2011). Nigeria’s Infrastructure: A Continental Perspective. World Bank Africa Infrastructure Country Diagnostic Report. François Bourguignon (2004): The Poverty-Growth-Inequality Triangle Galal, A., L. Jones, P. tendon, and I. Vogelsang (1994): Welfare Consequences of Selling Public Enterprises: An Empirical Analysis Gassner, K., A. Popov and N. Pushak (2007): An Empirical Assessment of Private Participation in Electricity and Water Distribution in Developing and Transition Countries GiZ (2002) Urban Transport and Poverty in Developing Countries - Analysis and Options for Transport Policy and Planning Goudarzi (2011) “Decentralized energy in Nigeria”, Journal of Renewable and Sustainable Energy Government of Nigeria (2010): Nigeria Vision 20: 2020 Haroon Bhorat & Carlene van der Westhuizen (2008) Economic Growth, Poverty and Inequality in South Africa: The First Decade of Democracy HM Treasury (2011): Valuing Infrastructure Spend: Supplementary guidance to the Green Book House of Commons International Development Committee (2011): DFID's Role in Building Infrastructure in Developing Countries Humplick, Frannie and William D.O. Paterson (1994): Framework of Performance Indicators for Managing Road Infrastructure and Pavements, the World Bank, 3rd International Conference on Managing Pavements IEG (World Bank Group) (2006): Water Management in Agriculture: Ten Years of World Bank Assistance 1994-2004 IEG (World Bank Group) (2010): Cost-Benefit Analysis in World Bank Projects, Fast Track Brief IEG (World Bank Group) (2010): Safeguards and Sustainability Policies in a Changing World IEG (World Bank Group) (2010): Water and Development, an Evaluation of World Bank Support 1997-2007 IEG (World Bank Group) (2011): Assessing IFC's Poverty Focus and Results Infrastructure Sub-Committee Report to National Economic Management Team, 2010 International Crisis Group (2014). Curbing Violence in Nigeria (II): The Boko Haram Insurgency, Africa Report No. 216. International Development Committee (2011): DFID's Role in Building Infrastructure in Developing Countries

Formative Evaluation of NIAF II
139
International Housing Coalition (2007): Urban Investments and Rates of Return: Assessing MCC’s approach to Project Evaluation International Journal of Education and Development using Information and Communication Technology (IJEDICT), 2007, Vol. 3, Issue 4, pp. 89-101. Ioannis N. Kessides (2012) Electricity Reforms - What Some Countries Did Right and Others Can Do Better Jody Kusek and Ray Rist (2004): Ten Steps to a Results-Based Monitoring and Evaluation System, World Bank John Hearsch Consulting Pty Ltd (2008): Rail Productivity Information Paper Commissioned by the National Transport Commission K. Gwilliam (2011): Africa's Transport Infrastructure: Mainstreaming Maintenance and Management, World Bank Kathy Hull (2009) Understanding the Relationship between Economic Growth, Employment and Poverty Reduction Ken Gwilliam, Vivien Foster, Rodrigo Archondo-Callao, Cecilia Briceño-Garmendia, Alberto Nogales, and Kavita Sethi (2008): The Burden of Maintenance: Roads in Sub-Saharan Africa, AICD Background Paper 14 Khandar, S., G. Koolwal and H. Samad (2010): Handbook on Impact Evaluation: Quantitative Methods and Practices Lagos State Government, Public Expenditure and Financial Accountability (PEFA) self-assessment, May, 2009 Anambra State Public Expenditure and Financial Accountability (PEFA) assessment, June 2008. M.G. Bos, M.A. Burton and D.J. Molden (2005), Irrigation and Drainage Performance Assessment: Practical Guidelines, World Bank, Africa Region: Irrigation Business Plan, October 2007 M.G. Bos, M.A. Burton and D.J. Molden (2005): Irrigation and Drainage Performance Assessment: Practical Guidelines Madhav G. Badami, Geetam Tiwari and Dinesh Mohan (2004) Access and Mobility for the Urban Poor in India – Bidfing the Gap between Policy and Needs Mark Huberty, Huan Gao, Juliana Mandell and John Zysman (2011) Shaping The Green Growth Economy - A review of the public debate and the prospects for green growth Martin Ravallion (1994) Growth and poverty: Evidence for developing countries in the 1980s Martin Ravallion (2001) Growth, Inequality and Poverty: Looking Beyond Averages Matt Lowe (2014) Rail Revival in Africa? The Impact of Privatization Michael Roemer and Mary Kay Gugerty (1997): Does Economic Growth Reduce Poverty? Ministry of Power (2010): Annual Report of the Power Project Supervision Unit New Zealand Ministry of Transport (2009): Transport Monitoring Indicator Framework OECD (2006) Promoting Pro-Poor Growth: Infrastructure OECD (2006) Promoting Pro-Poor Growth: Key Policy Messages
Formative Evaluation of NIAF II
140
OECD (2006): Guidance for Managing Joint Evaluations OECD (2010) Quality Standards for Development Evaluation OECD (2011): Aid Effectiveness 2005-2010: Progress in Implementing the Paris Declaration OECD (2012) Green Growth and Developing Countries - A Summary for Policy Makers OECD (2013) Putting Green Growth at the Heart of Development Summary for Policymakers Olaseni, Mobolaji and Alade, Wade (2012): Vision 20:2020 and the Challenges of Infrastructural Development in Nigeria. Journal of Sustainable Development, Vol. 5, No. 2. Pedro Martins (2013) Growth, Employment and Poverty in Africa: Tales of Lions and Cheetahs PIDG (2010): Results Monitoring Handbook Pierce and V. Foster (2008): Making Sense of Africa's Infrastructure Endowment: A Benchmarking Approach, AICD Working Paper 1 Popov Alexander, J. Katharina Gassner, and Nataliya Pushak (2007): An Empirical Assessment of Private Sector Participation in Electricity and Water Distribution in Developing and Transition Countries Power Holding Company of Nigeria Daily Reports, 2009-2011 PPIAF (2011): Annual Report Presentation of: “Pillar 1: Achieving Sustainable and Inclusive Non-oil Growth” made to the Third Country Partnership Strategy 2 Joint Monitoring Meeting, Abuja, 18th, May 2011 Prud’homme, Remy and Chang-Woon Lee (1998) Size, Sprawl, Speed, and the Efficiency of Cities R. W. Bacon and J. Besant-Jones (2002) Global Electric Power Reform, Privatization and Liberalization of the Electric Power Industry in Developing Countries Richard Bullock (2005) Results of Railway Privatization in Africa Richard Bullock (2009) Off Track: Sub-Saharan African Railways Richard H. Adams, Jr. (2002): Economic Growth, Inequality and Poverty: Findings from a New Data Set AFD (2005): Pro-Poor Growth in the 1990s Lessons and Insights from 14 Countries Roadmap for Power Sector Reform, August 2010 Sambo A.S. 2006. Renewable energy electricity in Nigeria: The way forward. Sarah Cook, Kiah Smith and Peter Utting (2012): Green Economy or Green Society? Contestation and Policies for a Fair Transition Shanghai Manual – A Guide for Sustainable Urban Development in the 21st Century Shenggen Fan and Connie Chan-Kang (2004): Road Development, Economic Growth and Poverty Reduction in China Stefan Dercon (2012) Is green growth good for the poor? Stéphane Hallegatte, Geoffrey Heal, Marianne Fay and David Treguer (2011) From Growth to Green Growth - A Framework

Formative Evaluation of NIAF II
141
Supee Teravaninthorn and Gaël Raballand (2009): Transport Prices and Costs in Africa - A Review of the International Corridors Teravaninthorn, S. and G. Raballand (2008): Transport Prices and Costs in Africa: A review of the Main International Corridors, AICD Working Paper 14 The Economist (May 26th 2010) Nigeria’s Prospects: A man and a morass TI-UP Note (2011): Infrastructure Economic Appraisal Toshiyuki Katagiri and Yumi Ito: The Effects of Private Sector Participation and Privatization in the electric power sector and the Modality of ODA Loans (External evaluation) UN HABITAT (2011) Infrastructure for Economic Development and Poverty Reduction in Africa United Nations Department of Economic and Social Affairs, Population Division (2008): World Urbanization Prospects: The 2007 Revision, United Nations, New York; UN-Habitat Walter Hook (2006) Urban Transport and the Millennium Development Goals Wendell Cox (2007) Urban Transport and Economic Growth Wendell Cox (2012) Developing Africa: Toward Customer Oriented Urban Transport Policy World Bank (1997) Brazil - Secondary and Feeder Roads Project and the Second Feeder Roads Project . World Bank (2003) Cote d'Ivoire: Railway Rehabilitation Project World Bank (2003) Cote d'Ivoire: Railway Rehabilitation Project; Richard Bullock (2005) Results of Railway Privatization in Africa World Bank (2005) Power Sector Reform in Africa: Assessing Impact on Poor People World Bank (2006): Infrastructure: Lessons from the Last Two Decades of World Bank Engagement World Bank (2007): Identified in the Public Expenditure Management and Financial Accountability Review of Nigeria World Bank (2007): Public Expenditure Management and Financial Accountability Review of Nigeria World Bank (2008 & 2010) Assessments of the Investment Climate in Nigeria World Bank (2008) Project Performance Assessment Report: Roads Project (Cr. 3357-GE) and Transport Ministry Restructuring (Cr.3129-GE) World Bank (2008): Africa Infrastructure Country Diagnostic World Bank (2008): An Assessment of the Investment Climate in Nigeria. World Bank (2008): An Evaluation of World Bank Economic and Sector Work and Technical Assistance, 2000–2006. World Bank (2009): FEU, Describing and Exploring Private Participation in Infrastructure Services (PPIS) Database World Bank (2010): Africa's Infrastructure: A Time for Transformation World Bank (2010): Roadmap for Power Sector Reform,

Formative Evaluation of NIAF II
142
World Bank (2010): Transformation through Infrastructure: Issues and Concept Note World Bank (2011) Railway Reform: Toolkit for Improving Rail Sector Performance World Bank (2011): Africa's Water and Sanitation Infrastructure: Access, Affordability and Alternatives World Bank (2012) Inclusive Green Growth: The Pathway to Sustainable Development World Bank (2013) Africa Pulse, Volume 8; and similar findings in Pedro Martins (2013) Growth, Employment and Poverty in Africa: Tales of Lions and Cheetahs World Bank PID (2008) Federal Roads Development Project World Bank (2007): Country Economic Memorandum World Bank, Transport for Development: Safe, Clean and Affordable: The World Bank Group's Transport Business Strategy 2008-2012, 2008 World Bank, World Bank Group Sustainable Infrastructure Action Plan, FY 2009-2011, July 2008 Yin-Fang Zhang, David Parker and Colin Kirkpatrick (2008): Electricity Sector Reform in Developing Countries: An Econometric Assessment of the Effects of Privatisation, Competition and Regulation.