Embed Size (px)
Citation preview
STUDENT USE OF FORMATIVE ASSESSMENTS AND PROGRESS CHARTS OF
FORMATIVE ASSESSMENTS IN THE 7TH GRADE SCIENCE CLASS
by
Emily Sue McKenna
A professional paper submitted in partial fulfillment of the requirements for the degree
of
Master of Science
in
Science Education
MONTANA STATE UNIVERSITY Bozeman, Montana
July 2011
ii
STATEMENT OF PERMISSION TO USE
In presenting this professional paper in partial fulfillment of the requirements for
a master’s degree at Montana State University, I agree that the MSSE Program shall
make it available to borrowers under rules of the program.
Emily Sue McKenna July, 2011
iii
DEDICATION
This paper is dedicated to my husband, Leo, who allowed me time and space to work uninterrupted. This paper is also dedicated to the many teachers and administrators at Montana State University that have made this Master’s Degree a wonderful experience. It is also dedicated to the wonderful teachers and administration at Belding Area Schools that truly care about the kids we teach and work hard at making improvements to the program. Lastly, I dedicate this paper to my daughter, Molly, who taught me just how “cool” Microsoft Excel can be.
iv
TABLE OF CONTENTS
INTRODUCTION AND BACKGROUND ........................................................................1
CONCEPTUAL FRAMEWORK ........................................................................................4
METHODOLOGY ............................................................................................................13
DATA AND ANALYSIS ..................................................................................................25
INTERPRETATION AND CONCLUSION .....................................................................33
VALUE ..............................................................................................................................38
REFERENCES CITED ......................................................................................................41
APPENDICES ...................................................................................................................42
APPENDIX A: Marzano’s Student Progress Chart ...............................................44 APPENDIX B: Sample Student Page From Formative Assessment .....................46 APPENDIX C: Student Progress Chart of Formative Assessments ......................48 APPENDIX D: Permission Slip to Take Research Surveys ..................................50 APPENDIX E: 1st Survey of Student Attitude ......................................................52 APPENDIX F: 2nd Survey of Student Attitude ......................................................54 APPENDIX G: 3rd Survey of Student Attitude......................................................56 APPENDIX H: Interview Transcripts ...................................................................58 APPENDIX I: Sample of Teacher Journal ............................................................61
APPENDIX J: Individual Mean Summative Assessment Scores Pre-Treatment and Post-Treatment ................................................................................................63
v
LIST OF TABLES
1. Treatment Summative Assessment Names and Learning Targets .........................13
2. Pre-treatment Summative Assessment Names and Learning Targets ...................15
3. Data Collection Matrix ..........................................................................................19
4. Mean Summative Assessment Scores Pre-treatment and Post-Treatment ............30
5. Individual Mean Summative Assessment Scores Pre-Treatment and Post-
Treatment ...............................................................................................................31
6. Students Returning Formative Assessment Progress Charts .................................... 33
vi
LIST OF FIGURES
1. 1st Survey Results: Student Attitude toward Achieving Success in Science Class
.......................................................................................................................................... 25
2. 2nd Survey Results: Student Perception of Formative Assessments and Progress
Charts Mid-Treatment .................................................................................................. 26
3. 3rd Survey Results: Student Attitude toward Formative Assessment at End of
Treatment ........................................................................................................................ 29
vii
ABSTRACT
In this investigation formative assessments and a progress chart of formative assessments were implemented with the purpose of improving student engagement and learning. Formative assessments were taken the day after material was presented. Student progress was self-monitored by using the progress charts. Student scores on summative assessments improved by 3% and students were overwhelmingly positive about using the formative assessments and the progress charts to monitor their learning.
1
INTRODUCTION AND BACKGROUND
Project Background
Teaching and Classroom Environment
For the past seven years I have been teaching science at Belding Middle School in
Belding, Michigan. We use a team approach at our school which means the students I see
everyday are also taught by the same English Language Arts teacher, the same Social
Studies teacher, and the same Mathematics teacher. The four core subject teachers form a
team that regularly discusses the welfare of the students both academically and
emotionally. We also discuss what works in our classrooms and what does not.
Consequently, the time we spend talking as a team also serves as professional
development. It is a very collaborative environment.
I teach four sessions of 7th grade science. My science classes contain an average
of 24 students, with some classes as large as 28 students. The larger class size makes it
difficult to interact with each student on a personal level. Because of the larger class size,
I have difficulty knowing who is making sense of the science material and who is not.
There are some students that are very adept at going unnoticed in a group setting. Even
with strategies in place to acknowledge all students, such as pulling name sticks to
promote random selection of students, some students get overlooked. I don’t have a well-
developed system for monitoring interaction between myself and each student.
Consequently, I am often not aware of a student experiencing difficulty with my class
until the summative assessment for the unit is taken and they have performed poorly. I
2
feel that I adequately cover the material and review often, so I am quite surprised when a
student that I considered quite capable fails the summative assessment of a unit of study.
School Demographics
Belding Area Schools is located in Belding, Michigan. Belding is a rural
community in mid-Michigan. The town has approximately 13,000 residents. We have one
kindergarten through second grade building, one third through fifth grade building, one
middle school and one high school. Belding Middle School has an enrollment of about
475 students this year. Approximately 93% are Caucasian, 6% are Hispanic and 1%
African American. The socio-economic status of our students is determined by the
number of free and reduced lunches at school. We have between 60 and 70% of our
students taking free or reduced lunches. Belding is typical of the formerly industrial small
towns in Michigan that are struggling during this period of economic hardship. That
struggle is evident in our students’ lives which affects their readiness to learn in the
classroom.
Belding Middle School uses the team approach for scheduling students. We have
two teams at 7th grade this year. I meet weekly with my other team members and meet
twice weekly with the other science teacher at the 7th grade level. I am also the
department chair for the science department at Belding Middle School and we meet
monthly. At all levels of meetings we discuss how to engage students who struggle in
school. As a general rule, the teachers I meet with are good at addressing various learning
styles through a variety of activities. Our science department, in particular, has worked
hard to provide a variety of hands-on activities to facilitate science learning. These
activities include labs, projects, drawings, and science fair projects. However, my peer
3
teachers express some of the same frustration that I have with our lack of awareness of
student achievement until several students have failed the assessment. We don’t feel that
we do an adequate job of monitoring student understanding of the material on a daily
basis. This frustration has led me to investigate formative assessments as a method of
monitoring student learning.
Focus Questions
I have been researching formative assessment use in the classroom through
various authors over the past two years. I was first introduced to formative assessment
through EDCI 504, Evaluation and Measurement, a required class for my Master’s
program at Montana State University. Since then I have been a member of a grading team
formed at Belding Middle School where we studied the 7 Strategies of Assessment for
Learning by Jan Chappuis (2009). The next year some members of our team did a year-
long study of Classroom Assessment for Learning Doing it Right, Using it Well, by Rick
Stiggins, Judith Arter, Jan Chappuis, and Steve Chappuis (2006). Most recently, I’ve
been asked to be on a formative assessment committee for our school. As a member of
this committee I attended a seminar conducted by Dr. Jan Clemens and was introduced to
Robert Marzano’s book, Formative Assessment and Standards-Based Grading (2010).
The main purpose of these committees and the focused book study was to make
recommendations to our administration as to how to implement more rigorous methods of
using formative assessment in the classrooms.
As a result of my study of formative assessments I have learned about many
useful methods of formative assessment that can be used for a variety of purposes. I
learned that it’s easy to implement formative assessments into my classroom, but I also
4
wanted to know if they were an effective use of time. I mentally struggled with the idea
of keeping track of student success using formative assessments. Therefore, I wanted to
introduce a strategy for using formative assessments that included record keeping that
was relatively unobtrusive to the functioning of my classroom. I also wanted to determine
its effect upon the students and myself. By using this strategy I wanted to collect
information about student learning through formative assessments in an organized
manner that was useful to both the student and me. I also wanted to determine whether
having students do the monitoring of their progress on formative assessments affected
their performance on the summative assessment. The question I wanted to answer was:
What is the impact upon middle school science students of implementing a self-
monitored progress chart of formative assessments?
The sub-questions to be answered by this research are:
• What is the impact of using formative assessments and progress charts on
student’s attitude toward learning science?
• What is the impact of using formative assessments and progress charts on student
grades?
• What is the impact of using formative assessments and progress charts on my
perception of myself as a teacher?
CONCEPTUAL FRAMEWORK Current research has influenced many of the teachers at our school to reconsider
what they emphasize in the classroom and how it influences student attitude towards
learning. At Belding Middle School we are making a gradual transition to grading
5
practices based solely upon summative assessments of the standards and benchmarks as
defined by the Michigan Curriculum Framework (1996). All teachers evaluate their
students and usually this evaluation is reported as grades. These grades should reflect
what a student knows about the topic being taught in the classroom. O’Connor (2002)
claims that using performance standards as reference points to determine grades supports
learning and encourages student success by ensuring that grades depend on clear, public
performance standards and the student’s own achievement. Guskey (2001) reports that
“Regardless of the format its [grading’s] purpose is to provide high-quality information to
interested persons in a form they can understand clearly and use effectively” (p. 2).
Student grades are a reflection of what a student understands about the topic. If teaching
of the topic has been adequate and the assessment of learning is centered on the topic,
then the grade should adequately reflect what the student knows about the topic.
As flawed as traditional grading can be if not properly done (O’Connor, 2002)
grading is probably not going away. It would require a huge paradigm shift for all
interested parties to completely change a grading system that has been around for 120
years. It makes more sense as a classroom teacher to work within the system and make
the grading process as meaningful as possible. O’Connor (2002) quotes Wiggins (1996)
as saying, “grades or numbers, like all symbols, offer efficient ways of summarizing” (p.
21). He also says it’s not worth fighting against the history of grading, but that it’s more
important to make grades meaningful and more supportive of learning. Working within
the system of grading requires teachers to rethink the way they are teaching if all students
aren’t succeeding in the classroom. Interventions need to be in place that support students
in ways that are non-threatening, self-motivating, and improves the learning process. An
6
effective teacher understands that some students need more time or more one-on-one
teaching in order to learn the material. Therefore, an effective teacher provides
interventions for struggling students in the classroom. The grade a student receives for
the learning should also reflect a student’s response to helpful interventions provided by
the teacher or accessed independently by the student, during the learning process. When
teachers do not provide adequate support for their students or students do not avail
themselves of the support system, students often receive low grades.
Sometimes, a letter grade, not learning, is perceived by students as the reason for
school. Teachers “give” good grades to those students they like and bad grades to those
they don’t like (O’Connor, 2002). O’Connor (2002) claims that overemphasis on grades
has detrimental effects on student achievement, motivation, and self-concept. Assignment
of grades can also damage interpersonal relationships between the student and the
teacher. A good interpersonal relationship between the student and the teacher is
necessary for effective teaching and learning to take place. Guskey (2009) quotes Selby
and Murphy (1992) when he says, “To protect their self-images, many [students] regard
the low grade as irrelevant and meaningless. Other students may blame themselves for
the low grade, but feel helpless to make any improvement” (p. 14). Considering the
detrimental effect of grading and low grades in particular, it is imperative that teachers
provide a support system for students to improve learning and ultimately the students’
grade. It is also imperative that teachers help students feel they are in control of their own
learning and subsequently their grades. “Long-term retention [of learning] and motivation
increase when students track, reflect on, and communicate about their learning”
7
(Chappuis, 2009, p. 13). A student’s sense of control over their learning in the classroom
provides motivation for learning and a more engaged student.
Teaching time is limited in the classroom, therefore everything teachers do needs
to be supportive of learning. For those students that struggle to succeed in the classroom,
systems need to be in place to help them. One of the support systems to consider for
student learning is well thought out formative assessments. Formative assessments have
been discussed since the late 1960’s but weren’t taken seriously until Black and Wiliam
(1998) refined educator’s understanding of formative assessments through an article
entitled, “Inside the black box: Raising standards through classroom assessment.”
Popham (2008) explains that Black and Wiliam argued through this article “… that
formative assessment, properly employed in the classroom, will help students learn what
is being taught to a substantially better degree” (p. 2). In 2006, during a meeting of The
Council of Chief State School Officers (CCSSO) in Austin, Texas, a definition of
formative assessment was agreed upon as follows: “Formative assessment is a process
used by teachers and students during instruction that provides feedback to adjust ongoing
teaching and learning to improve students’ achievement of intended instructional
outcomes” (p. 5). The key features of the FAST (Formative Assessment for Students and
Teachers) SCASS (State Collaborative on Assessment and Student Standards) definition
as presented by Popham are:
• “Formative assessment is a process, not any particular test.
• It is used not just by teachers, but by both teachers and students.
• Formative assessment takes place during instruction.
• It provides assessment-based feedback to teachers and students.
8
• The function of this feedback is to help teachers and students make
adjustments that will improve students’ achievement of intended
curricular aims” (p. 5).
In an article for Phi Delta Kappan, Stiggins states that formative assessments can be used
for a multitude of purposes. Teachers and school leaders use formative assessments to
form conclusions about program improvements and student achievement. Students, on
the other hand, can use formative assessments to change their way of thinking about the
learning they undertake in the classroom (2005). Formative assessments provide another
forum for discussion of the material that may not have previously existed. Sometimes it
may be the case that the student simply needed to see the material again in a different
way for understanding to take place. Formative assessments can help a student improve
their attitude toward learning when learning is broken down into smaller, more
manageable pieces. Formative assessments, if done correctly and presented to the student
in the right light, can provide a continuous stream of evidence of the student’s progress in
mastering the knowledge and skills required by the state standards. Formative
assessments can be a very effective tool to support learners in the classroom.
Students can use formative assessments to improve their performance in the
classroom if effective feedback is provided to the student. This feedback is a key
component of the formative assessment process. Marzano (2010) quotes researcher Shute
(2008) as she defines feedback as “information communicated to the learner that is
intended to modify his or her thinking or behavior for the purpose of improving learning”
(p. 3). As researchers studied feedback and its effectiveness they discovered that not all
feedback however provided the desired results. In one study of feedback conducted by
9
Kluger and DeNisi (1996) they found that in 38% of the studies they examined that
feedback had a negative impact on student achievement. This caused researchers to delve
deeper into the types of feedback that are the most effective. Their goal was to discover
the characteristics of feedback that produce the positive effects on student achievement
that all teachers want to see in their students. They found feedback that did not inform
students how to get better at the assigned task, or negative feedback, caused a decrease in
student achievement. This type of feedback had an ES score of 0.14. ES stands for effect
size. An ES score tells you how powerful a strategy is; the larger the ES score, the more
the strategy increases student learning (Marzano, 2010). The type of feedback found to
provide the most effective result on student learning is the type of feedback that describes
what improvement looks like for a task, a process or self-regulation. Feedback regarding
the self, such as praise for doing a good job, typically does not enhance learning and
achievement (Marzano, 2010). Teachers often use praise as a form of feedback and
researchers have proven that praise is a form of negative feedback and it doesn’t work on
most students. Chappius (2009) explains that praise can have a negative effect on
learning because it directs students’ attention away from the learning and onto what the
teacher thinks of them. “In general, praise as a motivator is unpredictable and often
counterproductive” (p. 63). Therefore, a more effective form of formative assessment is
one that uses positive feedback methods that demonstrate to the student what
improvement looks like. Research indicates that using formative assessments and positive
feedback can help students improve learning and overall performance in the classroom.
Formative assessments can also be used to inform the teacher of how much learning
is taking place among students. Teachers can use this instructional feedback to help them
10
determine how both the class and specific students are progressing (Marzano, 2010).
Popham (2008) described formative assessment as “transformative assessment.” His
definition described formative assessment as a planned process in which teachers or
students use assessment-based evidence to adjust what they are currently doing. Teachers
that are effectively using formative assessment to truly transform how they teach use the
results of the formative assessment to adjust their instructional methods and lesson plans.
They can either slow down their instruction and cause students to be exposed to the same
material in multiple ways or move ahead or elaborate more deeply on the topic being
addressed. Given the benefits of using formative assessments effectively to both students
and teachers, they should be considered for use in every classroom.
In conclusion, Stiggens, Arter, Chappuis, and Chappuis (2006) label the
prescribed use of formative assessment “Assessment FOR Learning”. Assessment for
learning is defined as formative assessments that happen while learning is still underway.
They are used to “… diagnose student needs, plan the next steps in instruction, provide
students with feedback they can use to improve the quality of their work, and to help
students feel in control of their journey to success” (p. 31). Using this definition can
cause teachers and students to look at learning in the classroom as a more collaborative
endeavor. Stiggens et al. stresses that students must understand the achievement
expectations from the beginning of the learning process. They are given examples of
strong achievement and poor achievement of the standards. Students are also taught how
scaffolding takes place in the classroom by explaining the purpose of the instruction and
how it is built upon what they’ve already learned. Students and teachers work together to
continuously monitor their current level of learning in relation to the learning goal.
11
Stiggins et al. also explains that when done correctly students play a special role in
communicating evidence of learning to one another, to their teacher, and to their families.
They do this at the same time they are learning the material and not just at the end of the
learning process through a summative assessment. Stiggens et al. cites claims made by
Ehrenber, Brewer, Gamoran, and Willms (2001) that the effect of assessment for learning
on student achievement is four to five times greater than the effect of reduced class size.
The results also show that while all students show achievement gains, the largest gains
are made by the lowest achievers in class.
When consistently carried out as a matter of routine within and across
classrooms, this set of practices has been linked to achievement gains of
one-half to two standard deviations on high-stakes tests, and the largest
gains made are by low achievers. (2005, p. 328)
If formative assessments become an integral part of the learning process in the classroom,
the ability to monitor learning, by both the teacher and the students themselves, is
enhanced. If effective feedback is included in the process, the overall effect is enhanced
learning in the classroom.
While most authors agree that formative assessments are useful in the classroom,
some authors are proposing different uses of the results of formative assessments. Some
authors believe that scores should not be taken, but only feedback given to the students
on their level of success towards reaching the learning goal. Marzano (2010) however,
proposes scoring formative assessments and gathering those scores over time to
determine a summative score for the learning target. He believes very strongly that “a
summative score should not be derived from a single final assessment” (p.27). A
12
summative score for a learning target should be the most reasonable representation of a
student’s level of learning at a particular point in time. In light of this belief, a method of
keeping track of student progress is needed. Marzano proposed using a student progress
chart (Appendix A) to keep track of a student’s progress. Using the scores from formative
assessments and taking note of the improvements in those scores, the teacher can
determine a summative score for the learning. Marzano points out that this summative
score is not an average of the formative scores, but the formative scores are used to help
the teacher determine how much learning has taken place over time. In this way planned
formative assessment directly linked to the learning target can be used to help the teacher
determine a summative grade for each student.
Changing learning behavior is the key to improvement in learning. Changing
behavior cannot be accomplished if a student is not aware that they are doing poorly in
the classroom. Using the progress chart of formative assessments will cause the student to
keep track of their performance on formative assessments. The progress chart is a very
tangible reminder of how a student is doing in class for both the student and the teacher.
Whether the progress chart is used exactly as Marzano (2010) proposes or not, the
feedback from such a chart is useful to both the student and the teacher. The information
can be used to change the learning behavior of the student or the teaching behavior of the
teacher or both, making formative assessments very effective.
13
METHODOLOGY
Project Design
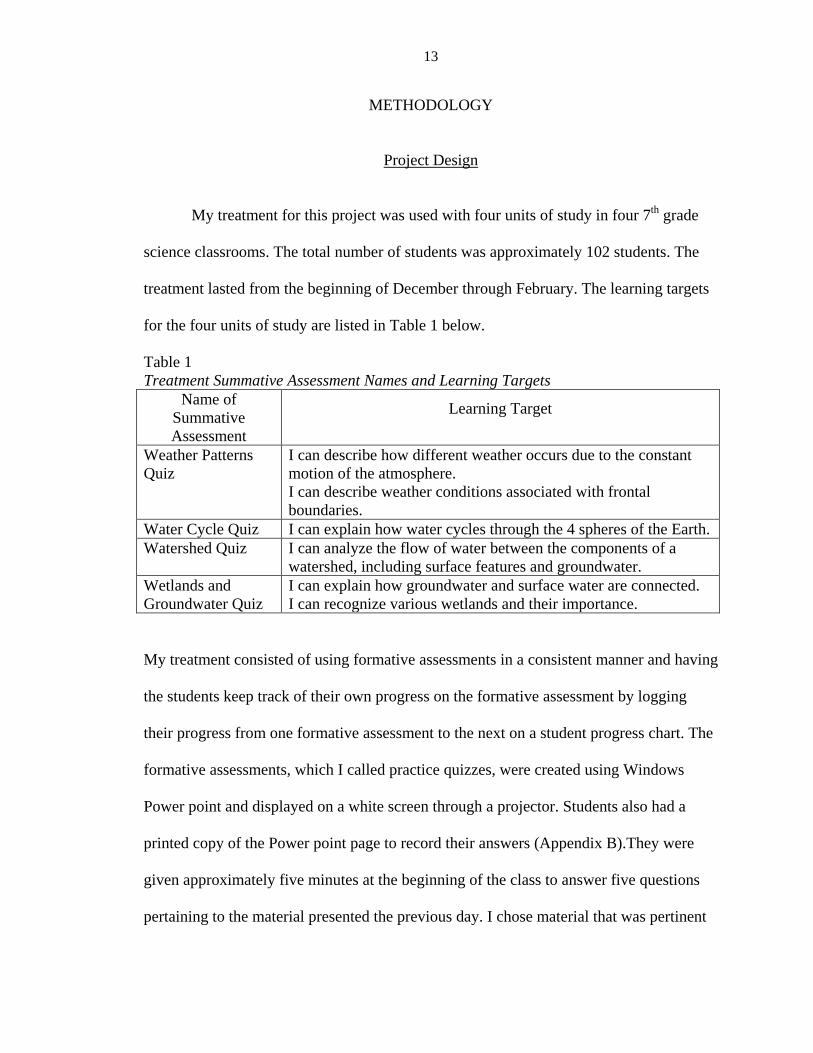
My treatment for this project was used with four units of study in four 7th grade
science classrooms. The total number of students was approximately 102 students. The
treatment lasted from the beginning of December through February. The learning targets
for the four units of study are listed in Table 1 below.
Table 1 Treatment Summative Assessment Names and Learning Targets
Name of Summative Assessment
Learning Target
Weather Patterns Quiz
I can describe how different weather occurs due to the constant motion of the atmosphere. I can describe weather conditions associated with frontal boundaries.
Water Cycle Quiz I can explain how water cycles through the 4 spheres of the Earth. Watershed Quiz I can analyze the flow of water between the components of a
watershed, including surface features and groundwater. Wetlands and Groundwater Quiz
I can explain how groundwater and surface water are connected. I can recognize various wetlands and their importance.
My treatment consisted of using formative assessments in a consistent manner and having
the students keep track of their own progress on the formative assessment by logging
their progress from one formative assessment to the next on a student progress chart. The
formative assessments, which I called practice quizzes, were created using Windows
Power point and displayed on a white screen through a projector. Students also had a
printed copy of the Power point page to record their answers (Appendix B).They were
given approximately five minutes at the beginning of the class to answer five questions
pertaining to the material presented the previous day. I chose material that was pertinent
14
to the questions that would be on the summative assessment. After each student had
enough time to answer the questions, I pulled name sticks in order to call on students
randomly. The student then answered the question, I displayed the correct answer on the
overhead, and we then had class discussion about the question and answer. During this
question and answer time students could ask questions about why the answer was correct
or incorrect or other pertinent questions. I also reinforced concepts learned the previous
day or elaborated on the content as needed. After we answered all five questions, students
scored their paper with the number of correct answers and marked their progress chart
(Appendix C) with the date of the formative assessment. Students used the score on the
formative assessment to fill in a data point on the line graph. Students were encouraged to
restudy questions they didn’t know before the summative assessment was given. We
continued this procedure until the summative assessment was taken and scored. There
were approximately four or five formative assessments given before each summative
assessment. Students then marked the score they earned on the summative assessment on
the progress chart and the progress chart was handed in to me.
The non-treatment portion of the research began at the beginning of the 2010 –
2011 school year. It lasted through five summative assessments which addressed one to
two learning targets per assessment. The learning targets for these summative
assessments are listed in Table 2.
15
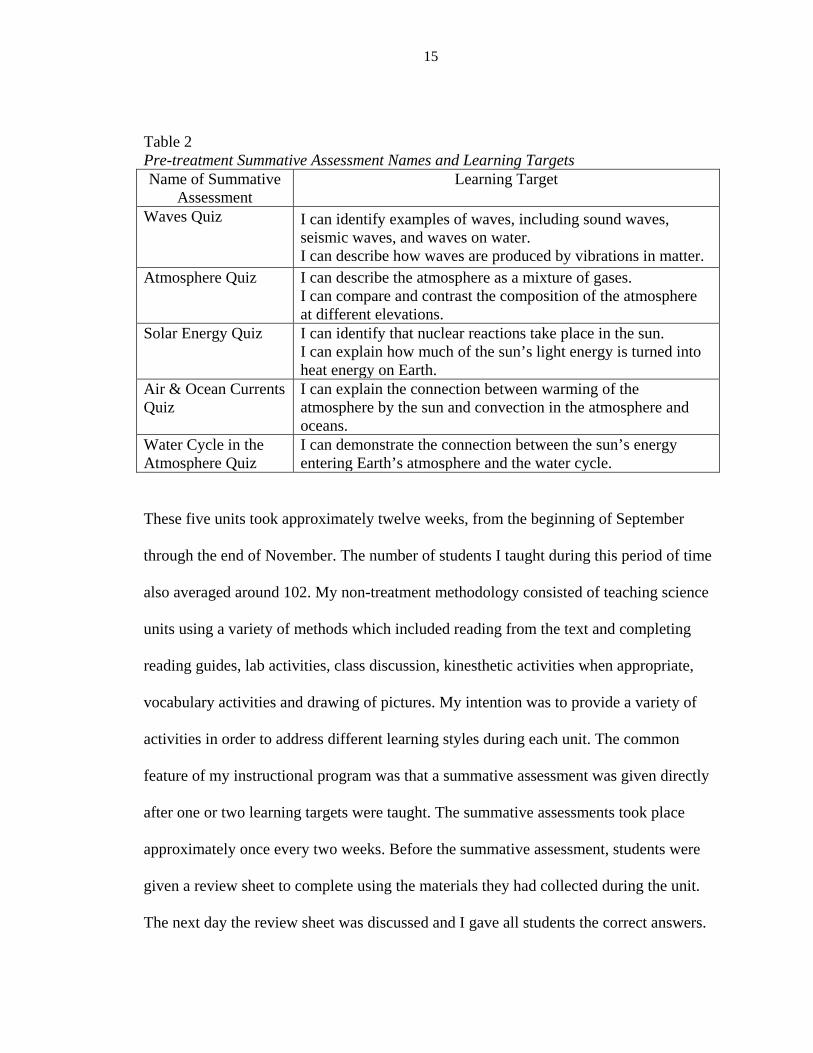
Table 2 Pre-treatment Summative Assessment Names and Learning Targets Name of Summative
Assessment Learning Target
Waves Quiz I can identify examples of waves, including sound waves, seismic waves, and waves on water. I can describe how waves are produced by vibrations in matter.
Atmosphere Quiz I can describe the atmosphere as a mixture of gases. I can compare and contrast the composition of the atmosphere at different elevations.
Solar Energy Quiz I can identify that nuclear reactions take place in the sun. I can explain how much of the sun’s light energy is turned into heat energy on Earth.
Air & Ocean Currents Quiz
I can explain the connection between warming of the atmosphere by the sun and convection in the atmosphere and oceans.
Water Cycle in the Atmosphere Quiz
I can demonstrate the connection between the sun’s energy entering Earth’s atmosphere and the water cycle.
These five units took approximately twelve weeks, from the beginning of September
through the end of November. The number of students I taught during this period of time
also averaged around 102. My non-treatment methodology consisted of teaching science
units using a variety of methods which included reading from the text and completing
reading guides, lab activities, class discussion, kinesthetic activities when appropriate,
vocabulary activities and drawing of pictures. My intention was to provide a variety of
activities in order to address different learning styles during each unit. The common
feature of my instructional program was that a summative assessment was given directly
after one or two learning targets were taught. The summative assessments took place
approximately once every two weeks. Before the summative assessment, students were
given a review sheet to complete using the materials they had collected during the unit.
The next day the review sheet was discussed and I gave all students the correct answers.
16
During this time students had the opportunity to ask questions if they didn’t understand
something. My intention was for the review sheet to be taken home and studied in depth
that night. The very next day I began class by asking if there were any questions. When
the students were done asking questions, I then asked a few to fill in with material they
may have missed during their question and answer time. Then the quiz was given. It
consisted of ten to twenty multiple choice, matching, or short answer questions. The
quizzes were designed to be short and to question students only about the learning
targets. The method of instruction that I have just described for the pre-treatment portion
of my research is what I have consistently done for the past couple of years of my
teaching career.
The portion of the treatment that was intentionally different from the non-
treatment was the use of a formative assessment in a consistent format on a nearly daily
basis. The formative assessments were called “practice quizzes” so the students were
discouraged from looking up answers, but the quiz was just for practice and did not affect
their grade in any way. My intention was to create a relaxed atmosphere surrounding the
formative assessments with very little pressure on the students in case they didn’t get all
the answers correct. I encouraged each student to try them as they didn’t count towards
their grade and in trying them, they would be able to find out what they didn’t understand
before the summative assessment was given. The formative assessments were designed to
cause the students to recall the previous day’s learning. They were given at the beginning
of class before any new teaching had begun. Sometimes it was a matching exercise for
vocabulary words and sometimes it was determining to which category something
belonged. I felt more comfortable designing my research around only one form of
17
formative assessment in order to collect data. Other techniques I use in the classroom
reflect a truer definition of formative assessment, that of being a process, but for the
purposes of this paper I will use the term “formative assessment” to mean the practice
quizzes given in my classroom.
Study Participants
The participants in the study were the 102 7th grade science students that I teach
every day. There are 55 girls and 47 boys distributed over four classes. Two of the classes
I see in the morning hours and two of the classes I see in the afternoon. The afternoon
classes come to science class after they have had lunch and two non-academic classes
such as physical education or band. The afternoon classes are not different in composition
from the morning classes, but their behavior is livelier and sometimes difficult to control.
Of the 102 science students, 13 of them receive special services for learning disabilities.
Of the 102 students I teach, 64 of them returned permission slips in order to take
surveys or to be interviewed (Appendix D). I had 38 girls and 26 boys able to take the
surveys and be interviewed. I used all 102 students’ tests scores to compare pre-treatment
to treatment in order to increase the reliability of the results. Over the course of the
school year, which includes the time of pre-treatment and treatment data collection, there
have been approximately nine students move out of my classroom due to moving out of
the district, and approximately four students move into my classroom due to moving into
the district. My team receives all the students that need special services, so if they move
into the district needing services, they are assigned to our team. We have between 60 and
70% of our students taking free or reduced lunches district-wide so approximately 66 of
18
my 102 students live in poverty as defined by the free and reduced lunch program.
Overall, the number of students remain about the same throughout the year and the ratio
of boys to girls also remains about the same. The research methodology for this project
received an exemption by Montana State University's Institutional Review Board and
compliance for working with human subjects was maintained.
Data Collection Techniques
One of the first methods of collecting data I used was to survey the students. I
surveyed students before the treatment asking questions about their feelings towards their
ability to learn science and whether they knew how well they were doing in class. I also
asked if they would use a tool to help them in the classroom if one were available to
them. My intention was to group students according to the level of importance that school
played in their life in order to determine the effectiveness of my treatment. My second
survey was administered during the treatment and was designed to ask about student
perception of the formative assessments. My third survey served as a post-treatment
survey of the students to determine whether student attitude had changed and whether the
treatment had an impact on their attitude. The last survey also served to determine the
impact my teaching methods, more specifically the formative assessments, had on student
attitudes. I followed these surveys with an interview of a random sample of students.
Another method of data collection I used was to keep a journal of specific events and my
feelings towards those events throughout the period of treatment. I noted any feelings of
frustration and feelings of accomplishment that I experienced directly related to the
formative assessments. Lastly, I compared the summative assessment scores pre-
treatment and post treatment to see if there was improvement in their unit assessment
19
scores. The application of these methods attempted to adequately answer the question,
“What is the impact upon middle school science students of implementing a self-
monitored progress chart of formative assessments?” It was also an attempt at answering
the sub-questions of:
• What is the impact of using formative assessments and progress charts on
student’s attitude toward learning science?
• What is the impact of using formative assessments and progress charts on student
grades?
• What is the impact of using formative assessments and progress charts on my
perception of myself as a teacher?
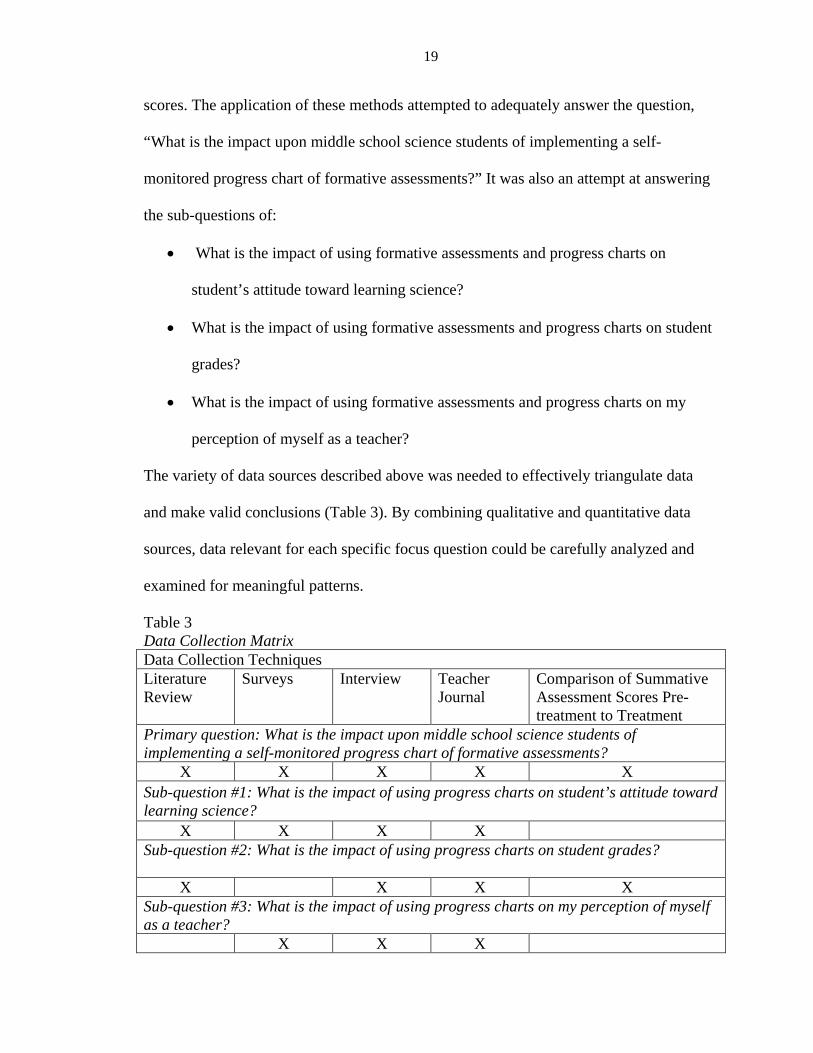
The variety of data sources described above was needed to effectively triangulate data
and make valid conclusions (Table 3). By combining qualitative and quantitative data
sources, data relevant for each specific focus question could be carefully analyzed and
examined for meaningful patterns.
Table 3 Data Collection Matrix Data Collection Techniques Literature Review
Surveys Interview Teacher Journal
Comparison of Summative Assessment Scores Pre-treatment to Treatment
Primary question: What is the impact upon middle school science students of implementing a self-monitored progress chart of formative assessments?
X X X X X Sub-question #1: What is the impact of using progress charts on student’s attitude toward learning science?
X X X X Sub-question #2: What is the impact of using progress charts on student grades?
X X X X Sub-question #3: What is the impact of using progress charts on my perception of myself as a teacher?
X X X
20
Survey
I chose the survey as a method of data collection because I wanted to know about
student attitude towards science learning in my classroom, student attitude towards their
capacity to learn, and student attitude towards the treatment. The survey seemed like the
most efficient method of gathering data for these multiple purposes. I was required by
Belding Area Schools to obtain parental permission to survey or interview their students
(Appendix D). I received 64 permission slips. I received 38 permission slips from female
students and 26 permission slips from male students. The first survey (Appendix E) was
given before the treatment and consisted of seven questions with response choices of
strongly agree, agree, undecided, disagree, and strongly disagree. The first three
questions attempted to evaluate the student’s attitude toward their capacity to control
their learning and to do well in school. The next two questions attempted to determine if
a student was aware of their level of success during the learning process and whether the
student felt responsible for their own learning while in science class. The last two
questions requiring a response from strongly agree to strongly disagree were an attempt
to determine the willingness of students to use a method of tracking their performance in
science class and whether that self-knowledge would spur change in their study habits. I
left the last question on the survey open ended by asking if there was anything else the
student would like me to know.
The second survey (Appendix F) was given during the treatment and focused on
the treatment of formative assessments. I asked six questions specifically about whether
the formative assessments were helping the student learn science and whether keeping
track of their score helped them to know how well they were learning science. One
21
question asked if the formative assessments prompted the student to restudy the material
in order to score higher on the next summative assessment.
The third survey (Appendix G) was meant to re-survey the students using the
same questions as Survey #1 however, due to the results of the first survey I changed the
questions to survey the student’s attitude towards continuing with formative assessments
in the classroom along with charting of their progress on the formative assessments. I
included two questions about how students felt about formative assessments administered
at the beginning of class, again using the format of strongly agree to strongly disagree
mentioned above. I also included three questions concerning their attitude towards my
performance as a teacher helping them to learn science and how I conducted the activities
in my classroom, specifically formative assessments. There was one question about how
students felt about how well they were learning science so far this year. Lastly, there
were two open ended questions: one asking for changes the student would like to see in
my classroom and one asking if there was anything else they would like me to know. I
wanted to check the validity of student answers on their surveys by focusing on questions
related to their attitude towards science class and their impression of how effective
formative assessments were for them. Students were given ample opportunity to disagree
to my claims based on their answers to the survey questions. I also surveyed as many
students as possible in order to increase the reliability of the data, given the restriction of
having to obtain a permission slip from their parents or guardians.
Interview For the interview portion of my data collection I chose an informal format. I
chose eleven boys and nine girls to interview, for a total of 20 students. I selected five
22
from each of my four classes and interviewed them in a room adjoining my classroom
while the other students were working on an assignment. The students were chosen
according to their level of accomplishment in my class. I used a stratified random
sampling technique in that I took care to select a balanced number of high, medium-level,
and low achievers in my class as well as a relatively equal mix of boys and girls. I also
chose a combination of students that regularly speak up in class and some students that
seldom volunteer to speak in class. I did this to increase the reliability and validity of
their answers. The interview only lasted about ten minutes and I recorded the
conversation on a portable recorder for the sake of accuracy. I began the conversation by
telling them how the interview would work and then I reminded them of the process of
putting formative assessments on the projector while they answered the formative
assessment questions on their own piece of paper. My question for them was, “Did the
practice quizzes help you?” I then recorded their responses and transcribed them to paper
for analysis (Appendix H).
Teacher Journal Another method of data collection was to keep a teacher journal recording my
thoughts about the day’s events and specifically my thoughts about the formative
assessments and student response to them. I used a form with blanks to fill in such as the
date, a section for my impression of the day as far as students being engaged, whether
there was more positive or negative feedback from the students, what successes and what
challenges I encountered that day, what would I do differently next time, and how would
I close the loop (Appendix I). The purpose of the journal entries was to record my
23
feelings towards the day’s events in order to determine any change in my attitude towards
the treatment.
Comparison of Pre-treatment and Treatment Summative Assessment Scores
The last portion of my data collection is a comparison of the summative
assessment scores for each learning target pre-treatment and summative assessment
scores for each learning target post treatment. Belding Area Schools Assistant
Superintendent, Mike Burde used the Statistical Package for the Social Sciences (SPSS)
program to analyze the summative assessment scores I obtained pre-treatment and post
treatment in order to compare them. The SPSS program is a powerful statistical analysis
program. Its primary use is for doing advanced statistical analysis of data for research and
other projects. The most notable feature of the SPSS system is its ability to allow users to
validate assumptions in an efficient manner. My study utilized SPSS capabilities in
calculating bivariate statistics, specifically a two sample t-test. Using this program
allowed me to perceive significant changes in the data that may have been difficult to
discern without the program and increased the validity of my project. I used the test
scores from all my students in order to have the largest sample size possible and increase
the reliability of the outcome. I was not restricted from using all test scores because of a
permission slip and the student names were omitted from the records for privacy reasons.
I also used Belding Area School’s on-line grading program to look at the mean of
summative assessment scores pre-treatment as compared to the class average. I then
compared them to the mean of the summative assessment scores post treatment as
compared to the class average. It is interesting to note that all four class averages declined
from the pre-treatment to post-treatment time periods. When I considered the difficulty of
24
the units we were addressing, I decided that the mean summative assessment scores
should be compared to the class average in each group in order to determine if there had
been improvement in the individual student’s mean summative assessment scores. I
reported this as either a negative number or a positive number of percentage points away
from the class average (Appendix J) in order to determine whether there had been
improved learning for individual students.
Purposes of Data Collection Techniques
The data collected during this project was both quantitative and qualitative in
nature. The Statistical Package for the Social Sciences (SPSS) program was used to make
comparisons of summative assessment scores pre-treatment to treatment of the entire
population in order to determine the effectiveness of the treatment. I also compared the
summative assessment scores for individuals in order to help triangulate data. Surveys
were used and the data was quantified according to the number of responses to each
question, even though it was more of a qualitative survey of student attitude and
performance in class.
The qualitative data was collected through interviews and the teacher’s reflective
journal entries. This data helped to validate the quantitative data. All questions proposed
in this study were answered using more than one method of data collection in order to
triangulate the data, increasing the reliability and validity of the project. Additionally, I
sought the opinions of colleagues at Belding Middle School and Montana State
University concerning my data collection methods and my conclusions. The data
presented is the result of these efforts.
25
DATA AND ANALYSIS
This study yielded an abundance of qualitative and quantitative data that was
analyzed to determine whether the treatment of formative assessments and the progress
chart of formative assessments were worth the time it took to implement and to answer
the four focus questions. The surveys, interviews, journal entries, and comparison of
summative assessment scores all provided a different type of evidence that, when
analyzed together, highlighted interesting patterns and led to several different meaningful
conclusions. One of my original concerns surrounding the project was whether students
were intrinsically motivated to work at learning in order to earn higher grades. Without
this drive to learn in school, I predicted that my treatment would be meaningless to them.
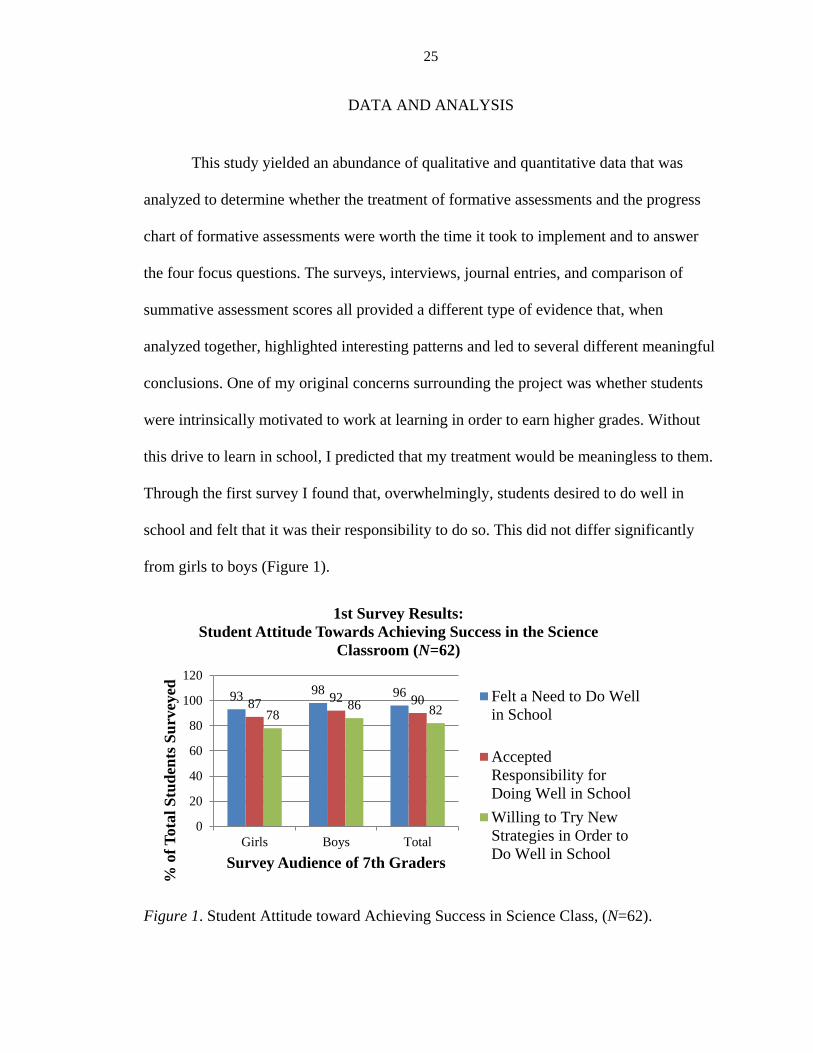
Through the first survey I found that, overwhelmingly, students desired to do well in
school and felt that it was their responsibility to do so. This did not differ significantly
from girls to boys (Figure 1).
Figure 1. Student Attitude toward Achieving Success in Science Class, (N=62).
93 98 96 87 92 90
78 86 82
0
20
40
60
80
100
120
Girls Boys Total
% o
f Tot
al S
tude
nts S
urve
yed
Survey Audience of 7th Graders
1st Survey Results: Student Attitude Towards Achieving Success in the Science
Classroom (N=62)
Felt a Need to Do Wellin School
AcceptedResponsibility forDoing Well in SchoolWilling to Try NewStrategies in Order toDo Well in School
26
93% of girls and 98% of boys surveyed in my science classes felt a need to do
well in school. 87% of girls and 92% of boys also accepted the responsibility for doing
well in school. In preparation for the introduction of formative assessments and the
student progress chart, I asked students about trying new strategies in class. 82% of the
students surveyed were also willing to try a new strategy in order to help them learn in
the science classroom. This set the stage for introduction of the formative assessments
and keeping track of their progress on the student progress chart.
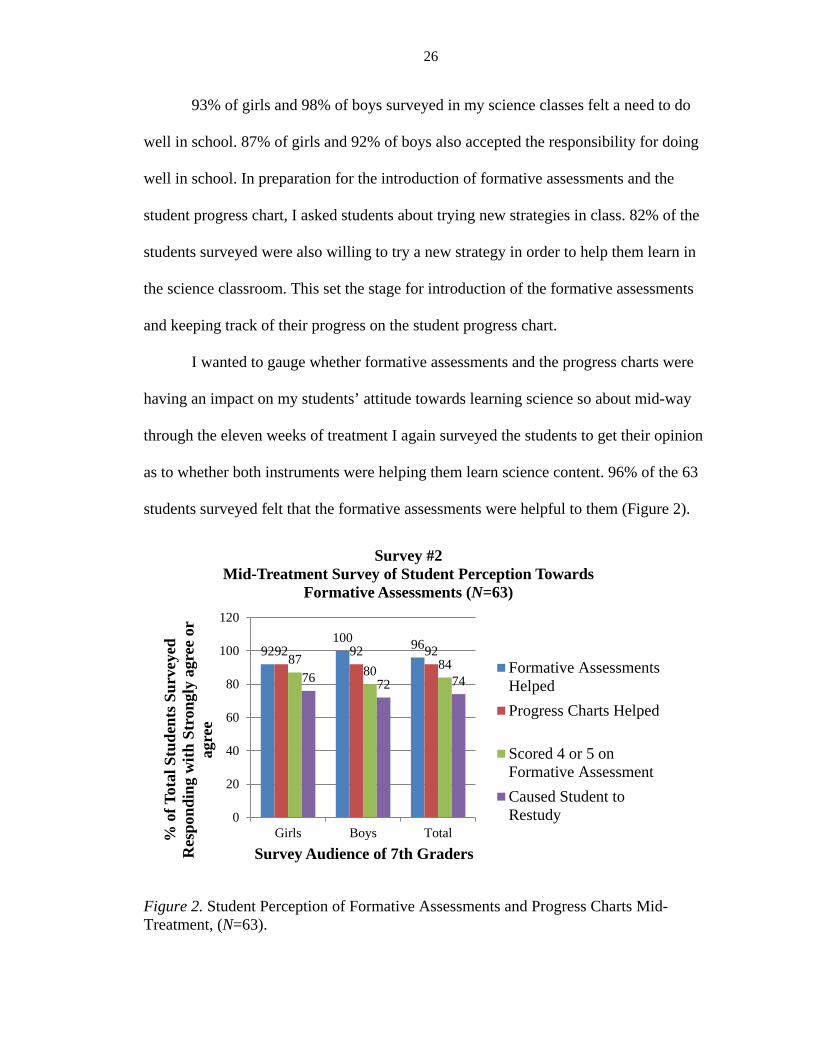
I wanted to gauge whether formative assessments and the progress charts were
having an impact on my students’ attitude towards learning science so about mid-way
through the eleven weeks of treatment I again surveyed the students to get their opinion
as to whether both instruments were helping them learn science content. 96% of the 63
students surveyed felt that the formative assessments were helpful to them (Figure 2).
Figure 2. Student Perception of Formative Assessments and Progress Charts Mid-Treatment, (N=63).
92 100 96 92 92 92 87
80 84 76 72 74
0
20
40
60
80
100
120
Girls Boys Total% o
f Tot
al S
tude
nts S
urve
yed
Res
pond
ing
with
Str
ongl
y ag
ree
or
agre
e
Survey Audience of 7th Graders
Survey #2 Mid-Treatment Survey of Student Perception Towards
Formative Assessments (N=63)
Formative AssessmentsHelpedProgress Charts Helped
Scored 4 or 5 onFormative AssessmentCaused Student toRestudy
27
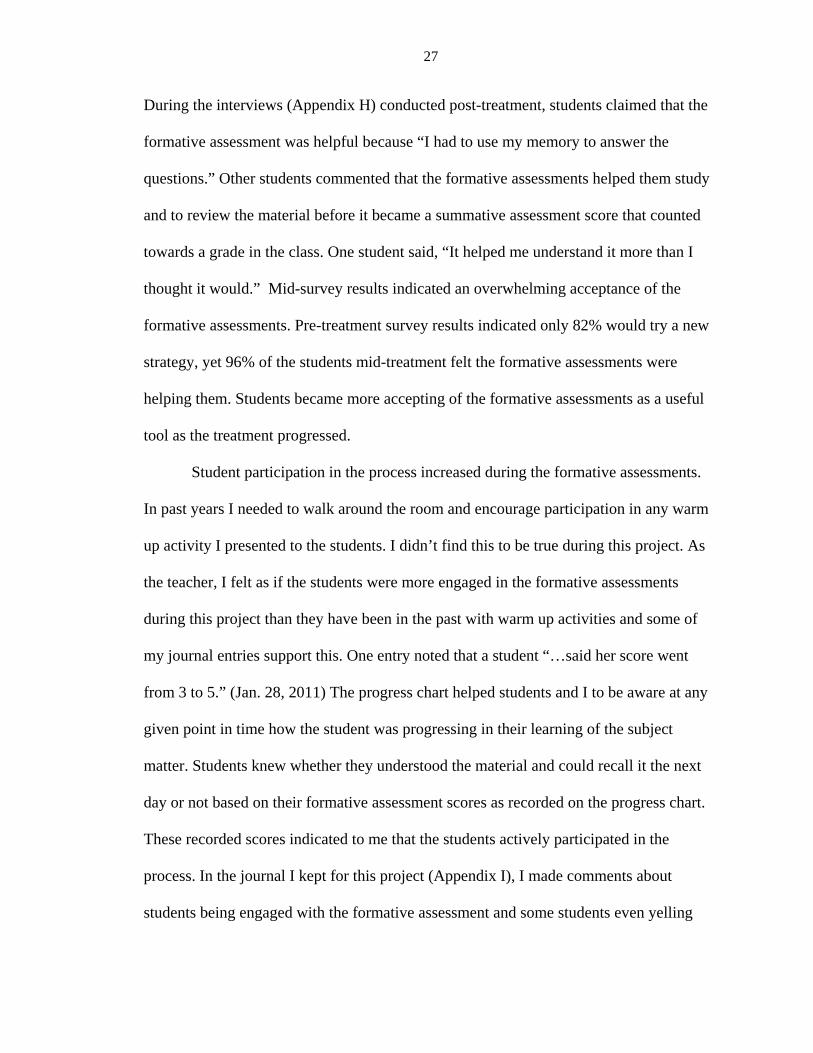
During the interviews (Appendix H) conducted post-treatment, students claimed that the
formative assessment was helpful because “I had to use my memory to answer the
questions.” Other students commented that the formative assessments helped them study
and to review the material before it became a summative assessment score that counted
towards a grade in the class. One student said, “It helped me understand it more than I
thought it would.” Mid-survey results indicated an overwhelming acceptance of the
formative assessments. Pre-treatment survey results indicated only 82% would try a new
strategy, yet 96% of the students mid-treatment felt the formative assessments were
helping them. Students became more accepting of the formative assessments as a useful
tool as the treatment progressed.
Student participation in the process increased during the formative assessments.
In past years I needed to walk around the room and encourage participation in any warm
up activity I presented to the students. I didn’t find this to be true during this project. As
the teacher, I felt as if the students were more engaged in the formative assessments
during this project than they have been in the past with warm up activities and some of
my journal entries support this. One entry noted that a student “…said her score went
from 3 to 5.” (Jan. 28, 2011) The progress chart helped students and I to be aware at any
given point in time how the student was progressing in their learning of the subject
matter. Students knew whether they understood the material and could recall it the next
day or not based on their formative assessment scores as recorded on the progress chart.
These recorded scores indicated to me that the students actively participated in the
process. In the journal I kept for this project (Appendix I), I made comments about
students being engaged with the formative assessment and some students even yelling
28
“yeah” when they found they had the correct answer. Of the 17 comments directly related
to formative assessments in my journal, 8 of them refer to student engagement in the
process and the outcomes of the activity. I saw an increased level of engagement from all
the students that I hadn’t seen at the beginning of the school year. In general, the students
that were resistant to doing school work were just as receptive to the formative
assessments as the students that were more compliant in school.
I also tried to determine student perception of the progress charts of formative
assessments by asking on Survey #2 (Appendix F) whether the progress chart helped the
students in class. Even though 96% of the students surveyed agreed or strongly agreed
that the progress charts helped them, the interview answers did not unanimously support
that sentiment. During the interview, the students were asked whether graphing their
grades was beneficial. About 50% of the respondents claimed it didn’t make a difference
and 50% felt it did. One student commented, “It didn’t make a difference.” While another
claimed, “It kind of did.” One student did say, “I like putting the numbers on the chart so
that I could see if I did better or worse [from time to time].”
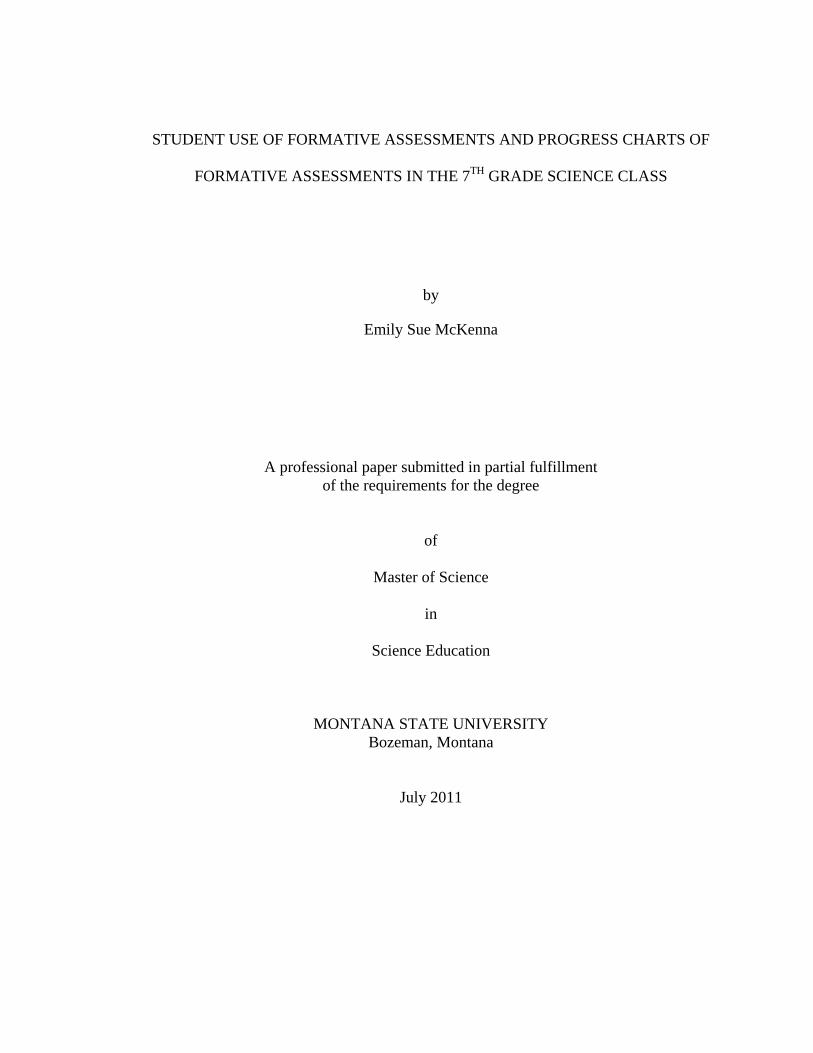
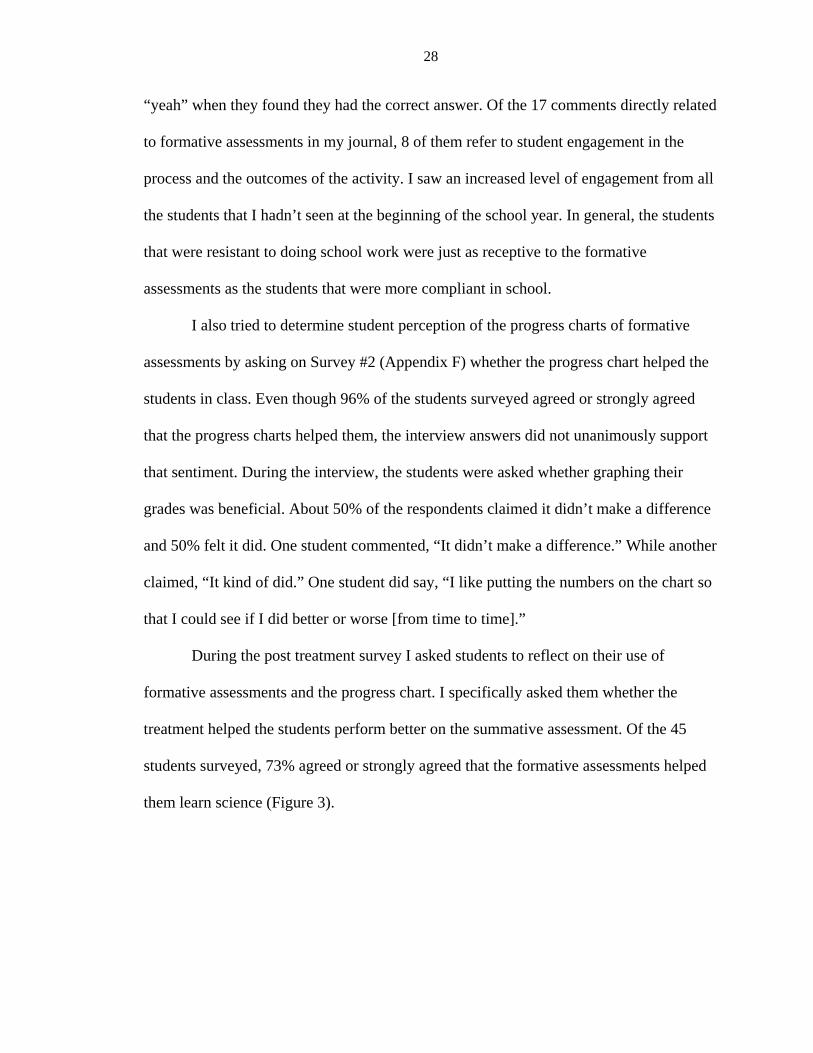
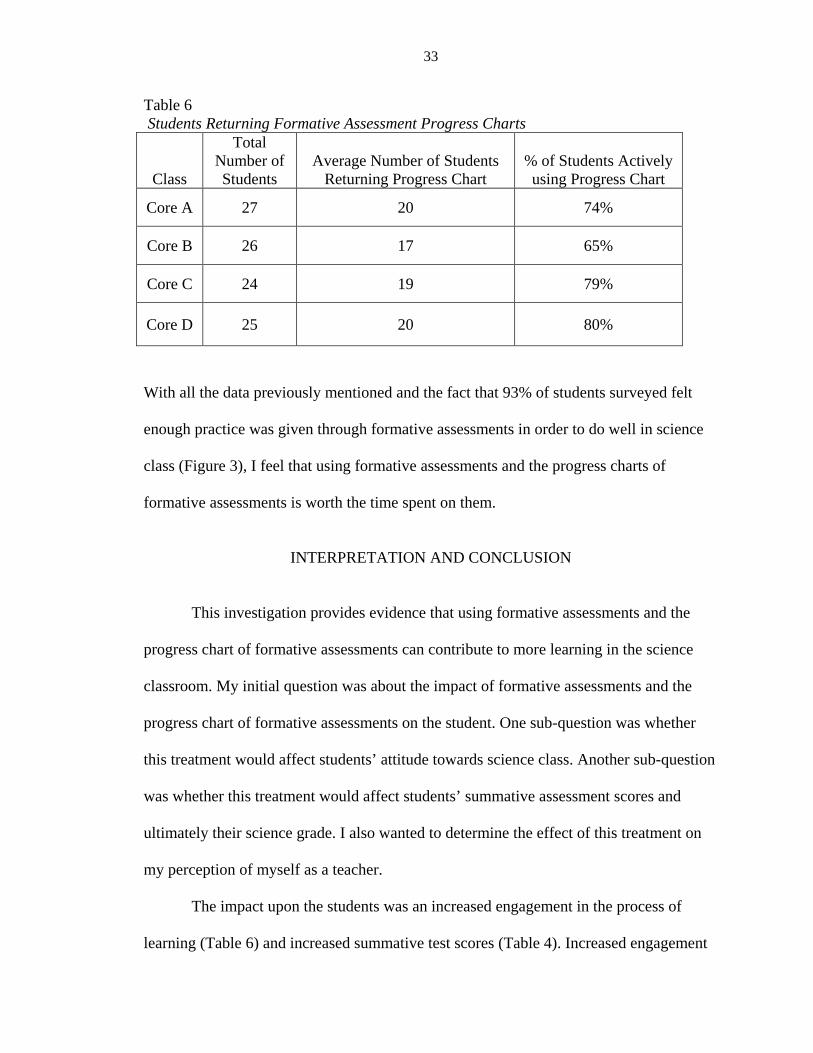
During the post treatment survey I asked students to reflect on their use of
formative assessments and the progress chart. I specifically asked them whether the
treatment helped the students perform better on the summative assessment. Of the 45
students surveyed, 73% agreed or strongly agreed that the formative assessments helped
them learn science (Figure 3).
29
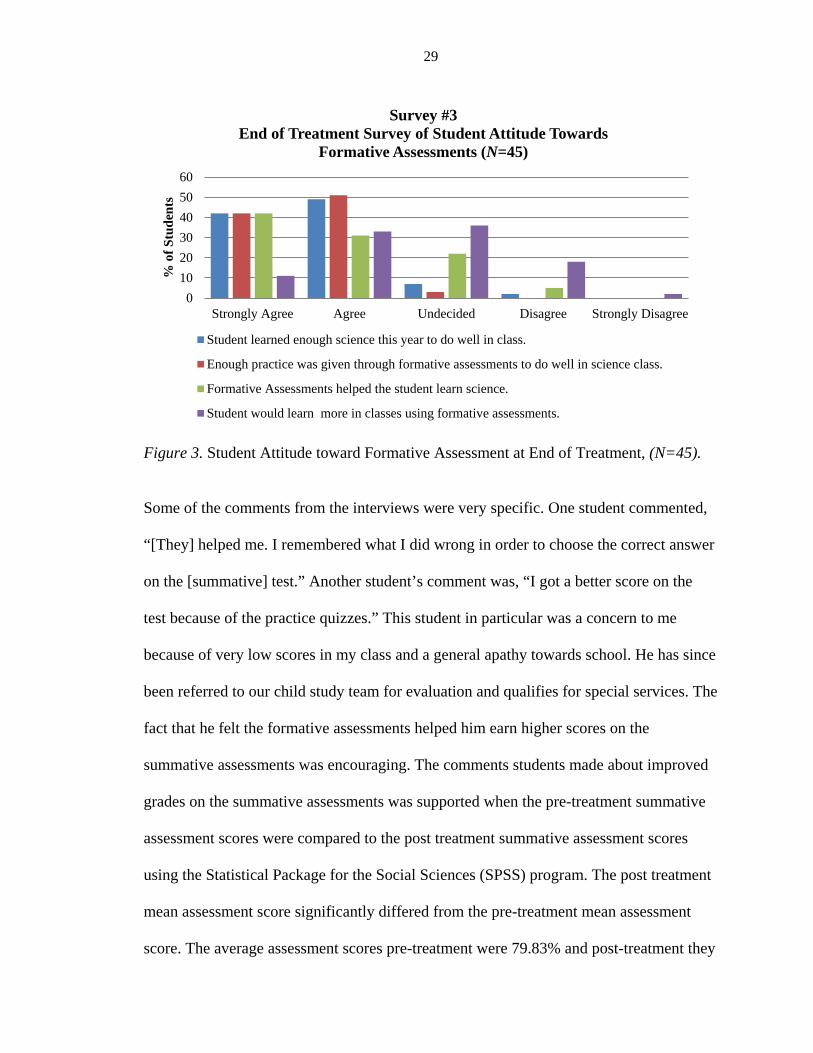
Figure 3. Student Attitude toward Formative Assessment at End of Treatment, (N=45).
Some of the comments from the interviews were very specific. One student commented,
“[They] helped me. I remembered what I did wrong in order to choose the correct answer
on the [summative] test.” Another student’s comment was, “I got a better score on the
test because of the practice quizzes.” This student in particular was a concern to me
because of very low scores in my class and a general apathy towards school. He has since
been referred to our child study team for evaluation and qualifies for special services. The
fact that he felt the formative assessments helped him earn higher scores on the
summative assessments was encouraging. The comments students made about improved
grades on the summative assessments was supported when the pre-treatment summative
assessment scores were compared to the post treatment summative assessment scores
using the Statistical Package for the Social Sciences (SPSS) program. The post treatment
mean assessment score significantly differed from the pre-treatment mean assessment
score. The average assessment scores pre-treatment were 79.83% and post-treatment they
0102030405060
Strongly Agree Agree Undecided Disagree Strongly Disagree
% o
f Stu
dent
s
Survey #3 End of Treatment Survey of Student Attitude Towards
Formative Assessments (N=45)
Student learned enough science this year to do well in class.
Enough practice was given through formative assessments to do well in science class.
Formative Assessments helped the student learn science.
Student would learn more in classes using formative assessments.
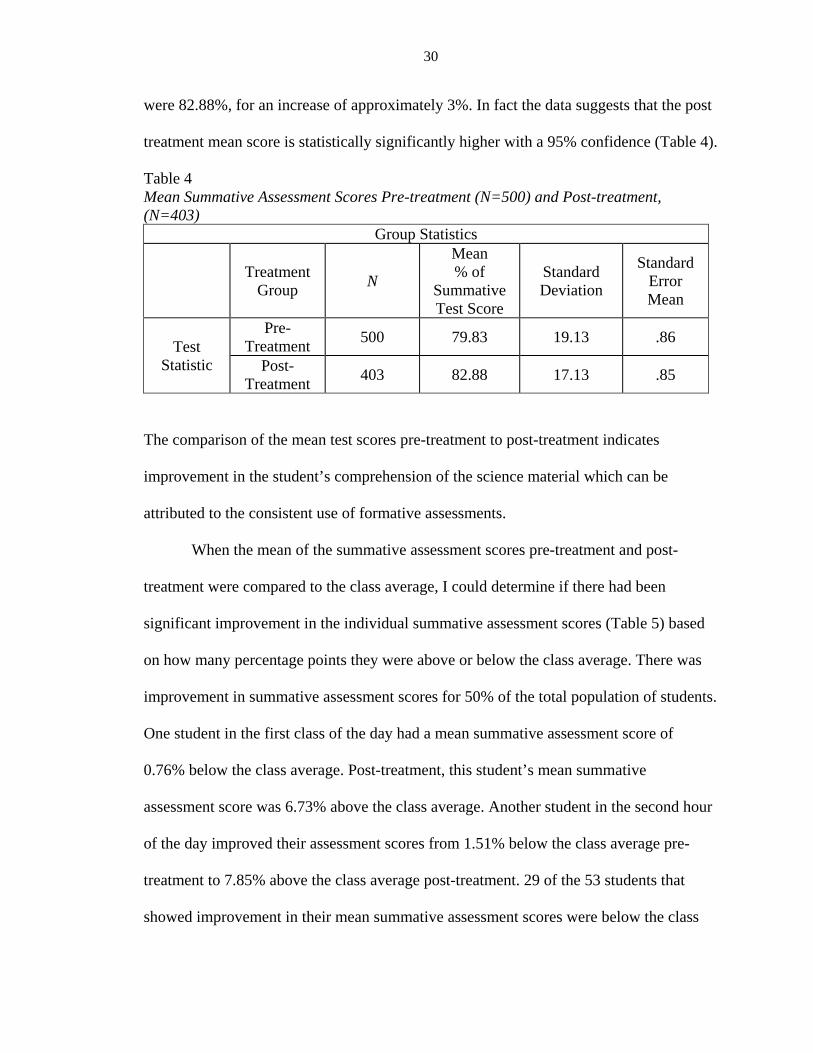
30
were 82.88%, for an increase of approximately 3%. In fact the data suggests that the post
treatment mean score is statistically significantly higher with a 95% confidence (Table 4).
Table 4 Mean Summative Assessment Scores Pre-treatment (N=500) and Post-treatment, (N=403)
Group Statistics
Treatment Group N
Mean % of
Summative Test Score
Standard Deviation
Standard Error Mean
Test Statistic
Pre-Treatment 500 79.83 19.13 .86
Post-Treatment 403 82.88 17.13 .85
The comparison of the mean test scores pre-treatment to post-treatment indicates
improvement in the student’s comprehension of the science material which can be
attributed to the consistent use of formative assessments.
When the mean of the summative assessment scores pre-treatment and post-
treatment were compared to the class average, I could determine if there had been
significant improvement in the individual summative assessment scores (Table 5) based
on how many percentage points they were above or below the class average. There was
improvement in summative assessment scores for 50% of the total population of students.
One student in the first class of the day had a mean summative assessment score of
0.76% below the class average. Post-treatment, this student’s mean summative
assessment score was 6.73% above the class average. Another student in the second hour
of the day improved their assessment scores from 1.51% below the class average pre-
treatment to 7.85% above the class average post-treatment. 29 of the 53 students that
showed improvement in their mean summative assessment scores were below the class
31
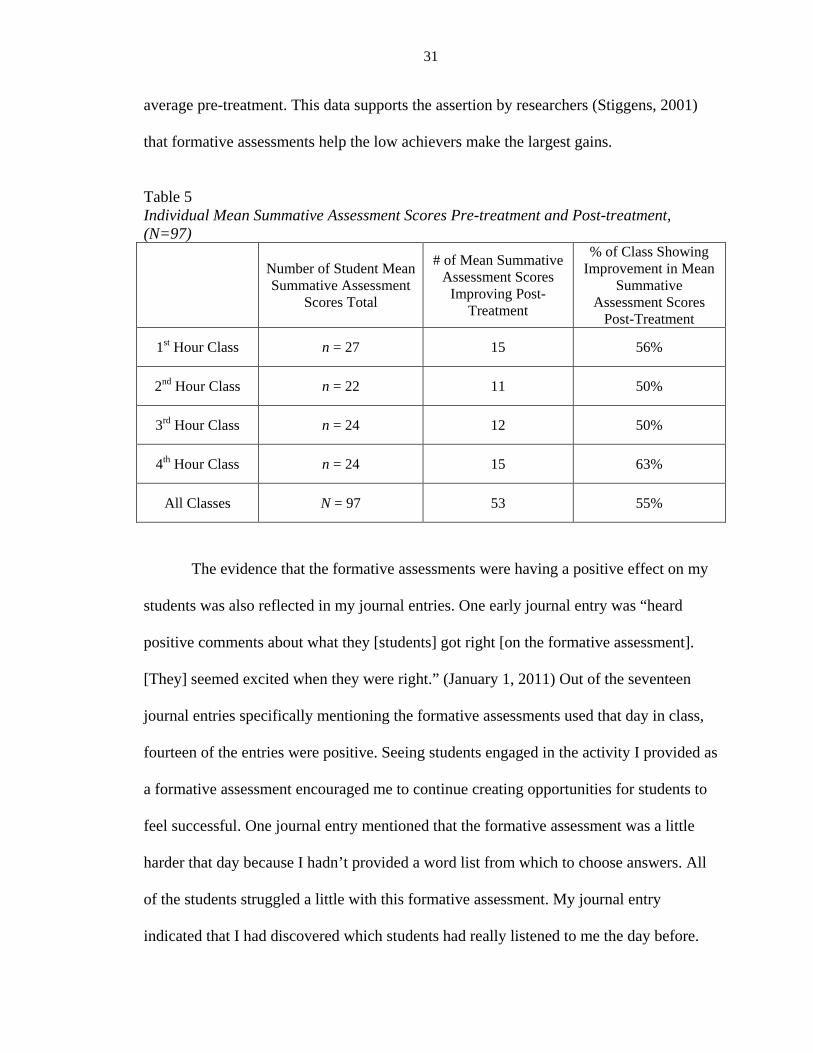
average pre-treatment. This data supports the assertion by researchers (Stiggens, 2001)
that formative assessments help the low achievers make the largest gains.
Table 5 Individual Mean Summative Assessment Scores Pre-treatment and Post-treatment, (N=97)
Number of Student Mean Summative Assessment
Scores Total
# of Mean Summative Assessment Scores
Improving Post-Treatment
% of Class Showing Improvement in Mean
Summative Assessment Scores
Post-Treatment
1st Hour Class n = 27 15 56%
2nd Hour Class n = 22 11 50%
3rd Hour Class n = 24 12 50%
4th Hour Class n = 24 15 63%
All Classes N = 97 53 55%
The evidence that the formative assessments were having a positive effect on my
students was also reflected in my journal entries. One early journal entry was “heard
positive comments about what they [students] got right [on the formative assessment].
[They] seemed excited when they were right.” (January 1, 2011) Out of the seventeen
journal entries specifically mentioning the formative assessments used that day in class,
fourteen of the entries were positive. Seeing students engaged in the activity I provided as
a formative assessment encouraged me to continue creating opportunities for students to
feel successful. One journal entry mentioned that the formative assessment was a little
harder that day because I hadn’t provided a word list from which to choose answers. All
of the students struggled a little with this formative assessment. My journal entry
indicated that I had discovered which students had really listened to me the day before.
32
(Feb. 2, 2011) One reflection I had concerning this day was to consider whether only
showing the formative assessment once had as much of a positive effect on students as
showing the same formative assessment multiple times, especially if that formative
assessment was judged difficult by the students. Therefore, the next day I used the same
formative assessment. My journal entries indicated the students felt it was easier to
complete the second day (Feb. 10, 2011). Because of repeating this formative assessment,
one student labeled as emotionally impaired volunteered a correct answer that day. Until
this day, this student had refused to participate in class. Another female student who
chose to avoid interaction with me and only had negative things to say about science
class came to me to ask for clarification on one of the questions on the formative
assessment (Feb. 10, 2011). These two incidences made it clear to me that providing
formative assessments as a learning tool helped students feel safe while learning and
provided an opportunity for them to feel successful. They also provided opportunities for
me to discuss curriculum with individual students that may not have approached me
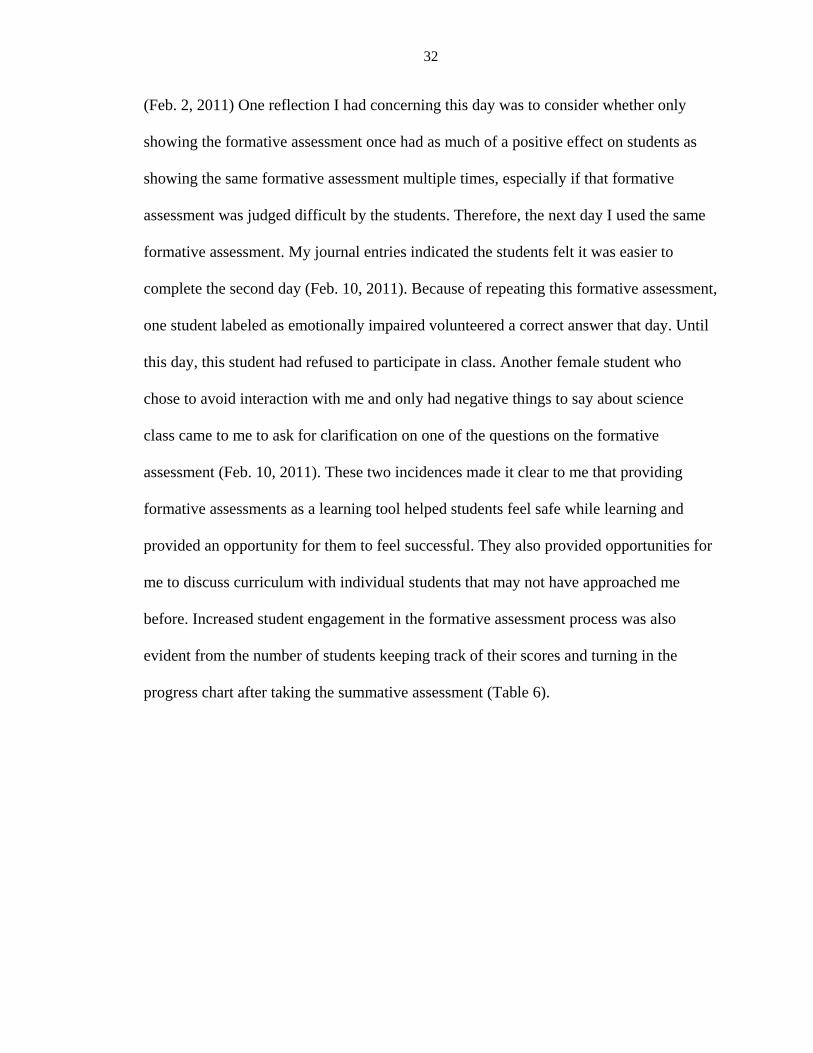
before. Increased student engagement in the formative assessment process was also
evident from the number of students keeping track of their scores and turning in the
progress chart after taking the summative assessment (Table 6).
33
Table 6 Students Returning Formative Assessment Progress Charts
Class
Total Number of Students
Average Number of Students Returning Progress Chart
% of Students Actively using Progress Chart
Core A 27 20 74%
Core B 26 17 65%
Core C 24 19 79%
Core D 25 20 80%
With all the data previously mentioned and the fact that 93% of students surveyed felt
enough practice was given through formative assessments in order to do well in science
class (Figure 3), I feel that using formative assessments and the progress charts of
formative assessments is worth the time spent on them.
INTERPRETATION AND CONCLUSION
This investigation provides evidence that using formative assessments and the
progress chart of formative assessments can contribute to more learning in the science
classroom. My initial question was about the impact of formative assessments and the
progress chart of formative assessments on the student. One sub-question was whether
this treatment would affect students’ attitude towards science class. Another sub-question
was whether this treatment would affect students’ summative assessment scores and
ultimately their science grade. I also wanted to determine the effect of this treatment on
my perception of myself as a teacher.
The impact upon the students was an increased engagement in the process of
learning (Table 6) and increased summative test scores (Table 4). Increased engagement
34
in the formative assessment activities in my science class was also evident from the
anecdotal statements in my journal, such as, “[I] walked around [room} and checked on
[formative assessment] activity [and the] majority [of students] were finished and
waiting.” (Feb. 9, 2011) I feel that student attitude towards science class improved
because they understood what was expected of them and were given multiple
opportunities to check their learning through the formative assessments. Improvement of
student attitude towards science class was further supported by a survey of students
concerning the use of the progress charts of formative assessments (Appendix F). An
average of 92% of the students surveyed agreed or strongly agreed to the statement:
“Keeping my practice quiz [formative assessments] scores recorded on a graph has
helped me know how well I am learning science.” Another question on the same survey
(Appendix F) asked students if they scored low on a practice quiz, would they restudy the
material until they had learned it. 74% of those students surveyed agreed or strongly
agreed that they would restudy the material. Overall, 73% of the students surveyed felt
the formative assessments helped them learn science and 44% of those students would
like to see formative assessments used in other classes. These results along with my first
survey results (Appendix E) indicating a majority of students (96%) want to be successful
in school, 90% of the students will accept the personal responsibility of doing well in
school, and 82% of the students would try something new in order to achieve success in
school indicated to me that very often students have the will and drive to be successful
but they often don’t know how to achieve it. Formative assessments and the student
progress chart of formative assessments are tools to help students stay engaged in the
learning process in the science classroom.
35
During the interviews some negative comments did occur. One such negative
comment was, “I don’t think they [formative assessments] helped that much because
some people cheated by not doing the quiz, just writing down the correct answer and then
claiming they got all 5 points.” I recognized this comment as a student more concerned
with how their fellow students were using the strategy and not an interpretation of their
own behavior. After we discussed the abuse of trust and how much the students I
interviewed were bothered by other students cheating during the formative assessment,
another statement was made that helped students focus on the purpose of the formative
assessments: “… you stand at the front of the room and teach us. That helps us too”. The
students all agreed that my discussion of the formative assessment while going over the
answers really helped them to understand the material. I think this review portion of the
formative assessments was the key to improved learning among the students. When
students had specific questions about the material they were given immediate feedback
through the class discussion. The review portion of the formative assessment reinforced
which material was important to learn. Students were interested in what the correct
answer was on the formative assessment and because of this interest they listened as I
explained which answer was correct and why. This often caused other students to ask
questions which allowed a forum for elaboration of the science material. I believe the
formative assessments provided students a purpose for listening to my explanation.
Marzano (2010) explains this as an approach to teaching where “…assessments used for
instructional feedback are scaffolds that gradually increase the knowledge level of the
class as a whole” (p. 32). The overwhelmingly positive response to formative assessment
36
use from my students has convinced me to incorporate them into my classroom
methodology almost daily.
Scoring of the formative assessments and keeping track of this score on the
progress chart was well received by students. 92% of the students surveyed felt that
progress charts helped them in science class (Appendix F). Keeping progress charts of
formative assessments provided a venue for discussion with each student about their
progress in learning the material. Even though my adaptation of the progress chart
(Appendix C) was different from Marzano’s (Appendix A), the progress chart could still
be used to consult with each student during review time before a summative assessment
was given. During this one-on-one time the student was provided time to ask a question
in private. The student and I were able to determine which material needed further study
by the student before the summative assessment. This process provided individualized
attention to each student and allowed me to differentiate the material for each student. I
was able to use both the formative assessment and the progress chart of formative
assessment as teachable moments. Marzano (2010) explains that one of the defining
features of the process of formative assessment is that it provides information to students
and teachers regarding adaptations they might make to improve performances. Students
were able to identify specific content they must improve on and things they might do to
improve. This placed the control of learning back on the students and I feel that over time
the process could empower students to become more active learners. Changing learning
behavior is the key to improvement in learning. Using formative assessments and
progress charts of formative assessments provided a focal point for both the student and I
to effect change in learning behavior.
37
Another question I wanted answered by this research was whether incorporating
the formative assessments and progress chart in my daily routines had an effect on
summative grades. As a result of using formative assessments and the progress chart, the
average of summative test scores for the entire population of students increased by 3% as
calculated by the Statistical Package for the Social Sciences Program (SPSS) (Table 3). I
used the entire population of my students to determine the change in summative
assessment scores to increase the reliability of the calculations. By analyzing individual
summative assessment scores I found that the increase in assessment scores was
predominantly among the lower achievers in class. Interviews with students also support
the claim of improved summative assessment scores. Approximately 50% of the students
in each class improved their test scores as compared to the class average. Those that were
below the class average pre-treatment, narrowed that gap post-treatment. Those students
that scored above the class average pre-treatment, increased their score even more post-
treatment (Appendix J). My initial use of timely formative assessments and the record
keeping process of using the progress chart of formative assessments increased
summative test scores among a substantial portion of my students.
My final sub-question addressed whether this action research would affect my
perception of myself as a teacher. I feel I’m a better teacher because of what I have
learned about formative assessments and engaging the students in the process to improve
learning. This research caused me to think about what the students needed to know in
order to demonstrate mastery of the learning targets. I adapted the pedagogy of formative
assessment to meet my level of comfort using them. I developed the formative
assessments using Power point and these documents can be used year after year
38
(Appendix B). Having a formative assessment document allowed me to modify it if it
didn’t address the learning target as well as it could. The formative assessments could
also be evaluated by comparing them to the summative assessments to be sure they were
addressing the important details of the learning targets. The progress chart provided a
method of record keeping that I could easily refer to and didn’t have to recall information
from memory (Appendix C). Also the students were in control of that record keeping
which placed the responsibility on them. My teacher journal indicated 14 out of 17 times
that the students were receiving the formative assessments in a positive way. Finally, the
increase in summative test scores (Table 4) encourages me to use formative assessments
daily.
VALUE
The experience of conducting this research has led me to clarify my thinking
about formative assessment and its use in my classroom. Because of this experience I feel
more confident in promoting the use of formative assessments and the progress chart of
formative assessments to other teachers. Formative assessments can not only be used by
the teacher to assess the effectiveness of their teaching methods, but can also be used by
the students to self-monitor their progress. In both instances, decisions can be made about
what should be done next to promote learning. I have come to the conclusion that
formative assessments should be used daily as much as possible. This project has also
inspired me to look more closely at the different forms of formative assessments and their
uses in the classroom. Our district is on the verge of leaping into assessments-only
grading practices and formative assessment use will be vital to the success of that
39
practice. I will use my experience with this research project to support other teachers in
their process of learning about formative assessments and I will volunteer to present the
findings of this research during professional development meetings of our staff.
Another effect of this project is that I have more confidence in speaking out in
support of formative assessment use in the classroom. I support formative assessment use
in the classroom, if for no other reason, than the fact that it gives students more control
over their learning. When students have more control, they are more engaged in the
process. Middle school is also a transition period from being the young child in
elementary school to the young adult in high school. New ways of thinking and doing are
needed by students to make this transition. Many of these strategies can be learned in
middle school. As a middle school teacher, I feel I should be helping my students learn
these strategies. Learning to monitor their own progress in learning science is a vital skill
to have in order to be a successful student. Formative assessment use and progress chart
use will help my students learn to monitor their progress. I feel this is a very tangible way
to help students become better learners.
Through this project I’ve realized the many benefits of using formative
assessments and progress charts of formative assessments. Those benefits include more
clear and concise learning targets, more frequent and proficient use of technology in my
classroom, a forum for discussing the topics in an interesting and non-confrontational
way, and most importantly a method of individualizing the instruction I deliver based on
student need. Because of the progress charts I can pinpoint where a student is having
difficulty and provide individualized or small group instruction that benefits specific
students. I can differentiate my curriculum in a meaningful way that provides successful
40
results for my students. Formative assessments can be used in so many ways to benefit
the students and the teacher that they should be considered an invaluable part of the day’s
schedule.
41
REFERENCES CITED
Black, P., & Wiliam, D. (1998). Inside the black box: Raising the standards through classroom assessment. Phi Delta Kappan, 80(2), 139-149.
Chappuis, J. (2009). Seven Strategies of Assessment for Learning. Portland: Educational Testing Service.
Ehrenberg, R. E., Brewer, D. J., Gamoran, A., & Willms, J. D. (2001). Does class size matter? Scientific American, 285(5), 78-85.
Guskey, T. R. (2009). Practical Solutions for Serious Problems in Standards-Based Grading. Thousand Oaks: Corwin Press
Guskey, T. R. & Bailey, J. (2001). Developing Grading and Reporting Systems for Student Learning. Thousand Oaks: Corwin Press.
Kluger, A. N., & DeNisi, A. (1996). The effects of feedback interventions on performance: A historical review, a meta-analysis, and a preliminary feedback intervention theory. Psychological Bulletin, 119(2), 254-284.
Marzano, R. J. (2010). Formative Assessment & Standards-Based Grading. Bloomington: Marzano Research Laboratory.
O’Connor, K. (2002). How to Grade for Learning: Linking Grades to Standards. Thousand Oaks: Corwin Press.
Popham, W. J. (2008). Transformative Assessment. Alexandria: Association for Supervision and Curriculum Development.
Selby, D., & Murphy, S. (1992). Graded or degraded: Perceptions of letter-grading for mainstreamed learning-disabled students. British Columbia Journal of Special Education, 16(1), 92-104.
Shute, V. (2008). Focus on formative feedback. Review of Educational Research, 78, 153-189.
State of Michigan. (1996). Michigan Curriculum Framework. Retrieved December 5, 2010, from Official State of Michigan Website: http://www.michigan.gov/documents/MichiganCurriculumFramework_8172_7.pdf
Stiggins, R. (2005). From Formative Assessment to Assessment FOR Learning: A Path to Success in Standards-Based Schools. Phi Delta Kappan, 87(4), 324-328.
Stiggins, R., Arter, J., Chappuis, J., & Chappuis, S. (2006). Classroom Assessment for Student Learning Doing it Right – Using it Well. Princeton: Educational Testing Service.
42
Wiggins, G. (1996). Honesty and Fairness: Toward Better Grading and Reporting. Alexandria: Association for Supervision and Curriculum Development.
43
APPENDICES
44
APPENDIX A
MARZANO’S STUDENT PROGRESS CHART
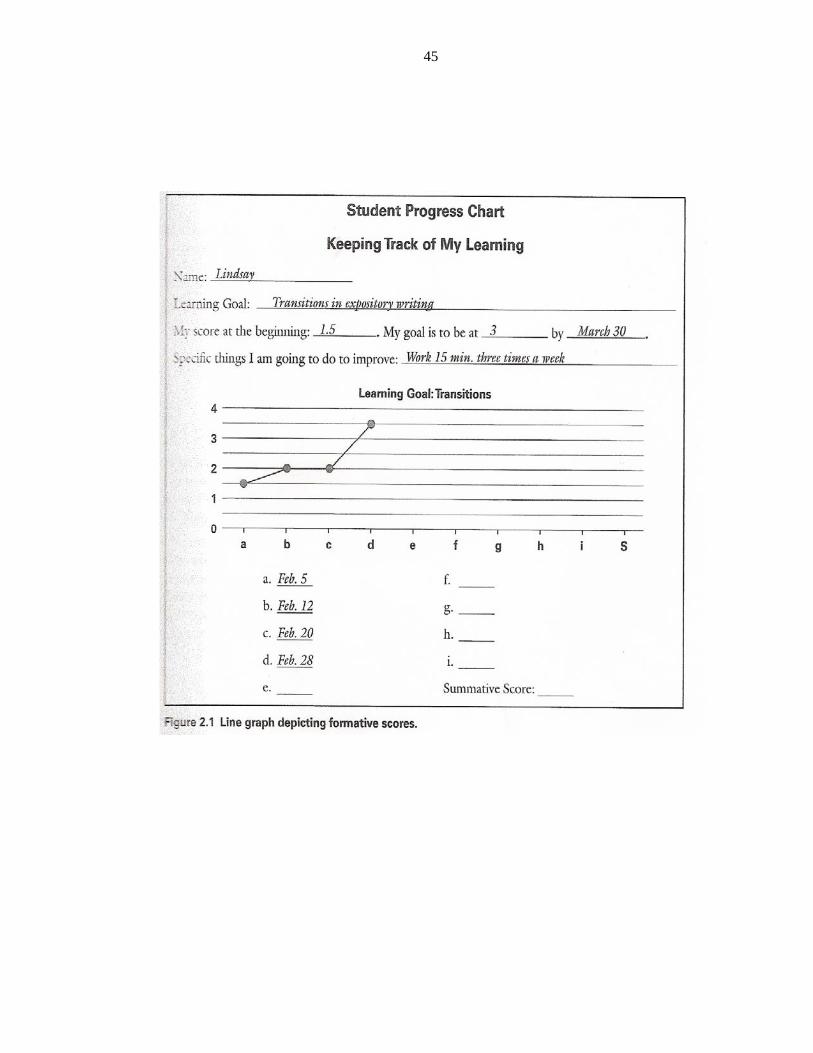
45
46
APPENDIX B
SAMPLE STUDENT PAGE FROM FORMATIVE ASSESSMENT
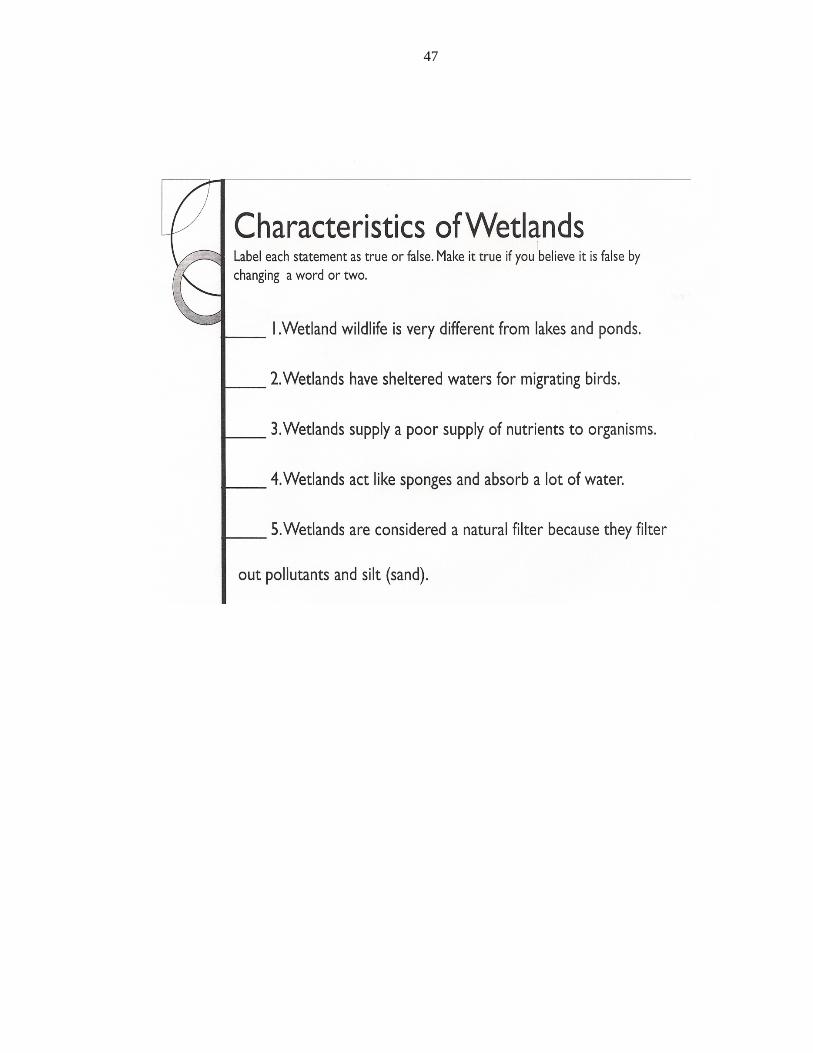
47
48
APPENDIX C
STUDENT PROGRESS CHART OF FORMATIVE ASSESSMENTS
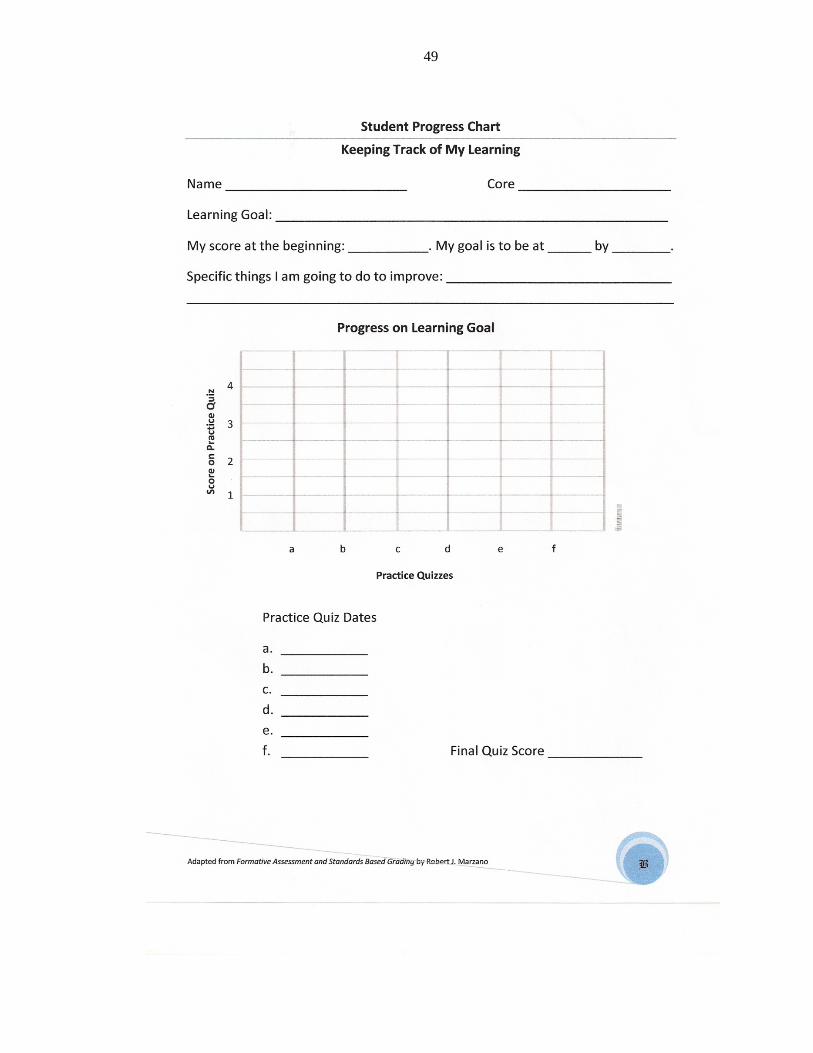
49
50
APPENDIX D
PERMISSION SLIP TO TAKE RESEARCH SURVEYS
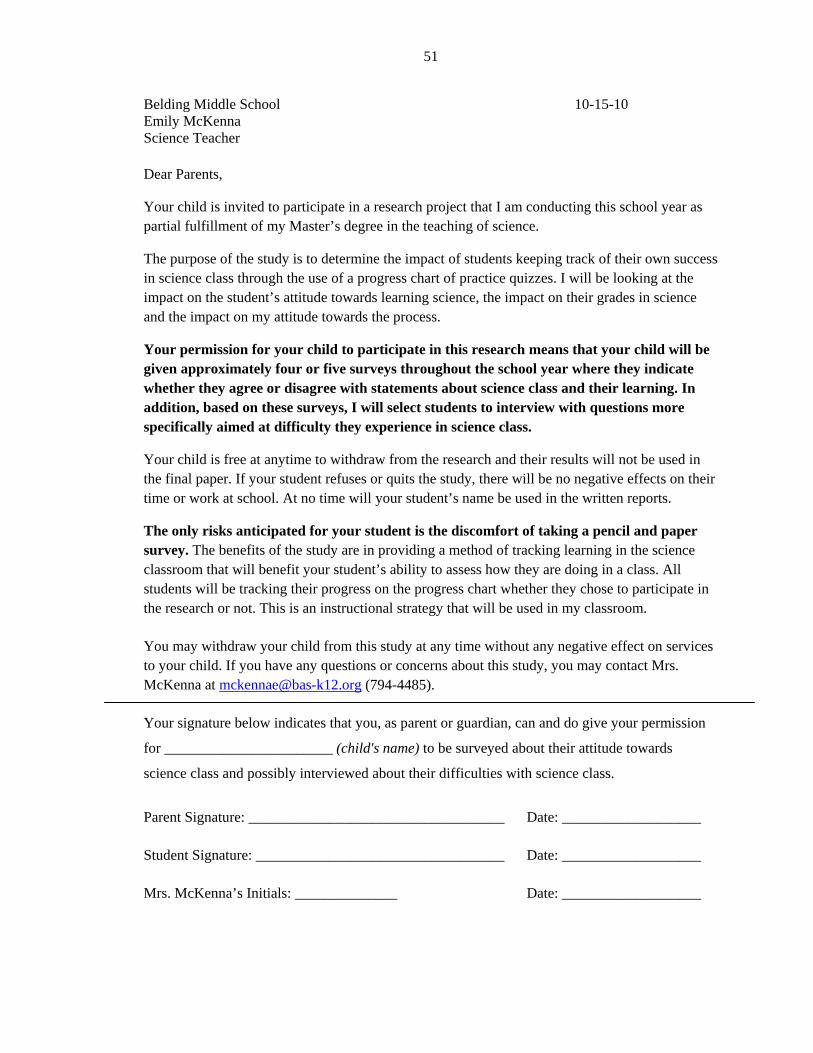
51
Belding Middle School 10-15-10 Emily McKenna Science Teacher Dear Parents,
Your child is invited to participate in a research project that I am conducting this school year as partial fulfillment of my Master’s degree in the teaching of science.
The purpose of the study is to determine the impact of students keeping track of their own success in science class through the use of a progress chart of practice quizzes. I will be looking at the impact on the student’s attitude towards learning science, the impact on their grades in science and the impact on my attitude towards the process.
Your permission for your child to participate in this research means that your child will be given approximately four or five surveys throughout the school year where they indicate whether they agree or disagree with statements about science class and their learning. In addition, based on these surveys, I will select students to interview with questions more specifically aimed at difficulty they experience in science class.
Your child is free at anytime to withdraw from the research and their results will not be used in the final paper. If your student refuses or quits the study, there will be no negative effects on their time or work at school. At no time will your student’s name be used in the written reports.
The only risks anticipated for your student is the discomfort of taking a pencil and paper survey. The benefits of the study are in providing a method of tracking learning in the science classroom that will benefit your student’s ability to assess how they are doing in a class. All students will be tracking their progress on the progress chart whether they chose to participate in the research or not. This is an instructional strategy that will be used in my classroom.
You may withdraw your child from this study at any time without any negative effect on services to your child. If you have any questions or concerns about this study, you may contact Mrs. McKenna at [email protected] (794-4485).
Your signature below indicates that you, as parent or guardian, can and do give your permission
for _______________________ (child's name) to be surveyed about their attitude towards
science class and possibly interviewed about their difficulties with science class.
Parent Signature: ___________________________________ Date: ___________________
Student Signature: __________________________________ Date: ___________________
Mrs. McKenna’s Initials: ______________ Date: ___________________
52
APPENDIX E
1ST SURVEY OF STUDENT ATTITUDE
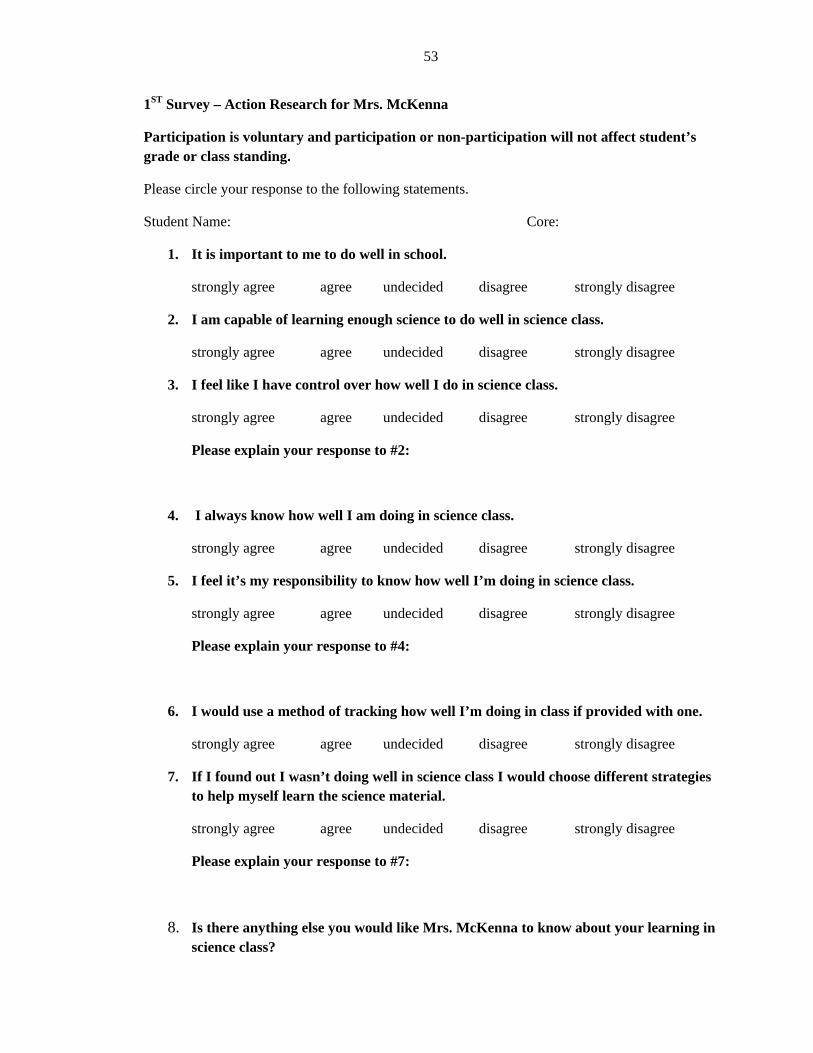
53
1ST Survey – Action Research for Mrs. McKenna
Participation is voluntary and participation or non-participation will not affect student’s grade or class standing.
Please circle your response to the following statements.
Student Name: Core:
1. It is important to me to do well in school.
strongly agree agree undecided disagree strongly disagree
2. I am capable of learning enough science to do well in science class.
strongly agree agree undecided disagree strongly disagree
3. I feel like I have control over how well I do in science class.
strongly agree agree undecided disagree strongly disagree
Please explain your response to #2:
4. I always know how well I am doing in science class.
strongly agree agree undecided disagree strongly disagree
5. I feel it’s my responsibility to know how well I’m doing in science class.
strongly agree agree undecided disagree strongly disagree
Please explain your response to #4:
6. I would use a method of tracking how well I’m doing in class if provided with one.
strongly agree agree undecided disagree strongly disagree
7. If I found out I wasn’t doing well in science class I would choose different strategies to help myself learn the science material.
strongly agree agree undecided disagree strongly disagree
Please explain your response to #7:
8. Is there anything else you would like Mrs. McKenna to know about your learning in science class?

54
APPENDIX F
2ND SURVEY OF STUDENT ATTITUDE
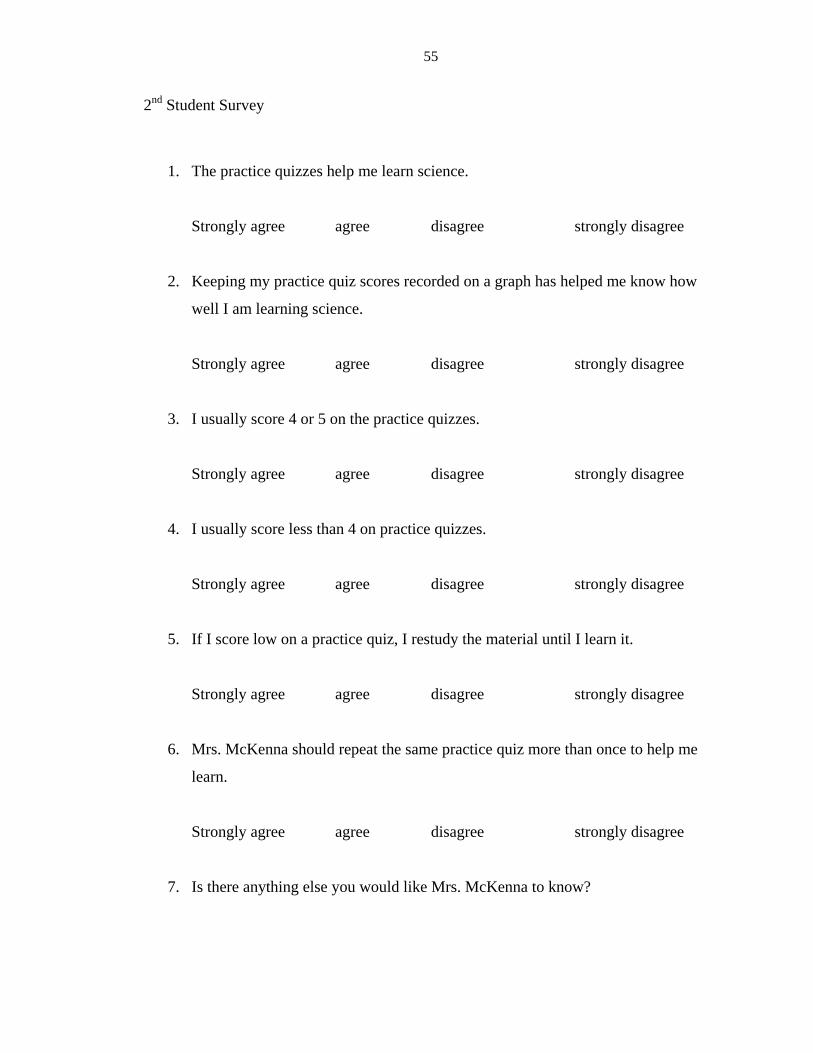
55
2nd Student Survey
1. The practice quizzes help me learn science.
Strongly agree agree disagree strongly disagree
2. Keeping my practice quiz scores recorded on a graph has helped me know how
well I am learning science.
Strongly agree agree disagree strongly disagree
3. I usually score 4 or 5 on the practice quizzes.
Strongly agree agree disagree strongly disagree
4. I usually score less than 4 on practice quizzes.
Strongly agree agree disagree strongly disagree
5. If I score low on a practice quiz, I restudy the material until I learn it.
Strongly agree agree disagree strongly disagree
6. Mrs. McKenna should repeat the same practice quiz more than once to help me
learn.
Strongly agree agree disagree strongly disagree
7. Is there anything else you would like Mrs. McKenna to know?

56
APPENDIX G
3RD SURVEY OF STUDENT ATTITUDE
57
3rd Survey – Action Research Please circle your response to the following statements.
1. I have learned enough science this year to do well in class.
Strongly agree agree undecided disagree strongly disagree
2. Mrs. McKenna gives me enough practice with science concepts that I feel I have control over how well I do in science class.
Strongly agree agree undecided disagree strongly disagree
3. Short practice quizzes given over the projector helped me learn the science material.
Strongly agree agree undecided disagree strongly disagree
4. I feel I would learn more in a classroom that used practice quizzes at the beginning of each hour.
Strongly agree agree undecided disagree strongly disagree
5. Mrs. McKenna has helped me learn science this year by the way she conducts the classroom.
Strongly agree agree undecided disagree strongly disagree
6. There are things I would like Mrs. McKenna to do differently in the classroom.
Strongly agree agree undecided disagree strongly disagree
7. Please write down what you would like to see changed in Mrs. McKenna’s classroom.
8. Please write down anything else you would like Mrs. McKenna to know at this time.
58
APPENDIX H
INTERVIEW TRANSCRIPTS
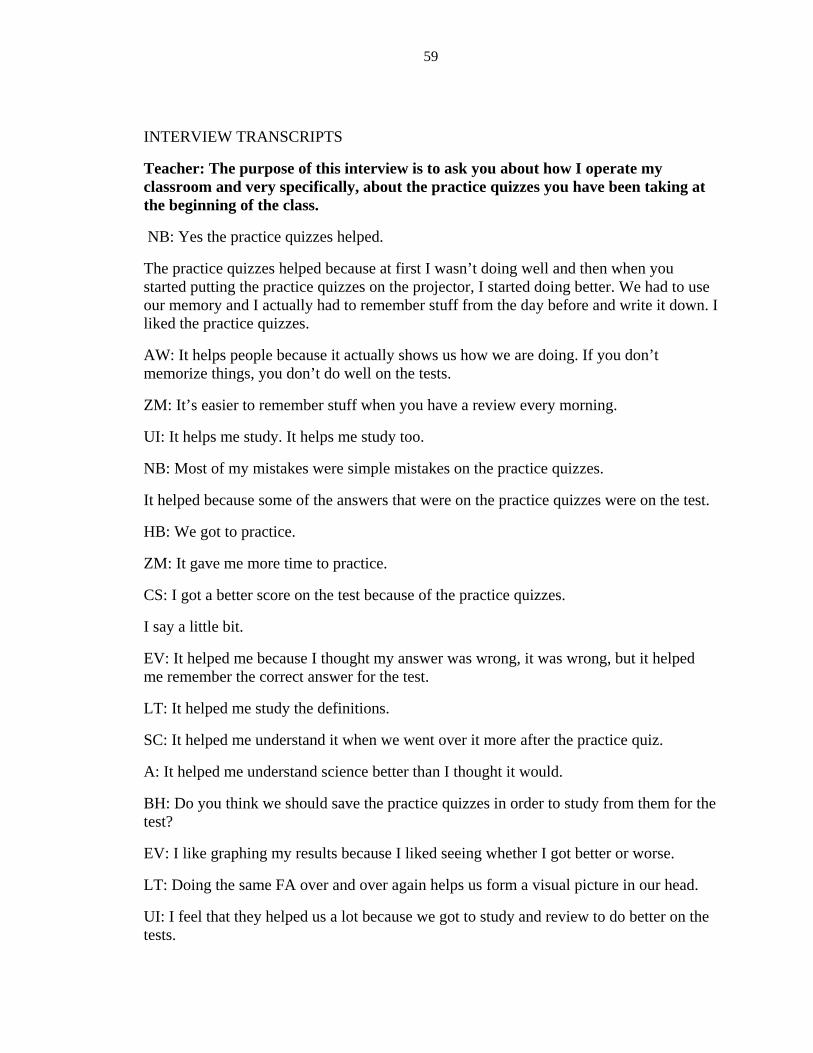
59
INTERVIEW TRANSCRIPTS
Teacher: The purpose of this interview is to ask you about how I operate my classroom and very specifically, about the practice quizzes you have been taking at the beginning of the class.
NB: Yes the practice quizzes helped.
The practice quizzes helped because at first I wasn’t doing well and then when you started putting the practice quizzes on the projector, I started doing better. We had to use our memory and I actually had to remember stuff from the day before and write it down. I liked the practice quizzes.
AW: It helps people because it actually shows us how we are doing. If you don’t memorize things, you don’t do well on the tests.
ZM: It’s easier to remember stuff when you have a review every morning.
UI: It helps me study. It helps me study too.
NB: Most of my mistakes were simple mistakes on the practice quizzes.
It helped because some of the answers that were on the practice quizzes were on the test.
HB: We got to practice.
ZM: It gave me more time to practice.
CS: I got a better score on the test because of the practice quizzes.
I say a little bit.
EV: It helped me because I thought my answer was wrong, it was wrong, but it helped me remember the correct answer for the test.
LT: It helped me study the definitions.
SC: It helped me understand it when we went over it more after the practice quiz.
A: It helped me understand science better than I thought it would.
BH: Do you think we should save the practice quizzes in order to study from them for the test?
EV: I like graphing my results because I liked seeing whether I got better or worse.
LT: Doing the same FA over and over again helps us form a visual picture in our head.
UI: I feel that they helped us a lot because we got to study and review to do better on the tests.
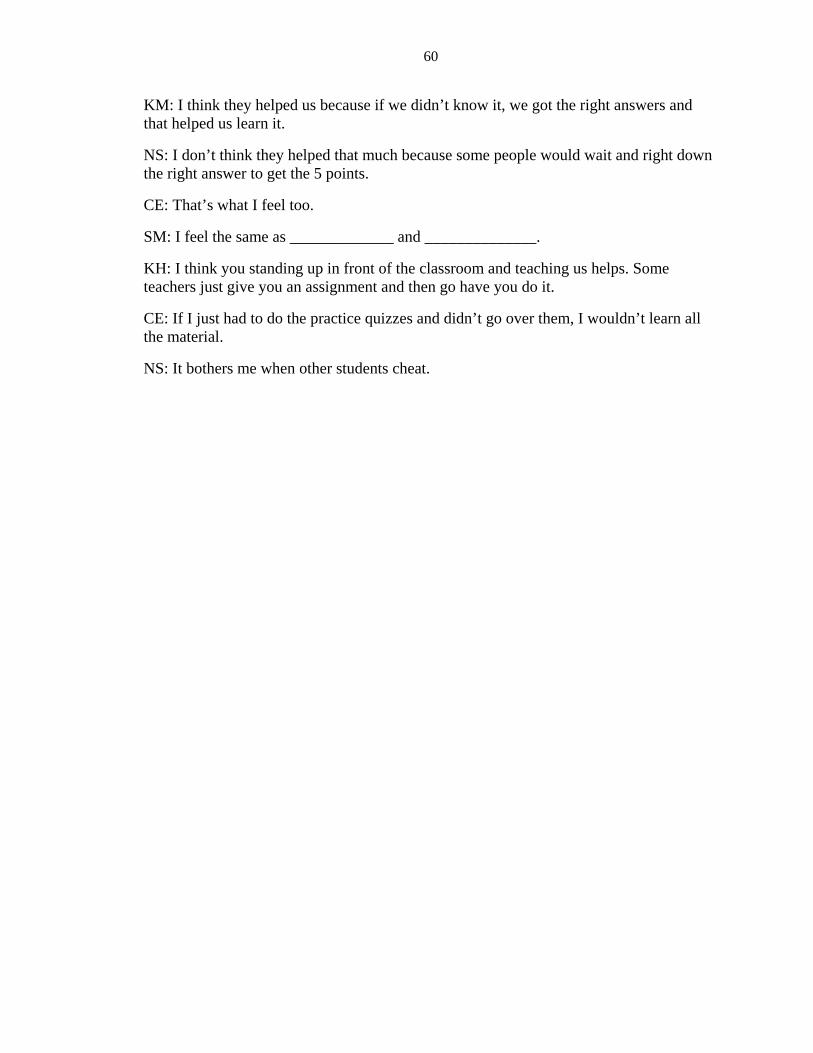
60
KM: I think they helped us because if we didn’t know it, we got the right answers and that helped us learn it.
NS: I don’t think they helped that much because some people would wait and right down the right answer to get the 5 points.
CE: That’s what I feel too.
SM: I feel the same as _____________ and ______________.
KH: I think you standing up in front of the classroom and teaching us helps. Some teachers just give you an assignment and then go have you do it.
CE: If I just had to do the practice quizzes and didn’t go over them, I wouldn’t learn all the material.
NS: It bothers me when other students cheat.
61
APPENDIX I
SAMPLE OF TEACHER JOURNAL
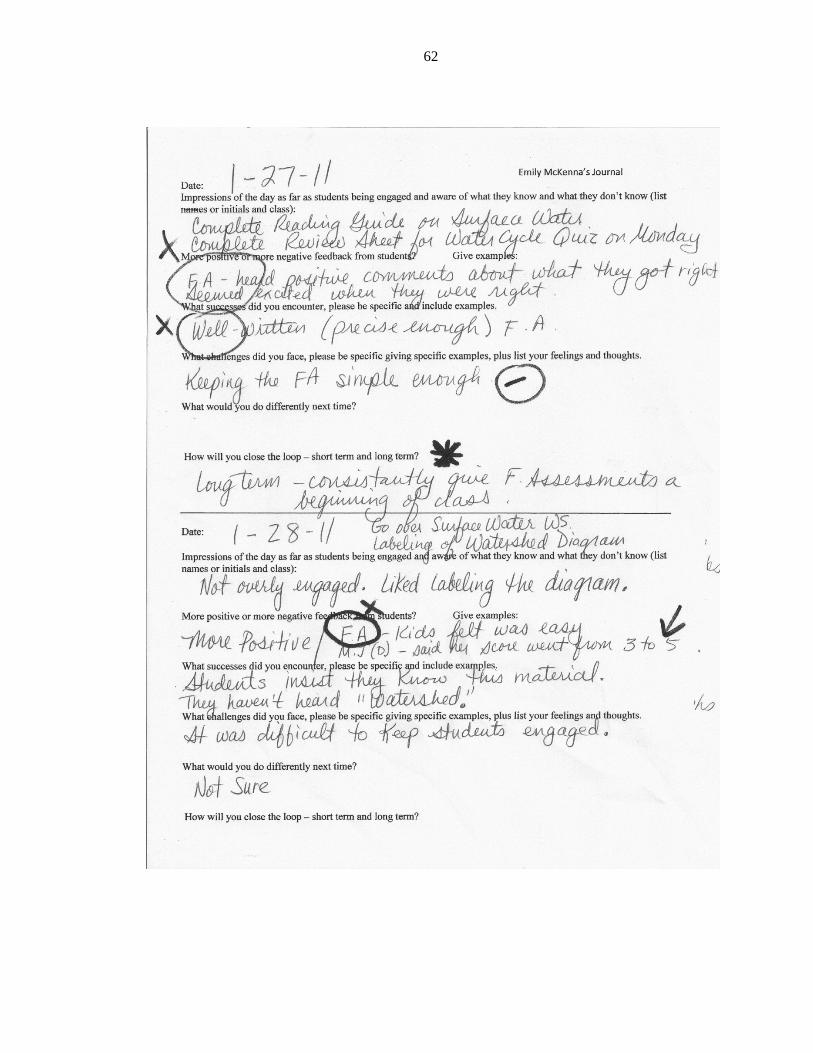
62
63
APPENDIX J
INDIVIDUAL MEAN SUMMATIVE ASSESSMENT SCORES
PRE-TREATMENT AND POST-TREATMENT
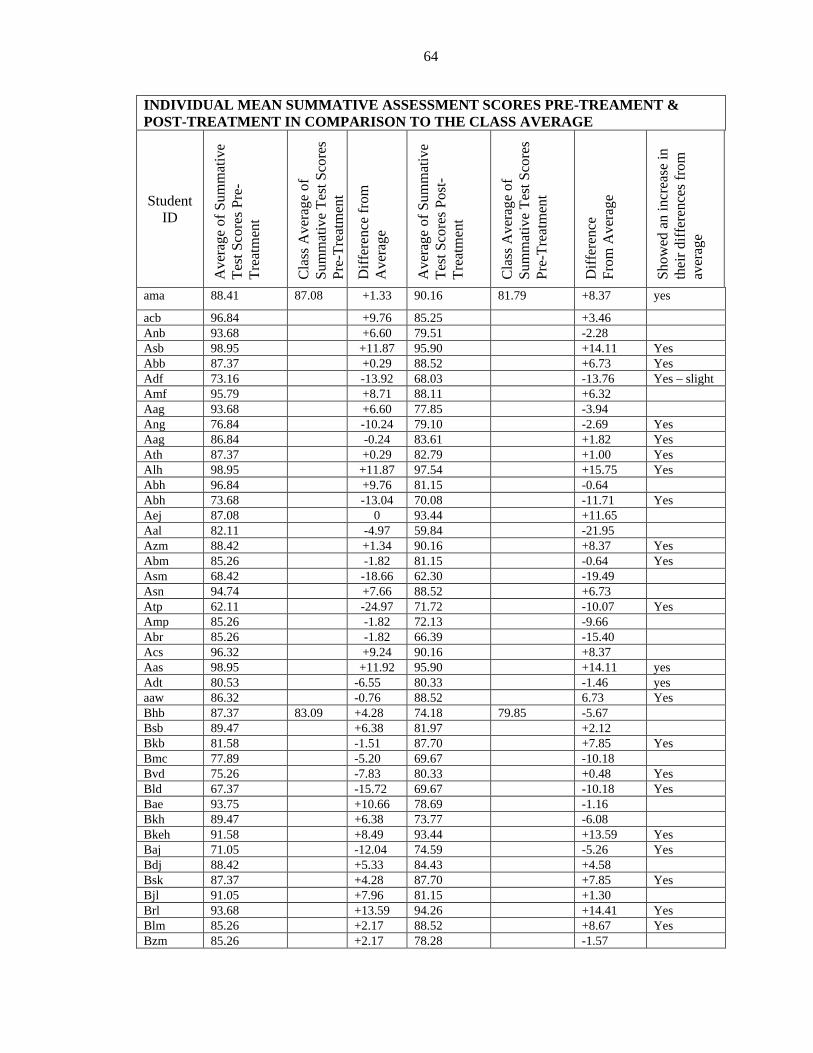
64
INDIVIDUAL MEAN SUMMATIVE ASSESSMENT SCORES PRE-TREAMENT & POST-TREATMENT IN COMPARISON TO THE CLASS AVERAGE
Student ID
Ave
rage
of S
umm
ativ
e Te
st S
core
s Pre
-Tr
eatm
ent
Cla
ss A
vera
ge o
f Su
mm
ativ
e Te
st S
core
s Pr
e-Tr
eatm
ent
Diff
eren
ce fr
om
Ave
rage
Ave
rage
of S
umm
ativ
e Te
st S
core
s Pos
t-Tr
eatm
ent
Cla
ss A
vera
ge o
f Su
mm
ativ
e Te
st S
core
s Pr
e-Tr
eatm
ent
Diff
eren
ce
From
Ave
rage
Show
ed a
n in
crea
se in
th
eir d
iffer
ence
s fro
m
aver
age
ama 88.41 87.08 +1.33 90.16 81.79 +8.37 yes
acb 96.84 +9.76 85.25 +3.46 Anb 93.68 +6.60 79.51 -2.28 Asb 98.95 +11.87 95.90 +14.11 Yes Abb 87.37 +0.29 88.52 +6.73 Yes Adf 73.16 -13.92 68.03 -13.76 Yes – slight Amf 95.79 +8.71 88.11 +6.32 Aag 93.68 +6.60 77.85 -3.94 Ang 76.84 -10.24 79.10 -2.69 Yes Aag 86.84 -0.24 83.61 +1.82 Yes Ath 87.37 +0.29 82.79 +1.00 Yes Alh 98.95 +11.87 97.54 +15.75 Yes Abh 96.84 +9.76 81.15 -0.64 Abh 73.68 -13.04 70.08 -11.71 Yes Aej 87.08 0 93.44 +11.65 Aal 82.11 -4.97 59.84 -21.95 Azm 88.42 +1.34 90.16 +8.37 Yes Abm 85.26 -1.82 81.15 -0.64 Yes Asm 68.42 -18.66 62.30 -19.49 Asn 94.74 +7.66 88.52 +6.73 Atp 62.11 -24.97 71.72 -10.07 Yes Amp 85.26 -1.82 72.13 -9.66 Abr 85.26 -1.82 66.39 -15.40 Acs 96.32 +9.24 90.16 +8.37 Aas 98.95 +11.92 95.90 +14.11 yes Adt 80.53 -6.55 80.33 -1.46 yes aaw 86.32 -0.76 88.52 6.73 Yes Bhb 87.37 83.09 +4.28 74.18 79.85 -5.67 Bsb 89.47 +6.38 81.97 +2.12 Bkb 81.58 -1.51 87.70 +7.85 Yes Bmc 77.89 -5.20 69.67 -10.18 Bvd 75.26 -7.83 80.33 +0.48 Yes Bld 67.37 -15.72 69.67 -10.18 Yes Bae 93.75 +10.66 78.69 -1.16 Bkh 89.47 +6.38 73.77 -6.08 Bkeh 91.58 +8.49 93.44 +13.59 Yes Baj 71.05 -12.04 74.59 -5.26 Yes Bdj 88.42 +5.33 84.43 +4.58 Bsk 87.37 +4.28 87.70 +7.85 Yes Bjl 91.05 +7.96 81.15 +1.30 Brl 93.68 +13.59 94.26 +14.41 Yes Blm 85.26 +2.17 88.52 +8.67 Yes Bzm 85.26 +2.17 78.28 -1.57
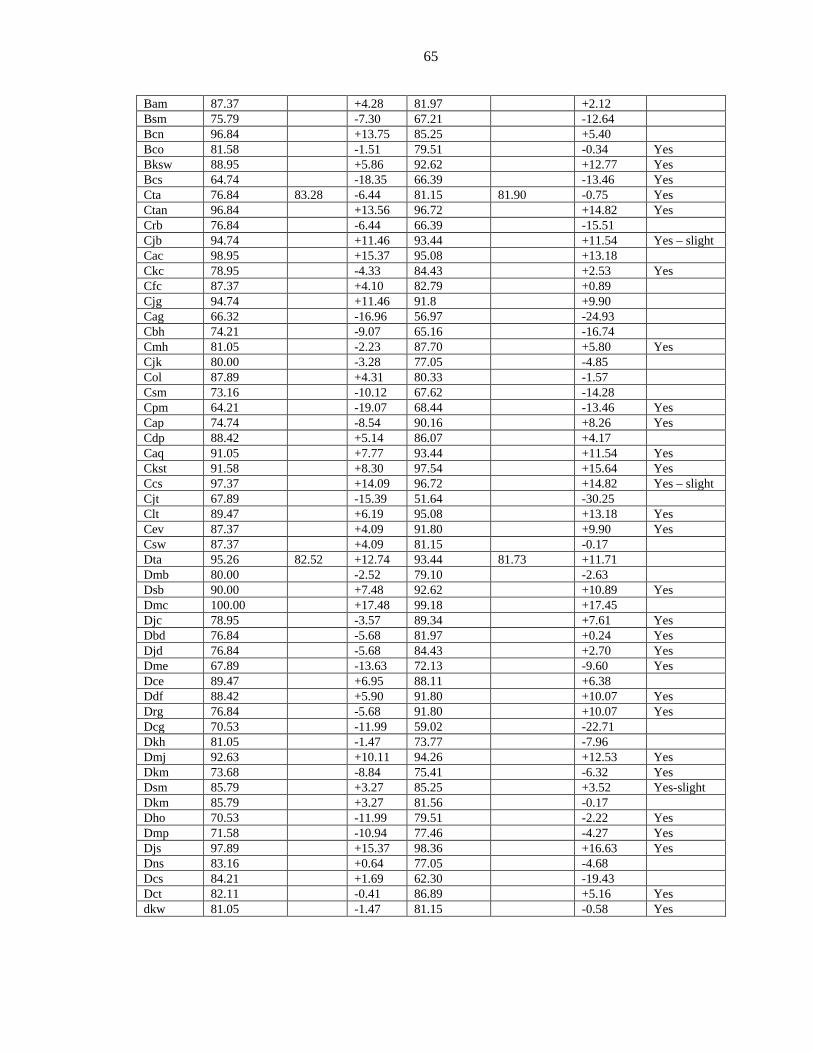
65
Bam 87.37 +4.28 81.97 +2.12 Bsm 75.79 -7.30 67.21 -12.64 Bcn 96.84 +13.75 85.25 +5.40 Bco 81.58 -1.51 79.51 -0.34 Yes Bksw 88.95 +5.86 92.62 +12.77 Yes Bcs 64.74 -18.35 66.39 -13.46 Yes Cta 76.84 83.28 -6.44 81.15 81.90 -0.75 Yes Ctan 96.84 +13.56 96.72 +14.82 Yes Crb 76.84 -6.44 66.39 -15.51 Cjb 94.74 +11.46 93.44 +11.54 Yes – slight Cac 98.95 +15.37 95.08 +13.18 Ckc 78.95 -4.33 84.43 +2.53 Yes Cfc 87.37 +4.10 82.79 +0.89 Cjg 94.74 +11.46 91.8 +9.90 Cag 66.32 -16.96 56.97 -24.93 Cbh 74.21 -9.07 65.16 -16.74 Cmh 81.05 -2.23 87.70 +5.80 Yes Cjk 80.00 -3.28 77.05 -4.85 Col 87.89 +4.31 80.33 -1.57 Csm 73.16 -10.12 67.62 -14.28 Cpm 64.21 -19.07 68.44 -13.46 Yes Cap 74.74 -8.54 90.16 +8.26 Yes Cdp 88.42 +5.14 86.07 +4.17 Caq 91.05 +7.77 93.44 +11.54 Yes Ckst 91.58 +8.30 97.54 +15.64 Yes Ccs 97.37 +14.09 96.72 +14.82 Yes – slight Cjt 67.89 -15.39 51.64 -30.25 Clt 89.47 +6.19 95.08 +13.18 Yes Cev 87.37 +4.09 91.80 +9.90 Yes Csw 87.37 +4.09 81.15 -0.17 Dta 95.26 82.52 +12.74 93.44 81.73 +11.71 Dmb 80.00 -2.52 79.10 -2.63 Dsb 90.00 +7.48 92.62 +10.89 Yes Dmc 100.00 +17.48 99.18 +17.45 Djc 78.95 -3.57 89.34 +7.61 Yes Dbd 76.84 -5.68 81.97 +0.24 Yes Djd 76.84 -5.68 84.43 +2.70 Yes Dme 67.89 -13.63 72.13 -9.60 Yes Dce 89.47 +6.95 88.11 +6.38 Ddf 88.42 +5.90 91.80 +10.07 Yes Drg 76.84 -5.68 91.80 +10.07 Yes Dcg 70.53 -11.99 59.02 -22.71 Dkh 81.05 -1.47 73.77 -7.96 Dmj 92.63 +10.11 94.26 +12.53 Yes Dkm 73.68 -8.84 75.41 -6.32 Yes Dsm 85.79 +3.27 85.25 +3.52 Yes-slight Dkm 85.79 +3.27 81.56 -0.17 Dho 70.53 -11.99 79.51 -2.22 Yes Dmp 71.58 -10.94 77.46 -4.27 Yes Djs 97.89 +15.37 98.36 +16.63 Yes Dns 83.16 +0.64 77.05 -4.68 Dcs 84.21 +1.69 62.30 -19.43 Dct 82.11 -0.41 86.89 +5.16 Yes dkw 81.05 -1.47 81.15 -0.58 Yes