Embed Size (px)
Citation preview

Forward
Page | 1
www.fastbridge.org© 2015 Theodore J. Christ and Colleagues, LLC. All rightsreserved.
Formative Assessment
System for Teachers™
(FAST™)
Abbreviated Technical Manual for IowaVersion 2.0, 2015–2016
NOTICE: Information for measures that were not implementedstatewide is omitted from this publication at the request of
The Iowa Department of Education.

Forward
Page | 1www.fastbridge.org
© 2015 Theodore J. Christ and Colleagues, LLC. All rights reserved.
Formative Assessment System for Teachers™ (FAST™): Abridged Technical ManualVersion for Iowa 2.0
Copyright © 2015 by Theodore J. Christ andColleagues, LLC. All rights reserved.
Warning: No part of this publication may bereproduced or transmitted in any form or by anymeans, electronic or mechanical, now known or laterdeveloped, including, but not limited to,photocopying, recording, or the process of scanningand digitizing, transmitted, or stored in a database orretrieval system, without permission in writing fromthe copyright owner.
Published by Theodore J. Christ and Colleagues, LLC (TJCC)
Distributed by TJCC and FastBridge Learning, LLC (FBL)
43 Main Street SE Suite # 509Minneapolis, MN 55414Email: [email protected]: www.fastbridge.orgPhone: 612-424-3714
Prepared by Theodore J. Christ, PhD as Senior Author and Editor with contributions from (alphabetic order)Yvette Anne Arañas, MA; LeAnne Johnson, PhD; Jessie M. Kember, MA; Stephen Kilgus, PhD; Allyson J. Kiss;Allison M. McCarthy Trentman, PhD; Barbara D. Monaghen PhD; Gena Nelson, MA; Peter Nelson, PhD; KirstenW. Newell, MA; Ethan R. Van Norman, PhD; Mary Jane White, PhD; and Holly Windram, PhD as AssociateAuthors and Editors.
Citation:Theodore J. Christ and Colleagues (2015). Formative Assessment System for Teachers: Abbreviated TechnicalManual for Iowa Version 2.0, Minneapolis, MN: Author and FastBridge Learning (www.fastbridge.org)

Forward
Page | 2www.fastbridge.org
© 2015 Theodore J. Christ and Colleagues, LLC. All rights reserved.
Forward
Our Story
Over 15 years, our research team received competitive funding from the US Department of Education to buildknowledge and improve educational assessments. The Formative Assessment System for Teachers™ (FAST™) ishow we disseminate that work. It was developed to reduce the gap between research at universities andresults in the classroom, which can take 10 to 30 years in a typical cycle. FAST™ has reduced that to weeks ormonths. We innovate today and implement tomorrow.
In 2010, Dr. Zoheb H. Borbora (Co-Founder) and I (Founder) conceptualized and created FAST™ as a cloud-based system at the University of Minnesota. Our goal was to use research and technology to make it easierfor teachers to collect and use data to improve student outcomes. We initially tried to create and distribute forfree. That model was unsustainable. We had no resources to achieve our standard of excellence. The schoolleadership and teachers that were our partners preferred an excellent low-cost system over a good freesystem. With the University, we made this transition in early 2012. The demand for FAST™ was tremendousand overwhelming. The demand quickly outpaced what we could support at the University. So, FastBridgeLearning was launched in the spring of 2015 to distribute and support FAST™.
FastBridge Learning is a partnership between the University of Minnesota, “Theodore J. Christ and Colleagues”(TJCC), and the FAST™ team. In 2014–15, FAST™ was used in more than 30 states, which includes a statewideadoption in Iowa (92% of schools). FAST™ users exceeded 5 million administrations in 2014–15. The feedbackhas been tremendous. In partnership, we continue to strive for our vision: Research to Results™.
Our Mission
The University of Minnesota and TJCC continue with their mission to innovate with research anddevelopment. FastBridge Learning continues to translate those innovations into practice for use by teachers.We aspire to provide a seamless and fully integrated solution for PreK–12 teaching, learning, and assessment.We are not just about assessment. We are about learning and optimization of teaching, parenting, and being.FAST™ was the centerpiece of FastBridge Learning in 2014–15. It will soon be supplemented with teachingand learning tools (e.g., materials, guides, reports, and automated software-based personalized instruction).
Like-minded researchers and trainers are encouraged to join our cause ([email protected],www.fastbridge.org). Educators are invited to join FastBridge Learning and challenge us to innovate anddeliver solutions for the most challenging teaching and learning problems.
Our Values
We are values driven. We strive towards our values. Those are: Tell the Truth, Respect the Teacher, andDeliver High-Value Solutions. These values inform our work, and we measure our successes against them.We invite others to hold us accountable.

Forward
Page | 3www.fastbridge.org
© 2015 Theodore J. Christ and Colleagues, LLC. All rights reserved.
We Tell the TruthPerhaps more than at any time in the past, educators are bombarded with claims of research, evidence, data,statistics, and assessments. These words relate to very important and lofty subject matter that is underminedwhen they are misused or abused for marketing, sales, or self-promotion. We strive to know better and dobetter. We strive to tell the truth. And, the truth is that all research has its limitations, as do the various types ofassessment and data. That is true regardless of any misleading claims. So, we acknowledge the limitations ofthe tools we deliver, and we do not exaggerate our claims. Instead, we deliver multiple types of assessment inone suite and provide guidance so users use the right tool for the right purpose. It is an honest and bettersolution for teachers.
We Respect the TeacherAt the beginning, FAST™ (Formative Assessment System for Teachers) was named to make the value ofteachers explicit. They are the primary intended user so we include them and value their opinions that guideour research, development and refinement. We are in service to the professional educator. We aspire to maketheir work easier and more effective.
I (Dr. Christ) was a paraprofessional, residential counselor, and special education teacher. I earned my MA andPhD degrees in school psychology as part of my professional development to be a better teacher for studentswho are at risk. I always intended to return to the classroom but was drawn into a research career, which givesme great joy. Our team respects, responds, and solicits input from teachers who work to solve difficultproblems with limited resources. We try to understand and meet their needs—and yours—with qualityresearch, engineering, training, and support.
We Deliver High-Value SolutionsWe strive to provide systems and services that are effective, efficient, elegant and economical.
An effective solution improves child outcomes. An efficient solution saves time and resources. An elegant solution is pleasing and easy to use. An economical solution is sustainable for us and our users.
Design and user focus are central tenets.

Forward
Page | 4www.fastbridge.org
© 2015 Theodore J. Christ and Colleagues, LLC. All rights reserved.
Final Note from Dr. Christ
Thank you for considering our work. It is a compilation of efforts by many graduate and undergraduatestudents, researchers, teachers, principals, and state agencies. This would not exist without them. I am verythankful for their contributions. I hope it confers great benefit to the professional educator and the childrenthey serve. Education has the potential to be the great equalizer and reduce the gaps in opportunity andachievement; however, we will only realize that potential if education is of high and equitable quality. I hopewe help in the pursuit of that.
Sincerely,Ted
Theodore J. Christ, PhDCo-Founder and Chief Scientific Officer

Table of Contents
Page | 5www.fastbridge.org
© 2015 Theodore J. Christ and Colleagues, LLC. All rights reserved.
Contents
Forward ....................................................................................................................................................................................2
Our Story..................................................................................................................................................................................2
Our Mission .............................................................................................................................................................................2
Our Values ...............................................................................................................................................................................2
We Tell the Truth..............................................................................................................................................................3
We Respect the Teacher ................................................................................................................................................3
We Deliver High-Value Solutions ...............................................................................................................................3
Final Note from Dr. Christ ..................................................................................................................................................4
Table of Figures ..........................................................................................................................................................................8
Table of Tables............................................................................................................................................................................9
Section 1. Introduction to FAST™ and FastBridge Learning.................................................................................... 13
Chapter 1.1: Overview, Purpose, and Description ................................................................................................. 13
Background..................................................................................................................................................................... 13
All in One.......................................................................................................................................................................... 13
Support and Training .................................................................................................................................................. 14
Trusted Results............................................................................................................................................................... 14
Curriculum-Based Measurement (CBM) ............................................................................................................... 14
Prevention and Intervention .................................................................................................................................... 15
Chapter 1.2: Development ............................................................................................................................................. 15
Chapter 1.3: Administration and Scoring.................................................................................................................. 15
Setting Standards ......................................................................................................................................................... 15
Chapter 1.4: Interpretation of Test Results ............................................................................................................... 16
Standard Setting ........................................................................................................................................................... 16
Chapter 1.5: Reliability ..................................................................................................................................................... 20
Chapter 1.6: Validity.......................................................................................................................................................... 21
Chapter 1.7: Diagnostic Accuracy of Benchmarks ................................................................................................. 21
A Conceptual Explanation: Diagnostic Accuracy of Screeners..................................................................... 22
Decisions that Guide Benchmarks Selection: Early Intervention and Prevention................................. 22
Area Under the Curve (AUC) ..................................................................................................................................... 23
Decision Threshold: Benchmark.............................................................................................................................. 23
Section 2. Reading and Language.................................................................................................................................... 25
Chapter 2.1: Overview, Purpose, and Description ................................................................................................. 25

Table of Contents
Page | 6www.fastbridge.org
© 2015 Theodore J. Christ and Colleagues, LLC. All rights reserved.
earlyReading................................................................................................................................................................... 25
CBMreading .................................................................................................................................................................... 27
aReading .......................................................................................................................................................................... 29
Chapter 2.2: Development ............................................................................................................................................. 37
earlyReading................................................................................................................................................................... 37
CBMreading .................................................................................................................................................................... 38
aReading .......................................................................................................................................................................... 38
Chapter 2.3: Administration and Scoring.................................................................................................................. 43
earlyReading................................................................................................................................................................... 43
CBMreading .................................................................................................................................................................... 43
aReading .......................................................................................................................................................................... 44
Chapter 2.4: Interpreting Test Results ........................................................................................................................ 44
earlyReading................................................................................................................................................................... 44
CBMreading .................................................................................................................................................................... 46
aReading .......................................................................................................................................................................... 47
Chapter 2.5: Reliability ..................................................................................................................................................... 49
earlyReading................................................................................................................................................................... 49
CBMreading .................................................................................................................................................................... 59
aReading .......................................................................................................................................................................... 72
Chapter 2.6: Validation..................................................................................................................................................... 72
earlyReading................................................................................................................................................................... 72
CBMreading .................................................................................................................................................................... 80
aReading .......................................................................................................................................................................... 86
Chapter 2.7: Diagnostic Accuracy ..............................................................................................................................101
earlyReading.................................................................................................................................................................101
CBMreading ..................................................................................................................................................................108
aReading ........................................................................................................................................................................114
Section 6. FAST™ as Evidence-Based Practice ............................................................................................................121
6.1: Theory of Change ....................................................................................................................................................122
6.2: Formative Assessment as Evidence-Based Practice ....................................................................................122
US Department of Education..................................................................................................................................122
Historical Evidence on Formative Assessment.................................................................................................123
Evidence Based: Contemporary Evidence on Formative Assessment.....................................................123
6.3: Evidence-Based: Formative Assessment System for Teachers ................................................................125
FAST™ Improves Student Achievement .............................................................................................................125

Table of Contents
Page | 7www.fastbridge.org
© 2015 Theodore J. Christ and Colleagues, LLC. All rights reserved.
FAST™ Improves the Practice of Teachers..........................................................................................................126
FAST™ Provides High Quality Formative Assessments..................................................................................126
References...............................................................................................................................................................................127
Appendix A: Benchmarks and Norms Information...................................................................................................145
Appendix B: FastBridge Learning Reading Diagnostic Accuracy ........................................................................146
Table of Contents
Page | 8www.fastbridge.org
© 2015 Theodore J. Christ and Colleagues, LLC. All rights reserved.
Table of Figures
Figure 1 A priori model for unified reading achievement ....................................................................................... 40Figure 3. Example of a student's aReading report with interpretations of the scaled score....................... 48Figure 14 Theory of Change .............................................................................................................................................122

Table of Contents
Page | 9www.fastbridge.org
© 2015 Theodore J. Christ and Colleagues, LLC. All rights reserved.
Table of Tables
Table 1 Example Standards for Informational Text .................................................................................................... 42Table 2 Foundational Skill Examples for Kindergarten and First Grade Students........................................... 42Table 3 Cross-Referencing CCSS Domains and aReading Domains..................................................................... 42Table 4 Weighting Scheme for earlyReading Composite Scores .......................................................................... 45Table 5. Demographic Information for earlyReading Alternate Form Sample................................................. 49Table 6 Alternate Form Reliability and SEm for earlyReading................................................................................ 50Table 7 Internal Consistency for earlyReading subtests of variable test length.............................................. 52Table 8 Internal Consistency for earlyReading subtests of fixed test length .................................................... 52Table 9 Descriptive Information for earlyReading Test-Retest Reliability Sample.......................................... 54Table 10 Test-Retest Reliability for all earlyReading Screening Measures ......................................................... 55Table 11 Disaggregated Test Re-Test Reliability for earlyReading Measures ................................................... 56Table 12 Inter-Rater Reliability by earlyReading Subtest ........................................................................................ 57Table 13 Demographic Information for earlyReading Reliability of the Slope Sample................................. 57Table 14 Reliability of the Slope for all earlyReading screening measures........................................................ 58Table 15. Reliability of the Slope for earlyReading measures, Disaggregated by Ethnicity ........................ 59Table 16. Demographic Information for CBMreading First Passage Reduction Sample .............................. 61Table 17 Descriptive Statistics for First Passage Reduction..................................................................................... 62Table 18. Demographic Information for Second Passage Reduction Sample.................................................. 62Table 19 Cut-points used for assigning students to CBMreading passage level based on words readcorrect per minute (WRC/min)........................................................................................................................................... 63Table 20 Descriptive Statistics for Second CBMreading Passage Reduction Sample .................................... 64Table 21 Alternate Form Reliability and SEm for CBMreading (Restriction of Range)................................... 64Table 22 Internal Consistency for CBMreading Passages......................................................................................... 66Table 23 Split-Half Reliability for CBMreading passages .......................................................................................... 66Table 24 Evidence for Delayed Test-Retest Reliability of CBMreading................................................................ 67Table 25 CBMreading Delayed Test-Retest Reliability Disaggregated by Ethnicity ....................................... 68Table 26 Evidence of Inter-Rater Reliability for CBMreading.................................................................................. 69Table 27 Reliability of the Slope for CBMreading........................................................................................................ 69Table 28 Reliability of the Slope of CBMreading by Passage using Spearman-Brown Split HalfCorrelation ................................................................................................................................................................................ 70Table 29 Reliability of the Slope for CBMreading by Passage using multi-level analyses............................ 71Table 30 CBMreading Reliability of the Slope - Disaggregated Data................................................................... 72Table 31 Demographics for Criterion-Related Validity Sample for earlyReading Composite Scores ...... 74Table 32 Sample-Related Information for Criterion-Related Validity Data (earlyReading).......................... 74Table 33 Concurrent and Predictive Validity for all earlyReading measures .................................................... 76Table 34. Criterion Validity of Spring earlyReading Composite (Updated weighting scheme) withSpring aReading: MN LEA 3 (Spring Data Collection)................................................................................................ 77Table 35 Predictive Validity of the Slope for All earlyReading Measures ........................................................... 78Table 36 Discriminant Validity for Kindergarten earlyReading Measures.......................................................... 78

Table of Contents
Page | 10www.fastbridge.org
© 2015 Theodore J. Christ and Colleagues, LLC. All rights reserved.
Table 37. Discriminant Validity for First Grade earlyReading Subtests ............................................................... 79Table 38 Concurrent and Predictive Validity for CBMreading................................................................................ 81Table 39. Criterion Validity of Spring CBMreading with Spring CRCT in Reading: GA LEA 1 (Spring DataCollection) ................................................................................................................................................................................. 82Table 40. Criterion Validity of Spring CBMreading with Spring MCA-III in Reading: MN LEA 4 (SpringData Collection)....................................................................................................................................................................... 83Table 41. Criterion Validity of Spring CBMreading with Spring MCA-III in Reading: MN LEA 3 (SpringData Collection)....................................................................................................................................................................... 83Table 42. Criterion Validity of Spring CBMreading with Spring Minnesota Comprehensive AssessmentIII (MCA-III) in Reading: MN LEA 2 (Spring Data Collection)..................................................................................... 84Table 43. Criterion Validity of Spring CBMreading on Spring MAP in Reading: WI LEA 1 (Spring DataCollection) ................................................................................................................................................................................. 84Table 44. Criterion Validity of Spring CBMreading with Spring Massachusetts ComprehensiveAssessment (MCA): MA LEA 1 (Spring Data Collection) ............................................................................................ 85Table 45 Predictive Validity for the Slope of Improvement by CBMreading Passage Level........................ 85Table 46 Correlation Coefficients between CBMreading Slopes, AIMSweb R-CBM, and DIBELS Next... 86Table 47 School Data Demographics for aReading Pilot Test ................................................................................ 90Table 48 Summarization of K–5 aReading Parameter Estimates by Domain.................................................... 90Table 49 Item Difficulty Information for K-5 aReading Items ................................................................................. 91Table 50 School Demographics for Field-Based Testing of aReading Items..................................................... 91Table 51 Sample Sizes for K-5 aReading Field-Testing by Grade and School ................................................... 92Table 52 Descriptive Statistics of K–12 aReading Item Parameters...................................................................... 96Table 53 Demographics for Criterion-Related Validity Sample for GMRT-4th and aReading....................... 97Table 54 Sample-Related Information for aReading Criterion-Related Validity Data.................................... 98Table 55 Correlation Coefficients between GMRT-4th and aReading Scaled Score ........................................ 98Table 56 Content, Construct, and Predictive Validity of aReading....................................................................... 99Table 57. Criterion Validity of Spring aReading with Spring Minnesota Comprehensive Assessment III(MCA-III) in Reading: MN LEA 1 (Spring Data Collection) ......................................................................................... 99Table 58. Criterion Validity for Spring aReading with Spring MCA-III in Reading: MN LEA 4 (Spring DataCollection) ...............................................................................................................................................................................100Table 59. Criterion Validity for Spring aReading with Spring MCA-III in Reading: MN LEA 3 (Spring DataCollection) ...............................................................................................................................................................................100Table 60. Criterion Validity of Spring aReading with Spring CRCT in Reading: GA LEA 1 (Spring toSpring Prediction).................................................................................................................................................................100Table 61.Criterion Validity of Spring aReading with Spring Massachusetts Comprehensive Assessment(MCA): MA LEA 1 (Spring Data Collection)...................................................................................................................101Table 62 Kindergarten Diagnostic Accuracy for earlyReading Measures.........................................................102Table 63 First Grade Diagnostic Accuracy for earlyReading Measures .............................................................103Table 64. Diagnostic Accuracy of Fall earlyReading Concepts of Print Subtest with Winter aReading:MN LEA 3 (Fall to Winter Prediction)..............................................................................................................................104

Table of Contents
Page | 11www.fastbridge.org
© 2015 Theodore J. Christ and Colleagues, LLC. All rights reserved.
Table 65. Diagnostic Accuracy of Fall earlyReading Onset Sounds Subtest with Winter aReading: MNLEA 3 (Fall to Winter Prediction)......................................................................................................................................104Table 66. Diagnostic Accuracy of Fall earlyReading Letter Names Subtest with Winter aReading: MNLEA 3 (Fall to Winter Prediction)......................................................................................................................................104Table 67. Diagnostic Accuracy of Fall earlyReading Letter Sounds Subtest with Winter aReading: MNLEA 3 (Fall to Winter Prediction)......................................................................................................................................105Table 68. Diagnostic Accuracy of Fall earlyReading Letter Sounds Subtest with Spring aReading: MNLEA 3 (Fall to Spring Prediction)......................................................................................................................................105Table 69. Diagnostic Accuracy of Winter earlyReading Letter Sounds Subtest with Spring aReading: MNLEA 3 (Winter to Spring Prediction) ...............................................................................................................................105Table 70. Diagnostic Accuracy of Winter earlyReading Rhyming Subtest with Spring aReading: MN LEA3 (Winter to Spring Prediction) ........................................................................................................................................105Table 71. Diagnostic Accuracy of Fall earlyReading Word Segmenting Subtest with Winter aReading:MN LEA 3 (Fall to Winter Prediction)..............................................................................................................................106Table 72. Diagnostic Accuracy of Fall earlyReading Nonsense Words Subtest with Winter aReading: MNLEA 3 (Fall to Winter Prediction)......................................................................................................................................106Table 73. Diagnostic Accuracy of Fall earlyReading Sight Words Subtest with Winter aReading: MN LEA3 (Fall to Winter Prediction) ..............................................................................................................................................106Table 74. Diagnostic Accuracy of Fall earlyReading Sentence Reading Subtest with Winter aReading:MN LEA 3 (Fall to Winter Prediction)..............................................................................................................................106Table 75. Diagnostic Accuracy of Fall earlyReading Sentence Reading Subtest with Spring aReading:MN LEA 3 (Fall to Spring Prediction)..............................................................................................................................107Table 76. Diagnostic Accuracy of Winter earlyReading Sentence Reading Subtest with SpringaReading: MN LEA 3 (Winter to Spring Prediction) ..................................................................................................107Table 77. Diagnostic Accuracy of Winter earlyReading Composite with Winter aReading: MN LEA 3(Fall to Winter Prediction)..................................................................................................................................................107Table 78. Diagnostic Accuracy of Fall earlyReading Composite with Spring aReading: MN LEA 3 (Fall toSpring Prediction).................................................................................................................................................................107Table 79. Diagnostic Accuracy of Winter earlyReading Composite with Spring aReading: MN LEA 3(Winter to Spring Prediction)............................................................................................................................................108Table 80. Diagnostic Accuracy of Fall earlyReading Composite (2014–15 Weights) with SpringaReading: MN LEA 3 (Fall to Spring Prediction).........................................................................................................108Table 81. Diagnostic Accuracy of Winter earlyReading Composite (2014-15 Weights) with SpringaReading: MN LEA 3 (Winter to Spring Prediction) ..................................................................................................108Table 82 Diagnostic Accuracy by Grade Level for CBMreading Passages........................................................109Table 83 Diagnostic Accuracy for CBMreading and MCA III..................................................................................110Table 84. Diagnostic Accuracy on Fall CBMreading with Spring CRCT in Reading: GA LEA 1 (Fall toSpring Prediction).................................................................................................................................................................111Table 85. Diagnostic Accuracy on Winter CBMreading on Spring CRCT in Reading: GA LEA 1 (Winter toSpring Prediction).................................................................................................................................................................111
Table of Contents
Page | 12www.fastbridge.org
© 2015 Theodore J. Christ and Colleagues, LLC. All rights reserved.
Table 86. Diagnostic Accuracy of Fall CBMreading with Spring MCA-III in Reading: MN LEA 3 (Fall toSpring Prediction).................................................................................................................................................................112Table 87. Diagnostic Accuracy for Fall CBMreading with Spring Minnesota Comprehensive AssessmentIII (MCA-III) in Reading: MN LEA 2 (Fall to Spring Prediction)................................................................................112Table 88. Diagnostic Accuracy for Winter CBMreading with Spring Minnesota ComprehensiveAssessment III (MCA-III) in Reading: MN LEA 2 (Winter to Spring Prediction) ................................................113Table 89. Diagnostic Accuracy for Winter CBMreading with MCA-III in Reading: MN LEA 3 (Winter toSpring Prediction).................................................................................................................................................................113Table 90. Diagnostic Accuracy of Winter CBMreading with Spring Massachusetts ComprehensiveAssessment (MCA): MA LEA 1 (Winter to Spring Prediction) ................................................................................114Table 91 Diagnostic Accuracy statistics for aReading and GMRT-4th .................................................................115Table 92 Diagnostic Accuracy Statistics for aReading and MAP..........................................................................116Table 93 Diagnostic Accuracy for aReading and MCA-III .......................................................................................116Table 94. Diagnostic Accuracy of Spring aReading with Spring MAP in Reading: WI LEA 1 (Spring DataCollection) ...............................................................................................................................................................................117Table 95. Diagnostic Accuracy of Fall aReading with Spring MCA-III in Reading: MN LEA 3 (Fall to SpringPrediction)...............................................................................................................................................................................118Table 96. Diagnostic Accuracy of Winter aReading with Spring MCA-III in Reading: MN LEA 3 (Winter toSpring Prediction).................................................................................................................................................................118Table 97. Diagnostic Accuracy Fall aReading with Spring Massachusetts Comprehensive Assessment(MCA): Cambridge, MA (Fall to Spring Prediction) ...................................................................................................119Table 98. Diagnostic Accuracy of Winter aReading with Spring Massachusetts ComprehensiveAssessment (MCA): MA LEA 1 (Winter to Spring Prediction) ................................................................................119Table 99. Diagnostic Accuracy of Fall aReading with Spring CRCT in Reading: GA LEA 1 (Fall to SpringPrediction)...............................................................................................................................................................................120Table 100. Diagnostic Accuracy of Winter aReading with Spring CRCT in Reading: GA LEA 1 (Winter toSpring Prediction).................................................................................................................................................................120Table 101. Diagnostic Accuracy of Winter aReading with Spring Criterion-Referenced CompetencyTests (CRCT) in Reading: Georgia LEA 1 (Winter to Spring Prediction) .............................................................121Table 102. Diagnostic Accuracy of Fall aReading with Spring Minnesota Comprehensive Assessment III(MCA-III) in Reading: MN LEA 2 (Fall to Spring Prediction) ....................................................................................121Table 103. Estimates of the Increase in the Percentage of Students who are Proficient or above withthe Implementation of Formative Assessment (Kingston & Nash, 2011, p. 35).............................................124Table 104. FAST™ Statistical Significance and Effect Sizes.....................................................................................125Table 105. Summary of Diagnostic Accuracy AUC Statistics and Validity Evidence.....................................146

Section 1. Introduction
Page | 13www.fastbridge.org
© 2015 Theodore J. Christ and Colleagues, LLC. All rights reserved.
Section 1. Introduction to FAST™ and FastBridge Learning
This document provides a brief overview of FastBridge Learning and a detailed description of theFormative Assessment System for Teachers™ (FAST™) measures. This document is partitioned into sixmajor sections:
Introduction to FAST™ and FastBridge Learning
Reading Measures
Math Measures
Social-Emotional-Behavioral Measures
Early Childhood and School Readiness
FAST™ as Evidence-Based Practice
The introduction and measurement sections are organized into chapters: (1) Overview, Purpose, andDescription, (2) Development, (3) Administration and Scoring, (4) Interpretation of Test Results, (5)Reliability, (6) Validation, and (7) Diagnostic Accuracy of Benchmarks.
Chapter 1.1: Overview, Purpose, and Description
FAST™ was developed by researchers as a cloud-based system for teachers and educators.
BackgroundFAST™ assessments were developed by researchers at universities from around the country, whichinclude the Universities of Minnesota, Georgia, Syracuse, East Carolina, Buffalo, Temple, and Missouri.FAST™ cloud-based technology was developed to support the use of those assessments for learning.Although there is a broad set of potential uses, the system was initially conceptualized to make iteasier for teachers (see the Forward for more information).
FAST™ is designed for use within Multi-Tiered Systems of Support (MTSS) and Response toIntervention (RTI) frameworks for early intervention and prevention of deficits and disabilities. It isresearch- and evidence-based. FAST™ is distinguished and trusted by educators. It is transformingteaching and learning for educators and kids nationwide.
All in OneFAST™ is one, comprehensive, simple cloud-based system with Curriculum-Based Measurement (CBM) and Computer-Adaptive Tests (CAT) for universalscreening, progress monitoring, MTSS/RTI support, online scoring, andautomated reporting. It is easy to implement with online training andresources, automated rostering and SIS integration, nothing to install ormaintain, and multi-platform and device support.

Section 1. Introduction
Page | 14www.fastbridge.org
© 2015 Theodore J. Christ and Colleagues, LLC. All rights reserved.
Support and TrainingOur school support team is accessible and responsive for support via livechat, e-mail, or phone. When combined with our knowledge base—full ofquick tips, articles, videos, webinars, and flipped training for staff—inaddition to customized online or onsite training, your teachers andadministration are supported at every step.
Trusted ResultsFAST™ is an evidence-based formative assessment system that wasdeveloped by researchers at the University of Minnesota in cooperationwith others from around the country. They set out to offer teachers aneasier way to access and use the highest quality formative assessments.Researchers and developers are continuously engaged with teachers andother users to refine and develop the best solutions for them. (e.g., betterdata, automated assessments, and sensible reports).
Curriculum-Based Measurement (CBM)Our Curriculum-Based Measures (CBM) are highly sensitive to growth overbrief periods. We offer Common Core-aligned CBM measures with onlinescoring and automated skills analysis in earlyReading and earlyMath (K-1),CBMreading, CBMcomprehension, and CBMmath (1-6).
Automated Assessments
Our Computer-Adaptive Tests (CAT) provide a reliable measure of broadachievement and predict high-stakes test outcomes with high accuracy.Automatically adapting to students’ skill levels to inform instruction andidentify MTSS/RtI grouping, we offer aReading (K–12), aMath (K–6), andStandards-Based Math (6–8).

Section 1. Introduction
Page | 15www.fastbridge.org
© 2015 Theodore J. Christ and Colleagues, LLC. All rights reserved.
Prevention and InterventionDesigned for Multi-Tiered Systems of Support (MTSS) and Response toIntervention (RTI), FAST™ makes program implementation easy andefficient with automated scoring, analysis, norming and reporting;customizable screening, benchmarking, instructional recommendations,and progress monitoring.
Chapter 1.2: Development
FastBridge Learning has a strong foundation in both research and theory. FAST™ assessments werecreated to provide a general estimate of overall achievement in reading and math, as well as provide atool to identify students at risk for emotional and behavioral problems. For reading and mathassessments, item banks have been created containing a variety of items, including those withpictures, words, individual letters and letter sounds, sentences, paragraphs, and combinations of theseelements. Overall, FastBridge Learning aims to extend and improve on the quality of currentlyavailable assessments.
Chapter 1.3: Administration and Scoring
FAST™ is supported by an extensive set of materials to support teachers and students, including self-directed training modules that allow teachers to become certified to administer each of theassessments. FAST™ assessments can be administered by classroom teachers, special educationteachers, school psychologists, and other individuals such as paraprofessionals with usually less thanan hour of training. Administration time varies depending on which assessment is being administered.Online administrations require a hard copy of the student materials (one copy per student) and accessto the FAST™ system (i.e., iPad or computer with Internet connection). Paper-and-pencil assessmentadministration materials and instructions are available upon request. As with any assessment, onlystudents who can understand the instructions and can make the necessary responses should beadministered FAST™ assessments. Assessments should be administered in a quiet area conducive tooptimal performance. The brevity of FAST™ assessments aims to minimize examinee fatigue, anxiety,and inattention. For the majority of assessments, FAST™ produces automated reports summarizingraw scores, percentile scores, developmental benchmarks, subscale and subtest scores, and compositescores. The online system provides standardized directions and instructions for the assessmentadministrator.
Setting StandardsOverall, FastBridge Learning uses standard-setting processes to summarize student performance.Standards may be used to inform goal setting, identify instructional level, and evaluate the accuracy ofstudent performance. For the purpose of this technical manual, standards are the content or skills thatare expected (content standards), which are often defined by a score for purposes of measurement(performance standards). A number of terms are used to reference performance standards, including:benchmarks, cut scores, performance levels, frustrational, instructional or mastery levels, and

Section 1. Introduction
Page | 16www.fastbridge.org
© 2015 Theodore J. Christ and Colleagues, LLC. All rights reserved.
thresholds. These terms each reference categories of performance with respect to standards and areused throughout the technical manual. The method of standard setting is described below.
Chapter 1.4: Interpretation of Test Results
The FastBridge Learning software provides various resources to assist administrators with test resultinterpretations. For example, a Visual Conventions drop down menu is available to facilitateinterpretation of screening and progress monitoring group and individual reports. Percentiles arecalculated for local school norms unless otherwise indicated. Local school norms compare individualstudent performances to their same grade and school peers. For example, a student in the 72ndpercentile performed as well or better than 72 percent of his or her grade level peers at that school.Methods of notation are also included to provide information regarding those students predicted tobe at risk. Exclamation marks (! and !!) indicate the level of risk based on national norms. Oneexclamation mark refers to some risk, whereas two exclamation marks refer to high risk of readingdifficulties or not meeting statewide assessments benchmarks, based on the score. InterpretingFastBridge Learning assessment scores involves a basic understanding of the various scores providedin the FAST™ system and helps to guide instructional and intervention development. FAST™ includesindividual, class, and grade level reports for screening, and individual reports for progress monitoring.Additionally, online training modules include sections on administering the assessments, interpretingresults, screen casts, and videos.
Results should always be interpreted carefully considering reliability and validity of the score, which isinfluenced by the quality of standardized administration and scoring. It important to consider theintended purpose of the assessment, its content, the stability of performance over time, scoringprocedures, testing situations, or the examinee. The FAST™ system automates analysis, scoring,calculations, reporting and data aggregation. It also facilitates scaling and equating across screeningand progress monitoring occasions.
Standard SettingIt is necessary to address questions such as, “How much skill/ability defines proficiency?” There aremany methods used for standards setting; however, human judgment is inherent to the process(Hambleton & Pitoniak, 2006) because some person(s) decide “how many” or “how much is enough”to meet a standard. Because judgment is involved, there are some criticisms that standard setting isarbitrary (Glass, 1978) and the results of standard setting are very often the source of debate andscrutiny. The Standards for Educational and Psychological Testing (AERA, APA & NCME, 199) define thebasic requirements to set standards and therein recognize the role of human judgment: “cut scoresembody value judgments as well as technical and empirical considerations” (p. 54). The standardsetting process in designed to ensure those value judgments are well-informed. The Standards alongwith the professional literature (e.g., Hableton & Pitoniak, 2006; Swets, Dawes & Monahan, 2000) guidethe standard setting processes for FAST™. A brief description of relevant concepts and methods arebelow.

Section 1. Introduction
Page | 17www.fastbridge.org
© 2015 Theodore J. Christ and Colleagues, LLC. All rights reserved.
Kane (1994, 2006, 2013) suggests that the rationale and reasons for the selected standard-settingprocedure are often the most relevant and important source of evidence for the validity of standardsto interpret scores. The method should be explicit, practical for the intended interpretation and use,implemented with fidelity, and documented (Hambleton & Pitoniak, 2006). The convergence ofstandards with other sources of information, such as criterion measures, also contributes to validation;however, such evidence is often limited because the quality and standards from external sources areoften just as limited (Kane, 2001). Moreover, external sources, such as criterion measures, are oftenunavailable or misaligned with the experimental measure or intended use for the standard.
Standard Setting MethodsThere are methods to set relative or absolute standards. Norm-referenced methods are most familiarto the general public. They are used to set a relative standard such that a particular proportion of apopulation is above or below the standard. For example, if the standard is set at the 40th percentilethen 39% of the population is below and 60% is at or above. Norm-referenced standards are relative tothe performances in the population. As noted by Sereci (2005), “scores are interpreted with respect tobeing better or worse than others, rather than with respect to the level of competence of a specifictest taker” (p. 118). Norm-referenced standards are used in FAST™ to guide resource allocation. Grade-level norms are provided for the class, school, district, and nation.
Absolute- or criterion-referenced methods are less familiar to the general public. They are used todefine “how much is enough” to be above or below a standard. For example, if the standard is thatstudents should identify all of the letters in the alphabet with 100% accuracy then all of the studentsin a particular grade might be above or below that standard. These methods often rely on thejudgment of experts who classify items, behaviors, or individual persons. Those judgments are used todefine the standard. For example, the expert is asked to consider a person whose performance is justat the standard. They then estimate the probability that person would exhibit a particular behavior orresponse correctly to a particular item. Another approach is to have that expert classify individuals asabove or below the standard. Once classified, the performance of the individuals is analyzed to definethe standard. The particular method is carefully selected based on the content and purpose of themeasure and standard. Careful selection of experts and panels, training, procedures, validation anddocumentation are all important components of those expert-based approaches.
Norm-Referenced Standards
Norm-referenced methods are used to set a relative standard such that a particular proportion of apopulation is above or below the standard. For example, if the standard is set at the 40th percentilethen 39% of the population is below and 60% is at or above. Norm-referenced standards are relative tothe performances in the population. As noted by Sereci (2005), “scores are interpreted with respect tobeing better or worse than others, rather than with respect to the level of competence of a specifictest taker” (p. 118). Norm-referenced standards are used in FAST™ to guide resource allocation. Grade-level norms are provided for the class, school, district and nation.

Section 1. Introduction
Page | 18www.fastbridge.org
© 2015 Theodore J. Christ and Colleagues, LLC. All rights reserved.
Norm-Referenced Interpretations
FAST™ calculates and reports the percentileranks, or percentiles, of scores relative tosame-grade peer performance in the class,school, district, and FAST™ users aroundthe nation. Those percentiles are classifiedand color-coded in bands: < 19.99th (red),20th to 29.99th (orange), 30th to 84.99th
(green) and > 85th percentiles (blue). Thesestandards were set to guide resourceallocations for early intervention andprevention within multi-tiered systems ofsupport (MTSS).
Most schools can provide supplemental and intensive supports for students at risk and enrichment forthe highest achieving students. Schools rarely have resources to support more than 30% of at-risklearners with supplemental and intensive supports; even if a larger proportion would benefit (Christ,2008; Christ & Arañas, 2014). The norm-referenced standards are applied to each norm group tosupport decisions by individual teachers (class norms), school-based grade level teams (school norms)and district-wide grade level teams (district norms) as to which students receive supports.
The percentiles and standards should be used to identify the individuals who will receivesupplemental support. The proportion of the population who receive supports depends on theavailability of resources. For example, one school might provide supplemental support to all studentsbelow the 30th percentile (red and orange). Another school might provide supplemental support to allstudents below the 20th percentile (red), but monitor those below the 30th percentile (orange). Theseare local decisions that should be determined in consideration of the balance between student needsand system resources.
National norms are used to compare local performance to that of an external group. The standards(color codes) are applied to support decisions about core and system-level supports. Visual analysis ofcolor codes are useful to estimate the typicality of achievement in the local population. They are oftenused in combination with benchmarks to guide school and district level decisions about instruction,curriculum and system-wide services (e.g., are the school-wide core reading services sufficient toprevent deficit achievement for 80% of students). If FAST™ data indicate that much more than 20% ofa school or district’s students are below the 20th percentile on national norms, then remediation effortsin that area should be considered as the data suggest that the core instruction is not supportingadequate achievement. If they observe that fewer than 20% of the total school population are belowthe 20th percentile on national norms, their population is over-performing relative to others.Subsequently, the school should continue using effective services, but identify another domain offocus.

Section 1. Introduction
Page | 19www.fastbridge.org
© 2015 Theodore J. Christ and Colleagues, LLC. All rights reserved.
Criterion-Referenced Standards (Benchmarks)Absolute or criterion-referenced methods are used to define “how much is enough” to be above orbelow a standard. For example, if the standard is that students should identify all of the letters in thealphabet with 100% accuracy then all of the students in a particular grade might be above or belowthat standard. These methods often rely on the judgment of experts who classify items, behaviors, orindividual persons. Those judgments are used to define the standard. For example, the expert is askedto consider a person whose performance is just at the standard. They then estimate the probabilitythat person would exhibit a particular behavior or response correctly to a particular item. Anotherapproach is to have that expert classify individuals as above or below the standard. Once classified,the performance of the individuals is analyzed to define the standard. The particular method iscarefully selected based on the content and purpose of the measure and standard. Careful selection ofexperts and panels, training, procedures, validation, and documentation are all importantcomponents of those expert-based approaches.
FAST™ reports provide tri-annual grade-level benchmarks, which generally correspond with the 15th
and 40th percentiles on national norms. Scores below the 15th percentile are classified as “high-risk.”Those at-or-above the 15th and below the 40th are “some risk;” and those at or above the 40th are “lowrisk.” This is consistent with established procedures and published recommendations (e.g., RTINetwork). It is common practice to use norm-reference standards at the 15th and 40th percentiles; or touse pre-determined standards on state achievement tests. As quoted from the RTI Network:
“Reading screens attempt to predict which students will score poorly on a futurereading test (i.e., the criterion measure). Some schools use norm-referenced test scoresfor their criterion measure, defining poor reading by a score corresponding to aspecific percentile (e.g., below the 10th, 15th, 25th, or 40th percentile). Others definepoor reading according to a predetermined standard (e.g., scoring below “basic”) onthe state’s proficiency test. The important point is that satisfactory and unsatisfactoryreading outcomes are dichotomous (defined by a cut-point on a reading test givenlater in the students’ career). Where this cut-point is set (e.g., the 10th or 40thpercentile) and the specific criterion reading test used to define reading failure (e.g., astate test or SAT 10) greatly affects which students a screen seeks to identify”(retrieved on 1-24-15 fromhttp://www.rtinetwork.org/essential/assessment/screening/readingproblems)
The procedure used by FAST™ is described in more detail below. Again, FAST™ establishesbenchmarks that approximate the 15th and 40th percentiles on national norms. This report providesadditional evidence on the correspondence with those standards and proficiency on state tests.
Interpreting Criterion-Referenced Standards
Benchmarks are often used to discern whether students are likely to perform sufficiently on a high-stakes assessment, such as a state test. FastBridge Learning will estimate specific benchmarks forstates and districts if their state test data are provided ([email protected]). Another way to interpret

Section 1. Introduction
Page | 20www.fastbridge.org
© 2015 Theodore J. Christ and Colleagues, LLC. All rights reserved.
benchmarks is to consider them the minimal level of performance that is acceptable. Anything lessplaces the student at risk. These standards should be met for all students. They are not based on thedistribution of performance unlike norms so all students can truly meet benchmark standards.
If more than 30% of students are below the “some risk” benchmark standard, then it is necessary tomodify core instruction and general education instruction to better serve all students. This is the mostefficient approach to remediate widespread deficits. If fewer than 15% of are below the “some risk”benchmark standard in a specific content area, then core instruction is highly effective. It should bemaintained and other content areas should be considered the focus. Schools often focus on readingand behavior and then move to math and other content areas as they achieve benchmark standardsfor 85% of students in each domain.
Chapter 1.5: Reliability
Reliability refers to the stability with which a test measures the same skills across minimal differencesin circumstances. Nunnally and Bernstein (1994) offer a hierarchical framework for estimating thereliability of a test, emphasizing the documentation of several forms of reliability. First and foremost,alternate-form reliability with a two-week interval is recommended, assuming that alternate (butequivalent) forms of the same test with different items should produce approximate scores. Thesecond recommended form of reliability is test-retest reliability, which also employs a two-weekinterval of time. The same test administered at two different points in time (i.e., the difference of atwo-week interval) should produce approximately the same scores. Finally, inter-rater reliability isrecommended and may be evaluated by comparing scores obtained for the same student by twodifferent examiners. For many FastBridge Learning assessments, there is no threat to inter-raterreliability because assessments are electronically scored. For the purpose of this technical manual,error refers to unintended factors that contribute to changes in scores. Other forms of reliabilityevidence include internal consistency (the extent to which different items measure the same generalconstruct and produce similar scores), and reliability of the slope (the ratio of true score variance tototal variance).
Overall, FastBridge Learning assessments show evidence of reliability coefficients that show promisefor producing little test error. Further, evidence supports the use of FastBridge Learning measures forscreening and progress monitoring, and for informing teachers of whether instructional practiceshave been effective or if more and what kind of instruction may be necessary to advance studentgrowth in reading and math skills. Educators can be confident that the FastBridge Learningassessments provide meaningful instructional information that can be quickly and easily interpretedand applied to impact student learning. Current research on FastBridge Learning assessments isencouraging, suggesting that these assessments may be used to reliably differentiate betweenstudents who are or are not at risk for reading problems, math problems, or behavioral or emotionalproblems.

Section 1. Introduction
Page | 21www.fastbridge.org
© 2015 Theodore J. Christ and Colleagues, LLC. All rights reserved.
Chapter 1.6: Validity
To validate an interpretation or use of test scores is to evaluate the plausibility of the claims based onthose scores (Kane, 2013). According to Kane (2013), interpretations and uses can change over time inresponse to evolving needs and new understandings. Additionally, consequences of the proposeduses of a test score need to be evaluated. Validity refers to the extent to which evidence and theorysupport the interpretations of test scores. Types of validity discussed in this technical manual arecontent, criterion, predictive, and discriminant validity.
Content validity is the extent to which a test’s items represent the domain or universe intended to bemeasured. Criterion-related validity is the extent to which performance on a criterion measure can beestimated from performance on the assessment procedure being evaluated. Predictive validity is theextent to which performance on a criterion measure can be estimated from performance across timeon the assessment being evaluated. Finally, discriminant validity is a measure of how well anassessment distinguishes between two groups of students at different skill levels.
Establishing validity evidence of FastBridge Learning assessments is ongoing. Studies will continue toprovide information regarding the content and construct validity of each assessment. Validityevidence will be interpreted as data is disaggregated across gender, racial, ethnic, and cultural groups.All FastBridge Learning assessments were designed to be sensitive to student growth while alsoproviding instructionally relevant information. Current research supports the validity of FastBridgeLearning assessments across reading, math, and behavioral domains.
Chapter 1.7: Diagnostic Accuracy of Benchmarks
Campbell and Ramey (1994) acknowledged the importance of early identification through the use ofeffective screening measures and intervention with those students in need. Early identification,screening, and intervention have been shown to improve academic and social-emotional/behavioraloutcomes (Severson, Walker, Hope-DooLittle, Kratochwill, & Gresham, 2007). Effective screening is apre-requisite for efficient service delivery in a multi-tiered Response to Intervention (RTI) framework(Jenkins, Hudson, & Johnson, 2007). RTI seeks to categorize students accurately as being at risk or notat risk for academic failure. Inaccurate categorization can lead to consequences such as ineffectiveallocation of already minimal resources.

Section 1. Introduction
Page | 22www.fastbridge.org
© 2015 Theodore J. Christ and Colleagues, LLC. All rights reserved.
A Conceptual Explanation: Diagnostic Accuracy of ScreenersWithin medicine, a diagnostic test can be used to determine the presence or absence of a disease. Theresults of a screening device are compared with a “gold standard” of evidence. For instance, a doctormay administer an assessment testing whether a tumor is malignant or benign. Based on a goldstandard, or later diagnosis, we can estimate how well the screener identifies cases in which thepatient truly has the ailment and cases in which he or she does not. When using any diagnostic testwith a gold standard there are four possible outcomes: the test classifies the tumor as malignant whenin fact it is malignant (True Positive; TP), the test classifies the tumor as not malignant when in fact it isnot malignant (True Negative; TN), the test classifies the tumor as malignant when in fact it is benign(False Positive; FP), and the test classifiesthe tumor as benign when in fact it ismalignant (False Negative; FN). The rates ofeach classification are directly tied to thedecision threshold, or cut-off score, of thescreening measure. The cut-off score is thescore at which a subject is said to besymptomatic or not symptomatic. Thedecision regarding placement of thedecision threshold is directly tied to theimplications of misclassifying a person assymptomatic versus not-symptomatic(Swets, Dawes, & Monahan, 2000). In thecase of the tumor, a FN may mean that apatient does not undergo a lifesavingprocedure. Conversely, a FP may cause undue stress and financial expense for treatments that aren’tneeded.
Decisions that Guide Benchmarks Selection: Early Intervention and PreventionIt should be apparent from a review of the illustration above that decisions based on the screener areinherently imperfect. The depiction in that particular figure illustrates a correlation of approximately.70 between the predictor and criterion measure. In this example, CBMreading is an imperfectpredictor of performance on the state test. Regardless of the measures, there will always be animperfect relationship. This is also true for test-retest and alternate-form reliability (i.e., performanceon the same test on two occasions). Tests are inherently unreliable, and all interpretations of scoresare tentative. This is especially true for screening assessments, which are designed to be highlyefficient and, therefore, often have less reliability and validity than a more comprehensive, albeitinefficient, assessment.
For the purposes of screening in education, students who are in need of extra help may be overlooked(FN), and students who do not need extra help may receive unneeded services (FP). The performanceof diagnostic tests, and corresponding decision thresholds, can be measured via sensitivity, specificity,

Section 1. Introduction
Page | 23www.fastbridge.org
© 2015 Theodore J. Christ and Colleagues, LLC. All rights reserved.
positive predictive value, negative predictive value, and area under the curve (AUC). All of thefollowing definitions are based on the work of Grzybowski and Younger (1997).
i. Sensitivity: The probability of a student testing positive given the true presence of adifficulty. (TP / TP + FN)
ii. Specificity: The probability of a student testing negative if the difficulty does not exist.(TN / TN + FP)
iii. Positive Predictive Power: The proportion of truly struggling students among those withpositive test results. (TP / TP + FP)
i. Negative Predictive Power: The proportion of truly non-struggling students among allthose with negative test results. (TN / TN + FN)
ii. Area Under the Curve (AUC): Quantitative measure of the accuracy of a test indiscriminating between students at-risk and not at-risk across all decision thresholds.
Previous research in school psychology (e.g., Hintze & Silberglitt, 2005; VanDerHeyden, 2011) derivesdecision thresholds by iteratively computing specificity and sensitivity at different cut scores.Precedence would be given to maximize each criterion by computing sensitivity and specificity foreach point. A more psychometrically sound and efficient method is to compute scores via a receiveroperating characteristic (ROC) curve analysis.
Area Under the Curve (AUC)Area Under the Curve (AUC) is used as a measure of predictive power. It is obtained by calculating thesensitivity and specificity values for all possible cutoff points on the screener by fixing a cutoff pointon criterion measure and plotting specificity (or TPP) against sensitivity (or TNP). AUC is expected tobe .5 if the screener provided little or no information. AUC is expected to be 1 for a perfect diagnosticmethod to identify the students at risk correctly. Although the criteria that are applied to interpretAUCs are variable, values are considered excellent (.90 to 1.0), good (.80 to .89), fair (.70 to 79), or poor(< .69). It seems reasonable and generally consistent with the standards outlined by the NationalCenter for Response to Intervention that an AUC of at least .85 is required for low-stakes decisions andthat an AUC of at least .90 is required for high-stake decisions.
Decision Threshold: BenchmarkA decision threshold is established to maximize the benefits of the decision process relative to its costs(Swets, Dawes, & Monahan, 2000). That threshold is adjusted to establish a neutral, lenient, or strictclassification criterion for the predictor. A neutral threshold will balance the proportion of TP and FP,although not all thresholds should be balanced. For example, screening measures for reading oftenover-identify students (increase the rate of TP as well as FP) to ensure that fewer positive cases aremissed. This is a rational choice, because failure to identify TP outweighs the consequences ofincreased FP.
Thresholds that are more lenient (over-identify) increase sensitivity, thereby increasing the proportionof positive classifications (both TP and FP). Thresholds that are more strict (under-identify) increase

Section 1. Introduction
Page | 24www.fastbridge.org
© 2015 Theodore J. Christ and Colleagues, LLC. All rights reserved.
specificity, thereby increasing the proportion of negative classifications (both TN and FN; Swets et al.,2000). The decision threshold is adjusted to obtain the optimal ratio of positive and negativeclassifications along with that of true and false classifications. For example, Silberglitt and Hintze(2005) systematically modified the CBMreading benchmark scores in Third Grade to optimize the cutscore, which improved classification accuracy. In general, FAST™ uses a procedure to balancesensitivity and specificity so that benchmarks neither over- nor under-identify individuals.
FastBridge Learning assessments predict performance on state accountability tests, including testsadministered in Iowa, Illinois, Vermont, Indiana, New York, Colorado, Minnesota, Georgia,Massachusetts, and Wisconsin. For diagnostic accuracy analyses, cut scores were selected byoptimizing sensitivity at approximately .70, and then balancing it with specificity using methodspresented by Silberglitt and Hintze (2005). Overall, analyses suggest that current benchmarks forFastBridge Learning assessments are appropriate, accurate, and reliable.
For a summary of Reading Diagnostic Accuracy statistics, see Appendix B: FastBridge LearningReading Diagnostic Accuracy.

Section 6. FAST as Evidence-Based Practice
Page | 25www.fastbridge.org
© 2015 Theodore J. Christ and Colleagues, LLC. All rights reserved.
Section 2. Reading and Language
Chapter 2.1: Overview, Purpose, and Description
earlyReadingThe earlyReading measure is designed to assess both unified and component skills associated withKindergarten and First Grade reading achievement. earlyReading is intended to enable screening andprogress monitoring across four domains of reading (Concepts of Print, Phonemic Awareness, Phonics,and Decoding) and provide domain-specific assessments of these component skills as well as ageneral estimate of overall reading achievement. earlyReading is an extension of CBMreading, whichwas initially developed by Deno and colleagues to index the level and rate of reading achievement(Deno, 1985; Shinn, 1989). The current version of earlyReading has an item bank that contains a varietyof items, including those with pictures, words, individual letters and letter sounds, sentences,paragraphs, and combinations of these elements.
The research literature provides substantial guidance on instruction and assessment of alphabeticknowledge, phonemic awareness, and oral reading. The objective of earlyReading measures is toextend and improve on the quality of currently available assessments.
Aspects of Reading measured by earlyReading
Concepts of Print (COP)
COP is defined as the general understanding of how print works and how it can be used (Snow, Burns,& Griffin, 1998). Concepts of print is the set of skills used in the manipulation of text-based materials,which includes effective orientation of materials (directionality), page turning, identifying thebeginning and ending of sentences, identifying words, as well as identifying letters, sentences, andsentence parts. Concepts of print are normally developed in the emergent literacy phase ofdevelopment and enable the development of meaningful early reading skills: “Emergent literacyconsists of skills, knowledge, and attitudes that are developmental precursors to conventional formsof reading and writing” (Whitehurst & Lonigan, 1998). These skills typically develop from preschoolthrough the beginning of First Grade— with some more advanced skills that develop through SecondGrade, such as understanding punctuation, standard spelling, reversible words, sequence, and otherstandard conventions of written and spoken language. Introductory level of logical and analyticalabilities as in understanding the concepts of print has an impact on early student readingachievement (Adams, 1990; Clay, 1972; Downing, Ollila, & Oliver, 1975; Hardy et al., 1974; Harlin & Lipa,1990; Johns, 1972; Johns, 1980; Lomax & McGee, 1987; Nichols et al., 2004; Tumner et al., 1988).
Phonemic Awareness (PA)
Phonemic Awareness involves the ability to identify and manipulate phonemes in spoken words(National Reading Panel [NRP], 2000). Phonemes are the smallest units of sound in spoken language."Depending on what distinctions are counted, there are between 36-44 phonemes in English, which isabout average for languages" (Juel, 2006, p.418). According to Adams, “to the extent that children

Section 6. FAST as Evidence-Based Practice
Page | 26www.fastbridge.org
© 2015 Theodore J. Christ and Colleagues, LLC. All rights reserved.
have learned to ‘hear’ phonemes as individual and separable speech sounds, the system will, throughthe associative network, strengthen their ability to remember or ‘see’ individual letters and spellingpatterns” (1990, p. 304). Hearing and distinguishing individual letter sounds comes last (Goswami,2000). Children who manipulate letters as they are learning to hear specific sounds have been shownto make better progress in early reading development than those who do not (NRP, 2000, p. 2-4).Phonemic awareness skills are centrally involved in decoding by processes of blending andsegmenting phonemes (NRP, 2000). Phonemic awareness also helps children learn how to spell wordscorrectly. Phonemic segmentation is required to help children retain correct spellings in memory byconnecting graphemes (printed letters) to phonemes (NRP, 2000).
Phonics
Phonics is the set of skills readers use to identify and manipulate printed letters (graphemes) andsounds (phonemes). It is the correspondences between spoken and written language. This connectionbetween letters, letter combinations, and sounds enable reading (decoding) and writing (encoding).Phonics skill development “involves learning the alphabetic system, that is, letter-soundcorrespondences and spelling patterns, and learning how to apply this knowledge” to reading (NRP,2000b).
Decoding
“Decoding ability is developed through a progression of strategies sequential in nature: acquiringletter-sound knowledge, engaging in sequential decoding, decoding by recognizing word patterns,developing word accuracy in word recognition, and developing automaticity and fluency in wordrecognition” (Hiebert & Taylor, 2000, p. 467). When a child has a large and established visual lexicon ofwords in combination with effective strategies to decode unfamiliar words, he/she can read fluently—smoothly, quickly, and more efficiently (Adams, 1990; Snow et al., 1998). The reader can also focushis/her attention on monitoring comprehension: “If there are too many unknown words in thepassage that require the child to apply more analytic (phonemic decoding) or guessing strategies tofill in the blanks, fluency will be impaired” (Phillips & Torgesen, 2006, p. 105). According to RAND,“readers with a slow or an inadequate mastery of word decoding may attempt to compensate byrelying on meaning and context to drive comprehension, but at the cost of glossing over importantdetails in the text” (2002, p. 104). Decoding is often linked with phonics with the emphasis on letter-sound knowledge. Vocabulary contains common characteristics with decoding such as recognizingword patterns, as in prefixes and suffixes.
Uses and ApplicationsearlyReading consists of 12 different evidence-based assessments for screening and monitoringstudent progress.
Concepts of Print
Onset Sounds
Letter Names
Letter Sounds
Word Rhyming
Word Blending
Word Segmenting
Decodable Words

Section 6. FAST as Evidence-Based Practice
Page | 27www.fastbridge.org
© 2015 Theodore J. Christ and Colleagues, LLC. All rights reserved.
Nonsense Words
Sight Words-Kindergarten (50 words)
Sight Words-1st Grade (150 words)
Sentence Reading
Oral Language (Sentence Repetition)
There are recommended combinations of subtests for fall, winter, and spring screening aimed tooptimize validity and risk evaluation. Similarly, there are recommended combinations of subtests forfall, winter, and spring for monitoring of progress. Supplemental assessments may be used todiagnose and evaluate skill deficits. Results from supplemental assessments provide guidance forinstructional and intervention development. earlyReading is often used by teachers to screen allstudents and to estimate annual growth with tri-annual assessments (fall, winter, & spring). Studentswho progress at a typical pace through the reading curriculum meet the standards for expectedperformance at each point in the year. Students with deficit achievement can be identified in the fallof the academic year so that supplemental, differentiated, or individualized instruction can beprovided.
earlyReading is designed to accommodate quick and easy weekly assessments, which provide usefuldata to monitor student progress and evaluate response to instruction. The availability of multiplealternate forms for various subtests of earlyReading make it suitable for monitoring progress betweenbenchmark assessment intervals (i.e., fall, winter, and spring) for those students that require morefrequent monitoring of progress. Onset Sounds has 13 alternate forms, and the following subtestshave a total of 20 alternate forms: Letter Naming, Letter Sound, Word Blending, Word Segmenting,Decodable Words, Sight Words, and Nonsense Words. Concepts of Print, Rhyming, and SentenceReading progress monitoring forms have not yet been developed.
Target Population
earlyReading is designed for all students in the early primary grade levels. This includes students inKindergarten through Third Grade. earlyReading subtests are most relevant for students inKindergarten and First Grade, but they have application to students in later grades who have yet tomaster early reading skills.
CBMreadingCurriculum-Based Measures of Reading (CBMreading) is a particular version of Curriculum-BasedMeasurement of Oral Reading fluency (CBM-R), which was originally developed by Deno andcolleagues to index the level and rate of reading achievement (Deno, 1985; Shinn, 1989). The tool is anevidence-based assessment for use to screen and monitor student progress in reading competency inprimary grades (1–6). CBMreading uses easy, time-efficient assessment procedures to determine astudent’s general reading ability across short intervals of time (i.e., weekly, monthly, or quarterly).Students read aloud for one minute from grade or instructional- level passages. The words readcorrect per minute (WRCM) functions as a robust indicator of a reading health and a sensitive indicatorof intervention effects. CBMreading includes standardized administration and scoring proceduresalong with proprietary instrumentation, which was designed and developed to optimize the

Section 6. FAST as Evidence-Based Practice
Page | 28www.fastbridge.org
© 2015 Theodore J. Christ and Colleagues, LLC. All rights reserved.
consistency of data collected across progress monitoring occasions. CBMreading provides teacherswith a direct link to instruction and allows them to determine if and when instructional adaptationsare needed, set ambitious but attainable goals for students, and monitor progress toward those goals(Fuchs & Fuchs, 2002).
CBMreading emerged from a project funded by the Institute for Education Sciences in the USDepartment of Education. That project was entitled Formative Assessment Instrumentation andProcedures for Reading (FAIP-R), so they are sometimes described as the FAIP-R passages. Earlyversions of those passages were used in published research (Ardoin & Christ, 2008; Christ & Ardoin,2009). The goal in creating the CBMreading measures was to systematically develop, evaluate andfinalize research-based instrumentation and procedures for accurate, reliable, and valid assessmentand evaluation of reading rate.
For the remainder of the manual, CBM-R will refer to the general concept of Curriculum-BasedMeasurement of Oral Reading while CBMreading will refer to the assessment in FastBridge Learning.
Aspects of Reading Measured by CBMreadingThe Common Core State Standards for English Language Arts and Literacy in History/Social Studies,Science and Technical Subjects (National Governors Association Center for Best Practices & Council ofChief State School Officers, 2010) is a synthesis of information gathered from state departments ofeducation, assessment developers, parents, students, educators, and other pertinent sources todevelop the next generation of state standards of K–12 students to ensure that all students are collegeand career literacy ready by the end of their high school education. This process is headed by theCouncil of Chief State School Officers (CCSO) and the National Governors Association (NGA). TheStandards are an extension of a previous initiative by the CCSSO and NGA titled the College andCareer Readiness (CCR) Anchor Standards. The CCR Anchor Standards are numbered from one to ten.The Standards related to fluency are found within Foundational Skills in Reading. These standards arerelevant to K–5 children and include the working knowledge of the following subcategories:
(1) Print Concepts: the ability to demonstrate the organization and basic feature of print.(2) Phonological Awareness: demonstrate understanding of spoken words, syllables, and
sounds or phonemes.(3) Phonics and Word Recognition: the skill of applying grade-level phonics and word analysis
skills in decoding words.(4) Fluency: Reading on-level texts with sufficient purpose, accuracy, and fluency to support
comprehension.
Oral Reading Fluency
Reading involves simultaneous completion of various component processes. In order to achievesimultaneous coordination across these component processes, instantaneous execution of eachcomponent skill is required (Logan, 1997). Reading fluency is achieved so that performance isspeeded, effortless, autonomous, and achieved without much conscious awareness (Logan, 1997).Oral reading fluency represents the automatic translation of letters into coherent sound
Section 6. FAST as Evidence-Based Practice
Page | 29www.fastbridge.org
© 2015 Theodore J. Christ and Colleagues, LLC. All rights reserved.
representations, unitizing those sound components into recognizable wholes, and automaticallyaccessing lexical representations, processing meaningful connections within and between sentences,relating text meaning to prior information, and making inferences in order to supply missinginformation. Logan (1997) described oral reading fluency as the complex orchestration of these skills,establishing it as a reliable measure of reading expertise.
As previously mentioned, CBMreading is a particular version of an oral reading fluency measure.CBMreading is an effective tool used to measure rate of reading. Indeed, reading disabilities are mostfrequently associated with deficits in accurate and efficient word identification. Although reading isnot merely rapid word identification or the “barking at words” (Samuels, 2007), the use of rate-basedmeasures provide a general measure of reading that can alert teachers to students who haveproblems and are behind their peers in general reading ability. Overall, CBMreading provides a globalindicator of reading.
Uses and ApplicationsCBMreading is an evidence-based assessment for use to screen and monitor students’ progress inreading achievement in the primary grades (1–6). Each assessment is designed to be highly efficientand give a broad indication of reading competence. The automated output of each assessment givesinformation on the accuracy and fluency of passage reading which can be used to determineinstructional level to inform intervention. At the school level, student growth can be tracked andmonitored, allowing administrators to look at improvements both across grades and academic yearsfor the purpose of accountability. Teachers and administrators may use this information to helpparents better understand their children’s reading needs.
Target Population
CBMreading is designed for all students in grades 1 through 6. For elementary grades 2 through 6,measures of fluency with connected text (curriculum-based measure of oral reading; CBM-R) are oftenused as a universal screeners for grade-level reading proficiency. Although strong evidence exists inthe literature to support the use of CBM-R (Fuchs, Fuchs, & Maxwell, 1988; Kranzler, Brownell, & Miller,1998; Markell & Deno, 1997), support for CBM-R as a universal screener for students who are not yetreading connected text is less robust (Fuchs, Fuchs, & Compton, 2004; National Research Council,1998). Thus, CBMreading may not be appropriate for students not yet reading connected text withsome degree of fluency. For those students not yet reading connected text with fluency, CBMreadingresults and scores should be interpreted with caution.
aReadingThe Adaptive Reading (aReading) assessment is a computer-adaptive measure of broad reading abilitythat is individualized for each student. aReading provides a useful estimate of broad readingachievement from Kindergarten through twelfth grade. The question-and-response format used inaReading is substantially similar to many statewide, standardized assessments. Browser-basedsoftware adapts and individualizes the assessment for each child so that it essentially functions at the

Section 6. FAST as Evidence-Based Practice
Page | 30www.fastbridge.org
© 2015 Theodore J. Christ and Colleagues, LLC. All rights reserved.
child’s developmental and skill level. The adaptive nature of the test makes it more efficient and moreprecise than paper-and-pencil assessments.
The design of aReading has a strong foundation in both research and theory. During the early phasesof student reading development, the component processes of reading are most predictive of futurereading success (Stanovich, 1981, 1984, 1990; Vellutino & Scanlon, 1987, 1991; Vellutino, Scanlon,Small, & Tanzman, 1991). Indeed, reading disabilities are most frequently associated with deficits inaccurate and efficient word identification. Those skills are necessary but not sufficient for reading tooccur. After all, reading is comprehending and acquiring information through print. It is not merelyrapid word identification or the “barking at words” (Samuels, 2007). As such, a unified readingconstruct is necessary to enhance the validity of reading assessment and inform balanced instructionthroughout the elementary grades. aReading was developed based on a skills hierarchy and unifiedreading construct (presented later in the technical manual).
Computer-Adaptive Testing (CAT)Classroom assessment practices have yet to benefit from advancements in both psychometric theoryand computer technology. Today, almost every school and classroom in the United States providesaccess to computers and the Internet. Despite this improved access to computer technology, feweducators use technology to its potential. Within an IRT based Computer-Adaptive Test (CAT), itemsare selected based on the student’s performance on all previously administered items. As a studentanswers each item, the item is scored in real time, and his or her ability (theta) is estimated. When aCAT is first administered, items are selected via a “step rule” (Weiss, 2004). That is, if a student answersan initial item correctly, his or her theta estimate increases by some value (e.g., .50). Conversely, if anitem is answered incorrectly, the student’s theta estimate decreases by that same amount. As testingcontinues, the student’s ability is re-estimated, typically via Maximum Likelihood Estimation (MLE).
After an item is administered and scored, theta is re-estimated and used to select the subsequentitem. Items that provide the most information—based on the item information function—at thattheta level that have not yet been administered are selected for the examinee to complete. The test isterminated after a specific number of items have been administered (a fixed-length test) or after acertain level of precision—measured by the standard error of the estimate of theta—is achieved.Subsequent administrations begin at the previous theta estimate and only present items that havenot been administered to that particular student. Research using simulation methods and live datacollections has been performed on aReading to optimize the length of administrations, the level of theinitial step size, and item selection algorithms to maximize the efficiency, and psychometric propertiesof the assessment.
There are multiple benefits of CAT as compared to traditional paper-and-pencil tests or non-adaptivecomputerized tests. The benefits that are most often cited in the professional literature include: (a)individualized dynamic assessment, which does not rely on a fixed set of items acrossadministrations/individuals; (b) testing time that is reduced by one-half to one-third (or more) oftraditional tests because irrelevant items are excluded from the administration; (c) test applicability

Section 6. FAST as Evidence-Based Practice
Page | 31www.fastbridge.org
© 2015 Theodore J. Christ and Colleagues, LLC. All rights reserved.
and measurement precision across a broad range of skills/abilities, and (d) more precise methods toequate assessment outcomes across alternate forms or administrations (Kingsbury & Houser, 1999;Weiss, 2004; Zickar, Overton, Taylor, & Harms, 1999).
IRT-based CAT can be especially useful in measuring change over time. CAT applications that are usedto measure change/progress have been defined as adaptive self-referenced tests (Weiss, 2004; Weiss &Kingsbury, 1984) or, more recently, adaptive measurement of change (AMC; Kim-Kang & Weiss, 2007;Kim-Kang, & Weiss, 2008). AMCs can be used to measure the change of an individual’s skills/abilitieswith repeated CATs administered from a common item bank. Since AMC is a CAT based in IRT, iteliminates most of the problems that result when measuring change (e.g., academic growth) usingtraditional assessment methods that are based in classical test theory. Kim-Kang and Weiss (2007)have demonstrated that change scores derived from AMC do not have the undesirable properties thatare characteristic of change scores derived by classical testing methods. Research suggests thatlongitudinal measurements obtained from AMC have the potential to be sensitive to the effects oftreatments and interventions at the single-person level, and are generally superior measures ofchange when compared to assessments developed within a classical test theory framework (VanLoy,1996). Finally, AMC compiles data and performance estimates (θ) from across administrations toenhance the adaptivity and efficiency of CAT.
Aspects of Reading measured by aReading
Concepts of Print (COP)
The assessment of Concepts of Print in aReading focuses on assessing types of instruction outlined inthe state and national standards and is based on relevant reading research for developing readersincluding skills synthesized from the work of Marie Clay (e.g., 2007), Barbara Taylor (i.e., 2011), Levy etal., (2006), and NWEA goals for Concepts of Print development (2009).
Concepts of Print is defined as the general understanding of how print works and how it can be used(Snow, Burns, & Griffin, 1998). Concepts of print is the set of skills used in the manipulation of text-based materials, which include effective orientation of materials (directionality), page turning, identifythe beginning and ending of sentences, identify words, identify letters, sentences, and sentence parts.
Concepts of print are normally developed in the emergent literacy phase of development and enablethe development of meaningful early reading skills: “Emergent literacy consists of skills, knowledge,and attitudes that are developmental precursors to conventional forms of reading and writing”(Whitehurst & Lonigan, 1998). These skills typically occur prior to or early in school years and are basedon the child’s exposure to printed materials and reading skills modeled by others, especially adults.Development in this area from age 4 to age 6 has been documented using word and sentencediscrimination tasks that violated elements of word shape, word elements, and spelling (Levy, Gong,Hessels, Evans, & Jared, 2006).
By age 4, few children are able to read any single words, but most can distinguish drawings fromwriting and can detect abstract print elements such as letter spacing. These latter skills are related to

Section 6. FAST as Evidence-Based Practice
Page | 32www.fastbridge.org
© 2015 Theodore J. Christ and Colleagues, LLC. All rights reserved.
letter reading skill but not phonological awareness. This suggests that print conventions may developbefore word reading skills (Rayner, et al., 2012).
At age 5, most can detect word-shape and letter-orientation violations and letter sequencing. At age6, knowledge of spelling is a stronger predictor of word reading than for 5 year olds (Rayner et al.,2012). According to Levy et al., “The data show clear development of print concepts from 48 to 83months of age. This development begins with an understanding of figural and spatial aspects ofwriting (word shape). Next, or in conjunction with the first development, comes development of moreabstract notions of word constituents, including letter orientation, and finally comes an understandingof more detailed aspects of acceptable spelling patterns” (2006, p. 89).
Some more advanced skills can develop through Second Grade, such as understanding punctuation,standard spelling, reversible words, sequence, and other standard conventions of written and spokenlanguage. Introductory level of logical and analytical abilities as in understanding the concepts of printhas an impact on early student reading achievement (Adams, 1990; Clay, 1972; Downing, Ollila, &Oliver, 1975; Hardy et al., 1974; Harlin & Lipa, 1990; Johns, 1972; Johns, 1980; Lomax & McGee, 1987;Nichols et al., 2004; Tumner et al., 1988).
Phonological Awareness (PA)
The assessment of Phonological Awareness in aReading focuses on assessing types of instructionoutlined in the state and national standards and is based on relevant reading research for developingreaders including skills that are generally ordered from broader segments of word sounds to smallersound distinctions and the ability to manipulate these smaller sounds.
Phonological Awareness is a broad term involving the ability to detect and manipulate the soundstructure of a language at the level of phonemes (i.e., smallest units of sound in spoken language),onset-rimes, syllables, and rhymes. It is used to refer to spoken language rather than letter-soundrelationships, which are the focus of phonics. Most students, especially in preschool, Kindergarten, andFirst Grade, benefit from systematic and explicit instruction in this area (Adams, 1990; Carnine et al.,2009; NRP, 2000; Rayner et al., 2012; Snow, et al., 1998).
Phonemic awareness refers to the ability to know, think about, and use phonemes—individual soundsin spoken words. It is a specific type of phonological skill dealing with individual speech sounds thathas been studied extensively and predicts success in reading development in languages that usealphabetic writing systems (Adams, 1990; NRP, 2000; Rayner, et al., 2012). The conscious awareness ofphonemes as the basic units of sound in a language allows the reader to identify, segment, store, andmanipulate phonemes in spoken words and it is required for proficient reading—when phonemes arelinked to letters and letter combinations in the language’s orthography. According to Adams, “to theextent that children have learned to ‘hear’ phonemes as individual and separable speech sounds, thesystem will, through an associative network, strengthen their ability to remember or ‘see’ individualletters and spelling patterns” (1990, p. 304). Unfortunately, this is a difficult task because the Englishlanguage does not follow an explicit one-to-one correspondence between phonemes and letters(graphemes). English phonemes may be associated with various letters. Similarly, a single letter may

Section 6. FAST as Evidence-Based Practice
Page | 33www.fastbridge.org
© 2015 Theodore J. Christ and Colleagues, LLC. All rights reserved.
be associated with several phonemes. This lack of one-to-one correspondence between phonemesand graphemes creates a sense of ambiguity. Although the English alphabet is generally structured sothat many morphemes and words can be generated from relatively few letters (see Perfetti, 1985), thesimplicity of the grapheme-phoneme relations in English (i.e., 26 letters to 41 phonemes—acrossnumerous word combinations, letters or letter combinations with multiple sounds) makes it a less-transparent system for learners to decode phonologically (Liberman, Cooper, Shankweiler, & Studdert-Kennedy, 1967; Rayner et al., 2012). Rayner et al., (2012), provides a good example of this lack oftransparency, “American English has over a dozen vowel sounds but only five standard vowel letters.That means that a, e, i, o, and u have to do double and triple duty…For example, cat, cake, car, and calleach use the letter a for a different vowel phoneme” (2012, p.311).
Hearing and distinguishing individual letter sounds comes later in development (Goswami, 2000).Children who manipulate letters as they are learning to hear the sounds make better progress in earlyreading development (NRP, 2000, p. 2-4). Phonemic awareness skills are centrally involved in decodingby blending and segmenting phonemes (NRP, 2000). Phonemic awareness also helps children learnhow to spell words correctly. Phonemic segmentation is required to help children retain correctspellings in memory by connecting graphemes to phonemes (NRP, 2000).
Phonics
The assessment of phonics in aReading focuses on assessing types of instruction outlined in the stateand national standards and is based on relevant reading research about a student’s ability to identifyand manipulate printed letters (graphemes) and sounds (phonemes).
The correspondences between spoken and written language. This connection between letters, lettercombinations, and sounds enable reading (decoding) and writing (encoding). Phonic skilldevelopment “involves learning the alphabetic system, that is, letter-sound correspondences andspelling patterns, and learning how to apply this knowledge” to reading (NRP, 2-89).
Phonics most often refers to an instructional approach—a systematic, planned, explicit, sequentialmethod to teach beginning readers how to link written letters in words to the sounds of those letters(i.e., understand the alphabetic principle) to decode regular words. This instruction is helpful to mostbeginning readers in early primary grades (Christensen & Bowey, 2005; Juel & Minden-Cupp, 2000:Mathes et al., 2005; NRP, 2000; Stahl, 2001) and helps “…foster full alphabetic processing to enablechildren to handle the orthography” (Juel, 2006, p. 422). Indeed, early and systematic instruction inphonics results in better achievement in reading (; NRP, 2000; and others).
For the purpose of aReading assessment, we operationalize phonics as skills associated with theawareness and use of letter-sound (i.e., grapheme-phoneme) correspondence in relation todevelopment of successful spelling and reading using the language’s orthography. Assessment andinstruction of phonics explores how these skills are applied to decode (read) and encode (spell/write)the language (NRP, 2000).

Section 6. FAST as Evidence-Based Practice
Page | 34www.fastbridge.org
© 2015 Theodore J. Christ and Colleagues, LLC. All rights reserved.
Orthography and Morphology
The assessment of orthography and morphology in aReading focuses on assessing types of instructionoutlined in the state and national standards and is based on relevant reading research for readersincluding development of correct spelling, word identification and discrimination, and application ofmorphological and phonological knowledge.
Measures of orthography and morphology assist readers to recognize and decode or decipher wordsin isolation and during reading. The ability to quickly recognize words and access their meaningsallows readers to focus their limited cognitive resources (e.g., attention, memory) on meaning insteadof decoding (e.g., Bear, Invernizzi, Templeton, & Johnston, 2012). For example, students whose readingdifficulties or disabilities persist into the secondary grades need explicit instruction in wordrecognition skills to help them identify and understand new words—particularly across differentcontent areas. These skills contribute substantively to vocabulary and reading comprehensiondevelopment, therefore assessing students in these areas allows aReading to determine if a student isable to accurately use and apply these skills.
Orthography
Orthography is the relationship between a script (i.e., a set of symbols) and the structure of a language(Katz & Frost, 1992). It typically refers to the use of letters and sounds to depict (i.e., write) a language.In relation to word learning and vocabulary development however, it refers to the reader’s ability toidentify, develop, store and retrieve orthographic representations of words or word parts usingunderlying orthographic/visual representations and phonological structures (Burt, 2006; Perfetti, 1992,1997; Stanovich & West, 1989). Although phonological elements have been identified as central todevelopment of letter and word skills, they do not explain all of the variance in word recognition suchthat, as Stanovich and West (1989) point out, “…phonological sensitivity is a necessary but notsufficient condition for the development of word recognition processes” (p.404). Thus the underlyingvisual element of orthographic representation is also important. Given older students’ exposure tonew words throughout the upper grade levels, both elements of sound and orthographic/visualrepresentations of letter/word identification need to be considered when discussing assessment oforthography in older students.
Measures of orthography and morphology can assist readers in recognizing and decoding ordeciphering words in isolation and during reading. The ability to quickly recognize words and accesstheir meanings allows readers to focus their limited cognitive resources (e.g., attention, memory) onmeaning instead of decoding (Bear et al., 2012). Students whose reading difficulties persist into thesecondary grades need explicit instruction in word recognition skills to help them identify andunderstand new words – particularly across different content areas. These skills contributesubstantively to vocabulary and reading comprehension development. Therefore, assessing studentsin these areas using aReading orthography items helps to determine whether a student is able toaccurately use and apply these skills.

Section 6. FAST as Evidence-Based Practice
Page | 35www.fastbridge.org
© 2015 Theodore J. Christ and Colleagues, LLC. All rights reserved.
Morphology
Morphology is unique from orthography because it emphasizes recognition and manipulation ofword parts that help readers better understand a word’s meaning. Morphemes are the smallest unit ofmeaning in a word and morphology is the study of these forms or parts of words. In relation to wordlearning and vocabulary development, morphology refers to the reader’s ability to be morphologicallyaware of word roots and affixes—suffixes and prefixes—and word origins (etymology). It also refers tothe structural analysis readers may use to segment and manipulate parts of words to identify newwords and help determine unknown word meanings (i.e., morphological analysis) (Carnine et al.,2009).
Morphological awareness is formally defined as “…awareness of morphemic structures of words andthe ability to reflect on and manipulate that structure” (Carlisle, 1995, p. 194, see also Carlisle 2011)and morphological processing involves underlying cognitive processes involved in understanding andusing morphological information (Bowers, Kirby, & Deacon, 2010; Deacon, Parrila, & Kirby, 2008). Intheir review of the literature on instruction in morphology, Bowers, Kirby, and Deacon (2010) usemorphological knowledge instead of either the awareness or processing terms frequently used, due tothe ambiguity of the learning processes that may or may not be used by students in relation tomorphological instruction. aReading therefore typically refers to morphological knowledge and thisbackground guided development of items to assess students’ knowledge of the meaning behind partsof a word.
Vocabulary
The assessment of vocabulary in aReading focuses on assessing word knowledge and vocabularyoutlined in the state and national standards and based on relevant reading research for K–12 readersincluding understanding and recognition of words in context that are appropriate for students atgrade-level as well as appropriate for mature readers and writers to convey concepts, ideas, actions,and feelings (NAEP, 2011). These words include academic and content-specific words, wordcategories, word relations, and different parts of speech. The goal of vocabulary assessment should beto measure word knowledge in context rather than in isolation due to the integrated nature ofreading comprehension in relation to vocabulary development.
Vocabulary is an oral language skill that involves understanding the semantic and contextual relationsof a word(s) in both general and content-specific domains (Storch & Whitehurst, 2002; Whitehurst &Lonigan, 1998). Vocabulary knowledge develops through general oral communication, directinstruction using contextual or decontextualized words and through reading connected texts in avariety of contexts (Nagy, 2005; Stahl & Kapunis, 2001). As new words are incorporated, wordknowledge and efficiency of access is increased (Perfetti, 1994). Vocabulary is related to other readingskills (Cain, Oakhill, & Lemon, 2004; Ricketts, Nation, & Bishop, 2007), and a particularly stronginteractive and reciprocal relation occurs between vocabulary and reading comprehension acrossages (Carroll, 1993; McGregor, 2004; Muter, Hulme, Snowling, & Stevenson, 2004; Nation, Clarke,Marshall, & Durand, 2004; Nation & Snowling, 2004; Oakhill, et al., 2003).
Section 6. FAST as Evidence-Based Practice
Page | 36www.fastbridge.org
© 2015 Theodore J. Christ and Colleagues, LLC. All rights reserved.
Indeed, “Vocabulary knowledge is fundamental to reading comprehension; one cannot understandtext without knowing what most of the words mean” (Nagy, 1988, p. 1). Developing a readingvocabulary typically enlists one’s oral vocabulary: as a beginning reader comes across words that areless familiar in print, these are decoded and “mapped onto the oral vocabulary the learner brings tothe task” (NRP, 2000, p. 4-3). If the word is not in the learner’s oral vocabulary, decoding becomes lesshelpful and contextual information more important. Learning new words from text involvesconnecting the orthography to multiple contexts and establishing a flexible definition. Vocabularyknowledge, then, includes both definitional knowledge and contextual knowledge (Stahl, 1999). Somewords in text are so familiar that they no longer require explicit processing; these are referred to as asight word vocabulary (NRP).
Comprehension
The assessment of reading comprehension in aReading focuses on comprehension processes outlinedin the state and national standards and based on relevant reading research for K–12 readers includingthe reader’s development of an organized, coherent, and integrated representation of knowledge andideas in the text through use of inferential processes and identification of key ideas and details in thetext as well as understanding its craft and structure.
The goal of reading comprehension is to understand the meaning of what is heard and read.Comprehension is the process of understanding what is heard and read. Comprehension, orconstructing meaning, is the purpose of reading and listening. The NRP noted that “Comprehensionhas come to be viewed as the ‘essence of reading’ (Durkin, 1993), essential not only to academiclearning but to lifelong learning as well” (NRP, 2000, p. 4-11). “Good readers have a purpose forreading” (Armbruster, 2002, p. 34), like learning how to do something, finding out new information, orfor the enjoyment and entertainment that reading for pleasure brings. Good readers actively processthe test “to make sense of what they read, good readers engage in a complicated process. Using theirexperiences and knowledge of the world, their knowledge of vocabulary and language structure, andtheir knowledge of reading strategies . . ., good readers make sense of the text and know how to getthe most out of it. They know when they have problems with understanding” and they know “how toresolve these problems as they occur” (Armbruster, 2002, p. 48). aReading items for grades 6–12depended heavily on comprehension skills. Thus, the aReading team consulted with Dr. Paul van denBroek in spring 2012 to learn from his expertise in cognitive processes involved in readingcomprehension. After meeting with Dr. van den Broek, the team ensured that questions about thereading passages should ask students to (a) locate and recall broad and specific information in thetext, (b) integrate and interpret beyond the explicit information in the text, and (c) critique andevaluate the quality of the author’s writing.
Uses and ApplicationsEach aReading assessment is individualized by the software and, as a result, the information andprecision of measurement is optimized regardless of whether a student functions at, above, orsignificantly below grade level.
Section 6. FAST as Evidence-Based Practice
Page | 37www.fastbridge.org
© 2015 Theodore J. Christ and Colleagues, LLC. All rights reserved.
Target Population
aReading is intended for use from Kindergarten through Twelfth Grades for screening. The aReadingitem bank consists of approximately 2000 items that target the reading domains described in theprevious section. Items developed for Kindergarten through Grade Five target Concepts of Print,Phonological Awareness, Phonics, Vocabulary, and Comprehension. Items developed for middle andhigh school grade levels target Orthography, Morphology, Vocabulary, and Comprehension. Pleasenote, however, that the importance and emphasis on each reading domain will vary across children.
Chapter 2.2: Development
earlyReadingThe results of the National Assessment of Educational Progress (NAEP) for 2011 suggest that amongFourth Grade students, 3% perform below a basic level (partial mastery of fundamental skills) and 68%perform below a proficient level of achievement (demonstrated competency over challenging subjectmatter) (National Center for Education Statistics, 2013). Among eighth grade students, 25% performbelow basic and 68% perform below proficiency (Aud, Wilkinson-Flicker, Kristapovich, Rathbun, Wang,& Zhang, 2013). Approximately 32% of students demonstrate reading proficiency at grade level. Therelatively low levels of reading proficiency and achievement within the general population arereflected within the population receiving services under the Individuals with Disabilities Education Act(IDEA), originally enacted in 1975. Among students who receive special education services, 91% ofFourth Graders and 95% of eighth graders fail to achieve grade-level proficiency in reading. Moreover,the majority of these students scored in the below basic range in reading achievement (NationalCenter for Educational Statistics, 2003). The incidence of reading-related disabilities isdisproportionately large when compared to other categories of disability under IDEA. Governmentdata suggests that almost 60% of the students who are served under IDEA are identified with aspecific learning disability, and 80% of those students are identified with a reading disability (U.S.Department of Education, 2001, 2002). Of the nearly 3 million students served under IDEA and the 1.5million students identified with a specific learning disability, approximately 1.3 million are identifiedwith a reading disability.
Reading instruction and reading development has never been better understood. Nevertheless, thereis a great deal of progress to be made in the future by building on our present knowledge-base. TheNational Reading Panel identified five essential component skills that support reading development:phonemic awareness, phonics, fluency, vocabulary, and comprehension. They did not, however,define the relative scope and importance of each component within or across developmental phases.It is likely that specific skill-sets are most relevant and more salient at particular points in thedevelopmental continuum (Paris, 2005). For elementary grades two through six, measures of fluencywith connected text (curriculum based measure of oral reading; CBM-R) are often used as a universalscreeners for grade-level reading proficiency. CBM-R requires students to read from a grade levelpassage for one minute while the number of words read correctly is recorded. Strong evidence existsin the literature to support the use of CBM-R (L.S. Fuchs, Fuchs, & Maxwell, 1988; Kranzler, Brownell, &Miller, 1998; Markell & Deno, 1997); however, support for CBM-R as a universal screener for students
Section 6. FAST as Evidence-Based Practice
Page | 38www.fastbridge.org
© 2015 Theodore J. Christ and Colleagues, LLC. All rights reserved.
not yet reading connected text is less robust (Fuchs, Fuchs, & Compton, 2004; National ResearchCouncil, 1998). The research literature provides substantial guidance on instruction and assessment ofalphabetic knowledge, phonemic awareness, and oral reading. The objective of earlyReadingmeasures is to extend and improve on the quality of currently available assessments.
There is growing evidence that successful reading in elementary school grades depends on acombination of code-related and language comprehension skills. Code-related skills include theawareness that printed text is meaningful and the ability to translate the letters and words of the textinto such meaningful concepts. Language comprehension skills concern the ability, knowledge andstrategies necessary to interpret concepts and connect these concepts into a coherent mentalrepresentation of the text (Gough & Tunmer, 1986; Oakhill & Cain, 2007; Whitehurst & Lonigan, 1998).
A long tradition of research support indicates that early code-related skills predict later readingachievement (Adams, 1990; Chall, 1987; Juel, 1988; LaBerge & Samuels, 1974; National Reading Panel,2000a; Stanovich, 1984). The design of earlyReading has a strong foundation in both research andtheory. During the early phases of student reading development, the component processes of readingare most predictive of future reading success (Stanovich, 1981, 1984, 1990; Vellutino & Scanlon, 1987,1991; Vellutino, Scanlon, Small, & Tanzman, 1991). Indeed, reading disabilities are most frequentlyassociated with deficits in accurate and efficient word identification.
CBMreadingThe National Reading Panel identified five essential component skills that support readingdevelopment: phonemic awareness, phonics, fluency, vocabulary and comprehension. Fluency (orrate) in particular, is important because it establishes a connection between word identification andcomprehension. Despite research establishing CBM-R as a valid measure of general readingachievement, as well as an effective tool for predicting later reading performance, research alsoprovides evidence for the necessity to improve CBM-R instrumentation and procedures. Estimates oflongitudinal growth for individual students can be more a function of the instrumentation (i.e.,inequitable passages) as opposed to students’ actual response to intervention. Development of theCBMreading passages, therefore, was based on findings from existing research and theory. Thisprovided clear guidance for ways to improve progress monitoring measures and outcomes that couldyield substantial and significant improvements for a widely used approach to progress monitoring.These benefits are especially relevant within the evolving context of response to intervention, whichrelies substantially on CBM-R and rate-based measures of reading. The goal in creating theCBMreading measures, therefore, was to systematically develop, evaluate and finalize research-basedinstrumentation and procedures for accurate, reliable, and valid assessment and evaluation of readingrate.
aReadingSimilar to CBMreading, aReading item development followed the process and standards presented bySchmeiser and Welch (2006) in the fourth edition of Educational Measurement (Brennan, 2006).Research assistants, teachers from each grade level (1st through 12th), and content experts in the area

Section 6. FAST as Evidence-Based Practice
Page | 39www.fastbridge.org
© 2015 Theodore J. Christ and Colleagues, LLC. All rights reserved.
of reading served as both item writers and reviewers for those items at the Kindergarten through 5thgrade level. Items for grades 6 through 12 were constructed to reflect the Common Core StateStandards’ (National Governors Association Center for Best Practices & Council of Chief State SchoolOfficers, 2010) specifications for various skills of interest, as well as the National Assessment ofEducational Progress’ (NAEP, 2011) guidelines for reading assessment items. After items were writtenat all grade levels, they were reviewed for feasibility, construct relevance, and content balance. Astratified procedure was used to recruit a diverse set of item writers from urban, suburban and ruralareas. The item writers wrote, reviewed, and edited assessment materials.
Item writing for aReading was a multi-year, collaborative, and iterative process. First the literature onitem writing guidelines used when developing assessments was reviewed. Next, the literature onmultiple-choice item writing was reviewed. Once the literature was reviewed, the guidelines wereapplied to aReading to examine relevance and utility. Extensive guidelines and practice were providedto item writers and the process outlined above was followed.
The Item Development Process: An a-priori ModelaReading targets the essential skills that enable reading. In its current form aReading provides generalestimate of overall reading achievement (i.e., a screening measure), which we define as the UnifiedMeasure of Reading Achievement (see Figure 1 below). The research team established an a priorimodel of component skills and a unified measurement construct based on previous data andassumptions regarding typical rates of reading achievement. The use of grade levels is a conveniencebecause the actual assessment is individualized to each student at the time of assessment (see latersection regarding computer adaptive testing). The grade levels indicate only the likely relevantdomains. These target skill components for assessment are derived from the research literature andare consistent with the recommendation of the National Reading Panel (2000) and criticalcomponents of most state standards for instruction and assessment.

Section 6. FAST as Evidence-Based Practice
Page | 40www.fastbridge.org
© 2015 Theodore J. Christ and Colleagues, LLC. All rights reserved.
Figure 1 A priori model for unified reading achievement
The Item Development Process: Alignment with Common Core State StandardsThe Common Core State Standards for English Language Arts and Literacy in History/Social Studies,Science and Technical Subjects (furthered referred to as the Standards) is a synthesis of informationgathered from state departments of education, assessment developers, parents, students, educators,and other pertinent sources to develop the next generation of state standards of K–12 students toensure that all students are college and career literacy ready by the end of their high school education.This process is headed by the Council of Chief State School Officers (CCSO) and the National GovernorsAssociation (NGA). The Standards are an extension of a previous initiative by the CCSSO and NGAtitled the College and Career Readiness (CCR) Anchor Standards. The CCR Anchor Standards arenumbered from one to ten, and are as follows: (1) Read closely to determine what the text saysexplicitly and to make logical inferences from it; cite specific textual evidence when writing orspeaking to support conclusions drawn from the text. (2) Determine central ideas or themes of a textand analyze their development; summarize the key supporting details and ideas. (3) Analyze how andwhy individuals, events, and ideas develop and interact over the course of a text. (4) Interpret wordsand phrases as they are used in a text, including determining technical, connotative, and figurativemeanings, and analyze how specific word choices shape meaning or tone. (5) Analyze the structure oftexts, including how specific sentences, paragraphs, and larger portions of the text (e.g., a section,chapter, scene, or stanza) relate to each other and the whole. (6) Assess how point of view or purposeshapes the content and style of a text. (7) Integrate and evaluate content presented in diverse mediaand formats, including visually and quantitatively as well as in words. (8) Delineate and evaluate the

Section 6. FAST as Evidence-Based Practice
Page | 41www.fastbridge.org
© 2015 Theodore J. Christ and Colleagues, LLC. All rights reserved.
argument and specific claims in a text, including the validity of the reasoning as well as the relevanceand sufficiency of the evidence. (9) Analyze how two or more texts addresses similar themes or topicsin order to build knowledge or to compare the approaches the authors take. (10) Read andcomprehend complex literary and informational texts independently and proficiently. These anchorstandards were designed with three themes in mind: craft and structure, integration of knowledgeand ideas, and range of reading and level of text complexity.
The Standards add a level of specificity in the form of end of grade expectations for each of these tenanchor standards. To do this, the Standards organize the 10 anchor standards in three ways. First, adistinction is made between Literature and Information text. Secondly, the ten items are grouped intorelevant clusters which are the same for both literature and information text. Those clusters are: KeyIdeas and Details 1–3, Craft and Structure 4–6, Integration of Knowledge and Ideas 7–9, and Range ofReading and Level of Text Complexity 10. Further, the Standards provide a corresponding end ofgrade skill expectation by grade for each number within the cluster. A portion of the ReadingsStandards for Information Text is presented inRelevant to reading standards for students inKindergarten through Fifth Grade, the CCSO and NGA identify foundational skills, including a workingknowledge of concepts of print, the alphabetic principle, and other basic conventions of the writingsystem. Sub-categories under these foundational skills include print concepts, phonologicalawareness, phonics and word recognition, and fluency. It is important to acknowledge that at thispoint in time, fluency is not yet applicable to aReading. Print concepts encompass the ability todemonstrate the organization and basic feature of print. Phonological awareness is the ability todemonstrate an understanding of spoken words, syllables, and sounds or phonemes. Finally, phonicsand word recognition includes applying grade-level phonics and word analysis skills in the process ofdecoding words. Within each category, there are specific end of the year expectations for each gradelevel. Examples are shown in
Table 2. Table 3 specifies cross-references between Common Core State Standards and aReading itemdomains.
Table 1 below. Similar, grade-level standards for all K–12 grade levels are available to view in theCommon Core State Standards (2010).
Relevant to reading standards for students in Kindergarten through Fifth Grade, the CCSO and NGAidentify foundational skills, including a working knowledge of concepts of print, the alphabeticprinciple, and other basic conventions of the writing system. Sub-categories under these foundationalskills include print concepts, phonological awareness, phonics and word recognition, and fluency. It isimportant to acknowledge that at this point in time, fluency is not yet applicable to aReading. Printconcepts encompass the ability to demonstrate the organization and basic feature of print.Phonological awareness is the ability to demonstrate an understanding of spoken words, syllables,and sounds or phonemes. Finally, phonics and word recognition includes applying grade-levelphonics and word analysis skills in the process of decoding words. Within each category, there arespecific end of the year expectations for each grade level. Examples are shown in

Section 6. FAST as Evidence-Based Practice
Page | 42www.fastbridge.org
© 2015 Theodore J. Christ and Colleagues, LLC. All rights reserved.
Table 2. Table 3 specifies cross-references between Common Core State Standards and aReading itemdomains.
Table 1. Example Standards for Informational Text
Reading Standards for Informational Text K–2Kindergarten Grade 1 Grade 2
Key Ideas and Details
1. With prompting and support,
ask and answer questions about
key details in a text.
1. Ask and answer questions about
key details in a text.
1. Ask and answer such questions
as who, what, where, when, why
and how to demonstrate
understanding of key details in a
text.
2. With prompting and support,identify the main topic and retell
key details of a text.
2. Identify the main topic andretell key details of a text.
2. Identify the main topic of amulti-paragraph text as well as the
focus of specific paragraphs within
the text.
3. With prompting and support,
describe the connection between
two individuals, events, ideas, orpieces of information in a text.
3. Describe the connection
between two individuals, events,
ideas, or pieces of information in atext.
Describe the connection between
a series of historical events,
scientific ideas or concepts, orsteps in technical procedures in a
text.
Table 2. Foundational Skill Examples for Kindergarten and First Grade Students
Table 3. Cross-Referencing CCSS Domains and aReading Domains
Common Core Subgroups / Clusters aReading Domains
Reading Standards: Foundational Skills (K–1)
Kindergarten Grade 1
Print Concepts
1. Demonstrate understanding of the organization
and basic features of print.
1. Demonstrate understanding of the organization
and basic features of print.
a. Follow words from left to right, top to bottom, and
page by page.
a. Recognize the distinguishing features of a
sentence (e.g., first word, capitalization, ending
punctuation).
b. Recognize that spoken words are represented in
written language by specific sequences of letters.
c. understand that words are separated by spaces in
print.
d. Recognize and name all upper- and lowercaseletters of the alphabet.

Section 6. FAST as Evidence-Based Practice
Page | 43www.fastbridge.org
© 2015 Theodore J. Christ and Colleagues, LLC. All rights reserved.
Foundational Skills
Print Concepts Concepts of Print
Phonological Awareness Phonemic Awareness
Phonetic Awareness Phonetic Awareness
Vocabulary Vocabulary
College and Career Readiness Reading Standards for Literature / Informational Text
Key Ideas and Details Comprehension
Craft and structure Comprehension & Vocabulary
Integration of Knowledge and Ideas Comprehension & Vocabulary
Chapter 2.3: Administration and Scoring
earlyReadingAdministration time varies depending on which earlyReading assessment subtest is beingadministered. A timer is built into the software and is required for all subtests. For those assessmentsthat calculate a rate-based score (i.e., number correct per minute), the default test duration is set toone minute. These subtests include Letter Names, Letter Sounds, Sight Words, Decodable Words, andNonsense Words. For those subtests that do not calculate a rate-based score (number correct), thedefault test duration is set to open-ended. This includes Concepts of Print, Onset Sounds, WordRhyming, Word Segmenting, and Word Blending subtests. Although it is not recommended, thoseadministering the assessments can change the test duration by selecting options from a drop-downmenu. earlyReading is individually administered, and each subtest can take approximately one tothree minutes to complete; administration of the composite assessments for universal screening takesapproximately 5 minutes.
CBMreadingCBMreading includes standardized administration and scoring procedures along with proprietaryinstrumentation, which was developed with funding from the US Department of Education andInstitute for Education Sciences. CBMreading takes approximately one minute to administer a singlepassage. The administration of three passages takes approximately five minutes per student.
If a student stops or does not say a word aloud for three seconds, tell the student the word, mark theword as incorrect, and instruct the student to continue. Aside from the three second rule, do notprovide the student with correct responses, or correct errors that the student makes. Alternate scoringmethods include word-by-word error analysis and performance analysis to evaluate the types of errorscommitted by students.

Section 6. FAST as Evidence-Based Practice
Page | 44www.fastbridge.org
© 2015 Theodore J. Christ and Colleagues, LLC. All rights reserved.
aReadingaReading can be group administered in a computer lab setting, or a student can complete anadministration individually at a computer terminal set up in a classroom. The aReading assessmentterminates on its own, informing students they have completed all items. A typical aReadingadministration is approximately 30 items. Students in grades K–5 take an average of 10–15 minutes tocomplete an assessment, and students in grades 6–12 take an average of 20–30 minutes.Administration time may vary by student. Instructions for completing aReading are provided viaheadphones to students. In addition to audible instructions, students are provided with an animatedexample. No verbal instructions are required on behalf of the administrator.
Chapter 2.4: Interpreting Test Results
earlyReading
Raw ScoresEach earlyReading subtest produces a raw score. The primary score for each subtest is the number ofitems correct and/or the number of items correct per minute. These raw scores are used to generatepercentile ranks.
Composite ScoresThe best estimate of students’ early literacy skills is the earlyReading composite score. The compositescore consists of multiple subtest scores administered during a universal screening period. TheearlyReading composite scores were developed as optimal predictors of spring broad readingachievement in Kindergarten and First Grade. A selected set of individual subtest scores wereweighted to optimize the predictive relationship between earlyReading and broad readingachievement scores (See Table 4 below). The weighting is specific to each season. It is important toemphasize that the weighting is influenced by the possible score range and the value of the skill. Forexample, letter sounds is an important skill with a score range of 0 to 60 or more sounds per minute.This represents a broad range of possible scores with benchmark scores that are fairly high (e.g.,benchmarks for fall, winter, and spring might be 10, 28, and 42, respectively). In contrast, Concepts ofPrint has a score range from 0 to 12 and benchmarks are relatively low in value (e.g., benchmarks forfall and winter might be 8 and 11, respectively). As a result of both the score range and the relativevalue of Concepts of Print to overall early reading performance, the subtest score is more heavilyweighted in the composite score. The weightings are depicted in Table 4 (below). The high (H),moderate (M), and low (L) weights indicate the relative influence of a one point change in the subteston the composite score. A one point change for an H weighting is highly influential. A one pointchange in an L weighting has low influence.
The composite scores should be interpreted in conjunction with specific subtest scores. A variety ofpatterns might be observed. It is most common for students to perform consistently above or belowbenchmark on the composite and subtests; however, it is also possible to observe that a particularstudent is above benchmark on one or more measures but below the composite benchmark. It is also

Section 6. FAST as Evidence-Based Practice
Page | 45www.fastbridge.org
© 2015 Theodore J. Christ and Colleagues, LLC. All rights reserved.
possible for a student to be below benchmark on one or more subtests but above the compositebenchmark. Although atypical, this phenomenon is not problematic. The recommendation is tocombine the use of composite and subtest scores in order to optimize the decision-making process.Overall, composite scores are the best predictors of future reading success.
Table 4. Weighting Scheme for earlyReading Composite ScoresKindergarten First Grade
earlyReading Subtests F W S F W S
Concepts of Print HOnset Sounds M H
Letter Names L
Letter Sounds L L L
Word Segmenting L M L L L
Nonsense/Decodable Words M M H H HSight Words L M M M
Sentence Reading L
CBMreading L L
Broad Score
Note. The weighting of subtests for the composite is represented above.H – high weighting, M – moderate weighting, L – low weighting.
Kindergarten
The composite score for Kindergarten students in the fall includes Concepts of Print, Onset Sounds,Letter Sounds, and Letter Naming. The composite score for winter includes Onset Sounds, LetterSounds, Word Segmenting and Nonsense Words. Finally, for spring of the Kindergarten year, thefollowing subtests are recommended in order to compute an interpretable composite score: LetterSounds, Word Segmenting, Nonsense Words, and Sight Words (50). The Decodable Words score maybe used in place of Nonsense Words for computing any of the composite scores specified.
First Grade
The composite score for First Grade students in the fall includes Word Segmenting, Nonsense Words,Sight Words (150), and Sentence Reading. The composite score for winter includes Word Segmenting,Nonsense Words, Sight Words (150), and CBMreading. Finally, for spring of First Grade, the followingsubtests are recommended in order to compute an interpretable composite score: Word Segmenting,Nonsense Words, Sight Words (150), and CBMreading. The Decodable Words score may be used inplace of Nonsense Words for computing any of the composite scores specified.
Section 6. FAST as Evidence-Based Practice
Page | 46www.fastbridge.org
© 2015 Theodore J. Christ and Colleagues, LLC. All rights reserved.
Benchmark ScoresBenchmark scores are available for each earlyReading subtest for the specific grade level and monthfor which they are intended for use. Thus, a benchmark is purposefully not provided for every subtest,for each month, during Kindergarten and First Grade. Benchmarks were established for earlyReadingto help teachers accurately identify students who are at risk or not at risk for academic failure. Thesebenchmarks were developed from a criterion study examining earlyReading assessment scores inrelation to scores on the Group Reading Assessment and Diagnostic Evaluation (GRADE; Williams,2001). Measures of diagnostic accuracy were used to determine decision thresholds using criteriarelated to sensitivity, specificity, and area under the curve (AUC). Specificity and sensitivity wascomputed at different cut scores in relation to maximum AUC values. Decisions for final benchmarkpercentiles were generated based on maximizing each criterion at each cut score (i.e., when the cutscore maximized specificity ≥ .70, and sensitivity was also ≥ .70; see Silberglitt & Hintze, 2005). Basedon these analyses, the values at the 40th and 15th percentiles were identified as the primary andsecondary benchmarks for earlyReading, respectively. These values thus correspond with a predictionof performance at the 40th and 15th percentiles on the GRADE™ (Group Reading Assessment andDiagnostic Evaluation), a nationally normed reading assessment of early reading skills. Performanceabove the primary benchmark indicates the student is at low risk for long-term reading difficulties.Performance between the primary and secondary benchmarks indicates the student is at some risk forlong-term reading difficulties. Performance below the secondary benchmark indicates the student isat high risk for long-term reading difficulties. These risk levels help teachers accurately monitorstudent progress using the FAST™ earlyReading measures. Benchmarks are reported in the FastBridgeLearning: Benchmarks and Norms Guide.
CBMreadingInterpreting CBMreading scores involves a basic understanding of the various scores provided in theFAST™ software.
Total Words ReadTotal Words Read refers to the total number of words read by the student, including correct andincorrect responses.
Number of ErrorsThis is the total number of errors the student made during the one minute administration time.
Words Read Correct per Minute (WRC/min)This is the number of Words Read Correct per minute. This is computed by taking the total number ofwords read and subtracting the number of errors the student made.
Benchmark ScoresBenchmark scores are available for CBMreading by grade level and time of the year (i.e., fall, winter,spring) for which they are intended for use. A benchmark is provided for every grade level (1-6), foreach of the three time points throughout the school year. The assessment of oral reading rate with

Section 6. FAST as Evidence-Based Practice
Page | 47www.fastbridge.org
© 2015 Theodore J. Christ and Colleagues, LLC. All rights reserved.
CBM-R is well established in the literature for use to benchmark student progress (Wayman et al.,2007). Benchmarks were established for CBMreading to help teachers accurately identify studentswho are at risk or not at risk for reading difficulties. All CBMreading forms are divided into Levels A, Band C, which correspond to 1st grade (A), 2nd and 3rd grade (B), and 4th through 6th grade (C)reading levels, respectively. There are 39 Level A passages, 60 Level B, and 60 Level C passages. Eachpassage is assigned as a screening/benchmarking form for each grade level (1st to 6th) and a varietyof progress monitoring forms. The weekly passage set options include: one unique passage weekly (1xweekly), two unique passages weekly (2x weekly), or three unique passages weekly (3x weekly).Analyses were conducted to link CBMreading scores with DIBELS Next and AIMSweb benchmark andtarget scores.
Measures of diagnostic accuracy were used to determine decision thresholds using criteria related tosensitivity, specificity, and area under the curve (AUC). Specifically, specificity and sensitivity wascomputed at different cut scores in relation to maximum AUC values. Decisions for final benchmarkpercentiles were generated based on maximizing each criterion at each cut score (i.e., when the cutscore maximized specificity ≥ .70, and sensitivity was also ≥ .70; see Silberglitt & Hintze, 2005).Benchmarks generally correspond to the 40th and 15th percentiles on nationally normed assessmentsand FAST™ norms. Benchmarks are reported in the FastBridge Learning: Benchmark and Norms Guide.
aReadingInterpreting aReading scores involves a basic understanding of the various scores provided in theFAST™ software.
Scaled ScoresScores generated by the aReading computer-adaptive test (CAT) yield scores based on an IRT logitscale. This type of scale is not useful to most school professionals; in addition, it is difficult to interpretscores on a scale for which everything below the mean value yields a negative number. Therefore, itwas necessary to create an aReading scale more similar to existing educational measures. Such scalesare arbitrarily created with predetermined basal and ceiling scores. For instance, the Measure ofAcademic Progress (MAP; NWEA) uses a scale from 150 to 300 and STAR Early Literacy (RenaissanceLearning) uses a scale from 300 to 850.
The aReading scale yields scores that are transformed from logits using the following formula:
y = 500 + (50 x Logit Score)
The logit scale has an M = 0 and SD = 1 and y is the new aReading scaled score, and (theta) is the
initial aReading logit theta estimate. Scores were scaled with a lower bound of 350 and a higher

Section 6. FAST as Evidence-Based Practice
Page | 48www.fastbridge.org
© 2015 Theodore J. Christ and Colleagues, LLC. All rights reserved.
bound of 650. The mean value is 500 and the standard deviation is 50. There are several shortcomingsin reporting logit scores to educational professionals. Among these are: (a) teachers are unfamiliarwith a measure ranging in six points with decimals and (b) using the current logit reporting scheme,negative values demarcate ability estimates below average. Displaying negative values for abilityestimates may carry with it off-putting connotations. Thus, the researchers for aReading chose toadopt an arbitrary scale upon which to report logit scores and theta estimates. The idea of reportingscores on the same scale as standard intelligence tests was considered but ultimately dismissed. Thereason for dismissing this idea was two-fold; the researchers wanted to avoid educators and parentsinaccurately equating aReading scores with IQ scores. In addition, creating a novel and arbitrary scalewould encourage educators to refer to the current technical manual for assistance in interpreting suchscores accurately. Details on interpreting aReading scaled scores for instructional purposes isdelineated in the following section.
Interpreting Scaled Scores
aReading scaled scoreshave an average of 500and standard deviation of50 across the range ofKindergarten to twelfthgrades. Scores should beinterpreted withreference to thebenchmarks and norms.In addition, aReading hasdescriptions regardingthe interpretation of astudent’s scaled scorewith respect to mastered,developing, and futureskill development. Theseare intended to helpteachers better understand the developmental progression and student needs. FAST™ generatesindividual reports to describe the reading skills that the student has mastered, is developing, and willdevelop based on their scaled score Figure 2 shows an example of a student’s score report and hermastered, developing, and future skills for Concepts of Print.
Benchmark ScoresBenchmark scores for aReading are available for Kindergarten through Twelfth Grade at three timeperiods: fall, winter, and spring. Benchmarks were established for aReading to help teachers accuratelyidentify students who are at risk or not at risk for academic failure. Benchmarks are reported in theFastBridge Learning: Benchmark and Norms Guide.
Figure 2. Example of a student's aReading report with interpretations of the scaledscore

Section 6. FAST as Evidence-Based Practice
Page | 49www.fastbridge.org
© 2015 Theodore J. Christ and Colleagues, LLC. All rights reserved.
Chapter 2.5: Reliability
earlyReadingearlyReading measures were administered to Kindergarten and First Grade students from nineelementary schools across three school districts in a metropolitan area in the Midwest. Kindergartenstudents who participated in the study were enrolled in all-day Kindergarten programming. Thedemographic information for each school district is provided in Table 5.
Table 5. Demographic Information for earlyReading Alternate Form SampleCategory District A District B District C
White 56.1% 93% 79.5%
Black 13.5% 4% 6.8%
Hispanic 10.3% 3% 4.5%
Asian/Pacific Islander 19.4% 4% 10.5%
American Indian/Alaska Native >.1% 1% .25%
Free/Reduced Lunch 44.9% 17% 9%
LEP 15.8% 6% 6%
Special Education 12.6% 10% 10%
Classrooms were recruited by the reading coordinator within each school district. Teachers received a$20.00 gift card for participating. Five progress monitoring alternate forms were randomly chosen foreach earlyReading measure (for which progress monitoring forms exist). Students were administeredfive forms of one to two earlyReading measures consecutively in one sitting. Administration wasconducted by trained administrators who all attended a two-hour training session in addition tocompleting integrity checks while working with students.
Evidence of reliability is available for Alternate Forms for all earlyReading subtests (see
Table 6). In order to effectively examine reliability coefficients, Standard error of measurement (SEm)has also been provided. The SEm is an index of measurement error representing the standarddeviation of errors attributable to sampling. The SEm provides information about the confidence withwhich a particular score can be interpreted, relative to a single individual’s true score. Thus, a smallSEm represents greater confidence that a score reflects the individual’s true performance and skill
level. The SEm is based on the formula = √1 − where SD represents the standard deviationof the distribution and r represents the reliability of the measure. The SEm can be used by thoseadministering the measure to help interpret the score obtained by a student. The SEm for bothKindergarten and First Grade are available for each subtest in
Table 6. To determine parallel form construction, ANOVAs were conducted to compare alternate formsfor each individual subtest. See below for a complete description of parallel form construction for the

Section 6. FAST as Evidence-Based Practice
Page | 50www.fastbridge.org
© 2015 Theodore J. Christ and Colleagues, LLC. All rights reserved.
following earlyReading subtests: Onset Sounds, Letter Naming, Letter Sounds, Word Blending, WordSegmenting, Decodable Words, and Nonsense Words.
Table 6. Alternate Form Reliability and SEm for earlyReading
Grade N (range)
Coefficient
SEm (SD)Range Median
KindergartenOnset Sounds 25–29 .77–.89 .83 .99 (.86)
Letter Naming 36–37 .82–.92 .88 5.07 (3.77)
Letter Sound 34–36 .85–.94 .89 5.56 (4.89)
Word Blending 36–37 .59–.79 .71 .97 (.82)
Word Segmenting 37–38 .68–.92 .82 8.07 (6.21)Decodable Words 29 .96–.98 .97 2.93 (2.71)
Nonsense Words 28 .86–.96 .93 2.15 (1.91)
Sight Words (50) 24–28 .94–.99 .97 4.40 (4.13)
Nonsense Words 28 .86–.96 .93 2.15 (1.91)
Grade 1
Word Blending 30–31 .15–.59 .26Word Segmenting 40 .67–.87 .82 9.83
Decodable Words 36–37 .97–.98 .98 2.98
Nonsense Words 26–27 .69–.96 .85 3.05 (3.04)
Sight Words (150) 37 .91–.96 .94 4.14
Note. SD = Standard Deviation.
Alternate Form ReliabilityOnset Sounds. To determine parallel form construction, a one-way, within-subjects (or repeatedmeasures) ANOVA was conducted to compare the effect of Onset Sounds alternate forms (n = 5) onthe number of correct responses within individuals. There was not a significant effect for forms F(1,109) = 1.81, p =.18. This indicates that different forms did not result in significantly different meanestimates of correct responses.
Letter Names. To determine parallel form construction, a one-way, within-subjects (or repeatedmeasures) ANOVA was conducted to compare the effect of Letter Names alternate forms (n = 5) on thenumber of correct responses within individuals. There was not a significant effect for forms F (1,146) =.71, p=.40. This indicates that different forms did not result in significantly different mean estimates ofcorrect responses.
Letter Sounds. To determine parallel form construction, a one-way, within-subjects (or repeatedmeasures) ANOVA was conducted to compare the effect of Letter Sounds alternate forms (n = 5) onthe number of correct responses within individuals. There was not a significant effect for forms F(1,139) = .96, p =.33. This indicates that different forms did not result in significantly different meanestimates of correct responses.

Section 6. FAST as Evidence-Based Practice
Page | 51www.fastbridge.org
© 2015 Theodore J. Christ and Colleagues, LLC. All rights reserved.
Word Blending. To determine parallel form construction, a one-way, within-subjects (or repeatedmeasures) ANOVA was conducted to compare the effect of Word Blending alternate forms (n = 5) onthe number of correct responses within individuals. There was not a significant effect for forms F(1,121) = 1.60, p =.21. This indicates that different forms did not result in significantly different meanestimates of correct responses.
Word Segmenting. To determine parallel form construction, a one-way, within-subjects (or repeatedmeasures) ANOVA was conducted to compare the effect of Word Segmenting alternate forms (n=5)on the number of correct responses within individuals in both Kindergarten and grade 1. There wasnot a significant effect for forms as used in either grade: Kindergarten = F (1,150) = 3.24, p=.07; grade 1= F (1,121) = 1.60, p =.21. This indicates that different forms did not result in significantly differentmean estimates of correct responses.
Decodable Words. To determine parallel form construction, a one-way, within-subjects (or repeatedmeasures) ANOVA was conducted to compare the effect of Decodable Words alternate forms (n = 5)on the number of correct responses within individuals. There was not a significant effect for forms F(1,145) = 1.72, p =.19. This indicates that different forms did not result in significantly different meanestimates of correct responses.
Nonsense Words. To determine parallel form construction, a one-way, within-subjects (or repeatedmeasures) ANOVA was conducted to compare the effect of Nonsense Words alternate forms (n = 5) onthe number of correct responses within individuals. For Kindergarten, there was not a significant effectfor forms F (1,107) = .03, p =.86. For First Grade, there was not a significant effect for forms F (1,106) =2.34, p =.13. This indicates that different forms did not result in significantly different mean estimatesof correct responses.
Internal Consistency (Item-Total Correlations)Some earlyReading measures have fixed test lengths and are subject to typical internal consistencyanalyses. Some earlyReading measures, however, are timed. Different students will therefore havetests of different lengths. Internal consistency measures of reliability are inflated on timed measuresbecause of the high percentage of incomplete items at the end of the assessment, which are those forwhich examinees did not respond (Crocker & Algina, 1986). As a solution to both illustrate thepotential inflation and also reduce it, estimates of internal consistency (reliability) were run on theitems completed by approximately 16% of students, the items completed by 50% of students, anditems completed by approximately 84% of students. Items not completed were coded as incorrect.For both fixed test -length and inconsistent test-length analyses, data were derived from a randomsample of students from the FAST™ database from the 2012–13 academic year. Reliability of measureswith variable test length is reported in .

Section 6. FAST as Evidence-Based Practice
Page | 52www.fastbridge.org
© 2015 Theodore J. Christ and Colleagues, LLC. All rights reserved.
Table 7. Reliability of measures with fixed test length is reported in Table 8.
Table 7. Internal Consistency for earlyReading Subtests of Variable Test Length
Measure Grade N Alpha Split-Half
Letter Names K 444
18 items .95 .96
35 items .98 .99
52 items .98 .99
Letter Sounds K 683
10 items .93 .93
30 items .98 .98
50 items .98 .99
Decodable Words K-1 434
6 items .76 .75
23 items .95 .96
40 items .98 .98
Nonsense Words K–1 501
5 items .74 .73
18 items .93 .95
31 items .96 .98
Sight Words (50) K–1 505
11 items .90 .91
29 items .97 .98
47 items .99 .99
Sight Words (150) 1 678
12 items .90 .91
53 items .99 .99
94 items .99 .99
Table 8. Internal Consistency for earlyReading Subtests of Fixed Test Length
Measure Grade N # of items Alpha Split-Half
Concepts of Print K 336 12 .75 .76
Onset Sounds K 597 16 .87 .91
Rhyming K 586 16 .94 .91

Section 6. FAST as Evidence-Based Practice
Page | 53www.fastbridge.org
© 2015 Theodore J. Christ and Colleagues, LLC. All rights reserved.
Word Blending K–1 480 10 .90 .91
Word Segmenting K–1 500 10 .95 .96

Section 6. FAST as Evidence-Based Practice
Page | 54www.fastbridge.org
© 2015 Theodore J. Christ and Colleagues, LLC. All rights reserved.
Test-Retest ReliabilityIn fall 2012, data were collected to determine test-retest reliability for all earlyReading screeningmeasures. Participants included 85 Kindergarten and 71 First Grade students from two elementaryschools in a metropolitan area in the Midwest. Kindergarten students who participated in the studywere enrolled in all-day Kindergarten at two elementary schools within the same school district.
Table 9. Descriptive Information for earlyReading Test-Retest Reliability Sample
Grade Measure N Min Max SD Mean Max Possible
Time 1 (Note. Time 1 is based on fall screening data)
K Concepts of Print 39 3 12 1.96 9.46 12
K Onset Sounds 39 2 16 2.94 13.74 16
K Letter Naming 39 2 52 15.91 32.23 52/min
K Letter Sound 39 0 50 13.36 19.62 38/minK Rhyming 39 0 16 4.60 11.77 16
K Word Blending 39 0 10 3.81 3.92 10
Time 2 (~3 weeks later)
K Concepts of Print 40 5 12 2.07 9.7 12
K Onset Sounds 40 5 16 2.35 14.15 16
K Letter Naming 40 2 52 15.73 31.70 52/min
K Letter Sound 40 1 39 11.23 19.43 38/minK Rhyming 40 4 16 3.74 12.18 16
K Word Blending 34 0 9 3.13 3.71 10
Time 1 (Note. Time 1 is based on fall screening data)
1st Word Blending 37 0 10 7.19 2.94 10
1st Word Segmenting 37 4 34 55.81 7.50 32
1st Decodable Words 37 0 49 12.82 14.10 50/min
1st Nonsense Words 37 1 34 10.65 8.39 50/min1st Sight Words (150) 37 1 91 35.35 24.21 150/min
1st Sentence Reading 37 1 181 42.68 38.60
1st Composite 33 79 128 11.99 104.5
Time 2 (~3 weeks later)
1st Word Blending 37 0 10 11.00 14.75 10
1st Word Segmenting 37 14 34 27.57 5.28 32
1st Decodable Words 37 0 50 17.22 13.95 50/min1st Nonsense Words 37 0 50 17.97 12.53 50/min
1st Sight Words (150) 37 0 109 46.41 29.48 150/min
1st Sentence Reading 37 0 220 55.81 50.13
1st Composite 33 80 138 13.58 110.03
All First Grade students who participated in the study were from a single school. The majority ofstudents within the school district were White (78%), with the remaining students identified as eitherBlack (19%), or other (3%). Forty to fifty percent of students at each school were on free and reducedlunch. For details regarding the demographic sample for this data collection, see Table 9. Coefficients

Section 6. FAST as Evidence-Based Practice
Page | 55www.fastbridge.org
© 2015 Theodore J. Christ and Colleagues, LLC. All rights reserved.
in Table 10 with larger sample sizes (i.e., larger than the above specified sample) were derived from aconvenience sample from the FAST™ database. This sample was approximately 85% White.
Teachers randomly selected three to five students and sent home passive consent forms. The firstadministration of earlyReading measures were given by classroom teachers during a two-weekscreening period. All teachers attended a two-hour training session on earlyReading measures andwere observed by the lead teacher at each school for a percentage of the time to confirmadministration integrity. The second administration of the earlyReading measures were given by ateam of school psychology graduate students. All graduate students also attended a two-hourtraining session related to earlyReading administration. This second administration took place two tothree weeks after the termination of the initial screening period. Due to ongoing data collections, test-retest reliability evidence has been provided for additional time intervals: fall (F) to winter (W), winterto spring (S), and fall (F) to spring (S). Sample sizes vary by time interval. Test-retest reliabilitis arereported in Table 10.
Table 10. Test-Retest Reliability for all earlyReading Screening Measures
Measure Grade
Test-Retest Coefficient (N)
2-3 Weeks F to W W to S F to S
Concepts of Print K .42 (39) .66 (89) .58 (90) .51 (168)
Onset Sounds K .79 (67) .75 (89) .67 (90) .58 (167)
Letter Names K .94* (45) .65 (1781) .55 (951) .45 (1141)
Letter Sounds K .92 (75) .51 (1241) .61 (1282) .35 (1600)
Rhyming K .74 (39) .68 (917) .62 (946) .46 (1130)
Word Blending K .73 (70) .59 (832) .59 (856) .34 (1069)
Word Segmenting K .86 (37) -- .61 (834) --
Decodable Words K .98 (29) .70 (56) .68 (168) --
Nonsense Words K .94 (27) .70 (119) .74 (321) --
Sight Words (50) K .97 (34) -- .73 (169) --
Composite K -- .91 (191) .68 (185) .71 (220)
Word Blending 1 .77 (67) .61 (592) .78 (579) .54 (568)
Word Segmenting 1 .83 (77) .52 (589) .70 (582) .48 (573)
Decodable Words 1 .97 (73) .80 (2152) .84 (604) .69 (1194)
Nonsense Words 1 .76 (64) .78 (1977) .82 (439) .65 (1046)
Sight Words (150) 1 .94 (74) .84 (913) .82 (432) .60 (1137)
Sentence Reading 1 .98 (37) Pending Pending Pending
Composite 1 .97 (33) .90 (153) .92 (104) .88 (118)
Note. Sample size provided in parentheses. F = Fall. S = Spring. W = Winter.*Outliers that were +/- 2 standard deviations from the mean were removed from the test-retest reliability sample.In this case 2 cases, making up 3% of the sample, were removed.

Section 6. FAST as Evidence-Based Practice
Page | 56www.fastbridge.org
© 2015 Theodore J. Christ and Colleagues, LLC. All rights reserved.
Table 11. Disaggregated Test Re-Test Reliability for earlyReading Measures
Measure Grade
Test-Retest Coefficient (N)
Ethnicity 2-3 Weeks F to W W to S F to S
Letter Names Black K -- .69 (293) -- .57 (274)
Letter Names Hispanic K -- .61 (194) -- .44 (179)
Letter Names White K -- .61 (1129) -- .40 (1293)
Letter Sounds Black K -- .53 (409) -- .45 (408)
Letter Sounds Hispanic K -- .46 (270) -- .29 (292)
Letter Sounds White K -- .50 (1410) -- .31 (1687)
Nonsense Words Black K -- .52 (23) -- .28 (38)
Nonsense Words Hispanic K -- .73 (91) -- .54 (102)
Onset Sounds Black K -- .53 (424) -- --
Onset Sounds Hispanic K -- .51 (274) -- --
Onset Sounds White K -- .49 (1418) -- --
Word Segmenting Black K -- .61 (49) -- .32 (52)
Word Segmenting Hispanic K -- .54 (15) -- .28 (20)
Word Segmenting White K -- .61 (163) -- .24 (230)
Word Blending Black K -- .56 (219) -- .34 (222)
Word Blending Hispanic K -- .48 (129) -- .30 (134)
Word Blending White K -- .56 (533) -- .33 (778)
Nonsense Words Black 1 -- .74 (337) -- .60 (179)
Nonsense Words Hispanic 1 -- .74 (225) -- .66 (121)
Nonsense Words White 1 -- .78 (1156) -- .63 (624)
Decodable Words Black 1 -- .80 (375) -- .73 (206)
Decodable Words Hispanic 1 -- .75 (260) -- .63 (138)
Decodable Words White 1 -- .79 (1220) -- .67 (707)
Sight Words (150) Black 1 -- .84 (172) -- .62 (194)
Sight Words (150) Hispanic 1 -- .73 (123) -- .52 (133)
Sight Words (150) White 1 -- .87 (501) -- .59 (674)
Word Segmenting Black 1 -- .60 (171) -- .53 (205)
Word Segmenting Hispanic 1 -- .57 (128) -- .52 (142)
Word Segmenting White 1 -- .48 (447) -- .46 (692)
Word Blending Black 1 -- .66 (172) -- .51 (205)
Word Blending Hispanic 1 -- .58 (130) -- .50 (142)
Word Blending White 1 -- .48 (452) -- .36 (705)
Inter-Rater ReliabilityearlyReading measures involve a small degree of subjectivity, given clear scoring guidelines andsoftware-assisted scoring mechanisms. Unreliable scoring in regards to earlyReading may be the result

Section 6. FAST as Evidence-Based Practice
Page | 57www.fastbridge.org
© 2015 Theodore J. Christ and Colleagues, LLC. All rights reserved.
of clerical errors or differences in the interpretation of a student’s response. To alleviate such error,examples and detailed responses are provided in the earlyReading Screening AdministrationTechnical Manual.
Evidence of inter-rater reliability is provided in Table 12. All coefficients represent Pearson product-moment correlation coefficients (Pearson r). For demographic information on the sample from whichinter-rater reliability coefficients were derived, see Table 5.
Table 12. Inter-Rater Reliability by earlyReading SubtestSubtest Grade Correlation Coefficient N
Onset Sounds K .98 40Letter Sounds K .99 47
Letter Names K .99 69
Word Blending K .98 95
Word Segmenting K .85 90
Sight Words (50) K .99 9
Word Blending 1 .89 159Word Segmenting 1 .83 85
Decodable Words 1 .99 120
Sight Words (150) 1 .97 125
Nonsense Words 1 .99 51
Reliability of the SlopeData collected during a normative information-aimed study was used to determine reliability of theslope for earlyReading measures. Participants included Kindergarten and First Grade students fromvarious elementary schools. Students were administered one or more earlyReading measures at threetime points throughout the school year (see below)
Table 13. Demographic Information for earlyReading Reliability of the Slope SampleCategory Kindergarten (N) 1st Grade (N)
Female 2086 1604
Male 2196 1555
White 2710 2114
Black 688 429
Hispanic 439 288
Asian/Pacific Islander 322 252
Other 123 77
General Education 2656 1727
Special Education 1345 1296
Unspecified 1626 1433
Reliability of the slope was calculated for earlyReading screening and progress monitoring data. Thisdata is shown in Table 14. Reliability of the slope data has also been disaggregated by ethnicity.Disaggregated information is also provided (See Table 15).

Section 6. FAST as Evidence-Based Practice
Page | 58www.fastbridge.org
© 2015 Theodore J. Christ and Colleagues, LLC. All rights reserved.
Table 14. Reliability of the Slope for All earlyReading Screening MeasuresSubtest Grade N Coefficient
Onset Sounds K 2129 .91
Letter Names K 1627 .81Letter Sounds K 2229 .88
Rhyming K 904 .38
Word Blending K 958 .73
Word Blending 1 824 .77
Word Segmenting K 235 .60Word Segmenting 1 824 .78
Decodable Words K 52 .59
Decodable Words 1 918 .86
Sight Words (50) K 167 .22
Sight Words (150) 1 624 .77
Nonsense Words K 116 .75Nonsense Words 1 664 .87
Note. All of the above information is based on three time points: fall, winter, and spring data.

Section 6. FAST as Evidence-Based Practice
Page | 59www.fastbridge.org
© 2015 Theodore J. Christ and Colleagues, LLC. All rights reserved.
Table 15. Reliability of the Slope for earlyReading measures, Disaggregated by EthnicitySubtest Grade N Coefficient Ethnicity
Onset Sounds K 342 .90 Black
253 .89 Hispanic1253 .92 White
Letter Sounds K 366 .93 Black
247 .86 Hispanic
1332 .89 White
Letter Names K 256 .80 Black
177 .76 Hispanic
1049 .83 White
Nonsense Words K 22 .70 Black89 .81 White
Word Blending K 206 .77 Black
125 .57 Hispanic
515 .74 White
Word Blending 1 156 .93 Black
123 .74 Hispanic
420 .77 White
Word Segmenting K 156 .78 Black122 .77 Hispanic
418 .73 White
Word Segmenting 1 48 .60 Black
15 .36 Hispanic
157 .65 White
Nonsense Words 1 153 .93 Black
92 .89 Hispanic328 .85 White
Decodable Words 1 199 .88 Black
136 .91 Hispanic
449 .83 White
Sight Words (150) 1 130 .71 Black
103 .85 Hispanic
303 .79 White
Note. All of the above information is based on three time points: fall, winter, and spring data.
CBMreadingThe CBMreading passages in FAST™ have been systematically developed and field tested over anumber of years to address the problems with pre-existing passage sets that introduced error intomeasurement of student reading rate during screening and progress monitoring. The goal in creatingthe CBMreading measures was to systematically develop, evaluate, and finalize research-basedinstrumentation and procedures for reliable assessment and evaluation of reading rate. Christ andArdoin (2009) described their initial method for FAIP-R field testing and passage-set development,which was designed to minimize variance due to instrumentation/passages and optimize progress

Section 6. FAST as Evidence-Based Practice
Page | 60www.fastbridge.org
© 2015 Theodore J. Christ and Colleagues, LLC. All rights reserved.
monitoring reliability/precision. In a follow-up study, Ardoin and Christ (2009) directly comparedFAIP-R passages to DIBELS and AIMSweb passage sets in a peer-refereed publication. In the onlypublished study of its kind, they concluded that FAIP-R passages yielded less error and more preciseestimates than either AIMSweb or DIBELS—with the most substantial improvements over the DIBELSsystem. Progress monitoring requires a set of equivalent reading passages, a schedule, graphingprocedures, and trend line or data-point decision rules due to the increased frequency of CBM-Radministration. The materials and decision rules guiding material use, selection, and schedule ofadministration in CBMreading have all been developed with these core elements in mind.
The CBMreading passages in FAST™ were initially developed and field tested with 500 students perlevel. All passages were designed with detailed specifications and in consultation with educators andcontent experts. The researchers analyzed data from three rounds of field testing and edited passagesto optimize the semantic, syntactic, and cultural elements. Evidence of test-retest reliability andreliability of the slope was derived from the same sample of participants.
Alternate Form Reliability
First Passage Reduction
Alternate forms of FAIP-R oral reading passages were administered in order to identify the best set ofpassages to use when measuring oral reading rate with students at differing levels of ability in firstthrough Fifth Grades. Three passage sets of different difficulty level were constructed.
Student participants were from urban and suburban schools located in the Southeast, the upperMidwest, and Northeastern regions of the US. A passive-consent procedure was used so that studentswhose parents opted out of participation were excluded from the sample. The sample consisted of177 participants from Kindergarten through Fifth Grades. Fifteen students were sampled fromKindergarten and First Grades in the upper Midwest site. Across all three sites, 40 students wereselected from second and Third Grade classrooms (n=80) and 40 students were selected from fourthand Fifth Grade classrooms (n=80; two extra participants were seen at the Northeastern site).Information about participant characteristics in the overall and disaggregated sample is provided inTable 16.

Section 6. FAST as Evidence-Based Practice
Page | 61www.fastbridge.org
© 2015 Theodore J. Christ and Colleagues, LLC. All rights reserved.
Table 16. Demographic Information for CBMreading First Passage Reduction Sample
GradeSex
AgeRace
SESaSpecial
EducationF M A B H Am W
Overall
K 3 2 6 years 5 months 0 1 0 0 4 0 0
1 3 7 7 years 2 months 0 1 0 0 9 1 0
2 15 21 7 years 11 months 1 7 3 1 28 14 03 15 27 8 years 10 months 1 3 1 0 37 14 0
4 21 21 10 years 2 months 2 7 0 0 33 12 1
5 14 26 10 years 10 months 3 4 1 1 31 10 1
Southeast
2 10 3 8 years 1 month 0 2 0 0 11 1 0
3 6 11 8 years 11 months 0 0 0 0 17 0 0
4 8 9 10 years 10 months 0 2 0 0 15 0 05 4 11 11 years 1 month 0 2 0 0 13 0 0
Upper Midwest
K 3 2 6 years 5 months 0 1 0 0 4 0 0
1 3 7 7 years 2 months 0 1 0 0 9 1 0
2 7 8 8 years 4 months 1 0 1 0 13 1 0
3 5 10 9 years 3 months 0 1 0 0 14 4 0
4 8 7 10 years 1 month 2 3 0 0 10 2 05 4 11 11 years 0 months 0 2 1 0 12 0 1 (not specified)
Northeast
2 2 10 7 years 5 months 0 5 2 1 4 12 0
3 4 6 8 years 4 months 1 2 1 0 6 10 0
4 5 5 9 years 7 months 0 2 0 0 8 10 1 (speech)
5 6 4 10 years 6 months 3 0 0 1 6 10 0
Note: A=Asian, B= Black, H= Hispanic, Am= American Indian, W= White.aSES indicates the number of students receiving free and reduced price lunch.
Experimenters worked individually with students in separate, quiet areas within the schools at eachsite. At the beginning of each session the experimenter provided a general introduction from aprepared set of directions. Students were assigned to particular levels of passages based on gradelevel. Students in Kindergarten and First Grades read passages in Level A. Students in second andThird Grades read passages in Level B and Fourth and Fifth Graders read passages in Level C. Passageorder was random within student; each student read all passages to facilitate analysis of passagespecific performances and prepare for equating and linking of passages within and across levels.
Students in Kindergarten through Fifth Grades were seen for approximately 10 successive days oftesting. On each day of testing, students in second through Fifth Grades read 12 different passagesand students in Kindergarten and First Grades read six passages each day. This resulted in students atLevel A reading 63 total passages, and students at Levels B and C reading 120 total passages (i.e., threelinking passages plus the number of progress monitoring passages for each level).

Section 6. FAST as Evidence-Based Practice
Page | 62www.fastbridge.org
© 2015 Theodore J. Christ and Colleagues, LLC. All rights reserved.
For each passage read, an appropriate paper version was placed in front of the student so s/he couldread aloud. The experimenter gave directions and then followed along and scored errors on his or herpaper or electronic copy for one minute. Each session lasted approximately 20 minutes. See Table 17for descriptive statistics for the first passage reduction sample.
Table 17. Descriptive Statistics for First Passage ReductionM SD Median Trimmed Min Max Skew Kurtosis SE
Level A Passages
All 60 66.63 33.08 57.30 64.89 23.88 132.0 0.51 -0.97 8.54
Reduced 40 65.47 30.97 57.83 63.88 24.83 126.8 0.50 -0.96 8.0
Level B Passages
All 117 117.76 42.40 117.80 117.36 23.88 219.47 0.07 -0.26 5.43
Reduced 80 114.92 43.90 116.20 114.92 10.00 225.0 -0.01 -0.07 5.0
Level C Passages
All 117 153.59 40.19 151.09 152.84 69.42 251.74 0.21 -0.34 5.37
Reduced 80 151.55 40.33 146.84 149.70 70.00 251.0 0.40 -0.29 4.79
Note. M = Mean; SD = Standard Deviation; Min = Minimum; Max = Maximum; SE = Standard Error
Second Passage Reduction
Screening. Screening took place at the beginning of the year. Due to time constraints, only oneof the three screening passages were used to collect alternate form reliability coefficients.Experimenters worked individually with students in separate, quiet areas within the schools ateach site. At the beginning of each session, the experimenters provided an introductiondialogue from a standardized set of directions. Each student was assessed during a singlesession. The appropriate paper version of the screening story was placed in front of the studentso that s/he could read aloud. After instructions were delivered, the examiner followed alongand scored errors on his or her copy for one minute. Each student session lasted approximatelythree to five minutes. Participants included students from urban and suburban schools locatedin the Southeast, the upper Midwest, and Northeastern regions of the United States. A passiveconsent procedure was used so that those students whose parents opted out of participationwere excluded from the sample. The sample consisted of 1,250 students from first through FifthGrades. Participant characteristics in the overall and disaggregated sample are provided in
Table 18.
Table 18. Demographic Information for Second Passage Reduction Sample
Grade
Level
SexAge
RaceSESa
Special
EducationF M A B H Am W
Overall
K 5 5 5 years 11 months N/A*
1 159 157 6 years 9 months 10 51 49 3 203 21 14
2 154 164 7 years 9 months 9 41 44 3 221 23 13

Section 6. FAST as Evidence-Based Practice
Page | 63www.fastbridge.org
© 2015 Theodore J. Christ and Colleagues, LLC. All rights reserved.
3 78 118 8 years 7 months 3 40 43 2 108 33 14
4 80 107 9 years 8 months 5 21 47 1 113 18 20
5 80 83 10 years 6 months 7 33 36 2 85 23 15
Southeast**
K 5 5 5 years 11 months N/A*1 67 83 6 years 11 months 2 9 16 0 116 N/A 7
2 67 84 7 years 10 months 3 8 16 0 120 N/A 10
3 18 30 8 years 10 months 0 3 5 0 40 N/A 4
4 19 12 9 years 11 months 1 1 2 1 26 N/A 2
5 10 16 11 years 2 months 1 0 4 0 21 N/A 4
Upper Midwest
1 58 56 6 years 10 months 3 14 28 0 69 9 172 57 58 7 years 8 months 6 16 28 2 63 16 14
3 44 54 8 years 9 months 3 13 33 2 47 23 30
4 38 69 9 years 10 months 3 8 40 1 55 6 25
5 41 48 10 years 5 months 4 13 30 2 40 17 21
Northeast
1 34 18 6 years 6 months 5 21 5 0 21 12 7
2 30 22 7 years 1 month 0 15 0 0 37 7 33 16 34 8 years 2 months 0 24 5 0 21 10 10
4 23 26 9 years 6 months 1 12 5 0 31 12 18
5 29 19 10 years 6 months 2 20 2 0 24 6 11
Note: A=Asian, B= Black, H= Hispanic, Am= American Indian, W= White.aSES indicates the number of students receiving free or reduced price lunch.*Not all schools were able to provide complete information about Race, SES, or Special Education.**About 5% of the southeast demographics were not available and are not included in this table.
Leveling/Anchor Process. On the first day of testing, three passages were sequentially administered tothe student at the beginning of the testing session. The experimenter immediately determined themedian score from these passages and compared it against the criterion points (established duringscreening) to determine which level of progress monitoring passages to administer. Table 19 providesthe cut points used to assign students to passage difficulty level (i.e. Level A, B or C). Althoughstudents were selected across grade level, student reading levels were restricted for each passagelevel. Experimenters worked individually with students in separate, quiet areas within the schools ateach site.
Table 19. Cut-points Used for Assigning Students to CBMreading Passage Level Based on WordsRead Correct per Minute (WRC/min)
Level Cut Point (WRC/min)
A 0 (5) to 20 (25)
B 26 to 70C 71 to 140

Section 6. FAST as Evidence-Based Practice
Page | 64www.fastbridge.org
© 2015 Theodore J. Christ and Colleagues, LLC. All rights reserved.
Process for Administering Progress Monitoring Passages. All students read all passages to facilitateanalysis of passage-specific performances and prepare for equating and linking of passages withinand across levels respectively. Experimenters worked individually with students in separate, quietareas within the schools. Students completed approximately eight successive assessment sessions.
On the first day of testing, after the child had been leveled according to the anchor passages, theexperimenter also administered four to nine progress monitoring passages at the student’sappropriate level. All other days of testing were used to complete administration of the progressmonitoring set at the appropriate level. This resulted in students at Level A reading a total of 42passages, and students at Levels B and C reading a total of 83 passages. All progress monitoringpassages were administered randomly to each student. For each passage read, an appropriate paperversion was placed in front of the student so that he or she could read aloud. The experimenter gavedirections and then followed along and scored errors on the electronic or paper copy for one minute.Each session lasted approximately 15–20 minutes. See Table 20 for Descriptive Statistics.
Table 20. Descriptive Statistics for Second CBMreading Passage Reduction SamplePassages Mean SD Median Trimmed Min Max Skew Kurtosis SE
Level A
Reduced 39 20.38 10.46 18.33 19.39 4.54 56.18 0.94 0.87 1.04
Reduced 30 19.54 9.96 17.55 18.60 4.40 55.30 0.99 1.16 0.99
Level B
Reduced 80 52.20 16.40 52.19 51.92 15.96 102.65 0.20 -0.18 1.13
Reduced 60 51.24 15.83 50.90 50.93 16.00 101.00 0.24 -0.06 1.09
Reduced 30 52.33 15.34 52.08 52.13 17.00 99.50 0.17 -0.20 1.06
Level C
Reduced 80 103.04 26.09 103.05 102.65 42.24 195.83 0.20 -0.21 1.32
Reduced 60 102.96 25.25 102.95 102.54 43.87 194.53 0.21 -0.15 1.28
Reduced 30 104.68 24.41 104.70 104.29 46.80 195.37 0.22 -0.10 1.24
Table 21 summarizes information accumulated across several studies. Data was collected from threestates: Minnesota, New York, and Georgia. The information represents evidence for alternate formreliability of CBMreading, and overall reliability of the performance level score.
Table 21. Alternate Form Reliability and SEm for CBMreading (Restriction of Range)Coefficienta
Grade and Passage# ofpassages
# ofWeeks
Range Median SEm
Passage Level A (Grade 1)
Grade 1 (206)
Grade 2 (21)
Grade 3 (4)Total N 231
39 < 2 .62 - .86 .74 5.40

Section 6. FAST as Evidence-Based Practice
Page | 65www.fastbridge.org
© 2015 Theodore J. Christ and Colleagues, LLC. All rights reserved.
Passage Level B (Grades 2–3)
Grade 1 (138)
Grade 2 (179)
Grade 3 (126)Grade 4 (32)
Grade 5 (13)Total N 488
60 < 2 .65 - .82 .75 8.54
Passage Level C (Grades 4–6)
Grade 1 (3)
Grade 2 (135)
Grade 3 (79)
Grade 4 (156)Grade 5 (140)Total N 513
60 < 2 .78 - .88 .83 10.41
Passage Level A (Grade 1)
Grade (206)
Grade (21)
Grade 3 (4)Total N 231
39 < 2 .89 - .94 .92 3.03
Passage Level B (Grades 2–3)
Grade 1 (138)Grade 2 (179)
Grade 3 (126)
Grade 4 (32)
Grade 5 (13)Total N 488
60 <2 .87 - .92 .90 4.97
Passage Level C (Grades 4–6)
Grade 1 (3)Grade 2 (135)
Grade 3 (79)
Grade 4 (156)
Grade 5 (140)Total N 513
60 < 2 .92 - .95 .94 7.06
Note: Alternate-Form Correlation – Individual Passages (Average Fisher z-transformed Inter-Passage Correlations). Samplesizes by grade level are provided in parentheses. *Coefficients are reduced due to restriction of range. SEm estimates areequivalent to published research (viz. Christ & Silberglitt, 2007; Wayman et al., 2007).
Internal Consistency (Item-Total Correlation)Data collection for internal consistency is ongoing. Evidence of CBMreading internal consistencyacross passages is provided in the table below. Similar to alternate-form reliability, information wasgathered across three states: Minnesota, New York, and Georgia. Table 22 provides evidence of thereliability of the performance level score.

Section 6. FAST as Evidence-Based Practice
Page | 66www.fastbridge.org
© 2015 Theodore J. Christ and Colleagues, LLC. All rights reserved.
Table 22. Internal Consistency for CBMreading Passages
Passage and Grade
# of # of
Weeks
Coefficient
Passages Range Median
Passage Level A (Designed for Grade 1)
Grade 1(206)Grade 2 (21)
Grade 3 (4)
Total N 231
60 < 2 .91 - .92 .92
Passage Level B (Designed for Grades 2 & 3)
Grade 1 (138)
Grade 2 (179)Grade 3 (126)
Grade 4 (32)
Grade 5 (13)
Total N 488
60 < 2 .89 - .91 .90
Passage Level C (Designed for Grades 4-6)
Grade 1 (3)Grade 2 (135)
Grade 3 (79)
Grade 4 (156)
Grade 5 (140)
Total N 513
60 < 2 .88 - .93 .91
Note. Sample sizes by grade level are provided in parentheses.a Coefficients are reduced due to restriction of range. Participants were selected from a very narrow (low) ability range toevaluate reliability with the intended population. SEm estimates are equivalent to those observed in published research (viz.Christ & Silberglitt, 2007; Wayman et al., 2007).
See Table 23 below for evidence of split-half reliability for CBMreading passages.
Table 23. Split-Half Reliability for CBMreading passagesGrade N Range Median
Grades 1st 500 .90 to .98 > .95
Grades 2 & 3 500 .90 to .98 > .95
Grades 4 to 6 500 .90 to .98 > .95
Test-Retest Reliability (Delayed)Table 24 provides evidence of the reliability of the performance level score. Data was gathered acrossthree states: Minnesota, New York, and Georgia. The reliability range coefficients have been computedwith a 95% confidence interval. In addition, for the time lag, the mean number of weeks between datacollections is reported.

Section 6. FAST as Evidence-Based Practice
Page | 67www.fastbridge.org
© 2015 Theodore J. Christ and Colleagues, LLC. All rights reserved.
Table 24. Evidence for Delayed Test-Retest Reliability of CBMreading
Grade
# Weeks Lag Coefficient
N Time Period Mean SD Range Median
1 428 Fall to Winter 18.68 3.03 .88 - .92 .90
2 414 Fall to Winter 18.56 2.44 .91 - .94 .933 435 Fall to Winter 18.98 2.50 .92 - .94 .93
4 475 Fall to Winter 19.00 2.32 .93 - .95 .94
5 481 Fall to Winter 19.00 2.51 .92 - .94 .93
6 220 Fall to Winter 17.45 0.86 .92 - .95 .94
1 408 Fall to Spring 35.57 2.02 .79 - .85 .82
2 386 Fall to Spring 35.93 1.61 .87 - .91 .903 403 Fall to Spring 35.79 1.47 .89 - .93 .91
4 406 Fall to Spring 35.67 1.41 .91 - .94 .93
5 411 Fall to Spring 35.67 1.41 .92 - .94 .93
6 218 Fall to Spring 35.01 0.96 .90 - .94 .92
Note. SD = Standard Deviation.
Table 25 provides evidence of delayed test-retest reliability, disaggregated by ethnicity. The sampleincluded students from urban, suburban, and rural areas in Minnesota.

Section 6. FAST as Evidence-Based Practice
Page | 68www.fastbridge.org
© 2015 Theodore J. Christ and Colleagues, LLC. All rights reserved.
Table 25. CBMreading Delayed Test-Retest Reliability Disaggregated by Ethnicity
Grade
# Weeks Lag Coefficient
N Time Period Range Median Ethnicity
2 1518 Fall to Winter 14 .91 - .92 .91 White
2 369 Fall to Winter 14 .90 - .94 .92 Black2 210 Fall to Winter 14 .92 - .95 .94 Asian
2 308 Fall to Winter 14 .91 - .94 .93 Hispanic
3 1439 Fall to Winter 14 .91 - .92 .92 White
3 442 Fall to Winter 14 .90 - .93 .91 Black
3 197 Fall to Winter 14 .87 - .92 .90 Asian3 314 Fall to Winter 14 .91 - .94 .93 Hispanic
4 1384 Fall to Winter 14 .88 - .91 .90 White
4 353 Fall to Winter 14 .89 - .92 .91 Black
4 204 Fall to Winter 14 .89 - .94 .92 Asian
4 268 Fall to Winter 14 .87 - .92 .90 Hispanic5 1309 Fall to Winter 14 .91 - .93 .92 White
5 378 Fall to Winter 14 .91 - .94 .93 Black
5 205 Fall to Winter 14 .89 - .93 .91 Asian
5 247 Fall to Winter 14 .91 - .95 .93 Hispanic
2 1518 Fall to Spring 31 .83 - .86 .85 White
2 369 Fall to Spring 31 .75 - .83 .79 Black
2 210 Fall to Spring 31 .81 - .88 .85 Asian2 308 Fall to Spring 31 .76 - .84 .80 Hispanic
3 1439 Fall to Spring 31 .88 - .90 .89 White
3 442 Fall to Spring 31 .82 - .87 .85 Black
3 197 Fall to Spring 31 .80 - .88 .84 Asian
3 314 Fall to Spring 31 .80 - .87 .84 Hispanic4 1384 Fall to Spring 31 .85 - .88 .87 White
4 353 Fall to Spring 31 .82 - .88 .85 Black
4 204 Fall to Spring 31 .80 -.88 .85 Asian
4 268 Fall to Spring 31 .81 - .88 .85 Hispanic
5 1309 Fall to Spring 31 .87 - .90 .88 White5 378 Fall to Spring 31 .77 - .84 .81 Black
5 205 Fall to Spring 31 .83 - .89 .86 Asian
5 247 Fall to Spring 31 .84 - .90 .87 Hispanic
Inter-Rater ReliabilityInter-rater reliability evidence was collected across three states: Minnesota, New York, and Georgia.See Table 26.

Section 6. FAST as Evidence-Based Practice
Page | 69www.fastbridge.org
© 2015 Theodore J. Christ and Colleagues, LLC. All rights reserved.
Table 26. Evidence of Inter-Rater Reliability for CBMreading
Passage
Coefficient
Sample Size Range Median
Passage Level A 146 .83 – 1.00 .97
Passage Level B 1391 .93 - 97 .97
Passage Level C 1345 .83 – 1.00 .98
Reliability of the SlopeSome may argue that alternate-form reliabilities may not accurately capture reliability of the slope dueto the small amount of variation in slope values, represented by low standard error of the estimateand standard error of the slope values. This might be a result of the structure of passageadministration (Levels vs. Grades). By using passage levels as groups instead of grades, we may bereducing variability within grades, decreasing the reliability of slope estimates. The following analysiswas conducted using HLM 7 software and used random slopes and random intercepts (See Table 27).
Table 27. Reliability of the Slope for CBMreading
Sample Size by Passage Weeks Observations
Coefficient
Range Median
Passage Level A
N=34 ~ 27 - 30 ~25-30 NA .95
N=39 ~ 7 -10 ~7-10 NA .78
Passage Level B
N=53 ~ 27 - 30 ~25-30 NA .98
~ 7 -10 ~7-10 NA .97
Passage Level C
~ 27 - 30 ~25-30 NA .98
~ 7 -10 ~7-10 NA .97
Table 28 provides a summary for reliability of the slope by grade (passage) level. Reliability of theslope for multi-level analyses may be biased when standard error of the estimate and standard error ofthe slope is minimal. CBMreading growth estimates are less prone to error than comparable progressmonitoring materials. As a result, increased precision (less error) is paradoxically detrimental to multi-level reliability estimates (Raudenbush & Bryk, 2002). In such circumstances, the spearman browncorrelation is more appropriate. The following information includes participants across three states:Minnesota, New York, and Georgia.

Section 6. FAST as Evidence-Based Practice
Page | 70www.fastbridge.org
© 2015 Theodore J. Christ and Colleagues, LLC. All rights reserved.
Table 28. Reliability of the Slope of CBMreading by Passage using Spearman-Brown Split HalfCorrelation
Passage Level Weeks (range) Coefficient SEmPassage Level A
Grade 1 (68)
Grade 2 (12)
Grade 3 (2)Total N = 82
Short Term
10
.71 .40
Passage Level B
Grade 1 (7)Grade 2 (72)
Grade 3 (53)
Grade 4 (12)
Grade 5 (6)
Grade 6 (1)Total N = 151
Short Term
10 - 20
.74 .31
Passage Level C
Grade 2 (3)Grade 3 (31)
Grade 4 (81)
Grade 5 (68)
Grade 6 (28)Total N = 211
Short Term
6 - 20
.65 .30
Passage Level A
Grade 1 (42)Grade 2 (15)
Grade 3 (4)Total N = 61
Long Term
14 - 30
.95 .21
Passage Level B
Grade 1 (6)
Grade 2 (41)
Grade 3 (38)Grade 4 (15)
Grade 5 (8)
Grade 6 (1)Total N = 109
Long Term
14 - 30
.70 .31
Passage Level C
Grade 2 (2)
Grade 3 (19)
Grade 4 (49)Grade 5 (44)
Grade 6 (23)Total N = 137
Long Term
18 - 30
.66 .32
Note. Sample sizes by grade level are provided in parentheses. SEm = |Even – Odd| / sqrt(2)

Section 6. FAST as Evidence-Based Practice
Page | 71www.fastbridge.org
© 2015 Theodore J. Christ and Colleagues, LLC. All rights reserved.
Table 29 provides reliability of the slope evidence derived from multi-level analyses, strictly using trueslope variance divided by total slope variance. The following information includes participants acrossthree states: Minnesota, New York, and Georgia.
Table 29. Reliability of the Slope for CBMreading by Passage Using Multi-Level AnalysesPassage Level Weeks (range) Coefficient
Passage Level AGrade 1 (68)Grade 2 (12)Grade 3 (2)
Total N = 82
Short Term10
.75
Passage Level BGrade 1 (7)Grade 2 (72)Grade 3 (53)Grade 4 (12)Grade 5 (6)Grade 6 (1)
Total N = 151
Short Term
10–20
.74
Passage Level CGrade 2 (3)Grade 3 (31)Grade 4 (81)Grade 5 (68)Grade 6 (28)
Total N = 211
Short Term
6–20
.63
Passage Level AGrade 1 (42)Grade 2 (15)Grade 3 (4)
Total N = 61
Long Term
14–30
.94
Passage Level BGrade 1 (6)Grade 2 (41)Grade 3 (38)Grade 4 (15)Grade 5 (8)Grade 6 (1)
Total N = 109
Long Term
14–30
.86
Passage Level CGrade 2 (2)Grade 3 (19)Grade 4 (49)Grade 5 (44)Grade 6 (23)
Total N = 137
Long Term
18–30
.45

Section 6. FAST as Evidence-Based Practice
Page | 72www.fastbridge.org
© 2015 Theodore J. Christ and Colleagues, LLC. All rights reserved.
Table 30 provides evidence of reliability of the slope disaggregated by ethnicity. Participants includedthose from Minnesota. Reliability of the slope for multi-level analyses may be biased when fewobservations are used to estimate slope. In this instance, slopes were estimated from tri-annualassessments (3 observations). Coefficients should be interpreted with caution (Raudenbush & Bryk,2002). The sample included students from urban, suburban, and rural areas of Minnesota.
Table 30. CBMreading Reliability of the Slope - Disaggregated Data
Grade N (range) Coefficient EthnicityRange Median
Grades 2–5 1308–1518 .25 - .43 .28 WhiteGrades 2–5 353–442 .32 - .60 .43 Black
Grades 2–5 197–210 .38 - .52 .40 Asian
Grades 2–5 247– 314 .21 - .52 .45 Hispanic
aReadingThe following sections provide a discussion of types of reliability obtained for aReading, as well assources of error. Data collection regarding reliability of the slope is ongoing.
Alternate-Form ReliabilityGiven the adaptive nature of aReading tests, a proxy for alternate-form reliability is provided bySamejima (1994), based on the standard error of measurement of an instrument. Using this proxy, thealternate-forms reliability coefficient for aReading is approximately .95 (based on approximately 2,333students).
Internal Consistency (Item-Total Correlations)Given the adaptive nature of aReading tests, a proxy for internal consistency is provided by Samejima(1994), based on the standard error of measurement of an instrument. Using this proxy, the internalconsistency reliability coefficient for aReading is approximately .95 (based on approximately 2,333students).
Test-Retest ReliabilityThree month test-retest reliability resulted in the following coefficients for 2,038 students in grades 1 -5 (Kindergarten and grades 6–12 results are coming soon). Growth was measured four times over theacademic year. The results by grade: one .71, two .87, three .81, four .86, five .75.
Chapter 2.6: Validation
earlyReadingEvidence for validity of the earlyReading subtest measures was examined using the Group ReadingAssessment and Diagnostic Evaluation (GRADE; Williams, 2001). The GRADE™ is a norm-referenceddiagnostic reading assessment that assists teachers in measuring pre-literacy, emerging reading andcore reading skills, as well as providing teachers with implications for instruction and intervention.

Section 6. FAST as Evidence-Based Practice
Page | 73www.fastbridge.org
© 2015 Theodore J. Christ and Colleagues, LLC. All rights reserved.
Content ValidityThe design specifications for earlyReading measures relate directly to their evidence of contentvalidity. Each subtest was designed with the intent to address specific criteria aimed to maximize bothutility and sensitivity.
earlyReading K 1stCommon Core
State StandardsState Specific
StandardsMeasures F W S F W S
Concepts of Print RF.K1, RF.K.1.a, RF.K.1.b, RF.K.1.c,RF.1.1, F.1.1.a
Letter Names RF.K.1.d
Letter Sounds RF.K.3.a
Decodable Words O O O O O R.F.K.3, RF.1.3, RF.1.3.b, RF.2.3,RF.3.3
Nonsense Words R.F.K.3, RF.1.3, RF.1.3.b, RF.2.3,RF.3.3
Sight Words (50)Sight Words (150)
RF.K.3.c, RF.1.3.g, R.2.3.f, RF.3.3.d Available uponrequest
Sentence Reading(CBM W, S)
RF.K.4, RF.1.4, RF.1.4.b, RF.2.4,RF.2.4.b, RF.3.4
Onset Sounds RF.K.2.c, RF.K.2.D, RF.1.2.c
Rhyming RF.K.2.a
Word Blending RF.K.2.b, RF.K.2.c, RF.1.2.b
Word Segmenting RF.K.2.b, RF.K.2.d, RF.1.2.c,RF.1.2.d
Oral Repetition SL.K.6, SL.1.6
Composite Broad Score – recommended screening tools and composition of broad composite scoreO – Optional measure to replace nonsense words
Criterion-Related ValidityCriterion-related validity of earlyReading subtests was examined using the GRADE™. The GRADE is anuntimed, group-administered, norm-referenced reading achievement test that is intended for childrenin preschool through grade 12. Comprised of 16 subtests categorized within five components, theGRADE utilizes particular subtest scores, depending on the testing level, to form the Total Testcomposite score. Evidence for the validity of earlyReading is presented below on the external criterionmeasure of the GRADE Total Test composite score. Validity is most often represented as a correlationbetween the assessment and the criterion. Both concurrent and predictive validity are reported for allearlyReading measures, where available (See Table 33).

Section 6. FAST as Evidence-Based Practice
Page | 74www.fastbridge.org
© 2015 Theodore J. Christ and Colleagues, LLC. All rights reserved.
In order to establish criterion-related validity, students were recruited from school districts. In SchoolDistrict 1, three elementary schools participated. Kindergarten students from District 1 whoparticipated in the study were enrolled in all-day or half-day Kindergarten. The majority of studentswithin the school district were White (78%), with the remaining students identified as either Black(19%), or other (3%). Forty to fifty percent of students at each school were eligible for free and reducedlunch. In school District 2, the majority of students within the school district were White (53%), withthe remaining students identified as Black (26%), Hispanic (11%), Asian (8%), or other (2%). Forty tofifty percent of students at each school are on free and reduced lunch.
Students in Kindergarten were administered FAST™ earlyReading Concepts of Print, Onset Sounds,Letter Naming, Letter Sound, Rhyming, Word Blending, Word Segmenting, Sight Words (50), NonsenseWords, and Decodable Words subtests. Students in First Grade were administered FAST™ earlyReadingWord Blending, Word Segmenting, Sight Words (150), Decodable Words, Nonsense Word, andSentence Reading subtests. Teachers administered six to nine measures at each screening period (fall,winter, and spring). See Table 31 for demographic information about the sample from whichearlyReading composite validity coefficients were derived, including predictive and concurrentvalidity. Sample-related information for criterion-related validity data is provided in
Table 32. Predictive and concurrent validity coefficients are reported in Table 33.
Table 31. Demographics for Criterion-Related Validity Sample for earlyReading CompositeScores
Category District A District B
White 78% 53%Black 19% 26%
Hispanic -- 11%
Asian/Pacific Islander -- 8%
Other 3% 2%
Free/Reduced Lunch 40-50%
Table 32. Sample-Related Information for Criterion-Related Validity Data (earlyReading)
Measure Fall Winter Spring
N Mean SD N Mean SD N Mean SD
KindergartenConcepts of Print 230 8.41 2.41 58 9.43 2.14 -- -- --
Onset Sounds 230 12.28 4.17 216 15.06 2.04 155 15.70 1.61
Letter Naming 230 28.57 15.60 210 39.51 13.35 230 54.80 18.40
Letter Sound 230 15.56 11.69 210 29.20 13.74 230 43.10 15.51
Rhyming 230 9.47 4.97 224 12.01 4.62 229 14.28 3.15
Word Blending 230 3.19 3.67 227 6.76 3.36 228 9.14 1.79
Word Segmenting 91 6.34 9.68 228 19.35 12.89 228 30.11 6.17
Decodable Words -- -- -- -- -- -- 228 16.04 15.15
Nonsense Words -- -- -- 2281 7.19 6.73 229 13.16 10.71

Section 6. FAST as Evidence-Based Practice
Page | 75www.fastbridge.org
© 2015 Theodore J. Christ and Colleagues, LLC. All rights reserved.
Sight Words 50 -- -- -- -- -- -- 227 44.29 29.38
Composite 173 40.78 9.91 173 49.41 13.74 173 59.79 14.37
First GradeWord Blending 179 7.42 2.41 169 8.80 2.14 172 9.30 1.38
Word Segmenting 179 26.84 4.17 168 30.10 2.04 172 30.91 4.40
Decodable Words 179 14.43 15.60 168 26.19 13.35 186 40.80 21.12
Nonsense Words 179 10.91 11.69 166 20.69 13.74 131 24.26 14.31
Sight Words 150 179 34.57 4.97 168 60.10 4.62 173 77.03 21.93
Sentence Reading 179 43.89 3.67 30 67.62 3.36 -- -- --
CBM-R
(median of 3)
-- -- -- 183 75.48 42.55 188 104.00 43.19
Composite 100 39.06 10.39 100 48.07 10.50 100 62.87 12.94
Note. 1Nonsense words in the winter used partially imputed values.

Section 6. FAST as Evidence-Based Practice
Page | 76www.fastbridge.org
© 2015 Theodore J. Christ and Colleagues, LLC. All rights reserved.
Table 33. Concurrent and Predictive Validity for all earlyReading Measures
Type of Validity Grade Criterion N Coefficient Information
Onset Sounds
Concurrent K GRADEP 85 .62 Data collected in Fall
Predictive K GRADEK 230 .55 Fall to Spring prediction
Predictive K GRADEK 216 .60 Winter to Spring prediction
Concurrent K GRADEK 140 .03 Data collected in Spring
Letter Names
Concurrent K GRADEP 85 .41 Data collected in Fall
Predictive K GRADEK 230 .47 Fall to Spring prediction
Predictive K GRADEK 210 .63 Winter to Spring prediction
Concurrent K GRADEK 214 .18 Data collected in Spring
Letter Sounds
Concurrent K GRADEP 85 .53 Data collected in Fall
Predictive K GRADEK 230 .44 Fall to Spring prediction
Predictive K GRADEK 210 .63 Winter to Spring prediction
Concurrent K GRADEK 214 .19 Data collected in Spring
Word Blending
Predictive K GRADEK 227 .66 Winter to Spring prediction
Predictive K GRADEK 230 .41 Fall to Spring prediction
Concurrent K GRADEK 213 .23 Data collected in Spring
Concurrent 1 GRADE1 71 .22 Data collected in Fall
Predictive 1 GRADE1 179 .56 Fall to Spring prediction
Predictive 1 GRADE1 169 .53 Winter to Spring prediction
Concurrent 1 GRADE1 165 .12 Data collected in Spring
Word Segmenting
Predictive K GRADEK 228 .58 Winter to Spring prediction
Concurrent K GRADEK 213 .25 Data collected in Spring
Concurrent 1 GRADE1 71 .49 Data collected in Fall
Predictive 1 GRADE1 179 .32 Fall to Spring prediction
Predictive 1 GRADE1 168 .60 Winter to Spring prediction
Concurrent 1 GRADE1 165 .07 Data collected in Spring
Decodable Words
Concurrent K GRADEK 214 .27 Data collected in Spring
Concurrent 1 GRADE1 71 .22 Data collected in Fall
Predictive 1 GRADE1 179 .59 Fall to Spring prediction
Predictive 1 GRADE1 168 .78 Winter to Spring prediction
Concurrent 1 GRADE1 124 .46 Data collected in Spring
Sight Words 50
Concurrent K GRADEK 213 .19 Data collected in Spring

Section 6. FAST as Evidence-Based Practice
Page | 77www.fastbridge.org
© 2015 Theodore J. Christ and Colleagues, LLC. All rights reserved.
Type of Validity Grade Criterion N Coefficient Information
Sight Words 150
Concurrent 1 GRADE1 71 .59 Data collected in Fall
Predictive 1 GRADE1 179 .66 Fall to Spring prediction
Predictive 1 GRADE1 168 .80 Winter to Spring prediction
Predictive 1 GRADE1 179 .66 Fall to Spring prediction
Concurrent 1 GRADE1 166 .43 Data collected in Spring
Nonsense Words
Predictive K GRADEK 105 .44 Winter to Spring prediction
Concurrent K GRADEK 215 .27 Data collected in Spring
Predictive 1 GRADE1 179 .60 Fall to Spring prediction
Predictive 1 GRADE1 168 .67 Winter to Spring prediction
Concurrent 1 GRADE1 179 .43 Data collected in Spring
Composite
Predictive K GRADEK 173 .68 Fall to Spring prediction
Predictive K GRADEK 173 .69 Winter to Spring prediction
Concurrent K GRADEK 173 .67 Data collected in Spring
Predictive 1 GRADE1 100 .72 Fall to Spring prediction
Predictive 1 GRADE1 100 .81 Winter to Spring prediction
Concurrent 1 GRADE1 100 .83 Data collected in SpringNote. All criterion coefficients were determined using the composite of the GRADE. Level is indicated insuperscript. For example, GRADEP represents GRADE Composite Level P.
More recently, criterion-related validity analyses was estimated for spring earlyReading compositescores to predict spring aReading scores. These findings are summarized in the table below. Studentswere recruited from several school districts in Minnesota. Cut score was selected by optimizingsensitivity at about .70 and balancing sensitivity with specificity (Silberglitt & Hintze, 2005). In the tablebelow, dashes indicate unacceptable sensitivity and specificity due to low AUC. Criterion coefficientsranged from .74 to .77.
Table 34. Criterion Validity of Spring earlyReading Composite (Updated weighting scheme) withSpring aReading: MN LEA 3 (Spring Data Collection)
Grade N Composite
M (SD)
aReading
M (SD)
r(x,y) Cut AUC Sens. Spec.
Some Risk (<40th percentile)
KG 515 62.41 (12.53) 415.59 (27.13) .74** 64.5 .87 .77 .80
1 169 56.08 (15.79) 459 (27.34) .77** -- .65 -- --
High Risk (<20th percentile)
KG 515 62.41 (12.53) 415.59 (27.13) .74** 61.5 .84 .76 .73
1 169 56.08 (15.79) 459 (27.34) .77** 51.5 .72 .70 .59

Section 6. FAST as Evidence-Based Practice
Page | 78www.fastbridge.org
© 2015 Theodore J. Christ and Colleagues, LLC. All rights reserved.
Predictive Validity of the SlopeValidity of earlyReading subtests were examined using the GRADE. Table 31 presents thedemographic information from which the sample was derived, as this sample served multiplepurposes in establishing validity evidence for earlyReading.
Table 35 presents the correlation between the slope of performance using screening data (i.e.,students were assessed three times per year, fall, winter and spring) and performance on the GRADE.All correlations account for initial level of performance.
Table 35. Predictive Validity of the Slope for All earlyReading Measures
Measure Grade Criterion N Coefficient
Onset Sounds K GRADEK 217 .29
Letter Names K GRADEK 231 .44
Letter Sounds K GRADEK 231 .54
Word Blending K GRADEK 230 .48
Word Blending 1 GRADE1 178 .16
Word Segmenting K GRADEK 224 .49
Word Segmenting 1 GRADE1 178 .23
Decodable Words 1 GRADE1 179 .62
Sight Words (150) 1 GRADE1 180 .59
Nonsense Words 1 GRADE1 174 .61
Note. All coefficients were determined using the composite of the GRADE. Level is indicated in superscript. Forexample, GRADEP represents GRADE Composite Level P.
Discriminant ValiditySee Table 13 for demographic information on the sample. This study provided data for both reliabilityof the slope and discriminant validity evidence for earlyReading measures. Table 36 and Table 37display discriminant validity for earlyReading subtests in Kindergarten and First Grade, respectively.
Table 36. Discriminant Validity for Kindergarten earlyReading MeasuresMeasure byTime of Year
Below 40th Percentile Above 40th Percentile Difference Stats
N Mean SD N Mean SD t dConcepts of Print
Beginning 204 6.42 1.60 240 10.29 1.08 30.24 2.88
Middle - - - - - - - -
End - - - - - - - -
Onset Sounds
Beginning 185 7.78 3.41 259 15.09 1.04 32.46 3.09
Middle 417 14.78 2.55 0 NA NA - -
End - - - - - - - -
Letter Naming
Beginning 182 10.38 7.76 262 38.68 9.01 34.42 3.27
Middle 182 25.45 11.34 242 49.20 3.54 30.66 2.99

Section 6. FAST as Evidence-Based Practice
Page | 79www.fastbridge.org
© 2015 Theodore J. Christ and Colleagues, LLC. All rights reserved.
End 193 34.62 12.55 271 65.98 28.85 14.17 1.32
Letter Sound
Beginning 187 3.77 3.48 257 23.81 10.40 25.33 2.41
Middle 173 14.16 7.85 251 36.82 8.58 27.66 2.69
End 212 26.13 10.65 252 51.85 10.90 25.59 2.38
Rhyming
Beginning 191 4.34 2.73 253 13.12 2.33 36.50 3.47
Middle 194 8.29 4.17 222 15.41 0.74 25.00 2.46
End 224 11.38 3.97 238 16.00 0.00 17.95 1.67
Word Blending
Beginning 209 0.00 0.00 234 5.85 2.92 28.96 2.76
Middle 179 2.29 2.18 254 8.93 1.09 41.72 4.02
End 206 6.50 2.97 256 10.00 0.00 18.86 1.76
Word Segmenting
Beginning - - - - - - - -
Middle 174 5.63 5.68 260 29.04 4.31 48.73 4.69
End 194 21.50 9.34 268 33.03 1.10 20.03 1.87
Decodable Words
Beginning - - - - - - - -
Middle - - - - - - - -
End 184 2.72 2.43 275 23.32 16.03 17.29 1.62
Nonsense Words
Beginning - - - - - - - -
Middle 107 1.01 1.01 142 12.23 9.47 12.20 1.55
End 191 3.53 2.86 269 19.80 12.33 17.96 1.68
Sight Words (50)
Beginning - - - - - - - -
Middle - - - - - - - -
End 177 9.58 7.29 253 57.66 22.59 27.33 2.64
Table 37. Discriminant Validity for First Grade earlyReading SubtestsMeasure by
Time of Year
Below 40th Percentile Above 40th Percentile Difference Stats
N Mean SD N Mean SD t d
Word BlendingBeginning 253 4.39 2.47 357 9.13 0.81 33.79 2.74Middle 276 7.78 2.10 344 10 0 19.61 1.58End - - - - - - - -
Word SegmentingBeginning 252 17.89 7.62 358 30.67 2.15 30.09 2.44Middle 278 27.38 5.47 340 33.22 10.79 8.23 0.66End 269 26.84 5.60 356 33.35 0.78 21.66 1.74
Decodable WordsBeginning 256 2.92 1.93 343 19.65 13.78 19.28 1.58Middle 265 11.29 4.92 353 34.22 10.79 32.17 2.59End 262 17.88 7.74 386 51.37 15.19 32.9 2.59
Nonsense WordsBeginning 283 3.88 2.29 316 16.06 9.02 22.09 1.81Middle 221 10.39 3.82 292 26.98 10.82 21.79 1.93End 240 12.78 5.00 343 35.31 12.52 26.44 2.19

Section 6. FAST as Evidence-Based Practice
Page | 80www.fastbridge.org
© 2015 Theodore J. Christ and Colleagues, LLC. All rights reserved.
Sight 150Beginning 248 6.48 4.06 351 44.94 19.92 29.96 2.45Middle 191 30.66 15.19 268 73.71 15.90 29.13 2.73End 253 48.48 17.54 379 88.47 14.44 31.27 2.49
Sentence ReadingBeginning 223 12.77 4.98 332 57.05 37.68 17.44 1.48Middle - - - - - - - -End - - - - - - - -
CBMreadingEvidence for validity of the CBMreading passages was examined using the Test of Silent ReadingEfficiency and Comprehension (TOSREC), the Group Reading Assessment and Diagnostic Evaluation(GRADE), Measures of Academic Progress (MAP), AIMSweb Reading CBM (R-CBM), and the DynamicIndicators of Basic Early Literacy Skills (DIBELS) Next. The TOSREC is a brief test of reading that assessessilent reading of connected text for comprehension. The TOSREC can be used for screening purposes,as well as for monitoring progress. The GRADE is a norm-referenced diagnostic reading assessmentthat assists teachers in measuring pre-literacy skills, emerging reading skills, and core reading skills, aswell as providing teachers with implications for instruction and intervention. MAP is a compilation ofcomputerized adaptive assessments used to benchmark student growth and to serve as a universalscreener. AIMSweb is web-based and may be used for universal screening, monitoring progress, andmanaging data for students in Kindergarten through twelfth grade. Like CBMreading, AIMSwebReading CBM probes are intended to measure oral reading fluency and provide an indicator of generalreading achievement. Finally, DIBELS Next are a set of procedures and measures for assessing theacquisition of early literacy skills from Kindergarten through Sixth Grade. DIBELS Next was designed toserve as a measure of oral reading fluency and a method for monitoring the development of earlyliteracy and early reading skills. Data collection to gather evidence of discriminant validity is ongoing.
Content ValidityThe design specifications for CBMreading relate directly to their evidence of content validity. Eachpassage set was designed with the intent to address specific criteria aimed to maximize both utilityand sensitivity. Specific guidelines were provided for paragraph and sentence structure. This wasnecessary to ensure a parallel text structure across the passages. Each writer was instructed to usethree or four paragraphs within each passage and, when possible, include a main idea sentence at thebeginning of each paragraph that would introduce and help organize content for the reader. Writerswere also instructed to not use complex punctuation such as colons and semi-colons in order toreflect text that is familiar to primary grade levels as well as to encourage a more direct style of writing.
The passages developed for the Grade 1 passages (Level A) could include 150–200 words overall in 2–5 paragraphs. Sentences were structured to stay within a range of 3–7 words. Each paragraph wasstrictly structured to stay within a range of 7–15 sentences. The number of words per sentence andsentences per paragraph were varied across the story to result in the appropriate total number ofwords.

Section 6. FAST as Evidence-Based Practice
Page | 81www.fastbridge.org
© 2015 Theodore J. Christ and Colleagues, LLC. All rights reserved.
Passages developed for Grades 2 and 3 (Level B) could include between 230–300 words overall.Sentences were structured to stay within a range of 6–11 words. Each paragraph was strictlystructured to stay within a range of 3–7 sentences. The number of words per sentence and sentencesper paragraph were varied across the story to result in the appropriate total number of words (i.e.,230–300).
The passages developed for Grades 4 through 6 (Level C) could include between 240–300 wordsoverall. Sentences were strictly structured to stay within a range of 7–11 words. Each paragraph wasstrictly structured to stay within a range of 3–7 sentences. In addition, the 2nd or 3rd sentence of eachparagraph of these passages was required to be a longer sentence, specifically from 12–19 words inlength. Once again, the number of words per sentence and sentences per paragraph were variedacross the story to result in the appropriate total number of words (i.e., 240–300). Overall evidencesupports that guidelines for development were accurately addressed and provided the FAST™ teamwith passages that were consistent at each level in the full and reduced passage sets.
Criterion-Related ValidityPredictive and concurrent criterion validity for each grade level are available using a number ofdifferent tests or criterion (i.e., TOSREC, MAP, AIMSweb and DIBELS Next), providing evidence ofcriterion-related validity. Where applicable, the delay between CBMreading administration andcriterion administration is stated. Students scoring in the lower 40th percentile during screening wereassigned to either the long- or short-term condition. Approximately 20% of the students weretargeted within Level 1, 40% in Level 2, and 40% in Level 3. When possible, participants were selectedto ensure they read at the lower end of each score range for Level 1, 2, and 3, respectively. Thismethodological constraint ensured that the students wouldn’t grow out of the range of equitablescores across the time of data collection, which spanned two years.
Concurrent and Predictive Validity for CBMreading Grade-Level Passages is provided in Table 38. Allcoefficients were derived from students across three states: Minnesota, New York, and Georgia.
Table 38. Concurrent and Predictive Validity for CBMreadingType ofValidity
Grade Criterion N Time Lapse (Weeks) CoefficientM SD
Concurrent 1 TOSREC 218 .862 246 .813 233 .814 228 .795 244 .816 222 .82
Concurrent 1 DIBELS 399 .952 NEXT 463 .923 483 .964 485 .955 503 .956 225 .95
Concurrent 1 AIMSweb 399 .95

Section 6. FAST as Evidence-Based Practice
Page | 82www.fastbridge.org
© 2015 Theodore J. Christ and Colleagues, LLC. All rights reserved.
2 425 .973 402 .954 445 .965 447 .966 229 .95
Concurrent 2 MAP 237 .813 231 .784 233 .735 219 .666 212 .69
Predictive 1 AIMSweb 385 18.68 3.04 .912 413 18.56 2.44 .933 391 18.98 2.50 .914 427 19 2.32 .945 431 19 2.51 .936 220 17.45 .86 .94
Predictive 1 DIBELS 425 35.57 2.02 .822 Next 80 35.93 1.61 .743 76 35.79 1.47 .914 74 35.67 1.41 .905 85 35.67 1.41 .93
Predictive 1 TOSREC 44 35.57 2.02 .472 35 35.94 1.61 .563 33 35.79 1.48 .694 35 35.67 1.41 .526 18 35.06 .96 .87
Predictive 2 MAP 240 35.23 1.42 .763 233 35.47 1.27 .734 235 35.23 .88 .695 220 35.29 1.13 .656 212 35.06 .96 .71
Note. SD = Standard Deviation; M = Mean.
Additional criterion-related validity evidence for CBMreading is summarized below.
Table 39. Criterion Validity of Spring CBMreading with Spring CRCT in Reading: GA LEA 1(Spring Data Collection)
Grade N CBMreading
M (SD)
CRCT
M (SD)
r(x,y) Cut AUC Sens. Spec.
Some Risk (Meets Standards)
3 324 115.74 (43) 848.62 (28) .61* 113.50 .77 .71 .70
4 310 135.74 (39) 848.30 (27) .61* 131.50 .79 .71 .73
5 343 148.01 (38) 841.27 (25) 56* 151.50 .73 .69 .69
High Risk (Does Not Meet Standards)
3 324 115.74 (43) 848.62 (28) .61* 79.00 .89 .80 .844 310 135.74 (39) 848.30 (27) .61* 99.50 .89 .83 .83
5 343 148.01 (38) 841.27 (25) 56* 122.50 .81 .77 .77

Section 6. FAST as Evidence-Based Practice
Page | 83www.fastbridge.org
© 2015 Theodore J. Christ and Colleagues, LLC. All rights reserved.
Table 40. Criterion Validity of Spring CBMreading with Spring MCA-III in Reading: MN LEA 4(Spring Data Collection)
Grade N
CBM-R
M (SD)
MCA-III
M (SD) r(x,y) Cut AUC Sens. Spec.
Some Risk (Does not Meet or Partially Meets Standards)
3 852 139 (40) 348 (20) .76 141.5 .86 .78 .76
4 818 165 (39) 447 (15) .71 164.5 .83 .75 .71
5 771 165 (40) 552 (16) .70 163.5 .84 .77 .76
High Risk (Does Not Meet Standards)
3 852 139 (40) 348 (20) .76 131.5 .88 .80 .79
4 818 165 (39) 447 (15) .71 153.5 .87 .80 .78
5 771 165 (40) 552 (16) .70 151.5 .89 .80 .79
Table 41. Criterion Validity of Spring CBMreading with Spring MCA-III in Reading: MN LEA 3(Spring Data Collection)
Grade N
CBMreading
M (SD)
MCA-III
M (SD) r(x,y) Cut AUC Sens. Spec.
Some Risk (Does Not Meet or Partially Meets Standards)
3 502 137.30 (44) 352.97 (22) .74 131.5 .87 .80 .79
4 505 160.98 (48) 451.54 (18) .74 161.5 .87 .78 .78
5 505 172.70 (41) 554.09 (15) .70 164.5 .85 .76 .75
6 472 176.57 (41) 654.35 (19) .64 173.5 .81 .72 .73
Some Risk (Partially Meets Standards)
3 502 137.30 (44) 352.97 (22) .74 -- .58 -- --
4 505 160.98 (48) 451.54 (18) .74 165.5 .63 .70 .55
5 505 172.70 (41) 554.09 (15) .70 172.5 .66 .69 .53
6 472 176.57 (41) 654.35 (19) .64 184.5 .60 .69 .56
High Risk (Does Not Meet Standards)
3 502 137.30 (44) 352.97 (22) .74 121.5 .91 .82 .82
4 505 160.98 (48) 451.54 (18) .74 144.5 .88 .78 .79
5 505 172.70 (41) 554.09 (15) .70 151.5 .91 .83 .81
6 472 176.57 (41) 654.35 (19) .64 165.5 .87 .77 .78

Section 6. FAST as Evidence-Based Practice
Page | 84www.fastbridge.org
© 2015 Theodore J. Christ and Colleagues, LLC. All rights reserved.
Table 42. Criterion Validity of Spring CBMreading with Spring Minnesota ComprehensiveAssessment III (MCA-III) in Reading: MN LEA 2 (Spring Data Collection)
Grade N
CBMreading
M (SD)
MCA
M (SD) r(x,y) Cut AUC Sens. Spec.
Some Risk (Does Not Meet or Partially Meets Standards)
3 252 142.95 (39) 353.34 (23) .69** 142.5 .83 .76 .77
4 240 165.98 (39) 451.83 (16) .69** 165.5 .82 .75 .75
5 234 175.33 (35) 558.69 (15) .62** 167.5 .83 .73 .72
Some Risk (Partially Meets Standards)
3 252 142.95 (39) 353.34 (23) .69** -- .58 -- --
4 240 165.98 (39) 451.83 (16) .69** -- .58 -- --
5 234 175.33 (35) 558.69 (15) .62** 174.5 .66 .67 .54
High Risk (Does Not Meet Standards)
3 252 142.95 (39) 353.34 (23) .69** 127.5 .85 .73 .71
4 240 165.98 (39) 451.83 (16) .69** 150.5 .90 .76 .84
5 234 175.33 (35) 558.69 (15) .62** 151.5 .93 .93 .88
Table 43. Criterion Validity of Spring CBMreading on Spring MAP in Reading: WI LEA 1(Spring Data Collection)
Grade N
CBMreading
M (SD)
MAP
M (SD) r(x,y) Cut AUC Sens. Spec.
Some Risk (≤ 40th percentile)
2 33 76.88 (45) 181.61 (19) .87** 66 .97 .91 .91
3 26 115.31 (54) 195.65 (17) .89** 76 .99 .86 .95
4 31 132.55 (41) 208.23 (13) .76** 123 .89 .86 .85
5 28 154.50 (33) 211.11 (13) .66** 140 .89 .78 .79
6 25 155.76 (38) 215.08 (12) .74** 149 1.00 1.00 .83
Some Risk (20th to 40th percentile)
2 33 76.88 (45) 181.61 (19) .87** 58 .68 .67 .74
3 26 115.31 (54) 195.65 (17) .89** 108.5 .85 1.00 .82
4 31 132.55 (41) 208.23 (13) .76** 123 .72 .75 .74
5 28 154.50 (33) 211.11 (13) .66** 144 .69 .80 .60
6 25 155.76 (38) 215.08 (12) .74** 149 .92 1.00 .71
High Risk (≤ 20th percentile)
2 33 76.88 (45) 181.61 (19) .87** 32 .99 .86 .96
3 26 115.31 (54) 195.65 (17) .89** 62 1.00 1.00 .87
4 31 132.55 (41) 208.23 (13) .76** 94 1.00 1.00 .93
5 28 154.50 (33) 211.11 (13) .66** 127 .97 1.00 .92
6 25 155.76 (38) 215.08 (12) .74** 140 .92 1.00 .77

Section 6. FAST as Evidence-Based Practice
Page | 85www.fastbridge.org
© 2015 Theodore J. Christ and Colleagues, LLC. All rights reserved.
Table 44. Criterion Validity of Spring CBMreading with Spring Massachusetts ComprehensiveAssessment (MCA): MA LEA 1 (Spring Data Collection)
Grade N
CBMreading
M (SD)
MCA
M (SD) r(x,y) Cut AUC Sens. Spec.
Some Risk (“Warning” and “Needs Improvement”)
3 93 138.82 (38) 241.89 (14) .72** 132.5 .86 .79 .78
4 94 145.85 (38) 238.40 (15) .71** 143.5 .81 .73 .78
5 72 158.99 (28) 243.63 (13) .59** 157 .87 .74 .76
Some Risk (“Needs Improvement”)
3 93 138.82 (38) 241.89 (14) .72** 132.5 .74 .72 .69
4 94 145.85 (38) 238.40 (15) .71** 144.5 .69 .69 .64
5 72 158.99 (28) 243.63 (13) .59** 155.5 .86 .73 .76
High Risk (“Warning”)
3 93 138.82 (38) 241.89 (14) .72** 103.5 .96 1.00 .93
4 94 145.85 (38) 238.40 (15) .71** 128 .89 .78 .78
5 72 158.99 (28) 243.63 (13) .59** 137.5 .80 1.00 .79
Predictive Validity of the SlopeValidity of CBMreading passages were examined using the TOSREC, AIMSweb R-CBM, Measures ofAcademic Progress (MAP), and DIBELS Next. Table 45 depicts correlations between the slope and theachievement outcome. Coefficients provided in
Table 46 were derived from progress monitoring data. Students were monitored with grade levelpassages for AIMSweb and DIBELS Next. Correlation coefficients in
Table 46 may be underestimated due to differences in error (i.e., Standard Error of the Estimate andStandard Error of the Slope) between passage sets (see Ardoin & Christ, 2009 and Christ & Ardoin,2009). The increased precision of CBMreading passages may lead to less variable slopes compared tomore error prone progress monitoring passages. This in turn may deflate the measure of associationbetween the two measures.
Table 45. Predictive Validity for the Slope of Improvement by CBMreading Passage LevelPassage
LevelTest or Criterion N
# CBMreading
Data Points
Weeks of
MonitoringCoefficient
Level A TOSREC Mid-Year 58 .43
Level B 98 .45
Level C 158 .36
Level A TOSREC End of Year 58 .58
Level B 98 .22
Level C 158 .14
Level A TOSREC* 85 1-24 .46
Level B 130 1-29 .56Level C 186 1-29 .16

Section 6. FAST as Evidence-Based Practice
Page | 86www.fastbridge.org
© 2015 Theodore J. Christ and Colleagues, LLC. All rights reserved.
Level A DIBELS Next 57 10-30 10-30 .89
Level B 197 10-30 10-30 .82
Level C 152 10-30 10-30 .60
Level A AIMSWEB 33 10-30 30 .98
Level B 39 10-30 30 .84Level C 70 10-30 30 .78
Level A MAP 49 10 10 .21
Level B 71 10-20 10 .23
Level C 112 6-20 10 .21
Level A MAP 33 14-30 30 .03
Level B 42 14-30 30 .41
Level C 78 18-30 30 .17
Note. Reported coefficients are partial Pearson correlation coefficients. Or rxy.z where x is the slope ofimprovement, y is the outcome measure and z is the intercept (initial level). TOSREC* coefficients are based on apartial data set from students in Georgia and Minnesota.
Table 46. Correlation Coefficients between CBMreading Slopes, AIMSweb R-CBM, andDIBELS Next
AIMSweb Slope DIBELS Next Slope
Passage
LevelN
Weeks of
Monitoring
(range)
Coefficient
(95% CI)N
Weeks of
Monitoring
(range)
Coefficient
(95% CI)
A
Grade 1 (42)
Grade 2 (15)
Grade 3 (4)Total N = 59
10–30.95
(.92 - .97)
Grade 1 (42)
Grade 2 (27)
Grade 3 (6)Total N = 75
10–30.76
(.65 - .85)
B
Grade 1 (6)
Grade 2 (41)
Grade 3 (38)
Grade 4 (15)
Grade 5 (7)
Grade 6 (1)Total N = 108
10–30.85
(.79 - .90)
Grade 1 (6)
Grade 2 (113)
Grade 3 (91)
Grade 4 (27)
Grade 5 (14)
Grade 6 (2)Total N = 253
10–30.75
(.69 - .80)
C
Grade 4 (49)
Grade 5 (44)
Grade 6 (23)Total N = 116
10–30.64
(.52 - .74)
Grade 4 (130)
Grade 5 (112)
Grade 6 (51)Total N = 293
10–30.50
(.38 - .61)
Note. CI = Confidence Interval. Samples are disaggregated by grade level.
aReading
Content ValidityThe development and design of aReading has a strong basis in reading research and theory. Itemswere created and revised by reading teachers and experts. See previous section on item writing

Section 6. FAST as Evidence-Based Practice
Page | 87www.fastbridge.org
© 2015 Theodore J. Christ and Colleagues, LLC. All rights reserved.
processes. Extensive field testing has been conducted to establish appropriate items for aReading. Forinstance, the National Reading Panel (NRP; 2000a) submitted a report detailing the current knowledgebase of reading, as well as information on effective approaches to teach children how to read and theimportant dimensions of reading to be emphasized. Factor analysis of preliminary data providedevidence for a large primary factor (i.e., unidimensionality) and several smaller factors, across theaReading items. Thus, aReading is designed to provide both a unified and a component assessment ofthese dimensions, specifically focusing on five main areas (as put forth by the NRP, 2000a): Conceptsof Print, Phonological Awareness, Phonics, Vocabulary, and Comprehension.
The following describes the field testing process in order to derive item parameters to examine bothdifficulty and content areas that aReading items are addressing.
Common Core State Standards: Foundational SkillsCommon Core Subgroups / Clusters aReading Domains
Print Concepts Concepts of Print
Phonological Awareness Phonemic Awareness
Phonetic Awareness Phonetic Awareness
Vocabulary Vocabulary
Common Core State Standards: College and Career Readiness Reading Standards forLiterature / Informational Text
Common Core Subgroups / Clusters aReading Domains
Key Ideas and Details Comprehension
Craft and structure Comprehension & Vocabulary
Integration of Knowledge and Ideas Comprehension & Vocabulary
aReading
Common Core State Standards &
MN K–12 Standards
Concepts of Print: RF K.1, RF 1.1
Familiarity with print/books RI K.5, RF K.1a
Understands appropriate directionality and tracking in print RF K.1a
Identifies organizational elements of text RF K.1a,c,d; RF 1.1a, L 1.2b,c; L 2.2b,c,
etc.; L 5.2a,b,c,d, RI K.6
Letter recognition RF K.1b,d; L K.1a, L 1.1a
Word recognition RF K.1b; RF K.1d
Sentence recognition
Phonological Skills:
Letter and word recognition / identification L 3.2f

Section 6. FAST as Evidence-Based Practice
Page | 88www.fastbridge.org
© 2015 Theodore J. Christ and Colleagues, LLC. All rights reserved.
Syllabication RF K.2b; RF 1.3d
Letter and word recognition/identification L.3.2f
Onset-rime RF k.2a, c
Phonemic categorization RF K.3d
Phonemic isolation RF K.2b,c,d; RF 1.2a,c
Phonemic identification RF 1.2b,d
Phonemic manipulation RF K.2e
Skills Related to Phonics:
Single consonant identification RF K.2d; RF K.3a; RF 1.2c
Single vowel identification RF K.2d; RF K.3b; RF 1.2a,c; RF 2.3a,c
Combined vowel identification RF 1.3c; RF 2.3b
Consonant blends RF 1.2b
Consonant digraphs RF 1.3a; L K.2c
R-, L-, -gh controlled vowel identification RF 1.2b
Vowel digraphs and diphthongs RF 1.3c; RF 2.3b
Phonograms
Recognize and analyze word roots and affixes RF 3.3b; L 4.4b; L 5.4b
Spelling RF 2.3c
Skills Related to Vocabulary:
Single-meaning words L K.4a,b
Double-meaning words RF 1.3f; RF 2.3d; L K.4a,b
Compound words and contractions L 2.4d
Base/root word identification and use RF 3.3b; L K 4b; L1.4b,c; L 3.3a; L 3.4c; L
4.4b; L 5.4b
Word relationships RL 3.4; RL 4.4; RL 5.4; L K.5a,b; L 1.5a,b; L3.1a,c; L 3.4; L 2.5, 3.5, 4.5, etc.; L 4.4c; L
5.4a,c
Skills Related to Comprehension:
Identify and locate information RL K.1, 1.1, 2.1, etc.; RI K.1, 1.1, 2.1, etc.
Using inferential processes RL K.7; 1.7, 2.7, etc.; RL K.9, RL 2.2, 2.3; RL
3.2, 3.3; RI K.7, 1.7, 2.7, etc.
Comprehension monitoring RL K.4; RI K.4; RI 1.4
Awareness of text/story structure RL k.5, 1.5, 2.5, etc.; RI 4.5, RI 5.5
Awareness of vocabulary use RL 2.4
Evaluative and analytical processes RL 2.6, 3.6, 4.6, etc.; RI 3.6
aReading literary passages include the following text types:
Fiction / Literature
Literary Nonfiction / Narrative Nonfiction
Poetry
Informational text types include:
Exposition

Section 6. FAST as Evidence-Based Practice
Page | 89www.fastbridge.org
© 2015 Theodore J. Christ and Colleagues, LLC. All rights reserved.
Argumentation and persuasive text
Procedural text and documents.
For Reading Comprehension items, both literary and informational text types were used.
For Vocabulary, Orthography and Morphology items, response types include:
Selected Response
Conventional Multiple Choice
Alternate Choice
Matching
Multiple True-False
Targeted standards include:
Identify common misspellings
Recognize and analyze affixes and roots to determine word meaning in context;
Use / recognize appropriate word change patterns that reflect change in meaning orparts of speech (e.g., derivational suffixes)
Identify word meaning in context
Demonstrate ability to use reference materials to pronounce words, clarify wordmeaning
Understand figurative language in context
Use word relations to improve understanding
Distinguish similar-different word connotations and/or denotations
Test items were created based upon the following categories from the Common Core State Standards:
Key Ideas and Details
Craft and Structure
Integration of Knowledge and Ideas
The test question types include the following:
Locate / Recall: Identify textually explicit information and make simple inferenceswithin and across texts
Integrate / Interpret: Make complex inferences and/or integrate information withinand across texts
Critique / Evaluate: Consider text(s) or author critically
Pilot Test
In 2007, there were seven data collections across four districts, six schools, and 78 classrooms with1,364 total students. Those data were used to estimate item parameters using student samples fromKindergarten through Third Grade. See Table 47 below.

Section 6. FAST as Evidence-Based Practice
Page | 90www.fastbridge.org
© 2015 Theodore J. Christ and Colleagues, LLC. All rights reserved.
Table 47. School Data Demographics for aReading Pilot TestCategory School A School B School C School D School E School F
White 94% 60% 10% 71% 3% 19%
Black <1% 11% 64% 16% 83% 51%
Hispanic <1% <1% 21% 4% 2% 1%
Asian/Pacific Islander 5% 23% 3% 8% 12% 28%
American
Indian/Alaska Native
<1% <1% 2% 1% <1% <1%
Free/Reduced Lunch 13% 36% 89% 28% 96% 76%
Twelve to thirteen laptop computers were used in each data collection. The test was administered tostudents by class. Each student used a mouse to navigate the computer and headphones to hear theaudio. Keyboards were covered so that students could not touch them, and each computer wassurrounded by a foam board to discourage students from looking on other student's computerscreens.
Data collections were proctored by two to three data collectors who entered each student's name andidentifying information. Proctors attended to the children if they had questions, but did not providehelp on any item. Tests consisted of 50–80 items across six domains of reading; 20 items, the linkingitems, were on each test and administered to all students in all sites. The linking items make it possibleto import all items into a data super matrix, enabling each item parameter to be based directly andinferentially on data from all participants across all tests.
A summarization of the mean, standard deviation, minimum and maximum values for the three IRTparameters is presented in Table 48 for each reading domain. The number of items developed in eachreading domain for the different ability levels are presented in Table 49. From over 500 itemsdeveloped, 366 items were identified as being accurately developed and having residual values thatwere less than 1.68.
Table 48. Summarization of K–5 aReading Parameter Estimates by DomainParameter (a) Parameter (b) Parameter (c)
Domain N M SD Min Max M SD Min Max M SD Min Max
Phonics 198 1.49 .16 1.06 2.01 .19 1.0 -2.13 2.65 .17 .04 .09 .35
Comprehension 24 1.44 .17 1.17 1.94 .77 .37 .14 1.37 .17 .04 .09 .24
Vocabulary 34 1.55 .27 1.15 2.50 .83 .99 -2.55 2.95 .16 .05 .09 .30
Concepts of Print 38 1.50 .19 1.18 2.20 -1.55 .75 -2.67 .64 .16 .02 .13 .22
Decoding &
Fluency65 1.57 .23 1.17 2.23 -.37 .68 -1.78 1.77 .18 .06 .11 .40
PhonemicAwareness
6 1.28 .15 1.03 1.43 -.41 1.03 -2.22 .45 .21 .04 .14 .28
Note. M = Mean.
A summary of item difficulty information is provided in Table 49. Analysis on level of difficulty afteritem parameterization for the five domains indicated that aReading items are representing domains as
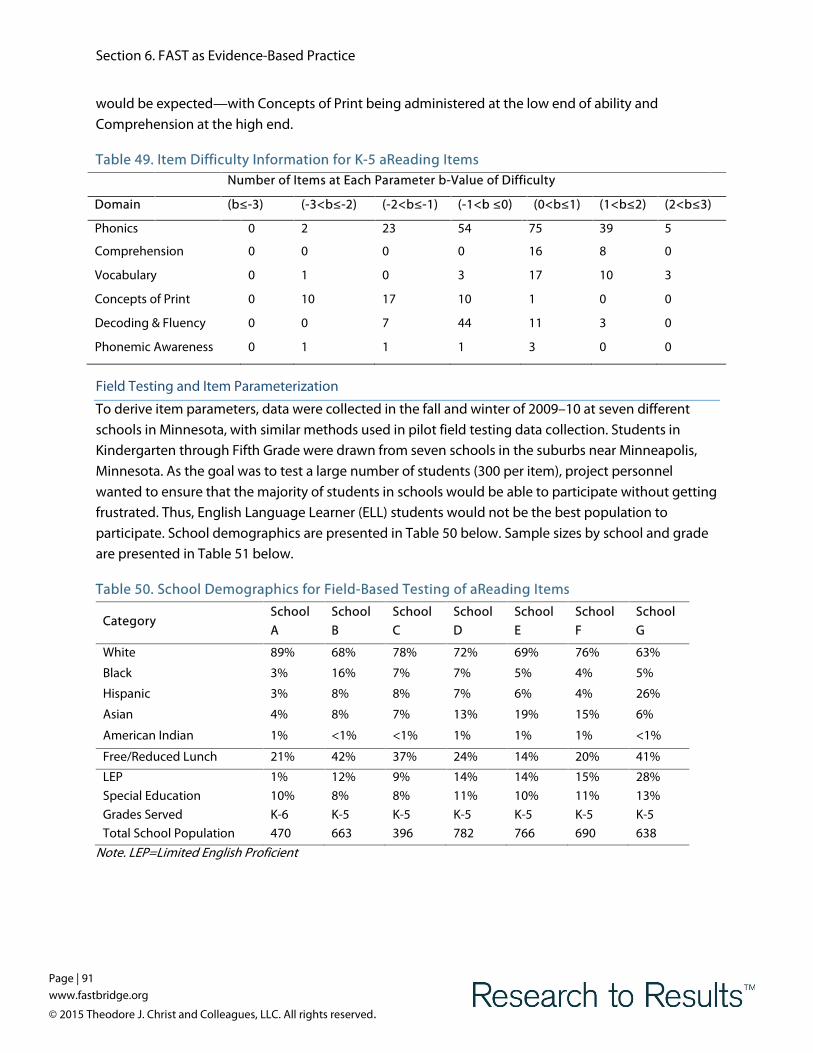
Section 6. FAST as Evidence-Based Practice
Page | 91www.fastbridge.org
© 2015 Theodore J. Christ and Colleagues, LLC. All rights reserved.
would be expected—with Concepts of Print being administered at the low end of ability andComprehension at the high end.
Table 49. Item Difficulty Information for K-5 aReading ItemsNumber of Items at Each Parameter b-Value of Difficulty
Domain (b≤-3) (-3<b≤-2) (-2<b≤-1) (-1<b ≤0) (0<b≤1) (1<b≤2) (2<b≤3)
Phonics 0 2 23 54 75 39 5
Comprehension 0 0 0 0 16 8 0
Vocabulary 0 1 0 3 17 10 3
Concepts of Print 0 10 17 10 1 0 0
Decoding & Fluency 0 0 7 44 11 3 0
Phonemic Awareness 0 1 1 1 3 0 0
Field Testing and Item Parameterization
To derive item parameters, data were collected in the fall and winter of 2009–10 at seven differentschools in Minnesota, with similar methods used in pilot field testing data collection. Students inKindergarten through Fifth Grade were drawn from seven schools in the suburbs near Minneapolis,Minnesota. As the goal was to test a large number of students (300 per item), project personnelwanted to ensure that the majority of students in schools would be able to participate without gettingfrustrated. Thus, English Language Learner (ELL) students would not be the best population toparticipate. School demographics are presented in Table 50 below. Sample sizes by school and gradeare presented in Table 51 below.
Table 50. School Demographics for Field-Based Testing of aReading Items
CategorySchool
A
School
B
School
C
School
D
School
E
School
F
School
G
White 89% 68% 78% 72% 69% 76% 63%
Black 3% 16% 7% 7% 5% 4% 5%
Hispanic 3% 8% 8% 7% 6% 4% 26%
Asian 4% 8% 7% 13% 19% 15% 6%
American Indian 1% <1% <1% 1% 1% 1% <1%
Free/Reduced Lunch 21% 42% 37% 24% 14% 20% 41%
LEP
Special Education
Grades ServedTotal School Population
1%
10%
K-6470
12%
8%
K-5663
9%
8%
K-5396
14%
11%
K-5782
14%
10%
K-5766
15%
11%
K-5690
28%
13%
K-5638
Note. LEP=Limited English Proficient

Section 6. FAST as Evidence-Based Practice
Page | 92www.fastbridge.org
© 2015 Theodore J. Christ and Colleagues, LLC. All rights reserved.
Table 51. Sample Sizes for K-5 aReading Field-Testing by Grade and SchoolGrades School A School B School C School D School E School F School G
K–1 100 203 128 243 278 216 215
2–3 130 238 123 255 258 180 174
4–5 150 212 114 243 238 180 182
Total 380 653 365 741 774 576 571
Field Testing to Establish Linking Items
IRT requires that each field-tested item be sampled on 300 individuals (Weiss personalcommunication, 2009). Therefore, our goal was to reach 300 students tested per item; some itemswere tested on more than 300 students. Sampling at this rate ensures that all three parameters (a, b,and c) are stable estimates (low levels of standard error).
The goal of the first data collection was to identify and establish parameters for linking items. Linkingitems (N = 16) are those items that were included on each subsequent field test as necessary to use amixed-group common-item linking procedure (Kolan & Brennan, 2004). Without linking items,examinee responses across alternate items and examinees samples could not be compared and usedto estimate item parameters. Linking items were developed and selected to represent all domains aswell as the range of item difficulties, which generally correspond with reading performance fromKindergarten through Fifth Grade. Identification of linking items from the pilot data collection wasextremely important because they appear on each subsequent field test. Project personnel identified16 linking items that spanned across a range of difficulty levels and were content-balanced.
aReading personnel systematically chose 55 items out of the entire bank of items (N = 638). First, theyindividually chose what they determined were the best 55 items based on findings from previousadministrations and on literacy research. The number of items chosen per domain was calculatedbased on the a priori model. For example, Concepts of Print and Phonological Awareness develop inKindergarten and First Grade. Therefore, the proportion of these item types should be much smallerthan the proportion of Comprehension items on tests; Comprehension develops across five grades,not just two. The number of items per grade level was similarly determined.
aReading staff decided that some items would be too difficult for young students at the first datacollection in which 55 items were to be tested. Thus, the administration was structured to have fivetests with branching and termination criteria. Each test was content-balanced and successive testswere sequenced so they became progressively more difficult (item difficulty was based on expertjudgment of project personnel). For instance, the first test included 15 items that were considered tobe the easiest. Based on performance within each test, students’ administration was either terminated(due to the number of incorrect responses) after a test was completed and prior to subsequent tests,or continued to the next, progressively difficult, test (if enough correct responses were given). If anexaminee’s test terminated, then it was assumed that the examinee would not respond to subsequentitems at a rate greater than chance.

Section 6. FAST as Evidence-Based Practice
Page | 93www.fastbridge.org
© 2015 Theodore J. Christ and Colleagues, LLC. All rights reserved.
The results of this initial field testing were used to guide the selection of linking items. These resultswere not included in the super matrix or to estimate the final item parameters.
Field Testing to Establish Item Parameters
Based on best estimates of the project team, items were sequenced by difficulty and divided into sixsets of three progressively more difficult tests [e.g., for Schools A & B there was a fall set of three tests(K–1, 2–3, 4–5) and a spring set of three tests (K–1, 2–3, 4–5)]. While all reading domains were assessedat all grade levels, grade-level tests were constructed with the particular domain emphasis for thatgrade in mind. Specifically, personnel believed that Kindergarten and First Grade examinees should beassessed in the domains of Concepts of Print, Phonological Awareness, and some Phonics skills. Thus,it seemed reasonable to combine these grades and test them using the same set of items. Similarly, itwas expected that examinees in grades two and three and grades four and five were similar in readingdevelopment. The most relevant domains for grades two and three seemed to be Phonics andVocabulary. Finally, the focus for grades four and five was Vocabulary and Comprehension. It isimportant to note that each grade was tested on Vocabulary and Comprehension, but at varyinglevels of difficulty corresponding with grade level.
Excluding the first data collection at School A, both the Kindergarten to First Grade (K–1) tests and thesecond to Third Grade (2–3) tests had 39 new items on each. Thirty-one new items were on eachfourth to Fifth Grade (4–5) test. The number of items on the grade 4–5 tests was reduced due to themajority of items belonging to the Comprehension domain. In general, Comprehension items requiremore time because more reading is involved. This means that the grades K–1 and 2–3 tests each had atotal of 55 items, including the linking items, and the grades 4–5 test had a total of 47 items, includingthe linking items.
Procedure: Data Collection OverviewData were collected using a mobile computer lab (N = 28 laptops each) or the school’s computer lab.At the time of administration, data collectors directed students to the appropriate computer, locatedin a test carrel, and provided a brief set of directions. Visual stimuli are presented on a computermonitor and auditory stimuli are presented with padded earphones (padding helps isolate studentsfrom extraneous noises and helps ensure that the assessment could be conducted within a populatedarea). The students receive oral directions from a proctor or teacher followed by automated directionsand on-screen demonstrations to guide them through the test. Students responded to items insessions of 15–30 minutes. Upon completion, students were free to return to their classroom.
FALL 2009 DATA COLLECTIONS: OCTOBERSchool A. The purpose of this initial data collection was to identify linking items (procedure describedabove). Three hundred sixty four students participated in this data collection. Once linking items wereidentified (N = 16), they were included in all subsequent tests for which items were field tested (withone exception; School B fall data collection, grades 4–5 test).
School B. As another early data collection in which aReading personnel had no data to aid in theselection of items, items considered to be high quality and representative of a range of ability levels

Section 6. FAST as Evidence-Based Practice
Page | 94www.fastbridge.org
© 2015 Theodore J. Christ and Colleagues, LLC. All rights reserved.
and content for this data collection were selected. Five linking items were unintentionally left out ofthe grades 4–5 test. As a result, items from the grades 4–5 test were added to the Super matrix once alldata collections were completed. The researchers adjusted the parameters appropriately. Fivehundred and sixty total students participated in this data collection at this school; specifically, 153students were administered the grade K–1 test, 211 students were administered the grades 2–3 test,and 196 students were administered the grades 4–5 test.
FALL 2009 DATA COLLECTIONS: NOVEMBERSchool C. This elementary school served as a make-up school for items tested at School B. In otherwords, the goal of 300 students per item was not achieved at School B due to the student population.Students at School C took the same test set as those at School B in order to obtain the goal of 300students per item. Three hundred and sixty two total students participated in this data collection atthis school; specifically, 128 students were administered the grades K–1 test, 123 students wereadministered the grades 2–3 test, and 111 students were administered the grades 4–5 test.
School D. Items were chosen with consideration for difficulty level and content balance. Sevenhundred and forty one total students participated in this data collection at this school; specifically, 243students were administered the grades K–1 test, 255 students were administered the grades 2–3 test,and 243 students were administered the grades 4–5 test.
FALL 2009 DATA COLLECTIONS: DECEMBERSchool E. Items were chosen with consideration for difficulty level and content balance. Sevenhundred and twenty seven total students participated in this data collection at this school; specifically,217 students were administered the grades K–1 test; 238 students were administered the grades 2–3test; 272 students were administered the grades 4–5 test.
WINTER 2010 DATA COLLECTIONS: JANUARYSchool A. Based on initial item analysis of the October data collection, more items that were very easy(< -2.0) and very difficult items (> +2.0) were needed to expand the range of linking items. As a result,project personnel focused on adding a majority of extremely easy items (in the domains of Conceptsof Print and Phonological Awareness) to the grades K–1 test. The 4–5th grade test included high levelVocabulary items and Comprehension items considered very difficult due to length of passage,vocabulary, and question type. The tests at this school consisted of an entirely new item set. Threehundred and eighty total students participated in this data collection at this school; specifically, 100students were administered the grades K–1 test, 130 students were administered the grades 2–3 test,and 150 students were administered the grades 4–5 test.
WINTER 2010 DATA COLLECTIONS: FEBRUARYSchool C. Again, this school served as the make-up school for previous fall data collections (i.e., SchoolB, School D, and School E). Three hundred and sixty two total students participated in this datacollection at this school; specifically, 126 students were administered the grades K–1 test, 122 studentswere administered the grades 2–3 test, and 114 students were administered the grades 4–5 test.

Section 6. FAST as Evidence-Based Practice
Page | 95www.fastbridge.org
© 2015 Theodore J. Christ and Colleagues, LLC. All rights reserved.
School D. Items were chosen with consideration for difficulty level and content balance. Testsadministered consisted of an entirely new item set. Seven hundred and ten total studentsparticipated in this data collection at this school; specifically, 234 students were administered thegrades K–1 test, 252 students were administered the grades 2–3 test, and 224 students wereadministered the grades 4–5 test.
School G. Items were chosen with consideration for difficulty level and content balance. Five hundredand seventy one total students participated in this data collection at this school; specifically, 215 wereadministered the grades K–1 test, 174 students were administered the grades 2–3 test, and 182students were administered the grades 4–5 test.
SPRING 2010 DATA COLLECTIONS: MARCHSchool B. Items were chosen with consideration for difficulty level and content balance. Testsadministered at School B were the same as those administered during the winter data collection atSchool F. Six hundred and fifty three total students participated in this data collection at this school;specifically, 203 students were administered the grades K–1 test, 238 students were administered thegrades 2–3 test, and 212 students were administered the grades 4–5 test.
School E. School E served as the make-up school for all data collections in need of moreadministrations for items. Seven hundred and sixty eight total students participated in this datacollection at this school; specifically, 278 students were administered the grades K–1 test, 258 studentswere administered the grades 2–3 test, and 232 students were administered the grades 4–5 test.
School F. Items were chosen with consideration for difficulty level and content balance. Testsadministered consisted of an entirely new item set. Five hundred and seventy six total studentsparticipated in this data collection at this school; specifically, 216 students were administered thegrades K–1 test, 180 students were administered the grades 2–3 test, and 180 students wereadministered the grades 4–5 test.
SPRING 2012 DATA COLLECTIONAnalysis of the initial field parameterization indicated that the item bank provided the mostinformation for students with ability levels in the middle range on the theta scale (mostly between -2.0and 2.0). However, the bank lacked items for students’ ability levels at the extreme ends of the thetascale. Because the test bank needs more information for students with extremely low ability levels(less than -2.0 on the theta scale) and those with extremely high ability levels (more than 2.0), theaReading team developed additional items that targeted Kindergarten through early First Grade levelstudents and also late fifth through early Sixth Grade students. The new easy items focused on theConcept of Print domain. The new items created for the higher grade students were allComprehension items that contained reading passages that reflect fifth through Sixth Grade readingcontent.
The participants were students from two public schools in South St. Paul, Minnesota. The schoolsprovided a richly diverse group of students. The aReading team administered the Concept of Print

Section 6. FAST as Evidence-Based Practice
Page | 96www.fastbridge.org
© 2015 Theodore J. Christ and Colleagues, LLC. All rights reserved.
items to 411 Kindergarten and First Grade students (N = 19 classrooms) and the Comprehension itemsto 391 fifth and Sixth Grade students (N = 18 classrooms).
The team collected data for the Concept of Print items in November and December 2011 and theComprehension items in March 2012. A range of two to three group administrations were completedin a day (during school hours and with transitions and scheduling conflicts). Research assistants andother project personnel supervised the test administrations, ensuring student safety and the integrityof collecting the data. Data collectors provided oral directions to the students. Students also receivedautomated directions and on-screen demonstrations before beginning the test. The studentscompleted the items on a web-based browser using laptops provided by the team. Eachadministration lasted approximately 15 to 30 minutes for each student and all responses wereautomatically saved in a secure online database.
FALL 2012 AND SPRING 2013 DATA COLLECTIONOver 9,000 students from six middle and junior high schools and four high schools in the upperMidwest participated to test items generated for aReading grades 6–12 (N=70 unique classrooms).Trained project personnel administered the assessments. Each test included linking items and 20unique aReading items targeted to grade level spans from 6–8, 9–12, and 11–12. Each item was givento approximately 300 students. Administration lasted 20 to 45 minutes per student. Criterionmeasures were collected from each school and used for additional analyses.
ParameterizationAll items were parameterized within a 3-PL IRT framework via the computer program Xcalibre (Guyer &Thompson, 2012). Xcalibre allows for the use of a sparse data-matrix used with linking items(described above) deriving item parameters for every item, even if all students did not complete eachitem. Table 52 below shows descriptive statistics for item parameters for aReading. Item parametersare used to calculate the level of information for each item at a given ability estimate (discussed in theprevious section). Based on a student’s current ability estimate during a CAT, the aReading algorithmselects the item that is likely to provide the most information for that student.
Table 52. Descriptive Statistics of K–12 aReading Item Parameters
Domain N M SD Min Max M SD Min Max M SD Min Max
Overall 1101 1.34 .40 .46 3.78 .11 1.02 -2.87 2.77 .24 .04 .06 .36
COP 98 1.5 .46 .63 2.82 -1.14 .96 -2.64 1.45 .21 .02 .11 .25
Comprehension 521 1.39 .4 .46 3.78 .39 .71 -1.28 2.77 .24 .04 .06 .36
Vocabulary 229 1.34 .37 .61 3.03 .33 1.13 -2.87 2.62 .22 .03 .06 .29
Phonics 128 1.38 .44 .52 2.73 -.34 1.09 -2.58 1.95 .21 .02 .13 .33
PA 66 1.11 .32 .61 1.9 -.61 .87 -2.56 1.24 .21 .01 .16 .23
OMF 57 1.31 .31 .76 2.27 .58 .72 -.76 2.63 .24 .06 .06 .29
Note. COP = Concepts of Print; PA = Phonological Awareness; OMF = orthography, morphology, and figurativelanguage.

Section 6. FAST as Evidence-Based Practice
Page | 97www.fastbridge.org
© 2015 Theodore J. Christ and Colleagues, LLC. All rights reserved.
Criterion-Related ValidityCriterion-related validity of aReading tests was examined using the Gates MacGinitie Reading Tests-4th
Edition (GMRT-4th; MacGinitie, MacGinitie, Maria, & Dreyer, 2000). The GMRT-4th is a norm-referenced,group administered measure of reading achievement distributed by Riverside Publishing Company. Itis designed to provide guidance in planning instruction and intervention and is typically used as adiagnostic tool for general reading achievement. The GMRT-4th was normed with students in the pre-reading stages through high school levels. The GMRT-4th was selected because of its strong criterionvalidity. Correlations between the GMRT composite score and comprehension and vocabularysubtests of the Iowa Test of Basic Skills and GMRT composite scores across grades is high (.76 and .78respectively; Morsy, Kieffer, & Snow, 2010). A similar pattern of results were observed between theGMRT and subscales of the California Tests of Basic Skills (.84 and .81 respectively; Morsy et al., 2010).GMRT scores also correlate highly with Comprehensive Tests of Basic Skills vocabulary,comprehension, and composite scores (.72, .79, and. 83 respectively; Morsy et al., 2010). Further, thecorrelation between GMRT composite scores and reading scores on the Basic Academic Skills Sampleswere strong as well (.79; Jenkins & Jewell, 1992).
The measure of interest with the GMRT-4th is the extended scale scores (ESS). The ESS puts the resultsfrom the test on a single continuous scale to allow comparison across time and grades. All materialswere provided to students, including the test booklet and answer booklet.
Five trained aReading project team data collectors administered the GMRT-4th during February of 2011at two separate schools. Participants included students in first through Fifth Grades. Three classroomsper grade at School A participated (n = 622); all students in first through Fifth Grades at School Bparticipated (n = 760). The majority of students at Schools A and B were white (69%). Students wereadministered the word decoding/vocabulary and comprehension subtests of the GMRT-4th during twoseparate testing sessions. Some students were administered the word decoding/vocabulary sectionfirst while other students were administered the comprehension subtest first. See the Table 53 belowfor demographic information, disaggregated by school.
Table 53. Demographics for Criterion-Related Validity Sample for GMRT-4th and aReadingCategory School A School B
White 70% 69%
Black 6% 5%
Hispanic 9% 6%
Asian/Pacific Islander 13% 19%
American Indian/Alaskan Native 3% 1%
Free/Reduced Lunch 19% 14%
LEP 14% 14%
Special Education 11% 10%
Note. LEP = Limited English Proficiency. Percentages are rounded to whole numbers and therefore may not addto precisely 100.

Section 6. FAST as Evidence-Based Practice
Page | 98www.fastbridge.org
© 2015 Theodore J. Christ and Colleagues, LLC. All rights reserved.
Descriptive information for the GMRT-4th and correlation coefficients between each scale andaReading scores are provided in Table 63.
Table 54. Sample-Related Information for aReading Criterion-Related Validity Data
Decoding Vocabulary Comprehension Composite
Grade N Mean SD N Mean SD N Mean SD N Mean SD
1 348 436 47 - - - 130 407 44 125 409 43
2 163 449 43 - - - 215 459 49 - - -
3 - - - 170 485 41 168 484 42 165 484 40
4 - - - 182 504 39 180 503 42 175 502 36
5 - - - 182 513 31 187 518 35 181 514 30
1–5 511 442.5 45 534 501 39 881 477 56 646 483 53
Note. M = Mean; SD = Standard Deviation
Table 55. Correlation Coefficients between GMRT-4th and aReading Scaled Score
Note. Sample size is denoted by ().
Overall, there appears to be a strong positive correlation between composite scores from the GMRT-4th and aReading scaled scores. There is some variability between grades, with coefficient valuesbetween .64 and .83. Subtests showed greater variability. Specifically, comprehension correlationcoefficients ranged from .58 to .81.
Content, construct, and predictive validity of aReading is summarized in.
Table 56.
Grade Decoding Vocabulary Comprehension Composite
1 .82 (131) - .73 (130) .83 (125)
2 .68 (163) - .75 (215) -3 - .79 (170) .81 (168) .84 (165)
4 - .76 (182) .72 (180) .78 (175)
5 - .65 (182) .58 (187) .64 (181)
1–5 .75 (348) .74 (534) .82 (881) .86 (646)

Section 6. FAST as Evidence-Based Practice
Page | 99www.fastbridge.org
© 2015 Theodore J. Christ and Colleagues, LLC. All rights reserved.
Table 56. Content, Construct, and Predictive Validity of aReading
Type of
Validity Grade Test or Criterion N (range)
Coefficient
(if applicable)
Range Median
Content K–5 Reading teachers/experts
Content K–3 Items administered by Theta Level 287
Predictive
1–5
12*
3
4
5
Gates-MacGinitie
125–215
125215
165
175
181
0.64–0.84
0.830.75
0.84
0.78
0.64
0.78
Construct
1–5
12
3
4
5
Curriculum-Based Measurement of
Oral Reading Fluency
55–171
55171
108
114
103
0.56–0.83
0.830.81
0.74
0.80
0.56
0.80
Construct
1-5
12
3
4
5
MAP
55–398
55302
391
398
376
0.69–0.83
0.690.83
0.83
0.77
0.73
0.77
Note. Grade 2 Predictive validity for the GMRT-4th is based on the Comprehension subtest, whereas all othergrades are based on the overall composite score.
More recently, data collections have produced aReading criterion-related evidence with various othercriterion measures.
Table 57. Criterion Validity of Spring aReading with Spring Minnesota ComprehensiveAssessment III (MCA-III) in Reading: MN LEA 1 (Spring Data Collection)
Grade N aReading
M (SD)
MCA
M (SD)
r(x,y) Cut AUC Sens. Spec.
Some Risk (Meets Standards)
6 202 522.01 (15.45) 651.36 (15.07) .72** 521.5 .86 .78 .77
7 126 522.81 (14.95) 742.01 (15.26) .66** 528.5 .83 .77 .76
8 94 524.95 (14.11) 843.22 (11.88) .58** 534.5 .85 .81 .79
High Risk (Does Not Meet Standards)
6 202 522.01 (15.45) 651.36 (15.07) .72** 515.5 .83 .74 .74
7 126 522.81 (14.95) 742.01 (15.26) .66** 523 .82 .75 .778 94 524.95 (14.11) 843.22 (11.88) .58** 524.5 .84 .78 .78

Section 6. FAST as Evidence-Based Practice
Page | 100www.fastbridge.org
© 2015 Theodore J. Christ and Colleagues, LLC. All rights reserved.
Table 58. Criterion Validity for Spring aReading with Spring MCA-III in Reading: MN LEA 4(Spring Data Collection)
Grade NaReading
M (SD)
MCA-III
M (SD)r(x,y) Cut AUC Sens. Spec.
Some Risk (Does Not Meet or Partially Meets Standards)
3 629 534 (27) 347 (21) .82 532.5 .90 .83 .82
4 615 549 (28) 447 (16) .81 550.5 .89 .82 .82
5 516 564 (32) 553 (16) .84 556.5 .93 .84 .84
High Risk (Does Not Meet Standards)
3 629 534 (27) 347 (21) .82 524.5 .90 .82 .81
4 615 549 (28) 447 (16) .81 536.5 .92 .84 .84
5 516 564 (32) 553 (16) .84 544.5 .96 .89 .86
Table 59. Criterion Validity for Spring aReading with Spring MCA-III in Reading: MN LEA 3(Spring Data Collection)
Grade N
aReading
M (SD)
MCA-III
M (SD) r(x,y) Cut AUC Sens. Spec.
Some Risk (Does Not Meet or Partially Meets Standards)
3 156 504.97 (18.09) 351.56 (19.77) .82 502.5 .89 .80 .79
4 63 508.17 (20.75) 447.33 (16.11) .78 509.5 .86 .78 .74
5 148 528.02 (19.58) 557.91 (14.22) .82 523.5 .91 .84 .83
6 152 529.18 (20.93) 655.09 (18.11) .76 530.5 .86 .80 .78
Some Risk (Partially Meets Standards)
3 156 504.97 (18.09) 351.56 (19.77) .82 -- .59 -- --
4 63 508.17 (20.75) 447.33 (16.11) .78 -- .46 -- --
5 148 528.02 (19.58) 557.91 (14.22) .82 522.5 .80 .75 .75
6 152 529.18 (20.93) 655.09 (18.11) .76 530.5 .64 .68 .63
High Risk (Does Not Meet Standards)
3 156 504.97 (18.09) 351.56 (19.77) .82 498.5 .92 .83 .82
4 63 508.17 (20.75) 447.33 (16.11) .78 503.00 .95 .90 .85
5 148 528.02 (19.58) 557.91 (14.22) .82 510.5 .96 .85 .87
6 152 529.18 (20.93) 655.09 (18.11) .76 518.5 .95 .84 .87
Criterion-related validity evidence for aReading is not limited to the Midwest. See tables below.
Table 60. Criterion Validity of Spring aReading with Spring CRCT in Reading: GA LEA 1(Spring to Spring Prediction)
Grade N aReadingM (SD)
CRCTM (SD)
r(x,y) Cut AUC Sens. Spec.
Some Risk (Meets Standards)
3 327 501.56 (20) 848.62 (28) .75* 501.50 .84 .78 .78
4 314 513.53 (20) 848.30 (27) .77* 514.50 .86 .79 .79

Section 6. FAST as Evidence-Based Practice
Page | 101www.fastbridge.org
© 2015 Theodore J. Christ and Colleagues, LLC. All rights reserved.
5 347 519.34 (19) 841.27 (25) .74* 525.50 .83 .79 .78
High Risk (Does Not Meet Standards)
3 327 501.56 (20) 848.62 (28) .75* 478.50 .95 .91 .85
4 314 513.53 (20) 848.30 (27) .77* 493.00 .93 .83 .84
5 347 519.34 (19) 841.27 (25) .74* 502.50 .90 .85 .84
Table 61.Criterion Validity of Spring aReading with Spring Massachusetts ComprehensiveAssessment (MCA): MA LEA 1 (Spring Data Collection)
Grade N aReading
M (SD)
MCA
M (SD)
r(x,y) Cut AUC Sens. Spec.
Some Risk (“Warning” and “Needs Improvement”)
3 93 508.96 (22.16) 241.89 (14.08) .81** 503.5 .89 .76 .77
4 93 512.17 (19.09) 238.40 (19.09) .78** 513.5 .88 .75 .75
5 74 524.04 (15.41) 243.63 (13.20) .64** 523.5 .85 .76 .76
Some Risk (“Needs Improvement”)
3 93 508.96 (22.16) 241.89 (14.08) .81** 504.5 .77 .76 .784 93 512.17 (19.09) 238.40 (19.09) .78** 515 .73 .71 .63
5 74 524.04 (15.41) 243.63 (13.20) .64** 522.5 .83 .75 .76
High Risk (“Warning”)
3 93 508.96 (22.16) 241.89 (14.08) .81** 483.00 .97 .88 .92
4 93 512.17 (19.09) 238.40 (19.09) .78** 496.5 .95 .89 .85
5 74 524.04 (15.41) 243.63 (13.20) .64** 511.5 .84 1.00 .78
Chapter 2.7: Diagnostic Accuracy
earlyReadingearlyReading diagnostic accuracy information was derived from the sample described in Table 31.earlyReading diagnostic accuracy information is provided for both Kindergarten and First Grade, usingthe Group Reading Assessment Diagnostic Evaluation (GRADE™) as a criterion measure. Measures ofdiagnostic accuracy were used to determine decision thresholds using criteria related to sensitivity,specificity, and area under the curve (AUC). Specifically, specificity and sensitivity were computed atdifferent cut scores in relation to maximum AUC values. Decisions for final benchmark percentileswere generated based on maximizing each criterion at each cut score (i.e., when the cut scoremaximized specificity ≥ .70, and sensitivity was also ≥ .70; see Silberglitt & Hintze, 2005). In thescenario for which a value of .70 could not be achieved for either specificity or sensitivity, precedencewas given to maximizing specificity.

Section 6. FAST as Evidence-Based Practice
Page | 102www.fastbridge.org
© 2015 Theodore J. Christ and Colleagues, LLC. All rights reserved.
Table 62. Kindergarten Diagnostic Accuracy for earlyReading Measures15th Percentile 40th Percentile
AUC Cutpoint Sens.
Spec. Classification AUC Cutpoint Sens.
Spec. ClassificationConcepts of PrintF to F1 .86 7 .80 .82 .82 .80 9 .74 .69 .72F to S .82 7 .76 .71 .71 .74 8 .75 .65 .68
Onset SoundsF to F1 .94 8 .80 .81 .81 .79 12 .74 .69 .72F to S .88 7 .82 .89 .89 .74 12 .80 .77 .78W to S .76 14 .69 .86 .85 .73 15 .62 .78 .74
Letter NamesF to F1 .73 22 .60 .59 .59 .65 25 .60 .64 .62F to S .81 20 .76 .74 .74 .76 25 .69 .69 .69W to S .79 35 .72 .73 .73 .77 40 .73 .73 .73S to S .78 48 .71 .70 .70 .76 51 .71 .72 .72
Letter SoundsF to F1 .95 1 .86 .14 .87 .68 7 .63 .60 .61F to S .81 6 .76 .78 .78 .75 10 .67 .71 .70W to S .85 22 .78 .75 .75 .82 28 .75 .73 .74S to S .85 34 .82 .80 .80 .71 42 .73 .59 .63
RhymingF to F1 .89 5 .80 .80 .80 .77 9 .72 .69 .71F to S .80 6 .76 .75 .75 .81 8 .79 .72 .74W to S .92 7 .88 .89 .89 .83 12 .75 .76 .76S to S .86 14 .88 .75 .76 .76 15 .71 .69 .70
Word BlendingF to S .70 1 .88 .53 .56 .69 1 .77 .60 .65W to S .82 4 .82 .80 .80 .74 8 .73 .55 .60S to S .85 9 .88 .72 .73 .75 9 .64 .79 .75
Word SegmentingW to S .85 4 .82 .81 .81 .78 15 .75 .76 .76S to S .90 28 .94 .87 .87 .76 32 .72 .57 .61
Sight Words 50S to S .82 25 .78 .72 .72 .74 39 .71 .65 .66Decodable WordsS to S .90 3 .78 .87 .86 .77 9 .72 .68 .69Nonsense WordsW to S .86 3 .83 .79 .79 .76 5 .70 .72 .72S to S .90 6 .83 .81 .81 .78 8 .70 .79 .76
CompositeF to F1 .96 28 .80 .91 .91 .79 42 .74 .67 .71F to S .91 33 .88 .84 .84 .84 40 .80 .77 .78W to S .91 40 .94 .72 .77 .85 47 .84 .72 .75S to S .95 52 .75 .74 .74 .81 60 .75 .74 .74
Note. F = Fall; W = Winter; S = Spring; 1Base rates below the 15th percentile were low and above the 40th
percentile were high. Note. Fall to Fall was concurrent and used the GRADE Level P as the criterion. All othersused the GRADE Level K.
Based on these analyses, the values at the 40th and 15th percentiles were identified as the primaryand secondary benchmarks for earlyReading, respectively. These values thus correspond with a

Section 6. FAST as Evidence-Based Practice
Page | 103www.fastbridge.org
© 2015 Theodore J. Christ and Colleagues, LLC. All rights reserved.
prediction of performance at the 40th and 15th percentiles on the GRADE, a nationally normedreading assessment of early reading skills. Performance above the primary benchmark indicates thestudent is at low risk for long-term reading difficulties. Performance between the primary andsecondary benchmarks indicates the student is at some risk for long-term reading difficulties.Performance below the secondary benchmark indicates the student is at high risk for long-termreading difficulties. These risk levels help teachers accurately monitor student progress using theFAST™ earlyReading measures. See
Table 62 below for Diagnostic Accuracy results using the GRADE as the criterion measure.
Table 63. First Grade Diagnostic Accuracy for earlyReading Measures15th Percentile 40th Percentile
AUC Cutpoint Sens. Spec. Classification AUC Cutpoint Sens. Spec. Classification
Word Blending
F to S .87 6 .86 .80 .80 .82 7 .72 .72 .72
W to S .82 8 .60 .80 .79 .78 8 .56 .84 .80
S1 to S2 .68 9 .55 .67 .66 .65 9 .50 .69 .66
Word Segmenting
F to S .78 25 .71 .72 .72 .75 27 .72 .68 .68
W to S .82 29 .70 .74 .74 .79 30 .67 .67 .67
S1 to S2 .71 30 .64 .71 .70 .67 30 .53 .74 .70
Sight Words 150
F to S .97 5 .86 .92 .92 .91 14 .84 .81 .82
W to S .97 21 .90 .95 .94 .95 44 .85 .89 .88
S1 to S2 .97 48 .91 .96 .96 .95 61 .87 .92 .91
Decodable Words
F to S .90 2 .86 .85 .85 .88 5 .76 .74 .75
W to S .93 10 .80 .91 .91 .95 15 .85 .86 .86
S1 to S2 .93 22 .82 .82 .82 .96 24 .84 .89 .88
Nonsense Words
F to S .93 2 .86 .88 .88 .84 5 .76 .79 .79
W to S .88 12 .80 .75 .75 .92 14 .93 .78 .81
S1 to S2 .87 14 .89 .80 .81 .87 17 .81 .77 .78
Sentence Reading/CBMR1
F to S .97 10 .86 .93 .93 .93 18 .84 .84 .84
W to S .98 192 1.0 .95 .95 .98 372 .96 .91 .92
S1 to S2 .98 362 .82 .98 .97 .98 652 .94 .93 .93
Composite
F to S .98 25 1.0 .93 .93 .93 28 .76 .84 .83
W to S .98 34 1.0 .82 .83 .97 37 1.0 .77 .81

Section 6. FAST as Evidence-Based Practice
Page | 104www.fastbridge.org
© 2015 Theodore J. Christ and Colleagues, LLC. All rights reserved.
S1 to S2 .99 45 .89 .90 .90 .97 51 .92 .92 .92
Note. F = Fall; W = Winter; S = Spring; 1Sentence Reading was administered in the fall, CBMR was administered inthe winter and spring. 2Scores shown are equated.
More recently, diagnostic accuracy analyses have also been conducted using earlyReading subtestscores and composite scores to predict aReading. These findings are summarized in the tables below.Students were recruited from several school districts in Minnesota. Cut score was selected byoptimizing sensitivity at about .70 and balancing sensitivity with specificity (Silberglitt & Hintze, 2005).In the tables that follow, dashes indicate unacceptable sensitivity and specificity due to low AUC.
Table 64. Diagnostic Accuracy of Fall earlyReading Concepts of Print Subtest with WinteraReading: MN LEA 3 (Fall to Winter Prediction)
Grade N Concepts of Print
M (SD)
aReading
M (SD)
r(x,y) Cut AUC Sens. Spec.
Some Risk (< 40th percentile)
KG 5173 8.31 (2.63) 430.28 (27.43) .58** 6.5 .80 .77 .71
Some Risk (20th to 40th percentile)
KG 5173 8.31 (2.63) 430.28 (27.43) .58** 6.5 .81 .74 .75
High Risk (< 20th percentile)
KG 5173 8.31 (2.63) 430.28 (27.43) .58** 6.5 .81 .79 .70
Table 65. Diagnostic Accuracy of Fall earlyReading Onset Sounds Subtest with Winter aReading:MN LEA 3 (Fall to Winter Prediction)
Grade N Onset Sounds
M (SD)
aReading
M (SD)
r(x,y) Cut AUC Sens. Spec.
Some Risk (< 40th percentile)
KG 13203 11.59 (4.28) 430.28 (27.43) 63** 8.50 .84 .79 .77
Some Risk (20th to 40th percentile)
KG 13203 11.59 (4.28) 430.28 (27.43) .63** 8.50 .84 .79 .77
High Risk (< 20th percentile)
KG 13203 11.59 (4.28) 430.28 (27.43) .63** 7.5 .83 .79 .77
Table 66. Diagnostic Accuracy of Fall earlyReading Letter Names Subtest with Winter aReading:MN LEA 3 (Fall to Winter Prediction)
Grade N Letter Names
M (SD)
aReading
M (SD)
r(x,y) Cut AUC Sens. Spec.
Some Risk (< 40th percentile)
KG 5173 27.29 (22.38) 430.28 (27.43) .69** 11.50 .78 .71 .70
Some Risk (20th to 40th percentile)
KG 5173 27.29 (22.38) 430.28 (27.43) .69** 14.5 .79 .74 .73
High Risk (< 20th percentile)
KG 5173 27.29 (22.38) 430.28 (27.43) .69** 9.5 .82 .73 .73

Section 6. FAST as Evidence-Based Practice
Page | 105www.fastbridge.org
© 2015 Theodore J. Christ and Colleagues, LLC. All rights reserved.
Table 67. Diagnostic Accuracy of Fall earlyReading Letter Sounds Subtest with Winter aReading:MN LEA 3 (Fall to Winter Prediction)
Grade N Letter Sounds
M (SD)
aReading
M (SD)
r(x,y) Cut AUC Sens. Spec.
Some Risk (< 40th percentile)
KG 5173 11.57 (11.76) 430.28 (27.43) .62** 2.5 .80 .71 .731 842 34.83 (14.89) 466.04 (27.16) .65 30.5 .73 .66 .65
Some Risk (20th to 40th percentile)
KG 5173 11.57 (11.76) 430.28 (27.43) .62** 3.5 .77 .72 .67
High Risk (< 20th percentile)
KG 5173 11.57 (11.76) 430.28 (27.43) .62** 1.5 .82 .79 .781 842 34.83 (14.89) 466.04 (27.16) .65 17.5 .99 1.00 .89
Table 68. Diagnostic Accuracy of Fall earlyReading Letter Sounds Subtest with Spring aReading:MN LEA 3 (Fall to Spring Prediction)
Grade N Letter Sounds
M (SD)
aReading
M (SD)
r(x,y) Cut AUC Sens. Spec.
Some Risk (< 40th percentile)
1 842 34.83 (14.89) 457.39 (25.21) .31** 29.50 .75 .70 .69
High Risk (< 20th percentile)
1 842 34.83 (14.89) 457.39 (25.21) .31** 27.50 .78 .74 .71
Table 69. Diagnostic Accuracy of Winter earlyReading Letter Sounds Subtest with SpringaReading: MN LEA 3 (Winter to Spring Prediction)
Grade N Letter Sounds
M (SD)
aReading
M (SD)
r(x,y) Cut AUC Sens. Spec.
Some Risk (< 40th percentile)
1 208 43.62 (18.25) 457.39 (25.21) .58** 40.50 .77 .70 .72
High Risk (< 20th percentile)
1 208 43.62 (18.25) 457.39 (25.21) .58** 40.50 .76 .73 .70
Table 70. Diagnostic Accuracy of Winter earlyReading Rhyming Subtest with Spring aReading:MN LEA 3 (Winter to Spring Prediction)
Grade N RhymingM (SD)
aReadingM (SD)
r(x,y) Cut AUC Sens. Spec.
Some Risk (< 40th percentile)
1 106 13.28 (3.34) 457.39 (25.21) .53** 14.50 .75 .70 .70
High Risk (< 20th percentile)
1 106 13.28 (3.34) 457.39 (25.21) .53** 14.50 .71 .70 .64

Section 6. FAST as Evidence-Based Practice
Page | 106www.fastbridge.org
© 2015 Theodore J. Christ and Colleagues, LLC. All rights reserved.
Table 71. Diagnostic Accuracy of Fall earlyReading Word Segmenting Subtest with WinteraReading: MN LEA 3 (Fall to Winter Prediction)
Grade N Word Segmenting
M (SD)
aReading
M (SD)
r(x,y) Cut AUC Sens. Spec.
Some Risk (< 40th percentile)
1 - - - - - - - -
High Risk (< 20th percentile)
1 9843 26.20 (7.41) 466.04 (27.16) .51** 22.50 .87 .78 .78
Table 72. Diagnostic Accuracy of Fall earlyReading Nonsense Words Subtest with WinteraReading: MN LEA 3 (Fall to Winter Prediction)
Grade N Nonsense Words
M (SD)
aReading
M (SD)
r(x,y) Cut AUC Sens. Spec.
Some Risk (< 40th percentile)
1 7997 13.14 (22.13) 466.04 (27.16) .62** 9.50 .66 .60 .61
High Risk (< 20th percentile)
1 7997 13.14 (22.13) 466.04 (27.16) .62** 5.50 .89 .83 .78
Table 73. Diagnostic Accuracy of Fall earlyReading Sight Words Subtest with Winter aReading:MN LEA 3 (Fall to Winter Prediction)
Grade N Sight Words
M (SD)
aReading
M (SD)
r(x,y) Cut AUC Sens. Spec.
Some Risk (< 40th percentile)
1 9685 32.76 (33.40) 466.04 (27.16) .67** 26.50 .69 .71 .58
High Risk (< 20th percentile)
1 9685 32.76 (33.40) 466.04 (27.16) .67** 4.5 .92 .85 .87
Table 74. Diagnostic Accuracy of Fall earlyReading Sentence Reading Subtest with WinteraReading: MN LEA 3 (Fall to Winter Prediction)
Grade N Sentence ReadingM (SD)
aReadingM (SD)
r(x,y) Cut AUC Sens. Spec.
Some Risk (< 40th percentile)
1 9618 34.23 (37.43) 466.04 (27.16) .70** 19.5 .71 .70 .60
High Risk (< 20th percentile)
1 9618 34.23 (37.43) 466.04 (27.16) .70** 6.5 .94 .90 .87

Section 6. FAST as Evidence-Based Practice
Page | 107www.fastbridge.org
© 2015 Theodore J. Christ and Colleagues, LLC. All rights reserved.
Table 75. Diagnostic Accuracy of Fall earlyReading Sentence Reading Subtest with SpringaReading: MN LEA 3 (Fall to Spring Prediction)
Grade N Sentence ReadingM (SD)
aReadingM (SD)
r(x,y) Cut AUC Sens. Spec.
Some Risk (< 40th percentile)
1 - - - - - - - -
High Risk (< 20th percentile)
1 9618 34.23 (37.43) 457.39 (25.21) .66** 15.50 .72 .68 .66
Table 76. Diagnostic Accuracy of Winter earlyReading Sentence Reading Subtest with SpringaReading: MN LEA 3 (Winter to Spring Prediction)
Grade N Sentence Reading
M (SD)
aReading
M (SD)
r(x,y) Cut AUC Sens. Spec.
Some Risk (< 40th percentile)
1 433 57.36 (36.69) 457.39 (25.21) .78** 32.50 .82 .76 .76
High Risk (< 20th percentile)
1 433 57.36 (36.69) 457.39 (25.21) .78** 22.50 .92 .85 .85
Table 77. Diagnostic Accuracy of Winter earlyReading Composite with Winter aReading:MN LEA 3 (Fall to Winter Prediction)
Grade N Composite
M (SD)
aReading
M (SD)
r(x,y) Cut AUC Sens. Spec.
Some Risk (< 40th percentile)
KG 577 34.45 (12.86) 430.95 (27.353) .70** 27.5 .84 .77 .78
1 589 30.44 (9.99) 466.74 (27.05) .73** 24.5 .85 .85 .73
Some Risk (20th to 40th percentile)
KG 577 34.45 (12.86) 430.95 (27.353) .70** 28.5 .79 .72 .70
1 590 30.44 (9.99) 466.74 (27.05) .73** 24.5 .73 .75 .66
High Risk (< 20th percentile)
KG 577 34.45 (12.86) 430.95 (27.353) .70** 25.5 .82 .79 .76
1 590 30.44 (9.99) 466.74 (27.05) .73** 23.5 .89 .86 .77
Table 78. Diagnostic Accuracy of Fall earlyReading Composite with Spring aReading: MN LEA 3(Fall to Spring Prediction)
Grade N Composite
M (SD)
aReading
M (SD)
r(x,y) Cut AUC Sens. Spec.
Some Risk (< 40th percentile)
KG 577 34.45 (12.86) 415.34 (27.16) .64** 37.50 .73 .68 .70
High Risk (< 20th percentile)
KG 577 34.45 (12.86) 415.34 (27.16) .64** 34.50 .76 .71 .70

Section 6. FAST as Evidence-Based Practice
Page | 108www.fastbridge.org
© 2015 Theodore J. Christ and Colleagues, LLC. All rights reserved.
Table 79. Diagnostic Accuracy of Winter earlyReading Composite with Spring aReading:MN LEA 3 (Winter to Spring Prediction)
Grade N CompositeM (SD)
aReadingM (SD)
r(x,y) Cut AUC Sens. Spec.
Some Risk (< 40th percentile)
KG 479 42.92 (15.6) 415.34 (27.16) .74** 49.50 .84 .76 .76
High Risk (< 20th percentile)
KG 479 42.92 (15.6) 415.34 (27.16) .74** 43.50 .84 .73 .77
Table 80. Diagnostic Accuracy of Fall earlyReading Composite (2014–15 Weights) with SpringaReading: MN LEA 3 (Fall to Spring Prediction)
Grade N Composite
M (SD)
aReading
M (SD)r(x,y) Cut AUC Sens. Spec.
Some Risk (<40th percentile)
KG 514 35.03 (6.28) 415.64 (27.24) .69** 35.5 .75 .69 .701 170 40.23 (10.78) 459.89 (26.03) .81** 34.5 .65 .63 .60
High Risk (<20th percentile)
KG 514 35.03 (6.28) 415.64 (27.24) .69** 34.5 .78 .74 .701 170 40.23 (10.78) 459.89 (26.03) .81** 34.5 .70 .69 .60
Table 81. Diagnostic Accuracy of Winter earlyReading Composite (2014-15 Weights) with SpringaReading: MN LEA 3 (Winter to Spring Prediction)
Grade N Composite
M (SD)
aReading
M (SD)r(x,y) Cut AUC Sens. Spec.
Some Risk (<40th percentile)
KG 522 48.02 (9.91) 415.34 (27.18) .75 51.5 .85 .79 .751 171 49.77 (13.87) 459.25 (27.28) .77 -- .65 -- --
High Risk (<20th percentile)
KG 522 48.02 (9.91) 415.34 (27.18) .75 48.5 .86 .79 .771 171 49.77 (13.87) 459.25 (27.28) .77 43.5 .71 .71 .62
CBMreadingCBMreading diagnostic accuracy information is provided for first through Sixth Grades, using theTOSREC, and MAP as the criterion measures. Measures of diagnostic accuracy were used to determinedecision thresholds using criteria related to sensitivity, specificity, and area under the curve (AUC).Specifically, specificity and sensitivity were computed at different cut scores in relation to maximumAUC values. Decisions for final benchmark percentiles were generated based on maximizing eachcriterion at each cut score (i.e., when the cut score maximized specificity ≥ .70, and sensitivity was also≥ .70; see Silberglitt & Hintze, 2005). In the scenario for which a value of .70 could not be achieved foreither specificity or sensitivity, precedence was given to maximizing specificity.

Section 6. FAST as Evidence-Based Practice
Page | 109www.fastbridge.org
© 2015 Theodore J. Christ and Colleagues, LLC. All rights reserved.
CBMreading diagnostic accuracy was determined based on a sample of 1,153 students in the state ofMinnesota, spanning across three regions. Data was collected during the 2012–13 school year. Thesample consisted of approximately 45% males and 55% females. Approximately 20% of the studentsinvolved were eligible for free and reduced lunch. The majority of students were White (52%). Theremainder of the sample consisted of approximately 30% Hispanic, 12% Black, 4% Asian or PacificIslander, and 1% American Indian or Alaska Native. Approximately 15% of students were receivingspecial education services. All participants were proficient in English. See Table 82 on the followingpage for diagnostic accuracy results.
Table 82. Diagnostic Accuracy by Grade Level for CBMreading PassagesGrade Level N Cuta AUC Sens. Spec. Classif. Lag Time Criterion Measure20th Percentile1 171 16.5 0.81 0.75 0.63 0.71 2 to 4 TOSREC2 206 42.5 0.93 0.88 0.87 0.88 2 to 43 188 75.5 0.89 0.84 0.83 0.84 2 to 44 181 108.5 0.87 0.78 0.82 0.79 2 to 45 202 107.5 0.90 0.84 0.79 0.83 2 to 46 205 118.5 0.90 0.92 0.72 0.88 2 to 41 171 17 0.77 0.63 0.82 0.74 4 months MAP2 206 57 0.82 0.63 0.85 0.76 4 mo.3 188 88 0.8 0.77 0.75 0.76 4 mo.4 181 113 0.88 0.82 0.81 0.81 4 mo.5 202 101 0.89 0.7 0.91 0.86 4 mo.6 205 126 0.89 0.83 0.82 0.82 4 mo.1 171 21 0.79 0.78 0.7 0.73 8 mo.2 206 63 0.82 0.83 0.68 0.72 8 mo.3 188 67 0.77 0.51 0.88 0.75 8 mo.4 181 104 0.89 0.8 0.86 0.84 8 mo.5 202 97 0.89 0.74 0.92 0.88 8 mo.6 205 126 0.89 0.85 0.82 0.83 8 mo.1 171 16 0.8 0.66 0.81 0.76 ~1 year2 206 82 0.9 0.87 0.84 0.86 ~1 year3 188 88 0.89 0.82 0.81 0.82 ~1 year4 181 114 0.87 0.83 0.76 0.78 ~1 year5 202 108 0.89 0.8 0.85 0.84 ~1 year6 205 126 0.85 0.77 0.79 0.79 ~1 year30th Percentile1 171 16.5 0.81 0.75 0.63 0.71 2 to 4 TOSREC2 206 44.5 0.94 0.91 0.83 0.89 2 to 43 188 79.5 0.88 0.83 0.83 0.83 2 to 44 181 117.5 0.83 0.73 0.79 0.75 2 to 45 202 115.5 0.87 0.79 0.77 0.79 2 to 46 205 135.5 0.88 0.76 0.82 0.78 2 to 41 171 31 0.78 0.84 0.57 0.74 4 mo. MAP2 206 82 0.83 0.81 0.73 0.78 4 mo.3 188 85 0.77 0.57 0.86 0.66 4 mo.4 181 128 0.82 0.84 0.59 0.74 4 mo.5 202 125 0.82 0.65 0.75 0.69 4 mo.6 205 144 0.82 0.76 0.75 0.75 4 mo.1 171 24 0.78 0.74 0.7 0.73 8 mo.2 206 82 0.78 0.77 0.54 0.67 8 mo.3 188 98 0.8 0.82 0.65 0.76 8 mo.4 181 125 0.84 0.66 0.85 0.75 8 mo.5 202 128 0.86 0.8 0.73 0.76 8 mo.6 205 144 0.79 0.74 0.7 0.71 8 mo.1 171 22 0.83 0.76 0.77 0.76 ~1 year

Section 6. FAST as Evidence-Based Practice
Page | 110www.fastbridge.org
© 2015 Theodore J. Christ and Colleagues, LLC. All rights reserved.
2 206 82 0.91 0.72 0.89 0.76 ~1 year3 188 104 0.85 0.63 0.92 0.71 ~1 year4 181 122 0.85 0.7 0.86 0.78 ~1 year5 202 135 0.82 0.77 0.68 0.73 ~1 year6 205 144 0.8 0.76 0.75 0.75 ~1 year
Note. aCut score was selected by optimizing sensitivity and then balancing it with specificity using methodspresented by Silberglitt and Hintze (2005)
Further diagnostic accuracy analyses were conducted using the Minnesota ComprehensiveAssessment III. Students were administered the Minnesota Comprehensive Assessment III (MCA-III) inReading in grades 3, 4, and 5. The MCAs are state tests that help school districts measure studentprogress toward Minnesota’s academic standards and meet the requirements of the Elementary andSecondary Education Act (ESEA). Additionally, students completed three FastBridge LearningCBMreading probes during the spring. The median score was computed. Only those studentsproviding complete data were utilized in the diagnostic accuracy analyses. More specifically, studentswith incomplete data regarding CBM-R Words Read Correctly (WRC) per minute, or those studentswith incomplete MCA-III Achievement Level Scores were excluded from analyses. ROC Analysis wasused to determine diagnostic accuracy of FastBridge Learning CBMreading probes with Spring MCA-IIIscale scores serving as the criterion measure. Students were disaggregated by grade level. Diagnosticaccuracy was computed for students identified as being at “High Risk” and those identified as“Somewhat at Risk” for reading difficulties using MCA-III Achievement Level Criteria (See Table 83).Data collection is ongoing.
Table 83. Diagnostic Accuracy for CBMreading and MCA III
Grade N CBM-R
M (SD)
MCA-III
M (SD)r(x,y) Cuta AUC Sensitivity Specificity
High Risk (Does Not Meet Standards)
K -- -- NA -- -- -- -- --1 -- -- NA -- -- -- -- --
2 -- -- NA -- -- -- -- --
3 852 139 (40) 348 (20) .76 131.5 .88 .80 .79
4 818 165 (39) 447 (15) .71 153.5 .87 .80 .78
5 771 165 (40) 552 (16) .70 151.5 .89 .80 .79
6 to 12 -- -- Pending -- -- -- --
Somewhat High Risk (Does Not Meet or Partially Meets Standards)
K -- -- NA -- -- -- -- --1 -- -- NA -- -- -- -- --
2 -- -- NA -- -- -- -- --
3 852 139 (40) 348 (20) .76 141.5 .86 .78 .76
4 818 165 (39) 447 (15) .71 164.5 .83 .75 .71
5 771 165 (40) 552 (16) .70 163.5 .84 .77 .76
6 to 12 -- -- Pending -- -- -- --
Note. M = Mean. SD = Standard Deviation. aCut score was selected to balance sensitivity and specificity usingmethods modified from Silberglitt and Hintze (2005)

Section 6. FAST as Evidence-Based Practice
Page | 111www.fastbridge.org
© 2015 Theodore J. Christ and Colleagues, LLC. All rights reserved.
Additional diagnostic accuracy analyses for various grade levels across multiple states is summarizedin the tables on the following page.
Table 84. Diagnostic Accuracy on Fall CBMreading with Spring CRCT in Reading: GA LEA 1 (Fallto Spring Prediction)
Grade N CBMreading
M (SD)
CRCT
M (SD)
r(x,y) Cut AUC Sens. Spec.
Some Risk (Meets Standards)
3 329 115.96 (42) 848.65 (28) .66* 116.50 .79 .72 .714 320 137.64 (41) 848.18 (27) .65* 130.50 .81 .72 .73
5 353 149.27 (40) 841.22 (25) .57* 150.50 .71 .66 .66
High Risk (Does Not Meet Standards)
3 329 115.96 (42) 848.65 (28) .66* 80.50 .89 .82 .834 320 137.64 (41) 848.18 (27) .65* 100.50 .85 .83 .85
5 353 149.27 (40) 841.22 (25) .57* 128.50 .82 .79 .71
Table 85. Diagnostic Accuracy on Winter CBMreading on Spring CRCT in Reading: GA LEA 1(Winter to Spring Prediction)
Grade N CBMreading
M (SD)
CRCT
M (SD)
r(x,y) Cut AUC Sens. Spec.
Some Risk (Meets Standards)
3 327 117.22 (43) 848.64 (28) .64* 119.50 .76 .69 .694 318 136.52 (41) 848.33 (27) .61* 133.50 .78 .70 .71
5 350 149.75 (40) 841.14 (25) .57* 152.50 .71 .65 .66
High Risk (Does Not Meet Standards)
3 327 117.22 (43) 848.64 (28) .64* 72.00 .92 .83 .874 318 136.52 (41) 848.33 (27) .61* 101.00 .90 .83 .84
5 350 149.75 (40) 841.14 (25) .57* 133.50 .80 .64 .68

Section 6. FAST as Evidence-Based Practice
Page | 112www.fastbridge.org
© 2015 Theodore J. Christ and Colleagues, LLC. All rights reserved.
Table 86. Diagnostic Accuracy of Fall CBMreading with Spring MCA-III in Reading: MN LEA 3 (Fallto Spring Prediction)
Grade NCBMreadingM (SD)
MCA-IIIM (SD) r(x,y) Cut AUC Sens. Spec.
Some Risk (Does Not Meet or Partially Meets Standards)
3 488 98.94 (42.72) 353.22 (22) .71 89.5 .85 .74 .754 486 126.67 (46.38) 451.25 (22) .70 126.5 .87 .79 .78
5 492 139.96 (40.73) 554.19 (16) .73 131.5 .87 .78 .77
6 463 145.71 (39.80) 654.68 (19) .68 143.5 .83 .76 .74
Some Risk (Partially Meets Standards)
3 488 98.94 (42.72) 353.22 (22) .71 -- .57 -- --4 486 126.67 (46.38) 451.25 (22) .70 127.5 .64 .70 .59
5 492 139.96 (40.73) 554.19 (16) .73 137.5 .68 .72 .58
6 463 145.71 (39.80) 654.68 (19) .68 151.5 .62 .70 .53
High Risk (Does Not Meet Standards)
3 488 98.94 (42.72) 353.22 (22) .71 77.5 .89 .78 .814 486 126.67 (46.38) 451.25 (22) .70 109.5 .88 .80 .79
5 492 139.96 (40.73) 554.19 (16) .73 116.5 .91 .82 .81
6 463 145.71 (39.80) 654.68 (19) .68 132.5 .88 .77 .78
Table 87. Diagnostic Accuracy for Fall CBMreading with Spring Minnesota ComprehensiveAssessment III (MCA-III) in Reading: MN LEA 2 (Fall to Spring Prediction)
Grade NCBMreadingM (SD)
MCAM (SD) r(x,y) Cut AUC Sens. Spec.
Some Risk (Does Not Meet or Partially Meets Standards)
3 249 107.97 (42) 351.53 (28) .71** 106 .82 .77 .774 236 134.75 (40) 452.51 (16) .70** 131.5 .85 .76 .77
5 229 154.78 (36) 559.07 (15) .65** 146.5 .85 .74 .73
Some Risk (Partially Meets Standards)
3 249 107.97 (42) 351.53 (28) .71** 107.5 .62 .68 .58
4 236 134.75 (40) 452.51 (16) .70** 132.5 .65 .69 .61
5 229 154.78 (36) 559.07 (15) .65** 150.5 .71 .70 .62
High Risk (Does not meet Standards)3 249 107.97 (42) 351.53 (28) .71** 97.5 .82 .77 .764 236 134.75 (40) 452.51 (16) .70** 117.5 .89 .81 .80
5 229 154.78 (36) 559.07 (15) .65** 129.5 .91 .88 .85

Section 6. FAST as Evidence-Based Practice
Page | 113www.fastbridge.org
© 2015 Theodore J. Christ and Colleagues, LLC. All rights reserved.
Table 88. Diagnostic Accuracy for Winter CBMreading with Spring Minnesota ComprehensiveAssessment III (MCA-III) in Reading: MN LEA 2 (Winter to Spring Prediction)
GradeN
CBMreading
M (SD)
MCA
M (SD)r(x,y) Cut AUC Sens. Spec.
Some Risk (Does Not Meet or Partially Meets Standards)
3 250 125.46 (41) 352.28 (26) .73** 125.5 .83 .75 .764 240 149.38 (40) 451.76 (16) .69** 148.5 .83 .76 .76
5 229 164.52 (34) 558.99 (15) .65** 153.5 .87 .79 .77
Some Risk (Partially Meets Standards)
3 250 125.46 (41) 352.28 (26) .73** -- .59 -- --4 240 149.38 (40) 451.76 (16) .69** -- .60 -- --
5 229 164.52 (34) 558.99 (15) .65** 152.5 .74 .70 .69
High Risk (Does Not Meet Standards)
3 250 125.46 (41) 352.28 (26) .73** 113.5 .85 .78 .794 240 149.38 (40) 451.76 (16) .69** 135.5 .89 .80 .80
5 229 164.52 (34) 558.99 (15) .65** 138.5 .91 .88 .85
Table 89. Diagnostic Accuracy for Winter CBMreading with MCA-III in Reading: MN LEA 3 (Winterto Spring Prediction)
Grade N
CBMreading
M (SD)
MCA-III
M (SD) r(x,y) Cut AUC Sens. Spec.
Some Risk (Does Not Meet or Partially Meets Standards)
3 496 123.11 (44) 353.06 (22) .73 117.5 .86 .77 .794 497 145.20 (48) 450.97 (22) .69 144.5 .87 .78 .76
5 497 159.21 (42) 554.22 (15) .72 150.5 .86 .77 .79
6 466 162.05 (41) 654.55 (19) .67 162.5 .81 .73 .73
Some Risk (Partially Meets Standards)
3 496 123.11 (44) 353.06 (22) .73 -- .56 -- --4 497 145.20 (48) 450.97 (22) .69 147.5 .63 .69 .56
5 497 159.21 (42) 554.22 (15) .72 156.5 .65 .67 .54
6 466 162.05 (41) 654.55 (19) .67 167.5 .58 .68 .50
High Risk (Does Not Meet Standards)
3 496 123.11 (44) 353.06 (22) .73 105.5 .90 .81 .824 497 145.20 (48) 450.97 (22) .69 129.0 .88 .80 .79
5 497 159.21 (42) 554.22 (15) .72 134.5 .93 .85 .85
6 466 162.05 (41) 654.55 (19) .67 148.5 .88 .81 .83

Section 6. FAST as Evidence-Based Practice
Page | 114www.fastbridge.org
© 2015 Theodore J. Christ and Colleagues, LLC. All rights reserved.
Table 90. Diagnostic Accuracy of Winter CBMreading with Spring Massachusetts ComprehensiveAssessment (MCA): MA LEA 1 (Winter to Spring Prediction)
Grade NCBMreadingM (SD)
MCAM (SD) r(x,y) Cut AUC Sens. Spec.
Some Risk (“Warning” and “Needs Improvement”)
3 92 123.82 (38) 241.89 (14) .71** 114 .82 .76 .754 93 134.33 (41) 238.40 (15) .68** 132.5 .81 .73 .73
5 75 153.03 (26) 243.63 (13) .66** 155.5 .90 .76 .74
Some Risk (“Needs Improvement”)
3 92 123.82 (38) 241.89 (14) .71** 116.5 .68 .72 .644 93 134.33 (41) 238.40 (15) .68** 134 .69 .72 .60
5 75 153.03 (26) 243.63 (13) .66** 154.5 .88 .75 .77
High Risk (“Warning”)
3 92 123.82 (38) 241.89 (14) .71** 90.5 .97 .88 .894 93 134.33 (41) 238.40 (15) .68** 109.5 .89 .78 .79
5 75 153.03 (26) 243.63 (13) .66** 130.5 .82 1.00 .80
aReadingaReading diagnostic accuracy was derived from a sample of 777 students in first through Fifth Gradesfrom two suburban schools in the Midwest. In the sample, 116 students were in First Grade, 188 insecond, 159 in third, 156 in fourth, and 158 in Fifth Grade. Gender of the sample was approximately49% female and 51% male. Approximately 67% of students in the sample were White, 5% Black, 19%Asian/Pacific Islander, 5% Hispanic, 2% American Indian, and 2% unspecified. In addition, 10% ofstudents were receiving special education services, and 10% of students were classified as havinglimited English language proficiency. Socioeconomic status information was not available for thesample, but the schools the students were drawn from had rates of free and reduced lunch of 13% and23% in 2009–10. Cut scores for aReading to predict students “At Risk” and “Somewhat At Risk” forreading difficulties were developed for the Gates-MacGinitie Reading Tests–Fourth Edition (GMRT-4th;MacGinitie, MacGinitie, Maria, & Dreyer, 2000) and the Measures of Academic Progress (MAP).Categories for the former were defined as students scoring below the 40th and 20th percentiles of thelocal sample and cut scores for each category developed by an adjacent school district for MAP wereused on this sample. An additional analysis regarding diagnostic accuracy of aReading using TheMinnesota Comprehensive Assessments (MCAs) as the criterion measure is briefly discussed. At thebeginning of the school year (October, 2010) students completed an aReading assessment. Themeasure was group administered via a mobile computer lab. Scaled scores were calculated for eachstudent. In February 2011, the same students completed the GMRT-4th. Composite scores wereavailable for all grades except Second Grade. Due to time constraints, one subtest could not beadministered to Second Grade students (the only grade that requires three subtests to yield acomposite score). As a result, comprehension subtest scores were used for analysis. The GMRT-4th wasgroup administered by a team of graduate students. Administrators completed advanced courseworkin psychological assessment and completed an in-service training to administer the test. Test booklets

Section 6. FAST as Evidence-Based Practice
Page | 115www.fastbridge.org
© 2015 Theodore J. Christ and Colleagues, LLC. All rights reserved.
were hand scored and inter-rater reliability was 100% across all subtest and composite scores. MAPscores for spring testing were provided to the aReading team from school administrators.
Table 91 below presents the ROC curve analysis results for each grade for students at high risk andsomewhat at risk using the Youden Index with the GMRT-4th. In addition, sensitivity, specificity, PPPand NPP are displayed for the each grade for each cut score. ROC curves across grades and risk levelswere far from the diagonal line indicating that aReading predicts reading difficulties with much moreaccuracy than chance. Evaluation of the table below indicated that across grades, AUC statistics wereextremely high, especially for students at high risk (Mdn = .92) and values were still high for studentssomewhat at risk (Mdn = .87). In addition, Sensitivity was higher for each grade when determiningstudents at high risk compared to somewhat risk. Positive Predictive Power was higher across gradeswhen predicting students at somewhat risk (Mdn = .72 versus .56) while the opposite was true forNegative Predictive Power (Mdn = .82 versus .96) respectively.
Table 91. Diagnostic Accuracy statistics for aReading and GMRT-4th
Grade N aReading Cut Score Sensitivity Specificity PPP NPP AUCHigh Risk – Below 20th Percentilea
1 116 430 .88 .87 .66 .96 .94
2 188 461 .70 .93 .74 .92 .88
3 159 490 .97 .77 .50 .99 .92
4 156 495 .85 .92 .72 .96 .94
5 159 506 .85 .84 .59 .95 .87
Somewhat at Risk – Below 40th Percentile1 116 436 .76 .86 .81 .82 .91
2 188 477 .86 .71 .71 .86 .87
3 159 490 .82 .87 .78 .90 .89
4 156 506 .72 .82 .73 .81 .82
5 159 522 .83 .76 .71 .86 .85
Note. aThe 20th percentile was used for this sample, which should approximate the 15th percentile.
A similar pattern of results emerged when predicting performance on the MAP (See Table 92).Compared to the GMRT-4th as a criterion, NPP was much higher when predicting MAP scores. Thiscould be attributed to the fact that the base rate of students at risk was much lower for MAP scores.Data collection for Kindergarten and for grades 6–12 are ongoing, and results are pending.

Section 6. FAST as Evidence-Based Practice
Page | 116www.fastbridge.org
© 2015 Theodore J. Christ and Colleagues, LLC. All rights reserved.
Table 92. Diagnostic Accuracy Statistics for aReading and MAPGrade N aReading Cut Score Sensitivity Specificity PPP NPP AUCHigh Risk - 20th Percentilea
2 188 497 1 .73 .14 1 .89
3 159 517 .95 .76 .21 1 .95
4 156 537 .96 .78 .30 1 .94
5 159 537 1 .82 .20 1 .93
Somewhat at Risk - 40th Percentile2 188 490 .77 .84 .41 .96 .89
3 159 527 .89 .77 .46 .97 .89
4 156 537 .82 .87 .65 .94 .92
5 159 547 .93 .77 .39 .99 .88
Note. aThe 20th percentile was used for this sample, which should approximate the 15th percentile.
Finally, diagnostic accuracy analyses were conducted with aReading and the MinnesotaComprehensive Assessment (MCA) to determine if aReading predicted state reading assessments. TheMCA is a state test that helps school districts measure student progress toward academic standardsand meets the requirements of the Elementary and Secondary Education Act (ESEA).
The sample consisted of 1,786 students in third, fourth, and Fifth Grades from eight schools in theupper Midwest (MCAs are not administered to students in grades K–1). In the sample, 631 studentswere in third, 618 students were in fourth, and 537 students were in Fifth Grade. Gender of the samplewas approximately 50% female and 50% male. Ethnic breakdown was approximately 45% White, 23%Black, 8% Asian/Pacific Islander, 15% Hispanic, 0.8% American Indian or Alaska Native, and 9%multiracial. (These percentages were rounded and may not add to 100). In addition, 12% of studentswere receiving special education services. Socioeconomic status information was not available for thesample, but the schools the students were drawn from had rates of free and reduced lunch rangingfrom 16% to 83% in 2013.
Students completed the Adaptive Reading (aReading) assessment and MCAs during the spring of2013. Students with incomplete data in aReading, or those students with incomplete MCAAchievement Level Scores were excluded from analyses.
ROC Analysis was used to determine diagnostic accuracy of FAST™ aReading with Spring MCA scalescores serving as the criterion measure. Students were disaggregated by grade level. Diagnosticaccuracy was computed for students at “High Risk” and “Somewhat At Risk” on MCA Scale Scores.“High Risk” includes those students that did not meet standards. “Somewhat At Risk” includes thosestudents who did not meet or only partially met standards. Diagnostic accuracy statistics are providedin Table 93. Data collection is ongoing for all grade levels.
Table 93. Diagnostic Accuracy for aReading and MCA-IIIGrade
LevelN aReading
M (SD)
MCA-III
M (SD)r(x,y) Cuta AUC Sens. Spec.
High Risk (Does Not Meet Standards)

Section 6. FAST as Evidence-Based Practice
Page | 117www.fastbridge.org
© 2015 Theodore J. Christ and Colleagues, LLC. All rights reserved.
3 629 534 (27) 347 (21) .82 524.5 .90 .82 .81
4 615 549 (28) 447 (16) .81 536.5 .92 .84 .84
5 516 564 (32) 553 (16) .84 544.5 .96 .89 .86
Somewhat High Risk (Does Not Meet or Partially Meets Standards)3 629 534 (27) 347 (21) .82 532.5 .90 .83 .82
4 615 549 (28) 447 (16) .81 550.5 .89 .82 .82
5 516 564 (32) 553 (16) .84 556.5 .93 .84 .84
More recently, the following diagnostic accuracy statistics were derived from samples of studentsacross various states, using various criterion measures.
Table 94. Diagnostic Accuracy of Spring aReading with Spring MAP in Reading: WI LEA 1 (SpringData Collection)
Grade N aReading
M (SD)
MAP
M (SD)
r(x,y) Cut AUC Sens. Spec.
Some Risk (≤ 40th percentile)
2 33 477.61 (22.09) 181.61 (19.34) .90** 474.5 .96 .91 .863 26 496.19 (26.13) 195.65 (17.25) .95** 499.00 1.00 1.00 .89
4 31 509.35 (13.51) 208.23 (13.25) .83** 504.00 .94 .86 .87
5 28 514.29 (13.49) 211.11 (12.90) .79** 514.5 .90 .89 .79
6 25 521.48 (19.44) 215.08 (11.56) .85** 520.5 .92 .86 .83
Some Risk (20th to 40th percentile)
2 33 477.61 (22.09) 181.61 (19.34) .90** 473 .79 1.00 .703 26 496.19 (26.13) 195.65 (17.25) .95** 499 .86 1.00 .73
4 31 509.35 (13.51) 208.23 (13.25) .83** 504 .79 .75 .78
5 28 514.29 (13.49) 211.11 (12.90) .79** 514.5 .72 .80 .65
6 25 521.48 (19.44) 215.08 (11.56) .85** 520.5 .74 .75 .71
High Risk (≤ 20th percentile)
2 33 477.61 (22.09) 181.61 (19.34) .90** 466.00 .97 .86 .853 26 496.19 (26.13) 195.65 (17.25) .95** 475.00 1.00 1.00 .92
4 31 509.35 (13.51) 208.23 (13.25) .83** 501.00 1.00 1.00 .89
5 28 514.29 (13.49) 211.11 (12.90) .79** 503.5 .95 .75 .87
6 25 521.48 (19.44) 215.08 (11.56) .85** 514.5 1.00 1.00 .86

Section 6. FAST as Evidence-Based Practice
Page | 118www.fastbridge.org
© 2015 Theodore J. Christ and Colleagues, LLC. All rights reserved.
Table 95. Diagnostic Accuracy of Fall aReading with Spring MCA-III in Reading: MN LEA 3 (Fall toSpring Prediction)
Grade NaReading
M (SD)
MCA-III
M (SD)r(x,y) Cut AUC Sens. Spec.
Some Risk (Does not Meet or Partially Meets Standards)
3 482 484.45 (19.73) 353.43 (21.78) .77 478.5 .89 .82 .824 485 496.62 (22.72) 452.05 (17.67) .77 499.5 .89 .80 .82
5 495 504.87 (19.72) 554.17 (15.46) .80 503.5 .91 .82 .81
6 459 511.37 (22.43) 654.81 (18.75) .73 508.5 .85 .75 .76
Some Risk (Partially Meets Standards)
3 482 484.45 (19.73) 353.43 (21.78) .77 474.5 .89 .86 .714 485 496.62 (22.72) 452.05 (17.67) .77 487.5 .94 1.00 .71
5 495 504.87 (19.72) 554.17 (15.46) .80 499.5 .93 .94 .71
6 459 511.37 (22.43) 654.81 (18.75) .73 504.5 .96 1.00 .70
High Risk (Does Not Meet Standards)
3 482 484.45 (19.73) 353.43 (21.78) .77 475.5 .90 .79 .834 485 496.62 (22.72) 452.05 (17.67) .77 490.5 .92 .82 .82
5 495 504.87 (19.72) 554.17 (15.46) .80 497.5 .93 .84 .85
6 459 511.37 (22.43) 654.81 (18.75) .73 504.5 .89 .83 .81
Table 96. Diagnostic Accuracy of Winter aReading with Spring MCA-III in Reading: MN LEA 3(Winter to Spring Prediction)
Grade NaReading
M (SD)
MCA-III
M (SD)r(x,y) Cut AUC Sens. Spec.
Some Risk (Does Not Meet or Partially Meets Standards)
5 134 519.97 (15.30) 560.84 (13.80) .77 514.5 .89 .83 .846 160 524.56 (18.42) 661.15 (16.55) .70 520.5 .80 .70 .74
Some Risk (Partially Meets Standards)
5 134 519.97 (15.30) 560.84 (13.80) .77 514.5 .79 .71 .776 160 524.56 (18.42) 661.15 (16.55) .70 522.5 .68 .74 .67
High Risk (Does Not Meet Standards)
5 134 519.97 (15.30) 560.84 (13.80) .77 510.5 .93 .80 .826 160 524.56 (18.42) 661.15 (16.55) .70 514.5 .92 .83 .84
aReading evidence of diagnostic accuracy is not limited to the Midwest. The following diagnosticaccuracy information was obtained from samples of students in other regions of the US.

Section 6. FAST as Evidence-Based Practice
Page | 119www.fastbridge.org
© 2015 Theodore J. Christ and Colleagues, LLC. All rights reserved.
Table 97. Diagnostic Accuracy Fall aReading with Spring Massachusetts ComprehensiveAssessment (MCA): Cambridge, MA (Fall to Spring Prediction)
Grade N aReadingM (SD)
MCAM (SD)
r(x,y) Cut AUC Sens. Spec.
Some Risk (“Warning” and “Needs Improvement”)
3 93 485.91 (17.59) 241.89 (14.08) .63** 478.5 .79 .73 .734 93 492.68 (18.52) 238.40 (15.14) .69** 492.5 .85 .75 .78
5 72 506.93 (18.58) 243.63 (13.20) .69** 507.5 .90 .85 .79
Some Risk (“Needs Improvement”)
3 93 485.91 (17.59) 241.89 (14.08) .63** 480.5 .71 .72 .634 93 492.68 (18.52) 238.40 (15.14) .69** 494.5 .72 .71 .60
5 72 506.93 (18.58) 243.63 (13.20) .69** 506.5 .88 .78 .87
High Risk (“Warning”)
3 93 485.91 (17.59) 241.89 (14.08) .63** 475.5 .80 .75 .724 93 492.68 (18.52) 238.40 (15.14) .69** 476.5 .92 .89 .84
5 72 506.93 (18.58) 243.63 (13.20) .69** 495.5 .85 1.00 .79
Table 98. Diagnostic Accuracy of Winter aReading with Spring Massachusetts ComprehensiveAssessment (MCA): MA LEA 1 (Winter to Spring Prediction)
Grade N aReadingM (SD)
MCAM (SD)
r(x,y) Cut AUC Sens. Spec.
Some Risk (“Warning” and “Needs Improvement”)
3 91 498.99 (18.66) 241.89 (14.08) .76** 499.5 .85 .76 .74
4 94 504.33 (16.37) 238.40 (16.37) .69** 505.5 .85 .76 .78
5 74 515.31 (14.42) 243.63 (14.42) .61** 516.5 .83 .82 .78
Some Risk (“Needs Improvement”)
3 91 498.99 (18.66) 241.89 (14.08) .76** 501.5 .71 .72 .64
4 94 504.33 (16.37) 238.40 (16.37) .69** 506.5 .71 .78 .64
5 74 515.31 (14.42) 243.63 (14.42) .61** 516.5 .81 .81 .76
High Risk (“Warning”)
3 91 498.99 (18.66) 241.89 (14.08) .76** 476.5 .97 .88 .954 94 504.33 (16.37) 238.40 (16.37) .69** 485.5 .94 .78 .88
5 74 515.31 (14.42) 243.63 (14.42) .61** 506.00 .86 1.00 .80

Section 6. FAST as Evidence-Based Practice
Page | 120www.fastbridge.org
© 2015 Theodore J. Christ and Colleagues, LLC. All rights reserved.
Table 99. Diagnostic Accuracy of Fall aReading with Spring CRCT in Reading: GA LEA 1(Fall to Spring Prediction)
Grade N aReading
M (SD)
CRCT
M (SD)
r(x,y) Cut AUC Sens. Spec.
Some Risk (Meets Standards)
3 329 483.81 (18) 848.65 (28) .73* 481.50 .83 .76 .76
4 320 491.37 (16) 848.18 (27) .64* 490.50 .80 .73 .75
5 353 497.81 (16) 841.22 (25) .64* 499.50 .75 .70 .68
High Risk (Does Not Meet Standards)
3 329 483.81 (18) 848.65 (28) .73* 466.50 .94 .82 .86
4 320 491.37 (16) 848.18 (27) .64* 478.50 .89 .83 .765 353 497.81 (16) 841.22 (25) .64* 485.00 .89 .79 .79
Table 100. Diagnostic Accuracy of Winter aReading with Spring CRCT in Reading: GA LEA 1(Winter to Spring Prediction)
Grade N aReading
M (SD)
CRCT
M (SD)
r(x,y) Cut AUC Sens. Spec.
Some Risk (Meets Standards)
3 327 495.67 (18) 848.64 (28) .75* 498.50 .83 .76 .76
4 318 505.31 (16) 848.33 (27) .71* 505.50 .82 .77 .78
5 351 512.19 (15) 841.14 (25) .66* 516.50 .78 .71 .72
6 283 518.78 (13) 850.14 (23) .67* 519.50 .87 .77 .80
High Risk (Does Not Meet Standards)
3 327 495.67 (18) 848.64 (28) .75* 477.50 .95 .83 .864 318 505.31 (16) 848.33 (27) .71* 487.50 .94 .83 .76
5 347 512.19 (15) 841.14 (25) .66* 500.50 .92 .86 .85
6 283 518.78 (13) 850.14 (23) .67* NA NA NA NA
These findings have also been demonstrated in higher grade levels. The following diagnostic accuracyinformation was obtained from a sample of approximately 322 7th grade students (50.0% female) and311 8th grade students (50.3%) in a Georgia Local Education Agency (LEA). Approximately 74.7% of 7th
grade students were White, 8.6% were Hispanic, 8.3% were African American, 5.6% were Multiracial,2.5% were Asian, and .3% identified themselves as “Other.” Approximately 81.2% of 8th grade studentswere White, 7.3% were African American, 5.7% were Hispanic, 4.1% were Multiracial, 1.3% were Asian,and .3% identified themselves as “Other.” See Table 101 for diagnostic accuracy statistics.

Section 6. FAST as Evidence-Based Practice
Page | 121www.fastbridge.org
© 2015 Theodore J. Christ and Colleagues, LLC. All rights reserved.
Table 101. Diagnostic Accuracy of Winter aReading with Spring Criterion-ReferencedCompetency Tests (CRCT) in Reading: Georgia LEA 1 (Winter to Spring Prediction)
Grade N aReading
M (SD)
CRCT
M (SD)
r(x,y) Cut AUC Sens. Spec.
Some Risk (Meets Standards)
7 322 521.77 (14.86) 842.50 (24.09) .64** 512.5 .91 .82 .81
8 311 524.69 (21.76) 850.36 (54.42) .33** 517.5 .95 1.00 .73
High Risk (Does Not Meet Standards)
7 322 521.77 (14.86) 842.50 (24.09) .64** 509.5 .92 .86 .86
8 311 524.69 (21.76) 850.36 (54.42) .33** 511.5 .92 .86 .84
Table 102. Diagnostic Accuracy of Fall aReading with Spring Minnesota ComprehensiveAssessment III (MCA-III) in Reading: MN LEA 2 (Fall to Spring Prediction)
Grade N aReadingM (SD)
MCAM (SD)
r(x,y) Cut AUC Sens. Spec.
Some Risk (Meets Standards)
10 66 527.91 (18.59) 1052.29 (12.99) .55** 523.5 .82 .77 .75
High Risk (Does Not Meet Standards)
10 66 527.91 (18.59) 1052.29 (12.99) .55** 521.5 .77 .75 .77
For additional diagnostic accuracy information for FastBridge Learning Reading Assessments, pleasesee Appendix B: FastBridge Learning Reading Diagnostic Accuracy.
Section 6. FAST™ as Evidence-Based Practice
This section provides a summary of some evidence for FAST™ as an evidence-based intervention. Theuse of well-developed training and support with technology to deliver and automate the use offormative assessments and data improve student outcomes. FAST™ improves teacher knowledge,skills, and appreciation for data. The use of FAST™ changes teaching.
The graphic below is our theory of change, which relates to our hypothesis for systems change andimproved student outcomes caused by the adoption and use of FAST™.

Section 6. FAST as Evidence-Based Practice
Page | 122www.fastbridge.org
© 2015 Theodore J. Christ and Colleagues, LLC. All rights reserved.
6.1: Theory of Change
FastBridge Learning and ourresearchers and developers have atheory of change (right). Our theory isthat student outcomes improve whenteachers use evidence-basedformative assessments in conjunctionwith technology-based training andsupports for data-based decisionmaking. We provide evidence for thistheory of change below.
FastBridge Learning’s researchers anddevelopers work continuously torefine and improve the tools. Theywork with teachers and educators toevaluate their needs and satisfaction.They collect and evaluate student datato ensure alignment with standardsand improved student outcomes.
6.2: Formative Assessment as Evidence-Based Practice
Effective teachers use formative assessment to guide their practices. This is recommended andsupported in the empirical and professional literature. Teachers and students benefit less fromsummative assessments, which occur infrequently, have little instructional relevance, and yield resultsthat are often delayed for days, weeks, or months (e.g., many state testing programs).
Teachers need an effective formative assessment system. Effective systems provide assessments,reporting, and guidance for data interpretation and use. Moreover, they support the multi-methodand multi-source approach, which requires multiple types of assessments with varied methods acrossthe most relevant content areas.
US Department of EducationThe US Department of Education’s Practice Guides summarize the evidence and recommendations foreffective practice (http://ies.ed.gov/pubsearch). They recommend formative assessment andevaluation.
Those guides were developed by panels of national experts who “relied on the WWC EvidenceStandards” (Gersten, 2008, p. 2). After a review of the evidence, the expert panel for Using StudentAchievement Data to Support Instructional Decision Making recommended that educators: (1) makedata part of an ongoing cycle of instructional improvement, (2) have a clear vision for schoolwide data
Figure 3 Theory of Change

Section 6. FAST as Evidence-Based Practice
Page | 123www.fastbridge.org
© 2015 Theodore J. Christ and Colleagues, LLC. All rights reserved.
use, (3) foster a data-driven culture, and (4) maintain a districtwide data system (Hamilton et al., 2009,p. 8). The RTI reading panel found moderate evidence to recommend universal screening andprogress monitoring for students with deficits (Gersten et al., 2008, p. 13). The RTI math panel madesubstantially similar recommendations (Gersten et al., 2009, p. 11).
All of the expert panels recommend the use of high-quality and highly efficient formativeassessments. They also recommend the use of assessment data to plan instruction, differentiateinstruction, titrate support (tiered services), devise instructional groups, monitor progress, andevaluate instructional effects. Some recommendations had lower levels of evidentiary support, butFAST™ is designed to facilitate the implementation of these recommended practices.
Historical Evidence on Formative AssessmentEffective teachers systematically collect and share student assessment data to help them makeinstructional decisions that improve student performance (Lipson, Mosenthal, Mekkelsen, & Russ,2004; Taylor et al., 2000) by 0.4 to 0.7 standard deviations (Black & Wiliam, 1998).
Teachers should be able to use data to inform their practice (Martone & Sireci, 2009). After a thoroughreview of the pre-1990 research literature on effective instruction, Hoffman (1991) concluded thatthere is persistent and consistent evidence that the use of instructionally relevant assessmentsimproved instructional effects and student achievement. Those findings converge with those ofcontemporary research. For example, Pressley et al. (2001) identified 103 behaviors that distinguishedteachers who were either highly effective or moderately effective. Classroom assessment practices—as opposed to external assessments—were a major distinguishing factor in instructionally relevantassessments. That is, the use of formative assessment data to guide instruction contributes to moreeffective instruction and higher student achievement (Jenkins, 2001; Taylor, Pearson, Clark, & Walpole,2000a, 2000b; Taylor, Pearson, Peterson, & Rodriguez, 2003, 2005).
Formative assessments guide both instruction and student learning. They provide feedback that islinked to explicit performance standards and provide guidance to achieve those standards (Sadler,1989). Formative assessment helps establish a learning-assessment process, which is encapsulated bythree key questions (Atkin, Black, & Coffey, 2001; Deno, 2002, 2005; Sadler, 1989):
“What is the expected level of performance?”
“What is the present level of performance?” and
“What must be done to reduce that discrepancy?”
FAST™ provides useful data for educators to address each of these questions through screening, skillsanalysis, and progress monitoring. It also provides training, supports, analysis, and reporting tofacilitate the use of data by teachers.
Evidence Based: Contemporary Evidence on Formative AssessmentData-based decision making and formative assessment are evidence-based. Black and Wiliam (1998)and other common sources of evidence were cited above; however, the most recent and rigorous

Section 6. FAST as Evidence-Based Practice
Page | 124www.fastbridge.org
© 2015 Theodore J. Christ and Colleagues, LLC. All rights reserved.
meta-analysis on formative assessment was done by Kingston and Nash (2011). The inclusion criteriafor the meta-analysis were: (a) formative assessment was the intervention, (b) K–12 student samples,(c) control or comparison group, (d) appropriate statistics to estimate effect size, and (e) published1988 or later. They identified 13 studies with 42 independent effect sizes, which allowed them toanalyze the effects of professional development and computer-based formative assessment—amongother things.
In brief, the weighed mean effect of formative assessment was .20 (Mdn = .25). The largest effectswere observed in the content area of English language arts (.32) with less robust effects inmathematics (.17); however, there were statistically significant (moderating) effects for bothprofessional development/training (.30) and technology-based formative assessments (.28). Resultsimproved when teachers received training and technology to support the implementation and use offormative assessments. Preliminary evidence indicates that FAST™ is likely to confer even moresubstantial effects.
Although recent research (Kingston & Nash, 2011) indicates more modest effects for formativeassessment, these are substantial and meaningful differences in student achievement.
As summarized in Table 103, if 80% of students are proficient (i.e., not in need of supplemental,intensive, or special education services) and formative assessment is implemented as an intervention,the proficiency rate is likely improve to 87% (assuming a .30 effect size). That is, the percentage ofstudents with deficits or disabilities who need RTI or special education is reduced from 20% to 13%.That is a 35% reduction. Larger effects are observed with the implementation of FAST™. This isdescribed as follows.
Table 103. Estimates of the Increase in the Percentage of Students who are Proficient or abovewith the Implementation of Formative Assessment (Kingston & Nash, 2011, p. 35)
Note. “While the weighted mean effect sizes found in this study are smaller than commonly reported in theliterature, they have great practical significance in today’s accountability climate. These improvements can berestated in terms of the percentage of students achieving summative assessment results at or above the proficientlevel. Table 350 shows the improvement that would result from several different effect sizes based on how manystudents are currently proficient or above (assuming scores are distributed normally). If currently 20% of studentsare proficient or above, then the weighted mean effect size of .20 would lead to an additional 6% of studentsachieving proficient status. If currently 50% of students are proficient or above, then the increase would be 8%.The .30 effect size associated with formative assessment based on professional development would lead to 9% and12% of all students moving into the proficient category under these two scenarios.” (Kingston & Nash, pp. 34-35).
Proficient

Section 6. FAST as Evidence-Based Practice
Page | 125www.fastbridge.org
© 2015 Theodore J. Christ and Colleagues, LLC. All rights reserved.
Formative assessment is an evidence-based practice with the most robust effects when it is deliveredwith technology, training, and support. The evidence summarized by Kingston & Nash (2011; N = 13studies, 42 effect sizes) meets the What Works Clearinghouse criteria for “Positive effects: Strongevidence of positive effect with no overriding contrary evidence” (WWC, 2014, p. 29).
6.3: Evidence-Based: Formative Assessment System for Teachers
FAST™ combines all aspects of those evidence-based practices described above: technology tools forassessment, training, and support. Two sources of evidence are presented to illustrate that theimplementation and use of FAST™ is an evidence-based practice.
FAST™ Improves Student AchievementWe analyzed grade-level performance of suburban Midwestern local educational agencies (Schools =8) with aReading data (broad measure of reading achievement). Performance data from the fall of year1 implementation (i.e., pre-test) were compared to fall of year 2 implementation (e.g., post-test) toevaluate the effect of FAST™. That is, the difference in performance between second graders in 2013(control, M = 445) and second graders in 2014 (after teachers implemented FAST™ for one year; M =451) might be attributed, in part, to the FAST™ implementation.
There were statistically significant differences with meaningful effect sizes in both general and specialeducation samples (Table 104, p. 125). This was observed at the district and school levels. Althoughnot all differences were statistically significant (viz., special education) that is attributed to statisticalpower—as effect sizes were still robust. The observed effect sizes converge with the findings ofKingston and Nash (2011). These are meaningful and important improvements that replicated acrossall grades and populations except 6th grade special education.
If combined with the estimates in Table 103, FAST™ is likely to reduce the proportion of students atrisk and increase the proportion who achieve proficiency by 7 to 13%--or more.
Table 104. FAST™ Statistical Significance and Effect Sizes2013 2014
Grade Group M SD N M SD N t df p d
2nd GenEd 463.3 25.8 578 469.5 27.7 523 3.80 1099 .00* .23
SpEd 445.6 25.1 51 451.6 33.9 46 .10 95 .32 20
3rd GenEd 484.5 19.3 507 492.4 24.3 559 5.83 1064 .00* 36
SpEd 470.2 25.7 46 474.6 26.6 57 .86 101 .40 17
4th GenEd 498.3 22.0 507 504.6 21.7 513 4.61 1018 .00* 29
SpEd 476.7 26.1 62 487.9 28.8 52 2.17 112 .03* 41
5th GenEd 504.3 19.4 483 514.7 23.2 505 7.54 986 .00* 48
SpEd 490.8 26.1 76 498.5 24.9 64 1.77 136 .08 30
6th GenEd 508.8 25.1 431 522.3 24.1 475 8.23 904 .00* .55

Section 6. FAST as Evidence-Based Practice
Page | 126www.fastbridge.org
© 2015 Theodore J. Christ and Colleagues, LLC. All rights reserved.
2013 2014
Grade Group M SD N M SD N t df p d
SpEd 506.3 20.0 71 506.1 29.5 80 -.04 149 .97 .01
Note. Adaptive Reading (aReading) is a computer-adaptive test of broad reading on a score scale range of 350 to650, which spans K to 12th grade achievement. Aggregate data are presented for 8 schools. Grade levelperformance was compared across the first two years of implementation.
FAST™ Improves the Practice of TeachersAn independent survey of teachers (N=2689 responses) by the Iowa Department of Educationindicates that 86% of educators believe FAST™ “may” or “will definitely” support increased studentachievement (Greg Felderman, Iowa Department of Education, personal communication, January2015). It also indicated that teachers use data to guide instruction and improve student achievement.
82% of teachers used FAST™ assessment data to form instructional groups (N = 401 teachersresponded),
82% adjusted interventions for students with deficits or disabilities (N = 369); 66% used data atleast once per month (66%), and
25% used FAST™ data at least weekly (N = 376).
These results provide insight as to the effects of FAST™ implementation.
FAST™ Provides High Quality Formative AssessmentsAs summarized above, the IES practitioner guides recommend the use of high quality assessments.The FAST™ assessments meet the IES recommendations for quality: reliability, validity, usability,efficiency, diagnostic accuracy, specificity, sensitivity, efficiency, and instructional relevance.
The FAST™ assessments are evidence-based. Numerous studies were completed with diverse samplesof students across many geographic locations and LEAs (e.g., NY, GA, MN, IA, and WI). Consistent withthe definitions of “evidence-based,” there are many large, multi-site studies with student samplesfrom the populations and settings of interest (i.e., K–12 students). The samples size for almost allstudies well-exceeded the requirement of 50 students per condition (e.g., assessment, grade, LEA,instructional condition). On aggregate, more than 15,000 students participated in well-controlledpsychometric research. In addition, norms were developed from samples of approximately 8,000students per grade (K to 8th) per assessment, which aggregates to 72,000 student participants.Consistent with the requirements for evidence, the psychometric qualities for reliability and validitywere statistically significant, and the various assessments are meaningful and statistically robustindicators of relevant outcomes, such as state tests and future performance in school.
References
Page | 127www.fastbridge.org
© 2015 Theodore J. Christ and Colleagues, LLC. All rights reserved.
References
Adams, M. J. (1990). Beginning to read. Cambridge, MA: MIT Press.
AERA, APA, NCME. (1999). Standards for educational and psychological testing. Washington DC:American Educational Research Association.
AIMSWeb Benchmark and Progress Monitoring System for Grades K-8. Pearson Education Inc.
Ardoin, S. P., & Christ, T. J. (2009). Curriculum based measurement of oral reading: Estimates ofstandard error when monitoring progress using alternate passage sets, School Psychology Review, 38,266-283.
Ardoin, S. P., Carfolite, J., Christ, T. J., Roof, C. M., & Klubnick, C. (2010). Examining readability estimates’predictions of students’ oral reading rate: Spache, Lexile, and Forcast. School Psychology Review,39(2), 277-285.
Ardoin, S. P., Suldo, S. M., Witt, J. C., Aldrich, S., & McDonald, E. (2005). Accuracy of readability estimates'predictions of CBM performance. School Psychology Quarterly, 20(1), 1-22.
Armbruster, B. (2002). Put reading first DIANE Publishing. Aud, S., Wilkinson-Flicker, S., Kristapovich, P.,Rathbun, A., Wang, X., & Zhang, J. (2013). The Condition of Education 2013 (NCES 2013-037). U.S.Department of Education, National Center for Education Statistics. Washington, DC. Retrieved[November 21st, 2013] from http://nces.ed.gov/pubsearch.
Atkin, J. M., Black, P., & Coffey, J. (2001). Classroom Assessment and the National Science EducationStandards. Washington, DC: National Academy Press.
Baroody, A. J. (2006). Why children have difficulties mastering the basic number combinations andhow to help them. Teaching Children Mathematics, 13, 22 – 31.
Bear, D.R., Invernizzi, M.A., Templeton S.R., & Johnston, F.R. (2012). Words Their Way: Word Study forPhonics, Vocabulary, and Spelling Instruction, 5th ed. Upper Saddle, NJ: Pearson Education Inc.
Beitchman J, Wilson B, Johnson CJ, Atkinson L, Young A, Adlaf E, et al. (2001). Fourteen-year follow-upof speech/language-impaired and control children: psychiatric outcome. Journal of the AmericanAcademy of Child and Adolescent Psychiatry, 40, 75–82.
Berch, D. B., & Mazzocco, M. M. (Eds) (2008). Why is math so hard for some children? The nature andorigins of mathematical learning difficulties and disabilities. Baltimore, MD: Paul H. Brookes.
Betts, J., Pickart, M., & Heistad, D. (2009). An investigation of the psychometric evidence of CBM-Rpassage equivalence: Utility of readability statistics and equating for alternate forms Journal of SchoolPsychology, 47, pp. 1–17.
References
Page | 128www.fastbridge.org
© 2015 Theodore J. Christ and Colleagues, LLC. All rights reserved.
Black, P., & William, D. (1998). Assessment and classroom learning. Assessment in Education: Principles,Policy & Practice, 5(1), 7-74.
Bowers, P. N., Kirby, J. R., & Deacon, S. H. (2010). The Effects of Morphological Instruction on LiteracySkills A Systematic Review of the Literature. Review of Educational Research, 80(2), 144-179.
Bowman, B., Donovan, S., & Burns, M.S. (Eds.). (2000). Eager to learn: Educating our preschoolers.National Research Council Commission on Behavioral and Social Sciences and Education. Washington,D.C.: National Academy Press.
Brennan, R. L. (Ed.). (2006). Educational Measurement (4th ed.). Westport, CT: American Council onEducation and Praeger Publishers.
Brown, E.D., Sax, K.L. (2013). Arts enrichment and preschool emotions for low-income children at risk.Early Childhood Research Quarterly, 28, 337-346.
Burt, J. S. (2006). What is orthographic processing skill and how does it relate to word identification inreading? Journal of Research in Reading, 29(4), 400-417.
Cain, K., Oakhill, J., & Bryant, P. E. (2004). Children's reading comprehension ability: Concurrentprediction by working memory, verbal ability, and component skills. Journal of EducationalPsychology, 96, 31-42.
Campbell, F. A., & Ramey, C. T. (1994). Effects of early intervention on intellectual and academic
achievement: A follow‐up study of children from low‐income families. Child Development, 65, 684-
698.
Carnine, D.W., Silbert, J., Kem’ennui, E.J., & Tarver, S.G. (2009). Direct instruction reading (5th ed.). , OR:Pearson Education Ltd.
Carroll, J. B. (1993). Human cognitive abilities: A survey of factor-analytic studies. New York:
Cambridge University Press.
Carlisle, J.F. (1995). Morphological awareness and early reading achievement, L.B. Feldment, (ed.),Morphological aspects of language processing, (pp. 189-209). Hillsdale, NJ: Lawrence ErlbaumAssociates, Publishers.
Carlisle, J. F. (2011). Effects of instruction in morphological awareness on literacy achievement: Anintegrative review. Reading Research Quarterly, 45 (4), 464-487.
Case, S.M., & Swanson, D.B. (2002). Constructing written test questions for the basic and clinicalsciences, 3rd edition. Philadelphia, PA: National Board of Medical Examiners.

References
Page | 129www.fastbridge.org
© 2015 Theodore J. Christ and Colleagues, LLC. All rights reserved.
Cawley, J. F., Parmar, R. S., Lucas-Fusco, L. M., Kilian, J. D., & Foley, T. E. (2007). Place value andmathematics for students with mild disabilities: Data and suggested practices. Learning Disabilities: AContemporary Journal, 5, 21-39.
Chall, J. (1987). Two vocabularies for reading: Recognition and meaning. In M. McKeown & M. Curtis(Eds.). The nature of vocabulary acquisition (pp. 7-17). Hillsdale, NJ: Lawrence Erlbaum.
Christ, T. J. (2006). Short term estimates of growth using curriculum-based measurement of oralreading fluency: Estimates of standard error of the slope to construct confidence intervals. SchoolPsychology Review, 35, 128-133.
Christ, T. J., & Ardoin, S. P. (2009). Curriculum-based measurement of oral reading: Passage equivalenceand probe-set development. Journal of School Psychology, 47, 55-75.
Christ, T. J., & Boice, C. H. (2009). Rating scale items: A brief review of nomenclature, components andformatting. Assessment for Effective Intervention, 34(4), 242-250.
Christensen, C. A., & Bowey, J. A. (2005). The efficacy of orthographic rime, grapheme–phonemecorrespondence, and implicit phonics approaches to teaching decoding skills. Scientific Studies ofReading, 9(4), 327-349.
Clements, D., Sarama, J., & DiBiase, A. M. (Eds.). (2004). Engaging young children in mathematics:Findings of the 2000 national conference on standards for preschool and Kindergarten mathematicseducation. Mahwah, NJ: Erlbaum.
Compton, D. L., Appleton, A. C., & Hosp, M. K. (2004). Exploring the relationship between text-levelingsystems and reading accuracy and fluency in second grade students who are average and poordecoders. Learning Disabilities Research & Practice, 19(3), 176-184.
Clay, M. (1972). Reading, the Patterning of Complex Behavior. Auckland, New Zealand: Heinemann.
Crocker, L. M., & Algina, J. (1986). Introduction to classical and modern test theory (Vol. 6277). NewYork: Holt, Rinehart and Winston.
Deacon, S. H., Parrila, R., & Kirby, J. R. (2008). A review of the evidence on morphological processing indyslexics and poor readers: A strength or weakness. The Sage handbook of dyslexia, 212-237.
Deno, S. L. (1985). Curriculum-Based measurement: The emerging alternative. Exceptional Children,52, 219-232.
Deno, S. L. (1986). Formative evaluation of individual student programs: A new role for schoolpsychologists. School Psychology Review, 1(3), 358-374.
Deno, S. L. (2002). Problem solving as best practices. In A. Thomas & J. Grimes (Eds.), Best practices inschool psychology IV. (pp. 37-56). Bethesda, MD: National Association of School Psychologists.

References
Page | 130www.fastbridge.org
© 2015 Theodore J. Christ and Colleagues, LLC. All rights reserved.
Deno, S. L. (2003). Developments in Curriculum-Based measurement. The Journal of Special Education,37(3), 184-192.
Deno, S. L. (2005). Problem solving assessment. In R. Brown-Chidsey (Ed.), Assessment for intervention:A problem-solving approach (pp. 10-42). New York: Guilford Press.
Deno, S. L. & Mirkin, P. K. (1977) Data-based Program Modification: A Manual.
Reston VA: Council for Exceptional Children
De Ayala, R. J. (2009). The theory and practice of item response theory. Guilford Press.
Dickinson, D., McCabe, A., & Essex, M. (2006). A window of opportunity we must open to all: The casefor high-quality support for language and literacy. In D. K. Dickinson & S. B. Neuman (Eds.), Handbookof early literacy research (pp. 11-28). New York: Guilford Press.
Dominguez, X., Vitiello, V.E., Maier, M.F., & Greefield, D.B. (2010). Longitudinal examination of youngchildren’s behavior: Child-level and classroom-level predictors of change throughout the preschoolyear. School Psychology Review, 39, 29-47.
Downing, J., Ollila, L., & Oliver, P. (1975). Cultural differences in children's concepts of reading andwriting. British Journal of Educational Psychology, 45, 312-316.
Dunn, J. & Brown, J. (1994). Affect expression in the family, children's understanding of emotions, andtheir interactions with others. Merrill-Palmer Quarterly, 40, pp. 120–137
Durkin, D. (1993). Teaching them to read (6th ed.). Boston, MA: Allyn and Bacon.
Dynamic Indicators of Basic Early Literacy Skills (DIBELS Next). Eugene, OR: Institute for theDevelopment of Educational Achievement. Available: https://dibels.org/next/index.php.
Eckoff, A. & Urback, J. (2008). Understanding imaginative thinking during childhood: Socioculturalconceptions of creativity and imaginative thought. Early Childhood Education Journal, 36, 179-185.
Eisenberg, N., Shepard, S. A., Fabes, R. A., Murphy, B. C, & Guthrie, I. K. (1998). Shyness and children'semotionality, regulation, and coping: Contemporaneous, longitudinal, and across-context relations.Child Development, 69, 767-790.
Eisner, E. W. (2002). The arts and the creation of mind. New Haven, CT: Yale University Press.
Ekeland, E., Heian, F. & Hagen, K.B. (2004). Can exercise improve self-esteem in children and youngpeople? A systematic review of randomized control trials. British Journal of Sports Medicine, 39, 792-798.
Flesch, R. F. (1949). A new readability yardstick. Journal of Applied Psychology, 32(3), 221-233.

References
Page | 131www.fastbridge.org
© 2015 Theodore J. Christ and Colleagues, LLC. All rights reserved.
Francis, D. J., Santi, K. L., Barr, C., Fletcher, J. M., Varisco, A., & Foorman, B. R. (2008). Form effects on theestimation of students’ oral reading fluency using DIBELS. Journal of School Psychology, 46, 315-342.
Fry, E. B., & Kress, J. E. (2006). The reading teacher's book of lists. San Francisco: Jossey-Bass.
Fuchs, D., & Fuchs, L. S. (2006). Introduction to Response to Intervention: What, why, and how valid isit? Reading Research Quarterly, 41, 93-99.
Fuchs, L. S., & Fuchs, D. (2002) Curriculum-Based Measurement: Describing competence, enhancingoutcomes, evaluating treatment effects, and identifying treatment non-responders. Peabody Journalof Education, 77:2, 64-84, doi: 10.1207/S15327930PJE7702_6
Fuchs, D., Fuchs, L. S., & Compton, D. L. (2004). Identifying reading disabilities by responsiveness-to-instruction: Specifying measures and criteria. Learning Disability Quarterly, 27(4), 216-227.
Fuchs, L. S., Fuchs, D., & Maxwell, L. (1988). The validity of informal reading comprehensionmeasures. Remedial and Special Education, 9(2), 20-28.
Gajdamaschko, N. (2005). Vygotsky on imagination: Why an understanding of the imagination is animportant issue for schoolteachers. Teaching Education, 16, 13–22
Geary, D.C. (1999). Mathematical Disabilities: What we know and don’t know. Retrieved
August 23, 2011 from the LD Online Web site: http://www.ldonline.org/article/5881.
Geary, D.C. (2004). Mathematics and learning disabilities. Journal of Learning Disabilities, 37,
(1), 4-15.
Gendron, M., Royer, E., Bertrand, R. & Potrin, P. (2004). Behavior disorders, social competence, and thepractice of physical activities among adolescents. Emotional and Behavioral Difficulties, 9, 249-259.
Gersten, R., Clarke, B., Jordan, N. C., Newman-Gonchar, R., Haymond, K., & Wilkins, C. (2012). Universalscreening in mathematics for the primary grades: Beginnings of a research base. Exceptional Children,78, 423-445.
Gersten, R., Jordan, N. C., & Flojo, J. R. (2005). Early identification and interventions for students withmathematics difficulties. Journal of learning disabilities, 38(4), 293-304.
Goswami, U. (2000). Phonological and lexical processes. In M. J. Kamil, P. B. Mosenthal, P. D. Pearson, &R. Barr (Eds.). Handbook of reading research, Volume III (pp. 251-267) Mahwah, NJ: Lawrence Earlbaum.
Goswami, U. (2001). Early phonological development and the acquisition of literacy. In S. B. Neuman &D. Dickinson (Eds.), Handbook of Early Literacy Research (pp. 111–125). New York: Guilford Press.

References
Page | 132www.fastbridge.org
© 2015 Theodore J. Christ and Colleagues, LLC. All rights reserved.
Gough, P. B., & Tunmer, W. E. (1986). Decoding, reading, and reading disability. Remedial and specialeducation, 7(1), 6-10.
Goldman, S. R., & Varnhagen, C. K. (1986). Memory for embedded and sequential episodes in stories.Journal of Memory and Language, 25, 401-418.
Group Reading Assessment and Diagnostic Evaluation (GRADE). Pearson Education Inc.
Graesser, A. C., Leon, J. A., & Otero, J. (2002). Introduction to the psychology of science textcomprehension. In J. Otero, J. A. Leon, & A. C. Graesser (Eds.), The Psychology of Science TextComprehension (pp. 1-15). Mahwah, NJ: Erlbaum.
Graesser, A. C., McNamara, D. S., & Louwerse, M. M (2003). What do readers need to learn in order toprocess coherence relations in narrative and expository text? In A.P. Sweet and C.E. Snow (Eds.),Rethinking reading comprehension (pp. 82–98). New York: Guilford Publications.
Graesser, A. C., McNamara, D. S., Lowerse, M. M., & Cai, Z. (2004). Coh-Metrix: Analysis of text oncohesion and language. Behavior Research Methods, Instruments, & Computers, 36(2), 193-202
Graesser, A.C., Olde, B. A., & Klettke, B. (2002). How does the mind construct and represent stories? InM. Green, J. Strange, and T. Brock (Eds.), Narrative Impact: Social and Cognitive Foundations. Mahwah:NJ: Erlbaum.
Graesser, A. C., Singer, M., & Trabasso, T. (1994). Constructing inferences during narrative textcomprehension. Psychological Review, 101(3), 371-395.
Grzybowski, M., & Younger, J. G. (1997). Statistical methodology: III. Receiver operating characteristic(ROC) curves. Academic Emergency Medicine, 4, 818-826.
Griffin, S. (2008). Early intervention for children at risk of developing mathematical learning difficulties.In D. Berch & M. Mazzocco (Eds.) Why is math so hard for some children? The nature and origins ofmathematical learning difficulties and disabilities. (pp. 373 – 395) Baltimore, MD: Paul H. Brookes.
Guyer, R., & Thompson, N.A. (2012). User’s Manual for Xcalibre item response theory calibrationsoftware, version 4.1.6. St. Paul MN: Assessment Systems Corporation. Available fromhttp://www.assess.com/
Haladyna, T. M., Downing, S. M., & Rodriguez, M. C. (2002). A review of multiple-choice item-writingguidelines for classroom assessment. Applied measurement in education, 15, 309-333.
Haladyna, T.M. (2007). Roles and importance of validity studies in test development (pp. 739-760). InS.M. Downing and T.M. Haladyna (Eds.) Handbook of test development. Mahwah, NJ: LawrenceErlbaum Associates.

References
Page | 133www.fastbridge.org
© 2015 Theodore J. Christ and Colleagues, LLC. All rights reserved.
Hardy, M., Stennett, R., & Smythe, P. (1974). Development of auditory and visual language conceptsand relationship to instructional strategies in Kindergarten. Elementary English Journal, 51, 525-532.
Harlin, R., & Lipa, S. (1990). Emergent literacy: A comparison of formal and informal assessmentmethods. Reading Horizons, 20, 209-223.
Henard, D.H. (2000). Item response theory. In L. Grimm & P. Yarnold (Eds.), Reading and understandingmore multivariate statistics (pp. 67-97). Washington, DC: American Psychological Association.
Hiebert, E. H., & Taylor, B.M. (2000). Beginning reading instruction: Research on early interventions. InM. J. Kamil, P. B. Mosenthal, P. D. Pearson, & R. Barr (Eds.). Handbook of reading research, Volume III(pp. 455-482) Mahwah, NJ: Lawrence Earlbaum.
Hiebert, E. H., & Fisher, C.W. (2007). The critical word factor in texts for beginning readers. Journal ofEducational Research. 101(1), 3-11.
Hintze, J. M., & Christ, T. J. (2004). An examination of variability as a function of passage variance inCBM progress monitoring. School Psychology Review, 33, 204-217.
Hintze, J. M., & Silberglitt, B. (2005). A longitudinal examination of the diagnostic accuracy andpredictive validity of R-CBM and high-stakes testing. School Psychology Review, 34, 372-386.
Hoffman, K. I. (1993). The USMLE, the NBME subject examinations, and assessment of individualacademic achievement. Academic Medicine, 68(10), 740-7.
Hosp, M. K., Hosp, J. L., & Howell, K. W. (2007). The ABC‟s of CBM: A practical guide to Curriculum-Basedmeasurement. New York, NY: The Guilford Press.
Hu, L.T., & Bentler, P.M. (1999). Cutoff criteria for fit indices in covariance structure analysis:Conventional criteria versus new alternatives. STRUCTURAL EQUATION MODELING. 6, 1-55.
Jenkins, D. (2001). Impact of the implementation of the teaching/learning cycle on teacher decision-making and emergent readers. Reading Psychology, 22(4), 267-288.
Jenkins, J. R., Hudson, R. F., & Johnson, E. S. (2007). Screening for at-risk readers in a Response-to-Intervention (RTI) framework. School Psychology Review. 36(4).
Jenkins, J. R., Zumeta, R., Dupree, O., & Johnson, K. (2005). Measuring gains in reading ability withpassage reading fluency. Learning Disabilities Research & Practice, 20(4), 245-253.
Jenkins, J. R., Hudson, R. F., & Johnson, E. S. (2007). Screening for at-risk readers in a response tointervention framework. School Psychology Review, 36, 582-600.
Jenkins, J. R., & Jewell, M. (1992). An examination of the concurrent validity of the Basic Academic SkillsSamples (BASS). Assessment for Effective Intervention, 17(4), 273-288.

References
Page | 134www.fastbridge.org
© 2015 Theodore J. Christ and Colleagues, LLC. All rights reserved.
Johns, J. (1972). Children’s concepts of reading and their reading achievement. Journal of ReadingBehavior, 4, 56-57.
Johns, J. (1980). First Graders’ concepts about print. Reading Research Quarterly, 15, 529- 549.
Jordan, N. C., Kaplan, D., Ramineni, C., & Locuniak, M. N. (2009). Early math matters: Kindergartennumber competence and later mathematics outcomes. Developmental Psychology, 45, 850-867.
Juel, C. (1988). Learning to read and write: A longitudinal study of 54 children from first through fourthgrades. Journal of educational Psychology, 80, 437-447.
Juel, C. (2006). The impact of early school experience on initial reading. In D. K. Dickinson, & S. B.Neuman (Eds.). The handbook of early literacy research (v.2), (pp. 410-426). NY: Guilford Press.
Juel, C., & Minden‐Cupp, C. (2000). Learning to read words: Linguistic units and instructional
strategies. Reading Research Quarterly, 35(4), 458-492.
Kane, M. T. (2013). Validating the interpretation and uses of test scores. Journal of EducationalMeasurement, 50(1), 1-73.
Katz, L., & Frost, R. (1992). The reading process is different for different orthographies: Theorthographic depth hypothesis. Advances in Psychology-Amsterdam, 94, 67.
Kendeou, P., van den Broek, P., White, M., & Lynch, J. (2007). Preschool and early elementarycomprehension: Skill development and strategy interventions. In D. S. McNamara (Ed.) Readingcomprehension strategies: Theories, interventions, and technologies, (pp. 27–45). Mahwah, NJ:Erlbaum.
Kilgus, S.P., Chafouleeas, S.M., & Riley-Tillman, T.C. (2013). Development and initial validation of the
social and academic behavior risk screener for elementary grades. School Psychology Quarterly, 28,210-226.
Kilgus, S. P., Sims, W., von der Embse, N. P., & Riley-Tillman, T. C. (under review). Confirmation ofmodels for interpretation and use of the Social and Academic Behavior Risk Screener (SABRS). SchoolPsychology Quarterly.
Kilgus, S. P., Eklund, K., von der Embse, N. P., & Taylor, C. (2014). Diagnostic accuracy of the Social,Academic, and Emotional Behavior Risk Screener (SAEBRS) in elementary and middle grades.Manuscript in preparation.
Kilpatrick, J., Swafford, J., & Findell, B. (Eds.). (2001). Adding it up. Washington, DC: National AcademyPress.

References
Page | 135www.fastbridge.org
© 2015 Theodore J. Christ and Colleagues, LLC. All rights reserved.
Kim-Kang, G., & Weiss, D. J. (2007). Comparison of computerized adaptive testing and classicalmethods for measuring individual change. In Proceedings of the 2007 GMAC Conference onComputerized Adaptive Testing. Available from www. psych. umn.edu/psylabs/CATCentral.
Kim-Kang, G., & Weiss, D. J. (2008). Adaptive measurement of individual change. Zeitschrift fürPsychologie/Journal of Psychology, 216, 49-58.
Kingsbury, G. G., & Houser, R. L. (1999). Developing computerized adaptive tests for school children. InF. Drasgow & J. B. Olson Buchanan (Eds.), Innovations in computerized assessment (pp. 93–115).Mahwah, NJ: Erlbaum.
Kingston, N., & Nash, B. (2011). Formative assessment: A meta‐analysis and a call for research.
Educational Measurement: Issues and Practice, 30(4), 28-37.
Kintsch, W. (1998). Comprehension: A Paradigm for Cognition. Boulder, CO: Cambridge UniversityPress.
Kintsch, W. & van Dijk, T. A. (1978). Toward a model of text comprehension and production.Psychological Review, 35(5), 363-394.
Kirkcaldy, B.D., Shephard, R.J. & Siefen, R.G. (2002). The relationship between physical activity and self-image and problem behavior among adolescents. Social Psychiatry and Psychiatric Epidemiology, 37,544-550.
Klare, G. R. (1974-1975). Assessing readability. Reading Research Quarterly, 10(1), 61-102.
Kolen, M. J., & Brennan, R. L. (2004). Test equating, scaling, and linking: Methods and practices (2nded.). New York: Springer-Verlag.
Kranzler, J.H., Brownell, M.T., & Miller, M.D. (1998). The construct validity of curriculum-basedmeasurement of reading: An empirical test of a plausible rival hypothesis. Journal of SchoolPsychology, 36 (4), 399-415.
Kuhl, J. & Kraska, K. (1989). Self-regulation and metamotivation: Computational mechanisms,development, and assessment. In R. Kanfer, P. Ackerman, R. Cudeck (Eds.), Abilities, motivation, andmethodology: The Minnesota Symposium on learning and individual differences, Lawrence ErlbaumAssociates, Hillsdale, NJ, pp. 373–374.
LaBerge, D., & Samuels, S. J. (1974). Toward a theory of automatic information processing in reading.Cognitive psychology, 6, 293-323.
Lee, J., Grigg, W., 8c Donahue, P. (2007). The nation's report card: Reading 2007 (NCES 2007-496).Washington, DC: National Center for Education Statistics, U.S. Department of Education.

References
Page | 136www.fastbridge.org
© 2015 Theodore J. Christ and Colleagues, LLC. All rights reserved.
Levy, B. A., Gong, Z., Hessels, S., Evans, M. A., & Jared, D. (2006). Understanding print: Early readingdevelopment and the contributions of home literacy experiences. Journal of Experimental ChildPsychology, 93(1), 63-93.
Liberman, A. M., Cooper, F. S., Shankweiler, D. P., & Studdert-Kennedy, M. (1967). Perception of thespeech code. Psychological review, 74(6), 431.
Lipson, M.L., Mosenthal, J. H., Mekkelsen, J., & Russ, B. (2004). Building knowledge and fashioningsuccess one school at a time. The Reading Teacher, 57 (6) 534-542.
Logan, G. D. (1997). Automaticity and reading: Perspectives from the instance theory ofautomatization. Reading and Writing Quarterly, 13, 123–146.
Lomax, R. G., & McGee, L.M. (1987). Young children’s concepts about print and reading: Toward amodel of word reading acquisition. Reading Research Quarterly, 22, 237-256.
MacGinitie, W., MacGinitie, R., Maria, K., & Dreyer, L.G. (2000). Gates-MacGinitie Reading Tests. 4th ed.Itasca, IL: Riverside Publishing Company.
Mandler, J. M. & Johnson, N. S. (1977). Remembrance of things parsed: Story structure and recall.Cognitive Psychology, 9(1), 111-151.
Markell, M. A., & Deno, S. L. (1997). Effects of increasing oral reading generalization across readingtasks. The Journal of Special Education, 31(2), 233-250.
Martone, A., & Sireci, S. G. (2009). Evaluating alignment between curriculum, assessment andinstruction. Review of Educational Research, 79(3), 1-76.
Mathes, P. G., Denton, C. A., Fletcher, J. M., Anthony, J. L., Francis, D. J., & Schatschneider, C. (2005). TheEffects of Theoretically Different Instruction and Student Characteristics on the Skills of StrugglingReaders. Reading Research Quarterly, 148-182.
Mazzeo D, Arens S, Germeroth C, Hein H. (2012). Stopping childhood obesity before it begins. PhiDelta Kappan, 93(7):10-15.
Mazzocco, M. M. M., & Thompson, R. E. (2005). Kindergarten predictors of math learning disability.Learning Disabilities Research and Practice, 20, 142 – 155.
McGregor, K. K. (2004). Developmental dependencies between lexical semantics andreading. Handbook of language and literacy, 302-317.
Measures of Academic Progress (MAP). Northwest Evaluation Association.
Messick, S. (1993). Validity. (In R. L. Linn (Ed), Educational measurement (2nd ed. pp. 13—104).Phoenix: American Council on Education and Oryx Press.)

References
Page | 137www.fastbridge.org
© 2015 Theodore J. Christ and Colleagues, LLC. All rights reserved.
Methe, S. A., Hojnoski, R., Clarke, B., Owens, B. B., Lilley, P. K., Politylo, B. C., White, K. M., & Marcotte, A.M. (2011). Innovations and future directions for early numeracy curriculum-based measurement:Commentary on the special series. Assessment for Effective Intervention, 36, 367 - 385.
Miller, K. (2004, October). Developing number names: A cross cultural analysis. Presentation at theEarly Childhood Academy, University of Michigan, Ann Arbor.
Morsy, L., Kieffer, M., & Snow, C. (2010). Measure for Measure: A Critical Consumers' Guide to ReadingComprehension Assessments for Adolescents. Final Report from Carnegie Corporation of New York'sCouncil on Advancing Adolescent Literacy. Carnegie Corporation of New York.
Morgan, P. L., Farkas, G., & Wu, Q. (2009). Five-year growth trajectories of Kindergarten children withlearning difficulties in mathematics. Journal of Learning Disabilities, 42, 306 321.
Muter, V., Hulme, C., Snowling, M. J., & Stevenson, J. (2004). Phonemes, rimes, vocabulary, andgrammatical skills as foundations of early reading development: evidence from a longitudinalstudy. Developmental psychology, 40(5), 665.
Nagy, W. E. (1988). Teaching Vocabulary to improve reading comprehension. National Council ofTeachers of English, 1111 Kenyon Rd., Urbana, IL 61801 (Stock No. 52384-015, $4.95 member, $7.50nonmember--ISBN-0-8141-5238-4); International Reading Association, PO Box 8139, 800 Barksdale Rd.,Newark, DE 19714-8139 (No. 151, $4.95 member, $7.50 nonmember--ISBN-0-87207-151-0).
National Center for Education Statistics (2013). The Nation’s Report Card: A First Look: 2013Mathematics and Reading (NCES 2014-451).Institute of Education Sciences, U.S. Department ofEducation, Washington, D.C.
National Center for Education Statistics (2013). The Nation’s Report Card: Trends in Academic Progress2012 (NCES 2013 456). Institute of Education Sciences, U.S. Department of Education, Washington, D.C.National Governors Association Center for Best Practices & Council of Chief State School Officers.(2010). Common Core State Standards for English Language Arts & Literacy in History/Social Studies,Science, & Technical Subjects. Washington, DC: National Governors Association Center for BestPractices, Council of Chief State Officers.
National Center for Response to Intervention (2010). Screening Tools Chart. U.S. Office of SpecialEducation Programs. Retrieved fromhttp://www.rti4success.org/sites/default/files/Screening%20Tools%20Chart.pdf
National Governors Association Center for Best Practices & Council of Chief State School Officers.(2010). Common Core State Standards for Mathematics. Washington, DC: Authors.
National Research Council. (2009). Mathematics learning in early childhood: Paths toward excellenceand equity. Washington, DC: Author.

References
Page | 138www.fastbridge.org
© 2015 Theodore J. Christ and Colleagues, LLC. All rights reserved.
Nation, K., Clarke, P., Marshall, C. M., & Durand, M. (2004). Hidden language impairments in children:Parallels between poor reading comprehension and specific language impairment? Journal of Speech,Language & Hearing Research, 47(1).
Nation, K., & Snowling, M. J. (2004). Beyond phonological skills: Broader language skills contribute tothe development of reading. Journal of research in reading, 27(4), 342-356.
National Mathematics Advisory Panel [NMAP], (2008) Foundations for Success: The Final Report of theNational Mathematics Advisory Panel (No. ED04CO0015/0006): U.S. Department of Education:Washington, D.C.
National Reading Panel (US), National Institute of Child Health, & Human Development (US). (2000a).Report of the National Reading Panel: Teaching children to read: an evidence-based assessment of thescientific research literature on reading and its implications for reading instruction: reports of thesubgroups. National Institute of Child Health and Human Development, National Institutes of Health.
National Reading Panel (US), National Institute of Child Health, & Human Development (US). (2000b).Teaching children to read: An evidence-based assessment of the scientific research literature onreading and its implications for reading instruction. National Institute of Child Health and HumanDevelopment, National Institutes of Health.
NCTM. (2000). Principles and standards for school mathematics. Reston, VA: National Council forTeachers of Mathematics.
Neuenschwander, R., Rothlisberger, M, Cimeli, P., Roebers, C.M. (2012). How do different aspects ofself-regulation predict successful adaptation to school? Journal of Experimental Child Psychology,113, 353-371.
Neuman, S.B. & Roskos, K. (2005). The state of pre-Kindergarten standards. Early Childhood ResearchQuarterly, 20, 125-145.
Nichols, W. D., Rickelman, R.J., & Rupley, W. H. (2004). Examining phonemic awareness and concepts ofprint patterns of Kindergarten students. Reading Research and Instruction. 43, 56-82.
McNamara, D. S., & Kintsch, W. (1996). Learning from texts: Effects of prior knowledge and textcoherence. Discourse processes, 22(3), 247-288.
Northwest Evaluation Association (NWEA) (2011). Measures of Academic Progress (MAP). Portland, OR.
Nunnally, J. C., & Bernstein, I. H. (1994). Psychometric theory (3rd ed.). New York: McGraw-Hill.
Nydick, S. W., & Weiss, D. J. (2009). A hybrid simulation procedure for the development of CATs. InProceedings of the 2009 GMAC Conference on Computerized Adaptive Testing. Retrieved from www.psych.umn.edu/psylabs/CATCentral.

References
Page | 139www.fastbridge.org
© 2015 Theodore J. Christ and Colleagues, LLC. All rights reserved.
Oakhill, J., & Cain, K. (2007). Introduction to comprehension development. In K. Cain & J. Oakhill (Eds.),Children’s comprehension problems in oral and written language: A cognitive perspective (pp. 3–40).New York: Guilford Press.
Oakhill, J. V., Cain, K., & Bryant, P. E. (2003). The dissociation of word reading and text comprehension:Evidence from component skills. Language and cognitive processes, 18, 443-468.
Okamoto, T. (1996, July). On relationships between statistical zero-knowledge proofs. In Proceedingsof the twenty-eighth annual ACM symposium on Theory of computing (pp. 649-658). ACM.
Paris, S. G. (2005). Reinterpreting the development of reading skills. Reading Research Quarterly, 40(2),184-202.
Perfetti, C. A. (1994). Psycholinguistics and reading ability. In M. Gernsbacher (Eds.), Handbook ofpsycholinguistics (pp. 849-894). San Diego, CA: Academic Press.
Perfetti, C. A. (1992). The representation problem in reading acquisition.
Porges, S. (2003). The polyvagal theory: Phylogenetic contributions to social behavior. Physiology andBehavior, 79, 503–513.
Phillips, B. M., & Torgesen, J. K. (2006). Phonemic awareness and reading: Beyond the growth of initialreading accuracy. Handbook of early literacy research, 2, 101-112.
Pratt, K., Martin, M., White, M.J., & Christ, T.J. (2010). Development of a FAIP-R First Grade Probe Set(Technical Report No. 3). Minneapolis, MN: University of Minnesota, Department of EducationalPsychology.
Purpura, D. J., & Lonigan, C. J. (2013). Informal numeracy skills: The structure and relations amongnumbering, relations, and arithmetic operations in preschool. American Educational Research Journal,50, 178-209.
RAND Reading Study Group (2002). Reading for understanding: Toward an R&D program in readingcomprehension. Santa Monica, CA: RAND.
Raver, C. C. & Knitzer, J. (2002). Ready to enter: What research tells policymakers about strategies topromote social and emotional school readiness among three- and four-year-old children. Promotingthe Emotional Well-being of Children and Families. Policy Paper No. 3. Columbia, New York: NationalCenter for Children in Poverty.
Rayner, K., Pollatsek, A., Ashby, J., & Clifton, C. Jr. (2012). Psychology of reading (2nd ed.). New York:Psychology Press.
Raudenbush, S. W. and Anthony S. Bryk (2002). Hierarchical linear models: Applications and dataanalysis methods, Second Edition. Newbury Park, CA: Sage

References
Page | 140www.fastbridge.org
© 2015 Theodore J. Christ and Colleagues, LLC. All rights reserved.
Reschly, A. L., Busch, T.W., Betts, J., Deno, S. L., and Long, J.D. (2009). Curriculum-Based measurementoral reading as an indicator of reading achievement: A meta-analysis of the correlational evidence.Journal of School Psychology, 47, 427-469.
Ricketts, J., Nation, K., & Bishop, D. V. (2007). Vocabulary is important for some, but not all readingskills. Scientific Studies of Reading, 11(3), 235-257.
Riddle Buly, M., & Valencia, S. W. (2002). Below the bar: Profiles of students who fail state reading tests.Educational Evaluation and Policy Analysis, 24, 219-239.
Renaissance Learning. (1998b). STAR Math. Wisconsin Rapids, WI: Renaissance Learning.
Rubin, D. C. (1995). Memory in oral traditions: The cognitive psychology of epic, ballads, and counting-out-rhymes. New York: Oxford University Press.
Rydell, A., Berlin, L., & Bohlin, G. (2003). Emotionality, emotion regulation, and adaptation among 5- to8-year-old children. Emotion, 3, 30–47.
Samejima, F. (1994). Some critical observations of the test information function as a measure of localaccuracy in ability estimation. Psychometrika, 59(3), 307-329.
Samuels, S. J. (2007). The DIBELS tests: Is speed of barking at print what we mean by reading fluency?Reading Research Quarterly, 42, 563–566.
Sadler, D. (1989). Formative assessment and the design of instructional systems. Instructional Science,18(2), 119-144.
Scarborough, H. (2001). Connecting early language and literacy to later reading (dis)abilities: Evidence,theory, and practice. In S. B. Neuman & D. Dickinson (Eds.), Handbook of early literacy research (pp. 97–110). New York: Guilford Press.
Schank, Roger C., and Robert P. Abelson. 1977. Scripts, plans, goals, and understanding: An inquiry intohuman knowledge structures. Hillsdale, NJ: Lawrence Erlbaum.
Schmeiser, C. B., & Welch, C. J. (2006). Test development. In R. L. Brennan (Ed.), EducationalMeasurement (4th ed., pp. 623-646). Westport, CT: American Council on Education and PraegerPublishers.
Severson, H. H., Walker, H. M., Hope-Doolittle, J., Kratochwill, T. R., & Gresham, F. M. (2007). Proactive,early screening to detect behaviorally at-risk students: Issues, approaches, emerging innovations, andprofessional practices. Journal of School Psychology, 45, 193-223.
Shinn, M. R. (Ed.). (1989). Curriculum-based measurement: Assessing special children. New York:Guilford Press.

References
Page | 141www.fastbridge.org
© 2015 Theodore J. Christ and Colleagues, LLC. All rights reserved.
Skiba, R. & Peterson, R. (2000). School discipline at a crossroads: From zero tolerance to early response.Exceptional Children, 32, 200-216.
Snow, C. E., Burns, M. S., & Griffin, P. (Eds.). (1998). Preventing reading difficulties in young children.National Academies Press.
Stahl, S. A. (2001). Teaching phonics and phonological awareness. Handbook of early literacyresearch, 1, 333-347.
Snow, C. (1991). The theoretical basis for relationships between language and literacy in development.Journal of Research in Childhood Education, 6, 5–10.
Snow, C. E., Burns, M. S., & Griffin, P. (1998). Preventing reading difficulties in young children. NationalAcademies Press.
Stanovich, K. E. (1981). Attentional and automatic context effects in reading. In A. M. Lesgold & C. A.Perfetti (Eds.), Interactive processes in reading. Hillsdale, N.J.: Erlbaum.
Stanovich, K.E. (1984). The interactive-compensatory model of reading: A confluence ofdevelopmental, experimental, and educational psychology. Remedial and Special Education, 5, 11-19.
Stanovich, K. E. (1986). Matthew effects in reading: Some consequences of individual differences in theacquisition of literacy. Reading Research Quarterly, 360-407.
Stanovich, K. E. (1990). A call for an end to the paradigm wars in reading research. Journal of ReadingBehavior, 22, 221-231.
Stanovich, K. E., & West, R. F. (1989). Exposure to print and orthographic processing. Reading ResearchQuarterly, 24(4), 402-433.
Stein, N. L. & Glenn, C. G. (1975). An Analysis of Story Comprehension in Elementary School Children: ATest of a Schema (Report No. PS 008 544). Washington University. (ERIC Document ReproductionService No. ED121474).
Stein, N. L. & Trabasso, T. (1982). What's in a story: An approach to comprehension and instruction. InR. Glaser (Ed.), Advances in the psychology of instruction (Vol. 2). Hillsdale, N.J.: Erlbaum.
Storch, S. A., & Whitehurst, G. J. (2002). Oral language and code-related precursors to reading:evidence from a longitudinal structural model. Developmental psychology, 38, 934-947.
Sugai, G., Horner, R., & Gresham, F. (2002). Behaviorally effective school environments. In Shinn, M.R.,Walker, H.M.,& Stoner, G. (Eds.), Interventions for academic and behavior problems II: Preventive andremedial approaches (pp. 315–350). Bethesda, MD: National Association of School Psychologists.

References
Page | 142www.fastbridge.org
© 2015 Theodore J. Christ and Colleagues, LLC. All rights reserved.
Sugden, D.A. (1986). The development of proprioceptive control. Themes in Motor Development, 35,21-39.
Swets, J. A., R. M. Dawes, & J. Monahan (2000), “Psychological Science Can Improve DiagnosticDecisions”, Psychological Science in the Public Interest 1: 1–26. Test of Silent Reading Efficiency andComprehension (TOSREC).
Taylor, B. M., Pearson, P., Clark, K., & Walpole, S. (2000). Effective schools and accomplished teachers:Lessons about primary-grade reading instruction in low-income schools. The Elementary SchoolJournal, 101(2), 121-165.
Taylor, B. M., Pearson, P., Peterson, D. S., & Rodriguez, M. C. (2003). Reading growth in high-povertyclassrooms: The influence of teacher practices that encourage cognitive engagement in literacylearning. The Elementary School Journal, 104(1), 3-28.
Taylor, B. M., Pearson, P., Peterson, D. S., & Rodriguez, M. C. (2005). The CIERA School ChangeFramework: An evidence-based approach to professional development and school readingimprovement. Reading Research Quarterly, 40(1), 40-69.
Thompson, S. J., Johnstone, C. J., Thurlow, M. L., & Clapper, A. T. (2004). State literacy standards,practices, and testing: Exploring accessibility (Technical Report 38). Minneapolis, MN: University ofMinnesota, National Center on Educational Outcomes.
Trabasso, T. & Nickels, M. (1992). The development of goal plans of action in the narration of a picturestory. Discourse Processes, 15, 249-275.
Trabasso, T. & Stein, N. L. (1997). Narrating, representing, and remembering event sequences. In P. W.van den Broek, P. J. Bauer, & T. Bourg (Eds.), Developmental spans in event comprehension andrepresentation: Bridging fictional and actual events (pp. 237-270). Mahwah, NJ: Erlbaum.
Tumner, W. E., Herriman, M. L., & Nesdale, A. R. (1988). Metalinguistic abilities and beginning Reading.Reading Research Quarterly, 23, 134-158.
Van de Walle, J. A., Karp, K. S. & Bay-Williams, J. M. (2013). Elementary and middle school mathematics:Teaching developmentally (8th ed.). New York, NY: Pearson.
van den Broek, P. & Trabasso, T. (1986). Causal networks versus goal hierarchies in summarizing text.Discourse Processes, 9, 1-15.
van den Broek, P. (1994). Comprehension and memory of narrative texts: Inferences and coherence. InM. A. Gernsbacher (Ed.) Handbook of Psycholinguistics (pp. 539-588). New York: Academic Press.
VanDerHeyden, A. M. (2011). Technical adequacy of response to intervention decisions. ExceptionalChildren, 77, 335-350.

References
Page | 143www.fastbridge.org
© 2015 Theodore J. Christ and Colleagues, LLC. All rights reserved.
VanLoy, W. J. (1996). A comparison of adaptive self-referenced testing and classical approaches to themeasurement of individual change (Doctoral dissertation, University of Minnesota).
Vellutino, F. R. (2003). Individual differences as sources of variability in reading comprehension inelementary school children. In A. P. Sweet & C. E. Snow (Eds.), Rethinking Reading Comprehension (pp.5-81). New York: Guilford Press.
Vellutino, F. R., & Scanlon, D. M. (1987). Phonological coding, phonological awareness, and readingability: Evidence from a longitudinal and experimental study. Merrill-Palmer Quarterly: Journal ofDevelopmental Psychology, 33, 321-363.
Vellutino, F. R., & Scanlon, D. M. (1991). The preeminence of phonologically based skills in learning toread. In S. Brady & D. Shankweiler (Eds.), Phonological processes in literacy: A tribute to IsabelleLiberman (pp. 237–252). Hillsdale, NJ: Erlbaum.
Vellutino, F. R., Scanlon, D. M., Small, S. G., & Tanzman, M. S. (1991). The linguistic basis of readingability: Converting written to oral language. Text, 11, 99–133.
Wayman, J., Cho, V. & Johnston, M. (2007). The Data-Informed District: A District-Wide Evaluation ofData Use in the Natrona County School District. Austin: The University of Texas. Retrieved 3/12/08 fromhttp://edadmin.edb.utexas.edu/datause/
Weiss, D. J. (2004). Computerized Adaptive Testing for Effective and Efficient Measurement inCounseling and Education. Measurement & Evaluation in Counseling & Development (AmericanCounseling Association), 37(2).
Weiss, D. J., & Kingsbury, G. (1984). Application of computerized adaptive testing to educationalproblems. Journal of Educational Measurement, 21(4), 361-375.
Weiss, D. J., & Kingsbury, G. (2005). Application of computerized adaptive testing to educationalproblems. Journal of Educational Measurement, 21(4), 361-375.
Westberg, K. L. (1993). An Observational Study of Instructional and Curricular Practices Used withGifted and Talented Students in Regular Classrooms. Research Monograph 93104.
Westberg, K. L., & Daoust, M. E. (2003). The results of the replication of the classroom practices surveyreplication in two states. The National Research Center on the Gifted and Talented Newsletter, 3-8.
Whitehurst, G. J., & Lonigan, C. J. (1998). Child development and emergent literacy. Childdevelopment, 69(3), 848-872.
Williams, K.T. (2001). Group Reading Assessment and Diagnostic Evaluation (GRADE).Circle
Pines, MN: AGS Publishing.

References
Page | 144www.fastbridge.org
© 2015 Theodore J. Christ and Colleagues, LLC. All rights reserved.
Williams, K.T. (2004). Group Mathematics Assessment and Diagnostic Evaluation (GMADE). Circle Pines,MN: AGS Publishing.
Williford, A.P., Maier, M.F., Downer, J.T., Pianta, R.C., & Howes, C. (2013). Understanding how children’sengagement and teacher’s interactions combine to predict school readiness. Journal of AppliedDevelopmental Psychology, 34, 299-309.
Zeno, S.M., Ivens, S.H., Millard, R.T., Duvvuri, R. (1995). The educator’s word frequency guide. Brewster,NY: Touchstone Applied Science Associates.
Zickar, M. J., Overton, R. C., Taylor, L. R., & Harms, H. J. (1999). The development of a computerizedselection system for computer programmers in a financial services company. In F. Drasgow & J. B.Olson-Buchanan (Eds.), Innovations in computerized assessment (pp. 7-33). Mahwah, NJ: Erlbaum.
Zwaan, R. A. & Rapp, D. N. (2008). Discourse comprehension. In M. J. Traxler & M. A. Gernsbacher (Eds.),Handbook of Psycholinguistics, 2nd Edition (pp. 725-764). New York: Elsevier.

Appendix A: Benchmarks and Norms Information
Page | 145www.fastbridge.org
© 2015 Theodore J. Christ and Colleagues, LLC. All rights reserved.
Appendix A: Benchmarks and Norms Information
Norms and benchmarks are reported in the FastBridge Learning Benchmarks and Norms Guide, 2015-2016.

Appendix C: Diagnostic Accuracy Supplement for Reading
Page | 146www.fastbridge.org
© 2015 Theodore J. Christ and Colleagues, LLC. All rights reserved.
Appendix B: FastBridge Learning Reading DiagnosticAccuracy
Table 105. Summary of Diagnostic Accuracy AUC Statistics and Validity Evidence
Grade Measure Subtest
F to W
AUC
W to S
AUC
F to S
AUC
Concurrent
Validity
(Spring)
K earlyReading Concepts of Print .80 -.81 — — pending
Onset Sounds .83 - .84 — — pending
Letter Names .78 - .82 — — pending
Letter Sounds .80 - .82 — — pending
Composite .82 - .84 .84 .73–.76 pending
1 earlyReading Letter Sounds .73 - .99 .76–.77 .75–.78 pending
Word Rhyming — .71–.75 — pending
Word Segmenting .87 — — pending
Nonsense Words .66 - .89 — — pending
Sight Words .69 - .92 — — pending
Sentence Reading .71 - .94 .82–.92 .72 pending
Composite .85 - .89 — — pending
2 aReading — — — .96–.97
CBMreading — — — .97 –.99
3 aReading — — .83–.97 .76–.90 .78–1.00
CBMreading — — .76–.97 .79–.97 .77 –1.00
4 aReading — — .77–.94 .75–.92 .79–1.00
CBMreading — — .78–.90 .81–.89 .71–1.00
5 aReading — — .71–.93 .68–.93 .78–.96
CBMreading — — .71–.93 .71–.91 .69–.97
6 aReading — — .77–.92 .83–.89 .86–1.00
CBMreading — — .81–.88 .83–.88 .81–1.00
7 aReading — — .91–.92 .81–.85 pending
8 aReading — — .92–.95 .69–.85 pending
9 aReading — — — .85–.87 pending
10 aReading — — — .77–.82 pending
Note. F = Fall; W = Winter; S = Spring