Embed Size (px)
Citation preview
ORI GIN AL PA PER
Formation of Variously Shaped Gold Nanoparticlesby Anabaena laxa
Monika Lenartowicz1• Paulina H. Marek2
•
Izabela D. Madura2• Jacek Lipok1
Received: 13 January 2017 / Published online: 22 July 2017
� The Author(s) 2017. This article is an open access publication
Abstract Anew aspect of this study is the biocatalysis ability of Anabaena laxa—
fresh-water strain—which to date has not been studied with respect to the formation
of gold nanoparticles. The results of our study have shown that A. laxa is able to
form gold nanoparticles (AuNPs) at good yields within 24 h of incubation at all
three tested concentrations (0.1, 0.5 and 1 mM) of hydrogen tetrachloroaurate (III).
After 24 h, nanoparticles were mostly localized in the growth medium, which
significantly facilitates their isolation. However, the elongation of this process is
accompanied by their concentration in the exopolysaccharide (EPS) layer of the
cyanobacterial cells. There is a correlation between the initial concentration of the
Au3? cations and the formation of AuNPs of various shapes and a size. The
comparison of activities of living and deactivated cells indicated that AuNPs were
formed more efficiently when metabolically active cyanobacteria were used.
Keywords Biocatalytic formation � Gold nanoparticles � Cyanobacteria � Anabaenalaxa
& Jacek Lipok
Monika Lenartowicz
1 Faculty of Chemistry, Opole University, Oleska 48, 45-052 Opole, Poland
2 Faculty of Chemistry, Warsaw University of Technology, Noakowskiego 3, 00-664 Warsaw,
Poland
123
J Clust Sci (2017) 28:3035–3055
DOI 10.1007/s10876-017-1275-0
Introduction
Although gold nanoparticles (AuNPs) have been known since antiquity, they are
now one of the most investigated fields, which is confirmed by increasing numbers
of publications [1]. The high interest in gold nanoparticles is due to their unique
properties, which are determined by their morphology, mainly shape and size. These
features strongly depend on their method of synthesis.
Currently, several (physical, chemical and biological) methods of synthesis of
metallic nanoparticles are known. The most commonly used physico-chemical
methods rely mostly on a bottom-up technique; oxidation/reduction processes are
the major modes, in which metal cations are reduced to nanoparticles by various
agents [2]. The most popular and well-defined nanoparticles are spherical which
differ from each other mainly by size (diameter) and thus have found many
applications in technology and medicine. Spherical nanoparticles are widely
described in the literature and evidenced by almost 2500 review papers (Web of
Science, September 2016). Nanoparticles of varying shapes, such as rods [3], cubes
[4], triangular prisms [5] and branched nanocrystals [6], exhibit significantly
different properties than spherical NPs [7], which are more pronounced in studies of
their applications. The nanorodparticles possess a higher sensitivity to the local
dielectric environment than spherical particles of a similar size. This feature makes
them excellent colorimetric probes [8]. The AuNPs have found numerous
applications in different disciplines of science and industry, such as: catalysis [9],
detection of toxic ions [10], biosensors and bioprobes [11], molecular recognition
[12], and nanoelectrodes [13]. Non-spherical particles also demonstrate catalytic
activity on textured surfaces and the enhancement of the surface enhanced Raman
spectroscopy SERS effect [14]. Some NPs have been examined as antibacterial
agents [15, 16]. Extensive studies on irregular metallic NPs result from their
possible application in biomedicine, since an important feature of these NPs is the
appearance of a plasmon band in the near-infrared region. The adsorption of near-
infrared radiation by tissues is relatively low; therefore, the region between 800 nm
and 1300 nm can be used for medicinal diagnostics. Due to this, metallic
nanoparticles of various shapes may be used as contrast agents [17] in photothermal
cancer therapy [18] and as nanocarriers for drug or gene delivery [19, 20].
Nanoparticles obtained by biological processes possess the same features and are
applied in the same way as those synthesized by classic chemical methods [15, 16].
Therefore, engaging various organisms, such as bacteria, fungi [21] and algae
[22–24] to plants [25], is an interesting alternative to the chemical and physical
methods of producing metal nanoparticles (MeNPs). This is because biological
processes are relatively cheap, environmentally friendly, easy to prepare and less
toxic. Biological processes can lead to nanoparticles suited for a wide range of
applications due to their differing morphology [15, 26]. The biological methods are
also based on the reduction of starting metal cations, which are added to the medium
containing live or dead microorganisms or secreted enzymatic cocktails [2]. The
reduction of metal ions by microorganisms is one of their protective mechanisms,
which are used to convert harmful chemicals into harmless substances [27]. The
3036 M. Lenartowicz et al.
123
microbial process can be performed in two ways: in vitro with the use of some cell
extracts or in vivo with the use of living cells [28]. Regarding the in vivo process,
the biosynthesis of MeNPs may be classified as dependent on the location where
nanoparticles are formed. The intracellular processes of formation comprise the
transportation of ions into microbial cells to form nanoparticles due to the
oxidoreductive activity of appropriate enzymes. Extracellular synthesis comprises
the capturing of metal ions on the surface of the cells, followed by the reduction of
cations [16]. The morphology of the biosynthesized nanoparticles depends on
various parameters, such as temperature, pH, the ratio between biomass and ion
concentrations and the duration of the process [12, 28]. The size and the shape are
also dependent on the strain of microorganism used [29], which is probably related
to the specificity of their enzymes and/or cell wall composition. Among
microorganisms that are capable of synthesizing gold nanoparticles, a photoau-
totrophic bacterium, cyanobacteria, is gaining increasing interest. It was proven that
the nitrogenases [EC 1.19.6.1] [EC 1.18.6.1] present in the specialized cyanobac-
terial cells, heterocysts, are taking part in bioreduction processes. Since nitrogenase
uses the nitrogen in the ambient air as a substrate, there is no need to add an external
reducing agent, as there is in case of hydrogenases, which always require the
presence of hydrogen or other reducing agents [30]. However, the mentioned
enzymes are not the main or only ones responsible for the production of AuNPs,
since there is evidence that NPs obtained extracellularly are present mostly within
vegetative cells and not in heterocysts [22, 28]. The study of Dahoumane and co-
authors proved that other types of microalgae, devoid of nitrogenases, offer a better
yield of nanoparticles [24, 29, 31, 32]. Spirulina platensis is the most frequently
mentioned cyanobacterial species able to produce AuNPs [33, 34] and thus can be
regarded as a model microorganism in this group. Other species described in the
literature include Nostoc ellipsosporum [35], Phormidium valderianum, Phormid-
ium tenue [36], Anabaena flos-aquae [29] and Anabaena sp. [28].
Anabaena flos-aquae [29] and Anabaena sp. [28] have been described as species
capable of reducing gold ions with the formation of spherical nanoparticles in most
cases. The aim of our paper is to enlarge this family by adding Anabaena laxa
(Braun) to the cyanobacterial species possessing this activity. The important issues
of our study were the influence of the initial concentration of Au3? on the
morphology of the obtained gold nanoparticles and the efficiency of formation and
stability of AuNPs in cyanobacterial media. Finally, we discuss the advantage using
living cells in the synthesis of AuNPs in the context of the yield of this process.
Materials and Methods
Cultivation of Cyanobacteria
The strain of A. laxa was purchased from the Culture Collection of Autotrophic
Organisms (CCALA), Institute of Botany, Academy of Sciences of the Czech
Republic. The cultivation of the microorganism was conducted in BG11 (ATCC
616) medium, which is typically used for the cultivation of fresh-water species. The
Formation of Variously Shaped Gold Nanoparticles by… 3037
123
medium is composed of the optimal mixture of nutrients to support the growth of
these organisms. The cultures of cyanobacteria were transferred to the fresh medium
every 3 weeks (when they were still in exponential phase and in good metabolic
conditions) in order to maintain the culture or obtain the microorganisms for
experimental inoculation. Cyanobacteria were cultivated at 23 ± 1 �C under
16/8 h day/night light conditions (25 lmol m-2 s-1 PAR) in 250 mL Erlenmeyer
flasks containing 50 mL of fresh medium, which was inoculated with 10 mL of
three-week-old culture. All activities related to the transfer of cyanobacterial
cultures were performed under a laminar flow chamber using sterile glass and sterile
equipment.
Estimation of Total Chlorophyll Content in Experimental Inoculum
The three-week-old cultures of cyanobacteria were centrifuged at 5000 rpm for
1 min, then the supernatants were removed and the cells were collected together due
to obtained experimental inoculum. Next the three 1.0 mL portions of inoculum
were centrifuged at 13,000 rpm for 5 min and the supernatants were removed. The
cyanobacterial pellets in each sample were resuspended in 0.9 mL methanol and
placed in the dark for 20 min with occasional stirring. After this time the methanol
extracts were centrifuged in the same condition as described above, and the
absorbances of the supernatants were measured at 645 and 663 nm against blank
using a Hitachi U-2810 UV–Vis spectrophotometer (Warszawa, Poland) [37]. The
concentrations (lg/mL) of the total chlorophyll were calculated based on Arnon’s
equation [38]:
Cchlorophyll ¼ 20:2 � A645 þ 8:02 � A663:
Viability of A. laxa
Cultivations of A. laxa were performed in 100 mL Erlenmeyer flasks containing
30 mL of fresh medium, which was supplemented with the appropriate volumes of
120 or 12 mM stock solutions of hydrogen tetrachloroaurate (III) trihydrate—
HAuCl4�3H2O (Sigma-Aldrich, Poznan, Poland) to obtain the final concentrations of
0.01; 0.05; 0.1; 0.5 and 1.0 mM. The stock solutions were prepared by dissolving
the HAuCl4 in deionized (Milipore Q) water, which was further sterilized by
filtration through a sterile cellulose acetate membrane with a pore diameter of
0.20 lm (Bionovo, Legnica, Poland). At the beginning of the experiment (day 0),
each culture contained the same amount of living A. laxa cells, related to 5 lg of
chlorophyll in 1 mL of culture. All activities were performed in a laminar flow
chamber using sterile equipment. Each experimental set was carried out at least in
triplicate. The viability of cyanobacteria growing at 23 ± 1 �C, under 16/8 h day/
night light conditions (250 lmol m-2 s-1 PAR), was estimated on the basis of the
chlorophyll content (an indicator of metabolic activity), which was measured on
days 1, 2, 3, 4, 7, 11 and 14.
3038 M. Lenartowicz et al.
123
Biosynthesis of Gold Nanoparticles by A. laxa
Experimental cultivations were performed according to the procedure described
above (Viability of A. laxa) but only for the final concentrations of HAuCl4: 0.1, 0.5
and 1.0 mM. Each experiment was carried out at least in triplicate by cultivating the
bacteria for 24 h or 14 days in order to obtain the cells and media for further
analyses. For this purpose the appropriate samples were centrifuged at 5000 rpm for
1 min and post-culture media were decanted and analysed using TEM and UV–Vis
methods. The concentrated biomass was washed three times by resuspending the
cells in deionized water followed by centrifugation and removal of supernatant.
Cyanobacterial pellets were prepared for SEM analysis and for the extraction of
gold nanoparticles.
To determine whether cyanobacterial cells influence the stability of formed gold
nanoparticles, the following experiment was performed. The cultures of A. laxa
were prepared according to the method described in the previous subsection, with
the difference being in that the experimental set (one set contains three
concentrations of gold ions in triplicate) was doubled. After 24 h of incubation,
when the AuNPs were obtained, cyanobacterial cells were removed by filtration
through cellulose acetate filters (0.45 lm) (Bionovo, Legnica, Poland) from one of
the sets. In the second set, the cells remained in the medium. Both sets were placed
under the temperature and light conditions described previously for seven days.
During this time, the UV–Vis spectra of 1-mL samples from each experiment (with
or without microorganisms) were recorded on days 0, 1, 2, 3, 4 and 7. The samples
containing cyanobacterial cells were filtered through cellulose acetate filters
(0.45 lm) before each spectroscopic measurement.
Extraction of Gold Nanoparticles from Cyanobacterial Cells
After 14 days of incubation, the cells were separated from the media by
centrifugation (5000 rpm for 1 min). They were transferred to 1 mL of 7.5 mM
sodium citrate solution (Sigma-Aldrich, Poznan, Poland) and placed in an ultrasonic
bath for 30 min. Sodium citrate is considered an environmentally friendly substance
due to its lack of surfactant features and it is commonly used in the preparation of
gold nanoparticles, mostly as a capping agent for their stabilization. For example,
Parial and Pal successfully used a sodium citrate solution to extract gold
nanoparticles from Spirulina subsalsa biomass [39]. Therefore, we decided to
adapt this method for our purposes. After the ultrasound-assisted extraction, the
samples were centrifuged (5000 rpm for 1 min) and the supernatants were analysed
by UV–Vis spectroscopy with respect to the presence of gold nanoparticles.
Formation of Gold Nanoparticles Catalysed by Deactivated Cells of A. laxa
The deactivation of cyanobacterial cells was performed either by freezing or with
the application of high temperature. The chlorophyll content of the appropriate
amount of concentrated cells was measured, and then the cells were divided into
twenty-four portions. Every portion was treated as an inoculum, which if added to
Formation of Variously Shaped Gold Nanoparticles by… 3039
123
an experimental culture created the final concentration of chlorophyll of 5 lg/mL.
Twelve of those portions were then autoclaved at 126 �C for 20 min, and twelve
others were frozen at -23 �C. Next, all these portions of deactivated cells were left
to reach room temperature (23 �C) and were placed in the glass flasks filled with
30 mL of deionized water supplemented with hydrogen tetrachloroaurate, with final
concentrations of 0.1, 0.5 or 1.0 mM. All samples were prepared in triplicate and
were incubated alongside the appropriate controls (without gold cations) for 24 h in
the temperature and light conditions described in the subsection Cultivation of
cyanobacteria. After this time, the supernatants were separated from the cells and
analysed by UV–Vis spectrophotometery in order to initially check for the presence
of AuNPs and subsequently study the surface plasmon resonance (SPR) features.
Characterization Techniques
UV–Visible Spectroscopy
UV–Vis spectra were taken for three types of samples: (i) media, (ii) aqueous and
(iii) citrate extracts from cyanobacterial cells. For this purpose, an aliquot of 1 mL
solution was scanned in the range of 400–1000 nm in order to determine the
spectrum of the gold nanoparticles formed by living A. laxa or in the range of
400–700 nm in the all other experiments using medium, water or stock solutions of
sodium citrate, as blanks.
X-ray Diffraction (XRD)
The crystalline nature and the approximate size of AuNPs were determined by X-
ray diffraction studies. For XRD studies the portions of three samples (0.1; 0.5 and
1.0 mM) obtained by biosynthesis after incubation of gold ions (concentrations: 0.1;
0.5 and 1.0 mM) with A. laxa cells were lyophilized and analyzed. Laboratory
powder X-ray diffraction patterns were recorded at room temperature on a Bruker
D8 Advance diffractometer (Warsaw, Poland) equipped with a LYNXEYE position
sensitive detector, using Cu-Ka radiation (k = 0.15418 nm). The data were
collected in the Bragg–Brentano (h/h) horizontal geometry (flat reflection mode)
between 7� and 70� (2h) in a continuous scan, using 0.03� steps 960 s/step. The
diffractometer incident beam path was equipped with a 2.5� Soller slit, and a 1.14�fixed divergence slit, while the diffracted beam path was equipped with a
programmable antiscatter slit (fixed at 2.20�), a Ni b-filter and a 2.5� Soller slit.
Data were collected under standard laboratory conditions (temperature and relative
humidity). The size of the AuNps was estimated by using the Scherrer equation:
Bð2hÞ ¼ Kk=L cos h
where B—reflection full width at half maximum, k = 1.54056 A, L—size of
crystallites. The value of the Scherrer constant K has been set to 1 [40]. The same
3040 M. Lenartowicz et al.
123
procedure of the instrumental profile and the background subtraction were applied
to three analysed samples.
Fourier Transform Infrared Spectroscopy (FT-IR)
The media containing AuNPs were separated from cyanobacterial cells after 24 h of
incubation and then centrifuged at 13,000 rpm for 10 min in order to isolate the
gold nanoparticles from the free proteins and other compounds present in the
supernatant. The pellets of gold nanoparticles obtained after centrifugation were re-
dispersed in deionized water and centrifuged again at 13,000 rpm for 10 min to
isolate the gold nanoparticles. Thus, the obtained AuNPs were lyophilized, then
incorporated in KBr pellets and subjected to FT-IR measurements, which were
carried out on a Nicolet Nexus (Thermo Scientific, Warszawa) spectrophotometer in
the diffuse reflectance mode operating at a resolution of 4 cm-1.
Transmission Electron Microscopy (TEM)
Media rich in gold nanoparticles (after 24 h of incubation) were analysed by
transmission electron microscopy (TEM). For this purpose, a drop of the supernatant
was placed on a carbon-coated copper grid and allowed to dry. TEM micrographs
were taken using an FEI Tecnai G2 20 X-TWIN instrument (University of Wroclaw,
Faculty of Chemistry) at an accelerating voltage of 200 kV using ES Vision analysis
software.
Scanning Electron Microscopy (SEM)
After 14 days of cultivation, the control and cultures of A. laxa brought into contact
with gold ions were centrifuged at 5000 rpm for 1 min. Then, the cells were
separated from the post-culture media and washed three times with sterile double-
distilled water. The pellet was suspended in a 3% solution of glutaraldehyde in
0.2 M phosphate buffer (pH 6.8–7.4) and placed at 4 �C overnight. Next, the cells
were washed three times with 0.1 M phosphate buffer (pH = 7.2), suspended in a
1% solution of osmium tetroxide in 0.1 M phosphate buffer and left for 2 h in the
dark. After this time, the cells were washed three times with 0.1 M phosphate buffer
and their sequential dehydration with 50, 60 and 70% ethanol was carried out. After
this step, the samples were lyophilized, placed on carbon tape and covered by
carbon. SEM and EDS analysis were performed using a scanning electron
microscope (Hitachi TM 3000, Warszawa, Poland) at voltage beam of 5.15 keV,
resolution *30 nm, magnification up to 30,000, using Quantax 70 analysis
software.
Formation of Variously Shaped Gold Nanoparticles by… 3041
123
Results
Viability of A. laxa
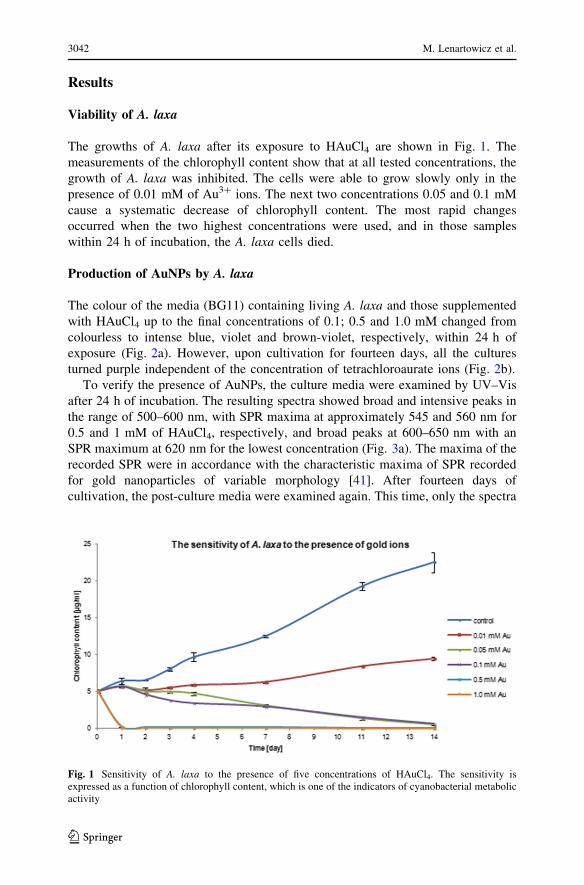
The growths of A. laxa after its exposure to HAuCl4 are shown in Fig. 1. The
measurements of the chlorophyll content show that at all tested concentrations, the
growth of A. laxa was inhibited. The cells were able to grow slowly only in the
presence of 0.01 mM of Au3? ions. The next two concentrations 0.05 and 0.1 mM
cause a systematic decrease of chlorophyll content. The most rapid changes
occurred when the two highest concentrations were used, and in those samples
within 24 h of incubation, the A. laxa cells died.
Production of AuNPs by A. laxa
The colour of the media (BG11) containing living A. laxa and those supplemented
with HAuCl4 up to the final concentrations of 0.1; 0.5 and 1.0 mM changed from
colourless to intense blue, violet and brown-violet, respectively, within 24 h of
exposure (Fig. 2a). However, upon cultivation for fourteen days, all the cultures
turned purple independent of the concentration of tetrachloroaurate ions (Fig. 2b).
To verify the presence of AuNPs, the culture media were examined by UV–Vis
after 24 h of incubation. The resulting spectra showed broad and intensive peaks in
the range of 500–600 nm, with SPR maxima at approximately 545 and 560 nm for
0.5 and 1 mM of HAuCl4, respectively, and broad peaks at 600–650 nm with an
SPR maximum at 620 nm for the lowest concentration (Fig. 3a). The maxima of the
recorded SPR were in accordance with the characteristic maxima of SPR recorded
for gold nanoparticles of variable morphology [41]. After fourteen days of
cultivation, the post-culture media were examined again. This time, only the spectra
Fig. 1 Sensitivity of A. laxa to the presence of five concentrations of HAuCl4. The sensitivity isexpressed as a function of chlorophyll content, which is one of the indicators of cyanobacterial metabolicactivity
3042 M. Lenartowicz et al.
123
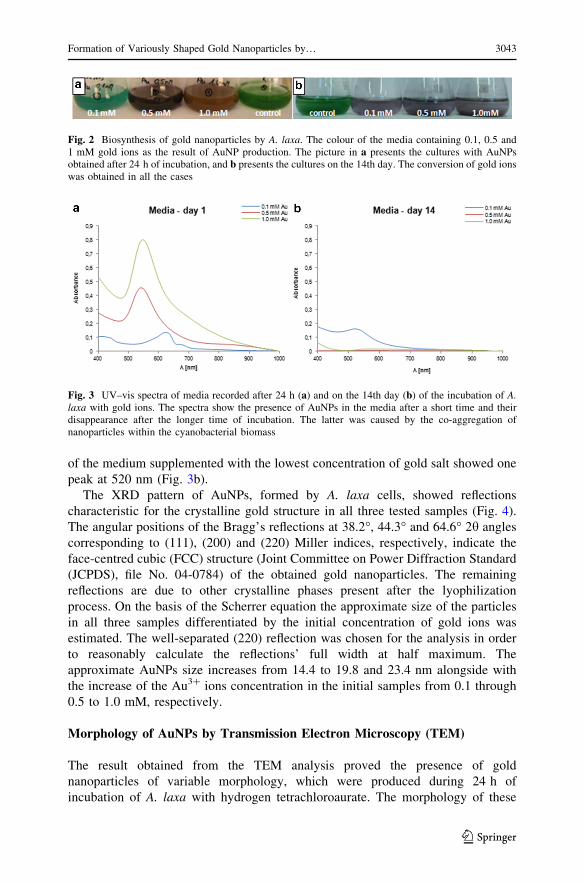
of the medium supplemented with the lowest concentration of gold salt showed one
peak at 520 nm (Fig. 3b).
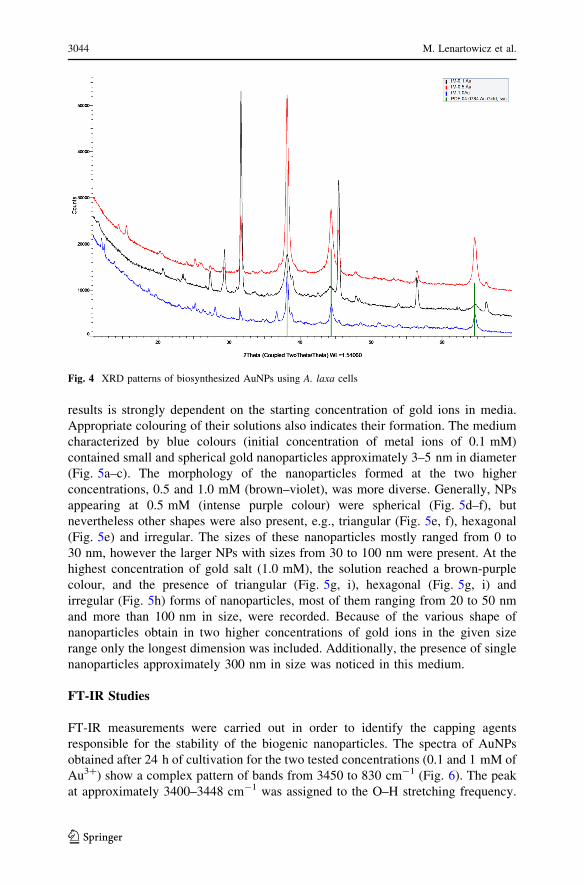
The XRD pattern of AuNPs, formed by A. laxa cells, showed reflections
characteristic for the crystalline gold structure in all three tested samples (Fig. 4).
The angular positions of the Bragg’s reflections at 38.2�, 44.3� and 64.6� 2h angles
corresponding to (111), (200) and (220) Miller indices, respectively, indicate the
face-centred cubic (FCC) structure (Joint Committee on Power Diffraction Standard
(JCPDS), file No. 04-0784) of the obtained gold nanoparticles. The remaining
reflections are due to other crystalline phases present after the lyophilization
process. On the basis of the Scherrer equation the approximate size of the particles
in all three samples differentiated by the initial concentration of gold ions was
estimated. The well-separated (220) reflection was chosen for the analysis in order
to reasonably calculate the reflections’ full width at half maximum. The
approximate AuNPs size increases from 14.4 to 19.8 and 23.4 nm alongside with
the increase of the Au3? ions concentration in the initial samples from 0.1 through
0.5 to 1.0 mM, respectively.
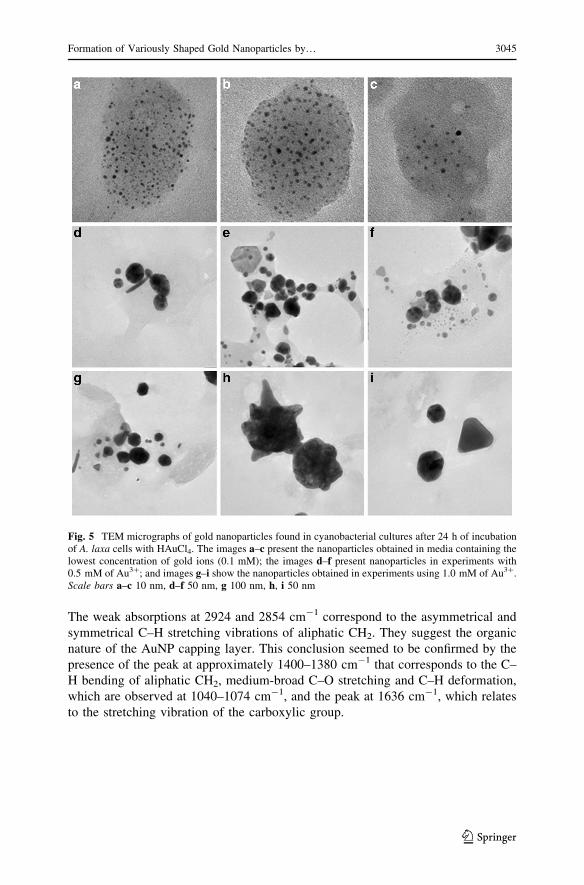
Morphology of AuNPs by Transmission Electron Microscopy (TEM)
The result obtained from the TEM analysis proved the presence of gold
nanoparticles of variable morphology, which were produced during 24 h of
incubation of A. laxa with hydrogen tetrachloroaurate. The morphology of these
Fig. 2 Biosynthesis of gold nanoparticles by A. laxa. The colour of the media containing 0.1, 0.5 and1 mM gold ions as the result of AuNP production. The picture in a presents the cultures with AuNPsobtained after 24 h of incubation, and b presents the cultures on the 14th day. The conversion of gold ionswas obtained in all the cases
Fig. 3 UV–vis spectra of media recorded after 24 h (a) and on the 14th day (b) of the incubation of A.laxa with gold ions. The spectra show the presence of AuNPs in the media after a short time and theirdisappearance after the longer time of incubation. The latter was caused by the co-aggregation ofnanoparticles within the cyanobacterial biomass
Formation of Variously Shaped Gold Nanoparticles by… 3043
123
results is strongly dependent on the starting concentration of gold ions in media.
Appropriate colouring of their solutions also indicates their formation. The medium
characterized by blue colours (initial concentration of metal ions of 0.1 mM)
contained small and spherical gold nanoparticles approximately 3–5 nm in diameter
(Fig. 5a–c). The morphology of the nanoparticles formed at the two higher
concentrations, 0.5 and 1.0 mM (brown–violet), was more diverse. Generally, NPs
appearing at 0.5 mM (intense purple colour) were spherical (Fig. 5d–f), but
nevertheless other shapes were also present, e.g., triangular (Fig. 5e, f), hexagonal
(Fig. 5e) and irregular. The sizes of these nanoparticles mostly ranged from 0 to
30 nm, however the larger NPs with sizes from 30 to 100 nm were present. At the
highest concentration of gold salt (1.0 mM), the solution reached a brown-purple
colour, and the presence of triangular (Fig. 5g, i), hexagonal (Fig. 5g, i) and
irregular (Fig. 5h) forms of nanoparticles, most of them ranging from 20 to 50 nm
and more than 100 nm in size, were recorded. Because of the various shape of
nanoparticles obtain in two higher concentrations of gold ions in the given size
range only the longest dimension was included. Additionally, the presence of single
nanoparticles approximately 300 nm in size was noticed in this medium.
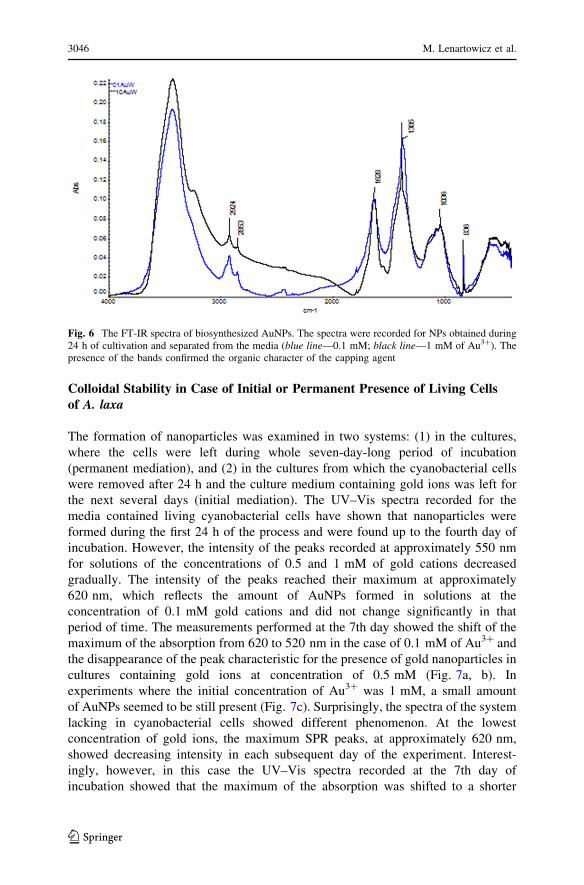
FT-IR Studies
FT-IR measurements were carried out in order to identify the capping agents
responsible for the stability of the biogenic nanoparticles. The spectra of AuNPs
obtained after 24 h of cultivation for the two tested concentrations (0.1 and 1 mM of
Au3?) show a complex pattern of bands from 3450 to 830 cm-1 (Fig. 6). The peak
at approximately 3400–3448 cm-1 was assigned to the O–H stretching frequency.
Fig. 4 XRD patterns of biosynthesized AuNPs using A. laxa cells
3044 M. Lenartowicz et al.
123
The weak absorptions at 2924 and 2854 cm-1 correspond to the asymmetrical and
symmetrical C–H stretching vibrations of aliphatic CH2. They suggest the organic
nature of the AuNP capping layer. This conclusion seemed to be confirmed by the
presence of the peak at approximately 1400–1380 cm-1 that corresponds to the C–
H bending of aliphatic CH2, medium-broad C–O stretching and C–H deformation,
which are observed at 1040–1074 cm-1, and the peak at 1636 cm-1, which relates
to the stretching vibration of the carboxylic group.
Fig. 5 TEM micrographs of gold nanoparticles found in cyanobacterial cultures after 24 h of incubationof A. laxa cells with HAuCl4. The images a–c present the nanoparticles obtained in media containing thelowest concentration of gold ions (0.1 mM); the images d–f present nanoparticles in experiments with0.5 mM of Au3?; and images g–i show the nanoparticles obtained in experiments using 1.0 mM of Au3?.Scale bars a–c 10 nm, d–f 50 nm, g 100 nm, h, i 50 nm
Formation of Variously Shaped Gold Nanoparticles by… 3045
123
Colloidal Stability in Case of Initial or Permanent Presence of Living Cellsof A. laxa
The formation of nanoparticles was examined in two systems: (1) in the cultures,
where the cells were left during whole seven-day-long period of incubation
(permanent mediation), and (2) in the cultures from which the cyanobacterial cells
were removed after 24 h and the culture medium containing gold ions was left for
the next several days (initial mediation). The UV–Vis spectra recorded for the
media contained living cyanobacterial cells have shown that nanoparticles were
formed during the first 24 h of the process and were found up to the fourth day of
incubation. However, the intensity of the peaks recorded at approximately 550 nm
for solutions of the concentrations of 0.5 and 1 mM of gold cations decreased
gradually. The intensity of the peaks reached their maximum at approximately
620 nm, which reflects the amount of AuNPs formed in solutions at the
concentration of 0.1 mM gold cations and did not change significantly in that
period of time. The measurements performed at the 7th day showed the shift of the
maximum of the absorption from 620 to 520 nm in the case of 0.1 mM of Au3? and
the disappearance of the peak characteristic for the presence of gold nanoparticles in
cultures containing gold ions at concentration of 0.5 mM (Fig. 7a, b). In
experiments where the initial concentration of Au3? was 1 mM, a small amount
of AuNPs seemed to be still present (Fig. 7c). Surprisingly, the spectra of the system
lacking in cyanobacterial cells showed different phenomenon. At the lowest
concentration of gold ions, the maximum SPR peaks, at approximately 620 nm,
showed decreasing intensity in each subsequent day of the experiment. Interest-
ingly, however, in this case the UV–Vis spectra recorded at the 7th day of
incubation showed that the maximum of the absorption was shifted to a shorter
Fig. 6 The FT-IR spectra of biosynthesized AuNPs. The spectra were recorded for NPs obtained during24 h of cultivation and separated from the media (blue line—0.1 mM; black line—1 mM of Au3?). Thepresence of the bands confirmed the organic character of the capping agent
3046 M. Lenartowicz et al.
123
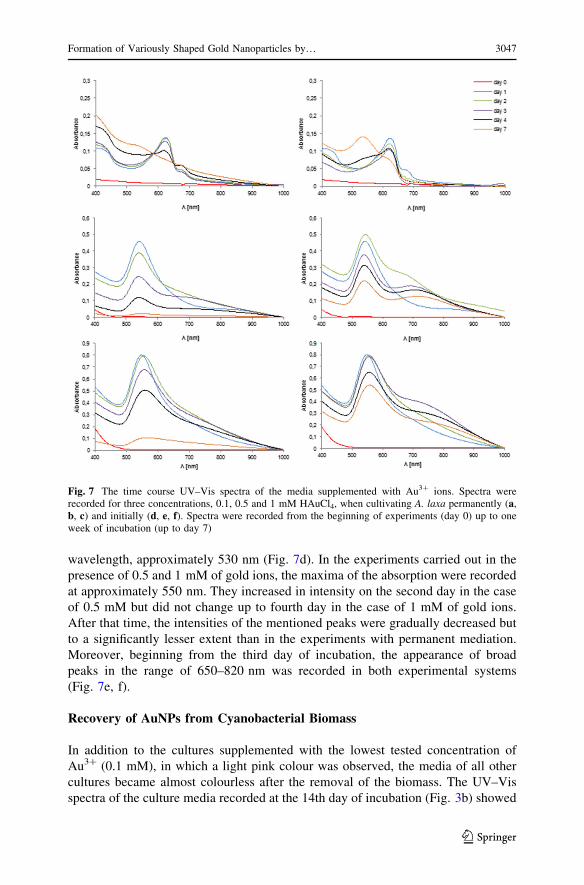
wavelength, approximately 530 nm (Fig. 7d). In the experiments carried out in the
presence of 0.5 and 1 mM of gold ions, the maxima of the absorption were recorded
at approximately 550 nm. They increased in intensity on the second day in the case
of 0.5 mM but did not change up to fourth day in the case of 1 mM of gold ions.
After that time, the intensities of the mentioned peaks were gradually decreased but
to a significantly lesser extent than in the experiments with permanent mediation.
Moreover, beginning from the third day of incubation, the appearance of broad
peaks in the range of 650–820 nm was recorded in both experimental systems
(Fig. 7e, f).
Recovery of AuNPs from Cyanobacterial Biomass
In addition to the cultures supplemented with the lowest tested concentration of
Au3? (0.1 mM), in which a light pink colour was observed, the media of all other
cultures became almost colourless after the removal of the biomass. The UV–Vis
spectra of the culture media recorded at the 14th day of incubation (Fig. 3b) showed
Fig. 7 The time course UV–Vis spectra of the media supplemented with Au3? ions. Spectra wererecorded for three concentrations, 0.1, 0.5 and 1 mM HAuCl4, when cultivating A. laxa permanently (a,b, c) and initially (d, e, f). Spectra were recorded from the beginning of experiments (day 0) up to oneweek of incubation (up to day 7)
Formation of Variously Shaped Gold Nanoparticles by… 3047
123
that only in the media containing 0.1 mM of gold ions were the AuNPs present at a
measurable level. These results suggest that the AuNPs that formed in cultures
containing higher concentrations of gold ions lost their colloidal stability. The
question of the fate of the gold nanoparticles which were undoubtedly also formed
in the cultures containing gold ions at concentrations of 0.5 and 1 mM at the
beginning of the incubation were answered when the cyanobacterial cells were
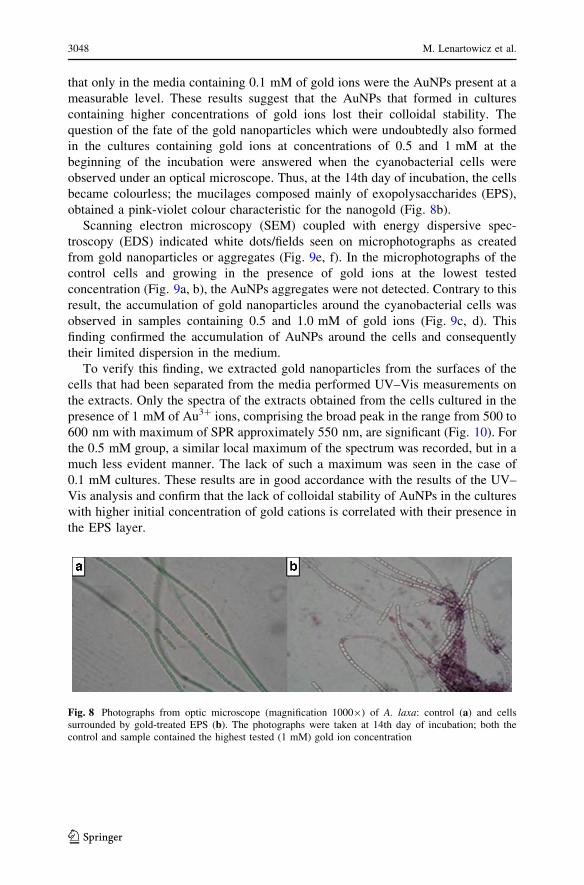
observed under an optical microscope. Thus, at the 14th day of incubation, the cells
became colourless; the mucilages composed mainly of exopolysaccharides (EPS),
obtained a pink-violet colour characteristic for the nanogold (Fig. 8b).
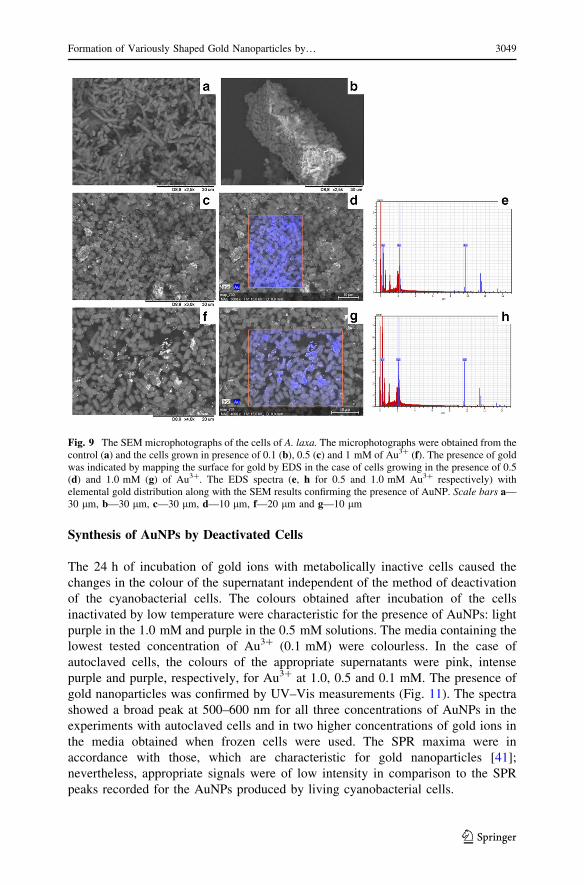
Scanning electron microscopy (SEM) coupled with energy dispersive spec-
troscopy (EDS) indicated white dots/fields seen on microphotographs as created
from gold nanoparticles or aggregates (Fig. 9e, f). In the microphotographs of the
control cells and growing in the presence of gold ions at the lowest tested
concentration (Fig. 9a, b), the AuNPs aggregates were not detected. Contrary to this
result, the accumulation of gold nanoparticles around the cyanobacterial cells was
observed in samples containing 0.5 and 1.0 mM of gold ions (Fig. 9c, d). This
finding confirmed the accumulation of AuNPs around the cells and consequently
their limited dispersion in the medium.
To verify this finding, we extracted gold nanoparticles from the surfaces of the
cells that had been separated from the media performed UV–Vis measurements on
the extracts. Only the spectra of the extracts obtained from the cells cultured in the
presence of 1 mM of Au3? ions, comprising the broad peak in the range from 500 to
600 nm with maximum of SPR approximately 550 nm, are significant (Fig. 10). For
the 0.5 mM group, a similar local maximum of the spectrum was recorded, but in a
much less evident manner. The lack of such a maximum was seen in the case of
0.1 mM cultures. These results are in good accordance with the results of the UV–
Vis analysis and confirm that the lack of colloidal stability of AuNPs in the cultures
with higher initial concentration of gold cations is correlated with their presence in
the EPS layer.
Fig. 8 Photographs from optic microscope (magnification 10009) of A. laxa: control (a) and cellssurrounded by gold-treated EPS (b). The photographs were taken at 14th day of incubation; both thecontrol and sample contained the highest tested (1 mM) gold ion concentration
3048 M. Lenartowicz et al.
123
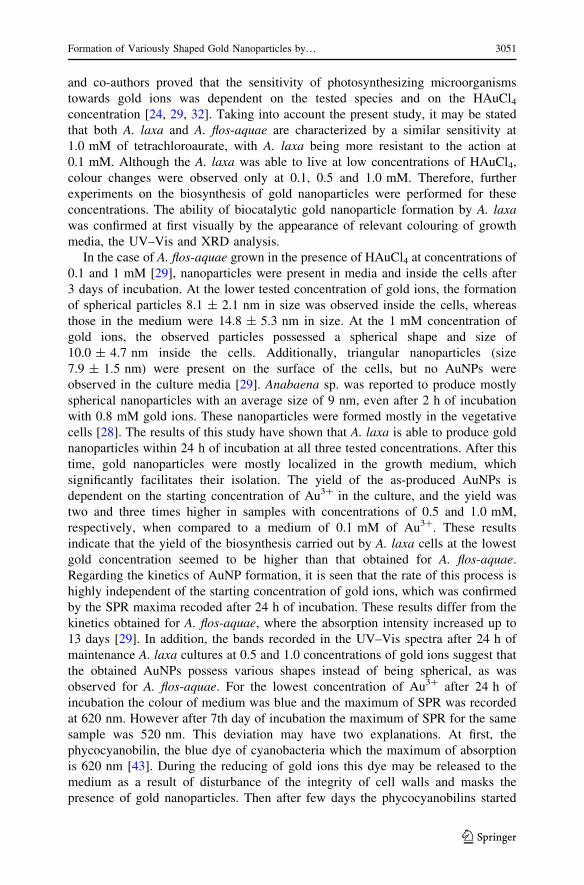
Synthesis of AuNPs by Deactivated Cells
The 24 h of incubation of gold ions with metabolically inactive cells caused the
changes in the colour of the supernatant independent of the method of deactivation
of the cyanobacterial cells. The colours obtained after incubation of the cells
inactivated by low temperature were characteristic for the presence of AuNPs: light
purple in the 1.0 mM and purple in the 0.5 mM solutions. The media containing the
lowest tested concentration of Au3? (0.1 mM) were colourless. In the case of
autoclaved cells, the colours of the appropriate supernatants were pink, intense
purple and purple, respectively, for Au3? at 1.0, 0.5 and 0.1 mM. The presence of
gold nanoparticles was confirmed by UV–Vis measurements (Fig. 11). The spectra
showed a broad peak at 500–600 nm for all three concentrations of AuNPs in the
experiments with autoclaved cells and in two higher concentrations of gold ions in
the media obtained when frozen cells were used. The SPR maxima were in
accordance with those, which are characteristic for gold nanoparticles [41];
nevertheless, appropriate signals were of low intensity in comparison to the SPR
peaks recorded for the AuNPs produced by living cyanobacterial cells.
Fig. 9 The SEM microphotographs of the cells of A. laxa. The microphotographs were obtained from thecontrol (a) and the cells grown in presence of 0.1 (b), 0.5 (c) and 1 mM of Au3? (f). The presence of goldwas indicated by mapping the surface for gold by EDS in the case of cells growing in the presence of 0.5(d) and 1.0 mM (g) of Au3?. The EDS spectra (e, h for 0.5 and 1.0 mM Au3? respectively) withelemental gold distribution along with the SEM results confirming the presence of AuNP. Scale bars a—30 lm, b—30 lm, c—30 lm, d—10 lm, f—20 lm and g—10 lm
Formation of Variously Shaped Gold Nanoparticles by… 3049
123
Discussion
The phenomenon of the formation of AuNPs by cyanobacteria that belong to the
Anabaena genus was described only three time to date: by Dahoumane and co-
authors in 2012 [29] regarding A. flos-aquae and by Rosken and co-authors in 2014
[28] and in 2016 [42] regarding Anabaena sp. and A. cylindrica respectively.
The viability of cyanobacterial cells in media containing HAuCl4 has shown that
A. laxa is very sensitive towards gold ions. The culture can grow in its presence only
at low concentrations ranging from 0.01 to 0.1 mM, whereas their higher
concentrations are lethal. The results of experiments carried out by Dahoumane
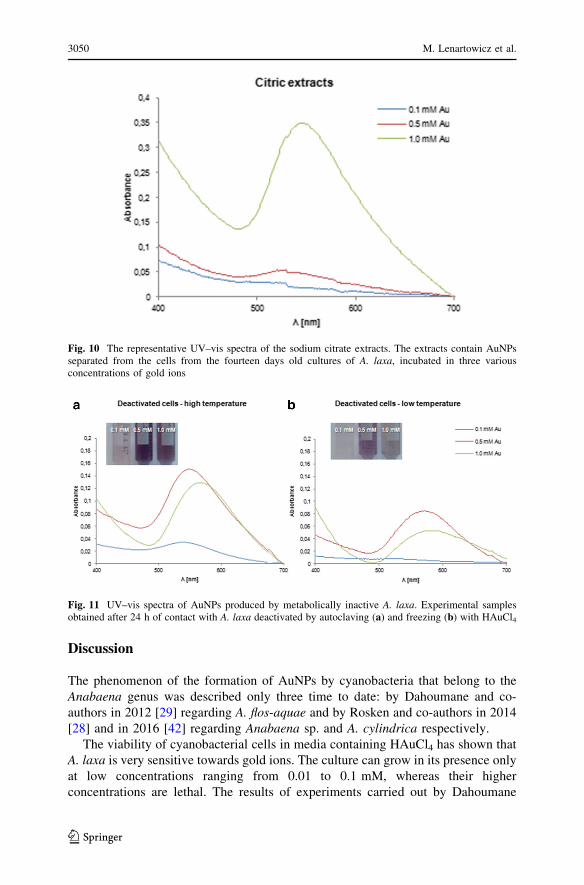
Fig. 10 The representative UV–vis spectra of the sodium citrate extracts. The extracts contain AuNPsseparated from the cells from the fourteen days old cultures of A. laxa, incubated in three variousconcentrations of gold ions
Fig. 11 UV–vis spectra of AuNPs produced by metabolically inactive A. laxa. Experimental samplesobtained after 24 h of contact with A. laxa deactivated by autoclaving (a) and freezing (b) with HAuCl4
3050 M. Lenartowicz et al.
123
and co-authors proved that the sensitivity of photosynthesizing microorganisms
towards gold ions was dependent on the tested species and on the HAuCl4concentration [24, 29, 32]. Taking into account the present study, it may be stated
that both A. laxa and A. flos-aquae are characterized by a similar sensitivity at
1.0 mM of tetrachloroaurate, with A. laxa being more resistant to the action at
0.1 mM. Although the A. laxa was able to live at low concentrations of HAuCl4,
colour changes were observed only at 0.1, 0.5 and 1.0 mM. Therefore, further
experiments on the biosynthesis of gold nanoparticles were performed for these
concentrations. The ability of biocatalytic gold nanoparticle formation by A. laxa
was confirmed at first visually by the appearance of relevant colouring of growth
media, the UV–Vis and XRD analysis.
In the case of A. flos-aquae grown in the presence of HAuCl4 at concentrations of
0.1 and 1 mM [29], nanoparticles were present in media and inside the cells after
3 days of incubation. At the lower tested concentration of gold ions, the formation
of spherical particles 8.1 ± 2.1 nm in size was observed inside the cells, whereas
those in the medium were 14.8 ± 5.3 nm in size. At the 1 mM concentration of
gold ions, the observed particles possessed a spherical shape and size of
10.0 ± 4.7 nm inside the cells. Additionally, triangular nanoparticles (size
7.9 ± 1.5 nm) were present on the surface of the cells, but no AuNPs were
observed in the culture media [29]. Anabaena sp. was reported to produce mostly
spherical nanoparticles with an average size of 9 nm, even after 2 h of incubation
with 0.8 mM gold ions. These nanoparticles were formed mostly in the vegetative
cells [28]. The results of this study have shown that A. laxa is able to produce gold
nanoparticles within 24 h of incubation at all three tested concentrations. After this
time, gold nanoparticles were mostly localized in the growth medium, which
significantly facilitates their isolation. The yield of the as-produced AuNPs is
dependent on the starting concentration of Au3? in the culture, and the yield was
two and three times higher in samples with concentrations of 0.5 and 1.0 mM,
respectively, when compared to a medium of 0.1 mM of Au3?. These results
indicate that the yield of the biosynthesis carried out by A. laxa cells at the lowest
gold concentration seemed to be higher than that obtained for A. flos-aquae.
Regarding the kinetics of AuNP formation, it is seen that the rate of this process is
highly independent of the starting concentration of gold ions, which was confirmed
by the SPR maxima recoded after 24 h of incubation. These results differ from the
kinetics obtained for A. flos-aquae, where the absorption intensity increased up to
13 days [29]. In addition, the bands recorded in the UV–Vis spectra after 24 h of
maintenance A. laxa cultures at 0.5 and 1.0 concentrations of gold ions suggest that
the obtained AuNPs possess various shapes instead of being spherical, as was
observed for A. flos-aquae. For the lowest concentration of Au3? after 24 h of
incubation the colour of medium was blue and the maximum of SPR was recorded
at 620 nm. However after 7th day of incubation the maximum of SPR for the same
sample was 520 nm. This deviation may have two explanations. At first, the
phycocyanobilin, the blue dye of cyanobacteria which the maximum of absorption
is 620 nm [43]. During the reducing of gold ions this dye may be released to the
medium as a result of disturbance of the integrity of cell walls and masks the
presence of gold nanoparticles. Then after few days the phycocyanobilins started
Formation of Variously Shaped Gold Nanoparticles by… 3051
123
gradually decaying and the SPR at 520 nm was recorded. The second, the Suganya
and co-authors indicate that excitation maximum at 620 nm may be due to HOMO–
LUMO intraband transitions of the nanoparticles [44]. At next days the size of
nanoparticles probably was changed (they grew up) what caused the shift of SPF
from 620 nm to 520 nm.
The TEM analysis confirmed the formation of NPs of irregular shapes, which is
the second major advantage of our study. Currently, the non-typical (non-spherical)
shaped nanoparticles have attracted interest because their structural, optical,
electronic, magnetic, and catalytic properties are different from spherical particles
and allow wider applications [14]. Additionally, the smallest particles (size
approximately 5 nm), which were obtained in the cultures of A. laxa supplemented
with the lowest tested concentration of gold ions (0.1 mM), seemed to be a
stable form of seed particles up to the fourth day after the reduction. These types of
NPs are used in seed-growing synthesis [45, 46]. Based on TEM and XRD analysis
the size of the particles increases with the increased concentration of gold ions in the
initial solutions.
An interesting property of NPs biosynthesized by cyanobacteria is the organic
capping that improves the stability of the obtained nanostructures. The TEM
experiments, as well as FT-IR analysis, proved the existence of an organic layer that
envelops the formed gold nanoparticles. Moreover, the FT-IR spectra of these
nanoparticles are in good accordance with the spectra obtained by Parikh and
Madamwar [47] for cyanobacterial exopolysaccharides (EPS). The high compat-
ibility between the literature and our results strongly suggests the presence of
cyanobacterial EPS as a cover of the surface of AuNPs. Therefore, the EPS can be
considered capping agents, which supports the process of AuNPs biosynthesis and
prevents them from aggregating. In addition, most EPS are water-soluble polymers
[48], so their presence at the NP surface improves the stability of colloidal gold in
aqueous solutions. Similar findings had been published by Dahoumane and co-
authors, who indicated the important role of EPS produced by photosynthetic
organisms in the stabilization of AuNPs [24, 29, 31]. Moreover, his recently
published results show that besides EPS, the presence of lactate molecules in the
medium may improve the stability of the as-produced AuNPs by algae [32].
The stabilities of the obtained forms of nanoparticles and the termination of the
process of their formation were also studied. Therefore, the role of the removal of
the biocatalyst from the medium was studied in the context of the stability of the
obtained NPs in the presence or absence of cyanobacterial cells. As a result, we
observed that the removal of A. laxa cells from media after 24 h of incubation did
not stop the growth and development of the nanoparticles in the following days of
the experiment. The appearance of additional bands between 700–800 nm (Fig. 7e,
f) in the UV–Vis spectra related to growth or aggregation of the AuNPs confirmed
such a change. This phenomenon was observed independently of the gold
concentration, but the most significant modification was noticed at 0.1 mM of
Au3?. However, nanoparticles formed in media from which cyanobacterial cells
were not removed did not grow in the case of the two higher concentrations. Over
time, these nanostructures exhibited the tendency to accumulate in the proximity of
the cell walls, mainly in the EPS layer. This phenomenon resulted in the lack of NP
3052 M. Lenartowicz et al.
123
colloidal stability in the cultures containing 0.5 or 1.0 mM and was the reason for
the slow disappearance of the characteristic UV–Vis bands recorded for the culture
media (Fig. 7a, b, c). Consequently, the trapping of NPs in the EPS layer caused the
need for their recovery from the biomass. However, according to our results, the
extraction of nanoparticles using the solution with sodium citrate (the standard
method) was efficient only for the highest tested concentration (1.0 mM) of gold
ions.
The results of our experiments have shown that the modification of cyanobac-
terial media with three different concentrations of gold ions led to obtaining gold
nanoparticles of diverse morphology and size. A similar effect was observed for A.
flos-aquae, where two concentrations also resulted in distinct morphologies of
AuNPs. Although both species, A. laxa and A. flos-aquae, belong to the same genus,
to date there is no clear evidence if the species of cyanobacteria used as biocatalysts
play an important role with respect to the shape of the formed NPs. Our results
indicate that the conditions of the biosynthesis were a more significant factor
influencing the final morphology and size of the obtained AuNPs. Similar
conclusions were derived concerning A. flos-aquae [29] and Euglena gracilis [32].
In the case of A. flos-aquae, the authors provided the information that gold
colloids formed even when the cells were damaged. They assumed that nanopar-
ticles could be formed faster and easier due to loss of membrane integrity by the
cells [29]. Thus, the deactivated cells should be deprived of the ability to form gold
nanoparticles. The results of the experiment with deactivated cells showed the
changes in the colours of the culture media in both systems, living and dead
cyanobacterial cells, which confirmed the formation of the AuNPs independent of
the cell status. However, the comparison of the intensities of the maxima of SPR
bands in these two cases confirmed that the use of dead cells caused a significant
decrease in the yield of AuNP formation.
Conclusions
The cyanobacterium A. laxa incubated with hydrogen tetrachloroaurate for 24 h is a
good biocatalyst for the formation of gold nanoparticles of variable size and shape.
The kinetics of this process is fast, and the AuNPs are formed with satisfactory
yield. The increase in initial concentration of gold ions raises the efficiency of this
process. The size and morphology of the nanostructures formed by A. laxa depend
on the initial concentration of gold ions, which creates the opportunity to control
this process. After 24 h of cultivation, nanostructures are localized mostly outside
the cells, which is an advantage considering the subsequent separation of AuNPs
from the biomass. The elongation of cultivation is accompanied with a decrease in
the colloidal stability of the nanoparticles and their further trapping in the
exopolysaccharide layer of the cyanobacterial cells. Bearing in mind all relevant
results, we conclude that cyanobacteria play an important role in biocatalytic
systems for the formation of variously shaped gold nanoparticles.
Formation of Variously Shaped Gold Nanoparticles by… 3053
123
Acknowledgements The authors acknowledge Prof. Paweł Kafarski for his inspiring mentoring and
continuous willingness to help and discuss all doubtful issues. Presented research were partially supported
in the frame of the Project PBS3/B8/25/2015, Granted by The National Centre for Research and
Development in Poland.
Compliance with Ethical Standards
Conflict of interest The authors declare that they have no conflict of interest.
Open Access This article is distributed under the terms of the Creative Commons Attribution 4.0
International License (http://creativecommons.org/licenses/by/4.0/), which permits unrestricted use, dis-
tribution, and reproduction in any medium, provided you give appropriate credit to the original author(s)
and the source, provide a link to the Creative Commons license, and indicate if changes were made.
References
1. M. C. Daniel and D. Astruc (2004). Chem. Rev. 104, 293–346.
2. A. Olenin and G. V. Lisichkin (2011). Russ. Chem. Rev. 80, 605–630.
3. C. J. Murphy, A. M. Gole, S. E. Hunyadi, and C. J. Orendorff (2006). Inorg. Chem. 45, 7544–7554.
4. Y. Sun and Y. Xia (2002). Science 298, 2176–2179.
5. S. Shankar, S. Bhargava, and M. Sastry (2005). J. Nanosci. Nanotech. 5, 1721–1727.
6. E. Hao, R. C. Bailey, G. C. Schatz, J. T. Hupp, and S. Li (2004). Nano Lett. 4, 327–330.
7. M. Treguer-Delapierre, J. Majimel, S. Mornet, E. Duguet, and S. Ravaine (2008). Gold Bull. 41,
195–207.
8. C. J. Murphy, A. M. Gole, S. E. Hunyadi, J. W. Stone, P. N. Sisco, A. Alkilany, B. E. Kinard, and P.
Hankins (2008). Chem. Commun. 7, 544–557.
9. R. Narayanan and M. A. El-Sayed (2005). J. Phys. Chem. B. 109, 12663–12676.
10. N. Bi, Y. Chen, H. Qi, X. Zheng, and Y. Chen (2012). Sens. Actuators B. 166–167, 766–771.
11. M. J. Kwon, J. Lee, A. W. Wark, and H. J. Lee (2012). Anal. Chem. 84, 1702–1707.
12. Y. Zhang, G. Chang, S. Liu, W. Lu, and X. Sun (2011). Biosens. Bioelectron. 28, 344–348.
13. Y. B. Mollamahalle, M. Ghorbani, and A. Dolati (2012). Electrochim. Acta. 75, 157–163.
14. N. Li, P. Zhao, and D. Astruc (2014). Angew. Chem. Int. Ed. 53, 1756–1789.
15. M. F. Lengke, C. Sanpawanitchakit, and G. Southam in M. Rai and N. Duran (eds.), Metal
nanoparticles in microbiology (Springer, New York, 2011), p. 37.
16. X. Li, H. Xu, Z. S. Chen, and G. Chen (2011). J. Nanomater. 2011, 1–16.
17. E. C. Dreaden, A. M. Alkilany, X. Huang, C. J. Murphy, and M. A. El-Sayed (2012). Chem. Soc. Rev.
41, 2740–2779.
18. J. You, R. Zhang, G. Zhang, M. Zhong, Y. Liu, C. S. Van Pelt, D. Liang, W. Wei, A. K. Sood, and C.
Li (2012). J. Control Release. 158, 319–328.
19. R. Bardhan, W. Chen, C. Perez-Torres, M. Bartels, R. M. Huschka, L. L. Zhao, E. Morosan, R.
G. Pautler, A. Joshi, and N. J. Halas (2009). Adv. Funct. Mater. 19, 3901–3909.
20. L. Dykman and N. Khlebtsov (2012). Chem. Soc. Rev. 41, 2256–2282.
21. B. K. Salunke, S. S. Sawant, S. Lee, and B. S. Kim (2016). World J. Microbiol. Biotechnol. 32, 1–16.
22. S. A. Dahoumane, E. K. Wujcik, and C. Jeffryes (2016). Enz. Microb. Tech. 95, 13–27.
23. A. Sharma, S. Sharma, K. Sharma, S. P. K. Chetri, A. Vashishtha, P. Singh, R. Kumar, B. Rathi, and
V. Agrawal (2016). J. App. Phycol. 28, 1759–1774.
24. S. A. Dahoumane, C. Yepremian, C. Djediat, A. Coute, F. Fievet, T. Coradin, and R. Brayner (2014).
J. Nanop. Res. 16, 1–12.
25. P. Kuppusamy, M. M. Yusoff, G. P. Maniam, and N. Govindan (2016). Saudi Pharm. J. 24, 473–484.
26. P. Mohanpuria, N. K. Rana, and S. K. Yadav (2008). J. Nanopart. Res. 10, 507–517.
27. K. B. Narayanan and N. Sakthivel (2010). Adv. Colloid Interface Sci. 156, 1–13.
28. L. M. Rosken, S. Korsten, C. B. Fischer, A. Schonleber, S. Smaalen, S. Geimer, C. Beresko, G.
Ankerhold, and S. Wehner (2014). J. Nanopart. Res. 16, 1–14.
29. S. A. Dahoumane, C. Djediat, C. Yepremian, A. Coute, F. Fievet, T. Coradin, and R. Brayner (2012).
J. Nanopart. Res. 14, 1–17.
3054 M. Lenartowicz et al.
123
30. R. Brayner, H. Barberousse, M. Hernadi, C. Djedjat, C. Yepremian, T. Coradin, J. Livage, F. Fievet,
and A. Coute (2007). J. Nanosci. Nanotechnol. 7, 2696–2708.
31. S. A. Dahoumane, K. Wijesekera, C. D. M. Filipe, and J. D. Brennan (2014). J. Colloid Interface Sci.
414, 67–72.
32. S. A. Dahoumane, C. Yepremian, C. Djediat, A. Coute, and F. Fievet (2016). J. Nanop. Res. 18, 1–12.
33. T. Kalabegishvili, I. Murusidze, E. Kirkesali, A. Rcheulishvili, E. Ginturi, N. Kuchava, N. Bag-
davadze, E. Gelagutashvili, M. V. Frontasyeva, I. Zinicovscaia, S. S. Pavlov, and A. Y. Dmitriev
(2013). Ecol. Chem. Eng. S. 20, 621–631.
34. U. K. S. Suganya, K. Govindaraju, V. Ganesh Kumar, T. Stalin Dhas, V. Karthick, G. Singaravelu,
and E. Manickan (2015). Mater. Sci. Eng. C 47, 351–356.
35. D. Parial, H. K. Patra, P. Roychoudhury, A. K. Dasgupta, and R. Pal (2012). J. Appl. Phycol. 24,
55–60.
36. D. Parial, H. K. Patra, A. K. Dasgupta, and R. Pal (2012). Eur. J. Phycol. 47, 22–29.
37. G. Forlani, V. Prearo, D. Wieczorek, P. Kafarski, and J. Lipok (2011). Enz. Microb. Tech. 48,
299–305.
38. H. K. Lichtenthaler (1987). Methods Enzymol. 148, 350–382.
39. D. Parial and R. Pal (2014). Indian J. Appl. Res. 4, 69–72.
40. J. I. Langford and A. J. C. Wilson (1978). J. Appl. Cryst. 11, 102–113.
41. P. Strobbia, E. Languirand, and B. M. Cullum (2015). Opt. Eng. 54, 1–22.
42. L. M. Rosken, F. Cappel, S. Korsten, C. B. Fischer, A. Schonleber, S. van Smaalen, S. Geimer, C.
Beresko, G. Ankerhold, and S. Wehner (2016). Beilstein J. Nanotechnol. 7, 312–327.
43. M. Sobiechowska-Sasin, J. Ston-Egiert, and A. Kosakowska (2014). J. Appl. Phycol. 26, 2065–2074.
44. U. K. S. Suganya, K. Govindaraju, V. Ganesh Kumar, T. Stalin Dhas, V. Karthick, G. Singaravelu,
and M. Elanchezhiyan (2015). Mater. Sci. Eng. C. 47, 351–356.
45. C. Ziegler and A. Eychmuller (2011). J. Phys. Chem. C 115, 4502–4506.
46. A. Henkel, O. Schubert, A. Plech, and C. Sonnichsen (2009). J. Phys. Chem. C 113, 10390–10394.
47. A. Parikh and D. Madamwar (2006). Bioresource Technol. 97, 1822–1827.
48. R. De Philippis, C. Sili, R. Paperi, and M. Vincenzini (2001). J. Appl. Phycol. 13, 293–299.
Formation of Variously Shaped Gold Nanoparticles by… 3055
123
![Flower-shaped gold nanoparticles synthesized using ... · nanoparticles like gold, silver, zinc, platinum [2–5], etc., due to its unique properties, which opens a new venue for](https://img.pdfslide.us/doc/110x75/5ee13256ad6a402d666c296d/flower-shaped-gold-nanoparticles-synthesized-using-nanoparticles-like-gold.jpg)