Embed Size (px)
Citation preview
Formation of Intermetallic Phases in Al-10Si-0.3Fe
based Alloys
vorgelegt von
Master of Engineering
Jiamin Yu
von der Fakultät III - Prozesswissenschaften
der Technischen Universität Berlin
zur Erlangung des akademischen Grades
Doktor der Ingenieurwissenschaften
-Dr.-Ing.-
genehmigte Dissertation
angefertigt am Helmholtz-Zentrum Berlin für Materialien und Energie
Institut für Angewandte Materialforschung
Promotionsausschuss:
Vorsitzender: Prof. Dr. -Ing. Walter Reimers
Berichter: Prof. Dr. rer. nat. John Banhart
Berichter: Prof. Dr. rer. nat. Dieter Herlach
Tag der wissenschaftlichen Aussprache: 16 December 2016
Berlin 2016


献给我最挚爱的父亲母亲
To my beloved parents

Abstract
I
Abstract
The emphasis of the work lies on finding out how impurities and the addition of Sr influence
the formation of Fe-rich intermetallic phases and the formation of the eutectic Si phase in
Al-Si casting alloys. A further objective of this study was the understanding of the influence
of the cooling rate on the formation of intermetallic phases. For this purpose, four Al-10Si-
0.3Fe-based casting alloys (high-purity alloy with and without addition of 200 ppm Sr and
corresponding commercial alloys) have been chosen for this study. The experimental work
was focused on the three-dimensional analysis of Fe-rich intermetallic phases using
tomographic methods on the micrometer scale such as serial slicing with a Focused Ion
Beam and Scanning Electron Microscopy imaging as well as synchrotron X-ray tomography.
The three-dimensional analyses were supported by two-dimensional studies using a
combination of optical microscopy, scanning electron microscopy and transmission electron
microscopy.
Besides the well-known phases, i.e. the α intermetallic phase, the tetragonal δ phase and the
β phase, a new γ phase was found. The composition of the γ phase is Al4.35FeSi, which is
close to that of the β phase (Al4.5FeSi), but the morphology of the γ phase looks like the one
of the α intermetallic phase. It features a trigonal R-centered crystal structure with hexagonal
lattice parameters a = 1.034(5) nm, c= 1.983(8) nm and V= 1.836(25) nm3.
The α intermetallic phase is dominant in the high-purity alloy, while in the modified alloy Sr
promotes the formation of the δ phase. Additionally, Sr was found to suppress the formation
of the β phase in the commercial alloy.
Impurities play an effective role in the nucleation of the eutectic grains, which lead to an
advantage for the formation of the coarse β phase.
Cooling conditions influence the formation of intermetallics. Their formation is suppressed
and refined during fast solidification. In contrast, a slow cooling rate promotes the formation
of the coarse β phase.
Focused Ion Beam tomography and synchrotron X-ray tomography have been used to
characterize the three-dimensional morphologies, the locations and the volume fractions of
the intermetallic phases formed in each investigated alloy.
In-situ synchrotron X-ray tomography allowed for the observation of phase separation from
the melt during solidification in real time. The nucleation of β and δ phases was observed

Abstract
II
and the phase solidification sequence has been clarified. β plates nucleate on or near the
dendrite whereas the δ phase was observed to nucleate on the eutectic Si.
Contents
III
Contents
Abstract.................................................................................................................................... I
Contents ................................................................................................................................. III
1 Introduction ......................................................................................................................... 1
2 Background ......................................................................................................................... 5
2.1 Binary Al-Si alloy system .............................................................................................. 5
2.2 Ternary Al-Si-Fe alloy system ....................................................................................... 6
2.3 Formation of eutectic microstructure and intermetallic phases ..................................... 8
2.3.1 α intermetallic phase .......................................................................................... 12
2.3.2 β intermetallic phase .......................................................................................... 14
2.3.3 δ intermetallic phase .......................................................................................... 16
2.4 Effect of Sr on the eutectic microstructure and the intermetallic phases ..................... 17
3 Materials ............................................................................................................................ 21
4 Experimental methods ...................................................................................................... 23
4.1 Optical Microscopy...................................................................................................... 23
4.2 Scanning Electron Microscopy .................................................................................... 24
4.3 Transmission Electron Microscopy ............................................................................. 25
4.3.1 TEM system ....................................................................................................... 26
4.3.2 Sample preparation ............................................................................................ 27
4.4 Focused Ion Beam ....................................................................................................... 27
4.4.1 FIB system ......................................................................................................... 27
4.4.2 Data processing .................................................................................................. 29
4.5 Synchrotron X-ray Tomography .................................................................................. 31
4.5.1 Synchrotron system............................................................................................ 32
4.5.2 Synchrotron X-ray tomography beamline ......................................................... 34
4.5.3 Sample measurement ......................................................................................... 35
Contents
IV
4.5.4 Data processing .................................................................................................. 37
5 Results ................................................................................................................................ 39
5.1 Microstructure characterization ................................................................................... 39
5.1.1 Optical microscopy ............................................................................................ 39
5.1.2 Scanning Electron Microscopy .......................................................................... 41
5.1.3 Transmission Electron Microscopy ................................................................... 44
5.2 Three-dimensional visualization of intermetallic phases (ex-situ tomography) .......... 56
5.2.1 Unmodified high-purity alloy (FIB tomography) .............................................. 56
5.2.2 Sr-modified high-purity alloy (FIB tomography) .............................................. 58
5.2.3 Sr-modified commercial alloy (FIB tomography) ............................................. 61
5.2.4 Summary (FIB tomography) .............................................................................. 64
5.2.5 Synchrotron tomography ................................................................................... 66
5.3 Three-dimensional visualization of intermetallic phases (in-situ tomography) .......... 69
5.3.1 Phase separation in the unmodified commercial alloy ...................................... 72
5.3.2 Evolution of β- and δ-intermetallics .................................................................. 75
6 Discussion........................................................................................................................... 85
6.1 In-situ synchrotron tomography / slow cooling ........................................................... 85
6.1.1 Effect of slow solidification on microstructure ................................................. 85
6.1.2 Nucleation and growth of the Fe-rich intermetallic β phase .............................. 88
6.1.3 Nucleation and growth of the Fe-rich intermetallic phase .............................. 93
6.2 Ex-situ observations of the microstructure in the as-cast alloys / fast cooling ............ 97
6.2.1 Effect of Sr on Al-10Si-0.3Fe-based alloy ........................................................ 97
6.2.2 Effect of impurities on Al-10Si-0.3Fe-based alloys .......................................... 99
6.2.3 Formation of α and γ intermetallics ................................................................. 100
6.2.4 Formation of δ intermetallics ........................................................................... 101
6.2.5 Formation of β intermetallics ........................................................................... 102
6.3 Effect of cooling rates on the formation of the intermetallic phases ......................... 102
7 Summary .......................................................................................................................... 105

Contents
V
References ............................................................................................................................ 111
Acknowledgements ............................................................................................................. 121
Declaration .......................................................................................................................... 123

1 Introduction
1
1. Introduction
Al-Si alloys are widely used for making automotive and aerospace components because of
their low weight and good mechanical and processing properties [1, 2]. Commercial Al-Si
alloys always contain some amounts of Fe as a natural impurity, which cannot be removed
from the primary aluminium metal in a cost efficient way. Iron tends to precipitate in
combination with other elements during solidification, forming complex intermetallic phases
of various types [3-5]. These intermetallic phases can markedly degrade the mechanical
properties and give rise to casting defects [3, 6]. More than twenty types of Fe-containing
intermetallic phases with different compositions and crystal structures, including at least
twelve types of stable ternary intermetallics, have been identified [7-9]. The most common
intermetallic Al-Si-Fe-phases are α, β and δ, which differ by their chemical composition and
their morphology. Their formation path also differs and depends on the amount of Fe, the
cooling rate during solidification, other impurities in the alloys and additions of further
transition elements. Transition elements are always present in the commercial Al-Si alloys
and are partly responsible for the observed diversity of intermetallics.
The most commonly occurring intermetallic phase is α-Al8Fe2Si. It has been identified as
either bcc [10, 11] or as a hexagonal structure [12, 13]. All of these α-phases are
characterized by the so-called “Chinese script” morphology in two dimensions (2D). In
addition, some researchers reported a phase α-Al15(Fe,Mn)3Si2, showing a compact blocky
shape and appearing as polyhedral crystals [14]. Many different compositions of α-phases in
the stable ternary and quaternary systems have been reported [15-18].
The second type of phase is the Fe-rich δ-phase. Depending on its orientation in the
transmission electron microscope (TEM) foil the Fe-rich δ-phase (Al4FeSi2), also termed
Al3FeSi2 [10, 19], exhibits a lath or an acicular shape in two dimensions. In three dimensions
(3D) the phases are plates or blades. It has been reported that the δ-phase has a tetragonal
PdGa5-type structure [19] or an orthorhombic structure with a pseudo-tetragonal cell [20].
The last common Fe-rich intermetallic phase is the β phase, which has often been designated
as Al4.5FeSi [21, 22] with needle-like or acicular morphology in two dimensions and inter-

1 Introduction
2
connected plates or blades in three dimensions. It has been found that this phase has a
monoclinic structure [21]. However, the β phase sometimes comes with a tetragonal [23], B-
centered orthorhombic [24], or A-centered orthorhombic [17] structure in multiphase
composites.
The β phase is the most studied phase. Many attempts have been made to prevent the
formation of the coarse brittle β phase or to neutralize the negative effect on casting porosity,
castability and mechanical properties. While the negative effects of the Fe-rich β-phase are
well known, its nucleation and growth is still under discussion. Many mechanisms have been
proposed for nucleation and sometimes there are contradictory results. Campbell et al. [25,
26] suggested that nucleation and growth of the Fe-rich β phase take place on the external
oxide films. Samuel et al. [27] found that P or AlP particles serve as nuclei of the β phase.
Lu and Dahle [28] investigated the interaction between transition elements like Mn, Cr, Be,
Ni, Mg, P and Fe and their influence on the nucleation of the Fe-rich intermetallic phases.
They found that neither the addition of P increases the number of the β plates, nor do AlP
particles serve as nuclei of the β phase.
Beside the impurities the solidification cooling rate plays an important role for the formation
of Fe-rich intermetallic phases. An influence of the Si and Fe content on the formation of Fe-
rich intermetallic phases at different cooling rates is reported in Ref. [29]. The β phase has
been obtained at a cooling rate < 1 K/min and an amount of Fe 0.25 wt. % and is
independent of the Si content. An increase of the cooling rate to > 6 K/min leads to the
formation of the β and additionally the α phase. Finally, at cooling rates > 9 K/min the α
phase is the only phase that forms.
To overcome the negative effect caused by β intermetallic phases some researchers [3, 30]
proposed to add traces of transition elements such as Mn, Cr, Cu or Co, which can neutralize
the embrittlement of alloys and promote the formation of the α phase with a compact
morphology. For commercial applications, elements such as Sr or Na are always added to
Al-Si alloys prior to casting to improve their mechanical properties by modifying the
eutectic Si phase. It has been found that the addition of Sr to the Al-Si alloys positively
influences the volume fraction as well as the size of the Fe-rich intermetallic phases [26-28,
31]. The influence of Sr on the formation of intermetallic phases, however, is still under
debate [28, 32, 33].
The visualization of the microstructure and the phases has long been possible only with
microscopic methods (optical microscopy (OM), scanning electron microscopy (SEM) and
1 Introduction
3
TEM). More recent studies have used tomographic methods to investigate the microstructure
of the eutectic Si as well as the Fe-rich intermetallic phases on a µm scale. Ex-situ
investigations of unmodified and Sr-modified eutectic microstructures of as-cast Al-Si alloys
were usually performed by Focused Ion Beam (FIB) tomography [10, 34-38]. The complete
microstructure in Al-Si alloys, the morphology of the eutectic Si phase and the real
morphology of Fe-rich intermetallic phases was clearly visualized. However, the nucleation
and growth of Fe-rich β intermetallic phases could only be observed by in-situ X-ray
tomography [39-42]. To clearly follow the nucleation and growth process of all phases a
huge number of pictures and a longer experimental time is required. Therefore, the melt has
to be cooled very slowly during solidification. The results of in-situ X-ray measurements
published in Ref.’s [39-42] describe only the formation of the β intermetallic phase.
However, the cooling rate during solidification of in-situ experiments is not high enough to
compare the microstructure with that obtained under industrial conditions. The cooling rate
used in the in-situ experiments was either 1.4°C/min [42] or lies between 3°C/min and
20°C/min [40], while the cooling rate of industrial castings is ~400°C/min. As mentioned
above the increase of the cooling rate results in the preferential formation of one or the other
Fe-rich intermetallic phase.
In summary, from the knowledge of the nucleation and growth of Fe-rich intermetallic
phases in Al-Si alloys we learn that every effect (impurities, modifier and cooling rate during
solidification) must be examined separately.
For this purpose four alloys of different compositions are going to be compared, i.e. the well
defined pure alloys Al-10Si-0.3Fe and Al-10Si-0.3Fe-200 ppm Sr and the two corresponding
commercial alloys containing additional impurities such as Mn, Ni, Zn, Ga and P, etc. This
will allow us to assess the influence of the modifier Sr and the commercial impurities on the
precipitation sequence.
The overview of the microstructure, the location of the intermetallic phases has been
examined by OM and SEM on the mm or the µm scale. The structure and the chemical
composition of the intermetallic phases were determined by diffraction in the TEM and
energy dispersive X-ray (EDX) spectroscopy, respectively. The characterization of the
microstructure and their results obtained by OM, SEM and TEM are presented in chapter
5.1.
The morphology of the eutectic Si and the intermetallic phases in the pure unmodified as
well as in the modified alloys and the corresponding commercial alloys was investigated in
three dimensions by FIB tomography. At much larger scales of ~ 1 mm ex-situ synchrotron
1 Introduction
4
tomography measurements have also been carried out on all casting alloys. The results
obtained from ex-situ tomographic measurements are illustrated in chapter 5.2.
To understand the nucleation and growth of the Fe-rich intermetallic phases in Al-10Si-
0.3Fe casting alloys during phase separation from the melt, in-situ X-ray microtomography
has been used for different solidification cooling rates. The present research was designed to
compare the density, shape, location and connectivity of Fe-rich phases precipitating from
the melt. The results of in-situ synchrotron tomography are shown in chapter 5.3.
Chapter 6 provides a discussion of the Fe-rich intermetallic phase formation influenced by
the cooling rates, by the addition of Sr and by the impurities in Al-Si alloys. The
microstructure development during phase separation is explained. Based on the three-
dimensional tomographic measurements the mechanisms of phase nucleation can be
discussed.

2 Background
5
2. Background
This chapter provides the fundamental properties of the microstructure in the Al-Si based
alloy system. Section 2.1 presents the structural components in the binary equilibrium phase
diagram of Al-Si alloys. The formation of the stable phases will be presented as a function of
the temperature and the composition. However, in practice, commercial Al-Si based alloy
systems consist not only of two alloying elements, but they include several additional
elements or impurities which form intermetallic phases. Especially Fe plays the role of a
natural impurity element. Section 2.2 shows the isothermal section of the ternary Al-Si-Fe
equilibrium phase diagram obtained at 600°C. The ternary diagram describes the existence
areas of all possible Fe-rich intermetallic phases. Section 2.3 schematically presents the
nucleation and growth process of Al-Si eutectic phases based on the temperature profile
during the eutectic solidification. In addition, the phase separation sequence including the
formation of intermetallic phases will be explained. The existence of one or the other
intermetallic phase depends not only on the composition of the alloy (Si content, amount of
impurities like Fe) but also on the cooling rate of the melt, and will be presented in Section
2.4. The influence of Sr addition on the eutectic solidification will be discussed in Section
2.5.
2.1 Binary Al-Si alloy system
The Al-Si binary system is a simple eutectic system with two solid solution phases, i.e. fcc
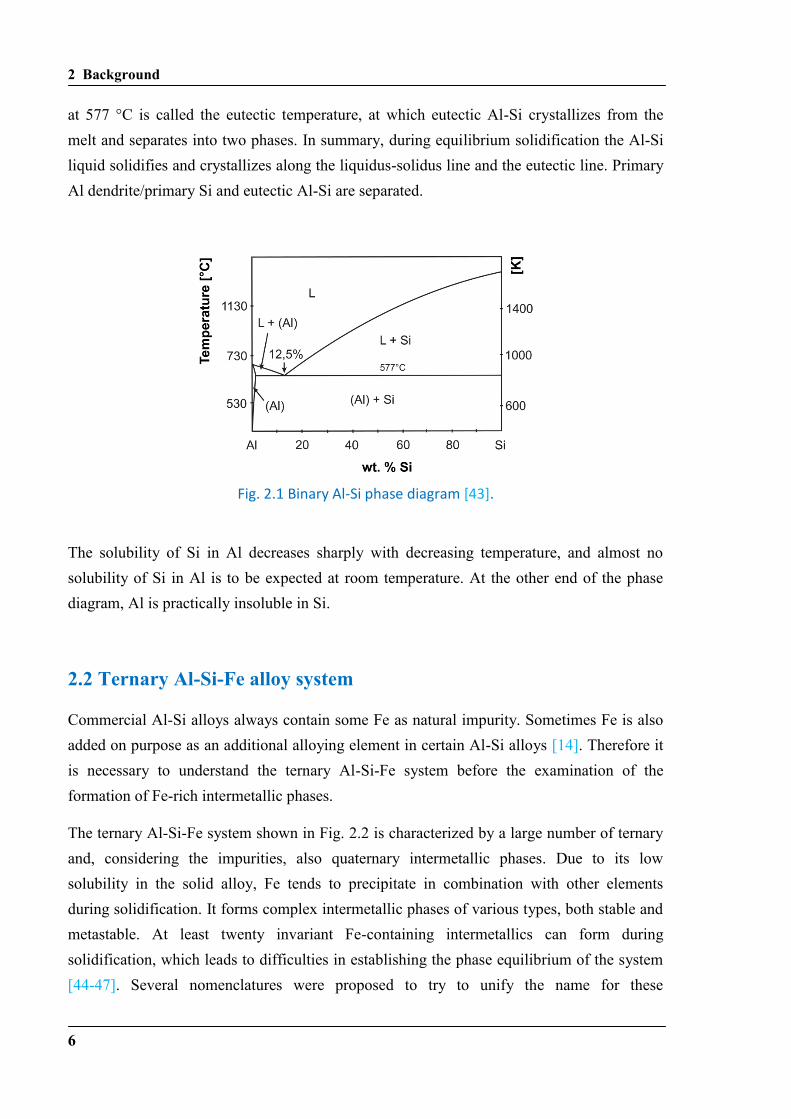
(Al) and diamond cubic (Si). The phase diagram shown in Fig. 2.1 [43] is mainly calculated
from the Gibbs energies of the phases based on the equilibrium state. It displays the
formation condition of the stable phases in the binary system in dependence of the
temperature and composition.
There is a eutectic point at 12.5 wt. % Si at which only eutectic Si and eutectic Al can form
when the temperature is decreasing. In the hypoeutectic Al-Si alloy, there is formation of
primary Al dendrites and then eutectic Si and eutectic Al phases. In the hypereutectic Al-Si
alloy there is formation of primary Si and then eutectic Si and eutectic Al. The temperature
2 Background
6
at 577 °C is called the eutectic temperature, at which eutectic Al-Si crystallizes from the
melt and separates into two phases. In summary, during equilibrium solidification the Al-Si
liquid solidifies and crystallizes along the liquidus-solidus line and the eutectic line. Primary
Al dendrite/primary Si and eutectic Al-Si are separated.
Fig. 2.1 Binary Al-Si phase diagram [43].
The solubility of Si in Al decreases sharply with decreasing temperature, and almost no
solubility of Si in Al is to be expected at room temperature. At the other end of the phase
diagram, Al is practically insoluble in Si.
2.2 Ternary Al-Si-Fe alloy system
Commercial Al-Si alloys always contain some Fe as natural impurity. Sometimes Fe is also
added on purpose as an additional alloying element in certain Al-Si alloys [14]. Therefore it
is necessary to understand the ternary Al-Si-Fe system before the examination of the
formation of Fe-rich intermetallic phases.
The ternary Al-Si-Fe system shown in Fig. 2.2 is characterized by a large number of ternary
and, considering the impurities, also quaternary intermetallic phases. Due to its low
solubility in the solid alloy, Fe tends to precipitate in combination with other elements
during solidification. It forms complex intermetallic phases of various types, both stable and
metastable. At least twenty invariant Fe-containing intermetallics can form during
solidification, which leads to difficulties in establishing the phase equilibrium of the system
[44-47]. Several nomenclatures were proposed to try to unify the name for these
2 Background
7
intermetallic phases, such as Greek alphabet letters: α, β, δ …, or letters τi (i = 1, 2, 3, ...)
[44-50].
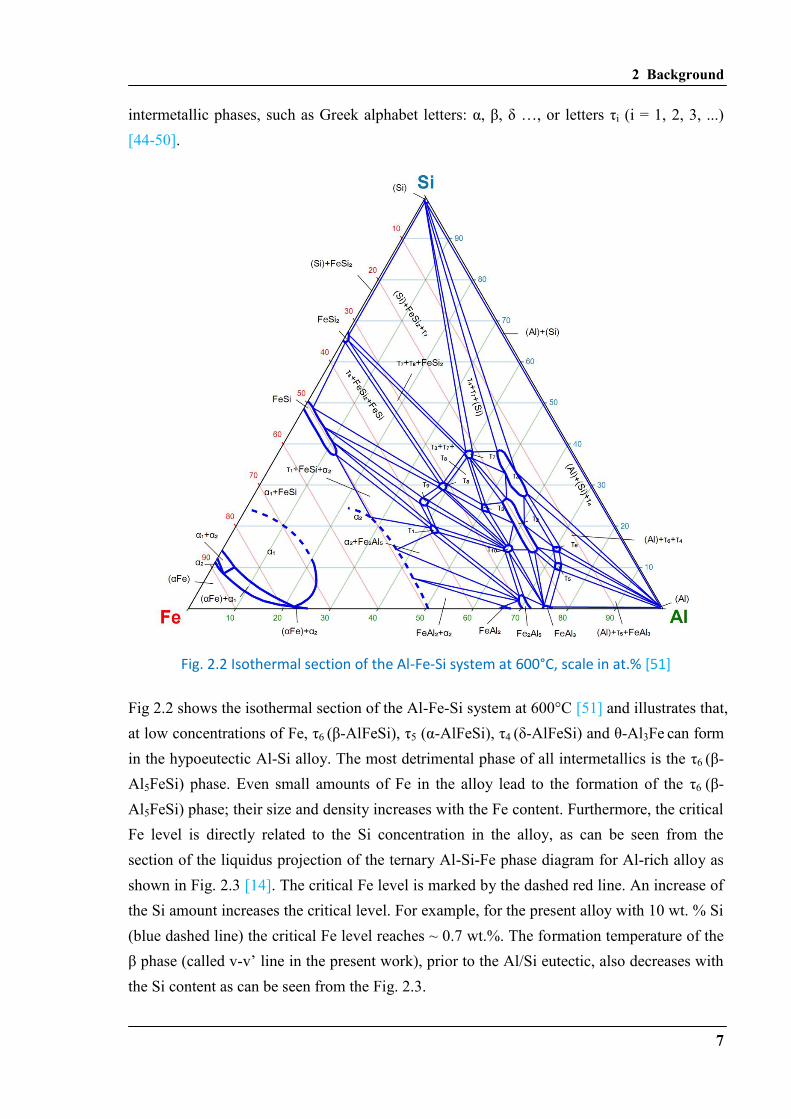
Fig. 2.2 Isothermal section of the Al-Fe-Si system at 600°C, scale in at.% [51]
Fig 2.2 shows the isothermal section of the Al-Fe-Si system at 600°C [51] and illustrates that,
at low concentrations of Fe, τ6 (β-AlFeSi), τ5 (α-AlFeSi), τ4 (δ-AlFeSi) and θ-Al3Fe can form
in the hypoeutectic Al-Si alloy. The most detrimental phase of all intermetallics is the τ6 (β-
Al5FeSi) phase. Even small amounts of Fe in the alloy lead to the formation of the τ6 (β-
Al5FeSi) phase; their size and density increases with the Fe content. Furthermore, the critical
Fe level is directly related to the Si concentration in the alloy, as can be seen from the
section of the liquidus projection of the ternary Al-Si-Fe phase diagram for Al-rich alloy as
shown in Fig. 2.3 [14]. The critical Fe level is marked by the dashed red line. An increase of
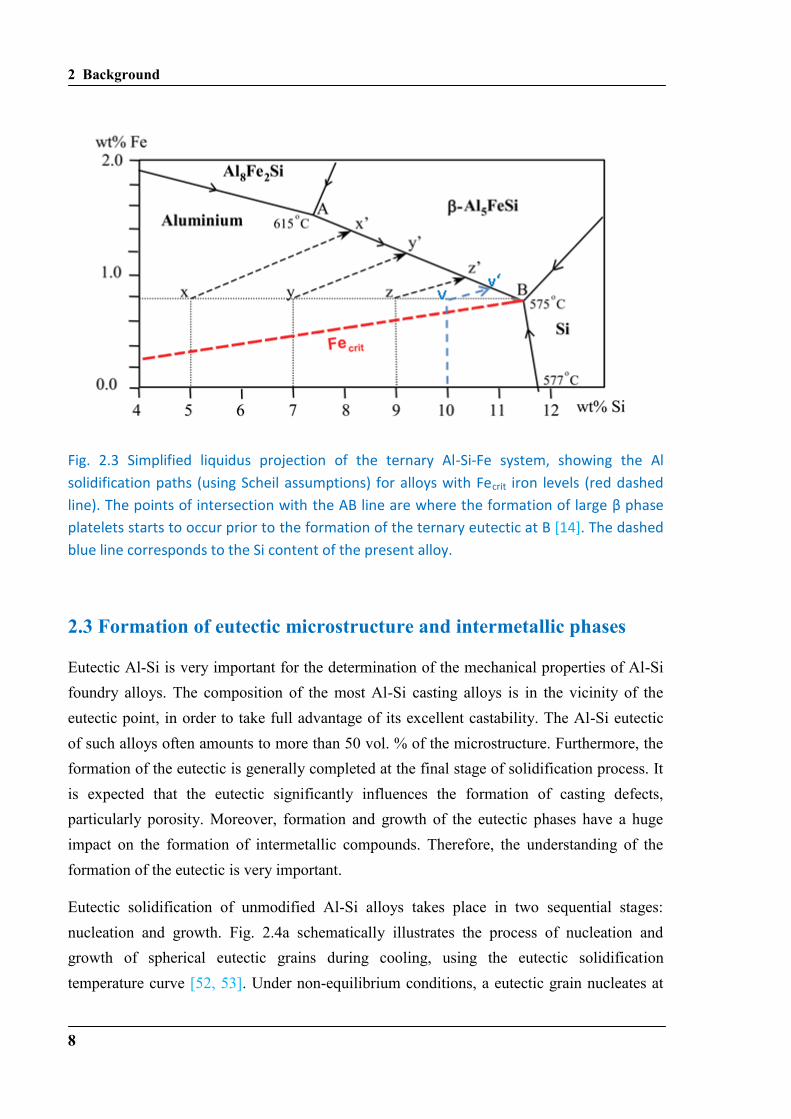
the Si amount increases the critical level. For example, for the present alloy with 10 wt. % Si
(blue dashed line) the critical Fe level reaches ~ 0.7 wt.%. The formation temperature of the
β phase (called v-v’ line in the present work), prior to the Al/Si eutectic, also decreases with
the Si content as can be seen from the Fig. 2.3.
2 Background
8
Fig. 2.3 Simplified liquidus projection of the ternary Al-Si-Fe system, showing the Al
solidification paths (using Scheil assumptions) for alloys with Fecrit iron levels (red dashed
line). The points of intersection with the AB line are where the formation of large β phase
platelets starts to occur prior to the formation of the ternary eutectic at B [14]. The dashed
blue line corresponds to the Si content of the present alloy.
2.3 Formation of eutectic microstructure and intermetallic phases
Eutectic Al-Si is very important for the determination of the mechanical properties of Al-Si
foundry alloys. The composition of the most Al-Si casting alloys is in the vicinity of the
eutectic point, in order to take full advantage of its excellent castability. The Al-Si eutectic
of such alloys often amounts to more than 50 vol. % of the microstructure. Furthermore, the
formation of the eutectic is generally completed at the final stage of solidification process. It
is expected that the eutectic significantly influences the formation of casting defects,
particularly porosity. Moreover, formation and growth of the eutectic phases have a huge
impact on the formation of intermetallic compounds. Therefore, the understanding of the
formation of the eutectic is very important.
Eutectic solidification of unmodified Al-Si alloys takes place in two sequential stages:
nucleation and growth. Fig. 2.4a schematically illustrates the process of nucleation and
growth of spherical eutectic grains during cooling, using the eutectic solidification
temperature curve [52, 53]. Under non-equilibrium conditions, a eutectic grain nucleates at
2 Background
9
the beginning of eutectic solidification (time t= tN; temperature T= TN) and grows until the
end of eutectic solidification (t=tE; T=TE), as shown in Fig. 2.4a. In order to achieve the
critical nucleus size an undercooling of the melt is required. Nucleation begins at a
temperature (TN) below the eutectic equilibrium temperature Teq. The nucleation temperature
is determined by the nuclei distribution and the cooling conditions (e.g. the heat release rate).
It is assumed that during the progressing undercooling new crystallization nuclei are formed
continuously [52, 54]. In the temperature interval TN ≤ T ≤ TM (marked in red in Fig. 2.4a)
there is a continuous formation of potential crystallization nuclei during the steady decrease
in temperature, along with the growth of already existing nuclei. In this interval nucleation
and growth of the eutectic grains occurs at the same time, until the minimum temperature
prior to recalescence (tM, TM) is reached. After reaching TM there is no further nucleation.
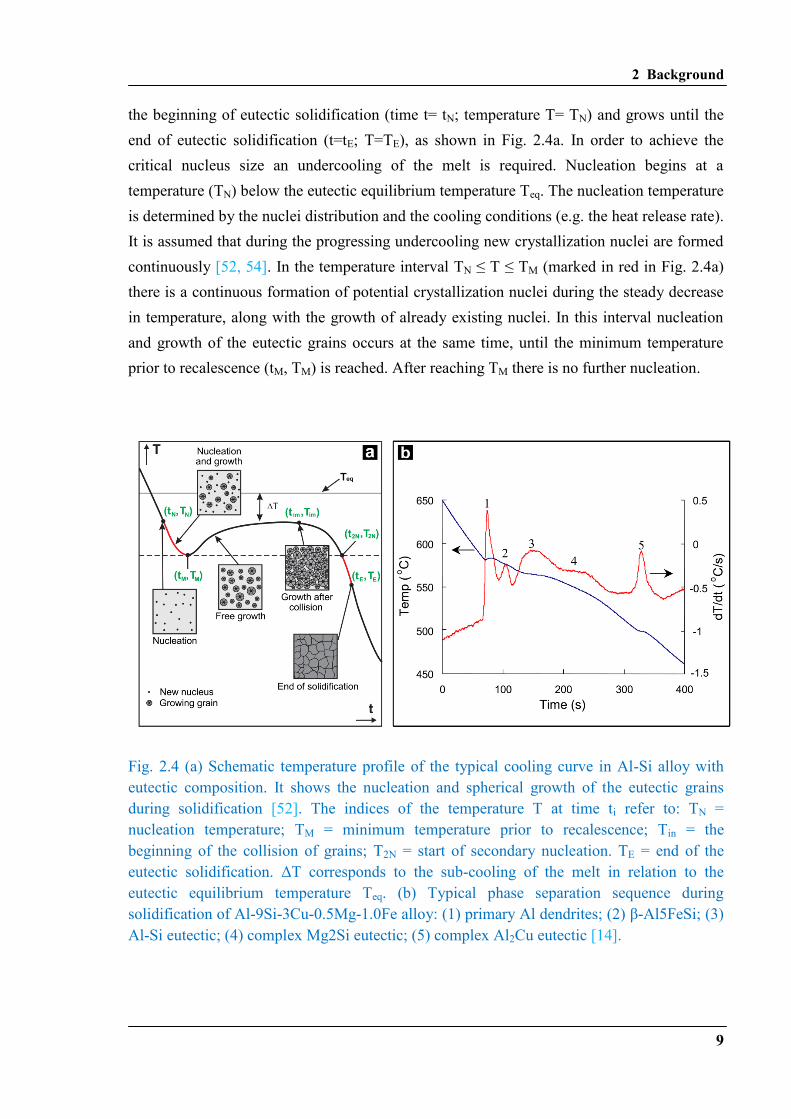
Fig. 2.4 (a) Schematic temperature profile of the typical cooling curve in Al-Si alloy with
eutectic composition. It shows the nucleation and spherical growth of the eutectic grains
during solidification [52]. The indices of the temperature T at time ti refer to: TN =
nucleation temperature; TM = minimum temperature prior to recalescence; Tin = the
beginning of the collision of grains; T2N = start of secondary nucleation. TE = end of the
eutectic solidification. ΔT corresponds to the sub-cooling of the melt in relation to the
eutectic equilibrium temperature Teq. (b) Typical phase separation sequence during
solidification of Al-9Si-3Cu-0.5Mg-1.0Fe alloy: (1) primary Al dendrites; (2) β-Al5FeSi; (3)
Al-Si eutectic; (4) complex Mg2Si eutectic; (5) complex Al2Cu eutectic [14].
2 Background
10
However, the growth of the eutectic grain continues, called “free growth” in Fig 2.4a. This is
because of an equilibrium at TM: the generating rate of latent heat is equal to the heat release
rate. Eutectic solidification starts at that moment, till Teq. The eutectic grains continue to
grow down to T2N, where recalescence ends. The eutectic solidification is finally completed
in the temperature region from T2N to TF.
The morphology of the eutectic Si phase within the eutectic grains can vary, i.e. it can form
coarsened and refined morphologies [55, 56]. The changing of the morphology is primarily
due to the change of the growth speed of the eutectic solidification front (s-l boundary
surface) during solidification of the entire system [55]. According to a postulate in Ref. [56]
the maximum attainable eutectic grain radius may be smaller if a grain nucleates after the tN
temperature or ceases to growth before tE, i.e. fast solidification.
Fig. 2.4b illustrates the typical phase separation sequence during solidification (from 650°C
to 450°C) of the Al-9Si-3Cu-0.5Mg-1.0Fe alloy, during which primary Al dendrites (peak 1),
then β-Al5FeSi phase form (peak 2) prior to the solidification of Al-Si eutectic while Al
dendrites are still growing [14]. Peak 3 corresponds to the Al-Si eutectic. In this special alloy
with high amounts of Cu and Mg there is formation of a complex Mg2Si eutectic at peak 4
and a complex Al2Cu eutectic at peak 5 [14]. In the present alloy peaks 4 and 5 are not
expected to appear because of the low content of impurity elements.
Generally, intermetallic particles that form prior to or at the same time as solidification of the
Al dendritic phase are relatively large. Particles that form much later, i.e. during or after the
period of Al-Si eutectic solidification, are comparatively smaller because there is less liquid
space available for growth during later stages.
As mentioned above, the Al-Si-Fe system is characterized by a large number of complex
intermetallic phases, which differ by chemical composition, morphology and crystal
structure. However, the frequently occurring intermetallic phases in Al-Si alloys are α, β and
δ. The various morphologies of the different intermetallics are partly responsible for the
impact of iron on castability and mechanical properties. The formation path of intermetallic
phases is different and depends, on the one hand on the amount of Si and Fe, and on the
cooling rate during solidification, on other impurities in the alloy, and on additions of further
transition elements.
Detailed investigations of intermetallic phases existing in Al-xSi-0.25Fe alloys with different
Si content and cooling rates have been reported in Ref. [29]. The intermetallics in Al-xSi-
0.25Fe (x=2-12.5 wt%) are τ5 (α-AlFeSi) and τ6 (β-AlFeSi) phases. Their evolution at
2 Background
11
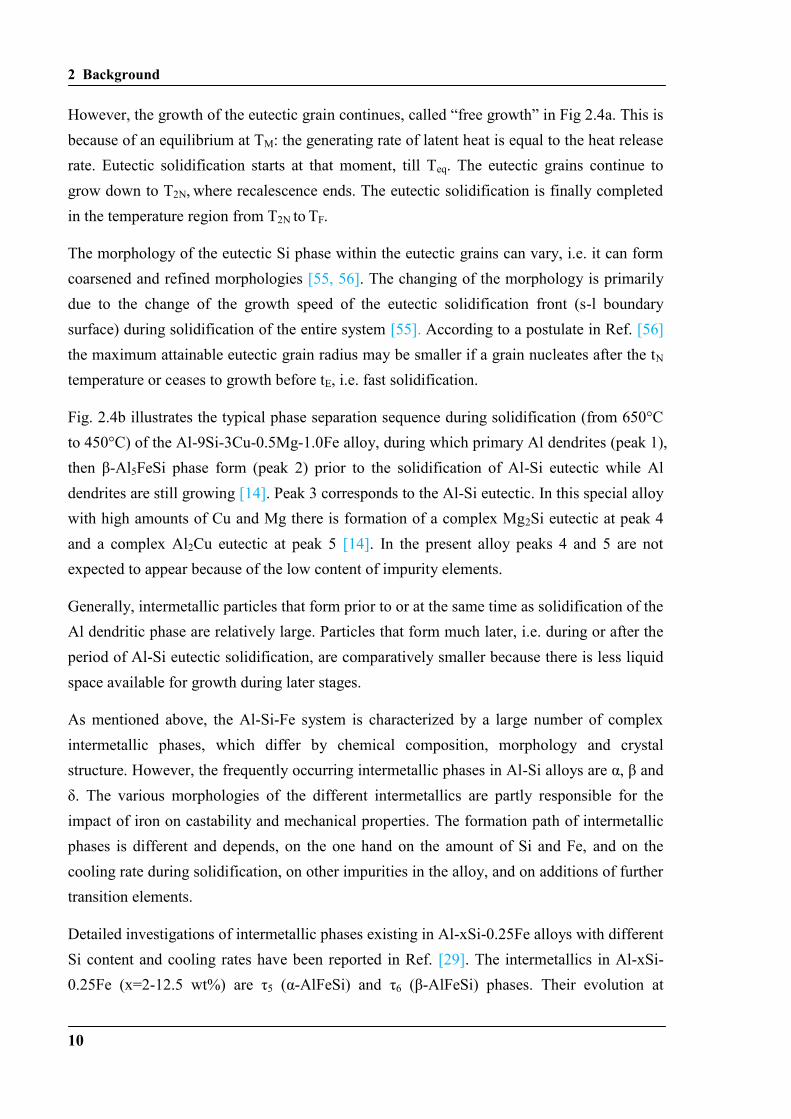
several solidification cooling rates is shown in a schematic diagram in Fig 2.5. Based on the
observations of the solidified microstructure it shows the conditions at which the
intermetallic phases show up. Clearly the Si content and the cooling rate have a strong
influence on the formation of either α-intermetallics or β-intermetallics along a critical band
line, marked by a dashed line in the image. For Al-10%Si, the only β-intermetallic phase
exists at cooling rates below 0.017 K/s, independently of the Si content. However, this phase
Fig. 2.5. Schematic diagram of the cooling rate as a function of the Si concentration
demonstrating the existence of different types of intermetallic phases in Al-10Si-0.25Fe
alloys, cooled from a temperature of about 1093 K (820 °C) after a melt holding time of 2 h.
The band framed by the dotted line presents the conditions in which both the τ5 (α-AlFeSi)
and the τ6 (β-AlFeSi) phases co-exist in the sample [29]. The alloy composition and the
cooling rates used in the present work are marked in orange.
can also be obtained at much higher cooling rates but at low Si contents (i.e. at 2 wt. % Si).
The area between the two dashed lines shows the existence of α- and β-intermetallic phases.
Finally, the high cooling rate promotes only the formation of α-intermetallic phase (area
above the dashed line). The δ- intermetallic phase has also been found in a similar alloy of
composition Al-10Si-0.25Fe [19]. It has been proposed [5, 57] that the δ-intermetallic phase
is dominant at a high Si content and a high cooling rate while β is dominant at a high Fe
content and a low cooling rate. The increase of the cooling rate enhances the formation of
intermetallic phases on some inclusions [33]. The combination of parameters (level of Si and
Fe and cooling rate) determines the final microstructure which may contain the α phase, the
β phase, the δ phase, or a combination of them. Low cooling rates result in larger sized
2 Background
12
intermetallic phases whereas high cooling rates lead to a higher density of intermetallics and
smaller sizes [5].
2.3.1 α intermetallic phase
It has been reported that the α phase exhibits many different compositions and structures in
the stable ternary and quaternary systems [15-18]. The α-intermetallic phase was designated
as α(FeSi) or c-AlFeSi and was attributed a cubic unit cell with a=1.2578 nm by earlier
researchers [58, 59]. Almost at the same time Robinson et al. [60] almost found an α–AlFeSi
intermetallic with a hexagonal unit cell and lattice parameters a=1.23 nm and c=2.62 nm.
Al-Si-Fe alloys containing Mn produce several α phases. Cooper [58] reported an α-
Al19Fe4MnSi with space group Im and a lattice parameter a=1.256 nm. Later, Kral [11]
revised this composition to α-Al19(Fe,Mn)5Si2 and another α-Al15(Fe,Mn)3Si2 phase was
reported in Ref. [61] with space group Im and a lattice parameter a=1.25 nm.
The most common α-intermetallic phase is α-Al8Fe2Si, which has either been identified as
body-centered cubic with space group Im and a lattice parameter around a = 1.25 nm [10, 11]
or as a hexagonal structure, space group P63/mmc, with lattice parameters around a = 1.2404
nm and c = 2.6234 nm [12, 13]. The α phases all exhibit the so-called “Chinese script”
morphology in two dimensions. In addition, some researchers reported a phase α-
Al15(Fe,Mn)3Si2 showing a compact blocky shape and looking like polyhedral crystals [14].
It has been suggested that traces of transition elements such as manganese, chromium,
copper or cobalt can promote the formation of the α phase [18, 62]. Such transition elements
in Al-Si alloys are partly responsible for the observed diversity of intermetallics since they
are always present in commercial alloys.
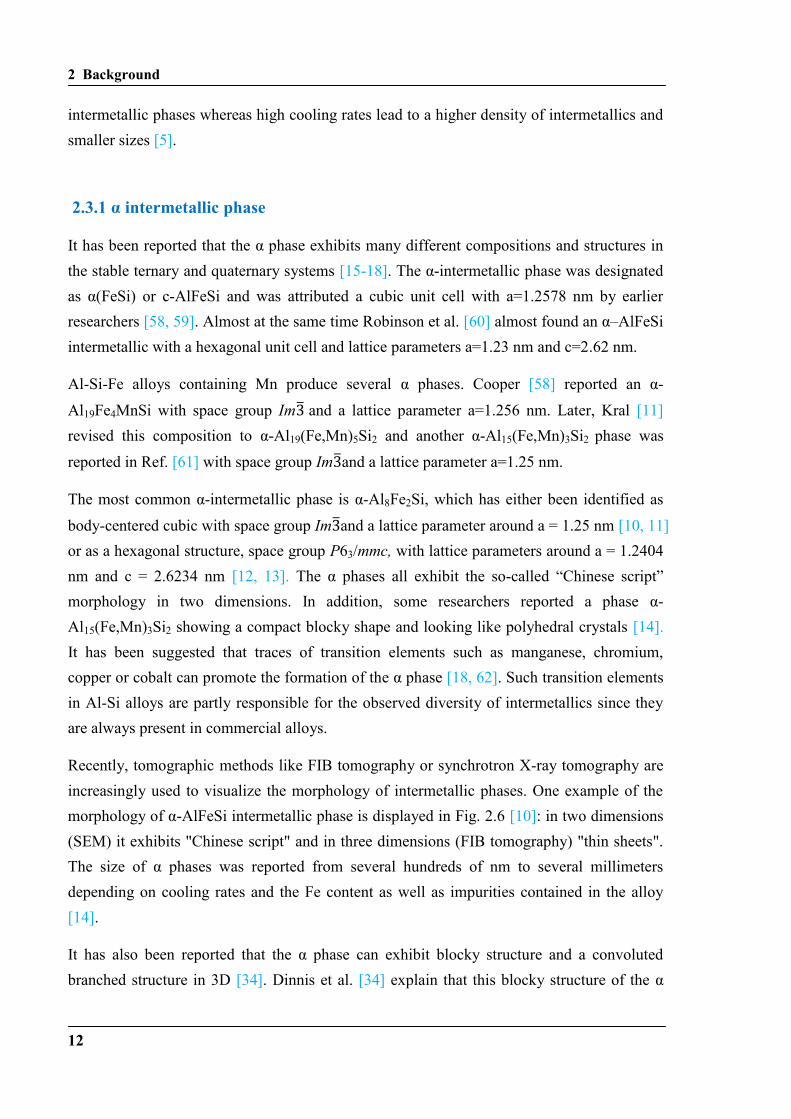
Recently, tomographic methods like FIB tomography or synchrotron X-ray tomography are
increasingly used to visualize the morphology of intermetallic phases. One example of the
morphology of α-AlFeSi intermetallic phase is displayed in Fig. 2.6 [10]: in two dimensions
(SEM) it exhibits "Chinese script" and in three dimensions (FIB tomography) "thin sheets".
The size of α phases was reported from several hundreds of nm to several millimeters
depending on cooling rates and the Fe content as well as impurities contained in the alloy
[14].
It has also been reported that the α phase can exhibit blocky structure and a convoluted
branched structure in 3D [34]. Dinnis et al. [34] explain that this blocky structure of the α
2 Background
13
phase forms before the Al dendrites begin to solidify while the convoluted branched
structure of the α phase forms after the Al dendrites have begun to solidify. In addition,
Gorny et al. [29] observed two distinct morphologies of the α phase, namely large phases
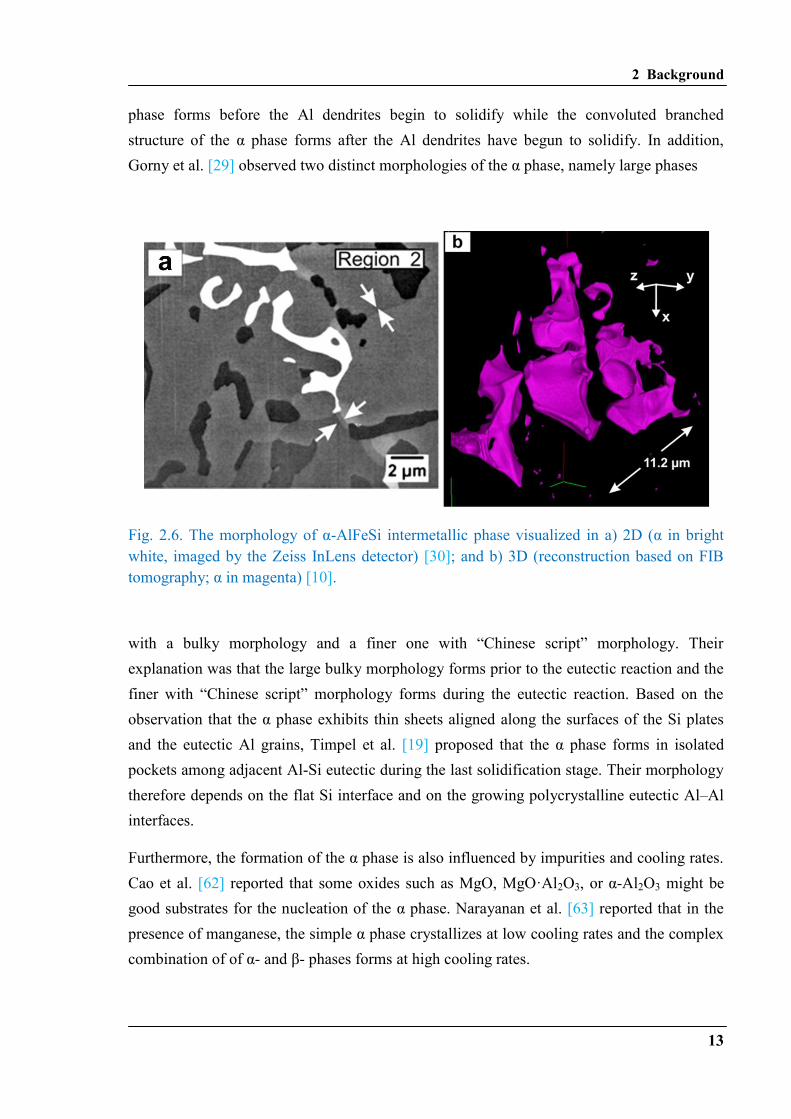
Fig. 2.6. The morphology of α-AlFeSi intermetallic phase visualized in a) 2D (α in bright
white, imaged by the Zeiss InLens detector) [30]; and b) 3D (reconstruction based on FIB
tomography; α in magenta) [10].
with a bulky morphology and a finer one with “Chinese script” morphology. Their
explanation was that the large bulky morphology forms prior to the eutectic reaction and the
finer with “Chinese script” morphology forms during the eutectic reaction. Based on the
observation that the α phase exhibits thin sheets aligned along the surfaces of the Si plates
and the eutectic Al grains, Timpel et al. [19] proposed that the α phase forms in isolated
pockets among adjacent Al-Si eutectic during the last solidification stage. Their morphology
therefore depends on the flat Si interface and on the growing polycrystalline eutectic Al–Al
interfaces.
Furthermore, the formation of the α phase is also influenced by impurities and cooling rates.
Cao et al. [62] reported that some oxides such as MgO, MgO·Al2O3, or α-Al2O3 might be
good substrates for the nucleation of the α phase. Narayanan et al. [63] reported that in the
presence of manganese, the simple α phase crystallizes at low cooling rates and the complex
combination of of α- and β- phases forms at high cooling rates.
2 Background
14
2.3.2 β intermetallic phase
The β-Al5FeSi intermetallic phase was first identified in an AlFeSi alloy by Rosenhain et al.
[64]. The formation of β-Al5FeSi intermetallic phase and its structure was of primary interest
in many research studies. Rømming et al. [21] reported a monoclinic structure of the β-
Al4.5FeSi phase with lattice parameters a=0.6161 nm, b=0.6175 nm, c=2.0813 nm, and
β=90.42° as determined by a combination of X-ray and electron diffraction. It was reported
that the β phase contains faults and twins [17, 21, 22], which might be the reason why the β
phase has such a variety of unit cell parameters. Hansen et al. [22] used the simplest fault
model to describe why the anti-phase structure will destroy the monoclinic symmetry of the
β phase and become triclinic with lattice parameters a=0.61676 nm, b=0.61661 nm,
c=2.08093 nm, and β=91° (slightly different from the monoclinic structure). However, there
were still some reports that the β phase sometimes exists as a tetragonal structure [23], a B-
face centered orthorhombic [24], or even an A-centered orthorhombic structure in
multiphase composites [21]. β-Al5FeSi was often designated as Al4.5FeSi or Al9Fe2Si2 [22,
64].
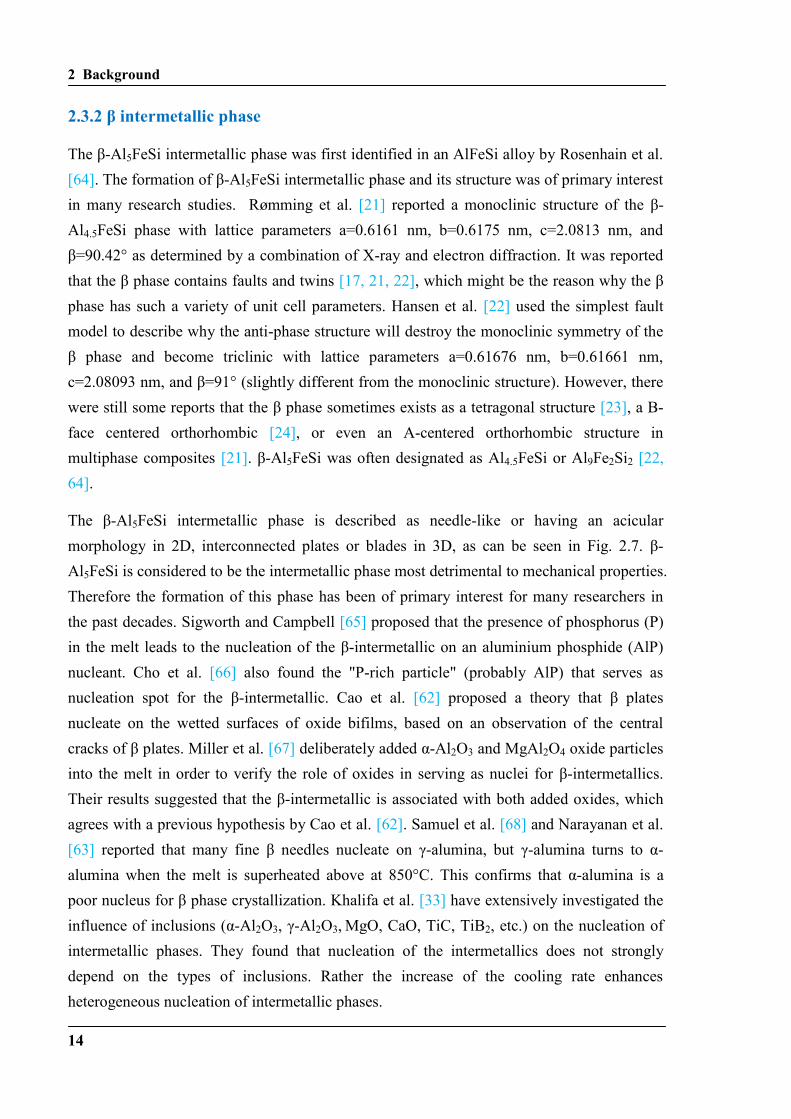
The β-Al5FeSi intermetallic phase is described as needle-like or having an acicular
morphology in 2D, interconnected plates or blades in 3D, as can be seen in Fig. 2.7. β-
Al5FeSi is considered to be the intermetallic phase most detrimental to mechanical properties.
Therefore the formation of this phase has been of primary interest for many researchers in
the past decades. Sigworth and Campbell [65] proposed that the presence of phosphorus (P)
in the melt leads to the nucleation of the β-intermetallic on an aluminium phosphide (AlP)
nucleant. Cho et al. [66] also found the "P-rich particle" (probably AlP) that serves as
nucleation spot for the β-intermetallic. Cao et al. [62] proposed a theory that β plates
nucleate on the wetted surfaces of oxide bifilms, based on an observation of the central
cracks of β plates. Miller et al. [67] deliberately added α-Al2O3 and MgAl2O4 oxide particles
into the melt in order to verify the role of oxides in serving as nuclei for β-intermetallics.
Their results suggested that the β-intermetallic is associated with both added oxides, which
agrees with a previous hypothesis by Cao et al. [62]. Samuel et al. [68] and Narayanan et al.
[63] reported that many fine β needles nucleate on γ-alumina, but γ-alumina turns to α-
alumina when the melt is superheated above at 850°C. This confirms that α-alumina is a
poor nucleus for β phase crystallization. Khalifa et al. [33] have extensively investigated the
influence of inclusions (α-Al2O3, γ-Al2O3, MgO, CaO, TiC, TiB2, etc.) on the nucleation of
intermetallic phases. They found that nucleation of the intermetallics does not strongly
depend on the types of inclusions. Rather the increase of the cooling rate enhances
heterogeneous nucleation of intermetallic phases.
2 Background
15
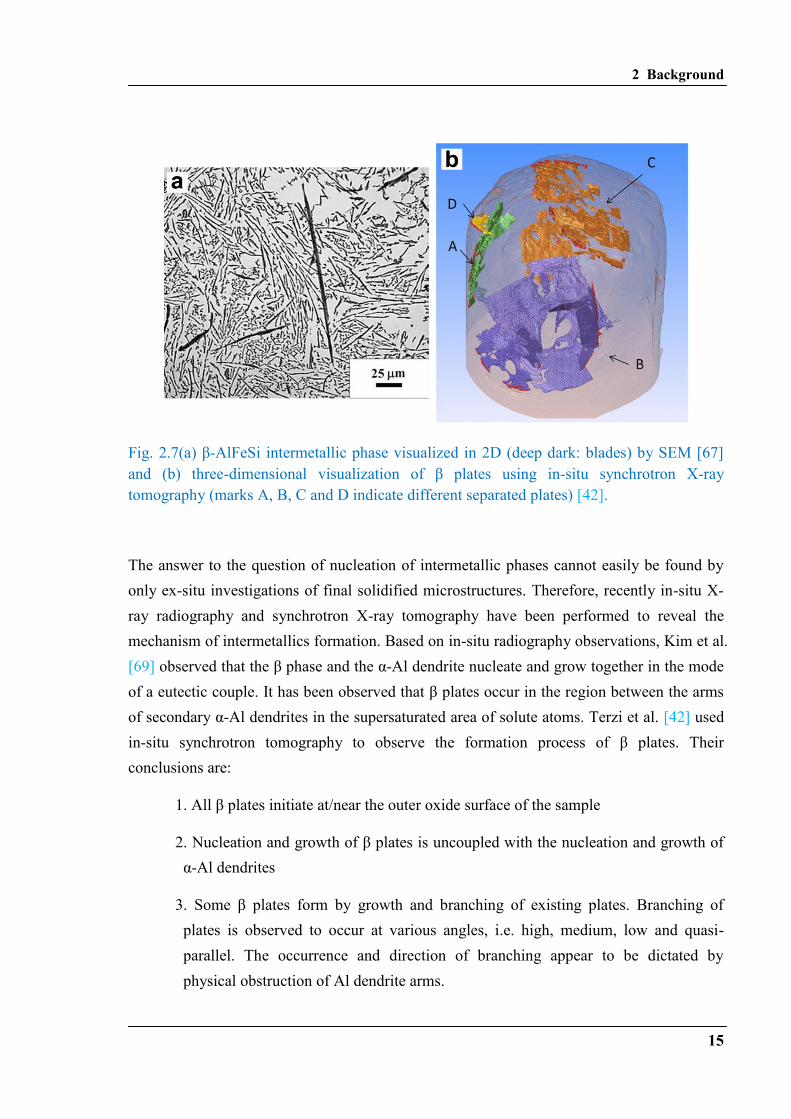
Fig. 2.7(a) β-AlFeSi intermetallic phase visualized in 2D (deep dark: blades) by SEM [67]
and (b) three-dimensional visualization of β plates using in-situ synchrotron X-ray
tomography (marks A, B, C and D indicate different separated plates) [42].
The answer to the question of nucleation of intermetallic phases cannot easily be found by
only ex-situ investigations of final solidified microstructures. Therefore, recently in-situ X-
ray radiography and synchrotron X-ray tomography have been performed to reveal the
mechanism of intermetallics formation. Based on in-situ radiography observations, Kim et al.
[69] observed that the β phase and the α-Al dendrite nucleate and grow together in the mode
of a eutectic couple. It has been observed that β plates occur in the region between the arms
of secondary α-Al dendrites in the supersaturated area of solute atoms. Terzi et al. [42] used
in-situ synchrotron tomography to observe the formation process of β plates. Their
conclusions are:
1. All β plates initiate at/near the outer oxide surface of the sample
2. Nucleation and growth of β plates is uncoupled with the nucleation and growth of
α-Al dendrites
3. Some β plates form by growth and branching of existing plates. Branching of
plates is observed to occur at various angles, i.e. high, medium, low and quasi-
parallel. The occurrence and direction of branching appear to be dictated by
physical obstruction of Al dendrite arms.
2 Background
16
4. β plates can grow around dendrite arms to a wide growth front after passing throug.
5. A thickening of β plates can result in imprinted images on the surrounding
dendrites being formed on their surface. Depressions and ridge lines marking
adjacent dendrite arms can be observed.
6. The interaction between plates, dendrites and the outer oxide boundary can result
in the formation of curved, bent, or fractured plates.
Puncreobutr et al. [40] observed four nucleation modes of the β phase:
1. Surface oxide nucleation (probably Al2O3)
2. On/near α-Al dendrites
3. Self-nucleation
4. Oxide skin of pores.
A quantification of all nucleation events demonstrated that the main mechanism of
nucleation was on/near Al dendrites. Furthermore, the morphological texture indicates an
orientation relationship of β plates growing parallel to the secondary dendrite arms. From the
observation in [40] the authors proposed two types of plate interaction mechanisms: 1)
impingement; 2) branching (new plates initiated at the existing plates, which is in agreement
with the observations by Terzi et al. [42]).
2.3.3 δ intermetallic phase
The last and most common Fe-rich intermetallic phase in Al-Si-based alloys is δ-Al4FeSi2 or
Al3FeSi2 [10, 19] which exhibits a needle-like or acicular morphology in 2D and plates or
blades in 3D, similar to the β phase. It has been reported that δ has a PdGa5-type tetragonal
structure with lattice parameters a=0.615 nm and c=0.947 nm [19]. Day et al. [20] re-
determined the symmetry and proposed an orthorhombic structure with a pseudo-tetragonal
cell a=0.6061 nm, b=0.6061 nm, and c= 0.9525 nm and space group Pbcn.
It has been reported that the formation of the β phase is dominant at low cooling rates and
high Si content, whereas the formation of the δ phase is dominant at high cooling rates and
high Si content in the Al-Si-Fe system [33]. Choi et al. [57] investigated two hypereutectic
types of Al-Si-Fe alloys with very high amounts of Fe. The alloys are Al-20Si-8Fe and Al-
2 Background
17
30Si-5Fe. It has been found that in the Al-20Si-8Fe alloy at a relatively low cooling rate
(0.17 K/s) the δ phase formed first, prior to primary Si precipitation. The remaining liquid
solidified into an irregular ternary eutectic consisting of α-Al, Si and δ phase. In the Al-30Si-
5Fe alloy the δ phase formed after primary Si precipitation, followed by the ternary eutectic
α-Al, Si and δ phases. The ratio of Si to Fe played an important role in the formation of the δ
phase. It has also been shown that the δ phase is meta-stable and transforms into equilibrium
β phase with a monoclinic structure during further heat treatments. It was previously
proposed that the δ phase can nucleate on oxide bifilms [62]. Khalifa et al. [33] investigated
a series of inclusions that might be potent nucleation substrates. They found that the δ phase
can nucleate on various different inclusions such as CaO, TiB2, and α-Al2O3.
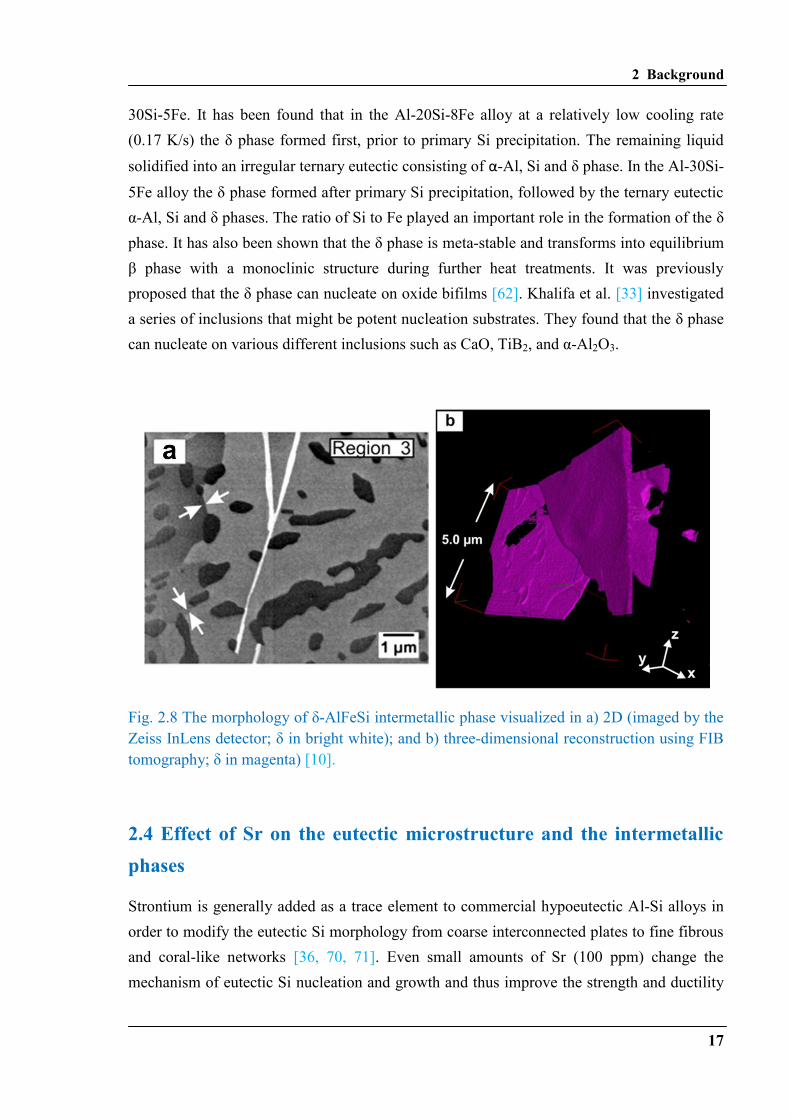
Fig. 2.8 The morphology of δ-AlFeSi intermetallic phase visualized in a) 2D (imaged by the
Zeiss InLens detector; δ in bright white); and b) three-dimensional reconstruction using FIB
tomography; δ in magenta) [10].
2.4 Effect of Sr on the eutectic microstructure and the intermetallic
phases
Strontium is generally added as a trace element to commercial hypoeutectic Al-Si alloys in
order to modify the eutectic Si morphology from coarse interconnected plates to fine fibrous
and coral-like networks [36, 70, 71]. Even small amounts of Sr (100 ppm) change the
mechanism of eutectic Si nucleation and growth and thus improve the strength and ductility
2 Background
18
of the final products. Modification of the eutectic microstructure has been investigated by
many researchers for about 90 years. Only recently, the Sr modification effect was further
explained by applying high resolution methods on the atomic scale. It has been found that it
is intermetallic Sr-Al-Si co-segregation that inhibits and restricts growth of the eutectic Si
phase [72-74], and not single Sr atoms as postulated in the past.
The modification effect of Sr, especially on the transformation of the eutectic microstructure,
is extremely important. However, the knowledge of the Sr influence on the formation of Fe-
rich intermetallic phases is equally important for industrial application. As mentioned earlier,
the presence of intermetallic phases has deleterious effect on the mechanical properties and
detrimentally impacts the castability of Al-Si alloys [3, 6, 14]. Elimination of plate-shaped
and large “Chinese-script”-style intermetallic phases results in an improvement of the
mechanical properties of Al-Si castings. Addition of alloying elements such as Mn, Cr, Sr,
etc to Al-Si alloys suppresses the formation of the most harmful β plates and causes the
fragmentation of β plates, or even changes the types of intermetallics from most harmful β
plates to less harmful Al15(Fe, Mn)3Si2 or Al13(Fe,Cr)4Si4 phases [68].
A sufficiently high concentration of Sr leads to a breaking of the β needles into smaller and
thinner fragments [75, 76]. The mechanism of fragmentation was explained by the diffusion
or the rejection of Si from the β plates.
The addition of Sr is also effective in reducing the number, size and volume fraction of the
β-Al5FeSi phase as has been reported in [31, 33].
The distribution of intermetallic phases in unmodified Al-Si alloys is homogeneous. In
contrast, the addition of Sr leads to a heterogeneous distribution of secondary intermetallic
phases within the eutectic grains of the Al-Si alloys [10, 55]. Recently Timpel et al. [10]
reported that the modified eutectic grains can be classified into three parts:
1) well-modified central regions with fine fibers, free of intermetallic phases;
2) a transition region where the α phase precipitates at the eutectic cell boundaries in the
eutectic grain;
3) an outer region, where the δ phase forms after a severe segregation of Fe into a Si-rich
melt during a second interval of nucleation.
McDonald et al. [53, 55] presented a similar grain cellular structure, in which numerous β
phase plates and isolated pores can only observed in the outer region (region 3).

2 Background
19
Fig 2.9 Typical cooling curves [71] for: (a) the unmodified and the Sr-modified high-purity
Al-10Si alloys; (b) the unmodified and the Sr-modified commercial Al-10Si alloys. The
dashed line indicates the equilibrium eutectic temperature of 577°C in binary Al-Si system.
The second cooling curve has been displaced along the time axis for the sake of clarity. (c)
Reaction temperatures (nucleation, minimum and growth) for the primary and eutectic
reactions in each of the four experimental alloys. Nucleation temperature TN, defined as
the first noticeable change on the derivative of the cooling curve, the minimum
temperature prior to recalescence TM, and the growth temperature TG, defined as the
maximum reaction temperature reached after recalescence.
The effect of impurities and Sr modification on the nucleation and growth of eutectic grains
in commercial and high purity Al-Si alloys has been investigated in Ref. [71]. The
phosphorus content in these alloys was less than 10 ppm. The eutectic in the unmodified
high-purity alloy exhibited extremely refined Si flakes, whereas the eutectic microstructure
of the unmodified commercial alloy was a typical mixture of coarse silicon flakes. The
addition of Sr to both the high-purity alloy and the commercial alloy modified the eutectic Si
phase, resulting in a flake-fibrous morphology of the eutectic Si phase. The average cooling
rate for both commercial and high-purity alloys prior to solidification was 1.5 K/s. The
typical cooling curves obtained during solidification of the above unmodified high-purity
alloy and Sr-modified high-purity alloy are shown in Fig. 2.9a. The unmodified commercial
alloy and the Sr-modified commercial alloy are shown in Fig. 2.9b. The characteristic
2 Background
20
temperatures for the primary and eutectic reactions obtained from these curves are shown in
Fig. 2.9c.
The comparison of the cooling curves of the commercial alloys (Fig. 2.9b) indicates an
increase in recalescence at the eutectic temperature and the repression of the eutectic growth
temperature when Sr is added. In contrast to the unmodified commercial alloy, the
unmodified high-purity alloy (Fig. 2.9a) shows a significant amount of recalescence and a
negligibly decrease of growth temperature. The addition of Sr to the high-purity alloy
increases the recalescence but does not reduce the growth temperature.
3 Materials
21
3. Materials
This chapter describes the preparation of hypoeutectic Al-10Si-0.3Fe – based alloys which
were chosen for the investigations. In order to examine the influence of impurities on the
formation of Fe-rich intermetallic phases, a high purity alloy and a commercial alloy were
used for experiments. Sr was added to the both alloys to study its influence on the evolution
of Fe-rich intermetallic phases. In total, four Al-10Si-0.3Fe-based alloys have been produced
externally:
1" High-purity Al-10Si-0.3Fe alloy named "P"
2" High-purity Al-10Si-0.3Fe alloy with Sr addition, named "PS"
3" Commercial Al-10Si-0.3Fe alloy, named "C"
4" Commercial Al-10Si-0.3Fe alloy with Sr addition, named "CS"
The detailed fabrication is as follows:
Al-10 Si-0.3 Fe (in wt.%) alloys with alloying elements of high purity (> 99.99 purity) and
alloying elements of commercial purity (> 99.70 purity) were manufactured separately by
Hydro Aluminium, Germany. For the modification of the eutectic Si, an Al-10Sr (wt.%)
master alloy was added to the unmodified alloy. The ratio between both the unmodified and
the master alloy has been choosen in such a way that at the end the alloy contained only 200
ppm Sr. The unmodified and the Sr-modified melt were cast into a cylindrical permanent
mold with a diameter of 30 mm and a height of 200 mm. The total solidification time was
approximately ~40 s. The chemical compositions of both the unmodified and the Sr-
modified Al-10Si-0.3Fe casting alloys as measured by optical emission spectrometry are
listed in Table 3.1.
3 Materials
22
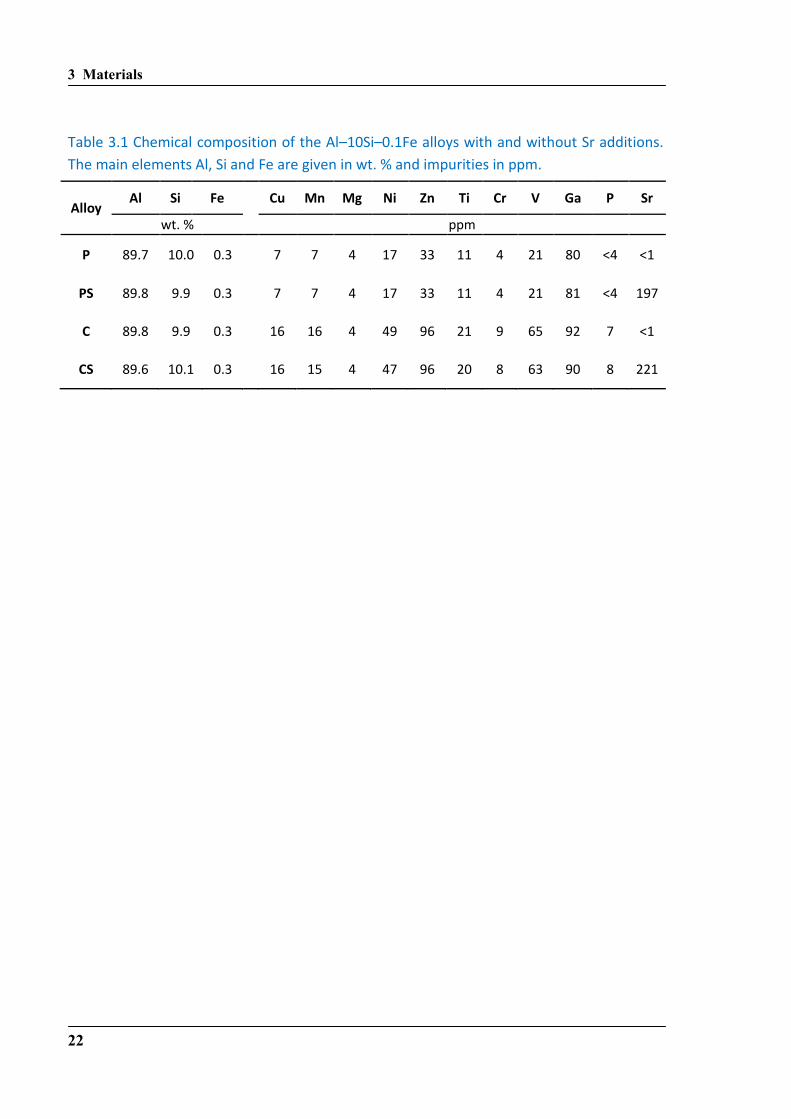
Table 3.1 Chemical composition of the Al–10Si–0.1Fe alloys with and without Sr additions.
The main elements Al, Si and Fe are given in wt. % and impurities in ppm.
Alloy Al Si Fe
Cu Mn Mg Ni Zn Ti Cr V Ga P Sr
wt. % ppm
P 89.7 10.0 0.3 7 7 4 17 33 11 4 21 80 <4 <1
PS 89.8 9.9 0.3 7 7 4 17 33 11 4 21 81 <4 197
C 89.8 9.9 0.3 16 16 4 49 96 21 9 65 92 7 <1
CS 89.6 10.1 0.3 16 15 4 47 96 20 8 63 90 8 221
4 Experimental methods
23
4. Experimental methods
Various microscopic methods scaling the size range from mm to nm were used for the
investigation of the influence of the modifying element Sr and the impurity elements on the
formation of the intermetallic phases in Al-Si alloys. Thus it is possible to characterize the
complete intermetallic phases and the distribution of the eutectic phases around the
associated intermetallic phases. The activities undertaken in this PhD thesis and the methods
used are divided into two areas:
1) The investigation of the microstructure, consisting of intermetallics with/without the
related eutectic areas, scaling in the range from nm to mm was carried out by optical
microscopy and Scanning Electron Microscope to reveal the detailed microstructure.
Additional TEM analysis was used to identify the type of the Fe-containing intermetallic
phases.
2) A three-dimensional visualization of the intermetallic phases with/without the related
eutectic areas was implemented to gain insight into the morphology of the precipitates and
their spatial arrangement, scaling from submicron to submillimeter using the methods of FIB
tomography and synchrotron X-ray tomography. In particular, In-situ synchrotron
tomography was performed to image in real time the shape, the location and the interactivity
of the intermetallic phases precipitating in the melt during phase separation. Thus it is
possible to study these parameters as a function of the solid fraction as the temperature
decreases during solidification.
Specimens used in this work are prepared in many different and complex ways, depending
on the requirements of the instruments and the facilities that are involved as described below.
4.1 Optical Microscopy
Optical microscopy analysis allows one to get a rough overview of the microstructure and to
obtain 2D images of the morphology of phases on different size scales from the investigated
4 Experimental methods
24
samples. A Zeiss microscope Axiophot 2, equipped with a digital camera AxioCamHRc was
used for image acquisition from the microstructure of the samples investigated in this work.
For the investigations by means of optical microscope, the cast rods were sectioned
perpendicular to their axes, ground using standard metallographic procedures and finally
polished with a colloidal silica suspension with a particle size of 50 nm (OP-U). All
specimens investigated in this work were extracted from the centers of the castings, 15 mm
from the bottom of the initial cast ingot.
The optical microscopic examination of the samples was performed in differential
interference contrast mode (Differential Interference Contrast, DIC). Basically near-surface
regions of the sample could be mapped very well using the DIC contrast without etching.
4.2 Scanning Electron Microscopy
A Zeiss 1540EsB CrossBeam® workstation combined with an ultra-high-resolution
GEMINI® field emission column was used to characterize the microstructure of the Al-Si
alloys.
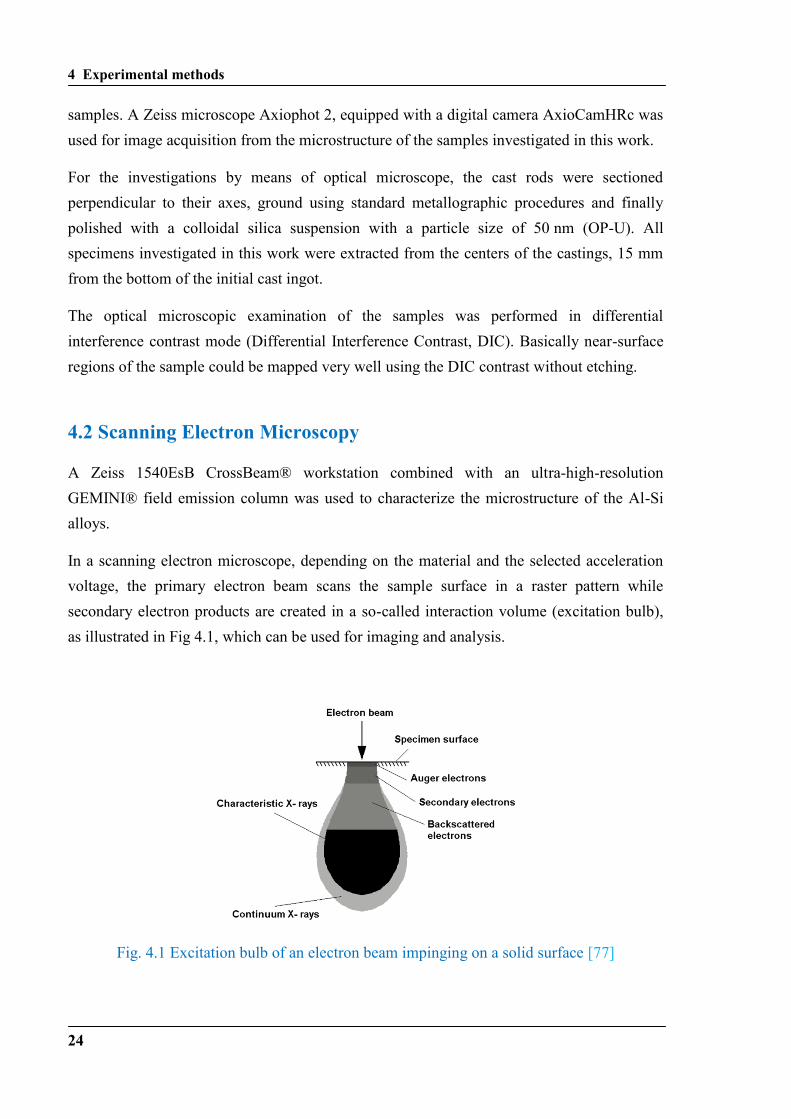
In a scanning electron microscope, depending on the material and the selected acceleration
voltage, the primary electron beam scans the sample surface in a raster pattern while
secondary electron products are created in a so-called interaction volume (excitation bulb),
as illustrated in Fig 4.1, which can be used for imaging and analysis.
Fig. 4.1 Excitation bulb of an electron beam impinging on a solid surface [77]
4 Experimental methods
25
The electron beam is created by applying an electric field of about 0.2 – 40 keV to a thin
needle of different types. The beam is then focused by lenses and arrives at the sample
surface with a diameter of 0.4 to 5 nm. In the interaction volume with the material it creates
Auger electrons, secondary electrons (SE) and backscattered electrons (BSE), the two latter
are being the most used for investigations. Different detectors are necessary for different
types of electrons, as shown in Fig. 4.2.
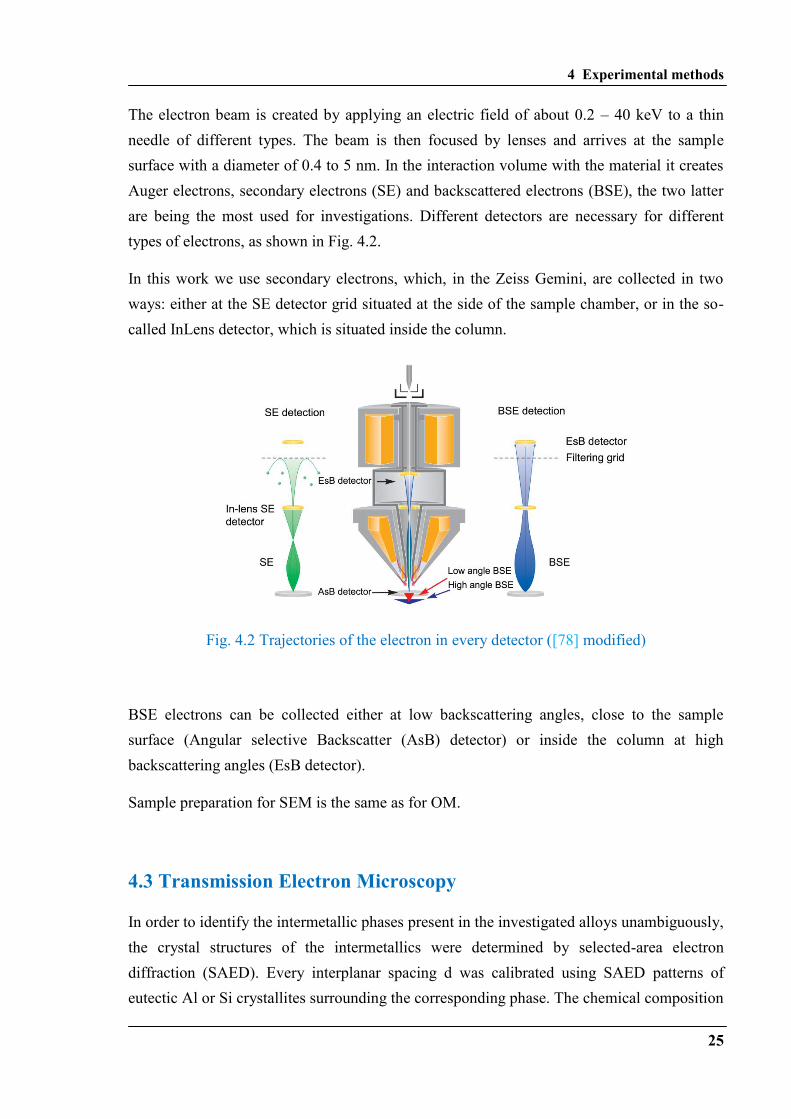
In this work we use secondary electrons, which, in the Zeiss Gemini, are collected in two
ways: either at the SE detector grid situated at the side of the sample chamber, or in the so-
called InLens detector, which is situated inside the column.
Fig. 4.2 Trajectories of the electron in every detector ([78] modified)
BSE electrons can be collected either at low backscattering angles, close to the sample
surface (Angular selective Backscatter (AsB) detector) or inside the column at high
backscattering angles (EsB detector).
Sample preparation for SEM is the same as for OM.
4.3 Transmission Electron Microscopy
In order to identify the intermetallic phases present in the investigated alloys unambiguously,
the crystal structures of the intermetallics were determined by selected-area electron
diffraction (SAED). Every interplanar spacing d was calibrated using SAED patterns of
eutectic Al or Si crystallites surrounding the corresponding phase. The chemical composition
4 Experimental methods
26
of the constituent phases was analyzed by TEM–EDX using a minimum of five
measurements for every intermetallic phase.
4.3.1 TEM system
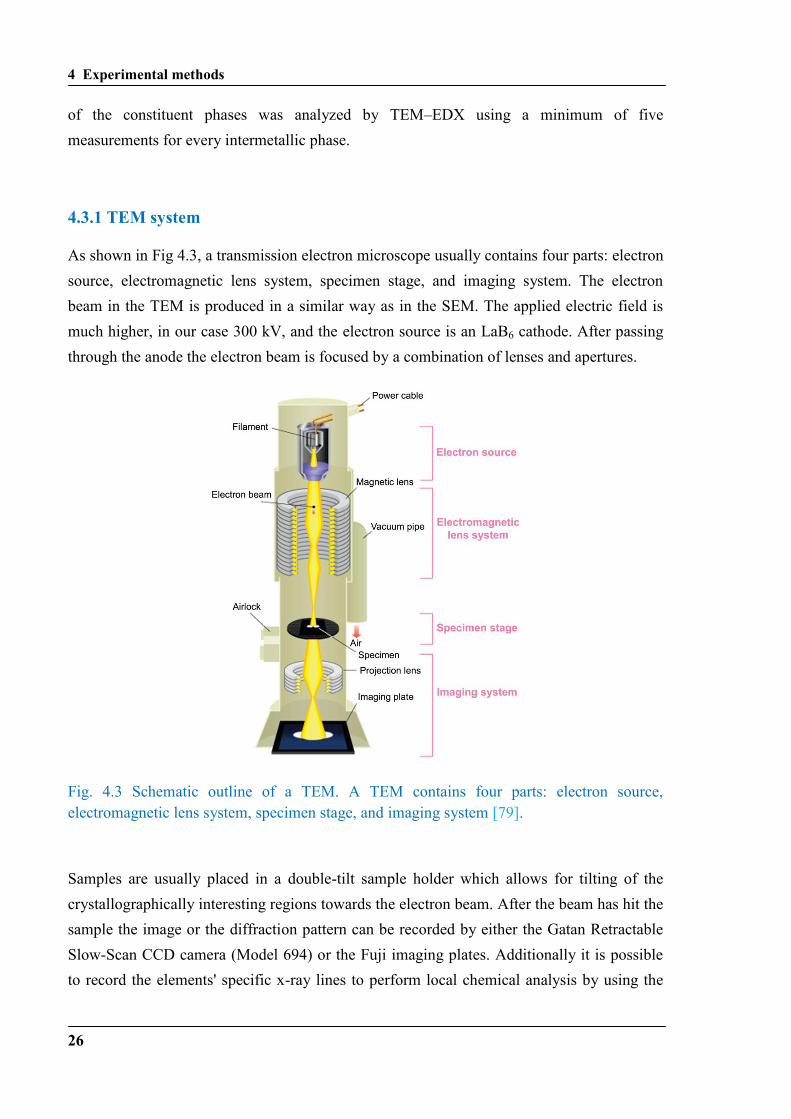
As shown in Fig 4.3, a transmission electron microscope usually contains four parts: electron
source, electromagnetic lens system, specimen stage, and imaging system. The electron
beam in the TEM is produced in a similar way as in the SEM. The applied electric field is
much higher, in our case 300 kV, and the electron source is an LaB6 cathode. After passing
through the anode the electron beam is focused by a combination of lenses and apertures.
Fig. 4.3 Schematic outline of a TEM. A TEM contains four parts: electron source,
electromagnetic lens system, specimen stage, and imaging system [79].
Samples are usually placed in a double-tilt sample holder which allows for tilting of the
crystallographically interesting regions towards the electron beam. After the beam has hit the
sample the image or the diffraction pattern can be recorded by either the Gatan Retractable
Slow-Scan CCD camera (Model 694) or the Fuji imaging plates. Additionally it is possible
to record the elements' specific x-ray lines to perform local chemical analysis by using the
4 Experimental methods
27
EDAX energy dispersive x-ray spectroscopy (EDX) detector, which is placed to the side and
above the specimen level.
In this work, a Philips CM30 TEM microscope operating at 300 kV and equipped with an
EDAX Genesis EDX system was used.
4.3.2 Sample preparation
A TEM specimen must be thin enough to let a sufficient number of electrons pass through to
form an image with minimum energy loss. Therefore specimen preparation is an important
aspect of TEM analysis. Samples for TEM investigation were prepared in two steps. In the
first step, they were cut into pieces of 1 × 1 mm2 area and mechanically ground to 30 μm
thickness using the T-tool technique [80]. In the second step, they were thinned to electron
transparency with a voltage of 5 kV by using Ar-ions at a current of 2.5 mA and an angle of
incidence of ± 6°. Ion milling was carried out in a Bal-Tec Res101 machine.
4.4 Focused Ion Beam
To obtain the morphology of intermetallic phases in three dimensions a serial sectioning
technique developed quite recently by means of FIB tomography has been used [19, 35-36].
Sample preparation is the same as in the SEM part.
4.4.1 FIB system
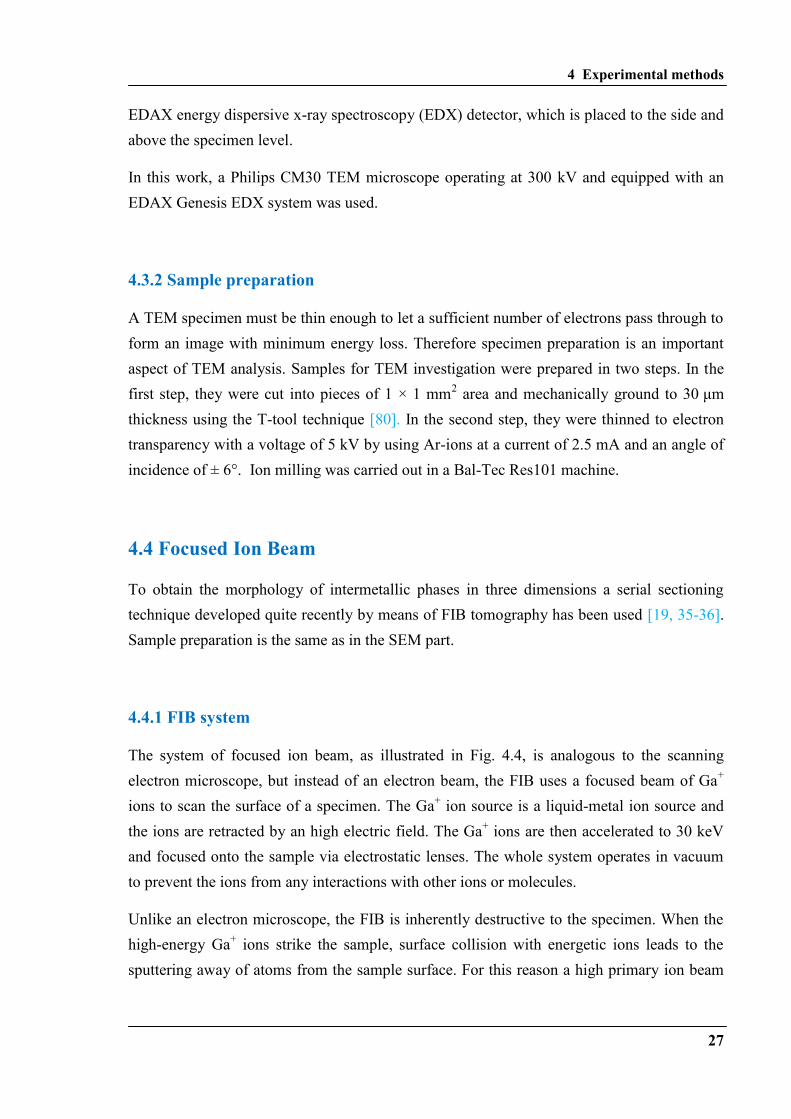
The system of focused ion beam, as illustrated in Fig. 4.4, is analogous to the scanning
electron microscope, but instead of an electron beam, the FIB uses a focused beam of Ga+
ions to scan the surface of a specimen. The Ga+ ion source is a liquid-metal ion source and
the ions are retracted by an high electric field. The Ga+ ions are then accelerated to 30 keV
and focused onto the sample via electrostatic lenses. The whole system operates in vacuum
to prevent the ions from any interactions with other ions or molecules.
Unlike an electron microscope, the FIB is inherently destructive to the specimen. When the
high-energy Ga+ ions strike the sample, surface collision with energetic ions leads to the
sputtering away of atoms from the sample surface. For this reason a high primary ion beam
4 Experimental methods
28
enables a precise material milling and cutting of slices from the sample surface in a
controlled way.
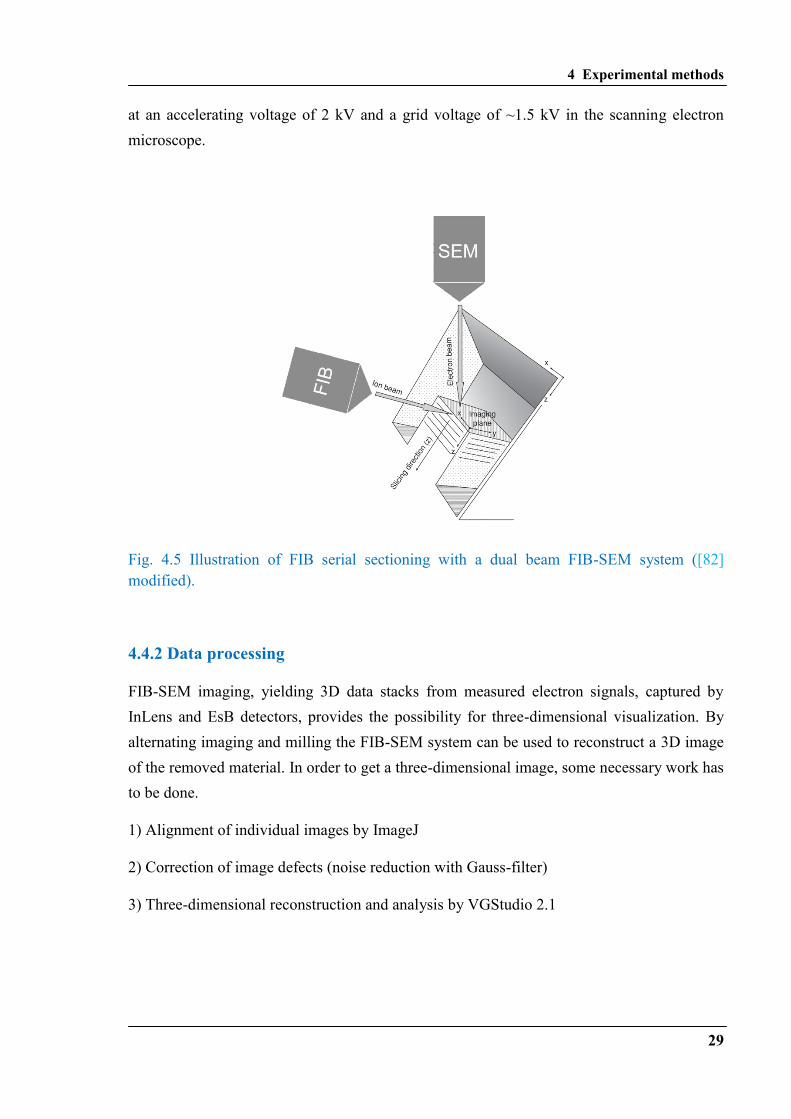
For the current FIB tomography experiment, a Zeiss 1540EsB CrossBeam® workstation was
used. This workstation combines a FIB column and an additional SEM column. This
combination allows one to simultaneously use the FIB for milling and the SEM for high-
resolution imaging. As illustrated in Fig 4.5, the FIB, which is positioned perpendicular to
the milling direction of sample, is set at 54° with the SEM. As a result, the serial cross-
Fig 4.4 Schematic diagram of a FIB system [81]
section plane of the sample prepared by FIB serial milling and serial sectioning normal to the
sample surface can be characterized by the SEM to obtain serial two-dimensional
information. Slices of about 20 nm thickness were cut with a 30 keV Ga+ ion beam and an
ion current of 500 pA. The SEM used in the FIB-SEM system is the same as the one that we
mentioned in chapter 4.2, the detectors used for SEM in the FIB tomography system are the
Inlens and the EsB detectors mentioned before. Inlens and EsB electron detectors were used
4 Experimental methods
29
at an accelerating voltage of 2 kV and a grid voltage of ~1.5 kV in the scanning electron
microscope.
Fig. 4.5 Illustration of FIB serial sectioning with a dual beam FIB-SEM system ([82]
modified).
4.4.2 Data processing
FIB-SEM imaging, yielding 3D data stacks from measured electron signals, captured by
InLens and EsB detectors, provides the possibility for three-dimensional visualization. By
alternating imaging and milling the FIB-SEM system can be used to reconstruct a 3D image
of the removed material. In order to get a three-dimensional image, some necessary work has
to be done.
1) Alignment of individual images by ImageJ
2) Correction of image defects (noise reduction with Gauss-filter)
3) Three-dimensional reconstruction and analysis by VGStudio 2.1
4 Experimental methods
30
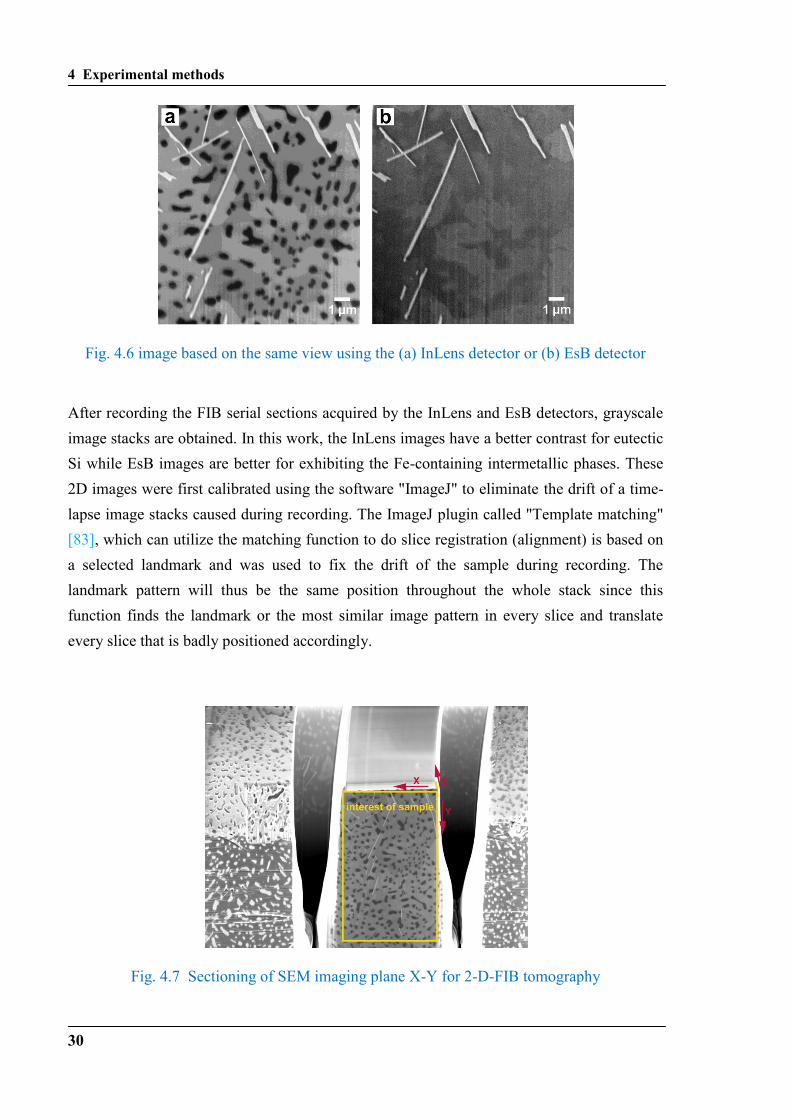
Fig. 4.6 image based on the same view using the (a) InLens detector or (b) EsB detector
After recording the FIB serial sections acquired by the InLens and EsB detectors, grayscale
image stacks are obtained. In this work, the InLens images have a better contrast for eutectic
Si while EsB images are better for exhibiting the Fe-containing intermetallic phases. These
2D images were first calibrated using the software "ImageJ" to eliminate the drift of a time-
lapse image stacks caused during recording. The ImageJ plugin called "Template matching"
[83], which can utilize the matching function to do slice registration (alignment) is based on
a selected landmark and was used to fix the drift of the sample during recording. The
landmark pattern will thus be the same position throughout the whole stack since this
function finds the landmark or the most similar image pattern in every slice and translate
every slice that is badly positioned accordingly.
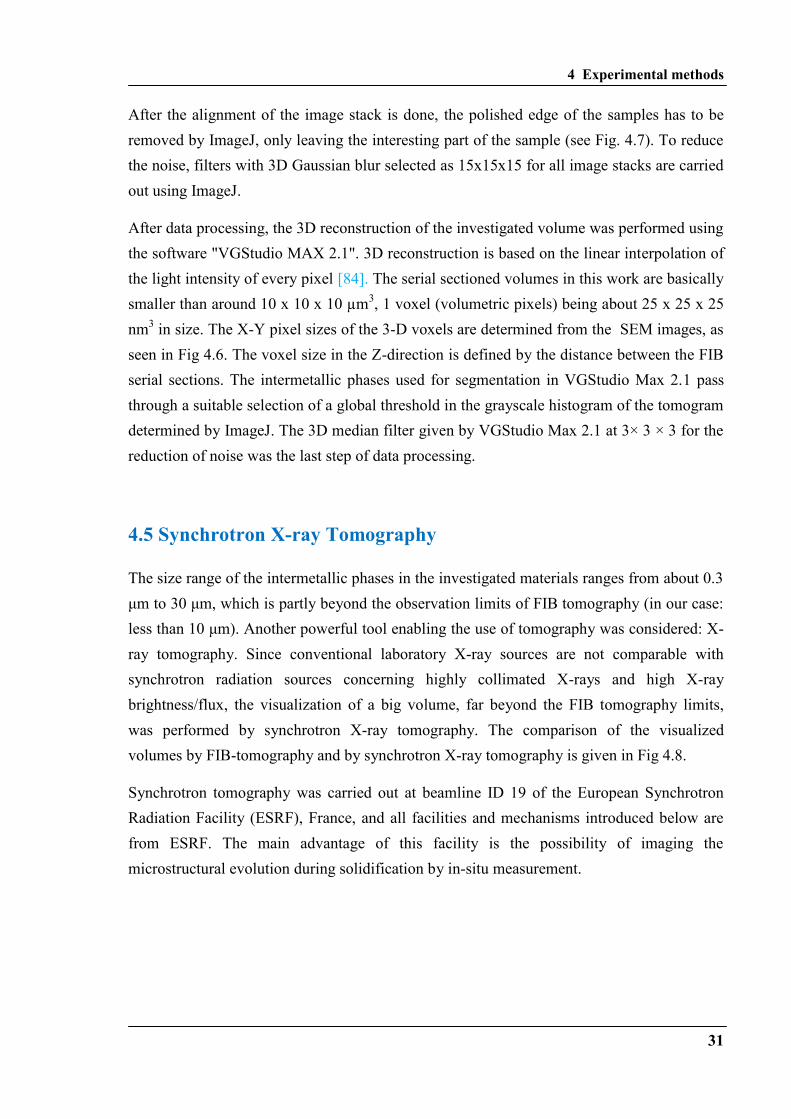
Fig. 4.7 Sectioning of SEM imaging plane X-Y for 2-D-FIB tomography
4 Experimental methods
31
After the alignment of the image stack is done, the polished edge of the samples has to be
removed by ImageJ, only leaving the interesting part of the sample (see Fig. 4.7). To reduce
the noise, filters with 3D Gaussian blur selected as 15x15x15 for all image stacks are carried
out using ImageJ.
After data processing, the 3D reconstruction of the investigated volume was performed using
the software "VGStudio MAX 2.1". 3D reconstruction is based on the linear interpolation of
the light intensity of every pixel [84]. The serial sectioned volumes in this work are basically
smaller than around 10 x 10 x 10 µm3, 1 voxel (volumetric pixels) being about 25 x 25 x 25
nm3 in size. The X-Y pixel sizes of the 3-D voxels are determined from the SEM images, as
seen in Fig 4.6. The voxel size in the Z-direction is defined by the distance between the FIB
serial sections. The intermetallic phases used for segmentation in VGStudio Max 2.1 pass
through a suitable selection of a global threshold in the grayscale histogram of the tomogram
determined by ImageJ. The 3D median filter given by VGStudio Max 2.1 at 3× 3 × 3 for the
reduction of noise was the last step of data processing.
4.5 Synchrotron X-ray Tomography
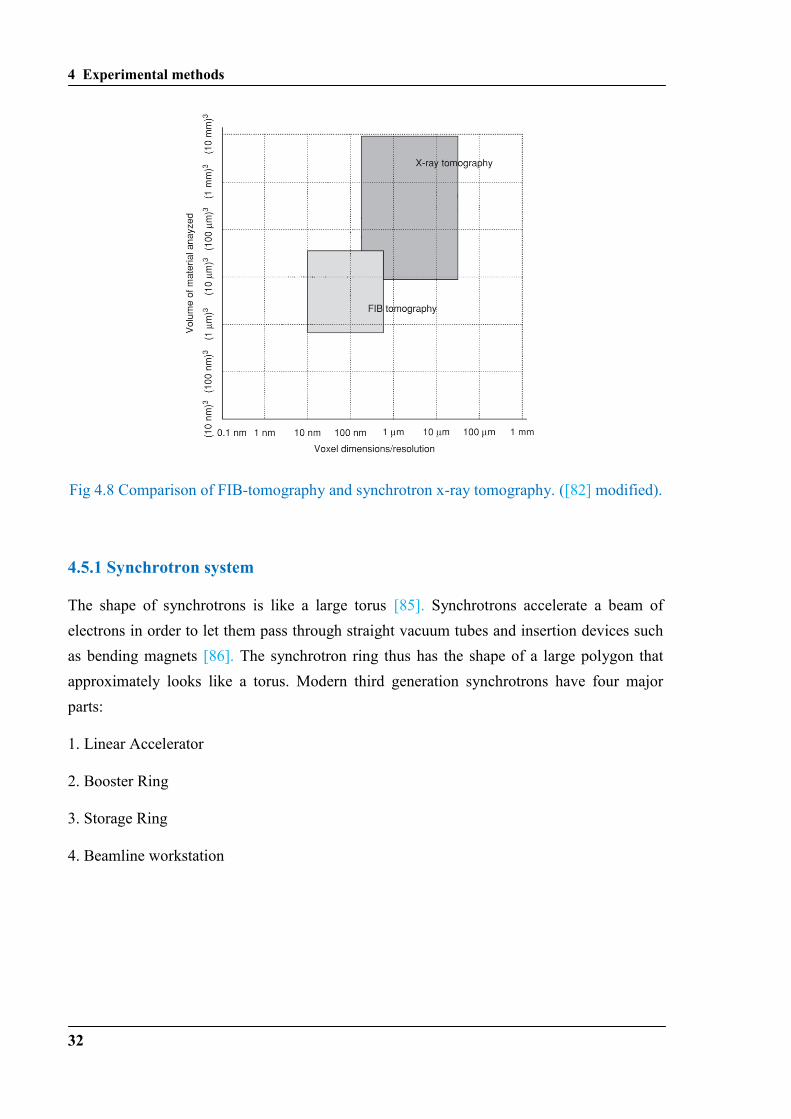
The size range of the intermetallic phases in the investigated materials ranges from about 0.3
μm to 30 μm, which is partly beyond the observation limits of FIB tomography (in our case:
less than 10 μm). Another powerful tool enabling the use of tomography was considered: X-
ray tomography. Since conventional laboratory X-ray sources are not comparable with
synchrotron radiation sources concerning highly collimated X-rays and high X-ray
brightness/flux, the visualization of a big volume, far beyond the FIB tomography limits,
was performed by synchrotron X-ray tomography. The comparison of the visualized
volumes by FIB-tomography and by synchrotron X-ray tomography is given in Fig 4.8.
Synchrotron tomography was carried out at beamline ID 19 of the European Synchrotron
Radiation Facility (ESRF), France, and all facilities and mechanisms introduced below are
from ESRF. The main advantage of this facility is the possibility of imaging the
microstructural evolution during solidification by in-situ measurement.
4 Experimental methods
32
Fig 4.8 Comparison of FIB-tomography and synchrotron x-ray tomography. ([82] modified).
4.5.1 Synchrotron system
The shape of synchrotrons is like a large torus [85]. Synchrotrons accelerate a beam of
electrons in order to let them pass through straight vacuum tubes and insertion devices such
as bending magnets [86]. The synchrotron ring thus has the shape of a large polygon that
approximately looks like a torus. Modern third generation synchrotrons have four major
parts:
1. Linear Accelerator
2. Booster Ring
3. Storage Ring
4. Beamline workstation
4 Experimental methods
33
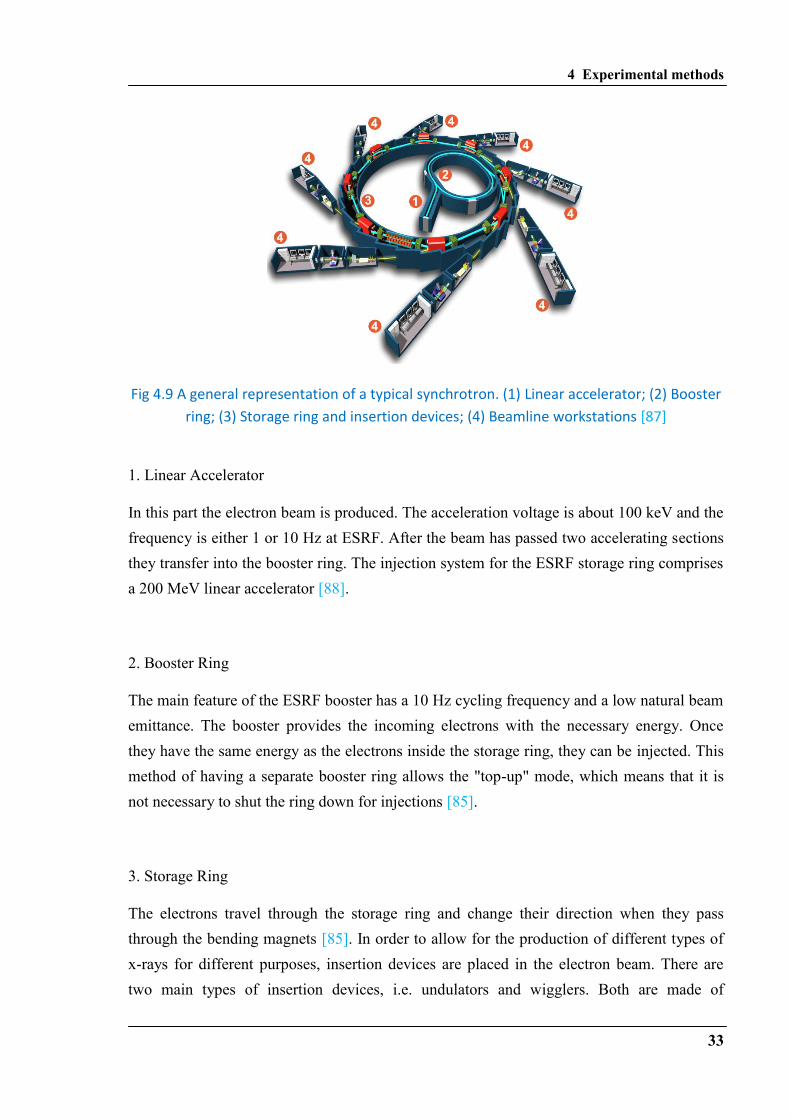
Fig 4.9 A general representation of a typical synchrotron. (1) Linear accelerator; (2) Booster
ring; (3) Storage ring and insertion devices; (4) Beamline workstations [87]
1. Linear Accelerator
In this part the electron beam is produced. The acceleration voltage is about 100 keV and the
frequency is either 1 or 10 Hz at ESRF. After the beam has passed two accelerating sections
they transfer into the booster ring. The injection system for the ESRF storage ring comprises
a 200 MeV linear accelerator [88].
2. Booster Ring
The main feature of the ESRF booster has a 10 Hz cycling frequency and a low natural beam
emittance. The booster provides the incoming electrons with the necessary energy. Once
they have the same energy as the electrons inside the storage ring, they can be injected. This
method of having a separate booster ring allows the "top-up" mode, which means that it is
not necessary to shut the ring down for injections [85].
3. Storage Ring
The electrons travel through the storage ring and change their direction when they pass
through the bending magnets [85]. In order to allow for the production of different types of
x-rays for different purposes, insertion devices are placed in the electron beam. There are
two main types of insertion devices, i.e. undulators and wigglers. Both are made of
4 Experimental methods
34
permanent magnets, like a series of alternating bending magnets, and they incite a sinusoidal
oscillation of the electrons. This allows for the creation of x-rays in every part of the
trajectory where the electron changes its direction [89]. The difference between the two lies
in the force of the magnets and thus in the type of the created x-ray spectra: wigglers use
strong magnets, which induce a high deviation from the initial trajectory of the electrons.
The created x-rays form a high angle with the axis of the wiggler and thus cannot interfere
with each other. This implies a broad x-ray spectrum. The aim of the undulator, however, is
to provoke interference of the x-rays, which is made possible by smaller deviation angles.
This implies a smaller photon energy, but a higher brilliance and a sharp spectrum. In this
work we have used a beamline that can use up to four undulators and one wiggler.
The storage ring at the ESRF has a circumference of 844.4 m and an electron energy of 6
GeV [88].
4. Beamline workstation
This is the final part of the synchrotron, the one which is used for research. This end station
can be close to the ring, or, in case of ID19 that we used in our work, several meters away.
The long distance allows for a good focusing of the beam. Monochromators can be used to
choose the wavelength of the beam that is used for experiments. In this work, the beamline
workstation of ID 19 was used for microtomography imaging.
4.5.2 Synchrotron X-ray tomography beamline
Synchrotron X-ray tomography is a non-destructive imaging technique that enables three-
dimensional analysis of the microstructural interior of materials with a high spatial
resolution. The basis of X-ray tomography is X-ray radiography, which has the same
principle as the medical scanner, but with a higher resolution. For tomography, a series of
radiographs are collected during sample rotating through 180°. This produces a set of
projections that can be reconstructed to reveal the 3D structure of the sample [90].
The set-up for our synchrotron tomography at ID19 is illustrated in Fig 4.10. The X-ray
beam, coming from the synchrotron ring and improved by a series of up to four undulators
and one wiggler (as discussed in last section) is used to illuminate the sample. The
transmitted beam, after having been attenuated by the sample, is recorded with a CCD
4 Experimental methods
35
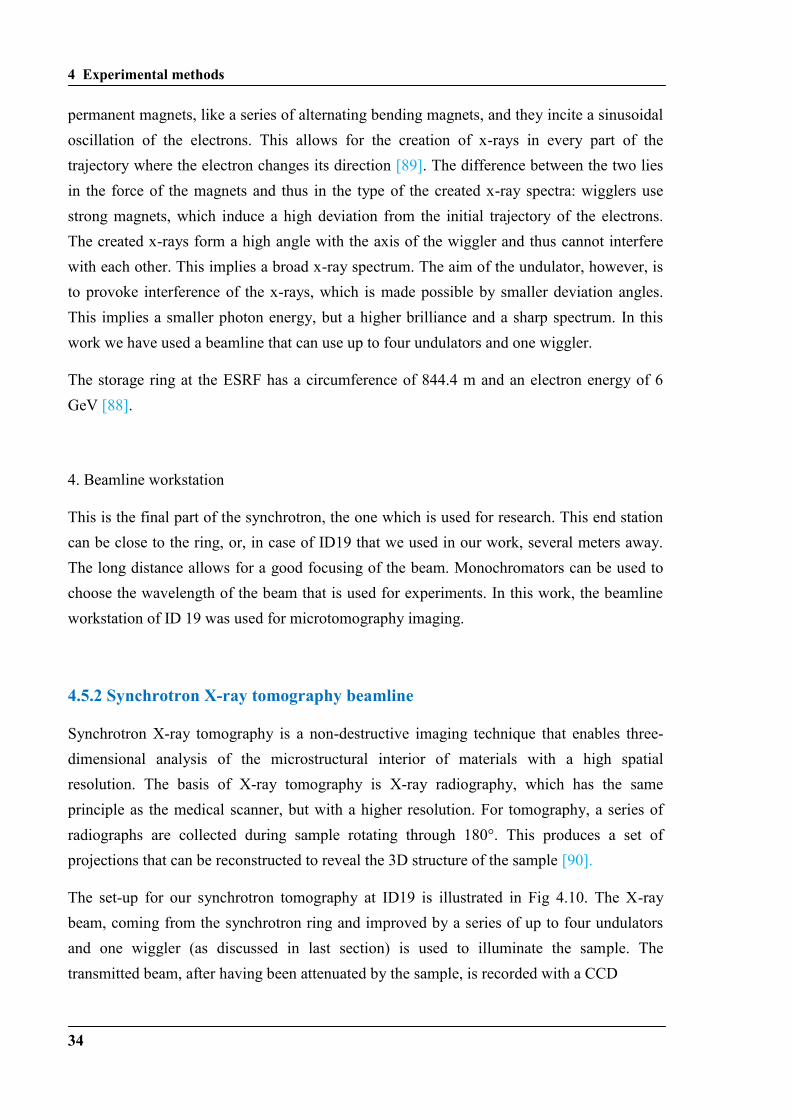
Fig 4.10 Set up for synchrotron tomography
camera. A most important device in the setup is the high-resolution detector that consists of
a luminescent screen coupled to a cooled CCD by magnifying optics. The camera at ID 19
(FreLoN: fast readout low noise [91]) has 2048 x 2048 pixels with a fast readout (0.22
frame/s), low dark current (3 electrons/s) and low readout noise (22 electrons). The optimum
resolution is of the order of ~1 μm. The applied beam energy at the measurement was 20.5
keV and the distance between sample and detector was 90 mm.
4.5.3 Sample measurement
A small cylindrical pin sample (3.2 mm long, 1.5 mm in diameter) was machined from the
casting and used in the synchrotron tomography solidification experiment. For the
experiment, the sample was glued with zirconia paste to the top of an alumina rod placed on
the rotating stage. During melting and solidification, the sample was supported by its own
oxide skin, i.e. no container was used.
Three-dimensional visualization was carried out by ex-situ and especially in-situ synchrotron
tomography experiments to image the density, the shape, the location and the
interconnection of the intermetallic phases. This is a strong tool for gaining insight into the
morphology of the precipitates and their spatial arrangement. Samples were heated up and
in-situ measurements were the performed on the cooling samples. The experiments can be
classified into two groups: 1) slowing cooling rate; 2) fast cooling rate.
1) Slow cooling rate:
4 Experimental methods
36
In this part, samples were first gradually heated (at 20 K/min) to 666 °C and then held for 5
minutes at this temperature to ensure complete melting and homogenization. Then the
samples were cooled separately at a rate of 1 K/min, 9 K/min and 30 K/min down to 450 °C
while microtomography image data was gathered throughout the complete cooling process.
The low cooling rate is necessary to ensure that the microstructure does not evolve too much
during image acquisition. The entire cooling process took 221 minutes, 24 minutes and 7.2
minutes separately corresponding to above each cooling rates, leaving enough time for a
sufficient number of high-resolution tomographs. The parameters used are listed below in
detail:
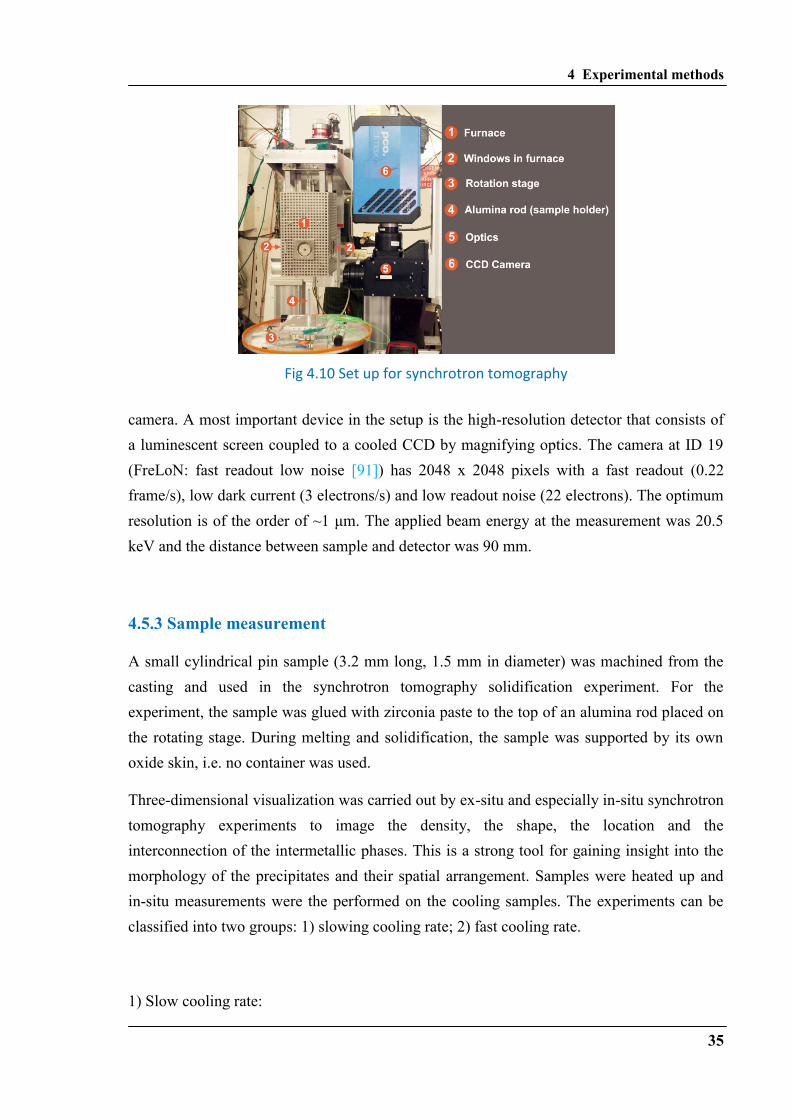
Table 4.1 Parameters of the in-situ synchrotron tomography measurements with a slow
cooling rate.
Scan Parameter
Numbers of projections per scan 1000
Duration of one scan 60s
Scan angle range 180°
Number of scans 216
Number of turns between scans 1
Download data between scans 1
(region of interest): X-axis 1632 pixels
(region of interest): Y-axis 1632 pixels
Numbers of dark images (no beam) 20
Numbers of flat images (without sample) 21
Numbers of dark images before scan 1
Numbers of flat images before scan 1
2) Fast cooling rate:
The fast cooling rate measurements differ from the slow cooling rate experiments by the
cooling rate for solidification and the associated scanning parameters. Samples were first
gradually heated (at 20 K/min) to 700 °C to ensure complete melting and homogenization
(sample temperature measured by a type K thermocouple located close to the sample). Then
the samples were cooled at a rate of 400 K/min down to 450 °C (solidus temperature) while
microtomography image data was gathered throughout the complete cooling process. This
fast cooling rate is close to commercial casting condition. The entire cooling process, down
to room temperature takes about 10 minutes.
The parameters that we used are listed below in detail:
4 Experimental methods
37
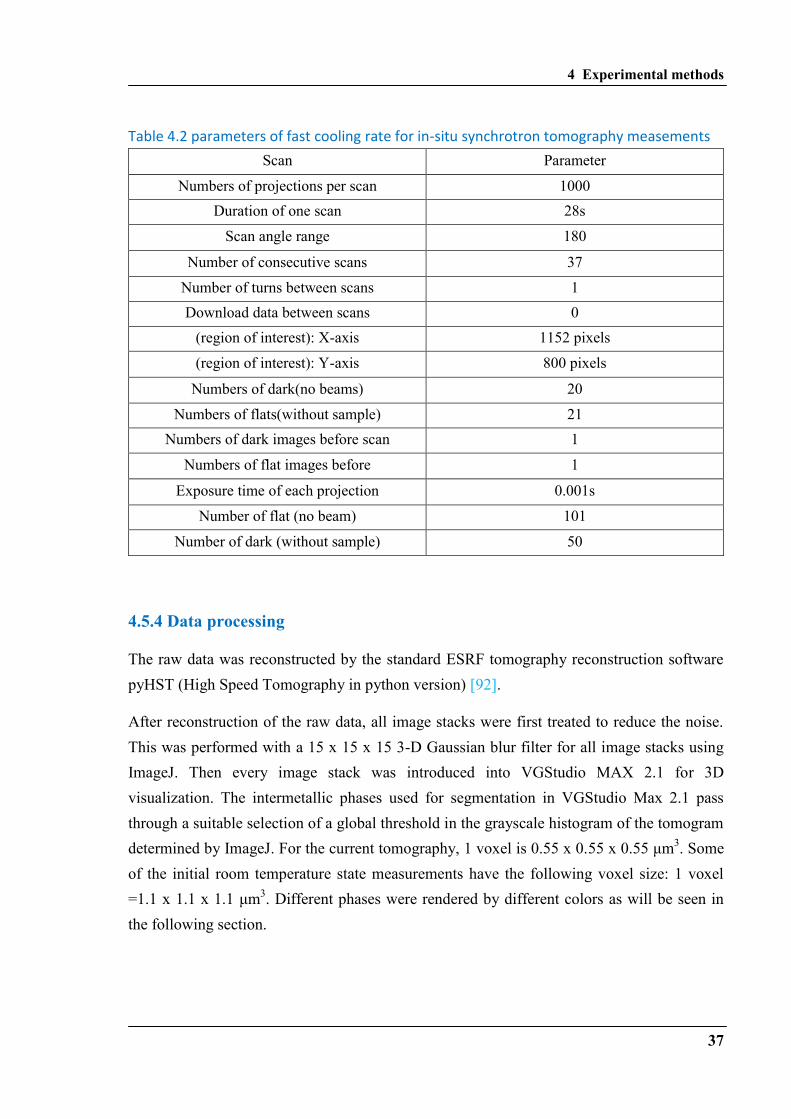
Table 4.2 parameters of fast cooling rate for in-situ synchrotron tomography measements
Scan Parameter
Numbers of projections per scan 1000
Duration of one scan 28s
Scan angle range 180
Number of consecutive scans 37
Number of turns between scans 1
Download data between scans 0
(region of interest): X-axis 1152 pixels
(region of interest): Y-axis 800 pixels
Numbers of dark(no beams) 20
Numbers of flats(without sample) 21
Numbers of dark images before scan 1
Numbers of flat images before 1
Exposure time of each projection 0.001s
Number of flat (no beam) 101
Number of dark (without sample) 50
4.5.4 Data processing
The raw data was reconstructed by the standard ESRF tomography reconstruction software
pyHST (High Speed Tomography in python version) [92].
After reconstruction of the raw data, all image stacks were first treated to reduce the noise.
This was performed with a 15 x 15 x 15 3-D Gaussian blur filter for all image stacks using
ImageJ. Then every image stack was introduced into VGStudio MAX 2.1 for 3D
visualization. The intermetallic phases used for segmentation in VGStudio Max 2.1 pass
through a suitable selection of a global threshold in the grayscale histogram of the tomogram
determined by ImageJ. For the current tomography, 1 voxel is 0.55 x 0.55 x 0.55 μm3. Some
of the initial room temperature state measurements have the following voxel size: 1 voxel
=1.1 x 1.1 x 1.1 μm3. Different phases were rendered by different colors as will be seen in
the following section.

4 Experimental methods
38
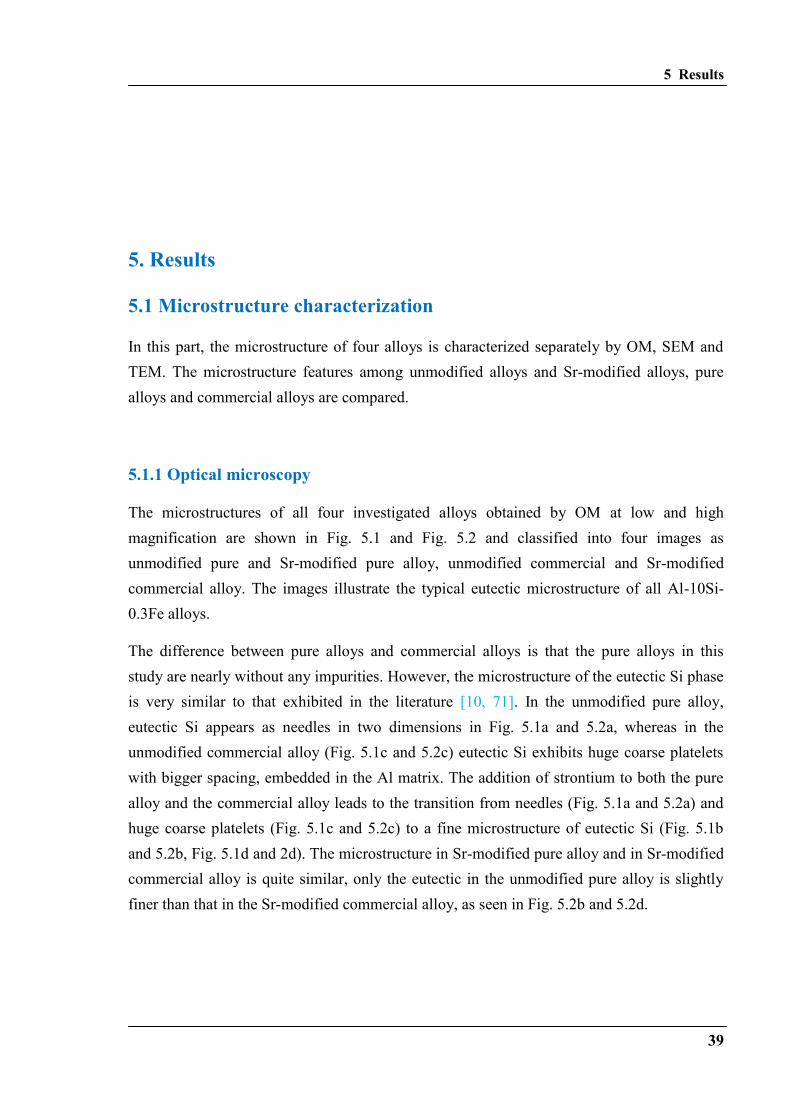
5 Results
39
5. Results
5.1 Microstructure characterization
In this part, the microstructure of four alloys is characterized separately by OM, SEM and
TEM. The microstructure features among unmodified alloys and Sr-modified alloys, pure
alloys and commercial alloys are compared.
5.1.1 Optical microscopy
The microstructures of all four investigated alloys obtained by OM at low and high
magnification are shown in Fig. 5.1 and Fig. 5.2 and classified into four images as
unmodified pure and Sr-modified pure alloy, unmodified commercial and Sr-modified
commercial alloy. The images illustrate the typical eutectic microstructure of all Al-10Si-
0.3Fe alloys.
The difference between pure alloys and commercial alloys is that the pure alloys in this
study are nearly without any impurities. However, the microstructure of the eutectic Si phase
is very similar to that exhibited in the literature [10, 71]. In the unmodified pure alloy,
eutectic Si appears as needles in two dimensions in Fig. 5.1a and 5.2a, whereas in the
unmodified commercial alloy (Fig. 5.1c and 5.2c) eutectic Si exhibits huge coarse platelets
with bigger spacing, embedded in the Al matrix. The addition of strontium to both the pure
alloy and the commercial alloy leads to the transition from needles (Fig. 5.1a and 5.2a) and
huge coarse platelets (Fig. 5.1c and 5.2c) to a fine microstructure of eutectic Si (Fig. 5.1b
and 5.2b, Fig. 5.1d and 2d). The microstructure in Sr-modified pure alloy and in Sr-modified
commercial alloy is quite similar, only the eutectic in the unmodified pure alloy is slightly
finer than that in the Sr-modified commercial alloy, as seen in Fig. 5.2b and 5.2d.

5 Results
40
Fig. 5.1. Optical micrographs of the microstructure of (a) unmodified pure and (b) Sr-
modified pure, (c) unmodified commercial and (d) Sr-modified commercial Al-10Si-0.3Fe
alloys. (Al matrix in bright gray; eutectic Si in black; intermetallics in dark gray)
While the OM images of all alloys in Fig. 5.1 and Fig. 5.2 clearly show primary Al dendrites
as bright regions, the intermetallic phases are difficult to distinguish because of the low
contrast difference to eutectic Si (both dark in contrast). In order to observe intermetallic
phases more clearly, SEM has been used.
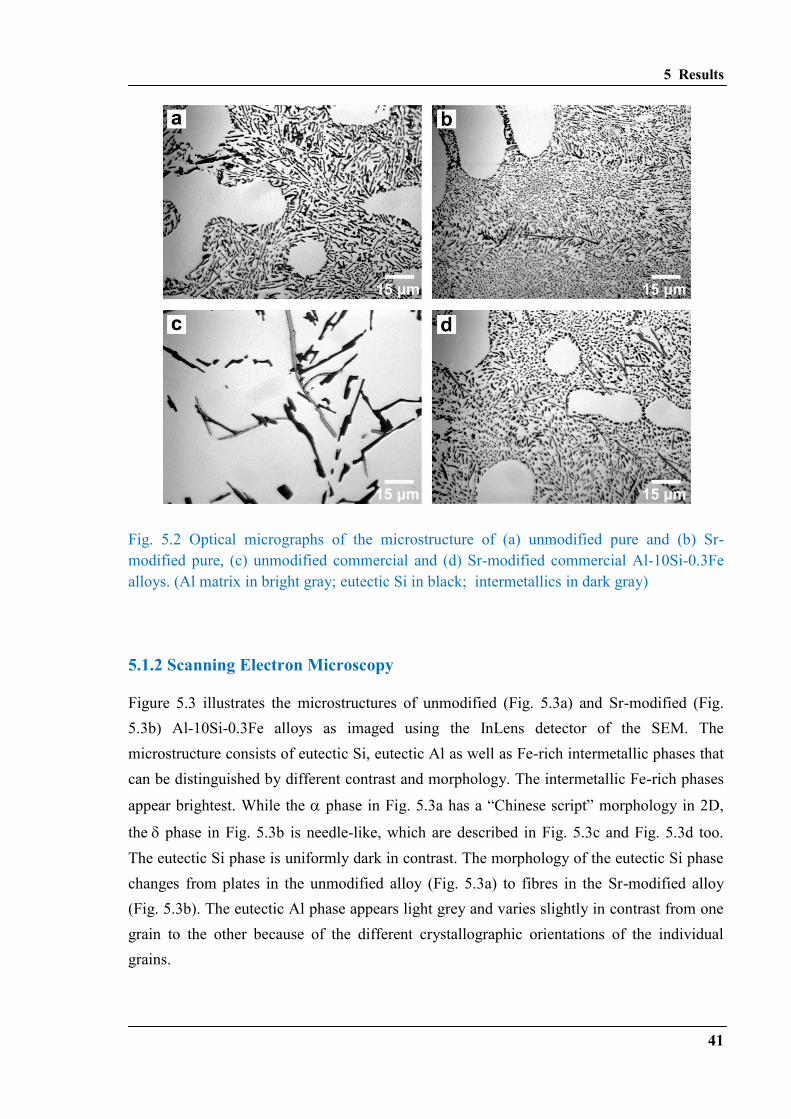
5 Results
41
Fig. 5.2 Optical micrographs of the microstructure of (a) unmodified pure and (b) Sr-
modified pure, (c) unmodified commercial and (d) Sr-modified commercial Al-10Si-0.3Fe
alloys. (Al matrix in bright gray; eutectic Si in black; intermetallics in dark gray)
5.1.2 Scanning Electron Microscopy
Figure 5.3 illustrates the microstructures of unmodified (Fig. 5.3a) and Sr-modified (Fig.
5.3b) Al-10Si-0.3Fe alloys as imaged using the InLens detector of the SEM. The
microstructure consists of eutectic Si, eutectic Al as well as Fe-rich intermetallic phases that
can be distinguished by different contrast and morphology. The intermetallic Fe-rich phases
appear brightest. While the phase in Fig. 5.3a has a “Chinese script” morphology in 2D,
the phase in Fig. 5.3b is needle-like, which are described in Fig. 5.3c and Fig. 5.3d too.
The eutectic Si phase is uniformly dark in contrast. The morphology of the eutectic Si phase
changes from plates in the unmodified alloy (Fig. 5.3a) to fibres in the Sr-modified alloy
(Fig. 5.3b). The eutectic Al phase appears light grey and varies slightly in contrast from one
grain to the other because of the different crystallographic orientations of the individual
grains.
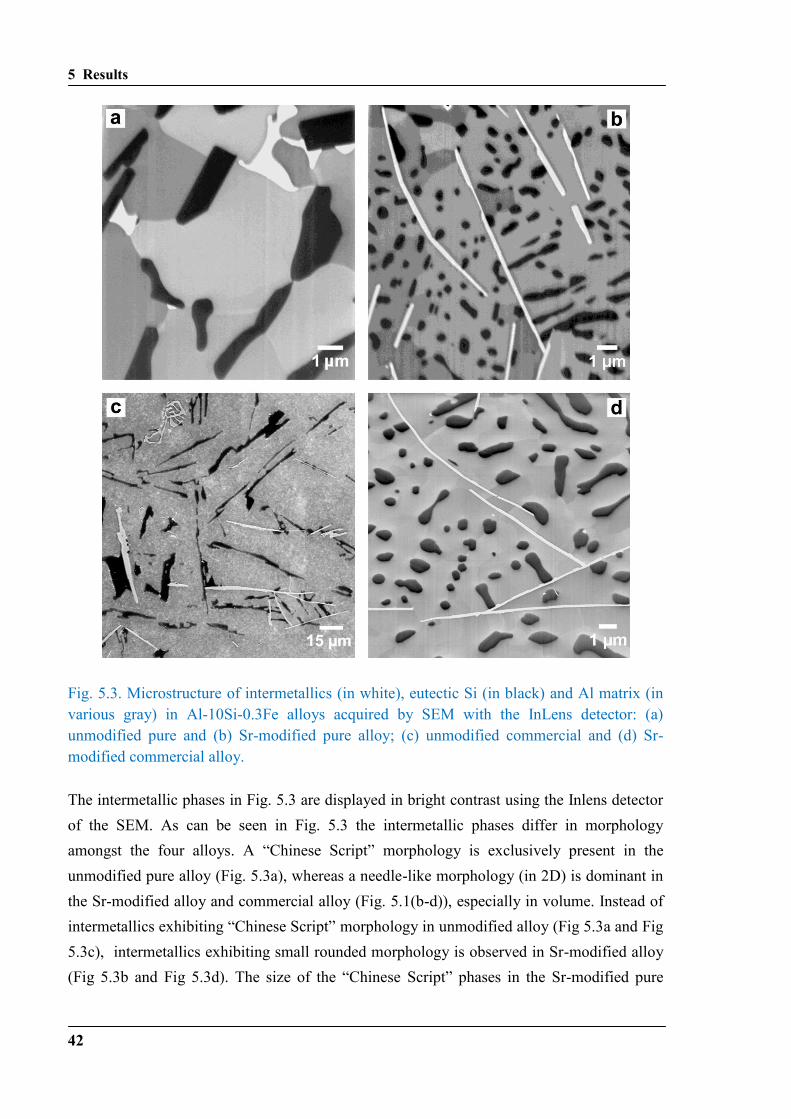
5 Results
42
Fig. 5.3. Microstructure of intermetallics (in white), eutectic Si (in black) and Al matrix (in
various gray) in Al-10Si-0.3Fe alloys acquired by SEM with the InLens detector: (a)
unmodified pure and (b) Sr-modified pure alloy; (c) unmodified commercial and (d) Sr-
modified commercial alloy.
The intermetallic phases in Fig. 5.3 are displayed in bright contrast using the Inlens detector
of the SEM. As can be seen in Fig. 5.3 the intermetallic phases differ in morphology
amongst the four alloys. A “Chinese Script” morphology is exclusively present in the
unmodified pure alloy (Fig. 5.3a), whereas a needle-like morphology (in 2D) is dominant in
the Sr-modified alloy and commercial alloy (Fig. 5.1(b-d)), especially in volume. Instead of
intermetallics exhibiting “Chinese Script” morphology in unmodified alloy (Fig 5.3a and Fig
5.3c), intermetallics exhibiting small rounded morphology is observed in Sr-modified alloy
(Fig 5.3b and Fig 5.3d). The size of the “Chinese Script” phases in the Sr-modified pure
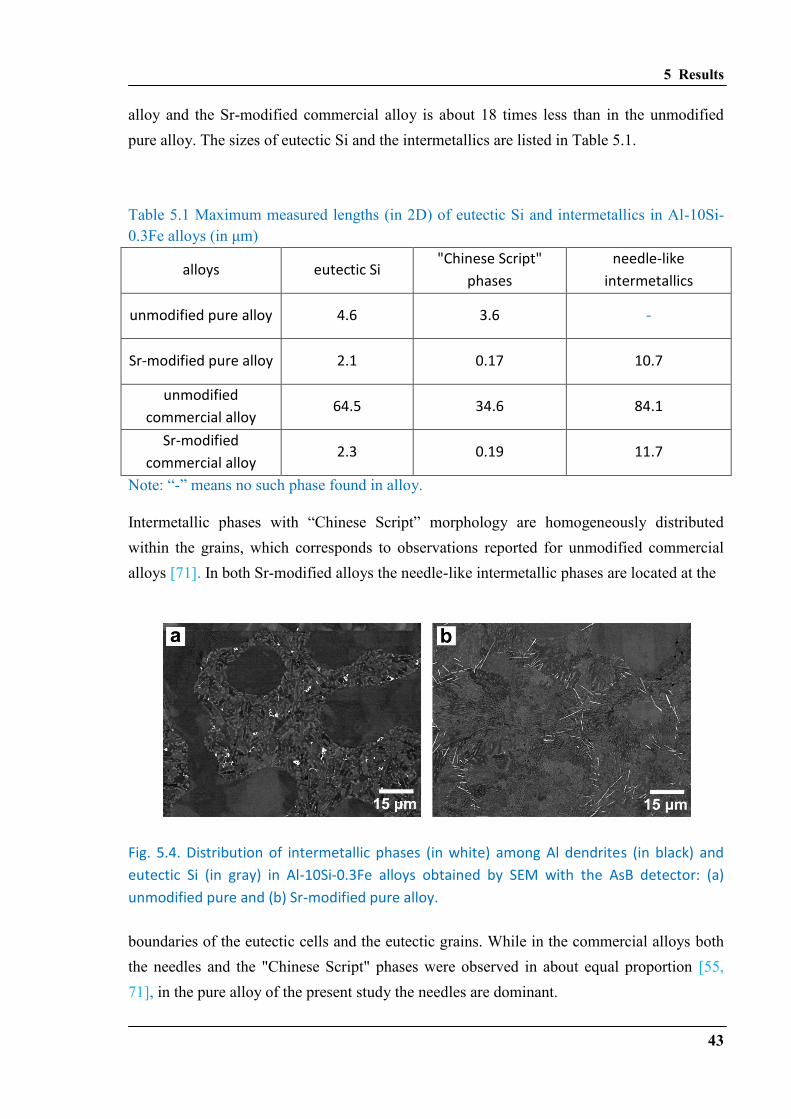
5 Results
43
alloy and the Sr-modified commercial alloy is about 18 times less than in the unmodified
pure alloy. The sizes of eutectic Si and the intermetallics are listed in Table 5.1.
Table 5.1 Maximum measured lengths (in 2D) of eutectic Si and intermetallics in Al-10Si-
0.3Fe alloys (in μm)
alloys eutectic Si "Chinese Script"
phases
needle-like
intermetallics
unmodified pure alloy 4.6 3.6 -
Sr-modified pure alloy 2.1 0.17 10.7
unmodified
commercial alloy 64.5 34.6 84.1
Sr-modified
commercial alloy 2.3 0.19 11.7
Note: “-” means no such phase found in alloy.
Intermetallic phases with “Chinese Script” morphology are homogeneously distributed
within the grains, which corresponds to observations reported for unmodified commercial
alloys [71]. In both Sr-modified alloys the needle-like intermetallic phases are located at the
Fig. 5.4. Distribution of intermetallic phases (in white) among Al dendrites (in black) and
eutectic Si (in gray) in Al-10Si-0.3Fe alloys obtained by SEM with the AsB detector: (a)
unmodified pure and (b) Sr-modified pure alloy.
boundaries of the eutectic cells and the eutectic grains. While in the commercial alloys both
the needles and the "Chinese Script" phases were observed in about equal proportion [55,
71], in the pure alloy of the present study the needles are dominant.
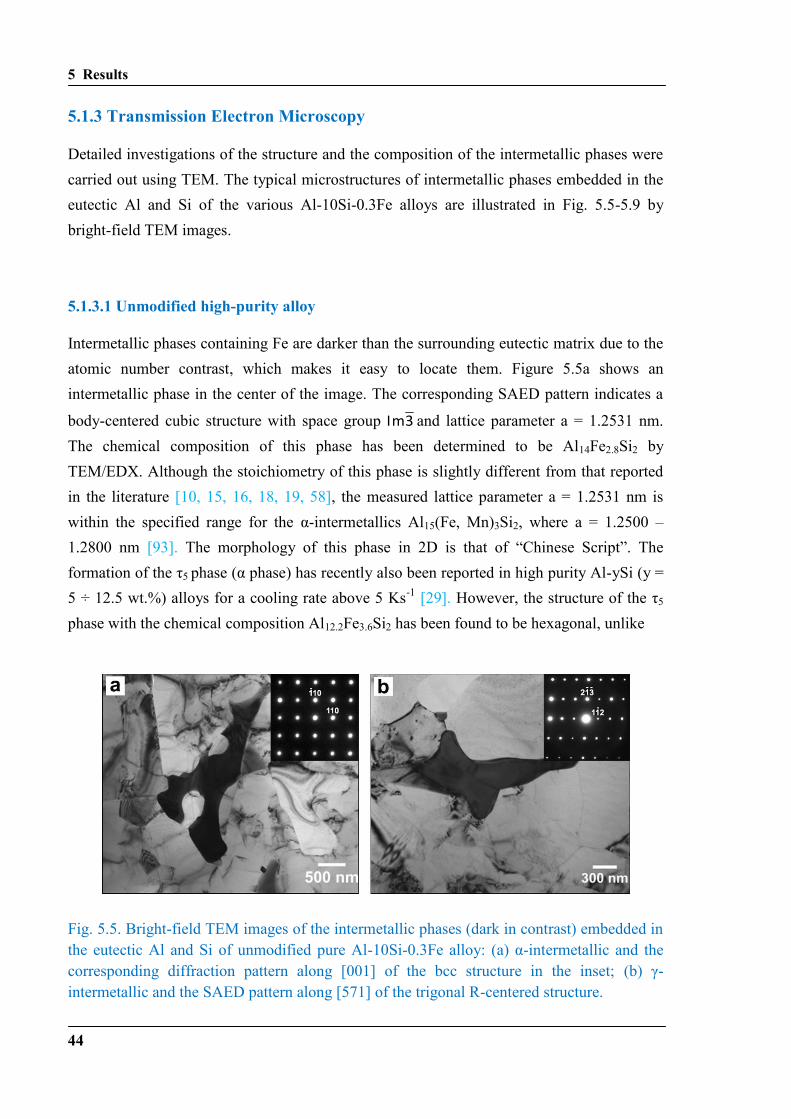
5 Results
44
5.1.3 Transmission Electron Microscopy
Detailed investigations of the structure and the composition of the intermetallic phases were
carried out using TEM. The typical microstructures of intermetallic phases embedded in the
eutectic Al and Si of the various Al-10Si-0.3Fe alloys are illustrated in Fig. 5.5-5.9 by
bright-field TEM images.
5.1.3.1 Unmodified high-purity alloy
Intermetallic phases containing Fe are darker than the surrounding eutectic matrix due to the
atomic number contrast, which makes it easy to locate them. Figure 5.5a shows an
intermetallic phase in the center of the image. The corresponding SAED pattern indicates a
body-centered cubic structure with space group 3Im and lattice parameter a = 1.2531 nm.
The chemical composition of this phase has been determined to be Al14Fe2.8Si2 by
TEM/EDX. Although the stoichiometry of this phase is slightly different from that reported
in the literature [10, 15, 16, 18, 19, 58], the measured lattice parameter a = 1.2531 nm is
within the specified range for the α-intermetallics Al15(Fe, Mn)3Si2, where a = 1.2500 –
1.2800 nm [93]. The morphology of this phase in 2D is that of “Chinese Script”. The
formation of the τ5 phase (α phase) has recently also been reported in high purity Al-ySi (y =
5 ÷ 12.5 wt.%) alloys for a cooling rate above 5 Ks-1
[29]. However, the structure of the τ5
phase with the chemical composition Al12.2Fe3.6Si2 has been found to be hexagonal, unlike
Fig. 5.5. Bright-field TEM images of the intermetallic phases (dark in contrast) embedded in
the eutectic Al and Si of unmodified pure Al-10Si-0.3Fe alloy: (a) α-intermetallic and the
corresponding diffraction pattern along [001] of the bcc structure in the inset; (b) γ-
intermetallic and the SAED pattern along [571] of the trigonal R-centered structure.
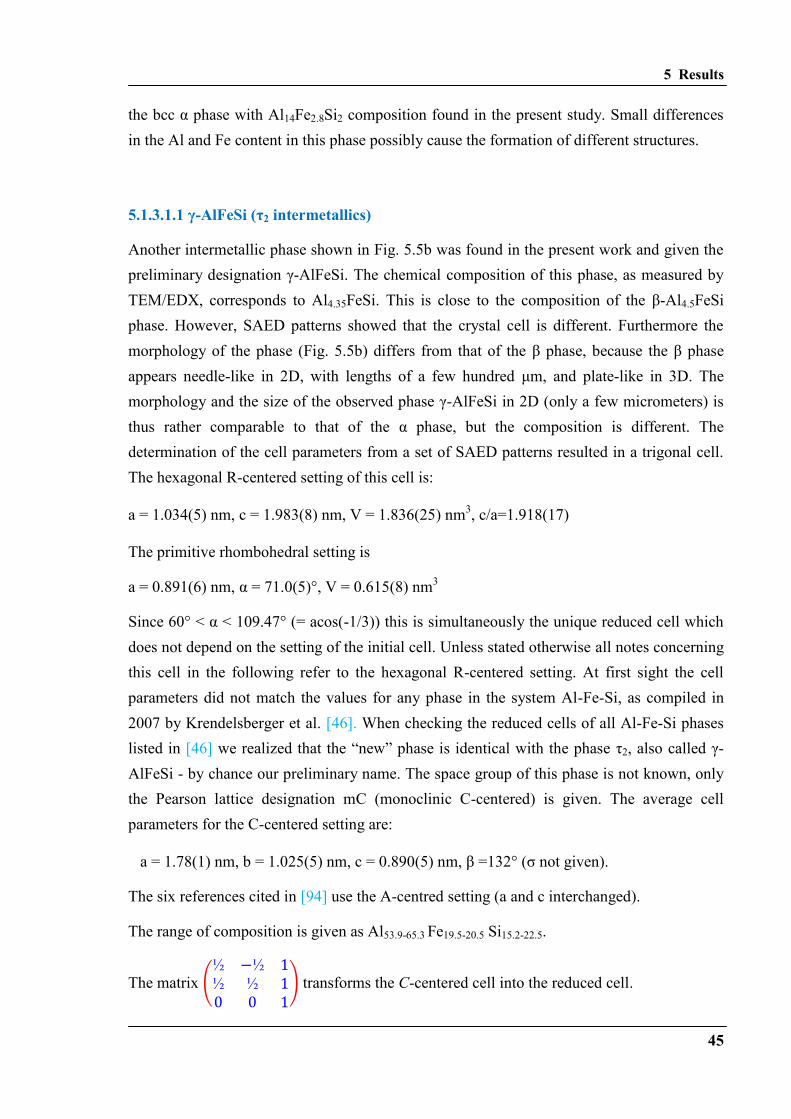
5 Results
45
the bcc α phase with Al14Fe2.8Si2 composition found in the present study. Small differences
in the Al and Fe content in this phase possibly cause the formation of different structures.
5.1.3.1.1 γ-AlFeSi (τ2 intermetallics)
Another intermetallic phase shown in Fig. 5.5b was found in the present work and given the
preliminary designation γ-AlFeSi. The chemical composition of this phase, as measured by
TEM/EDX, corresponds to Al4.35FeSi. This is close to the composition of the β-Al4.5FeSi
phase. However, SAED patterns showed that the crystal cell is different. Furthermore the
morphology of the phase (Fig. 5.5b) differs from that of the β phase, because the β phase
appears needle-like in 2D, with lengths of a few hundred μm, and plate-like in 3D. The
morphology and the size of the observed phase γ-AlFeSi in 2D (only a few micrometers) is
thus rather comparable to that of the α phase, but the composition is different. The
determination of the cell parameters from a set of SAED patterns resulted in a trigonal cell.
The hexagonal R-centered setting of this cell is:
a = 1.034(5) nm, c = 1.983(8) nm, V = 1.836(25) nm3, c/a=1.918(17)
The primitive rhombohedral setting is
a = 0.891(6) nm, α = 71.0(5)°, V = 0.615(8) nm3
Since 60° < α < 109.47° (= acos(-1/3)) this is simultaneously the unique reduced cell which
does not depend on the setting of the initial cell. Unless stated otherwise all notes concerning
this cell in the following refer to the hexagonal R-centered setting. At first sight the cell
parameters did not match the values for any phase in the system Al-Fe-Si, as compiled in
2007 by Krendelsberger et al. [46]. When checking the reduced cells of all Al-Fe-Si phases
listed in [46] we realized that the “new” phase is identical with the phase τ2, also called γ-
AlFeSi - by chance our preliminary name. The space group of this phase is not known, only
the Pearson lattice designation mC (monoclinic C-centered) is given. The average cell
parameters for the C-centered setting are:
a = 1.78(1) nm, b = 1.025(5) nm, c = 0.890(5) nm, β =132° (σ not given).
The six references cited in [94] use the A-centred setting (a and c interchanged).
The range of composition is given as Al53.9-65.3 Fe19.5-20.5 Si15.2-22.5.
The matrix
transforms the C-centered cell into the reduced cell.
5 Results
46
a = 0.887 nm, b = 0.887 nm, c = 0.890 nm, α = 70.61°, β = 70.61°, γ = 70.59°
which is nearly identical with the rhombohedral cell we obtained from the evaluation of
SAED patterns. The special value α β γ 70.60 acos(1/3) = 70.53° causes the
following relations between the cell parameters of the monoclinic setting:
a = b · 3½, c = a/2, acos (-2/3)
The R-centered representation of the rhombohedron is directly obtained from the monoclinic
cell using the matrix
.
a = 1.025 nm, b = 1.027 nm, c = 1.984 nm, α= 90.16°, β = 90.00°, γ = 119.94° ; c/a 1.9337
In Fig. 5.6, the “monoclinic” (Fig. 5.6a) and the trigonal (Fig. 5.6b) indexing of a prominent
SAED pattern are compared. The auxiliary line in Fig. 5.6a clarifies the lack of any mirror
planes, when considering the intensities of the diffraction spots. The two-dimensional point
group is quite clearly 6. This does not necessarily mean that the structure is trigonal or
hexagonal or cubic. In fact it means that the symmetry of the structure projected along the
employed zone axis is very close to p6.
Fig. 5.6. SAED pattern of the γ-AlFeSi phase, indexed using (a): the published C-centered
monoclinic cell. Note that intensities hkl and h-kl are different; (b): the R-centered
hexagonal cell. Note the six-fold symmetry and the lack of mirror planes.
5 Results
47
As the reciprocal space of monoclinic space groups displays the symmetry 2/m, even if the
point group of the structure is 2 or m, the auxiliary line in Fig. 5.3a should represent the
mirror plane. As this is not the case, monoclinic symmetry is excluded. Hence the structure
is either trigonal or triclinic. The lack of mirror planes limits the possible space groups to R ,
R3, P or 1P . (In space group R32 mirror planes are missing, despite that the diffraction
pattern of zone [001] displays the symmetry 6m).
5.1.3.1.2 Proposed Structure Type for γ-AlFeSi (τ2 intermetallic)
A structure determination of γ-AlFeSi has not yet been published. A reason might be that a
structure determination based on X-ray powder data is complicated by the fact that the angle
of the rhombohedral setting of the published cell is very close to acos(1/3)=70.529° (the
well-known angle between the faces of a tetrahedron). This implies that for the hexagonal
setting the ratio c/a 1.9337 is very close to c/a = (15/4)½
= 1.93649, and that the value of
d2 = d
2(a,h,k,l) is very close to dhkl
2 = (15/4) · a
2 / Khkl with Khkl = 5·(h
2 + k
2 + hk) + l
2.
All powder lines with common Khkl coincide. Since Khkl is an integer the situation is similar
to the cubic case where non-equivalent lines with a common value of (h2 + k
2 + l
2) coincide.
In contrast, in the hexagonal case coincidence only occurs for a very special value of the free
parameter c/a. Deviations from this value cause an increased splitting of the multiplets with
increasing Khkl. However, if this value is exactly met, the overlap is perfect. Coincidences
are much more abundant than in the cubic system, in particular for low h, k, l. Among the
first 400 lines of a hexagonal R-centred lattice there are only 10 “singulets” (hkl and ik-l
counted as one line): 101, 110, 015, 122, 131, 315, 324, 505, 345, 5 1 10. Multiplets with
multiplicities > 2 are the rule. For Khkl = 261 (d=0.123 nm), e.g., the 7 lines 6 2 1, 7 0 4, 3 5 4,
6 0 9, 4 2 11, 3 1 14, 1 0 16 coincide. For a monoclinic setting there are no singulets at all.
By a search-match procedure which uses an indexibility criterion (and therefore is not
sensitive to the setting of cells) a scan through a crystal structure data base was performed. If
only phases containing nothing but metals and metalloids are included a group of nearly
isostructural rhombohedral phases can be found. The space group of these phases is 3R .
(The phase was not contained in the data base.) The matches are:
- Mo30.4Co51.3Cr18.3 : 1.0903 nm, 1.9342 nm, c/a = 1.774, Komura et al. (1960) [94]
- -Mg23Al30 : 1.2825 nm, 2.1748 nm, c/a = 1.686, Samson et al. (1968) [95]

5 Results
48
- Mn85.5 Si14.5 : 1.0871 nm, 1.9180 nm, c/a = 1.764, Shoemaker et al. (1978) [96]
In 1951 the Mo-Co-Cr phase was first encountered and named “R phase” by Rideout et al.
[97]. Even though later the structure turned out to be trigonal R-centered the name “R-phase”
does not stand for this fact. In 1960 the structure was determined by Komura et al. [94]. If
Al68.6Fe15.7Si15.7 (Table 5.2) is written (Al,Fe)84.3Si15.5 the similarity to Mn85.5 Si14.5 [96]
becomes evident. There is additional crystallographic evidence for a relationship: In Fig.
5.3b, reflection 140 and its equivalents, which underline the six-fold symmetry, are clearly
the strongest in zone [001]. This matches the findings in the Fo-Fc listings reproduced in
Refs. [94] and [95]. (In Ref. [95], hkl has to be replaced by kh-l due to a different setting of
the structure.)
Furthermore we compared calculated powder diffractograms of the R phases using the
parameters from [94], [95] and [96] with a measured powder diffractogram of an alloy
Al61Fe22Si17 which was given to us by Prof. J. C. Schuster (Vienna). The predominant phase
in this material is γ-AlFeSi. A common feature is a very characteristic group of strong lines
between d 0.19 nm and d 0.22 nm. However, although the calculated intensity for the
doublet 202, 113 at 0.404 nm displays the highest intensity in the range d > 0.22 nm, it is
very much weaker than the observed line. Nevertheless these findings corroborate the view
point that the structure of the γ-AlFeSi phase is at least strongly related to the structure of the
R phases. As stated in Refs. [94-96] these structures are built from 11 sites. The R-centered
setting of the cell contains 159 atoms, many sites with mixed occupancy. The structures
exhibit 12- to 16-fold atomic coordination and only tetrahedral interstices.
5.1.3.2 Sr-modified high-purity alloy
Figure 5.7 shows bright-field TEM images and the SAED patterns of different types of
intermetallic phases embedded in the eutectic matrix of the pure alloy modified by Sr. The
corresponding SAED images of every intermetallic phase along the zone axes [111], [110]
and [ 1 11] are shown in the inset. The intermetallic phase in Fig. 5.7a is a Fe-rich α phase.
Its chemical composition is close to Al14Fe3Si2 as measured by EDX in the TEM. According
to the SAED the lattice parameter of the bcc structure is a = 1.253 nm. The phase located in
the center of Fig. 5.7b is a Fe-rich δ phase with composition Al4FeSi2. The lattice parameters
of the tetragonal phase are a = 0.6146 nm and c = 0.9509 nm. Both α and δ phases have also
been observed in the commercial Sr-modified alloy (containing further elements)
investigated in [19].
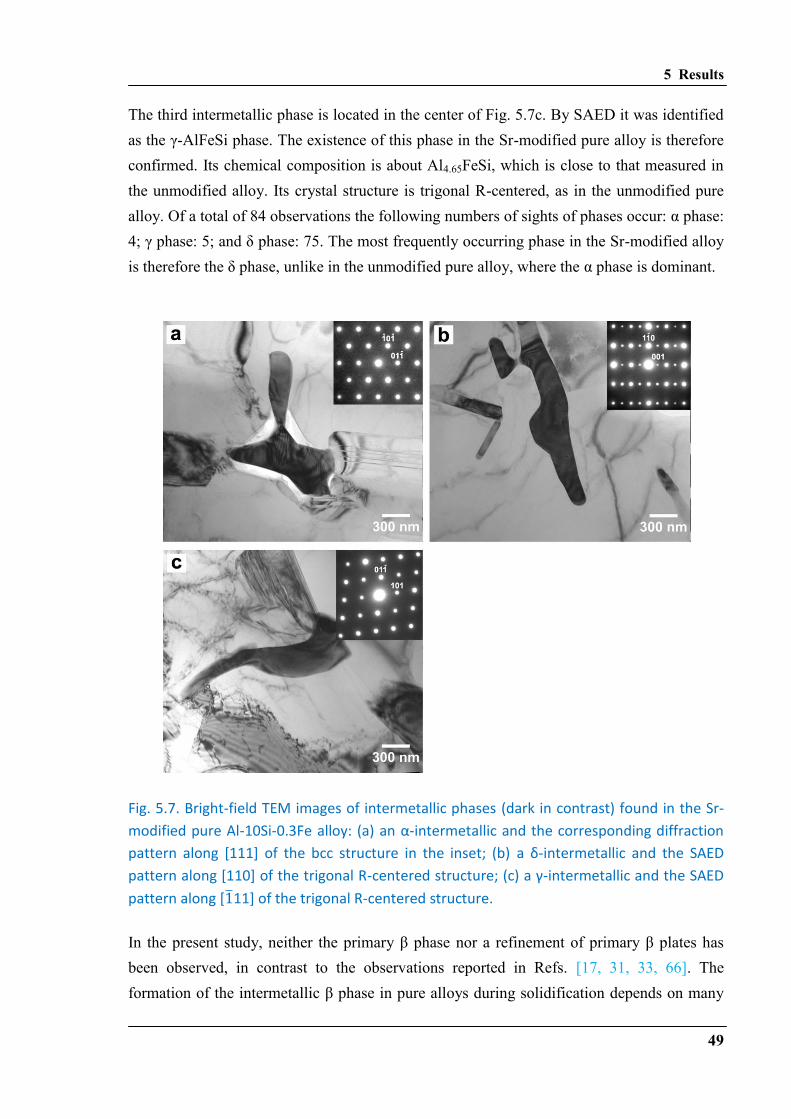
5 Results
49
The third intermetallic phase is located in the center of Fig. 5.7c. By SAED it was identified
as the γ-AlFeSi phase. The existence of this phase in the Sr-modified pure alloy is therefore
confirmed. Its chemical composition is about Al4.65FeSi, which is close to that measured in
the unmodified alloy. Its crystal structure is trigonal R-centered, as in the unmodified pure
alloy. Of a total of 84 observations the following numbers of sights of phases occur: α phase:
4; γ phase: 5; and δ phase: 75. The most frequently occurring phase in the Sr-modified alloy
is therefore the δ phase, unlike in the unmodified pure alloy, where the α phase is dominant.
Fig. 5.7. Bright-field TEM images of intermetallic phases (dark in contrast) found in the Sr-
modified pure Al-10Si-0.3Fe alloy: (a) an α-intermetallic and the corresponding diffraction
pattern along [111] of the bcc structure in the inset; (b) a δ-intermetallic and the SAED
pattern along [110] of the trigonal R-centered structure; (c) a γ-intermetallic and the SAED
pattern along [ 11] of the trigonal R-centered structure.
In the present study, neither the primary β phase nor a refinement of primary β plates has
been observed, in contrast to the observations reported in Refs. [17, 31, 33, 66]. The
formation of the intermetallic β phase in pure alloys during solidification depends on many
5 Results
50
parameters as reported in Ref. [29]. According to this study the β phase forms at cooling
rates up to 50 K/s during solidification in alloys containing about 2 wt.% Si and 0.25 wt.%
Fe [29]. For alloys with Si contents around 10 wt.% Si the β phase has been found in
samples cooled at < 5 K/s. The present alloys have been solidified at a cooling rate of ~8 K/s
and the β phase cannot be observed. Based on the results in this study, our conclusion is that
without commercial impurities the formation of the intermetallic β phase can be observed
neither in the unmodified nor in the Sr-modified alloy. Chemical and crystallographic
information of the intermetallic phases observed in the Sr-modified alloy are given in Table
5.2.
5.1.3.3 Unmodified commercial alloy
Figure 5.8 shows the bright-field TEM images and corresponding SAED patterns of different
types of intermetallic phases in the unmodified commercial alloy. Fig 5.8a displays an α
phase with corresponding SAED pattern along [001] of the bcc structure. This α phase
exhibits a more complex morphology, known as fish skeleton or complex ‘‘Chinese script’’.
It is thin and compact, corresponding to an observation previously reported [18] and
probably due to various impurities in the alloy. The chemical composition of the α phase is
similar to that in the unmodified pure alloy, which is Al14Fe3Si2 as measured by EDX in the
TEM. According to SAED the lattice parameter of the bcc structure is a = 1.2487 nm.
Figure 5.8b displays a needle-like morphology of the δ intermetallic phase in bright field
TEM images and the corresponding SAED pattern along the zone axis [010] of the
tetragonal structure in the inset of Fig. 5.8b. The chemical composition of the δ phase is
Al3.6FeSi2 as measured by EDX in the TEM which is similar to that in the pure alloy.
According to SAED the lattice parameters of the tetragonal phase are a = 0.6092 nm and c
=0.9538 nm.
The third intermetallic phase in the unmodified commercial alloy is the β intermetallic phase
which is shown in Fig. 5.8c. The chemical composition of the β phase is close to Al4.7FeSi as
measured by EDX in the TEM, which corresponds to Al5FeSi, which has often been
designated as Al4.5FeSi [21, 22]. The morphology of the β phase has been described as
needle-like or acicular in 2D and as very large interconnected plates or blades in 3D.
However, central oxide cracks in the middle of the phase [62], branching of β phase or β
distributing around oxides [68] are not found in the present work. Compared to the δ phase,
which also has a platelet appearance, the β intermetallic generally exhibits coarser platelets
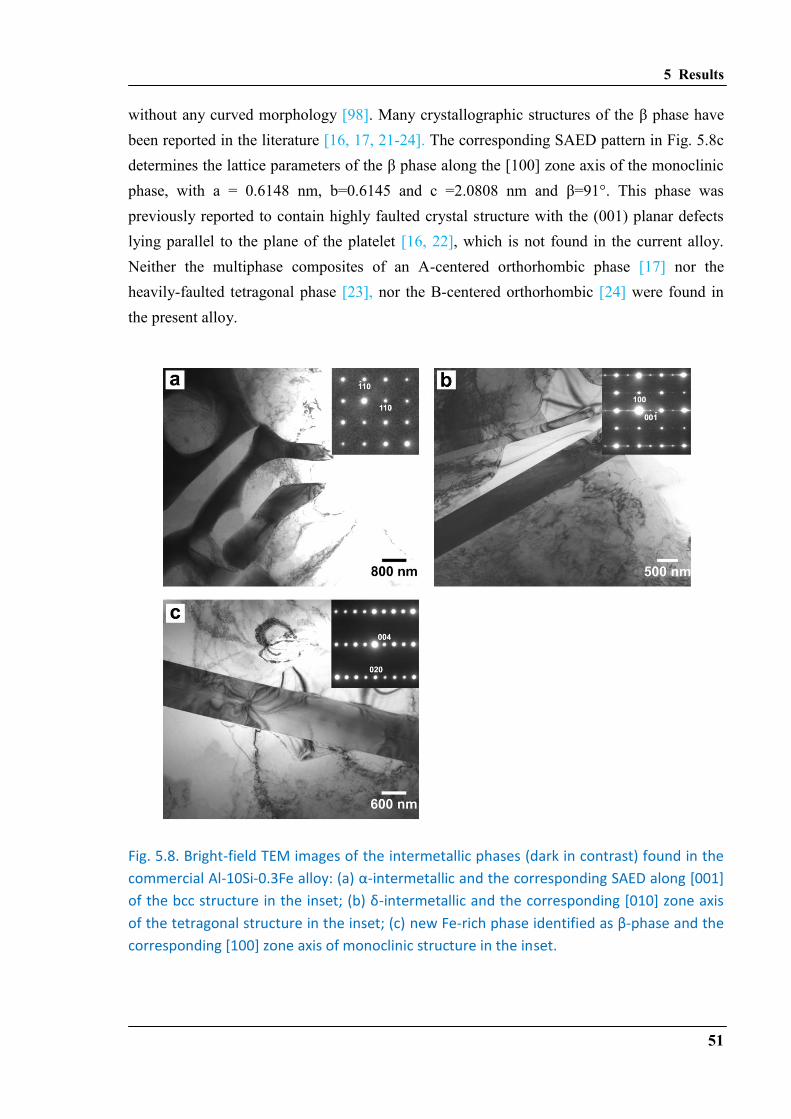
5 Results
51
without any curved morphology [98]. Many crystallographic structures of the β phase have
been reported in the literature [16, 17, 21-24]. The corresponding SAED pattern in Fig. 5.8c
determines the lattice parameters of the β phase along the [100] zone axis of the monoclinic
phase, with a = 0.6148 nm, b=0.6145 and c =2.0808 nm and β=91°. This phase was
previously reported to contain highly faulted crystal structure with the (001) planar defects
lying parallel to the plane of the platelet [16, 22], which is not found in the current alloy.
Neither the multiphase composites of an A-centered orthorhombic phase [17] nor the
heavily-faulted tetragonal phase [23], nor the B-centered orthorhombic [24] were found in
the present alloy.
Fig. 5.8. Bright-field TEM images of the intermetallic phases (dark in contrast) found in the
commercial Al-10Si-0.3Fe alloy: (a) α-intermetallic and the corresponding SAED along [001]
of the bcc structure in the inset; (b) δ-intermetallic and the corresponding [010] zone axis
of the tetragonal structure in the inset; (c) new Fe-rich phase identified as β-phase and the
corresponding [100] zone axis of monoclinic structure in the inset.
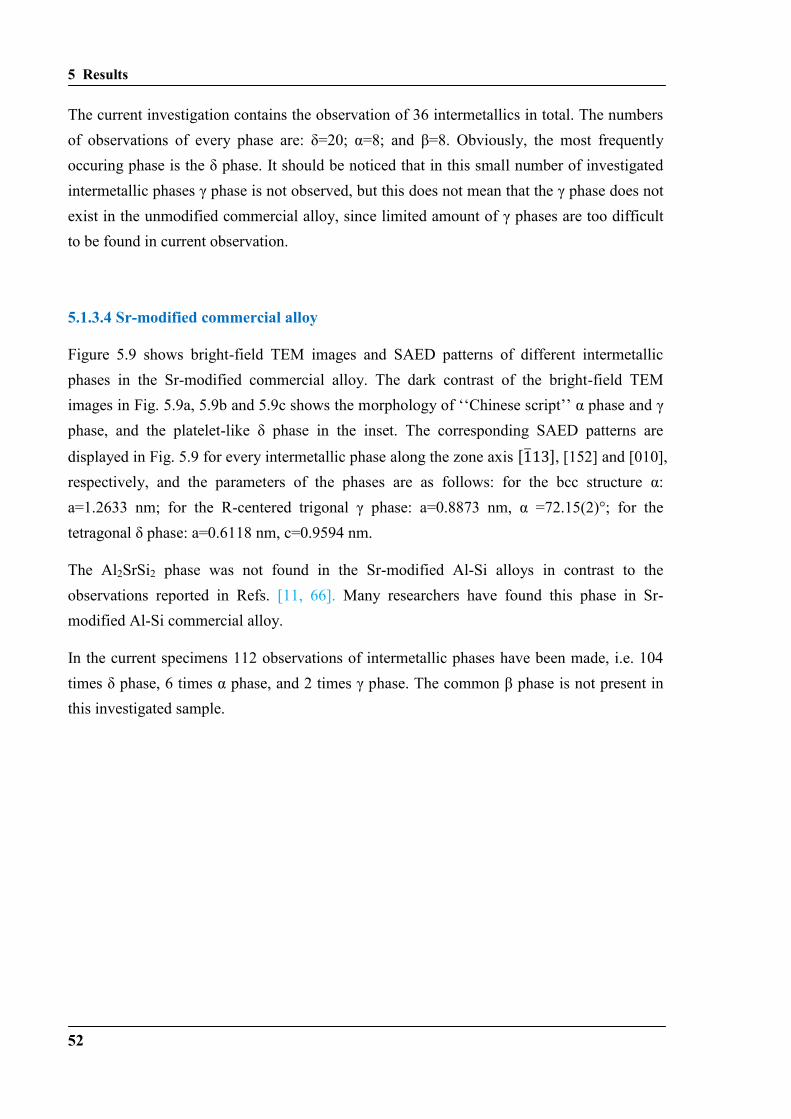
5 Results
52
The current investigation contains the observation of 36 intermetallics in total. The numbers
of observations of every phase are: δ=20; α=8; and β=8. Obviously, the most frequently
occuring phase is the δ phase. It should be noticed that in this small number of investigated
intermetallic phases γ phase is not observed, but this does not mean that the γ phase does not
exist in the unmodified commercial alloy, since limited amount of γ phases are too difficult
to be found in current observation.
5.1.3.4 Sr-modified commercial alloy
Figure 5.9 shows bright-field TEM images and SAED patterns of different intermetallic
phases in the Sr-modified commercial alloy. The dark contrast of the bright-field TEM
images in Fig. 5.9a, 5.9b and 5.9c shows the morphology of ‘‘Chinese script’’ α phase and γ
phase, and the platelet-like δ phase in the inset. The corresponding SAED patterns are
displayed in Fig. 5.9 for every intermetallic phase along the zone axis , [152] and [010],
respectively, and the parameters of the phases are as follows: for the bcc structure α:
a=1.2633 nm; for the R-centered trigonal γ phase: a=0.8873 nm, α =72.15(2)°; for the
tetragonal δ phase: a=0.6118 nm, c=0.9594 nm.
The Al2SrSi2 phase was not found in the Sr-modified Al-Si alloys in contrast to the
observations reported in Refs. [11, 66]. Many researchers have found this phase in Sr-
modified Al-Si commercial alloy.
In the current specimens 112 observations of intermetallic phases have been made, i.e. 104
times δ phase, 6 times α phase, and 2 times γ phase. The common β phase is not present in
this investigated sample.
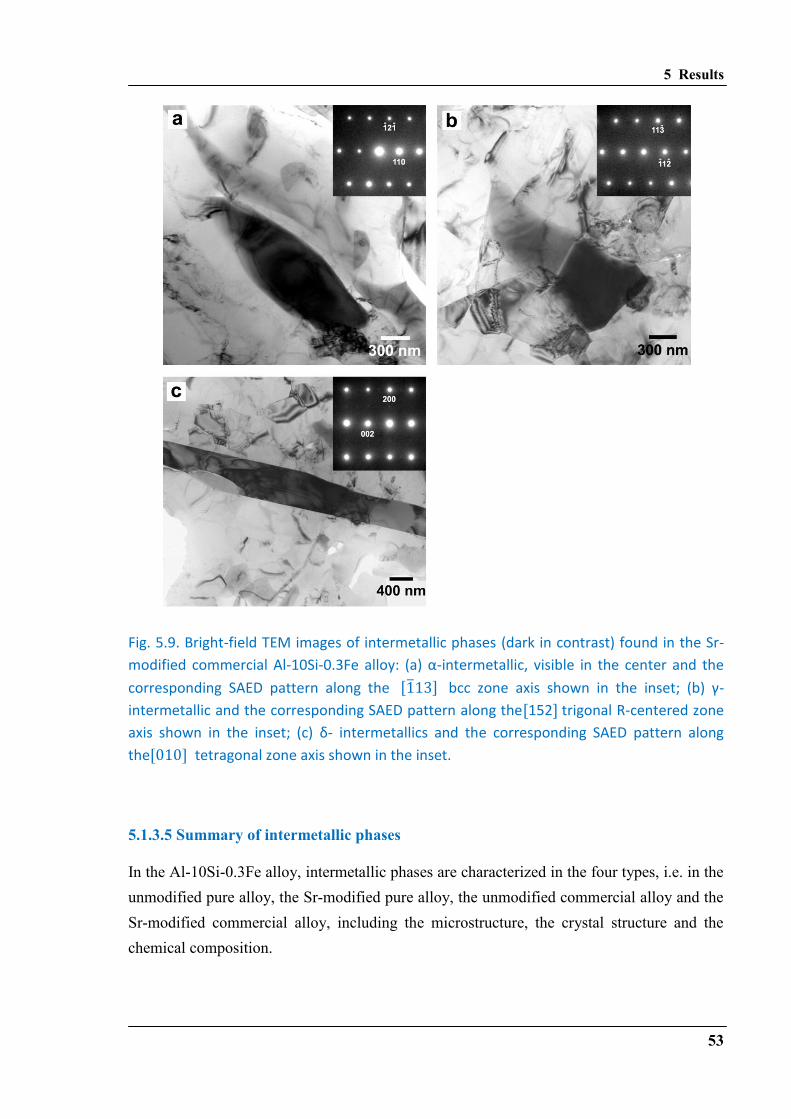
5 Results
53
Fig. 5.9. Bright-field TEM images of intermetallic phases (dark in contrast) found in the Sr-
modified commercial Al-10Si-0.3Fe alloy: (a) α-intermetallic, visible in the center and the
corresponding SAED pattern along the bcc zone axis shown in the inset; (b) γ-
intermetallic and the corresponding SAED pattern along the trigonal R-centered zone
axis shown in the inset; (c) δ- intermetallics and the corresponding SAED pattern along
the tetragonal zone axis shown in the inset.
5.1.3.5 Summary of intermetallic phases
In the Al-10Si-0.3Fe alloy, intermetallic phases are characterized in the four types, i.e. in the
unmodified pure alloy, the Sr-modified pure alloy, the unmodified commercial alloy and the
Sr-modified commercial alloy, including the microstructure, the crystal structure and the
chemical composition.
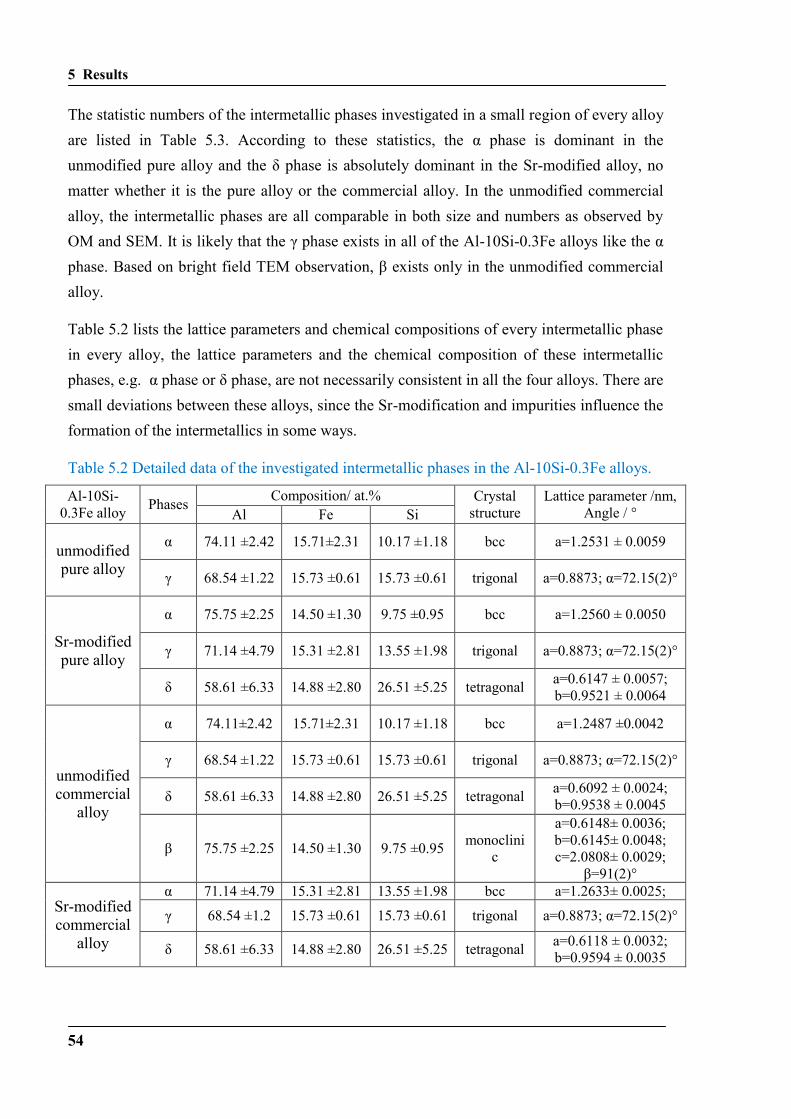
5 Results
54
The statistic numbers of the intermetallic phases investigated in a small region of every alloy
are listed in Table 5.3. According to these statistics, the α phase is dominant in the
unmodified pure alloy and the δ phase is absolutely dominant in the Sr-modified alloy, no
matter whether it is the pure alloy or the commercial alloy. In the unmodified commercial
alloy, the intermetallic phases are all comparable in both size and numbers as observed by
OM and SEM. It is likely that the γ phase exists in all of the Al-10Si-0.3Fe alloys like the α
phase. Based on bright field TEM observation, β exists only in the unmodified commercial
alloy.
Table 5.2 lists the lattice parameters and chemical compositions of every intermetallic phase
in every alloy, the lattice parameters and the chemical composition of these intermetallic
phases, e.g. α phase or δ phase, are not necessarily consistent in all the four alloys. There are
small deviations between these alloys, since the Sr-modification and impurities influence the
formation of the intermetallics in some ways.
Table 5.2 Detailed data of the investigated intermetallic phases in the Al-10Si-0.3Fe alloys.
Al-10Si-
0.3Fe alloy Phases
Composition/ at.% Crystal
structure
Lattice parameter /nm,
Angle / ° Al Fe Si
unmodified
pure alloy
α 74.11 ±2.42 15.71±2.31 10.17 ±1.18 bcc a=1.2531 ± 0.0059
γ 68.54 ±1.22 15.73 ±0.61 15.73 ±0.61 trigonal a=0.8873; α=72.15(2)°
Sr-modified
pure alloy
α 75.75 ±2.25 14.50 ±1.30 9.75 ±0.95 bcc a=1.2560 ± 0.0050
γ 71.14 ±4.79 15.31 ±2.81 13.55 ±1.98 trigonal a=0.8873; α=72.15(2)°
δ 58.61 ±6.33 14.88 ±2.80 26.51 ±5.25 tetragonal a=0.6147 ± 0.0057;
b=0.9521 ± 0.0064
unmodified
commercial
alloy
α 74.11±2.42 15.71±2.31 10.17 ±1.18 bcc a=1.2487 ±0.0042
γ 68.54 ±1.22 15.73 ±0.61 15.73 ±0.61 trigonal a=0.8873; α=72.15(2)°
δ 58.61 ±6.33 14.88 ±2.80 26.51 ±5.25 tetragonal a=0.6092 ± 0.0024;
b=0.9538 ± 0.0045
β 75.75 ±2.25 14.50 ±1.30 9.75 ±0.95 monoclini
c
a=0.6148± 0.0036;
b=0.6145± 0.0048;
c=2.0808± 0.0029;
β=91(2)°
Sr-modified
commercial
alloy
α 71.14 ±4.79 15.31 ±2.81 13.55 ±1.98 bcc a=1.2633± 0.0025;
γ 68.54 ±1.2 15.73 ±0.61 15.73 ±0.61 trigonal a=0.8873; α=72.15(2)°
δ 58.61 ±6.33 14.88 ±2.80 26.51 ±5.25 tetragonal a=0.6118 ± 0.0032;
b=0.9594 ± 0.0035
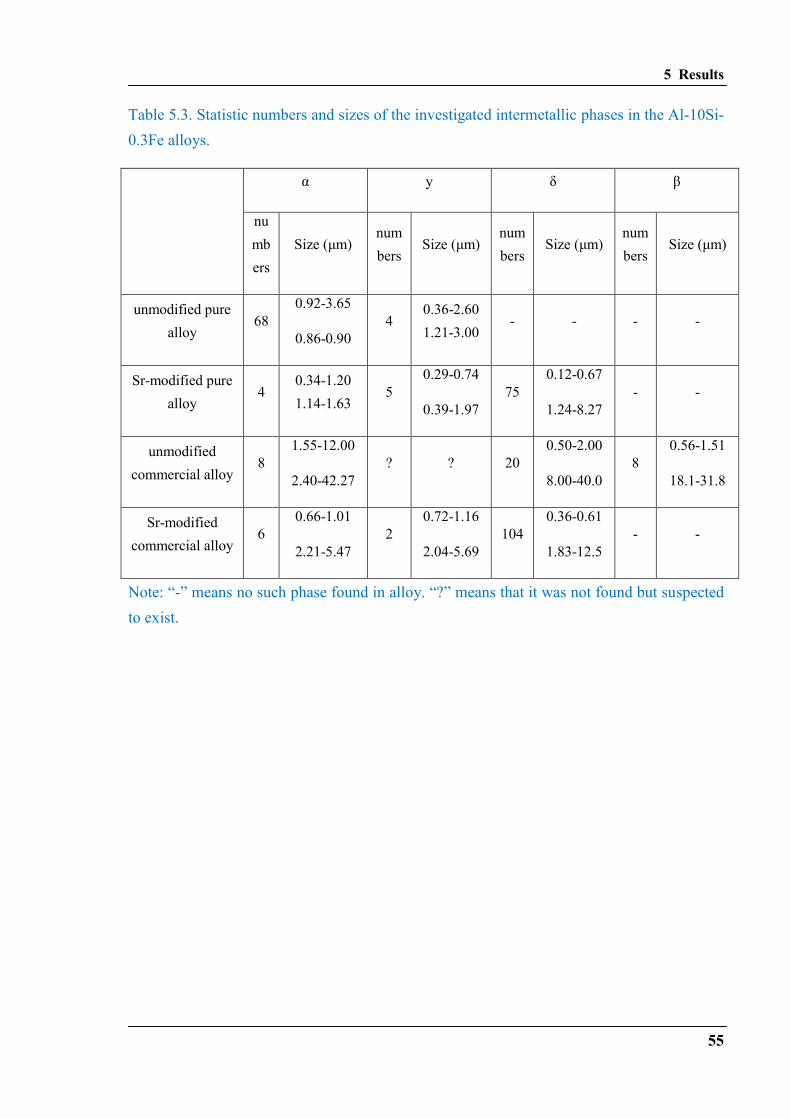
5 Results
55
Table 5.3. Statistic numbers and sizes of the investigated intermetallic phases in the Al-10Si-
0.3Fe alloys.
α y δ β
nu
mb
ers
Size (μm) num
bers Size (μm)
num
bers Size (μm)
num
bers Size (μm)
unmodified pure
alloy 68
0.92-3.65
0.86-0.90
4 0.36-2.60
1.21-3.00 - - - -
Sr-modified pure
alloy 4
0.34-1.20
1.14-1.63 5
0.29-0.74
0.39-1.97
75
0.12-0.67
1.24-8.27
- -
unmodified
commercial alloy 8
1.55-12.00
2.40-42.27
? ? 20
0.50-2.00
8.00-40.0
8
0.56-1.51
18.1-31.8
Sr-modified
commercial alloy 6
0.66-1.01
2.21-5.47
2
0.72-1.16
2.04-5.69
104
0.36-0.61
1.83-12.5
- -
Note: “-” means no such phase found in alloy. “?” means that it was not found but suspected
to exist.
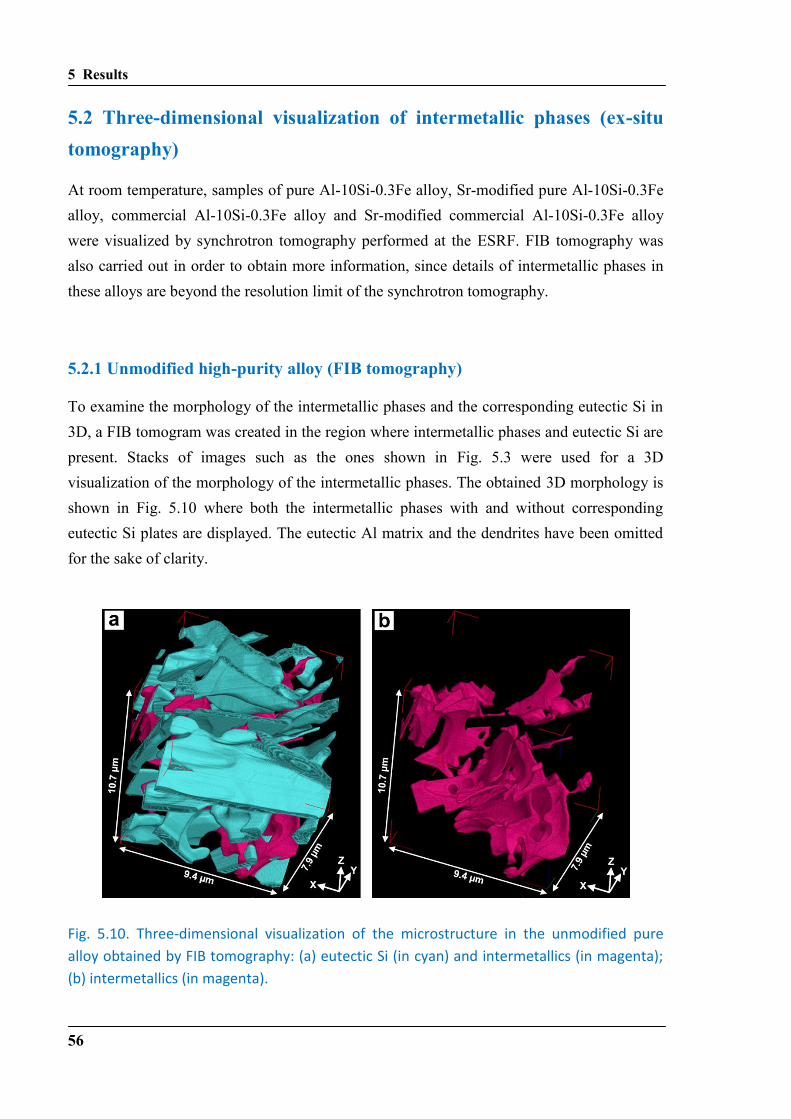
5 Results
56
5.2 Three-dimensional visualization of intermetallic phases (ex-situ
tomography)
At room temperature, samples of pure Al-10Si-0.3Fe alloy, Sr-modified pure Al-10Si-0.3Fe
alloy, commercial Al-10Si-0.3Fe alloy and Sr-modified commercial Al-10Si-0.3Fe alloy
were visualized by synchrotron tomography performed at the ESRF. FIB tomography was
also carried out in order to obtain more information, since details of intermetallic phases in
these alloys are beyond the resolution limit of the synchrotron tomography.
5.2.1 Unmodified high-purity alloy (FIB tomography)
To examine the morphology of the intermetallic phases and the corresponding eutectic Si in
3D, a FIB tomogram was created in the region where intermetallic phases and eutectic Si are
present. Stacks of images such as the ones shown in Fig. 5.3 were used for a 3D
visualization of the morphology of the intermetallic phases. The obtained 3D morphology is
shown in Fig. 5.10 where both the intermetallic phases with and without corresponding
eutectic Si plates are displayed. The eutectic Al matrix and the dendrites have been omitted
for the sake of clarity.
Fig. 5.10. Three-dimensional visualization of the microstructure in the unmodified pure
alloy obtained by FIB tomography: (a) eutectic Si (in cyan) and intermetallics (in magenta);
(b) intermetallics (in magenta).
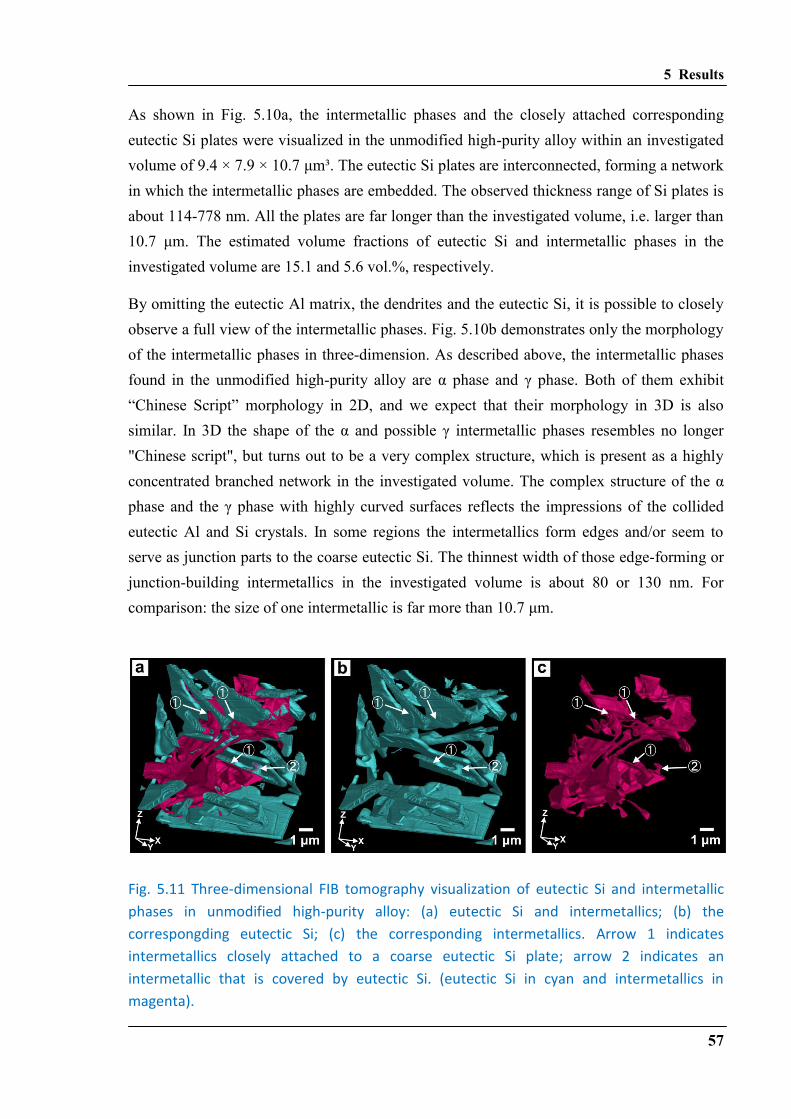
5 Results
57
As shown in Fig. 5.10a, the intermetallic phases and the closely attached corresponding
eutectic Si plates were visualized in the unmodified high-purity alloy within an investigated
volume of 9.4 × 7.9 × 10.7 μm³. The eutectic Si plates are interconnected, forming a network
in which the intermetallic phases are embedded. The observed thickness range of Si plates is
about 114-778 nm. All the plates are far longer than the investigated volume, i.e. larger than
10.7 μm. The estimated volume fractions of eutectic Si and intermetallic phases in the
investigated volume are 15.1 and 5.6 vol.%, respectively.
By omitting the eutectic Al matrix, the dendrites and the eutectic Si, it is possible to closely
observe a full view of the intermetallic phases. Fig. 5.10b demonstrates only the morphology
of the intermetallic phases in three-dimension. As described above, the intermetallic phases
found in the unmodified high-purity alloy are α phase and γ phase. Both of them exhibit
“Chinese Script” morphology in 2D, and we expect that their morphology in 3D is also
similar. In 3D the shape of the α and possible γ intermetallic phases resembles no longer
"Chinese script", but turns out to be a very complex structure, which is present as a highly
concentrated branched network in the investigated volume. The complex structure of the α
phase and the γ phase with highly curved surfaces reflects the impressions of the collided
eutectic Al and Si crystals. In some regions the intermetallics form edges and/or seem to
serve as junction parts to the coarse eutectic Si. The thinnest width of those edge-forming or
junction-building intermetallics in the investigated volume is about 80 or 130 nm. For
comparison: the size of one intermetallic is far more than 10.7 μm.
Fig. 5.11 Three-dimensional FIB tomography visualization of eutectic Si and intermetallic
phases in unmodified high-purity alloy: (a) eutectic Si and intermetallics; (b) the
correspongding eutectic Si; (c) the corresponding intermetallics. Arrow 1 indicates
intermetallics closely attached to a coarse eutectic Si plate; arrow 2 indicates an
intermetallic that is covered by eutectic Si. (eutectic Si in cyan and intermetallics in
magenta).
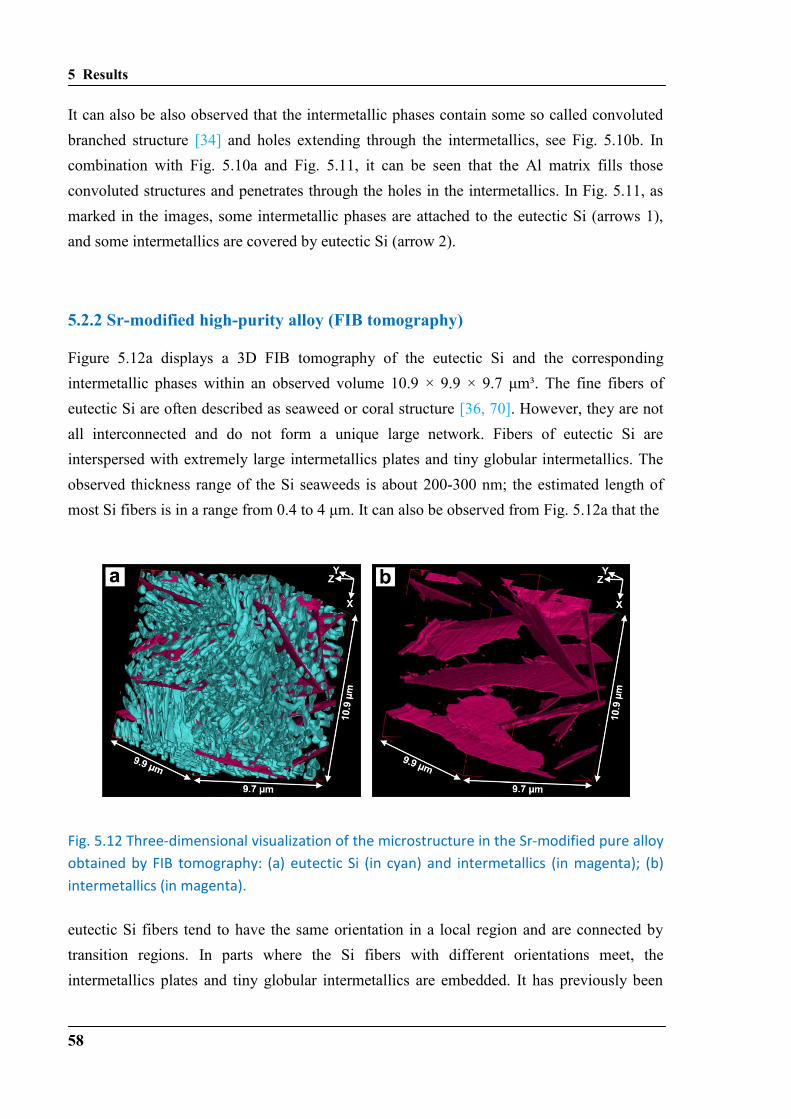
5 Results
58
It can also be also observed that the intermetallic phases contain some so called convoluted
branched structure [34] and holes extending through the intermetallics, see Fig. 5.10b. In
combination with Fig. 5.10a and Fig. 5.11, it can be seen that the Al matrix fills those
convoluted structures and penetrates through the holes in the intermetallics. In Fig. 5.11, as
marked in the images, some intermetallic phases are attached to the eutectic Si (arrows 1),
and some intermetallics are covered by eutectic Si (arrow 2).
5.2.2 Sr-modified high-purity alloy (FIB tomography)
Figure 5.12a displays a 3D FIB tomography of the eutectic Si and the corresponding
intermetallic phases within an observed volume 10.9 × 9.9 × 9.7 μm³. The fine fibers of
eutectic Si are often described as seaweed or coral structure [36, 70]. However, they are not
all interconnected and do not form a unique large network. Fibers of eutectic Si are
interspersed with extremely large intermetallics plates and tiny globular intermetallics. The
observed thickness range of the Si seaweeds is about 200-300 nm; the estimated length of
most Si fibers is in a range from 0.4 to 4 μm. It can also be observed from Fig. 5.12a that the
Fig. 5.12 Three-dimensional visualization of the microstructure in the Sr-modified pure alloy
obtained by FIB tomography: (a) eutectic Si (in cyan) and intermetallics (in magenta); (b)
intermetallics (in magenta).
eutectic Si fibers tend to have the same orientation in a local region and are connected by
transition regions. In parts where the Si fibers with different orientations meet, the
intermetallics plates and tiny globular intermetallics are embedded. It has previously been
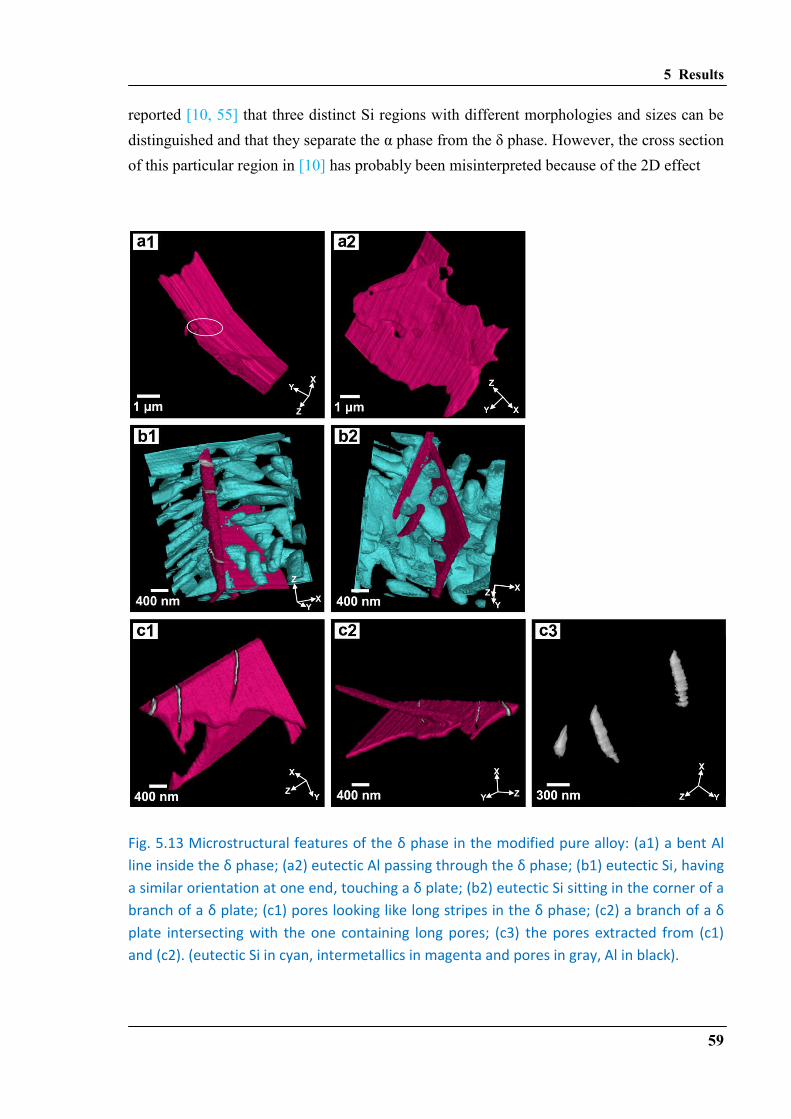
5 Results
59
reported [10, 55] that three distinct Si regions with different morphologies and sizes can be
distinguished and that they separate the α phase from the δ phase. However, the cross section
of this particular region in [10] has probably been misinterpreted because of the 2D effect
Fig. 5.13 Microstructural features of the δ phase in the modified pure alloy: (a1) a bent Al
line inside the δ phase; (a ) eutectic Al passing through the δ phase; (b ) eutectic Si, having
a similar orientation at one end, touching a δ plate; (b ) eutectic Si sitting in the corner of a
branch of a δ plate; (c ) pores looking like long stripes in the δ phase; (c2) a branch of a δ
plate intersecting with the one containing long pores; (c3) the pores extracted from (c1)
and (c2). (eutectic Si in cyan, intermetallics in magenta and pores in gray, Al in black).
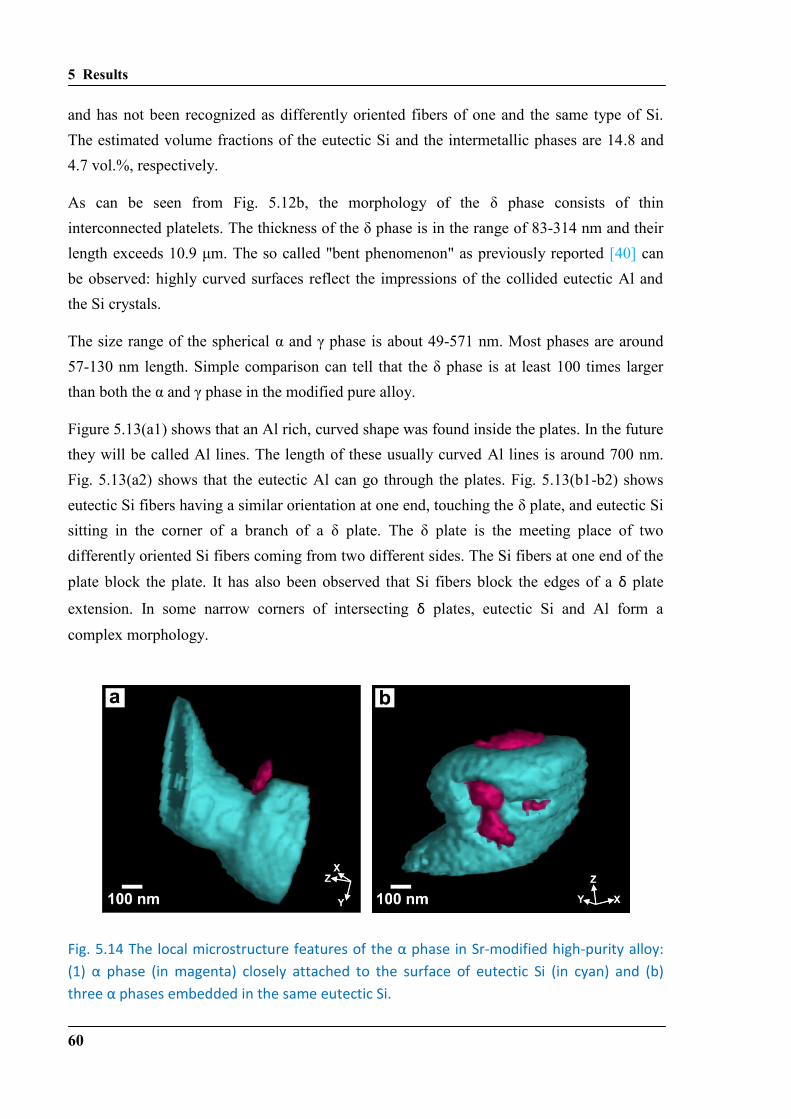
5 Results
60
and has not been recognized as differently oriented fibers of one and the same type of Si.
The estimated volume fractions of the eutectic Si and the intermetallic phases are 14.8 and
4.7 vol.%, respectively.
As can be seen from Fig. 5.12b, the morphology of the δ phase consists of thin
interconnected platelets. The thickness of the δ phase is in the range of 83-314 nm and their
length exceeds 10.9 μm. The so called "bent phenomenon" as previously reported [40] can
be observed: highly curved surfaces reflect the impressions of the collided eutectic Al and
the Si crystals.
The size range of the spherical α and γ phase is about 49-571 nm. Most phases are around
57-130 nm length. Simple comparison can tell that the δ phase is at least 100 times larger
than both the α and γ phase in the modified pure alloy.
Figure 5.13(a1) shows that an Al rich, curved shape was found inside the plates. In the future
they will be called Al lines. The length of these usually curved Al lines is around 700 nm.
Fig. 5.13(a2) shows that the eutectic Al can go through the plates. Fig. 5.13(b1-b2) shows
eutectic Si fibers having a similar orientation at one end, touching the δ plate, and eutectic Si
sitting in the corner of a branch of a δ plate. The δ plate is the meeting place of two
differently oriented Si fibers coming from two different sides. The Si fibers at one end of the
plate block the plate. It has also been observed that Si fibers block the edges of a δ plate
extension. In some narrow corners of intersecting δ plates, eutectic Si and Al form a
complex morphology.
Fig. 5.14 The local microstructure features of the α phase in Sr-modified high-purity alloy:
( ) α phase (in magenta) closely attached to the surface of eutectic Si (in cyan) and (b)
three α phases embedded in the same eutectic Si.
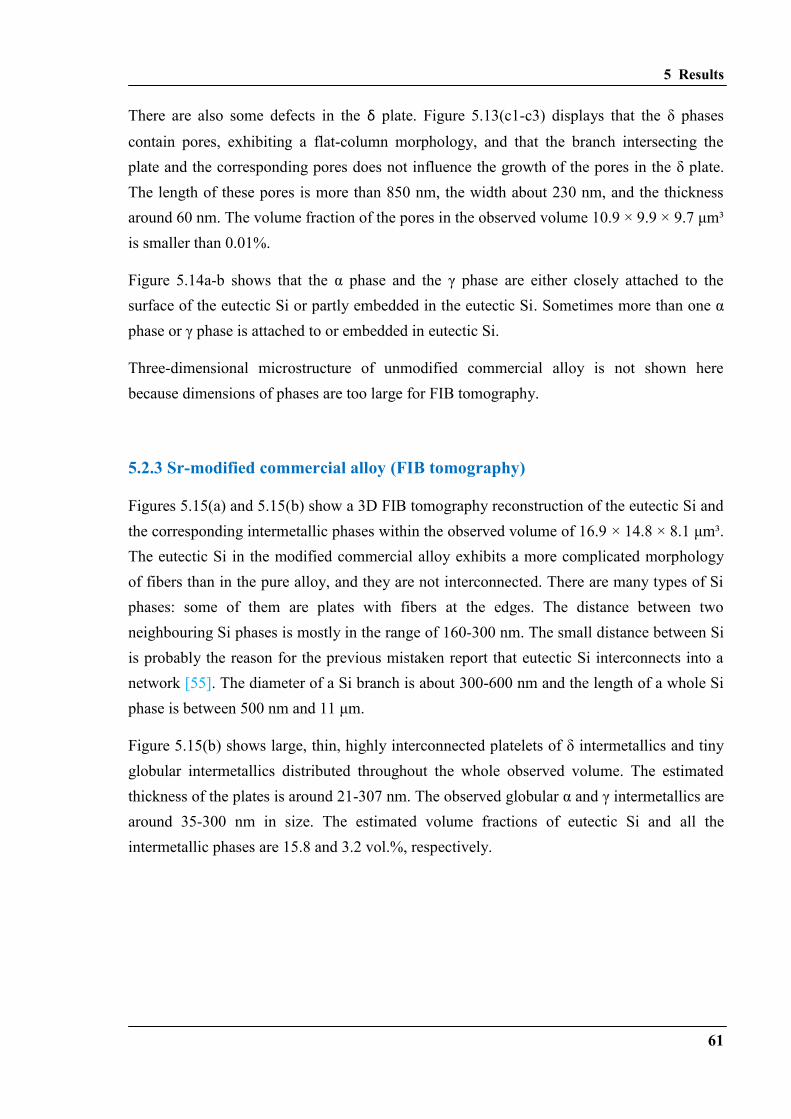
5 Results
61
There are also some defects in the δ plate. Figure 5.13(c1-c3) displays that the δ phases
contain pores, exhibiting a flat-column morphology, and that the branch intersecting the
plate and the corresponding pores does not influence the growth of the pores in the δ plate.
The length of these pores is more than 850 nm, the width about 230 nm, and the thickness
around 60 nm. The volume fraction of the pores in the observed volume 10.9 × 9.9 × 9.7 μm³
is smaller than 0.01%.
Figure 5.14a-b shows that the α phase and the γ phase are either closely attached to the
surface of the eutectic Si or partly embedded in the eutectic Si. Sometimes more than one α
phase or γ phase is attached to or embedded in eutectic Si.
Three-dimensional microstructure of unmodified commercial alloy is not shown here
because dimensions of phases are too large for FIB tomography.
5.2.3 Sr-modified commercial alloy (FIB tomography)
Figures 5.15(a) and 5.15(b) show a 3D FIB tomography reconstruction of the eutectic Si and
the corresponding intermetallic phases within the observed volume of 16.9 × 14.8 × 8.1 μm³.
The eutectic Si in the modified commercial alloy exhibits a more complicated morphology
of fibers than in the pure alloy, and they are not interconnected. There are many types of Si
phases: some of them are plates with fibers at the edges. The distance between two
neighbouring Si phases is mostly in the range of 160-300 nm. The small distance between Si
is probably the reason for the previous mistaken report that eutectic Si interconnects into a
network [55]. The diameter of a Si branch is about 300-600 nm and the length of a whole Si
phase is between 500 nm and 11 μm.
Figure 5.15(b) shows large, thin, highly interconnected platelets of δ intermetallics and tiny
globular intermetallics distributed throughout the whole observed volume. The estimated
thickness of the plates is around 21-307 nm. The observed globular α and γ intermetallics are
around 35-300 nm in size. The estimated volume fractions of eutectic Si and all the
intermetallic phases are 15.8 and 3.2 vol.%, respectively.
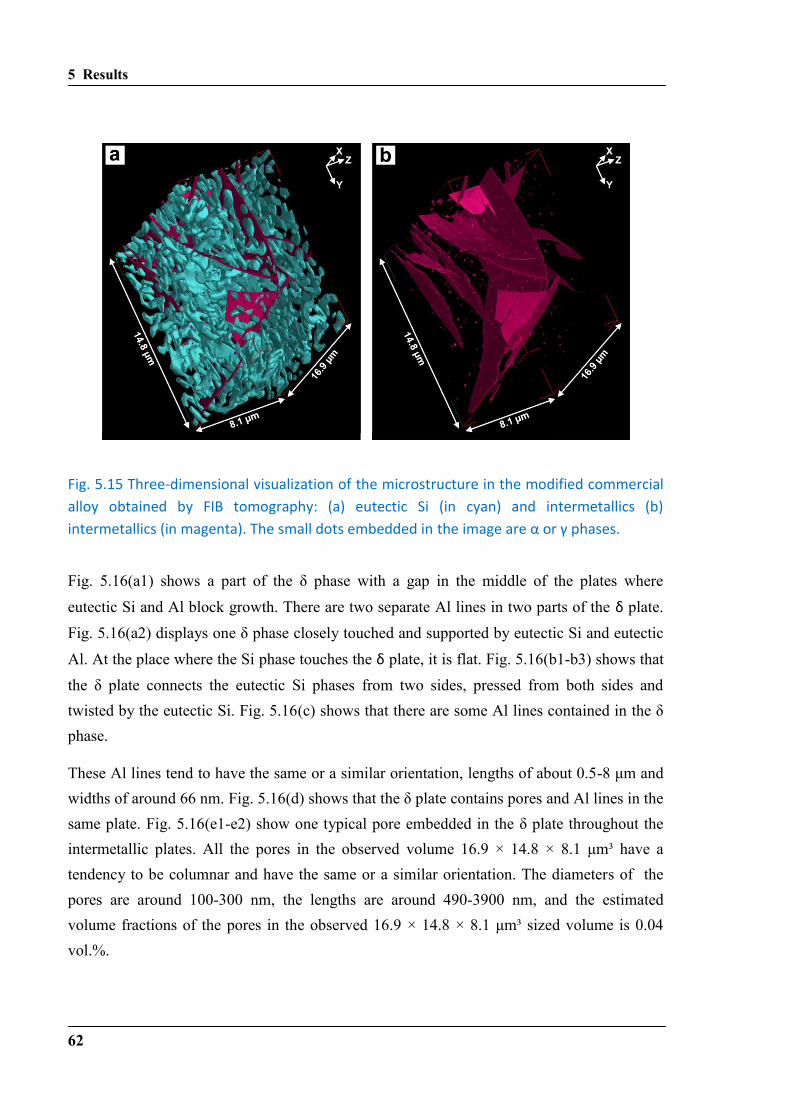
5 Results
62
Fig. 5.15 Three-dimensional visualization of the microstructure in the modified commercial
alloy obtained by FIB tomography: (a) eutectic Si (in cyan) and intermetallics (b)
intermetallics (in magenta). The small dots embedded in the image are α or γ phases.
Fig. 5.16(a1) shows a part of the δ phase with a gap in the middle of the plates where
eutectic Si and Al block growth. There are two separate Al lines in two parts of the δ plate.
Fig. 5.16(a2) displays one δ phase closely touched and supported by eutectic Si and eutectic
Al. At the place where the Si phase touches the δ plate, it is flat. Fig. 5.16(b1-b3) shows that
the δ plate connects the eutectic Si phases from two sides, pressed from both sides and
twisted by the eutectic Si. Fig. 5.16(c) shows that there are some Al lines contained in the δ
phase.
These Al lines tend to have the same or a similar orientation, lengths of about 0.5-8 μm and
widths of around 66 nm. Fig. 5.16(d) shows that the δ plate contains pores and Al lines in the
same plate. Fig. 5.16(e1-e2) show one typical pore embedded in the δ plate throughout the
intermetallic plates. All the pores in the observed volume 16.9 × 14.8 × 8.1 μm³ have a
tendency to be columnar and have the same or a similar orientation. The diameters of the
pores are around 100-300 nm, the lengths are around 490-3900 nm, and the estimated
volume fractions of the pores in the observed 16.9 × 14.8 × 8.1 μm³ sized volume is 0.04
vol.%.
5 Results
63
Fig. 5.16 Microstructural features of the δ phase in the modified commercial alloy: (a ) δ
phase blocked by Si, and an Al line embedded in the δ phase; (a ) eutectic Si and δ phase in
the middle; (b ) eutectic Si touching the δ plate at one end; (b ) Si denting on a δ phase;
(b3) two eutectic Si phases twisting a δ plate; (c) Al lines in the δ plate marked by arrows;
(d) pores and Al coexisting in the δ plate; (e ) pores in the δ plate; (e2) light-grey pores. (all
figures: eutectic Si in cyan, intermetallics in magenta and pores in gray, Al in black).
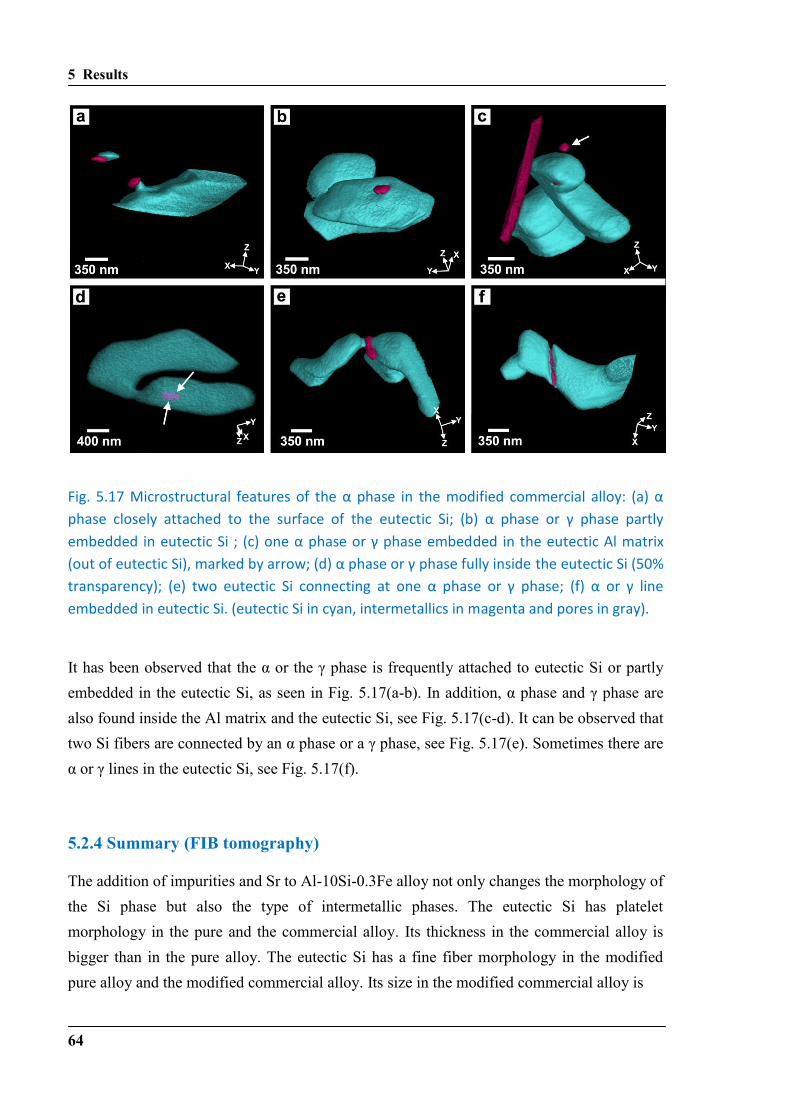
5 Results
64
Fig. 5.17 Microstructural features of the α phase in the modified commercial alloy: (a) α
phase closely attached to the surface of the eutectic Si; (b) α phase or γ phase partly
embedded in eutectic Si ; (c) one α phase or γ phase embedded in the eutectic Al matrix
(out of eutectic Si), marked by arrow; (d) α phase or γ phase fully inside the eutectic Si (50%
transparency); (e) two eutectic Si connecting at one α phase or γ phase; (f) α or γ line
embedded in eutectic Si. (eutectic Si in cyan, intermetallics in magenta and pores in gray).
It has been observed that the α or the γ phase is frequently attached to eutectic Si or partly
embedded in the eutectic Si, as seen in Fig. 5.17(a-b). In addition, α phase and γ phase are
also found inside the Al matrix and the eutectic Si, see Fig. 5.17(c-d). It can be observed that
two Si fibers are connected by an α phase or a γ phase, see Fig. 5.17(e). Sometimes there are
α or γ lines in the eutectic Si, see Fig. 5.17(f).
5.2.4 Summary (FIB tomography)
The addition of impurities and Sr to Al-10Si-0.3Fe alloy not only changes the morphology of
the Si phase but also the type of intermetallic phases. The eutectic Si has platelet
morphology in the pure and the commercial alloy. Its thickness in the commercial alloy is
bigger than in the pure alloy. The eutectic Si has a fine fiber morphology in the modified
pure alloy and the modified commercial alloy. Its size in the modified commercial alloy is
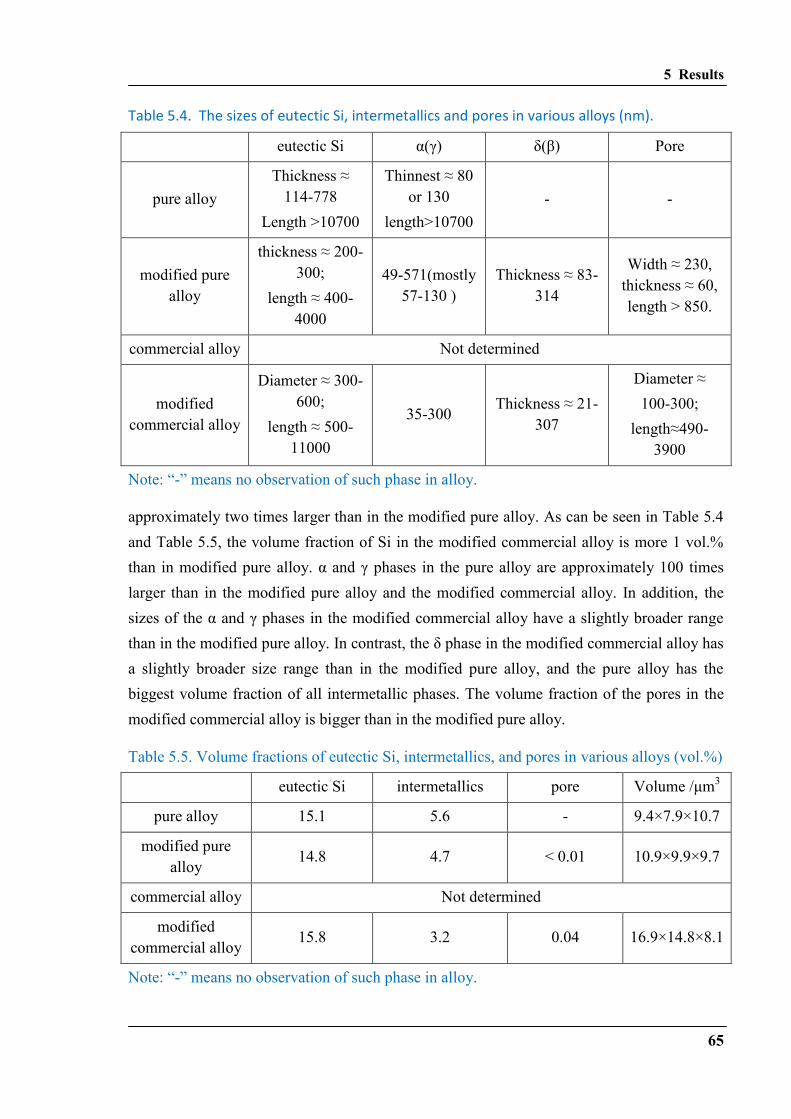
5 Results
65
Table 5.4. The sizes of eutectic Si, intermetallics and pores in various alloys (nm).
eutectic Si α(γ) δ(β) Pore
pure alloy
Thickness ≈
114-778
Length >10700
Thinnest ≈ 80
or 130
length>10700
- -
modified pure
alloy
thickness ≈ 200-
300;
length ≈ 400-
4000
49-571(mostly
57-130 )
Thickness ≈ 83-
314
Width ≈ 230,
thickness ≈ 60,
length > 850.
commercial alloy Not determined
modified
commercial alloy
Diameter ≈ 300-
600;
length ≈ 500-
11000
35-300 Thickness ≈ 21-
307
Diameter ≈
100-300;
length≈490-
3900
Note: “-” means no observation of such phase in alloy.
approximately two times larger than in the modified pure alloy. As can be seen in Table 5.4
and Table 5.5, the volume fraction of Si in the modified commercial alloy is more 1 vol.%
than in modified pure alloy. α and γ phases in the pure alloy are approximately 100 times
larger than in the modified pure alloy and the modified commercial alloy. In addition, the
sizes of the α and γ phases in the modified commercial alloy have a slightly broader range
than in the modified pure alloy. In contrast, the δ phase in the modified commercial alloy has
a slightly broader size range than in the modified pure alloy, and the pure alloy has the
biggest volume fraction of all intermetallic phases. The volume fraction of the pores in the
modified commercial alloy is bigger than in the modified pure alloy.
Table 5.5. Volume fractions of eutectic Si, intermetallics, and pores in various alloys (vol.%)
eutectic Si intermetallics pore Volume /μm3
pure alloy 15.1 5.6 - 9.4×7.9×10.7
modified pure
alloy 14.8 4.7 < 0.01 10.9×9.9×9.7
commercial alloy Not determined
modified
commercial alloy 15.8 3.2 0.04 16.9×14.8×8.1
Note: “-” means no observation of such phase in alloy.
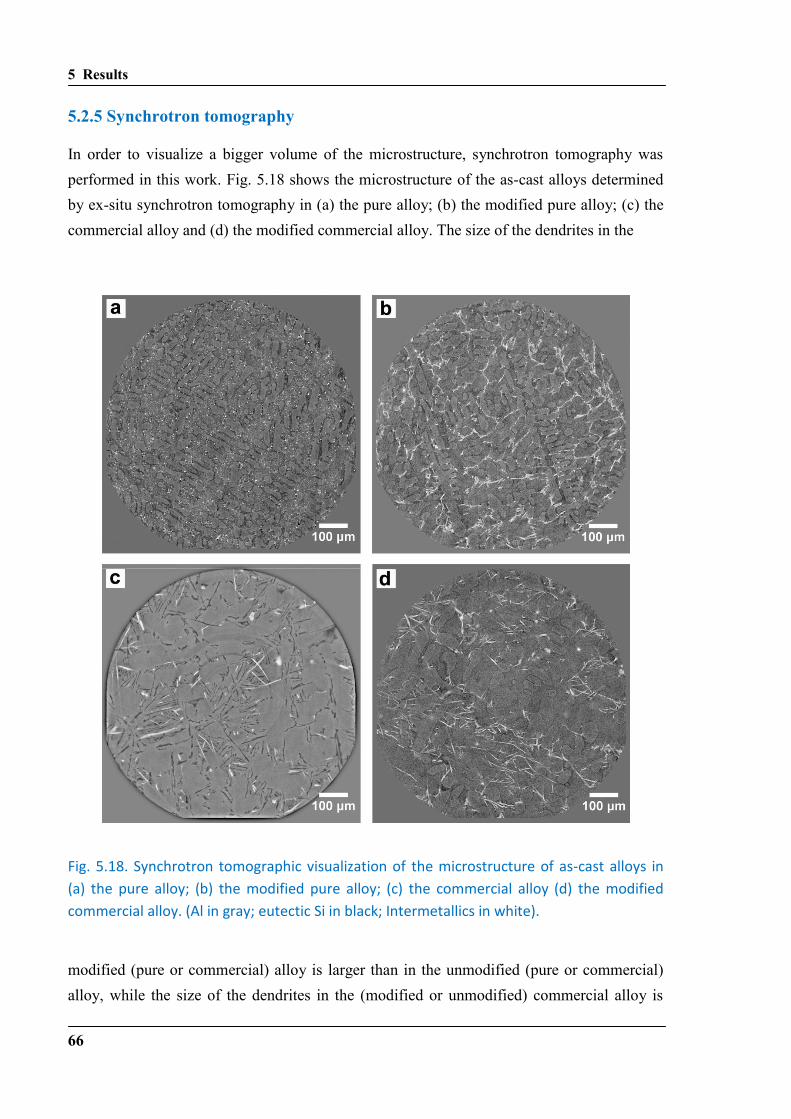
5 Results
66
5.2.5 Synchrotron tomography
In order to visualize a bigger volume of the microstructure, synchrotron tomography was
performed in this work. Fig. 5.18 shows the microstructure of the as-cast alloys determined
by ex-situ synchrotron tomography in (a) the pure alloy; (b) the modified pure alloy; (c) the
commercial alloy and (d) the modified commercial alloy. The size of the dendrites in the
Fig. 5.18. Synchrotron tomographic visualization of the microstructure of as-cast alloys in
(a) the pure alloy; (b) the modified pure alloy; (c) the commercial alloy (d) the modified
commercial alloy. (Al in gray; eutectic Si in black; Intermetallics in white).
modified (pure or commercial) alloy is larger than in the unmodified (pure or commercial)
alloy, while the size of the dendrites in the (modified or unmodified) commercial alloy is
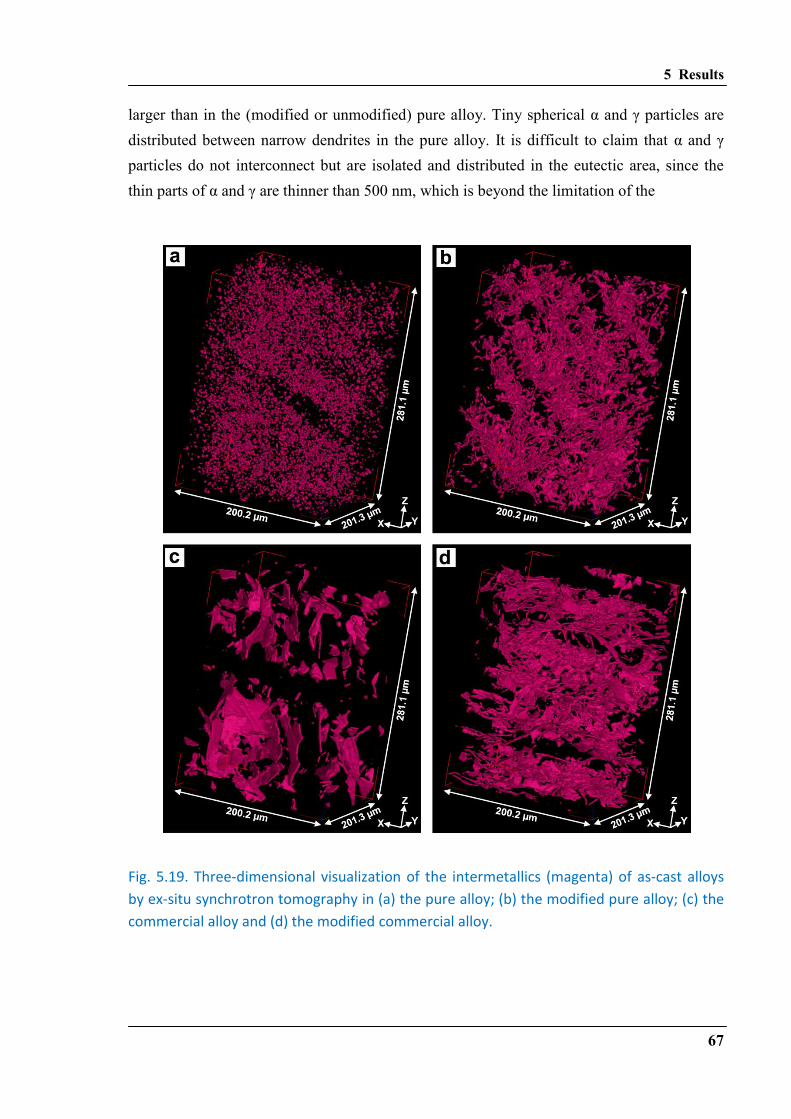
5 Results
67
larger than in the (modified or unmodified) pure alloy. Tiny spherical α and γ particles are
distributed between narrow dendrites in the pure alloy. It is difficult to claim that α and γ
particles do not interconnect but are isolated and distributed in the eutectic area, since the
thin parts of α and γ are thinner than 500 nm, which is beyond the limitation of the
Fig. 5.19. Three-dimensional visualization of the intermetallics (magenta) of as-cast alloys
by ex-situ synchrotron tomography in (a) the pure alloy; (b) the modified pure alloy; (c) the
commercial alloy and (d) the modified commercial alloy.
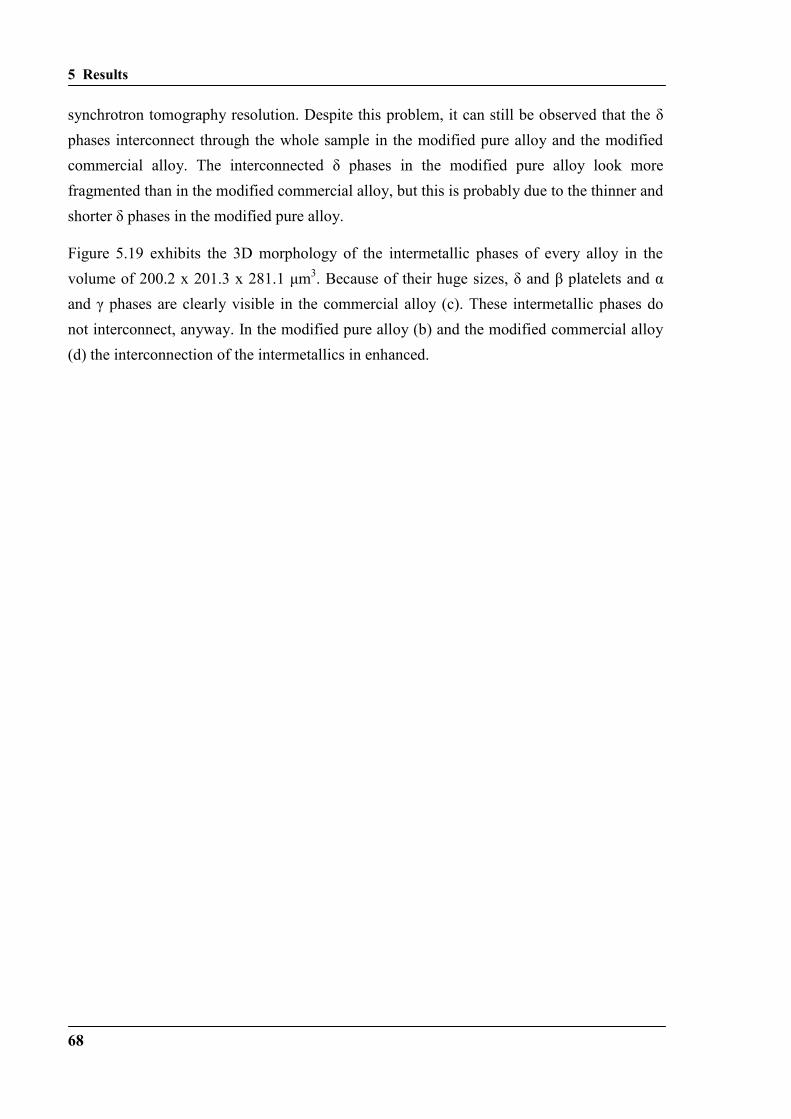
5 Results
68
synchrotron tomography resolution. Despite this problem, it can still be observed that the δ
phases interconnect through the whole sample in the modified pure alloy and the modified
commercial alloy. The interconnected δ phases in the modified pure alloy look more
fragmented than in the modified commercial alloy, but this is probably due to the thinner and
shorter δ phases in the modified pure alloy.
Figure 5.19 exhibits the 3D morphology of the intermetallic phases of every alloy in the
volume of 200.2 x 201.3 x 281.1 μm3. Because of their huge sizes, δ and β platelets and α
and γ phases are clearly visible in the commercial alloy (c). These intermetallic phases do
not interconnect, anyway. In the modified pure alloy (b) and the modified commercial alloy
(d) the interconnection of the intermetallics in enhanced.
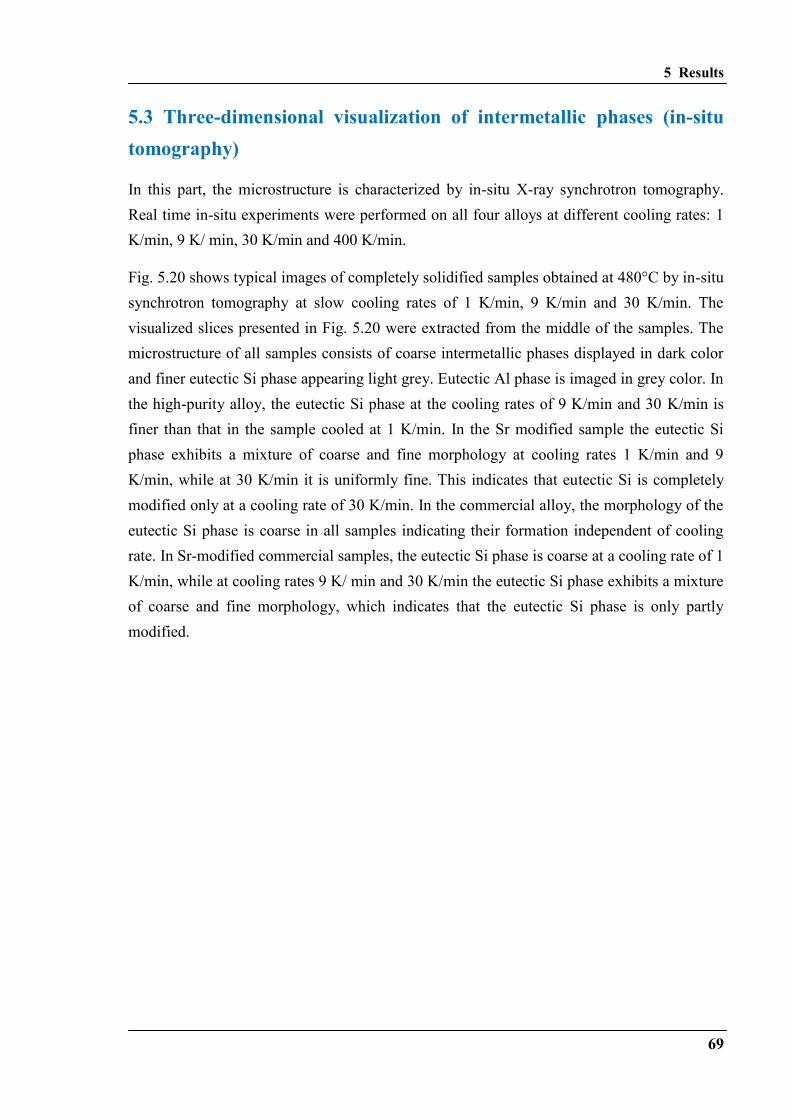
5 Results
69
5.3 Three-dimensional visualization of intermetallic phases (in-situ
tomography)
In this part, the microstructure is characterized by in-situ X-ray synchrotron tomography.
Real time in-situ experiments were performed on all four alloys at different cooling rates: 1
K/min, 9 K/ min, 30 K/min and 400 K/min.
Fig. 5.20 shows typical images of completely solidified samples obtained at 480°C by in-situ
synchrotron tomography at slow cooling rates of 1 K/min, 9 K/min and 30 K/min. The
visualized slices presented in Fig. 5.20 were extracted from the middle of the samples. The
microstructure of all samples consists of coarse intermetallic phases displayed in dark color
and finer eutectic Si phase appearing light grey. Eutectic Al phase is imaged in grey color. In
the high-purity alloy, the eutectic Si phase at the cooling rates of 9 K/min and 30 K/min is
finer than that in the sample cooled at 1 K/min. In the Sr modified sample the eutectic Si
phase exhibits a mixture of coarse and fine morphology at cooling rates 1 K/min and 9
K/min, while at 30 K/min it is uniformly fine. This indicates that eutectic Si is completely
modified only at a cooling rate of 30 K/min. In the commercial alloy, the morphology of the
eutectic Si phase is coarse in all samples indicating their formation independent of cooling
rate. In Sr-modified commercial samples, the eutectic Si phase is coarse at a cooling rate of 1
K/min, while at cooling rates 9 K/ min and 30 K/min the eutectic Si phase exhibits a mixture
of coarse and fine morphology, which indicates that the eutectic Si phase is only partly
modified.
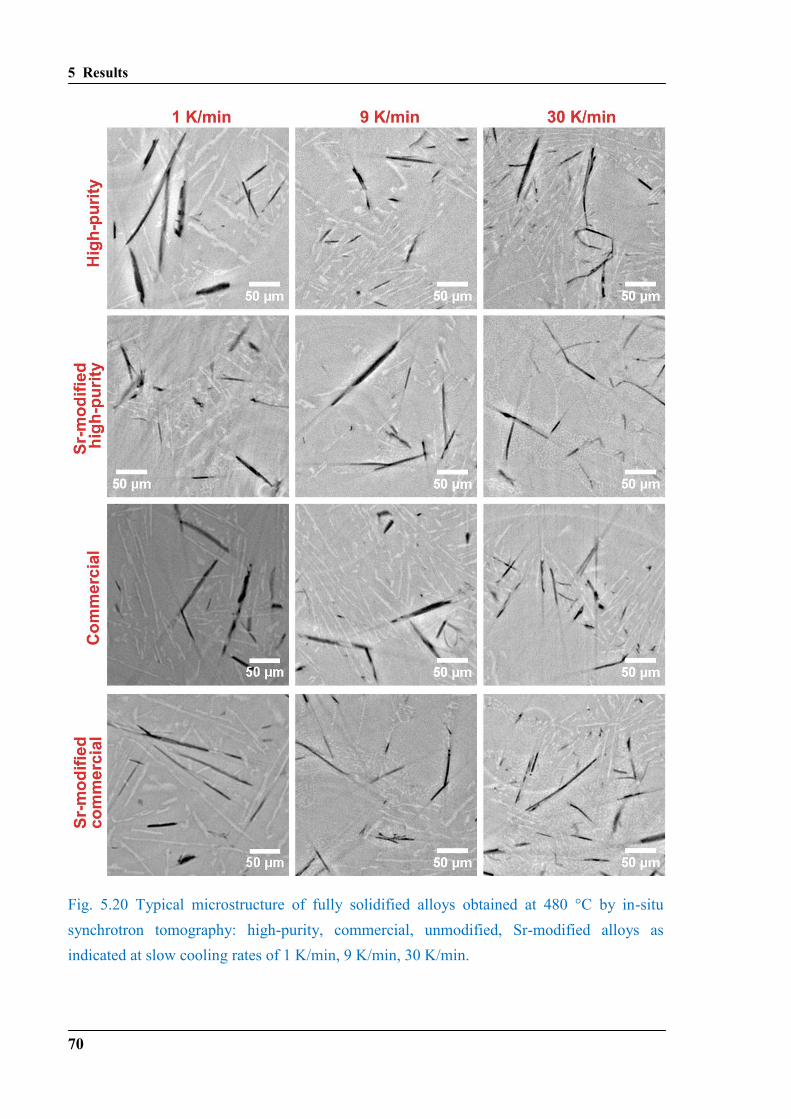
5 Results
70
Fig. 5.20 Typical microstructure of fully solidified alloys obtained at 480 °C by in-situ
synchrotron tomography: high-purity, commercial, unmodified, Sr-modified alloys as
indicated at slow cooling rates of 1 K/min, 9 K/min, 30 K/min.
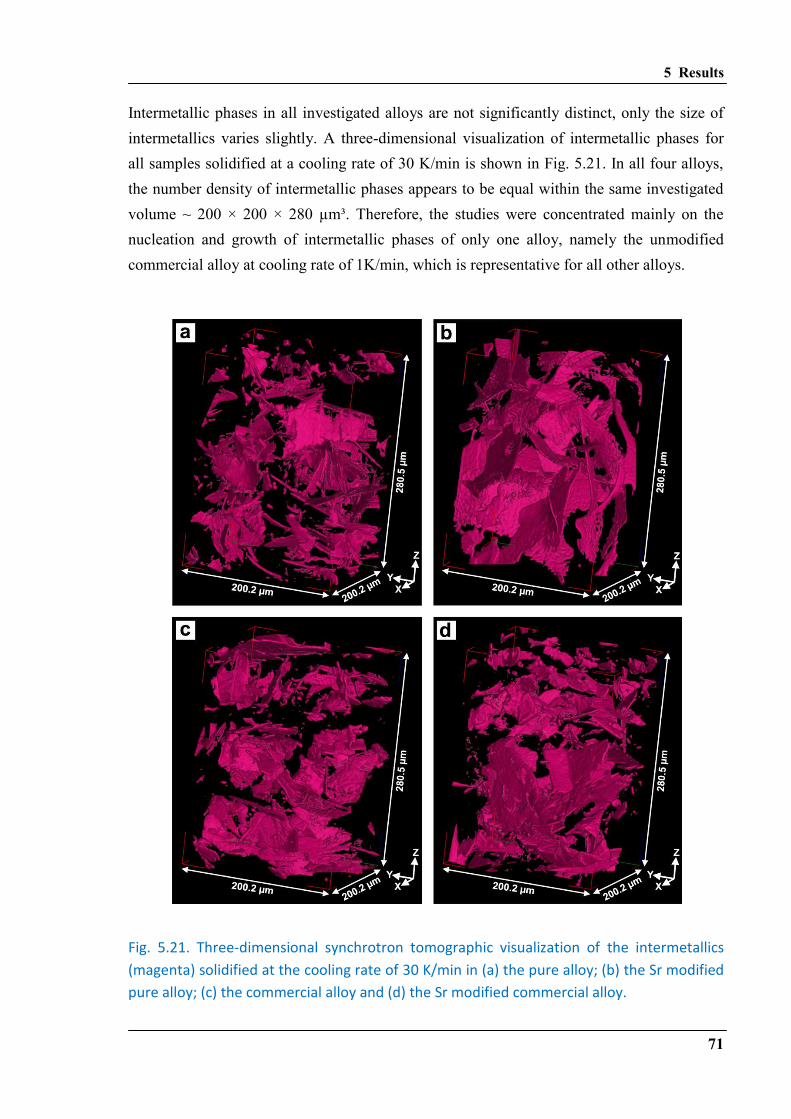
5 Results
71
Intermetallic phases in all investigated alloys are not significantly distinct, only the size of
intermetallics varies slightly. A three-dimensional visualization of intermetallic phases for
all samples solidified at a cooling rate of 30 K/min is shown in Fig. 5.21. In all four alloys,
the number density of intermetallic phases appears to be equal within the same investigated
volume ~ 200 × 200 × 280 µm³. Therefore, the studies were concentrated mainly on the
nucleation and growth of intermetallic phases of only one alloy, namely the unmodified
commercial alloy at cooling rate of 1K/min, which is representative for all other alloys.
Fig. 5.21. Three-dimensional synchrotron tomographic visualization of the intermetallics
(magenta) solidified at the cooling rate of 30 K/min in (a) the pure alloy; (b) the Sr modified
pure alloy; (c) the commercial alloy and (d) the Sr modified commercial alloy.
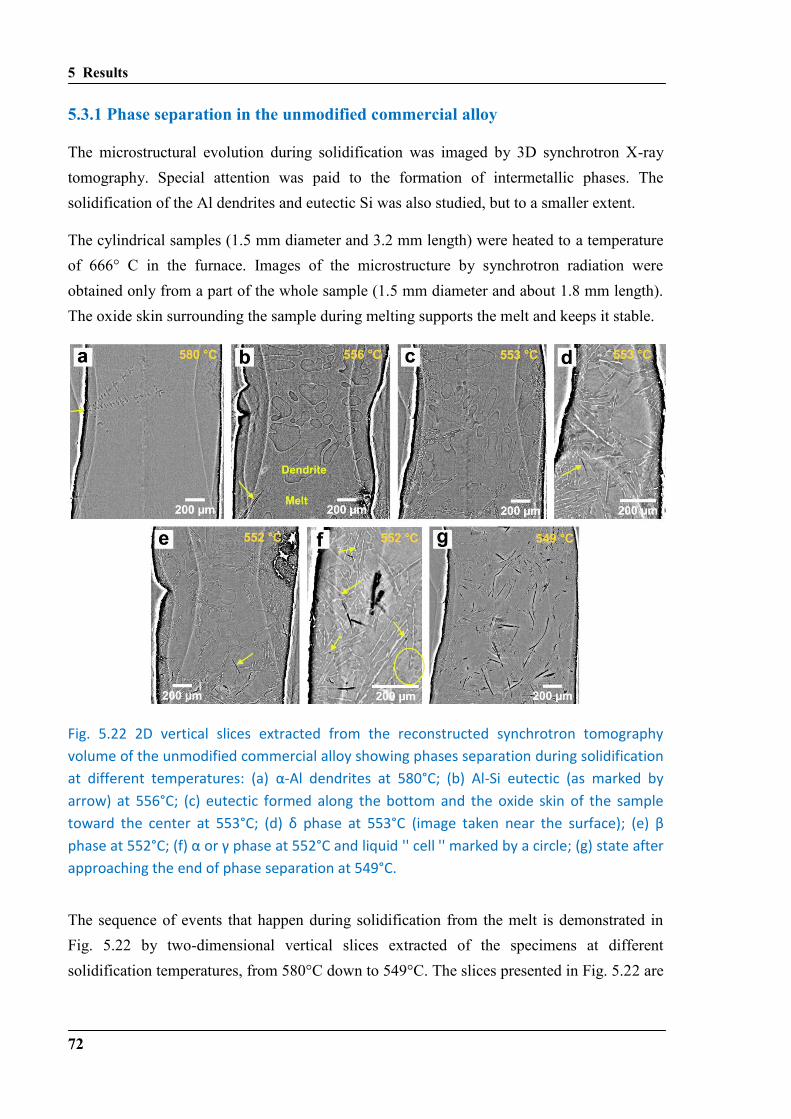
5 Results
72
5.3.1 Phase separation in the unmodified commercial alloy
The microstructural evolution during solidification was imaged by 3D synchrotron X-ray
tomography. Special attention was paid to the formation of intermetallic phases. The
solidification of the Al dendrites and eutectic Si was also studied, but to a smaller extent.
The cylindrical samples (1.5 mm diameter and 3.2 mm length) were heated to a temperature
of 666° C in the furnace. Images of the microstructure by synchrotron radiation were
obtained only from a part of the whole sample (1.5 mm diameter and about 1.8 mm length).
The oxide skin surrounding the sample during melting supports the melt and keeps it stable.
Fig. 5.22 2D vertical slices extracted from the reconstructed synchrotron tomography
volume of the unmodified commercial alloy showing phases separation during solidification
at different temperatures: (a) α-Al dendrites at 580°C; (b) Al-Si eutectic (as marked by
arrow) at 556°C; (c) eutectic formed along the bottom and the oxide skin of the sample
toward the center at 3°C; (d) δ phase at 3°C (image taken near the surface); (e) β
phase at °C; (f) α or γ phase at 552°C and liquid '' cell '' marked by a circle; (g) state after
approaching the end of phase separation at 549°C.
The sequence of events that happen during solidification from the melt is demonstrated in
Fig. 5.22 by two-dimensional vertical slices extracted of the specimens at different
solidification temperatures, from 580°C down to 549°C. The slices presented in Fig. 5.22 are
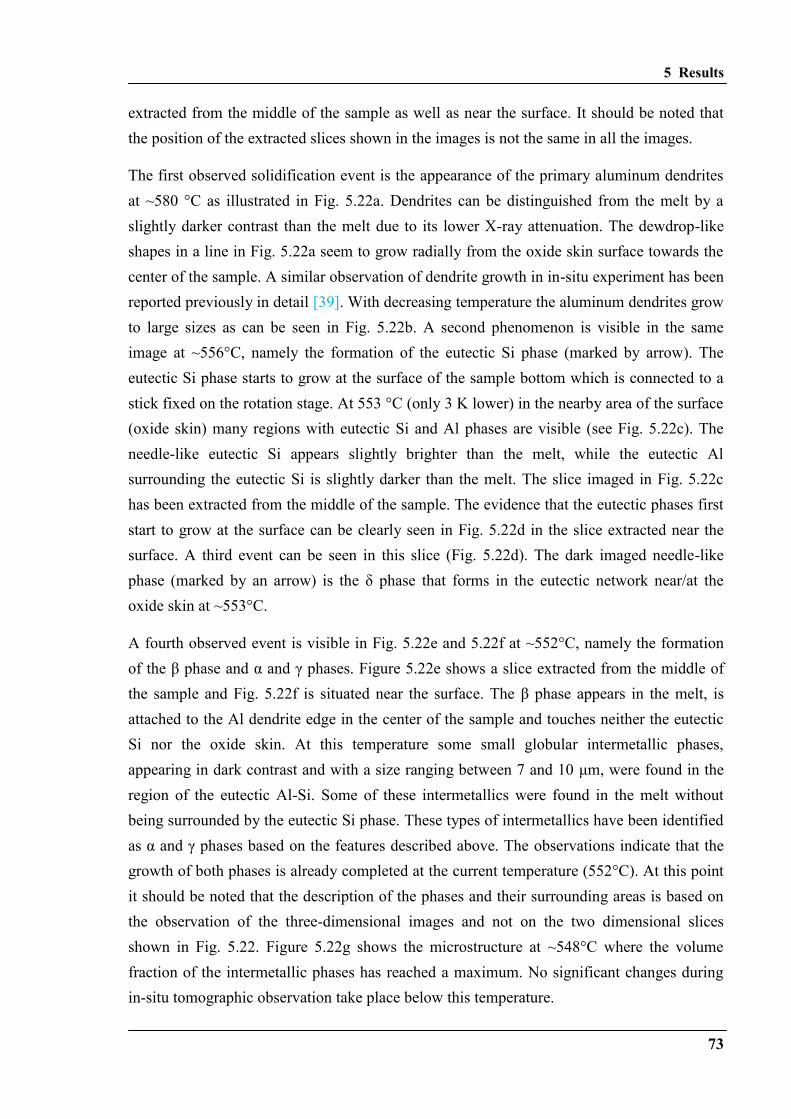
5 Results
73
extracted from the middle of the sample as well as near the surface. It should be noted that
the position of the extracted slices shown in the images is not the same in all the images.
The first observed solidification event is the appearance of the primary aluminum dendrites
at ~580 °C as illustrated in Fig. 5.22a. Dendrites can be distinguished from the melt by a
slightly darker contrast than the melt due to its lower X-ray attenuation. The dewdrop-like
shapes in a line in Fig. 5.22a seem to grow radially from the oxide skin surface towards the
center of the sample. A similar observation of dendrite growth in in-situ experiment has been
reported previously in detail [39]. With decreasing temperature the aluminum dendrites grow
to large sizes as can be seen in Fig. 5.22b. A second phenomenon is visible in the same
image at ~556°C, namely the formation of the eutectic Si phase (marked by arrow). The
eutectic Si phase starts to grow at the surface of the sample bottom which is connected to a
stick fixed on the rotation stage. At 553 °C (only 3 K lower) in the nearby area of the surface
(oxide skin) many regions with eutectic Si and Al phases are visible (see Fig. 5.22c). The
needle-like eutectic Si appears slightly brighter than the melt, while the eutectic Al
surrounding the eutectic Si is slightly darker than the melt. The slice imaged in Fig. 5.22c
has been extracted from the middle of the sample. The evidence that the eutectic phases first
start to grow at the surface can be clearly seen in Fig. 5.22d in the slice extracted near the
surface. A third event can be seen in this slice (Fig. 5.22d). The dark imaged needle-like
phase (marked by an arrow) is the δ phase that forms in the eutectic network near/at the
oxide skin at ~553°C.
A fourth observed event is visible in Fig. 5.22e and 5.22f at ~552°C, namely the formation
of the β phase and α and γ phases. Figure 5.22e shows a slice extracted from the middle of
the sample and Fig. 5.22f is situated near the surface. The β phase appears in the melt, is
attached to the Al dendrite edge in the center of the sample and touches neither the eutectic
Si nor the oxide skin. At this temperature some small globular intermetallic phases,
appearing in dark contrast and with a size ranging between 7 and 10 μm, were found in the
region of the eutectic Al-Si. Some of these intermetallics were found in the melt without
being surrounded by the eutectic Si phase. These types of intermetallics have been identified
as α and γ phases based on the features described above. The observations indicate that the
growth of both phases is already completed at the current temperature (552°C). At this point
it should be noted that the description of the phases and their surrounding areas is based on
the observation of the three-dimensional images and not on the two dimensional slices
shown in Fig. 5.22. Figure 5.22g shows the microstructure at ~548°C where the volume
fraction of the intermetallic phases has reached a maximum. No significant changes during
in-situ tomographic observation take place below this temperature.
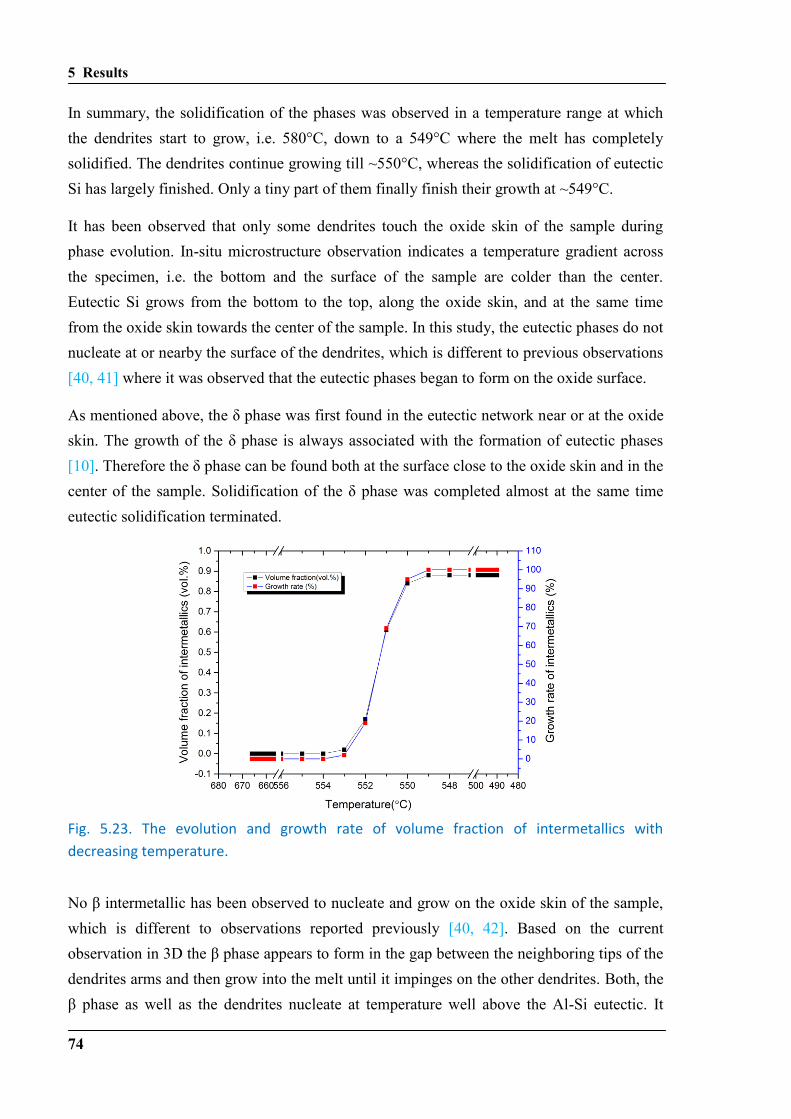
5 Results
74
In summary, the solidification of the phases was observed in a temperature range at which
the dendrites start to grow, i.e. 580°C, down to a 549°C where the melt has completely
solidified. The dendrites continue growing till ~550°C, whereas the solidification of eutectic
Si has largely finished. Only a tiny part of them finally finish their growth at ~549°C.
It has been observed that only some dendrites touch the oxide skin of the sample during
phase evolution. In-situ microstructure observation indicates a temperature gradient across
the specimen, i.e. the bottom and the surface of the sample are colder than the center.
Eutectic Si grows from the bottom to the top, along the oxide skin, and at the same time
from the oxide skin towards the center of the sample. In this study, the eutectic phases do not
nucleate at or nearby the surface of the dendrites, which is different to previous observations
[40, 41] where it was observed that the eutectic phases began to form on the oxide surface.
As mentioned above, the δ phase was first found in the eutectic network near or at the oxide
skin. The growth of the δ phase is always associated with the formation of eutectic phases
[10]. Therefore the δ phase can be found both at the surface close to the oxide skin and in the
center of the sample. Solidification of the δ phase was completed almost at the same time
eutectic solidification terminated.
Fig. 5.23. The evolution and growth rate of volume fraction of intermetallics with
decreasing temperature.
No β intermetallic has been observed to nucleate and grow on the oxide skin of the sample,
which is different to observations reported previously [40, 42]. Based on the current
observation in 3D the β phase appears to form in the gap between the neighboring tips of the
dendrites arms and then grow into the melt until it impinges on the other dendrites. Both, the
β phase as well as the dendrites nucleate at temperature well above the Al-Si eutectic. It
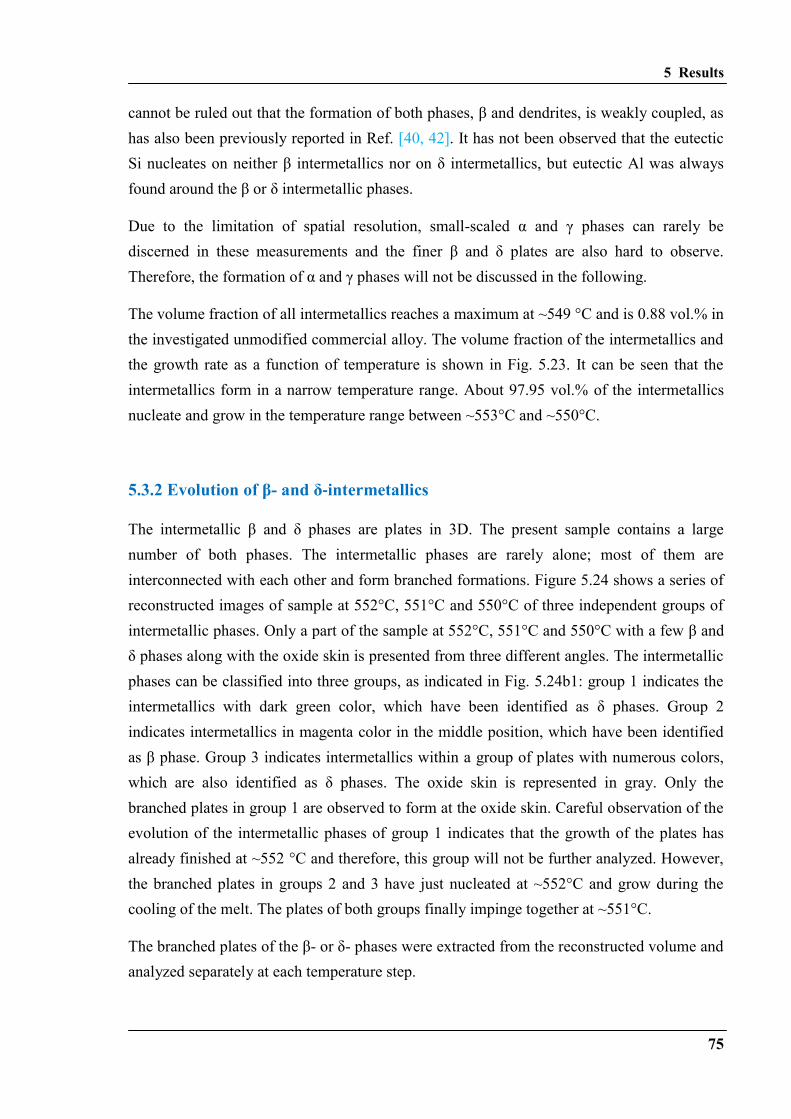
5 Results
75
cannot be ruled out that the formation of both phases, β and dendrites, is weakly coupled, as
has also been previously reported in Ref. [40, 42]. It has not been observed that the eutectic
Si nucleates on neither β intermetallics nor on δ intermetallics, but eutectic Al was always
found around the β or δ intermetallic phases.
Due to the limitation of spatial resolution, small-scaled α and γ phases can rarely be
discerned in these measurements and the finer β and δ plates are also hard to observe.
Therefore, the formation of α and γ phases will not be discussed in the following.
The volume fraction of all intermetallics reaches a maximum at ~549 °C and is 0.88 vol.% in
the investigated unmodified commercial alloy. The volume fraction of the intermetallics and
the growth rate as a function of temperature is shown in Fig. 5.23. It can be seen that the
intermetallics form in a narrow temperature range. About 97.95 vol.% of the intermetallics
nucleate and grow in the temperature range between ~553°C and ~550°C.
5.3.2 Evolution of β- and δ-intermetallics
The intermetallic β and δ phases are plates in 3D. The present sample contains a large
number of both phases. The intermetallic phases are rarely alone; most of them are
interconnected with each other and form branched formations. Figure 5.24 shows a series of
reconstructed images of sample at 552°C, 551°C and 550°C of three independent groups of
intermetallic phases. Only a part of the sample at 552°C, 551°C and 550°C with a few β and
δ phases along with the oxide skin is presented from three different angles. The intermetallic
phases can be classified into three groups, as indicated in Fig. 5.24b1: group 1 indicates the
intermetallics with dark green color, which have been identified as δ phases. Group 2
indicates intermetallics in magenta color in the middle position, which have been identified
as β phase. Group 3 indicates intermetallics within a group of plates with numerous colors,
which are also identified as δ phases. The oxide skin is represented in gray. Only the
branched plates in group 1 are observed to form at the oxide skin. Careful observation of the
evolution of the intermetallic phases of group 1 indicates that the growth of the plates has
already finished at ~552 °C and therefore, this group will not be further analyzed. However,
the branched plates in groups 2 and 3 have just nucleated at ~552°C and grow during the
cooling of the melt. The plates of both groups finally impinge together at ~551°C.
The branched plates of the β- or δ- phases were extracted from the reconstructed volume and
analyzed separately at each temperature step.
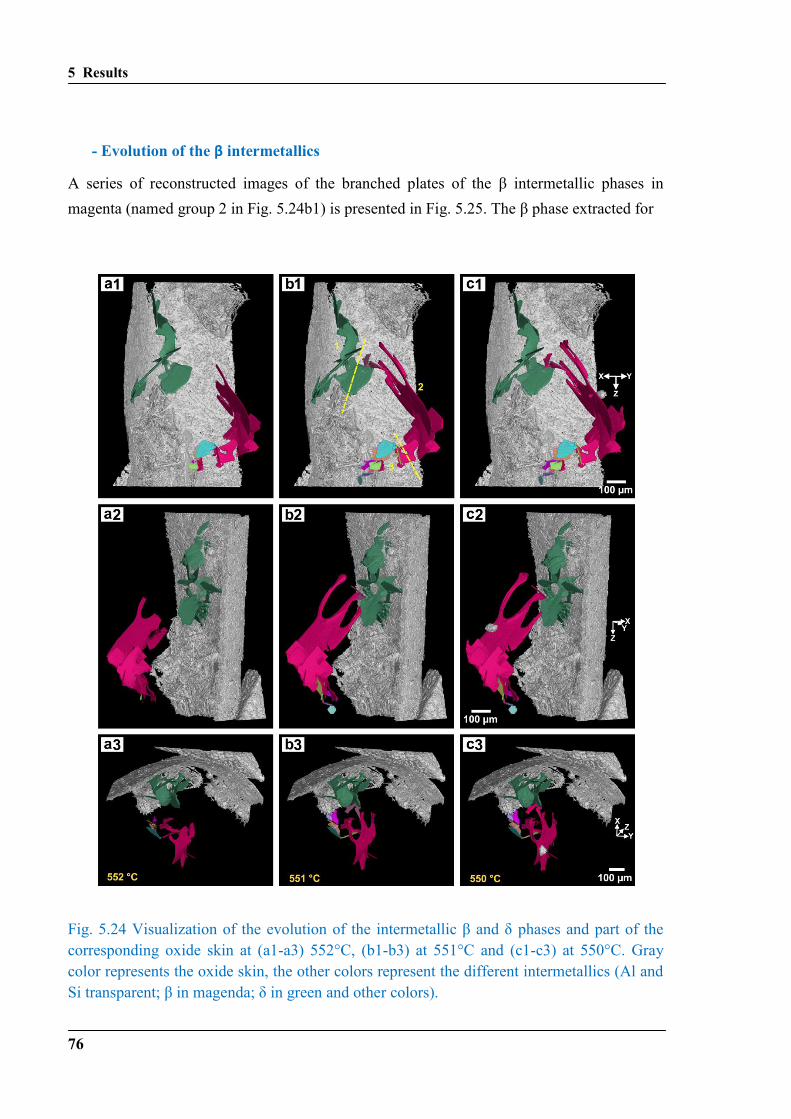
5 Results
76
- Evolution of the β intermetallics
A series of reconstructed images of the branched plates of the β intermetallic phases in
magenta (named group 2 in Fig. 5.24b1) is presented in Fig. 5.25. The β phase extracted for
Fig. 5.24 Visualization of the evolution of the intermetallic β and δ phases and part of the
corresponding oxide skin at (a1-a3) 552°C, (b1-b3) at 551°C and (c1-c3) at 550°C. Gray
color represents the oxide skin, the other colors represent the different intermetallics (Al and
Si transparent; β in magenda; δ in green and other colors).
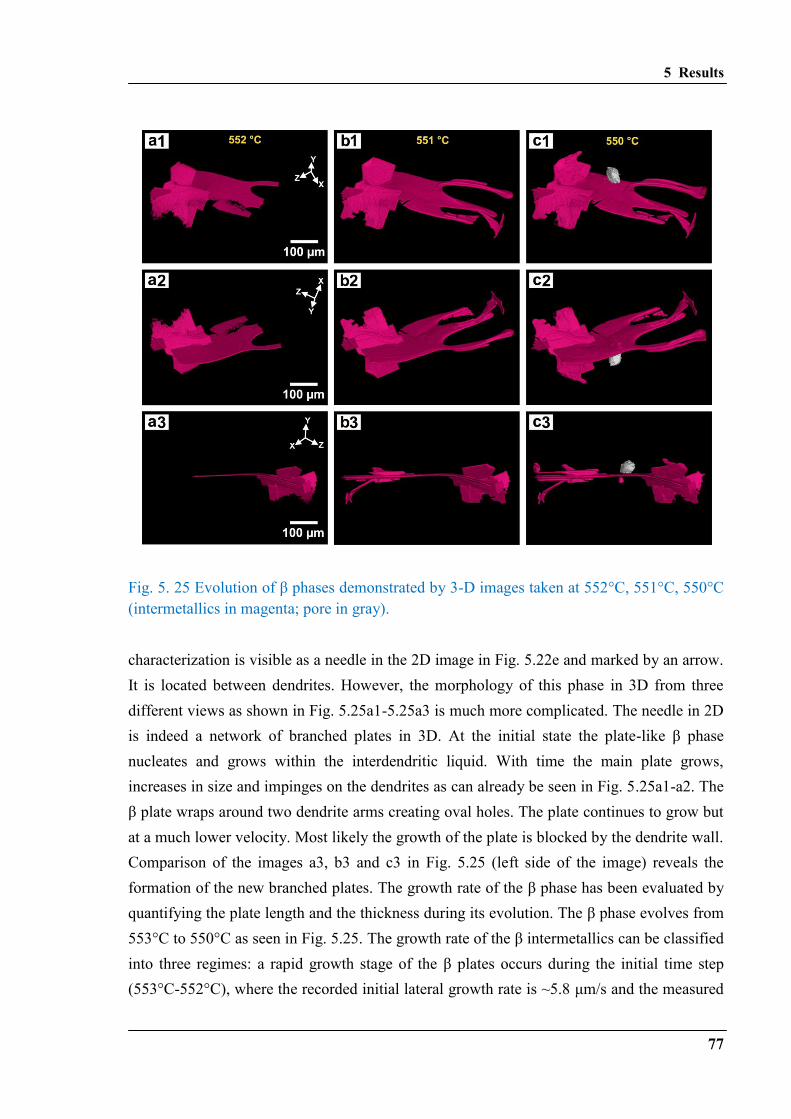
5 Results
77
Fig. 5. 25 Evolution of β phases demonstrated by 3-D images taken at 552°C, 551°C, 550°C
(intermetallics in magenta; pore in gray).
characterization is visible as a needle in the 2D image in Fig. 5.22e and marked by an arrow.
It is located between dendrites. However, the morphology of this phase in 3D from three
different views as shown in Fig. 5.25a1-5.25a3 is much more complicated. The needle in 2D
is indeed a network of branched plates in 3D. At the initial state the plate-like β phase
nucleates and grows within the interdendritic liquid. With time the main plate grows,
increases in size and impinges on the dendrites as can already be seen in Fig. 5.25a1-a2. The
β plate wraps around two dendrite arms creating oval holes. The plate continues to grow but
at a much lower velocity. Most likely the growth of the plate is blocked by the dendrite wall.
Comparison of the images a3, b3 and c3 in Fig. 5.25 (left side of the image) reveals the
formation of the new branched plates. The growth rate of the β phase has been evaluated by
quantifying the plate length and the thickness during its evolution. The β phase evolves from
553°C to 550°C as seen in Fig. 5.25. The growth rate of the β intermetallics can be classified
into three regimes: a rapid growth stage of the β plates occurs during the initial time step
(553°C-552°C), where the recorded initial lateral growth rate is ~5.8 μm/s and the measured
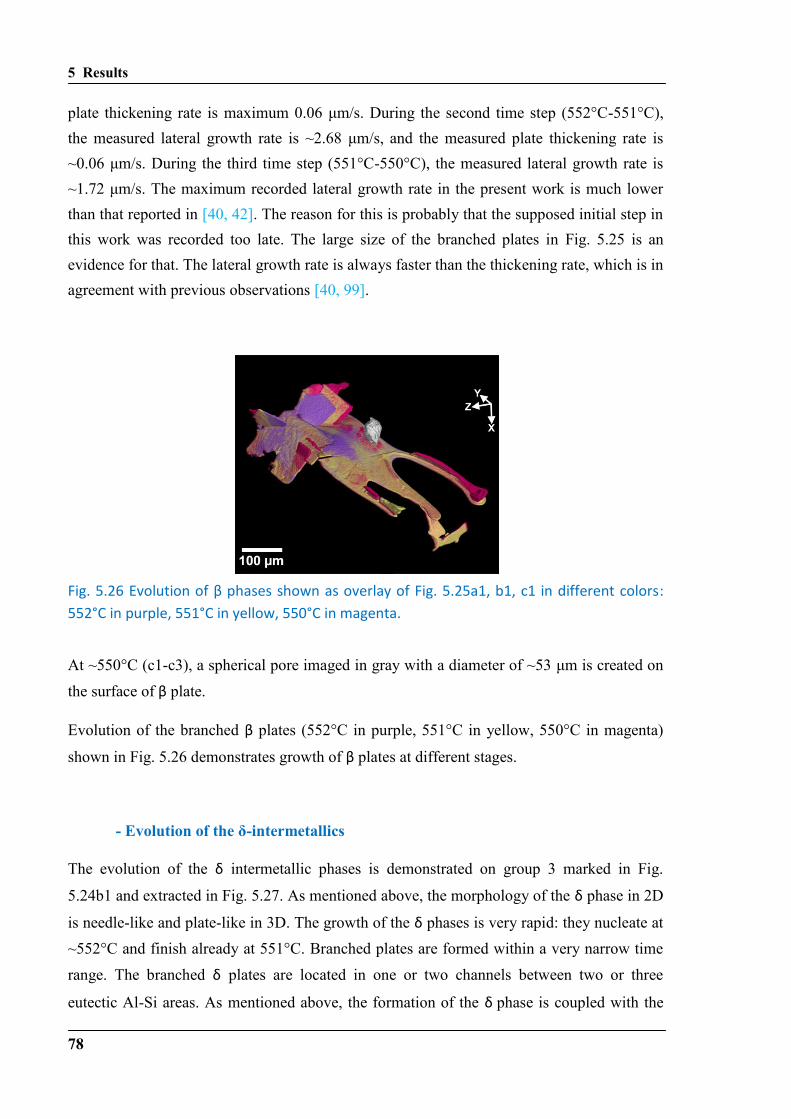
5 Results
78
plate thickening rate is maximum 0.06 μm/s. During the second time step (552°C-551°C),
the measured lateral growth rate is ~2.68 μm/s, and the measured plate thickening rate is
~0.06 μm/s. During the third time step (551°C-550°C), the measured lateral growth rate is
~1.72 μm/s. The maximum recorded lateral growth rate in the present work is much lower
than that reported in [40, 42]. The reason for this is probably that the supposed initial step in
this work was recorded too late. The large size of the branched plates in Fig. 5.25 is an
evidence for that. The lateral growth rate is always faster than the thickening rate, which is in
agreement with previous observations [40, 99].
Fig. . 6 Evolution of β phases shown as overlay of Fig. . a , b , c in different colors:
552°C in purple, 551°C in yellow, 550°C in magenta.
At ~550°C (c1-c3), a spherical pore imaged in gray with a diameter of ~53 μm is created on
the surface of β plate.
Evolution of the branched β plates (552°C in purple, 551°C in yellow, 550°C in magenta)
shown in Fig. 5.26 demonstrates growth of β plates at different stages.
- Evolution of the δ-intermetallics
The evolution of the δ intermetallic phases is demonstrated on group 3 marked in Fig.
5.24b1 and extracted in Fig. 5.27. As mentioned above, the morphology of the δ phase in 2D
is needle-like and plate-like in 3D. The growth of the δ phases is very rapid: they nucleate at
~552°C and finish already at 551°C. Branched plates are formed within a very narrow time
range. The branched δ plates are located in one or two channels between two or three
eutectic Al-Si areas. As mentioned above, the formation of the δphase is coupled with the
5 Results
79
nucleation and growth of the eutectic Al-Si phases. The δphases shown in Fig. 5.27 are
much smaller than the phases. It has to be noted that the environment in which the δand
phases are formed is different, and this difference affects the size of the phases.
The formation of the δ phase can be explained as follows. The dendrites and the eutectic Al-
Si grow during solidification and roughly separate the whole melt into many small areas
which can be called small droplets or cells (see Fig. 5.22f). The word "cell" is defined here
as small melt areas surrounded by eutectic Al-Si. Inside this irregularly shaped cell encircled
by solidified phases, the δ phase nucleates and grows towards the outer layer of the existing
eutectic Al-Si areas that have solidified before. The growth of the δ phase is finally blocked
by the newly formed eutectic Al-Si phases. It has been observed that the δ phase can also
nucleate and grow at the surface of pores and oxides in the cell, following the same
mechanism. Growth and interaction of the δ intermetallics rapidly evolve in the lateral
direction.
Since the δ plates only evolve from 553°C-551°C as seen in Fig. 5.27, their growth rate can
be classified into two periods. At each time step, rapid growth spurts of the δ plates happen
at the initial time step (553°C-552°C). The maximum recorded initial lateral growth rate is
~2.35 μm/s and the average initial lateral growth rate is ~1.22 μm/s. The maximum
measured plate thickening rate is 0.1 μm/s and the average thickening rate is ~0.07 μm/sec.
At the second time step (552°C-551°C), the maximum measured lateral growth rate is ~0.95
μm/s and the average lateral growth rate is ~0.33 μm/s. The measured maximum plate
thickening rate is ~0.05 μm/s and the average plate thickening rate is ~0.025 μm/s. These
growth rates are all in good agreement with previous observations [40, 42].
The formation of imprints such as depressions on the δ plates can be explained when the
growth of the thickness of the δ phases follows the surface of the already existing eutectic Si.
With the continuous solidification of the cell towards the enclosed melt of the cell, new δ
phases can nucleate and grow on the newly solidified eutectic Al-Si and impinge with the
previously formed δ phase in this cell. This process, during which several branches of δ
phases are produced, repeats itself until the whole cell has fully solidified. It is worth noting
that the nucleation and formation of δ and β plates in the same cell is possible if the
solidification of dendrites and eutectic Al-Si are both involved in the cell formation.
The existing δ phase also influences the melt environment, the solidification areas and the
solidification process in such a way that later formed δ plates impinge mainly on earlier
formed δ plates or that simultaneously formed δ plates impinge on each other. During that
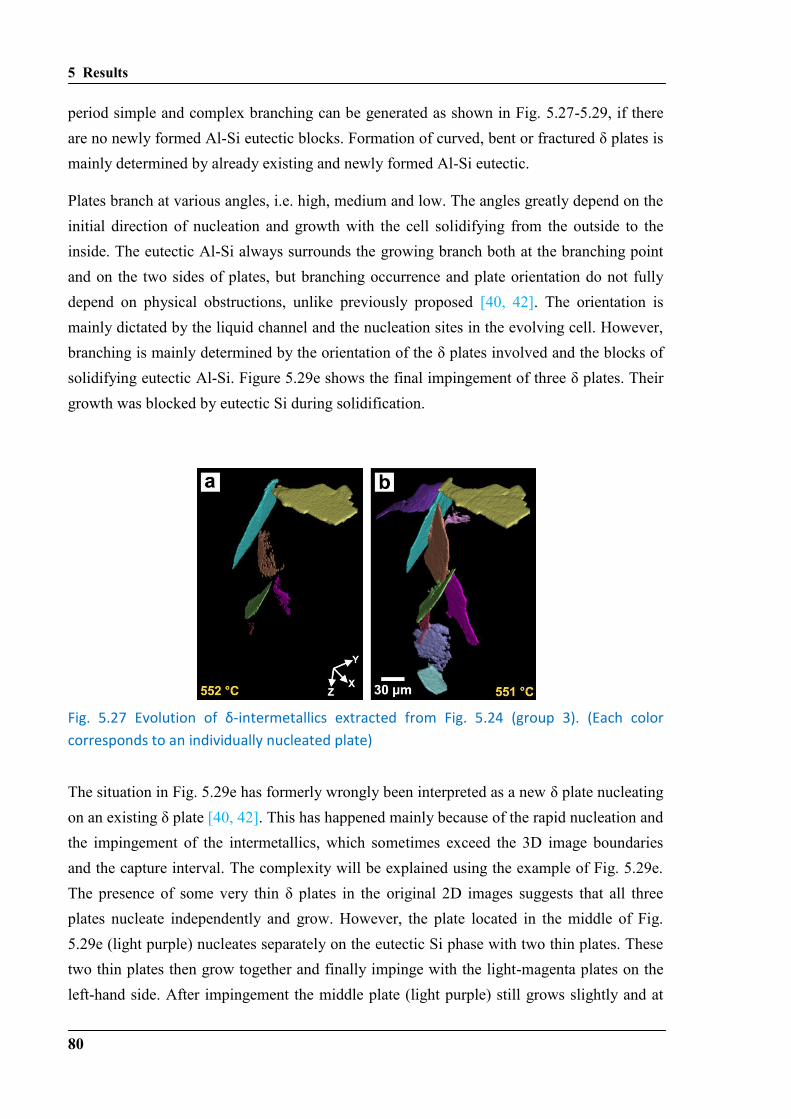
5 Results
80
period simple and complex branching can be generated as shown in Fig. 5.27-5.29, if there
are no newly formed Al-Si eutectic blocks. Formation of curved, bent or fractured δ plates is
mainly determined by already existing and newly formed Al-Si eutectic.
Plates branch at various angles, i.e. high, medium and low. The angles greatly depend on the
initial direction of nucleation and growth with the cell solidifying from the outside to the
inside. The eutectic Al-Si always surrounds the growing branch both at the branching point
and on the two sides of plates, but branching occurrence and plate orientation do not fully
depend on physical obstructions, unlike previously proposed [40, 42]. The orientation is
mainly dictated by the liquid channel and the nucleation sites in the evolving cell. However,
branching is mainly determined by the orientation of the δ plates involved and the blocks of
solidifying eutectic Al-Si. Figure 5.29e shows the final impingement of three δ plates. Their
growth was blocked by eutectic Si during solidification.
Fig. 5.27 Evolution of δ-intermetallics extracted from Fig. 5.24 (group 3). (Each color
corresponds to an individually nucleated plate)
The situation in Fig. 5.29e has formerly wrongly been interpreted as a new δ plate nucleating
on an existing δ plate [40, 42]. This has happened mainly because of the rapid nucleation and
the impingement of the intermetallics, which sometimes exceed the 3D image boundaries
and the capture interval. The complexity will be explained using the example of Fig. 5.29e.
The presence of some very thin δ plates in the original 2D images suggests that all three
plates nucleate independently and grow. However, the plate located in the middle of Fig.
5.29e (light purple) nucleates separately on the eutectic Si phase with two thin plates. These
two thin plates then grow together and finally impinge with the light-magenta plates on the
left-hand side. After impingement the middle plate (light purple) still grows slightly and at
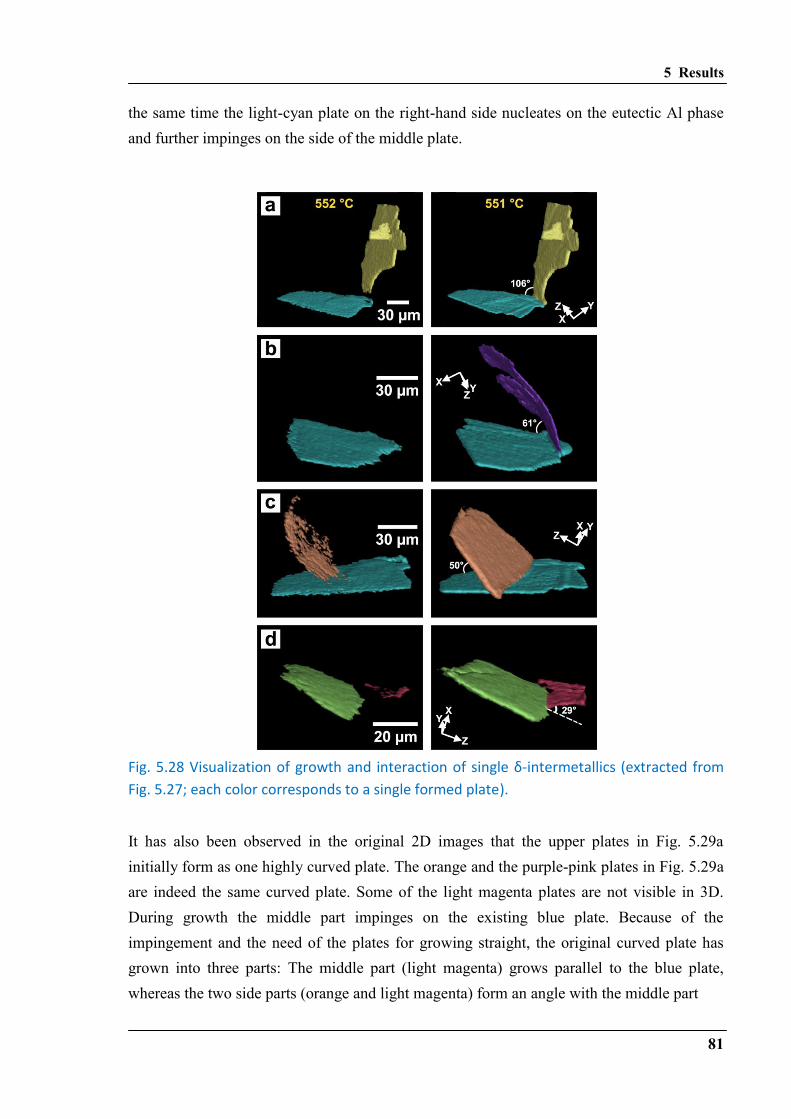
5 Results
81
the same time the light-cyan plate on the right-hand side nucleates on the eutectic Al phase
and further impinges on the side of the middle plate.
Fig. 5.28 Visualization of growth and interaction of single δ-intermetallics (extracted from
Fig. 5.27; each color corresponds to a single formed plate).
It has also been observed in the original 2D images that the upper plates in Fig. 5.29a
initially form as one highly curved plate. The orange and the purple-pink plates in Fig. 5.29a
are indeed the same curved plate. Some of the light magenta plates are not visible in 3D.
During growth the middle part impinges on the existing blue plate. Because of the
impingement and the need of the plates for growing straight, the original curved plate has
grown into three parts: The middle part (light magenta) grows parallel to the blue plate,
whereas the two side parts (orange and light magenta) form an angle with the middle part
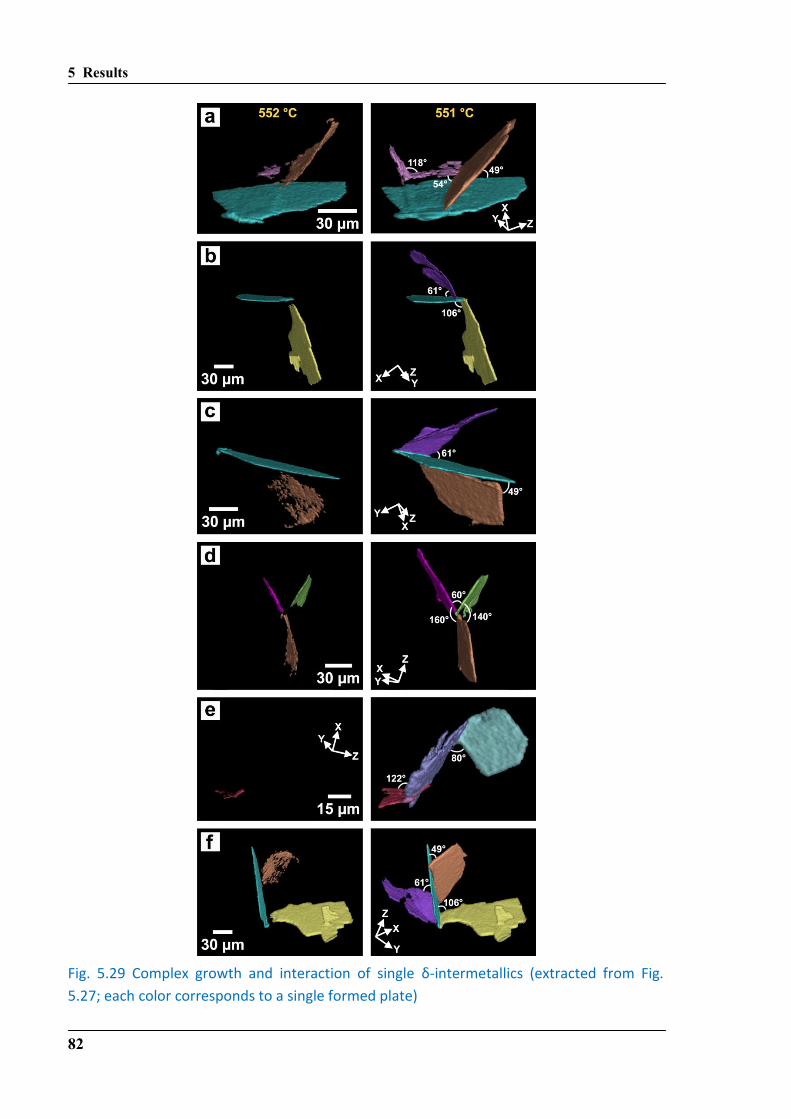
5 Results
82
Fig. 5.29 Complex growth and interaction of single δ-intermetallics (extracted from Fig.
5.27; each color corresponds to a single formed plate)

5 Results
83
and still grow a little. No eutectic Al-Si is involved during this straightening process.
According to the current observations, no new δ phase directly nucleates on the existing δ
phases and no eutectic Al-Si phase nucleate directly on the δ phases.

5 Results
84
6 Discussion
85
6. Discussion
Based on the results presented in Chapter 5 and using the basics explained in Chapter 2, the
understanding of the microstructure in Al-10Si-0.3Fe -based alloys was further developed. In
particular, the influence of impurities, of Sr additions and of cooling rates of the melt on the
nucleation and growth of intermetallic phases during solidification has been described and
discussed in detail.
6.1 In-situ synchrotron tomography / slow cooling
6.1.1 Effect of slow solidification on microstructure
The difference between the microstructure of the casting alloys shown in Fig. 5.2 and the
microstructure produced during solidification at slow cooling rates (1 K/min, 9 K/min and
30 K/min) of all investigated alloys is shown in Fig. 5.20 and is quite obvious. At all slow
cooling rates all samples exhibit coarse intermetallic phases (dark). The eutectic Si phase
(light grey), solidified at the cooling rate of 1 K/min, in the high purity, the commercial and
the Sr modified commercial alloys is shown in Fig. 5.20. It is coarse and comparable to that
observed in the commercial alloy shown in Fig. 5.2c. In addition, the modification of the
eutectic Si phase by Sr is totally absent in the commercial alloy, and only a partial
modification is visible in the high purity alloy. The mixed structure of the eutectic Si phase,
consisting of both plates and fibrous elements, indicates the low Sr amount in the alloy, as
has been reported in Ref. [19]. Indeed, the level of Sr in the mentioned study was measured
to be 62 ppm [19], whereas a well modified structure of eutectic Si can be achieved at Sr
levels in the range of 80 - 120 ppm [100]. The loss of Sr in the in-situ investigated alloys can
be due to the low cooling rate. At cooling rates of 1 K/min, 9 K/min and 30 K/min the melt
was obviously kept at high temperatures for too long. The reduction of Sr from 62 ppm to 1
ppm was measured in the hypoeutectic Al-Si alloy after a 120 min melt holding time [19].
The reason for the Sr loss in the alloys is its evaporation during long melt holding times and
due to its oxidation, as has been reported previously [101]. During solidification the Sr can
evaporate up to the melt surface of the casting container, thus forming SrO with the oxygen
6 Discussion
86
at the vicinity of the melt surface [101]. Unfortunately, there are no systematic
measurements in the literature about the loss rate of Sr during the different holding times.
However, in order to provide an estimation of the remaining Sr amount in the present study
during solidification at slow cooling, the data from Ref. [19] was used. The Sr oxidation rate
in the melt can be expressed by the kinetic equation (1), as has been reported in Ref. [101]:
(1)
where c is the Sr concentration in the melt at the t; k is the reaction rate constant; n is the
order of reaction. When “kn” is set as “m”, in which m is still constant, then equation (1)
becomes:
(2)
When t=0, c0 is the initial concentration of Sr, and we can obtain equation (3):
(3)
According to equation (3), the reaction rate constant of Sr can be calculated for different
holding conditions. Based on the data from Ref. [19] (in which the alloys' compositions are
similar to the current alloys), i.e. the reduction of Sr from its initial concentration of 100 ppm
down to 62 ppm after a melt holding time of 5 min at the 720°C, the constant m can be
calculated and used for estimation of the remaining Sr at different cooling rates of 1 K/min,
9 K/min and 30 K/min.
The high temperature state must thus be kept as short as possible. According to Ref. [19] the
Sr modification time will be as follows: the cooling time from 720°C to 540°C, at a cooling
rate of 390 K/min, corresponds to 0.46 min. Together with the 5 min holding time it equals
to 5.46 min, which was rounded to 6 min for simplification. The 62 ppm of Sr after 5 min
holding time [19] were measured by inductively coupled plasma-atomic emission
spectroscopy (ICP-AES). By introducing an initial composition of Sr c0 = 100 ppm and c1 =
62 ppm after ~ 6 min, the constant m in the equation (3) is calculated to be m = 0.08. First we
checked the value of the remaining Sr, which is < 1 ppm after 121 min (whole cooling time),
measured by ICP-AES, as reported in Ref. [19]. The remaining concentration of Sr was
calculated to be c1 = 0.95 ppm, which is less than 1 ppm and in good agreement with the
analysis in Ref. [19].
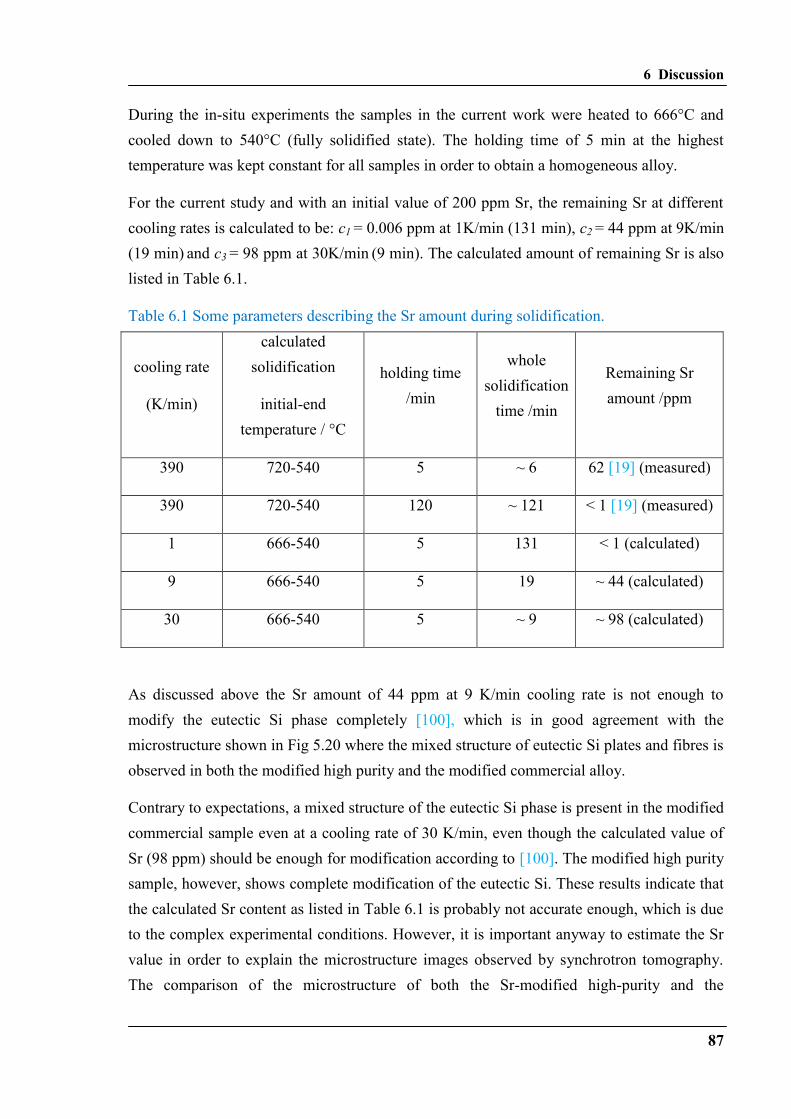
6 Discussion
87
During the in-situ experiments the samples in the current work were heated to 666°C and
cooled down to 540°C (fully solidified state). The holding time of 5 min at the highest
temperature was kept constant for all samples in order to obtain a homogeneous alloy.
For the current study and with an initial value of 200 ppm Sr, the remaining Sr at different
cooling rates is calculated to be: c1 = 0.006 ppm at 1K/min (131 min), c2 = 44 ppm at 9K/min
(19 min) and c3 = 98 ppm at 30K/min (9 min). The calculated amount of remaining Sr is also
listed in Table 6.1.
Table 6.1 Some parameters describing the Sr amount during solidification.
cooling rate
(K/min)
calculated
solidification
initial-end
temperature / °C
holding time
/min
whole
solidification
time /min
Remaining Sr
amount /ppm
390 720-540 5 ~ 6 62 [19] (measured)
390 720-540 120 ~ 121 < 1 [19] (measured)
1 666-540 5 131 < 1 (calculated)
9 666-540 5 19 ~ 44 (calculated)
30 666-540 5 ~ 9 ~ 98 (calculated)
As discussed above the Sr amount of 44 ppm at 9 K/min cooling rate is not enough to
modify the eutectic Si phase completely [100], which is in good agreement with the
microstructure shown in Fig 5.20 where the mixed structure of eutectic Si plates and fibres is
observed in both the modified high purity and the modified commercial alloy.
Contrary to expectations, a mixed structure of the eutectic Si phase is present in the modified
commercial sample even at a cooling rate of 30 K/min, even though the calculated value of
Sr (98 ppm) should be enough for modification according to [100]. The modified high purity
sample, however, shows complete modification of the eutectic Si. These results indicate that
the calculated Sr content as listed in Table 6.1 is probably not accurate enough, which is due
to the complex experimental conditions. However, it is important anyway to estimate the Sr
value in order to explain the microstructure images observed by synchrotron tomography.
The comparison of the microstructure of both the Sr-modified high-purity and the
6 Discussion
88
commercial alloys at all cooling rates indicates that the modification of the eutectic Si in the
commercial alloys is less pronounced than in the high-purity alloys. This is obvious when
comparing the microstructure observed in Fig. 5.20, especially at 1 K/min and 30 K/min
cooling rate. The modification of the eutectic Si phase in the commercial alloy is completely
absent at 1 K/min cooling rate which is expected according to the estimated value of Sr < 1
ppm. In contrast, the eutectic Si in the high-purity alloy is partially modified. At the cooling
rate of 30 K/min only a mixed structure of eutectic Si has been observed in the commercial
alloy while the high-purity alloy exhibits a complete modification of the eutectic Si phase at
the same cooling rate. Indeed, the given Sr value for modification, i.e. in the range of 80 -
120 ppm in Ref. [100], is a range of about 40 ppm and not a constant value, which can
probably vary from one alloy to another depending on its composition. The conclusion based
on the results of the present work is that the impurities in the commercial alloys induce
evaporation of Sr.
The Fe-rich intermetallic phases shown in Fig 5.20 exhibit a similar coarse plate morphology
in all investigated alloys. They are not significantly distinct and differ only slightly by their
size. This observation indicates that the intermetallics follow a similar formation mechanism
at slow cooling rates (1 K/min, 9 K/min, 30 K/min), regardless of Sr addition and impurities
in the alloys.
The Fe-rich intermetallics β and δ in the in-situ investigated samples can be identified easily
because of their large sizes. In contrast, the small-sized Fe-rich intermetallics α and γ are
difficult to identify here due to the limited spatial resolution of synchrotron tomography,
which is in the range of 1 µm. However, at some locations of the tomograms, Fe-rich phases
of other morphologies than plates have been observed, and they are believed to correspond
to these smaller-sized types of precipitates. Since the average size of the α and the γ phase is
beyond the current resolution limit for in-situ tomography, only β and δ phases will be
discussed in the following sections.
6.1.2 Nucleation and growth of the Fe-rich intermetallic β phase
A few words must be said about the sequence of the solidified phases in the alloys. As
mentioned in section 5.3 the first solidified phase at 580°C are primary α-Al dendrites,
which appear slightly darker than the surrounding melt due to their lower X-ray attenuation.
They start to nucleate near the oxide skin surface and grow radially to the center of the
sample as can be seen in Fig. 5.22a. As the temperature decreases (T = 556°C) coarsening of
6 Discussion
89
the α-Al dendrites proceeds, as can be seen in Fig. 5.22b. This result is not new; in the
previous studies [39-42] α-Al dendrites being the first solidifying phase have also been
reported. The second solidification event is the eutectic Si phase, which has also been
observed near the oxide skin surface at the bottom of the sample. Thus, both phases have
been observed to nucleate near the surface. This indicates the presence of a thermal gradient
across the sample since the surface is colder than the center. Similar observations of in-situ
solidification experiments have also been reported in Ref’s [40, 42].
The next solidification event is the formation of the β phase. In this work, only a few
apparently independently nucleating β plates were observed in the volume of ~1.5 mm3.
Terzi et al. [42] have suggested that the low nucleation of the β phase is attributed to the
slower cooling rate (1.4 K/min), since the only difference between their work and previous
research (20 K/min) [102] was the cooling rate. However, based on the results in the present
work, it can be suggested that the low number of nucleating β phase is not only due to the
lower cooling rate (1 K/ min), which decelerates heterogeneous nucleation, but probably also
due to the low Fe amount and thereby a low ratio of Fe to Si, since the formation of the β
phase is strongly linked to the Fe and Si content [29].
The current observations indicate that the β plate shown in Fig. 5.22e and Fig. 5.24 forms in
the melt and is attached to the dendrite edge in the center of the sample without touching
neither the eutectic nor the oxide surface. No independent β intermetallics have been
observed to nucleate and grow on the oxide surface of the sample. This observation is
different from previous reports [42] with which we share a similar experimental environment
at the ESRF in Grenoble, even though the alloy compositions (0.8 wt.% Fe in Ref. [42]
compared to only 0.3 wt.% Fe in the current work) between these two experiments are
different. In the result of Terzi et al. [42], all four observed β intermetallics initiate on or
near the oxide surface, suggesting that aluminium oxide is an active nucleant for β
intermetallics, which is in good agreement with reports [63, 68]. Puncreobutr et al. [40] have
also observed the nucleation of β plates on the oxide surface and oxide skin of pores using
synchrotron X-ray tomography. A nucleation of the β phase on the externally wetted
surfaces of the oxide films (called double oxide films or bi-films), which are entrained into
the melts during casting, has been reported by Cao et al. [62]. The typical center-line cracks,
commonly observed in their work, have not been found in the current study. Furthermore, it
is still under discussion whether γ-Al2O3 or α-Al2O3 (skin surface oxide) is proposed as a
potential nucleant for the β phase formation [5, 62, 63, 67, 68].
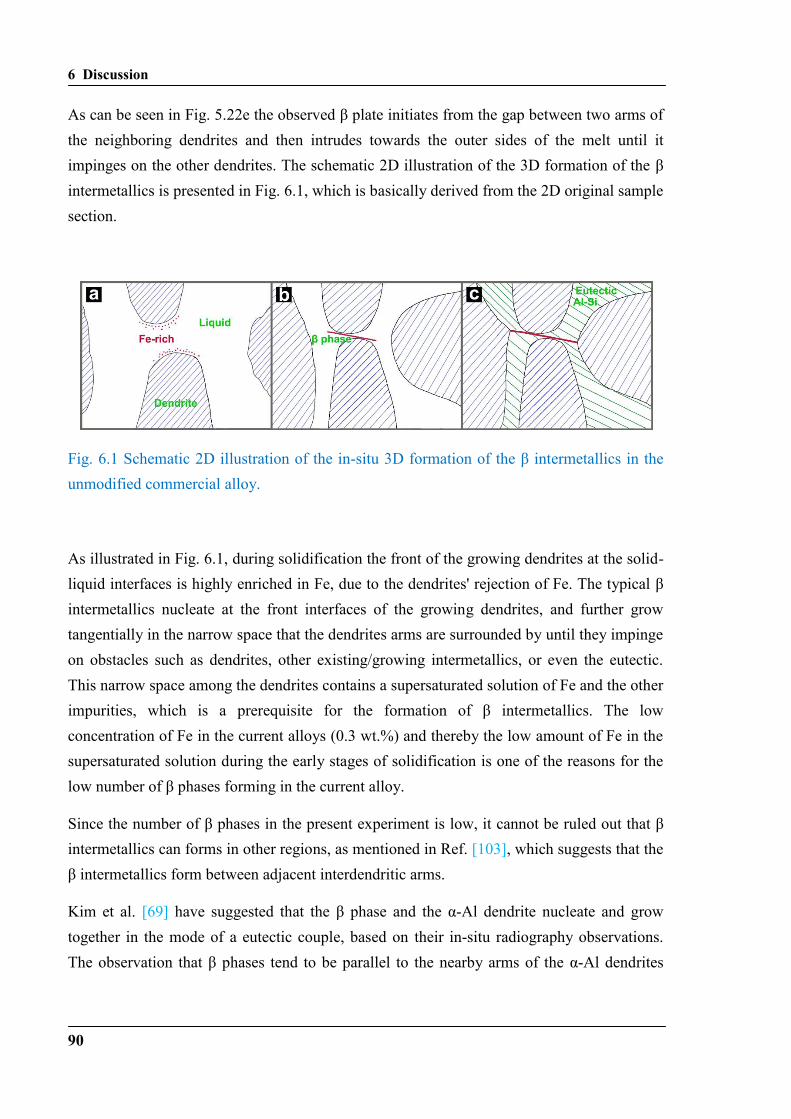
6 Discussion
90
As can be seen in Fig. 5.22e the observed β plate initiates from the gap between two arms of
the neighboring dendrites and then intrudes towards the outer sides of the melt until it
impinges on the other dendrites. The schematic 2D illustration of the 3D formation of the β
intermetallics is presented in Fig. 6.1, which is basically derived from the 2D original sample
section.
Fig. 6.1 Schematic 2D illustration of the in-situ 3D formation of the β intermetallics in the
unmodified commercial alloy.
As illustrated in Fig. 6.1, during solidification the front of the growing dendrites at the solid-
liquid interfaces is highly enriched in Fe, due to the dendrites' rejection of Fe. The typical β
intermetallics nucleate at the front interfaces of the growing dendrites, and further grow
tangentially in the narrow space that the dendrites arms are surrounded by until they impinge
on obstacles such as dendrites, other existing/growing intermetallics, or even the eutectic.
This narrow space among the dendrites contains a supersaturated solution of Fe and the other
impurities, which is a prerequisite for the formation of β intermetallics. The low
concentration of Fe in the current alloys (0.3 wt.%) and thereby the low amount of Fe in the
supersaturated solution during the early stages of solidification is one of the reasons for the
low number of β phases forming in the current alloy.
Since the number of β phases in the present experiment is low, it cannot be ruled out that β
intermetallics can forms in other regions, as mentioned in Ref. [103], which suggests that the
β intermetallics form between adjacent interdendritic arms.
Kim et al. [69] have suggested that the β phase and the α-Al dendrite nucleate and grow
together in the mode of a eutectic couple, based on their in-situ radiography observations.
The observation that β phases tend to be parallel to the nearby arms of the α-Al dendrites
6 Discussion
91
also points towards the fact that the β phase nucleates because of the supersaturation in
solute atoms in the melt.
Recently, Puncreobutr et al. [40] quantitatively investigated the morphological texture of the
β intermetallics nucleating on/near the α-Al dendrites, indicating that a majority of β plates
grows parallel to the secondary dendrite arms, which supports our observations.
Unlike the results of Terzi et al. [42], who claimed that the β intermetallics only form on or
near the oxide surface of sample, Puncreobutr et al. [40] suggested that the β intermetallics
can nucleate 1) on the oxide surface; 2) on the α-Al dendrites; 3) by self-nucleation; 4) on
the oxide skin of the pores. Furthermore, it was proposed that aluminium phosphide is a
potential nucleation site for β intermetallics [65, 66]. Since the aluminium phosphide nuclei
are beyond the resolution limit of synchrotron tomography, their presence in the
“supersaturated solution” cannot be detected in the present study. According to Puncreobutr
et al. [40] the nucleation on or near the α-Al dendrites is the dominant mechanism (~66 % of
the cases) for the formation of β intermetallics. The other β phases (~34 %) nucleate at the
oxides in the specimen or at pore surfaces via branching or via the presence of other active
nucleation sites such as aluminium phosphide. Although the current study could not confirm
all of the above mechanisms due to the limited number of β intermetallics formed in the used
alloys, there is no doubt that there is more than one nucleation site for the formation of β
intermetallics based on the knowledge of heterogeneous nucleation as described in Ref.
[104].
The initially rapid growth after nucleation of the β phase in the lateral direction is followed
by a slow growth and a slow thickening rate during later stages of solidification. This
observation is confirmed by previous in-situ 3D synchrotron X-ray tomography
investigations [40, 42, 103]. However, in the present study, the average growth velocity of
the β phase at the beginning of solidification was found to be ~ 5.8 µm/s, which is much
lower than the one measured in Ref. [42], i.e. 12.5 µm/s at 1.4°C/min cooling rate or 34
µm/s at 20°C/min cooling rate; and 30 µm/s at 3°C/min cooling rate as reported in Ref. [40].
The large difference in these values to those in the present study is probably due to the
different alloy compositions and the late start of measurement of the growth kinetics in the
present study. The initial tremendous burst of speed is mainly due to the release of
accumulated growth energy based on the undercooling as has been confirmed in Ref. [40].
However, the sufficient solute diffusion at the growth front of the β plate is also considered
an important factor for influencing the growth velocity and the growth behavior of the β
plates [40, 42]. The growth velocity at the end of solidification in the present study, ~ 1.7
6 Discussion
92
µm/s, is comparable to that measured in [40, 42]. The decrease of the growth velocity can be
explained by the solute depletion and the blocking caused by surrounding α-Al dendrites,
which is in agreement with the results observed in Ref. [40, 42]. Indeed, the β plate located
in the center of the sample (see Fig. 5.24) was found to grow from the bottom to the upper
part of the sample, further growing in an oval shaped frame around the dendrite arms. Based
on the images in Fig. 5.25 it is evident that the growth of the β plate is restricted by the
constrained space, which in this case are the dendrite arms.
Terzi at al. [42] suggested that the α-Al and the β phase grow with an irregular eutectic
growth in a coupled or an uncoupled way. Puncreobutr et al. [40] suggested that the α-Al and
the β phase exhibit weakly coupled growth. The observations in the present study lead to the
conclusion that α-Al and the β phase have indeed a weakly coupled growth since the Fe-rich
plate-like intermetallic β phase has been found to nucleate inside the Fe-supersaturated melt
near or between the α-Al dendrite arms. Based on the experimental observations it can be
suggested that the nucleation of the β phase occurs mainly via a binary eutectic reaction, i.e.
L α-Al + β-Al5FeSi. Similar in-situ observations have been reported on the alloy Al-
7.5Si-3.5Cu-0.6Fe (wt.%), where nearly 90% of the total volume of the β phase forms via a
binary eutectic reaction [40]. In contrast to this, Refs [28, 42, 102] claim that nucleation of
the β phase forms via a ternary eutectic reaction, i.e. L α-Al + Al-Si + β-Al5FeSi. The
latter observations are not supported by the present experiment, even though imprints of
eutectic Si are visible on the β plate as shown in Fig. 5.25. The presence of these unique
imprints of eutectic Si on the β plate can be explained as follows: as the growth of both
phases (α-Al and β-Al5FeSi) proceeds during further solidification, the eutectic Si start to
nucleate and grow rapidly in such a way that the Si plates touch the β phase and leaves
imprints.
The formation of β plates during eutectic solidification is believed to be responsible for
sponge-like pores [28]. A detailed examination of the microstructure development vs. time
in the present study revealed that the pores shown in Fig. 5.24 and Fig. 5. 25 have been
formed in the last stage of local solidification near the β plate. This pore is also surrounded
by α-Al and eutectic Al-Si. Some mechanisms have been proposed in order to interpret the
influence of the β plate on pore formation:
1) blockage of the interdendritic flow by the β plate [28, 33, 103, 105-108];
2) blockage of the hydrogen diffusion paths by the β plate [33, 105];
3) β plate acts as a nuclei [33, 103, 106];
6 Discussion
93
4) growth behavior affected by the β plate and/or other phases [103, 105].
The interdendritic flow and the growth behavior being affected by the β plate has been
directly observed by in-situ tomography [105]. It has also been observed [105] that the
growth of a pore is physically constrained by several β intermetallics, primary dendrites and
the Al-Si eutectic. It has been suggested [103, 105] that accelerated pore growth along the
surface of a Fe-rich β plate is due to a lower interfacial energy of the intermetallics–gas
interface than that of the gas-liquid or the gas-α-Al interfaces. The pore observed in the
current study (Fig 5.24, and Fig 5.25) is located near the β plate. The pore grew very fast
within less than 1°C and therefore its evolution or coarsening could not be followed. Based
on the current results it is suggested that the growth of the pore is completed at already
550 °C due to the solidification of the surrounding phases. Preferential pore growth along the
planar surfaces of the β phase has also been observed previously [105]. Puncreobutr et al.
[105] suggested that the β phases do not nucleate the pore directly during solidification, but
instead they block the interdendritic channels and reduce the permeability of hydrogen
resulting in its local supersaturation.
Besides the β phase no other Fe-rich intermetallic phases have been found in the recently
published in-situ experiments [39-42, 102]. In contrast to these, in the present work all Fe-
rich intermetallic phases (α, β, and ) are present, as has been supported by the subsequent
examination of the in-situ samples by TEM investigations.
6.1.3 Nucleation and growth of the Fe-rich intermetallic phase
The second intermetallic phase formed in the alloys during solidification was found to be the
phase. This was surprising, because formation of phase during solidification experiments
has not yet been reported in in-situ experiment [40, 42]. This is probably because of their
plate-like morphology, which is similar to that of the β phase, and thus they can easy be
mistakenly identified as the β phase. Since both phases have a similar chemical composition
it is hard to distinguish between them by SEM/EDX [18]. It has often been reported that the
β phase can nucleate via binary and ternary eutectic reactions depending on the Fe content in
the alloy [28]. The β phase via binary reaction has been observed in an as-cast alloy with 0.7
wt% Fe, the β phase via ternary reaction in one with 0.3 wt% Fe (which is the same amount
as in the current study) [28]. Therefore, it seems likely that the δ phase has been mis-
identified as a ternary β phase in previous research, forming via eutectic reaction L α-Al +
Al-Si + β-Al5FeSi [76, 108]. In fact, the β-Al5FeSi phase should be -Al4FeSi2, because the δ
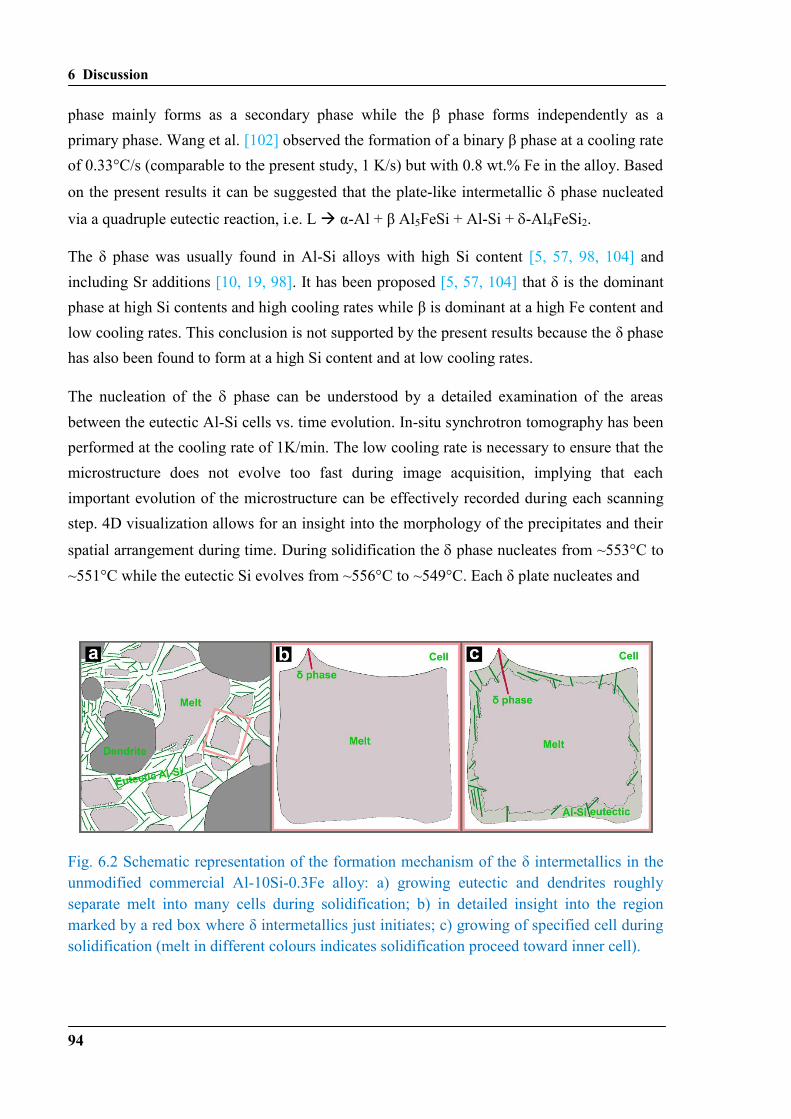
6 Discussion
94
phase mainly forms as a secondary phase while the β phase forms independently as a
primary phase. Wang et al. [102] observed the formation of a binary β phase at a cooling rate
of 0.33°C/s (comparable to the present study, 1 K/s) but with 0.8 wt.% Fe in the alloy. Based
on the present results it can be suggested that the plate-like intermetallic phase nucleated
via a quadruple eutectic reaction, i.e. L α-Al + β Al5FeSi + Al-Si + -Al4FeSi2.
The δ phase was usually found in Al-Si alloys with high Si content [5, 57, 98, 104] and
including Sr additions [10, 19, 98]. It has been proposed [5, 57, 104] that δ is the dominant
phase at high Si contents and high cooling rates while β is dominant at a high Fe content and
low cooling rates. This conclusion is not supported by the present results because the δ phase
has also been found to form at a high Si content and at low cooling rates.
The nucleation of the phase can be understood by a detailed examination of the areas
between the eutectic Al-Si cells vs. time evolution. In-situ synchrotron tomography has been
performed at the cooling rate of 1K/min. The low cooling rate is necessary to ensure that the
microstructure does not evolve too fast during image acquisition, implying that each
important evolution of the microstructure can be effectively recorded during each scanning
step. 4D visualization allows for an insight into the morphology of the precipitates and their
spatial arrangement during time. During solidification the phase nucleates from ~553°C to
~551°C while the eutectic Si evolves from ~556°C to ~549°C. Each δ plate nucleates and
Fig. 6.2 Schematic representation of the formation mechanism of the δ intermetallics in the
unmodified commercial Al-10Si-0.3Fe alloy: a) growing eutectic and dendrites roughly
separate melt into many cells during solidification; b) in detailed insight into the region
marked by a red box where δ intermetallics just initiates; c) growing of specified cell during
solidification (melt in different colours indicates solidification proceed toward inner cell).
6 Discussion
95
grows in a temperature range of ~1°C, i.e. from 553°C -552°C or 552°C -551°C as can be
seen in Fig. 5.27. It is apparent that the time range of δ phase formation is basically covered
by the eutectic formation time range, and the time range of the eutectic formation has a
longer time span than the formation of the δ phase. Thus, the formation of the δ
intermetallics should be significantly influenced by the formation of the eutectic Al-Si.
The formation mechanism of the phase is presented schematically in Fig. 6.2. The melt
areas surrounding the eutectic Al-Si cells and the -Al dendrites are shown in Fig. 6.2a. One
of the melt areas is extracted and examined in detail. The extracted area is surrounded by
solidified eutectic Al-Si cell (see Fig 6.2b). During solidification of the eutectic Al-Si, the
enclosed melt is enriched in Fe due to the rejection of Fe towards the solid-liquid interfaces.
The δ phase nucleates on the supersaturation front pushed by the growth of the eutectic, i.e.
in the places where Fe and other solutes are locally abundant in the eutectic (Fig. 6.2c).
The observed δ plate initiates at the eutectic Si, probably due to the enrichment in
supersaturated Fe and other solutes or impurities that are potential nucleants. It should be
noted that there might be more than one event initiated simultaneously at each growing cell
wall. This schematic drawing in Fig. 6.2 only exhibits one event for each growing cell wall
progressing towards the cell center for the sake of simplicity. The diameter of the cells
surrounded by the eutectic can take any value but mainly ranges from some tens to a few
hundreds of micrometers.
When the growth of the phase is completed, the surrounding solidifying melt has formed
mainly eutectic Al. The average size of the plate-like phase is much lower than that of the
β phase. This is because of the limited melt areas between the eutectic Al-Si phases.
Nucleation and growth of the phase has already been described in detail in chapter 5.3.
However, it should be noted that this phase has not been observed in the as-cast commercial
alloy, but only in the Sr-modified commercial and high-purity alloys. The only difference in
the production process of the cast samples and the in-situ samples of the commercial alloys
is the cooling rate. This means that a lower cooling rate promotes formation of the phase.
In order to be sure that the phase really exists in the solidified sample after the in-situ
synchrotron tomography experiment, the sample has been investigated by SEM and TEM.
Both the coarse β and the fine phase could be identified.
The δ plates observed by synchrotron tomography in this work nucleate not only on the
eutectic (as shown in Fig. 6.2), but also on the surface of the pores and the aluminium oxide
in the cell which is located around or containing these areas (not shown in Fig 6.2, but it

6 Discussion
96
follows a similar mechanism). These observations indicate that the δ phase follows the
heterogeneous nucleation theory. It was previously proposed that the δ phase can nucleate on
oxide bi-films [62]. Khalifa et al. [104] investigated a series of inclusions that might be a
potential nucleation substrate, and they found that the δ phase can nucleate on extensive
inclusions such as CaO, TiB2 or α-Al2O3. There are three simultaneous necessary conditions
for the nucleation of intermetallics [104]:
1) a certain solute concentration that corresponds to the composition of the phase in the melt;
2) the necessary nucleation temperature;
3) an appropriate nucleation substrate.
It has been suggested [104] that nucleation of the δ phase as a secondary phase is highly
affected by the solute concentration, rather more than by the potency of the substrate.
Furthermore, heterogeneous nucleation of a phase on a nucleant in a melt requires a certain
amount of undercooling to activate the nucleation events if the nucleation sites are not potent
enough [104]. Here, the role of substrates in the nucleation of the intermetallic phases is
largely limited by the satisfaction of the solute concentration and the nucleation temperature
requirements [104]. Keeping that in mind, the current nucleation events on the eutectic, the
pores and the oxides can be understood. It is obvious that the eutectic is a potent nucleation
substrate for the formation of the δ phase in this alloy. Pores and oxides are only second
choices for nucleation since the vast majority of δ phase nucleation is observed on the
eutectic, especially on eutectic Si.
As reported in the literature [40, 42] thin evolving β plates can undergo deformation,
bending or fracture during growth, which is a result of physical interactions with contacting
dendrites. The deformation of δ plates due to internal strains and contact with eutectic Al-Si
and solidified α-Al dendrites has also been observed in the present study. A small movement
of the outer oxide skin and of the dendrites can occur during shrinkage of the sample. This
can locally change the growth orientation of the δ plate. A δ plate can straighten itself when
a curved δ plate grows closer to an adjacent straight δ plate. Here as seen in Fig. 5.29a it
probably happened because the curved δ plate was pinned by the eutectic Al-Si and the
solidified α-Al dendrite.
β plates as well as δ plates can never be found alone; they are always branched. Branching
and interaction of the β plates can be mainly classified into two types via an impingement
mechanism and a nucleation mechanism (new β plates nucleate on existing β plates) [40]. In
the present study, only one mechanism could be observed, namely growth process of the
6 Discussion
97
impingement of the δ plates. Initially, δ plates nucleate and grow independently. Later during
rapid lateral growth they collide as can be seen in Fig. 5.29. The nucleation of new δ plates
on existing δ plates has never been observed in the current experiment.
6.2 Ex-situ observations of the microstructure in the as-cast alloys /
fast cooling
The microstructure of high-purity and commercial-purity Al-10Si-0.3Fe-based casting alloys
with and without Sr additions was compared and discussed in terms of the impurities'
influence on the microstructure evolution using different microscopic (OM, SEM, TEM) and
tomographic (FIB and synchrotron) techniques.
6.2.1 Effect of Sr on Al-10Si-0.3Fe-based alloy
The eutectic microstructure of the as-cast alloys shown in Fig. 5.1 indicates different
evolution mechanisms during solidification. The typical eutectic Si of unmodified
commercial alloys as shown in Fig. 5.1c is coarse with large space between the Si flakes. In
comparison, the eutectic Si in the unmodified high-purity alloy (see Fig. 5.1a) is very fine,
containing short Si flakes with little space between them. The modified eutectic Si of both
alloys shown in Fig. 5.1b and 5.1d is the result of Sr additions, which implies the fibrous
structure of the eutectic Si. Modification of eutectic Si by Sr was attributed to the high
undercooling [110], observed from the typical cooling curves of similar investigated alloys
[71] and shown in Fig. 2.9.
In contrast to the commercial alloy, the high-purity alloy without Sr shows a much higher
undercooling which is comparable to that of both alloys with Sr addition. Mc Donald et al.
[71] suggested that the undercooling is not directly linked to modification but to the growth
of the eutectic grains. Indeed, the size of the eutectic grains (except in the unmodified
commercial alloy) [71] is almost identical for the high-purity alloy with and without Sr and
for the Sr-modified commercial alloy. Recent research with atom probe tomography and
transmission electron microscopy [35, 36, 72, 73] clearly demonstrates that the modification
of the eutectic Si is attributed to nanometer-sized Al-Si-Sr segregations located within the
eutectic Si, and that it is not attributed to individual atoms absorbed at the eutectic Si growth
interface [111]. The commercial alloy has a much higher density of eutectic grains, which
are much smaller than in the Sr modified alloy [71]. The large number of eutectic grains in
6 Discussion
98
the commercial alloy is due to the major role of impurities which act as active nucleants in
the eutectic solidification. However, Sr additions markedly decrease the nucleation of
eutectic grains. The refined Al-Si eutectic can be explained by an increase of the growth rate
and interface velocity of coupled Al and Si eutectic phases.
Since Sr-modification has an effect on the eutectic grains, a model has been proposed
recently by Timpel et al. [10], explaining how intermetallic phases form in the eutectic grain
in the Sr-modified Al-10Si-0.1Fe alloy, which indicates that the addition of Sr leads to an
heterogeneous distribution of secondary intermetallic phases within the eutectic grains of the
Al-Si alloys. The modified eutectic grains can be categorized into three regions:
1) well-modified central regions with fine fibers and free of intermetallics;
2) transition region, where the α phase precipitates in isolated pockets next to the pre-
existing primary Al dendrites in the eutectic grain;
3) outer region, where the δ phase forms after a severe segregation of Fe in a Si-rich melt
during a second interval of nucleation.
McDonald et al. [55] presented a similar grain cell structure, in which numerous β phases
and isolated pores are observed only in the outer region (region 3). The development of the
radial eutectic grain structure during solidification, which has been previously reported [10,
55], is not supported by the present study. Based on the current synchrotron tomography
results it has been concluded that the flake-fibrous transition in the Si morphology at the cell
boundaries mentioned in Ref. [10, 55] is probably due to different local orientations of the
eutectic Si fibers within the neighbor cells.
Addition of Sr to the high-purity alloy does change the intermetallic types, sizes and density
as well as their morphology. In general the growth mode of the eutectic Al-Si is changed
from the uncoupled mode in the unmodified to the coupled mode in the Sr modified alloys.
The coupled and identical growth rate of eutectic Si and Al results in the creation of a
smooth solid-liquid interface, which is responsible for the absence of isolated pockets, in
which usually the α phase or the γ phase precipitate. Moreover, the isolated pockets are very
small and therefore the size and the number density of the α or the γ phase is strongly
reduced. This is supported by the results in Table 5.3 where, e.g., the number of α phases in
the unmodified alloy decreases from 68 to 4 in the Sr-modified high-purity alloy.
6 Discussion
99
However, Sr promotes formation of the δ phase, which was found to form at the boundaries
of the eutectic cells.
Sr modification of the eutectic Si in the commercial alloy increases the number density of δ
phases but their average sizes are smaller. However, Sr was found to suppress the formation
of the β phase. According to typical cooling curves of similar alloys [71], the addition of Sr
to a commercial alloy results in an increase in recalescence, which is probably the reason
that the β phase cannot form in the current Sr modified commercial alloy. This is similar to
another report [28], which claims that Sr slightly depresses the precipitation temperature of
the binary reaction β phase.
6.2.2 Effect of impurities on Al-10Si-0.3Fe-based alloys
In comparison to the unmodified high-purity alloy and the unmodified commercial alloy,
impurities indeed have an effect, not only on the types of intermetallics, but also on their
sizes. The sizes of the intermetallic phases are much larger in the commercial alloy than in
the high-purity alloy as illustrated in Fig. 5.18a and 5.18c, Fig. 5.19a and 5.19c. As
discussed in section 6.2.1, the impurities seem to play an effective role in the nucleation of
the eutectic grains, which seems to be advantageous for the formation of the coarse β phase.
The nucleation of the β phase occurs prior to the eutectic Al-Si solidification, as has been
already discussed in section 6.1 based on the in-situ observations. The β phase nucleates at a
higher temperature than the eutectic Al-Si phases. Growth of the β phase is initially very
rapid up to the point where it is retarded by surrounding phases as already shown in section
6.1. Sr additions change the growth mode of the eutectic Al-Si and thereby also the
nucleation of the β phase in such a way that formation of the δ phase is favored to the β
phase.
There is no significant difference between the Sr-modified high-purity alloy and the Sr-
modified commercial alloy. Only the sizes of the intermetallics in the Sr-modified
commercial alloy are larger than in the Sr-modified high-purity alloy. These results indicate
that the Sr in the high-purity alloy and the commercial alloy does not have a distinct effect
on the intermetallics despite the presence of impurities in the commercial alloy.
It was reported previously [62, 63, 66] that oxides or oxide bi-films are the nucleation sites
for the eutectic Si. Others reported that AlP particles cause the nucleation of the eutectic Si
in Al-Si alloys. However, in a recent study [111], no increase in the number of β plates was
observed with the addition of P, nor were AlP particles found along the β plates not even at
6 Discussion
100
100 ppm P in the alloy. It has also been reported that in small concentrations the modifier Sr
can deactivate AlP as a nucleant for Si, and in larger concentrations it can even deactivate
the oxides, leaving Si to be formed by an unknown nucleus at significantly lower
temperatures [25]. Campbell has claimed that “these mechanisms suggest the interesting
prediction that for clean metal containing neither P nor oxides, the Al-Si alloys will be
automatically modified without the intervention of Na or Sr” [25]. However, based on the
comparison of the current alloys in this work, the eutectic Si in the unmodified high-purity
alloy is still plate-like, unlike fine fibers or a coral structure, which is also supported by the
previous study [71]. Campbell’s suggestion [25] is not consistent with the experiment
reported here.
6.2.3 Formation of α and γ intermetallics
It should be mentioned that the γ intermetallic phase was found to be new and its structure
was calculated in details for the first time in the present work in sections 5.1.3.1.1 and
5.1.3.1.2. The phase called τ2 [46], known in the literature, is of similar composition but has
another structure. The Fe-rich γ phase was determined to have a trigonal R-centered crystal
structure with hexagonal lattice parameters a = 1.034(5) nm, c = 1.983(8) nm, V = 1.836(25)
nm3.
It is reported that the α phase exhibits a separate blocky structure and a convoluted branched
structure in 3D [19, 29, 34]. Dinnis et al. [34] explain that the blocky structure of the α phase
forms before the Al dendrites begin to solidify while the convoluted branched structure of
the α phase forms after the Al dendrites have begun to solidify. In addition, Gorny et al [29]
observe two distinct morphologies of the α phase: a large and bulky morphology and a finer
“Chinese script” morphology. Their explanation is that the α phase, which exhibits a large
and bulky morphology, forms prior to the eutectic reaction and the α phase, which exhibits
the finer “Chinese script” morphology, forms during the eutectic reaction. Based on the
observation that the α phase exhibits thin sheets aligned along the surfaces of the Si plates
and often connects different Si plates along the interfaces of two eutectic Al grains, Timpel
et al. [19] proposed that the α phase forms in isolated pockets among adjacent eutectic Al-Si
plates in the last solidification stage, and the morphology of the α phase depends on the flat
Si interface and the necking caused by the growing polycrystalline Al–Al interfaces.
Beside the α / γ intermetallic phases with “Chines script” morphology, much larger
intermetallic phases of blocky structure have been found in the present work. Observation of
6 Discussion
101
the modified commercial alloy by FIB tomography indicates four possible locations of the α
/ γ intermetallics:
1) inside the eutectic Si;
2) partially embedded in the eutectic Si;
3) attached to the eutectic Si;
4) embedded in the eutectic Al.
These observations strongly indicate there is some time span between the formation of the α
/ γ intermetallics. It is suggested that all four types of α / γ phases nucleate at the earlier
stages of solidification, prior to the nucleation of the eutectic Al-Si phases. However, those
types of α / γ phases with blocky morphology shown in Fig. 5.17 are not dominant in all
investigated alloys.
It is hard to say whether the intermetallics formed at the earlier stages of the eutectic Si are γ
phases or not since the number of γ phase in all four alloys observed by FIB tomography is
low. This seems to be consistent with observation by TEM.
6.2.4 Formation of δ intermetallics
The δ phase is not always observed to form in all four investigated alloys. At a low cooling
rate such as 1 K/min, the δ phase nucleates in the Fe-rich region rejected by the eutectic in
the cell encircled by the eutectic Al-Si, during which the eutectic is growing simultaneously
in the cell. The growing of the δ phase is probably constrained by the growing of the eutectic.
The in-situ synchrotron observations in 4D, which shows that the eutectic Si restricts the
growth of the δ platelets, is in good agreement with the results obtained by FIB tomography,
which display the eutectic Si always surrounded by δ platelets. If there is a slight difference,
it might be because formation process is much faster at high cooling rates since features such
as collision impressions of the δ phase and the eutectic are more pronounced.
Another interesting observed phenomenon is that the eutectic Si, which is surrounded from
two sides by δ plates, has a higher tendency to orientation in the Sr-modified high-purity
alloy than in the Sr-modified commercial alloy, which is probably due to different nucleation
mechanisms of the eutectic Si in the Sr modified commercial alloy. The latter has more
diversity than in the Sr-modified high-purity alloy.
6 Discussion
102
Some pores and Al lines can be frequently found in the δ plates as shown in Fig. 5.16. The
diameter of Al crack lines in Fig 5.16 is less than 200 nm. In contrast, the estimated size of
the eutectic Al is more than 400 nm, thus it does not seem as if the eutectic Al penetrate the
δ plates. It can be suggested that the Al crack lines or pores are formed during casting due to
shrinkage or hot tear, structural shrinking stress or thermal stress. As long as the surrounding
part is still liquid, Al fills these cracks, but after the surrounding part has solidified, the crack
will become a pore. Casting porosity and shrinkage defects have also been observed by Lu
and Dahle [111]. Their interpretation is that the porosity is strong dependent on the
composition of the alloy and the cooling rate. The high Fe level leads to a higher porosity
and the high amount of Si suppresses the formation of coarse intermetallics and increases the
volume fraction of eutectic Si and thereby improves castability [111]. The hypothesis [111]
that the pores form at the end of the solidification is supported by the current work as
described in section 6.1.
6.2.5 Formation of β intermetallics
As presented in chapter 5.1, the Fe-rich β phase was found in the as-cast unmodified
commercial alloy only. The effect of impurities has already been discussed in section 6.2.2,
since the difference between the commercial alloy and the high-purity alloy is the presence
of impurities. The growth rate of eutectic Al-Si grains is most likely the reason for the
absence of the β phase in the unmodified high purity alloy. Sr can suppress the formation of
the β phase by increasing the recalescence and depressing the precipitation temperature of
the binary β phase.
6.3 Effect of cooling rates on the formation of the intermetallic phases
Cooling conditions can also influence the formation of intermetallics. It has been reported
[112, 113] that the formation of Fe-containing intermetallics in Al-Si alloys can be
suppressed, refined or modified using rapid solidification processes, which is supported by
the present results when ex-situ and in-situ solidification experiments are compared. Fig.
5.19 and Fig. 5.21 show the distinct sizes of Fe-rich intermetallics formed at a fast cooling
and a slow cooling rate, respectively. The predominant difference between the fast cooling
rate and the slow cooling rate in this work is the refinement and the suppression of the Fe-
rich intermetallics during fast cooling.
6 Discussion
103
Liu et al. [108] reported that the smaller dendritic arm spacing (DAS) obtained at a high
cooling rate could physically restrict the growth of an intermetallic in the interdendritic
spaces, reducing the final length of the intermetallics. However, the short diffusion time
during fast cooling does not play a minor role in the size of the intermetallics. The diffusion
length x can be easily estimated from the following equation:
x = 2(Dt)1/2
(4)
where D = D0exp(-Q/RT), Q = 276 kJ/mol, R = 8.314 J/molK (gas constant), D0 = 2.34 x
10²²/s [114] and t is the time at a the given temperature.
At high cooling rates, segregation and diffusion of Fe is limited by time and thus the sizes of
the intermetallics are expected to be smaller. The estimated diffusion length of Fe in the
alloy, calculated according to equation (4) at 570°C after 1 min for a slow cooling rate of 1
K/min, exceeds 640 nm. At a high cooling rate of about 400 K/min it is only 32 nm, which is
20 times slower. Thus, the growth velocity and the final size of the intermetallic is controlled
by the cooling rate.
At fast cooling conditions, as seen in Fig. 5.19, the formation of intermetallics in the
investigated alloys is also influenced by impurities and Sr addition. In contrast, at slow
cooling rates as seen in Fig. 5.21, the formation of intermetallics is similar for all
investigated alloys, which is probably due to the long diffusion time, regardless of impurities
and Sr modification.

6 Discussion
104
7 Summary
105
7. Summary
Extensive microscopic investigations were performed on four Al-10Si-0.3Fe-based casting
alloys (high-purity alloy with and without addition of 200 ppm Sr and the corresponding
commercial alloys). The main goal of this study was to find out how the impurities and the
addition of Sr influence the formation of Fe-rich intermetallic phases and the formation of
the eutectic Si phase. A further objective of this study was to understand the influence of the
cooling rate on the formation of intermetallic phases. The experimental work was focused on
the three-dimensional analysis of Fe-rich intermetallic phases using tomographic methods on
the micrometer scale such as imaging with a focused ion beam and with synchrotron X-ray
tomography. The 3D analyses were supported by 2D studies using a combination of optical
microscopy, scanning electron microscopy and transmission electron microscopy.
The experimental work was divided into three parts:
In the first part of the work all intermetallic phases were examined for their crystal structure
and chemical composition. The crystal structure of the Fe-rich intermetallic phases was
identified using selected-area electron diffraction in TEM and the chemical composition was
measured using energy-dispersive X-ray spectroscopy. In total, four Fe-rich intermetallic
phases (, , , and ) have been identified.
The location and the distribution of the Fe-rich intermetallic phases within the eutectic Al-Si
grains have been also investigated.
The results obtained in the first part with respect to the Fe-rich intermetallic phases and
eutectic Al-Si in Al-10Si-0.3Fe casting alloys can be summarized as follows:
1. Beside the well-known bcc α intermetallic phase and tetragonal δ phase a new γ
phase was found. The composition of the γ phase is Al4.35FeSi, which is close to that
of the β phase (Al4.5FeSi), but the morphology of the γ phase looks like the one of the
α intermetallic phase. It features a trigonal R-centred crystal structure with hexagonal
lattice parameters a = 1.034(5) nm, c= 1.983(8) nm and V= 1.836(25) nm3.
7 Summary
106
2. In the unmodified high-purity alloy, the dominant phase is the α phase. The γ phase
was also found but with a lower density. α phases are distributed homogeneously in
the eutectic Al-Si. No other intermetallic phases were found in this alloy.
3. In the Sr-modified high-purity alloy the dominant phase is the δ phase. However, both
α and γ phases are also present in this alloy, with low number density.
4. No β phase was found in any of the high-purity alloys.
5. In the commercial alloy, all phases (, , , and ) are present. The crystal structure of
the β phase was found monoclinic, with lattice parameters a = 0.6148 nm, b=0.6145
and c =2.0808 nm and β=91°, and their composition was Al4.7FeSi. However, no β
phase was found in the commercial alloy with additions of Sr.
6. The eutectic Si in the unmodified high-purity alloy appears needle-like in 2D and is
very fine, while in the unmodified commercial alloy it exhibits coarse needles of
much larger sizes. Sr additions transform the eutectic Si to a very fine morphology in
both the pure and the commercial modified alloys.
In the second part of the work, the morphology, size and location of the intermetallic phases
have been investigated using FIB and X-ray synchrotron tomography. Ex-situ FIB and
synchrotron tomographic measurements of all casting alloys were carried out at room
temperature. The cooling rate of the castings was about 400 K/min.
FIB tomography results:
1. The real shape and morphology of the α and γ phases as investigated by FIB
tomography show thin interconnected sheets inside the eutectic microstructure.
2. The individual α phases with a blocky morphology has also been identified, but with a
lower number density than the thin interconnected sheets. Some of these phases have
been found located closely to the eutectic Si or embedded into the eutectic Si phase.
3. The δ phase appears as platelets and is located at the boundaries of the eutectic Al-Si
cells in the Sr-modified alloys.
4. The β phase has not been visualized by FIB tomography because of its large size.
Synchrotron tomography results:
1. The α and γ phases are very fine in the unmodified high-purity alloy.
2. Large δ and β platelets and much smaller α and γ phases have been found in the
commercial alloy. The intermetallic phases in this alloy are not interconnected with
each other.
7 Summary
107
3. In the Sr-modified high-purity and commercial alloys the number density of the Fe-
rich intermetallic phases is much higher than in the commercial alloy. The
modification of both the pure and the commercial alloys enhances the
interconnection of the intermetallic phases.
The third part of the work deals with in-situ synchrotron tomographic measurements.
Primarily, the nucleation and growth of the Fe-rich intermetallic β and δ phases has been
followed during solidification by in-situ synchrotron measurements.
The samples were heated up to a processing temperature 666°C and slowly cooled down to
450°C. In order to follow the nucleation and growth of the Al dendrites, the intermetallic
phases and the eutectic Al-Si phases, the cooling rate was decided to be as low as possible.
All alloys were measured at low cooling rates: 1 K/min, 9 K/min and 30 K/min.
Measurements with the higher cooling rate of 400 K/min, which nearly corresponds to the
cooling rate during the commercial casting procedure, have also been performed.
Unfortunately the nucleation and growth of the phases was too fast, in such a way that within
~ 0.5 minutes all events had occurred. Surprisingly, in all four alloys, the intermetallic
phases are not significantly different at cooling rates between 1 K/min and 30 K/ min. The
intermetallic phases are coarse at all (1 K/min, 9 K/min, 30 K/min) cooling rates. However,
modification of the eutectic Si with Sr additions was found to depend not only on the cooling
rate, but also strongly on the composition of the alloy. While the commercial alloy at 1
K/min cooling rate shows no modification of the eutectic Si, the high-purity alloy indicates a
mixed (flakes and fibrous) structure. The reason is most probably the evaporation of Sr
during the slow cooling of the melt because the samples were kept for too long at high
temperatures. The slower the cooling rate the higher evaporation and oxidation of the Sr is as
estimated in this study.
However, the main goal of the present work focused on the formation of the intermetallic
phases. Because all investigated samples indicated similar sizes, distributions and densities
of the intermetallic phases, the studies concentrated on nucleation and growth of the and
phases during solidification in the commercial alloy only, because it is representative for all
other alloys. The results of the in-situ tomographic measurements at slow cooling rates (1
K/min-30 K/min) are as follows:
1. The first phase which starts to solidify in the melt are α-Al dendrites.
2. The second solidified phase is the β phase which nucleates near the Al dendrite arms
and not at the oxidised surface.
7 Summary
108
3. The next solidified phases are the eutectic Si and the eutectic Al, the last solidified
around the eutectic Si phase.
4. The phase solidified in the supersaturated melt between the eutectic Al-Si grains.
The existence of the δ phase was found for the first time. In the literature this phase
was mistakenly treated as phase.
5. The and the phases initially nucleate as independent, individual plates; with time
and due to their fast growth they collide and build a branched interconnected
structure of the plates.
6. Due to the limitation of spatial resolution, small scaled α and γ phases can rarely be
discerned in these measurements.
7. The initial growth rate of the Fe-rich intermetallic and phases is very high within
a narrow temperature range. It decreases significantly at the end of solidification
because of their impingement with surrounding phases like α-Al dendrites or eutectic
Al-Si or the outer oxide skin.
Another main attention of this study lay on the nucleation and growth behavior of the
phase. These are the main points of this study:
1. Generally, formation of the phase depends on the cooling rate, the composition and
the addition of a modifier (Sr).
2. A slow cooling rate promotes nucleation of the phase in the high-purity alloy, in
the commercial alloy and in the corresponding alloys with Sr addition. The phase is
coarse and independent of the alloy composition.
3. A fast cooling rate refines the phase in the commercial alloy. No phase was
found in neither the high-purity nor the Sr-modified (high-purity and commercial)
alloys.
4. Nucleation of the phase takes place mainly in the supersaturated solute near or
between the α-Al dendrite arms.
5. The importance of AlP as a nucleant for the phase formation was not confirmed.
6. The phase is not the direct nucleant for pore formation; however, they are
necessary contributors for the formation of pores.
7. The impurities in the commercial alloy promote a faster evaporation and oxidation of
Sr. The commercial alloys need a higher amount of Sr than the high-purity alloys in
order to modify the eutectic Si.

7 Summary
109
Since the coarse phases markedly degrade mechanical properties and give rise to casting
defects the main conclusion from this study is:
The finer the phase the fewer pores (defects) can form and the density of the pores is lower.
This is due to the melt's permeability for hydrogen (source of the pore) during solidification,
which is an important factor for the industry.

7 Summary
110
References
111
References
[1] J.R. Davis (editor) (1993) Aluminum and aluminum alloys. ASM International, Ohio
[2] T. Hosch, R.E. Napolitano, The effect of the flake to fiber transition in silicon
morphology on the tensile properties of Al–Si eutectic alloys, Mater. Sci. Eng. A 528 (2010)
226-232
[3] A. Couture, Iron in aluminum casting alloys - A literature survey. AFS Int. J. Cast. Met.
6 (1981) 9-17
[4] L. Bäckerud, G. Chai, J. Tamminen, Solidification Characteristics of Aluminum Alloys,
Foundry Alloys, vol. 2, AFS/Skanaluminum (1990) 71-84
[5] W. Khalifa, F.H. Samuel, J.E. Gruzleski, Iron intermetallic phases in the corner of the
Al-Si-Fe system, Metall. Mater. Trans. A 34A (2003) 807-825
[6] J.A. Taylor, G.B. Schaffer, D.H. StJohn, The role of iron in the formation of porosity in
Al-Si-Cu-based casting alloys: Part I. Initial experimental observations, Metall. Mater.
Trans. A 30A (1999) 1643-1650
[7] S. Yaneva, N. Stoichev, Z. Kamenova and S. Budurov, Quaternary Iron-Containing
Phases in Al-Si Cast Alloys, Z. Metallkd. 75 (1984) 395-398
[8] S.P. Gupta, Intermetallic compound formation in Fe-Al-Si ternary system: Part I. Mater.
Charact. 49 (2003) 269-291
[9] T. Maitra, S.P. Gupta, Intermetallic compound formation in Fe-Al-Si ternary system: Part
II. Mater. Charact. 49 (2003) 293–311
[10] M. Timpel, N. Wanderka, R. Grothausmann, J. Banhart, Distribution of Fe-rich phases
in eutectic grains of Sr-modified Al-10wt%Si-0.1wt% Fe casting alloy, J. Alloy & Comp.
558 (2013) 18-25
References
112
[11] M.V. Kral, A crystallographic identification of intermetallic phases in Al-Si alloys,
Mater. Lett. 59 (2005) 2271-2276
[12] J. Murray, A.J. McAlister, The Al-Si (aluminum-silicon) system. Bull Alloy Phase
Diagr. 5 (1984) 74-84
[13] A.K. Dahle, K. Nogita, S.D. McDonald, C. Dinnis, L. Lu, Eutectic modification and
microstructure development in Al-Si Alloys, Mat. Sci. & Eng. A 413-414 (2005) 243-248
[14] J.A. Taylor, Iron-Containing Intermetallic Phases in Al-Si Based Casting Alloys,
Procedia Mater. Sci. 1 (2012) 19-33
[15] J.E. Tibballs, Al-Si substitution in Al(Fe, Mn)Si phases, Key Eng. Mater. 44-45 (1990)
233-246
[16] M.H. Mulazimoglu, A. Zaluska, J.E. Gruzleski, F. Paray, Electron Microscope study of
Al-Fe-Si intermetallics in 6201 Aluminum Alloy, Metall. Mater. Trans. A 27A (1996) 929-
936
[17] J.G. Zheng, R. Vincent, J.W. Steeds, Crystal structure of an orthorhombic phase in β-
(Al-Fe-Si) precipitates determined by convergent-beam electron diffraction, Philos. Mag. A
80 (2000) 493-500
[18] M.V. Kral, H.R. McIntyre, M.J. Smillie, Identification of intermetallic phases in a
eutectic Al-Si casting alloy using electron backscatter diffraction pattern analysis, Scripta
Mater. 51 (2004) 215-219
[19] M. Timpel, N. Wanderka, B.S. Murty, J. Banhart, Three-dimensional visualization of
the microstructure development of Sr-modified Al-15Si casting alloy using FIB-EsB
tomography, Acta Mater. 58 (2010) 6600–6608
[20] M.G. Day, A. Hellawell, The Microstructure and Crystallography of Aluminium-Silicon
Eutectic Alloys, P. Roy. Soc. A (1968) 473-491
[21] C. Rømming, V. Hansen, J. Gjonnes, Crystal Structure of β-Al4.5FeSi, Acta Crystallogr.
B50 (1994) 307-312
[22] V. Hansen, B. Hauback, M. Sundberg, Chr. Rømming, J. Gjønnes, β-Al4.5FeSi: A
combined synchrotron powder diffraction, electron diffraction, high-Resolution electron
microscopy and single-crystal X-ray diffraction study of a faulted structure, Acta
Crystallogr. B54 (1998) 351-357
References
113
[23] P.J. Black, XLIX. Brillouin Zones of some intermetallic compounds, Philos. Mag. 46
(1955) 401-409
[24] G.J.C. Carpenter, V.L. Page, Revised cell data for the β-FeAlSi phase in aluminum
alloys, Scr. Metall. Mater. 28 (1993) 733–736
[25] J. Campbell, Discussion of “effect of strontium and phosphorus on eutectic Al-Si
nucleation and formation of β-Al5FeSi in hypoeutectic Al-Si foundry alloys”, Metall. Mater.
Trans. A 40A (2009) 1009-1010
[26] S. G. Shabestari, M. Mamudi, M. Emamy, J. Campbell, Effect of Mn and Sr on
intermetallics in Fe-rich eutectic Al-Si alloy. Int. J. Cast. Met. Res. 15 (2002) 17-24
[27] A.M. Samuel, A. Pennors, C. Villeneuve, F.H. Samuel, H.W. Doty, S. Valtierra, Effect
of cooling rate and Sr-modification on porosity and Fe-intermetallics formation in Al-6.5%
Si-3.5% Cu-Fe alloys. Int. J. Cast, Met. Res. 13 (4) (2000)231-253
[28] L. Lu, A.K. Dahle, Iron-rich intermetallic phases and their role in casting defect
formation in hypoeutectic Al-Si alloys, Metall. Mater. Trans. A 36A (2005) 819-835
[29] A. Gorny, J. Manickaraj, Z. Cai, S. Shankar, Evolution of Fe based intermetallic phases
in Al–Si hypoeutectic casting alloys: Influence of the Si and Fe concentrations, and
solidification rate, J. Alloys & Comp. 577 (2013) 103–124
[30] A.L. Dons, Superstructures in alpha-Al(Mn,Fe,Cr)Si, Z. Metallkd. 76(2) (1985) 151-
153
[31] S.G. Shabestari, J.E. Gruzleski, Modification of iron intermetallics by strontium in 413
aluminum alloys, AFS Trans. 103 (1995) 285-293
[32] F.H. Samuel, A.M. Samuel, H.W. Doty, S. Valtierra, Decomposition of Fe-
intermetallics in Sr-modified cast 6XXX type aluminum alloys for automotive Skin. Metall.
Mater. Trans. A 32A (2001) 2061-2075
[33] A. Samuel, F. Samuel, H. Doty, S. Valtierra, Metallographic observations of β-AlFeSi
phase and its role in porosity formation in Al–7%Si alloys, Int. J. Cast. Met. Res. 19 (2006)
156-166
[34] C.M. Dinnis, J.A. Taylor, A.K Dahle, As-cast morphology of iron-intermetallics in Al–
Si foundry alloys, Scripta Mater. 53 (2005) 955-958
References
114
[35] F. Lasagni, A. Lasagni, C, Holzapfel, F. Mücklich, H.P. Degischer, Three dimensional
characterization of unmodified and Sr-modified Al-Si eutecticsby FIB and FIB/EDX
tomography, Advanc. Eng. Mater. 8 (2006) 719-723
[36] F. Lasagni, A. Lasagni, E. Marks, C, Holzapfel, F. Mücklich, H.P. Degischer. Three
dimensional characterization of “as-cast” and solution-treated AlSi12(Sr) alloys by high-
resolution FIB tomography, Acta Mater 55 (2007) 3875-3882
[37] J.M. Yu, N.Wanderka, G. Miehe, J. Banhart, Intermetallic phases in high-purity Al-
10Si-0.3Fe cast alloys with and without Sr modification studied by FIB tomography and
TEM, Intermetallics, 72 (2016) 53-61
[38] P. Mikołajczak, L. Ratke, X-ray tomography investigators of Fe-rich intermetallics in
AlSi alloys, Archives of Foundry Eng. 13 (2013) 79-82
[39] N. Limodin, L. Salvo, E. Boller, M. Suéry, M. Felberbaum, S. Gailliègue, K. Madi, In-
situ and real-time 3-D microtomography investigation of dendritic solidification in an Al–10
wt.% Cu alloy, Acta Mater. 57 (2009) 2300-2310
[40] C. Puncreobutr, A.B. Phillion, J.L. Fife, P. Rockett, A.P. Horsfield, P.D. Lee, In-situ
quantification of the nucleation and growth of Fe-rich intermetallics during Al alloy
solidification, Acta Mater. 79 (2014) 292–303
[41] R. H. Mathiesen, L. Arnberg, Y. Li, V. Meier, P. Schaffer, I. Snigireva, A. Snigirev,
A.K. Dahle. X-Ray videomicroscopy studies of eutectic Al-Si solidification in Al-Si-Cu,
Metall. Mater. Trans. A 42A (2011) 170-180
[42] S. Terzi, J.A. Taylor, Y.H. Cho, L. Salvo, M. Suéry, E. Boller, A.K. Dahle. In-situ study
of nucleation and growth of the irregular α-Al/β-Al5FeSi eutectic by 3-D synchrotron X-ray
microtomography, Acta Mater. 58 (2010) 5370–5380
[43] C. Kammer: Aluminium-Taschenbuch. Düsseldorf: Aluminium-Verlag, 2002
[44] Z. Liu, Y.A. Chang, Thermodynamic Assessment of the Al-Fe-Si system, Metall. Mater.
Trans. A 30A (1999) 1081-1095
[45] Y. Du, J. C. Schuster, Z. Liu, R. Hu, P. Nash, W. Sun, etc. A thermodynamic
description of the AlFeSi system over the whole composition and temperature ranges via a
hybrid approach of CALPHAD and key experiments, Intermetallics 16 (2008) 554-570
References
115
[46] N. Krendelsberger, F. Weitzer, J. C. Schuster, On the Reaction Scheme and Liquidus
Surface in the Ternary System Al-Fe-Si, Metall. Mater. Trans. A 38A (2007) 1681-1691
[47] V. Raghavan, Al-Fe-Si (Aluminum-Iron-Silicon), J. Phase Equilibria and Diffusion 23
(2002) 362–366
[48] H.P. Takeda and K. Mutuzaki, The Equilibrium Diagram of the Iron-Aluminium-
Silicon System, Tetsu to Hagane, 26 (1940) 335-361
[49] V. Rivlin, G.V. Raynor, Critical evaluation of constitution of aluminium–iron–silicon
system, Int. Met. Rev. 3 (1981) 133–152
[50] S. Pontevichi, F. Bosselet, F. Barbeau, M. Peronnet, J.C. Viala, Solid-Liquid Phase
Equilibria in the Al-Fe-Si System at 727 °C, J. Phase Equilibria & Diffusion 25 (2004) 528-
537
[51] G. Ghosh and MSIT, Al-Fe-Si Ternary Phase Diagram Evaluation, in: G. Effenberg (ed.)
MSI Eureka in Springer Materials (2007)
[52] M. Rappaz, Modelling of microstructure formation in solidification processes,
International Materials Reviews 34 (1989) 93–123
[53] S.D. McDonald, Eutectic Solidification and Porosity Formation in Unmodified and
Modified Hypoeutectic Aluminium-Silicon Alloys, PhD thesis, Queensland, Australia, 2002
[54] P. Thevoz, J. L. Desbiolles, M. Rappaz, Modeling of equiaxed microstructure formation
in casting, Metall. Trans. A 20 (1989) 311–322
[55] S.D. McDonald, A.K. Dahle, J.A. Taylor. D.H. StJohn, Eutectic Grains in Unmodified
and Strontium-modified Hypoeutectic Aluminum-Silicon Alloys, Metall. Mater. Trans. A
35A (2004) 1829–1837
[56] X.-G. Chen, Crystallization of the aluminum-silicon-eutectic and application of the
thermal analysis for controlling the processing, PhD thesis, RWTH Aachen, Germany, 1990
[57] Y.S. Choi, J.S. Lee, W.T.Kim, H.Y. Ra, Solidification behaviour of Al-Si-Fe alloys and
phase transformation of metastable intermetallic compound by heat treatment, J. Mater. Sci.
34 (1999) 2163-2168
[58] M. Cooper, K. Robinson, The crystal structure of the ternary alloy α (AlMnSi), Acta
Crystallogr. 20 (1966) 614-617
References
116
[59] H.W.L. Phillips, Annotated equilibrium diagrams of some aluminium alloy systems
(monograph No.25), London (Inst. Metals) (1959) 25
[60] K. Robinson, P. J. Black, An X-ray examination of an α (Al-Fe-Si) ternary compound,
Phil. Mag. 44 (1953) 1392-1397
[61] V. Elser, C.L. Henley, Crystal and quasicrystal structures in Al-Mn-Si alloys, Phys. Rev.
Lett. 55 (1985) 2883
[62] X. Cao, J. Campbell, The nucleation of Fe-rich phases on oxide films in Al-11.5Si-
0.4Mg cast alloys, Metall. Mater. Trans. A 34A (2003)1409-1420
[63] L.A. Narayanan, F.H. Samuel, J.E. Gruzleski, Crystallization behavior of iron-
containing intermetallic compounds in 319 aluminum alloy. Metall Mater Trans A 25A
(1994) 1761-1773
[64] W. Rosenhain, S.L. Archbutt. D. Hanson. Eleventh Report to the Alloys Research
Committee of the Institution of Mechanical Engineers. Alloys Research Committee;
National Physical Laboratory (Great Britain) (1921)
[65] G. Sigworth, J. Campbell, The modification of Al-Si casting alloys: important practical
and theoretical aspects. Int. J. Metalcast. 3 (2009) 65-74
[66] Y.H. Cho, H.C. Lee, K.H. Oh, A.K. Dahle, Effect of Strontium and Phosphorus on
Eutectic Al-Si Nucleation and Formation of β-Al5FeSi in Hypoeutectic Al-Si Foundry
Alloys. Metall. Mater. Trans. A, 39A (2008) 2008-2435
[67] D.N. Miller, L. Lu, A.K. Dahle, The role of oxides in the formation of primary iron
intermetallics in an Al-11.6Si-0.37Mg Alloy. Metall. Mater. Trans. B 37B (2006) 873-878
[68] A.M. Samuel, F.H. Samuel, H.W. Doty, Observations on the formation of β-Al5FeSi
phase in 319 type Al-Si alloys. J. Mater. Sci. 31(1996) 5529-5539
[69] B. Kim, S. Lee, S. Lee, H. Yasuda, Real-time radiographic observation of solidification
of solidification behavior of Al-Si-Cu casting alloys with the variation of iron content. Mater.
Trans. 53 (2012) 374-379
[70] A.K. Dahle, K. Nogita, J.W. Zindel, S.D. McDonald, L.M. Hogan, Eutectic nucleation
and growth in hypoeutectic Al-Si alloys at different strontium levels. Metall. Mater. Trans. A
32A (2001) 949–960
References
117
[71] S.D. McDonald, K. Nogita, A.K. Campbell, Eutectic nucleation in Al-Si alloys. Acta
Mater. 52 (2004) 4273-4280
[72] M. Timpel, N. Wanderka, R. Schlesiger, T. Yamamoto, N. Lazarev, D. Isheim, G.
Schmitz, S. Matsumura, J. Banhart. The role of strontium in modifying aluminium-silicon
alloys, Acta Mater. 60 (2012) 3920-3928
[73] M. Timpel, N. Wanderka, R. Schlesiger, T. Yamamoto, D. Isheim, G. Schmitz, S.
Matsumura, J. Banhart, Sr-Al-Si co-segregated regions in eutectic Si phase of Sr-modified
Al-10Si alloy. Ultramicroscopy 132 (2013) 216-221
[74] J. Barrirero, M. Engstler, N. Ghafoor, N. de Jonge, M. Oden, F. Mücklich, Comparison
of segregations formed in unmodified and Sr-modified Al-Si alloys studied by atom probe
tomography and transmission electron microscopy. J. Alloys & Compd. 611 (2014) 410-421
[75] A.M. Samuel, F.H. Samuel, C. Villeneuve, H.W. Doty and S. Valtierra, Effect of trace
elements on β-Al5FeSi characteristics, porosity and tensile properties of Al-Si-Cu (319) cast
alloys. Int. J. Cast Metals Res. 14 (2001) 97-120
[76] C. Villeneuve and F.H. Samuel, Modification of iron intermetallics by magnesium and
strontium in Al-Si alloys. Int. J. Cast Met. Res. 12 (1997) 145–160
[77] Manual Smart SEM V 5.00. Manual for the SUPRA (VP) and ULTRA Scanning
Electron Microscope, (2005)
[78] Carl Zeiss SMT-Nano technology systems division, Zeiss Ultra 55 & Ultra 60.
http://www.pro-4-pro.com/media/product/12508/attachment_en-1398244596.pdf
[79] Principle of TEM. http://www.hk-phy.org/atomic_world/tem/tem02_e.html
[80] H. Zhang, What limits the application of TEM in the semiconductor industry?, Thin
Solid Films 320 (1998) 77–85
[81] Principle of Focused ion beam. https://en.wikipedia.org/wiki/Focused_ion_beam
[82] L. Holzer and M. Cantoni. Review of FIB Tomography in Nanofabrication Using
Focused Ion and Electron Beams: Principles and Applications. Oxford University Press,
Oxford, UK (2012) 410-435
[83] Template Matching and Slice Alignment- ImageJ Plugins. http://sites.google.com /site/
qingzongtseng/template-matching-ij-plugin
References
118
[84] L. A. Giannuzzi and F.A. Stevie. Introduction to Focused Ion Beams. New York,
Springer, (2005)
[85] G. Margaritondo. Elements of Synchrotron Light: For Biology, Chemistry, and Medical
Research. Oxford University Press, (2002)
[86] M. H. R. Donald, M. R. Harold, N. M. King, B. G. Loach, J. R. M. Maidment, C. W.
Planner, G. H. Rees, and J. V. Trotman. A Superconducting Synchrotron Design Study at the
Rutherford Laboratory. IEEE Transactions on Nuclear Science 18 (1971)
[87] H.A. Barnett. Chemical analysis of polymer blends via synchrotron X-ray tomography.
PhD Dissertation. Louisiana Tech University. (2008)
[88] Parameters of Accelerators of ESRF. http://www.esrf.eu/Accelerators/Accelerators/
[89] D. J. Thompson, R. Coisson, M. Ericksson, J. Leduff, A. Hofmann, D. Husmann, G.
Mulhaupt, M. W. Poole, M. Renard, M. Sommer, V. P. Suller, S. Tazzari, and F. H. Wang.
The All Wiggler Synchrotron Radiation Source. IEEE Transactions on Nuclear Science 28
(1981) 3153-3155
[90] Salvo, L., P. Cloetens, E. Maire, S. Zabler, J.J. Blandin, J.Y. Buffiere, W. Ludwig, E.
Boller, D. Bellet, and C. Josserond, X-ray micro-tomography an attractive characterisation
technique in materials science. Nuclear Instruments & Methods in Physics Research Section
B- Beam Interactions with Materials and Atoms 200 (2003) 273-286
[91] P. A. Douissard, A. Cecilia, X. Rochet, X. Chapel, T. Martin T. van de Kamp, L. Helfen,
T. Baumbach, L. Luquot, X. Xiao, J. Meinhardt, and A. Rack. A versatile indirect detector
design for hard X-ray microimaging, Journal of Instrumentation 7 (2012) P09016, 1-26
[92] Reconstruction program performing by pyHST (High Speed Tomography in python
version) software. http://www.esrf.eu/UsersAndScience/Experiments/Imaging/ID19/ micro
tomography/computing duringexperiment/toto
[93] A.L. Dons, Superstructures in alpha-Al(Mn,Fe,Cr)Si, Z. Metallkd. 76 (2) (1985) 151-
153
[94] Y. Komura, W.G. Sly, D.P. Shoemaker, The crystal structure of the R phase, Mo-Co-Cr,
Acta Crystallogr. 13 (1960) 575-585
[95] S. Samson, E.K. Gordon, The crystal structure of ε-Mg23Al30, Acta Crystallogr. B24
(1968) 1004-1013
References
119
[96] C.B. Shoemaker, D.P. Shoemaker, Refinement of an R phase, Mn85.5Si14.5, Acta
Crystallogr. B34 (1978) 701-705
[97] S. Rideout, W.D. Manly, E.L. Kamen, B.S. Lement, P.A. Beck, Intermediate Phases in
Ternary Alloy Systems of Transition Elements, Trans. Amer. Inst. Min. (Metall.) Eng. 191
(1951) 872-876
[98] M.V. Kral, P.N.H Nakashima, D.R.G. Mitchell, Electron Microscope studies of Al-Fe-
Si intermetallics in an Al-11Pct Si alloy, Metall. Mater. Trans. A 37A (2006) 1987-1997
[99] G. Sha, K. Sha, B. Cantor. Characterization of Fe-rich intermetallic phases in a 6xxx
series Al alloy, Mater. Sci. Forum 519–521 (2006) 1721-1726
[100] G.K. Sigworth, The modification of Al–Si casting alloys: important practical and
theoretical aspects, Int. J. Metal cast. 2 (2008) 19–40
[101] C. Liao, J. Chen, Y. Li, H. Chen, C. Pan, Modification performance on 4032 Al alloy
by using Al-10Sr master alloys manufactured from different processes, Progress in Natural
Science: Materials International 24 (2014) 87-96
[102] J. Wang, P.D. Lee, R.W. Hamilton, M. Li, J. Alison, The kinetics of Fe-rich
intermetallic formation in aluminium alloys: In situ observation. Scripta Mater. 60 (2005)
516-519
[103] J. Wang, M. Li, J. Allison, P.D. Lee, Multiscale modeling of the influence of Fe
content in a Al-Si-Cu alloy on the size distribution of intermetallic phases and micropores, J.
Appl. Phys. 107 (2010) 061804, 1-8
[104] W. Khalifa, F.H. Samuel, J.E. Gruzleski, H.W. Doty, S. Valtierra, Nucleation of Fe-
intermetallic phases in the Al-Si-Fe alloys, Metall Mater Trans A, 36A (2005) 1017-1032
[105] C. Puncreobutr, P.D. Lee, K.M. Kareh, T. Connolley, J.L. Fife, A.B. Phillion,
Influence of Fe-rich intermetallics on solidification defects in Al–Si–Cu alloys. Acta
Materialia 68 (2014) 42–51
[106] N. Roy, A.M. Samuel, F.H. Samuel. Metall. Porosity formation in Al-9 wt Pct Cu
alloy system: metallographic observations. Mater. Trans. A 27 (1996) 415-429.
[107] L.A. Narayanan, F.H. Samuel, Thermal analysis studies on the effect of cooling rate
on the microstructure of the 319 aluminium alloy. AFS Trans., 100 (1992) 383-391.
References
120
[108] L. Liu, A. M. A. Mohamed, A. M. Samuel, F. H. Samuel, H. W. Doty, S.Valtierra,
Precipitation of β-Al5FeSi phase platelets in Al-Si based casting alloys. Metall. Mater. Trans.
A 40A (2009) 2457-2469
[109] P. Ashtari, H, Tezuka, T, Sato, Influence of Sr and Mn additions on intermetallic
compound morphologies in Al-Si-Cu-Fe cast alloys. Mater. Trans. 44 (2003) 2611-2616
[110] L.M. Hogan, H. Song, Aluminium grains structures in Al-Si eutectic alloys, Acta
Metal. 35 (1987) 677-680
[111] S. Lu, A. Hellawell, The mechanism of Si modification in Aluminium-Silicon Alloys:
Impurity induced twinning, Metall. Mater. Trans. A 18A (1987) 1721-1733
[112] A. K. Srivastava, V. C. Srivastava, A. Gloter, S. N. Ojha, Microstructural features
induced by spray processing and hot extrusion of an Al–18% Si–5% Fe–1.5% Cu alloy. Acta
Mater 54 (2006) 1741-1748
[113] J. Li, M. Zarif, P. Schumacher, TEM investigation of a novel Fe-containing phase in
high purity Al-Si-Fe alloys. BHM Berg-Huttenmann Monatsh 155 (2010) 499-505
[114] D. Naoi, M. Kajihara, Growth behavior of Fe2Al5 during reactive diffusion between Fe
and Al at solid-state temperatures. Mater. Sci. & Eng. A 459 (2007) 375-382
Acknowledgements
121
Acknowledgements
I am deeply grateful to Prof. John Banhart, who gave me the opportunity to pursue my PhD
at the Institute of Applied Materials of the Helmholtz-Zentrum Berlin für Materialien und
Energie (HZB) and partly financial support during my PhD. I would like to thank the second
examiner Prof. Dieter Herlach from German Aerospace Center (DLR), who is ready to
examine my thesis. I would like to express my greatest gratitude to Dr. Nelia Wanderka,
who guided me through the palace of science during my PhD. She is a great scientist. She
also trained me to operate TEM with her professional skills and rich experience, and she
always headed me in time when I was about to be lost with her patience, her encouragement,
her enthusiasm, and her great efforts as well as her inspiration, which I really appreciate.
My sincere thanks also go to Dr. Gerhard Miehe from TU-Darmstadt for the excellent
analysis of SAED patterns. I would also like to thank Dr. Anna Manzoni and Dr. Florian
Vogel in our group for their kind assistance in performing synchrotron tomography
experiment at ESRF. I am especially grateful to Dr. Anna Manzoni, who gave me thousand
times of helps. I also would like to thank Dr. Florian Vogel, who taught me how to process
images using photoshop. I would like to thank Mr. Holger Kropf for the help of FIB
tomography experiment, and Mrs. Christiane Förster for the help of TEM sample preparation,
and Mrs. Claudia Leistner for using cutting machine in her lab and the help of DSC
experiment.
My gratitude also goes to Mr. Manuel Wüstenhagen from TU Berlin, who helped me
together make an excellent programming to run macro which indeed saved a lot of time to
process massive data. I also would like to thank Mr. Jörg Bajorat for always solving the
computer problems in time, and Mrs Annette Friedrich and Mrs Manfred Wiencken from
HZB library department for providing and ordering literatures that I needed. I would like to
thank Mrs. Christiane Ciceron for the help of documents management.
I also would like to acknowledge the experiment condition provided by European
Synchrotron Radiation Facility and the help from the scientists at beamline ID 19 at ESRF.
Particularly, I would like to thank Dr. Alexander Rack for the help of synchrotron

Acknowledgements
122
tomography experiment at ESRF and all the arrangement during the period of experiment
and data processing. My gratitude also goes to Dr. Remi Daudin for lots of help of data
processing, and Mrs Elodie Boller for the help of this experiment, especially for optimizing
parameters for in-situ measurement.
My gratitude also goes to the excellent tomography group in our institute. Particularly, I
would like to thank Dr. Manke Ingo, whose group helped me perform many valuable
experiments at BESSY II for synchrotron tomography and also taught me valuable methods
of data processing, for which I would like to express my gratitude to Dr. Henning Markötter,
Dr. Tobias Arlt, Dr. Hilger Andre, Dr Kardjilov Nikolay, Mr. Markus Osenberg. I especially
would like to express my appreciation to Dr. Henning Markötter for teaching me images
processing methods with his patience and enthusiasm, and Dr. Tobias Arlt for his great help
in performing in-situ synchrotron tomography work at ESRF.
My deepest gratitude goes to my parents for their long standing encouragement and support
as well as their incessant love. I also would like to thank my girlfriend Ms Piao Xiangzi, who
gave me lots of encouragement and supports.
I would like to thank my country and the Chinese Scholarship Council for giving me
financial support during my PhD.
I would also like to thank all the people who gave me helps, supports and encouragements
during my PhD period.
Berlin, 2016
Jiamin Yu
Declaration
123
Declaration
Ich erkläre hiermit, dass ich diese Dissertation selbständig verfasst habe. Die benutzten
Hilfsmittel und Quellen sind in der Arbeit vollständig angegeben. Ich habe weder früher
noch gleichzeitig ein Promotionsverfahren bei einem anderen Fachbereich bzw. einer
anderen Hochschule beantragt. Diese Arbeit hat in gleicher oder ähnlicher Form noch keiner
Prüfungsbehörde vorgelegen.
Berlin, im September 2016

Declaration
124