Embed Size (px)
Citation preview
University of Groningen
Formation and evolution of dwarf early-type galaxies in the Virgo cluster I. Internal kinematicsToloba, E.; Boselli, A.; Cenarro, A. J.; Peletier, R. F.; Gorgas, J.; Gil de Paz, A.; Munoz-Mateos, J. C.Published in:Astronomy & astrophysics
DOI:10.1051/0004-6361/201015344
IMPORTANT NOTE: You are advised to consult the publisher's version (publisher's PDF) if you wish to cite fromit. Please check the document version below.
Document VersionPublisher's PDF, also known as Version of record
Publication date:2011
Link to publication in University of Groningen/UMCG research database
Citation for published version (APA):Toloba, E., Boselli, A., Cenarro, A. J., Peletier, R. F., Gorgas, J., Gil de Paz, A., & Munoz-Mateos, J. C.(2011). Formation and evolution of dwarf early-type galaxies in the Virgo cluster I. Internal kinematics.Astronomy & astrophysics, 526, [A114]. https://doi.org/10.1051/0004-6361/201015344
CopyrightOther than for strictly personal use, it is not permitted to download or to forward/distribute the text or part of it without the consent of theauthor(s) and/or copyright holder(s), unless the work is under an open content license (like Creative Commons).
The publication may also be distributed here under the terms of Article 25fa of the Dutch Copyright Act, indicated by the “Taverne” license.More information can be found on the University of Groningen website: https://www.rug.nl/library/open-access/self-archiving-pure/taverne-amendment.
Take-down policyIf you believe that this document breaches copyright please contact us providing details, and we will remove access to the work immediatelyand investigate your claim.
Downloaded from the University of Groningen/UMCG research database (Pure): http://www.rug.nl/research/portal. For technical reasons thenumber of authors shown on this cover page is limited to 10 maximum.
Download date: 28-11-2021
A&A 526, A114 (2011)DOI: 10.1051/0004-6361/201015344c© ESO 2011
Astronomy&
Astrophysics
Formation and evolution of dwarf early-type galaxiesin the Virgo cluster�, ��
I. Internal kinematics
E. Toloba1, A. Boselli2, A. J. Cenarro3, R. F. Peletier4, J. Gorgas1, A. Gil de Paz1, and J. C. Muñoz-Mateos1,5
1 Departamento de Astrofísica y CC. de la Atmósfera, Universidad Complutense de Madrid, 28040 Madrid, Spaine-mail: [etj;jcmunoz]@astrax.fis.ucm.es, [email protected], [email protected]
2 Laboratoire d’Astrophysique de Marseille, UMR 6110 CNRS, 38 rue F. Joliot-Curie, 13388 Marseille, Francee-mail: [email protected]
3 Centro de Estudios de Física del Cosmos de Aragón, 44001 Teruel, Spaine-mail: [email protected]
4 Kapteyn Astronomical Institute, Rijksuniversiteit Groningen, Postbus 800, 9700 AV Groningen, The Netherlandse-mail: [email protected]
5 National Radio Astronomy Observatory, 520 Edgemont Road, Charlottesville, VA 22903-2475, USA
Received 6 July 2010 / Accepted 12 November 2010
ABSTRACT
We present new medium resolution kinematic data for a sample of 21 dwarf early-type galaxies (dEs) mainly in the Virgo cluster,obtained with the WHT and INT telescopes at the Roque de los Muchachos Observatory (La Palma, Spain). These data are usedto study the origin of the dwarf elliptical galaxy population inhabiting clusters. We confirm that dEs are not dark matter dominatedgalaxies, at least not up to the half-light radius. We also find that the observed galaxies in the outer parts of the cluster are mostlyrotationally supported systems with disky morphological shapes. Rotationally supported dEs have rotation curves similar to those ofstar-forming galaxies of similar luminosity and follow the Tully-Fisher relation. This is expected if dE galaxies are the descendants oflow-luminosity star-forming systems that have recently entered the cluster environment and lost their gas due to a ram-pressure strip-ping event, quenching their star formation activity and transforming into quiescent systems, but conserving their angular momentum.
Key words. galaxies: clusters: individual: Virgo – galaxies: dwarf – galaxies: elliptical and lenticular, cD – galaxies: kinematics anddynamics – galaxies: evolution – galaxies: formation
1. Introduction
The processes involved in galaxy formation and evolutionthrough cosmic time are still poorly understood. It is indeed stillunclear how matter assembled to form the present-day galaxypopulation, whether it followed a passive evolution after the col-lapse of the primordial density fluctuations (secular evolution),through a subsequent merging of growing structures (hierarchi-cal formation) or a combination of the two. A way to quantifythe relative role of these different mechanisms is to study dwarfgalaxies, the most numerous objects in the universe (Ferguson& Binggeli 1994). Their importance resides in the expectationthat these low-luminosity systems will be the building blocks ofmassive galaxies in lambda cold dark matter (ΛCDM) hierarchi-cal merging scenarios (e.g., White & Rees 1978; White & Frenk1991).
Among dwarf galaxies, quiescent dwarfs (which we heredefine as all quiescent galaxies with MB > −18, including bothdwarf ellipticals and spheroidals, hereafter indicated as dEs)are particularly interesting since they are the most numerous
� Appendices, Full Fig. 6, and Fig. 7 are only available in electronicform at http://www.aanda.org.�� Full Table 3 is only available in electronic form at the CDS viaanonymous ftp to cdsarc.u-strasbg.fr (130.79.128.5) or viahttp://cdsarc.u-strasbg.fr/viz-bin/qcat?J/A+A/526/A114
population in clusters (Ferguson & Binggeli 1994). Theseobjects were originally thought to be the low-luminosityextension of giant ellipticals (Es). Since the 1990s it has beenknown that dEs are composed of several families of objects(e.g. compact and low surface brightness dwarfs) (Bender et al.1992; Kormendy et al. 2009). Later on, it was shown that dEswere no longer small Es with simple, old, and metal-poor stellarpopulations, but much more complex objects exhibiting a widerange of stellar contents. For example, in the Virgo cluster, theyhave stellar populations ranging from very young (around 1 Gyrold) luminosity-weighted ages to as old as the oldest Es galaxies(14 Gyr) (Michielsen et al. 2008). Their proximity alloweddetailed studies of their structural properties that indicated that,behind their elliptical appearance, dEs show a wide variety ofunderlying structures, like disks, spiral arms, irregular features,etc, making them a very heterogeneous class of galaxies (Liskeret al. 2006a,b, 2007).
These proofs indicate a complex formation process shapingthe evolution of dEs in clusters. Two main different processeshave been proposed in the literature. The first mechanism isbased on the idea that dEs are formed through internal processes,like supernova feedback, where the interstellar medium (ISM) ofthe progenitor star-forming galaxy is swept away by the kineticpressure generated by supernovae (Yoshii & Arimoto 1987),although it seems highly unlikely in dark-matter dominated
Article published by EDP Sciences A114, page 1 of 24
A&A 526, A114 (2011)
systems (Silich & Tenorio-Tagle 2001). The second mechanismrests upon external processes induced by the interaction with thehostile environment in which dEs reside (Sandage et al. 1985;Blanton et al. 2005). In a dense environment several mecha-nisms affect galaxies. This might happen through interactionswith the intergalactic medium (IGM), such as ram-pressure strip-ping (Boselli et al. 2008a,b), galaxy-galaxy interactions (e.g.,Byrd & Valtonen 1990), and galaxy harassment (e.g., Mooreet al. 1998; Mastropietro et al. 2005). It has been shown thatall these interactions are able to reproduce some of the observa-tional properties of local dEs in clusters, such as their structuralparameters (Lisker et al. 2006b, 2007) or their stellar populations(Geha et al. 2002, 2003; van Zee et al. 2004b; Michielsen et al.2008; Paudel et al. 2010), but none of them have been testedagainst the kinematic properties. In this regard, whereas in theharassment scenario the system is rapidly heated, leading to anincrease in the velocity dispersion of the galaxy and a decreasein its rotation (Mastropietro et al. 2005), the angular momen-tum is conserved in a ram-pressure stripping event (Boselli et al.2008a,b).
With the aim of using kinematic data to constrain dwarfgalaxy evolution, we recently started an ambitious observationalprogramme at the Observatory El Roque de los Muchachos(La Palma, Spain) to gather medium-resolution spectroscopicdata of dEs in the Virgo cluster. In this paper we present a de-tailed analysis of the internal kinematics focusing our attentionon the most rapidly rotating systems. In Toloba et al. (2009) westudied the kinematics as a function of local environment insidethe Virgo cluster. Several typical scaling relations of pressure-supported systems, such as the fundamental plane, as well astheir stellar population properties, will be analysed in a forth-coming communication.
This paper is structured as follows. In Sects. 2–4 we de-scribe the sample selection, the observations, and the data re-duction process. In Sect. 5 we report on the kinematic measure-ments, paying special attention to the method employed and thestellar templates used. We also describe the procedure for ob-taining the radial kinematic profiles (Sect. 5.1), the central ve-locity dispersion, and the maximum rotational speed of the se-lected galaxies (Sect. 5.2), allowing comparisons with previousworks (Sect. 5.3). Combined with photometric data (Sect. 6), thepresent kinematic observations are used to study the propertiesof rotationally supported systems in the framework of variousmodels of galaxy evolution (Sects. 7–9).
2. The sample
The sample analysed in this work is composed of galaxies withMr > −16 classified as dE or dS0 in the Virgo Cluster Catalog(VCC) by Binggeli et al. (1985). All galaxies have been selectedto have SDSS imaging and to be within the GALEX MIS fields(Boselli et al. 2005), thus to have a measured UV magnitude oran upper limit. To these we added a few field-quiescent dwarfs(originally used as fillers in our observing runs) useful for com-parison in a statistical study. Out of the 43 Virgo galaxies satis-fying these requirements in the VCC, 18 have been observed forthis work. To make the observations accessible to 2.5–4.2 m tele-scopes, we chose those objects with the highest surface bright-ness.
The field sample consists of early-type dwarfs in low-densityregions with magnitudes between −18.5 < Mr < −14.5 and dis-tances similar to Virgo (375 km s−1 < v < 1875 km s−1, 5–25 Mpc). Quiescent objects were selected assuming the colourcriterion FUV-NUV > 0.9 or u − g > 1.2 when UV detections
were not available. We observed only 3 out of 10 field dEs can-didates. To these 18 Virgo and three field dEs we added M 32,selected to test the setup of the instruments. Thanks to the largeamount of available data, M 32 is also an ideal target for com-parison with other data available in the literature.
Although we can consider it representative of the bright endof the Virgo Cluster dE population, the observed sample is notcomplete in any sense.
3. Observations
The observing time that we obtained for this work was part ofthe International Time Program (ITP 2005–2007) at El Roquede los Muchachos Observatory. Here we focus on the medium-resolution (R � 3800), long-slit spectroscopy carried out dur-ing three observing runs. In Runs 1 and 3 (December 2005,February 2007) we used the ISIS double-arm spectrograph atthe 4.2 m WHT, and in Run 2 (January 2007) we used the IDSspectrograph at the INT (2.5 m telescope).
The advantage of ISIS over IDS is that it allows us to usea dichroic (5300 dichroic in our case) to split the light into twobeams to observe two wavelength ranges simultaneously, one inthe blue optical part of the spectra and another in the red. Thistechnique allowed us to cover, in three settings in the first run,the full wavelength range from 3500 Å to 8950 Å, using a mirrorto cover 5000–5600 Å, the only range that we could not coverwith this dichroic. In the third run we used two settings to coverthe same wavelength range except for the dichroic gap.
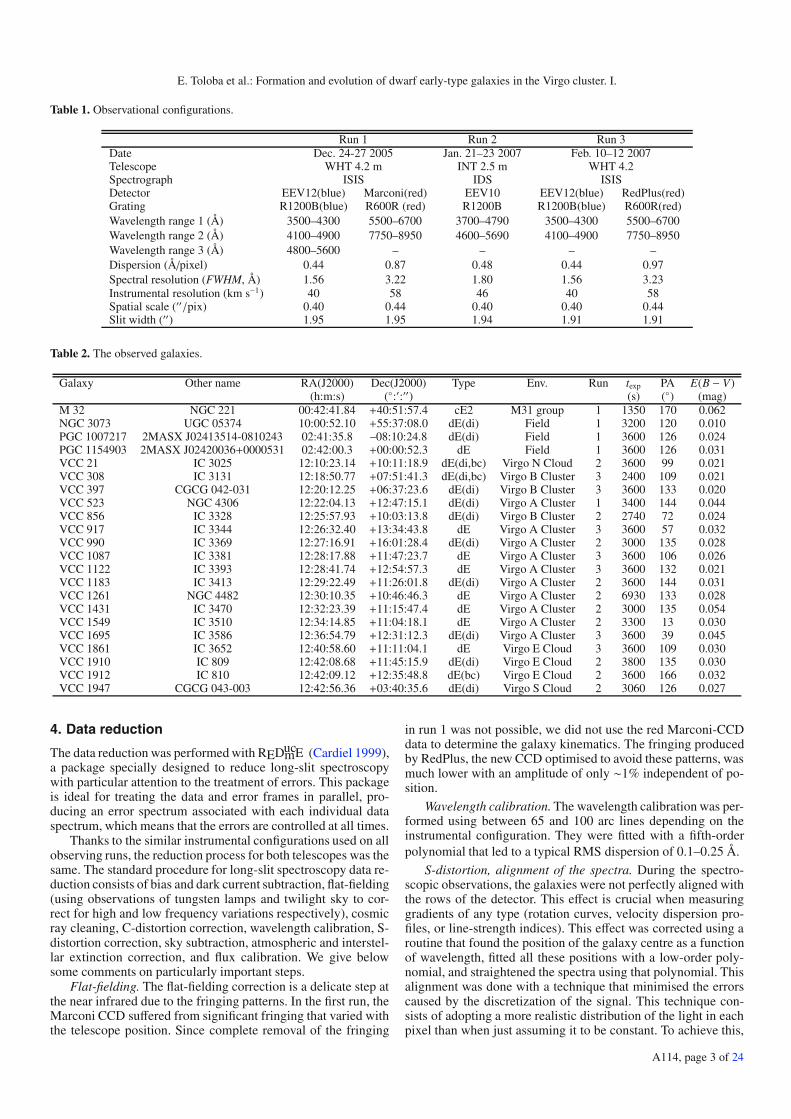
The wavelength range covered by the IDS was smaller(4600–5960 Å), since detector and grating are the same as on theblue arm of ISIS, the data obtained had similar resolution. Thespectral resolution (R � 3800) is high enough to obtain reliablekinematics for dwarf galaxies. All the details of the configura-tions used in each run are specified in Table 1.
In Table 2 we list the observed sample. Column 5 presentsthe morphological type classification according to Lisker et al.(2006a) and Lisker et al. (2006b): dE(di) indicates dwarf el-lipticals with a certain, probable or possible underlying disk(i.e. showing spiral arms, edge-on disks, and/or a bar) orother structures (such as irregular central features (VCC21));dE(bc) refers to galaxies with a blue centre; dE to galax-ies with no evident underlying structure. Four out of our 21dwarf galaxies were not in the Lisker et al. sample (NGC 3073,PGC1007217, PGC1154903 and VCC1947), therefore we clas-sified them as described in Section 6, attending only to theirboxyness/diskyness. Column 6 gives the Virgo substructure towhich the galaxy belongs, taken from the GOLDMine Database(Gavazzi et al. 2003) and defined as in Gavazzi et al. (1999).Columns 7 and 8 refer to the observational campaign (seeTable 1) and the exposure time for each setting, which allowedus to get a typical signal-to-noise ratio1 for the central spectraof ∼60 Å−1, enough to obtain reliable central kinematics. Thegalaxies were observed along their major axis. Their positionangles (PA) from the HyperLEDA Database (Paturel et al. 2003)are given in Col. 9. Column 10 gives the Galactic colour excessfrom Schlegel et al. (1998).
A total of 37 B to M stars in common with the MILES library(Sánchez-Blázquez et al. 2006) and the CaT library (Cenarroet al. 2001) were observed to flux-calibrate our data and to usethem as templates for velocity dispersion measurements.
1 The S/N per Å−1 is obtained dividing the S/N per pixel by the squareroot of the spatial scale along the slit. This measurement is thereforeindependent of the instrument used.
A114, page 2 of 24
E. Toloba et al.: Formation and evolution of dwarf early-type galaxies in the Virgo cluster. I.
Table 1. Observational configurations.
Run 1 Run 2 Run 3Date Dec. 24-27 2005 Jan. 21–23 2007 Feb. 10–12 2007Telescope WHT 4.2 m INT 2.5 m WHT 4.2Spectrograph ISIS IDS ISISDetector EEV12(blue) Marconi(red) EEV10 EEV12(blue) RedPlus(red)Grating R1200B(blue) R600R (red) R1200B R1200B(blue) R600R(red)Wavelength range 1 (Å) 3500–4300 5500–6700 3700–4790 3500–4300 5500–6700Wavelength range 2 (Å) 4100–4900 7750–8950 4600–5690 4100–4900 7750–8950Wavelength range 3 (Å) 4800–5600 – – – –Dispersion (Å/pixel) 0.44 0.87 0.48 0.44 0.97Spectral resolution (FWHM, Å) 1.56 3.22 1.80 1.56 3.23Instrumental resolution (km s−1) 40 58 46 40 58Spatial scale (′′/pix) 0.40 0.44 0.40 0.40 0.44Slit width (′′) 1.95 1.95 1.94 1.91 1.91
Table 2. The observed galaxies.
Galaxy Other name RA(J2000) Dec(J2000) Type Env. Run texp PA E(B − V)(h:m:s) (◦:′:′′) (s) (◦) (mag)
M 32 NGC 221 00:42:41.84 +40:51:57.4 cE2 M31 group 1 1350 170 0.062NGC 3073 UGC 05374 10:00:52.10 +55:37:08.0 dE(di) Field 1 3200 120 0.010PGC 1007217 2MASX J02413514-0810243 02:41:35.8 –08:10:24.8 dE(di) Field 1 3600 126 0.024PGC 1154903 2MASX J02420036+0000531 02:42:00.3 +00:00:52.3 dE Field 1 3600 126 0.031VCC 21 IC 3025 12:10:23.14 +10:11:18.9 dE(di,bc) Virgo N Cloud 2 3600 99 0.021VCC 308 IC 3131 12:18:50.77 +07:51:41.3 dE(di,bc) Virgo B Cluster 3 2400 109 0.021VCC 397 CGCG 042-031 12:20:12.25 +06:37:23.6 dE(di) Virgo B Cluster 3 3600 133 0.020VCC 523 NGC 4306 12:22:04.13 +12:47:15.1 dE(di) Virgo A Cluster 1 3400 144 0.044VCC 856 IC 3328 12:25:57.93 +10:03:13.8 dE(di) Virgo B Cluster 2 2740 72 0.024VCC 917 IC 3344 12:26:32.40 +13:34:43.8 dE Virgo A Cluster 3 3600 57 0.032VCC 990 IC 3369 12:27:16.91 +16:01:28.4 dE(di) Virgo A Cluster 2 3000 135 0.028VCC 1087 IC 3381 12:28:17.88 +11:47:23.7 dE Virgo A Cluster 3 3600 106 0.026VCC 1122 IC 3393 12:28:41.74 +12:54:57.3 dE Virgo A Cluster 3 3600 132 0.021VCC 1183 IC 3413 12:29:22.49 +11:26:01.8 dE(di) Virgo A Cluster 2 3600 144 0.031VCC 1261 NGC 4482 12:30:10.35 +10:46:46.3 dE Virgo A Cluster 2 6930 133 0.028VCC 1431 IC 3470 12:32:23.39 +11:15:47.4 dE Virgo A Cluster 2 3000 135 0.054VCC 1549 IC 3510 12:34:14.85 +11:04:18.1 dE Virgo A Cluster 2 3300 13 0.030VCC 1695 IC 3586 12:36:54.79 +12:31:12.3 dE(di) Virgo A Cluster 3 3600 39 0.045VCC 1861 IC 3652 12:40:58.60 +11:11:04.1 dE Virgo E Cloud 3 3600 109 0.030VCC 1910 IC 809 12:42:08.68 +11:45:15.9 dE(di) Virgo E Cloud 2 3800 135 0.030VCC 1912 IC 810 12:42:09.12 +12:35:48.8 dE(bc) Virgo E Cloud 2 3600 166 0.032VCC 1947 CGCG 043-003 12:42:56.36 +03:40:35.6 dE(di) Virgo S Cloud 2 3060 126 0.027
4. Data reduction
The data reduction was performed with REDucmE (Cardiel 1999),a package specially designed to reduce long-slit spectroscopywith particular attention to the treatment of errors. This packageis ideal for treating the data and error frames in parallel, pro-ducing an error spectrum associated with each individual dataspectrum, which means that the errors are controlled at all times.
Thanks to the similar instrumental configurations used on allobserving runs, the reduction process for both telescopes was thesame. The standard procedure for long-slit spectroscopy data re-duction consists of bias and dark current subtraction, flat-fielding(using observations of tungsten lamps and twilight sky to cor-rect for high and low frequency variations respectively), cosmicray cleaning, C-distortion correction, wavelength calibration, S-distortion correction, sky subtraction, atmospheric and interstel-lar extinction correction, and flux calibration. We give belowsome comments on particularly important steps.
Flat-fielding. The flat-fielding correction is a delicate step atthe near infrared due to the fringing patterns. In the first run, theMarconi CCD suffered from significant fringing that varied withthe telescope position. Since complete removal of the fringing
in run 1 was not possible, we did not use the red Marconi-CCDdata to determine the galaxy kinematics. The fringing producedby RedPlus, the new CCD optimised to avoid these patterns, wasmuch lower with an amplitude of only ∼1% independent of po-sition.
Wavelength calibration. The wavelength calibration was per-formed using between 65 and 100 arc lines depending on theinstrumental configuration. They were fitted with a fifth-orderpolynomial that led to a typical RMS dispersion of 0.1–0.25 Å.
S-distortion, alignment of the spectra. During the spectro-scopic observations, the galaxies were not perfectly aligned withthe rows of the detector. This effect is crucial when measuringgradients of any type (rotation curves, velocity dispersion pro-files, or line-strength indices). This effect was corrected using aroutine that found the position of the galaxy centre as a functionof wavelength, fitted all these positions with a low-order poly-nomial, and straightened the spectra using that polynomial. Thisalignment was done with a technique that minimised the errorscaused by the discretization of the signal. This technique con-sists of adopting a more realistic distribution of the light in eachpixel than when just assuming it to be constant. To achieve this,
A114, page 3 of 24
A&A 526, A114 (2011)
the signal in each pixel is fitted with a second-order polynomialusing the available information in the adjacent pixels.
Sky subtraction. Sky subtraction is critical for studies wherethe spectra are analysed at light levels corresponding to only afew percent of the sky signal, as in our case. For each galaxyobservation, a sky image was generated fitting the data at eachwavelength with a first-order polynomial in regions on both sidesof the galaxy close to the ends of the slit (which has a lengthof 3.7 arcmin on the WHT and 3.3 arcmin on the INT). Thiswas possible since for all targets except M 32 the galaxy filledonly a small region of the slit, so this synthetic sky image wasfree of contamination from the galaxy. For M 32, we observeda separate sky frame moving the telescope from the coordinatesof the galaxy to a position Δα = −416′′ (West), Δδ = −459′′(South) far enough from M 32 to avoid its light but with the samelevel of contamination from M 31.
Extinction correction. Atmospheric extinction was calcu-lated using the extinction curve for El Roque de los MuchachosObservatory (www.ing.iac.es/Astronomy/observing/manuals/ps/tech_notes/tn031.pdf). The Galactic extinc-tion was corrected using the curve of Fitzpatrick (1999) and thereddening from Schlegel et al. (1998) listed in Table 2.
Flux calibration. The spectra was calibrated in relative fluxusing the observed stars in common with the MILES library(Sánchez-Blázquez et al. 2006) for the optical spectra and withthe CaT library (Cenarro et al. 2001) for the near infrared. Foreach observed star we obtained a flux-calibration curve. All ofthem were averaged to obtain one unique flux curve for eachrun and instrumental configuration. The deviations in each flux-calibration curve from the averaged one were introduced as un-certainties in the error spectra. The typical deviation was about2% reaching ∼7% in the first and last ∼150 Å of each setupspectra where the noise is the highest.
5. Measurement of the kinematic parameters
The stellar kinematics of galaxies (radial velocities and veloc-ity dispersions) were calculated using the routine MOVEL in-cluded in REDucmE package (Cardiel 1999). This routine is basedon the Fourier quotient method described by Sargent & Turner(1977) and refined with the OPTEMA algorithm (González1993), which allows us to overcome the typical template mis-match problem. In order to do this, a number of stars of differentspectral types and luminosity classes were introduced in the pro-gramme to create a model galaxy. These stars were of spectraltype B9, A0, A3V, G0, G2III, G5III, G8III, G9III, K0III, K0I,K2III, K3III, M0III, and M2III. The model galaxy was createdand processed in parallel with the galaxy spectrum. To build themodel galaxy, all the template spectra were scaled, shifted, andbroadened according to a first guess of γ (mean line-strength),v (radial velocity), and σ (velocity dispersion). Then the algo-rithm looked for the linear combination of these template starsthat matched the observed galaxy spectrum best. The best lin-ear combination of observed stars was chosen as the one thatminimises the residuals between the galaxy spectrum and thebroadened optimal template. This provided a first model galaxywith a first kinematic output (γ, v and σ). This model galaxywas then improved using this new guess of kinematic param-eters. The process was iterated until it converged. The emissionlines, found only for the field dwarf galaxies, and some large skyline residuals, only present in some cases, were masked, so thatthe programme did not use them for minimising the residuals.
To minimise template mismatch effects, it is essential to usea variety of spectral types and luminosity classes as templates,
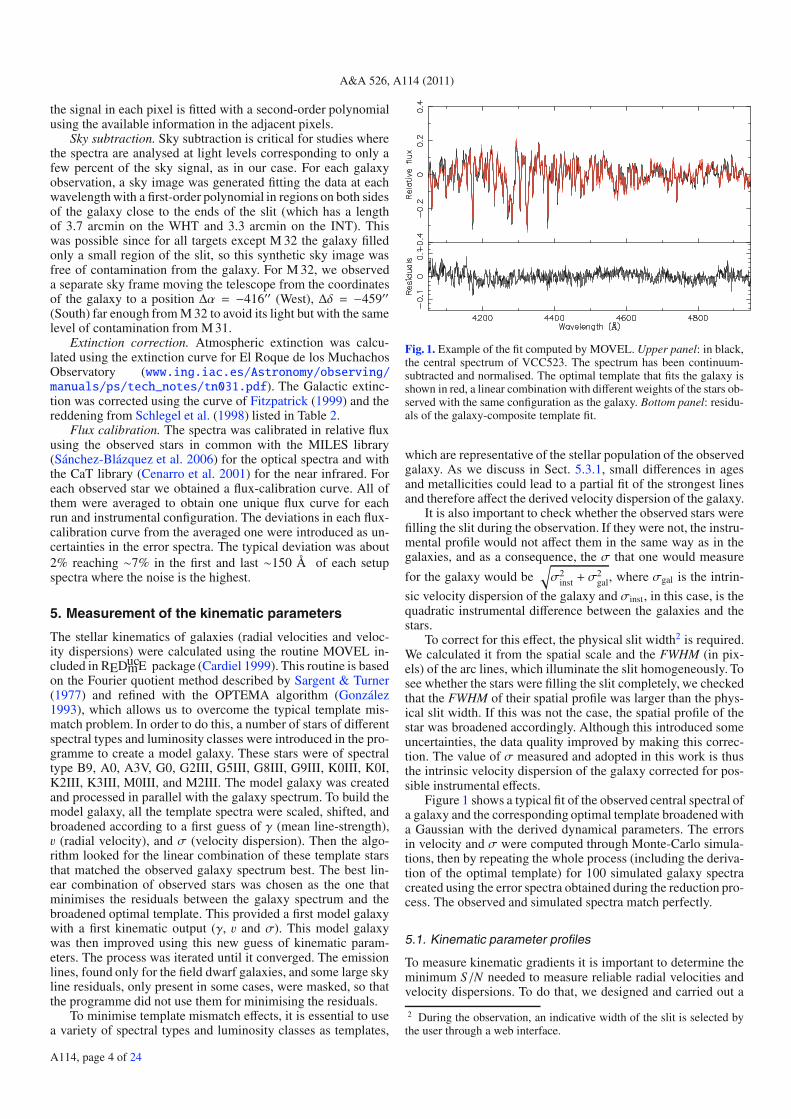
Fig. 1. Example of the fit computed by MOVEL. Upper panel: in black,the central spectrum of VCC523. The spectrum has been continuum-subtracted and normalised. The optimal template that fits the galaxy isshown in red, a linear combination with different weights of the stars ob-served with the same configuration as the galaxy. Bottom panel: residu-als of the galaxy-composite template fit.
which are representative of the stellar population of the observedgalaxy. As we discuss in Sect. 5.3.1, small differences in agesand metallicities could lead to a partial fit of the strongest linesand therefore affect the derived velocity dispersion of the galaxy.
It is also important to check whether the observed stars werefilling the slit during the observation. If they were not, the instru-mental profile would not affect them in the same way as in thegalaxies, and as a consequence, the σ that one would measure
for the galaxy would be√σ2
inst + σ2gal, where σgal is the intrin-
sic velocity dispersion of the galaxy and σinst, in this case, is thequadratic instrumental difference between the galaxies and thestars.
To correct for this effect, the physical slit width2 is required.We calculated it from the spatial scale and the FWHM (in pix-els) of the arc lines, which illuminate the slit homogeneously. Tosee whether the stars were filling the slit completely, we checkedthat the FWHM of their spatial profile was larger than the phys-ical slit width. If this was not the case, the spatial profile of thestar was broadened accordingly. Although this introduced someuncertainties, the data quality improved by making this correc-tion. The value of σ measured and adopted in this work is thusthe intrinsic velocity dispersion of the galaxy corrected for pos-sible instrumental effects.
Figure 1 shows a typical fit of the observed central spectral ofa galaxy and the corresponding optimal template broadened witha Gaussian with the derived dynamical parameters. The errorsin velocity and σ were computed through Monte-Carlo simula-tions, then by repeating the whole process (including the deriva-tion of the optimal template) for 100 simulated galaxy spectracreated using the error spectra obtained during the reduction pro-cess. The observed and simulated spectra match perfectly.
5.1. Kinematic parameter profiles
To measure kinematic gradients it is important to determine theminimum S/N needed to measure reliable radial velocities andvelocity dispersions. To do that, we designed and carried out a
2 During the observation, an indicative width of the slit is selected bythe user through a web interface.
A114, page 4 of 24
E. Toloba et al.: Formation and evolution of dwarf early-type galaxies in the Virgo cluster. I.
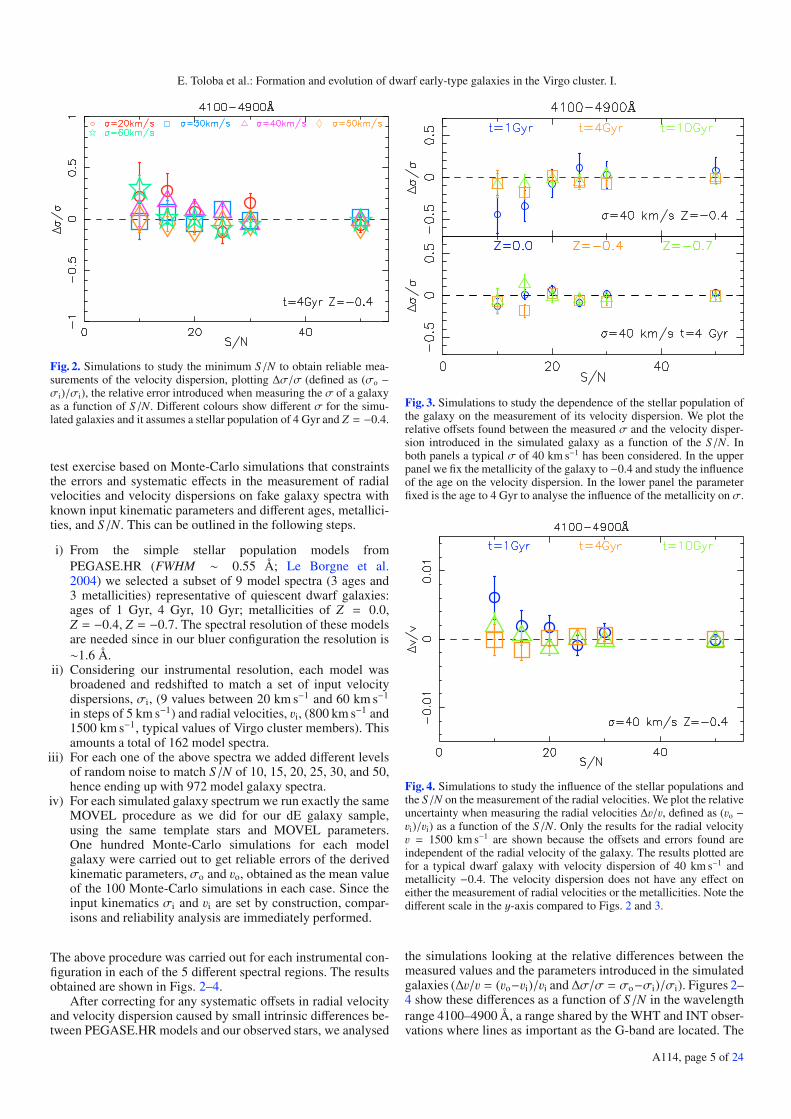
Fig. 2. Simulations to study the minimum S/N to obtain reliable mea-surements of the velocity dispersion, plotting Δσ/σ (defined as (σo −σi)/σi), the relative error introduced when measuring the σ of a galaxyas a function of S/N. Different colours show different σ for the simu-lated galaxies and it assumes a stellar population of 4 Gyr and Z = −0.4.
test exercise based on Monte-Carlo simulations that constraintsthe errors and systematic effects in the measurement of radialvelocities and velocity dispersions on fake galaxy spectra withknown input kinematic parameters and different ages, metallici-ties, and S/N. This can be outlined in the following steps.
i) From the simple stellar population models fromPEGASE.HR (FWHM ∼ 0.55 Å; Le Borgne et al.2004) we selected a subset of 9 model spectra (3 ages and3 metallicities) representative of quiescent dwarf galaxies:ages of 1 Gyr, 4 Gyr, 10 Gyr; metallicities of Z = 0.0,Z = −0.4, Z = −0.7. The spectral resolution of these modelsare needed since in our bluer configuration the resolution is∼1.6 Å.
ii) Considering our instrumental resolution, each model wasbroadened and redshifted to match a set of input velocitydispersions, σi, (9 values between 20 km s−1 and 60 km s−1
in steps of 5 km s−1) and radial velocities, vi, (800 km s−1 and1500 km s−1, typical values of Virgo cluster members). Thisamounts a total of 162 model spectra.
iii) For each one of the above spectra we added different levelsof random noise to match S/N of 10, 15, 20, 25, 30, and 50,hence ending up with 972 model galaxy spectra.
iv) For each simulated galaxy spectrum we run exactly the sameMOVEL procedure as we did for our dE galaxy sample,using the same template stars and MOVEL parameters.One hundred Monte-Carlo simulations for each modelgalaxy were carried out to get reliable errors of the derivedkinematic parameters, σo and vo, obtained as the mean valueof the 100 Monte-Carlo simulations in each case. Since theinput kinematics σi and vi are set by construction, compar-isons and reliability analysis are immediately performed.
The above procedure was carried out for each instrumental con-figuration in each of the 5 different spectral regions. The resultsobtained are shown in Figs. 2–4.
After correcting for any systematic offsets in radial velocityand velocity dispersion caused by small intrinsic differences be-tween PEGASE.HR models and our observed stars, we analysed
Fig. 3. Simulations to study the dependence of the stellar population ofthe galaxy on the measurement of its velocity dispersion. We plot therelative offsets found between the measured σ and the velocity disper-sion introduced in the simulated galaxy as a function of the S/N. Inboth panels a typical σ of 40 km s−1 has been considered. In the upperpanel we fix the metallicity of the galaxy to −0.4 and study the influenceof the age on the velocity dispersion. In the lower panel the parameterfixed is the age to 4 Gyr to analyse the influence of the metallicity on σ.
Fig. 4. Simulations to study the influence of the stellar populations andthe S/N on the measurement of the radial velocities. We plot the relativeuncertainty when measuring the radial velocities Δv/v, defined as (vo −vi)/vi) as a function of the S/N. Only the results for the radial velocityv = 1500 km s−1 are shown because the offsets and errors found areindependent of the radial velocity of the galaxy. The results plotted arefor a typical dwarf galaxy with velocity dispersion of 40 km s−1 andmetallicity −0.4. The velocity dispersion does not have any effect oneither the measurement of radial velocities or the metallicities. Note thedifferent scale in the y-axis compared to Figs. 2 and 3.
the simulations looking at the relative differences between themeasured values and the parameters introduced in the simulatedgalaxies (Δv/v = (vo−vi)/vi and Δσ/σ = σo−σi)/σi). Figures 2–4 show these differences as a function of S/N in the wavelengthrange 4100–4900 Å, a range shared by the WHT and INT obser-vations where lines as important as the G-band are located. The
A114, page 5 of 24
A&A 526, A114 (2011)
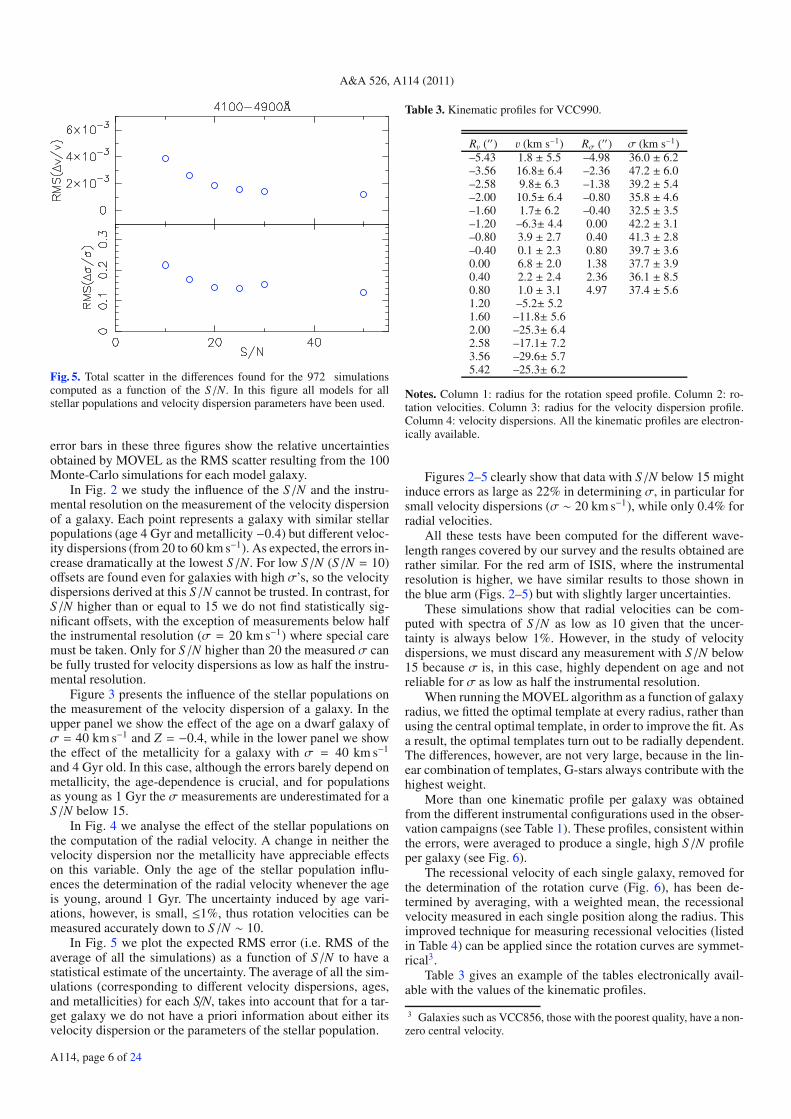
Fig. 5. Total scatter in the differences found for the 972 simulationscomputed as a function of the S/N. In this figure all models for allstellar populations and velocity dispersion parameters have been used.
error bars in these three figures show the relative uncertaintiesobtained by MOVEL as the RMS scatter resulting from the 100Monte-Carlo simulations for each model galaxy.
In Fig. 2 we study the influence of the S/N and the instru-mental resolution on the measurement of the velocity dispersionof a galaxy. Each point represents a galaxy with similar stellarpopulations (age 4 Gyr and metallicity −0.4) but different veloc-ity dispersions (from 20 to 60 km s−1). As expected, the errors in-crease dramatically at the lowest S/N. For low S/N (S/N = 10)offsets are found even for galaxies with high σ’s, so the velocitydispersions derived at this S/N cannot be trusted. In contrast, forS/N higher than or equal to 15 we do not find statistically sig-nificant offsets, with the exception of measurements below halfthe instrumental resolution (σ = 20 km s−1) where special caremust be taken. Only for S/N higher than 20 the measured σ canbe fully trusted for velocity dispersions as low as half the instru-mental resolution.
Figure 3 presents the influence of the stellar populations onthe measurement of the velocity dispersion of a galaxy. In theupper panel we show the effect of the age on a dwarf galaxy ofσ = 40 km s−1 and Z = −0.4, while in the lower panel we showthe effect of the metallicity for a galaxy with σ = 40 km s−1
and 4 Gyr old. In this case, although the errors barely depend onmetallicity, the age-dependence is crucial, and for populationsas young as 1 Gyr the σ measurements are underestimated for aS/N below 15.
In Fig. 4 we analyse the effect of the stellar populations onthe computation of the radial velocity. A change in neither thevelocity dispersion nor the metallicity have appreciable effectson this variable. Only the age of the stellar population influ-ences the determination of the radial velocity whenever the ageis young, around 1 Gyr. The uncertainty induced by age vari-ations, however, is small, ≤1%, thus rotation velocities can bemeasured accurately down to S/N ∼ 10.
In Fig. 5 we plot the expected RMS error (i.e. RMS of theaverage of all the simulations) as a function of S/N to have astatistical estimate of the uncertainty. The average of all the sim-ulations (corresponding to different velocity dispersions, ages,and metallicities) for each S/N, takes into account that for a tar-get galaxy we do not have a priori information about either itsvelocity dispersion or the parameters of the stellar population.
Table 3. Kinematic profiles for VCC990.
Rv (′′) v (km s−1) Rσ (′′) σ (km s−1)–5.43 1.8 ± 5.5 –4.98 36.0 ± 6.2–3.56 16.8± 6.4 –2.36 47.2 ± 6.0–2.58 9.8± 6.3 –1.38 39.2 ± 5.4–2.00 10.5± 6.4 –0.80 35.8 ± 4.6–1.60 1.7± 6.2 –0.40 32.5 ± 3.5–1.20 –6.3± 4.4 0.00 42.2 ± 3.1–0.80 3.9 ± 2.7 0.40 41.3 ± 2.8–0.40 0.1 ± 2.3 0.80 39.7 ± 3.60.00 6.8 ± 2.0 1.38 37.7 ± 3.90.40 2.2 ± 2.4 2.36 36.1 ± 8.50.80 1.0 ± 3.1 4.97 37.4 ± 5.61.20 –5.2± 5.21.60 –11.8± 5.62.00 –25.3± 6.42.58 –17.1± 7.23.56 –29.6± 5.75.42 –25.3± 6.2
Notes. Column 1: radius for the rotation speed profile. Column 2: ro-tation velocities. Column 3: radius for the velocity dispersion profile.Column 4: velocity dispersions. All the kinematic profiles are electron-ically available.
Figures 2–5 clearly show that data with S/N below 15 mightinduce errors as large as 22% in determining σ, in particular forsmall velocity dispersions (σ ∼ 20 km s−1), while only 0.4% forradial velocities.
All these tests have been computed for the different wave-length ranges covered by our survey and the results obtained arerather similar. For the red arm of ISIS, where the instrumentalresolution is higher, we have similar results to those shown inthe blue arm (Figs. 2–5) but with slightly larger uncertainties.
These simulations show that radial velocities can be com-puted with spectra of S/N as low as 10 given that the uncer-tainty is always below 1%. However, in the study of velocitydispersions, we must discard any measurement with S/N below15 because σ is, in this case, highly dependent on age and notreliable for σ as low as half the instrumental resolution.
When running the MOVEL algorithm as a function of galaxyradius, we fitted the optimal template at every radius, rather thanusing the central optimal template, in order to improve the fit. Asa result, the optimal templates turn out to be radially dependent.The differences, however, are not very large, because in the lin-ear combination of templates, G-stars always contribute with thehighest weight.
More than one kinematic profile per galaxy was obtainedfrom the different instrumental configurations used in the obser-vation campaigns (see Table 1). These profiles, consistent withinthe errors, were averaged to produce a single, high S/N profileper galaxy (see Fig. 6).
The recessional velocity of each single galaxy, removed forthe determination of the rotation curve (Fig. 6), has been de-termined by averaging, with a weighted mean, the recessionalvelocity measured in each single position along the radius. Thisimproved technique for measuring recessional velocities (listedin Table 4) can be applied since the rotation curves are symmet-rical3.
Table 3 gives an example of the tables electronically avail-able with the values of the kinematic profiles.
3 Galaxies such as VCC856, those with the poorest quality, have a non-zero central velocity.
A114, page 6 of 24
E. Toloba et al.: Formation and evolution of dwarf early-type galaxies in the Virgo cluster. I.
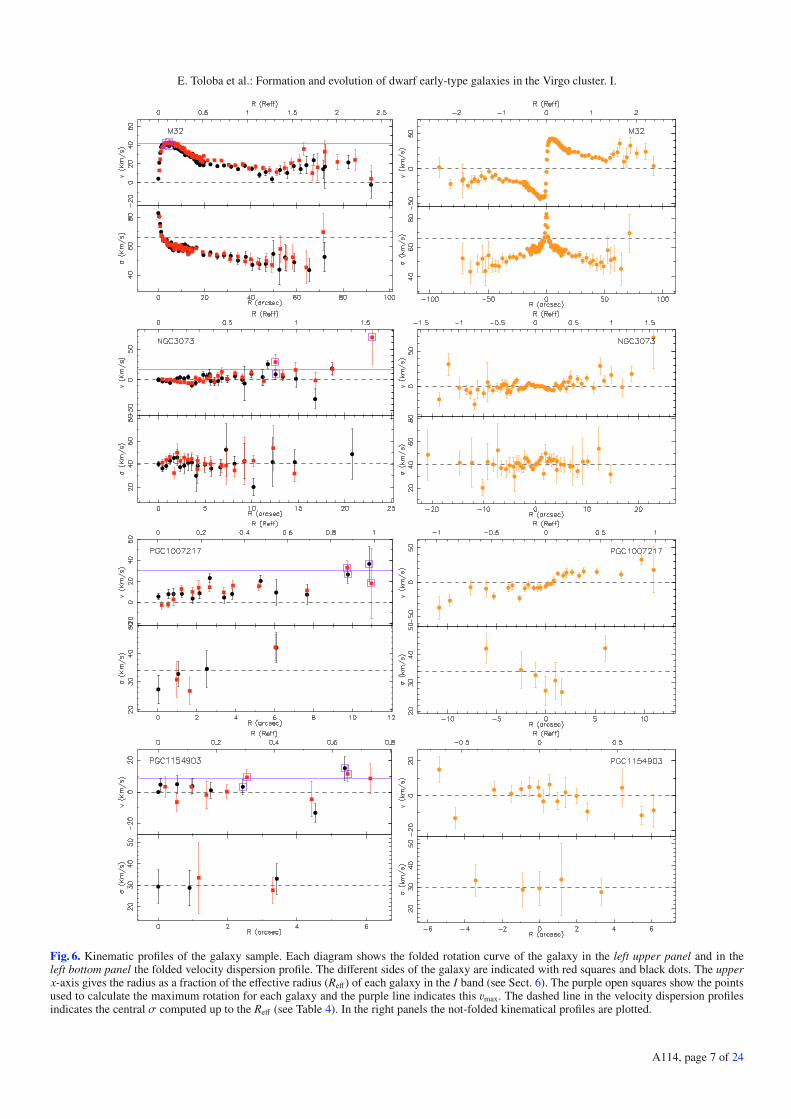
Fig. 6. Kinematic profiles of the galaxy sample. Each diagram shows the folded rotation curve of the galaxy in the left upper panel and in theleft bottom panel the folded velocity dispersion profile. The different sides of the galaxy are indicated with red squares and black dots. The upperx-axis gives the radius as a fraction of the effective radius (Reff) of each galaxy in the I band (see Sect. 6). The purple open squares show the pointsused to calculate the maximum rotation for each galaxy and the purple line indicates this vmax. The dashed line in the velocity dispersion profilesindicates the central σ computed up to the Reff (see Table 4). In the right panels the not-folded kinematical profiles are plotted.
A114, page 7 of 24
A&A 526, A114 (2011)
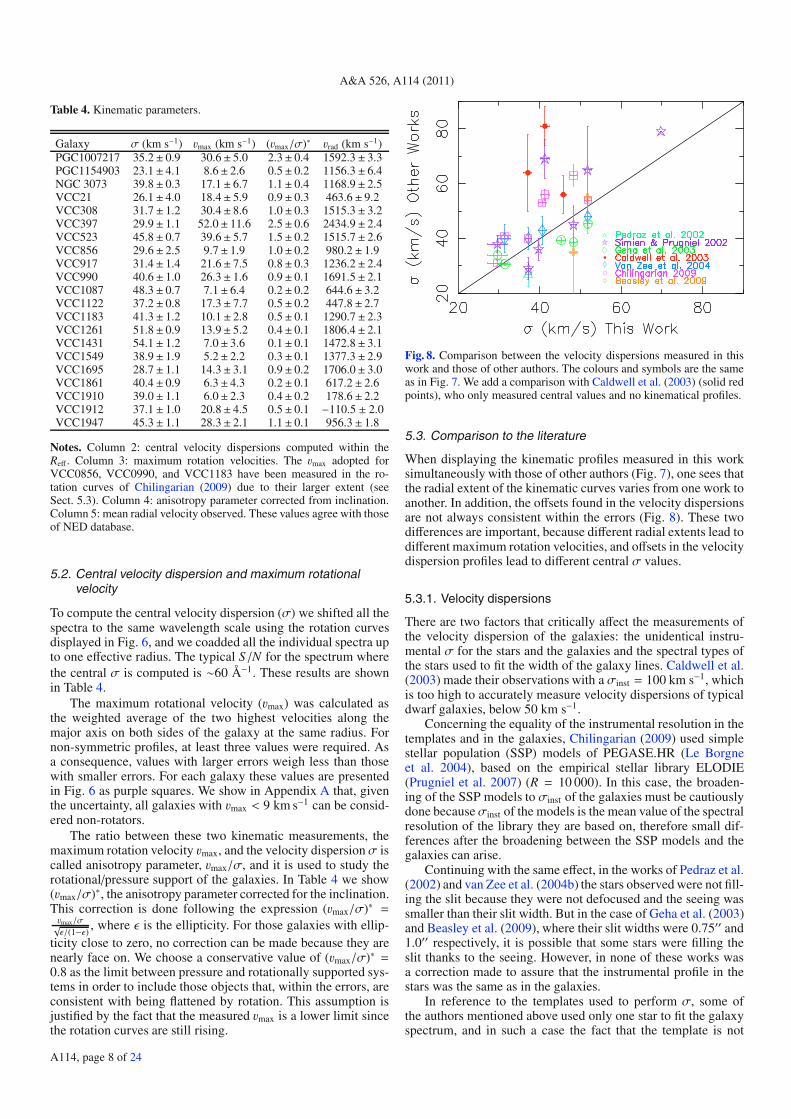
Table 4. Kinematic parameters.
Galaxy σ (km s−1) vmax (km s−1) (vmax/σ)∗ vrad (km s−1)PGC1007217 35.2± 0.9 30.6± 5.0 2.3± 0.4 1592.3± 3.3PGC1154903 23.1± 4.1 8.6± 2.6 0.5± 0.2 1156.3± 6.4NGC 3073 39.8± 0.3 17.1± 6.7 1.1± 0.4 1168.9± 2.5VCC21 26.1± 4.0 18.4± 5.9 0.9± 0.3 463.6± 9.2VCC308 31.7± 1.2 30.4± 8.6 1.0± 0.3 1515.3± 3.2VCC397 29.9± 1.1 52.0± 11.6 2.5± 0.6 2434.9± 2.4VCC523 45.8± 0.7 39.6± 5.7 1.5± 0.2 1515.7± 2.6VCC856 29.6± 2.5 9.7± 1.9 1.0± 0.2 980.2± 1.9VCC917 31.4± 1.4 21.6± 7.5 0.8± 0.3 1236.2± 2.4VCC990 40.6± 1.0 26.3± 1.6 0.9± 0.1 1691.5± 2.1VCC1087 48.3± 0.7 7.1± 6.4 0.2± 0.2 644.6± 3.2VCC1122 37.2± 0.8 17.3± 7.7 0.5± 0.2 447.8± 2.7VCC1183 41.3± 1.2 10.1± 2.8 0.5± 0.1 1290.7± 2.3VCC1261 51.8± 0.9 13.9± 5.2 0.4± 0.1 1806.4± 2.1VCC1431 54.1± 1.2 7.0± 3.6 0.1± 0.1 1472.8± 3.1VCC1549 38.9± 1.9 5.2± 2.2 0.3± 0.1 1377.3± 2.9VCC1695 28.7± 1.1 14.3± 3.1 0.9± 0.2 1706.0± 3.0VCC1861 40.4± 0.9 6.3± 4.3 0.2± 0.1 617.2± 2.6VCC1910 39.0± 1.1 6.0± 2.3 0.4± 0.2 178.6± 2.2VCC1912 37.1± 1.0 20.8± 4.5 0.5± 0.1 −110.5 ± 2.0VCC1947 45.3± 1.1 28.3± 2.1 1.1± 0.1 956.3± 1.8
Notes. Column 2: central velocity dispersions computed within theReff . Column 3: maximum rotation velocities. The vmax adopted forVCC0856, VCC0990, and VCC1183 have been measured in the ro-tation curves of Chilingarian (2009) due to their larger extent (seeSect. 5.3). Column 4: anisotropy parameter corrected from inclination.Column 5: mean radial velocity observed. These values agree with thoseof NED database.
5.2. Central velocity dispersion and maximum rotationalvelocity
To compute the central velocity dispersion (σ) we shifted all thespectra to the same wavelength scale using the rotation curvesdisplayed in Fig. 6, and we coadded all the individual spectra upto one effective radius. The typical S/N for the spectrum wherethe central σ is computed is ∼60 Å−1. These results are shownin Table 4.
The maximum rotational velocity (vmax) was calculated asthe weighted average of the two highest velocities along themajor axis on both sides of the galaxy at the same radius. Fornon-symmetric profiles, at least three values were required. Asa consequence, values with larger errors weigh less than thosewith smaller errors. For each galaxy these values are presentedin Fig. 6 as purple squares. We show in Appendix A that, giventhe uncertainty, all galaxies with vmax < 9 km s−1 can be consid-ered non-rotators.
The ratio between these two kinematic measurements, themaximum rotation velocity vmax, and the velocity dispersionσ iscalled anisotropy parameter, vmax/σ, and it is used to study therotational/pressure support of the galaxies. In Table 4 we show(vmax/σ)∗, the anisotropy parameter corrected for the inclination.This correction is done following the expression (vmax/σ)∗ =vmax/σ√ε/(1−ε) , where ε is the ellipticity. For those galaxies with ellip-
ticity close to zero, no correction can be made because they arenearly face on. We choose a conservative value of (vmax/σ)∗ =0.8 as the limit between pressure and rotationally supported sys-tems in order to include those objects that, within the errors, areconsistent with being flattened by rotation. This assumption isjustified by the fact that the measured vmax is a lower limit sincethe rotation curves are still rising.
Fig. 8. Comparison between the velocity dispersions measured in thiswork and those of other authors. The colours and symbols are the sameas in Fig. 7. We add a comparison with Caldwell et al. (2003) (solid redpoints), who only measured central values and no kinematical profiles.
5.3. Comparison to the literature
When displaying the kinematic profiles measured in this worksimultaneously with those of other authors (Fig. 7), one sees thatthe radial extent of the kinematic curves varies from one work toanother. In addition, the offsets found in the velocity dispersionsare not always consistent within the errors (Fig. 8). These twodifferences are important, because different radial extents lead todifferent maximum rotation velocities, and offsets in the velocitydispersion profiles lead to different central σ values.
5.3.1. Velocity dispersions
There are two factors that critically affect the measurements ofthe velocity dispersion of the galaxies: the unidentical instru-mental σ for the stars and the galaxies and the spectral types ofthe stars used to fit the width of the galaxy lines. Caldwell et al.(2003) made their observations with a σinst = 100 km s−1, whichis too high to accurately measure velocity dispersions of typicaldwarf galaxies, below 50 km s−1.
Concerning the equality of the instrumental resolution in thetemplates and in the galaxies, Chilingarian (2009) used simplestellar population (SSP) models of PEGASE.HR (Le Borgneet al. 2004), based on the empirical stellar library ELODIE(Prugniel et al. 2007) (R = 10 000). In this case, the broaden-ing of the SSP models to σinst of the galaxies must be cautiouslydone becauseσinst of the models is the mean value of the spectralresolution of the library they are based on, therefore small dif-ferences after the broadening between the SSP models and thegalaxies can arise.
Continuing with the same effect, in the works of Pedraz et al.(2002) and van Zee et al. (2004b) the stars observed were not fill-ing the slit because they were not defocused and the seeing wassmaller than their slit width. But in the case of Geha et al. (2003)and Beasley et al. (2009), where their slit widths were 0.75′′ and1.0′′ respectively, it is possible that some stars were filling theslit thanks to the seeing. However, in none of these works wasa correction made to assure that the instrumental profile in thestars was the same as in the galaxies.
In reference to the templates used to perform σ, some ofthe authors mentioned above used only one star to fit the galaxyspectrum, and in such a case the fact that the template is not
A114, page 8 of 24
E. Toloba et al.: Formation and evolution of dwarf early-type galaxies in the Virgo cluster. I.
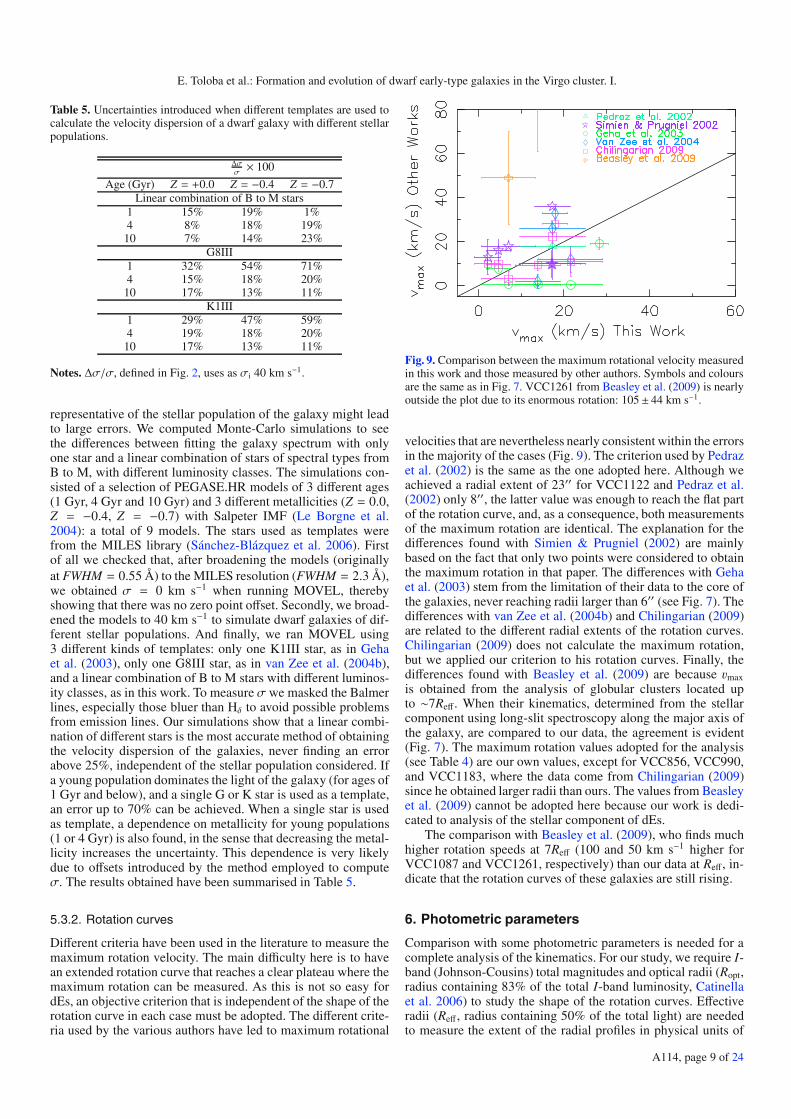
Table 5. Uncertainties introduced when different templates are used tocalculate the velocity dispersion of a dwarf galaxy with different stellarpopulations.
Δσσ× 100
Age (Gyr) Z = +0.0 Z = −0.4 Z = −0.7Linear combination of B to M stars
1 15% 19% 1%4 8% 18% 19%
10 7% 14% 23%G8III
1 32% 54% 71%4 15% 18% 20%
10 17% 13% 11%K1III
1 29% 47% 59%4 19% 18% 20%
10 17% 13% 11%
Notes. Δσ/σ, defined in Fig. 2, uses as σi 40 km s−1.
representative of the stellar population of the galaxy might leadto large errors. We computed Monte-Carlo simulations to seethe differences between fitting the galaxy spectrum with onlyone star and a linear combination of stars of spectral types fromB to M, with different luminosity classes. The simulations con-sisted of a selection of PEGASE.HR models of 3 different ages(1 Gyr, 4 Gyr and 10 Gyr) and 3 different metallicities (Z = 0.0,Z = −0.4, Z = −0.7) with Salpeter IMF (Le Borgne et al.2004): a total of 9 models. The stars used as templates werefrom the MILES library (Sánchez-Blázquez et al. 2006). Firstof all we checked that, after broadening the models (originallyat FWHM = 0.55 Å) to the MILES resolution (FWHM = 2.3 Å),we obtained σ = 0 km s−1 when running MOVEL, therebyshowing that there was no zero point offset. Secondly, we broad-ened the models to 40 km s−1 to simulate dwarf galaxies of dif-ferent stellar populations. And finally, we ran MOVEL using3 different kinds of templates: only one K1III star, as in Gehaet al. (2003), only one G8III star, as in van Zee et al. (2004b),and a linear combination of B to M stars with different luminos-ity classes, as in this work. To measure σ we masked the Balmerlines, especially those bluer than Hδ to avoid possible problemsfrom emission lines. Our simulations show that a linear combi-nation of different stars is the most accurate method of obtainingthe velocity dispersion of the galaxies, never finding an errorabove 25%, independent of the stellar population considered. Ifa young population dominates the light of the galaxy (for ages of1 Gyr and below), and a single G or K star is used as a template,an error up to 70% can be achieved. When a single star is usedas template, a dependence on metallicity for young populations(1 or 4 Gyr) is also found, in the sense that decreasing the metal-licity increases the uncertainty. This dependence is very likelydue to offsets introduced by the method employed to computeσ. The results obtained have been summarised in Table 5.
5.3.2. Rotation curves
Different criteria have been used in the literature to measure themaximum rotation velocity. The main difficulty here is to havean extended rotation curve that reaches a clear plateau where themaximum rotation can be measured. As this is not so easy fordEs, an objective criterion that is independent of the shape of therotation curve in each case must be adopted. The different crite-ria used by the various authors have led to maximum rotational
Fig. 9. Comparison between the maximum rotational velocity measuredin this work and those measured by other authors. Symbols and coloursare the same as in Fig. 7. VCC1261 from Beasley et al. (2009) is nearlyoutside the plot due to its enormous rotation: 105± 44 km s−1.
velocities that are nevertheless nearly consistent within the errorsin the majority of the cases (Fig. 9). The criterion used by Pedrazet al. (2002) is the same as the one adopted here. Although weachieved a radial extent of 23′′ for VCC1122 and Pedraz et al.(2002) only 8′′, the latter value was enough to reach the flat partof the rotation curve, and, as a consequence, both measurementsof the maximum rotation are identical. The explanation for thedifferences found with Simien & Prugniel (2002) are mainlybased on the fact that only two points were considered to obtainthe maximum rotation in that paper. The differences with Gehaet al. (2003) stem from the limitation of their data to the core ofthe galaxies, never reaching radii larger than 6′′ (see Fig. 7). Thedifferences with van Zee et al. (2004b) and Chilingarian (2009)are related to the different radial extents of the rotation curves.Chilingarian (2009) does not calculate the maximum rotation,but we applied our criterion to his rotation curves. Finally, thedifferences found with Beasley et al. (2009) are because vmaxis obtained from the analysis of globular clusters located upto ∼7Reff. When their kinematics, determined from the stellarcomponent using long-slit spectroscopy along the major axis ofthe galaxy, are compared to our data, the agreement is evident(Fig. 7). The maximum rotation values adopted for the analysis(see Table 4) are our own values, except for VCC856, VCC990,and VCC1183, where the data come from Chilingarian (2009)since he obtained larger radii than ours. The values from Beasleyet al. (2009) cannot be adopted here because our work is dedi-cated to analysis of the stellar component of dEs.
The comparison with Beasley et al. (2009), who finds muchhigher rotation speeds at 7Reff (100 and 50 km s−1 higher forVCC1087 and VCC1261, respectively) than our data at Reff, in-dicate that the rotation curves of these galaxies are still rising.
6. Photometric parameters
Comparison with some photometric parameters is needed for acomplete analysis of the kinematics. For our study, we require I-band (Johnson-Cousins) total magnitudes and optical radii (Ropt,radius containing 83% of the total I-band luminosity, Catinellaet al. 2006) to study the shape of the rotation curves. Effectiveradii (Reff, radius containing 50% of the total light) are neededto measure the extent of the radial profiles in physical units of
A114, page 9 of 24
A&A 526, A114 (2011)
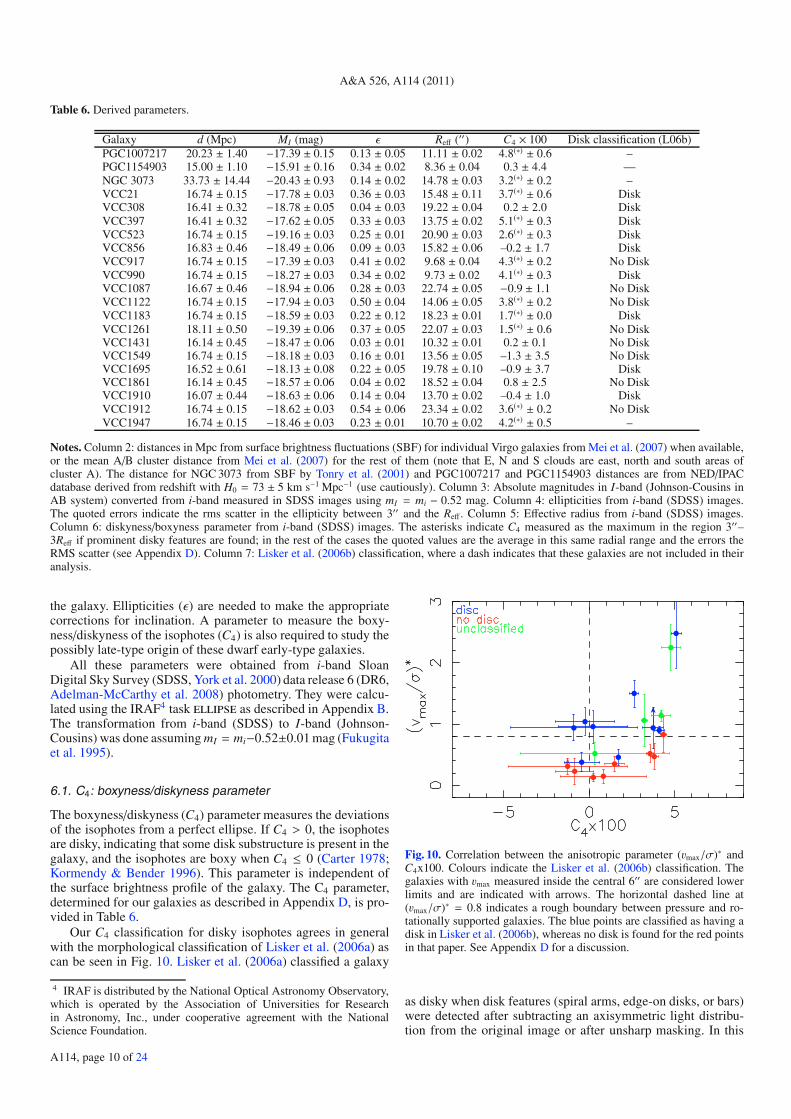
Table 6. Derived parameters.
Galaxy d (Mpc) MI (mag) ε Reff (′′) C4 × 100 Disk classification (L06b)PGC1007217 20.23 ± 1.40 −17.39 ± 0.15 0.13 ± 0.05 11.11 ± 0.02 4.8(∗) ± 0.6 –PGC1154903 15.00 ± 1.10 −15.91 ± 0.16 0.34 ± 0.02 8.36 ± 0.04 0.3 ± 4.4 —NGC 3073 33.73 ± 14.44 −20.43 ± 0.93 0.14 ± 0.02 14.78 ± 0.03 3.2(∗) ± 0.2 –VCC21 16.74 ± 0.15 −17.78 ± 0.03 0.36 ± 0.03 15.48 ± 0.11 3.7(∗) ± 0.6 DiskVCC308 16.41 ± 0.32 −18.78 ± 0.05 0.04 ± 0.03 19.22 ± 0.04 0.2 ± 2.0 DiskVCC397 16.41 ± 0.32 −17.62 ± 0.05 0.33 ± 0.03 13.75 ± 0.02 5.1(∗) ± 0.3 DiskVCC523 16.74 ± 0.15 −19.16 ± 0.03 0.25 ± 0.01 20.90 ± 0.03 2.6(∗) ± 0.3 DiskVCC856 16.83 ± 0.46 −18.49 ± 0.06 0.09 ± 0.03 15.82 ± 0.06 –0.2 ± 1.7 DiskVCC917 16.74 ± 0.15 −17.39 ± 0.03 0.41 ± 0.02 9.68 ± 0.04 4.3(∗) ± 0.2 No DiskVCC990 16.74 ± 0.15 −18.27 ± 0.03 0.34 ± 0.02 9.73 ± 0.02 4.1(∗) ± 0.3 DiskVCC1087 16.67 ± 0.46 −18.94 ± 0.06 0.28 ± 0.03 22.74 ± 0.05 −0.9 ± 1.1 No DiskVCC1122 16.74 ± 0.15 −17.94 ± 0.03 0.50 ± 0.04 14.06 ± 0.05 3.8(∗) ± 0.2 No DiskVCC1183 16.74 ± 0.15 −18.59 ± 0.03 0.22 ± 0.12 18.23 ± 0.01 1.7(∗) ± 0.0 DiskVCC1261 18.11 ± 0.50 −19.39 ± 0.06 0.37 ± 0.05 22.07 ± 0.03 1.5(∗) ± 0.6 No DiskVCC1431 16.14 ± 0.45 −18.47 ± 0.06 0.03 ± 0.01 10.32 ± 0.01 0.2 ± 0.1 No DiskVCC1549 16.74 ± 0.15 −18.18 ± 0.03 0.16 ± 0.01 13.56 ± 0.05 –1.3 ± 3.5 No DiskVCC1695 16.52 ± 0.61 −18.13 ± 0.08 0.22 ± 0.05 19.78 ± 0.10 –0.9 ± 3.7 DiskVCC1861 16.14 ± 0.45 −18.57 ± 0.06 0.04 ± 0.02 18.52 ± 0.04 0.8 ± 2.5 No DiskVCC1910 16.07 ± 0.44 −18.63 ± 0.06 0.14 ± 0.04 13.70 ± 0.02 –0.4 ± 1.0 DiskVCC1912 16.74 ± 0.15 −18.62 ± 0.03 0.54 ± 0.06 23.34 ± 0.02 3.6(∗) ± 0.2 No DiskVCC1947 16.74 ± 0.15 −18.46 ± 0.03 0.23 ± 0.01 10.70 ± 0.02 4.2(∗) ± 0.5 –
Notes. Column 2: distances in Mpc from surface brightness fluctuations (SBF) for individual Virgo galaxies from Mei et al. (2007) when available,or the mean A/B cluster distance from Mei et al. (2007) for the rest of them (note that E, N and S clouds are east, north and south areas ofcluster A). The distance for NGC 3073 from SBF by Tonry et al. (2001) and PGC1007217 and PGC1154903 distances are from NED/IPACdatabase derived from redshift with H0 = 73 ± 5 km s−1 Mpc−1 (use cautiously). Column 3: Absolute magnitudes in I-band (Johnson-Cousins inAB system) converted from i-band measured in SDSS images using mI = mi − 0.52 mag. Column 4: ellipticities from i-band (SDSS) images.The quoted errors indicate the rms scatter in the ellipticity between 3′′ and the Reff . Column 5: Effective radius from i-band (SDSS) images.Column 6: diskyness/boxyness parameter from i-band (SDSS) images. The asterisks indicate C4 measured as the maximum in the region 3′′–3Reff if prominent disky features are found; in the rest of the cases the quoted values are the average in this same radial range and the errors theRMS scatter (see Appendix D). Column 7: Lisker et al. (2006b) classification, where a dash indicates that these galaxies are not included in theiranalysis.
the galaxy. Ellipticities (ε) are needed to make the appropriatecorrections for inclination. A parameter to measure the boxy-ness/diskyness of the isophotes (C4) is also required to study thepossibly late-type origin of these dwarf early-type galaxies.
All these parameters were obtained from i-band SloanDigital Sky Survey (SDSS, York et al. 2000) data release 6 (DR6,Adelman-McCarthy et al. 2008) photometry. They were calcu-lated using the IRAF4 task ellipse as described in Appendix B.The transformation from i-band (SDSS) to I-band (Johnson-Cousins) was done assuming mI = mi−0.52±0.01 mag (Fukugitaet al. 1995).
6.1. C4: boxyness/diskyness parameter
The boxyness/diskyness (C4) parameter measures the deviationsof the isophotes from a perfect ellipse. If C4 > 0, the isophotesare disky, indicating that some disk substructure is present in thegalaxy, and the isophotes are boxy when C4 ≤ 0 (Carter 1978;Kormendy & Bender 1996). This parameter is independent ofthe surface brightness profile of the galaxy. The C4 parameter,determined for our galaxies as described in Appendix D, is pro-vided in Table 6.
Our C4 classification for disky isophotes agrees in generalwith the morphological classification of Lisker et al. (2006a) ascan be seen in Fig. 10. Lisker et al. (2006a) classified a galaxy
4 IRAF is distributed by the National Optical Astronomy Observatory,which is operated by the Association of Universities for Researchin Astronomy, Inc., under cooperative agreement with the NationalScience Foundation.
Fig. 10. Correlation between the anisotropic parameter (vmax/σ)∗ andC4x100. Colours indicate the Lisker et al. (2006b) classification. Thegalaxies with vmax measured inside the central 6′′ are considered lowerlimits and are indicated with arrows. The horizontal dashed line at(vmax/σ)∗ = 0.8 indicates a rough boundary between pressure and ro-tationally supported galaxies. The blue points are classified as having adisk in Lisker et al. (2006b), whereas no disk is found for the red pointsin that paper. See Appendix D for a discussion.
as disky when disk features (spiral arms, edge-on disks, or bars)were detected after subtracting an axisymmetric light distribu-tion from the original image or after unsharp masking. In this
A114, page 10 of 24
E. Toloba et al.: Formation and evolution of dwarf early-type galaxies in the Virgo cluster. I.
figure we can see that those galaxies classified as being with-out underlying structures in Lisker et al. (2006a), are groupedaround C4 ≤ 0 (boxy or elliptical isophotes), while the galaxieswith some disky structure in Lisker et al. (2006a) are all consis-tent with C4 > 0 (disky isophotes). This justifies the use of theC4 parameter to detect an underlying disk. Three exceptions arefound and discussed in Appendix D.
In this respect, it is important to underline the correlationbetween C4 and the anisotropic parameter evident in Fig. 10,first found by Bender et al. (1988) for more massive ellipticalgalaxies.
7. Analysis
The analysis presented in this work is primarily focusedon the rotationally supported systems. Although the major-ity of the dwarf galaxies (15 out of 21) show some rotation(vmax > 9 km s−1, Table 4), only 11 are rotationally supported((vmax/σ)∗ > 0.8) (Toloba et al. 2009). Here we try to under-stand whether the observed kinematic properties of the rotation-ally supported systems are consistent with those of star-forminggalaxies of similar luminosity.
7.1. Shape of the rotation curves
Catinella et al. (2006) made a systematic study of the shapeof the rotation curves of late-type spiral galaxies as a functionof luminosity based on the method described in Persic et al.(1996). They fitted the rotation curves following the Polyexmodel (Giovanelli & Haynes 2002), which has the form
VPE(r) = V0
(1 − e−r/rPE
)(1 +αrrPE
)· (1)
This analytical function depends on 3 parameters V0, rPE, and α,which represent the amplitude, the exponential scale of the innerregion, and the slope of the outer part of the rotation curve. Themean fitted rotation curves from Catinella et al. (2006) are nor-malised to the optical radius (Ropt, radius containing 83% of thetotal I-band luminosity), and the velocities are corrected frominclination. To compare them with our rotationally supportedgalaxies, we calculated the inclinations as in Giovanelli et al.(1997a):
cos2 i =(1 − ε)2 − q2
0
1 − q20
(2)
where i is the inclination, ε is the ellipticity, and q0 is a constantvalue that depends on the thickness of the disk. Here we assumeq0 = 0.3, a conservative value for dwarf galaxies shaped as thickdisks (Lisker et al. 2007)5.
The comparison between the mean rotation curves ofCatinella et al. (2006) and those of our rotationally supportedobjects must be done in the same luminosity regime since thederived parameters of the Polyex model are luminosity depen-dent. As the dwarf galaxies analysed in this work have magni-tudes below the minimum magnitude in Catinella et al. (2006)(MI = −19.4), the reference Polyex model of low-luminosity
5 For early-type spirals q0 = 0.2 (Giovanelli et al. 1997a). The mostrecent measurements of the thickness of dwarf galaxies gives q0 =0.3−0.35 (Sánchez-Janssen et al. 2010). The difference in vmax after thecorrection for inclination between using q0 = 0.2 and q0 = 0.35 is of4.4%, insignificant.
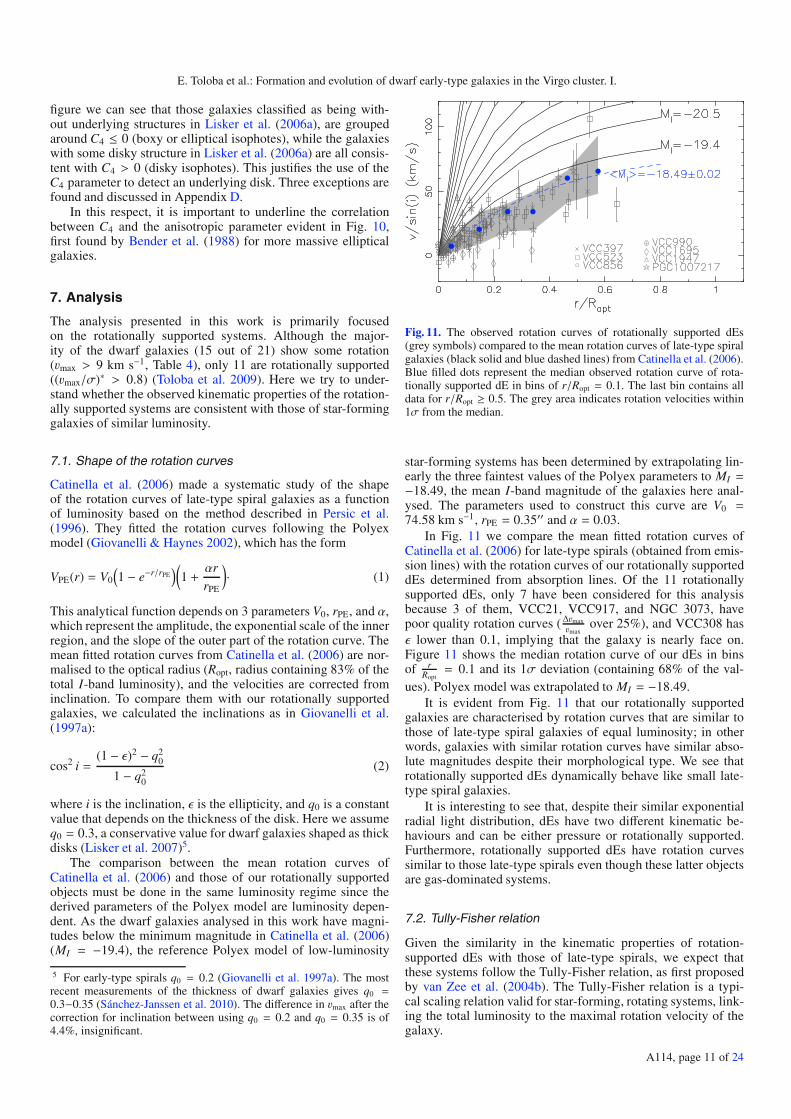
Fig. 11. The observed rotation curves of rotationally supported dEs(grey symbols) compared to the mean rotation curves of late-type spiralgalaxies (black solid and blue dashed lines) from Catinella et al. (2006).Blue filled dots represent the median observed rotation curve of rota-tionally supported dE in bins of r/Ropt = 0.1. The last bin contains alldata for r/Ropt ≥ 0.5. The grey area indicates rotation velocities within1σ from the median.
star-forming systems has been determined by extrapolating lin-early the three faintest values of the Polyex parameters to MI =−18.49, the mean I-band magnitude of the galaxies here anal-ysed. The parameters used to construct this curve are V0 =74.58 km s−1, rPE = 0.35′′ and α = 0.03.
In Fig. 11 we compare the mean fitted rotation curves ofCatinella et al. (2006) for late-type spirals (obtained from emis-sion lines) with the rotation curves of our rotationally supporteddEs determined from absorption lines. Of the 11 rotationallysupported dEs, only 7 have been considered for this analysisbecause 3 of them, VCC21, VCC917, and NGC 3073, havepoor quality rotation curves (Δvmax
vmaxover 25%), and VCC308 has
ε lower than 0.1, implying that the galaxy is nearly face on.Figure 11 shows the median rotation curve of our dEs in binsof r
Ropt= 0.1 and its 1σ deviation (containing 68% of the val-
ues). Polyex model was extrapolated to MI = −18.49.It is evident from Fig. 11 that our rotationally supported
galaxies are characterised by rotation curves that are similar tothose of late-type spiral galaxies of equal luminosity; in otherwords, galaxies with similar rotation curves have similar abso-lute magnitudes despite their morphological type. We see thatrotationally supported dEs dynamically behave like small late-type spiral galaxies.
It is interesting to see that, despite their similar exponentialradial light distribution, dEs have two different kinematic be-haviours and can be either pressure or rotationally supported.Furthermore, rotationally supported dEs have rotation curvessimilar to those late-type spirals even though these latter objectsare gas-dominated systems.
7.2. Tully-Fisher relation
Given the similarity in the kinematic properties of rotation-supported dEs with those of late-type spirals, we expect thatthese systems follow the Tully-Fisher relation, as first proposedby van Zee et al. (2004b). The Tully-Fisher relation is a typi-cal scaling relation valid for star-forming, rotating systems, link-ing the total luminosity to the maximal rotation velocity of thegalaxy.
A114, page 11 of 24
A&A 526, A114 (2011)
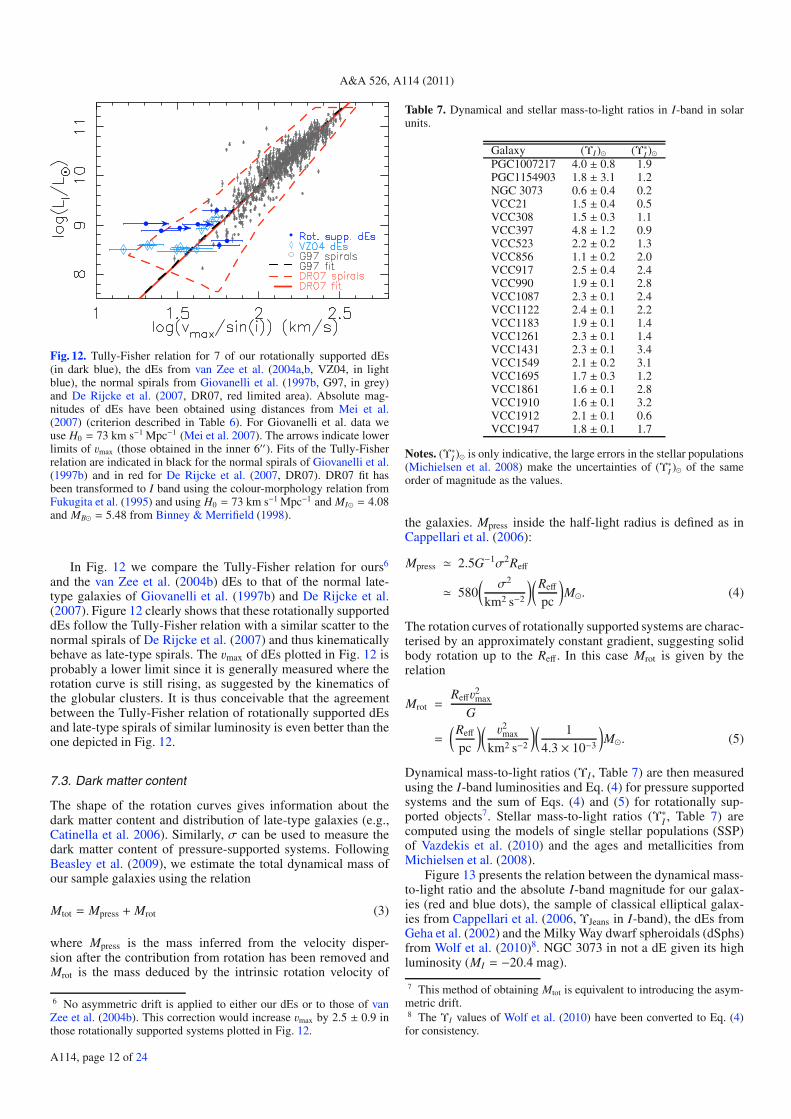
Fig. 12. Tully-Fisher relation for 7 of our rotationally supported dEs(in dark blue), the dEs from van Zee et al. (2004a,b, VZ04, in lightblue), the normal spirals from Giovanelli et al. (1997b, G97, in grey)and De Rijcke et al. (2007, DR07, red limited area). Absolute mag-nitudes of dEs have been obtained using distances from Mei et al.(2007) (criterion described in Table 6). For Giovanelli et al. data weuse H0 = 73 km s−1 Mpc−1 (Mei et al. 2007). The arrows indicate lowerlimits of vmax (those obtained in the inner 6′′). Fits of the Tully-Fisherrelation are indicated in black for the normal spirals of Giovanelli et al.(1997b) and in red for De Rijcke et al. (2007, DR07). DR07 fit hasbeen transformed to I band using the colour-morphology relation fromFukugita et al. (1995) and using H0 = 73 km s−1 Mpc−1 and MI� = 4.08and MB� = 5.48 from Binney & Merrifield (1998).
In Fig. 12 we compare the Tully-Fisher relation for ours6
and the van Zee et al. (2004b) dEs to that of the normal late-type galaxies of Giovanelli et al. (1997b) and De Rijcke et al.(2007). Figure 12 clearly shows that these rotationally supporteddEs follow the Tully-Fisher relation with a similar scatter to thenormal spirals of De Rijcke et al. (2007) and thus kinematicallybehave as late-type spirals. The vmax of dEs plotted in Fig. 12 isprobably a lower limit since it is generally measured where therotation curve is still rising, as suggested by the kinematics ofthe globular clusters. It is thus conceivable that the agreementbetween the Tully-Fisher relation of rotationally supported dEsand late-type spirals of similar luminosity is even better than theone depicted in Fig. 12.
7.3. Dark matter content
The shape of the rotation curves gives information about thedark matter content and distribution of late-type galaxies (e.g.,Catinella et al. 2006). Similarly, σ can be used to measure thedark matter content of pressure-supported systems. FollowingBeasley et al. (2009), we estimate the total dynamical mass ofour sample galaxies using the relation
Mtot = Mpress + Mrot (3)
where Mpress is the mass inferred from the velocity disper-sion after the contribution from rotation has been removed andMrot is the mass deduced by the intrinsic rotation velocity of
6 No asymmetric drift is applied to either our dEs or to those of vanZee et al. (2004b). This correction would increase vmax by 2.5 ± 0.9 inthose rotationally supported systems plotted in Fig. 12.
Table 7. Dynamical and stellar mass-to-light ratios in I-band in solarunits.
Galaxy (ΥI)� (Υ∗I )�PGC1007217 4.0 ± 0.8 1.9PGC1154903 1.8 ± 3.1 1.2NGC 3073 0.6 ± 0.4 0.2VCC21 1.5 ± 0.4 0.5VCC308 1.5 ± 0.3 1.1VCC397 4.8 ± 1.2 0.9VCC523 2.2 ± 0.2 1.3VCC856 1.1 ± 0.2 2.0VCC917 2.5 ± 0.4 2.4VCC990 1.9 ± 0.1 2.8VCC1087 2.3 ± 0.1 2.4VCC1122 2.4 ± 0.1 2.2VCC1183 1.9 ± 0.1 1.4VCC1261 2.3 ± 0.1 1.4VCC1431 2.3 ± 0.1 3.4VCC1549 2.1 ± 0.2 3.1VCC1695 1.7 ± 0.3 1.2VCC1861 1.6 ± 0.1 2.8VCC1910 1.6 ± 0.1 3.2VCC1912 2.1 ± 0.1 0.6VCC1947 1.8 ± 0.1 1.7
Notes. (Υ∗I )� is only indicative, the large errors in the stellar populations(Michielsen et al. 2008) make the uncertainties of (Υ∗I )� of the sameorder of magnitude as the values.
the galaxies. Mpress inside the half-light radius is defined as inCappellari et al. (2006):
Mpress � 2.5G−1σ2Reff
� 580(σ2
km2 s−2
)(Reff
pc
)M�. (4)
The rotation curves of rotationally supported systems are charac-terised by an approximately constant gradient, suggesting solidbody rotation up to the Reff . In this case Mrot is given by therelation
Mrot =Reffv
2max
G
=
(Reff
pc
)( v2max
km2 s−2
)( 14.3 × 10⁻³
)M�. (5)
Dynamical mass-to-light ratios (ΥI , Table 7) are then measuredusing the I-band luminosities and Eq. (4) for pressure supportedsystems and the sum of Eqs. (4) and (5) for rotationally sup-ported objects7. Stellar mass-to-light ratios (Υ∗I , Table 7) arecomputed using the models of single stellar populations (SSP)of Vazdekis et al. (2010) and the ages and metallicities fromMichielsen et al. (2008).
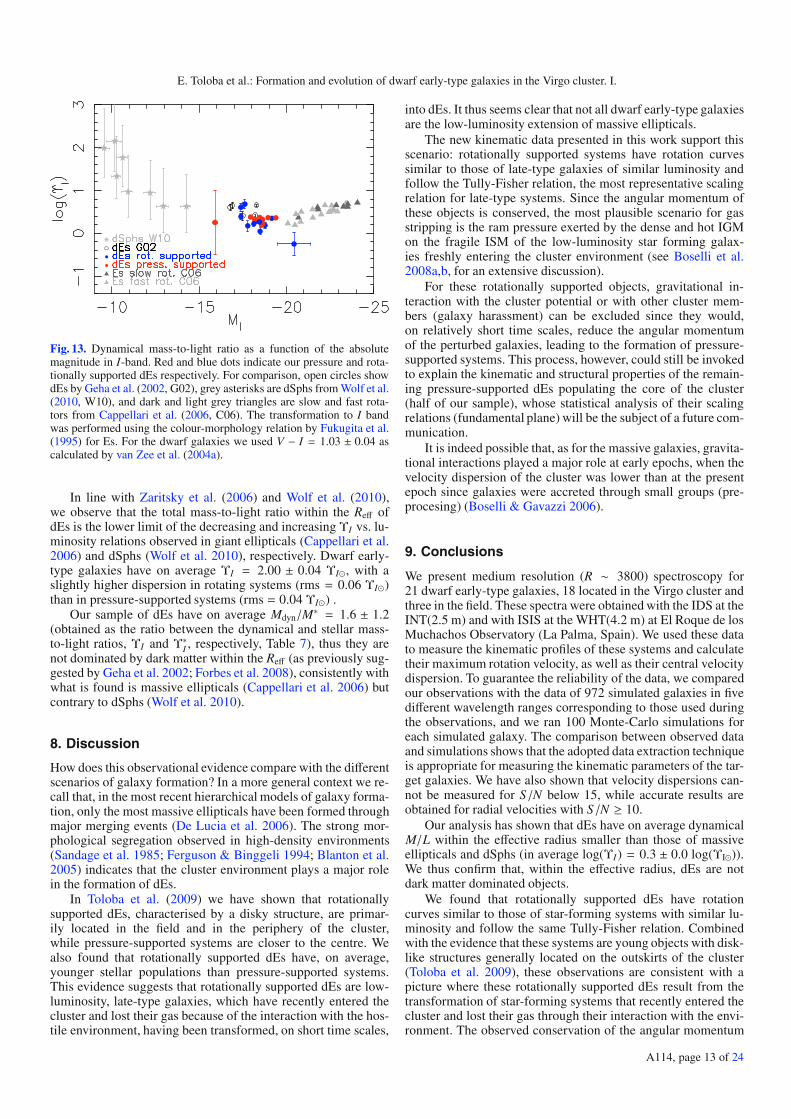
Figure 13 presents the relation between the dynamical mass-to-light ratio and the absolute I-band magnitude for our galax-ies (red and blue dots), the sample of classical elliptical galax-ies from Cappellari et al. (2006, ΥJeans in I-band), the dEs fromGeha et al. (2002) and the Milky Way dwarf spheroidals (dSphs)from Wolf et al. (2010)8. NGC 3073 in not a dE given its highluminosity (MI = −20.4 mag).
7 This method of obtaining Mtot is equivalent to introducing the asym-metric drift.8 The ΥI values of Wolf et al. (2010) have been converted to Eq. (4)for consistency.
A114, page 12 of 24
E. Toloba et al.: Formation and evolution of dwarf early-type galaxies in the Virgo cluster. I.
Fig. 13. Dynamical mass-to-light ratio as a function of the absolutemagnitude in I-band. Red and blue dots indicate our pressure and rota-tionally supported dEs respectively. For comparison, open circles showdEs by Geha et al. (2002, G02), grey asterisks are dSphs from Wolf et al.(2010, W10), and dark and light grey triangles are slow and fast rota-tors from Cappellari et al. (2006, C06). The transformation to I bandwas performed using the colour-morphology relation by Fukugita et al.(1995) for Es. For the dwarf galaxies we used V − I = 1.03 ± 0.04 ascalculated by van Zee et al. (2004a).
In line with Zaritsky et al. (2006) and Wolf et al. (2010),we observe that the total mass-to-light ratio within the Reff ofdEs is the lower limit of the decreasing and increasing ΥI vs. lu-minosity relations observed in giant ellipticals (Cappellari et al.2006) and dSphs (Wolf et al. 2010), respectively. Dwarf early-type galaxies have on average ΥI = 2.00 ± 0.04 ΥI�, with aslightly higher dispersion in rotating systems (rms = 0.06 ΥI�)than in pressure-supported systems (rms = 0.04 ΥI�) .
Our sample of dEs have on average Mdyn/M∗ = 1.6 ± 1.2(obtained as the ratio between the dynamical and stellar mass-to-light ratios, ΥI and Υ∗I , respectively, Table 7), thus they arenot dominated by dark matter within the Reff (as previously sug-gested by Geha et al. 2002; Forbes et al. 2008), consistently withwhat is found is massive ellipticals (Cappellari et al. 2006) butcontrary to dSphs (Wolf et al. 2010).
8. Discussion
How does this observational evidence compare with the differentscenarios of galaxy formation? In a more general context we re-call that, in the most recent hierarchical models of galaxy forma-tion, only the most massive ellipticals have been formed throughmajor merging events (De Lucia et al. 2006). The strong mor-phological segregation observed in high-density environments(Sandage et al. 1985; Ferguson & Binggeli 1994; Blanton et al.2005) indicates that the cluster environment plays a major rolein the formation of dEs.
In Toloba et al. (2009) we have shown that rotationallysupported dEs, characterised by a disky structure, are primar-ily located in the field and in the periphery of the cluster,while pressure-supported systems are closer to the centre. Wealso found that rotationally supported dEs have, on average,younger stellar populations than pressure-supported systems.This evidence suggests that rotationally supported dEs are low-luminosity, late-type galaxies, which have recently entered thecluster and lost their gas because of the interaction with the hos-tile environment, having been transformed, on short time scales,
into dEs. It thus seems clear that not all dwarf early-type galaxiesare the low-luminosity extension of massive ellipticals.
The new kinematic data presented in this work support thisscenario: rotationally supported systems have rotation curvessimilar to those of late-type galaxies of similar luminosity andfollow the Tully-Fisher relation, the most representative scalingrelation for late-type systems. Since the angular momentum ofthese objects is conserved, the most plausible scenario for gasstripping is the ram pressure exerted by the dense and hot IGMon the fragile ISM of the low-luminosity star forming galax-ies freshly entering the cluster environment (see Boselli et al.2008a,b, for an extensive discussion).
For these rotationally supported objects, gravitational in-teraction with the cluster potential or with other cluster mem-bers (galaxy harassment) can be excluded since they would,on relatively short time scales, reduce the angular momentumof the perturbed galaxies, leading to the formation of pressure-supported systems. This process, however, could still be invokedto explain the kinematic and structural properties of the remain-ing pressure-supported dEs populating the core of the cluster(half of our sample), whose statistical analysis of their scalingrelations (fundamental plane) will be the subject of a future com-munication.
It is indeed possible that, as for the massive galaxies, gravita-tional interactions played a major role at early epochs, when thevelocity dispersion of the cluster was lower than at the presentepoch since galaxies were accreted through small groups (pre-procesing) (Boselli & Gavazzi 2006).
9. Conclusions
We present medium resolution (R ∼ 3800) spectroscopy for21 dwarf early-type galaxies, 18 located in the Virgo cluster andthree in the field. These spectra were obtained with the IDS at theINT(2.5 m) and with ISIS at the WHT(4.2 m) at El Roque de losMuchachos Observatory (La Palma, Spain). We used these datato measure the kinematic profiles of these systems and calculatetheir maximum rotation velocity, as well as their central velocitydispersion. To guarantee the reliability of the data, we comparedour observations with the data of 972 simulated galaxies in fivedifferent wavelength ranges corresponding to those used duringthe observations, and we ran 100 Monte-Carlo simulations foreach simulated galaxy. The comparison between observed dataand simulations shows that the adopted data extraction techniqueis appropriate for measuring the kinematic parameters of the tar-get galaxies. We have also shown that velocity dispersions can-not be measured for S/N below 15, while accurate results areobtained for radial velocities with S/N ≥ 10.
Our analysis has shown that dEs have on average dynamicalM/L within the effective radius smaller than those of massiveellipticals and dSphs (in average log(ΥI) = 0.3 ± 0.0 log(ΥI�)).We thus confirm that, within the effective radius, dEs are notdark matter dominated objects.
We found that rotationally supported dEs have rotationcurves similar to those of star-forming systems with similar lu-minosity and follow the same Tully-Fisher relation. Combinedwith the evidence that these systems are young objects with disk-like structures generally located on the outskirts of the cluster(Toloba et al. 2009), these observations are consistent with apicture where these rotationally supported dEs result from thetransformation of star-forming systems that recently entered thecluster and lost their gas through their interaction with the envi-ronment. The observed conservation of the angular momentum
A114, page 13 of 24
A&A 526, A114 (2011)
in the rotationally supported dEs suggests that a milder ram-pressure stripping event must be the one responsible for the gasremoval preferentially to more violent gravitational interactions(harassment) which would rapidly heat up the perturbed sys-tems. Therefore, all this evidence suggests that dEs are not thelow luminosity extension of massive early-types, because if thatwas the case, all dEs would be rotating with vmax/σ higher thanthose of Es. However, a population of non-rotators has also beenfound and, in addition, the evidence that they are stripped late-type spirals is strong enough to consider it as a possible originof dEs in clusters.
Acknowledgements. We thank the MAGPOP EU Marie Curie Training Networkfor financial support for the collaborating research visits and observations thatled to this paper. E.T. acknowledges the financial support by the Spanish researchproject AYA2007-67752-C03-03. We thank Consolider-GTC project for partialfinancial support. This paper made use of the following public databases: SDSS,NED, HyperLEDA, GOLDMine. We are grateful to the anonymous referee for acritical report that has improved the quality of the paper.
ReferencesAdelman-McCarthy, J. K., Agüeros, M. A., Allam, S. S., et al. 2008, ApJS, 175,
297Beasley, M. A., Cenarro, A. J., Strader, J., & Brodie, J. P. 2009, AJ, 137, 5146Bender, R., Doebereiner, S., & Moellenhoff, C. 1988, A&AS, 74, 385Bender, R., Burstein, D., & Faber, S. M. 1992, ApJ, 399, 462Binggeli, B., Sandage, A., & Tammann, G. A. 1985, AJ, 90, 1681Binney, J., & Merrifield, M. 1998, Galactic astronomy (Princeton Series in
Astrophysiscs)Blanton, M. R., Lupton, R. H., Schlegel, D. J., et al. 2005, ApJ, 631, 208Boselli, A., & Gavazzi, G. 2006, PASP, 118, 517Boselli, A., Cortese, L., Deharveng, J. M., et al. 2005, ApJ, 629, L29Boselli, A., Boissier, S., Cortese, L., & Gavazzi, G. 2008a, ApJ, 674, 742Boselli, A., Boissier, S., Cortese, L., & Gavazzi, G. 2008b, A&A, 489, 1015Byrd, G., & Valtonen, M. 1990, ApJ, 350, 89Caldwell, N., Rose, J. A., & Concannon, K. D. 2003, AJ, 125, 2891Cappellari, M., Bacon, R., Bureau, M., et al. 2006, MNRAS, 366, 1126Cardiel, N. 1999, PhD Thesis, Universidad Complutense de Madrid, SpainCarter, D. 1978, MNRAS, 182, 797Catinella, B., Giovanelli, R., & Haynes, M. P. 2006, ApJ, 640, 751Cenarro, A. J., Cardiel, N., Gorgas, J., et al. 2001, MNRAS, 326, 959Chilingarian, I. V. 2009, MNRAS, 394, 1229De Lucia, G., Springel, V., White, S. D. M., Croton, D., & Kauffmann, G. 2006,
MNRAS, 366, 499De Rijcke, S., Zeilinger, W. W., Hau, G. K. T., Prugniel, P., & Dejonghe, H.
2007, ApJ, 659, 1172Ferguson, H. C., & Binggeli, B. 1994, A&ARv, 6, 67Ferrarese, L., Côté, P., Jordán, A., et al. 2006, ApJS, 164, 334Fitzpatrick, E. L. 1999, PASP, 111, 63Forbes, D. A., Lasky, P., Graham, A. W., & Spitler, L. 2008, MNRAS, 389, 1924
Fukugita, M., Shimasaku, K., & Ichikawa, T. 1995, PASP, 107, 945Gavazzi, G., Boselli, A., Scodeggio, M., Pierini, D., & Belsole, E. 1999,
MNRAS, 304, 595Gavazzi, G., Boselli, A., Donati, A., Franzetti, P., & Scodeggio, M. 2003, A&A,
400, 451Geha, M., Guhathakurta, P., & van der Marel, R. P. 2002, AJ, 124, 3073Geha, M., Guhathakurta, P., & van der Marel, R. P. 2003, AJ, 126, 1794Gil de Paz, A., Boissier, S., Madore, B. F., et al. 2007, ApJS, 173, 185Giovanelli, R., & Haynes, M. P. 2002, ApJ, 571, L107Giovanelli, R., Haynes, M. P., da Costa, L. N., et al. 1997a, ApJ, 477, L1Giovanelli, R., Haynes, M. P., Herter, T., et al. 1997b, AJ, 113, 22González, J. J. 1993, PhD Thesis, Thesis University of California, Santa Cruz,
Source: Dissertation Abstracts International, Volume: 54-05, Section: B, 2551Kormendy, J., & Bender, R. 1996, ApJ, 464, L119+Kormendy, J., Fisher, D. B., Cornell, M. E., & Bender, R. 2009, ApJS, 182, 216Le Borgne, D., Rocca-Volmerange, B., Prugniel, P., et al. 2004, A&A, 425, 881Lisker, T., Glatt, K., Westera, P., & Grebel, E. K. 2006a, AJ, 132, 2432Lisker, T., Grebel, E. K., & Binggeli, B. 2006b, AJ, 132, 497Lisker, T., Grebel, E. K., Binggeli, B., & Glatt, K. 2007, ApJ, 660, 1186Mastropietro, C., Moore, B., Mayer, L., et al. 2005, MNRAS, 364, 607Mei, S., Blakeslee, J. P., Côté, P., et al. 2007, ApJ, 655, 144Michielsen, D., Boselli, A., Conselice, C. J., et al. 2008, MNRAS, 385, 1374Moore, B., Lake, G., & Katz, N. 1998, ApJ, 495, 139Paturel, G., Petit, C., Prugniel, P., et al. 2003, A&A, 412, 45Paudel, S., Lisker, T., Kuntschner, H., Grebel, E. K., & Glatt, K. 2010, MNRAS,
570Pedraz, S., Gorgas, J., Cardiel, N., Sánchez-Blázquez, P., & Guzmán, R. 2002,
MNRAS, 332, L59Peletier, R. F., Davies, R. L., Illingworth, G. D., Davis, L. E., & Cawson, M.
1990, AJ, 100, 1091Persic, M., Salucci, P., & Stel, F. 1996, MNRAS, 281, 27Prugniel, P., Soubiran, C., Koleva, M., & Le Borgne, D. 2007, unpublished
[arXiv:astro-ph/0703658]Sánchez-Blázquez, P., Peletier, R. F., Jiménez-Vicente, J., et al. 2006, MNRAS,
371, 703Sánchez-Janssen, R., Méndez-Abreu, J., & Aguerri, J. A. L. 2010, MNRAS, 406,
L65Sandage, A., Binggeli, B., & Tammann, G. A. 1985, AJ, 90, 1759Sargent, W. L. W., & Turner, E. L. 1977, ApJ, 212, L3Schlegel, D. J., Finkbeiner, D. P., & Davis, M. 1998, ApJ, 500, 525Silich, S., & Tenorio-Tagle, G. 2001, ApJ, 552, 91Simien, F., & Prugniel, P. 2002, A&A, 384, 371Toloba, E., Boselli, A., Gorgas, J., et al. 2009, ApJ, 707, L17Tonry, J. L., Dressler, A., Blakeslee, J. P., et al. 2001, ApJ, 546, 681van Zee, L., Barton, E. J., & Skillman, E. D. 2004a, AJ, 128, 2797van Zee, L., Skillman, E. D., & Haynes, M. P. 2004b, AJ, 128, 121Vazdekis, A., Sánchez-Blázquez, P., Falcón-Barroso, J., et al. 2010, MNRAS,
404, 1639White, S. D. M., & Frenk, C. S. 1991, ApJ, 379, 52White, S. D. M., & Rees, M. J. 1978, MNRAS, 183, 341Wolf, J., Martinez, G. D., Bullock, J. S., et al. 2010, MNRAS, 406, 1220York, D. G., Adelman, J., Anderson, Jr., J. E., et al. 2000, AJ, 120, 1579Yoshii, Y., & Arimoto, N. 1987, A&A, 188, 13Zaritsky, D., Gonzalez, A. H., & Zabludoff, A. I. 2006, ApJ, 638, 725
Pages 15 to 24 are available in the electronic edition of the journal at http://www.aanda.org
A114, page 14 of 24
E. Toloba et al.: Formation and evolution of dwarf early-type galaxies in the Virgo cluster. I.
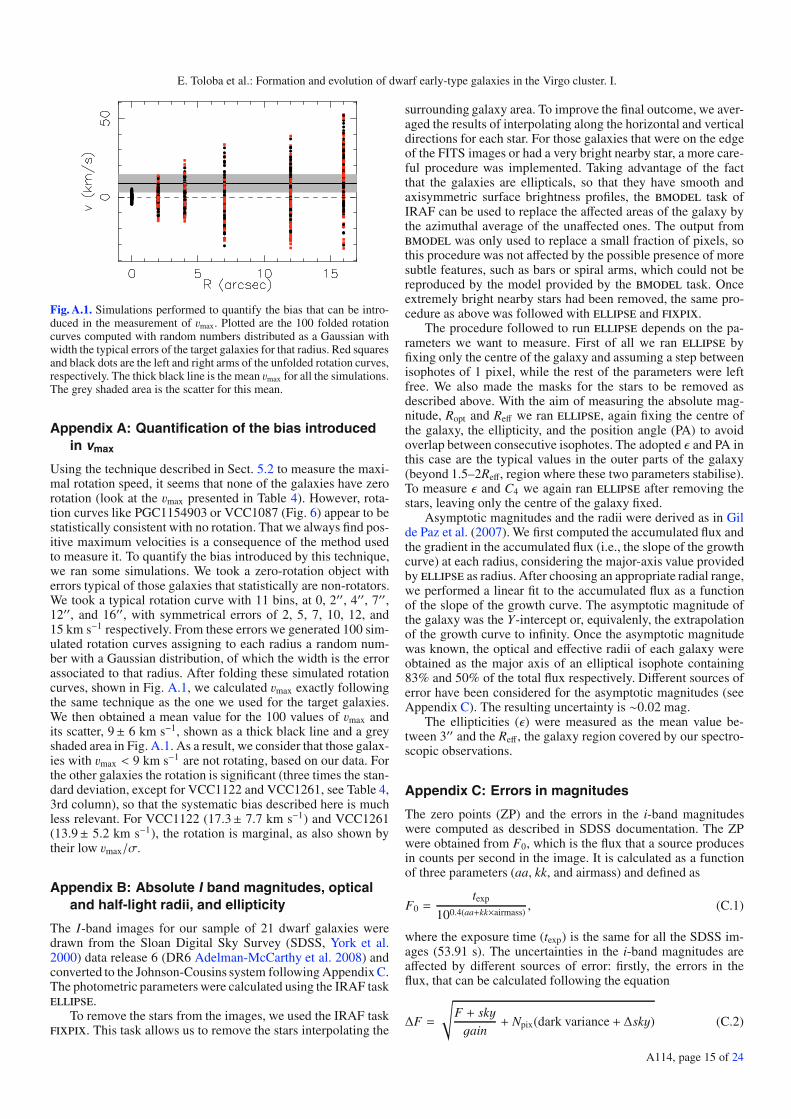
Fig. A.1. Simulations performed to quantify the bias that can be intro-duced in the measurement of vmax. Plotted are the 100 folded rotationcurves computed with random numbers distributed as a Gaussian withwidth the typical errors of the target galaxies for that radius. Red squaresand black dots are the left and right arms of the unfolded rotation curves,respectively. The thick black line is the mean vmax for all the simulations.The grey shaded area is the scatter for this mean.
Appendix A: Quantification of the bias introducedin vmax
Using the technique described in Sect. 5.2 to measure the maxi-mal rotation speed, it seems that none of the galaxies have zerorotation (look at the vmax presented in Table 4). However, rota-tion curves like PGC1154903 or VCC1087 (Fig. 6) appear to bestatistically consistent with no rotation. That we always find pos-itive maximum velocities is a consequence of the method usedto measure it. To quantify the bias introduced by this technique,we ran some simulations. We took a zero-rotation object witherrors typical of those galaxies that statistically are non-rotators.We took a typical rotation curve with 11 bins, at 0, 2′′, 4′′, 7′′,12′′, and 16′′, with symmetrical errors of 2, 5, 7, 10, 12, and15 km s−1 respectively. From these errors we generated 100 sim-ulated rotation curves assigning to each radius a random num-ber with a Gaussian distribution, of which the width is the errorassociated to that radius. After folding these simulated rotationcurves, shown in Fig. A.1, we calculated vmax exactly followingthe same technique as the one we used for the target galaxies.We then obtained a mean value for the 100 values of vmax andits scatter, 9± 6 km s−1, shown as a thick black line and a greyshaded area in Fig. A.1. As a result, we consider that those galax-ies with vmax < 9 km s−1 are not rotating, based on our data. Forthe other galaxies the rotation is significant (three times the stan-dard deviation, except for VCC1122 and VCC1261, see Table 4,3rd column), so that the systematic bias described here is muchless relevant. For VCC1122 (17.3± 7.7 km s−1) and VCC1261(13.9± 5.2 km s−1), the rotation is marginal, as also shown bytheir low vmax/σ.
Appendix B: Absolute I band magnitudes, opticaland half-light radii, and ellipticity
The I-band images for our sample of 21 dwarf galaxies weredrawn from the Sloan Digital Sky Survey (SDSS, York et al.2000) data release 6 (DR6 Adelman-McCarthy et al. 2008) andconverted to the Johnson-Cousins system following Appendix C.The photometric parameters were calculated using the IRAF taskellipse.
To remove the stars from the images, we used the IRAF taskfixpix. This task allows us to remove the stars interpolating the
surrounding galaxy area. To improve the final outcome, we aver-aged the results of interpolating along the horizontal and verticaldirections for each star. For those galaxies that were on the edgeof the FITS images or had a very bright nearby star, a more care-ful procedure was implemented. Taking advantage of the factthat the galaxies are ellipticals, so that they have smooth andaxisymmetric surface brightness profiles, the bmodel task ofIRAF can be used to replace the affected areas of the galaxy bythe azimuthal average of the unaffected ones. The output frombmodel was only used to replace a small fraction of pixels, sothis procedure was not affected by the possible presence of moresubtle features, such as bars or spiral arms, which could not bereproduced by the model provided by the bmodel task. Onceextremely bright nearby stars had been removed, the same pro-cedure as above was followed with ellipse and fixpix.
The procedure followed to run ellipse depends on the pa-rameters we want to measure. First of all we ran ellipse byfixing only the centre of the galaxy and assuming a step betweenisophotes of 1 pixel, while the rest of the parameters were leftfree. We also made the masks for the stars to be removed asdescribed above. With the aim of measuring the absolute mag-nitude, Ropt and Reff we ran ellipse, again fixing the centre ofthe galaxy, the ellipticity, and the position angle (PA) to avoidoverlap between consecutive isophotes. The adopted ε and PA inthis case are the typical values in the outer parts of the galaxy(beyond 1.5–2Reff, region where these two parameters stabilise).To measure ε and C4 we again ran ellipse after removing thestars, leaving only the centre of the galaxy fixed.
Asymptotic magnitudes and the radii were derived as in Gilde Paz et al. (2007). We first computed the accumulated flux andthe gradient in the accumulated flux (i.e., the slope of the growthcurve) at each radius, considering the major-axis value providedby ellipse as radius. After choosing an appropriate radial range,we performed a linear fit to the accumulated flux as a functionof the slope of the growth curve. The asymptotic magnitude ofthe galaxy was the Y-intercept or, equivalenly, the extrapolationof the growth curve to infinity. Once the asymptotic magnitudewas known, the optical and effective radii of each galaxy wereobtained as the major axis of an elliptical isophote containing83% and 50% of the total flux respectively. Different sources oferror have been considered for the asymptotic magnitudes (seeAppendix C). The resulting uncertainty is ∼0.02 mag.
The ellipticities (ε) were measured as the mean value be-tween 3′′ and the Reff, the galaxy region covered by our spectro-scopic observations.
Appendix C: Errors in magnitudes
The zero points (ZP) and the errors in the i-band magnitudeswere computed as described in SDSS documentation. The ZPwere obtained from F0, which is the flux that a source producesin counts per second in the image. It is calculated as a functionof three parameters (aa, kk, and airmass) and defined as
F0 =texp
100.4(aa+kk×airmass), (C.1)
where the exposure time (texp) is the same for all the SDSS im-ages (53.91 s). The uncertainties in the i-band magnitudes areaffected by different sources of error: firstly, the errors in theflux, that can be calculated following the equation
ΔF =
√F + skygain
+ Npix(dark variance + Δsky) (C.2)
A114, page 15 of 24
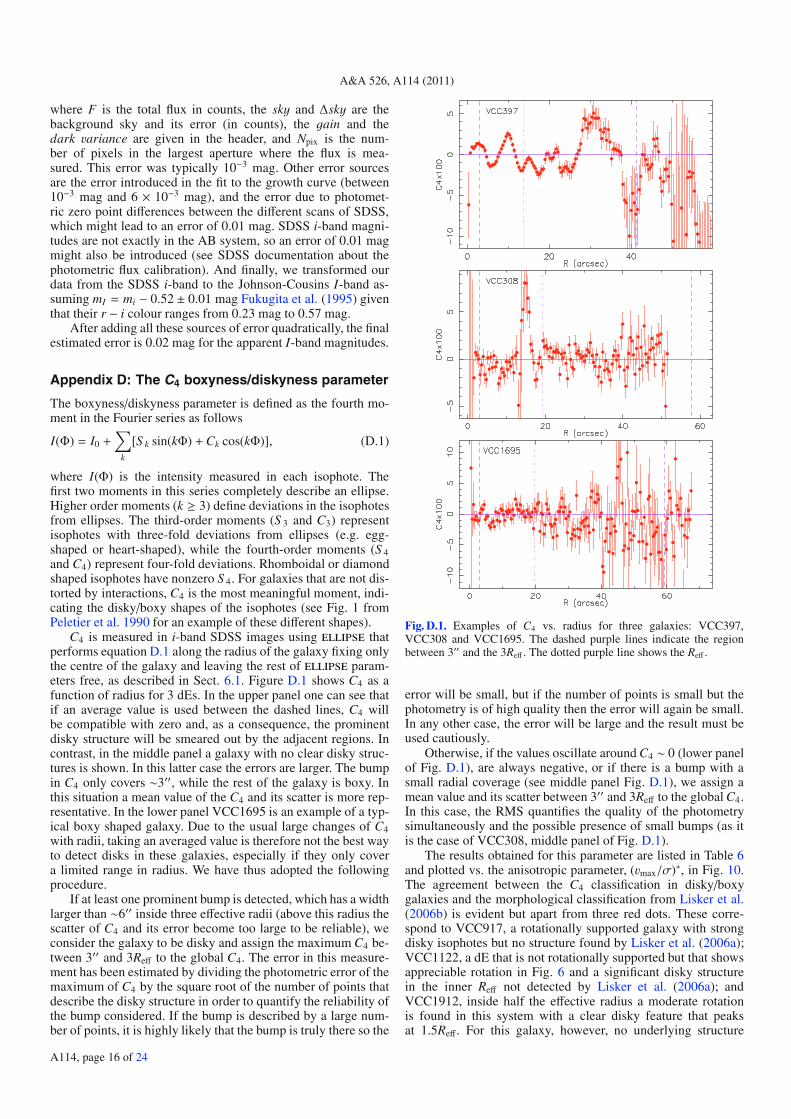
A&A 526, A114 (2011)
where F is the total flux in counts, the sky and Δsky are thebackground sky and its error (in counts), the gain and thedark variance are given in the header, and Npix is the num-ber of pixels in the largest aperture where the flux is mea-sured. This error was typically 10−3 mag. Other error sourcesare the error introduced in the fit to the growth curve (between10−3 mag and 6 × 10⁻³ mag), and the error due to photomet-ric zero point differences between the different scans of SDSS,which might lead to an error of 0.01 mag. SDSS i-band magni-tudes are not exactly in the AB system, so an error of 0.01 magmight also be introduced (see SDSS documentation about thephotometric flux calibration). And finally, we transformed ourdata from the SDSS i-band to the Johnson-Cousins I-band as-suming mI = mi − 0.52 ± 0.01 mag Fukugita et al. (1995) giventhat their r − i colour ranges from 0.23 mag to 0.57 mag.
After adding all these sources of error quadratically, the finalestimated error is 0.02 mag for the apparent I-band magnitudes.
Appendix D: The C4 boxyness/diskyness parameter
The boxyness/diskyness parameter is defined as the fourth mo-ment in the Fourier series as follows
I(Φ) = I0 +∑
k
[S k sin(kΦ) +Ck cos(kΦ)], (D.1)
where I(Φ) is the intensity measured in each isophote. Thefirst two moments in this series completely describe an ellipse.Higher order moments (k ≥ 3) define deviations in the isophotesfrom ellipses. The third-order moments (S 3 and C3) representisophotes with three-fold deviations from ellipses (e.g. egg-shaped or heart-shaped), while the fourth-order moments (S 4and C4) represent four-fold deviations. Rhomboidal or diamondshaped isophotes have nonzero S 4. For galaxies that are not dis-torted by interactions, C4 is the most meaningful moment, indi-cating the disky/boxy shapes of the isophotes (see Fig. 1 fromPeletier et al. 1990 for an example of these different shapes).
C4 is measured in i-band SDSS images using ellipse thatperforms equation D.1 along the radius of the galaxy fixing onlythe centre of the galaxy and leaving the rest of ellipse param-eters free, as described in Sect. 6.1. Figure D.1 shows C4 as afunction of radius for 3 dEs. In the upper panel one can see thatif an average value is used between the dashed lines, C4 willbe compatible with zero and, as a consequence, the prominentdisky structure will be smeared out by the adjacent regions. Incontrast, in the middle panel a galaxy with no clear disky struc-tures is shown. In this latter case the errors are larger. The bumpin C4 only covers ∼3′′, while the rest of the galaxy is boxy. Inthis situation a mean value of the C4 and its scatter is more rep-resentative. In the lower panel VCC1695 is an example of a typ-ical boxy shaped galaxy. Due to the usual large changes of C4with radii, taking an averaged value is therefore not the best wayto detect disks in these galaxies, especially if they only covera limited range in radius. We have thus adopted the followingprocedure.
If at least one prominent bump is detected, which has a widthlarger than ∼6′′ inside three effective radii (above this radius thescatter of C4 and its error become too large to be reliable), weconsider the galaxy to be disky and assign the maximum C4 be-tween 3′′ and 3Reff to the global C4. The error in this measure-ment has been estimated by dividing the photometric error of themaximum of C4 by the square root of the number of points thatdescribe the disky structure in order to quantify the reliability ofthe bump considered. If the bump is described by a large num-ber of points, it is highly likely that the bump is truly there so the
Fig. D.1. Examples of C4 vs. radius for three galaxies: VCC397,VCC308 and VCC1695. The dashed purple lines indicate the regionbetween 3′′ and the 3Reff . The dotted purple line shows the Reff .
error will be small, but if the number of points is small but thephotometry is of high quality then the error will again be small.In any other case, the error will be large and the result must beused cautiously.
Otherwise, if the values oscillate around C4 ∼ 0 (lower panelof Fig. D.1), are always negative, or if there is a bump with asmall radial coverage (see middle panel Fig. D.1), we assign amean value and its scatter between 3′′ and 3Reff to the global C4.In this case, the RMS quantifies the quality of the photometrysimultaneously and the possible presence of small bumps (as itis the case of VCC308, middle panel of Fig. D.1).
The results obtained for this parameter are listed in Table 6and plotted vs. the anisotropic parameter, (vmax/σ)∗, in Fig. 10.The agreement between the C4 classification in disky/boxygalaxies and the morphological classification from Lisker et al.(2006b) is evident but apart from three red dots. These corre-spond to VCC917, a rotationally supported galaxy with strongdisky isophotes but no structure found by Lisker et al. (2006a);VCC1122, a dE that is not rotationally supported but that showsappreciable rotation in Fig. 6 and a significant disky structurein the inner Reff not detected by Lisker et al. (2006a); andVCC1912, inside half the effective radius a moderate rotationis found in this system with a clear disky feature that peaksat 1.5Reff. For this galaxy, however, no underlying structure
A114, page 16 of 24
E. Toloba et al.: Formation and evolution of dwarf early-type galaxies in the Virgo cluster. I.
was found by Lisker et al. (2006a). More importantly, VCC308and VCC856, two rotationally supported galaxies with boxyC4, present prominent spiral arms in Lisker et al. (2006a). InFerrarese et al. (2006), based on ACS-HST images, VCC856also shows spiral arms but their analysis of the isophotes’ shapesshows that they are boxy too. Looking at Table 6 we see that bothgalaxies are nearly face-on, which means that the isophotes areboxy since face-on disks are round and not disky. As a conse-quence, we emphasise that boxy isophotes could miss disk fea-tures (mainly if the galaxies are face-on), but not the other wayround (see VCC917).
A114, page 17 of 24
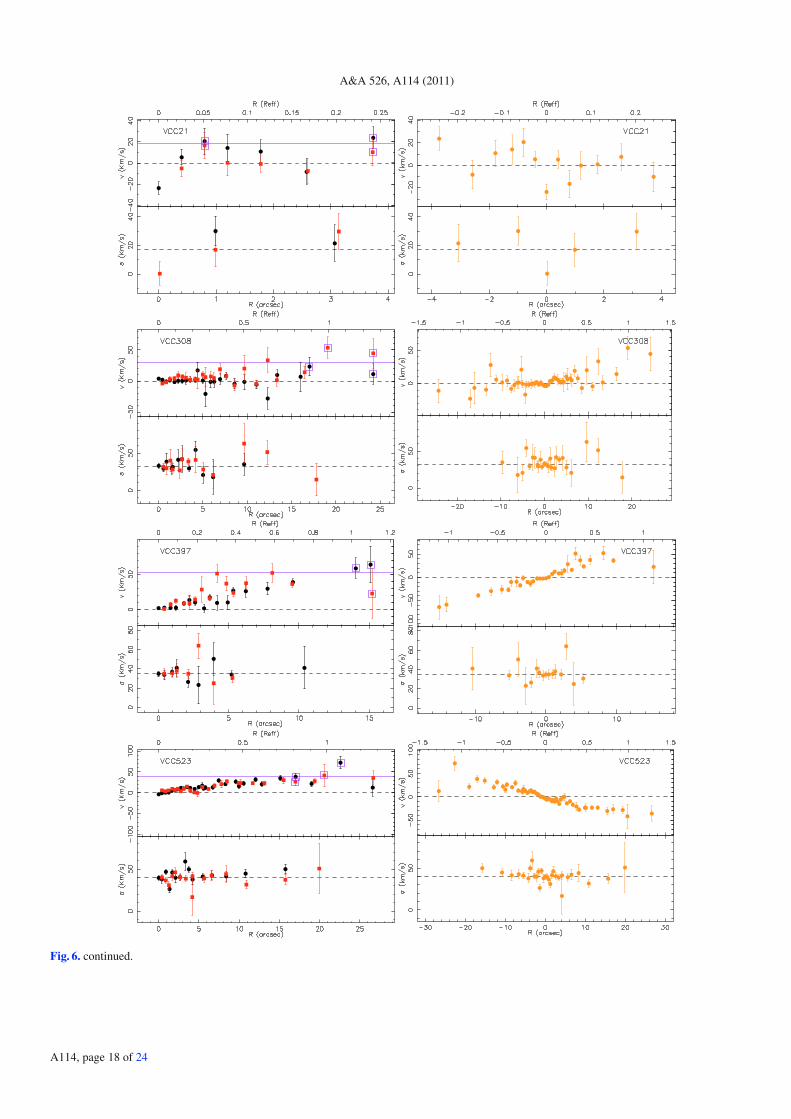
A&A 526, A114 (2011)
Fig. 6. continued.
A114, page 18 of 24
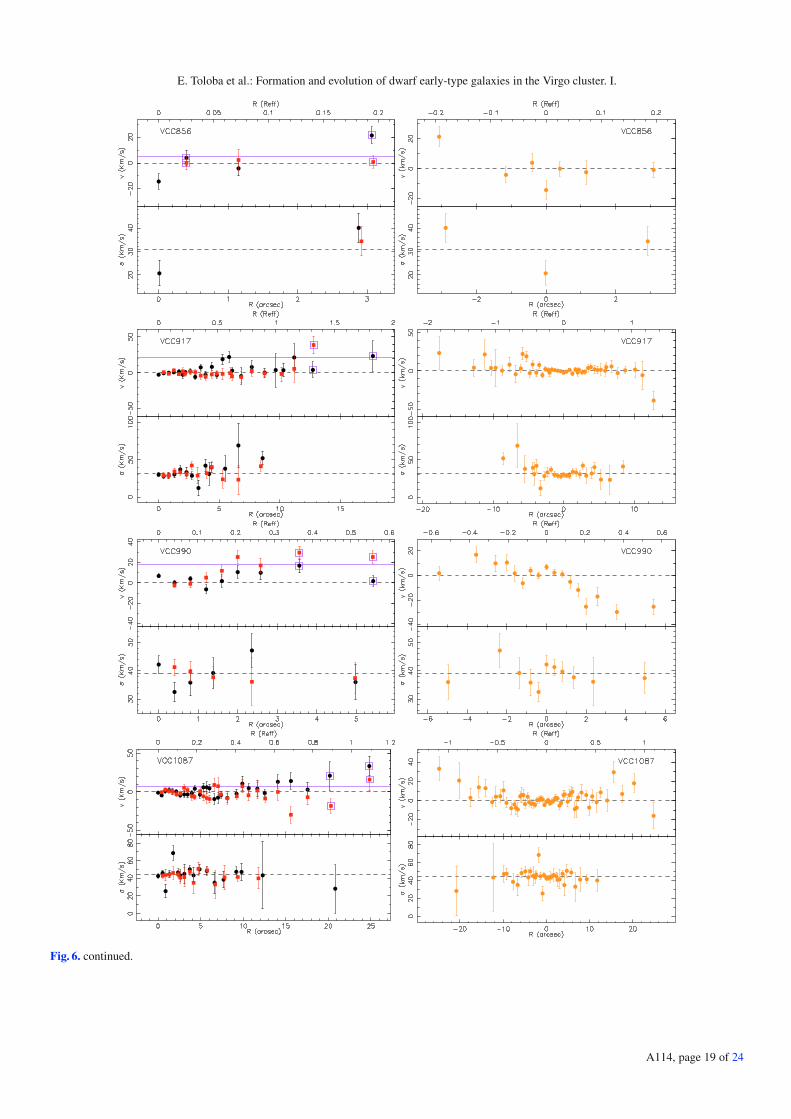
E. Toloba et al.: Formation and evolution of dwarf early-type galaxies in the Virgo cluster. I.
Fig. 6. continued.
A114, page 19 of 24
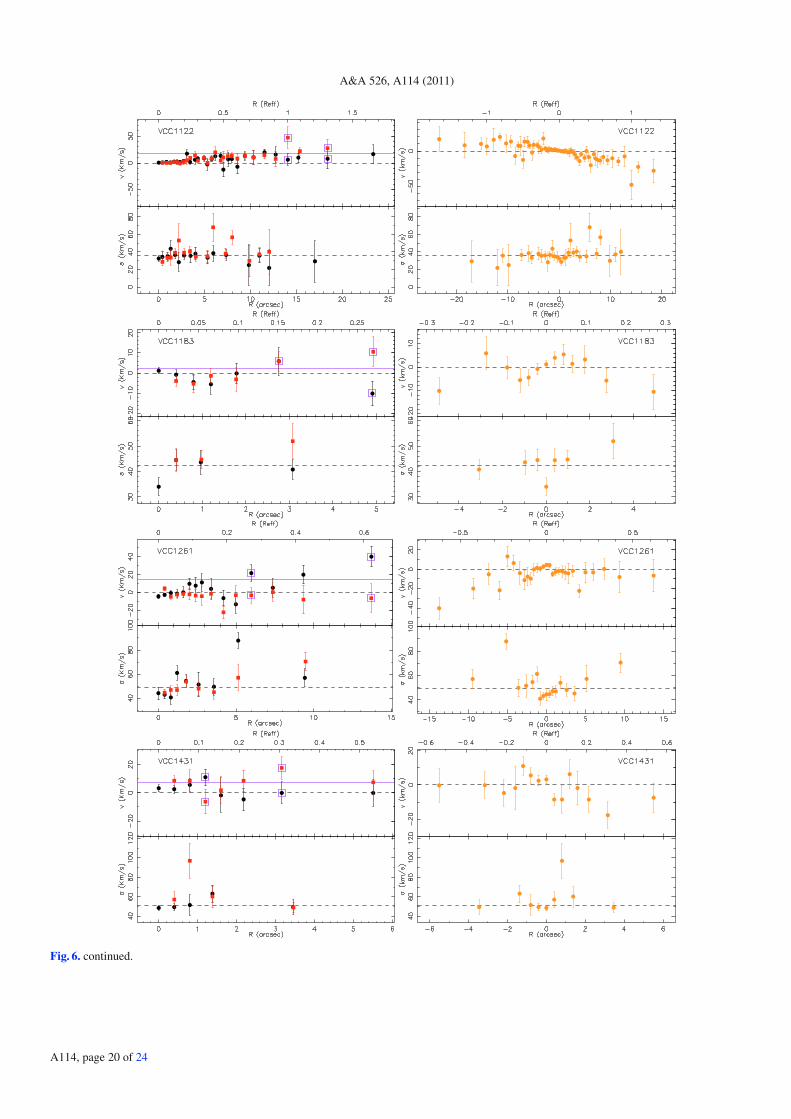
A&A 526, A114 (2011)
Fig. 6. continued.
A114, page 20 of 24
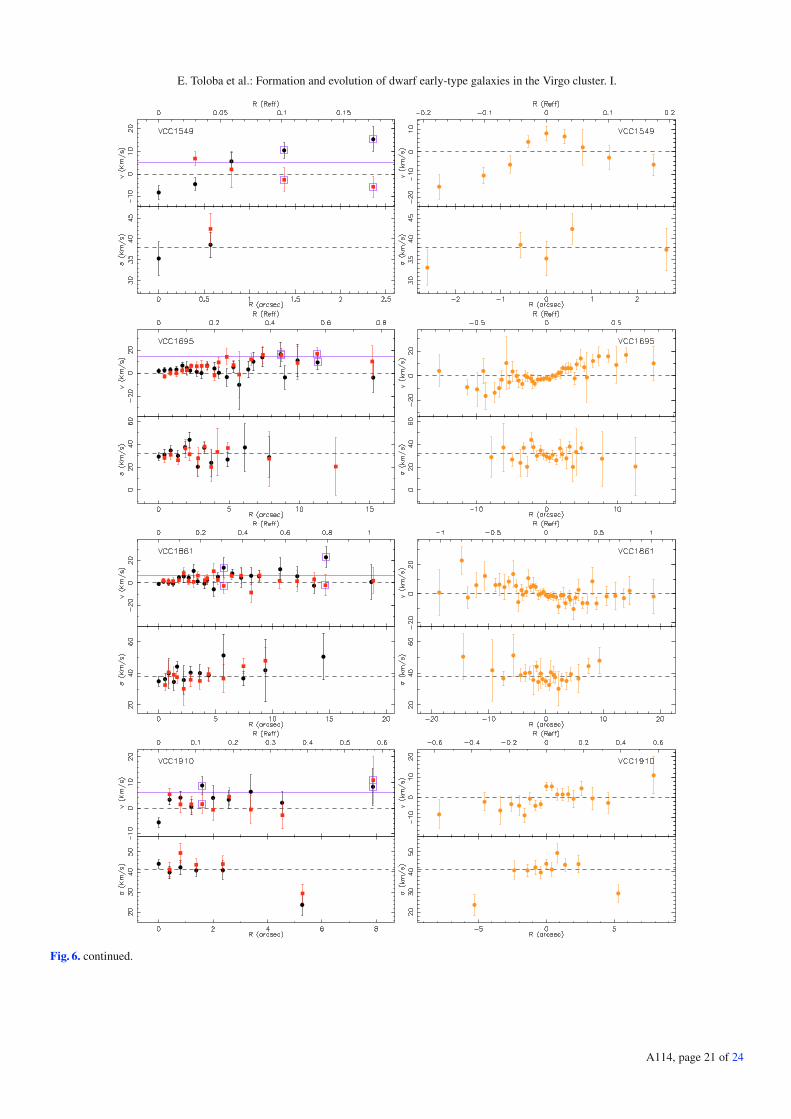
E. Toloba et al.: Formation and evolution of dwarf early-type galaxies in the Virgo cluster. I.
Fig. 6. continued.
A114, page 21 of 24
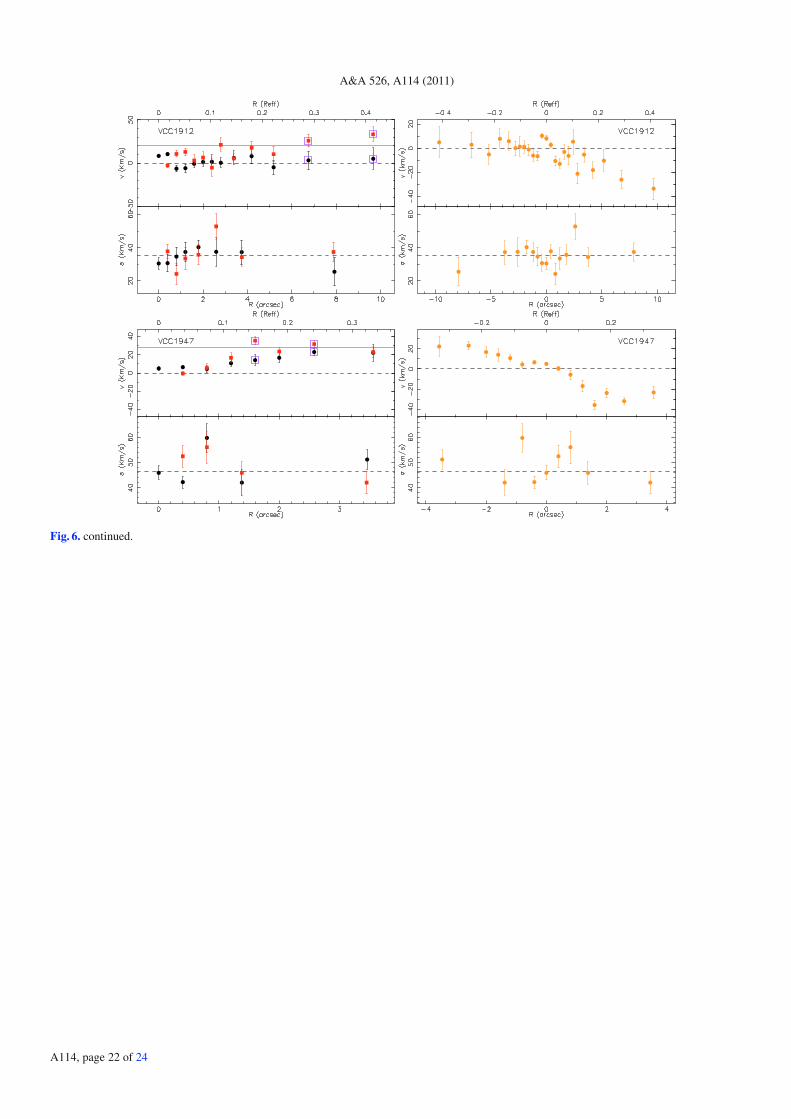
A&A 526, A114 (2011)
Fig. 6. continued.
A114, page 22 of 24
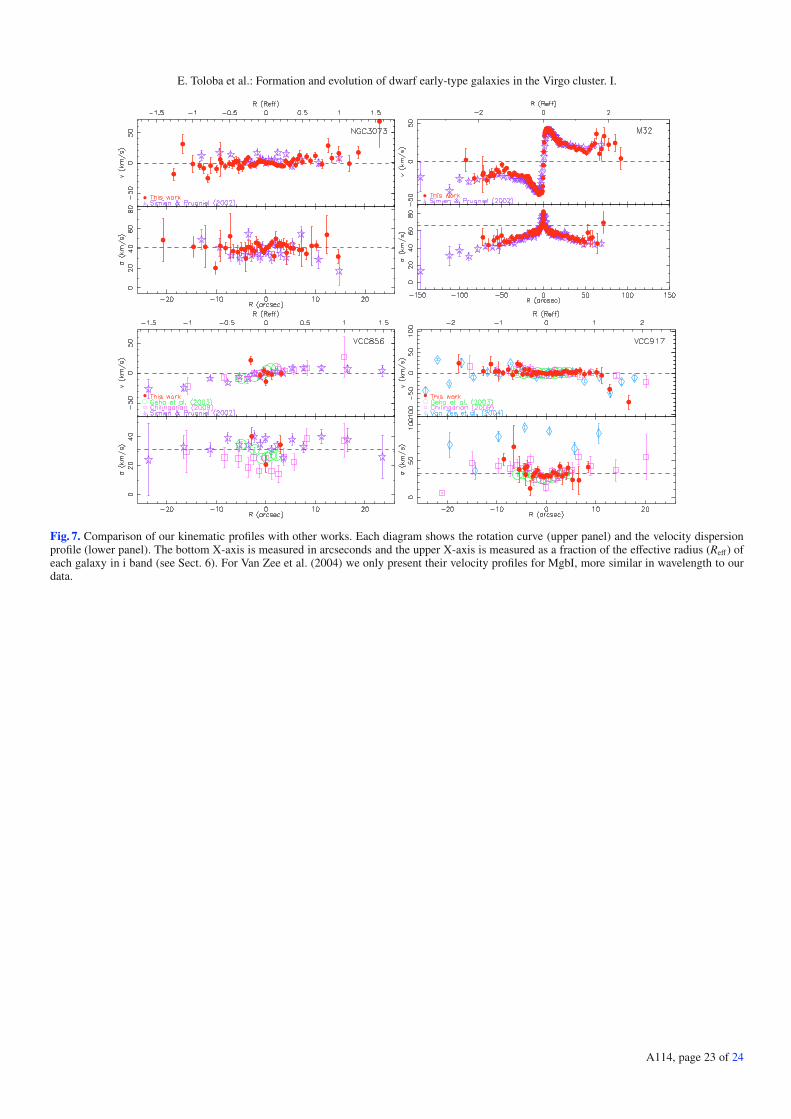
E. Toloba et al.: Formation and evolution of dwarf early-type galaxies in the Virgo cluster. I.
Fig. 7. Comparison of our kinematic profiles with other works. Each diagram shows the rotation curve (upper panel) and the velocity dispersionprofile (lower panel). The bottom X-axis is measured in arcseconds and the upper X-axis is measured as a fraction of the effective radius (Reff) ofeach galaxy in i band (see Sect. 6). For Van Zee et al. (2004) we only present their velocity profiles for MgbI, more similar in wavelength to ourdata.
A114, page 23 of 24
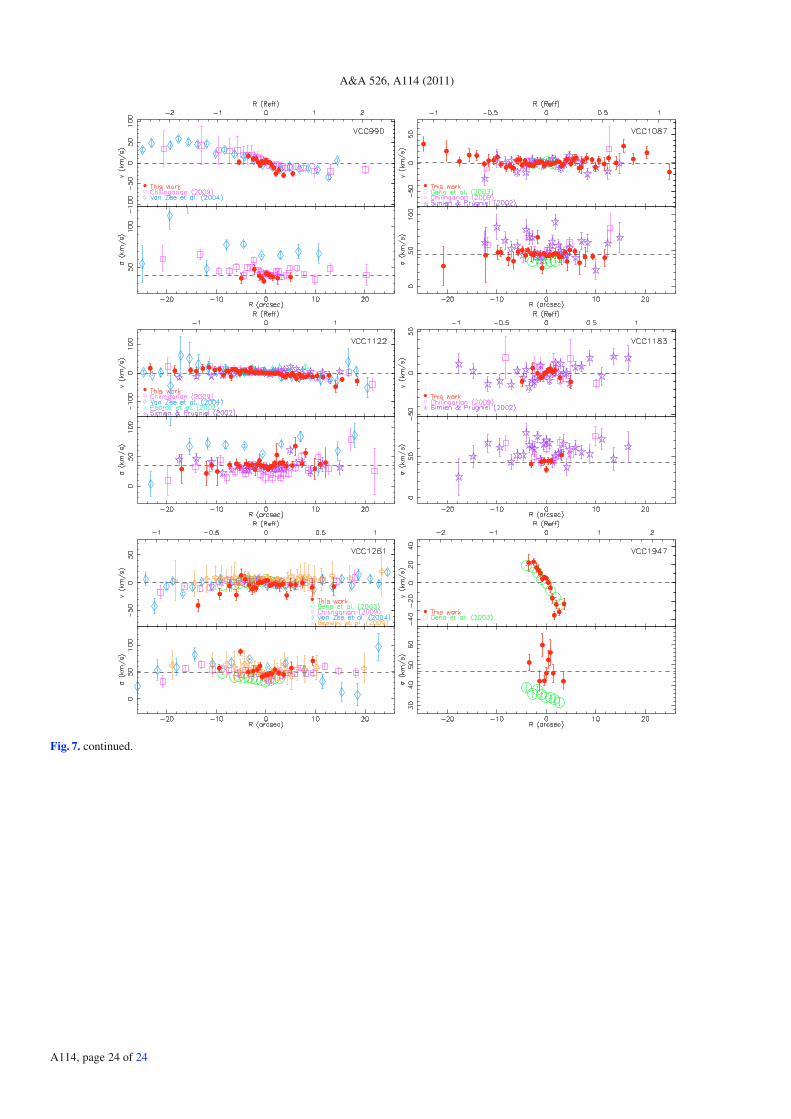
A&A 526, A114 (2011)
Fig. 7. continued.
A114, page 24 of 24