Embed Size (px)
Citation preview

Formation and Dissipation of Trihalomethanes during Aquifer Storage and Recovery Operations
Jason Pulley
City of Salem Public Works

System Overview
• Slow sand filtration– 80 MGD firm treatment capacity
– 66 MGD transmission capacity
• 183,000 service population
• 30 MGD average
• 55 MGD peak day
• 136 MG system storage
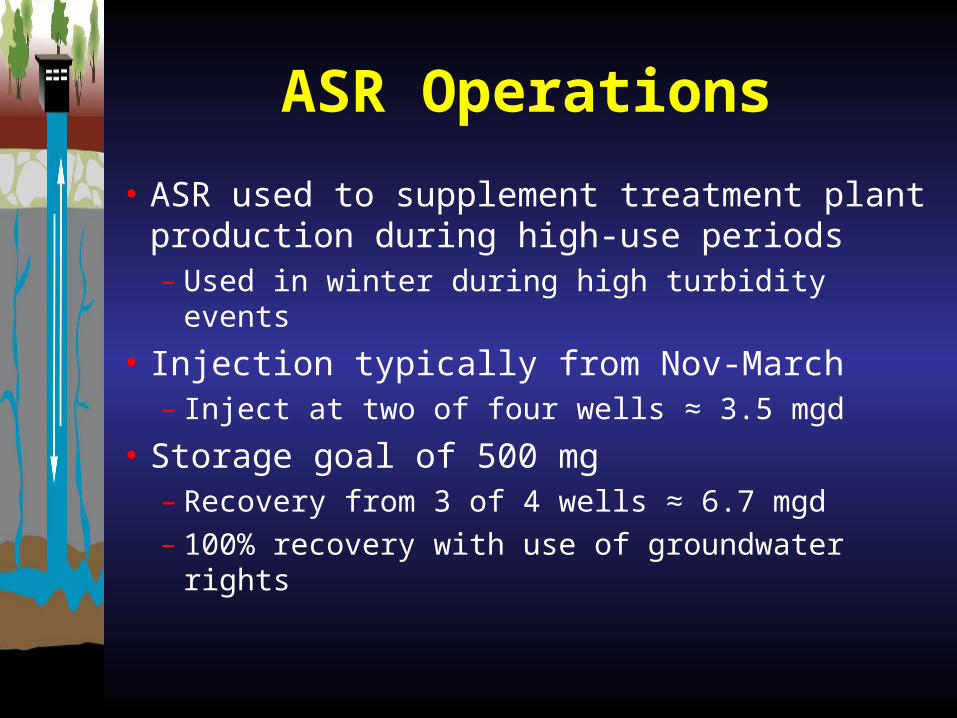
ASR Operations
• ASR used to supplement treatment plant production during high-use periods– Used in winter during high turbidity events
• Injection typically from Nov-March– Inject at two of four wells ≈ 3.5 mgd
• Storage goal of 500 mg– Recovery from 3 of 4 wells ≈ 6.7 mgd
– 100% recovery with use of groundwater rights
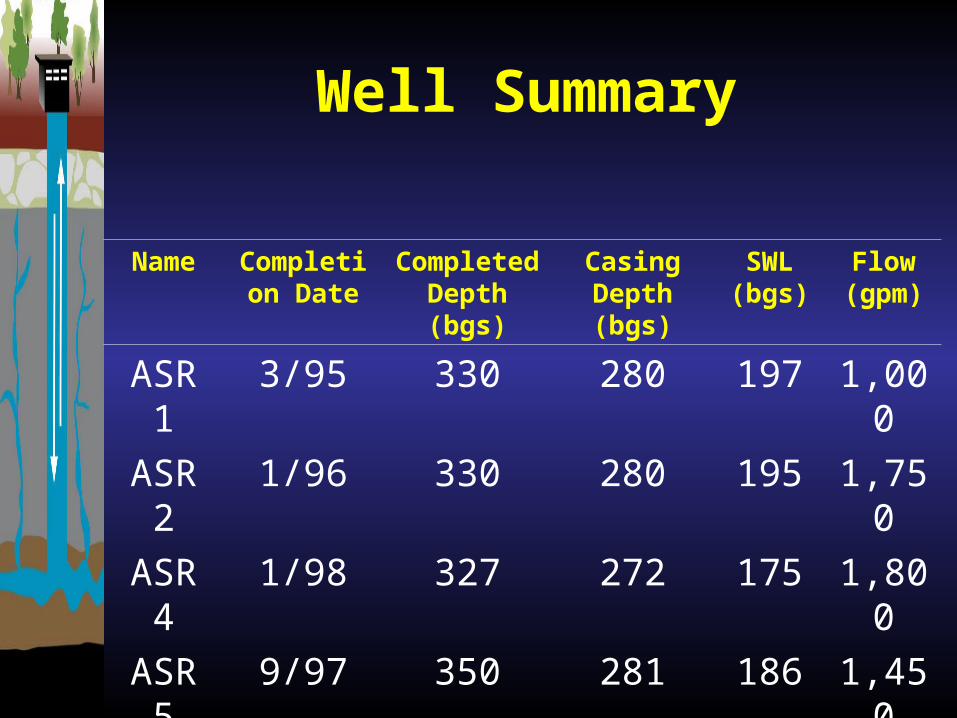
Well Summary
Name Completion Date
Completed Depth (bgs)
Casing Depth (bgs)
SWL (bgs)
Flow (gpm)
ASR 1 3/95 330 280 197 1,000
ASR 2 1/96 330 280 195 1,750
ASR 4 1/98 327 272 175 1,800
ASR 5 9/97 350 281 186 1,450

Distribution System Water Quality (Typical)
pH 7.2
TOC 0.64 mg/L
TDS 30.0 mg/L
Alkalinity 20.4 mg/L
Calcium 3.64 mg/L
Magnesium 0.95 mg/l
Potassium 0.57 mg/L
TTHM 17-57 ug/L
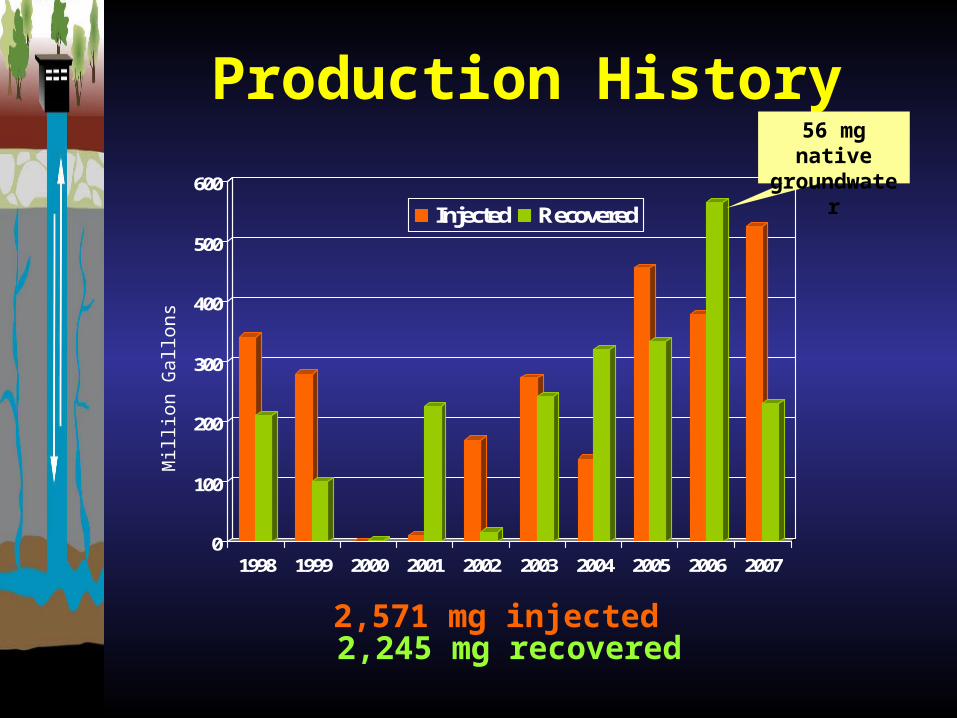
Production History
0
100
200
300
400
500
600
1998 1999 2000 2001 2002 2003 2004 2005 2006 2007
Injected Recovered
Mil
lion
Gal
lons
56 mg native groundwater
2,571 mg injected2,245 mg recovered
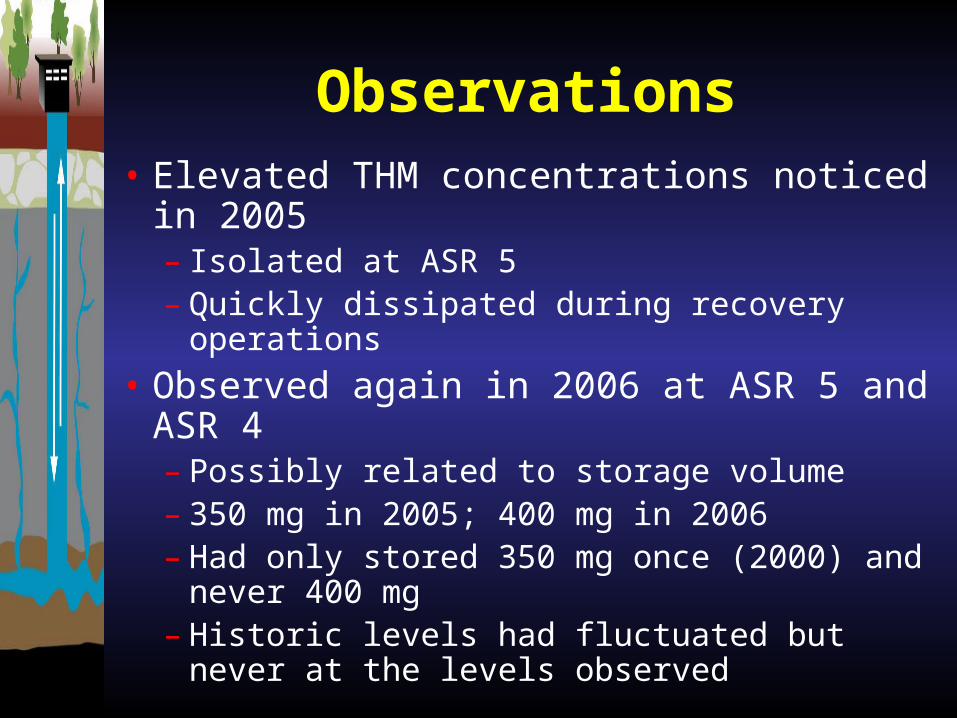
Observations• Elevated THM concentrations noticed in
2005– Isolated at ASR 5– Quickly dissipated during recovery operations
• Observed again in 2006 at ASR 5 and ASR 4– Possibly related to storage volume– 350 mg in 2005; 400 mg in 2006– Had only stored 350 mg once (2000) and never
400 mg– Historic levels had fluctuated but never at the
levels observed
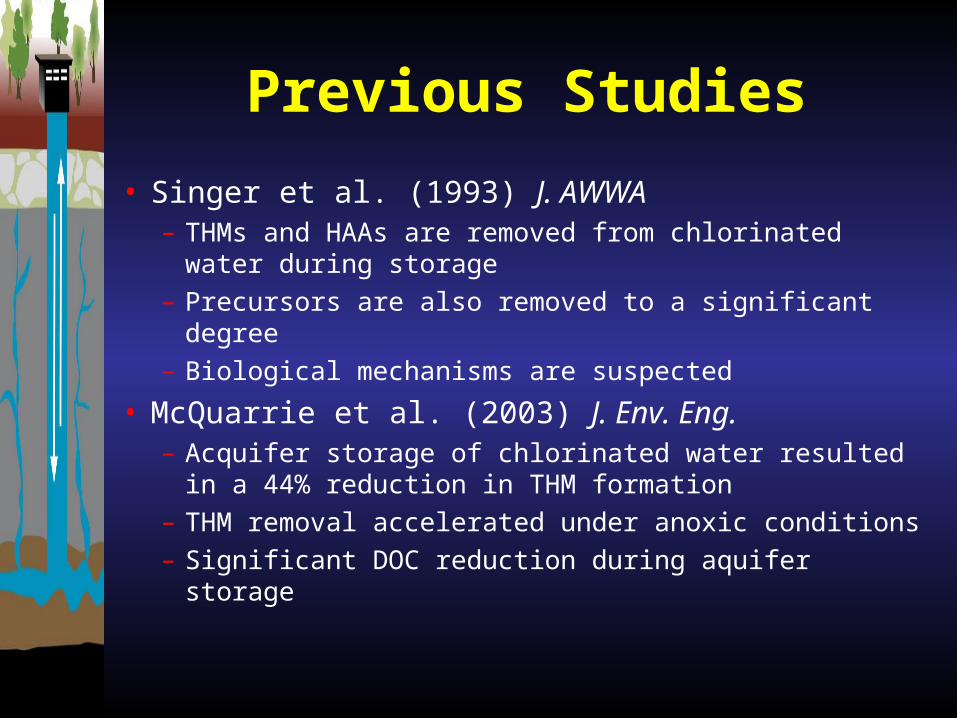
Previous Studies
• Singer et al. (1993) J. AWWA– THMs and HAAs are removed from chlorinated water
during storage
– Precursors are also removed to a significant degree
– Biological mechanisms are suspected
• McQuarrie et al. (2003) J. Env. Eng.– Acquifer storage of chlorinated water resulted in a 44%
reduction in THM formation
– THM removal accelerated under anoxic conditions
– Significant DOC reduction during aquifer storage
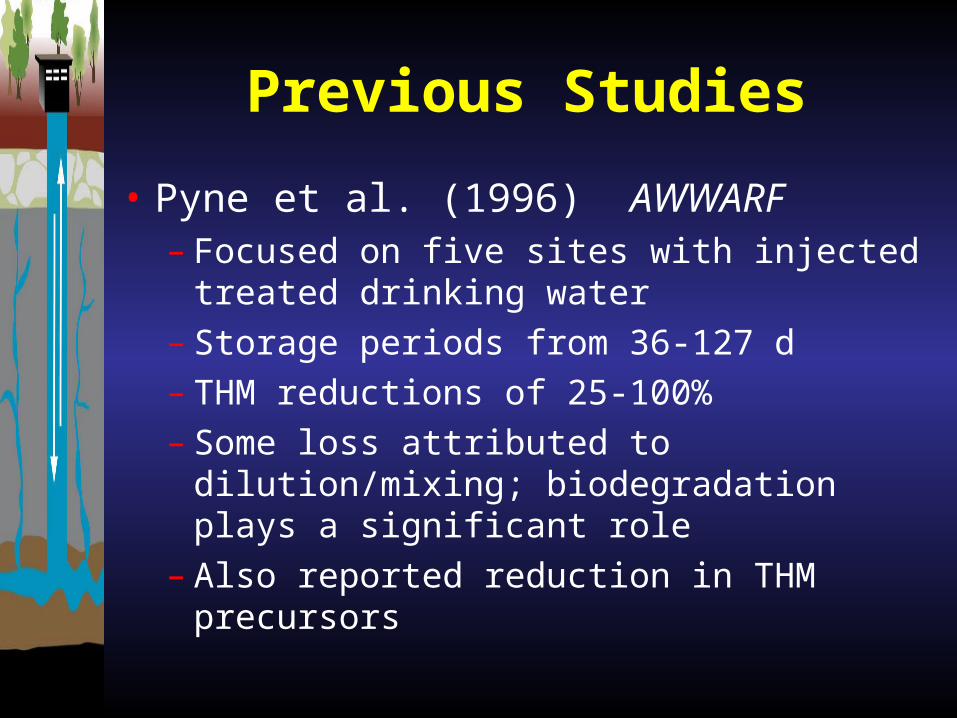
Previous Studies
• Pyne et al. (1996) AWWARF – Focused on five sites with injected treated
drinking water
– Storage periods from 36-127 d
– THM reductions of 25-100%
– Some loss attributed to dilution/mixing; biodegradation plays a significant role
– Also reported reduction in THM precursors
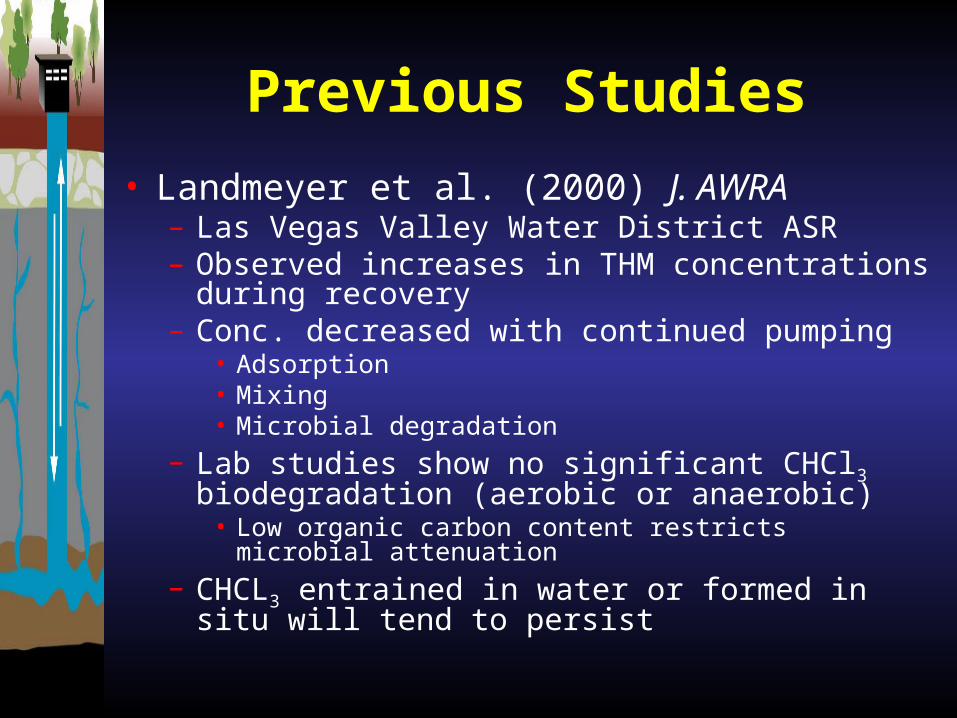
Previous Studies
• Landmeyer et al. (2000) J. AWRA– Las Vegas Valley Water District ASR– Observed increases in THM concentrations during
recovery– Conc. decreased with continued pumping
• Adsorption• Mixing• Microbial degradation
– Lab studies show no significant CHCl3 biodegradation (aerobic or anaerobic)
• Low organic carbon content restricts microbial attenuation
– CHCL3 entrained in water or formed in situ will tend to persist

Initial Investigations
• Monitor THM concentrations over a 30-day storage period– Weekly measurements of THM at each of four wells
• Collect samples from each well and finished water from TP– 7-d THMFP, DOC, SUVA on all samples– 30-d THMFP on finished water– 7 & 30-d SDS on finished water
• Time series analysis after 30-d storage (every 10-min for 1 h)

Analytical Methodology• EPA Method 524.2
– Purgeable organic compounds by capillary column GC/MS
– Alternate methods 551.1 & 552.2 (liquid extraction with ECD)
– All provide full speciation
• Hach Procedure 10132– Colorimetric read on spectrophotometer
– All results reported as chloroform (CHCl3)
– Estimated detection limit of 6 g L-1
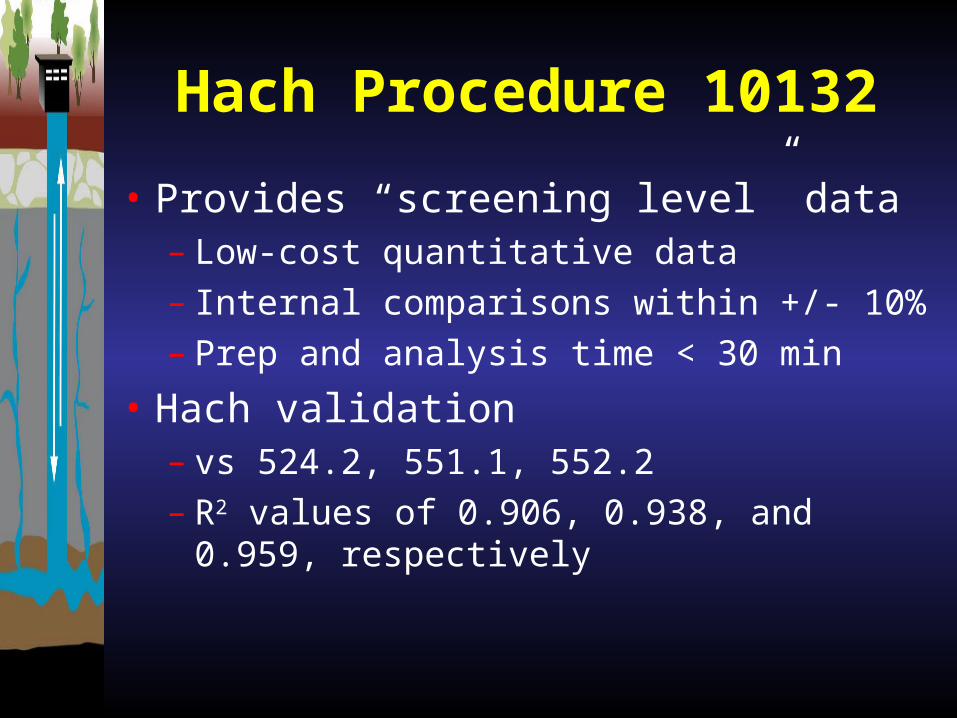
Hach Procedure 10132
• Provides “screening level” data– Low-cost quantitative data
– Internal comparisons within +/- 10%
– Prep and analysis time < 30 min
• Hach validation– vs 524.2, 551.1, 552.2
– R2 values of 0.906, 0.938, and 0.959, respectively
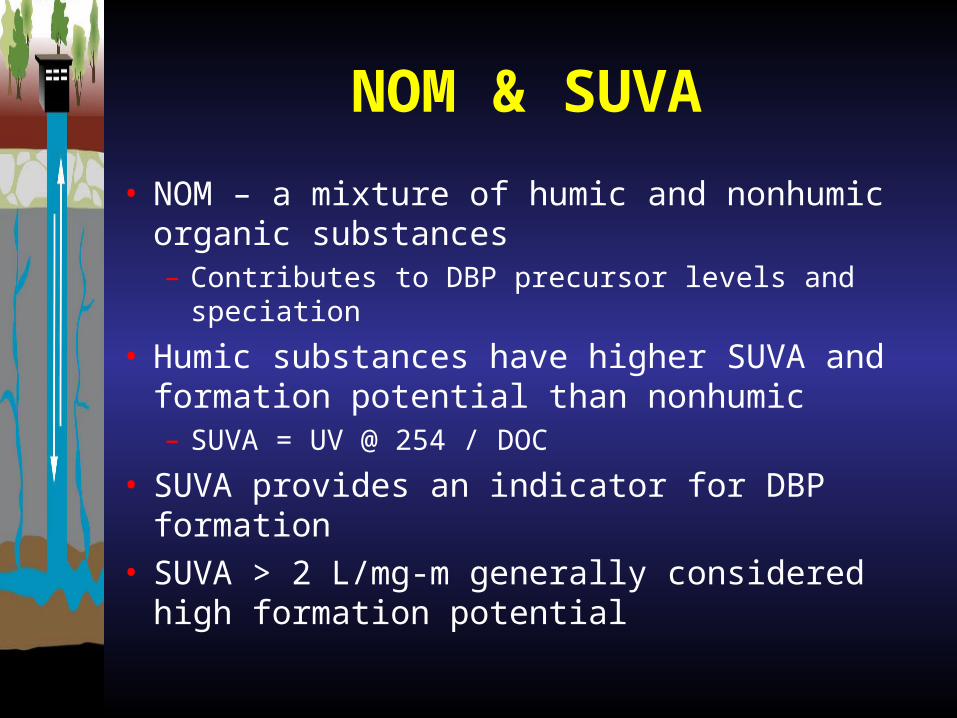
NOM & SUVA
• NOM – a mixture of humic and nonhumic organic substances– Contributes to DBP precursor levels and speciation
• Humic substances have higher SUVA and formation potential than nonhumic– SUVA = UV @ 254 / DOC
• SUVA provides an indicator for DBP formation• SUVA > 2 L/mg-m generally considered high
formation potential

ASR THM Formation Potential
7d THMFP DOC SUVA FCl*
---g/L--- --mg/L-- --L/mg-m-- ---mg/L---
ASR 1 82 0.95 2.9 4.2
ASR 2 90 0.85 3.5 3.6
ASR 4 87 0.65 3.1 4.6
ASR 5 95 0.58 2.6 4.7* Initial chlorine dose of 6.0 mg/L
Treatment Plant Effluent
DOC: 0.67mg/L SUVA: 1.9 L/mg-m
7d FP: 41 g/L 30d FP: 36 g/L
7d SDS: 41 g/L 30d SDS: 62 g/L
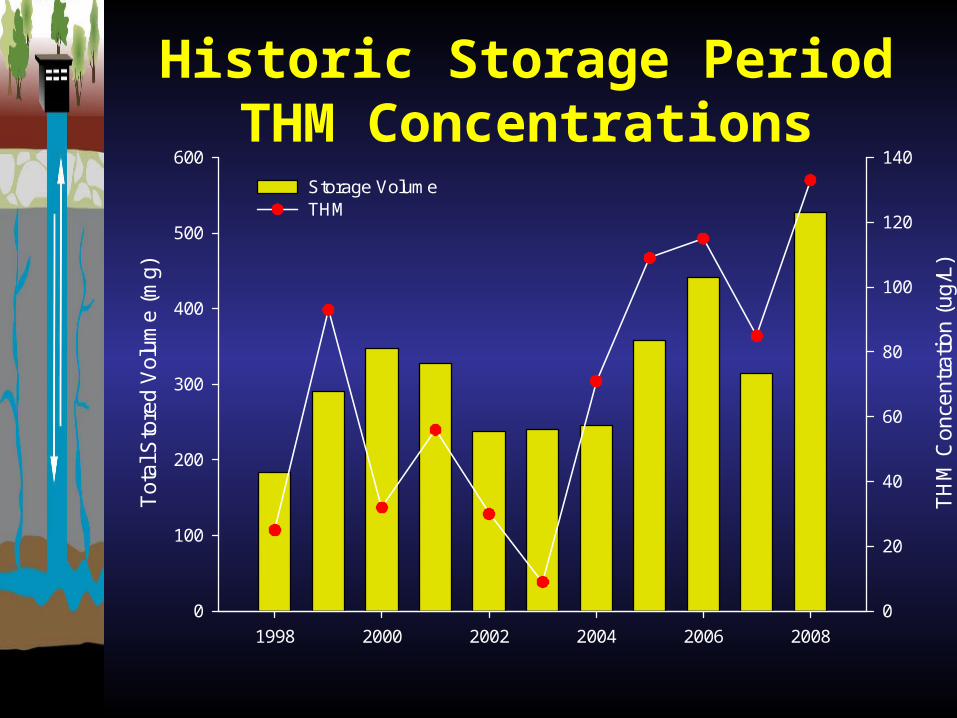
Historic Storage Period THM Concentrations
1998 2000 2002 2004 2006 2008
Tot
al S
tore
d V
olum
e (m
g)
0
100
200
300
400
500
600
TH
M C
once
ntra
tion
(ug/
L)
0
20
40
60
80
100
120
140
Storage VolumeTHM
Date
1/1/2006 5/1/2006 9/1/2006 1/1/2007 5/1/2007 9/1/2007 1/1/2008
Cum
ulat
ive
Vol
ume
(mg)
0
100
200
300
400
500
600
Con
cent
ratio
n (u
g/L)
0
20
40
60
80
100
120
140
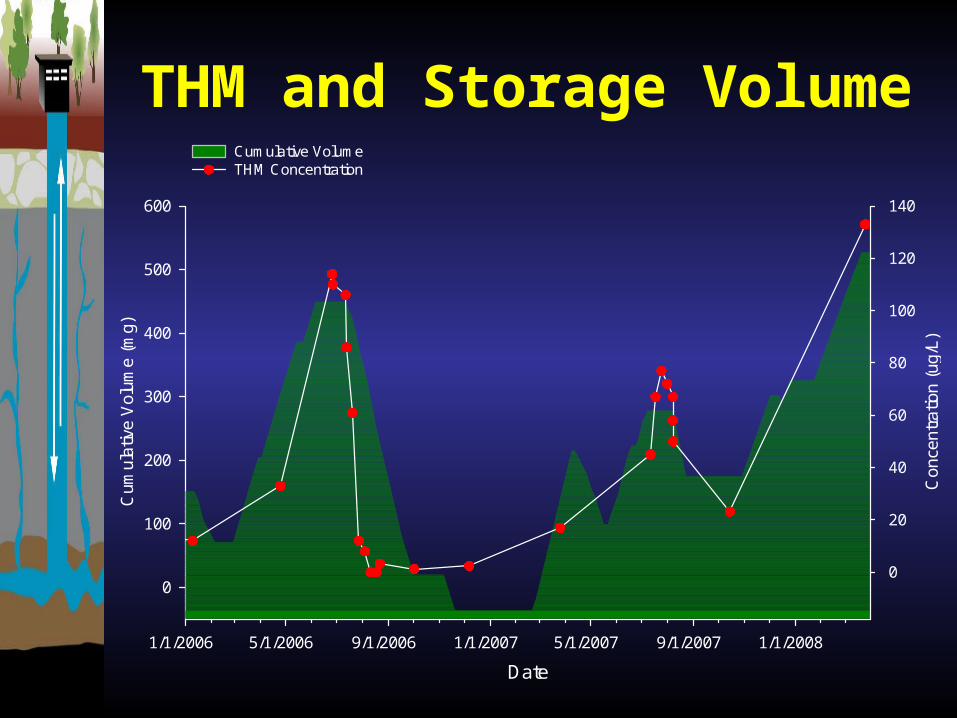
Cumulative Volume THM Concentration
THM and Storage Volume
Date
1/1/06 2/1/06 3/1/06 4/1/06 5/1/06 6/1/06 7/1/06 8/1/06 9/1/06 10/1/06 11/1/06 12/1/06
Cu
mu
lati
ve A
SR
Sto
rag
e (
MG
)
-50
0
50
100
150
200
250
300
350
400
450
500
Co
nce
ntr
ati
on
(m
g/L
)
0
5
10
15
20
25
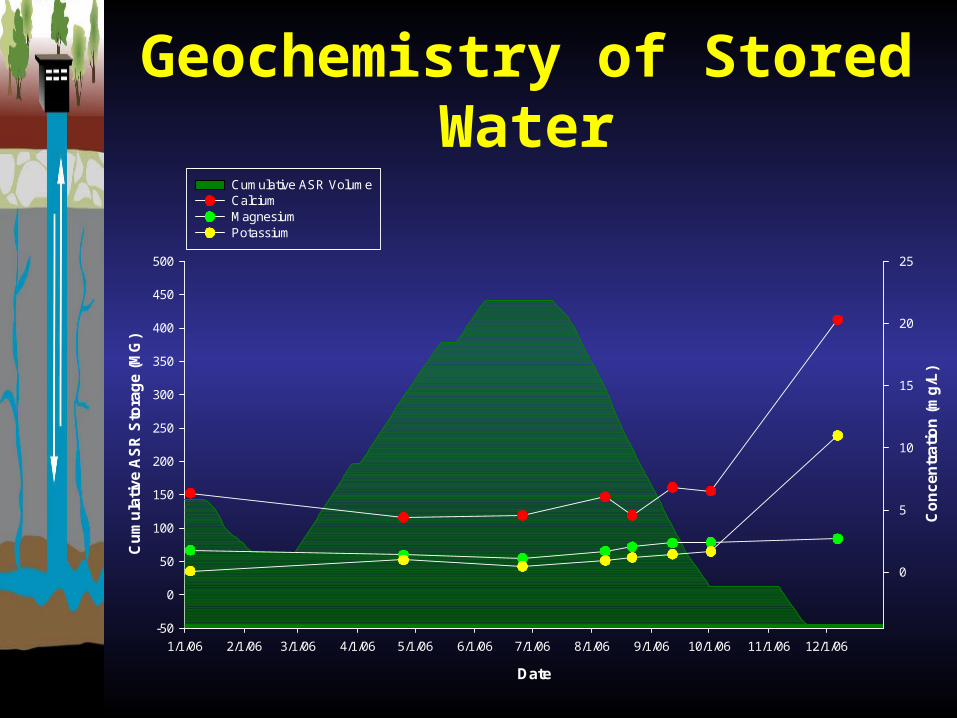
Cumulative ASR VolumeCalciumMagnesiumPotassium
Geochemistry of Stored Water
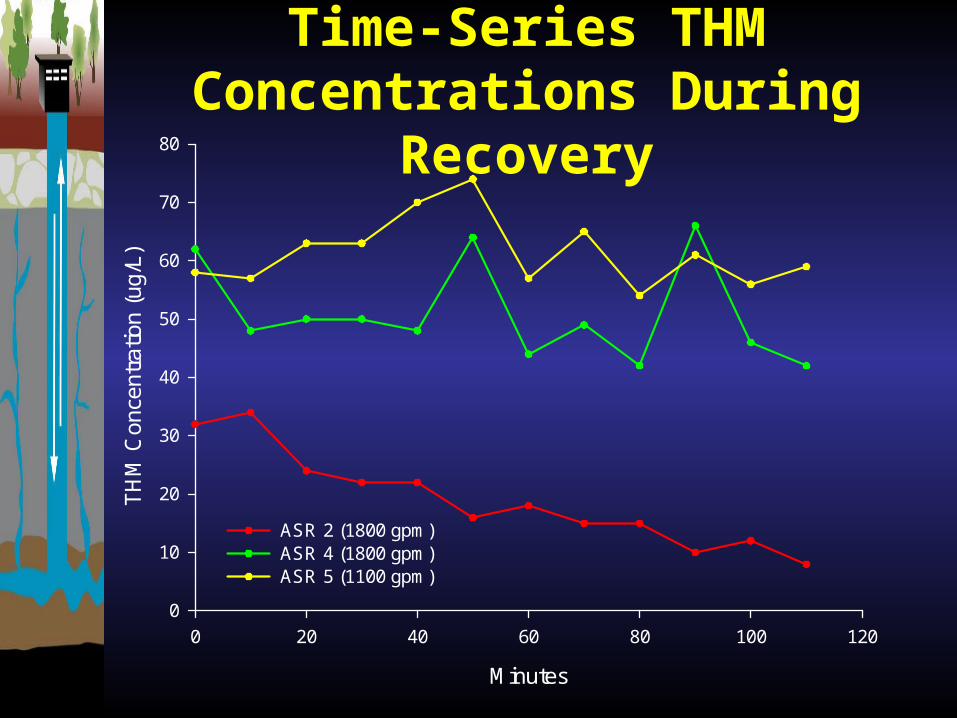
Minutes
0 20 40 60 80 100 120
TH
M C
once
ntra
tion
(ug/
L)
0
10
20
30
40
50
60
70
80
ASR 2 (1800 gpm)ASR 4 (1800 gpm)ASR 5 (1100 gpm)
Time-Series THM Concentrations During Recovery
Findings
• THM concentration appears to be related to storage volume
• Formation occurs rapidly during storage period• Rate of dissipation indicates that THMs are not
evenly distributed in stored water– Lack of observation in ASR 1 & 2 suggests a localized
phenomenom• Dissipation of THMs does not appear to be a
function of mixing/dilution (based on geochem data)
• TOC probably the limiting factor in formation• ∆ SUVA indicates potential source of additional
TOC/DOC
Next Steps
• Continue to monitor during current storage period to see if levels increase above existing concentrations– More frequent analysis during recovery operations
• Further analysis of SUVA during injection and recovery cycles at varying water elevations
• Examine HAA formation characteristics• Pursue dechlorination of injection water if
increasing concentration are not manageable