Embed Size (px)
Citation preview
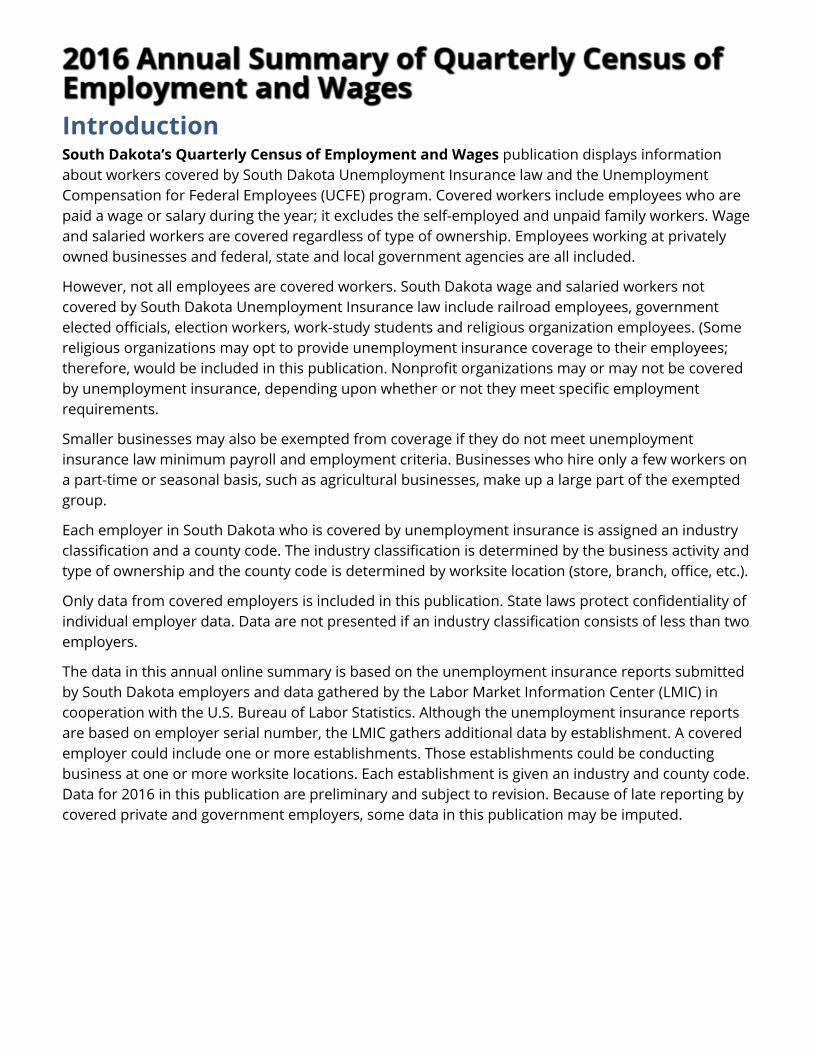
IntroductionSouth Dakota’s Quarterly Census of Employment and Wages publication displays information about workers covered by South Dakota Unemployment Insurance law and the Unemployment Compensation for Federal Employees (UCFE) program. Covered workers include employees who are paid a wage or salary during the year; it excludes the self-employed and unpaid family workers. Wage and salaried workers are covered regardless of type of ownership. Employees working at privately owned businesses and federal, state and local government agencies are all included.
However, not all employees are covered workers. South Dakota wage and salaried workers not covered by South Dakota Unemployment Insurance law include railroad employees, government elected officials, election workers, work-study students and religious organization employees. (Some religious organizations may opt to provide unemployment insurance coverage to their employees; therefore, would be included in this publication. Nonprofit organizations may or may not be covered by unemployment insurance, depending upon whether or not they meet specific employment requirements.
Smaller businesses may also be exempted from coverage if they do not meet unemployment insurance law minimum payroll and employment criteria. Businesses who hire only a few workers on a part-time or seasonal basis, such as agricultural businesses, make up a large part of the exempted group.
Each employer in South Dakota who is covered by unemployment insurance is assigned an industry classification and a county code. The industry classification is determined by the business activity and type of ownership and the county code is determined by worksite location (store, branch, office, etc.).
Only data from covered employers is included in this publication. State laws protect confidentiality of individual employer data. Data are not presented if an industry classification consists of less than two employers.
The data in this annual online summary is based on the unemployment insurance reports submitted by South Dakota employers and data gathered by the Labor Market Information Center (LMIC) in cooperation with the U.S. Bureau of Labor Statistics. Although the unemployment insurance reports are based on employer serial number, the LMIC gathers additional data by establishment. A covered employer could include one or more establishments. Those establishments could be conducting business at one or more worksite locations. Each establishment is given an industry and county code. Data for 2016 in this publication are preliminary and subject to revision. Because of late reporting by covered private and government employers, some data in this publication may be imputed.
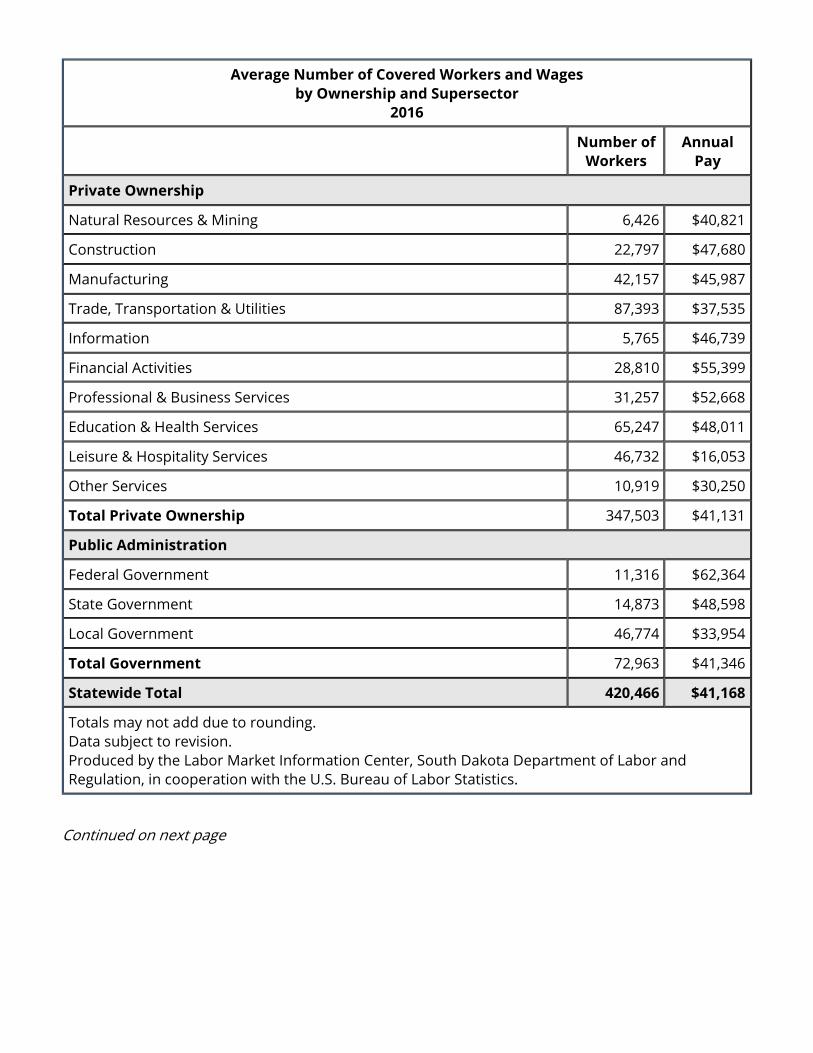
Average Number of Covered Workers and Wagesby Ownership and Supersector
2016
Number of Workers
Annual Pay
Private Ownership
Natural Resources & Mining 6,426 $40,821
Construction 22,797 $47,680
Manufacturing 42,157 $45,987
Trade, Transportation & Utilities 87,393 $37,535
Information 5,765 $46,739
Financial Activities 28,810 $55,399
Professional & Business Services 31,257 $52,668
Education & Health Services 65,247 $48,011
Leisure & Hospitality Services 46,732 $16,053
Other Services 10,919 $30,250
Total Private Ownership 347,503 $41,131
Public Administration
Federal Government 11,316 $62,364
State Government 14,873 $48,598
Local Government 46,774 $33,954
Total Government 72,963 $41,346
Statewide Total 420,466 $41,168
Totals may not add due to rounding.Data subject to revision.Produced by the Labor Market Information Center, South Dakota Department of Labor and Regulation, in cooperation with the U.S. Bureau of Labor Statistics.
Continued on next page
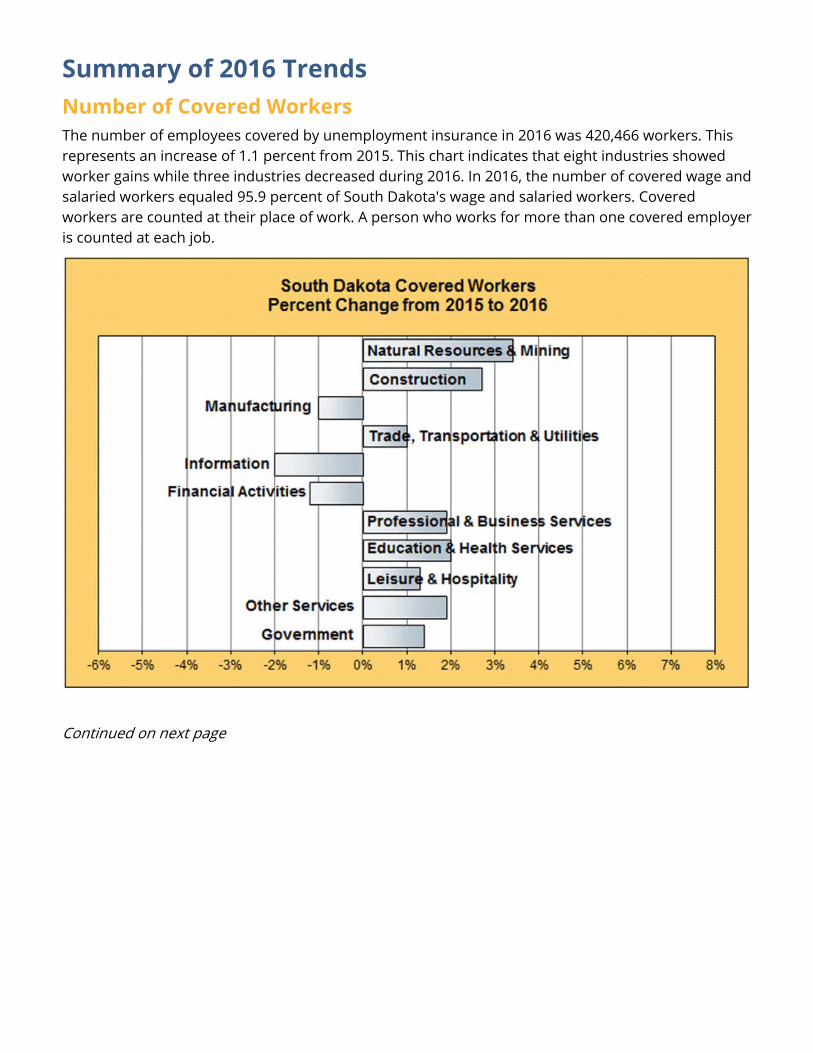
Summary of 2016 Trends Number of Covered WorkersThe number of employees covered by unemployment insurance in 2016 was 420,466 workers. This represents an increase of 1.1 percent from 2015. This chart indicates that eight industries showed worker gains while three industries decreased during 2016. In 2016, the number of covered wage and salaried workers equaled 95.9 percent of South Dakota's wage and salaried workers. Covered workers are counted at their place of work. A person who works for more than one covered employer is counted at each job.
Continued on next page
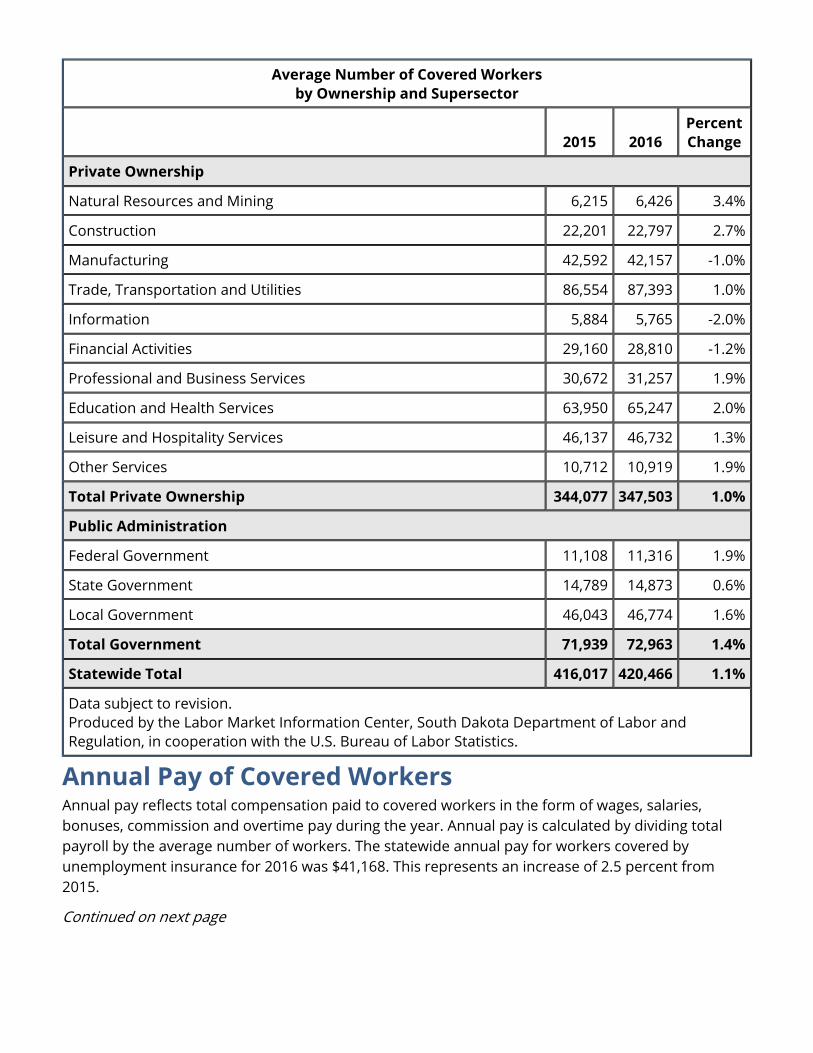
Average Number of Covered Workersby Ownership and Supersector
2015 2016Percent Change
Private Ownership
Natural Resources and Mining 6,215 6,426 3.4%
Construction 22,201 22,797 2.7%
Manufacturing 42,592 42,157 -1.0%
Trade, Transportation and Utilities 86,554 87,393 1.0%
Information 5,884 5,765 -2.0%
Financial Activities 29,160 28,810 -1.2%
Professional and Business Services 30,672 31,257 1.9%
Education and Health Services 63,950 65,247 2.0%
Leisure and Hospitality Services 46,137 46,732 1.3%
Other Services 10,712 10,919 1.9%
Total Private Ownership 344,077 347,503 1.0%
Public Administration
Federal Government 11,108 11,316 1.9%
State Government 14,789 14,873 0.6%
Local Government 46,043 46,774 1.6%
Total Government 71,939 72,963 1.4%
Statewide Total 416,017 420,466 1.1%
Data subject to revision.Produced by the Labor Market Information Center, South Dakota Department of Labor and Regulation, in cooperation with the U.S. Bureau of Labor Statistics.
Annual Pay of Covered WorkersAnnual pay reflects total compensation paid to covered workers in the form of wages, salaries, bonuses, commission and overtime pay during the year. Annual pay is calculated by dividing total payroll by the average number of workers. The statewide annual pay for workers covered by unemployment insurance for 2016 was $41,168. This represents an increase of 2.5 percent from 2015.
Continued on next page
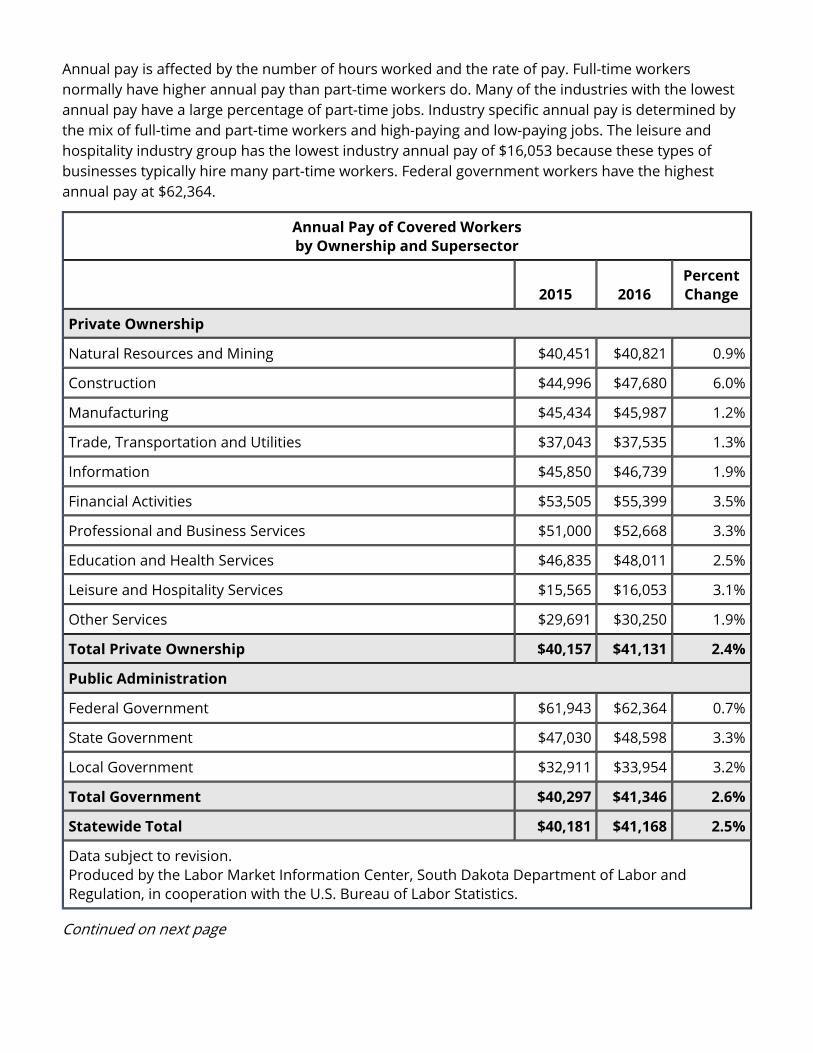
Annual pay is affected by the number of hours worked and the rate of pay. Full-time workers normally have higher annual pay than part-time workers do. Many of the industries with the lowest annual pay have a large percentage of part-time jobs. Industry specific annual pay is determined by the mix of full-time and part-time workers and high-paying and low-paying jobs. The leisure and hospitality industry group has the lowest industry annual pay of $16,053 because these types of businesses typically hire many part-time workers. Federal government workers have the highest annual pay at $62,364.
Annual Pay of Covered Workersby Ownership and Supersector
2015 2016Percent Change
Private Ownership
Natural Resources and Mining $40,451 $40,821 0.9%
Construction $44,996 $47,680 6.0%
Manufacturing $45,434 $45,987 1.2%
Trade, Transportation and Utilities $37,043 $37,535 1.3%
Information $45,850 $46,739 1.9%
Financial Activities $53,505 $55,399 3.5%
Professional and Business Services $51,000 $52,668 3.3%
Education and Health Services $46,835 $48,011 2.5%
Leisure and Hospitality Services $15,565 $16,053 3.1%
Other Services $29,691 $30,250 1.9%
Total Private Ownership $40,157 $41,131 2.4%
Public Administration
Federal Government $61,943 $62,364 0.7%
State Government $47,030 $48,598 3.3%
Local Government $32,911 $33,954 3.2%
Total Government $40,297 $41,346 2.6%
Statewide Total $40,181 $41,168 2.5%
Data subject to revision.Produced by the Labor Market Information Center, South Dakota Department of Labor and Regulation, in cooperation with the U.S. Bureau of Labor Statistics.
Continued on next page
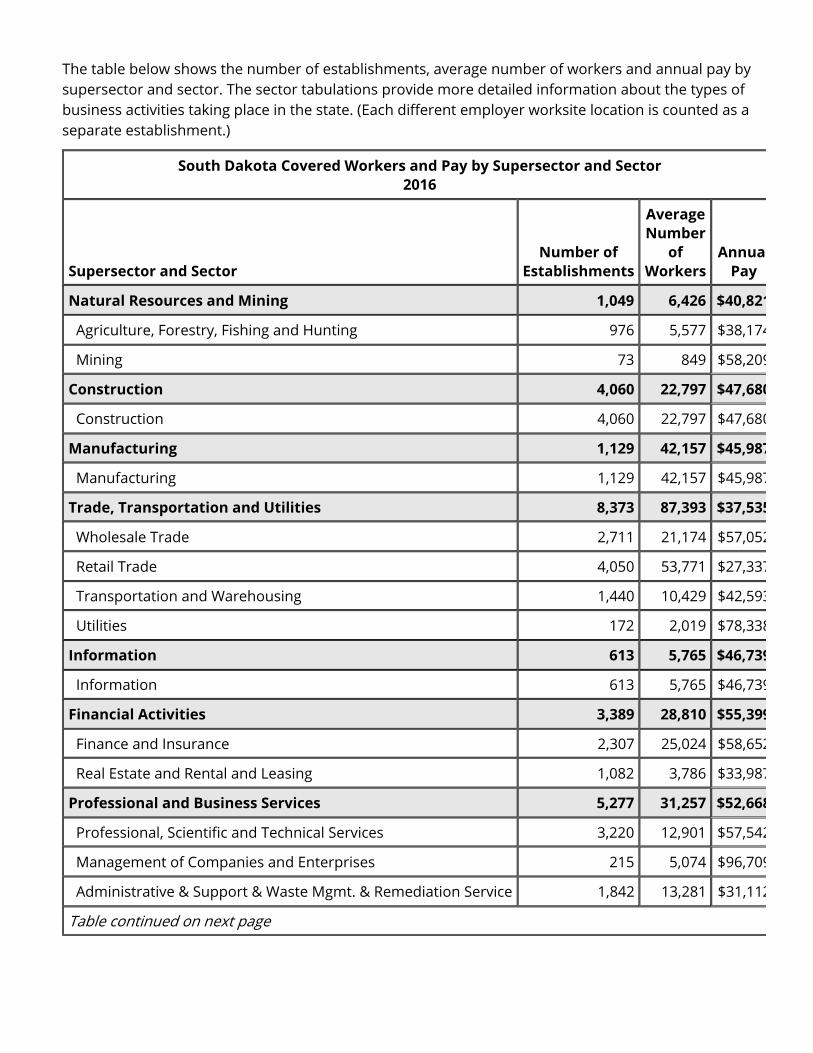
The table below shows the number of establishments, average number of workers and annual pay by supersector and sector. The sector tabulations provide more detailed information about the types of business activities taking place in the state. (Each different employer worksite location is counted as a separate establishment.)
South Dakota Covered Workers and Pay by Supersector and Sector2016
Supersector and SectorNumber of
Establishments
Average Number
of Workers
AnnuaPay
Natural Resources and Mining 1,049 6,426 $40,821
Agriculture, Forestry, Fishing and Hunting 976 5,577 $38,174
Mining 73 849 $58,209
Construction 4,060 22,797 $47,680
Construction 4,060 22,797 $47,680
Manufacturing 1,129 42,157 $45,987
Manufacturing 1,129 42,157 $45,987
Trade, Transportation and Utilities 8,373 87,393 $37,535
Wholesale Trade 2,711 21,174 $57,052
Retail Trade 4,050 53,771 $27,337
Transportation and Warehousing 1,440 10,429 $42,593
Utilities 172 2,019 $78,338
Information 613 5,765 $46,739
Information 613 5,765 $46,739
Financial Activities 3,389 28,810 $55,399
Finance and Insurance 2,307 25,024 $58,652
Real Estate and Rental and Leasing 1,082 3,786 $33,987
Professional and Business Services 5,277 31,257 $52,668
Professional, Scientific and Technical Services 3,220 12,901 $57,542
Management of Companies and Enterprises 215 5,074 $96,709
Administrative & Support & Waste Mgmt. & Remediation Service 1,842 13,281 $31,112
Table continued on next page
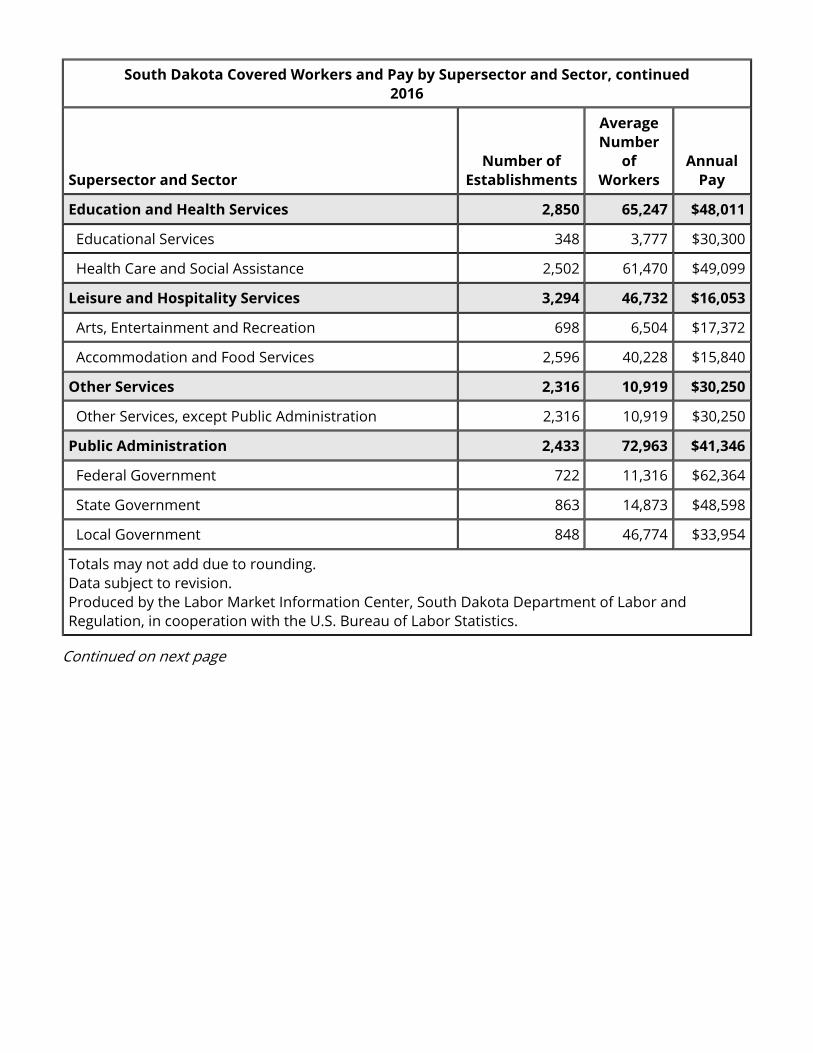
South Dakota Covered Workers and Pay by Supersector and Sector, continued2016
Supersector and SectorNumber of
Establishments
Average Number
of Workers
AnnualPay
Education and Health Services 2,850 65,247 $48,011
Educational Services 348 3,777 $30,300
Health Care and Social Assistance 2,502 61,470 $49,099
Leisure and Hospitality Services 3,294 46,732 $16,053
Arts, Entertainment and Recreation 698 6,504 $17,372
Accommodation and Food Services 2,596 40,228 $15,840
Other Services 2,316 10,919 $30,250
Other Services, except Public Administration 2,316 10,919 $30,250
Public Administration 2,433 72,963 $41,346
Federal Government 722 11,316 $62,364
State Government 863 14,873 $48,598
Local Government 848 46,774 $33,954
Totals may not add due to rounding.Data subject to revision.Produced by the Labor Market Information Center, South Dakota Department of Labor and Regulation, in cooperation with the U.S. Bureau of Labor Statistics.
Continued on next page
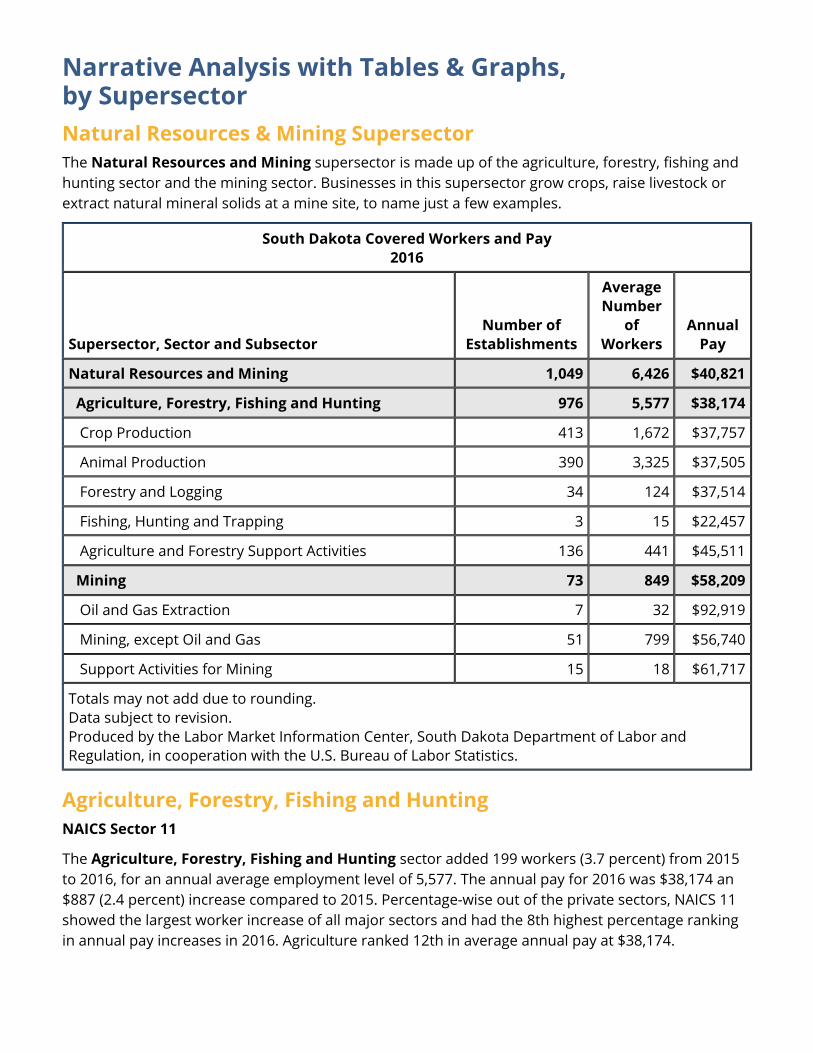
Narrative Analysis with Tables & Graphs,by SupersectorNatural Resources & Mining SupersectorThe Natural Resources and Mining supersector is made up of the agriculture, forestry, fishing and hunting sector and the mining sector. Businesses in this supersector grow crops, raise livestock or extract natural mineral solids at a mine site, to name just a few examples.
South Dakota Covered Workers and Pay2016
Supersector, Sector and SubsectorNumber of
Establishments
Average Number
of Workers
Annual Pay
Natural Resources and Mining 1,049 6,426 $40,821
Agriculture, Forestry, Fishing and Hunting 976 5,577 $38,174
Crop Production 413 1,672 $37,757
Animal Production 390 3,325 $37,505
Forestry and Logging 34 124 $37,514
Fishing, Hunting and Trapping 3 15 $22,457
Agriculture and Forestry Support Activities 136 441 $45,511
Mining 73 849 $58,209
Oil and Gas Extraction 7 32 $92,919
Mining, except Oil and Gas 51 799 $56,740
Support Activities for Mining 15 18 $61,717
Totals may not add due to rounding.Data subject to revision.Produced by the Labor Market Information Center, South Dakota Department of Labor and Regulation, in cooperation with the U.S. Bureau of Labor Statistics.
Agriculture, Forestry, Fishing and HuntingNAICS Sector 11
The Agriculture, Forestry, Fishing and Hunting sector added 199 workers (3.7 percent) from 2015 to 2016, for an annual average employment level of 5,577. The annual pay for 2016 was $38,174 an $887 (2.4 percent) increase compared to 2015. Percentage-wise out of the private sectors, NAICS 11 showed the largest worker increase of all major sectors and had the 8th highest percentage ranking in annual pay increases in 2016. Agriculture ranked 12th in average annual pay at $38,174.
The Agriculture, Forestry, Fishing and Hunting sector includes establishments mainly engaged in growing crops, raising animals, harvesting timber, and harvesting fish and other animals from a farm, ranch, or their natural habitats. The establishments in this sector are often described as farms, ranches, dairies, greenhouses, nurseries, orchards, or hatcheries. A farm may consist of a single tract of land or a number of separate tracts which may be held under different tenures. For example, one tract may be owned by the farm operator and another rented. It may be operated by the operator alone or with the assistance of members of the household or hired employees, or it may be operated by a partnership, corporation, or other type of organization.
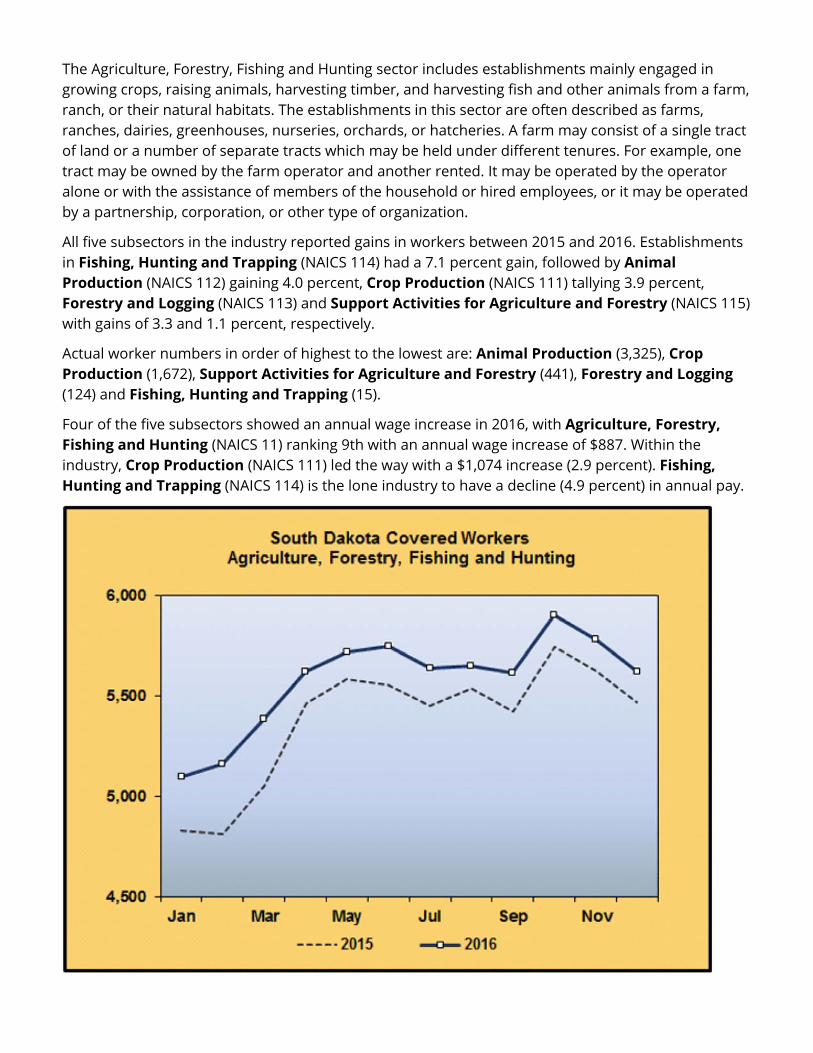
All five subsectors in the industry reported gains in workers between 2015 and 2016. Establishments in Fishing, Hunting and Trapping (NAICS 114) had a 7.1 percent gain, followed by Animal Production (NAICS 112) gaining 4.0 percent, Crop Production (NAICS 111) tallying 3.9 percent, Forestry and Logging (NAICS 113) and Support Activities for Agriculture and Forestry (NAICS 115) with gains of 3.3 and 1.1 percent, respectively.
Actual worker numbers in order of highest to the lowest are: Animal Production (3,325), Crop Production (1,672), Support Activities for Agriculture and Forestry (441), Forestry and Logging(124) and Fishing, Hunting and Trapping (15).
Four of the five subsectors showed an annual wage increase in 2016, with Agriculture, Forestry, Fishing and Hunting (NAICS 11) ranking 9th with an annual wage increase of $887. Within the industry, Crop Production (NAICS 111) led the way with a $1,074 increase (2.9 percent). Fishing, Hunting and Trapping (NAICS 114) is the lone industry to have a decline (4.9 percent) in annual pay.
Actual worker numbers in order of highest to the lowest are: Animal Production (3,198), Crop Production (1,610), Support Activities for Agriculture and Forestry (436), Forestry and Logging (120) and Fishing, Hunting and Trapping (14).
All 22 NAICS sectors showed annual wage increases in 2015. The Agriculture, Forestry, Fishing and Hunting sector ranked 11th with an annual pay increase of $1,141. Within the sector, Fishing, Hunting and Trapping (NAICS 114) led the way with a $3,319 increase (16.4 percent). All five subsectors in Agriculture, Forestry, Fishing and Hunting had annual pay increases in 2015.
Mining, Quarrying, and Oil and Gas ExtractionNAICS Sector 21
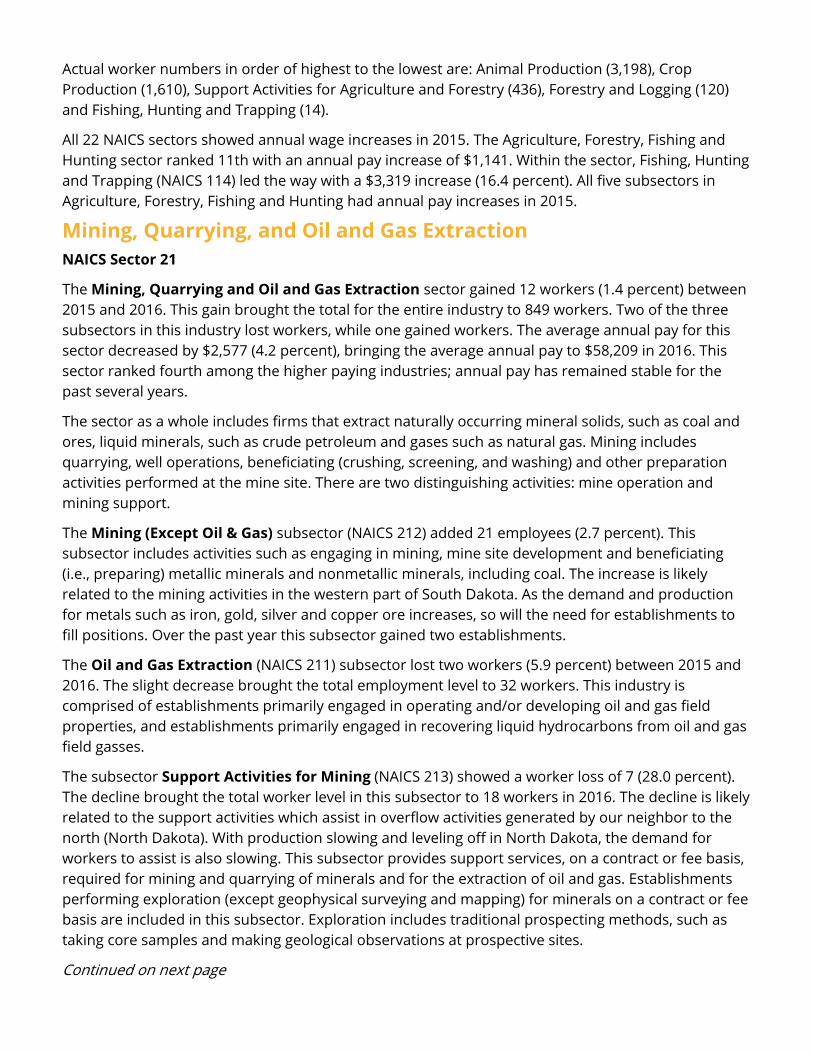
The Mining, Quarrying and Oil and Gas Extraction sector gained 12 workers (1.4 percent) between 2015 and 2016. This gain brought the total for the entire industry to 849 workers. Two of the three subsectors in this industry lost workers, while one gained workers. The average annual pay for this sector decreased by $2,577 (4.2 percent), bringing the average annual pay to $58,209 in 2016. This sector ranked fourth among the higher paying industries; annual pay has remained stable for the past several years.
The sector as a whole includes firms that extract naturally occurring mineral solids, such as coal and ores, liquid minerals, such as crude petroleum and gases such as natural gas. Mining includes quarrying, well operations, beneficiating (crushing, screening, and washing) and other preparation activities performed at the mine site. There are two distinguishing activities: mine operation and mining support.
The Mining (Except Oil & Gas) subsector (NAICS 212) added 21 employees (2.7 percent). This subsector includes activities such as engaging in mining, mine site development and beneficiating (i.e., preparing) metallic minerals and nonmetallic minerals, including coal. The increase is likely related to the mining activities in the western part of South Dakota. As the demand and production for metals such as iron, gold, silver and copper ore increases, so will the need for establishments to fill positions. Over the past year this subsector gained two establishments.
The Oil and Gas Extraction (NAICS 211) subsector lost two workers (5.9 percent) between 2015 and 2016. The slight decrease brought the total employment level to 32 workers. This industry is comprised of establishments primarily engaged in operating and/or developing oil and gas field properties, and establishments primarily engaged in recovering liquid hydrocarbons from oil and gas field gasses.
The subsector Support Activities for Mining (NAICS 213) showed a worker loss of 7 (28.0 percent). The decline brought the total worker level in this subsector to 18 workers in 2016. The decline is likely related to the support activities which assist in overflow activities generated by our neighbor to the north (North Dakota). With production slowing and leveling off in North Dakota, the demand for workers to assist is also slowing. This subsector provides support services, on a contract or fee basis, required for mining and quarrying of minerals and for the extraction of oil and gas. Establishments performing exploration (except geophysical surveying and mapping) for minerals on a contract or fee basis are included in this subsector. Exploration includes traditional prospecting methods, such as taking core samples and making geological observations at prospective sites.
Continued on next page
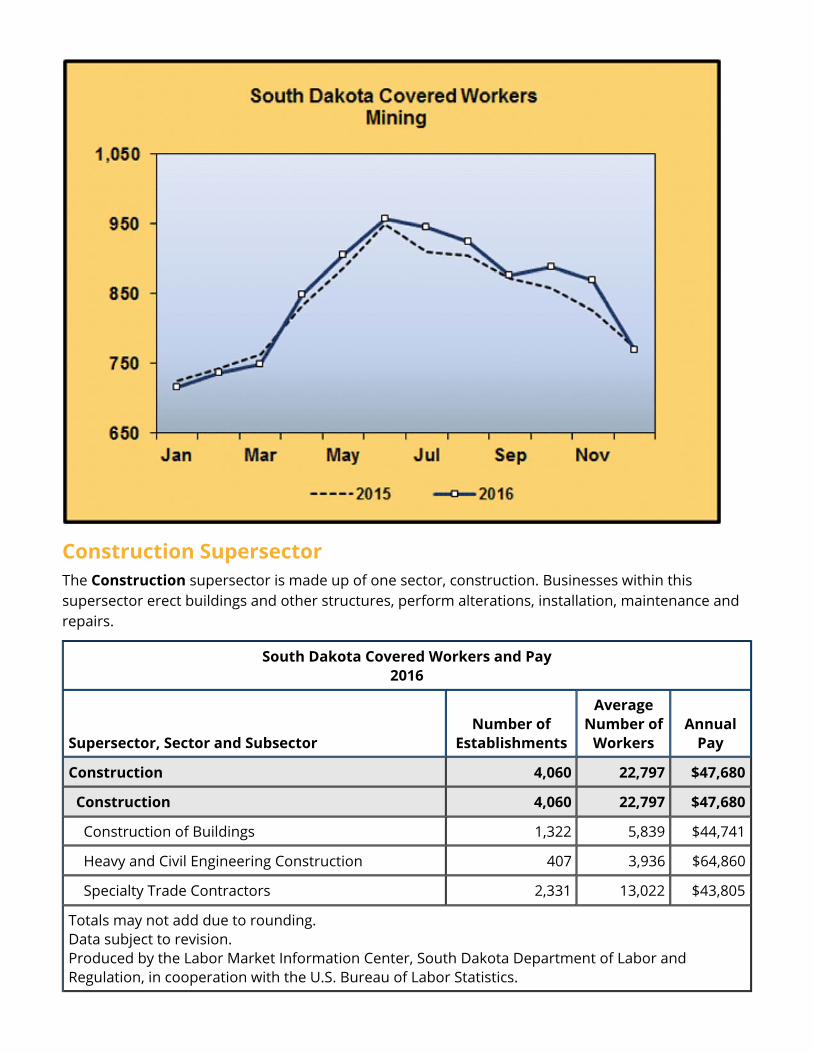
Construction SupersectorThe Construction supersector is made up of one sector, construction. Businesses within this supersector erect buildings and other structures, perform alterations, installation, maintenance and repairs.
South Dakota Covered Workers and Pay2016
Supersector, Sector and SubsectorNumber of
Establishments
Average Number of
WorkersAnnual
Pay
Construction 4,060 22,797 $47,680
Construction 4,060 22,797 $47,680
Construction of Buildings 1,322 5,839 $44,741
Heavy and Civil Engineering Construction 407 3,936 $64,860
Specialty Trade Contractors 2,331 13,022 $43,805
Totals may not add due to rounding.Data subject to revision.Produced by the Labor Market Information Center, South Dakota Department of Labor and Regulation, in cooperation with the U.S. Bureau of Labor Statistics.
ConstructionNAICS Sector 23
The Construction sector is divided into three subsectors:
The Construction of Buildings (NAICS 236) subsector contains establishments that primarily construct new buildings and additions and make alterations to buildings. Work may also include maintenance and repairs. Part or all of the production work may be subcontracted to other construction establishments, such as those dedicated to specialty trades.
The Heavy and Civil Engineering Construction (NAICS 237) subsector includes establishments whose primary activity is the construction of entire engineering projects (e.g. highways). Work may include new construction, additions, alterations or maintenance and repairs. This subsector also includes specialty trade contractors whose primary activity is the production of a specific component for such projects.
The Specialty Trade Contractors (NAICS 238) subsector is defined as establishments whose primary activity is performing specialized activities involved in building construction such as pouring concrete, site preparation, plumbing, painting and electrical work.
The Construction sector built on to its recent annual gains in worker level with an increase of 596 workers in 2016. This 2.7 percent increase placed it fourth among the sectors overall in employment percentage growth (privately owned establishments).The addition of 50 establishments brought Construction’s total to 4,060, enough to surpass Retail Trade for the top spot in privately owned establishments for 2016. The average annual pay for this sector increased to $47,680, which ranked eighth in annual pay among the sectors for 2016. The additional $2,684 equaled a 6.0 percent rise, the greatest percentage increase in pay among the sectors (privately owned establishments).
Annual pay increased in all three subsectors:
The Specialty Trade subsector accounted for the bulk of the establishment increase with its 48 additions. Heavy and Civil Engineering added eight establishments while the Construction of Buildings subsector declined by six.
While Specialty Trade Contractors led the way in establishment increases, employment levels fell by 0.2 percent (27 workers). The majority of the worker increase occurred in the Heavy and Civil Engineering subsector, which added 485 workers (14.1 percent). Four consecutive years of worker growth has stabilized this subsector. The Construction of Buildings subsector added 138 workers (2.4 percent) in 2016.
The overall picture of construction in South Dakota portrays steady worker growth to support infrastructure repair and upgrades as well as the undertaking of new projects.
Construction of Buildings increased by $1,787 (4.2 percent)
Heavy and Civil Engineering increased by $7,576 (13.2 percent)
Specialty Trade increased by $1,167 (2.7 percent)
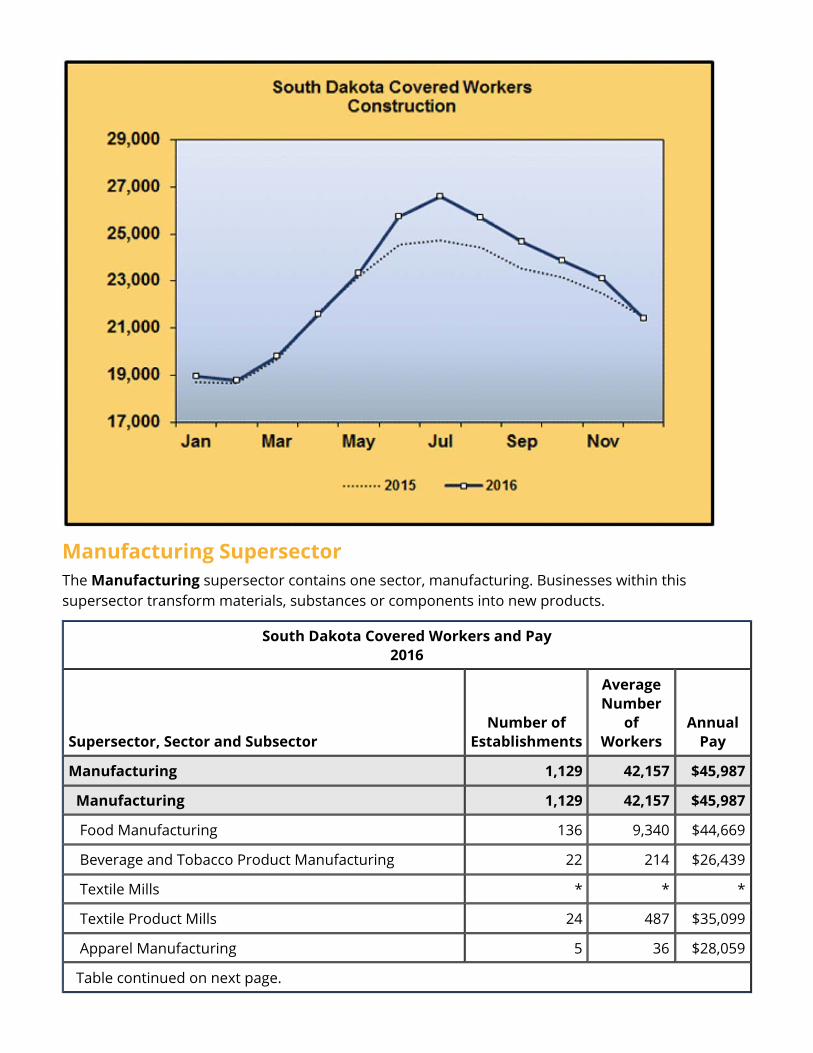
Manufacturing SupersectorThe Manufacturing supersector contains one sector, manufacturing. Businesses within this supersector transform materials, substances or components into new products.
South Dakota Covered Workers and Pay2016
Supersector, Sector and SubsectorNumber of
Establishments
Average Number
of Workers
Annual Pay
Manufacturing 1,129 42,157 $45,987
Manufacturing 1,129 42,157 $45,987
Food Manufacturing 136 9,340 $44,669
Beverage and Tobacco Product Manufacturing 22 214 $26,439
Textile Mills * * *
Textile Product Mills 24 487 $35,099
Apparel Manufacturing 5 36 $28,059
Table continued on next page.
South Dakota Covered Workers and Pay, continued2016
Manfacturing Supersector, Sector and Subsector, continuedNumber of
Establishments
Average Number
of Workers
Annual Pay
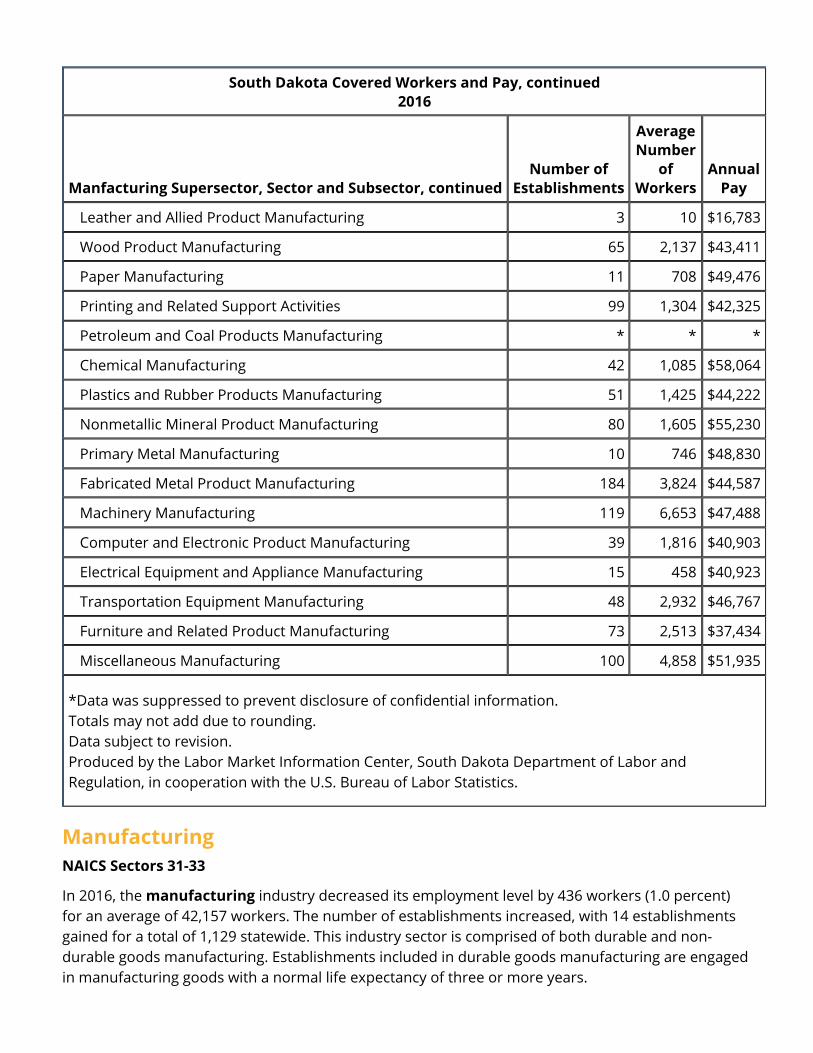
Leather and Allied Product Manufacturing 3 10 $16,783
Wood Product Manufacturing 65 2,137 $43,411
Paper Manufacturing 11 708 $49,476
Printing and Related Support Activities 99 1,304 $42,325
Petroleum and Coal Products Manufacturing * * *
Chemical Manufacturing 42 1,085 $58,064
Plastics and Rubber Products Manufacturing 51 1,425 $44,222
Nonmetallic Mineral Product Manufacturing 80 1,605 $55,230
Primary Metal Manufacturing 10 746 $48,830
Fabricated Metal Product Manufacturing 184 3,824 $44,587
Machinery Manufacturing 119 6,653 $47,488
Computer and Electronic Product Manufacturing 39 1,816 $40,903
Electrical Equipment and Appliance Manufacturing 15 458 $40,923
Transportation Equipment Manufacturing 48 2,932 $46,767
Furniture and Related Product Manufacturing 73 2,513 $37,434
Miscellaneous Manufacturing 100 4,858 $51,935
*Data was suppressed to prevent disclosure of confidential information.Totals may not add due to rounding.Data subject to revision.Produced by the Labor Market Information Center, South Dakota Department of Labor and Regulation, in cooperation with the U.S. Bureau of Labor Statistics.
Manufacturing NAICS Sectors 31-33
In 2016, the manufacturing industry decreased its employment level by 436 workers (1.0 percent) for an average of 42,157 workers. The number of establishments increased, with 14 establishments gained for a total of 1,129 statewide. This industry sector is comprised of both durable and non-durable goods manufacturing. Establishments included in durable goods manufacturing are engaged in manufacturing goods with a normal life expectancy of three or more years.

These items typically consist of higher dollar products, such as machinery, furniture, building materials and electronic equipment. Non-durable goods typically consist of food and beverage products, clothing and paper products.
In 2016, 6 of the 21 industries showed a gain in the number of workers, showing a recovery from the recession. The following industries showed worker gains:
Despite overall gain in workers for this industry, 12 of the 21 manufacturing industry sectors experienced decreased worker levels. Worker loss occurred within the sectors of Machinery Manufacturing (NAICS 333) with 342 workers (4.9 percent), Transportation Equipment Manufacturing (NAICS 336) with 256 workers (8.0 percent), Fabricated Metal Product Manufacturing (NAICS 332) with 215 workers (5.3 percent), Computer and Electronic Product Manufacturing (NAICS 334) with 107 workers (5.6 percent), Plastics and Rubber Products Manufacturing (NAICS 326) with 72 workers (4.8 percent), Paper Manufacturing (NAICS 322) with 59 workers (7.7 percent), Primary Metal Manufacturing (NAICS 331): 38 workers (4.8 percent), Printing and Related Support Activities (NAICS 323) with 25 workers (1.9 percent), Nonmetallic Mineral Product Manufacturing (NAICS 327): 21 workers (1.3 percent), Wood Product Manufacturing (NAICS 321): 21 workers (1.0 percent), Chemical Manufacturing (NAICS 325): 15 workers (1.4 percent), and Apparel Manufacturing (NAICS 315) with 5 workers (12.2 percent). Textile Mills (NAICS 313) remained unchanged from 2015 with five workers, and Leather and Allied Product Manufacturing (NAICS 316) with 10 workers.
The 2016 annual pay for the manufacturing sector was $45,987, an increase of 1.2 percent compared to the 2015 level of $45,433. The manufacturing sector saw an increase in annual pay with 13 of the 21 sectors increasing their annual pay. The following industries had increases in their annual pay:
Food Manufacturing (NAICS 311): 591 workers (6.8 percent)
Textile Product Mills (NAICS 314): 81 workers (20.0 percent)
Beverage and Tobacco Product Manufacturing (NAICS 312): 28 workers (15.1 percent)
Miscellaneous Manufacturing (NAICS 339): 21 workers (0.4 percent)
Furniture and Related Product Manufacturing (NAICS 337): 14 workers (0.6 percent)
Electrical Equipment, Appliance, and Component Manufacturing (NAICS 335): six workers (1.3 percent)
Petroleum and Coal Products Manufacturing (NAICS 324): $24,954 (25.9 percent)
Printing and Related Support Activities (NAICS 323): $1,549 (3.8 percent)
Computer and Electronic Product Manufacturing (NAICS 334): $1,300 (3.3 percent)
Fabricated Metal Product Manufacturing (NAICS 332): $1,175 (2.7 percent)
Plastics and Rubber Products Manufacturing (NAICS 326): $1,155 (2.7 percent)
Food Manufacturing (NAICS 311): $891 (2.0 percent)
Miscellaneous Manufacturing (NAICS 339): $814 (1.6 percent)
The majority of the manufacturing sector had an increase in annual salary. The following eight industries had decreases in their annual pay:
Overall, the manufacturing sector had an increase in the number of workers from 2015 to 2016. The manufacturing sector continues to have an increase in annual pay. The recession has greatly impacted the manufacturing industry in 2009. Data from 2015 and 2016 data shows a continuing recovery in the manufacturing industry.
Continued on next page
Furniture and Related Product Manufacturing (NAICS 337): $673 (1.8 percent)
Paper Manufacturing (NAICS 322): $624 (1.3 percent)
Electrical Equipment, Appliance, and Component Manufacturing (NAICS 335) $535 (1.3 percent)
Machinery Manufacturing (NAICS 333): 494 (1.1 percent)
Wood Product Manufacturing (NAICS 321): $147 (0.3 percent)
Chemical Manufacturing (NAICS 325): $146 (0.3 percent)
Apparel Manufacturing (NAICS 315): $3,502 (11.1 percent)
Textile Mills (NAICS 313): $3,436 (12.1 percent)
Textile Product Mills (NAICS 314): $1,770 (4.8 percent)
Leather and Allied Product Manufacturing (NAICS 316): $1,307 (8.4 percent)
Transportation Equipment Manufacturing (NAICS 336): $390 (0.8 percent)
Beverage and Tobacco Product Manufacturing (NAICS 312): $769 (2.8 percent)
Nonmetallic Mineral Product Manufacturing (NAICS 327): $444 (0.8 percent)
Primary Metal Manufacturing (NAICS 331): $312 (0.6 percent)
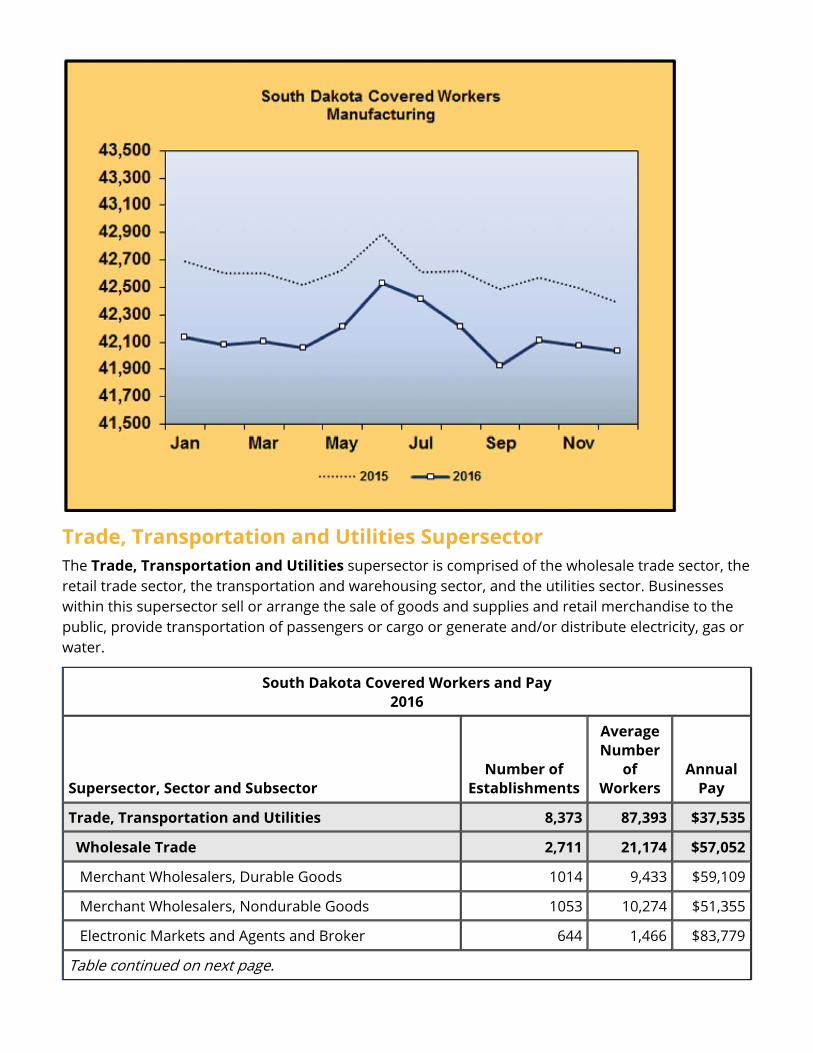
Trade, Transportation and Utilities SupersectorThe Trade, Transportation and Utilities supersector is comprised of the wholesale trade sector, the retail trade sector, the transportation and warehousing sector, and the utilities sector. Businesses within this supersector sell or arrange the sale of goods and supplies and retail merchandise to the public, provide transportation of passengers or cargo or generate and/or distribute electricity, gas or water.
South Dakota Covered Workers and Pay 2016
Supersector, Sector and SubsectorNumber of
Establishments
Average Number
of Workers
Annual Pay
Trade, Transportation and Utilities 8,373 87,393 $37,535
Wholesale Trade 2,711 21,174 $57,052
Merchant Wholesalers, Durable Goods 1014 9,433 $59,109
Merchant Wholesalers, Nondurable Goods 1053 10,274 $51,355
Electronic Markets and Agents and Broker 644 1,466 $83,779
Table continued on next page.
South Dakota Covered Workers and Pay, continued2016
Trade, Transportation and Utilities, continuedNumber of
EstablishmentsAverage Number
of WorkersAnnual
Pay
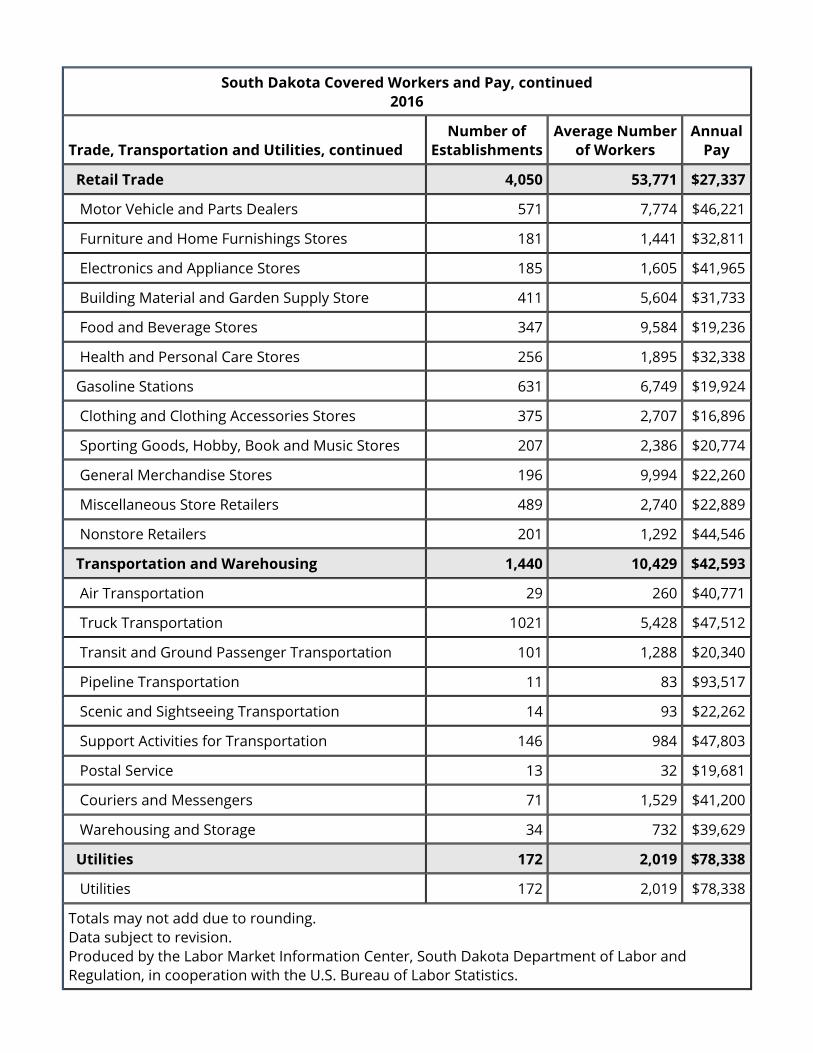
Retail Trade 4,050 53,771 $27,337
Motor Vehicle and Parts Dealers 571 7,774 $46,221
Furniture and Home Furnishings Stores 181 1,441 $32,811
Electronics and Appliance Stores 185 1,605 $41,965
Building Material and Garden Supply Store 411 5,604 $31,733
Food and Beverage Stores 347 9,584 $19,236
Health and Personal Care Stores 256 1,895 $32,338
Gasoline Stations 631 6,749 $19,924
Clothing and Clothing Accessories Stores 375 2,707 $16,896
Sporting Goods, Hobby, Book and Music Stores 207 2,386 $20,774
General Merchandise Stores 196 9,994 $22,260
Miscellaneous Store Retailers 489 2,740 $22,889
Nonstore Retailers 201 1,292 $44,546
Transportation and Warehousing 1,440 10,429 $42,593
Air Transportation 29 260 $40,771
Truck Transportation 1021 5,428 $47,512
Transit and Ground Passenger Transportation 101 1,288 $20,340
Pipeline Transportation 11 83 $93,517
Scenic and Sightseeing Transportation 14 93 $22,262
Support Activities for Transportation 146 984 $47,803
Postal Service 13 32 $19,681
Couriers and Messengers 71 1,529 $41,200
Warehousing and Storage 34 732 $39,629
Utilities 172 2,019 $78,338
Utilities 172 2,019 $78,338
Totals may not add due to rounding.Data subject to revision.Produced by the Labor Market Information Center, South Dakota Department of Labor and Regulation, in cooperation with the U.S. Bureau of Labor Statistics.
Wholesale TradeNAICS Sector 42
The Wholesale Trade sector consists of establishments engaged in wholesaling merchandise and rendering services incidental to merchandise sales. The wholesaling process is an intermediate step in product distribution. Wholesalers sell or arrange the sale of goods for resale, capital or durable non-consumer goods, and raw and intermediate materials and supplies used in production.
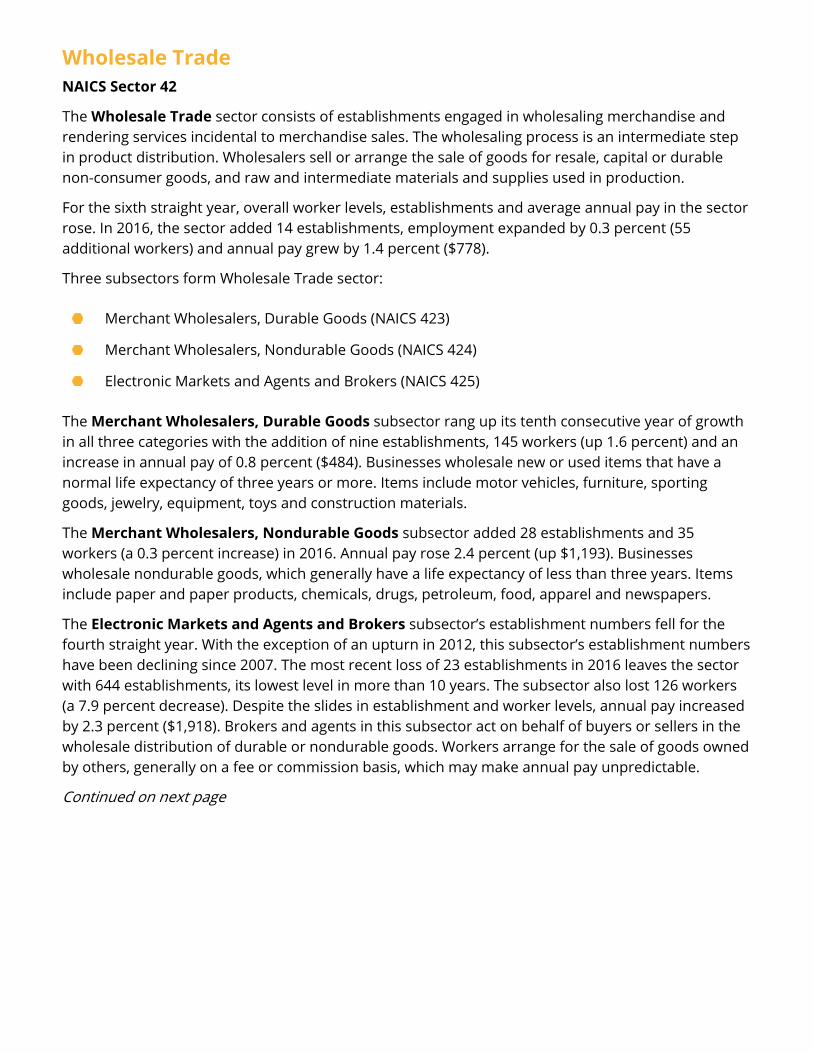
For the sixth straight year, overall worker levels, establishments and average annual pay in the sector rose. In 2016, the sector added 14 establishments, employment expanded by 0.3 percent (55 additional workers) and annual pay grew by 1.4 percent ($778).
Three subsectors form Wholesale Trade sector:
The Merchant Wholesalers, Durable Goods subsector rang up its tenth consecutive year of growth in all three categories with the addition of nine establishments, 145 workers (up 1.6 percent) and an increase in annual pay of 0.8 percent ($484). Businesses wholesale new or used items that have a normal life expectancy of three years or more. Items include motor vehicles, furniture, sporting goods, jewelry, equipment, toys and construction materials.
The Merchant Wholesalers, Nondurable Goods subsector added 28 establishments and 35 workers (a 0.3 percent increase) in 2016. Annual pay rose 2.4 percent (up $1,193). Businesses wholesale nondurable goods, which generally have a life expectancy of less than three years. Items include paper and paper products, chemicals, drugs, petroleum, food, apparel and newspapers.
The Electronic Markets and Agents and Brokers subsector’s establishment numbers fell for the fourth straight year. With the exception of an upturn in 2012, this subsector’s establishment numbers have been declining since 2007. The most recent loss of 23 establishments in 2016 leaves the sector with 644 establishments, its lowest level in more than 10 years. The subsector also lost 126 workers (a 7.9 percent decrease). Despite the slides in establishment and worker levels, annual pay increased by 2.3 percent ($1,918). Brokers and agents in this subsector act on behalf of buyers or sellers in the wholesale distribution of durable or nondurable goods. Workers arrange for the sale of goods owned by others, generally on a fee or commission basis, which may make annual pay unpredictable.
Continued on next page
Merchant Wholesalers, Durable Goods (NAICS 423)
Merchant Wholesalers, Nondurable Goods (NAICS 424)
Electronic Markets and Agents and Brokers (NAICS 425)
Retail Trade NAICS Sectors 44-45
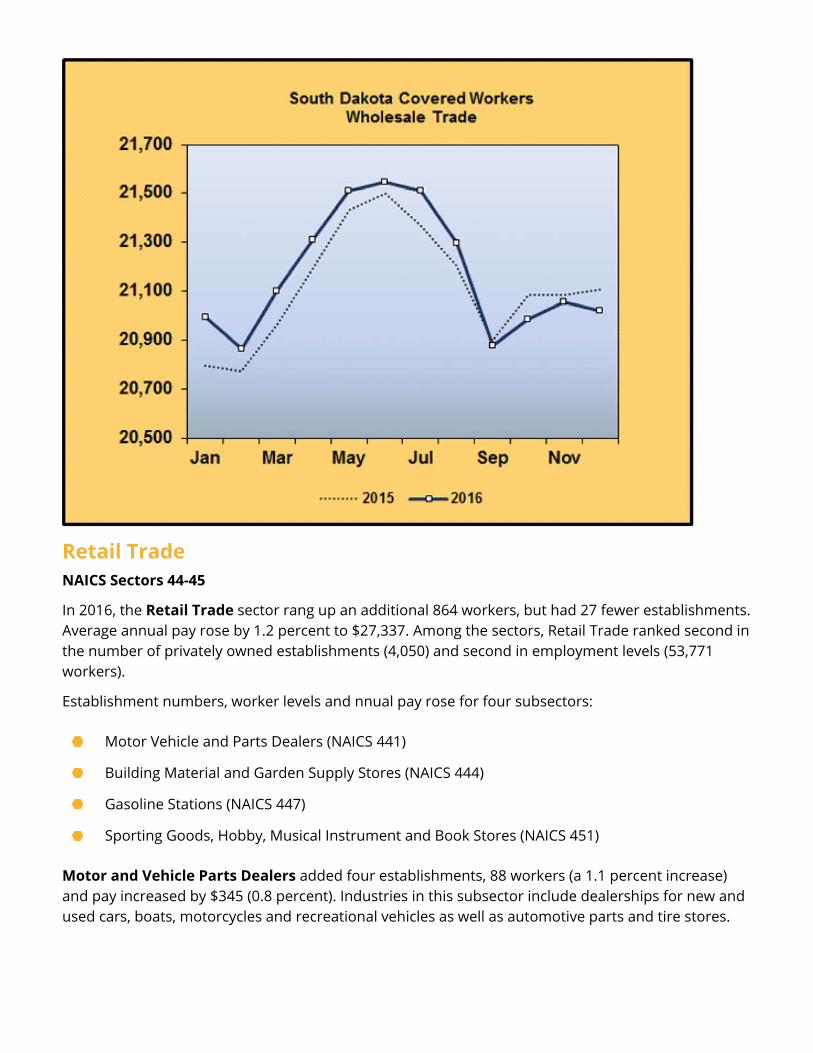
In 2016, the Retail Trade sector rang up an additional 864 workers, but had 27 fewer establishments. Average annual pay rose by 1.2 percent to $27,337. Among the sectors, Retail Trade ranked second in the number of privately owned establishments (4,050) and second in employment levels (53,771 workers).
Establishment numbers, worker levels and nnual pay rose for four subsectors:
Motor and Vehicle Parts Dealers added four establishments, 88 workers (a 1.1 percent increase) and pay increased by $345 (0.8 percent). Industries in this subsector include dealerships for new and used cars, boats, motorcycles and recreational vehicles as well as automotive parts and tire stores.
Motor Vehicle and Parts Dealers (NAICS 441)
Building Material and Garden Supply Stores (NAICS 444)
Gasoline Stations (NAICS 447)
Sporting Goods, Hobby, Musical Instrument and Book Stores (NAICS 451)
Building Material and Garden Supply Stores grew by five establishments, added 71 employees (1.3 percent), and received a $27 bump in annual average pay (a 0.1 percent increase). Establishments include hardware stores, home centers, garden and farm supply stores, nurseries and paint stores.
A gain of 181 employees, the most for any subsectors with increases in all three categories, helped fuel Gasoline Stations’ growth. It surpassed all other Retail Trade subsectors in establishment gains with the addition of 10 establishments. Annual pay rose by $609 (a 3.2 percent increase). Industries in this subsector sell automotive fuels and automotive oils. They may sell these products along with convenience store items.
Sports, Hobby, Music Instrument and Book Stores added two establishments, 10 employees (0.4 percent) and $756 increase in pay (3.8 percent). Establishments include sporting goods, toy, sewing, hobby and bookstores, as well as newsstands.
The remaining Retail Trade subsectors were mixed bags of gains and losses in establishment levels, worker levels and annual pay. None of the subsectors experienced losses in all three areas.
In addition to the subsectors listed above, three others had gains in worker levels and two had gains in establishment levels. Annual pay rose in all but one subsector.
General Merchandise Stores (NAICS 452) and Food and Beverage Stores (NAICS 445), claimed the top two spots in worker growth, each gaining more than 300 employees (3.2 percent and 3.3 percent increases, respectively). Establishment levels fell by 12 for General Merchandise Stores and by four for Food and Beverage Stores. Annual pay increased by about one percent for each of the subsectors. Both of these subsectors usually sell items from a fixed-point-of-sale location. General Merchandise Stores include department stores, warehouse clubs and supercenters, dollar stores and discount department stores. Food and Beverage Stores include grocery stores, specialty food stores and beer, wine and liquor stores.
Clothing and Clothing Accessories Stores (NAICS 448) added 69 employees (a 2.6 percent gain). Establishment levels also rose by four, but annual pay dropped by 0.4 percent ($61 decline). Clothing, shoe, jewelry, luggage and leather goods stores fall within this subsector.
Miscellaneous Store Retailers (NAICS 453) rounded out the subsectors with establishment increases with the addition of three establishments over the year. Worker levels fell by 62 (a 2.2 percent decline), while annual pay inched up $68. Retailers in this subsector include stores with unique characteristics, like florists, used merchandise stores, pet and pet supply stores, art dealers and office supply stores.
Nonstore Retailers (NAICS 454) lost 58 workers (a 4.3 percent decline) and establishments remained unchanged at 201. Annual pay increased by $1,733, the second biggest numerical increase among subsectors. It once again kept its spot as the second-highest paying Retail Trade subsector, behind only Motor and Vehicle Parts Dealers. Nonstore Retailers sell merchandise through infomercials, direct-response advertising, catalogs, door-to-door sales and in-home demonstrations. Establishments include vending machine operations, home delivery sales, party plan sales, street vending (excluding food) and mail order houses.
Continued on next page
Transportation and WarehousingNAICS Sectors 48-49
The Transportation and Warehousing sector includes industries that provide passenger and cargo transportation, warehousing and storage for goods, scenic and sightseeing transportation, and support activities for transportation. It is common for a business in this sector to operate a network of facilities, workers and equipment over a widespread area.
Several subsectors make up the Transportation and Warehousing sector:
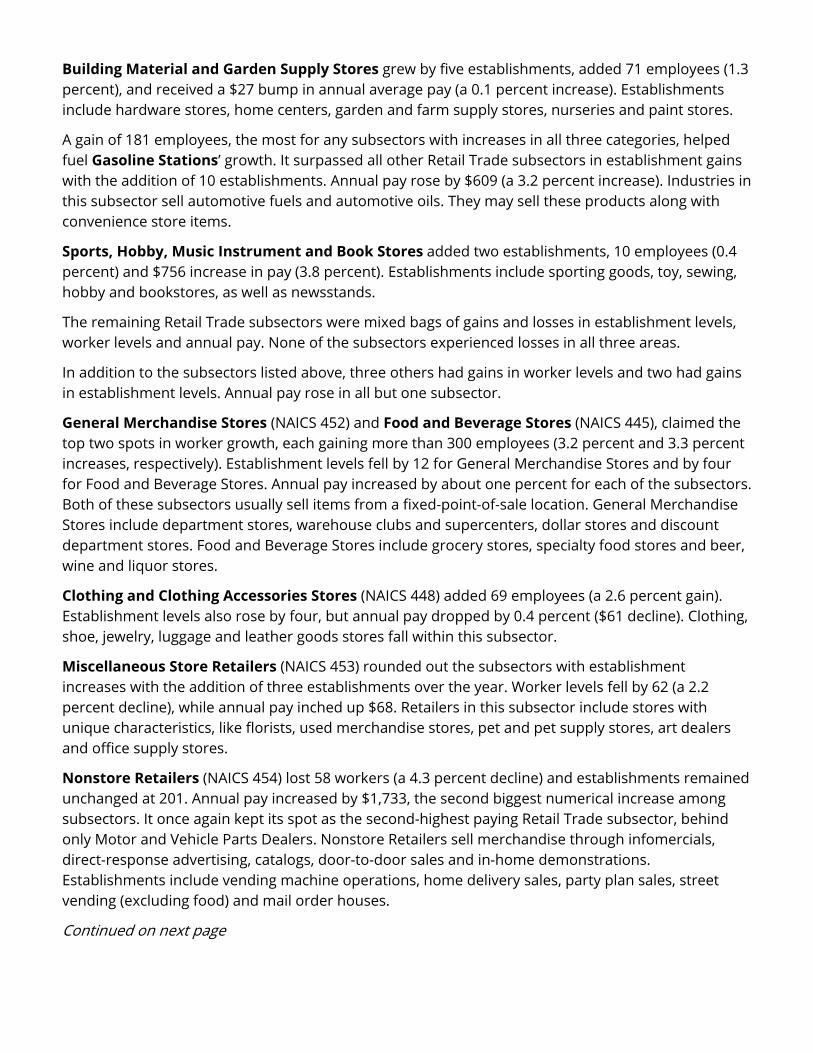
After five years of growth, employment levels in Transportation and Warehousing sector reversed course and dropped by 1.0 percent, down 102 workers from 2015 to 2016. Establishments increased for the second year in a row with the addition of 70 establishments, the second-highest
Each mode of passenger and cargo transportation (i.e. air, rail, water, road and pipeline)
Warehousing and storage
Establishments providing support activities for transportation
Establishments providing passenger transportation for scenic and sightseeing purposes
Postal services and courier services
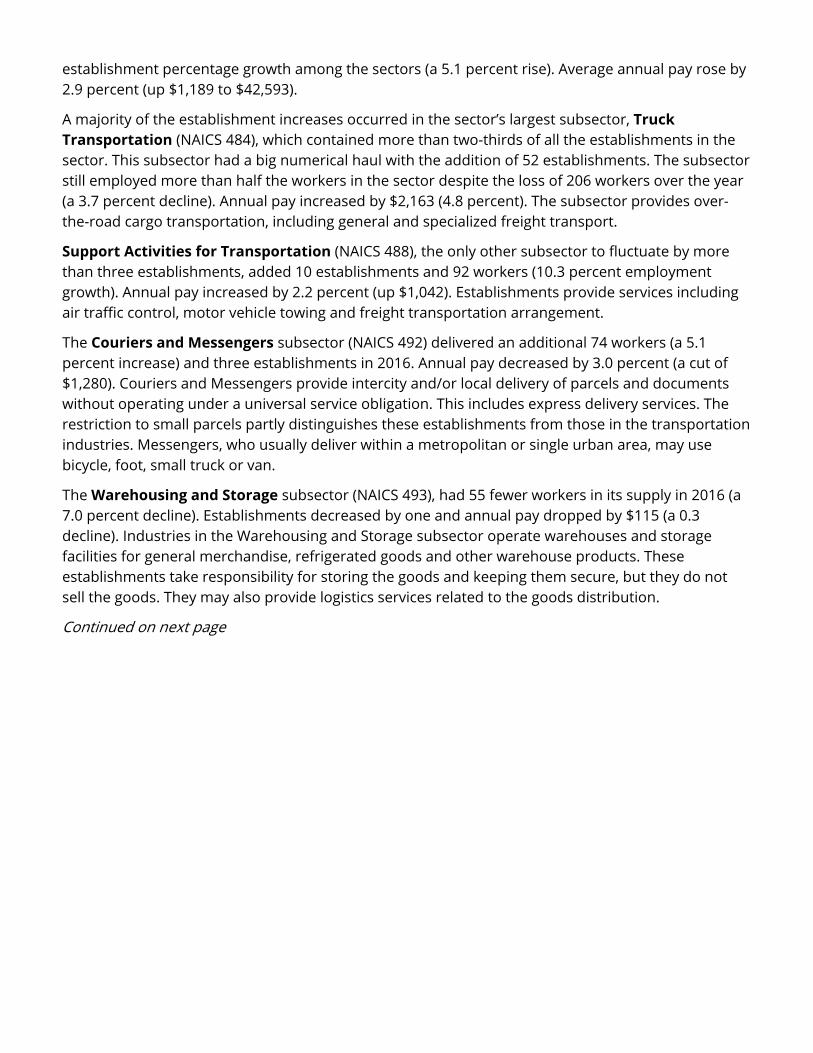
establishment percentage growth among the sectors (a 5.1 percent rise). Average annual pay rose by 2.9 percent (up $1,189 to $42,593).
A majority of the establishment increases occurred in the sector’s largest subsector, Truck Transportation (NAICS 484), which contained more than two-thirds of all the establishments in the sector. This subsector had a big numerical haul with the addition of 52 establishments. The subsector still employed more than half the workers in the sector despite the loss of 206 workers over the year (a 3.7 percent decline). Annual pay increased by $2,163 (4.8 percent). The subsector provides over-the-road cargo transportation, including general and specialized freight transport.
Support Activities for Transportation (NAICS 488), the only other subsector to fluctuate by more than three establishments, added 10 establishments and 92 workers (10.3 percent employment growth). Annual pay increased by 2.2 percent (up $1,042). Establishments provide services including air traffic control, motor vehicle towing and freight transportation arrangement.
The Couriers and Messengers subsector (NAICS 492) delivered an additional 74 workers (a 5.1 percent increase) and three establishments in 2016. Annual pay decreased by 3.0 percent (a cut of $1,280). Couriers and Messengers provide intercity and/or local delivery of parcels and documents without operating under a universal service obligation. This includes express delivery services. The restriction to small parcels partly distinguishes these establishments from those in the transportation industries. Messengers, who usually deliver within a metropolitan or single urban area, may use bicycle, foot, small truck or van.
The Warehousing and Storage subsector (NAICS 493), had 55 fewer workers in its supply in 2016 (a 7.0 percent decline). Establishments decreased by one and annual pay dropped by $115 (a 0.3 decline). Industries in the Warehousing and Storage subsector operate warehouses and storage facilities for general merchandise, refrigerated goods and other warehouse products. These establishments take responsibility for storing the goods and keeping them secure, but they do not sell the goods. They may also provide logistics services related to the goods distribution.
Continued on next page
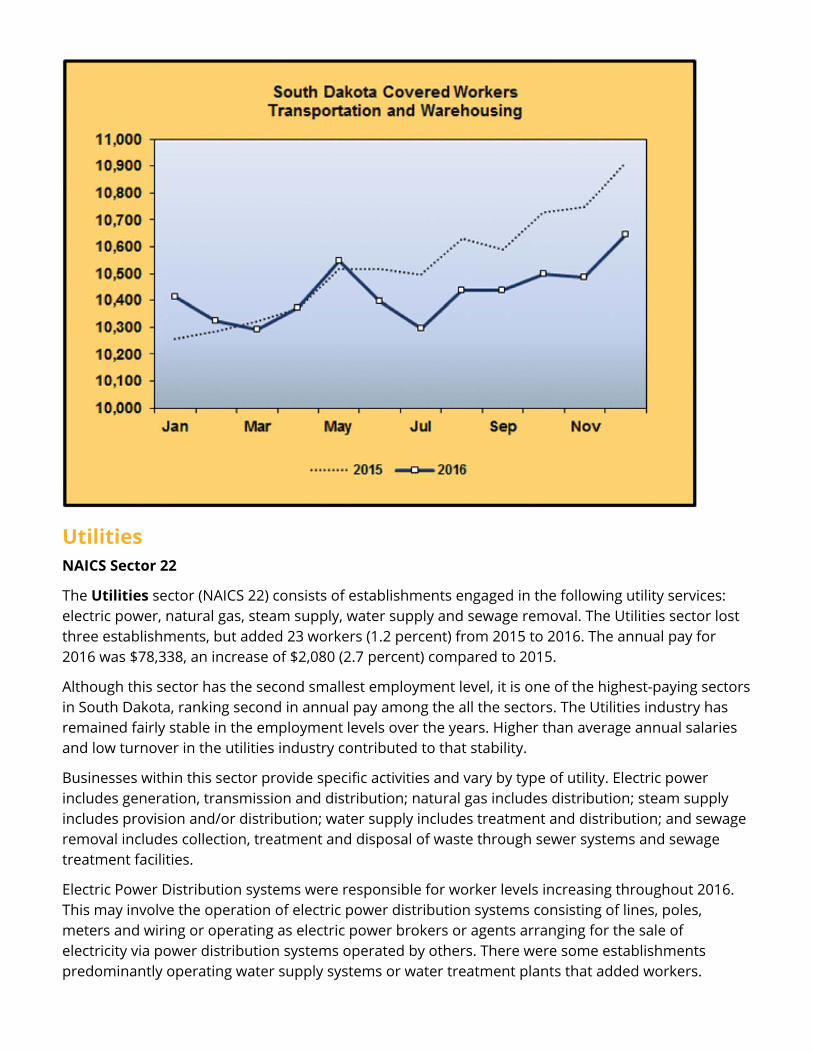
UtilitiesNAICS Sector 22
The Utilities sector (NAICS 22) consists of establishments engaged in the following utility services: electric power, natural gas, steam supply, water supply and sewage removal. The Utilities sector lost three establishments, but added 23 workers (1.2 percent) from 2015 to 2016. The annual pay for 2016 was $78,338, an increase of $2,080 (2.7 percent) compared to 2015.
Although this sector has the second smallest employment level, it is one of the highest-paying sectors in South Dakota, ranking second in annual pay among the all the sectors. The Utilities industry has remained fairly stable in the employment levels over the years. Higher than average annual salaries and low turnover in the utilities industry contributed to that stability.
Businesses within this sector provide specific activities and vary by type of utility. Electric power includes generation, transmission and distribution; natural gas includes distribution; steam supply includes provision and/or distribution; water supply includes treatment and distribution; and sewage removal includes collection, treatment and disposal of waste through sewer systems and sewage treatment facilities.
Electric Power Distribution systems were responsible for worker levels increasing throughout 2016. This may involve the operation of electric power distribution systems consisting of lines, poles, meters and wiring or operating as electric power brokers or agents arranging for the sale of electricity via power distribution systems operated by others. There were some establishments predominantly operating water supply systems or water treatment plants that added workers.
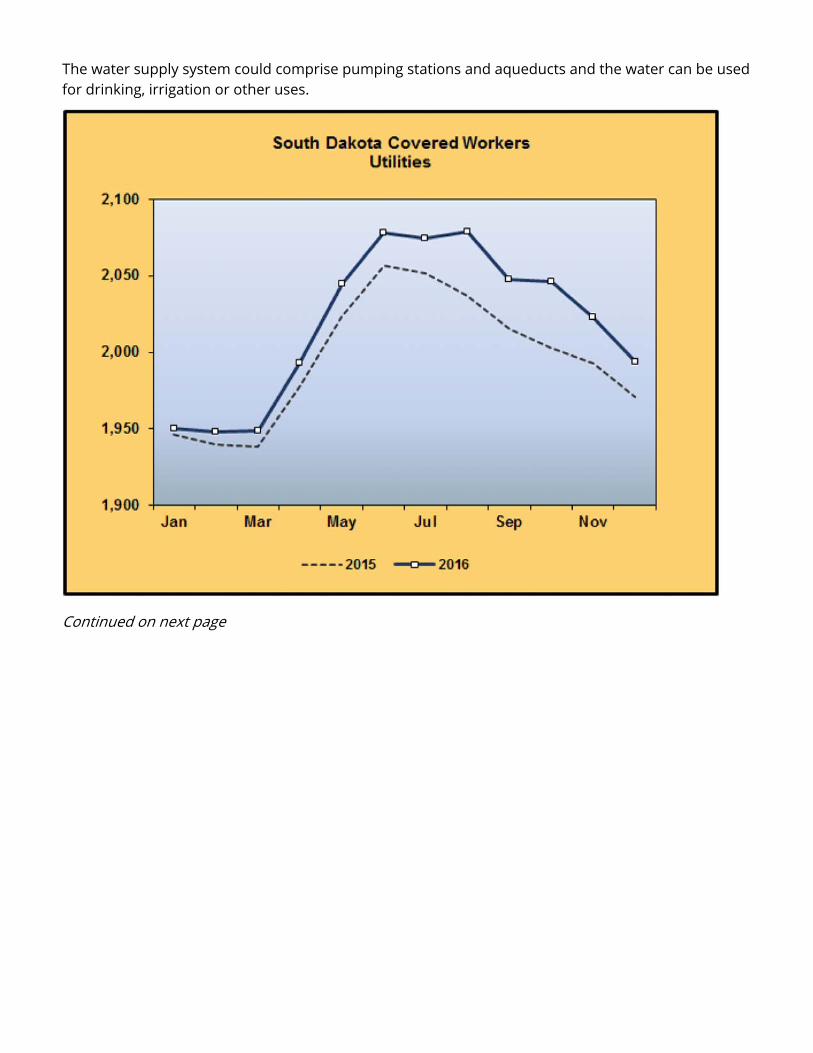
The water supply system could comprise pumping stations and aqueducts and the water can be used for drinking, irrigation or other uses.
Continued on next page
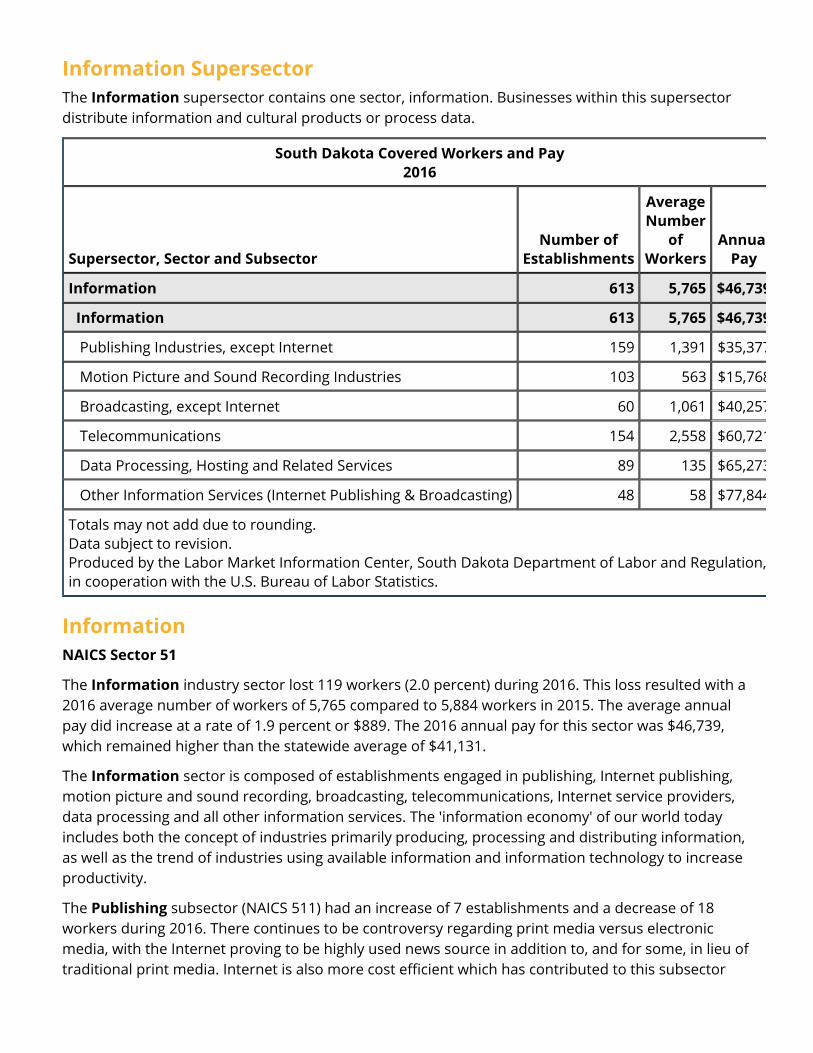
Information SupersectorThe Information supersector contains one sector, information. Businesses within this supersector distribute information and cultural products or process data.
South Dakota Covered Workers and Pay 2016
Supersector, Sector and Subsector Number of
Establishments
Average Number
of Workers
AnnuaPay
Information 613 5,765 $46,739
Information 613 5,765 $46,739
Publishing Industries, except Internet 159 1,391 $35,377
Motion Picture and Sound Recording Industries 103 563 $15,768
Broadcasting, except Internet 60 1,061 $40,257
Telecommunications 154 2,558 $60,721
Data Processing, Hosting and Related Services 89 135 $65,273
Other Information Services (Internet Publishing & Broadcasting) 48 58 $77,844
Totals may not add due to rounding.Data subject to revision.Produced by the Labor Market Information Center, South Dakota Department of Labor and Regulation,in cooperation with the U.S. Bureau of Labor Statistics.
Information NAICS Sector 51
The Information industry sector lost 119 workers (2.0 percent) during 2016. This loss resulted with a 2016 average number of workers of 5,765 compared to 5,884 workers in 2015. The average annual pay did increase at a rate of 1.9 percent or $889. The 2016 annual pay for this sector was $46,739, which remained higher than the statewide average of $41,131.
The Information sector is composed of establishments engaged in publishing, Internet publishing, motion picture and sound recording, broadcasting, telecommunications, Internet service providers, data processing and all other information services. The 'information economy' of our world today includes both the concept of industries primarily producing, processing and distributing information, as well as the trend of industries using available information and information technology to increase productivity.
The Publishing subsector (NAICS 511) had an increase of 7 establishments and a decrease of 18 workers during 2016. There continues to be controversy regarding print media versus electronic media, with the Internet proving to be highly used news source in addition to, and for some, in lieu of traditional print media. Internet is also more cost efficient which has contributed to this subsector

having a decline in workers. This cultural turn of events has led to a steady decline in newspaper circulations across the country, which in turn impacts worker levels in this industry. The annual pay in this industry did increase by 0.2 percent for a 2016 average of $35,377.
The Motion Picture and Sound Recording subsector (NAICS 512) had a decrease of 43 workers for 2016. The annual pay for this industry had an increase of 6.8 percent; for a 2016 average of $15,768 compared to a 2015 average of $14,764. This low pay is indicative of a large number of part-time workers.
Broadcasting (except Internet) (NAICS 515) had a gain of 5 workers (0.5 percent) for a total of 1,061 workers for 2016. The establishments had a gain of 3. There was a decrease in annual pay by 1.2 percent for a 2016 average of $40,257 compared to $40,738 for 2015. This subsector includes radio, television, cable and other subscription programming.
The Telecommunications (NAICS 517) subsector had a decrease of 83 workers (3.1 percent) but had an increase in annual pay. The 2016 average pay was $60,721, which increased 2.8 percent compared to the 2015 pay of $59,062. Total average employment in this subsector was 2,558 for the year 2016. There was a decrease of 6 establishments from 2015.
The Data Processing, Hosting and Related Services (NAICS 518) subsector had an increase, showing a gain of 12 workers (9.8 percent), for a total annual average employment of 135 workers in 2016. The average annual pay for this subsector decreased 1.5 percent for a 2016 average of $65,273 compared to an average of $66,294 in 2015. Industries in this subsector provide the infrastructure for hosting and/or data processing services.
The Other Information Services (NAICS 519) subsector had an increase of 9 workers, or 18.4 percent. Annual pay increased in this subsector by $2,112 (2.8 percent) for a 2016 average of $77,844 compared to the 2015 average of $75,732. The main components of this subsector are news syndicates, libraries, archives, exclusive Internet publishing and/or broadcasting, and Web Search Portals.
Continued on next page
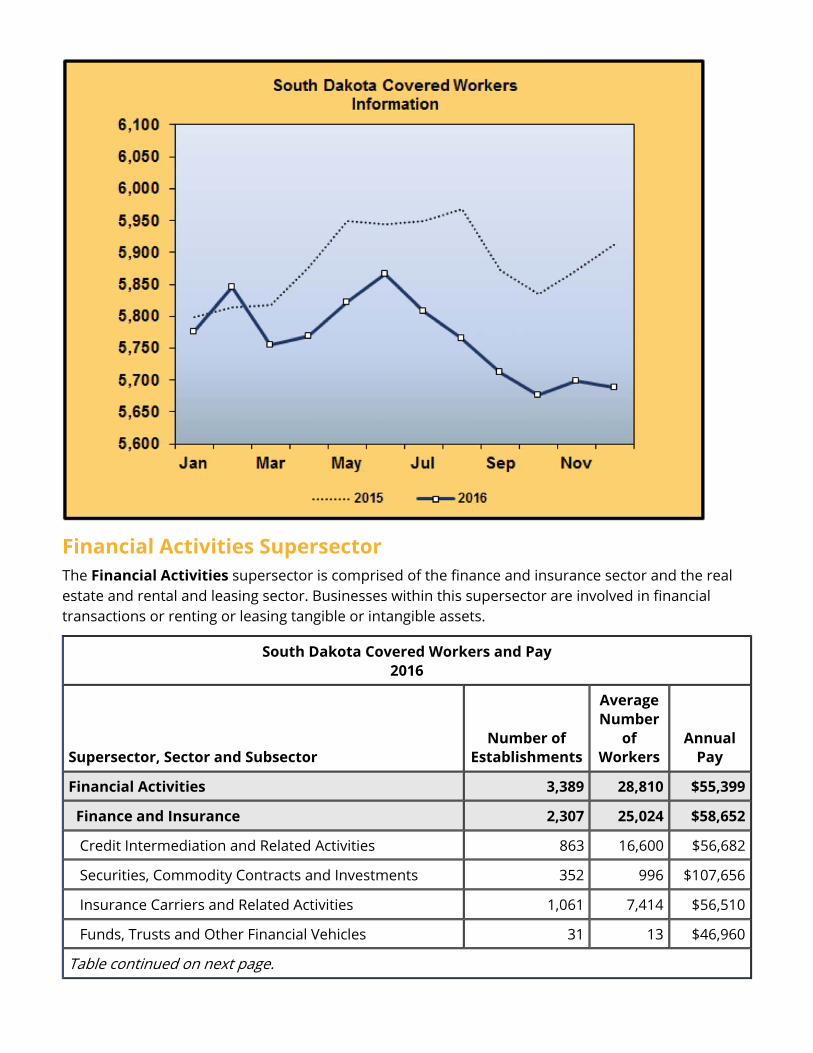
Financial Activities SupersectorThe Financial Activities supersector is comprised of the finance and insurance sector and the real estate and rental and leasing sector. Businesses within this supersector are involved in financial transactions or renting or leasing tangible or intangible assets.
South Dakota Covered Workers and Pay 2016
Supersector, Sector and Subsector Number of
Establishments
Average Number
of Workers
Annual Pay
Financial Activities 3,389 28,810 $55,399
Finance and Insurance 2,307 25,024 $58,652
Credit Intermediation and Related Activities 863 16,600 $56,682
Securities, Commodity Contracts and Investments 352 996 $107,656
Insurance Carriers and Related Activities 1,061 7,414 $56,510
Funds, Trusts and Other Financial Vehicles 31 13 $46,960
Table continued on next page.
South Dakota Covered Workers and Pay, continued2016
Financial Activities, continuedNumber of
Establishments
Average Number of
WorkersAnnual
Pay
Real Estate and Rental and Leasing 1,082 3,786 $33,897
Real Estate 912 2,840 $33,148
Rental and Leasing Services 163 902 $35,242
Lessors of Nonfinancial Intangible Assets 7 44 $54,610
Totals may not add due to rounding.Data subject to revision.Produced by the Labor Market Information Center, South Dakota Department of Labor and Regulation, in cooperation with the U.S. Bureau of Labor Statistics.
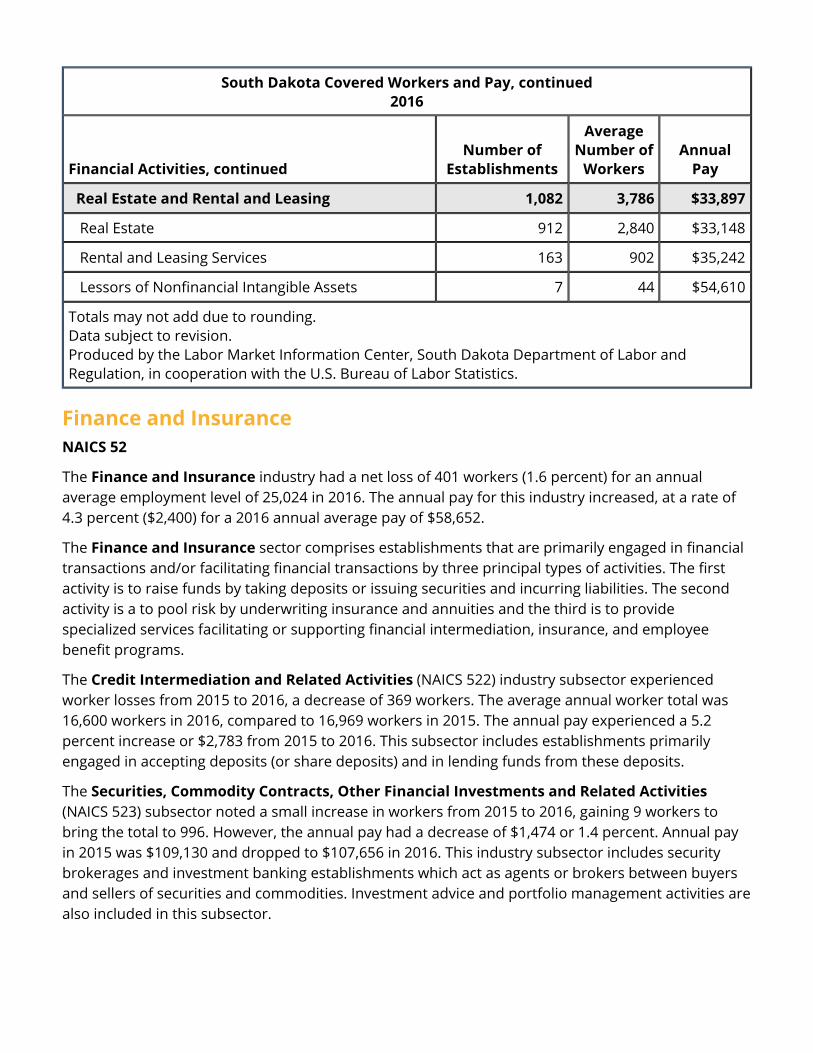
Finance and InsuranceNAICS 52
The Finance and Insurance industry had a net loss of 401 workers (1.6 percent) for an annual average employment level of 25,024 in 2016. The annual pay for this industry increased, at a rate of 4.3 percent ($2,400) for a 2016 annual average pay of $58,652.
The Finance and Insurance sector comprises establishments that are primarily engaged in financial transactions and/or facilitating financial transactions by three principal types of activities. The first activity is to raise funds by taking deposits or issuing securities and incurring liabilities. The second activity is a to pool risk by underwriting insurance and annuities and the third is to provide specialized services facilitating or supporting financial intermediation, insurance, and employee benefit programs.
The Credit Intermediation and Related Activities (NAICS 522) industry subsector experienced worker losses from 2015 to 2016, a decrease of 369 workers. The average annual worker total was 16,600 workers in 2016, compared to 16,969 workers in 2015. The annual pay experienced a 5.2 percent increase or $2,783 from 2015 to 2016. This subsector includes establishments primarily engaged in accepting deposits (or share deposits) and in lending funds from these deposits.
The Securities, Commodity Contracts, Other Financial Investments and Related Activities(NAICS 523) subsector noted a small increase in workers from 2015 to 2016, gaining 9 workers to bring the total to 996. However, the annual pay had a decrease of $1,474 or 1.4 percent. Annual pay in 2015 was $109,130 and dropped to $107,656 in 2016. This industry subsector includes security brokerages and investment banking establishments which act as agents or brokers between buyers and sellers of securities and commodities. Investment advice and portfolio management activities are also included in this subsector.
The number of workers in the Insurance Carriers and Related Activities (NAICS 524) subsector decreased by 45 workers (or 0.6 percent) which brings the total number of workers to 7,414 for 2016. There was an increase in annual pay of $1,929 or 3.5 percent. Annual pay for 2015 was $54,581 and increased to $56,510 in 2016. This subsector includes establishments involved in selling annuities and insurance policies, and providing employee benefits such as claims adjusting and third party administration.
The Funds, Trusts, and Other Financial Vehicles (NAICS 525) subsector experienced an increase of 4 workers in 2016 to a level of 13. This subsector experienced a significant decrease in annual pay of $39,137 or 45.5 percent. Total annual pay in 2015 was $86,097 and decreased to $46,960 for 2016. This sector includes insurance and employee benefit funds and other investment pools and funds.
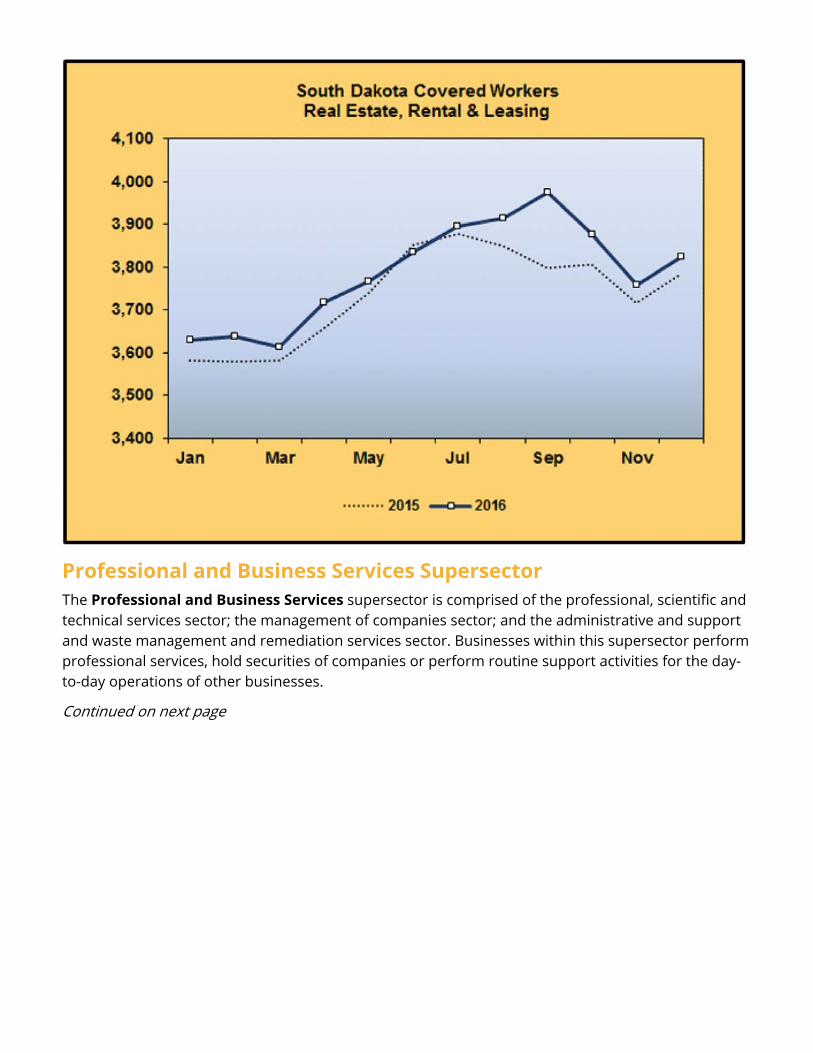
Real Estate and Rental and LeasingNAICS Sector 53
The Real Estate and Rental and Leasing industry experienced a worker gain from 2015 to 2016, increasing by 51 workers (1.4 percent) for a total of 3,786 workers. This industry showed negative pay growth for the same time period, decreasing by $904 (-2.6 percent) for an annual average pay of $33,897.
This industry sector is comprised of three subsectors: Real Estate (NAICS 531); Rental and Leasing Services (NAICS 532); and Lessors of Nonfinancial Intangible Assets (NAICS 533). The majority of workers in this industry, approximately 75 percent, are employed in the real estate subsector.
The Real Estate subsector had a positive worker change from 2015 to 2016. The net gain of jobs totaled 61 workers, an increase of 2.2 percent. Annual average pay weakened (-3.8 percent) to arrive at a new annual average of $33,148. Industries in the Real Estate subsector group are primarily engaged in the following activities:
Activities Related to Real Estate were responsible for the majority of worker gains within the real estate subsector. This industry is comprised of establishments primarily engaged in providing real estate services except lessors of real estate and offices of real estate agents and brokers. This industry group has establishments involved in activities such as managing real estate for others and appraising real estate. Residential property management such as apartments and condominiums are within this grouping. Small increases in the work force for nonresidential property managers were noted.
Worker loss occurred in the industry subsector Rental and Leasing Services. A decrease of 14 workers (-1.5 percent) was realized in 2016. Annual pay rose, with an increase of $243 (0.7 percent). Consumer goods rental such as electronics equipment and appliances are included in this industry. Some worker loss was offset by gains in automotive equipment rental. These establishments generally operate from a retail-like facility. Some establishments offer only short-term rental, others only longer term leases and some provide both types of services. There were some small gains of workers within general rental centers and commercial and industrial machinery and equipment rental area.
Worker levels in the Lessors of Nonfinancial Intangible Assets subsector increased during 2016, with a gain of four workers. This subsector has small representation in terms of total workers. Businesses in this subsector own patents, trademarks and franchise agreements which they allow others to use or reproduce for a fee; they may or may not have created those assets. Establishments which provide brand name licensing, franchise agreements, industrial design licensing, patent buying and licensing, and trademark licensing belong in this industry. Oil royalty leasing also is grouped in this subsector.
Continued on next page
Renting or leasing real estate to others
Managing real estate for others
Selling, buying or renting real estate for others
Providing other services, such as listing services, appraisal, consulting or escrow services
Professional and Business Services SupersectorThe Professional and Business Services supersector is comprised of the professional, scientific and technical services sector; the management of companies sector; and the administrative and support and waste management and remediation services sector. Businesses within this supersector perform professional services, hold securities of companies or perform routine support activities for the day-to-day operations of other businesses.
Continued on next page
South Dakota Covered Workers and Pay2016
Supersector, Sector and Subsector Number of
Establishments
Average Number
of Workers
Annual Pay
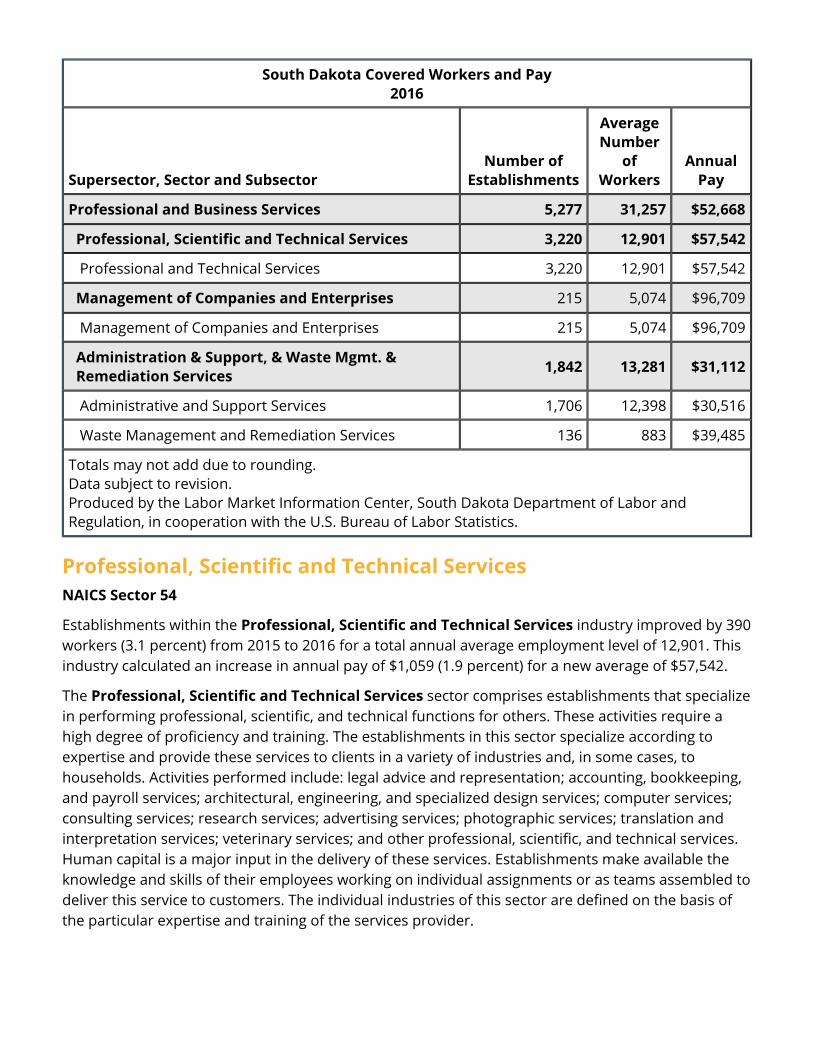
Professional and Business Services 5,277 31,257 $52,668
Professional, Scientific and Technical Services 3,220 12,901 $57,542
Professional and Technical Services 3,220 12,901 $57,542
Management of Companies and Enterprises 215 5,074 $96,709
Management of Companies and Enterprises 215 5,074 $96,709
Administration & Support, & Waste Mgmt. & Remediation Services 1,842 13,281 $31,112
Administrative and Support Services 1,706 12,398 $30,516
Waste Management and Remediation Services 136 883 $39,485
Totals may not add due to rounding.Data subject to revision.Produced by the Labor Market Information Center, South Dakota Department of Labor and Regulation, in cooperation with the U.S. Bureau of Labor Statistics.
Professional, Scientific and Technical Services NAICS Sector 54
Establishments within the Professional, Scientific and Technical Services industry improved by 390 workers (3.1 percent) from 2015 to 2016 for a total annual average employment level of 12,901. This industry calculated an increase in annual pay of $1,059 (1.9 percent) for a new average of $57,542.
The Professional, Scientific and Technical Services sector comprises establishments that specialize in performing professional, scientific, and technical functions for others. These activities require a high degree of proficiency and training. The establishments in this sector specialize according to expertise and provide these services to clients in a variety of industries and, in some cases, to households. Activities performed include: legal advice and representation; accounting, bookkeeping, and payroll services; architectural, engineering, and specialized design services; computer services; consulting services; research services; advertising services; photographic services; translation and interpretation services; veterinary services; and other professional, scientific, and technical services. Human capital is a major input in the delivery of these services. Establishments make available the knowledge and skills of their employees working on individual assignments or as teams assembled to deliver this service to customers. The individual industries of this sector are defined on the basis of the particular expertise and training of the services provider.
The unique feature of the Professional, Scientific and Technical Services subsector is the fact that most of the industries grouped in it have production processes that are almost solely reliant on worker skills. In most of these industries, equipment and materials are not of major importance. Thus, the establishments classified in this subsector sell expertise. Much of the expertise requires degrees, though not in every case.
Some industries in this group have close ties to the goods sector, with construction, manufacturing and mining being among their most important clients. However, their clients also include governments and other industries in the service sector. Others have a more broadly based clientele, including both businesses and households as their customers.
Several establishments within the Professional, Scientific and Technical Services industry subsector (NAICS 541) experienced worker increases during 2016. The following industry groups all had increased worker levels from 2015 to 2016:
Some of the gains in worker levels for Computer Systems Design and Related Services can be attributed to establishments engaged in planning and designing systems that integrate computer hardware, software and communication technologies. These establishments often install the system, and train and support users of the system. Computer hardware and software consulting businesses belong in this category.
Accounting, Tax Preparation, Bookkeeping and Payroll Services experienced employment gains throughout 2016. These establishments perform auditing on accounting records of public and private organizations, design accounting systems, develop budgets, and prepare tax returns and process payrolls. Offices of certified public accountants (CPAs) may provide these accounting services.
As has been the trend, increases in the number of workers within the Architectural, Engineering and Related Services was mainly focused within engineering services. These establishments are primarily engaged in applying physical laws and principles of engineering in the design, development and utilization of machines, materials, instruments, structures, processes and systems. Additional worker levels were acknowledged within testing laboratories where establishments conduct analytical testing services in laboratories or on-site. Surveying and mapping services gained workers as they examine surfaces of the earth, including the sea floor.
Legal Services (NAICS 5411)
Accounting, Tax Preparation, Bookkeeping and Payroll Services (NAICS 5412)
Architectural, Engineering and Related Services (NAICS 5413)
Specialized Design Services (NAICS 5414)
Computer Systems Design and Related Services (NAICS 5415)
Management, Scientific, and Technical Consulting Services (5416)
Scientific Research and Development Services (NAICS 5417)
Other Professional, Scientific and Technical Services (NAICS 5419)

Scientific Research and Development Services realized worker gains in 2016. Biotechnology companies conducting research and experimental development expanded due to the demand for their services.
Other Professional, Scientific and Technical Services experienced employment gains during 2016. Veterinary offices and hospitals licensed to practice medicine, dentistry and surgeries for animals had positive worker levels. Livestock inspecting and testing services and pet hospitals are included in this category.
There was one area experiencing some worker loss during 2016. The expertise provided within this sector includes a range of diverse industries, including Advertising, Public Relations and Related Services (NAICS 5418). Reclassification of workers caused a shift in worker levels for Advertising, Public Relations and Related Services. These workers are now part of credit intermediation services. Based on new information and business activity they were re-classified.
Although these industry groups suffered worker losses or shifts in the way they are grouped, the sector as a whole increased in worker levels. There is still a correlation to the continued consumer demand for the specialized services which it offers.
Continued on next page
Management of Companies and EnterprisesNAICS Sector 55
Establishments in this sector hold companies’ securities. They own a controlling interest and can influence management decisions. This sector also includes companies that normally handle the strategic or organizational planning and decision-making on behalf of other companies. The majority of the workers are in high-level management positions.
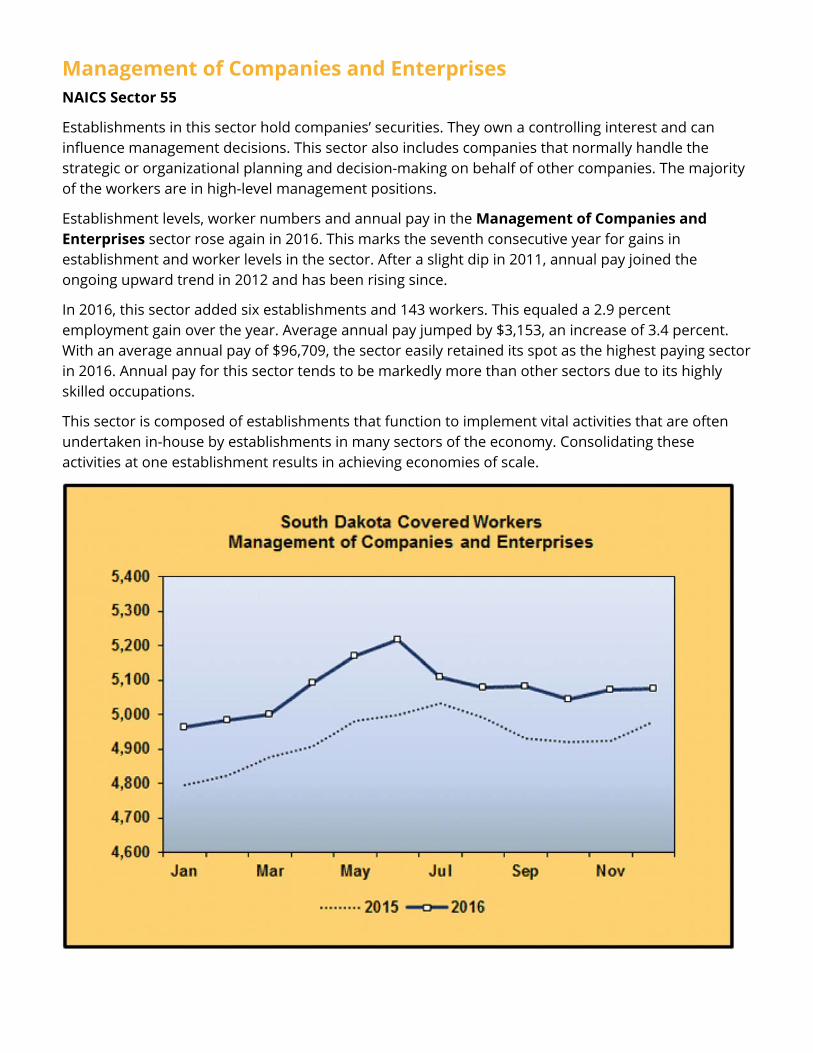
Establishment levels, worker numbers and annual pay in the Management of Companies and Enterprises sector rose again in 2016. This marks the seventh consecutive year for gains in establishment and worker levels in the sector. After a slight dip in 2011, annual pay joined the ongoing upward trend in 2012 and has been rising since.
In 2016, this sector added six establishments and 143 workers. This equaled a 2.9 percent employment gain over the year. Average annual pay jumped by $3,153, an increase of 3.4 percent. With an average annual pay of $96,709, the sector easily retained its spot as the highest paying sector in 2016. Annual pay for this sector tends to be markedly more than other sectors due to its highly skilled occupations.
This sector is composed of establishments that function to implement vital activities that are often undertaken in-house by establishments in many sectors of the economy. Consolidating these activities at one establishment results in achieving economies of scale.
Administrative and Support, Waste Management and Remediation ServicesNAICS Sector 56
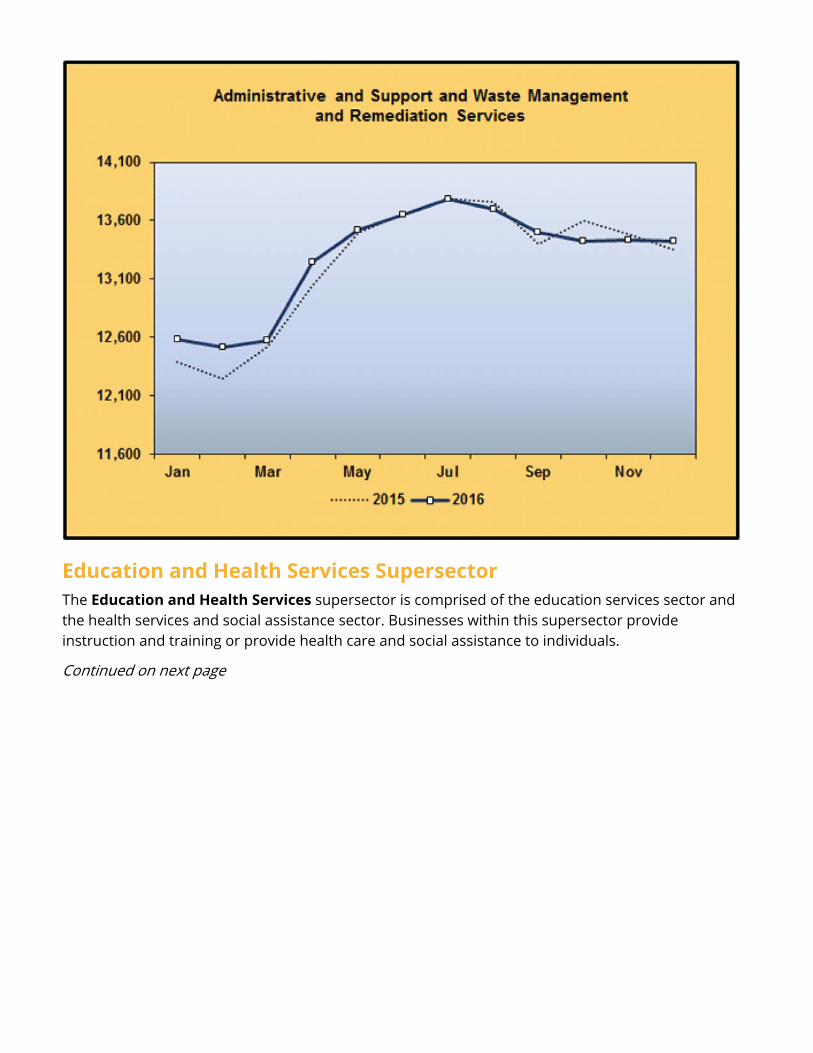
The average number of workers in the Administrative and Support, Waste Management and Remediation Services industry increased 0.4 percent from 2015 to 2016. Employment gains of 50 raised the industry to a new level, with an annual average of 13,281 in 2016. The annual pay for this sector increased $1,160 (3.9 percent) for an average of $31,112 in 2016.
The Administration and Support Services (NAICS 561) subsector had the greatest percentage of workers in this sector and was responsible for small worker increases. Most of these workers were employed by businesses engaged in performing activities to buildings and dwellings. Landscaping establishments providing care and maintenance for trees, lawns and gardens along with designing of walkways, decks and fences contributed to the employment expansion.
Job growth occurred within this same subsector in those establishments involved in office administration services. This industry comprises establishments primarily engaged in providing a range of day to day office functions such as financial planning, billing and recordkeeping. These establishments do not provide operating staff to carry out the complete operations of a business.
Travel arrangement and reservation services suffered worker loss during 2016. Airline, car rental, hotel, and restaurant reservation services are all categorized in this subsector and are seeing a decline for their assistance. Consumers with Internet and smartphone technology options available are becoming their own agent by crafting their own travel arrangements.
Job losses were felt for establishments engaged in providing employment services which include manpower pools and executive search services. Although temporary help agencies and labor pools, which normally provide businesses with supplemental staffing showed some loss of workers, demand still exists for employment placement services. These establishments are involved in listing employment vacancies and in referring or placing applicants for employment. Nurse and teacher registries are examples belonging in this category. These services continue to be an important and practical labor supply strategy for employers all across South Dakota who benefit from the specialized day-to-day services provided by them. Executive search, recruitment and placement services for clients with specific executive and senior management position requirements had an expansion of workers.
The number of workers in the Waste Management and Remediation Services (NAICS 562) subsector improved (48 workers or 5.7 percent) for a 2016 average worker level of 883. The annual pay showed a gain of $1,088 (2.8 percent) for an annual average of $39,485. Establishments included in this subsector which showed worker gains collect, treat and dispose hazardous or nonhazardous waste materials. Establishments comprising solid waste collection and hauling and collecting and hauling recyclable materials were contributors to worker additions. Businesses engaged in environmental remediation services and cleanup of contaminated buildings, mine sites, soil or ground water increased worker levels throughout 2016.
Continued on next page
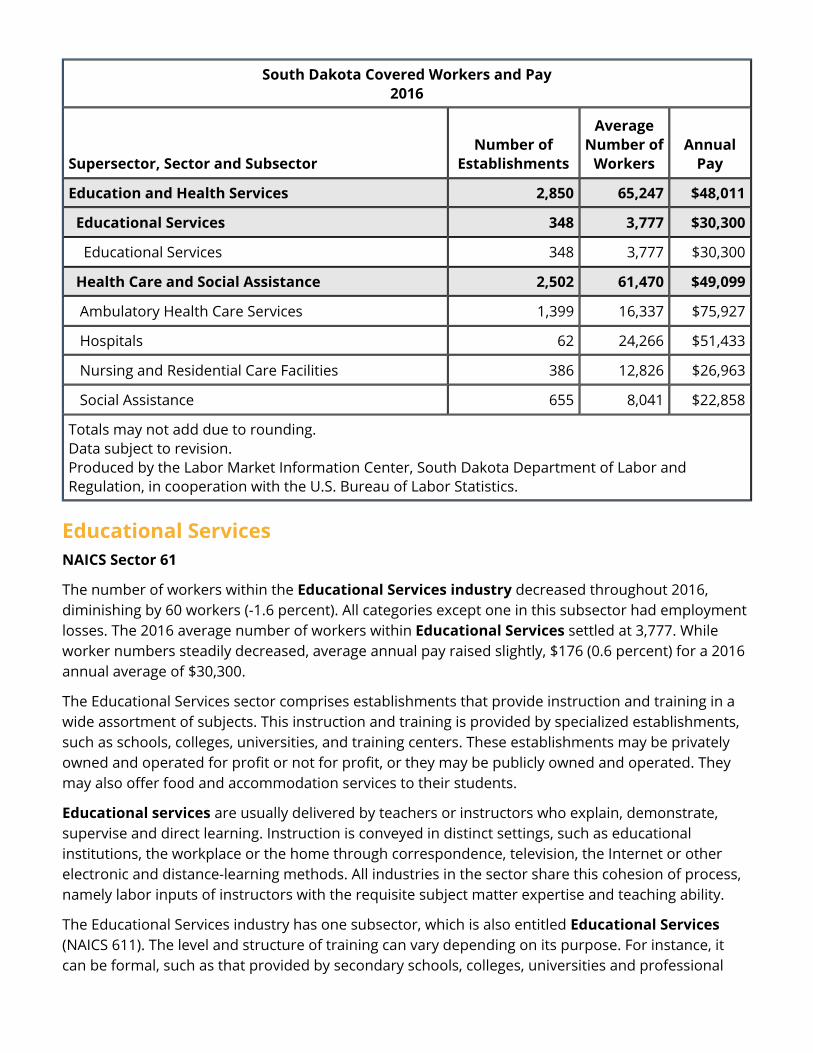
Education and Health Services SupersectorThe Education and Health Services supersector is comprised of the education services sector and the health services and social assistance sector. Businesses within this supersector provide instruction and training or provide health care and social assistance to individuals.
Continued on next page
South Dakota Covered Workers and Pay2016
Supersector, Sector and Subsector Number of
Establishments
Average Number of
WorkersAnnual
Pay
Education and Health Services 2,850 65,247 $48,011
Educational Services 348 3,777 $30,300
Educational Services 348 3,777 $30,300
Health Care and Social Assistance 2,502 61,470 $49,099
Ambulatory Health Care Services 1,399 16,337 $75,927
Hospitals 62 24,266 $51,433
Nursing and Residential Care Facilities 386 12,826 $26,963
Social Assistance 655 8,041 $22,858
Totals may not add due to rounding.Data subject to revision.Produced by the Labor Market Information Center, South Dakota Department of Labor and Regulation, in cooperation with the U.S. Bureau of Labor Statistics.
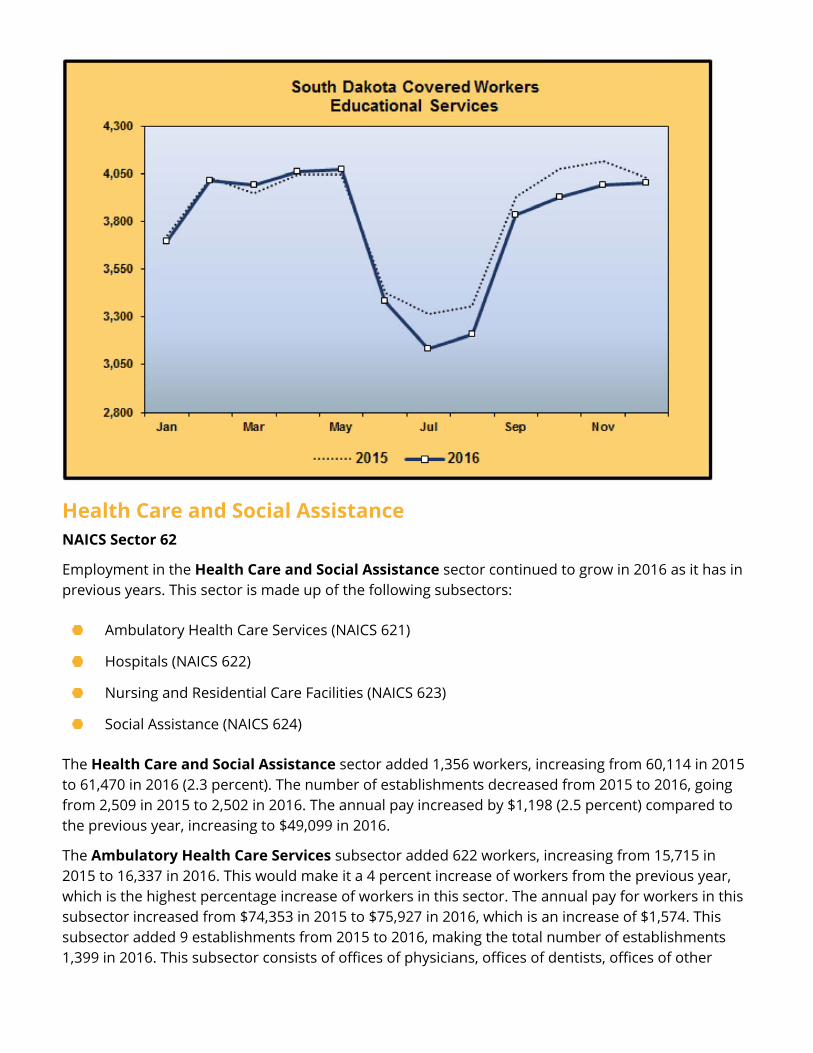
Educational Services NAICS Sector 61
The number of workers within the Educational Services industry decreased throughout 2016, diminishing by 60 workers (-1.6 percent). All categories except one in this subsector had employment losses. The 2016 average number of workers within Educational Services settled at 3,777. While worker numbers steadily decreased, average annual pay raised slightly, $176 (0.6 percent) for a 2016 annual average of $30,300.
The Educational Services sector comprises establishments that provide instruction and training in a wide assortment of subjects. This instruction and training is provided by specialized establishments, such as schools, colleges, universities, and training centers. These establishments may be privately owned and operated for profit or not for profit, or they may be publicly owned and operated. They may also offer food and accommodation services to their students.
Educational services are usually delivered by teachers or instructors who explain, demonstrate, supervise and direct learning. Instruction is conveyed in distinct settings, such as educational institutions, the workplace or the home through correspondence, television, the Internet or other electronic and distance-learning methods. All industries in the sector share this cohesion of process, namely labor inputs of instructors with the requisite subject matter expertise and teaching ability.
The Educational Services industry has one subsector, which is also entitled Educational Services(NAICS 611). The level and structure of training can vary depending on its purpose. For instance, it can be formal, such as that provided by secondary schools, colleges, universities and professional
schools. These institutions correspond to a recognized series of formal levels of education designated by diplomas, associate degrees and bachelors and higher degrees. Less formal venues include seminars, sport camps or a specific computer software package. Establishments offering this type of training may grant certificates or licenses. Establishments that manage schools and other educational establishments on a contractual basis are classified in this subsector if they both manage the operation and provide the operating staff. Such establishments are classified in the educational services subsector based on the type of facility managed and operated.
Worker levels dipped throughout the entire industry. Educational support services were responsible for about one third of the regression of workers during 2016. Guidance, test development, evaluation and college selection services were in less demand, thus employment decline. Basic preparatory education such as elementary and secondary schools had some worker loss. Kindergarten through 12th grade represents this category as well as school boards and school districts. Junior colleges along with community colleges experienced negative worker growth. These establishments primarily are engaged in furnishing academic, or academic and technical, courses and granting associate degrees, certificates, or diplomas below the baccalaureate level. The requirement for admission to an associate or equivalent degree program is at least a high school diploma or equivalent general academic training. Business and secretarial schools that offer courses in office procedures, secretarial and stenographic skills and word processing had worker numbers subside.
Worker growth was evident within technical and trade schools. These educational firms are primarily engaged in offering training in barbering, hair styling, or cosmetic arts, such as makeup or skin care. Job specific certification is provided by these schools.
Educational Services is widely considered a counter-cyclical industry. That is to say, typically, when the economy is doing poorly and unemployment is rising, more working adults, as their career prospects start to dim, decide to upgrade their education. This, in turn, leads to higher enrollment and increased profit at the schools. We note that traditional undergraduate education for young students is generally non-cyclical. Culinary arts schools, however, can be labeled as moderately cyclical. Also, certain types of educational institutions do perform largely in sync with the broader economy. For example, providers of information technology instruction benefit in good times, when companies are likely to boost related investment.
Although the educational services employment diminished some in 2016, education remains important, as the amount and type of education individuals receive is shown to have a major influence on both the types of jobs obtained and corresponding earnings. Lifelong learning is important in acquiring new knowledge and upgrading skills, as well as developing values, beliefs and habits, particularly in this age of rapid technological and economic changes. The educational services industry includes a variety of institutions that offer academic education, career and technical instruction, and other education and training to millions of students each year.
Continued on next page
Health Care and Social AssistanceNAICS Sector 62
Employment in the Health Care and Social Assistance sector continued to grow in 2016 as it has in previous years. This sector is made up of the following subsectors:
The Health Care and Social Assistance sector added 1,356 workers, increasing from 60,114 in 2015 to 61,470 in 2016 (2.3 percent). The number of establishments decreased from 2015 to 2016, going from 2,509 in 2015 to 2,502 in 2016. The annual pay increased by $1,198 (2.5 percent) compared to the previous year, increasing to $49,099 in 2016.
The Ambulatory Health Care Services subsector added 622 workers, increasing from 15,715 in 2015 to 16,337 in 2016. This would make it a 4 percent increase of workers from the previous year, which is the highest percentage increase of workers in this sector. The annual pay for workers in this subsector increased from $74,353 in 2015 to $75,927 in 2016, which is an increase of $1,574. This subsector added 9 establishments from 2015 to 2016, making the total number of establishments 1,399 in 2016. This subsector consists of offices of physicians, offices of dentists, offices of other
Ambulatory Health Care Services (NAICS 621)
Hospitals (NAICS 622)
Nursing and Residential Care Facilities (NAICS 623)
Social Assistance (NAICS 624)
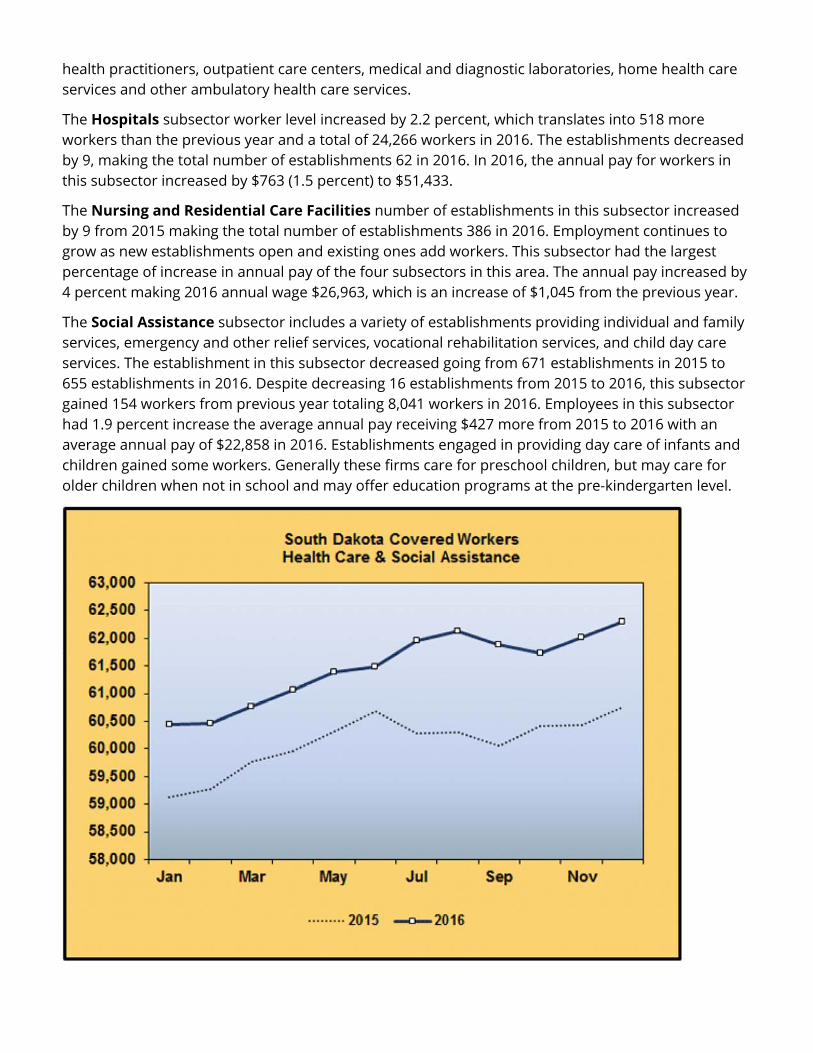
health practitioners, outpatient care centers, medical and diagnostic laboratories, home health care services and other ambulatory health care services.
The Hospitals subsector worker level increased by 2.2 percent, which translates into 518 more workers than the previous year and a total of 24,266 workers in 2016. The establishments decreased by 9, making the total number of establishments 62 in 2016. In 2016, the annual pay for workers in this subsector increased by $763 (1.5 percent) to $51,433.
The Nursing and Residential Care Facilities number of establishments in this subsector increased by 9 from 2015 making the total number of establishments 386 in 2016. Employment continues to grow as new establishments open and existing ones add workers. This subsector had the largest percentage of increase in annual pay of the four subsectors in this area. The annual pay increased by 4 percent making 2016 annual wage $26,963, which is an increase of $1,045 from the previous year.
The Social Assistance subsector includes a variety of establishments providing individual and family services, emergency and other relief services, vocational rehabilitation services, and child day care services. The establishment in this subsector decreased going from 671 establishments in 2015 to 655 establishments in 2016. Despite decreasing 16 establishments from 2015 to 2016, this subsector gained 154 workers from previous year totaling 8,041 workers in 2016. Employees in this subsector had 1.9 percent increase the average annual pay receiving $427 more from 2015 to 2016 with an average annual pay of $22,858 in 2016. Establishments engaged in providing day care of infants and children gained some workers. Generally these firms care for preschool children, but may care for older children when not in school and may offer education programs at the pre-kindergarten level.
Leisure and Hospitality Services SupersectorThe Leisure and Hospitality Services supersector is comprised of the arts, entertainment and recreation sector, and the accommodation and food services sector. Businesses within this supersector provide cultural, recreational or entertainment services or provides customers with lodging and/or food for immediate consumption.
South Dakota Covered Workers and Pay2016
Supersector, Sector and Subsector Number of
Establishments
Average Number
of Workers
Annual Pay
Leisure and Hospitality Services 3,294 46,732 $16,053
Arts, Entertainment and Recreation 698 6,504 $17,372
Performing Arts and Spectator Sports 136 1,269 $17,154
Museums, Historical Sites, Zoos and Parks 45 582 $25,339
Amusements, Gambling and Recreation 517 4,653 $16,435
Accommodation and Food Services 2,596 40,228 $15,840
Accommodation 611 8,856 $18,945
Food Services and Drinking Places 1,985 31,372 $14,963
Totals may not add due to rounding.Data subject to revision.Produced by the Labor Market Information Center, South Dakota Department of Labor and Regulation, in cooperation with the U.S. Bureau of Labor Statistics.
Arts, Entertainment and RecreationNAICS Sector 71
The Arts, Entertainment and Recreation sector went from 692 establishments in 2015 to 698 in 2016. Despite a gain of 6 establishments, there was a decrease of 26 workers bringing the number of workers to 6,504 in 2016. The average annual wage for this sector was $17,372 in 2016; which was a $131 decrease from the previous year.
This sector includes a variety of establishments that operate facilities or provide services to meet varied cultural, entertainment, and recreational interests of their patrons. Three subsectors form the Arts, Entertainment and Recreation sector:
Performing Arts, Spectator Sports and Related Industries (NAICS 711)
Museums, Historical Sites and Similar Institutions (NAICS 712)
Amusements, Gambling and Recreation Industries (NAICS 713)
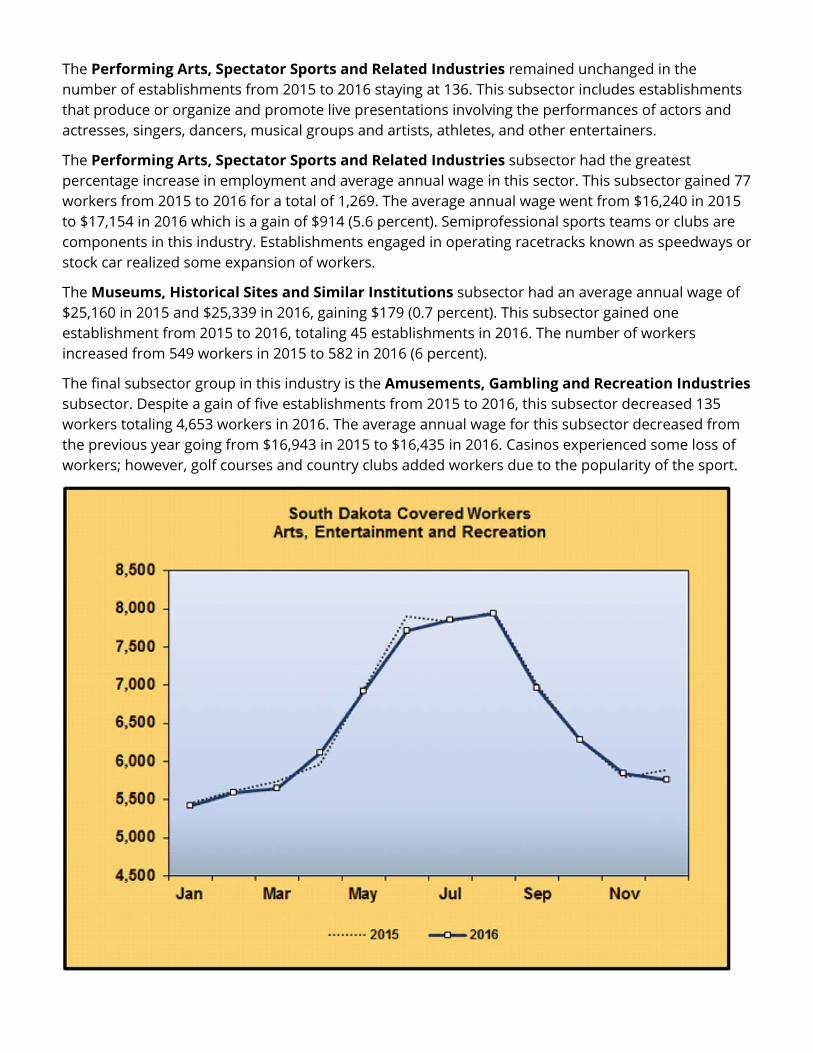
The Performing Arts, Spectator Sports and Related Industries remained unchanged in the number of establishments from 2015 to 2016 staying at 136. This subsector includes establishments that produce or organize and promote live presentations involving the performances of actors and actresses, singers, dancers, musical groups and artists, athletes, and other entertainers.
The Performing Arts, Spectator Sports and Related Industries subsector had the greatest percentage increase in employment and average annual wage in this sector. This subsector gained 77 workers from 2015 to 2016 for a total of 1,269. The average annual wage went from $16,240 in 2015 to $17,154 in 2016 which is a gain of $914 (5.6 percent). Semiprofessional sports teams or clubs are components in this industry. Establishments engaged in operating racetracks known as speedways or stock car realized some expansion of workers.
The Museums, Historical Sites and Similar Institutions subsector had an average annual wage of $25,160 in 2015 and $25,339 in 2016, gaining $179 (0.7 percent). This subsector gained one establishment from 2015 to 2016, totaling 45 establishments in 2016. The number of workers increased from 549 workers in 2015 to 582 in 2016 (6 percent).
The final subsector group in this industry is the Amusements, Gambling and Recreation Industries subsector. Despite a gain of five establishments from 2015 to 2016, this subsector decreased 135 workers totaling 4,653 workers in 2016. The average annual wage for this subsector decreased from the previous year going from $16,943 in 2015 to $16,435 in 2016. Casinos experienced some loss of workers; however, golf courses and country clubs added workers due to the popularity of the sport.
Accommodation and Food ServicesNAICS Sector 72
The Arts, Entertainment and Recreation sector went from 692 establishments in 2015 to 698 in 2016. Despite a gain of 6 establishments, there was a decrease of 26 workers bringing the number of workers to 6,504 in 2016. The average annual wage for this sector was $17,372 in 2016; which was a $131 decrease from the previous year.
This sector includes a variety of establishments that operate facilities or provide services to meet varied cultural, entertainment, and recreational interests of their patrons. Three subsectors form the Arts, Entertainment and Recreation sector:
The Performing Arts, Spectator Sports and Related Industries remained unchanged in the number of establishments from 2015 to 2016 staying at 136. This subsector includes establishments that produce or organize and promote live presentations involving the performances of actors and actresses, singers, dancers, musical groups and artists, athletes, and other entertainers.
The Performing Arts, Spectator Sports and Related Industries subsector had the greatest percentage increase in employment and average annual wage in this sector. This subsector gained 77 workers from 2015 to 2016 for a total of 1,269. The average annual wage went from $16,240 in 2015 to $17,154 in 2016 which is a gain of $914 (5.6 percent). Semiprofessional sports teams or clubs are components in this industry. Establishments engaged in operating racetracks known as speedways or stock car realized some expansion of workers.
The Museums, Historical Sites and Similar Institutions subsector had an average annual wage of $25,160 in 2015 and $25,339 in 2016, gaining $179 (0.7 percent). This subsector gained one establishment from 2015 to 2016, totaling 45 establishments in 2016. The number of workers increased from 549 workers in 2015 to 582 in 2016 (6 percent).
The final subsector group in this industry is the Amusements, Gambling and Recreation Industries subsector. Despite a gain of five establishments from 2015 to 2016, this subsector decreased 135 workers totaling 4,653 workers in 2016. The average annual wage for this subsector decreased from the previous year going from $16,943 in 2015 to $16,435 in 2016. Casinos experienced some loss of workers; however, golf courses and country clubs added workers due to the popularity of the sport.
Continued on next page
Performing Arts, Spectator Sports and Related Industries (NAICS 711)
Museums, Historical Sites and Similar Institutions (NAICS 712)
Amusements, Gambling and Recreation Industries (NAICS 713)
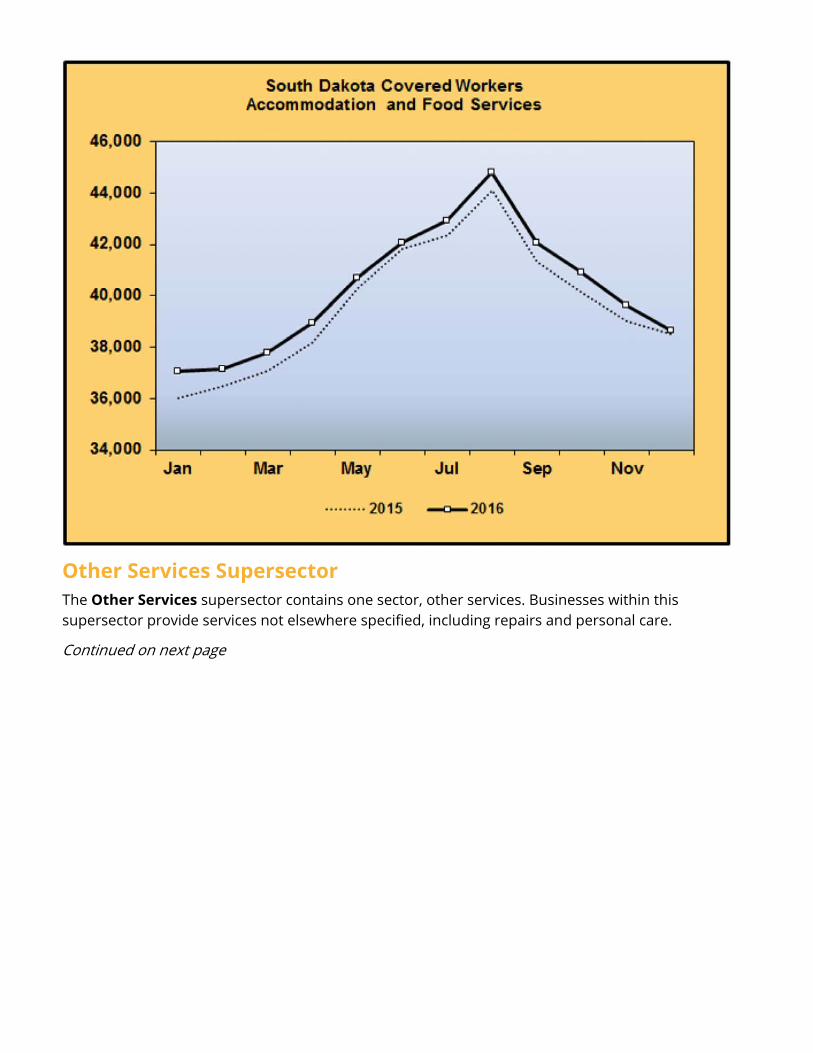
Other Services SupersectorThe Other Services supersector contains one sector, other services. Businesses within this supersector provide services not elsewhere specified, including repairs and personal care.
Continued on next page
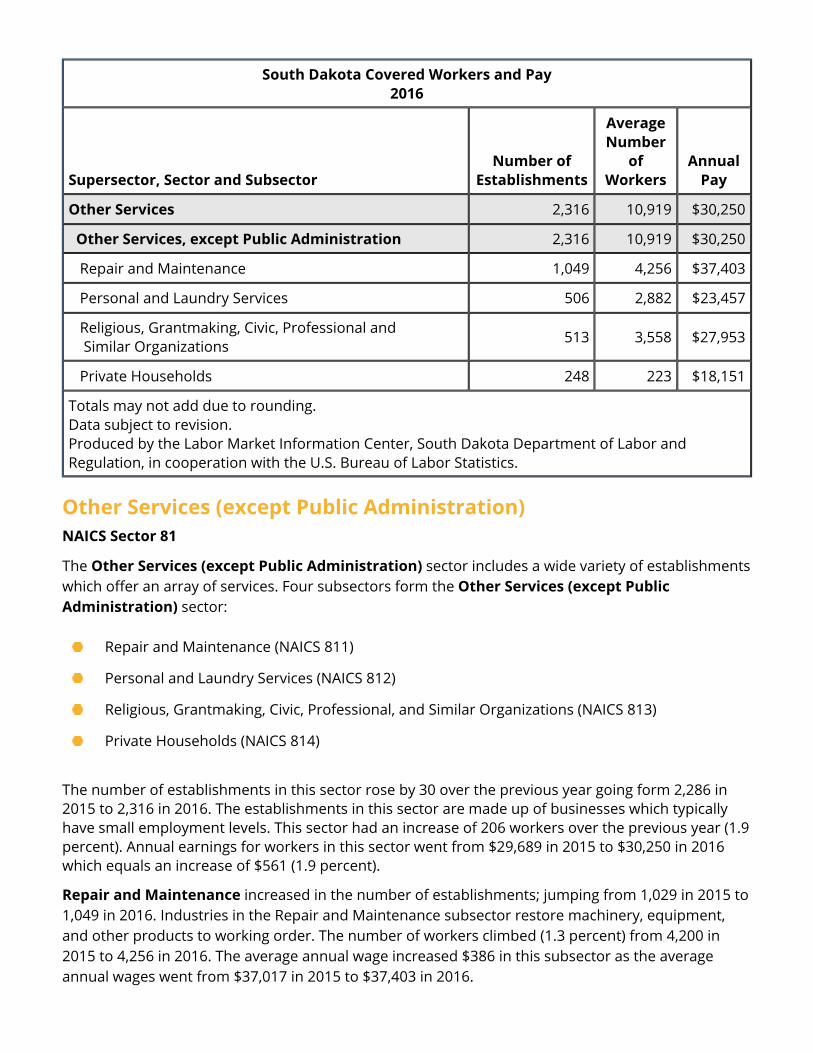
South Dakota Covered Workers and Pay2016
Supersector, Sector and Subsector Number of
Establishments
Average Number
of Workers
Annual Pay
Other Services 2,316 10,919 $30,250
Other Services, except Public Administration 2,316 10,919 $30,250
Repair and Maintenance 1,049 4,256 $37,403
Personal and Laundry Services 506 2,882 $23,457
Religious, Grantmaking, Civic, Professional and Similar Organizations 513 3,558 $27,953
Private Households 248 223 $18,151
Totals may not add due to rounding.Data subject to revision.Produced by the Labor Market Information Center, South Dakota Department of Labor and Regulation, in cooperation with the U.S. Bureau of Labor Statistics.
Other Services (except Public Administration)NAICS Sector 81
The Other Services (except Public Administration) sector includes a wide variety of establishments which offer an array of services. Four subsectors form the Other Services (except Public Administration) sector:
The number of establishments in this sector rose by 30 over the previous year going form 2,286 in 2015 to 2,316 in 2016. The establishments in this sector are made up of businesses which typically have small employment levels. This sector had an increase of 206 workers over the previous year (1.9 percent). Annual earnings for workers in this sector went from $29,689 in 2015 to $30,250 in 2016 which equals an increase of $561 (1.9 percent).
Repair and Maintenance increased in the number of establishments; jumping from 1,029 in 2015 to 1,049 in 2016. Industries in the Repair and Maintenance subsector restore machinery, equipment, and other products to working order. The number of workers climbed (1.3 percent) from 4,200 in 2015 to 4,256 in 2016. The average annual wage increased $386 in this subsector as the average annual wages went from $37,017 in 2015 to $37,403 in 2016.
Repair and Maintenance (NAICS 811)
Personal and Laundry Services (NAICS 812)
Religious, Grantmaking, Civic, Professional, and Similar Organizations (NAICS 813)
Private Households (NAICS 814)
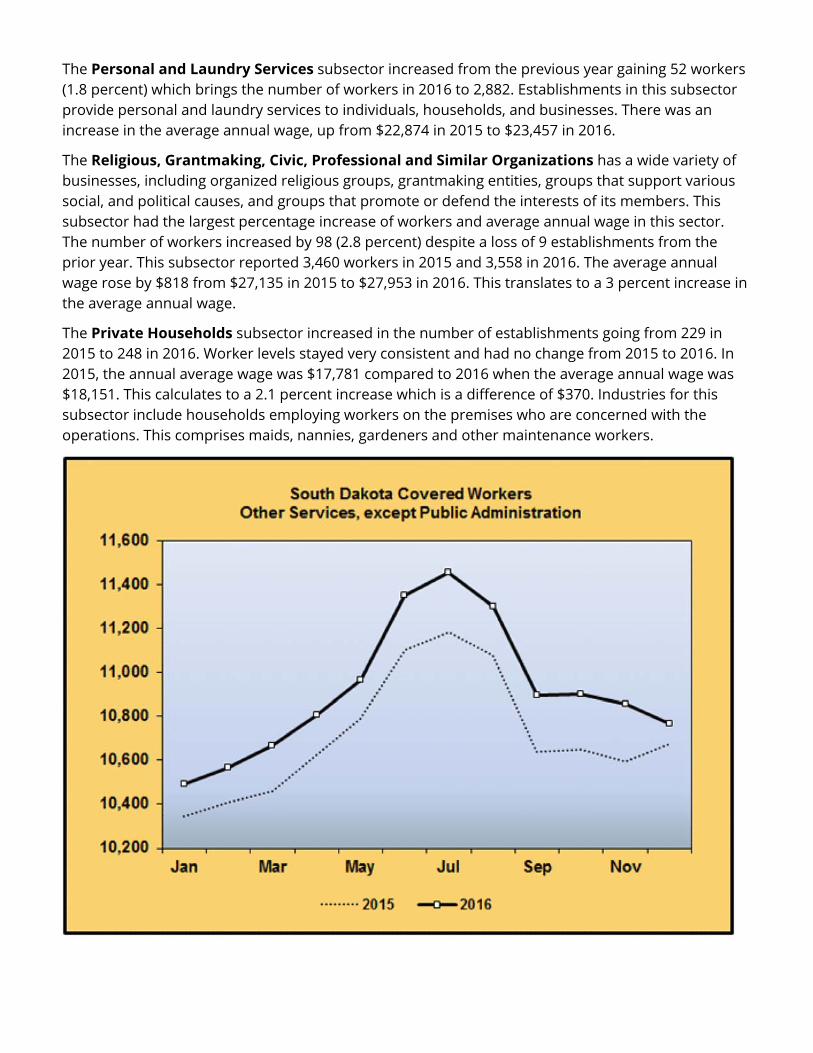
The Personal and Laundry Services subsector increased from the previous year gaining 52 workers (1.8 percent) which brings the number of workers in 2016 to 2,882. Establishments in this subsector provide personal and laundry services to individuals, households, and businesses. There was an increase in the average annual wage, up from $22,874 in 2015 to $23,457 in 2016.
The Religious, Grantmaking, Civic, Professional and Similar Organizations has a wide variety of businesses, including organized religious groups, grantmaking entities, groups that support various social, and political causes, and groups that promote or defend the interests of its members. This subsector had the largest percentage increase of workers and average annual wage in this sector. The number of workers increased by 98 (2.8 percent) despite a loss of 9 establishments from the prior year. This subsector reported 3,460 workers in 2015 and 3,558 in 2016. The average annual wage rose by $818 from $27,135 in 2015 to $27,953 in 2016. This translates to a 3 percent increase in the average annual wage.
The Private Households subsector increased in the number of establishments going from 229 in 2015 to 248 in 2016. Worker levels stayed very consistent and had no change from 2015 to 2016. In 2015, the annual average wage was $17,781 compared to 2016 when the average annual wage was $18,151. This calculates to a 2.1 percent increase which is a difference of $370. Industries for this subsector include households employing workers on the premises who are concerned with the operations. This comprises maids, nannies, gardeners and other maintenance workers.

Public Administration SupersectorThe Public Administration supersector contains information on federal, state and local governments. Tribal governments are now included in local government. A change in federal law requires Indian tribes to be classified similarly to state and local governments.
South Dakota Covered Workers and Pay 2016
Supersector and Sector Number of
Establishments
Average Number
of Workers
Annual Pay
Public Administration 2,433 72,963 $41,346
Federal Government 722 11,316 $62,364
Federal Government 722 11,316 $62,364
State Government 863 14,873 $48,598
State Government Education 24 5,911 $51,553
State Government, excluding education 839 8,962 $46,689
Local Government 848 46,774 $33,954
Local Government Education 212 24,923 $34,693
Local Government, excluding ed. tribal government* 557 14,135 $33,198
Local Tribal Government excluding education 47 5,819 $32,055
Local Tribal Government Education 32 1,897 $34,006
(See below for a separate table of the Local Tribal Government data, including sums.)
Totals may not add due to rounding.Data subject to revision.Produced by the Labor Market Information Center, South Dakota Department of Labor and Regulation, in cooperation with the U.S. Bureau of Labor Statistics.
Continued on next page
South Dakota Covered Workers and Pay 2016
Number of Establishments
Average Number
of Workers
Annual Pay
Local Tribal Government 79 7,716 $32,950
Local Tribal Government Education 32 1,897 $34,006
Local Tribal Government excluding education 47 5,819 $32,055
Totals may not add due to rounding.Data subject to revision.Produced by the Labor Market Information Center, South Dakota Department of Labor and Regulation, in cooperation with the U.S. Bureau of Labor Statistics.
Public Administration
Federal GovernmentThe number of Federal Government workers had an increase in workers during 2016. This government sector increased by 208 workers (1.9 percent). Federal Government workforce rose to an employment level of 11,316. The average annual pay for federal government employees had an increase of $421 (0.7 percent), which brings the average pay to $62,364 for 2016 compared to $61,943 in 2015.
Retail Trade (NAICS 44-45) experienced a rise in 15 workers in 2016. The annual pay decreased from $28,953 in 2015 to $24,063 (16.9 percent) in 2016.
Transportation and Warehousing (NAICS 48-49) experienced an increase of 37 workers (1.9 percent). The annual pay for this subsector under the Federal Government industry decreased from $52,170 in 2015 to $49,549 (5.0 percent) in 2016.
The Information (NAICS 51) sector lost 1 worker over the year and decreased the annual pay by $6,179 (20.3 percent). The annual pay in 2015 was $30,512 and dropped to $24,333 in 2016.
Finance and Insurance (NAICS 52) had an annual pay decrease for 2016 in the amount of $865 (1.3 percent). Annual pay was $64,265 in 2015 compared to $63,400 in 2016. The employee levels have shown an increase of 12 workers (6.1 percent).
Professional, Scientific and Technical Services (NAICS 54) had a gain of 9 workers (4.1 percent). The annual pay also increased by $883 (1.1 percent).
The Educational Services (NAICS 61) subsector decreased by 1 worker (0.2 percent). The annual pay decreased from $55,219 in 2015 to $54,929 ($290 or 0.5 percent) in 2016.
Health Care and Social Assistance (NAICS 62) experienced an annual pay increase to $65,395 (1.6 percent) in 2016 compared to $64,393 in 2015. The Health Care and Social Assistance subsector strengthen employment levels by 97 workers (2.7 percent).
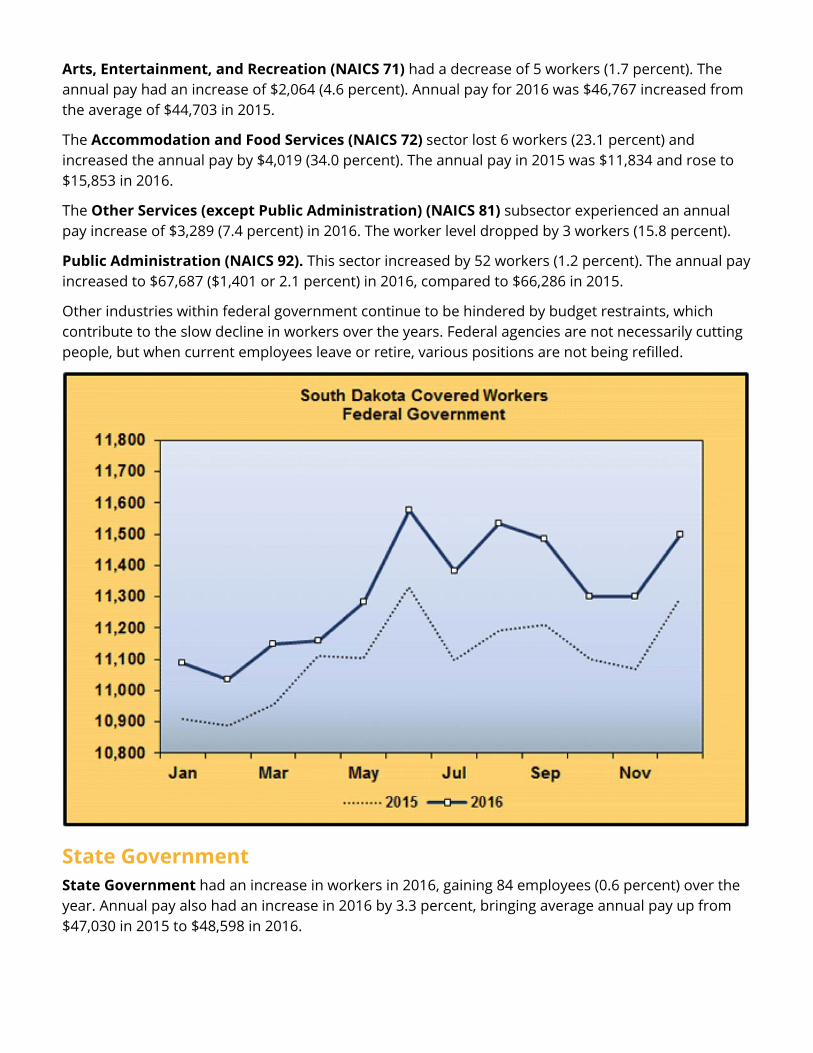
Arts, Entertainment, and Recreation (NAICS 71) had a decrease of 5 workers (1.7 percent). The annual pay had an increase of $2,064 (4.6 percent). Annual pay for 2016 was $46,767 increased from the average of $44,703 in 2015.
The Accommodation and Food Services (NAICS 72) sector lost 6 workers (23.1 percent) and increased the annual pay by $4,019 (34.0 percent). The annual pay in 2015 was $11,834 and rose to $15,853 in 2016.
The Other Services (except Public Administration) (NAICS 81) subsector experienced an annual pay increase of $3,289 (7.4 percent) in 2016. The worker level dropped by 3 workers (15.8 percent).
Public Administration (NAICS 92). This sector increased by 52 workers (1.2 percent). The annual pay increased to $67,687 ($1,401 or 2.1 percent) in 2016, compared to $66,286 in 2015.
Other industries within federal government continue to be hindered by budget restraints, which contribute to the slow decline in workers over the years. Federal agencies are not necessarily cutting people, but when current employees leave or retire, various positions are not being refilled.
State GovernmentState Government had an increase in workers in 2016, gaining 84 employees (0.6 percent) over the year. Annual pay also had an increase in 2016 by 3.3 percent, bringing average annual pay up from $47,030 in 2015 to $48,598 in 2016.
Agriculture, Forestry, Fishing and Hunting (NAICS 11) sector was decreased over the year by 2 (15.4 percent) workers and an increase of $1,792 (7.8 percent) in annual pay. The 2016 annual pay was $24,683 compared to $22,891 in 2015.
The Construction (NAICS 23) sector had an increase of 17 workers (2.3 percent). Annual pay rose by $1,135 (2.6 percent). The 2016 annual pay was $45,309 compared to $44,174 in 2015.
The Information (NAICS 51) sector had a loss of 4 workers (2.6 percent) but had an increase of $2,014 (4.1 percent) in annual pay. The 2016 annual pay was $51,303 compared to $49,289 in 2015.
The Professional, Scientific, and Technical Services (NAICS 54) sector was increased in employment with 10 workers (1.9 percent) from 2015 to 2016. The annual pay increased by $1,832 (3.2 percent) for an average salary of $59,164 in 2016.
Administrative and Support and Waste Management and Remediation Services (NAICS 56) had a loss of 1 worker (0.6 percent) and an increase in annual pay of $1,592 (4.2 percent).
Educational Services (NAICS 61) sector had an increase of 114 workers (2.0 percent) and an increase of $1,086 (2.2 percent) in annual pay. The 2016 annual pay was $51,553 compared to $50,467 in 2015. The continuing increases in this sector can be attributed to the growth of South Dakota's university curriculum and research activities.
The Health Care and Social Assistance (NAICS 62) sector had a gain of 7 workers (0.4 percent) and also an increase of $1,724 (4.2 percent) in annual pay. The 2016 annual pay was $42,738 compared to $41,014 in 2015.
Arts, Entertainment and Recreation (NAICS 71) had a gain of 2 workers (0.5 percent) and an increase in annual pay of $1,536 (5.4 percent). The 2016 annual pay was $30,072.
The Public Administration (NAICS 92) sector lost 61 workers (1.2 percent) and had an annual pay increase of $2,023 or 4.4 percent. The 2016 average annual pay was $48,318 compared to $46,295 in 2015.
Continued on next page
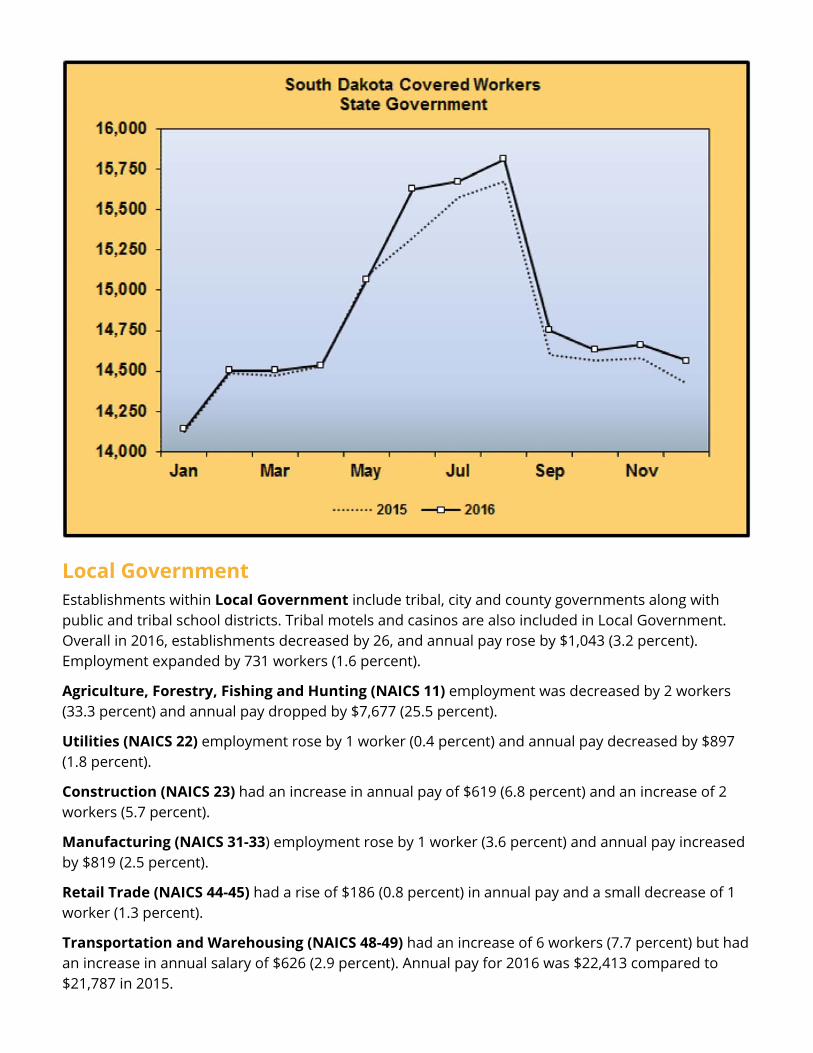
Local GovernmentEstablishments within Local Government include tribal, city and county governments along with public and tribal school districts. Tribal motels and casinos are also included in Local Government. Overall in 2016, establishments decreased by 26, and annual pay rose by $1,043 (3.2 percent). Employment expanded by 731 workers (1.6 percent).
Agriculture, Forestry, Fishing and Hunting (NAICS 11) employment was decreased by 2 workers (33.3 percent) and annual pay dropped by $7,677 (25.5 percent).
Utilities (NAICS 22) employment rose by 1 worker (0.4 percent) and annual pay decreased by $897 (1.8 percent).
Construction (NAICS 23) had an increase in annual pay of $619 (6.8 percent) and an increase of 2 workers (5.7 percent).
Manufacturing (NAICS 31-33) employment rose by 1 worker (3.6 percent) and annual pay increased by $819 (2.5 percent).
Retail Trade (NAICS 44-45) had a rise of $186 (0.8 percent) in annual pay and a small decrease of 1 worker (1.3 percent).
Transportation and Warehousing (NAICS 48-49) had an increase of 6 workers (7.7 percent) but had an increase in annual salary of $626 (2.9 percent). Annual pay for 2016 was $22,413 compared to $21,787 in 2015.
Information (NAICS 51) had a 14.7 percent decrease in employment and an increase of 12.5 percent or $4,405 in annual pay.
Finance and Insurance (NAICS 52) was down 1 worker (33.3 percent) but had a decrease in annual pay of $5,478 (11.8 percent).
Real Estate and Rental and Leasing (NAICS 53) had a gain of 4 workers or 0.7 percent. Annual pay also increased by $634 or 2.0 percent. Annual pay for 2016 was $32,601 compared to $31,967 in 2015.
Professional, Scientific, and Technical Services (NAICS 54) employment rose by 3 workers (25.0 percent) but had a decrease in annual pay of $553 or 1.9 percent. The average annual pay for 2016 was $29,277 compared to $29,830 in 2015.
Administrative and Support and Waste Management and Remediation Services (NAICS 56) was unchanged with 6 workers. There was a large increase in annual salary of $12,768 (33.8 percent).
Education Services (NAICS 61) saw a significant rise of 423 workers or 1.7 percent. Annual pay increased by $1,516 (4.6 percent) for a 2016 level of $34,693. The majority of establishments within local government are comprised of public school districts.
The Health Care and Social Assistance (NAICS 62) sector had a decrease in employment, losing 5 workers (0.3 percent) in 2016. The annual pay for this sector continued to rise in 2016 showing an increase of $1,342 or 4.4 percent. Annual pay for 2016 was $31,944 compared to $30,602 in 2015.
The Arts, Entertainment, and Recreation (NAICS 71) sector had a drop in the number of workers losing 42 workers or 3.0 percent. However, they had an increase of $881 or 3.3 percent in annual pay. Annual pay for 2016 was $27,669 compared to $26,788 in 2015.
Accommodation and Food Services (NAICS 72) had a decrease of 4 workers (1.2 percent) and an increase of $507 (2.0 percent) in annual pay. The average annual pay for 2016 was $26,172.
Other Services (Except Public Administration) (NAICS 81) had an increase of 1 worker (33.3 percent) and had a large decrease in annual pay of $6,846 (16.4 percent). This results in the annual pay for 2016 being $34,932.
Public Administration (NAICS 92) gained 347 workers for a 2016 average of 17,430 workers or 2.0 percent. Annual pay increased by 1.1 percent to an annual average of $33,703. There are 508 establishments in this sector, decreased by 4 from 2015. The public administration sector consists of establishments of federal, state and local government agencies that administer, oversee and manage public programs and have authorities over other institutions within a given area.
Continued on next page
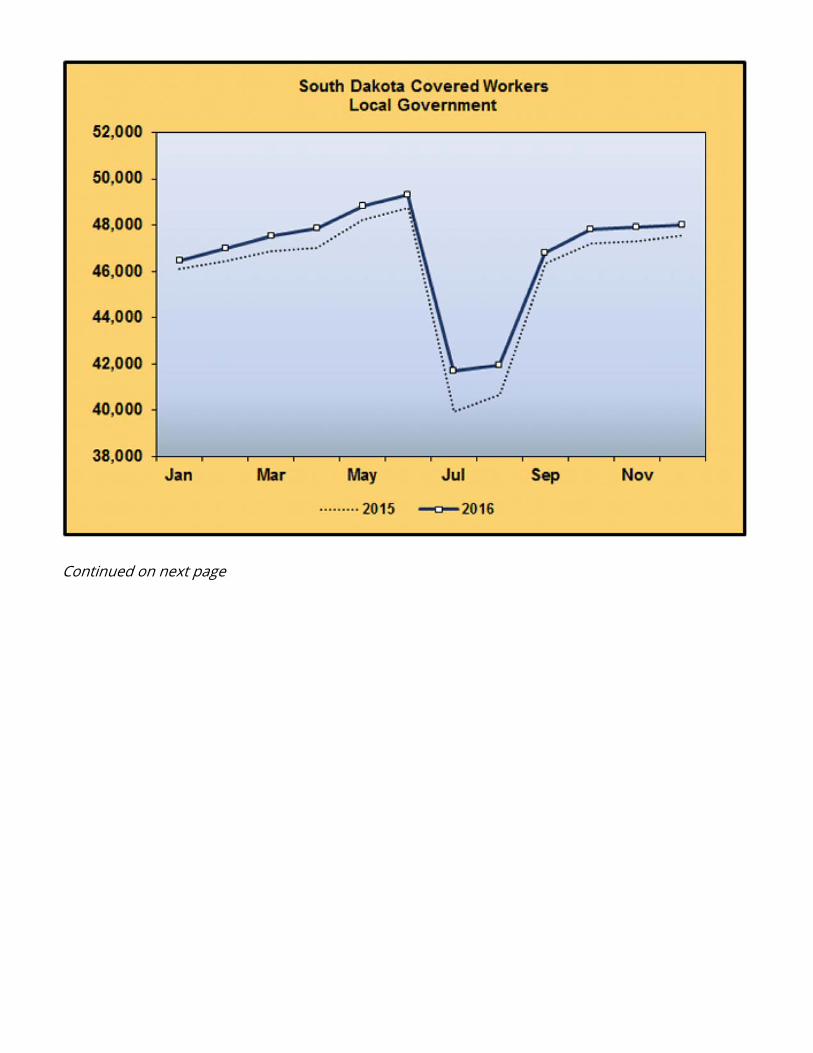
Continued on next page
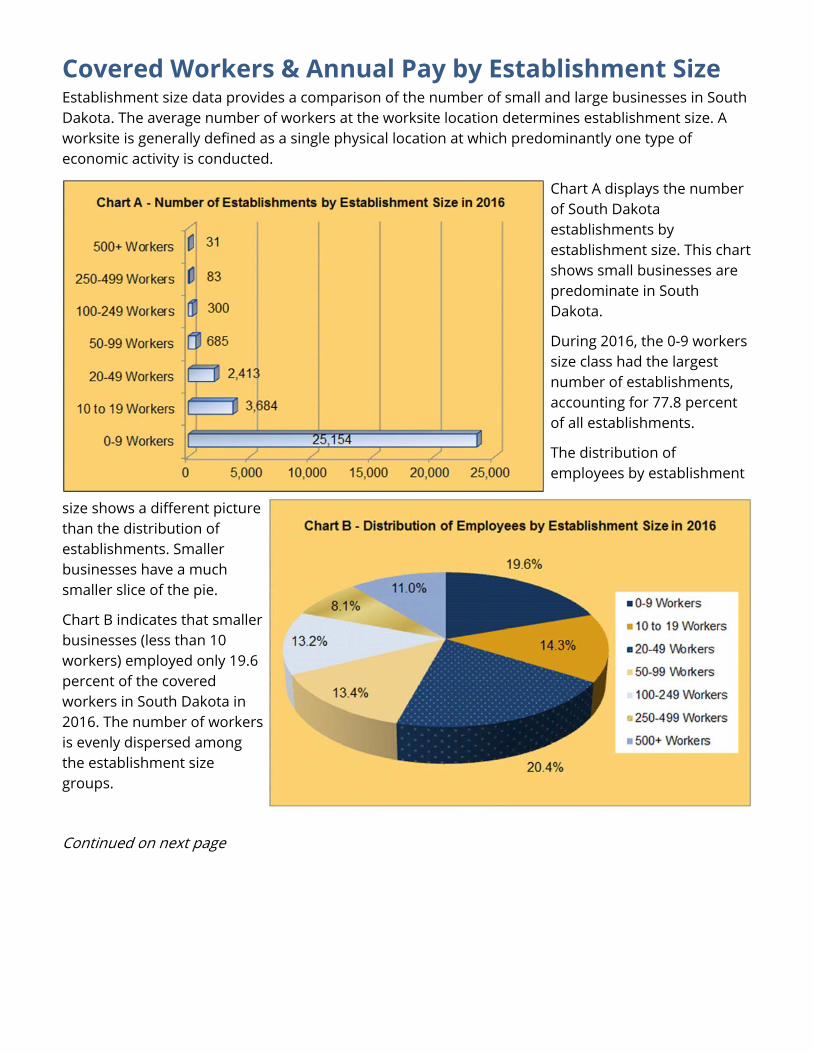
Covered Workers & Annual Pay by Establishment SizeEstablishment size data provides a comparison of the number of small and large businesses in South Dakota. The average number of workers at the worksite location determines establishment size. A worksite is generally defined as a single physical location at which predominantly one type of economic activity is conducted.
Chart A displays the number of South Dakota establishments by establishment size. This chart shows small businesses are predominate in South Dakota.
During 2016, the 0-9 workers size class had the largest number of establishments, accounting for 77.8 percent of all establishments.
The distribution of employees by establishment
size shows a different picture than the distribution of establishments. Smaller businesses have a much smaller slice of the pie.
Chart B indicates that smaller businesses (less than 10 workers) employed only 19.6 percent of the covered workers in South Dakota in 2016. The number of workers is evenly dispersed among the establishment size groups.
Continued on next page
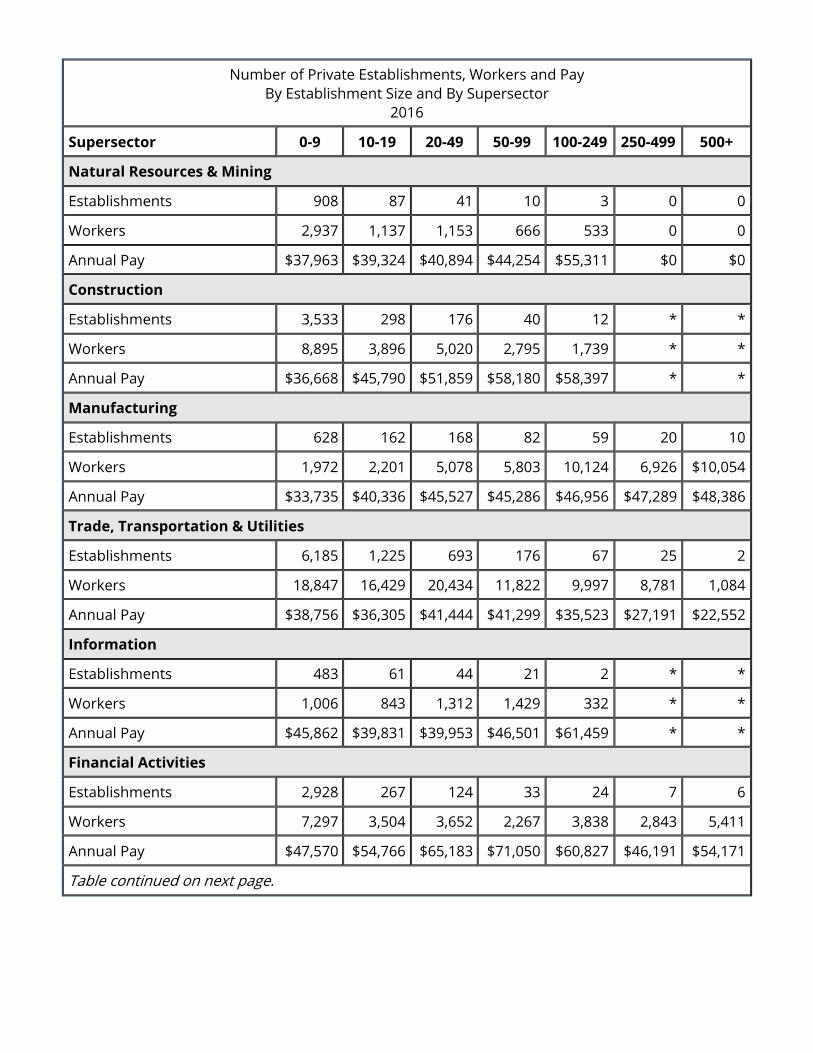
Number of Private Establishments, Workers and PayBy Establishment Size and By Supersector
2016
Supersector 0-9 10-19 20-49 50-99 100-249 250-499 500+
Natural Resources & Mining
Establishments 908 87 41 10 3 0 0
Workers 2,937 1,137 1,153 666 533 0 0
Annual Pay $37,963 $39,324 $40,894 $44,254 $55,311 $0 $0
Construction
Establishments 3,533 298 176 40 12 * *
Workers 8,895 3,896 5,020 2,795 1,739 * *
Annual Pay $36,668 $45,790 $51,859 $58,180 $58,397 * *
Manufacturing
Establishments 628 162 168 82 59 20 10
Workers 1,972 2,201 5,078 5,803 10,124 6,926 $10,054
Annual Pay $33,735 $40,336 $45,527 $45,286 $46,956 $47,289 $48,386
Trade, Transportation & Utilities
Establishments 6,185 1,225 693 176 67 25 2
Workers 18,847 16,429 20,434 11,822 9,997 8,781 1,084
Annual Pay $38,756 $36,305 $41,444 $41,299 $35,523 $27,191 $22,552
Information
Establishments 483 61 44 21 2 * *
Workers 1,006 843 1,312 1,429 332 * *
Annual Pay $45,862 $39,831 $39,953 $46,501 $61,459 * *
Financial Activities
Establishments 2,928 267 124 33 24 7 6
Workers 7,297 3,504 3,652 2,267 3,838 2,843 5,411
Annual Pay $47,570 $54,766 $65,183 $71,050 $60,827 $46,191 $54,171
Table continued on next page.
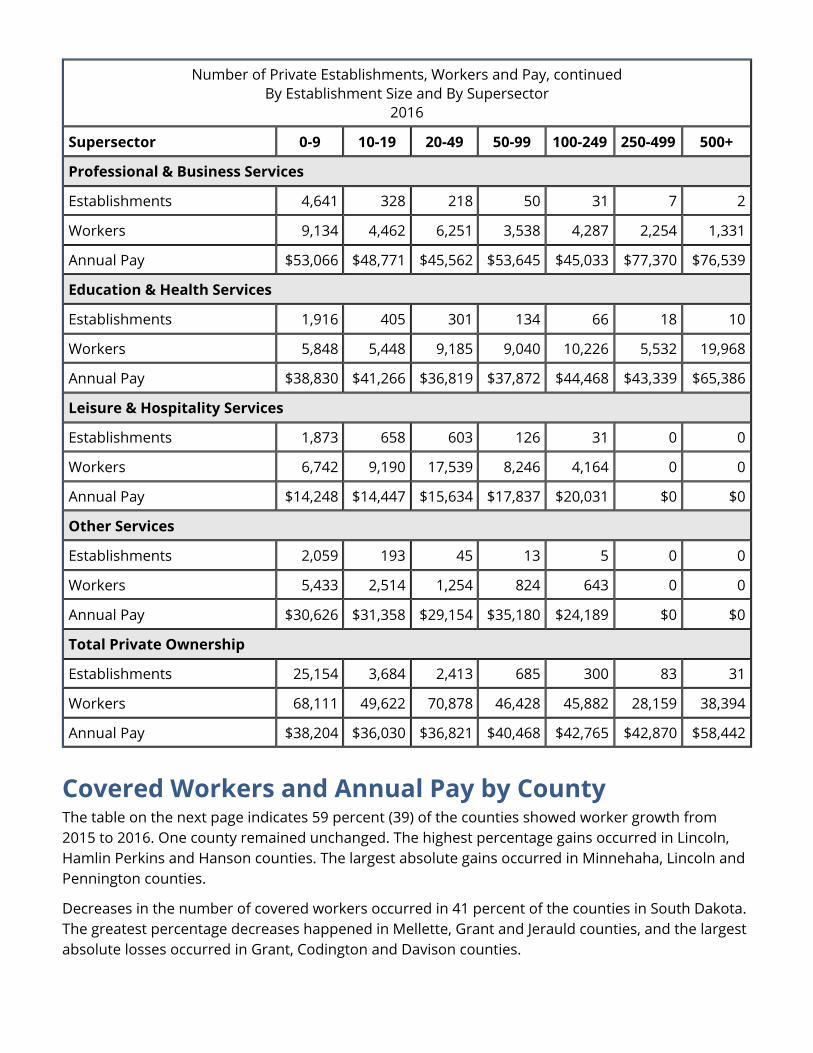
Number of Private Establishments, Workers and Pay, continuedBy Establishment Size and By Supersector
2016
Supersector 0-9 10-19 20-49 50-99 100-249 250-499 500+
Professional & Business Services
Establishments 4,641 328 218 50 31 7 2
Workers 9,134 4,462 6,251 3,538 4,287 2,254 1,331
Annual Pay $53,066 $48,771 $45,562 $53,645 $45,033 $77,370 $76,539
Education & Health Services
Establishments 1,916 405 301 134 66 18 10
Workers 5,848 5,448 9,185 9,040 10,226 5,532 19,968
Annual Pay $38,830 $41,266 $36,819 $37,872 $44,468 $43,339 $65,386
Leisure & Hospitality Services
Establishments 1,873 658 603 126 31 0 0
Workers 6,742 9,190 17,539 8,246 4,164 0 0
Annual Pay $14,248 $14,447 $15,634 $17,837 $20,031 $0 $0
Other Services
Establishments 2,059 193 45 13 5 0 0
Workers 5,433 2,514 1,254 824 643 0 0
Annual Pay $30,626 $31,358 $29,154 $35,180 $24,189 $0 $0
Total Private Ownership
Establishments 25,154 3,684 2,413 685 300 83 31
Workers 68,111 49,622 70,878 46,428 45,882 28,159 38,394
Annual Pay $38,204 $36,030 $36,821 $40,468 $42,765 $42,870 $58,442
Covered Workers and Annual Pay by County The table on the next page indicates 59 percent (39) of the counties showed worker growth from 2015 to 2016. One county remained unchanged. The highest percentage gains occurred in Lincoln, Hamlin Perkins and Hanson counties. The largest absolute gains occurred in Minnehaha, Lincoln and Pennington counties.
Decreases in the number of covered workers occurred in 41 percent of the counties in South Dakota. The greatest percentage decreases happened in Mellette, Grant and Jerauld counties, and the largest absolute losses occurred in Grant, Codington and Davison counties.
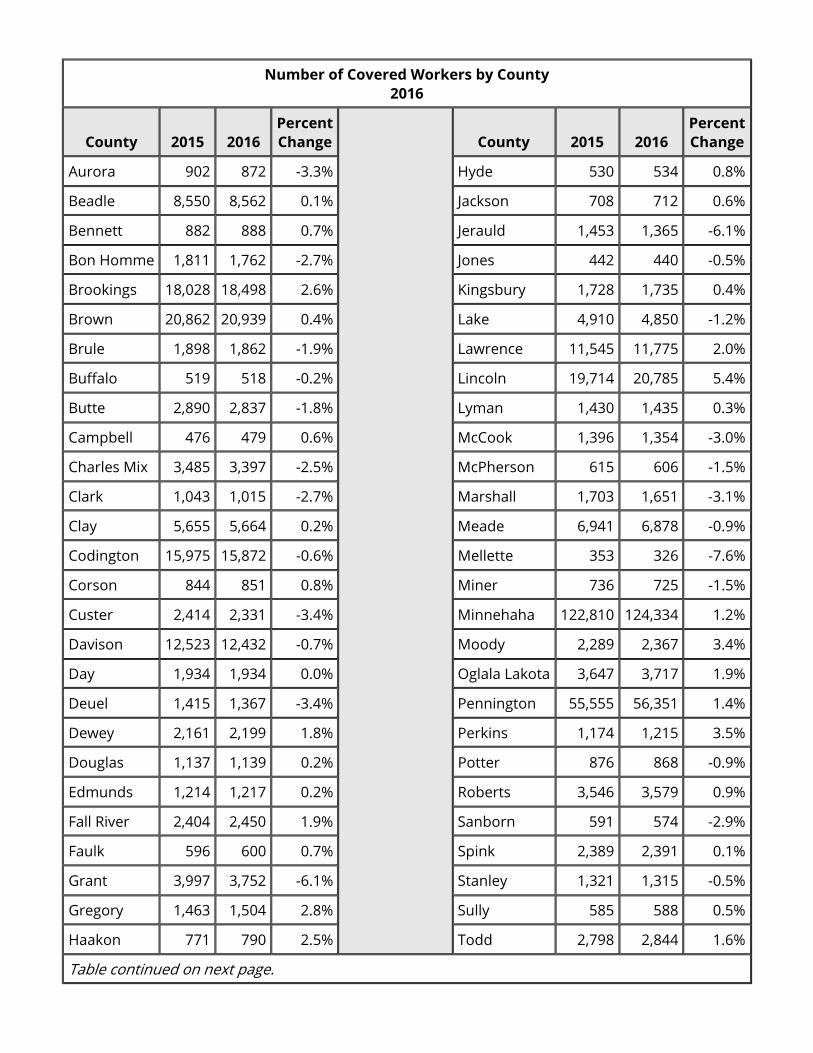
Number of Covered Workers by County2016
County 2015 2016Percent Change County 2015 2016
Percent Change
Aurora 902 872 -3.3% Hyde 530 534 0.8%
Beadle 8,550 8,562 0.1% Jackson 708 712 0.6%
Bennett 882 888 0.7% Jerauld 1,453 1,365 -6.1%
Bon Homme 1,811 1,762 -2.7% Jones 442 440 -0.5%
Brookings 18,028 18,498 2.6% Kingsbury 1,728 1,735 0.4%
Brown 20,862 20,939 0.4% Lake 4,910 4,850 -1.2%
Brule 1,898 1,862 -1.9% Lawrence 11,545 11,775 2.0%
Buffalo 519 518 -0.2% Lincoln 19,714 20,785 5.4%
Butte 2,890 2,837 -1.8% Lyman 1,430 1,435 0.3%
Campbell 476 479 0.6% McCook 1,396 1,354 -3.0%
Charles Mix 3,485 3,397 -2.5% McPherson 615 606 -1.5%
Clark 1,043 1,015 -2.7% Marshall 1,703 1,651 -3.1%
Clay 5,655 5,664 0.2% Meade 6,941 6,878 -0.9%
Codington 15,975 15,872 -0.6% Mellette 353 326 -7.6%
Corson 844 851 0.8% Miner 736 725 -1.5%
Custer 2,414 2,331 -3.4% Minnehaha 122,810 124,334 1.2%
Davison 12,523 12,432 -0.7% Moody 2,289 2,367 3.4%
Day 1,934 1,934 0.0% Oglala Lakota 3,647 3,717 1.9%
Deuel 1,415 1,367 -3.4% Pennington 55,555 56,351 1.4%
Dewey 2,161 2,199 1.8% Perkins 1,174 1,215 3.5%
Douglas 1,137 1,139 0.2% Potter 876 868 -0.9%
Edmunds 1,214 1,217 0.2% Roberts 3,546 3,579 0.9%
Fall River 2,404 2,450 1.9% Sanborn 591 574 -2.9%
Faulk 596 600 0.7% Spink 2,389 2,391 0.1%
Grant 3,997 3,752 -6.1% Stanley 1,321 1,315 -0.5%
Gregory 1,463 1,504 2.8% Sully 585 588 0.5%
Haakon 771 790 2.5% Todd 2,798 2,844 1.6%
Table continued on next page.
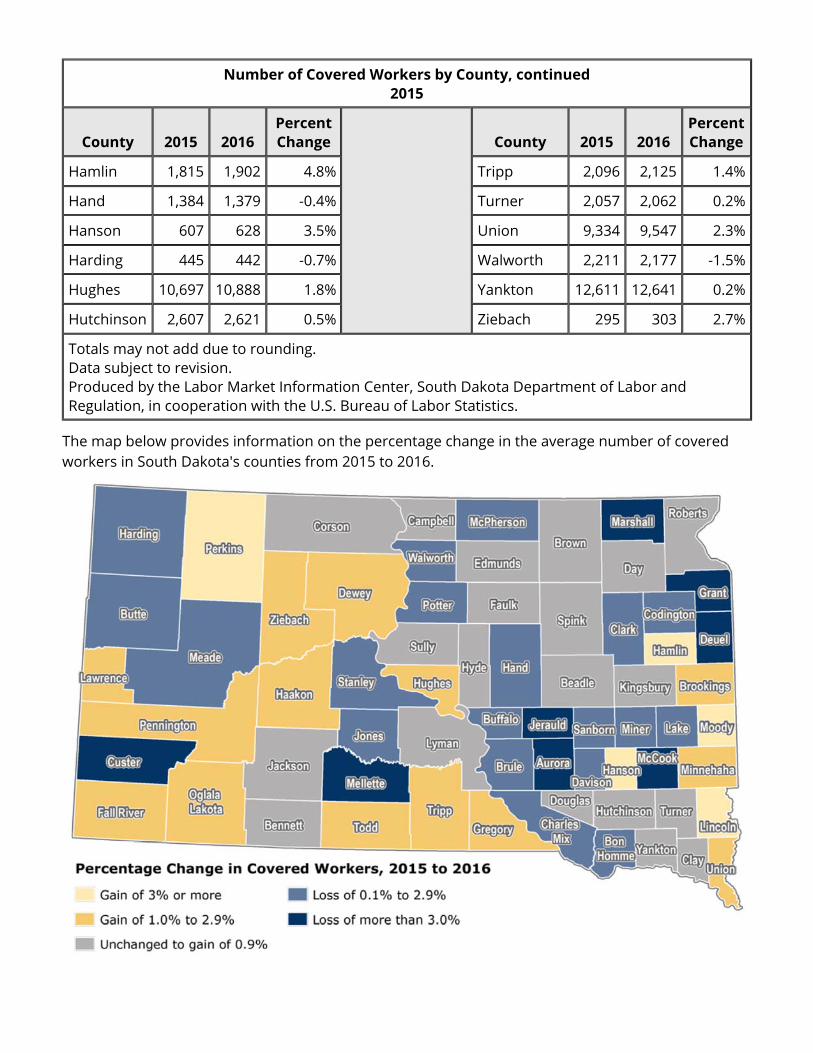
Number of Covered Workers by County, continued2015
County 2015 2016Percent Change County 2015 2016
Percent Change
Hamlin 1,815 1,902 4.8% Tripp 2,096 2,125 1.4%
Hand 1,384 1,379 -0.4% Turner 2,057 2,062 0.2%
Hanson 607 628 3.5% Union 9,334 9,547 2.3%
Harding 445 442 -0.7% Walworth 2,211 2,177 -1.5%
Hughes 10,697 10,888 1.8% Yankton 12,611 12,641 0.2%
Hutchinson 2,607 2,621 0.5% Ziebach 295 303 2.7%
Totals may not add due to rounding.Data subject to revision.Produced by the Labor Market Information Center, South Dakota Department of Labor and Regulation, in cooperation with the U.S. Bureau of Labor Statistics.
The map below provides information on the percentage change in the average number of covered workers in South Dakota's counties from 2015 to 2016.

Annual Pay for Covered Workers by County2016
County 2015 2016Percent Change County 2015 2016
Percent Change
Aurora $30,287 $30,816 1.7% Hyde $37,655 $38,185 1.4%
Beadle $37,143 $38,330 3.2% Jackson $27,758 $28,001 0.9%
Bennett $28,264 $30,141 6.6% Jerauld $32,899 $34,848 5.9%
Bon Homme $31,720 $32,659 3.0% Jones $27,918 $28,347 1.5%
Brookings $40,668 $41,457 1.9% Kingsbury $33,392 $34,760 4.1%
Brown $39,214 $39,819 1.5% Lake $36,901 $38,026 3.0%
Brule $30,144 $30,776 2.1% Lawrence $33,425 $33,274 -0.5%
Buffalo $35,774 $36,673 2.5% Lincoln $45,312 $47,049 3.8%
Butte $32,218 $32,613 1.2% Lyman $28,135 $28,862 2.6%
Campbell $33,003 $32,452 -1.7% McCook $31,826 $34,239 7.6%
Charles Mix $31,192 $32,455 4.0% McPherson $28,303 $29,905 5.7%
Clark $31,656 $32,075 1.3% Marshall $36,183 $35,997 -0.5%
Clay $35,095 $35,944 2.4% Meade $36,714 $38,511 4.9%
Codington $37,124 $37,192 0.2% Mellette $23,784 $26,013 9.4%
Corson $34,056 $34,813 2.2% Miner $32,345 $31,986 -1.1%
Custer $32,737 $33,552 2.5% Minnehaha $45,173 $46,207 2.3%
Davison $37,030 $37,682 1.8% Moody $35,980 $36,839 2.4%
Day $29,418 $30,020 2.0% Oglala Lakota $37,306 $37,938 1.7%
Deuel $38,283 $39,661 3.6% Pennington $39,240 $39,972 1.9%
Dewey $36,192 $37,189 2.8% Perkins $29,735 $30,627 3.0%
Douglas $32,870 $33,409 1.6% Potter $32,200 $32,951 2.3%
Edmunds $36,889 $36,989 0.3% Roberts $31,843 $33,133 4.1%
Fall River $33,970 $34,987 3.0% Sanborn $30,685 $31,197 1.7%
Table continued on next page.
Annual Pay for Covered Workers by CountyThe table below shows annual pay for covered workers by county for 2015 and 2016. The county with the highest annual pay for 2016 was Union County at $52,142. The majority of South Dakota’s counties experienced increases in annual pay. The highest percentage gains occurred in Mellette, McCook and Bennett counties.
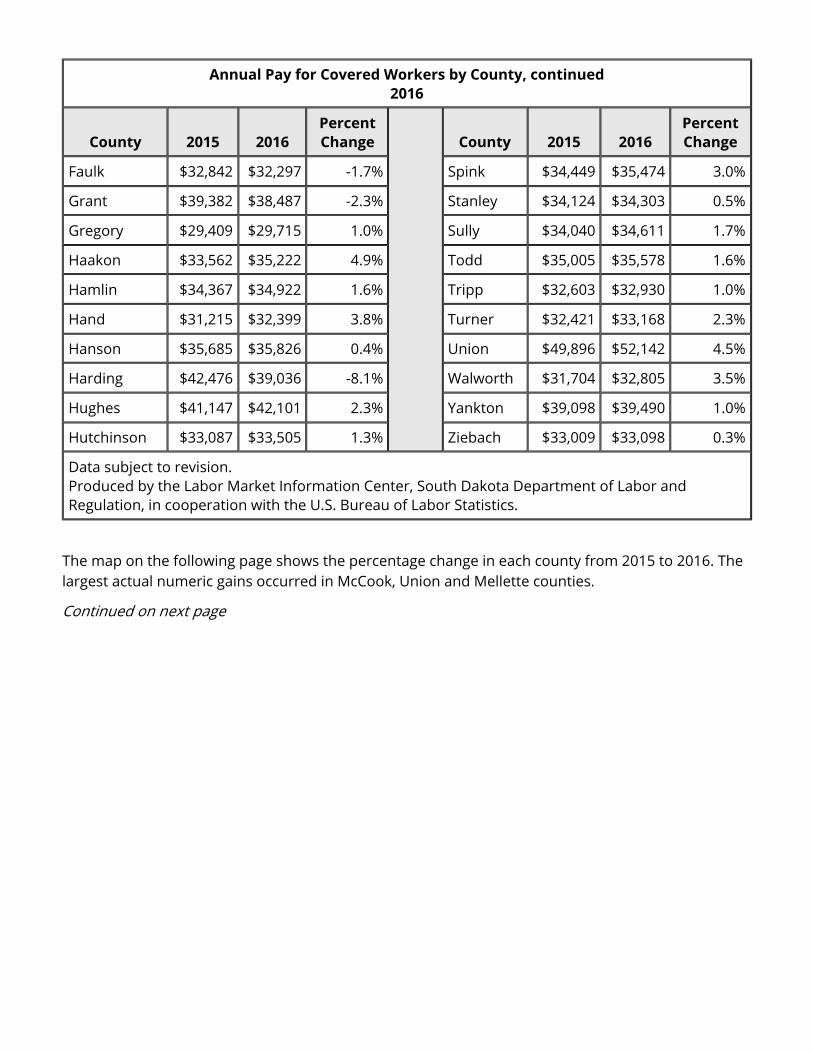
Annual Pay for Covered Workers by County, continued2016
County 2015 2016Percent Change County 2015 2016
Percent Change
Faulk $32,842 $32,297 -1.7% Spink $34,449 $35,474 3.0%
Grant $39,382 $38,487 -2.3% Stanley $34,124 $34,303 0.5%
Gregory $29,409 $29,715 1.0% Sully $34,040 $34,611 1.7%
Haakon $33,562 $35,222 4.9% Todd $35,005 $35,578 1.6%
Hamlin $34,367 $34,922 1.6% Tripp $32,603 $32,930 1.0%
Hand $31,215 $32,399 3.8% Turner $32,421 $33,168 2.3%
Hanson $35,685 $35,826 0.4% Union $49,896 $52,142 4.5%
Harding $42,476 $39,036 -8.1% Walworth $31,704 $32,805 3.5%
Hughes $41,147 $42,101 2.3% Yankton $39,098 $39,490 1.0%
Hutchinson $33,087 $33,505 1.3% Ziebach $33,009 $33,098 0.3%
Data subject to revision.Produced by the Labor Market Information Center, South Dakota Department of Labor and Regulation, in cooperation with the U.S. Bureau of Labor Statistics.
The map on the following page shows the percentage change in each county from 2015 to 2016. The largest actual numeric gains occurred in McCook, Union and Mellette counties.
Continued on next page

Number of Establishments by Size of Establishment, by County Private Ownership Only
2016
County 0-9 10-19 20-49 50-99 100-249 250-499 500+
Aurora 73 8 4 1 1 0 0
Beadle 480 89 57 12 6 1 1
Bennett 55 11 5 1 0 0 0
Bon Homme 162 16 8 3 0 0 0
Brookings 792 139 91 22 12 4 3
Brown 1,093 184 126 29 22 3 3
Brule 204 32 9 2 0 0 0
Buffalo 9 3 1 0 0 0 0
Butte 304 50 18 3 0 0 0
Table continued on next page.
Establishments, Private Ownership Only, by County and Size
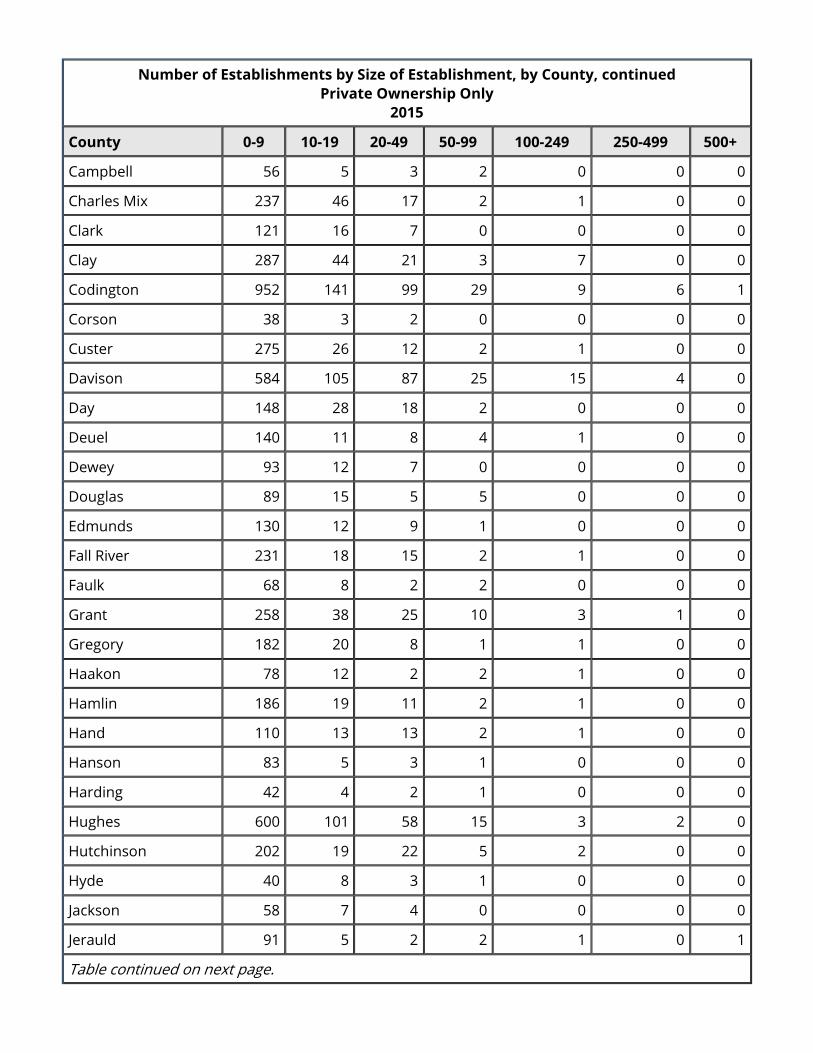
Number of Establishments by Size of Establishment, by County, continuedPrivate Ownership Only
2015
County 0-9 10-19 20-49 50-99 100-249 250-499 500+
Campbell 56 5 3 2 0 0 0
Charles Mix 237 46 17 2 1 0 0
Clark 121 16 7 0 0 0 0
Clay 287 44 21 3 7 0 0
Codington 952 141 99 29 9 6 1
Corson 38 3 2 0 0 0 0
Custer 275 26 12 2 1 0 0
Davison 584 105 87 25 15 4 0
Day 148 28 18 2 0 0 0
Deuel 140 11 8 4 1 0 0
Dewey 93 12 7 0 0 0 0
Douglas 89 15 5 5 0 0 0
Edmunds 130 12 9 1 0 0 0
Fall River 231 18 15 2 1 0 0
Faulk 68 8 2 2 0 0 0
Grant 258 38 25 10 3 1 0
Gregory 182 20 8 1 1 0 0
Haakon 78 12 2 2 1 0 0
Hamlin 186 19 11 2 1 0 0
Hand 110 13 13 2 1 0 0
Hanson 83 5 3 1 0 0 0
Harding 42 4 2 1 0 0 0
Hughes 600 101 58 15 3 2 0
Hutchinson 202 19 22 5 2 0 0
Hyde 40 8 3 1 0 0 0
Jackson 58 7 4 0 0 0 0
Jerauld 91 5 2 2 1 0 1
Table continued on next page.
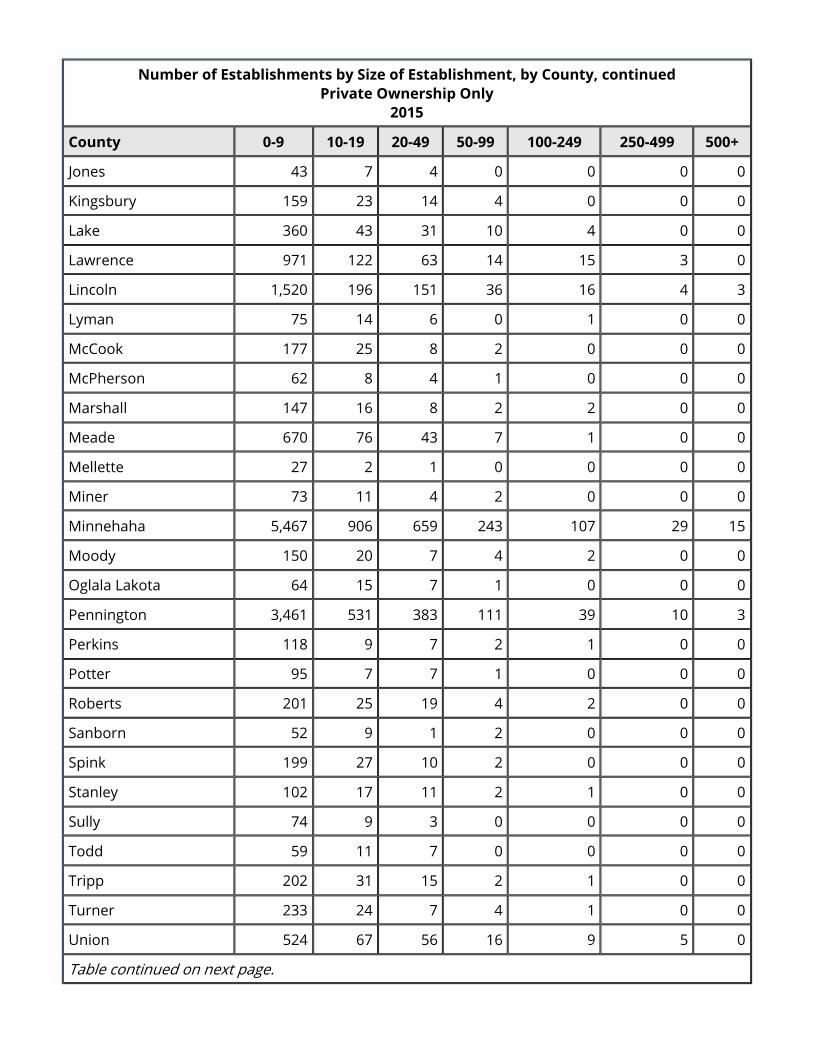
Number of Establishments by Size of Establishment, by County, continuedPrivate Ownership Only
2015
County 0-9 10-19 20-49 50-99 100-249 250-499 500+
Jones 43 7 4 0 0 0 0
Kingsbury 159 23 14 4 0 0 0
Lake 360 43 31 10 4 0 0
Lawrence 971 122 63 14 15 3 0
Lincoln 1,520 196 151 36 16 4 3
Lyman 75 14 6 0 1 0 0
McCook 177 25 8 2 0 0 0
McPherson 62 8 4 1 0 0 0
Marshall 147 16 8 2 2 0 0
Meade 670 76 43 7 1 0 0
Mellette 27 2 1 0 0 0 0
Miner 73 11 4 2 0 0 0
Minnehaha 5,467 906 659 243 107 29 15
Moody 150 20 7 4 2 0 0
Oglala Lakota 64 15 7 1 0 0 0
Pennington 3,461 531 383 111 39 10 3
Perkins 118 9 7 2 1 0 0
Potter 95 7 7 1 0 0 0
Roberts 201 25 19 4 2 0 0
Sanborn 52 9 1 2 0 0 0
Spink 199 27 10 2 0 0 0
Stanley 102 17 11 2 1 0 0
Sully 74 9 3 0 0 0 0
Todd 59 11 7 0 0 0 0
Tripp 202 31 15 2 1 0 0
Turner 233 24 7 4 1 0 0
Union 524 67 56 16 9 5 0
Table continued on next page.
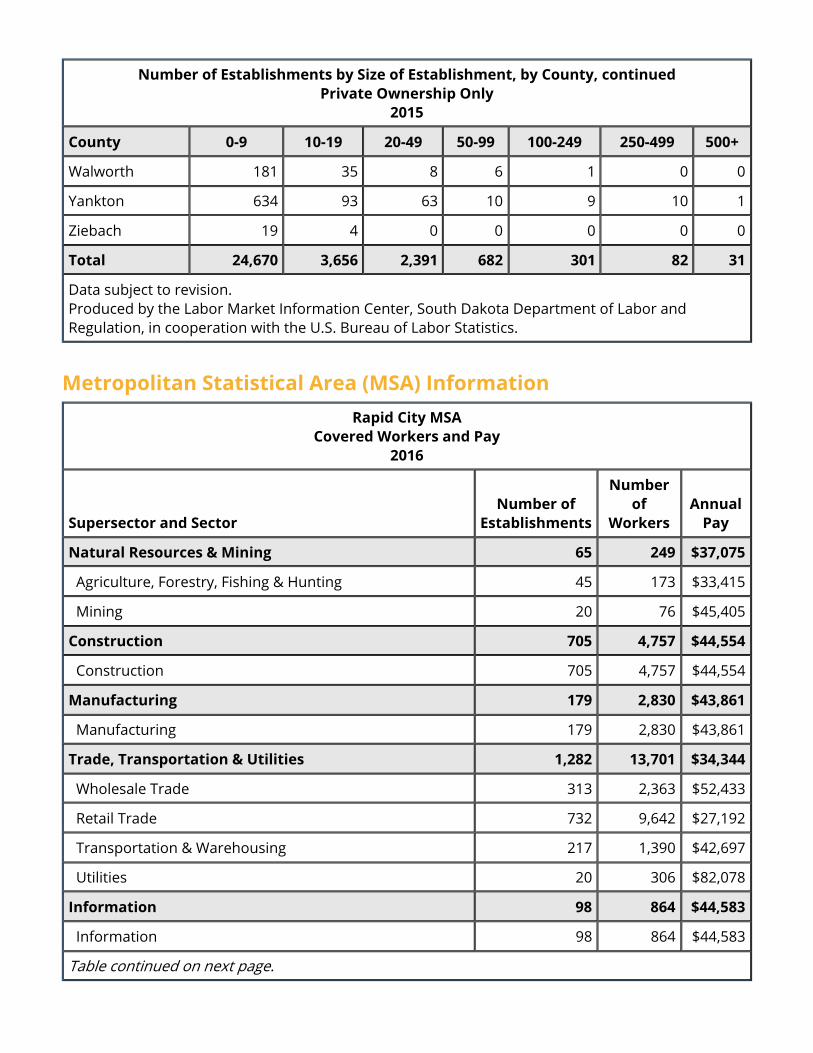
Number of Establishments by Size of Establishment, by County, continuedPrivate Ownership Only
2015
County 0-9 10-19 20-49 50-99 100-249 250-499 500+
Walworth 181 35 8 6 1 0 0
Yankton 634 93 63 10 9 10 1
Ziebach 19 4 0 0 0 0 0
Total 24,670 3,656 2,391 682 301 82 31
Data subject to revision.Produced by the Labor Market Information Center, South Dakota Department of Labor and Regulation, in cooperation with the U.S. Bureau of Labor Statistics.
Rapid City MSACovered Workers and Pay
2016
Supersector and SectorNumber of
Establishments
Number of
WorkersAnnual
Pay
Natural Resources & Mining 65 249 $37,075
Agriculture, Forestry, Fishing & Hunting 45 173 $33,415
Mining 20 76 $45,405
Construction 705 4,757 $44,554
Construction 705 4,757 $44,554
Manufacturing 179 2,830 $43,861
Manufacturing 179 2,830 $43,861
Trade, Transportation & Utilities 1,282 13,701 $34,344
Wholesale Trade 313 2,363 $52,433
Retail Trade 732 9,642 $27,192
Transportation & Warehousing 217 1,390 $42,697
Utilities 20 306 $82,078
Information 98 864 $44,583
Information 98 864 $44,583
Table continued on next page.
Metropolitan Statistical Area (MSA) Information
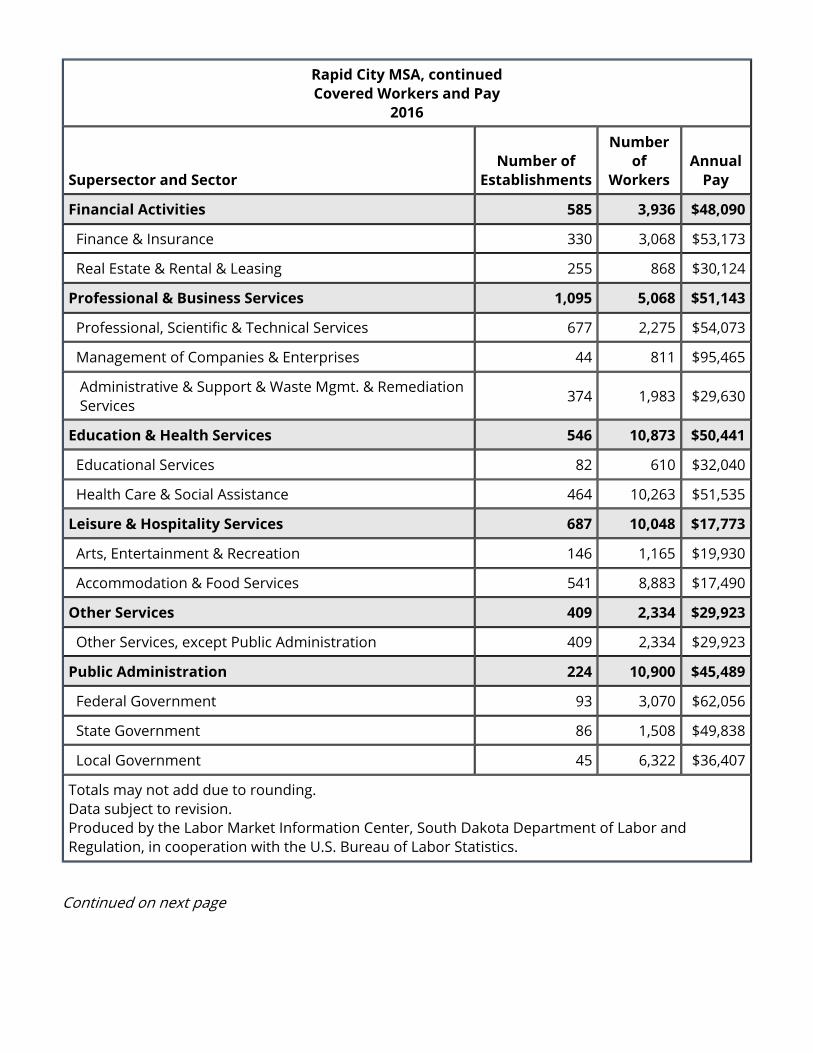
Rapid City MSA, continuedCovered Workers and Pay
2016
Supersector and SectorNumber of
Establishments
Number of
WorkersAnnual
Pay
Financial Activities 585 3,936 $48,090
Finance & Insurance 330 3,068 $53,173
Real Estate & Rental & Leasing 255 868 $30,124
Professional & Business Services 1,095 5,068 $51,143
Professional, Scientific & Technical Services 677 2,275 $54,073
Management of Companies & Enterprises 44 811 $95,465
Administrative & Support & Waste Mgmt. & Remediation Services 374 1,983 $29,630
Education & Health Services 546 10,873 $50,441
Educational Services 82 610 $32,040
Health Care & Social Assistance 464 10,263 $51,535
Leisure & Hospitality Services 687 10,048 $17,773
Arts, Entertainment & Recreation 146 1,165 $19,930
Accommodation & Food Services 541 8,883 $17,490
Other Services 409 2,334 $29,923
Other Services, except Public Administration 409 2,334 $29,923
Public Administration 224 10,900 $45,489
Federal Government 93 3,070 $62,056
State Government 86 1,508 $49,838
Local Government 45 6,322 $36,407
Totals may not add due to rounding.Data subject to revision.Produced by the Labor Market Information Center, South Dakota Department of Labor and Regulation, in cooperation with the U.S. Bureau of Labor Statistics.
Continued on next page
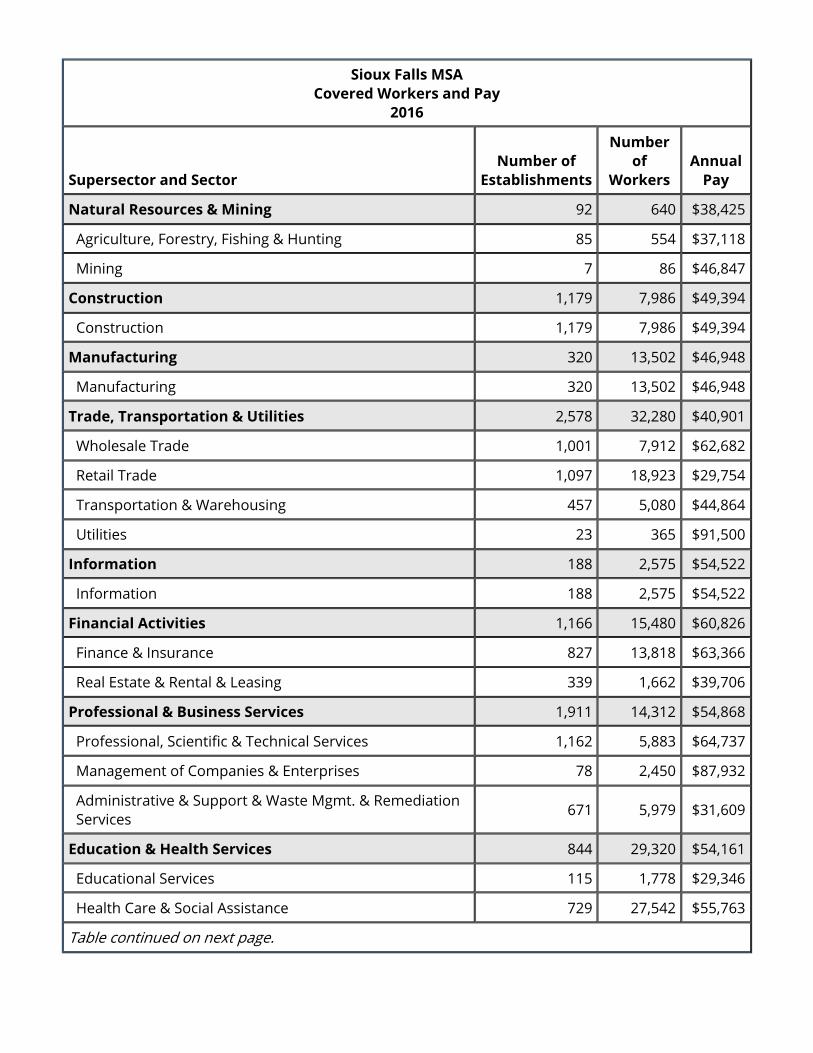
Sioux Falls MSACovered Workers and Pay
2016
Supersector and SectorNumber of
Establishments
Number of
WorkersAnnual
Pay
Natural Resources & Mining 92 640 $38,425
Agriculture, Forestry, Fishing & Hunting 85 554 $37,118
Mining 7 86 $46,847
Construction 1,179 7,986 $49,394
Construction 1,179 7,986 $49,394
Manufacturing 320 13,502 $46,948
Manufacturing 320 13,502 $46,948
Trade, Transportation & Utilities 2,578 32,280 $40,901
Wholesale Trade 1,001 7,912 $62,682
Retail Trade 1,097 18,923 $29,754
Transportation & Warehousing 457 5,080 $44,864
Utilities 23 365 $91,500
Information 188 2,575 $54,522
Information 188 2,575 $54,522
Financial Activities 1,166 15,480 $60,826
Finance & Insurance 827 13,818 $63,366
Real Estate & Rental & Leasing 339 1,662 $39,706
Professional & Business Services 1,911 14,312 $54,868
Professional, Scientific & Technical Services 1,162 5,883 $64,737
Management of Companies & Enterprises 78 2,450 $87,932
Administrative & Support & Waste Mgmt. & Remediation Services 671 5,979 $31,609
Education & Health Services 844 29,320 $54,161
Educational Services 115 1,778 $29,346
Health Care & Social Assistance 729 27,542 $55,763
Table continued on next page.

Sioux Falls MSA, continuedCovered Workers and Pay
2016
Supersector and SectorNumber of
Establishments
Number of
WorkersAnnual
Pay
Leisure & Hospitality Services 814 15,055 $16,666
Arts, Entertainment & Recreation 202 2,828 $16,976
Accommodation & Food Services 612 12,227 $16,595
Other Services 741 3,813 $32,898
Other Services, except Public Administration 741 3,813 $32,898
Public Administration 273 13,573 $46,630
Federal Government 81 2,702 $68,663
State Government 78 1,455 $48,912
Local Government 114 9,416 $39,954
Totals may not add due to rounding.Data subject to revision.Produced by the Labor Market Information Center, South Dakota Department of Labor and Regulation, in cooperation with the U.S. Bureau of Labor Statistics.
Rapid City MSANumber of Establishments, Workers & Payby Establishment Size and by Supersector
2016
Supersector 0-9 10-19 20-49 50-99 100-249 250-499 500+
Natural Resources and Mining
Establishments 60 2 3 0 0 0 0
Workers 138 26 85 0 0 0 0
Annual Pay $35,767 $32,896 $40,476 $0 $0 $0 $0
Construction
Establishments 593 66 34 9 3 0 0
Workers 1,669 869 1,018 652 549 0 0
Annual Pay $35,699 $44,101 $48,202 $54,671 $53,412 $0 $0
Table continued on next page.
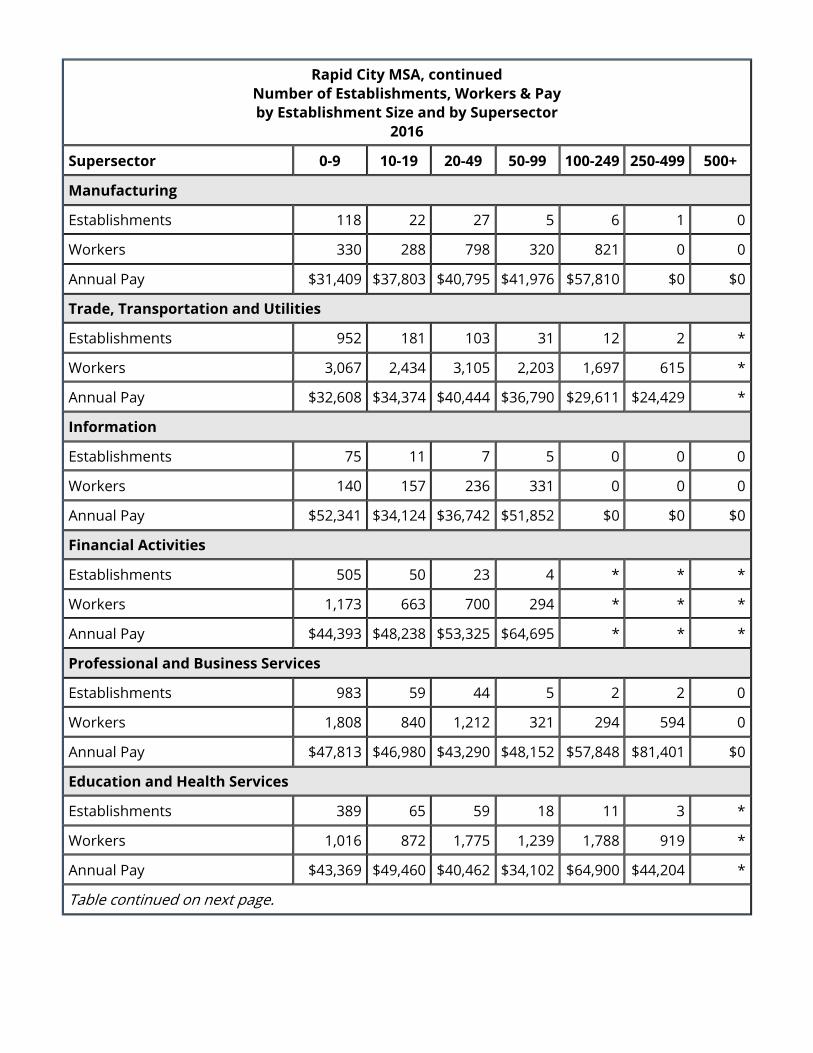
Rapid City MSA, continuedNumber of Establishments, Workers & Payby Establishment Size and by Supersector
2016
Supersector 0-9 10-19 20-49 50-99 100-249 250-499 500+
Manufacturing
Establishments 118 22 27 5 6 1 0
Workers 330 288 798 320 821 0 0
Annual Pay $31,409 $37,803 $40,795 $41,976 $57,810 $0 $0
Trade, Transportation and Utilities
Establishments 952 181 103 31 12 2 *
Workers 3,067 2,434 3,105 2,203 1,697 615 *
Annual Pay $32,608 $34,374 $40,444 $36,790 $29,611 $24,429 *
Information
Establishments 75 11 7 5 0 0 0
Workers 140 157 236 331 0 0 0
Annual Pay $52,341 $34,124 $36,742 $51,852 $0 $0 $0
Financial Activities
Establishments 505 50 23 4 * * *
Workers 1,173 663 700 294 * * *
Annual Pay $44,393 $48,238 $53,325 $64,695 * * *
Professional and Business Services
Establishments 983 59 44 5 2 2 0
Workers 1,808 840 1,212 321 294 594 0
Annual Pay $47,813 $46,980 $43,290 $48,152 $57,848 $81,401 $0
Education and Health Services
Establishments 389 65 59 18 11 3 *
Workers 1,016 872 1,775 1,239 1,788 919 *
Annual Pay $43,369 $49,460 $40,462 $34,102 $64,900 $44,204 *
Table continued on next page.
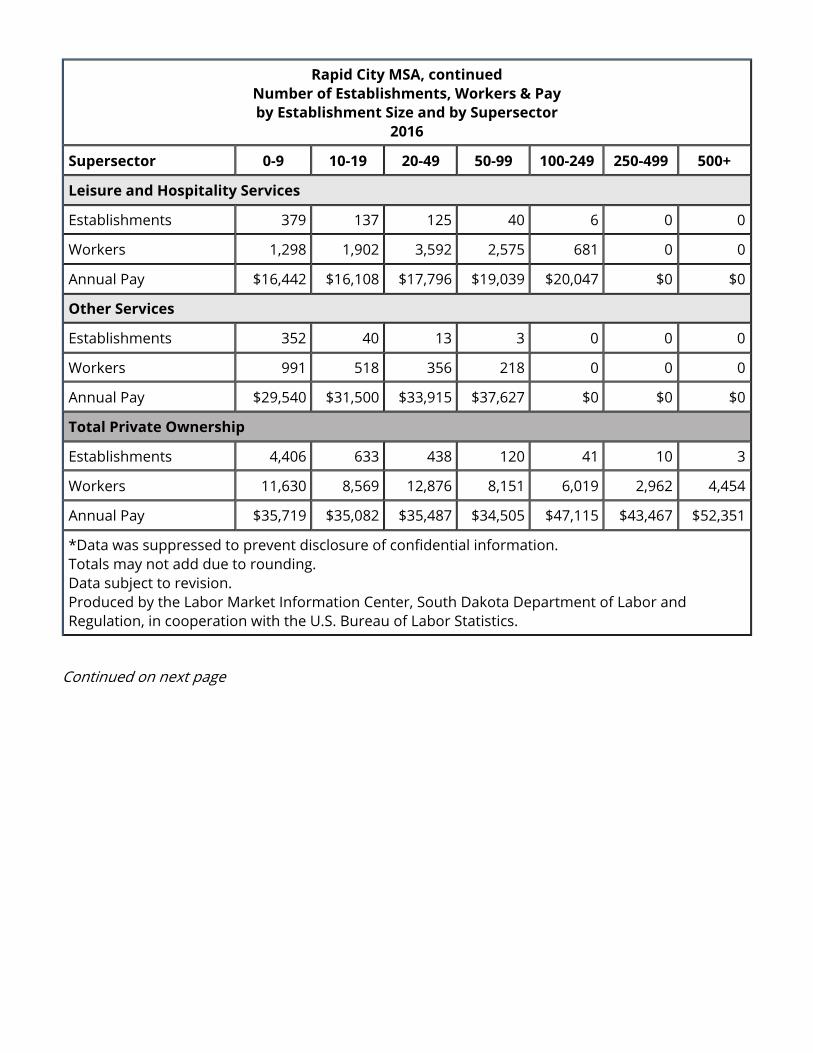
Rapid City MSA, continuedNumber of Establishments, Workers & Payby Establishment Size and by Supersector
2016
Supersector 0-9 10-19 20-49 50-99 100-249 250-499 500+
Leisure and Hospitality Services
Establishments 379 137 125 40 6 0 0
Workers 1,298 1,902 3,592 2,575 681 0 0
Annual Pay $16,442 $16,108 $17,796 $19,039 $20,047 $0 $0
Other Services
Establishments 352 40 13 3 0 0 0
Workers 991 518 356 218 0 0 0
Annual Pay $29,540 $31,500 $33,915 $37,627 $0 $0 $0
Total Private Ownership
Establishments 4,406 633 438 120 41 10 3
Workers 11,630 8,569 12,876 8,151 6,019 2,962 4,454
Annual Pay $35,719 $35,082 $35,487 $34,505 $47,115 $43,467 $52,351
*Data was suppressed to prevent disclosure of confidential information.Totals may not add due to rounding.Data subject to revision.Produced by the Labor Market Information Center, South Dakota Department of Labor and Regulation, in cooperation with the U.S. Bureau of Labor Statistics.
Continued on next page
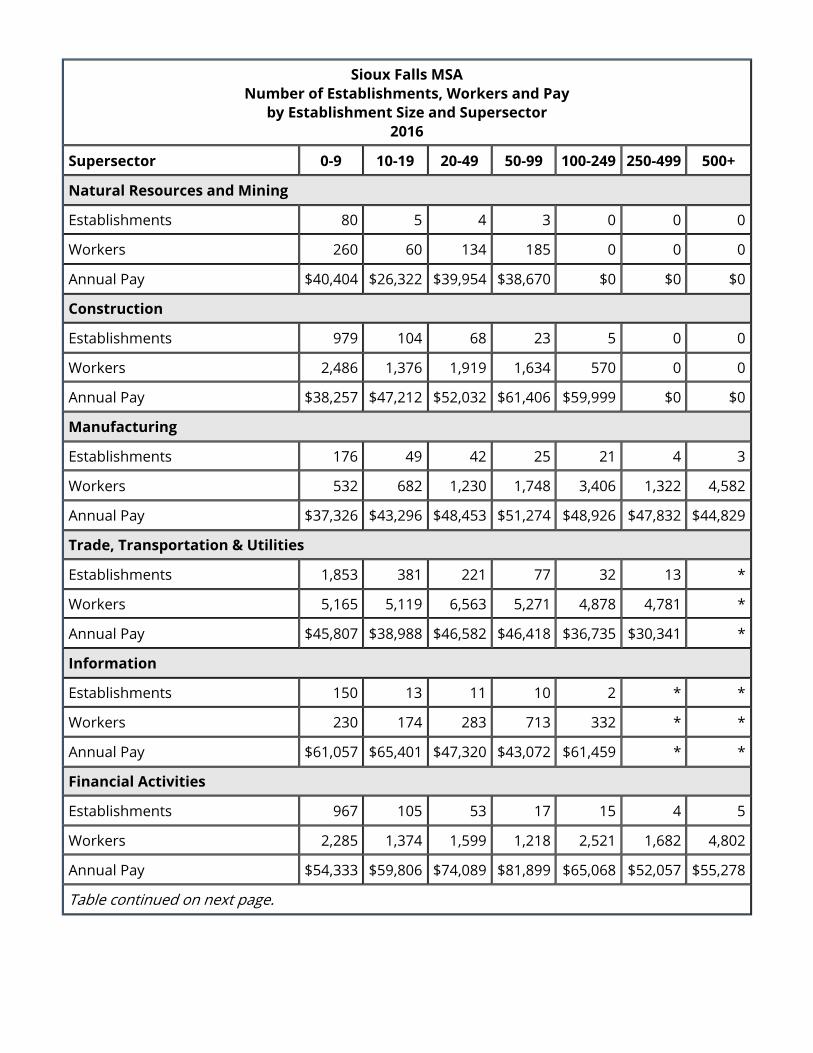
Sioux Falls MSANumber of Establishments, Workers and Pay
by Establishment Size and Supersector2016
Supersector 0-9 10-19 20-49 50-99 100-249 250-499 500+
Natural Resources and Mining
Establishments 80 5 4 3 0 0 0
Workers 260 60 134 185 0 0 0
Annual Pay $40,404 $26,322 $39,954 $38,670 $0 $0 $0
Construction
Establishments 979 104 68 23 5 0 0
Workers 2,486 1,376 1,919 1,634 570 0 0
Annual Pay $38,257 $47,212 $52,032 $61,406 $59,999 $0 $0
Manufacturing
Establishments 176 49 42 25 21 4 3
Workers 532 682 1,230 1,748 3,406 1,322 4,582
Annual Pay $37,326 $43,296 $48,453 $51,274 $48,926 $47,832 $44,829
Trade, Transportation & Utilities
Establishments 1,853 381 221 77 32 13 *
Workers 5,165 5,119 6,563 5,271 4,878 4,781 *
Annual Pay $45,807 $38,988 $46,582 $46,418 $36,735 $30,341 *
Information
Establishments 150 13 11 10 2 * *
Workers 230 174 283 713 332 * *
Annual Pay $61,057 $65,401 $47,320 $43,072 $61,459 * *
Financial Activities
Establishments 967 105 53 17 15 4 5
Workers 2,285 1,374 1,599 1,218 2,521 1,682 4,802
Annual Pay $54,333 $59,806 $74,089 $81,899 $65,068 $52,057 $55,278
Table continued on next page.
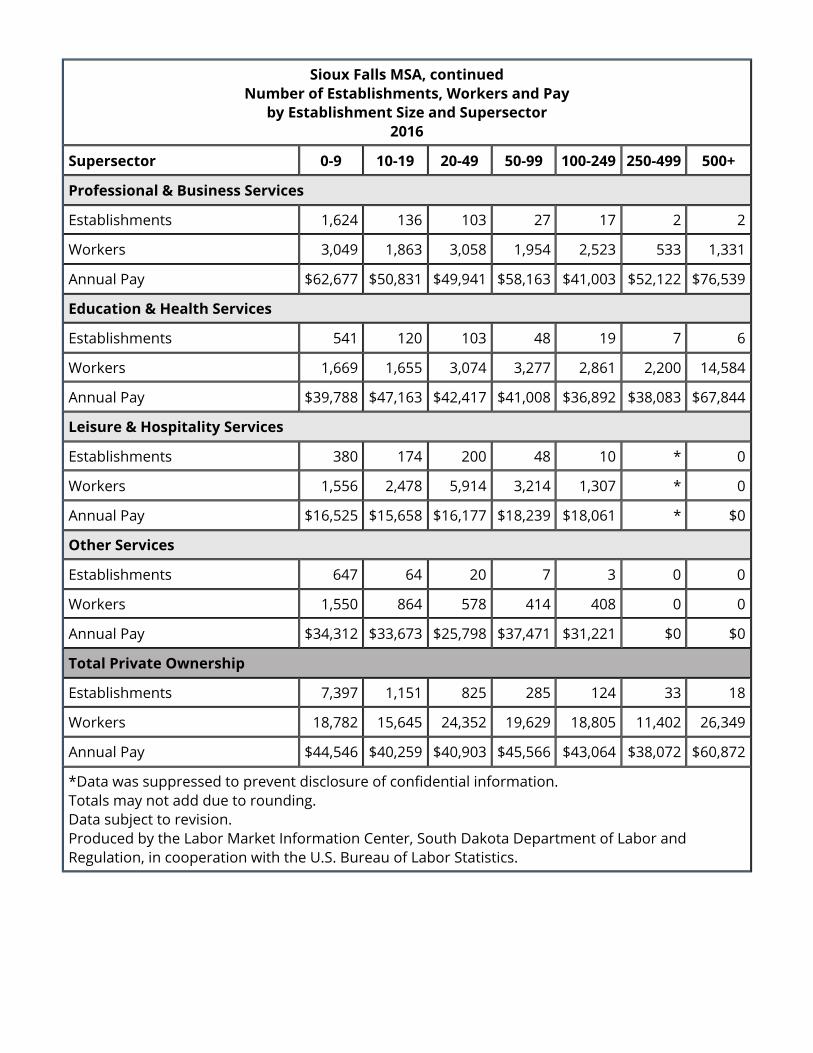
Sioux Falls MSA, continuedNumber of Establishments, Workers and Pay
by Establishment Size and Supersector2016
Supersector 0-9 10-19 20-49 50-99 100-249 250-499 500+
Professional & Business Services
Establishments 1,624 136 103 27 17 2 2
Workers 3,049 1,863 3,058 1,954 2,523 533 1,331
Annual Pay $62,677 $50,831 $49,941 $58,163 $41,003 $52,122 $76,539
Education & Health Services
Establishments 541 120 103 48 19 7 6
Workers 1,669 1,655 3,074 3,277 2,861 2,200 14,584
Annual Pay $39,788 $47,163 $42,417 $41,008 $36,892 $38,083 $67,844
Leisure & Hospitality Services
Establishments 380 174 200 48 10 * 0
Workers 1,556 2,478 5,914 3,214 1,307 * 0
Annual Pay $16,525 $15,658 $16,177 $18,239 $18,061 * $0
Other Services
Establishments 647 64 20 7 3 0 0
Workers 1,550 864 578 414 408 0 0
Annual Pay $34,312 $33,673 $25,798 $37,471 $31,221 $0 $0
Total Private Ownership
Establishments 7,397 1,151 825 285 124 33 18
Workers 18,782 15,645 24,352 19,629 18,805 11,402 26,349
Annual Pay $44,546 $40,259 $40,903 $45,566 $43,064 $38,072 $60,872
*Data was suppressed to prevent disclosure of confidential information.Totals may not add due to rounding.Data subject to revision.Produced by the Labor Market Information Center, South Dakota Department of Labor and Regulation, in cooperation with the U.S. Bureau of Labor Statistics.