Embed Size (px)
Citation preview
FORMAT EVALUATION FOR AN
AIRBORNE AIR TRAFFIC SITUATION DISPLAY
by
ROBERT EDWARD ANDERSON
S.B., Massachusetts Institute of Technology
(1969)
SUBMITTED IN PARTIAL FULFILLMENT
OF THE REQUIREMENTS FOR THE
DEGREE OF MASTER OF SCIENCE
at the
MASSACHUSETTS INSTITUTE OF TECHNOLOGY
June, 1971
Signature of Author
Department of Aeronautics
and Astronautics, June 1971
Certified by
Thesis Supervisor '
Accepted by
Chairman, Departmental
Graduate Committee
FORMAT EVALUATION FOR ANAIRBORNE AIR TRAFFIC SITUATION DISPLAY
by
ROBERT E. ANDERSON
Submitted to the Department of Aeronautics and Astronautics on June 1,1971 in partial fulfillment of the requirements for the degree of Masterof Science in Aeronautics and Astronautics.
ABSTRACT
By the mid-1970' s, the evolving National Airspace System/AutomaticRadar Terminal System (NAS/ARTS) ground environment will providethe air traffic controllers with high quality computer -processed trafficsituation displays. It has been suggested that it would be useful, par -ticularly in busy terminal areas, to display some of this data in thecockpit.
It is the goal of this thesis to provide guidelines for the format of sucha cockpit display. A Boeing 707 fixed base simulator with computergenerated displays of the basic flight instruments and the proposedtraffic situation display is used in the testing. Two phases of testingare pursued: first, to compare the display of traffic data (speed, altitude,and identification) in moving tags and in sidelined tables, and second,to investigate the effects of display size and orientation as well as dis-continuity of display motion on performing simple traffic followingmaneuvers.
Thesis Supervisor: Renwick E. Curry, Ph. D
Title: Assistant Professor of Aeronautics and Astronautics
- 2-

ACKNOWLEDGEMENTS
The work reported here is part of a project in air traffic control carriedout by the following MIT Laboratories: Lincoln Laboratory, ElectronicSystems Laboratory, Flight Transportation Laboratory, and Man-VehicleLaboratory. Lincoln Laboratory has provided the basic coordination andsupport under Contract F19628-70-C-0230 with the Department of the AirForce. The guidance of Professor R. E. Curry of the Department ofAeronautics and Astronautics and association with the Man-VehicleLaboratory were essential to the completion of this work. Special appre-ciation is extended to Mark E. Connelly, research staff member in theElectronic Systems Laboratory, who coordinated the on-campus effort,including assembly of the simulation facility used in these studies. RobertRausch, also of the ESL research staff, was indispensible in helping withthe programming effort; and Thomas Imrich, a fellow graduate studentwho is associated with the Flight Transportation Laboratory' s part inthe study, provided invaluable information from first hand experiencewith the air traffic control environment through many hours of flyingtime and personal contacts. Dr. A. Natapoff of the MVL researchstaff was of great help in planning the data analysis. Dr. R. W. Bushof Lincoln Laboratory provided much needed encouragement and essentialliason with the prototype planning group.
-3-

TABLE OF CONTENTS
page
ABSTRACT 2
ACKNOWLEDGEMENTS 3
TABLE OF CONTENTS 4
LIST OF FIGURES 6
CHAPTER 1 Introduction 7
CHAPTER 2 Display Format Options 12
2. 1 Background Reference (Map) 12
2.2 Other Traffic 14
2.3 Alphanumerics 15
2.4 Display Scales 16
2. 5 Scope Size 16
2.6 Fixed Items and Scale References 17
CHAPTER 3 Experimental Design 18
3. 1 Phase 1 Introduction 18
3.2 Phase 1 Test 20
3.3 Phase 2 23
3.4 Head Orientation Monitor 29
3.5 Side Task 32
3.6 Flight Performance Measures 35
CHAPTER 4 Experimental Results 36
4.1 Phase 1 Test Results 36
4.2 Phase 2 Test Results 40
4.3 Pilot Questionaire Results (Phase 2) 47
CHAPTER 5 Summary of Experimental Findingsand Recommendations 50
5. 1 Summary of Experimental Findings 50
5.2 Recommendations for Display Format 51
5.3 Recommendation for Further Study 53
-4-

APPENDIX A Coded Experimental Design (Phase 2)
APPENDIX B Analysis of Variance Results (Phase 2)and Student' s t-test Results
APPENDIX C Pilot Questionnaire (Phase 2)
BIBLIOGRAPHY
-5-
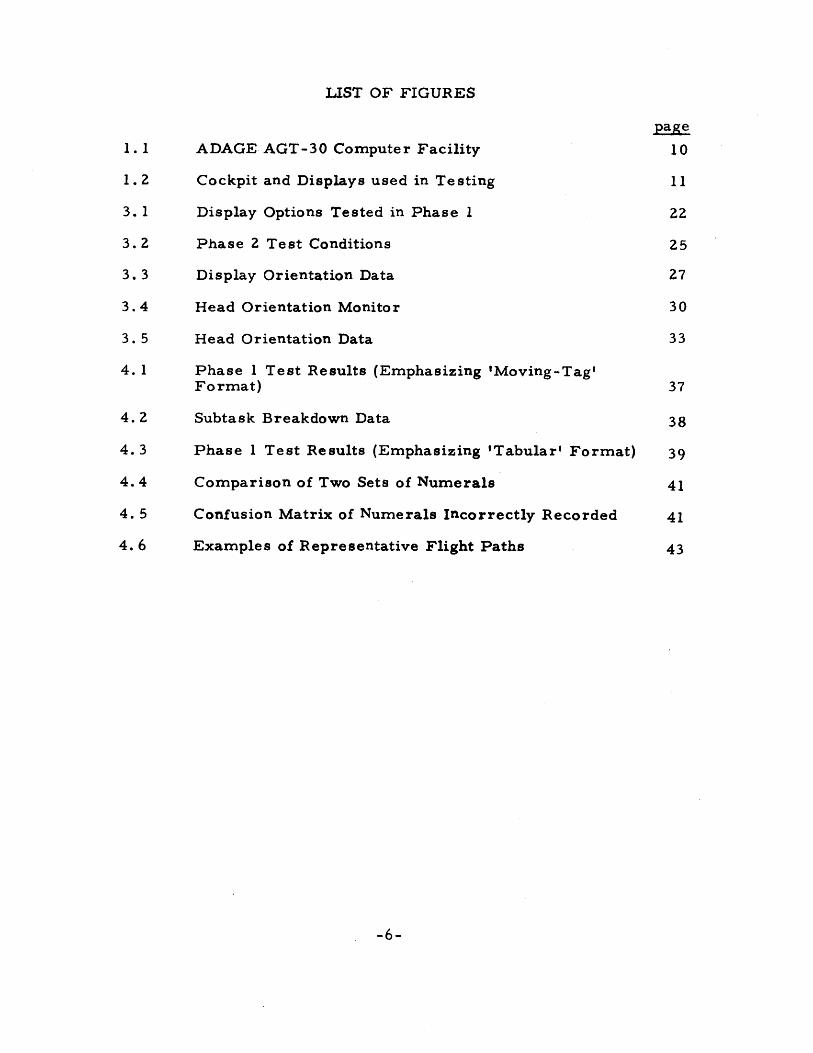
LIST OF FIGURES
page1.1 ADAGE AGT-30 Computer Facility 10
1.2 Cockpit and Displays used in Testing 11
3. 1 Display Options Tested in Phase 1 22
3.2 Phase 2 Test Conditions 25
3.3 Display Orientation Data 27
3.4 Head Orientation Monitor 30
3. 5 Head Orientation Data 33
4.1 Phase 1 Test Results (Emphasizing 'Moving-Tag'Format) 37
4.2 Subtask Breakdown Data 38
4. 3 Phase 1 Test Results (Emphasizing 'Tabular' Format) 39
4. 4 Comparison of Two Sets of Numerals 41
4. 5 Confusion Matrix of Numerals Incorrectly Recorded 41
4. 6 Examples of Representative Flight Paths 43
-6-

CHAPTER I
INTRODUCTION
One of the critical problems in air traffic control is the substan-
tial reduction of the terminal area capacity under restricted visibility
conditions in comparison with that routinely achieved during clear condi-
tions. 13 Without visual contact between the aircraft in the area or visual
ground contact, the controllers have the task of giving speed and radar
vector commands to each aircraft, as well as advising each pilot of other
traffic in his area. Concurrently, the controller has to achieve proper
spacing of the aircraft on approach to bring them all safely down to the
ground. Over the next decade, the evolving National Airspace System/
Automated Radar Terminal System (NAS/ARTS) will gradually provide
5, 6,11the controller with better data and aids to perform his job. One
of the major items will be computer processed transponder data from
the beacon equipped aircraft in the terminal area. Eventually all air -
craft in high density areas will be equipped with Mode C beacons which
respond with their identification and altitude when interrogated by the
ground system.
It has been indicated by Lincoln Laboratory that a high-quality
transmission of selected segments of the data appearing on the controller' s
scope can be relayed over a narrow band digital data link to the aircraft
in the area. Systems with this objective have been constructed and tested
at least three times in the past 25 years, but these earlier systems could
not benefit from: 1) a source of computer -processed data of the quality to
-7-
-8-
be available from NAS/ARTS; 2) aircraft altitude information; 3) contem-
porary digital data link techniques; and 4) airborne equipment capable of
automatically selecting and displaying only information relevant to a par -
ticular airplane. It is believed that an effective cockpit display would
permit pilots, under IFR conditions, to retain some of the station keeping
and navigation functions they perform during VFR conditions and thereby
improve the efficiency of terminal area operations. A small airborne com-
puter can process ground-generated and cockpit-generated data to provide
a display of the relevant portion of the air traffic situation and possibly a
picture of the route structure being traversed.
The variety of roles that such a display might play is virtually
unlimited. It might be envisioned that the controller interjects spacing
commands through the display or it may serve simply as a reassurance
device.
With the general system being considered, 1' 3 the pilot would
be able to select the dimensions of the block of airspace to be displayed.
The selection would include altitude bands above and below his own flight
level and the forward viewing range. The display of the various data items
associated with each aircraft would be at his option as well.
Though the display of traffic information in the cockpit is not new,
the availability of a digitized data base and the current state of the art in
data links makes implementation much more, feasible at this time. This
particular formulation of the concept is novel enough that there are many
basic areas which need to be investigated via simulation prior to investing
in an operational airborne system.
-9-
This particular research effort is intended to provide data in support
or refutation of some of the concepts being considered for the display for -
mat in the prototype system.
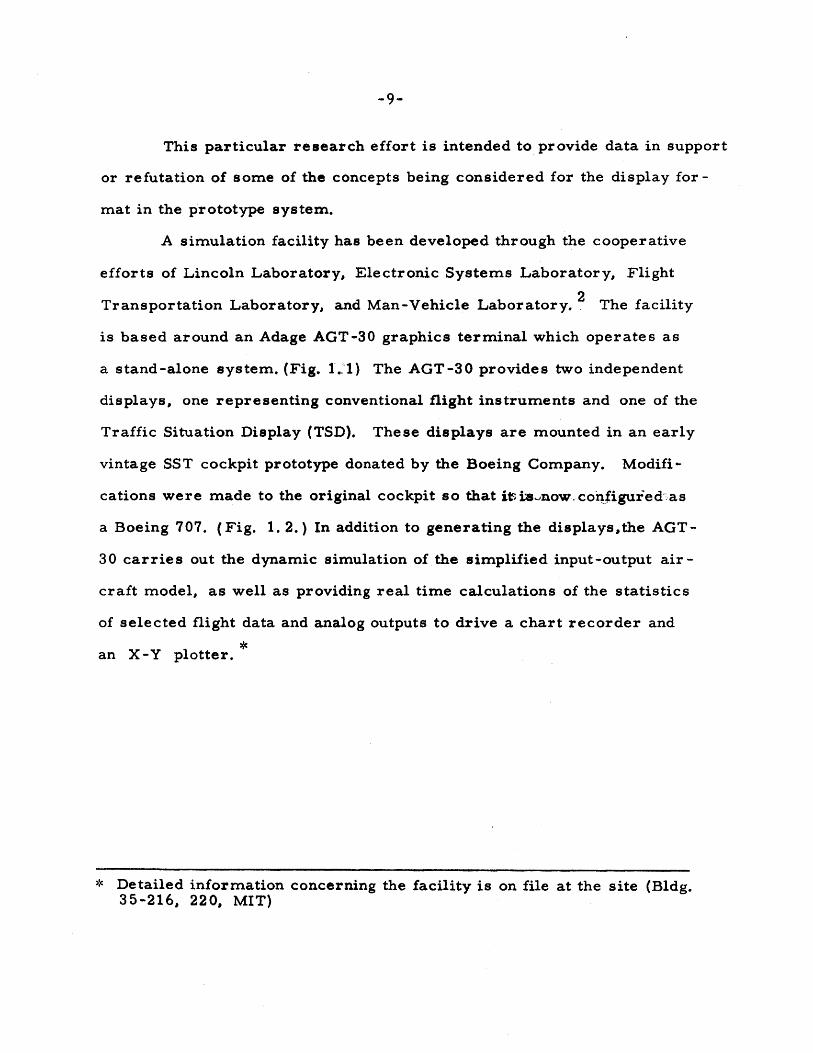
A simulation facility has been developed through the cooperative
efforts of Lincoln Laboratory, Electronic Systems Laboratory, Flight
2Transportation Laboratory, and Man-Vehicle Laboratory. 2 The facility
is based around an Adage AGT-30 graphics terminal which operates as
a stand-alone system. (Fig. 1. 1) The AGT-30 provides two independent
displays, one representing conventional flight instruments and one of the
Traffic Situation Display (TSD). These displays are mounted in an early
vintage SST cockpit prototype donated by the Boeing Company. Modifi-
cations were made to the original cockpit so that its isnow.configuied as
a Boeing 707. (Fig. 1. 2.) In addition to generating the displays,the AGT-
30 carries out the dynamic simulation of the simplified input-output air -
craft model, as well as providing real time calculations of the statistics
of selected flight data and analog outputs to drive a chart recorder and
an X-Y plotter.
* Detailed information concerning the facility is on file at the site (Bldg.35-216, 220, MIT)
Fig. 1.1 Adage AGT-30 Computer Facility with R. Rausch standing and R. Anderson seated.The cockpit room is visible at the right of the picture.

Fig. 1.2 Cockpit and Displays used in testing.
CHAPTER 2
DISPLAY FORMAT OPTIONS
The following is a review of what may be called format options or
display parameters for the design of an airborne TSD using data linked
information from ARTS-Ill. This is basically a listing of the features that
compose the display and a commentary on the various factors relating to
each one. Subsequent sections will describe the tests designed to provide
data on the features described here.
The presentation variables are:
1. Background reference (map)
2. Traffic
3. Alpha-numerics
4. Display scales (miles per inch)
5. Scope size (diameter)
6. Fixed items and scale references
2. 1 Background Reference (Map)
This reference element can take form in various levels of complexity.
Between the extremes of no background reference and a facsimile of a
Jeppesen chart lie a nondescript grid and a simple map with only standard
air routes and navigation fixes. Several considerations which will influence
the selection of the reference to be provided are the desirability of some
area navigation capability and the fact that Ieppesen charts will be available
in the cockpit to provide any detailed information which is desired. A rea-
sonable provision is therefore some form of map presenting less information
than is available on standard charts and approach plates.

-13-
Whatever the form or content of the map, certain other decisions
regarding its orientation and motion must be made. For translation, the
first level of decision is whether the map will move so your aircraft is
always in the same position of the display, or the map will be fixed and
the symbol of your aircraft will move across it. Very simple estimates
of the greatest number of miles per inch that it is reasonable to put on
the display and the number of miles travelled in terminal area operation
quickly indicate the difficulty with a fixed map for :our applications. In
the case of your aircraft symbol remaining fixed near the center of the
display, there still remain a number of variations for the presentation.
The map can be oriented so that UP corresponds to north or the
aircraft' s heading, though numerous reports have shown that confusion
arises when travelling south on &anoth UP disP1wy 9. On the other hand,
a heading oriented display may also prove difficult to interpret, as indi-
cated by collisions of ships equipped with such displays.
The position of your aircraft for centering the map may come from
the uplinked ground radar data or from onboard radio navigation equipment
and/or onboard air data. Since the radar update is every-four secondswhile
radio navigation is continuous, the map translation can be either continuous
or in four second jumps regardless of the orientation. The possible prob-
lems in the compatability of relative motion of map and traffic will be em-
phasized in the next section.
In summary, the combined options for map orientation and translation
are: continuous or four second jumps on translation; north or heading UP;
and continuous or four second jumps on the orientation when heading is UP.

-14-
This gives 5 possible combinations, discounting continuous translation with
jumping heading orientation.
2. 2 Other Traffic
Probably the most important feature of the overall concept is the
presentation of selected traffic information. Simple operations on the new
data which is available every four seconds can provide the relative position
of all other aircraft in the area. This information allows the placement of
nondirectional symbols on the display corresponding to each aircraft of
interest. Keeping a record of the past few positions of those aircraft being
displayed allows adding history tracers to the nondirectional symbols. Track-
ing of selected aircraft can provide both directional and predictive informa-
tion. The symbol may then be chosen to depict the direction in which the
aircraft is moving and either show a predictive vector or actually provide
continuous motion of the symbol through prediction. The history tracers
may, of course, be included while tracking and prediction are being used.
It must be realized that the predictions will be in error while the aircraft
deviates from a steady state flight condition.
Higher data rates than once every four seconds may be available in
the future. These higher rates may reduce the significance of any differ-
ences which are found to exist between the acceptability of traffic symbols
moving continuously through prediction and those jumping at the basic up-
date rate.
If the map translation is discontinuous, there will probably not be
any question about how the traffic moves since they will jump together.
However, if the map has continuous translation, a choice exists for dis -
playing continuous traffic or unpredicted traffic (having discontinuous
-15-
motion) between updates. Their coordinates may be frozen so they stay
fixed relative to the translating map, or they can stay at a fixed range
from your aircraft' s symbol on the display. Either case can result in
extremes of misrepresentation.
There is one other consideration which may have a strong influ-
ence on the desirability of the airborne system tracking selected traffic.
The ground system sweeps the sky at a rate of one revolution every four
seconds. If data goes directly from the ground receiver to the airborne
display we would have current information at this basic interrogation rate.
As we introduce delays for collecting and processing the data on the ground,
for transmitting the data over a narrow band data link, and for airborne pro-
cessing prior to display update, the presentation immediately after an update
may still be based on data which is several seconds old. Tracking and pre -
diction could take out these processing lags over steady state portions of the
traffic' s flight. The new errors which arise during turns and speed changes
must be considered, however.
2.3 Alphanumerics
The data link provides identification, altitude, and tracking estimates
of ground speed for all mode-C transponder -equipped aircraft. There are
elements of this alphanumeric data which would be desirable to present on
the display in such a way that they can be easily associated with their respec-
tive aircraft. The type of alphanumeric information useful to the pilot de-
pends on the task he is performing. Data from the literature8 provides a
guide to character size. The effects of the characters moving across the
display face, possibly in jumps, will depend upon the beam width and

-16-
persistence properties of the particular scope. An alternative presenta-
tion of alphanumerics in tabular form is possible. This may improve leg-
ibility and reduce clutter, but will introduce difficulty in associating an
aircraft with its data tag. Vibration within the cockpit and the angle of
viewing will effect the operational acceptability of the alphanumerics. The
particular font selections and choice between stroke or dot raster charac-
ters will also require attention. 12
2. 4 Display Scales
There are three variables which have a direct relationship upon one
another: the display scale (in miles/inch), the field of view of the display
(in miles), and the scope size (in inches). Specifying any two determine
the third. Since each phase of an approach has a characteristic range of
viewing interest (field of view) and a set of tolerances for performing ma-
neuvers, a variety of scales (miles per inch) will be required. Each view-
ing scale must display enough range to provide basic collision avoidance
capability as well as presenting all of the picture needed to plan and exe -
cute the current maneuver. The precision possible in an aircraft- following
task will depend on the number of inches on the display corresponding to
the desired separation. The value of the scale setting must be easily and
unambigouously identifiable.
2. 5 Scope Size
If, as stated in the previous paragraph, the phase of the flight spe-
cifies a desired field of view, then the scale of the display can be adjusted
so that this desired view fills whatever size of a display is available. This
means that there will be more miles per inch on a smaller display, and the
-17-
alphanumerics, which will have to remain a legible size, will fill up more
of the display area. The acceptability of this imposed change in scale and
added clutter should be examined to determine the reaction to a small scope
which may be required in certain aircraft.
2. 6 Fixed Items and Scale References
Special consideration will be required to define those features of
the display which relate to your aircraft: there should be unique symbols
for your position, other aircraft, and possibly additional lines to indicate
selected ranges and bearings.
CHAPTER 3
EXPERIMENTAL DESIGN
The previous chapter outlines some of the features which require
consideration when designing a TSD such as in the proposed system. A
set of symbols and reasonable fields of view were selected to reduce the
number of variables confronting us when planning the experimental inves -
tigation. As predicted in the discussion of display scales, the desirable
field of view was essentially dictated by the tasks being asked of the sub-
jects.
A review of the literature on alphanumeric displays18, 12,13 pro-
vides guidelines for selecting an acceptable set of characters. A bright
display presenting critical information in moving labels, viewed at 40"
from less than 400 off axis is recommended to employ characters be -
tween . 18" and . 28" high. These figures assume a wise choice of char -
acter style. 1 2 An essential feature of CRT characters is the stroke width
to height ratio. For maximum viewing distance,ratios of 1:40 are cited.
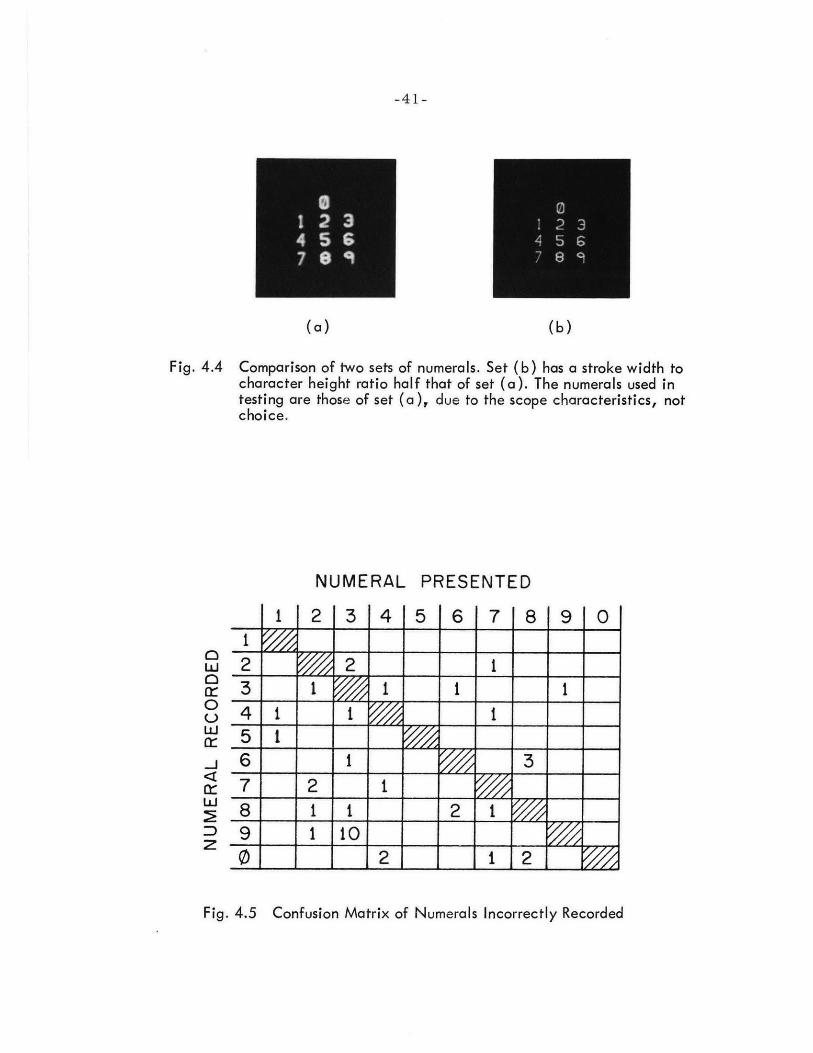
Our characters are . 2" high and have a stroke to height ratio of roughly
*1:15. The desirability of a larger ratio can be seen in Fig. 4. 4 which
shows the full set of numerals.
With a field of view and character set selectedthere still remains
a formidable number of features to be investigated. A two-phase plan of
experimentation was prepared to divide the opposition before attacking.
3. 1 Phase 1 Introduction
The first phase of testing addresses the following factors: 1)
display format for alphanumerics, 2) scope utility for different sizes
*See page 41
-18-

-19-
and shapes, and 3) effects of continuous and jumping traffic on the extrac-
tion of information from the display.
To elaborate briefly on these factors:
1) With various alphanumeric data (identification, altitude, and
ground speed) selectively available, consideration must be given to present
this data in a way which makes it easy to associate the data with its respec -
tive aircraft. The danger of the display becoming cluttered when alpha-
numeric (A/N) data is present must be guarded against. Two forms of
data presentation have been considered. One is a traditional moving tag
which stays alongside the , actual aircraft symbol. The computer gen-
eration of these data tags makes it possible to display them in an upright
form, independent of the overall display orientation. The other form is
a tabular stationary presentation with a single character affixed to the
aircraft symbol to establish the tie between an aircraft and its data. The
advantages and disadvantages of these options are investigated under
various conditions of scope dimensions and traffic motion.
2) It has been indicated by Lincoln Laboratory that the proto-
type system will probably use a scope having face dimensions of 5 1/4"
wide x 7 1/4" high. The different ways that a scope of this size can be
utilized in the cases of moving tag or tabular alphanumerics will be in-
vestigated. Another trend of thought indicates that the possible modi-
fications necessary in the cockpit to accommodate a slightly larger
scope would be undertaken, so similar investigations for a square scope
7 1/4" x 7 1/4" are included.
-20-
3) With data update occurring every four seconds, direct imple-
mentation requires that at least the other aircraft jump from point to point
as new data becomes available. As previously indicated,continuous pre-
diction could provide more smoothly moving symbols. Phase 2 tests will
indicate what effect these two presentations will have on flight tasks involv-
ing interaction of your aircraft with other traffic. This present concern is
the effect of jumping or continuously moving symbols when one is trying to
read the associated A/N data.
These investigations are done using both pilot and non-pilot subjects.
This is felt acceptable because the tasks are simply making observations
and require no control action.
3.2 Phase 1 Test
Situation: With the subject sitting in a normal pilot posi-
Task:
tion, a variety of display options are presented.
There is no primary or even secondary flying
task, but rather the subject is instructed to give
his full attention to the traffic display.
With no traffic on the display, the subject is
given the flight identification for one of the
test aircraft. This aircraft as well as one to
four others then pop up on the display and the
subject hits a response button as soon as he
has identified the relative position, and read
the altitude and ground speed of the selected
aircraft. The subject then writes the data on
an answer sheet.
-21-
Measures: The computer records the response time and
the accuracy of his observations is checked by
grading his answer sheet. Each of 14 subjects
makes 12 observations on each of the four basic
configurations shown in Fig. 3. 1.
Display Options:
a) Scope size
b) Tabular or Moving tag alphanumerics
c) Update rate
The search and observe portion of the task in this phase of tes-
ting can be thought of as a combination of two subtasks: 1) locating a
particular item, 2) reading and committing to short term memory the
related alphanumeric data. Tests using moving tag data require locating
the prescribed identification label and reading the data; the aircraft, iden-
tification, and data all being in one location. With tabular data the pre -
scibed ID must be located within the table and the associated aircraft must
also be located, the data being read either before or after searching for
aircraft. The tests with tabular data are clearly not equivalent to the
tests with moving tag data, so we should not be surprised to find a shorter
response time when there are fewer operations required.
To provide a further breakdown of the time required by each of the
subtasks,an additional set of tests were administered at the completion of
the primary tests. Four subtasks were considered: 1) locater: an air-
craft identified by its moving tag - no data is read, 2) locate a pre -
scribed ID in a table - do not locate the aircraft or bother to read the
dlata, only the associated character (A, B, C, etc. ) 3) locate a tabular ID

(a) Moving Tag DataSmall Display
(b) Bottom Tabular DataSmall Display
(c) Moving Tag DataLarge Display
(d) Side Tabular DataLarge Display
Fig. 3.1 Display options tested in Phase 1.

-23-
3) locate a tabular ID and read the data - do not locate the aircraft or
bother with the associated character, 4) locate an aircraft identified by a
single character as with tabular data.
The primary task is somewhat extreme in that the subject is re-
quired to extract a great deal of information in a single glance. In nor-
mal operation the pilot would likely know in advance which aircraft was of
interest to him and the ground speed may often be the only data of constant
interest. The issues of clutter, mistaken association of aircraft and
data, and assured legability must be considered in addition to the response
times provided by these tests.
3. 3 Phase 2
The second phase of testing requires piloting a simulated jet trans -
port class aircraft through a variety of maneuvers within a simulated traf-
fic situation. The flight is composed of three sections covering the basic
tasks which might be expected when following another aircraft into a ter -
minal area.
The traffic pattern is modelled after the normal operations occur -
ring around the Acton approach fix for Boston' s Logan Airport. The traf-
fic flies into Acton at 225 knots indicated airspeed. The pith is along the
standard airway defined by the 1110 radial from the Gardner VOR. At
Acton a turn to a heading of 1650 is executed. This takes the aircraft
down a standard path used by controllers to bring aircraft from Acton to
an approach on runway 4-R at Logan. The approach to Acton is the first
section of the flight test and the turn from the approach fix initiates the
second section. After travelling for two minutes out of Actonthe third
-24-
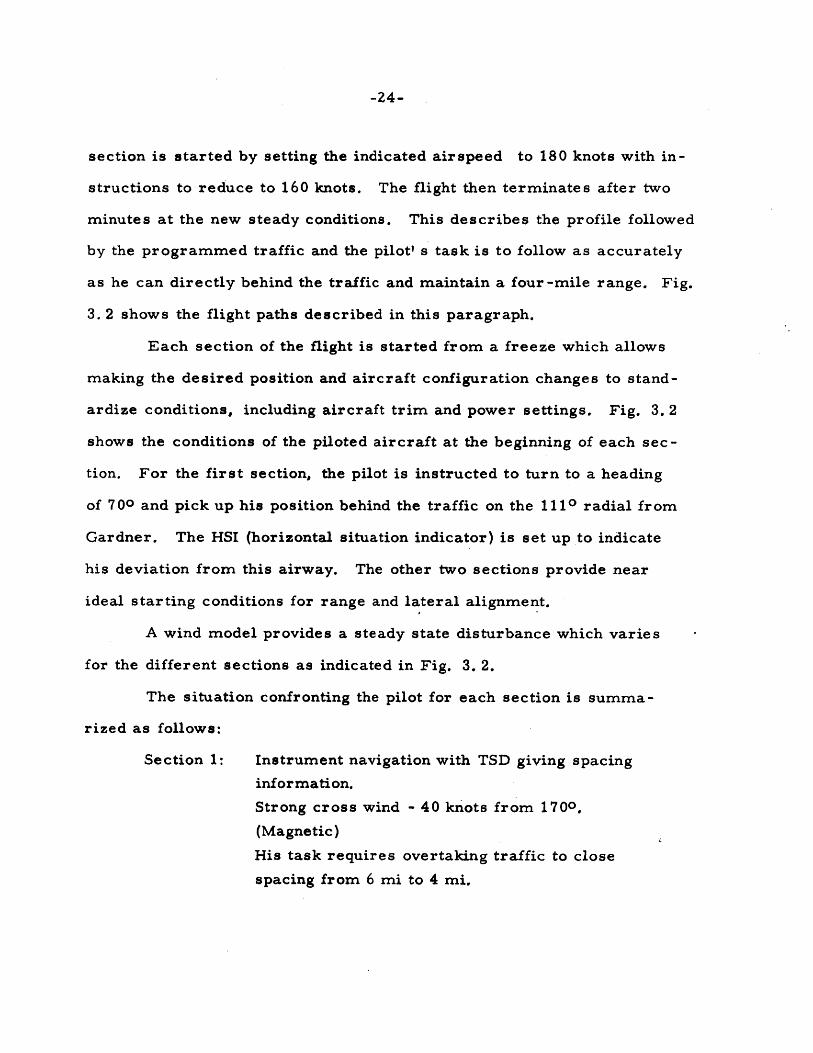
section is started by setting the indicated airspeed to 180 knots with in-
structions to reduce to 160 knots. The flight then terminates after two
minutes at the new steady conditions. This describes the profile followed
by the programmed traffic and the pilot' s task is to follow as accurately
as he can directly behind the traffic and maintain a four -mile range. Fig.
3. 2 shows the flight paths described in this paragraph.
Each section of the flight is started from a freeze which allows
making the desired position and aircraft configuration changes to stand-
ardize conditions, including aircraft trim and power settings. Fig. 3. 2
shows the conditions of the piloted aircraft at the beginning of each sec-
tion. For the first section, the pilot is instructed to turn to a heading
of 700 and pick up his position behind the traffic on the 1110 radial from
Gardner. The HSI (horizontal situation indicator) is set up to indicate
his deviation from this airway. The other two sections provide near
ideal starting conditions for range and lateral alignment.
A wind model provides a steady state disturbance which varies
for the different sections as indicated in Fig. 3. 2.
The situation confronting the pilot for each section is summa-
rized as follows:
Section 1: Instrument navigation with TSD giving spacing
information.
Strong cross wind - 40 knots from 1700.
(Magnetic)
His task requires overtaking traffic to close
spacing from 6 mi to 4 mi.

-25-
04p4TRAFFIC:RANGE= 6 N.M.
.G.S.x 205 KNOTSSECTION 2IAS= 220 KNOTS
HEADINGm 1 0
SECTIONI iWIND ACTON
IAS = 250 KNOTS 40 KNOTSHEADING = 090 0 1(170*)
INSTRUCTED TRAFFIC:TO TURN 0700 RANGE = 4 N.
WIND G.S.= 19526 KNOTS(340)
SECTION 3 WINDI AS = 180 KNOTS 15 KNOTS
FLAPS = 20*HEADING = 170 .
G.S. = GROUND SPEEDTRAFFIC:
RANGEm 4 N.M.G.S.= 175 KNOTS
REDUCINGTO 155 KNOTS
SCALE '' ' 'ON0 1 2 4 6NAUTICAL MILES
Fig. 3.2 Phase 2 Test Conditions
KNOTS

-26-
Section 2:
Section 3:
Instrument navigation for the brief portion before
the turn. After the turn,all navigation except
heading is derived from the TSD.
Moderate cross wind - 25 knots from 1340
His task requires following traffic through a 600 turn.
Nominal heading for wind correction is learned
quickly during practice, so lateral navigation re -
quirements can be very light. Similarly the power
and flap settings to maintain acceptable spacing
through the deceleration can become mechanical.
Light cross winds - 15 knots from 1100.
His task requires a 20 knot deceleration.
With these flight conditions and requirements, the following dis -
play options are investigated (see Fig. 3. 3).
1. Ground reference frame (GRF) and traffic translation
a) Continuous GRF translation with continuous traffic
translation.
b) Continuous GRF translation with traffic frozen in the
GRF between four -second updates.
c) Both GRF and traffic frozen in translation between
four -se c ond updates.
2. Display orientation
a) North up
b) Heading up with continuous update
3. Background reference
a) With a background map showing nominal traffic routes
b) With no background reference.
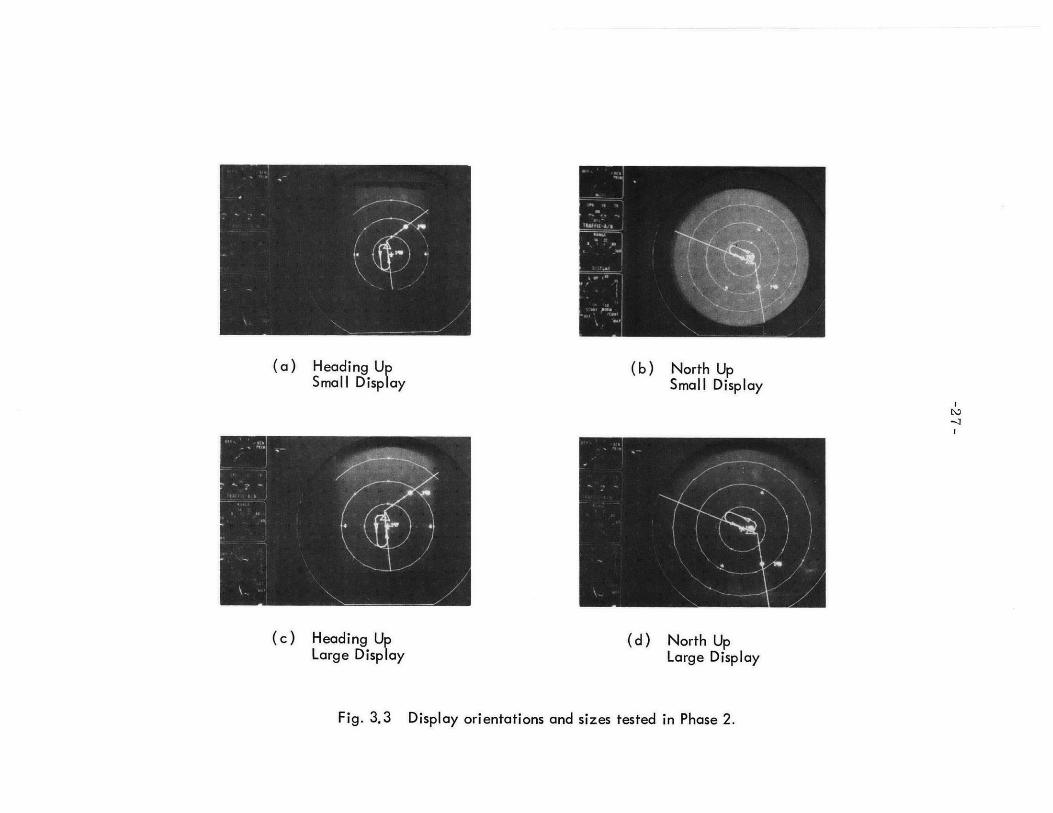
(a) Heading UpSmall Display
(b) North UpSmall Display
(c) Heading UpLarge Display
(d) NorthLarge
Fig. 3.3 Display orientations and sizes tested in Phase 2.
-Zr
UpDisplay

-28-
4. Scope Size
a) Large -- providing 4. 7 inches of forward viewing distance
on the scope.
b) Small -- providing 3. 9 inch of forward viewing distance.
This list of feature options gives 24 different conditions. The
experimental design employs four test subjects. Each subject is tested
in two sessions. Half of them have a heading up display for the first ses-
sion and north up for the second session. The others encounter the dis-
plays in the opposite order. One subject in each of the two orientation
groupings has no background reference for his first session and does have
this reference in his second session. The reverse is true for the other
two subjects. Within each session half the subjects view the three trans -
lational options first on a large scope, then on a small scope. The order
of presenting translation cases is randomized among the subjects. Ap-
pendix A presents a coded summary of the experimental design.
The subjects used are experienced pilots, one is a current in-
strument instructor, one a Navy reservist, one a 707 flight engineer
for TWA, and the other a first officer on Electras flying backup for the
Eastern shuttle.
Each subject had at least three hours of familiarization training
on the simulation, about half of the time was devoted to practice with the
actual test situation which the particular subject would first encounter
in the testing. At the beginning of each test session the subjects were
given two more practice runs before starting data runs. When the
scope size was changed midway through the sessiona 15 minute break
-29-
was taken, and an abbreviated practice run was made before recommencing
data cases. The translational options could be changed at any time with-
out stopping the flight, and they were all interspersed throughout the prac-
tice cases.
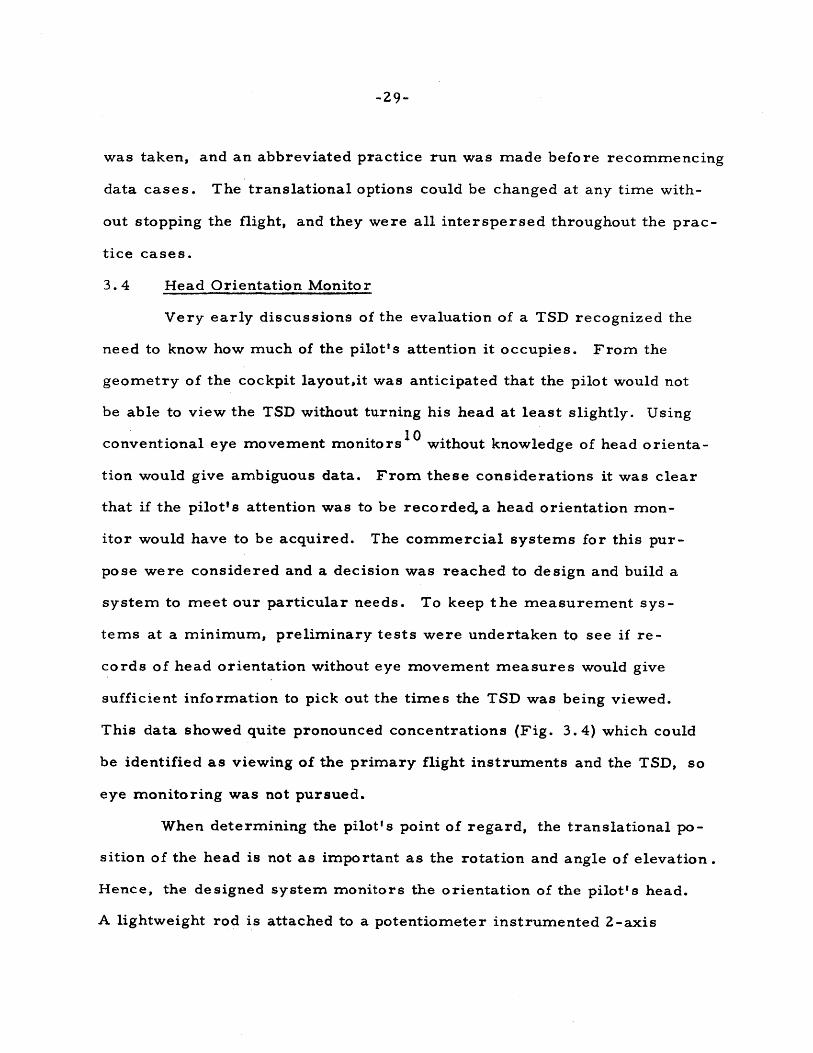
3.4 Head Orientation Monitor
Very early discussions of the evaluation of a TSD recognized the
need to know how much of the pilot's attention it occupies. From the
geometry of the cockpit layout,it was anticipated that the pilot would not
be able to view the TSD without turning his head at least slightly. Using
10conventional eye movement monitors without knowledge of head orienta-
tion would give ambiguous data. From these considerations it was clear
that if the pilot's attention was to be recorded, a head orientation mon-
itor would have to be acquired. The commercial systems for this pur-
pose were considered and a decision was reached to design and build a
system to meet our particular needs. To keep the measurement sys-
tems at a minimum, preliminary tests were undertaken to see if re-
cords of head orientation without eye movement measures would give
sufficient information to pick out the times the TSD was being viewed.
This data showed quite pronounced concentrations (Fig. 3. 4) which could
be identified as viewing of the primary flight instruments and the TSD, so
eye monitoring was not pursued.
When determining the pilot's point of regard, the translational po-
sition of the head is not as important as the rotation and angle of elevation.
Hence, the designed system monitors the orientation of the pilot's head.
A lightweight rod is attached to a potentiometer instrumented 2-axis

-30-
Fig. 3.4 Head Orientation Monitor
-31-
gimbal on the back of a head band worn by the pilot. The rod then passes
through a plastic bushing mounted to another 2-axis gimbal on the top of
the captain's seat back. The seat mounting is instrumented in the vertical
axis only. This combination of potentiometer signals provides a single
elevation measure and a pair of signals give the angles that the rod forms
about the vertical axis at the chair mount and at the head band mount. The
difference of the two measures about the verticAl axis gives the angle of
the head's rotation independent of side translation. The single elevation
measure and the difference giving rotation are the voltages feed into the
A-D multiplexer of the computer.
We desired to preserve a time history of these two measures for
later processing. With our computer system such data preservation is
most practical by packing data words in core and writing them onto mag-
netic tape at the completion of the test. To get the desired number of
samples,this required some data compression. The vertical measure
was separated into 16 bands, specified by 4 bits, and the rotation meas-
ure went into 64 columns, using 6 more bits. These ten bits for each
time sample were then packed with two other samples to fill a single
thirty bit word. Sufficient definition of the head orientation angles was
thus recorded in a recognizable time sequence. A sample rate of five
per second was used.
Analysis of Head Monitor Data
Though we decided that eye movement monitoring would be an
unrewarding increase in complexity, there is no way to be certain that
the partitioning of the head orientation data accurately makes the desired
-32-
identifications . When the experimenter is present to watch the movements
of the pilot while the data is being recorded, he can more easily identify
characteristic patterns in the data when he later does the processing. As
Fig. 3. 5 indicates, the data can contain grouping of the sort that might be
predicted by the geometry of the cockpit setup. A heavy concentration
occurs near the center for flight instrument viewing, while the cluster
of samples in the lower right area corresponds to viewing the TSD.
The two vertical and two horizontal lines on the scope can be
moved independently so that any selected area of the data may be boxed
in. Since the records have preserved the time sequence of the data we
can find out where we were at each preceding sample, and thus tell if we
have entered or left the boxed-in area. Counters record how many times
the area is entered and how long the gaze remains there each time. From
the measurements takenwe determine the average time between glances
in this direction, the average dwell time, and the percentage of total time
the pilot gives to TSD viewing.
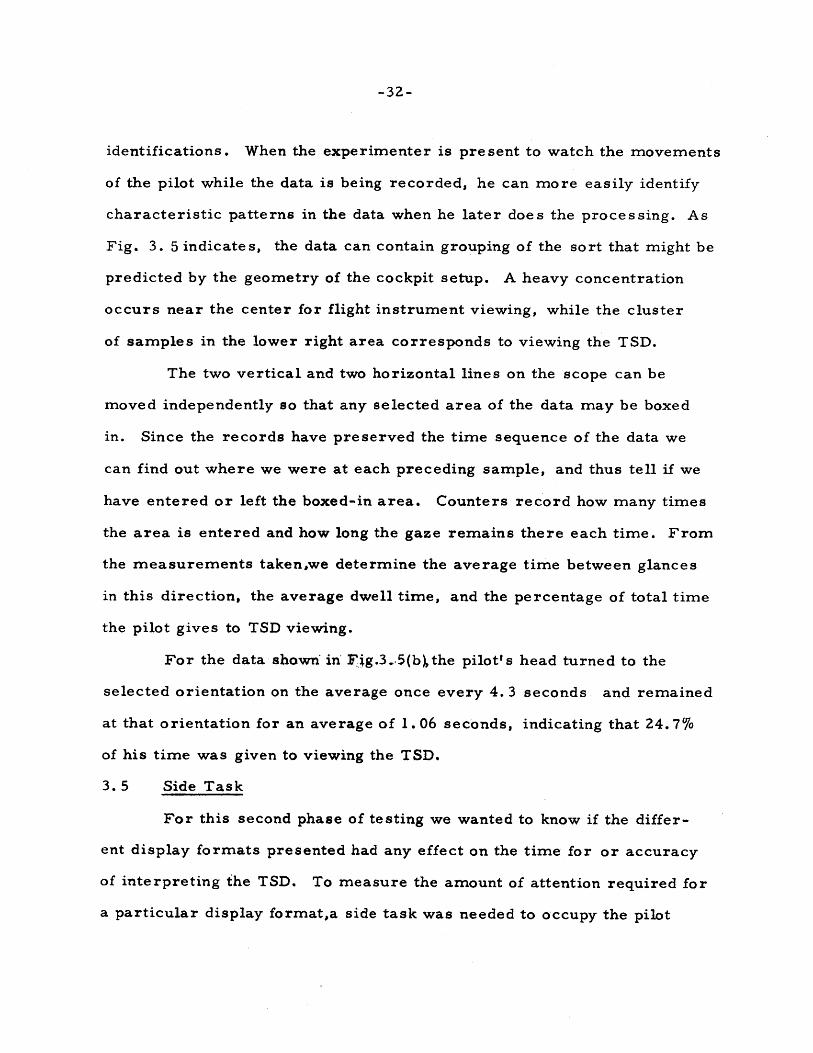
For the data shown in Fjg.3.,5(b),the pilot's head turned to the
selected orientation on the average once every 4. 3 seconds and remained
at that orientation for an average of 1. 06 seconds, indicating that 24.7%
of his time was given to viewing the TSD.
3.5 Side Task
For this second phase of testing we wanted to know if the differ-
ent display formats presented had any effect on the time for or accuracy
of interpreting the TSD. To measure the amount of attention required for
a particular display format,a side task was needed to occupy the pilot

-33-
(a) Sample of data for a fullflight - 4 sections. Theleft cluster corresponds toflight instrument viewingand the right cluster pri-marily to TSD viewing.
(b) Portion of the above datafor one section of theflight.
(c) Same data as in (b) withadjustable lines moved into select TSD area. Dots inupper right are EnginePressure Ratio gaugeviewing.
Fig. 3.5 Head Orientation Data

-34-
whenever he didn't feel compelled to check the TSD. A task was desired
which would be simple enough so that even a small amount of spare time
directed toward it would permit a noticeable change in the score. At the
same time,the side task should always provide something to do so any at-
tention given to it will yield a reward. The other requirements placed on
this diversion are that it not interfere with the necessary control actions
of the primary flying task, and that recognizable excellent performance
is possible, though requiring constant attention.
These conditions were satisfactorily met by using the three-
position spring centered switch on the left of the aircraft control wheel
to control a divergent meter. The FAST-SLOW indicator to the right
of the artifical horizon was used to implement the task. This selection
provided a marker which moved along the same axis as the control switch
and which could not be viewed simultaneously with the TSD.
The divergent relation which was employed is derived from a
serpentine curve:
abx
a2 2a +x a
The discrete control power (+ 4*b/2) provided through the switch
adds to this natural velocity. The mean of the magnitude of the position

-35-
of the marker is the measure, ranging between 0 and 1 00'.
3. 6 Flight Performance Measures
Real time calculations provided mean and standard deviation of range,
lateral error, course deviation (crosstrack velocity/groundspeed) over
selected intervals of the test. In addition, strip chart records of range,
groundspeed difference betWeen the subject and his traffic, and the sub-
ject's indicated airspeed were obtained, as well as x-y plots of his course
over a map showing nominal tracks. Viewing time for the traffic dis-
play, as extracted from the head monitor data, and the side task score
are used to provide workload measures.
/
CHAPTER 4
EXPERIMENTAL RESULTS
4. 1 Phase 1 Test Results
Figures 4. 1, 4. 2, and 4. 3 provide graphical presentations of the
major results for the first phase of testing. The mean and standard de-
viation of the response times for the indicated division of the data shown
on the vertical axis are the elapsed time between the display appearing
and the computer sensing that the response has been actuated. Comparing
tabular and moving tag presentations for alphanumeric data, we can see
from Fig. 4. 1 (a) that the tabular format requires roughly 2/3 again as
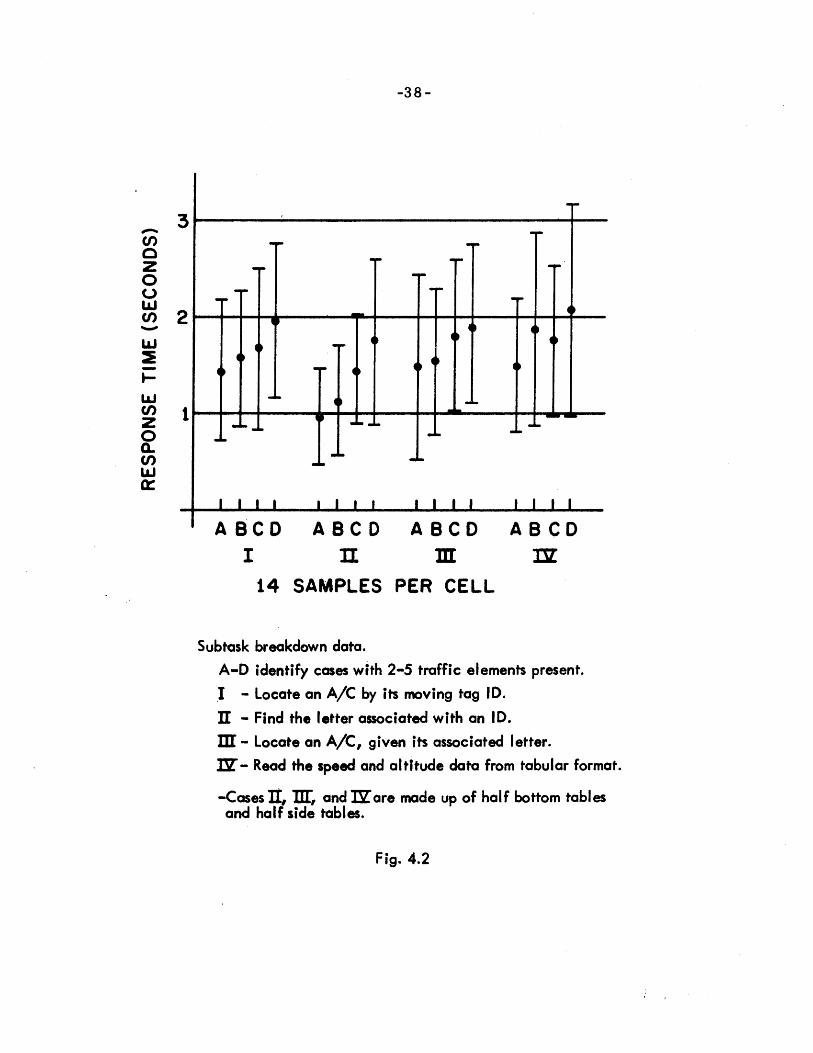
much time to complete the task of these tests. Figure 4. 2 is intended
to provide a guide to the breakdown of the total tasks depicted in Figure
4. 1 and 4. 3. For instance,the difference between the moving -tag -
response -timeof Fig. 4. 1 and the average of Row I in Fig. 4. 2 should
correspond to the time required to memorize the data once the tag is
located. This is a very realistic action corresponding to checking on
an aircraft which has been on the display for some time. This esti-
mate of reading time should also serve as an upper bound on the time
for reading a tabular entry for which you already know the location.
Similarly, adding up the response times of Rows II, III, and IV of Fig.
4. 2 should give the total response time for tabular data plus a factor
to correct for the requirement to flip the switch once for each of the
subtasks. The fact that this sum,even without the deduction for re -
peated response,falls short of the average response time for the full
task indicates some additional hidden component. The factor was
-36-

(a) Phase I test results with a 2-waybreakdown.
A - Continuous Motion TrafficB - 4 second freeze of Traffic MotionI - Moving Tag DataII - Tabular Data
(b) Moving Tag Data onlyA - D identify cases with 2 - 5 Traffic
elements present.I - Continuous Motion TrafficII - 4 second freeze of Traffic Motion
Fig. 4.1
-38-
.3
3T
2 TT ip T i I i 1 4
ABCD ABCDI In
14 SAMPLES
ABCD
PER CELL
Subtask breakdown data.A-D identify cases with 2-5 traffic elements present.I - Locate an A/C by its moving tag ID.
I1 - Find the letter associated with an ID.IE - Locate an A/C, given its associated letter.M- Read the speed and altitude data from tabular format.
-Cases I, i, and Mare made up of half bottom tablesand half side tables.
Fig. 4.2
z0(1)
Cf)
z00.C/)w
ABCD

(a) Phase 1 test results with a 2-waybreakdown
A - Rectangular DisplayB - Square DisplayI - Moving Tag DataII - Tabular Data
(b) Tabular Data onlyA - Rectangular Display
(Bottom Table)B - Square Display
(Side Table)I - IV identify cases with 2 - 5
Traffic elements present.
Fig. 4.3
-40-
described by the subjects as the frequent need to check back on one of the
factors which they tried to remember while completing one of the other
subtasks.
If tabular data is to be usedFig. 4. 3 indicates a slight preference
for the table appearing in a single column at the side rather than two rows
at the bottom. However, unless a terribly cluttered map is to be presented
on the display,which would lead to unresolvable conflicts of the data tags
with map elements, it appears very advisable to implement moving tag
alphanumerics.
Since more care and insight will hopefully go into the selection of
the character set for the prototype and production models than went into
the characters used in these tests, the following may be of little value.
However, errors did occur in reading some of the numerals. Figure 4. 5
is a confusion matrix showing which characters were mistaken for which
other ones. The source of the confusion can be considered by reference
to the set of numerals (Fig. 4. 4). These few errors arose from 672
observations each containing 5 unknown numerals. The precise distri-
bution of the occurrence of different numerals is not provided here, but
assurance is given that all numerals were represented and the number
3 is definitely not sufficiently more common to account for the big
number of errors it produced.
4. 2 Phase 2 Test Results
For the simulated flight-test portion of the investigation,the re -
cords of position and velocity were useful during training to show the
subject how he was doing and for judging his preparedness for the actual
tests. For the test cases in which no map of nominal tracks was displayed,
-41-
(a) (b)
Fig. 4.4 Comparison of two sets of numerals. Set (b) has a stroke width tocharacter height ratio half that of set (a). The numerals used intesting are those of set (a), due to the scope characteristics, notchoice.
NUMERAL PRESENTED
I 2 4 5 6 7 8 | 9
2 ff)2
4 1 /fy5 17 2 iEf8 2 f9 1 1 101 1 1 f0 112 [---j 11 2 f
Fig. 4.5 Confusion Matrix of Numerals Incorrectly Recorded
0
a
0
0C)w
-42-
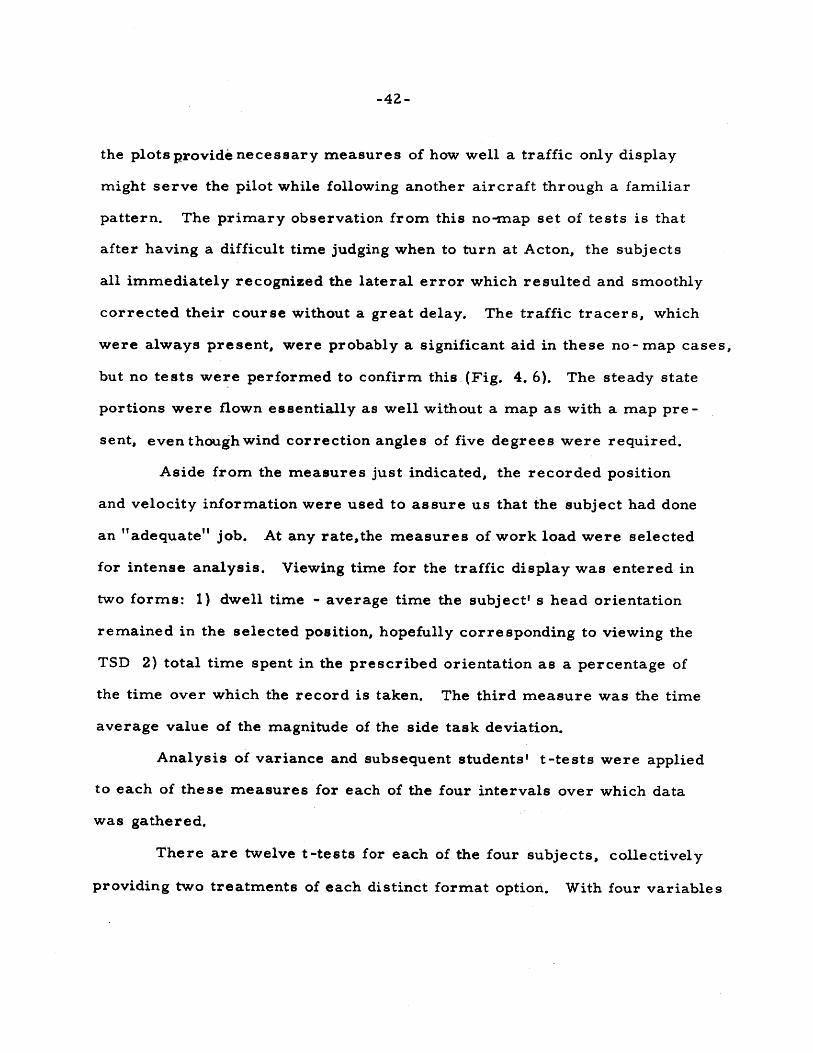
the plots provide necessary measures of how well a traffic only display
might serve the pilot while following another aircraft through a familiar
pattern. The primary observation from this no-map set of tests is that
after having a difficult time judging when to turn at Acton, the subjects
all immediately recognized the lateral error which resulted and smoothly
corrected their course without a great delay. The traffic tracers, which
were always present, were probably a significant aid in these no-map cases,
but no tests were performed to confirm this. (Fig. 4. 6). The steady state
portions were flown essentially as well without a map as with a map pre -
sent, even thoughwind correction angles of five degrees were required.
Aside from the measures just indicated, the recorded position
and velocity information were used to assure us that the subject had done
an "adequate" job. At any rate,the measures of work load were selected
for intense analysis. Viewing time for the traffic display was entered in
two forms: 1) dwell time - average time the subject' s head orientation
remained in the selected position, hopefully corresponding to viewing the
TSD 2) total time spent in the prescribed orientation as a percentage of
the time over which the record is taken. The third measure was the time
average value of the magnitude of the side task deviation.
Analysis of variance and subsequent students' t-tests were applied
to each of these measures for each of the four intervals over which data
was gathered.
There are twelve t-tests for each of the four subjects, collectively
providing two treatments of each distinct format option. With four variables
j(a) N
(b)
) Heading up casewith no map displayed.
) North up casewith map diplayed.
- cases are for the samesubject, with the same sizeand translation. (Lg/C-J)
Fig. 4.6 Examples of representative flight paths.
(C
(b

-44-
included in the definition of the distinct options, the data must be in a
format which can be conveniently manipulated. It was desired to preserve
the identification of the individual work load measures, the data interval,
the subject, and the specific display format associated with each data item.
The data was structured in a 12 x 4 x 2 x 2 x 3 array. The twelve indices
of the first dimension are assigned to the three measures over the four
data intervals. The second dimension specifies the subject. The third
dimension has a dual function. The original array is divided at this point
between north and heading orientation; however, once the subject and ori-
entation are known, the option of having a map reference is decided. In
fact, by reversing the indices at this third dimension for subjects 2 and
3, the data can be view as being divided between cases with or without a
map reference. Dimension four identifies the scope size, and the final
dimension specifies which of the three translation cases is involved.
This 5 dimensioned array of data was set up on an IBM 360-67
by use of the time-shared program APL. APL possesseagapabilities for
easy restructuring of and operating on multidimensional arrays and
gives immediate results, so various types of analysiscan be tried quick-
ly and easily. The specific programs used in this analysis are on file
at the simulation facility along with all the other programs incorporated
in this study.
Considering a single work load measure on a particular interval,
the experimental design reduces to a three-way classification, with four
replications (subjects) per cell. The object of h av'ing a ground
reference is distributed evenly over the other variables and will not be
-45-
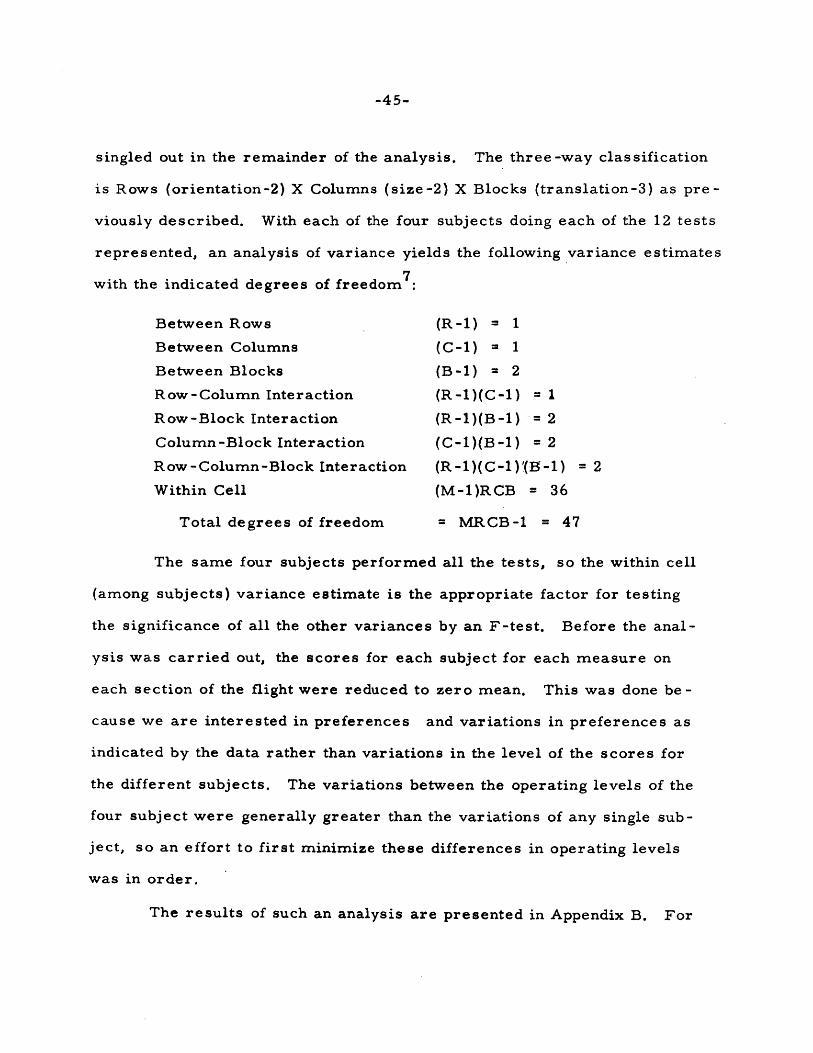
singled out in the remainder of the analysis. The three-way classification
is Rows (orientation-2) X Columns (size-2) X Blocks (translation-3) as pre-
viously described. With each of the four subjects doing each of the 12 tests
represented, an analysis of variance yields the following variance estimates
with the indicated degrees of freedom :
Between Rows (R-1) = 1
Between Columns (C-1) = 1
Between Blocks (B-1) = 2
Row-Column Interaction (R-1)(C-1) = 1
Row-Block Interaction (R-1)(B-1) 2
Column-Block Interaction (C-1)(B-1) = 2
Row-Column-Block Interaction (R -1)(C-1)'(H-1) = 2
Within Cell (M-1)RCB = 36
Total degrees of freedom = MRCB-1 = 47
The same four subjects performed all the tests, so the within cell
(among subjects) variance estimate is the appropriate factor for testing
the significance of all the other variances by an F-test. Before the anal-
ysis was carried out, the scores for each subject for each measure on
each section of the flight were reduced to zero mean. This was done be -
cause we are interested in preferences and variations in preferences as
indicated by the data rather than variations in the level of the scores for
the different subjects. The variations between the operating levels of the
four subject were generally greater than the variations of any single sub-
ject, so an effort to first minimize these differences in operating levels
was in order.
The results of such an analysis are presented in Appendix B. For

-46-
each major feature which showed significant variance between its indicies,
individual t-tests were examined for each subject on the particular measure
and interval. For the Student' s t-Tedt the data was treated by calculating
the differences between the scores of cases differing only by the indices
being examined and determining the significance of the mean of these
differences being non-zero. The t-test results are also presented in
Appendix B.
Before considering our findings of statistical significance, the
reader may want to review the section of Chapter 3. 4 which describes
the special features of the flight sections. Interval 3 of the data begins
with the third section of the flight and interval 4 of the data takes over
after two minutes of flight section three, by which time the deceleration
transients have supposedly died out.
Statistically significant findings at the 10% level:
1. Of the 12 data sets, & showed a significant variance between
orientations. All but one of these eight data sets lead to t-tests
which showed significantly better scores for heading-up cases.
The one other data set exhibited a north-up preference at a
significant level.
2. The display size did not show a consistent significant effect.
3. The translation options require close examination. Section 3
of the flight (Data intervals 3 and 4) have been described as cases
in which the necessary control actions are fairly well established,
so the display provides a check that the pilot' s action had the ex-
pected effect. For these intervals of the data,the differences

-47-
showing significance favor both other options over the case of
continuous map translation with traffic jumping every four seconds.
For this unfavored case,it can be noted that the pilot must watch
until he sees the traffic jump to be sure of the correct measure
of the spacing. Conclusions for sections 1 and 2 are tenuous,
though the pilot questionaires fill in the guide lines which the
data is weak in providing. The data for side task performance
shows the case of continuous traffic and map to be significantly
better than the case of both jumping. However, the other two
measures show the reverse preference at a lower level of sig-
nificance. Other investigations have found the after image of
jumping traffic to be useful in judging relative motion for more
complex tasks.
4. The interactions which are indicated are not too ambiguous
because generally two of the primary features have already
shown significant variation. Perusal of the original data re -
veals that the cases which fail to provide two variables of sig-
nificant. variation require the qualification that the heading-up
orientation is favored most when appearing in a large display.
Note that this interaction is only significant in three of the
twelve data sets, and a heading-up-small interaction is fa-
vored once.
4. 3 Pilot Questionaire Results (Phase 2)
A. Orientation: Heading up was more generally favored.
Comments went as follows: "Heading up is good for determining
-48-
bearing to other aircraft"; "with a quick glance I feel well oriented". North-
Up was prefered by some in turns: "Less is moving in the turns with the
North-Up case". However it was still found "More difficult to orient the
overall picture" and "North up causes some tendency to turn the wrong
way when flying south".
B. Size: Both sizes were considered adequate by all subjects,
though they also claimed in general to feel more comfortable with the
larger display.
C. Translation: Continuous map and traffic was prefered by
all, and strongly preferred by most. The pilots emphasized the fact
that the display of their ground speed and the other traffic' s ground
speed provided the needed information for speed control rather than
relative motion on the display. One subject vigorously objected to the
case of continuous aiap translation with frozen traffic between updates.
Other subjects made less distinction between this form and the case
of both map and traffic jumping.
D. Tracers for the subject! sa'iraft: were not provided. When
asked if it was felt that these would be helpful, two said 'ryVes"4: for ident-
ifying wind correction and judging turns, and the other two felt that
it would only clutter the display.
E. The side task was considered by three of the pilots to be
hard enough that it pushed their total work load above what they would
expect in a normal cockpit.
F. The aircraft simulation was considered very good; and the
wind model acceptable. It was felt by one pilot that the attitude
-49-
stabilization in the control system and the absence of turbulence reduced
the normal workload.
G. General recommendation on the display format included:
1. 1hanging theuse of dots to mark 450 sectors on the rangerings because they become confused with traffic tracers.
2. Thenumber appearing on the range selector should agreewith some number indicating range on the display. Thetest system displays the number of miles to the middlerange ring, so the number is half the value appearingon the selector switch.
3. One pilot wished to have the traffic tracer appear as amore continuous string.

CHAPTER 5
SUMMARY OF EXPERIMENTAL FINDINGSAND RECOMMENDATIONS
5. 1 Summary of Experimental Findings
Phase 1
Unless a terribly cluttered map is to be presented on the display,
which would lead to unresolvable conflicts of data tags with map elements,
it appears very desirable to implement moving tag alphanumerics. If
tabular data is used, however, Fig. 4. 3 indicates a slight preference
for the table appearing in a single column at the side of the display, rather
than in rows at the bottom.
Phase 2
For the flight tasks employed in these tests, which were a com-
bination of navigation through a familiar flight pattern and following pre -
dictable traffic in this pattern, a heading oriented display generally leads
to lower workload scores and better pilot acceptance than a north oriented
display. Neither performance nor workload measures appear to be influ-
enced significantly by the display sizes tested. Pilot opinion was not
critical of the smaller scope, while the larger one was naturally favored.
For the translation options, either the case of continuous map and traffic
or that of jumping map and traffic appear acceptable, with the written
preference going to the fully continuous case. The continuous map with
jumping traffic is undesirable from the standpoints of both workload and
pilot opinion.
-50-

-51-
5. 2 Recommendations for Display Format
The following guidelines for the construction of a prototype air -
borne TSD are based on the test results described in Chapter 4.
A. The display orientation should be heading up. This pre -
ference was shown by both the work load measures and the pilot ques-
tionaires for traffic following tasks.
B. The display providing the smaller viewing area (3. 9" ahead
of the subject' s aircraft position) was credited as being adequate, both
by the comparable performance achieved and the pilot opinions. How-
ever, the larger display area (4. 7" ahead) was considered superior by
pilots. There is no data to indicate what size would be considered in-
adequate. For displays much smaller than the smaller one tested, the
ability to fit legible alphanumerics in the limited display area becomes
a problem. It is also suspected that the precision achieved in tasks
such as those used in the phase-2 tests would seriously degrade with
successively smaller displays before the pilot opinions would brand
them "inadequate".
C. A recommendation for the map and traffic translations is
difficult to make. Observation of the tests, pilot opinion, and work-
load measures all suggest the elimination of the option in which the
map translates continuously and the traffic moves relative to the map
in jumps every four seconds. For this case, viewing the display at a
time other than immediately after an update gives erroneous range
data - as much as a quarter of a mile in error when following at 225
knots. Pilot opinion consistently favors continuous translation of both
-52-
map and traffic rather than the case with both jumping. Half of the pilots
indicate a very close opinion of these two cases, while the other two
pilots made a stronger distinction, though never giving the dual jumping
case an "unacceptable" rating. Each subject contributed 12 sets of data
(3 measures X 4 sections). One pilot (# 3) had a statistically signif-
icant difference between these two options in six of his data sets - all
favoring the dual jumping. At the same time, the 36 data sets for the
other three pilots contained only four statistically significant differences
- 3 to 1 in favor of continuous motion.
A dual jumping system would appear acceptable for tasks such
as were performed here and with data current at four second updates.
As higher data rates become available or predictive operations pro-
vide continuous translation of both traffic positions and one' s own po-
sition on the map, performance and acceptability can only be expected
to improve. The probable degredation in performance with either op--
tion when processing delays enter the data flow cannot be quantified from
these tests.
D. Unless a very detailed (cluttered) map is presented for the
navigational reference, the advantages of moving tag alphanumeric
traffic data appear sufficient to warrent this form of implementation,
if feasable. The use of tabular data with a cluttered display requires
(for full advantage) that a provision be made to strictly exclude other
display elements from the area alotted to the table of data.
E. Since character size will have to be constrained, the leg-
ibility advantage of a large character height to stroke width ratio
-53-
must be emphasized when specifying the beam properties for the display.
F. Provide a background reference consisting of navigation
fixes and the current route. structure with a switch for displaying fix and
route identifications.
5. 3 Recommendation for Further Study
As was pointed out in Chapter 2,the traffic data may be subjected
to a number of delays between the time of interrogation and the time
the updated position appears on the airborne display. Once the plan
for data handling is established,a realistic model of the data delays
should be introduced into the simulated traffic model and the issues
surrounding the prediction of position for selected traffic should be re -
evaluated. The losses involved in degrading the TSD from a case in
which the data is current once every four seconds to a case in which
it is at best eight seconds old once every four seconds may be suffi-
cient to require on board prediction.
All of the test reported here had traffic tracers for position
over the past 12, 24, and 36 seconds. Tests to investigate the inter-
action of tracers and nominal ground tracks being displayed could
prove interesting. Apart from the area navigation capability that a
map provides, the degree to which traffic intentions can be inferred
by seeing the standard route structure may make such a provision sig-
nificant even if the display is not used for primary navigation. In an
The scope used in these tests was a 16" DEC-Type 330 with a P-7phosphor.

-54-
advanced role, the nominal track may provide the necessary lead infor-
mation when flying on a "command bug".
The displays with heading up used a position roughly 1/3 of the
way up from the bottom as the location of the subject aircraft, and this
was the center of rotation. This was based on the fact that pilots are
most often interested in where they are going, and on the fact that col-
lision threats develop more quickly for head on encounter. A review of
the most likely ranges of traffic interest and the requirements for col-
lision warning should be undertaken to provide a more qualified indication
of where the subject aircraft should be located on the display. Similar
studies could indicate the importance of the increased peripheral view
provided by a square or round display rather than a rectangular one
as was used with the heading-up displays of these tests.
Another important area for research is that of collision avoid-
ance. The problem cited earlier of ship collisions may have serious
implication as far as the role of a TSD for primary collision avoidance
decision making.Pilot opinion however is quite favorable in respect
to its potential as a warning device.

APPENDIX A.
Coded Experimental Design (Phase 2)
1 2 3 4
Display Orientation:
Nominal Track Display:
Display Size:
Transtations:
1
North up (N), Heading up (H)
Yes(M), No (O)
Large (Lg.), Small (Sm)
Map and Traffic Continuous (CC)
Map Continuous, Traffic Jumping (CJ)
Map and Traffic Jumping (JJ)
2 3
Session 1:
Session 2:
N-M-Sm-CJ
-JJ
-CC
-Lg-JJ
-CC
-CJ
H-O-Lg-CJ
-CC
-JJ
-SM-CC
-CJ
-JJ
H-M-Sm-JJ
-CC
-CJ
-Lg-CJ
CC
ii
N-O-Sm-CC
-CJ
-JJ
-Lg-JJ
-CJ
-CC
N-O-Lg-CJ
-CC
-JJ
-Sm-CC
-JJ
-CJ
H-M-Sm-JJ
-CJ
-CC
-Lg-JJ
-CC
-CJ
H-O-Lg-JJ
-CJ
-CC
Sm-CC
-CJ
-JJ
N-M-Lg-CJ
-JJ
-CC
-Sm-CC
-JJ
-CJ
-55-
Subjects:
4
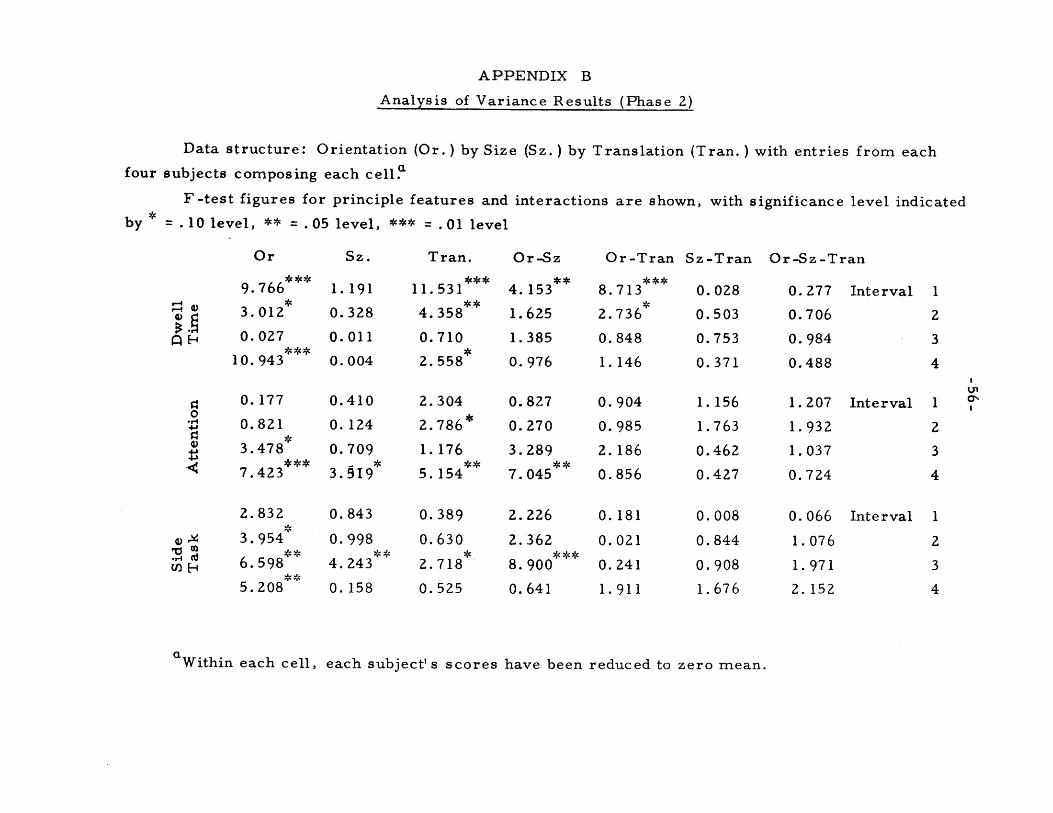
APPENDIX B
Analysis of Variance Results (Phase 2)
Data structure: Orientation (Or.) by Size (Sz.) by Translation (Tran. ) with entries from each
four subjects composing each cell.
F-test figures for principle features and interactions are shown, with significance level indicated
by * = . 10 level, ** = . 05 level, *** = . 01 level
Or
9. 766****
3.012
0.027***
10.943
0.177
0.821
3.478***2
7.423
2.832
3.954
6.598*
5.208
Sz.
1.191
0.328
0.011
0.004
0.410
0.124
0. 709- *
3.519*
0. 843
0.998** -
4.243
0.158
Tran.
11. 531*****
4.358
0.710
2.558
2.304
2.786k
1.176**4
5.154
0. 389
0.630*
2.718
0.525
Or-Sz
4. 153'*
1.625
1.385
0.976
0.827
0.270
3.289*4
7.045
2. 226
2.362*4*
8.900
0.641
Or-Tran
8.713
2.736
0.848
1.146
0.904
0.985
2. 186
0.856
0.181
0.021
0.241
1.911
Sz-Tran Or-Sz-Tran
0. 028
0.503
0.753
0.371
1.156
1.763
0.462
0.427
0. 008
0.844
0.908
1.676
0. 277
0.706
0.984
0.488
1.207
1.932
1.037
0.724
0. 066
1.076
1.971
2.152
Interval 1
2
3
4
Interval 1
2
3
4
Interval 1
2
3
4
Within each cell, each subject's scores have been reduced to zero mean.
r-
H
0
4JA<3
..-I
U'
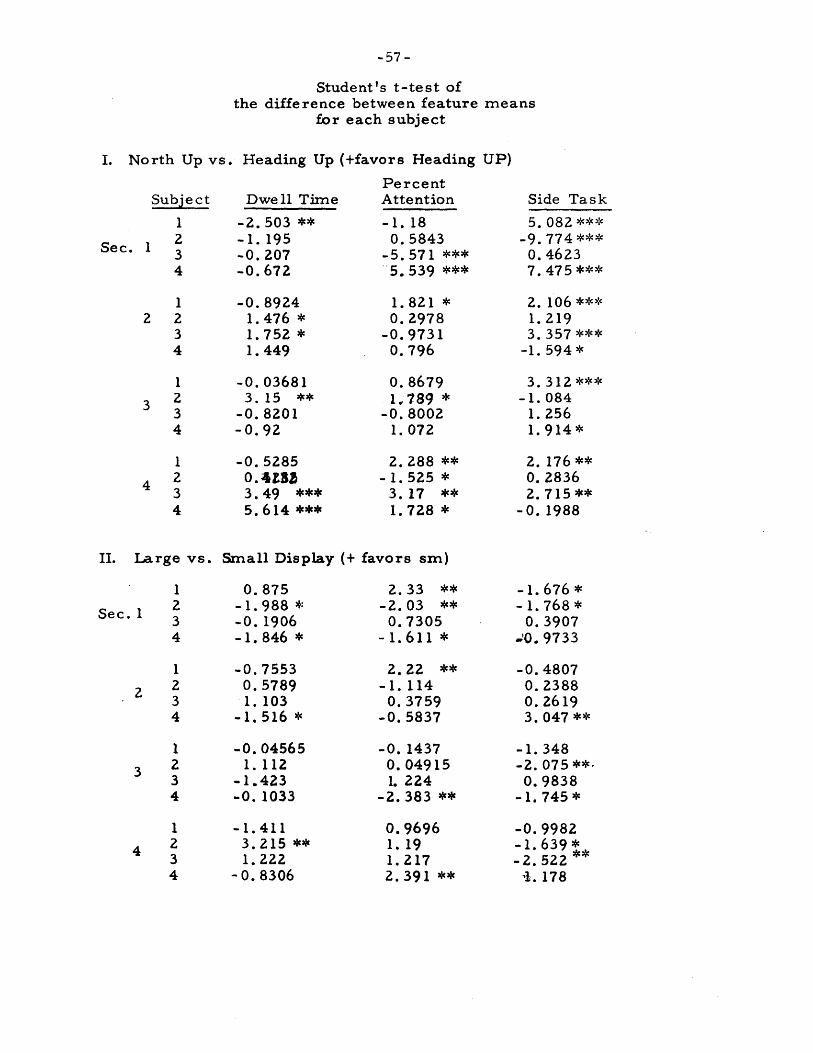
-57-
Student's t-test ofthe difference between feature means
for each subject
I. North Up vs. Heading Up (+favors Heading UP)
Subject
12
Se c. 1 3
4
Dwell Time
-2.503 **-1. 195-0. 207-0. 672
PercentAttention
-1.180.5843
-5. 571 ***5. 539 ***
Side Task
5. 082***-9. 774***
0. 46237. 475 ***
-0.1.1.1.
-0.3.
-0.-0.
8924476 *752 *449
0368115 **820192
-0.52850.4.3sh3.49 ***5.614 ***
1.821 *0.2978
-0.97310.796
0.
-0.1.
8679789 *8002072
2. 288 **- 1. 525 *
3.17 **1.728 *
II. Large vs. Small Display (+ favors sm)
1
Se c. 1 34
1
32 234
132
34
12
434
0.875-1.988 *-0. 1906-1.846 *
-0.0.1.
-1.
75535789103516 *
-0.045651.112
-1.423-0. 1033
-1.4113.215 **1.222
-0.8306
2.33 **-2.03 **
0. 7305-1.611 *
2.-1.
0.-0.
22 **11437595837
-0. 14370.049151. 224
-2.383 **
0.96961.191.2172.391 **
-1.- 1.
0.,
-0.0.0.
3.
-1.-2.
0.-1.
676 *768 *39079733
480723882619047**
348075**.9838745 *
-0.9982- 1. 639*-2. 522 **
,1.178
12 2
34
13 2
34
14 2
34
2.1.3.
-1.
3.-1.
1.1.
2.0.2.
-0.
106***219357***594*
312084256914*
176**2836715**1988
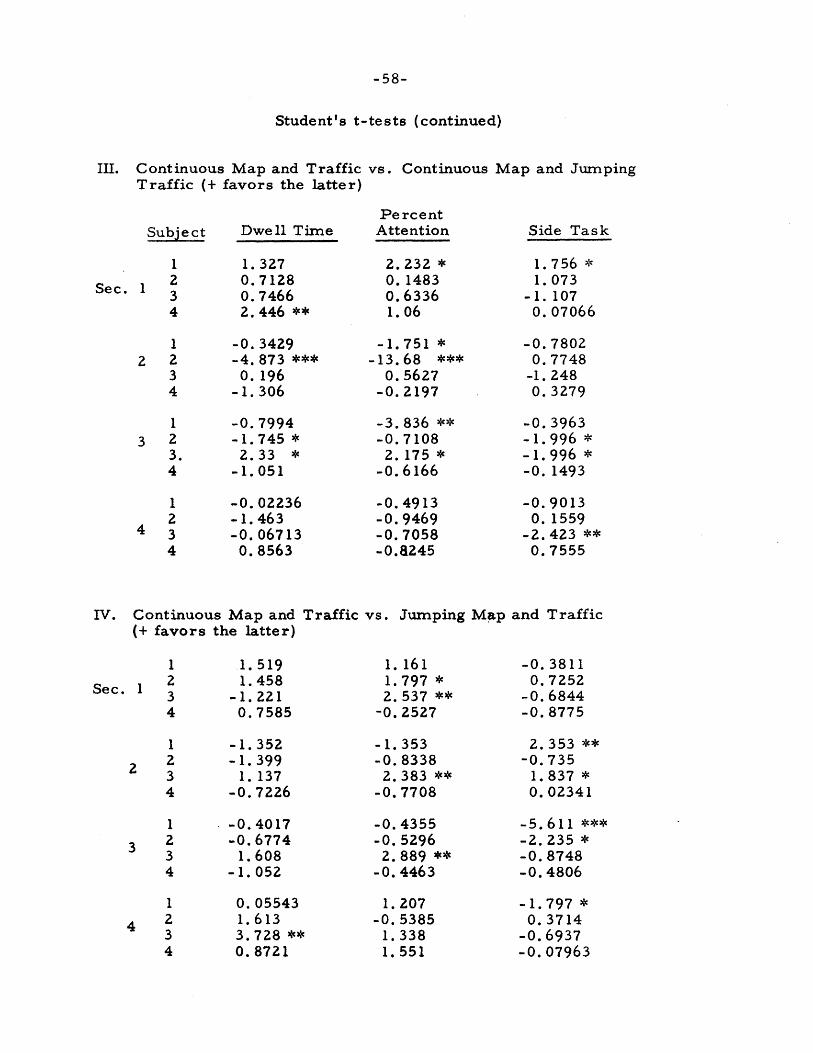
-58-
Student's t-tests (continued)
III. Continuous Map and TrafficTraffic (+ favors the latter)
vs. Continuous Map and Jumping
Subject Dwell Time
1
Sec.1 234
122
34
13 2
3.4
12
4 34
1.3270.71280.74662.446 **
-0.-4.
0.-1.
-0.-1.
2.-1.
-0.-1.-0.
0.
3429873 ***196306
7994745 *33 *051
02236463067138563
PercentAttention
2.0.0.1.
-1.-13.
0.-0.
232 *1483633606
751 *68 ***56272197
-3.836 **-0.7108
2. 175 *-0.6166
-0.4913-0.9469-0. 7058-0.8245
Side Task
1.756 *1.073
-1. 1070.07066
-0.78020.7748
-1.2480.3279
-0.3963-1.996 *-1.996 *-0. 1493
-0.0.
-2.0.
90131559423 **7555
IV. Continuous Map and Traffic vs. Jumping Map and Traffic(+ favors the latter)
1
Sec. 1 234
234
1
3 234
1
4 234
1.1.
-1.0.
5194582217585
1.1.2.
-0.
-1.352-1.399
1. 137-0. 7226
-0.4017-0. 6774
1.608-1.052
0.055431.6133.728 **0.8721
161797 *537 **2527
-0. 38110.7252
-0. 6844-0.8775
2.-0.
1.0.
-1.353-0.8338
2. 383 **-0. 7708
-0.4355-0. 52962.889 **
-0.4463
1.-0.
1.1.
2075385338551
353 **735837 *02341
-5.611 ***-2. 235 *-0.8748-0.4806
-1.797 *0.3714
-0.6937-0.07963

-59-
Student's t-tests (continued)
V. Continuous Map and Jumping(+ favors the latter)
Subject Dwell Time
12
Se c. 1 34
-1. 0570.:8974
-1. 373-1.564
-0.0.3.1.
0.0.
-0.-1.
12 2
34
13 2
34
1
4 234
1328333114 **539
1877550104294001
Traffic vs. Jumping Map and Traffic
PercentAttentiorn
-0. 74940.89321. 754 *
-1.742 *
1.707 *0.73191. 89 *
-0.7954
0.-0.
1.0.
2.0.1.2.
0.074841. 5291.4480.6906
Side Task
-1. 172-0.4007-0. ?2487-0.2716
1.846 *-0.7798
5. 658 ***-0. 1964
-0.9646-1.028
1.705 *-0.4696
-0. 2220. 07681.925 *
-1.691 *
3875062522777811
384 **946407507 *

APPENDIX C.
PILOT QUESTIONNAIRE FOR PHASE -2 TESTS
1. The orientation of the display for this set of tests was NORTH/HEADING
Up. Place an N/H on the scale below to indicate how well the display
depicted the course of your aircraft relative to other references on the
display, e. g. other aircraft and the ground.
VeryConfusing
Acceptable
- General comments (if any) on the orientation of the traffic situation
display:
2. Please comment on the effect (if any) that you feel the display size
had on your performance and/or workload.
3: Three different motion combinations were used:
A) Continuous Map and Traffic
B) Continuous Map with Jumping Traffic
C) Jumping Map and Traffic
Using the letters A, B, and C as identified here, rate each of the
motion cases in the following respects:
a) How easily was relative motion between your aircraft and the
traffic detected?
Acceptable ImmediatelyClear
b) How easily was the absolute motion of the traffic recognized?
I I I
Acceptable Immed iatelyClear
-60-
IVeryClear
VeryHard
A
VeryHard
I
I I I
I I I
i
-61-
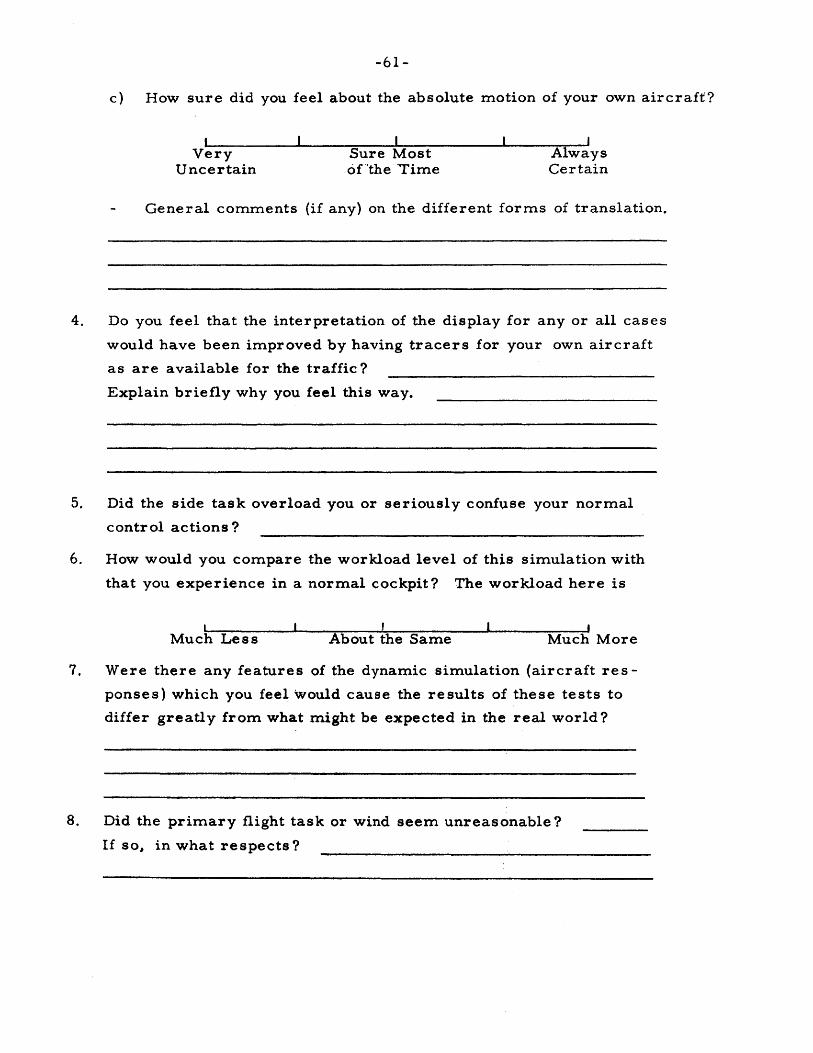
c) How sure did you feel about the absolute motion of your own aircraft?
VeryUncertain
Sure Mostof the Time
- General comments (if any) on the different forms of translation.
4. Do you feel that the interpretation of the display for any or all cases
would have been improved by having tracers for your own aircraft
as are available for the traffic?
Explain briefly why you feel this way.
5. Did the side task overload you or seriously confuse your normal
control actions ?
6. How would you compare the workload level of this simulation with
that you experience in a normal cockpit? The workload here is
1 1 1
Much Less About the Same Much More
7. Were there any features of the dynamic simulation (aircraft res-
ponses) which you feel would cause the results of these tests to
differ greatly from what might be expected in the real world?
8. Did the primary flight task or wind seem unreasonable?
If so, in what respects?
-IAlwaysCertain
. II I I

-62-
9. Are there any features of the display -- traffic symbology, range
markings, etc. -- which you would like to see changed? If so, in
what way?
BIBLIOGRAPHY
1. Bush, R. W . , Blatt, H. , and Brady, F . X. , "A Cockpit SituationDisplay of Selected NAS/ARTS Data', Lincoln Laboratory, M.I. T.,Tech. Note 1970-39 (ESD-TR-70-404), Lexington, Massachusetts,December, 1970.
2. Connelly, M.E., Rausch, R., Imrich, T., and Anderson, R.,"A Cockpit Simulator for Air Traffic Control Research", 1971Summer Computer Simulation Conference, Boston, Massachusetts,July, 1971.
3. Imrich, T. , "System Concept Development and Evaluation of Air-borne Traffic Displays", Flight Transportation Laboratory, M. I. T.Tech. Memo 71-1, January 1971.
4. Imrich, T., 'System Concept Development and Evaluation of Air-borne Traffic Displays", Department of Aeronautics and Astro-nautics, M.I. T., Master of Science Thesis, June, 1971
5. Klass, P. J., "ATC Automation Facing Key Test", Aviation Weekand Space Technology, July 20, 1970.
6. Kiass, P.J., "ARTS-3 Readied for FAA Service", Aviation Weekand Space Technology, January 25, 1971.
7. McNemar, Quimt. Psychological Statistics, John Wiley and- Sons,Inc.-, New York, 1962.
8. Meister, D. , and Sullivan, D. , "Guide to Human Engineering Designfor Visual Displays", The Bunker-Ramo Corporation, (AD 693 237)Canoga Park, California, August 1969.
9. Payne, T. , "A Study of the Moving Part, Heading Presentation, andMap Detail on Pictorial Air Navigation Displays", Human EngineeringRep. SPECDEVCEN 71-16-10, University of Illinois for U.S.N.,November 1952.
10. Young, L.R. , "Measuring Eye Movement", The American Journalof Medical Electronics, Vol. 2, No. 4, pp. 300-307, October-December, 1963,
11. "Air Traffic Out of Control", Flying, Staff Report, January, 1968.
12. "A Preliminary Report - Design for Legibility of Visual Displays",Human Factors Group, Bendix Radio Div., Bendix Aviation Corp.
13. "Analysis of Human Factors Data for Electronic Flight Displays",Manned Systems Sciences (Contract Objective Summary - Lt. KiethBurnetter, Conract monitor AFFDL, Wright Patterson AFB)(to be published in 1971).
-63-