Embed Size (px)
Citation preview
(FORM-V)
ENVIRONMENTAL STATEMENT REPORT
YEAR 2015-2016
JSW CEMENT LIMITED P.O Vidyanagar, Toranagallu
Dist.Bellary-583275
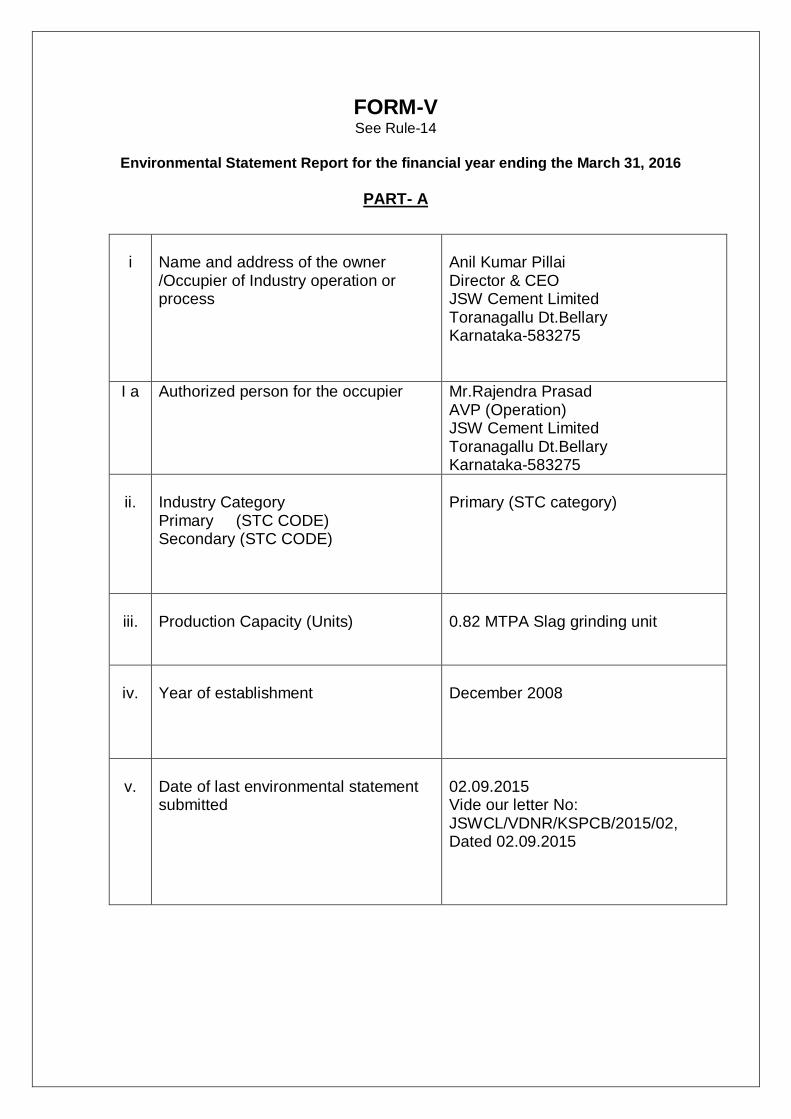
FORM-V See Rule-14
Environmental Statement Report for the financial year ending the March 31, 2016
PART- A
i
Name and address of the owner /Occupier of Industry operation or process
Anil Kumar Pillai Director & CEO JSW Cement Limited Toranagallu Dt.Bellary Karnataka-583275
I a Authorized person for the occupier Mr.Rajendra Prasad AVP (Operation) JSW Cement Limited Toranagallu Dt.Bellary Karnataka-583275
ii.
Industry Category Primary (STC CODE) Secondary (STC CODE)
Primary (STC category)
iii.
Production Capacity (Units)
0.82 MTPA Slag grinding unit
iv.
Year of establishment
December 2008
v.
Date of last environmental statement submitted
02.09.2015 Vide our letter No: JSWCL/VDNR/KSPCB/2015/02, Dated 02.09.2015
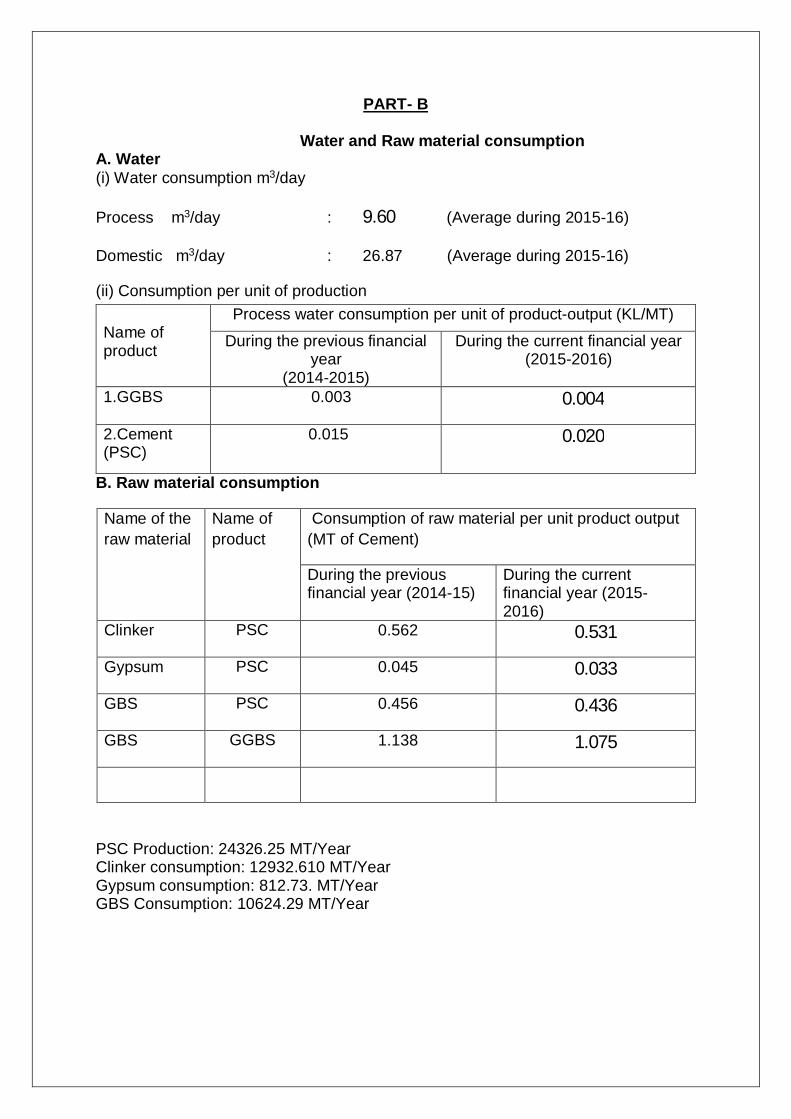
PART- B Water and Raw material consumption A. Water (i) Water consumption m3/day Process m3/day : 9.60 (Average during 2015-16) Domestic m3/day : 26.87 (Average during 2015-16) (ii) Consumption per unit of production
B. Raw material consumption
Name of the raw material
Name of product
Consumption of raw material per unit product output (MT of Cement)
During the previous financial year (2014-15)
During the current financial year (2015-2016)
Clinker PSC 0.562 0.531
Gypsum PSC 0.045 0.033
GBS PSC 0.456 0.436
GBS GGBS 1.138 1.075
PSC Production: 24326.25 MT/Year Clinker consumption: 12932.610 MT/Year Gypsum consumption: 812.73. MT/Year GBS Consumption: 10624.29 MT/Year
Name of product
Process water consumption per unit of product-output (KL/MT) During the previous financial
year (2014-2015)
During the current financial year (2015-2016)
1.GGBS
0.003 0.004
2.Cement (PSC)
0.015 0.020
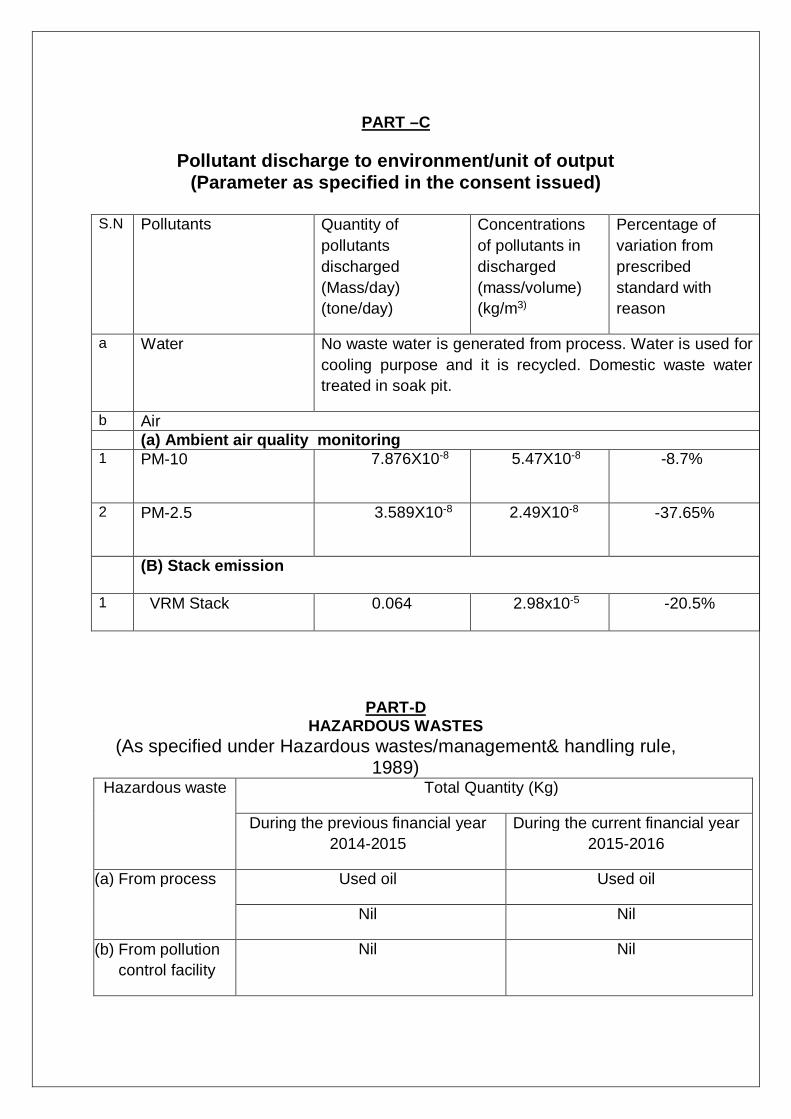
PART –C
Pollutant discharge to environment/unit of output
(Parameter as specified in the consent issued)
S.N
Pollutants
Quantity of pollutants discharged (Mass/day) (tone/day)
Concentrations of pollutants in discharged (mass/volume) (kg/m3)
Percentage of variation from prescribed standard with reason
a Water No waste water is generated from process. Water is used for cooling purpose and it is recycled. Domestic waste water treated in soak pit.
b Air (a) Ambient air quality monitoring 1 PM-10 7.876X10⁻⁸ 5.47X10⁻⁸
-8.7%
2 PM-2.5 3.589X10⁻⁸ 2.49X10⁻⁸
-37.65%
(B) Stack emission
1 VRM Stack 0.064 2.98x10⁻⁵ -20.5%
PART-D HAZARDOUS WASTES
(As specified under Hazardous wastes/management& handling rule, 1989)
Hazardous waste Total Quantity (Kg)
During the previous financial year 2014-2015
During the current financial year 2015-2016
(a) From process Used oil Used oil
Nil Nil
(b) From pollution control facility
Nil Nil
PART-E
SOLID WASTE
S.N Solid Waste Total Quantity (Kg.)
During the previous financial year (2014-15)
During the current financial year (2015-16)
a From Process
No solid waste is generated from the Cement manufacturing process
No solid waste is generated from the Cement manufacturing process
b From Pollution control facility
All the collected material is recycled in process
All the collected material recycled in process
c (i)Quantity recycled or reused
All the collected swept solid waste is reused in process.
All the collected swept solid waste is reused in process.
(ii) sold Nil Nil
(iii) Disposed Nil Nil
PART –F
Please specify the characterizations (in terms of composition quantity and Quantum) of hazardous as well as solid waste and indicates disposal practice adopted for both these categories of wastes.
Hazardous waste, used oil: Nil
Solid waste: Nil
PART –G
Impact of the pollution abatement measures taken on conservation of natural resources and on the cost of production
Following measures have been adopted for abatement of pollution conservation of natural resource:-
1. CONSERVATION OF LIME STONE (Clinker): Utilization of Slag. We are using blast furnace slag, which is waste material of steel plant for the manufacturing of PSC cement. The slag is consumed for making the PSC & GGBS almost 796290 MT for the year of 2015-16.
2. CONSERVATION OF MINIRAL GYPSUM: Utilization of chemical gypsum. We have used fertilizer industry by product which is waste in nature and its chemical properties are as good as gypsum. The chemical gypsum is used for cement manufacturing process almost 720 MT of Chemical gypsum has been consumed in cement manufacturing process during the year of 2015-2016.
3. WATER CONSERVATION : Company is adopting best possible approaches to conserve water, which Can be witnessed as:
i Dry Cement manufacturing process. ii. The process water is used for machinery cooling and it is recycled to Maintain Zero Waste Water Discharge.
iii Rain water harvesting is being done in plant area for ground water Recharge.
4. AIR POLLUTION CONTROL MEASURES: Following measures have being taken to control of air pollution A. Bag House, Bag filters Installed in the plant for the control of air
pollution. Photographs of Bag filter & List of Bag filters with their details given below:
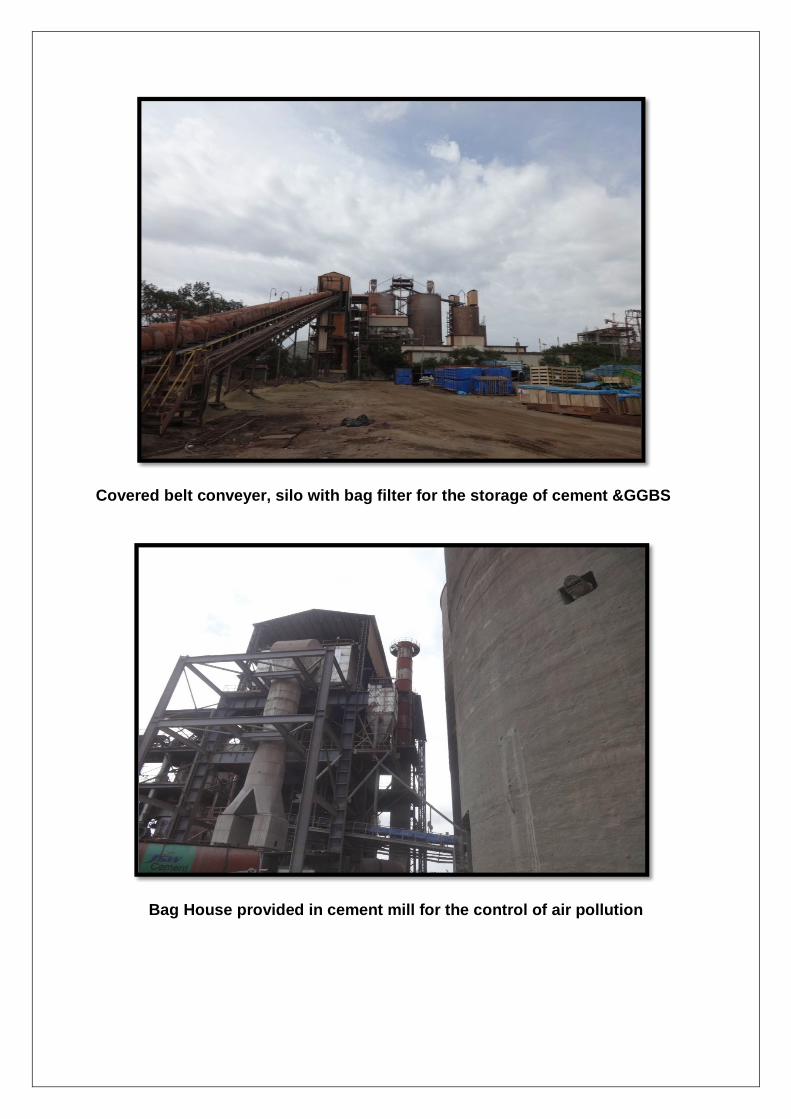
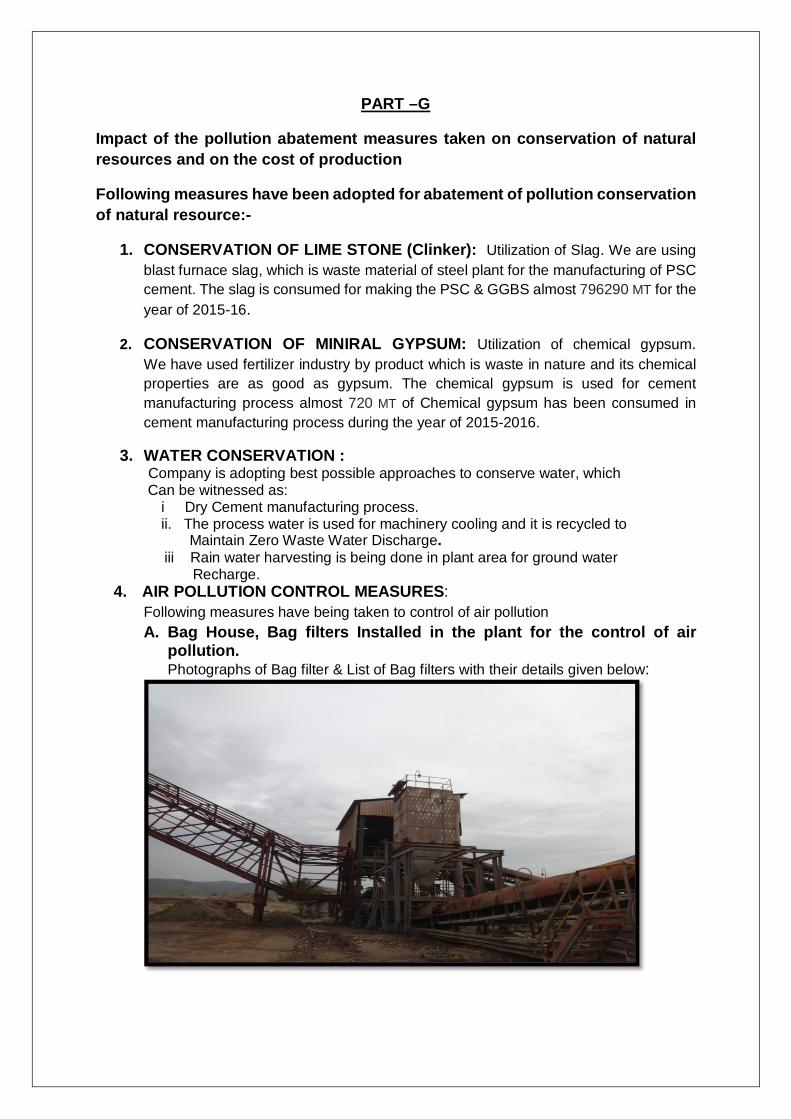
Covered belt conveyer, silo with bag filter for the storage of cement &GGBS
Bag House provided in cement mill for the control of air pollution
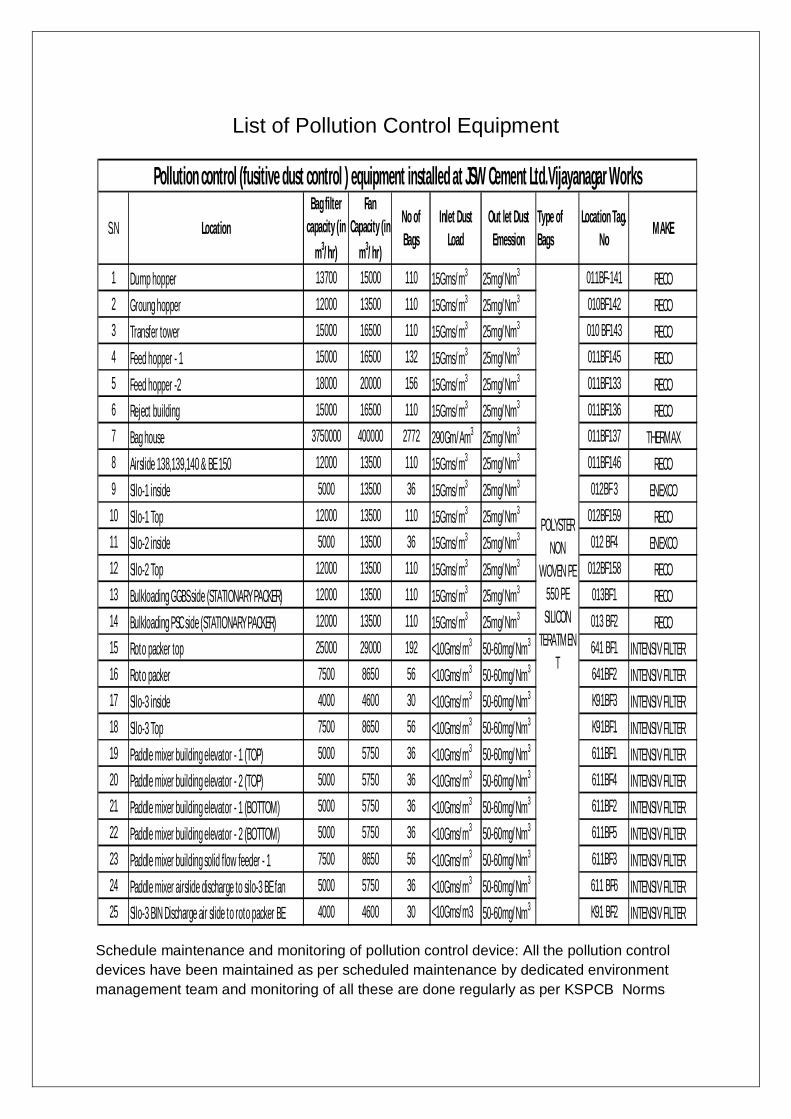
List of Pollution Control Equipment
Schedule maintenance and monitoring of pollution control device: All the pollution control devices have been maintained as per scheduled maintenance by dedicated environment management team and monitoring of all these are done regularly as per KSPCB Norms
S.N Location Bag filter
capacity (in m3/hr)
Fan Capacity (in
m3/hr)
No of Bags
Inlet Dust Load
Out let Dust Emession
Type of Bags
Location Tag. No
MAKE
1 Dump hopper 13700 15000 110 15Gms/m3 25mg/Nm3 011BF-141 RECO2 Groung hopper 12000 13500 110 15Gms/m3 25mg/Nm3 010BF142 RECO3 Transfer tower 15000 16500 110 15Gms/m3 25mg/Nm3 010 BF143 RECO4 Feed hopper - 1 15000 16500 132 15Gms/m3 25mg/Nm3 011BF145 RECO5 Feed hopper -2 18000 20000 156 15Gms/m3 25mg/Nm3 011BF133 RECO6 Reject building 15000 16500 110 15Gms/m3 25mg/Nm3 011BF136 RECO7 Bag house 3750000 400000 2772 290Gm/Am3 25mg/Nm3 011BF137 THERMAX8 Airslide 138,139,140 & BE 150 12000 13500 110 15Gms/m3 25mg/Nm3 011BF146 RECO9 Silo-1 inside 5000 13500 36 15Gms/m3 25mg/Nm3 012BF 3 ENEXCO
10 Silo-1 Top 12000 13500 110 15Gms/m3 25mg/Nm3 012BF159 RECO11 Silo-2 inside 5000 13500 36 15Gms/m3 25mg/Nm3 012 BF4 ENEXCO12 Silo-2 Top 12000 13500 110 15Gms/m3 25mg/Nm3 012BF158 RECO13 Bulkloading GGBS side (STATIONARY PACKER) 12000 13500 110 15Gms/m3 25mg/Nm3 013BF1 RECO14 Bulkloading PSC side (STATIONARY PACKER) 12000 13500 110 15Gms/m3 25mg/Nm3 013 BF2 RECO15 Roto packer top 25000 29000 192 <10Gms/m3 50-60mg/Nm3 641 BF1 INTENSIV FILTER16 Roto packer 7500 8650 56 <10Gms/m3 50-60mg/Nm3 641BF2 INTENSIV FILTER17 Silo-3 inside 4000 4600 30 <10Gms/m3 50-60mg/Nm3 K91BF3 INTENSIV FILTER18 Silo-3 Top 7500 8650 56 <10Gms/m3 50-60mg/Nm3 K91BF1 INTENSIV FILTER19 Paddle mixer building elevator - 1 (TOP) 5000 5750 36 <10Gms/m3 50-60mg/Nm3 611BF1 INTENSIV FILTER20 Paddle mixer building elevator - 2 (TOP) 5000 5750 36 <10Gms/m3 50-60mg/Nm3 611BF4 INTENSIV FILTER21 Paddle mixer building elevator - 1 (BOTTOM) 5000 5750 36 <10Gms/m3 50-60mg/Nm3 611BF2 INTENSIV FILTER22 Paddle mixer building elevator - 2 (BOTTOM) 5000 5750 36 <10Gms/m3 50-60mg/Nm3 611BF5 INTENSIV FILTER23 Paddle mixer building solid flow feeder - 1 7500 8650 56 <10Gms/m3 50-60mg/Nm3 611BF3 INTENSIV FILTER24 Paddle mixer airslide discharge to silo-3 BE fan 5000 5750 36 <10Gms/m3 50-60mg/Nm3 611 BF6 INTENSIV FILTER25 Silo-3 BIN Discharge air slide to roto packer BE 4000 4600 30 <10Gms/m3 50-60mg/Nm3 K91 BF2 INTENSIV FILTER
Pollution control (fusitive dust control ) equipment installed at JSW Cement Ltd.Vijayanagar Works
POLYSTER NON
WOVEN PE 550 PE
SILICON TERATMEN
T
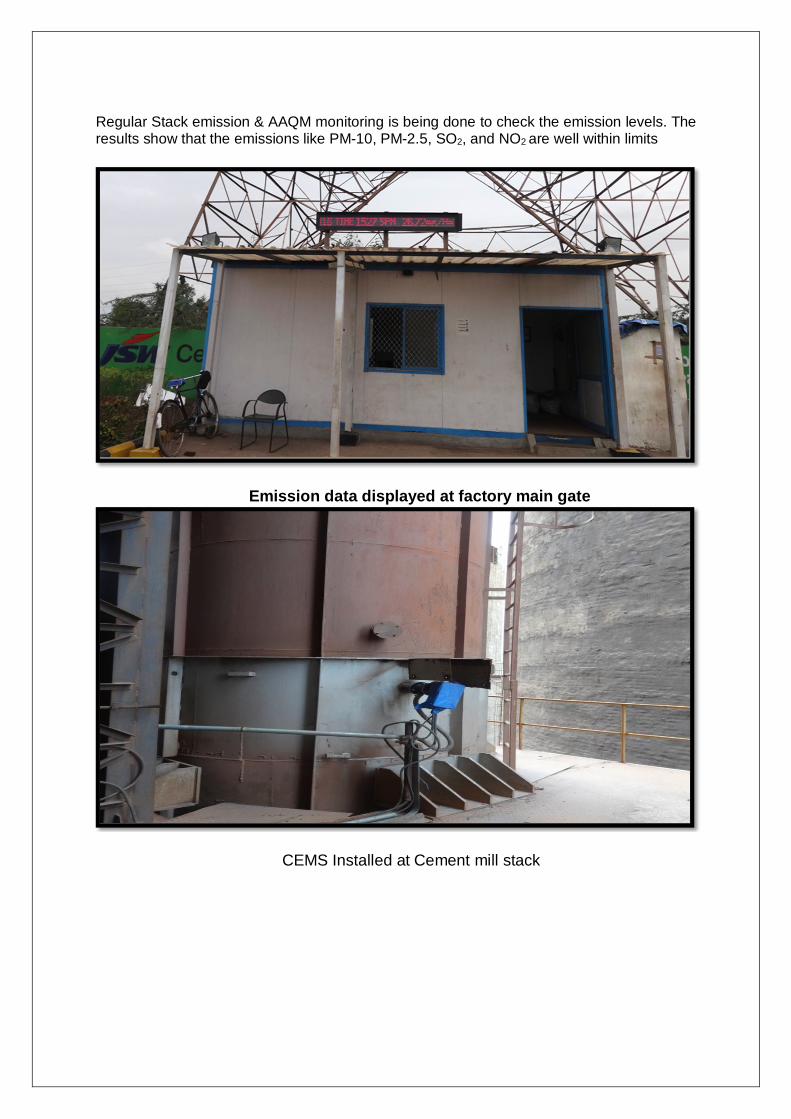
Regular Stack emission & AAQM monitoring is being done to check the emission levels. The
results show that the emissions like PM-10, PM-2.5, SO2, and NO2 are well within limits
Emission data displayed at factory main gate
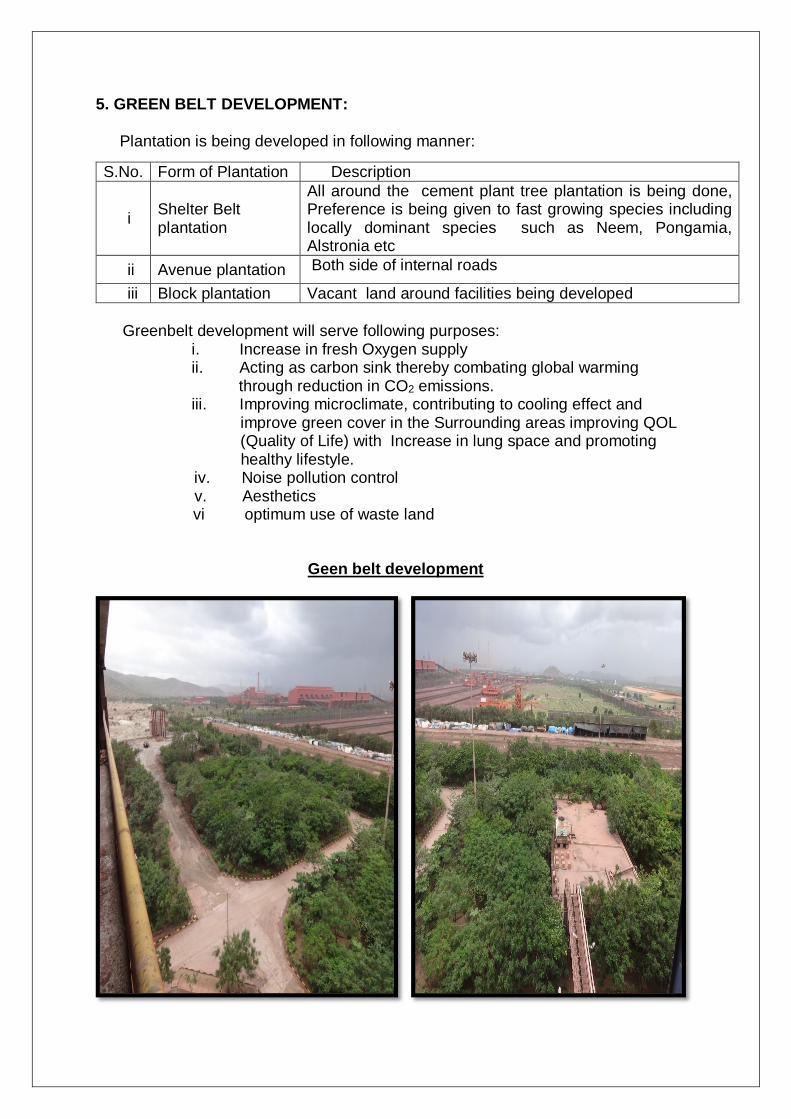
CEMS Installed at Cement mill stack
5. GREEN BELT DEVELOPMENT: Plantation is being developed in following manner:
Greenbelt development will serve following purposes:
i. Increase in fresh Oxygen supply ii. Acting as carbon sink thereby combating global warming
through reduction in CO2 emissions. iii. Improving microclimate, contributing to cooling effect and improve green cover in the Surrounding areas improving QOL (Quality of Life) with Increase in lung space and promoting healthy lifestyle.
iv. Noise pollution control v. Aesthetics vi optimum use of waste land
Geen belt development
S.No. Form of Plantation Description
i Shelter Belt plantation
All around the cement plant tree plantation is being done, Preference is being given to fast growing species including locally dominant species such as Neem, Pongamia, Alstronia etc
ii Avenue plantation Both side of internal roads
iii Block plantation Vacant land around facilities being developed
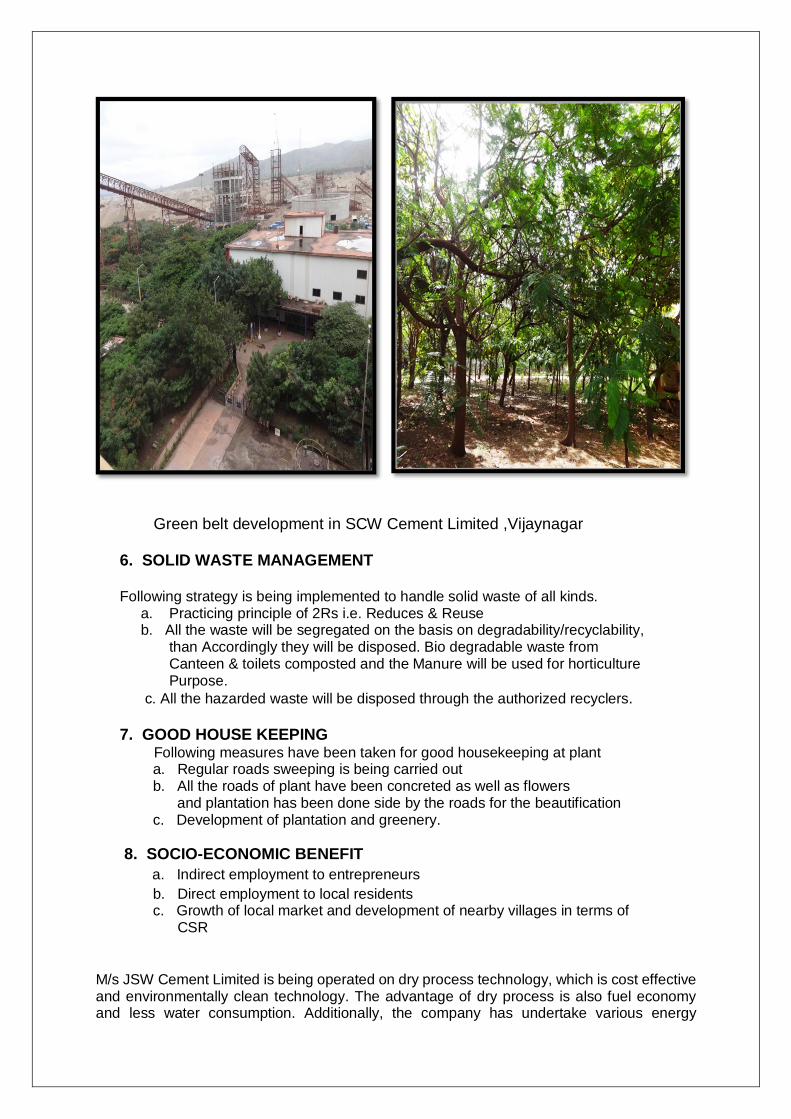
Green belt development in SCW Cement Limited ,Vijaynagar
6. SOLID WASTE MANAGEMENT Following strategy is being implemented to handle solid waste of all kinds.
a. Practicing principle of 2Rs i.e. Reduces & Reuse b. All the waste will be segregated on the basis on degradability/recyclability, than Accordingly they will be disposed. Bio degradable waste from Canteen & toilets composted and the Manure will be used for horticulture Purpose. c. All the hazarded waste will be disposed through the authorized recyclers.
7. GOOD HOUSE KEEPING
Following measures have been taken for good housekeeping at plant a. Regular roads sweeping is being carried out b. All the roads of plant have been concreted as well as flowers and plantation has been done side by the roads for the beautification c. Development of plantation and greenery.
8. SOCIO-ECONOMIC BENEFIT a. Indirect employment to entrepreneurs
b. Direct employment to local residents c. Growth of local market and development of nearby villages in terms of CSR
M/s JSW Cement Limited is being operated on dry process technology, which is cost effective and environmentally clean technology. The advantage of dry process is also fuel economy and less water consumption. Additionally, the company has undertake various energy
efficiency improvement measures & process optimization which helped to significantly reduce the overall energy consumption to enable us to achieves our ultimate goal of GHG emission reduction and positive contribution towards reversing the effects of Climate change. The stack emission from the plant controlled by equipment like Bag house and bag filter installed at various material transfer points to clean the process and arrest the fugitive emission. The particulate matter collected in the pollution control equipment is recycled in process and neutralizing the cost of operation of pollution control equipments and hence no cost impact on the production cost.
PART –H
Additional Measures /investments proposed for environmental protection including abatement of pollution, prevention of pollution.
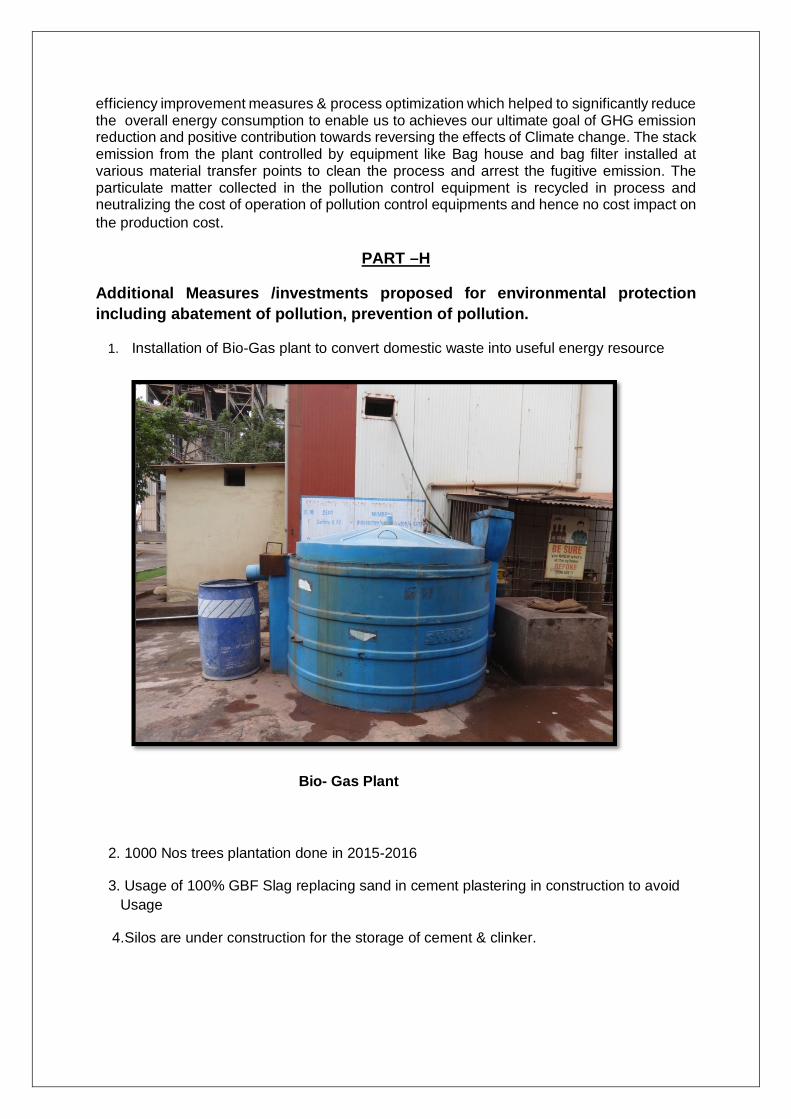
1. Installation of Bio-Gas plant to convert domestic waste into useful energy resource
Bio- Gas Plant
2. 1000 Nos trees plantation done in 2015-2016
3. Usage of 100% GBF Slag replacing sand in cement plastering in construction to avoid Usage
4.Silos are under construction for the storage of cement & clinker.
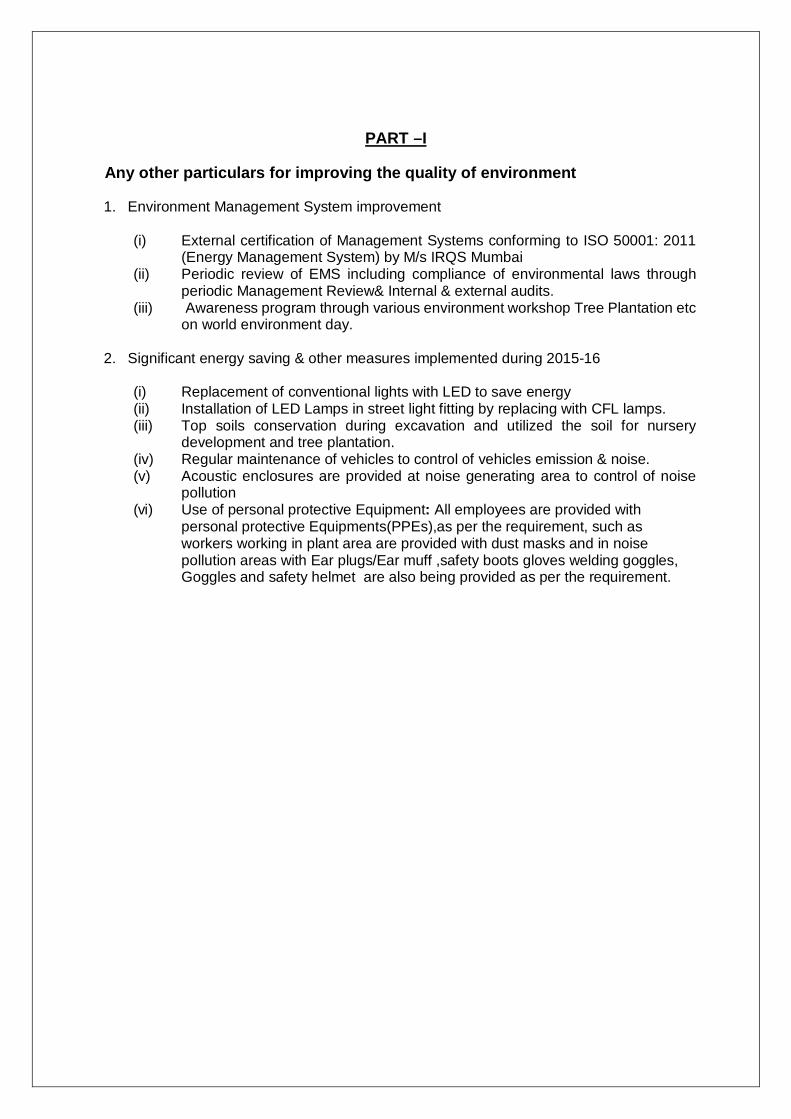
PART –I
Any other particulars for improving the quality of environment
1. Environment Management System improvement (i) External certification of Management Systems conforming to ISO 50001: 2011
(Energy Management System) by M/s IRQS Mumbai (ii) Periodic review of EMS including compliance of environmental laws through
periodic Management Review& Internal & external audits. (iii) Awareness program through various environment workshop Tree Plantation etc
on world environment day.
2. Significant energy saving & other measures implemented during 2015-16
(i) Replacement of conventional lights with LED to save energy (ii) Installation of LED Lamps in street light fitting by replacing with CFL lamps. (iii) Top soils conservation during excavation and utilized the soil for nursery
development and tree plantation. (iv) Regular maintenance of vehicles to control of vehicles emission & noise. (v) Acoustic enclosures are provided at noise generating area to control of noise
pollution (vi) Use of personal protective Equipment: All employees are provided with
personal protective Equipments(PPEs),as per the requirement, such as workers working in plant area are provided with dust masks and in noise pollution areas with Ear plugs/Ear muff ,safety boots gloves welding goggles, Goggles and safety helmet are also being provided as per the requirement.
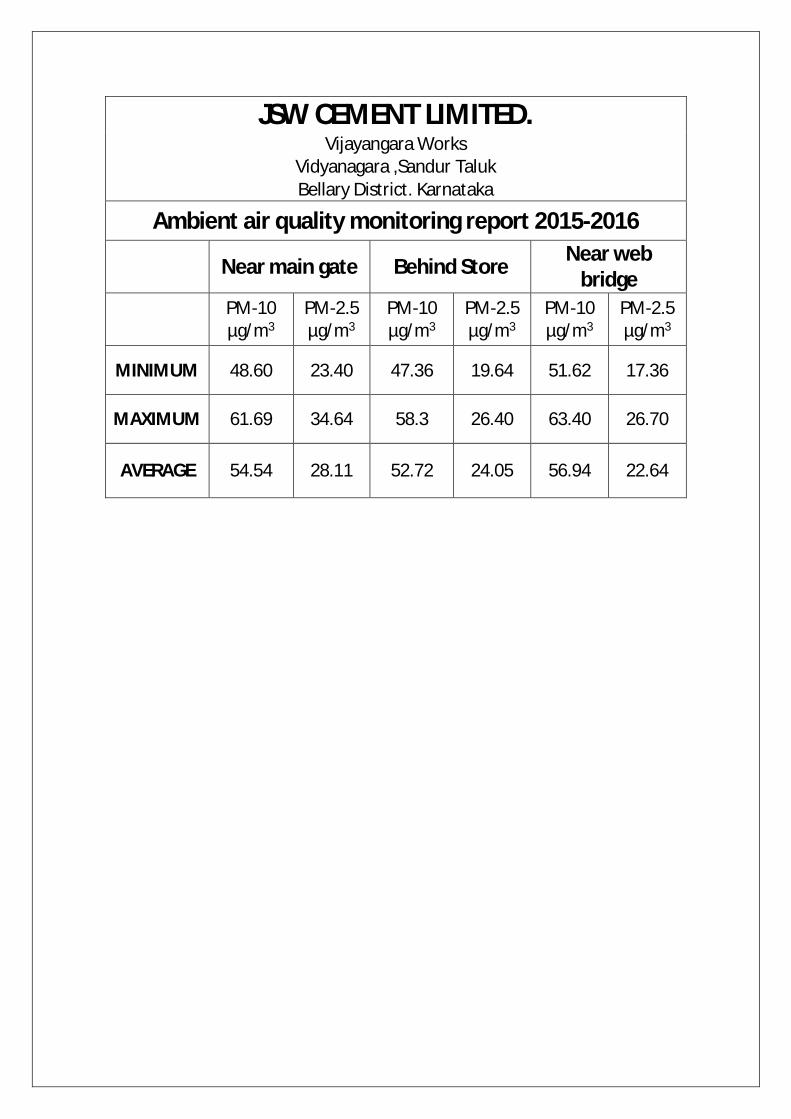
JSW CEMENT LIMITED. Vijayangara Works
Vidyanagara ,Sandur Taluk Bellary District. Karnataka
Ambient air quality monitoring report 2015-2016
Near main gate Behind Store Near web bridge
PM-10 µg/m3
PM-2.5 µg/m3
PM-10 µg/m3
PM-2.5 µg/m3
PM-10 µg/m3
PM-2.5 µg/m3
MINIMUM 48.60 23.40 47.36 19.64 51.62 17.36
MAXIMUM 61.69 34.64 58.3 26.40 63.40 26.70
AVERAGE 54.54 28.11 52.72 24.05 56.94 22.64
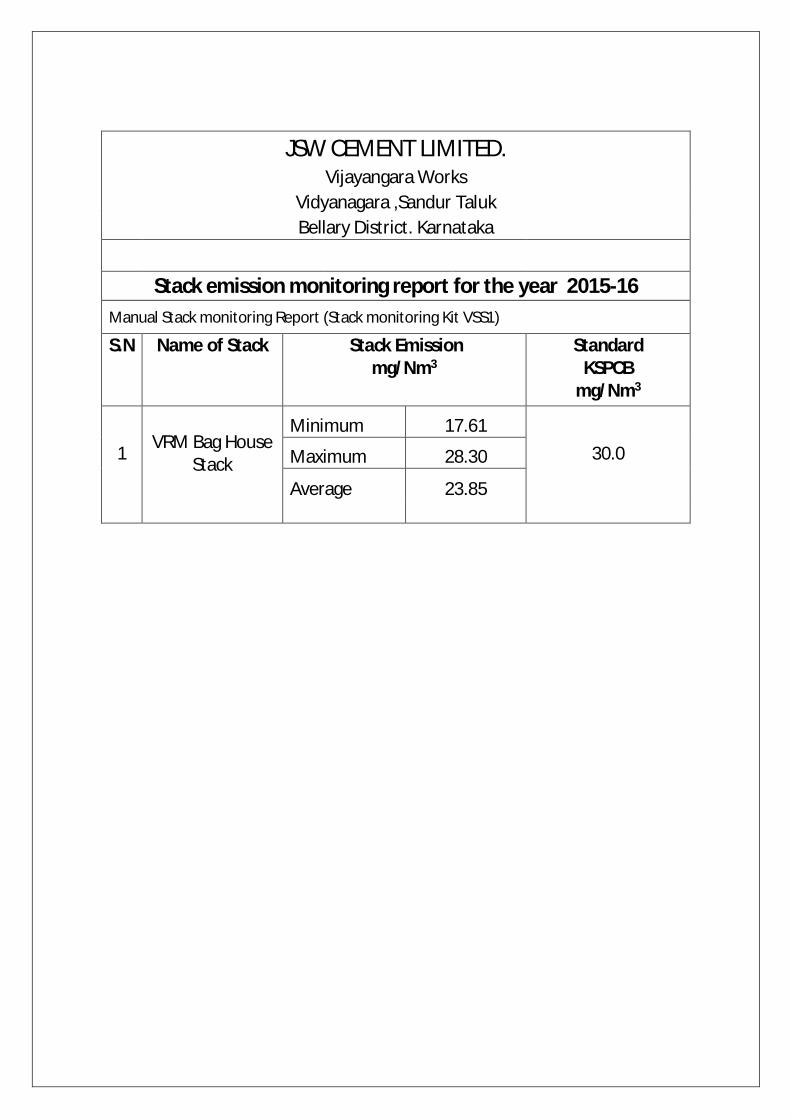
JSW CEMENT LIMITED. Vijayangara Works
Vidyanagara ,Sandur Taluk Bellary District. Karnataka
Stack emission monitoring report for the year 2015-16
Manual Stack monitoring Report (Stack monitoring Kit VSS1)
S.N Name of Stack Stack Emission mg/Nm3
Standard KSPCB
mg/Nm3
1 VRM Bag House Stack
Minimum 17.61 30.0 Maximum 28.30
Average 23.85
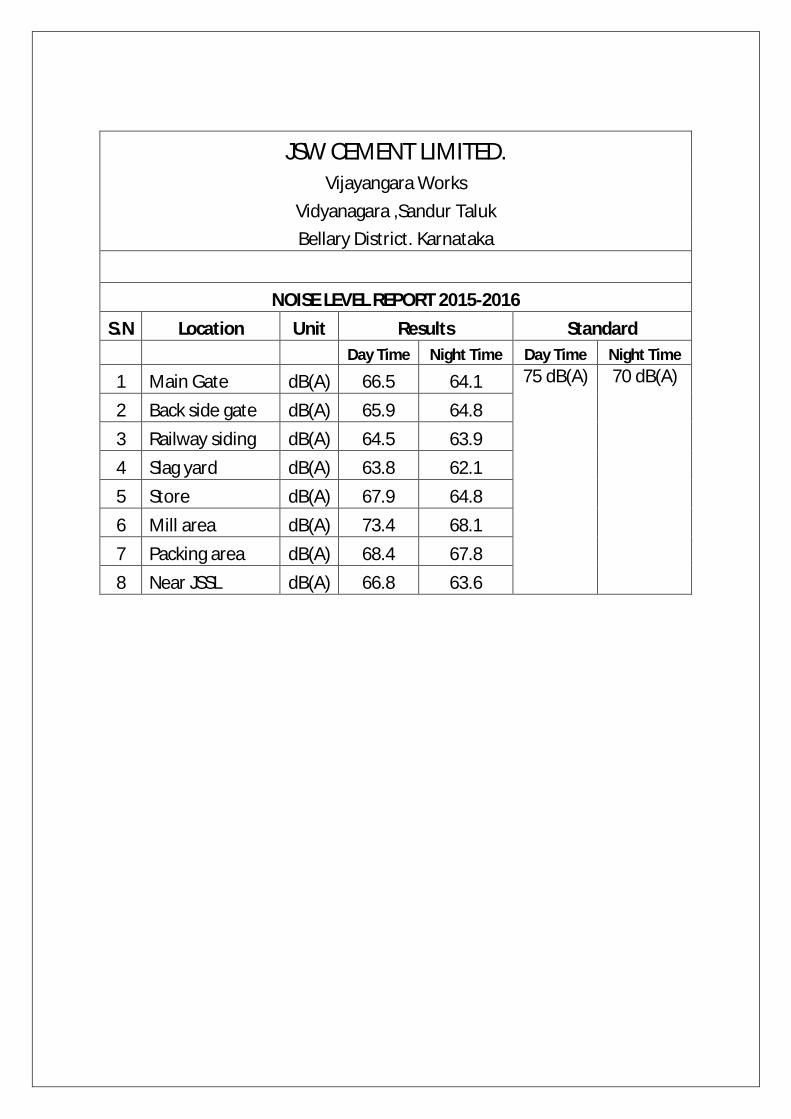
JSW CEMENT LIMITED. Vijayangara Works
Vidyanagara ,Sandur Taluk Bellary District. Karnataka
NOISE LEVEL REPORT 2015-2016
S.N Location Unit Results Standard Day Time Night Time Day Time Night Time
1 Main Gate dB(A) 66.5 64.1 75 dB(A) 70 dB(A)
2 Back side gate dB(A) 65.9 64.8 3 Railway siding dB(A) 64.5 63.9 4 Slag yard dB(A) 63.8 62.1 5 Store dB(A) 67.9 64.8 6 Mill area dB(A) 73.4 68.1 7 Packing area dB(A) 68.4 67.8 8 Near JSSL dB(A) 66.8 63.6