Embed Size (px)
Citation preview
i
Form Approved REPORT DOCUMENTATION PAGE OMB No. 0704-0188 Public reporting burden for this collection of information is estimated to average 1 hour per response, including the time for reviewing instructions, searching data sources, gathering and maintaining the data needed, and completing and reviewing the collection of information. Send comments regarding this burden estimate or any other aspect of this collection of information, including suggestions for reducing this burden to Washington Headquarters Service, Directorate for Information Operations and Reports, 1215 Jefferson Davis Highway, Suite 1204, Arlington, VA 22202-4302, and to the Office of Manag ent and Budget, em
PLEASE DO NOT RETURN YOUR ORM TO THE ABOVE DDRESS. Paperwork Reduction Project (0704-0188) Washington, DC 20503. F A
1. REPORT DATE (DD-MM-YYYY) 2. REPORT TYPE 3. DATES COVERED (From - To) 04-05-2007 Technical report 09-2005 – 04 007 -2
5a. CONTRACT NUMBER DTRA01-03-C-0064
4. TITLE AND SUBTITLE 5b. GRANT NUMBER
Bounding Analysis of Effects of Fractionation of Radionuclides in Fallout on Estimation of Doses to Atomic Veterans
5c. PROGRAM ELEMENT NUMBER 139D
5d. PROJECT NUMBER CS
5e. TASK NUMBER AH
6. AUTHOR(S) John R. Trabalka and David C. Kocher
5f. WORK UNIT NUMBER DH11146
7. PERFORMING ORGANIZATION NAME(S) AND ADDRESS(ES) 8. PERFORMING ORGANIZATION REPORT NUMBER Senes Oak Ridge, Inc.
102 Donner Drive Oak Ridge, TN 37830
10. SPONSOR/MONITOR'S ACRONYM(S)
9. SPONSORING/MONITORING AGENCY NAME(S) AND ADDRESS(ES) Defense Threat Reduction Agency Nuclear Technologies Directorate 8725 John J. Kingman Road, STOP 6201 Fort Belvoir, VA 22060-6201
11. SPONSORING/MONITORING AGENCY REPORT NUMBER DTRA-TR-07-5
12. DISTRIBUTION AVAILABILITY STATEMENT Approved for public release; distribution is unlimited.
13. SUPPLEMENTARY NOTES This work was sponsored by the Defense Threat Reduction Agency under RDT&E RMSS Code B 139D K113 CS AH 111 46 25904 . D14. ABSTRACT This report presents a bounding analysis of the effects of fractionation of radionuclides in fallout from atmospheric nuclear-weapons tests on reconstructed radiation doses to atomic veterans. All dose reconstructions for atomic veterans have been performed by assuming that there was no fractionation of radionuclides in fallout, except for removal of noble gases. This report evaluates the potential importance of fractionation in estimating doses to atomic veterans by using assumptions that would be expected to maximize effects of fractionation.
15. SUBJECT TERMS Nuclear Test Personnel Review, Veterans, Atmospheric Nuclear Weapons Testing, Fallout, Fractionation, Bounding Analysis
16. SECURITY CLASSIFICATION OF: 19a. NAME OF RESPONSIBLE PERSON 17. IMITATION OF BSTRACT
L A
UU 18. NUMBER OF PAGES 72
a. EPORT RU b.
A TRACT BS
U c. THIS P E
19b. TELEPONE NUMBER (Include area code) AG
U STANDARD FORM 298 (Rev. 8/98)
ii
ABSTRACT
This report presents a bounding analysis of the effects of fractionation of radionuclides in
fallout from atmospheric nuclear-weapons tests on reconstructed radiation doses to atomic
veterans. All dose reconstructions for atomic veterans have been performed by assuming that
there was no fractionation of radionuclides in fallout, except for removal of noble gases. Our
purpose was to evaluate the potential importance of fractionation in estimating doses to atomic
veterans by using assumptions that would be expected to maximize effects of fractionation. Our
approach was to (1) assume complete separation of refractory radionuclides from volatile
radionuclides in local fallout and (2) evaluate the effects of this assumption on doses to
individuals exposed to fallout containing only refractory radionuclides after decay periods of
2 days and 4 years compared with doses produced by the same pathways of exposure under an
assumption of no fractionation. If effects of fractionation on doses are relatively small under
bounding conditions at early and late times after detonation, more rigorous calculations to assess
effects of fractionation on doses to atomic veterans would not be needed. Exposure pathways
considered included external exposure to radionuclides deposited on the skin or ground surface
and internal exposure to inhaled or ingested radionuclides. The results of our bounding
calculations indicate that reconstructed doses to atomic veterans that assume no effect of
fractionation could underestimate actual doses from exposure to fission and activation products
by less than a factor of two under the most extreme and highly unlikely assumptions about
fractionation. In many cases, however, the current approach of neglecting fractionation in dose
reconstructions for atomic veterans probably results in overestimates of doses from exposure to
fission and activation products if significant enhancement of refractory radionuclides relative to
volatiles occurred. These conclusions do not include the potential effects of contributions from
unfissioned plutonium in weapons debris, for which all data are currently classified. However,
effects of fractionation on doses from plutonium should be bounded by our analysis, provided
levels of plutonium in unfractionated weapons debris have been accurately characterized in
carrying out dose reconstructions for atomic veterans. Under these conditions, doses from
plutonium would likely be underestimated by less than a factor of three.
iii
TABLE OF CONTENTS ABSTRACT.................................................................................................................................... ii LIST OF FIGURES……………………………………………………………………………….iv LIST OF TABLES……………………………………………………………………...…………v 1. INTRODUCTION ..................................................................................................................... 1 2. BACKGROUND AND APPROACH ....................................................................................... 3 3. DATA AND METHODS .......................................................................................................... 6
3.1 DOSE MODELS AND SOURCES OF DATA .................................................................... 6 3.2 RADIONUCLIDE INVENTORIES AND DECAY CHAINS ............................................ 9
3.2.1 Fission Yields and Decay Chains for Fission Products ................................................. 9 3.2.2 Neutron Activation Products .......................................................................................... 9
3.3 RADIOACTIVE DECAY CALCULATIONS .................................................................. 12 3.4 EXTERNAL AND INTERNAL DOSE COEFFICIENTS ................................................ 15
3.4.1 Dose Coefficients for External Exposure ..................................................................... 15 3.4.1.1 Dose Rate to Skin from Radionuclides Deposited on Body Surface. ................... 15 3.4.1.2 Dose Rate to Skin from Radionuclides Deposited on Ground Surface................ 16 3.4.1.3 Effective Dose Rate from Radionuclides Deposited on Ground Surface............. 17
3.4.2 Dose Coefficients for Internal Exposure ...................................................................... 17 3.5 CALCULATIONS OF EXTERNAL AND INTERNAL DOSE ....................................... 19
4. RESULTS AND DISCUSSION.............................................................................................. 27
4.1 Adjusted Fractionation Ratios for Refractory Radionuclides............................................. 27 4.2 Doses from Unfractionated Mixtures of Fission and Uranium Activation Products ......... 30
5. SUMMARY AND CONCLUSIONS ...................................................................................... 32 6. REFERENCES ......................................................................................................................... 47 APPENDIX A: PARAMETERS AND DOSE COEFFICIENTS FOR RADIONUCLIDES USED IN CALCULATIONS……………………………………………………………......... ...A-1 DISTRIBUTION LIST………………………………………………………………………...DL-1
iv
LIST OF FIGURES Figure Page 1 Summary of Approach to Bounding Analysis of Effects of Radionuclide
Fractionation on Estimates of Dose from Different Exposure Pathways
34
v
LIST OF TABLES Table Page 1 Fission and activation product radionuclides included in analysis 35 2 Fractionation ratios for external effective dose rates from exposure to
radionuclides on ground surface for four fission modes and two activation scenarios at 2 days after detonation
36
3 Adjusted fractionation ratios for external dose rates to skin from exposure to radionuclides produced in four fission modes as a function of decay time, exposure pathway, and assumed yields of activation products
37
4 Adjusted fractionation ratios for 50-y committed effective doses from inhalation of radionuclides produced in four fission modes as a function of decay time, dose-coefficient selection, and assumed yields of activation products
38
5 Adjusted fractionation ratios for 50-y committed effective doses from ingestion of radionuclides produced in four fission modes as a function of decay time, dose-coefficient selection, and assumed yields of activation products
39
6 Adjusted fractionation ratios for 50-y committed doses to lung from inhalation and colon from ingestion by workers of radionuclides produced in four fission modes as a function of decay time and assumed yields of activation products
40
7 Adjusted fractionation ratios for 50-y committed doses to red marrow from inhalation or ingestion by workers of radionuclides produced in four fission modes as a function of decay time and assumed yields of activation products
41
8 Adjusted fractionation ratios for 50-y committed doses to pancreas from inhalation or ingestion by workers of radionuclides produced in four fission modes as a function of decay time and assumed yields of activation products
42
9 External dose rates (Sv/h) per fission from unfractionated mixtures of radionuclides produced in four fission modes as a function of decay time, target organ, exposure pathway, and assumed yields of activation products
43
10 50-year committed effective doses (Sv) per fission from internal exposure to unfractionated mixtures of radionuclides produced in four fission modes as a function of decay time, exposure pathway, dose-coefficient selection, and assumed yields of activation products
44
11 50-year committed effective doses (Sv) per fission to lung from inhalation and colon from ingestion by workers of unfractionated mixtures of radionuclides produced in four fission modes as a function of decay time, target organ, and assumed yields of activation products
45
12 50-year committed effective doses (Sv/fission) to red marrow and pancreas from inhalation or ingestion by workers of unfractionated mixtures of radionuclides produced in four fission modes as a function of decay time and assumed yields of activation products
46
vi
LIST OF TABLES (cont.)
Table Page A.1 Half-lives, chemical characteristics, and decay relationships for radionuclides
used in calculating activity at different times after detonation A-2
A.2 Decay relationships used in calculating activity of I-131 produced in fission A-5 A.3 Fission yields and activities of radionuclides after 2 days of decay A-6 A.4 Calculated activities of radionuclides after 4 years of decay A-8 A.5 Dose coefficients for external exposure and effective dose coefficients for
internal exposure of members of the public A-9
A.6 Dose coefficients for internal exposure of workers A-12
1. INTRODUCTION
In dose reconstructions for atomic veterans, activity concentrations of specific radionuclides
in fallout deposited on the ground are estimated on the basis of external exposure rates (R/h) that
were measured within a few days after detonations of nuclear weapons by assuming that there
was no fractionation of radionuclides, except for removal of noble gases (Egbert et al. 1985;
NRC 2003). The term “fractionation” refers to the chemical and physical separation of
radionuclides produced in a nuclear detonation as the fireball cools over time. Thus, assumed
relative activities of specific radionuclides in fallout are based essentially on estimates of their
abundances or abundances of their precursor radionuclides in weapons debris shortly after a
detonation and before fractionation occurred (e.g., see Hicks 1982; Hicks 1990; and references
therein). For example, relative activities of various fission products in fallout are assumed to be
determined by known fission yields (atoms per fission) in the different mass chains produced by
fission of plutonium and/or uranium in a weapon and knowledge of the decay rates (half-lives) of
radionuclides and precursor-decay product relationships within each mass chain.
The National Research Council’s Committee to Review the Dose Reconstruction Program of
the Defense Threat Reduction Agency noted that while fractionation typically alters the relative
activities of refractory and volatile radionuclides in local fallout by a factor of about 3–4
compared with initial activities in an atmospheric cloud produced by a nuclear detonation, an
effect as large as a factor of 100 or greater has been reported (NRC 2003; also see Freiling et al.
1964). Thus, the committee expressed the concern that activities of plutonium and other
refractory radionuclides in fallout at locations of exposure of atomic veterans could be
underestimated substantially when fractionation is not taken into account, especially at the
Nevada Test Site (NTS), and that activities of volatile radionuclides could be overestimated to a
similar extent.
Although questions exist about the potential contribution of fractionation to uncertainty in
estimated doses to atomic veterans, the limited data on fractionation in weapons fallout do not
appear sufficient to fully address the concerns. Therefore, we elected to evaluate the potential
importance of fractionation in estimating doses to atomic veterans by using assumptions that
would be expected to maximize effects of fractionation. Our analysis is intended to apply

2
primarily to exposures at locations within a few tens of miles from ground zeros of detonations at
the NTS, where substantial enhancement of refractory radionuclides, compared with volatiles, in
fallout occurred. However, the results also are applicable to exposures in the Pacific if
enhancement of refractories in fallout occurred. We also considered effects of enhancement of
volatile radionuclides on estimated doses, but these results are not expected to be important to
exposures of atomic veterans at the NTS or in the Pacific.
The following section provides additional discussion of the process of fractionation and its
potential significance in dose reconstructions for atomic veterans, as well as the rationale for the
approach we used to bound the effects of fractionation on dose. Data sources and equations used
in the bounding analysis are described in Section 3, and results of our calculations are presented
and discussed in Section 4. A summary of the results and our conclusions about their
implications are presented in Section 5. Data used in our analysis are tabulated in Appendix A.
3
2. BACKGROUND AND APPROACH
Fractionation of radionuclides in fallout is a complex phenomenon (Freiling 1961; Freiling
1963; Freiling et al. 1965), and data on fractionation in fallout from specific nuclear weapons
tests do not appear to be extensive. Chemical separation of radionuclides occurs in the first few
minutes after a detonation as a result of differences in rates of condensation of the various
elements that initially make up the radioactive materials in a fireball. Refractory materials have
relatively high boiling points and are largely incorporated in liquid droplets of molten soil and
iron oxide that form as materials in the fireball from a near-surface explosion cool to about
3000oC. In contrast, volatile elements are those that have relatively low boiling points or that
have precursors with low boiling points and remain in the gaseous phase while the fireball cools
to about 1500oC and the liquid droplets solidify. As the cloud cools to ambient temperature
(~50oC), volatile elements (except for the noble gases Kr and Xe) and their decay products
condense on the surfaces of particles. Radionuclides that exhibit the largest fractionation effects
in fallout are those that have short-lived isotopes of Kr and Xe as precursors; those radionuclides
include, for example, Sr-89, Sr-90, and Cs-137 (Hicks 1982; NRC 2003).
Physical separation of fission products occurs as a result of differences in the settling
velocities of small and large particles in the atmosphere. Fallout close to ground zero consists
mostly of relatively large particles that contain a higher proportion of refractory materials,
whereas fallout at more distant locations consists mostly of relatively small particles that contain
a larger proportion of volatile radionuclides (NRC 2003).
An assumption of no fractionation (other than removal of noble gases) in fallout should
result in overestimates of the concentrations of volatile radionuclides deposited on the ground at
locations of exposure of atomic veterans but underestimates of refractory radionuclides, because
participants at the NTS and the Pacific Proving Grounds usually were exposed at locations where
fallout was dominated by larger particles that should have contained a higher proportion of
refractory radionuclides (NRC 2003). An assumption of no fractionation also does not account
for differential fractionation of the volatile radionuclides Sr-89, Sr-90, and Cs-137, which results
from differences in the half-lives of their noble-gas precursors (NRC 2003).
A simplified and idealized description of fractionation is given by Hicks (1982). Hicks
assumed that mass chains of fission products produced by nuclear detonations are either all
4
refractory (mass chains 92–100 and 142–180) or all volatile (75–90 and 101–139), except for
mass chains 91, 140, and 141, which he characterized as having precursors that exhibit volatile
and refractory behavior. Hicks also classified activation products in mass chains 181–203 as
volatile and those in mass chains 7–74 and 204–242 as refractory, while noting that there were
no known volatile radionuclides within the latter two mass ranges.
For purposes of estimating concentrations of radionuclides in fallout at locations far from
the NTS, Hicks (1982) also concluded that the limited data on fractionation were consistent with
a 50% removal of refractory radionuclides but no removal of volatiles in fallout within 160 miles
of ground zero. However, no data on the extent of fractionation in fallout from NTS shots were
reported for distances less than 5–15 miles from ground zero, which is a region of interest in
dose reconstructions for atomic veterans at the NTS. Data presented by Hicks, which show that
volatile/refractory ratios increased with increasing distance and with decreasing particle size,
indicate that concentrations of refractories relative to volatiles had to be elevated within the
region closest to ground zero.1 Indeed, Hicks’ conclusion would imply that at some point close
to ground zero, fallout would have consisted almost entirely of refractory radionuclides, which
typically are incorporated within the volume of larger fallout particles, and it suggests that a
bounding analysis of effects of fractionation on estimated doses to atomic veterans that assumes
complete separation of refractory and volatile radionuclides in local fallout is not unreasonable.
Given the paucity of data on fractionation of radionuclides in fallout at locations of
exposure of atomic veterans at the NTS, our approach was to (1) assume complete separation of
refractory radionuclides from volatile radionuclides in local fallout and (2) evaluate the effects of
this assumption on estimated doses to individuals exposed to fallout containing only refractory
radionuclides compared with doses produced by the same pathways of exposure under an
assumption of no fractionation, as is currently used in dose reconstructions for atomic veterans.
Our reasoning was that if effects of fractionation on doses, in contrast to relative activities of
individual radionuclides or groupings of radionuclides, are relatively small under such
conditions, more rigorous calculations to assess effects of fractionation on doses to atomic
veterans would not be needed.
1 The study that provided the primary source of data used by Hicks (Larson et al. 1966) also showed significant fractionation of Sr-89 from Sr-90 in close-in fallout from tower shots (defined as fallout that occurred in the zone beginning at one mile from ground zero and continuing out to the distance at which fallout arrived at 12 hours after detonation).

5
In dose reconstructions for atomic veterans, relative concentrations of fission products in
fallout from fission of Pu-239, U-235, and U-238 by fast and high-energy (14-MeV) neutrons are
obtained by combining classified data on yields of nuclear weapons from different fission modes
with unfractionated fission product inventories for each fission mode provided by the computer
program FIIDOS (Egbert et al. 1985). Fission product inventories in FIIDOS were calculated
with the isotope generation and depletion code ORIGEN2 by assuming an instantaneous
(2 msec) irradiation time. Each inventory includes the activities of 148 radionuclides potentially
produced in fission. For a particular nuclear test, those inventories are adjusted based on the
fraction of the total fissions attributable to a given fission mode (e.g., from fast neutron fission of
U-235), as obtained from yield data specific to that test. Each fission product inventory is
calculated at 40 decay times ranging from 3 minutes to 70 years (Egbert et al. 1985).
Data on the amounts of activation products and actinides initially produced by a weapon are
supplied by the user of the FIIDOS code. Inventories of individual activation products and
actinides are normalized to 1014 fissions and calculated at the decay times just described.
For calculations involving fallout deposited on the ground, 13 isotopes of Kr and Xe are
removed from the radionuclide inventory. Provisions to modify the radionuclide composition to
reflect fission product fractionation are included in the FIIDOS code but reportedly have not
been used in dose reconstructions for atomic veterans (Egbert et al. 1985; NRC 2003).
Since we lacked access to the FIIDOS or ORIGEN2 codes, we performed simplified
calculations to estimate radionuclide inventories and doses for various exposure pathways using
spreadsheet models. The pathways considered included external exposure to radionuclides
deposited on the skin or ground surface and internal exposure to inhaled or ingested
radionuclides (see Section 3). Calculations were performed for post-detonation times of 2 days
and 4 years, which we assume can be used to bound the effects of fractionation in fresh fallout
and in aged fallout, respectively. The results at 2 days are relevant to evaluating the effects of
fractionation on estimates of concentrations of radionuclides on the ground surface, because
photon exposure rates in air on which those estimates were based were measured at times within
a few days after detonation. Results at 4 years are relevant to certain scenarios for inhalation
exposure of atomic veterans at the NTS that involved unusually high resuspension of aged
fallout, either by the precursor or blast wave produced in a detonation or by participation in
certain types of maneuvers (e.g., helicopter landings) (NRC 2003; Kocher et al. 2005).
6
3. DATA AND METHODS
3.1 DOSE MODELS AND SOURCES OF DATA
We carried out a series of simplified calculations based on an assumption that local fallout
contained only refractory radionuclides for the purpose of estimating doses resulting from
various pathways of internal and external exposure to fission products and a limited suite of
neutron activation products produced by detonation of nuclear weapons compared with doses
that would result by assuming that fallout was unfractionated.
To perform the calculations needed for our evaluation of the effects of fractionation on
estimates of dose to atomic veterans, we utilized five sets of information:
• Fission yields of radionuclides from four fission modes in nuclear weapons:
U-235 by fission neutrons.
Pu-239 by fission neutrons.
U-238 by fission neutrons.
U-238 by 14.7 MeV neutrons.
• Yields of neutron activation products.
• Data on decay chains for fission and neutron activation products.
• Dose coefficients for internal exposure to radionuclides via inhalation or ingestion (i.e.,
committed doses per unit activity intake):
Effective doses from inhalation or ingestion, which give a sum of weighted
equivalent doses in various organs and tissues of the body (ICRP 1991).
Doses to the lung, red marrow, and pancreas from inhalation.
Doses to the colon, red marrow, and pancreas from ingestion.
• Dose coefficients for three pathways of external exposure to radionuclides (i.e., dose
rates per unit activity concentration in specified source region):
Dose to the skin from electrons emitted by radionuclides deposited on the skin.
Dose to the skin from electrons emitted by radionuclides deposited on the ground.
Effective dose equivalent from photons emitted by radionuclides deposited on the
ground.
• Hicks’ (1982) categorization of volatile and refractory radionuclides (see Section 2).

7
The types and sources of this information are discussed in Sections 3.2–3.4. An emphasis on
external exposure of the skin to electrons emitted by radionuclides deposited on skin or on the
ground reflects the importance of skin cancers in claims for compensation by atomic veterans.
In performing the calculations, we eliminated parameters that were not needed in assessing
effects of fractionation on dose, so that results would not be confounded by uncertainties in other
parameters (e.g., inhalable fraction, resuspension factor) used in dose calculations for specific
pathways. The importance of uncertainties in such parameters in assessing doses to atomic
veterans is evaluated in other studies (e.g., see Apostoaei and Kocher 2005; Kocher et al. 2005).
The basic equations used in the dose calculations are the following:
Ai,j = SAi × FYi,j × [BDFi × BRi], (1)
where
Ai,j = activity of radionuclide i per fission in fission mode j (Bq/fission),
SAi = specific activity of radionuclide i or appropriate precursor (Bq/atom),
FYi,j = fission yield of radionuclide i or appropriate precursor in fission mode j
(atom/fission),
BDFi = buildup-decay factor for radionuclide i (dimensionless),
BRi = branching ratio for production of radionuclide i in decay of precursor
(dimensionless).2
Di,j = Ai,j × DFi (2)
where
Di,j = effective dose from intake of radionuclide i produced in fission mode j
(Sv/fission),
Ai,j = activity of radionuclide i per fission (Bq/fission) in fission mode j [see
equation (1)], which is activity assumed to be inhaled or ingested,
DFi = effective dose per unit activity intake of radionuclide i by inhalation or
ingestion (Sv/Bq).
2 The activity of some radionuclides represents the sum of activities resulting from decays of precursors with two decay modes (i.e., with different buildup-decay factors and branching ratios) and, in several cases, from decays of several precursors with independent fission yields (e.g., I-131); see discussion in Section 3.3 and data in Appendix A, Tables A.1 and A.2.
8
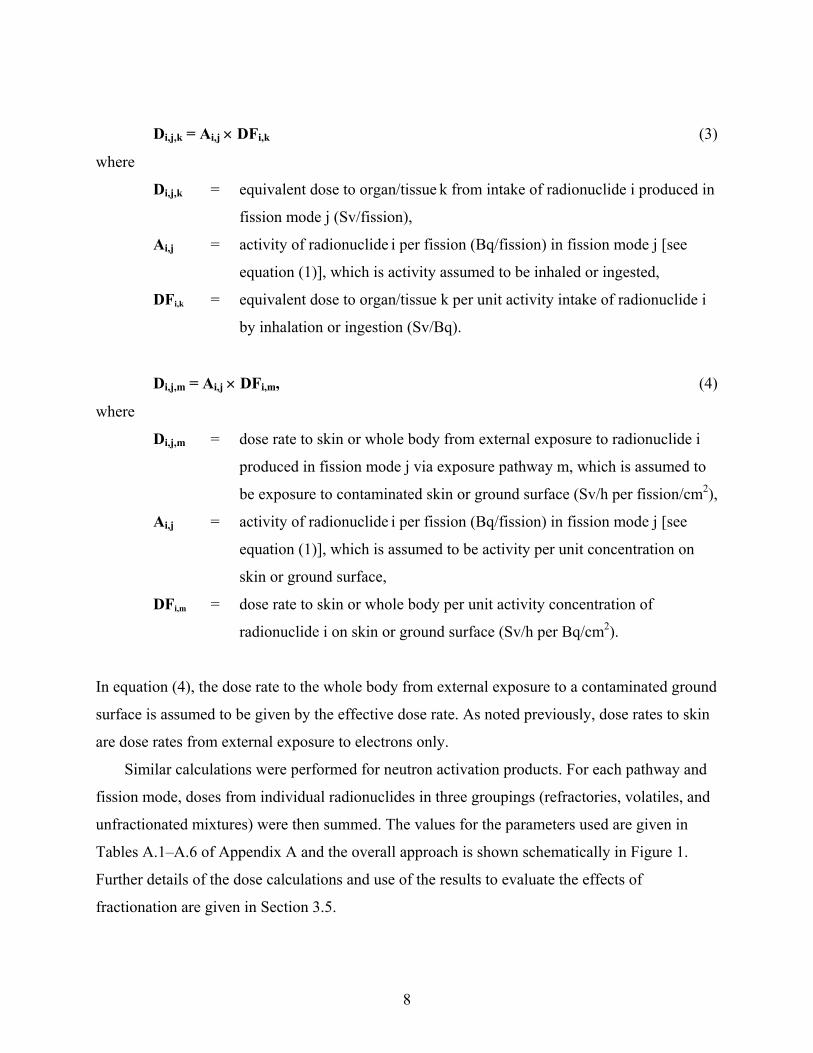
Di,j,k = Ai,j × DFi,k (3)
where
Di,j,k = equivalent dose to organ/tissue k from intake of radionuclide i produced in
fission mode j (Sv/fission),
Ai,j = activity of radionuclide i per fission (Bq/fission) in fission mode j [see
equation (1)], which is activity assumed to be inhaled or ingested,
DFi,k = equivalent dose to organ/tissue k per unit activity intake of radionuclide i
by inhalation or ingestion (Sv/Bq).
Di,j,m = Ai,j × DFi,m, (4)
where
Di,j,m = dose rate to skin or whole body from external exposure to radionuclide i
produced in fission mode j via exposure pathway m, which is assumed to
be exposure to contaminated skin or ground surface (Sv/h per fission/cm2),
Ai,j = activity of radionuclide i per fission (Bq/fission) in fission mode j [see
equation (1)], which is assumed to be activity per unit concentration on
skin or ground surface,
DFi,m = dose rate to skin or whole body per unit activity concentration of
radionuclide i on skin or ground surface (Sv/h per Bq/cm2).
In equation (4), the dose rate to the whole body from external exposure to a contaminated ground
surface is assumed to be given by the effective dose rate. As noted previously, dose rates to skin
are dose rates from external exposure to electrons only.
Similar calculations were performed for neutron activation products. For each pathway and
fission mode, doses from individual radionuclides in three groupings (refractories, volatiles, and
unfractionated mixtures) were then summed. The values for the parameters used are given in
Tables A.1–A.6 of Appendix A and the overall approach is shown schematically in Figure 1.
Further details of the dose calculations and use of the results to evaluate the effects of
fractionation are given in Section 3.5.
9
3.2 RADIONUCLIDE INVENTORIES AND DECAY CHAINS
3.2.1 Fission Yields and Decay Chains for Fission Products
Information on decay chains and yields of fission products was obtained from England and
Rider (1994) for four fission modes: U-235 by fission neutrons (U-235 nf), Pu-239 by fission
neutrons (Pu-239 nf), U-238 by fission neutrons (U-238 nf), and U-238 by 14.7-MeV neutrons
(U-238 n14). These data were expected to represent the principal fission modes of interest in
assessing doses from exposure to weapons fallout. In the absence of actual or generic nuclear
weapons yield data, we were not able to estimate the fractional contributions of each fission
mode to the total fission yield for specific shots. Thus, we performed four independent sets of
calculations using these data, one for each fission mode. Fission yield data for specific
radionuclides used in the calculations are shown in Tables A.3 and A.4 of Appendix A.
Fission products with half-lives of 2.4 hours or less were not included unless they were
required in calculating the activities of longer-lived decay products (e.g., 23-min Sb-131, 2.1-h
Sn-127) or they were decay products of long-lived radionuclides (see Section 3.3and listing of
half-lives in Table A.1 of Appendix A). Radionuclides with half-lives greater than 104 years
(e.g., 6.5 × 10⁴-y Se-79) also were excluded because they were expected to make negligible
contributions to doses and dose rates in the time frames considered, due to their low specific
activities. Noble-gas fission products (isotopes of Kr and Xe) were excluded regardless of half-
life because they were not present in fallout. Radionuclides with fission yields less than 10-6 were
excluded unless the yield for at least one of the four fission modes exceeded 10-6 (e.g., Cd-113m,
I-130). Finally, contributions from 7.4-min Pr-144m, which is a decay product of Ce-144, were
ignored because that radionuclide contributes negligibly to internal and external doses from
exposure to Ce-144 and its decay product Pr-144.
3.2.2 Neutron Activation Products
In contrast to the situation for fission products, there is much less published information on
yields of activation products from nuclear detonations. Published data for specific activation
products produced by individual nuclear detonations are limited to activation products in
weapons debris, and those data that are available appear to be highly variable (e.g., see
10
Morgenthau et al. 1957; Hicks 1981). Hicks (1982) assumed a yield of one atom of each
activation product per fission in his calculations. Calculations presented in this report that
include neutron activation products consider U-237 and U-239–Np-239 only. However, as
indicated by later discussions in Section 4.1, we believe that calculations that include uranium
activation products are sufficient to fully support a bounding analysis of the effects of
fractionation on reconstructed doses to atomic veterans.
Yields of U-237 and U-239─Np-239 in one set of calculations for all fission modes (fission
products + U, 2-d decay) were based on activation estimates of 0.15 atoms/fission for U-237 and
0.30 atoms/fission for U-239 in fallout resulting from Shot BRAVO, which was a test of a
thermonuclear weapon (Miller 1964). Based on the results for effective dose rates from exposure
to radionuclides on the ground surface that include U-237 and U-239 at the stated levels (see
Section 4.1), however, it appears that the activation estimates from the Shot BRAVO data cited
by Miller (1964) may not be representative of levels in fallout from many thermonuclear
weapons tests. Decay of U-237 and Np-239 in fallout from thermonuclear weapons reportedly
can contribute 50% or more of the total gamma radiation level at times of a few days after
detonation (Miller 1959; Barss 2000). However, results of calculations based on the Shot
BRAVO data yield an increase in the effective dose rate from ground deposition of fallout,
which is a reasonable surrogate for external gamma radiation level, of only about 14% compared
with calculations that include fission products only. The yield of Na-24, which is the other
principal activation product in weapons debris, and its contribution to the external exposure rate
was found to be small in comparison with uranium activation products and fission products
produced in fission and thermonuclear devices tested in the Pacific (Miller 1959).
Data on Np-239 levels in fallout following several weapons tests conducted during
Operation REDWING in May–July 1956 at the Pacific Proving Grounds were provided by
Morgenthau et al. (1957). Measurements of Mo-99 (a refractory fission product) and Np-239
(also considered to be refractory) were used to estimate the yields of Np-239 per fission in fallout
from three tests. Values ranged from about 0.2 atoms/fission for fallout from Shot LACROSSE
(40 kt) to about 0.5–1 atoms/fission (including uncertainties) for Shots ZUNI (3.5 Mt) and
FLATHEAD (also presumed to be a multi-Mt device, although no yield was provided in any
reference available to us, e.g., Zander and Araskog 1973; Moghissi and Carter 1977). Thus, we
performed another set of calculations for all fission modes by assuming elevated levels of
11
uranium activation products (fission products + 3.3 × U, 2-d decay); the yield of Np-239 in those
calculations was increased from 0.3 to 1 atom/fission, and the yield of U-237, which was not
measured in the fallout studies at Operation REDWING, was increased to 0.5 atoms/fission
based on its relative abundance in the Shot BRAVO fallout data. These increases resulted in an
increase in the effective dose rate from ground deposition of fallout of about 50% compared with
calculations that include only fission products, in better agreement with the expected
contribution of uranium activation products to gamma radiation levels in fallout from
thermonuclear weapons tests.
Although calculations were performed for all fission modes using the two sets of U-237 and
Np-239 data described above, much of the data are strictly applicable only to activation of U-238
in the uranium tamper of a thermonuclear weapon, for which the principal source of neutrons is
expected to be fusion reactions (~14 MeV) and fission of U-238 by ~14-MeV and fission
neutrons. However, a complete set of results for all four fission modes was included because
they show that (1) assumptions about relative contributions from other fission modes have little
or no effect on conclusions about effects of fractionation obtained from comparisons of
estimated doses for U-238 n14 fission alone and (2) results of calculations that include Np-239
and U-237 appear to bound the effects of fractionation that would be obtained on the basis of
other assumptions about quantities of activation products (see Section 4.1).
Comparisons of data provided by Hicks (1981) on Np-239, U-237, and Mo-99 activity levels
in fallout from four detonations of fission weapons conducted during Operation PLUMBBOB in
1957 [BOLTZMANN (12 kt), FRANKLIN (0.14 kt), PRISCILLA (37 kt), and WILSON (10 kt)]
suggest that the yield of Np-239 in these tests was less than about 0.1 atoms/fission, and that the
yield of U-237 was an order of magnitude lower. We did not have access to all the data on tests
at the NTS that have been compiled in the series of reports by Hicks. However, coupled with the
data on the yield of Np-239 (about 0.2 atoms/fission) in Shot LACROSSE (40 kt) at Operation
REDWING and additional data on the relative importance of activation products given by Hicks
(1982), it would appear that the data for Shot BRAVO might be a useful surrogate (i.e., perhaps
close to an upper bound) for levels of uranium activation products in fallout from weapons tests
at the NTS. Neptunium-239 reportedly was the primary source of gamma radiation among the
activation products in those tests, contributing up to 20% of external gamma radiation levels
from early fallout (e.g., in fallout from Shots HARRY and SMOKY; Hicks et al. 1982). Such
12
levels are comparable to those produced by U-237 and Np-239 combined in fallout from Shot
BRAVO, as discussed above.
Uranium-237 and Np-239 were not included in calculations in which a 4-year decay period
was assumed because of their very short half-lives (both less than 10 days). Other short-lived
uranium activation products that could be considered at 2 days are U-240 and Np-240m.
However, available information (e.g., Hicks 1981) indicates that yields of these radionuclides
were typically 1–2 orders of magnitude less than yields of U-237 or U-239–Np-239.
The effects of not including activation products in weapons debris other than those of
uranium are not expected to be substantial, because data reported by Hicks (1982) indicate that
contributions to photon exposure rates in air from other activation products in fallout at the NTS
were less than exposure rates from Np-239. For example, the contribution to exposure rates from
Co-60, which is the next most important activation product, was 10% or less (Hicks 1982). A
check of the NTS data for 25 detonations (tower shots, balloon shots, air bursts) by Hicks (1982)
reportedly showed that contributions of more than 1% to the total gamma radiation levels were
due to only three activation products: Co-60, U-237, and Np-239. Contributions from other
activation products to other exposure pathways, such as inhalation, should be of the same order
of magnitude. However, additional calculations could be performed to include such materials if
so desired.
3.3 RADIOACTIVE DECAY CALCULATIONS
Calculations of activities (in units of Bq/fission) of each fission and uranium activation
product were performed for each of the four fission modes, as indicated in Figure 1, using an
EXCEL spreadsheet program. Initial activities were corrected for radioactive decay over times
after detonation times of 2 days and 4 years. Analyses at these times are expected to provide
representative information on conditions at times of interest in exposures of atomic veterans.
Two sets of calculations included assumed activities of uranium activation products, as
estimated from yields in tests conducted in the Pacific (see Section 3.2.2), and the other set of
calculations included only data on yields of fission products. Parameters used in the decay
calculations are given in Tables A.1 and A.2 of Appendix A, along with calculated buildup-
decay factors and decay branching ratios with values less than 1.
13
Because we did not have access to a sophisticated isotope generation and depletion code,
such as ORIGEN2, as used in FIIDOS (Egbert et al. 1985), we calculated buildup and decay of
radionuclides in decay chains directly using the Bateman equations, as described in Evans
(1955). This approach can be problematic when a mass chain has decay products with significant
fission yields independent of yields of the parent or other precursor radionuclides (see Table A.3
of Appendix A) and calculations involving decay chains longer than three radionuclides can be
difficult to perform analytically. Thus, as described below, simplifications were employed to
reduce the complexity of decay-chain calculations or eliminate radionuclides that were not
expected to be significant contributors to fission product activity.
• As noted in Section 3.2.1, radionuclides with half-lives less than 2.4 hours were not
included in calculations unless they are decay products of radionuclides with half-lives of
2.4 hours or greater. The rationale for this choice was that more than 10 half-lives would
have elapsed in the 2-day decay period assumed in the first set of calculations. Likewise,
radionuclides with half-lives less than 30 days were not included in the calculations at
4 years unless they are decay products in secular equilibrium with longer-lived parents.
Radionuclides with half-lives greater than 104 years also were excluded, as noted in
Section 3.2.1, due to their very low activities per fission compared with shorter-lived
radionuclides.
• Effects on yields and activities due to decay of short-lived precursors with half-lives less
than 10 minutes were ignored, because the effects were expected to be negligible.
• In the following three cases, consideration of four-member decay chains was required:
10-min Y-95 → 64.02-d Zr-95 → 86.6-h Nb-95m → 35.06-d Nb-95
2.1-h Sn-127 → 3.85-d Sb-127 → 109-d Te-127m → 9.35-h Te-127
23-min Sb-131 → 30-h Te-131m → 25-min Te-131 → 8.04-d I-131.
Calculations at 2 days for the first two cases were simplified by reducing the decay period
by an amount equal to the time of maximum buildup of the decay product of the first
radionuclide in the decay chain, which is given by tmax = ln (λA/λB)/(λB – λA), where λA
and λB are the decay constants for the first and second radionuclides in the decay chains,
respectively (Evans 1955). Thus, the decay periods in the 2-day calculations were
reduced by 2.2 hours for Zr-95 and by 11.7 hours for Sb-127, to 45.8 hours and
14
36.3 hours, respectively. In the third case, the branching ratio for the portion of the decay
pathway from 30-h Te-131m to 8.04-d I-131 was increased from 0.778 to 1 to account for
the contribution from intermediate decay of 25-min Te-131. This simplification is
expected to have a negligible influence on the results because the half-life of Te-131 is
about 1% of that for Te-131m and about 0.2% of that for I-131 (see Table A.2 of
Appendix A).
• Ag-111 is fed by decays of 5.5-h Pd-111m and 23-min Pd-111, both of which originate
from decay of the fission product 11-s Rh-111. Because the branching ratio from Rh-111
to Pd-111m is <0.5%, the presence of Pd-111m and its decay products, 23-min Pd-111
and 74-s Ag-111m, was ignored in mass chain 111, and Pd-111m was not included in the
calculations even though its half-life is greater than 2.4 hours. A similar simplification
apparently is employed in the FIIDOS code (see Table 7 in Egbert et al. 1985).
These types of assumptions and simplifications are not expected to have a significant impact
on the results of our analysis. For example, results from the present exercise were not
significantly different than those from a preliminary set of calculations we performed that did not
include decay chain calculations for any precursor with a half-life less than 2.4 hours. If greater
rigor is desired, we would need access to a computer program, such as ORIGEN2, to calculate
the formation, buildup, and decay of fission products, along with weapons yield data for different
fission modes.
Using the approaches described in Section 2.1 and this section, the total number of fission
products was reduced to 79 in the 2-day calculations and to 27 in the 4-year calculations.
Radionuclides (fission and activation products) included in the calculations at 2 days and 4 years
are listed in Table 1.
15
3.4 EXTERNAL AND INTERNAL DOSE COEFFICIENTS
3.4.1 Dose Coefficients for External Exposure
As discussed in Section 3.1, we performed dose calculations for three pathways of external
exposure using equation (4). External dose coefficients for the 79 fission products and two
activation products included in our analysis were obtained from the published literature for the
following exposure pathways:
• Exposure of the skin to electrons emitted by radionuclides deposited on the surface of the
body;
• Exposure of the skin to electrons emitted by radionuclides deposited on the ground
surface;
• Exposure of the whole body to photons emitted by radionuclides deposited on the ground
surface.
These pathways were selected because skin can receive the largest dose from exposure to
radionuclides deposited on the body surface or ground and the effective dose rate resulting from
photons emitted by radionuclides deposited on the ground is a reasonable surrogate for the
photon exposure rate in air, which is used to calculate concentrations of radionuclides in fallout
in dose reconstructions for atomic veterans (Barrett et al. 1986; NRC 2003). However, only the
results at 2 days are relevant to evaluating the effects of fractionation on estimates of
concentrations of radionuclides on the ground surface, because photon exposure rates in air on
which those estimates were based were measured within a few days after detonation. Doses to
skin from exposure to photons emitted by radionuclides deposited on the body surface or ground
are not included because they are unimportant whenever a radionuclide emits significant
intensities of electrons, primarily beta particles, of energy sufficient to irradiate tissue at a depth
of 7 mg/cm2.
3.4.1.1 Dose Rate to Skin from Radionuclides Deposited on Body Surface.
Dose coefficients for exposure of the skin to electrons emitted by radionuclides deposited on
the surface of the body were obtained from Table 1 in Kocher and Eckerman (1987). Those dose
coefficients apply to irradiation of tissue at a depth of 7 mg cm-2, and they were calculated by
16
assuming that sources are distributed uniformly on the body surface.3 However, Kocher and
Eckerman (1987) did not provide dose coefficients for the following 27, mainly shorter-lived,
radionuclides included in our calculations: Ge-77, As-77, Y-91m, Sr-92, Y-92, Y-93, Pd-109,
Ag-111, Ag-112, Ag-113, Cd-115, In-115m, Sn-121, Sn-123, Sn-125, Sb-128, I-130, La-141, Pr-
145, Pm-149, Pm-151, Sm-153, Sm-156, Eu-156, Eu-157, Gd-159, and U-237. Dose coefficients
for these radionuclides were estimated by interpolation of values in Kocher and Eckerman
(1987) for radionuclides with similar average or maximum beta energies. Interpolations were
based on maximum beta energies when average beta energies were not available. Average beta
energies were obtained from Kocher (1980), and maximum beta energies were obtained from
Kocher (1981) or Firestone (1996).
Dose coefficients obtained from data in Kocher and Eckerman (1987) in units of Sv/y per
Bq/cm2 were converted to units of Sv/h per Bq/cm2 by dividing by 8760. Dose coefficients for
exposure of the skin to electrons emitted by radionuclides deposited on the surface of the body
used in our analysis are given in Table A.5 of Appendix A.
3.4.1.2 Dose Rate to Skin from Radionuclides Deposited on Ground Surface.
Dose coefficients for exposure of the skin to electrons emitted by radionuclides deposited on
the ground surface were obtained from Table III.3 in Eckerman and Ryman (1993). Those dose
coefficients were calculated at a height of 1 m above ground and assume exposure to an infinite
and uniformly contaminated plane source. However, the compilation by Eckerman and Ryman
(1993) does not include two radionuclides considered in our analysis: Pd-112 and Ag-113. Dose
coefficients for these two radionuclides were estimated by interpolation of values in Eckerman
and Ryman (1993) for radionuclides with similar decay schemes. In the case of Pd-112, dose
coefficients for Pd-113 and Cf-253 were summed to obtain a suitable surrogate and, for Ag-113,
dose coefficients for Ag-110 and Sm-153 were summed. These summations were required
because decay schemes of single radionuclides alone were insufficiently representative of the
decay schemes of Pd-112 and Ag-113.
3 An assumption of uniform contamination over the body is not a serious limitation in using dose coefficients calculated by Kocher and Eckerman (1987). As a result of the short range of electrons in tissue, a surface area as small as 15 cm2 is effectively infinite in extent with respect to estimating electron dose to skin at depths below the center of a contaminated area.
17
Dose coefficients obtained from data in Eckerman and Ryman (1993) in units of Sv/s per
Bq/m2 were converted to units of Sv/h per Bq/cm2 by multiplying by 3.6 × 10⁷. Dose coefficients
for exposure of the skin to electrons emitted by radionuclides deposited on the ground surface
used in our analysis are given in Table A.5 of Appendix A.
3.4.1.3 Effective Dose Rate from Radionuclides Deposited on Ground Surface.
Effective dose coefficients for exposure to photons emitted by radionuclides deposited on
the ground surface also were obtained from Table III.3 in Eckerman and Ryman (1993). Those
dose coefficients again were calculated at a height of 1 m above ground and assume exposure to
an infinite and uniformly contaminated plane source. As discussed in the previous section, dose
coefficients in Eckerman and Ryman (1993) do not include values for Pd-112 and Ag-113, and
dose coefficients for these radionuclides again were estimated by interpolation of values for
other radionuclides.
Dose coefficients obtained from data in Eckerman and Ryman (1993) in units of Sv/s per
Bq/m2 again were converted to units of Sv/h per Bq/cm2 by multiplying by 3.6 × 10⁷. Effective
dose coefficients for exposure to photons emitted by radionuclides deposited on the ground
surface used in our analysis are listed in Table A.5 of Appendix A.
3.4.2 Dose Coefficients for Internal Exposure
All dose coefficients for inhalation or ingestion of radionuclides used in dose
reconstructions for atomic veterans are 50-year committed doses, i.e., equivalent doses delivered
to specific organs or tissues over 50 years following a single intake. Those dose coefficients were
obtained from Publication 30 of the International Commission on Radiological Protection (ICRP
1979) or from reports by Killough et al. (1978) and Dunning et al. (1979), which used dosimetric
and biokinetic models similar to those in ICRP Publication 30.
In our analysis, we used organ-specific internal dose coefficients for all radionuclides listed
in Table 1 that were calculated using dosimetric and biokinetic models currently recommended
by the ICRP (1994a; 1996; and references therein) and were obtained from an available compact
disc (ICRP 2002). These dose coefficients are intended to supersede values calculated using
18
models in ICRP Publication 30 (ICRP 1979). Dose coefficients for adult workers in ICRP
Publication 68 (ICRP 1994a) and adult members of the public in ICRP Publication 72 (ICRP
1996) were used. Although dose coefficients for workers may be more appropriate for exposures
of atomic veterans, use of both sets of data ensures that potential effects of fractionation on
estimated inhalation and ingestion doses were fully considered. Because it was impractical to
perform calculations of internal dose to all organs and tissues, we selected a few organs that are
expected to be important in inhalation and ingestion exposures, as described below. We also
performed calculations using effective dose coefficients to provide a measure of the effects of
fractionation on a weighted average of doses to many organs and tissues.
Doses to atomic veterans from ingestion of radionuclides are expected to be small in nearly
all cases (NRC 2003). However, in the model of the respiratory tract used in dose reconstructions
(ICRP 1979), dose coefficients for inhalation of particles with an activity median aerodynamic
diameter (AMAD) of 20 μm, which are used in dose reconstructions when this choice results in a
higher estimate of dose to a tissue or organ of concern (NRC 2003), are essentially the same as
dose coefficients for ingestion, because about 95% of the inhaled material is assumed to be
transferred to the gastrointestinal (GI) tract by swallowing.4 Thus, we included doses from
ingestion of radionuclides, as well as inhalation, in our evaluation of potential effects of
fractionation on estimated doses.
For each intake pathway, we used dose coefficients for three organs or tissues: lung, red
marrow, and pancreas for inhalation; and colon, red marrow, and pancreas for ingestion. The
lung and the colon usually are the organs that receive the highest dose from inhalation of smaller
particles (AMAD 1 μm) and ingestion (or inhalation of large particles), respectively, when
radionuclides are largely insoluble, as is typically the case in local fallout.5 Red marrow was
included because of the presence of a significant number of bone-seeking radionuclides in fallout
and the association between exposure of red marrow and leukemia. The pancreas was included
as a surrogate for the prostate, which is a frequent cancer site in claims for compensation by
atomic veterans; both organs are assigned to the Remainder Tissues category by the ICRP for
4 In the ICRP’s current lung model (ICRP, 1994b), only about 25% of large particles inhaled is assumed to be transferred to the GI tract by swallowing. 5 In dose reconstructions for atomic veterans, all inhaled or ingested radionuclides are assumed to be in oxide form (Egbert et al. 1985); such forms are relatively insoluble for all elements of concern except Sr.
19
purposes of calculating effective doses and should have similar internal dose coefficients when
they are not major sites of deposition of radionuclides of potential importance in fallout.
Lung absorption types appropriate for radionuclides in oxide form, as given in Annex F of
ICRP (2002), were used to select inhalation dose coefficients, and GI-tract absorption fractions
(f1) appropriate for radionuclides in oxide form, as given in Annex E of ICRP (2002), were used
to guide the selection of ingestion dose coefficients. In the case of uranium, which has more than
two potential oxide forms, dose coefficients that apply to UO2 and U3O8 were selected.
Because internal dose coefficients for Pd-112 and Ag-113 were not included in ICRP
(2002), values used in our analysis were estimated on the basis of dose coefficients for other
radioisotopes of the same elements. In the case of Pd-112, which has a decay scheme different
from other radioisotopes of Pd (Firestone 1996; see also Section 3.4.1.2), we used dose
coefficients for Pd-100 because they are the highest of the values for any radioisotope of Pd
included in ICRP (2002) and, thus, should be a suitably conservative surrogate. Dose coefficients
for Ag-113 were estimated by dividing values for Ag-112 by a factor of two. This approximation
is reasonable when the half-lives of the two radioisotopes are similar (5.3 hours vs 3.13 hours;
Firestone 1996) but the maximum beta energy of Ag-112 is about twice that of Ag-113
(3.956 MeV vs 2.016 MeV; Firestone 1996).
Organ- or tissue-specific dose coefficients for inhalation and ingestion of radionuclides used
in our analysis are given in Table A.6 of Appendix A and effective dose coefficients are given in
Table A.5.
3.5 CALCULATIONS OF EXTERNAL AND INTERNAL DOSE
The first step in the bounding analysis was the calculation of doses per fission from external
and internal exposures to fission products and a limited set of uranium activation products in
fallout for each assumption about the extent of fractionation in fallout. These calculations were
performed for each of four cases:
• Exposure to 79 fission products at 2 days after detonation;
• Exposure to 79 fission products and levels of two uranium activation products derived
from data at Shot BRAVO at 2 days after detonation (see Section 3.2.2);
20
• Exposure to 79 fission products and elevated levels of two uranium activation products
(i.e., 3.3 times the levels used in the preceding case, or 1 atom/fission of Np-239 and
0.5 atoms/fission of U-237) at 2 days after detonation;
• Exposure to 27 fission products at 4 years after detonation.
As noted previously, radionuclide-independent factors, such as resuspension factors,
deposition rates of resuspended radionuclides on the skin, breathing rates, and duration of
exposure, are not needed in evaluating effects of fractionation or differences in fission mode on
doses and, thus, were omitted to simplify the calculations. Additional assumptions include the
following:
• All radionuclides in fallout are resuspended, and redeposited on the skin, to the same
extent. Depending on the stress that causes resuspension of fallout deposited on the
ground surface, this assumption may not be correct if near-field fallout enriched in
refractory radionuclides has a significantly larger particle-size distribution than fallout
enriched in volatile radionuclides. However, the expected effect would be to lower
internal doses from intakes of refractories and external doses from deposition of
refractories on the skin relative to doses from volatiles, and thus lessen the likelihood
that dose calculations assuming no fractionation would yield underestimates of doses.
• Differences in absorption of radionuclides from the lungs or GI tract into blood due to
volumetric occlusion of refractory radionuclides within fallout or soil particles compared
with absorption of volatile radionuclides that are attached to the surfaces of fallout
particles are not considered. Again, the expected effect would likely be to lower internal
doses from intakes of refractories relative to those from volatiles, and thus lessen the
effects of fractionation, as above.
As noted in Section 3.1, we placed each radionuclide into one of three categories─volatile,
refractory, or intermediate─using the approach of Hicks (1982). Our rationale was that this
approach would maximize the potential importance of fractionation effects and, thus, would be
consistent with the objective of a bounding analysis. That is, if many radionuclides characterized
as either purely volatile or purely refractory actually exhibited intermediate (both volatile and

21
refractory) behavior, as has been suggested by others (e.g., Prokofiev and Smirnov 2000), the
effects of fractionation would be reduced. Another justification for our approach is that current
data on fractionation of radionuclides do not permit a firm characterization of such intermediate
behavior. The assumed categorization of the volatile/refractory behavior of each radionuclide is
given in Table A.1 of Appendix A.
One difference between our approach and that of Hicks (1982) is that we apportioned the
activity (hence resulting doses) of radionuclides in the intermediate category (identified as V-R
in Table A.1) equally between the volatile and refractory fractions of radionuclides in fallout.
This assumption was used because fractionation data for debris from nuclear weapons tests given
by Crocker et al. (1965), Freiling (1961), and Freiling et al. (1965) suggest that radionuclides in
mass chains 91, 140, and 141 exhibit fully intermediate fractionation behavior. Although Hicks
(1982) apportioned more of the activity in mass chains 91 and 140 to the volatile category than
the refractory category, and did the reverse for mass chain 141, his supporting data were limited
and highly variable. Thus, we opted for a simpler approach in dealing with these mass chains.
Our approach also increases the total activity of radionuclides in the refractory category,
compared with the approach used by Hicks.
Dose calculations were performed using a simple, stepwise, multiplicative-chain model
represented by equations (1)–(4). First, for each radionuclide listed in Table 1, the fission or
activation yield of that radionuclide and its precursor radionuclides (if any) for a given fission
mode, the specific activity of that radionuclide and any precursors, and appropriate correction
factors for buildup and decay were multiplied to obtain the activity initially produced by a single
fission that was remaining at the time of interest (either 2 days or 4 years after detonation). The
activity of each radionuclide at the time of interest was then multiplied by the appropriate dose
coefficients for the target organs or tissues and exposure pathways of interest to obtain estimates
of dose per fission resulting from internal exposure or dose rate per fission resulting from
external exposure.6
For each combination of fission mode and exposure pathway, the next step was to calculate
total internal doses or external dose rates per fission at 2 days and 4 years for each of the three
fractionation categories, i.e., volatiles, refractories, and unfractionated mixtures (see Figure 1).
6 We describe these quantities as a dose or dose rate per fission, even though they are only proportional to dose or dose rate. Factors of proportionality are unimportant in comparing doses in different cases.
22
We apportioned 50% of the doses for each radionuclide in the intermediate (V-R) category to the
volatile and refractory categories, as discussed above. For example, in calculations at 2 days that
assume inhalation of fission products, but no activation products, from fission of U-235 by
fission neutrons, doses to the lung were calculated for (1) 26 refractory radionuclides and seven
intermediate radionuclides (with individual dose contributions halved as just described), (2) 46
volatile radionuclides and seven intermediate radionuclides (again with halved dose
contributions from each of the latter), and (3) all 79 fission products in the unfractionated
mixture. The products of these three steps give total doses per fission in the refractory, volatile,
and unfractionated categories at the post-detonation times of interest. These three steps were then
repeated for each combination of fission mode, yield of uranium activation products, post-
detonation (decay) time, target organ or tissue, and exposure pathway of interest.
We then calculated ratios of doses per fission for each exposure and fractionation category to
doses per fission for the corresponding exposure categories assuming a complete (i.e.,
unfractionated) set of radionuclides. We refer to these ratios unadjusted fractionation ratios.
Using the 2-day example described above to illustrate, the ratio of the dose from refractories to
the dose from the unfractionated mixture was calculated by dividing the dose to the lung per
fission resulting from inhalation of 26 refractory and seven intermediate fission products by the
dose to the lung per fission resulting from inhalation of all 79 fission products in the
unfractionated mixture. This step was repeated by dividing the dose to the lung per fission from
inhalation of 46 volatile and seven intermediate fission products by the dose to the lung per
fission resulting from inhalation of all 79 fission products in the unfractionated mixture.
These calculations are illustrated in the following equations using effective doses that were
calculated using equations (1) and (2) as examples:
23
FRj (r:u) = Σ Di,j (refractories)/Σ Di,j (unfractionated) (5)
where
FRj (r:u) = unadjusted fractionation ratio for refractory
radionuclides for fission mode j,
Σ Di,j (refractories) = sum of effective doses from intake via inhalation or
ingestion of all refractory radionuclides produced in
fission mode j (Sv/fission),
Σ Di,j (unfractionated) = sum of effective doses from intake via inhalation or
ingestion of all radionuclides (unfractionated mixture)
produced in fission mode j (Sv/fission).
FRj (v:u) = Σ Di,j (volatiles)/Σ Di,j (unfractionated) (6)
where
FRj (v:u) = unadjusted fractionation ratio for volatile radionuclides
for fission mode j,
Σ Di,j (volatiles) = sum of effective doses from intake via inhalation or
ingestion of all volatile radionuclides produced in
fission mode j (Sv/fission),
Σ Di,j (unfractionated) = sum of effective doses from intake via inhalation or
ingestion of all radionuclides (unfractionated mixture)
produced in fission mode j (Sv/fission). When uranium activation products are included, the numbers of radionuclides in the refractory
grouping and in the unfractionated mixture were increased by two (i.e., to 28 + 7 and 81,
respectively).
Paired sets of unadjusted fractionation ratios (ratios of doses per fission from refractories
only to doses per fission from unfractionated mixtures and ratios of doses per fission from
volatiles only to doses per fission from unfractionated mixtures) were calculated for each
combination of fission mode, yield of uranium activation products, post-detonation (decay) time,
target organ or tissue, and exposure pathway of interest (see Figure 1). All unadjusted
fractionation ratios so obtained are less than unity, because they incorporate an assumption that
24
all volatiles have been removed from unfractionated fallout without changing the amounts of
refractories that would remain, or vice versa.
Because of the way that concentrations of radionuclides in fallout are estimated in dose
reconstructions for atomic veterans, the unadjusted fractionation ratios calculated as described
above only partially account for the effects of fractionation on doses from internal or external
exposure. These ratios must be corrected for the potential effects of fractionation on the levels of
external exposure to photons in air above the ground surface.
The need for such a correction is illustrated by the unadjusted fractionation ratios for
effective dose rates from external exposure to radionuclides in fallout deposited on the ground
given in Table 2. As noted previously, those effective dose rates are a good surrogate for external
photon exposure rates in air above the ground surface. Two days after a detonation, results in
Table 2 indicate that refractory radionuclides contribute between 36.6 and 61.5% of the total
effective dose rate from an unfractionated mixture, depending on the assumed fission mode and
assumptions about yields per fission of uranium activation products. The physical basis for this
result is that the average effective dose rate per radionuclide at 2 days is roughly the same for
volatiles and refractories in mixtures of fission products that are present at that time but there are
about 60% more volatile fission products than refractories.
In dose reconstructions for atomic veterans, the concentrations of radionuclides in fallout
deposited on the ground are estimated on the basis of measured photon exposure rates in air
above ground at times within a few days of detonation combined with (1) calculations of the
exposure rate in air per unit activity concentration of each radionuclide on the ground surface
and (2) estimates of relative activities of radionuclides present in an unfractionated mixture of
weapons debris, which are obtained as described in Section 2 (NRC 2003). Thus, if an effective
external dose rate at 2 days were due only to refractory radionuclides, calculations based on an
assumption of an unfractionated mixture would underestimate the concentrations of refractory
radionuclides in deposited fallout by an amount equal to the reciprocal of the fractionation ratio
derived from effective external dose rates from ground-surface exposure.
We refer to the reciprocal of the fractionation ratio for external effective dose rates from
exposure to fallout deposited on the ground as an activity-concentration adjustment factor
(ACAF). Values of this factor also are given in Table 2. For example, relative activities of
refractories in fallout must be increased by a factor between 1.6 and 2.7 to reproduce the same
25
external dose rate that results from unfractionated mixtures. Thus, to properly represent the
effects of complete fractionation in other dose or dose-rate calculations, including those
assuming a 4-year decay period, unadjusted fractionation ratios described above must be
increased by the appropriate activity-concentration adjustment factor that describes reductions in
external effective dose rates when all volatiles or refractories are removed from unfractionated
mixtures on the ground surface. We characterize the corrected sets of fractionation ratios that
apply to internal doses or external dose rates to skin as adjusted fractionation ratios (AFRs).
The corrections described above are illustrated for refractories in the following equation,
which uses unadjusted fractionation ratios for effective doses per fission resulting from
inhalation or ingestion as calculated in equation (5):
AFRj (r:u) = FRj (r:u) × ACAFj (r:u) (7)
where
AFRj (r:u) = adjusted fractionation ratio for refractory radionuclides for effective
doses resulting from inhalation or ingestion of radionuclides produced
in fission mode j,
FRj (r:u) = unadjusted fractionation ratio for refractory radionuclides for effective
doses resulting from inhalation or ingestion of radionuclides produced
in fission mode j [see equation (5)],
ACAFj (r:u) = activity-concentration adjustment factor for refractory radionuclides
for fission mode j – i.e., reciprocal of fractionation ratio for refractory
radionuclides that applies to effective dose rate from external
exposure to radionuclides deposited on ground surface (see Table 2).
Our calculations do not include contributions to doses from unfissioned plutonium in
weapons debris, for which all data currently are classified. Plutonium is a potentially important
radionuclide in regard to estimating inhalation doses to atomic veterans (NRC 2003). Given that
plutonium is one of the most refractory radionuclides in weapons debris (Crocker et al. 1965;
Freiling 1961; Freiling et al. 1965), effects of fractionation on doses from plutonium can be
bounded by the activity-concentration adjustment factors in Table 2, provided that levels of
plutonium in unfractionated weapons debris, as estimated from cloud-sampling data, have been
26
accurately characterized in carrying out dose reconstructions for atomic veterans. That is,
increases in levels of plutonium in fractionated fallout compared with unfractionated weapons
debris would not exceed the factor by which concentrations of refractory fission and activation
products would need to be increased to give a measured external exposure rate in air that applies
to an unfractionated mixture of radionuclides on the ground.
We think that doses or dose rates corrected by activity-concentration adjustment factors
(ACAFs), as we have defined them, provide a reasonable representation of the maximal effects
of fractionation on doses or dose rates in dose reconstructions for atomic veterans. We reiterate
that the fractionation effects of greatest interest to exposures of atomic veterans are those that
involve enhancements in abundances of refractory radionuclides relative to volatiles in fallout,
i.e., adjusted ratios of doses per fission from refractory radionuclides to doses per fission for the
unfractionated mixtures, because participants at the NTS and the Pacific Proving Grounds
usually were exposed at locations where fallout was dominated by larger particles that should
have contained a higher proportion of refractory radionuclides than unfractionated fallout. An
assumption of no fractionation in fallout should result in overestimates of the concentrations of
volatile radionuclides deposited on the ground but underestimates of the concentrations of
refractory radionuclides. Our calculations that assume complete separation of refractories from
volatiles should similarly result in an overestimate of the effects of fractionation, but that was the
purpose of our bounding analysis.
27
4. RESULTS AND DISCUSSION
Results of the calculations described in Section 3.5 are given in Tables 3–12. Adjusted
fractionation ratios (AFRs) resulting from calculations of external dose rate to skin and internal
dose per fission for the six combinations of radionuclide inventories and decay periods and four
fission modes are given in Tables 3–8. Although AFRs for volatile radionuclides are included in
Tables 3–8 for completeness, these ratios are not considered germane to an evaluation of effects
of fractionation in local fallout to which atomic veterans were primarily exposed. Calculated
external dose rates per fission, including the effective dose rate from exposure to fallout on the
ground surface, and internal doses per fission for unfractionated mixtures of radionuclides in the
same scenarios are given in Tables 9–12. The latter data are useful in examining potential effects
of differences in fission mode or yield of activation products on doses to atomic veterans in the
absence of fractionation.
Both sets of tables are organized in the same manner. Results for external exposure are
presented first, followed by results for effective doses from inhalation or ingestion, and finally by
results for doses to individual target organs or tissues from inhalation or ingestion.
4.1 Adjusted Fractionation Ratios for Refractory Radionuclides
AFRs obtained by assuming that only refractory radionuclides are present in fallout
[AFR (r:u)] in Tables 3–8 are all less than 2. These results thus suggest that even under extreme
assumptions about the extent of fractionation, dose estimates that are obtained by assuming an
unfractionated mixture of radionuclides would underestimate the dose to any target organ or
tissue from external or internal exposure by less than a factor of two, regardless of fission mode
or abundance of activation products, for the two post-detonation decay times we assumed. The
average photon energy does not change much from one fission mode to another, and the largest
differences in the number of photons per fission among the different fission modes considered
occur at ~4–5 days and at 3–5 years (Björnerstedt 1959). The beta/photon intensity ratio peaks at
the later times for thermal fission of U-235. If this is also the case for the other fission modes, the
range of potential fractionation ratios for fission products at other times may be well
characterized by the values at 2 days and 4 years presented in Tables 3–8.
28
The largest AFR (r:u) of 1.9 was obtained in calculations of dose to the lung at 4 years from
inhalation of fission products produced by fission of U-235 by fission neutrons, but with no
uranium activation products present (Table 6). That AFR (r:u) is significantly higher than the
corresponding values for the other three fission modes because the fission yields for two key
longer-lived volatile radionuclides (Ru-106, Sb-125) are significantly lower in the U-235 fission
mode, thus reducing the relative contribution to dose from the volatile components of an
unfractionated mixture. For all four fission modes, slightly lower AFRs (r:u) of about 1.4–1.7
were obtained in calculations of doses to the lung from inhalation and doses to the colon from
ingestion at 2 days, with or without uranium activation products (Table 6). All AFRs (r:u) for
doses to the skin at 2 days, with or without uranium activation products, were somewhat lower
(1.1–1.7) (Table 3). In all cases, the influence of fission mode on the AFRs (r:u) at 2 days was
reduced when uranium activation products were included, because the presence of refractory
activation products reduces differences among the doses and dose rates for fractionated and
unfractionated materials upon which the AFRs (r:u) are based.
It is also noteworthy that when levels of uranium activation products are increased from the
nominal values to 3.3 times those values, the difference between an AFR (r:u) for internal doses
and external dose rates to skin and the value 1 typically is reduced. This is as expected because
with a sufficiently high content of refractory activation products, the fractional contribution of
refractories to the total external dose rate from exposure to photons emitted by unfractionated
fallout on the ground surface at 2 days is increased, up to a maximum value of 1. As a result, for
external exposure to fallout on the ground, both the activity-concentration adjustment factor
(ACAF) defined in Section 3.5 (see also Table 2) and AFR (r:u) approach a value of 1 in the
limit, albeit at different rates.7
Although the higher level of uranium activation products we assumed in our analysis is
strictly applicable only to fallout from detonations of thermonuclear weapons tested in the
Pacific, we think it also serves to bound the potential effects that would be obtained by including
7 This intuitive result appears to be contradicted by results for committed effective doses from inhalation at 2 days for all fission modes given in Table 4 and committed doses to red marrow from ingestion at 2 days for fission of U-235 by a spectrum of fission neutrons or 14-MeV neutrons given in Table 7, which show increasing departures of AFR (r:u) from the value 1 as assumed amounts of uranium activation products are increased from the nominal levels to 3.3 times those levels. In all such cases, however, AFR (r:u) approaches the value 1, as expected, as assumed amounts of uranium activation products are increased still further.
29
a full suite of short-lived neutron activation products that would occur in weapons debris from
detonations at the NTS. Data given by Hicks (1981; 1982) indicate that there are potentially
more than twice as many refractory activation products as there are volatile activation products
produced by nuclear detonations at the NTS, and that activities of most shorter-lived activation
products we did not consider are expected to be lower, typically by several orders of magnitude,
than activities of Np-239 and most fission products at 2 days after detonation. Thus, we do not
expect that including additional activation products would have a significant effect on our
fractionation calculations.
As an additional test of the potential importance of including additional activation products
in our calculations, we added what should be conservatively large amounts of soil activation
products Co-60 and Eu isotopes with decay-corrected activities relative to the activity of Cs-137
of 15 for Eu-155, 9 for Co-60, 3 for Eu-154, and 3 for Eu-152, as derived from soil survey data
at the NTS (McArthur and Mead 1987), to the refractory radionuclides in a mixture of fission
products at 4 years. In this extremely unlikely case, all values of AFR (r:u) were <1 and all
values that were <1 without soil activation products increased when soil activation products were
included. Although these calculations could be revisited with more realistic relative activities of
fission and activation products, these results, along with those for cases where uranium
activation products were included in calculations at 2 days, appear to reinforce the idea that the
potential effects of activation scenarios on fractionation at times >2 days probably have been
bounded by our calculations.
In many calculations of internal doses from ingestion or inhalation at 4 years after
detonation, the results indicate that doses to some organs and tissues that would be obtained by
assuming an unfractionated mixture of radionuclides could overestimate actual doses by more
than two orders of magnitude if significant fractionation (i.e., enhancement of refractories)
occurred. For example, values of AFR (r:u) for red marrow and pancreas at 4 years in Tables 7
and 8 are about 0.1 or less. In these cases, the principal contributors to internal dose from
exposure to unfractionated fallout are the volatile radionuclides Sr-90, Ru-106, and Cs-137. It
also is important to bear in mind, however, that internal doses from exposure to fission products
at 4 years usually should be low and often would be insignificant compared with internal doses
from exposure to plutonium (NRC 2003).
30
4.2 Doses from Unfractionated Mixtures of Fission and Uranium Activation Products
In this section, we examine the potential effects of differences in fission mode or yield of
activation products on doses to atomic veterans in the absence of fractionation. Comparisons of
doses per fission for unfractionated mixtures given in Tables 9-12 indicate that the largest
differences produced by variations in radionuclide content among the four fission modes are of
the same order of magnitude as the differences in the adjusted fractionation ratios [AFRs (r:u)] in
Tables 3-8 for a given decay time (i.e., about a factor of 2). However, in most cases, the effects
of differences in fission mode on doses per fission typically are much less than the effects on
AFRs (r:u) (i.e., <20%). The largest effects of differences in fission mode on doses are seen at
4 years (Tables 9-12). The effective dose from inhalation of fission products produced by fission
of Pu-239 is 1.5 times that for U-235 fission at 4 years, while nearly the reverse is true for
ingestion, where the effective dose from U-235 fission products is 1.2 times that from Pu-239
fission (Table 10). These comparisons hold regardless of whether calculations are based on dose
coefficients for the public or workers, and the relatively small differences observed between the
two sets of calculations indicate that distinctions between workers and members of the public are
not needed. Dose coefficients for workers probably are more appropriate for exposures at the
NTS, but this may not be the case in the Pacific, where many participants were exposed during
off-duty activities.
A larger difference (1.8 times) is observed when comparing the effective dose from external
exposure at 4 years from U-238 fission by high-energy neutrons with that from U-235 fission by
fission neutrons (Table 9). The former is expected to be the dominant fission mode in
thermonuclear weapons tested in the Pacific (Freiling et al. 1965), whereas fission of U-235 (and
Pu-239) by fission neutrons should be the dominant contributors to yields of nuclear weapons
tested at the NTS. Fission of U-238 by high-energy neutrons should not have occurred in
weapons tested at the NTS, although a small contribution from fission of U-238 by fission
neutrons would be expected. Thus, the observed difference of a factor of 1.8 noted above may
not be particularly meaningful because contributions from those two fission modes should
dominate spectra of fission products produced in weapons tests under radically different
conditions. That is, uncertainties in doses resulting from uncertainties in activities contributed by
one fission mode should not contribute to uncertainties in doses produced by tests in which the
31
other mode was dominant. This is unlike the situation with some tests of fission weapons at the
NTS, in which contributions to activities of fission products from several fission modes (such as
U-235 and Pu-239 fission—and potentially U-238 fission—by fission neutrons) was possible.
More meaningful differences in doses per fission due to differences in activities of fission
products generated in different fission modes are found in calculated doses to individual organs
or tissues from inhalation or ingestion of fission products alone at 4 years after detonation. As
indicated in Table 11, for example, the dose to the lung from inhalation of unfractionated fission
products produced by fission of Pu-239 is 1.9 times that for U-235 fission, while the dose to the
colon from ingestion of Pu-239 fission products is 1.3 times that from U-235 fission. This pattern
is somewhat different from what was seen in the comparisons of effective doses from inhalation
or ingestion of fission products produced by these two fission modes, where the effective dose to
the lung from Pu-239 fission was 1.5 times that for U-235 fission and the dose to the colon from
U-235 fission was 1.2 times larger than that from Pu-239 fission. The higher dose contributions
to lung and colon from inhaled or ingested Pu-239 fission products are linked to the higher
fission yield of Ru-106 in this mode. The yield of Ru-106 in Pu-239 fission is more than eight
times the yield in U-235 fission by fission neutrons, and Ru-106 contributes about 70% of the
total dose to the lung from inhalation and about 50% of the total dose to the colon from ingestion
of unfractionated mixtures of Pu-239 fission products in our scenarios.
In another case for which doses per fission are given in Table 12, doses to red marrow at
4 years from inhalation or ingestion of radionuclides in unfractionated mixtures of fission
products produced by fission of U-235 by fission neutrons are 2.3–2.4 times greater than those
produced by fission of Pu-239. This difference is due primarily to the higher yield of Sr-90 in
U-235 fission (2.7 times greater than the yield in Pu-239 fission). Although yields of Cs-137,
Ce-144, and Pm-147 also are higher in U-235 fission, these increases serve primarily to offset
the contributions to dose from Ru-106, Sb-125, and Eu-155, which have higher yields in Pu-239
fission.
32
5. SUMMARY AND CONCLUSIONS
Our bounding analysis of potential effects of fractionation of radionuclides in fallout on
reconstructed doses to atomic veterans indicates that, if unfissioned plutonium is excluded,
neglect of fractionation could result in underestimates of dose, but that the extent of
underestimation probably is less than a factor of two even under the most extreme (and highly
unlikely) assumption that fallout contains only refractory fission and activation products. In
many cases, however, the current approach of neglecting fractionation in dose reconstructions for
atomic veterans probably results in overestimates of doses from exposure to fission and
activation products if significant fractionation (i.e., enhancement of refractory radionuclides
relative to volatiles) occurred.
The conclusions summarized above do not take into account potential effects of
contributions from unfissioned plutonium in weapons debris, for which all data are classified
and, thus, have not been included in our calculations. However, the effects of fractionation on
doses from plutonium should be bounded by the activity-concentration adjustment factors
derived from an analysis of effects of fractionation on effective dose rates from exposure to
radionuclides on the ground given in Table 2, provided that levels of plutonium in unfractionated
weapons debris have been accurately characterized on the basis of cloud-sampling data in
carrying out dose reconstructions for atomic veterans. Under that condition, doses from
plutonium would be underestimated by less than a factor of three in calculations that assume no
fractionation even if fallout contained refractory radionuclides only.
There are at least two reasons why our bounding analysis has likely captured the potential
effects of fractionation on doses to atomic veterans from exposure to fission and activation
products. An obvious reason is that complete separation of refractories from volatiles in fallout
has never been reported. The other is that many radionuclides, including Sr-90 and Np-239, that
figure prominently in the results described in the preceding section do not exhibit the “black or
white” volatility behavior that we and Hicks (1982) have attributed to them (e.g., see Crocker et
al. 1965; Freiling et al. 1965; Prokofiev and Smirnov 2000). Rather, these radionuclides, along
with others that we have classified as either volatile (e.g., Ru-103) or refractory (e.g., Te-132),
have been shown to exhibit intermediate fractionation behavior. Factoring in such behavior
33
would effectively blur the distinctions between the volatile and refractory categories and reduce
differences in doses between them.
We were only able to find published data on fractionation behavior for less than 20% of the
79 radionuclides we included in our calculations. Thus, more exact quantitative comparisons of
doses from exposures to fractionated and unfractionated fallout probably are impractical and
bounding calculations or related mathematical exercises akin to those we performed are the most
reasonable approach. Although modeling of fractionation behavior in mass chains produced in
nuclear detonations and neutron activation of weapons and soil components based on first
principles could be attempted, i.e., by using available information on decay modes, neutron
fluxes and capture cross sections of precursors of activation products, volatilities of precursor
nuclides, thermal-temporal characteristics of fireballs, and the nature of environmental or other
materials incorporated into the fireballs or exposed to neutron fluxes, it seems doubtful that such
an approach would be useful, given the large number of variables in such calculations, the
limited shot-specific data from nuclear weapons testing available to assess the accuracy of model
predictions, and indications from these limited data that there is a large, sometimes
unpredictable, test-to-test variability in fallout characteristics. Results from our analysis, which
indicate that doses to atomic veterans could be underestimated by less than a factor of two in the
worst cases, also argue against the usefulness of a more rigorous analysis of effects of
fractionation.
Our analysis clearly indicates that the potential degree of underestimation of external and
internal doses to atomic veterans that results from neglect of fractionation in all dose
reconstructions is not large – i.e., less than a factor of two for external and internal exposure to
fission and activation products and less than a factor of three for internal exposure to plutonium.
Therefore, given the conservative assumptions that often are incorporated in dose reconstructions
(NRC, 2003), potential underestimations of dose probably are less than values of simple
adjustment factors specified in the 2003 Interim Guidance (Benavides 2003) that are applied to
estimates of dose from specific pathways to obtain upper bounds (i.e., at least upper 95%
credibility limits). That is, it is unlikely that additional adjustments to account for effects of
fractionation would be needed to obtain credible upper bounds of dose to atomic veterans.
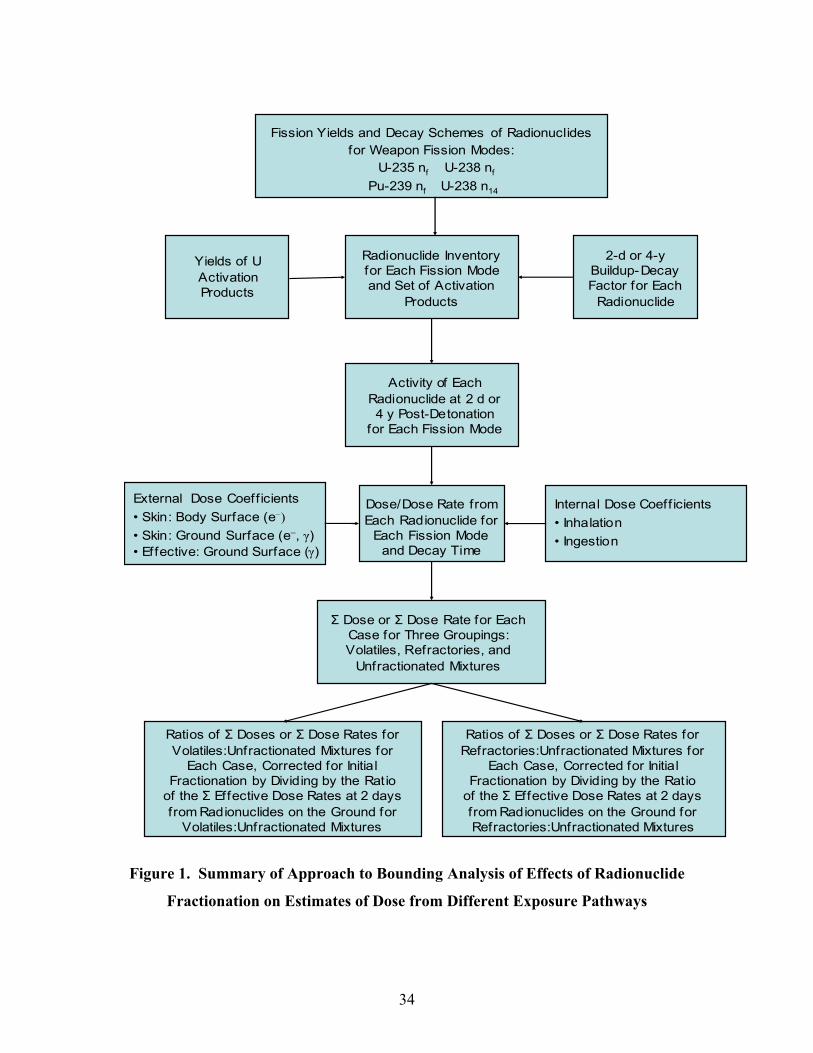
34
Fission Yields and Decay Schemes of Radionuclidesfor Weapon Fission Modes:
U-235 nf U-238 nf
Pu-239 nf U-238 n14
Radionuclide Inventory for Each Fission Mode and Set of Activation
Products
2-d or 4-y Buildup-Decay Factor for Each
Radionuclide
Activity of Each Radionuclide at 2 d or 4 y Post-Detonation
for Each Fission Mode
Dose/Dose Rate from Each Radionuclide for
Each Fission Mode and Decay Time
Internal Dose Coeff icients• Inhalation • Ingestion
External Dose Coefficients• Skin: Body Surface (e–)• Skin: Ground Surface (e–, γ)• Effective: Ground Surface (γ)
Σ Dose or Σ Dose Rate for Each Case for Three Groupings: Volatiles, Refractories, and
Unfractionated Mixtures
Ratios of Σ Doses or Σ Dose Rates for Volatiles:Unfractionated Mixtures for
Each Case, Corrected for Initial Fractionation by Dividing by the Ratio
of the Σ Effective Dose Rates at 2 days from Radionuclides on the Ground for
Volatiles:Unfractionated Mixtures
Ratios of Σ Doses or Σ Dose Rates for Refractories:Unfractionated Mixtures for
Each Case, Corrected for Initial Fractionation by Dividing by the Ratio
of the Σ Effective Dose Rates at 2 days from Radionuclides on the Ground for Refractories:Unfractionated Mixtures
Yields of U Activation Products
Figure 1. Summary of Approach to Bounding Analysis of Effects of Radionuclide
Fractionation on Estimates of Dose from Different Exposure Pathways
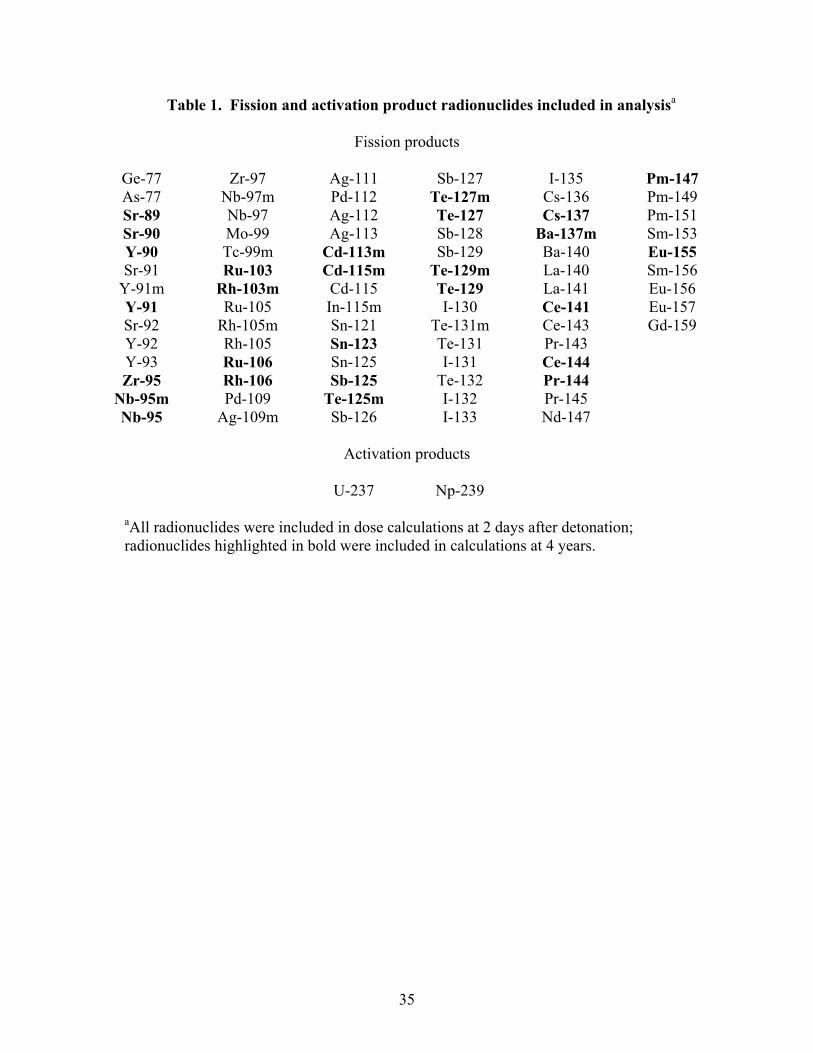
35
Table 1. Fission and activation product radionuclides included in analysisa
Fission products
Ge-77 Zr-97 Ag-111 Sb-127 I-135 Pm-147 As-77 Nb-97m Pd-112 Te-127m Cs-136 Pm-149 Sr-89 Nb-97 Ag-112 Te-127 Cs-137 Pm-151 Sr-90 Mo-99 Ag-113 Sb-128 Ba-137m Sm-153 Y-90 Tc-99m Cd-113m Sb-129 Ba-140 Eu-155 Sr-91 Ru-103 Cd-115m Te-129m La-140 Sm-156
Y-91m Rh-103m Cd-115 Te-129 La-141 Eu-156 Y-91 Ru-105 In-115m I-130 Ce-141 Eu-157 Sr-92 Rh-105m Sn-121 Te-131m Ce-143 Gd-159 Y-92 Rh-105 Sn-123 Te-131 Pr-143 Y-93 Ru-106 Sn-125 I-131 Ce-144 Zr-95 Rh-106 Sb-125 Te-132 Pr-144
Nb-95m Pd-109 Te-125m I-132 Pr-145 Nb-95 Ag-109m Sb-126 I-133 Nd-147
Activation products
U-237 Np-239
aAll radionuclides were included in dose calculations at 2 days after detonation; radionuclides highlighted in bold were included in calculations at 4 years.
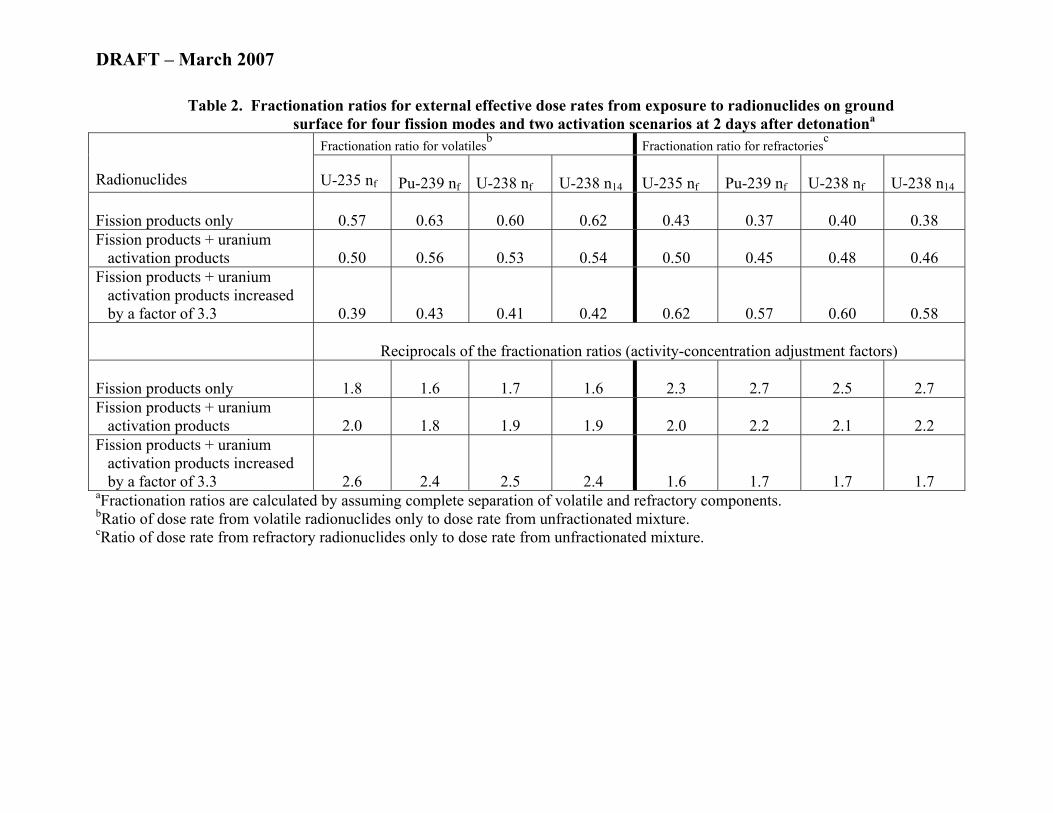
DRAFT – March 2007
Table 2. Fractionation ratios for external effective dose rates from exposure to radionuclides on ground surface for four fission modes and two activation scenarios at 2 days after detonationa
Fractionation ratio for volatilesb Fractionation ratio for refractoriesc Radionuclides
U-235 nf
Pu-239 nf
U-238 nf
U-238 n14
U-235 nf
Pu-239 nf
U-238 nf
U-238 n14
Fission products only
0.57
0.63
0.60
0.62
0.43
0.37
0.40
0.38
Fission products + uranium activation products
0.50
0.56
0.53
0.54
0.50
0.45
0.48
0.46
Fission products + uranium activation products increased by a factor of 3.3
0.39
0.43
0.41
0.42
0.62
0.57
0.60
0.58
Reciprocals of the fractionation ratios (activity-concentration adjustment factors) Fission products only
1.8
1.6
1.7
1.6
2.3
2.7
2.5
2.7
Fission products + uranium activation products
2.0
1.8
1.9
1.9
2.0
2.2
2.1
2.2
Fission products + uranium activation products increased by a factor of 3.3
2.6
2.4
2.5
2.4
1.6
1.7
1.7
1.7 aFractionation ratios are calculated by assuming complete separation of volatile and refractory components. bRatio of dose rate from volatile radionuclides only to dose rate from unfractionated mixture. cRatio of dose rate from refractory radionuclides only to dose rate from unfractionated mixture.
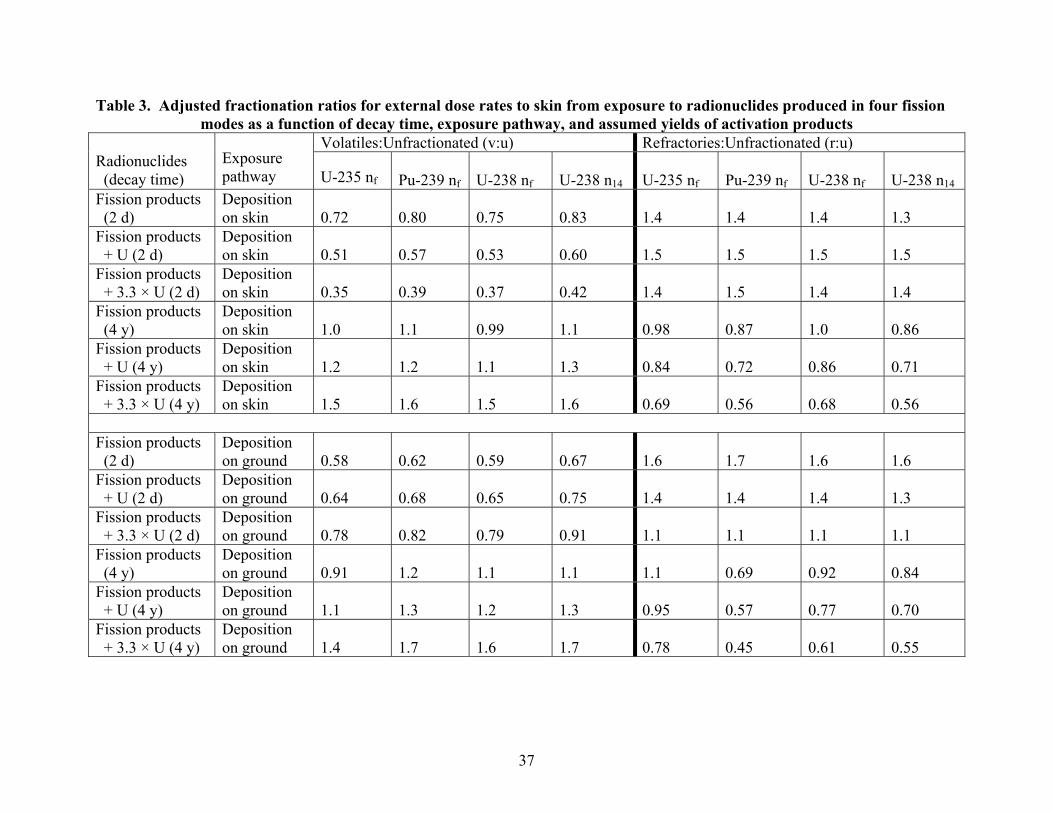
37
Table 3. Adjusted fractionation ratios for external dose rates to skin from exposure to radionuclides produced in four fission modes as a function of decay time, exposure pathway, and assumed yields of activation products
Volatiles:Unfractionated (v:u) Refractories:Unfractionated (r:u) Radionuclides (decay time)
Exposure pathway
U-235 nf
Pu-239 nf
U-238 nf
U-238 n14
U-235 nf
Pu-239 nf
U-238 nf
U-238 n14
Fission products (2 d)
Deposition on skin
0.72
0.80
0.75
0.83
1.4
1.4
1.4
1.3
Fission products + U (2 d)
Deposition on skin
0.51
0.57
0.53
0.60
1.5
1.5
1.5
1.5
Fission products + 3.3 × U (2 d)
Deposition on skin
0.35
0.39
0.37
0.42
1.4
1.5
1.4
1.4
Fission products (4 y)
Deposition on skin
1.0
1.1
0.99
1.1
0.98
0.87
1.0
0.86
Fission products + U (4 y)
Deposition on skin
1.2
1.2
1.1
1.3
0.84
0.72
0.86
0.71
Fission products + 3.3 × U (4 y)
Deposition on skin
1.5
1.6
1.5
1.6
0.69
0.56
0.68
0.56
Fission products (2 d)
Deposition on ground
0.58
0.62
0.59
0.67
1.6
1.7
1.6
1.6
Fission products + U (2 d)
Deposition on ground
0.64
0.68
0.65
0.75
1.4
1.4
1.4
1.3
Fission products + 3.3 × U (2 d)
Deposition on ground
0.78
0.82
0.79
0.91
1.1
1.1
1.1
1.1
Fission products (4 y)
Deposition on ground
0.91
1.2
1.1
1.1
1.1
0.69
0.92
0.84
Fission products + U (4 y)
Deposition on ground
1.1
1.3
1.2
1.3
0.95
0.57
0.77
0.70
Fission products + 3.3 × U (4 y)
Deposition on ground
1.4
1.7
1.6
1.7
0.78
0.45
0.61
0.55
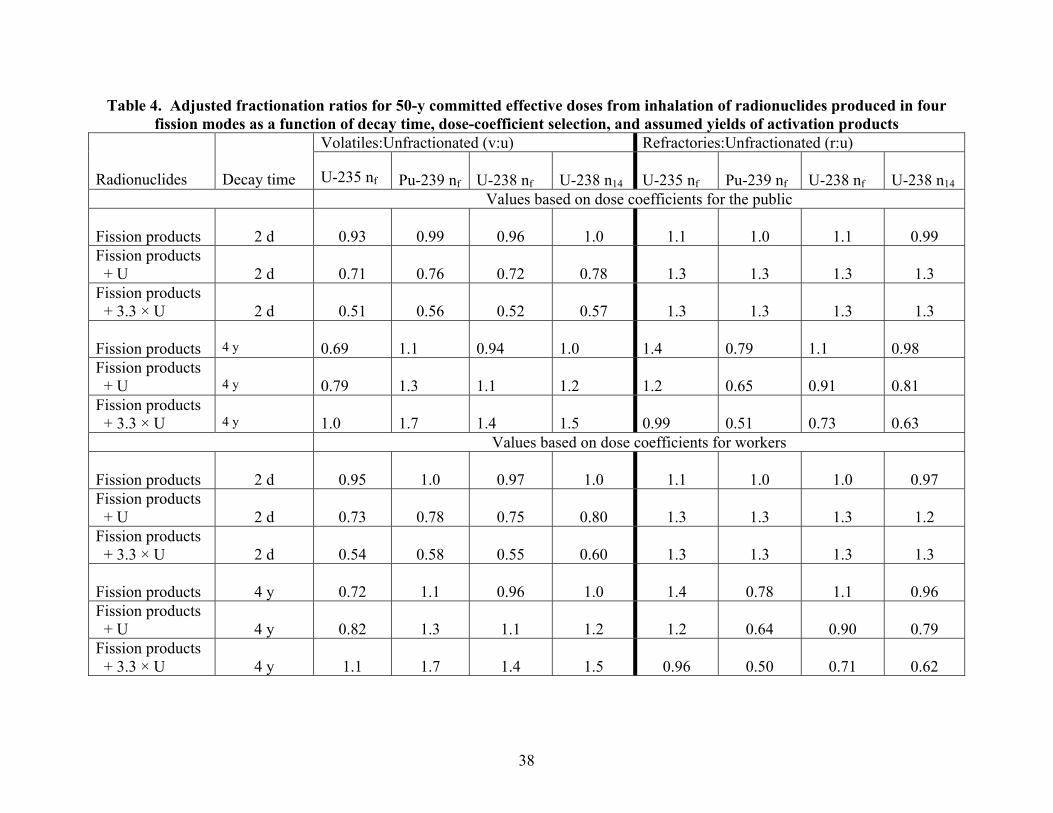
38
Table 4. Adjusted fractionation ratios for 50-y committed effective doses from inhalation of radionuclides produced in four fission modes as a function of decay time, dose-coefficient selection, and assumed yields of activation products
Volatiles:Unfractionated (v:u) Refractories:Unfractionated (r:u) Radionuclides
Decay time
U-235 nf
Pu-239 nf
U-238 nf
U-238 n14
U-235 nf
Pu-239 nf
U-238 nf
U-238 n14
Values based on dose coefficients for the public Fission products
2 d
0.93
0.99
0.96
1.0
1.1
1.0
1.1
0.99
Fission products + U
2 d
0.71
0.76
0.72
0.78
1.3
1.3
1.3
1.3
Fission products + 3.3 × U
2 d
0.51
0.56
0.52
0.57
1.3
1.3
1.3
1.3
Fission products
4 y
0.69
1.1
0.94
1.0
1.4
0.79
1.1
0.98
Fission products + U
4 y
0.79
1.3
1.1
1.2
1.2
0.65
0.91
0.81
Fission products + 3.3 × U
4 y
1.0
1.7
1.4
1.5
0.99
0.51
0.73
0.63
Values based on dose coefficients for workers Fission products
2 d
0.95
1.0
0.97
1.0
1.1
1.0
1.0
0.97
Fission products + U
2 d
0.73
0.78
0.75
0.80
1.3
1.3
1.3
1.2
Fission products + 3.3 × U
2 d
0.54
0.58
0.55
0.60
1.3
1.3
1.3
1.3
Fission products
4 y
0.72
1.1
0.96
1.0
1.4
0.78
1.1
0.96
Fission products + U
4 y
0.82
1.3
1.1
1.2
1.2
0.64
0.90
0.79
Fission products + 3.3 × U
4 y
1.1
1.7
1.4
1.5
0.96
0.50
0.71
0.62
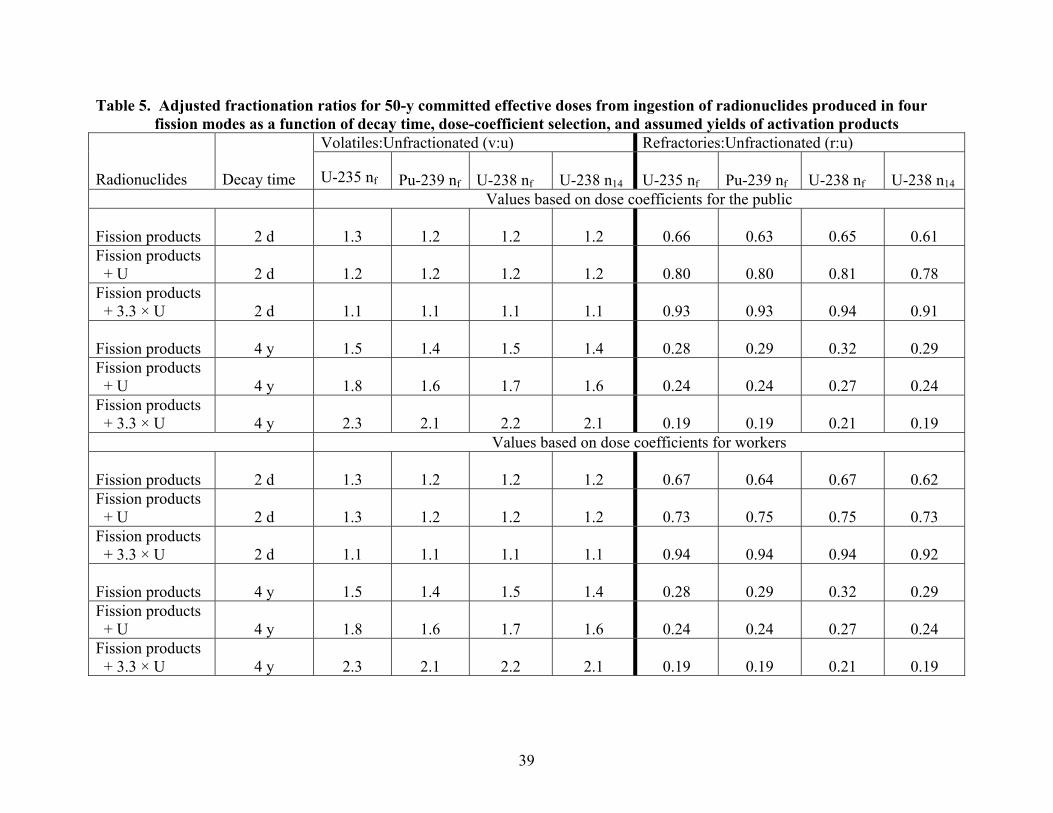
39
Table 5. Adjusted fractionation ratios for 50-y committed effective doses from ingestion of radionuclides produced in four fission modes as a function of decay time, dose-coefficient selection, and assumed yields of activation products
Volatiles:Unfractionated (v:u) Refractories:Unfractionated (r:u) Radionuclides
Decay time
U-235 nf
Pu-239 nf
U-238 nf
U-238 n14
U-235 nf
Pu-239 nf
U-238 nf
U-238 n14
Values based on dose coefficients for the public Fission products
2 d
1.3
1.2
1.2
1.2
0.66
0.63
0.65
0.61
Fission products + U
2 d
1.2
1.2
1.2
1.2
0.80
0.80
0.81
0.78
Fission products + 3.3 × U
2 d
1.1
1.1
1.1
1.1
0.93
0.93
0.94
0.91
Fission products
4 y
1.5
1.4
1.5
1.4
0.28
0.29
0.32
0.29
Fission products + U
4 y
1.8
1.6
1.7
1.6
0.24
0.24
0.27
0.24
Fission products + 3.3 × U
4 y
2.3
2.1
2.2
2.1
0.19
0.19
0.21
0.19
Values based on dose coefficients for workers Fission products
2 d
1.3
1.2
1.2
1.2
0.67
0.64
0.67
0.62
Fission products + U
2 d
1.3
1.2
1.2
1.2
0.73
0.75
0.75
0.73
Fission products + 3.3 × U
2 d
1.1
1.1
1.1
1.1
0.94
0.94
0.94
0.92
Fission products
4 y
1.5
1.4
1.5
1.4
0.28
0.29
0.32
0.29
Fission products + U
4 y
1.8
1.6
1.7
1.6
0.24
0.24
0.27
0.24
Fission products + 3.3 × U
4 y
2.3
2.1
2.2
2.1
0.19
0.19
0.21
0.19
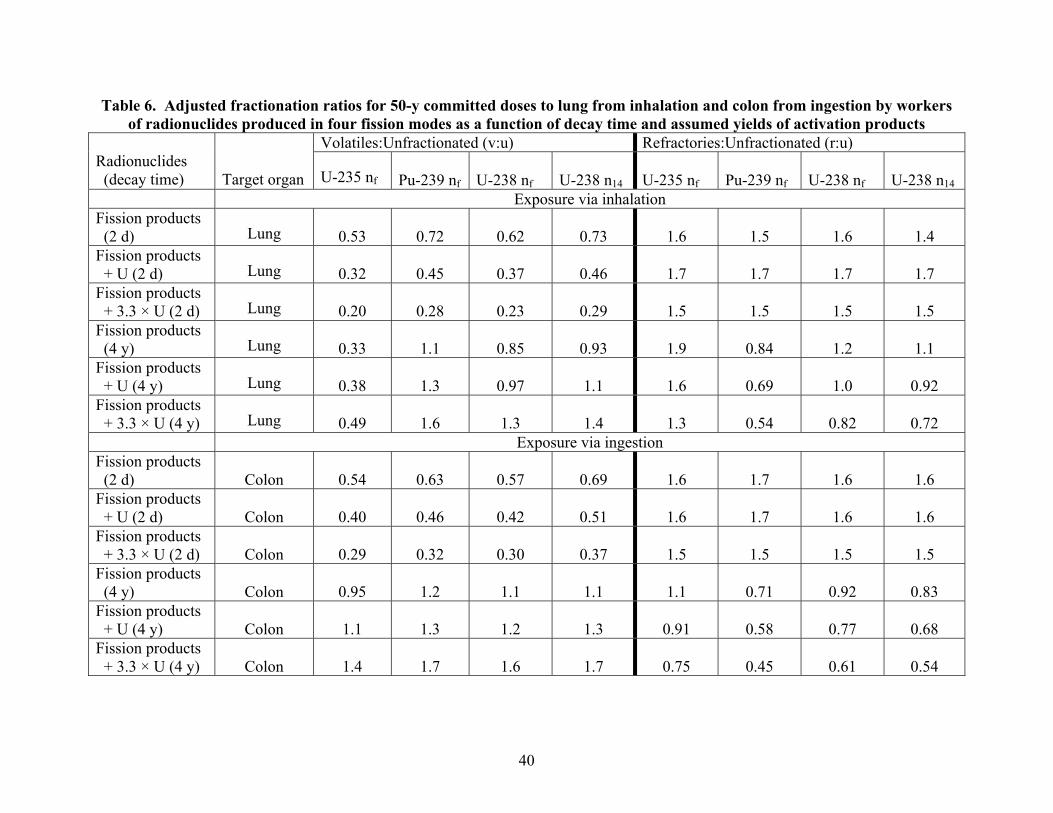
40
Table 6. Adjusted fractionation ratios for 50-y committed doses to lung from inhalation and colon from ingestion by workers of radionuclides produced in four fission modes as a function of decay time and assumed yields of activation products
Volatiles:Unfractionated (v:u) Refractories:Unfractionated (r:u) Radionuclides (decay time)
Target organ
U-235 nf
Pu-239 nf
U-238 nf
U-238 n14
U-235 nf
Pu-239 nf
U-238 nf
U-238 n14
Exposure via inhalation Fission products (2 d)
Lung
0.53
0.72
0.62
0.73
1.6
1.5
1.6
1.4
Fission products + U (2 d)
Lung
0.32
0.45
0.37
0.46
1.7
1.7
1.7
1.7
Fission products + 3.3 × U (2 d)
Lung
0.20
0.28
0.23
0.29
1.5
1.5
1.5
1.5
Fission products (4 y)
Lung
0.33
1.1
0.85
0.93
1.9
0.84
1.2
1.1
Fission products + U (4 y)
Lung
0.38
1.3
0.97
1.1
1.6
0.69
1.0
0.92
Fission products + 3.3 × U (4 y)
Lung
0.49
1.6
1.3
1.4
1.3
0.54
0.82
0.72
Exposure via ingestion Fission products (2 d)
Colon
0.54
0.63
0.57
0.69
1.6
1.7
1.6
1.6
Fission products + U (2 d)
Colon
0.40
0.46
0.42
0.51
1.6
1.7
1.6
1.6
Fission products + 3.3 × U (2 d)
Colon
0.29
0.32
0.30
0.37
1.5
1.5
1.5
1.5
Fission products (4 y)
Colon
0.95
1.2
1.1
1.1
1.1
0.71
0.92
0.83
Fission products + U (4 y)
Colon
1.1
1.3
1.2
1.3
0.91
0.58
0.77
0.68
Fission products + 3.3 × U (4 y)
Colon
1.4
1.7
1.6
1.7
0.75
0.45
0.61
0.54
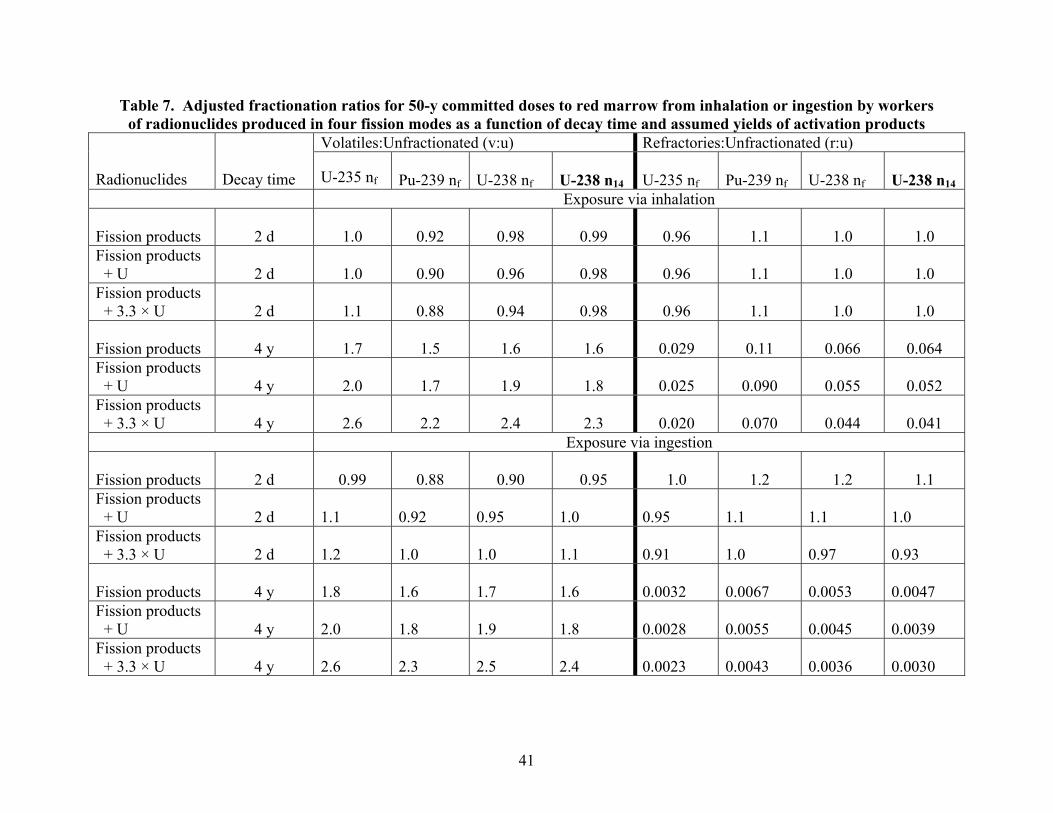
41
Table 7. Adjusted fractionation ratios for 50-y committed doses to red marrow from inhalation or ingestion by workers of radionuclides produced in four fission modes as a function of decay time and assumed yields of activation products
Volatiles:Unfractionated (v:u) Refractories:Unfractionated (r:u) Radionuclides
Decay time
U-235 nf
Pu-239 nf
U-238 nf
U-238 n14
U-235 nf
Pu-239 nf
U-238 nf
U-238 n14
Exposure via inhalation Fission products
2 d
1.0
0.92
0.98
0.99
0.96
1.1
1.0
1.0
Fission products + U
2 d
1.0
0.90
0.96
0.98
0.96
1.1
1.0
1.0
Fission products + 3.3 × U
2 d
1.1
0.88
0.94
0.98
0.96
1.1
1.0
1.0
Fission products
4 y
1.7
1.5
1.6
1.6
0.029
0.11
0.066
0.064
Fission products + U
4 y
2.0
1.7
1.9
1.8
0.025
0.090
0.055
0.052
Fission products + 3.3 × U
4 y
2.6
2.2
2.4
2.3
0.020
0.070
0.044
0.041
Exposure via ingestion Fission products
2 d
0.99
0.88
0.90
0.95
1.0
1.2
1.2
1.1
Fission products + U
2 d
1.1
0.92
0.95
1.0
0.95
1.1
1.1
1.0
Fission products + 3.3 × U
2 d
1.2
1.0
1.0
1.1
0.91
1.0
0.97
0.93
Fission products
4 y
1.8
1.6
1.7
1.6
0.0032
0.0067
0.0053
0.0047
Fission products + U
4 y
2.0
1.8
1.9
1.8
0.0028
0.0055
0.0045
0.0039
Fission products + 3.3 × U
4 y
2.6
2.3
2.5
2.4
0.0023
0.0043
0.0036
0.0030
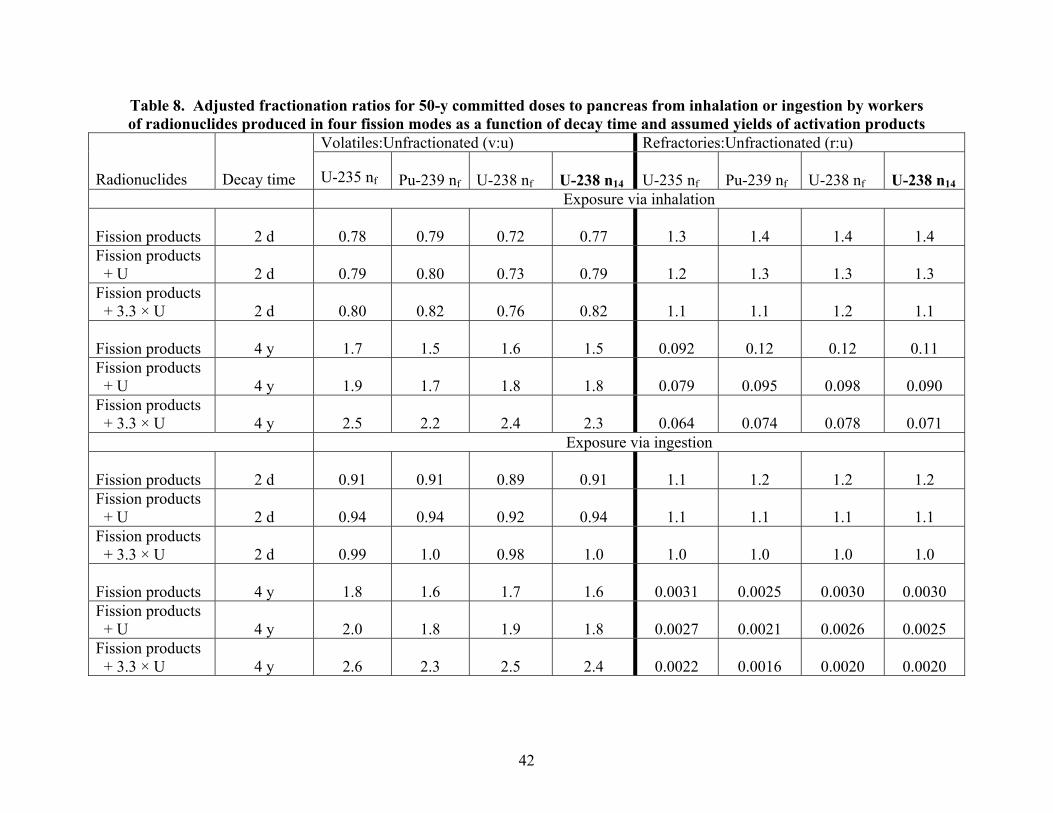
42
Table 8. Adjusted fractionation ratios for 50-y committed doses to pancreas from inhalation or ingestion by workers of radionuclides produced in four fission modes as a function of decay time and assumed yields of activation products
Volatiles:Unfractionated (v:u) Refractories:Unfractionated (r:u) Radionuclides
Decay time
U-235 nf
Pu-239 nf
U-238 nf
U-238 n14
U-235 nf
Pu-239 nf
U-238 nf
U-238 n14
Exposure via inhalation Fission products
2 d
0.78
0.79
0.72
0.77
1.3
1.4
1.4
1.4
Fission products + U
2 d
0.79
0.80
0.73
0.79
1.2
1.3
1.3
1.3
Fission products + 3.3 × U
2 d
0.80
0.82
0.76
0.82
1.1
1.1
1.2
1.1
Fission products
4 y
1.7
1.5
1.6
1.5
0.092
0.12
0.12
0.11
Fission products + U
4 y
1.9
1.7
1.8
1.8
0.079
0.095
0.098
0.090
Fission products + 3.3 × U
4 y
2.5
2.2
2.4
2.3
0.064
0.074
0.078
0.071
Exposure via ingestion Fission products
2 d
0.91
0.91
0.89
0.91
1.1
1.2
1.2
1.2
Fission products + U
2 d
0.94
0.94
0.92
0.94
1.1
1.1
1.1
1.1
Fission products + 3.3 × U
2 d
0.99
1.0
0.98
1.0
1.0
1.0
1.0
1.0
Fission products
4 y
1.8
1.6
1.7
1.6
0.0031
0.0025
0.0030
0.0030
Fission products + U
4 y
2.0
1.8
1.9
1.8
0.0027
0.0021
0.0026
0.0025
Fission products + 3.3 × U
4 y
2.6
2.3
2.5
2.4
0.0022
0.0016
0.0020
0.0020
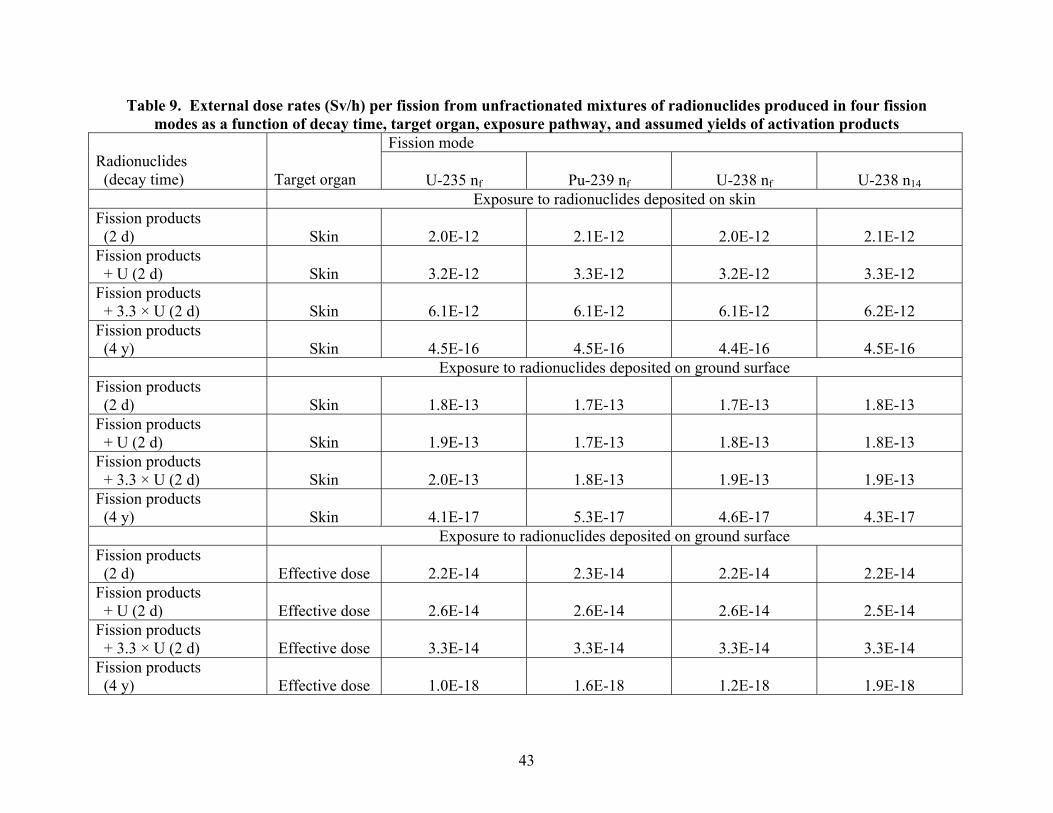
43
Table 9. External dose rates (Sv/h) per fission from unfractionated mixtures of radionuclides produced in four fission modes as a function of decay time, target organ, exposure pathway, and assumed yields of activation products
Fission mode Radionuclides (decay time)
Target organ
U-235 nf
Pu-239 nf
U-238 nf
U-238 n14
Exposure to radionuclides deposited on skin Fission products (2 d)
Skin
2.0E-12
2.1E-12
2.0E-12
2.1E-12
Fission products + U (2 d)
Skin
3.2E-12
3.3E-12
3.2E-12
3.3E-12
Fission products + 3.3 × U (2 d)
Skin
6.1E-12
6.1E-12
6.1E-12
6.2E-12
Fission products (4 y)
Skin
4.5E-16
4.5E-16
4.4E-16
4.5E-16
Exposure to radionuclides deposited on ground surface Fission products (2 d)
Skin
1.8E-13
1.7E-13
1.7E-13
1.8E-13
Fission products + U (2 d)
Skin
1.9E-13
1.7E-13
1.8E-13
1.8E-13
Fission products + 3.3 × U (2 d)
Skin
2.0E-13
1.8E-13
1.9E-13
1.9E-13
Fission products (4 y)
Skin
4.1E-17
5.3E-17
4.6E-17
4.3E-17
Exposure to radionuclides deposited on ground surface Fission products (2 d)
Effective dose
2.2E-14
2.3E-14
2.2E-14
2.2E-14
Fission products + U (2 d)
Effective dose
2.6E-14
2.6E-14
2.6E-14
2.5E-14
Fission products + 3.3 × U (2 d)
Effective dose
3.3E-14
3.3E-14
3.3E-14
3.3E-14
Fission products (4 y)
Effective dose
1.0E-18
1.6E-18
1.2E-18
1.9E-18
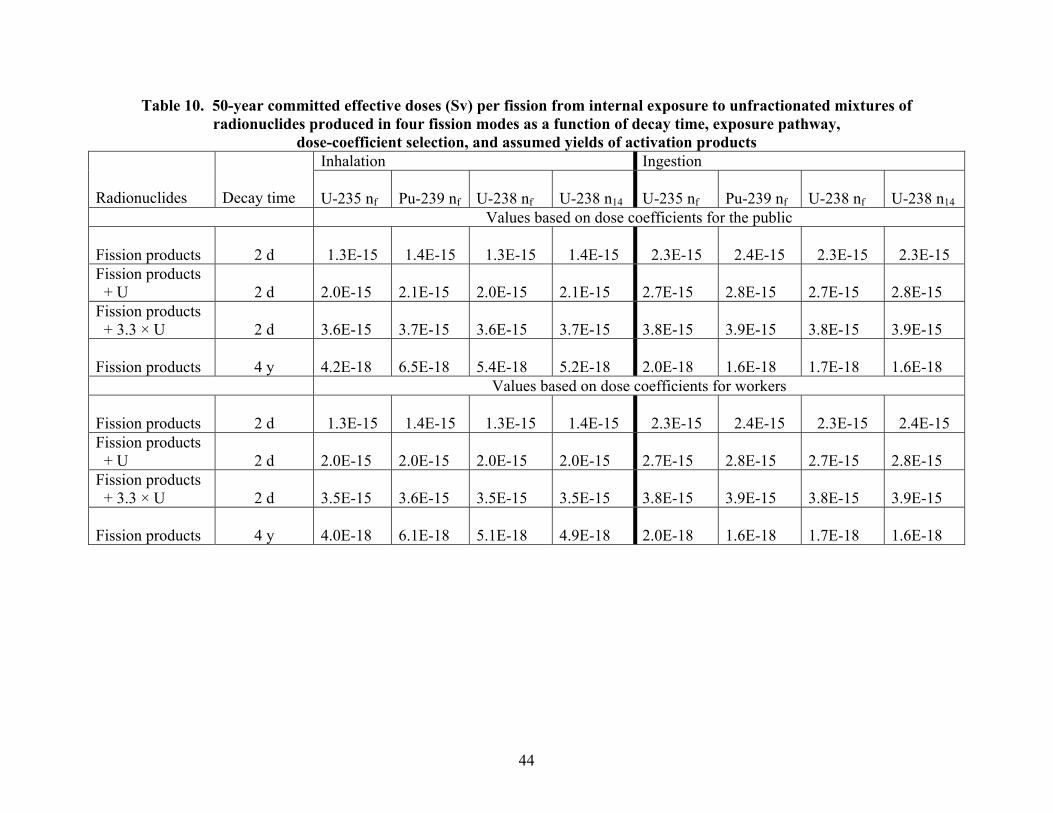
44
Table 10. 50-year committed effective doses (Sv) per fission from internal exposure to unfractionated mixtures of radionuclides produced in four fission modes as a function of decay time, exposure pathway,
dose-coefficient selection, and assumed yields of activation products Inhalation Ingestion
Radionuclides
Decay time
U-235 nf
Pu-239 nf
U-238 nf
U-238 n14
U-235 nf
Pu-239 nf
U-238 nf
U-238 n14
Values based on dose coefficients for the public Fission products
2 d
1.3E-15
1.4E-15
1.3E-15
1.4E-15
2.3E-15
2.4E-15
2.3E-15
2.3E-15
Fission products + U
2 d
2.0E-15
2.1E-15
2.0E-15
2.1E-15
2.7E-15
2.8E-15
2.7E-15
2.8E-15
Fission products + 3.3 × U
2 d
3.6E-15
3.7E-15
3.6E-15
3.7E-15
3.8E-15
3.9E-15
3.8E-15
3.9E-15
Fission products
4 y
4.2E-18
6.5E-18
5.4E-18
5.2E-18
2.0E-18
1.6E-18
1.7E-18
1.6E-18
Values based on dose coefficients for workers Fission products
2 d
1.3E-15
1.4E-15
1.3E-15
1.4E-15
2.3E-15
2.4E-15
2.3E-15
2.4E-15
Fission products + U
2 d
2.0E-15
2.0E-15
2.0E-15
2.0E-15
2.7E-15
2.8E-15
2.7E-15
2.8E-15
Fission products + 3.3 × U
2 d
3.5E-15
3.6E-15
3.5E-15
3.5E-15
3.8E-15
3.9E-15
3.8E-15
3.9E-15
Fission products
4 y
4.0E-18
6.1E-18
5.1E-18
4.9E-18
2.0E-18
1.6E-18
1.7E-18
1.6E-18
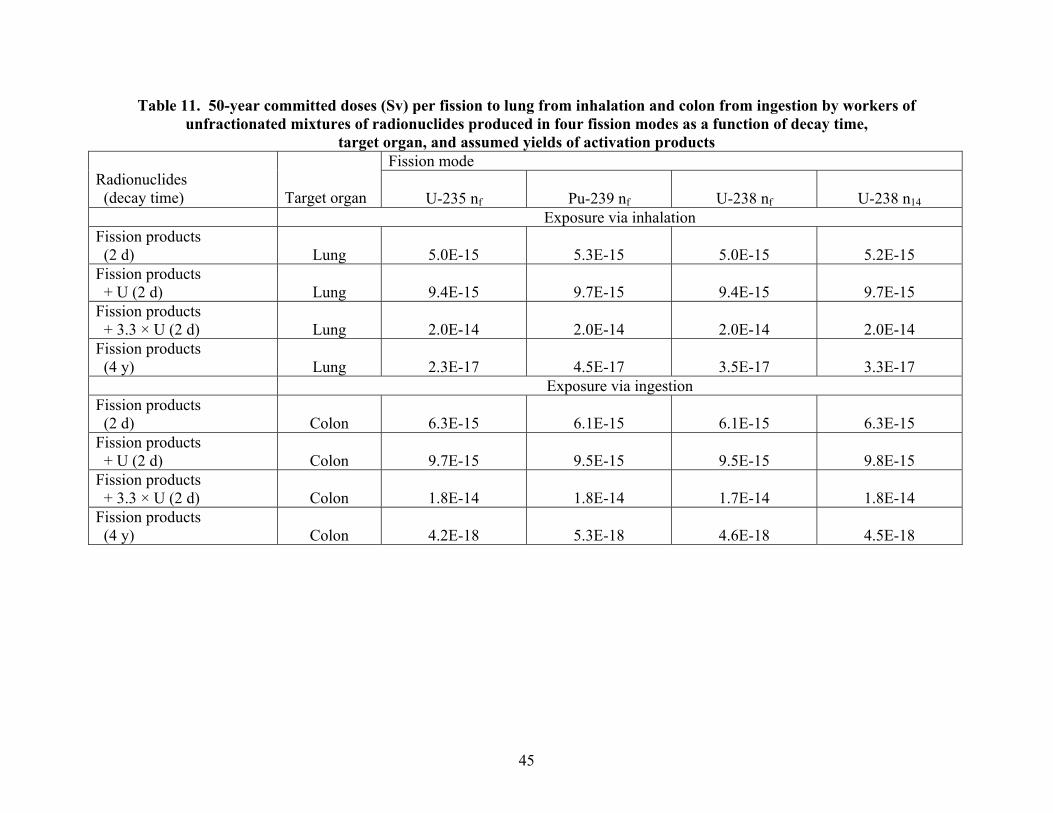
45
Table 11. 50-year committed doses (Sv) per fission to lung from inhalation and colon from ingestion by workers of unfractionated mixtures of radionuclides produced in four fission modes as a function of decay time,
target organ, and assumed yields of activation products Fission mode
Radionuclides (decay time)
Target organ
U-235 nf
Pu-239 nf
U-238 nf
U-238 n14
Exposure via inhalation Fission products (2 d)
Lung
5.0E-15
5.3E-15
5.0E-15
5.2E-15
Fission products + U (2 d)
Lung
9.4E-15
9.7E-15
9.4E-15
9.7E-15
Fission products + 3.3 × U (2 d)
Lung
2.0E-14
2.0E-14
2.0E-14
2.0E-14
Fission products (4 y)
Lung
2.3E-17
4.5E-17
3.5E-17
3.3E-17
Exposure via ingestion Fission products (2 d)
Colon
6.3E-15
6.1E-15
6.1E-15
6.3E-15
Fission products + U (2 d)
Colon
9.7E-15
9.5E-15
9.5E-15
9.8E-15
Fission products + 3.3 × U (2 d)
Colon
1.8E-14
1.8E-14
1.7E-14
1.8E-14
Fission products (4 y)
Colon
4.2E-18
5.3E-18
4.6E-18
4.5E-18

46
Table 12. 50-year committed doses (Sv/fission) to red marrow and pancreas from inhalation or ingestion by workers of unfractionated mixtures of radionuclides produced in four fission modes as a function of decay time
and assumed yields of activation products Red marrow Pancreas
Radionuclides
Decay time
U-235 nf
Pu-239 nf
U-238 nf
U-238 n14
U-235 nf
Pu-239 nf
U-238 nf
U-238 n14
Exposure via inhalation Fission products
2 d
1.7E-16
1.3E-16
1.4E-16
1.5E-16
6.8E-17
7.4E-17
7.7E-17
7.6E-17
Fission products + U
2 d
2.0E-16
1.6E-16
1.6E-16
1.7E-16
7.7E-17
8.3E-17
8.7E-17
8.5E-17
Fission products + 3.3 × U
2 d
2.5E-16
2.1E-16
2.1E-16
2.2E-16
9.9E-17
1.0E-16
1.1E-16
1.1E-16
Fission products
4 y
6.4E-18
2.7E-18
4.0E-18
3.9E-18
2.5E-19
3.2E-19
2.7E-19
2.8E-19
Exposure via ingestion Fission products
2 d
2.1E-16
1.9E-16
1.9E-16
2.0E-16
1.1E-16
1.1E-16
1.1E-16
1.1E-16
Fission products + U
2 d
2.2E-16
2.1E-16
2.1E-16
2.1E-16
1.2E-16
1.3E-16
1.2E-16
1.2E-16
Fission products + 3.3 × U
2 d
2.6E-16
2.5E-16
2.5E-16
2.5E-16
1.4E-16
1.5E-16
1.5E-16
1.5E-16
Fission products
4 y
7.4E-18
3.3E-18
4.7E-18
4.6E-18
6.2E-19
7.2E-19
6.3E-19
5.7E-19
47
6. REFERENCES
Apostoaei, A. I., and Kocher, D. C. 2005. Skin Doses from Dermal Contamination, Draft Report
to the Defense Threat Reduction Agency, September 2005 (SENES Oak Ridge, Inc., Oak
Ridge, TN).
Barrett, M., Goetz, J., Klemm, J., McRaney, W., and Phillips, J. 1986. Low-Level Dose Screen─
CONUS Tests, DNA-TR-85-317 (Science Applications International Corporation, McLean,
VA).
Barss, N. M. 2000. Methods and Applications for Dose Assessment of Beta Particle Radiation
SAIC – 001/2024, Science Applications International Corporation, McLean, VA.
Benavides, C. 2003. Letter to S. Powell (Titan Corporation), Defense Threat Reduction Agency, Fort Belvoir, VA (July 16). Carter, M. W., and Moghissi, A. A. 1967. “Three decades of nuclear weapons testing,”
Health Phys. 33, 55–71.
Crocker, G. R., Kawahara, K. H., and Freiling, E. C. 1965. “Radiochemical data
correlations on debris from silicate bursts,” pp. 72–81 in Radioactive Fallout from Nuclear
Weapons Tests, Klement, A. W., Jr. (ed.) (U.S. Atomic Energy Commission, Germantown,
MD).
Dunning, D. E., Bernard, S. R., Walsh, P. J., Killough, G. G., Jr., and Pleasant, J. C. 1979.
Estimates of Internal Dose Equivalent to 22 Target Organs for Radionuclides Occurring in
Routine Releases from Nuclear Fuel-Cycle Facilities, Vol. II, NUREG/CR-0150, Vol. 2,
ORNL/NUREG/TM-190/V2 (Oak Ridge National Laboratory, Oak Ridge, TN).
Eckerman, K. F., and Ryman, J. C. 1993. External Exposure to Radionuclides in Air, Water,and
Soil, Federal Guidance Report No. 12, EPA-402-93-081 (Office of Radiation and Indoor
Air, U.S. Environmental Protection Agency, Washington, DC).
Egbert, S. D., Kaul, D. C., Klemm, J., and Phillips, J. C. 1985. FIIDOS─A Computer Code for
the Computation of Fallout Inhalation and Ingestion Dose to Organs, DNA-TR-84-375
(Science Applications International Corporation, McLean, VA).
England, T. R., and Rider, B. F. 1994. Appendix A: Set A Yields Evaluated and Compiled for Los
Alamos Report LA-UR-94-3106 (ENDF-349), Evaluation and Compilation of Fission
Product Yields (Los Alamos National Laboratory, Los Alamos, NM).
Evans, R. D. 1955. The Atomic Nucleus (McGraw-Hill, New York).
48
Firestone, R. B. 1996. Table of Isotopes, Vols. I and II (John Wiley and Sons, Inc., New York).
Freiling, E. C. 1961. “Radionuclide fractionation in bomb debris,” Science 133, 1991–1998.
Freiling, E. C. 1963. “Theoretical basis for logarithmic correlations of fractionated radionuclide
compositions,” Science 139, 1058–1059.
Freiling, E. C., Crocker, G. R., and Adams, C. E. 1965. “Nuclear-debris formation,” pp. 1–43 in
Radioactive Fallout from Nuclear Weapons Tests, Klement, A. W., Jr. (ed.) (U.S. Atomic
Energy Commission, Germantown, MD).
Hawthorne, H. A. (ed.). Compilation of Local Fallout Data from Test Detonations 1945–1962
Extracted from DASA 1251, Volume I─Continental U.S. Tests, DNA 1251-1-EX (General
Electric Company─TEMPO, DASIAC, Santa Barbara, CA).
Hicks, H. G. 1981. Results of Calculations of External Gamma Radiation Exposure Rates from
Fallout and the Related Radionuclide Compositions, UCRL-53152, Parts 1–8 (Lawrence
Livermore National Laboratory, Livermore, CA).
Part 1: Operation Ranger, 1951
Part 2: Operation Buster-Jangle, 1951
Part 3: Operation Tumbler-Snapper, 1952
Part 4: Operation Upshot-Knothole, 1953
Part 5: Operation Teapot, 1955
Part 6. Operation Plumbbob, 1957
Part 7: Operation Hardtack II, 1958
Part 8: Operations Nougat through Bowline, 1962–1968.
Hicks, H. G. 1982. “Calculation of the concentration of any radionuclide deposited on the ground
by off-site fallout from a nuclear detonation,” Health Phys. 42, 585–600.
Hicks, H. G. 1990. “Additional calculation of radionuclide production following nuclear
explosions and Pu isotopic ratios for Nevada Test Site events,” Health Phys. 59, 515–524.
ICRP (International Commission on Radiological Protection). 1979. Limits for Intakes of
Radionuclides by Workers, ICRP Publication 30, Part 1, Ann. ICRP 2(3/4) (Pergamon Press,
Oxford).
ICRP (International Commission on Radiological Protection). 1991. 1990 Recommendations of
the International Commission on Radiological Protection, ICRP Publication 60, Ann. ICRP
21(3) (Elsevier Science Ltd, Oxford).
49
ICRP (International Commission on Radiological Protection). 1994a. Dose Coefficients for
Intakes of Radionuclides by Workers, ICRP Publication 68, Ann. ICRP 24(4) (Elsevier
Science Ltd, Oxford).
ICRP (International Commission on Radiological Protection). 1994b. Human Respiratory Tract
Model for Radiological, ICRP Publication 66, Ann. ICRP 24(1−3) (Elsevier Science Ltd,
Oxford).
ICRP (International Commission on Radiological Protection). 1996. Age-Dependent Doses to
Members of the Public from Intake of Radionuclides: Part 5, Compilation of Ingestion and
Inhalation Dose Coefficients, ICRP Publication 72, Ann. ICRP 26(1) (Elsevier Science Ltd,
Oxford).
ICRP (International Commission on Radiological Protection). 2002. ICRP Database
of Dose Coefficients: Workers and Members of the Public, Version 2.01 (ICRP, Stockholm,
Sweden).
Killough, G. G., Dunning, D. E., Jr., Bernard, S. R., and Pleasant, J. C. 1978. Estimates of
Internal Dose Equivalent to 22 Target Organs for Radionuclides Occurring in Routine
Releases from Nuclear Fuel-Cycle Facilities, Vol. I, NUREG/CR-0150,
ORNL/NUREG/TM-190 (Oak Ridge National Laboratory, Oak Ridge, TN).
Kocher, D. C. 1980. A Radionuclide Decay Data Base─Index and Summary Table,
NUREG/CR-1413, ORNL/NUREG-70 (Oak Ridge National Laboratory, Oak Ridge, TN). Kocher, D. C. 1981. Radioactive Decay Data Tables, DOE/TIC-11026 (Technical
Information Center, U.S. Department of Energy, Oak Ridge, TN). Kocher, D. C., and Eckerman, K. F. 1987. “Electron dose-rate conversion factors for
external exposure of the skin from uniformly deposited activity on the body surface,” Health
Phys. 53, 135–141.
Kocher, D. C., Trabalka, J. R., and Apostoaei, A. I. 2005. Evaluation of Inhalation Doses in
High-Resuspension Scenarios at the Nevada Test Site, Draft Report to the Defense Threat Reduction Agency, September 2005 (SENES Oak Ridge, Inc., Oak Ridge, TN).
50
Larson, K. H., Neel, J. W., Hawthorne, H. A., Mork, H. M., Rowland, R. H., Baurmash, L.,
Lindberg, R. G., Olafson, J. H., and Kowalewsky, Miller, B.W. 1966. Distribution,
Characteristics, and Biotic Availability of Fallout, Operation Plumbbob, WT-1488
(Laboratory of Nuclear Medicine and Radiation Biology, University of California at Los
Angeles, Los Angeles, CA).
McArthur, R. D., and Mead, S. W. 1987. Nevada Test Site Radionuclide Inventory and
Distribution Program, DOE/NV/10384-15 (Water Resources Center, Desert Research
Institute, University of Nevada System, Las Vegas, NV).
Miller, C. F. 1959. The Decontamination of Surfaces Contaminated with Fallout from
Nuclear Detonations at Sea, USNRDL-TR-329 (U.S. Naval Radiological Defense
Laboratory, San Francisco, CA).
Miller, C. F. 1964. Biological and Radiological Effects of Fallout from Nuclear Explosions
(Stanford Research Institute, Menlo Park, CA).
Morgenthau, M., Shaw, H.E., Hardin, L. M., Tompkins, R. C., and Krey, P. W. 1957.
Preliminary Report, Operation Redwing, Pacific Proving Grounds, Project 2.65, Land Fallout Studies, ITR–1319, January 30, 1957 (Headquarters Field Command, Armed Forces Special Weapons Project, Sandia Base, Albuquerque, NM). NRC (National Research Council). 2003. A Review of the Dose Reconstruction Program of the
Defense Threat Reduction Agency (The National Academies Press, Washington, DC).
Prokofiev, O. N., and Smirnov, O. A. 2000. “Retrospective determination of doses from local
fallout of nuclear explosions,” P-4b-224 (7 pp.), in Proceedings of the 10th International
Congress of IRPA (International Radiation Protection Association, Fontenay-aux-Roses,
France).
Zander, I., and Araskog, R. 1973. Nuclear Explosions 1945–1972, Basic Data, FOA 4 Report A4505–A1 (Research Institute of National Defense, Forsvarets Forskninganstalt, Stockholm,
Sweden).
A-1
APPENDIX A . PARAMETERS AND DOSE COEFFICIENTS FOR RADIONUCLIDES USED IN CALCULATIONS
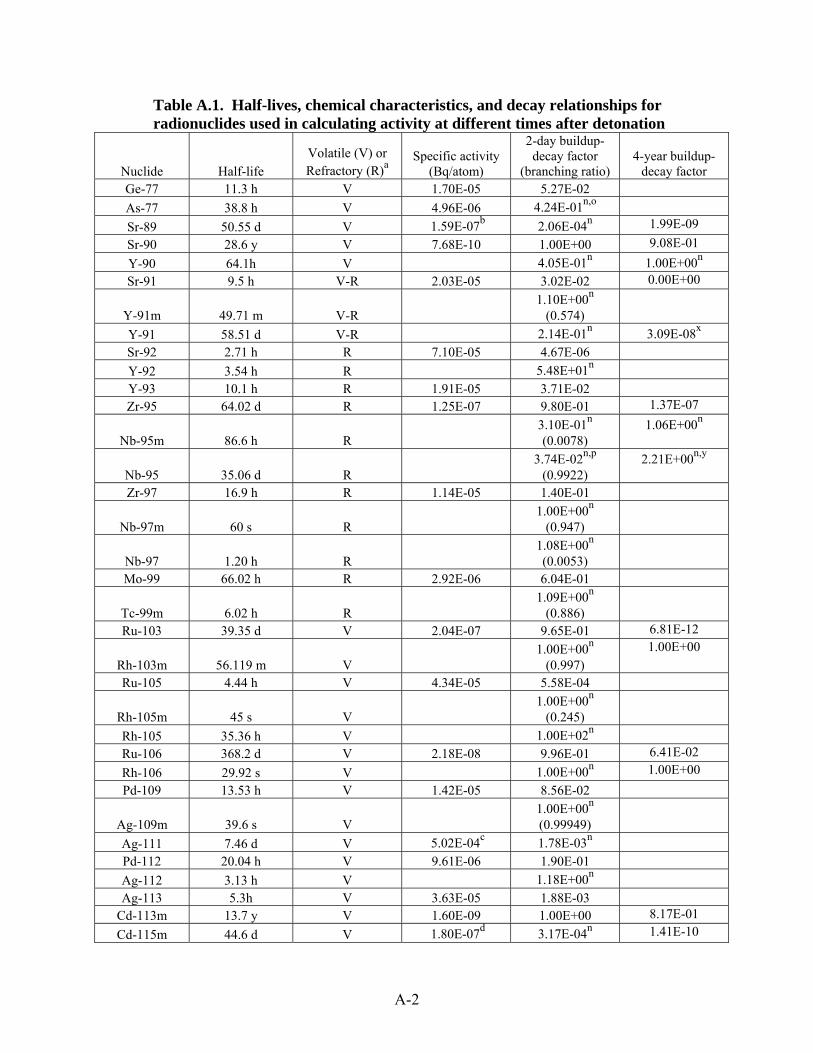
A-2
Table A.1. Half-lives, chemical characteristics, and decay relationships for radionuclides used in calculating activity at different times after detonation
Nuclide Half-life Volatile (V) or Refractory (R)a
Specific activity (Bq/atom)
2-day buildup-decay factor
(branching ratio)
4-year buildup-
decay factor Ge-77 11.3 h V 1.70E-05 5.27E-02 As-77 38.8 h V 4.96E-06 4.24E-01n,o
Sr-89 50.55 d V 1.59E-07b 2.06E-04n 1.99E-09 Sr-90 28.6 y V 7.68E-10 1.00E+00 9.08E-01 Y-90 64.1h V 4.05E-01n 1.00E+00n Sr-91 9.5 h V-R 2.03E-05 3.02E-02 0.00E+00
Y-91m 49.71 m V-R 1.10E+00n
(0.574)
Y-91 58.51 d V-R 2.14E-01n 3.09E-08x Sr-92 2.71 h R 7.10E-05 4.67E-06 Y-92 3.54 h R 5.48E+01n Y-93 10.1 h R 1.91E-05 3.71E-02 Zr-95 64.02 d R 1.25E-07 9.80E-01 1.37E-07
Nb-95m 86.6 h R 3.10E-01n
(0.0078) 1.06E+00n
Nb-95 35.06 d R 3.74E-02n,p
(0.9922) 2.21E+00n,y
Zr-97 16.9 h R 1.14E-05 1.40E-01
Nb-97m 60 s R 1.00E+00n
(0.947)
Nb-97 1.20 h R 1.08E+00n
(0.0053)
Mo-99 66.02 h R 2.92E-06 6.04E-01
Tc-99m 6.02 h R 1.09E+00n
(0.886)
Ru-103 39.35 d V 2.04E-07 9.65E-01 6.81E-12
Rh-103m 56.119 m V 1.00E+00n
(0.997) 1.00E+00
Ru-105 4.44 h V 4.34E-05 5.58E-04
Rh-105m 45 s V 1.00E+00n
(0.245)
Rh-105 35.36 h V 1.00E+02n Ru-106 368.2 d V 2.18E-08 9.96E-01 6.41E-02 Rh-106 29.92 s V 1.00E+00n 1.00E+00 Pd-109 13.53 h V 1.42E-05 8.56E-02
Ag-109m 39.6 s V 1.00E+00n
(0.99949)
Ag-111 7.46 d V 5.02E-04c 1.78E-03n Pd-112 20.04 h V 9.61E-06 1.90E-01 Ag-112 3.13 h V 1.18E+00n Ag-113 5.3h V 3.63E-05 1.88E-03
Cd-113m 13.7 y V 1.60E-09 1.00E+00 8.17E-01 Cd-115m 44.6 d V 1.80E-07d 3.17E-04n 1.41E-10
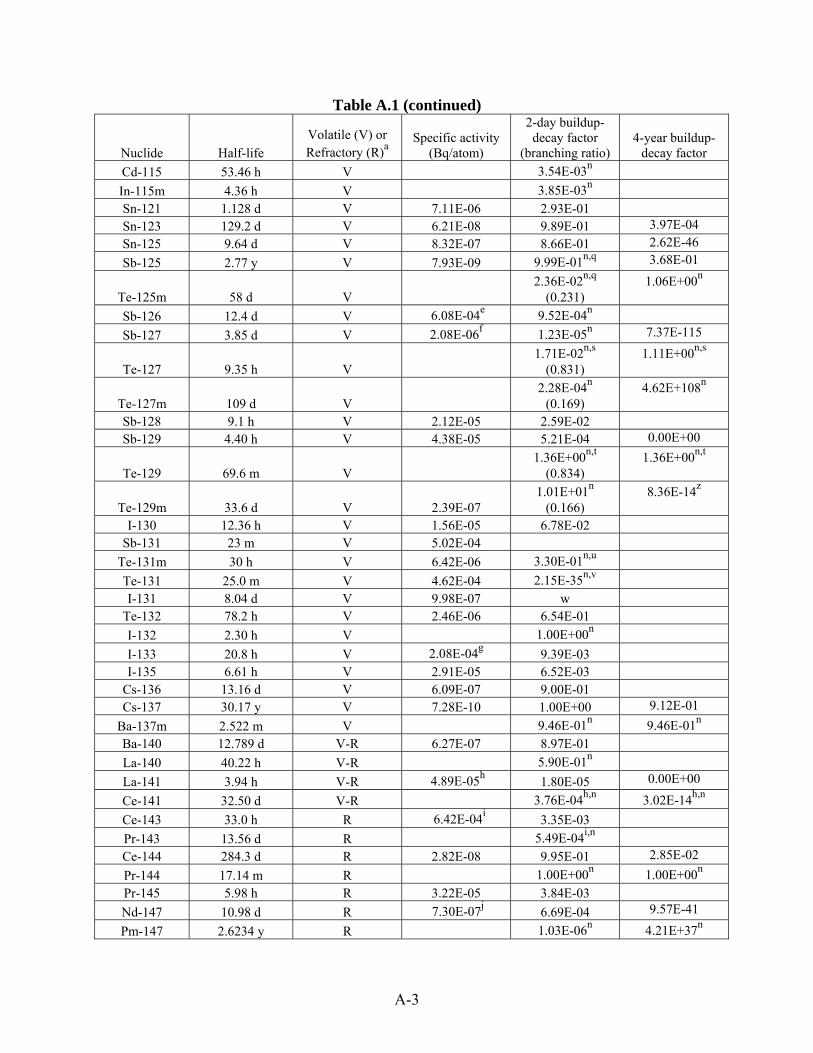
A-3
Table A.1 (continued)
Nuclide Half-life Volatile (V) or Refractory (R)a
Specific activity (Bq/atom)
2-day buildup-decay factor
(branching ratio)
4-year buildup-
decay factor Cd-115 53.46 h V 3.54E-03n
In-115m 4.36 h V 3.85E-03n Sn-121 1.128 d V 7.11E-06 2.93E-01 Sn-123 129.2 d V 6.21E-08 9.89E-01 3.97E-04 Sn-125 9.64 d V 8.32E-07 8.66E-01 2.62E-46 Sb-125 2.77 y V 7.93E-09 9.99E-01n,q 3.68E-01
Te-125m 58 d V 2.36E-02n,q
(0.231) 1.06E+00n
Sb-126 12.4 d V 6.08E-04e 9.52E-04n
Sb-127 3.85 d V 2.08E-06f 1.23E-05n 7.37E-115
Te-127 9.35 h V 1.71E-02n,s
(0.831) 1.11E+00n,s
Te-127m 109 d V 2.28E-04n
(0.169) 4.62E+108n
Sb-128 9.1 h V 2.12E-05 2.59E-02 Sb-129 4.40 h V 4.38E-05 5.21E-04 0.00E+00
Te-129 69.6 m V 1.36E+00n,t
(0.834) 1.36E+00n,t
Te-129m 33.6 d V 2.39E-07 1.01E+01n
(0.166) 8.36E-14z
I-130 12.36 h V 1.56E-05 6.78E-02 Sb-131 23 m V 5.02E-04
Te-131m 30 h V 6.42E-06 3.30E-01n,u
Te-131 25.0 m V 4.62E-04 2.15E-35n,v I-131 8.04 d V 9.98E-07 w
Te-132 78.2 h V 2.46E-06 6.54E-01 I-132 2.30 h V 1.00E+00n
I-133 20.8 h V 2.08E-04g 9.39E-03 I-135 6.61 h V 2.91E-05 6.52E-03
Cs-136 13.16 d V 6.09E-07 9.00E-01 Cs-137 30.17 y V 7.28E-10 1.00E+00 9.12E-01
Ba-137m 2.522 m V 9.46E-01n 9.46E-01n Ba-140 12.789 d V-R 6.27E-07 8.97E-01 La-140 40.22 h V-R 5.90E-01n
La-141 3.94 h V-R 4.89E-05h 1.80E-05 0.00E+00
Ce-141 32.50 d V-R 3.76E-04h,n 3.02E-14h,n Ce-143 33.0 h R 6.42E-04i 3.35E-03
Pr-143 13.56 d R 5.49E-04i,n Ce-144 284.3 d R 2.82E-08 9.95E-01 2.85E-02 Pr-144 17.14 m R 1.00E+00n 1.00E+00n Pr-145 5.98 h R 3.22E-05 3.84E-03 Nd-147 10.98 d R 7.30E-07j 6.69E-04 9.57E-41
Pm-147 2.6234 y R 1.03E-06n 4.21E+37n
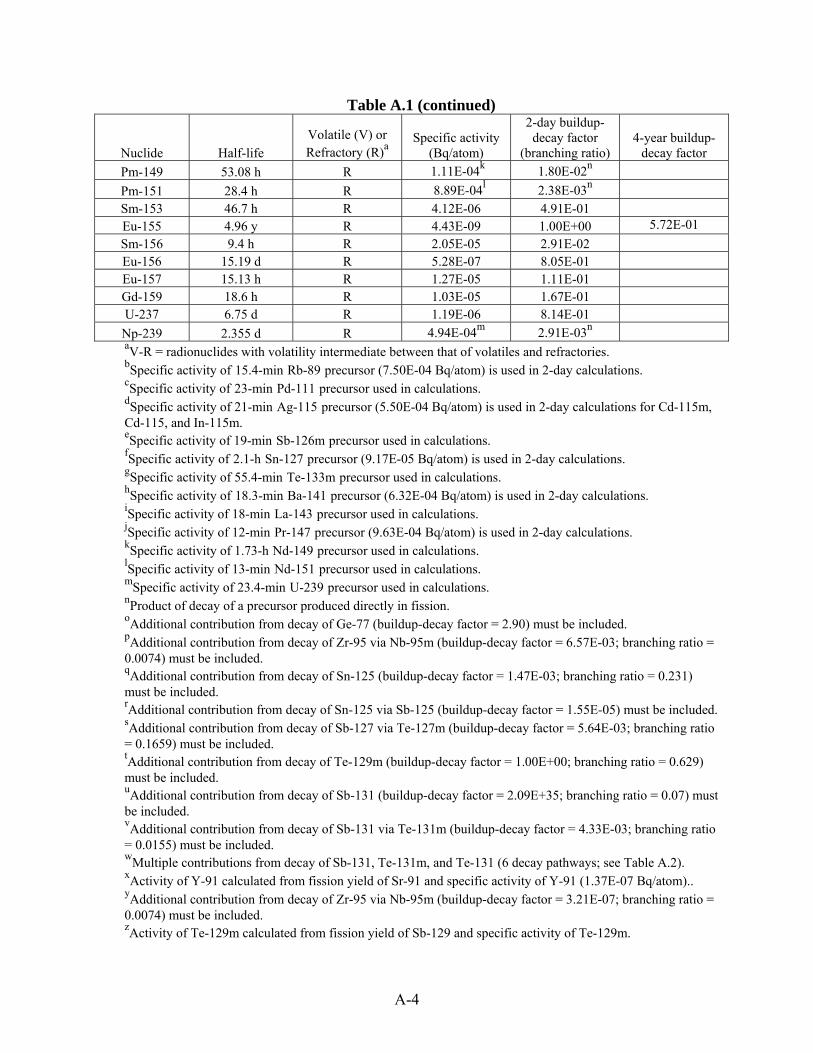
A-4
Table A.1 (continued)
Nuclide Half-life Volatile (V) or Refractory (R)a
Specific activity (Bq/atom)
2-day buildup-decay factor
(branching ratio)
4-year buildup-
decay factor Pm-149 53.08 h R 1.11E-04k 1.80E-02n
Pm-151 28.4 h R 8.89E-04l 2.38E-03n Sm-153 46.7 h R 4.12E-06 4.91E-01 Eu-155 4.96 y R 4.43E-09 1.00E+00 5.72E-01 Sm-156 9.4 h R 2.05E-05 2.91E-02 Eu-156 15.19 d R 5.28E-07 8.05E-01 Eu-157 15.13 h R 1.27E-05 1.11E-01 Gd-159 18.6 h R 1.03E-05 1.67E-01 U-237 6.75 d R 1.19E-06 8.14E-01 Np-239 2.355 d R 4.94E-04m 2.91E-03n aV-R = radionuclides with volatility intermediate between that of volatiles and refractories. bSpecific activity of 15.4-min Rb-89 precursor (7.50E-04 Bq/atom) is used in 2-day calculations. cSpecific activity of 23-min Pd-111 precursor used in calculations. dSpecific activity of 21-min Ag-115 precursor (5.50E-04 Bq/atom) is used in 2-day calculations for Cd-115m, Cd-115, and In-115m. eSpecific activity of 19-min Sb-126m precursor used in calculations. fSpecific activity of 2.1-h Sn-127 precursor (9.17E-05 Bq/atom) is used in 2-day calculations. gSpecific activity of 55.4-min Te-133m precursor used in calculations. hSpecific activity of 18.3-min Ba-141 precursor (6.32E-04 Bq/atom) is used in 2-day calculations. iSpecific activity of 18-min La-143 precursor used in calculations. jSpecific activity of 12-min Pr-147 precursor (9.63E-04 Bq/atom) is used in 2-day calculations. kSpecific activity of 1.73-h Nd-149 precursor used in calculations. lSpecific activity of 13-min Nd-151 precursor used in calculations. mSpecific activity of 23.4-min U-239 precursor used in calculations. nProduct of decay of a precursor produced directly in fission. oAdditional contribution from decay of Ge-77 (buildup-decay factor = 2.90) must be included. pAdditional contribution from decay of Zr-95 via Nb-95m (buildup-decay factor = 6.57E-03; branching ratio = 0.0074) must be included. qAdditional contribution from decay of Sn-125 (buildup-decay factor = 1.47E-03; branching ratio = 0.231) must be included. rAdditional contribution from decay of Sn-125 via Sb-125 (buildup-decay factor = 1.55E-05) must be included. sAdditional contribution from decay of Sb-127 via Te-127m (buildup-decay factor = 5.64E-03; branching ratio = 0.1659) must be included. tAdditional contribution from decay of Te-129m (buildup-decay factor = 1.00E+00; branching ratio = 0.629) must be included. uAdditional contribution from decay of Sb-131 (buildup-decay factor = 2.09E+35; branching ratio = 0.07) must be included. vAdditional contribution from decay of Sb-131 via Te-131m (buildup-decay factor = 4.33E-03; branching ratio = 0.0155) must be included. wMultiple contributions from decay of Sb-131, Te-131m, and Te-131 (6 decay pathways; see Table A.2). xActivity of Y-91 calculated from fission yield of Sr-91 and specific activity of Y-91 (1.37E-07 Bq/atom).. yAdditional contribution from decay of Zr-95 via Nb-95m (buildup-decay factor = 3.21E-07; branching ratio = 0.0074) must be included. zActivity of Te-129m calculated from fission yield of Sb-129 and specific activity of Te-129m.
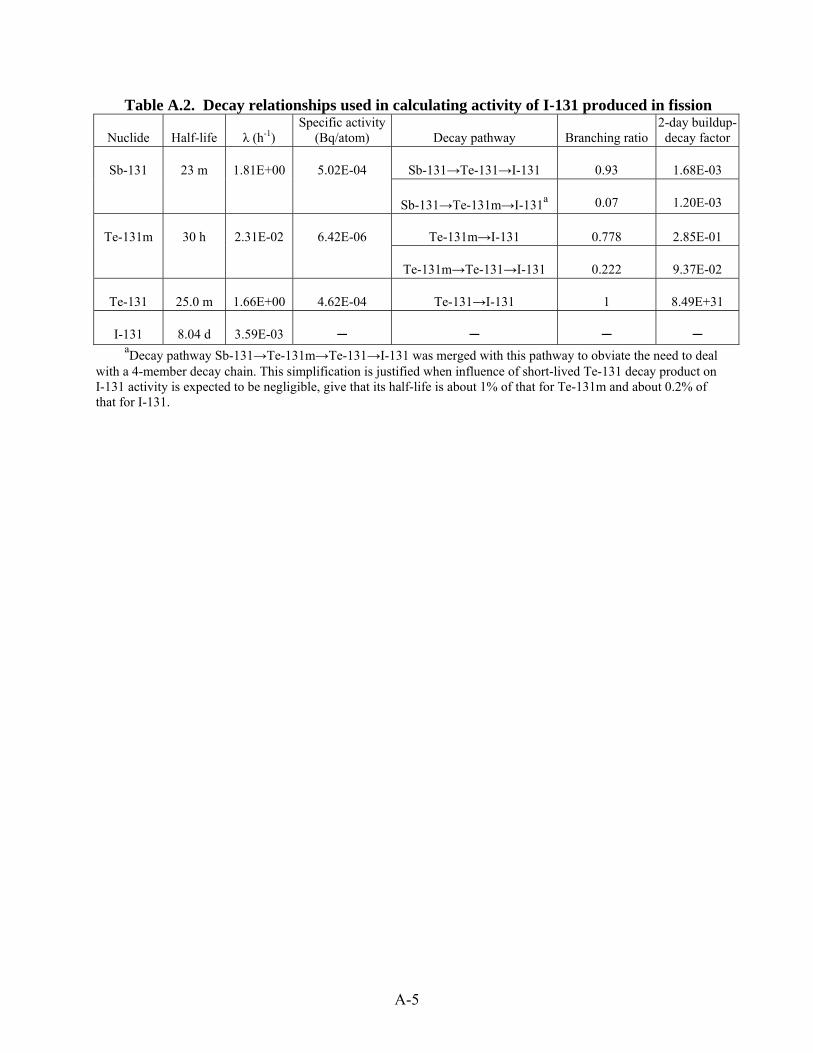
A-5
Table A.2. Decay relationships used in calculating activity of I-131 produced in fission
Nuclide
Half-life
λ (h-1) Specific activity
(Bq/atom)
Decay pathway
Branching ratio 2-day buildup-decay factor
Sb-131→Te-131→I-131
0.93
1.68E-03
Sb-131
23 m
1.81E+00
5.02E-04
Sb-131→Te-131m→I-131a
0.07
1.20E-03
Te-131m→I-131
0.778
2.85E-01
Te-131m
30 h
2.31E-02
6.42E-06
Te-131m→Te-131→I-131
0.222
9.37E-02
Te-131
25.0 m
1.66E+00
4.62E-04
Te-131→I-131
1
8.49E+31
I-131
8.04 d
3.59E-03
─
─
─
─
aDecay pathway Sb-131→Te-131m→Te-131→I-131 was merged with this pathway to obviate the need to deal with a 4-member decay chain. This simplification is justified when influence of short-lived Te-131 decay product on I-131 activity is expected to be negligible, give that its half-life is about 1% of that for Te-131m and about 0.2% of that for I-131.
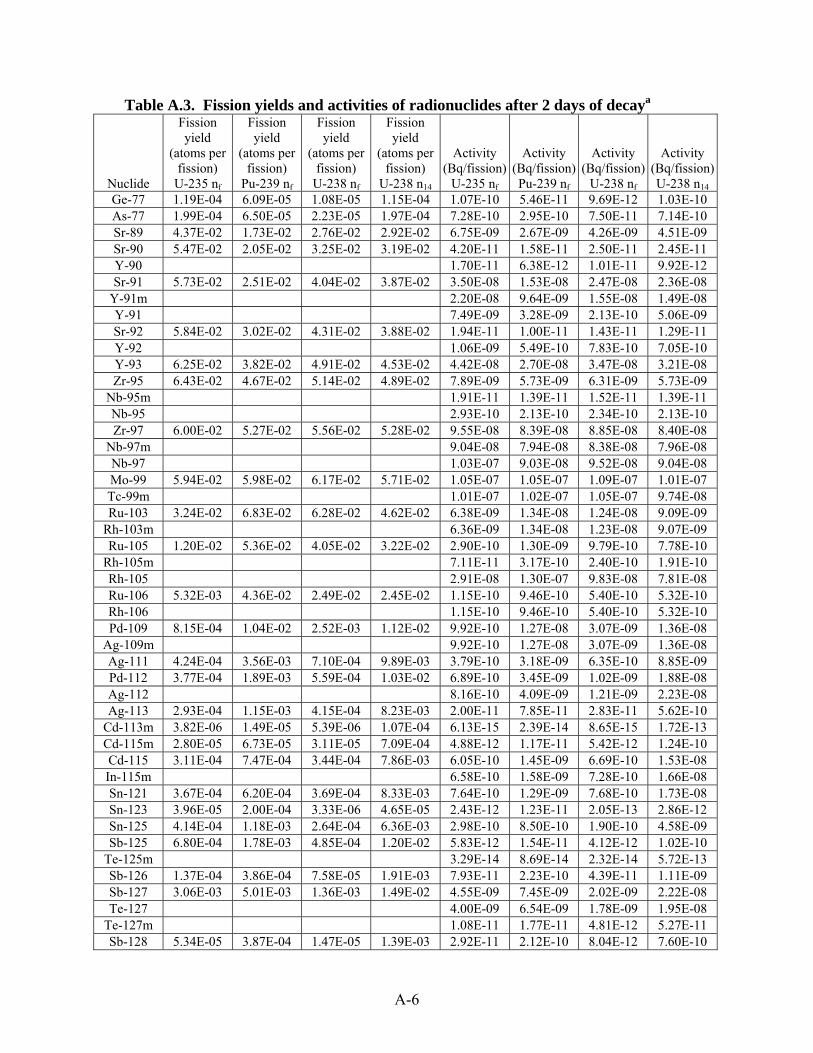
A-6
Table A.3. Fission yields and activities of radionuclides after 2 days of decaya
Nuclide
Fission yield
(atoms per fission)
U-235 nf
Fission yield
(atoms per fission)
Pu-239 nf
Fission yield
(atoms per fission)
U-238 nf
Fission yield
(atoms per fission)
U-238 n14
Activity (Bq/fission)
U-235 nf
Activity (Bq/fission)Pu-239 nf
Activity (Bq/fission)
U-238 nf
Activity (Bq/fission)U-238 n14
Ge-77 1.19E-04 6.09E-05 1.08E-05 1.15E-04 1.07E-10 5.46E-11 9.69E-12 1.03E-10 As-77 1.99E-04 6.50E-05 2.23E-05 1.97E-04 7.28E-10 2.95E-10 7.50E-11 7.14E-10 Sr-89 4.37E-02 1.73E-02 2.76E-02 2.92E-02 6.75E-09 2.67E-09 4.26E-09 4.51E-09 Sr-90 5.47E-02 2.05E-02 3.25E-02 3.19E-02 4.20E-11 1.58E-11 2.50E-11 2.45E-11 Y-90 1.70E-11 6.38E-12 1.01E-11 9.92E-12 Sr-91 5.73E-02 2.51E-02 4.04E-02 3.87E-02 3.50E-08 1.53E-08 2.47E-08 2.36E-08
Y-91m 2.20E-08 9.64E-09 1.55E-08 1.49E-08 Y-91 7.49E-09 3.28E-09 2.13E-10 5.06E-09 Sr-92 5.84E-02 3.02E-02 4.31E-02 3.88E-02 1.94E-11 1.00E-11 1.43E-11 1.29E-11 Y-92 1.06E-09 5.49E-10 7.83E-10 7.05E-10 Y-93 6.25E-02 3.82E-02 4.91E-02 4.53E-02 4.42E-08 2.70E-08 3.47E-08 3.21E-08 Zr-95 6.43E-02 4.67E-02 5.14E-02 4.89E-02 7.89E-09 5.73E-09 6.31E-09 5.73E-09
Nb-95m 1.91E-11 1.39E-11 1.52E-11 1.39E-11 Nb-95 2.93E-10 2.13E-10 2.34E-10 2.13E-10 Zr-97 6.00E-02 5.27E-02 5.56E-02 5.28E-02 9.55E-08 8.39E-08 8.85E-08 8.40E-08
Nb-97m 9.04E-08 7.94E-08 8.38E-08 7.96E-08 Nb-97 1.03E-07 9.03E-08 9.52E-08 9.04E-08 Mo-99 5.94E-02 5.98E-02 6.17E-02 5.71E-02 1.05E-07 1.05E-07 1.09E-07 1.01E-07 Tc-99m 1.01E-07 1.02E-07 1.05E-07 9.74E-08 Ru-103 3.24E-02 6.83E-02 6.28E-02 4.62E-02 6.38E-09 1.34E-08 1.24E-08 9.09E-09
Rh-103m 6.36E-09 1.34E-08 1.23E-08 9.07E-09 Ru-105 1.20E-02 5.36E-02 4.05E-02 3.22E-02 2.90E-10 1.30E-09 9.79E-10 7.78E-10
Rh-105m 7.11E-11 3.17E-10 2.40E-10 1.91E-10 Rh-105 2.91E-08 1.30E-07 9.83E-08 7.81E-08 Ru-106 5.32E-03 4.36E-02 2.49E-02 2.45E-02 1.15E-10 9.46E-10 5.40E-10 5.32E-10 Rh-106 1.15E-10 9.46E-10 5.40E-10 5.32E-10 Pd-109 8.15E-04 1.04E-02 2.52E-03 1.12E-02 9.92E-10 1.27E-08 3.07E-09 1.36E-08
Ag-109m 9.92E-10 1.27E-08 3.07E-09 1.36E-08 Ag-111 4.24E-04 3.56E-03 7.10E-04 9.89E-03 3.79E-10 3.18E-09 6.35E-10 8.85E-09 Pd-112 3.77E-04 1.89E-03 5.59E-04 1.03E-02 6.89E-10 3.45E-09 1.02E-09 1.88E-08 Ag-112 8.16E-10 4.09E-09 1.21E-09 2.23E-08 Ag-113 2.93E-04 1.15E-03 4.15E-04 8.23E-03 2.00E-11 7.85E-11 2.83E-11 5.62E-10
Cd-113m 3.82E-06 1.49E-05 5.39E-06 1.07E-04 6.13E-15 2.39E-14 8.65E-15 1.72E-13 Cd-115m 2.80E-05 6.73E-05 3.11E-05 7.09E-04 4.88E-12 1.17E-11 5.42E-12 1.24E-10 Cd-115 3.11E-04 7.47E-04 3.44E-04 7.86E-03 6.05E-10 1.45E-09 6.69E-10 1.53E-08 In-115m 6.58E-10 1.58E-09 7.28E-10 1.66E-08 Sn-121 3.67E-04 6.20E-04 3.69E-04 8.33E-03 7.64E-10 1.29E-09 7.68E-10 1.73E-08 Sn-123 3.96E-05 2.00E-04 3.33E-06 4.65E-05 2.43E-12 1.23E-11 2.05E-13 2.86E-12 Sn-125 4.14E-04 1.18E-03 2.64E-04 6.36E-03 2.98E-10 8.50E-10 1.90E-10 4.58E-09 Sb-125 6.80E-04 1.78E-03 4.85E-04 1.20E-02 5.83E-12 1.54E-11 4.12E-12 1.02E-10
Te-125m 3.29E-14 8.69E-14 2.32E-14 5.72E-13 Sb-126 1.37E-04 3.86E-04 7.58E-05 1.91E-03 7.93E-11 2.23E-10 4.39E-11 1.11E-09 Sb-127 3.06E-03 5.01E-03 1.36E-03 1.49E-02 4.55E-09 7.45E-09 2.02E-09 2.22E-08 Te-127 4.00E-09 6.54E-09 1.78E-09 1.95E-08
Te-127m 1.08E-11 1.77E-11 4.81E-12 5.27E-11 Sb-128 5.34E-05 3.87E-04 1.47E-05 1.39E-03 2.92E-11 2.12E-10 8.04E-12 7.60E-10
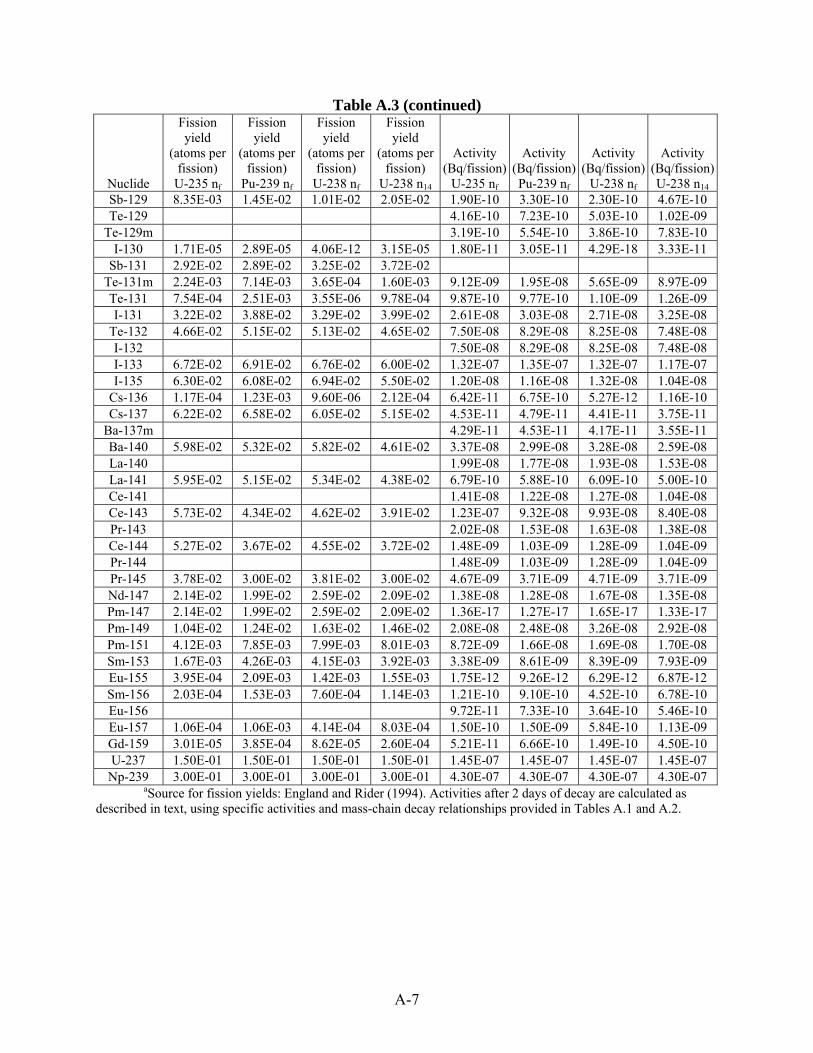
A-7
Table A.3 (continued)
Nuclide
Fission yield
(atoms per fission)
U-235 nf
Fission yield
(atoms per fission)
Pu-239 nf
Fission yield
(atoms per fission)
U-238 nf
Fission yield
(atoms per fission)
U-238 n14
Activity (Bq/fission)
U-235 nf
Activity (Bq/fission)Pu-239 nf
Activity (Bq/fission)
U-238 nf
Activity (Bq/fission)U-238 n14
Sb-129 8.35E-03 1.45E-02 1.01E-02 2.05E-02 1.90E-10 3.30E-10 2.30E-10 4.67E-10 Te-129 4.16E-10 7.23E-10 5.03E-10 1.02E-09
Te-129m 3.19E-10 5.54E-10 3.86E-10 7.83E-10 I-130 1.71E-05 2.89E-05 4.06E-12 3.15E-05 1.80E-11 3.05E-11 4.29E-18 3.33E-11
Sb-131 2.92E-02 2.89E-02 3.25E-02 3.72E-02 Te-131m 2.24E-03 7.14E-03 3.65E-04 1.60E-03 9.12E-09 1.95E-08 5.65E-09 8.97E-09 Te-131 7.54E-04 2.51E-03 3.55E-06 9.78E-04 9.87E-10 9.77E-10 1.10E-09 1.26E-09 I-131 3.22E-02 3.88E-02 3.29E-02 3.99E-02 2.61E-08 3.03E-08 2.71E-08 3.25E-08
Te-132 4.66E-02 5.15E-02 5.13E-02 4.65E-02 7.50E-08 8.29E-08 8.25E-08 7.48E-08 I-132 7.50E-08 8.29E-08 8.25E-08 7.48E-08 I-133 6.72E-02 6.91E-02 6.76E-02 6.00E-02 1.32E-07 1.35E-07 1.32E-07 1.17E-07 I-135 6.30E-02 6.08E-02 6.94E-02 5.50E-02 1.20E-08 1.16E-08 1.32E-08 1.04E-08
Cs-136 1.17E-04 1.23E-03 9.60E-06 2.12E-04 6.42E-11 6.75E-10 5.27E-12 1.16E-10 Cs-137 6.22E-02 6.58E-02 6.05E-02 5.15E-02 4.53E-11 4.79E-11 4.41E-11 3.75E-11
Ba-137m 4.29E-11 4.53E-11 4.17E-11 3.55E-11 Ba-140 5.98E-02 5.32E-02 5.82E-02 4.61E-02 3.37E-08 2.99E-08 3.28E-08 2.59E-08 La-140 1.99E-08 1.77E-08 1.93E-08 1.53E-08 La-141 5.95E-02 5.15E-02 5.34E-02 4.38E-02 6.79E-10 5.88E-10 6.09E-10 5.00E-10 Ce-141 1.41E-08 1.22E-08 1.27E-08 1.04E-08 Ce-143 5.73E-02 4.34E-02 4.62E-02 3.91E-02 1.23E-07 9.32E-08 9.93E-08 8.40E-08 Pr-143 2.02E-08 1.53E-08 1.63E-08 1.38E-08 Ce-144 5.27E-02 3.67E-02 4.55E-02 3.72E-02 1.48E-09 1.03E-09 1.28E-09 1.04E-09 Pr-144 1.48E-09 1.03E-09 1.28E-09 1.04E-09 Pr-145 3.78E-02 3.00E-02 3.81E-02 3.00E-02 4.67E-09 3.71E-09 4.71E-09 3.71E-09 Nd-147 2.14E-02 1.99E-02 2.59E-02 2.09E-02 1.38E-08 1.28E-08 1.67E-08 1.35E-08 Pm-147 2.14E-02 1.99E-02 2.59E-02 2.09E-02 1.36E-17 1.27E-17 1.65E-17 1.33E-17 Pm-149 1.04E-02 1.24E-02 1.63E-02 1.46E-02 2.08E-08 2.48E-08 3.26E-08 2.92E-08 Pm-151 4.12E-03 7.85E-03 7.99E-03 8.01E-03 8.72E-09 1.66E-08 1.69E-08 1.70E-08 Sm-153 1.67E-03 4.26E-03 4.15E-03 3.92E-03 3.38E-09 8.61E-09 8.39E-09 7.93E-09 Eu-155 3.95E-04 2.09E-03 1.42E-03 1.55E-03 1.75E-12 9.26E-12 6.29E-12 6.87E-12 Sm-156 2.03E-04 1.53E-03 7.60E-04 1.14E-03 1.21E-10 9.10E-10 4.52E-10 6.78E-10 Eu-156 9.72E-11 7.33E-10 3.64E-10 5.46E-10 Eu-157 1.06E-04 1.06E-03 4.14E-04 8.03E-04 1.50E-10 1.50E-09 5.84E-10 1.13E-09 Gd-159 3.01E-05 3.85E-04 8.62E-05 2.60E-04 5.21E-11 6.66E-10 1.49E-10 4.50E-10 U-237 1.50E-01 1.50E-01 1.50E-01 1.50E-01 1.45E-07 1.45E-07 1.45E-07 1.45E-07 Np-239 3.00E-01 3.00E-01 3.00E-01 3.00E-01 4.30E-07 4.30E-07 4.30E-07 4.30E-07
aSource for fission yields: England and Rider (1994). Activities after 2 days of decay are calculated as described in text, using specific activities and mass-chain decay relationships provided in Tables A.1 and A.2.
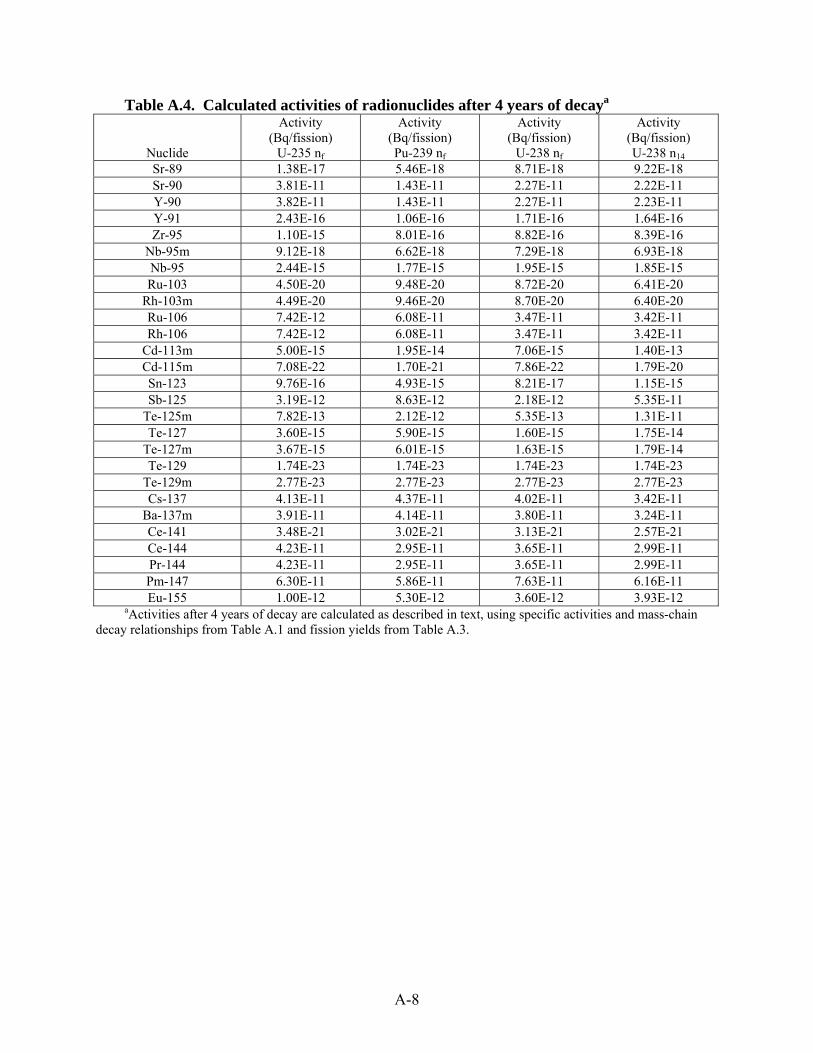
A-8
Table A.4. Calculated activities of radionuclides after 4 years of decaya
Nuclide
Activity (Bq/fission)
U-235 nf
Activity (Bq/fission) Pu-239 nf
Activity (Bq/fission)
U-238 nf
Activity (Bq/fission) U-238 n14
Sr-89 1.38E-17 5.46E-18 8.71E-18 9.22E-18 Sr-90 3.81E-11 1.43E-11 2.27E-11 2.22E-11 Y-90 3.82E-11 1.43E-11 2.27E-11 2.23E-11 Y-91 2.43E-16 1.06E-16 1.71E-16 1.64E-16 Zr-95 1.10E-15 8.01E-16 8.82E-16 8.39E-16
Nb-95m 9.12E-18 6.62E-18 7.29E-18 6.93E-18 Nb-95 2.44E-15 1.77E-15 1.95E-15 1.85E-15 Ru-103 4.50E-20 9.48E-20 8.72E-20 6.41E-20
Rh-103m 4.49E-20 9.46E-20 8.70E-20 6.40E-20 Ru-106 7.42E-12 6.08E-11 3.47E-11 3.42E-11 Rh-106 7.42E-12 6.08E-11 3.47E-11 3.42E-11
Cd-113m 5.00E-15 1.95E-14 7.06E-15 1.40E-13 Cd-115m 7.08E-22 1.70E-21 7.86E-22 1.79E-20 Sn-123 9.76E-16 4.93E-15 8.21E-17 1.15E-15 Sb-125 3.19E-12 8.63E-12 2.18E-12 5.35E-11
Te-125m 7.82E-13 2.12E-12 5.35E-13 1.31E-11 Te-127 3.60E-15 5.90E-15 1.60E-15 1.75E-14
Te-127m 3.67E-15 6.01E-15 1.63E-15 1.79E-14 Te-129 1.74E-23 1.74E-23 1.74E-23 1.74E-23
Te-129m 2.77E-23 2.77E-23 2.77E-23 2.77E-23 Cs-137 4.13E-11 4.37E-11 4.02E-11 3.42E-11
Ba-137m 3.91E-11 4.14E-11 3.80E-11 3.24E-11 Ce-141 3.48E-21 3.02E-21 3.13E-21 2.57E-21 Ce-144 4.23E-11 2.95E-11 3.65E-11 2.99E-11 Pr-144 4.23E-11 2.95E-11 3.65E-11 2.99E-11 Pm-147 6.30E-11 5.86E-11 7.63E-11 6.16E-11 Eu-155 1.00E-12 5.30E-12 3.60E-12 3.93E-12
aActivities after 4 years of decay are calculated as described in text, using specific activities and mass-chain decay relationships from Table A.1 and fission yields from Table A.3.
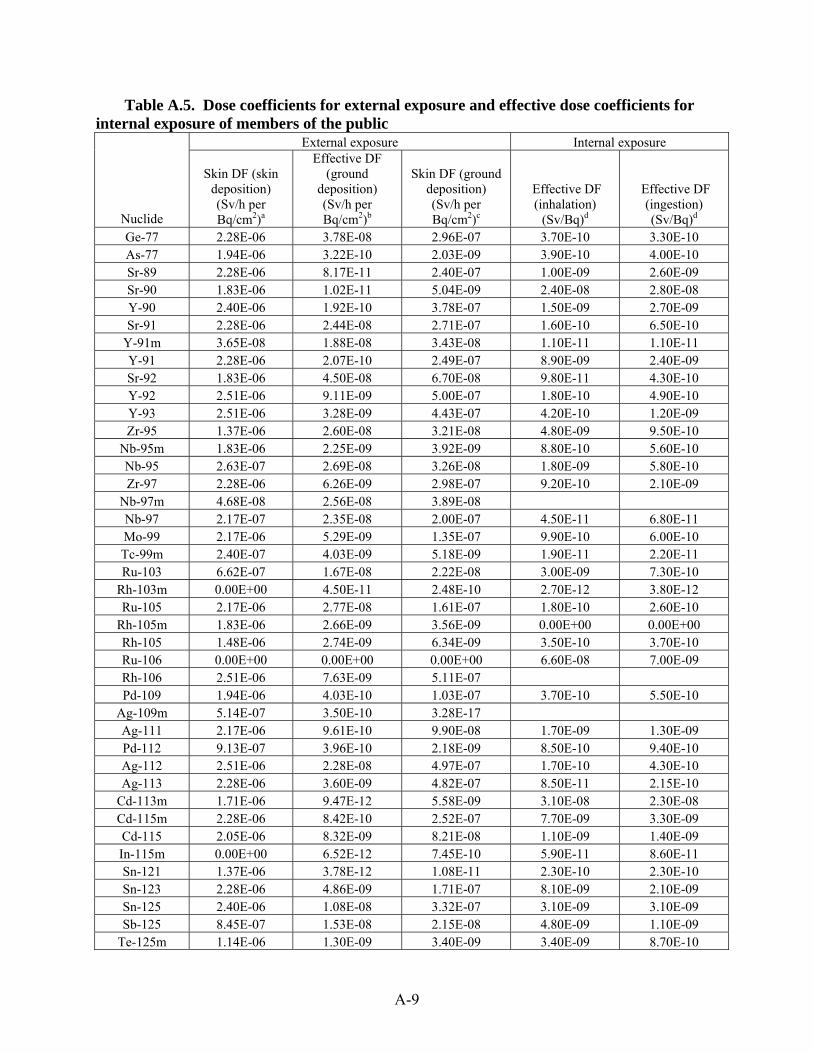
A-9
Table A.5. Dose coefficients for external exposure and effective dose coefficients for internal exposure of members of the public
External exposure Internal exposure
Nuclide
Skin DF (skin deposition) (Sv/h per Bq/cm2)a
Effective DF (ground
deposition) (Sv/h per Bq/cm2)b
Skin DF (ground deposition) (Sv/h per Bq/cm2)c
Effective DF (inhalation)
(Sv/Bq)d
Effective DF (ingestion) (Sv/Bq)d
Ge-77 2.28E-06 3.78E-08 2.96E-07 3.70E-10 3.30E-10 As-77 1.94E-06 3.22E-10 2.03E-09 3.90E-10 4.00E-10 Sr-89 2.28E-06 8.17E-11 2.40E-07 1.00E-09 2.60E-09 Sr-90 1.83E-06 1.02E-11 5.04E-09 2.40E-08 2.80E-08 Y-90 2.40E-06 1.92E-10 3.78E-07 1.50E-09 2.70E-09 Sr-91 2.28E-06 2.44E-08 2.71E-07 1.60E-10 6.50E-10
Y-91m 3.65E-08 1.88E-08 3.43E-08 1.10E-11 1.10E-11 Y-91 2.28E-06 2.07E-10 2.49E-07 8.90E-09 2.40E-09 Sr-92 1.83E-06 4.50E-08 6.70E-08 9.80E-11 4.30E-10 Y-92 2.51E-06 9.11E-09 5.00E-07 1.80E-10 4.90E-10 Y-93 2.51E-06 3.28E-09 4.43E-07 4.20E-10 1.20E-09 Zr-95 1.37E-06 2.60E-08 3.21E-08 4.80E-09 9.50E-10
Nb-95m 1.83E-06 2.25E-09 3.92E-09 8.80E-10 5.60E-10 Nb-95 2.63E-07 2.69E-08 3.26E-08 1.80E-09 5.80E-10 Zr-97 2.28E-06 6.26E-09 2.98E-07 9.20E-10 2.10E-09
Nb-97m 4.68E-08 2.56E-08 3.89E-08 Nb-97 2.17E-07 2.35E-08 2.00E-07 4.50E-11 6.80E-11 Mo-99 2.17E-06 5.29E-09 1.35E-07 9.90E-10 6.00E-10 Tc-99m 2.40E-07 4.03E-09 5.18E-09 1.90E-11 2.20E-11 Ru-103 6.62E-07 1.67E-08 2.22E-08 3.00E-09 7.30E-10
Rh-103m 0.00E+00 4.50E-11 2.48E-10 2.70E-12 3.80E-12 Ru-105 2.17E-06 2.77E-08 1.61E-07 1.80E-10 2.60E-10
Rh-105m 1.83E-06 2.66E-09 3.56E-09 0.00E+00 0.00E+00 Rh-105 1.48E-06 2.74E-09 6.34E-09 3.50E-10 3.70E-10 Ru-106 0.00E+00 0.00E+00 0.00E+00 6.60E-08 7.00E-09 Rh-106 2.51E-06 7.63E-09 5.11E-07 Pd-109 1.94E-06 4.03E-10 1.03E-07 3.70E-10 5.50E-10
Ag-109m 5.14E-07 3.50E-10 3.28E-17 Ag-111 2.17E-06 9.61E-10 9.90E-08 1.70E-09 1.30E-09 Pd-112 9.13E-07 3.96E-10 2.18E-09 8.50E-10 9.40E-10 Ag-112 2.51E-06 2.28E-08 4.97E-07 1.70E-10 4.30E-10 Ag-113 2.28E-06 3.60E-09 4.82E-07 8.50E-11 2.15E-10
Cd-113m 1.71E-06 9.47E-12 5.58E-09 3.10E-08 2.30E-08 Cd-115m 2.28E-06 8.42E-10 2.52E-07 7.70E-09 3.30E-09 Cd-115 2.05E-06 8.32E-09 8.21E-08 1.10E-09 1.40E-09 In-115m 0.00E+00 6.52E-12 7.45E-10 5.90E-11 8.60E-11 Sn-121 1.37E-06 3.78E-12 1.08E-11 2.30E-10 2.30E-10 Sn-123 2.28E-06 4.86E-09 1.71E-07 8.10E-09 2.10E-09 Sn-125 2.40E-06 1.08E-08 3.32E-07 3.10E-09 3.10E-09 Sb-125 8.45E-07 1.53E-08 2.15E-08 4.80E-09 1.10E-09
Te-125m 1.14E-06 1.30E-09 3.40E-09 3.40E-09 8.70E-10
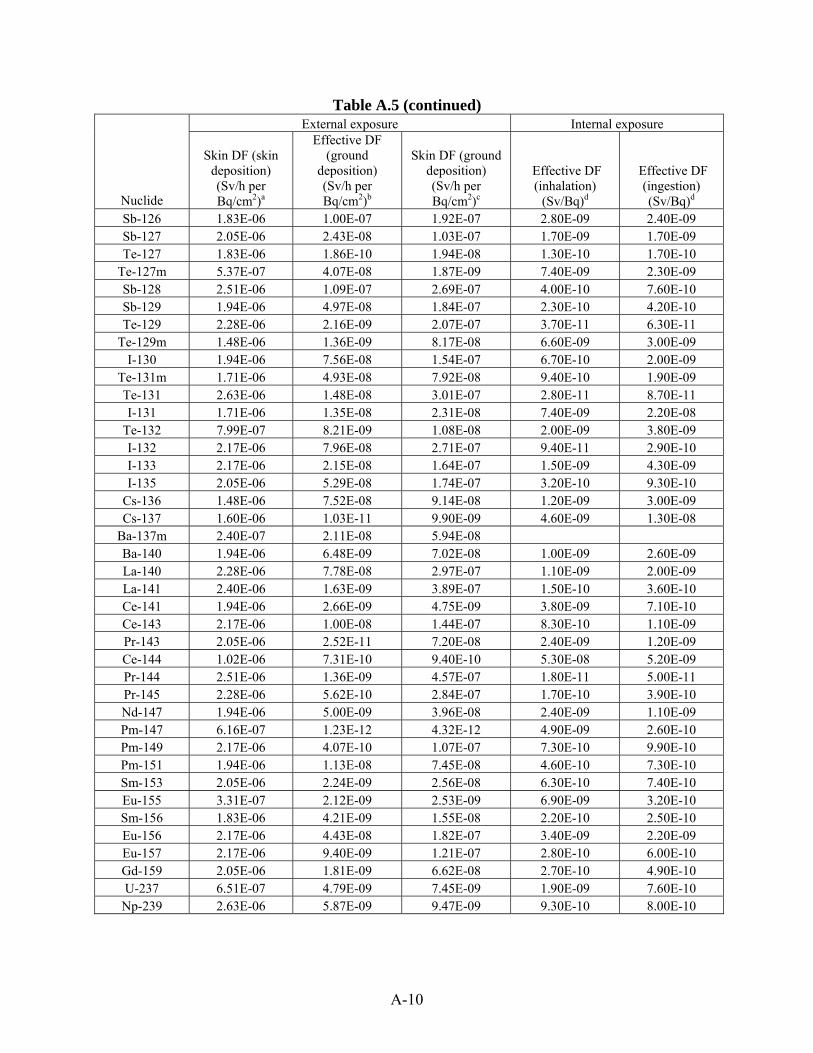
A-10
Table A.5 (continued) External exposure Internal exposure
Nuclide
Skin DF (skin deposition) (Sv/h per Bq/cm2)a
Effective DF (ground
deposition) (Sv/h per Bq/cm2)b
Skin DF (ground deposition) (Sv/h per Bq/cm2)c
Effective DF (inhalation)
(Sv/Bq)d
Effective DF (ingestion) (Sv/Bq)d
Sb-126 1.83E-06 1.00E-07 1.92E-07 2.80E-09 2.40E-09 Sb-127 2.05E-06 2.43E-08 1.03E-07 1.70E-09 1.70E-09 Te-127 1.83E-06 1.86E-10 1.94E-08 1.30E-10 1.70E-10
Te-127m 5.37E-07 4.07E-08 1.87E-09 7.40E-09 2.30E-09 Sb-128 2.51E-06 1.09E-07 2.69E-07 4.00E-10 7.60E-10 Sb-129 1.94E-06 4.97E-08 1.84E-07 2.30E-10 4.20E-10 Te-129 2.28E-06 2.16E-09 2.07E-07 3.70E-11 6.30E-11
Te-129m 1.48E-06 1.36E-09 8.17E-08 6.60E-09 3.00E-09 I-130 1.94E-06 7.56E-08 1.54E-07 6.70E-10 2.00E-09
Te-131m 1.71E-06 4.93E-08 7.92E-08 9.40E-10 1.90E-09 Te-131 2.63E-06 1.48E-08 3.01E-07 2.80E-11 8.70E-11 I-131 1.71E-06 1.35E-08 2.31E-08 7.40E-09 2.20E-08
Te-132 7.99E-07 8.21E-09 1.08E-08 2.00E-09 3.80E-09 I-132 2.17E-06 7.96E-08 2.71E-07 9.40E-11 2.90E-10 I-133 2.17E-06 2.15E-08 1.64E-07 1.50E-09 4.30E-09 I-135 2.05E-06 5.29E-08 1.74E-07 3.20E-10 9.30E-10
Cs-136 1.48E-06 7.52E-08 9.14E-08 1.20E-09 3.00E-09 Cs-137 1.60E-06 1.03E-11 9.90E-09 4.60E-09 1.30E-08
Ba-137m 2.40E-07 2.11E-08 5.94E-08 Ba-140 1.94E-06 6.48E-09 7.02E-08 1.00E-09 2.60E-09 La-140 2.28E-06 7.78E-08 2.97E-07 1.10E-09 2.00E-09 La-141 2.40E-06 1.63E-09 3.89E-07 1.50E-10 3.60E-10 Ce-141 1.94E-06 2.66E-09 4.75E-09 3.80E-09 7.10E-10 Ce-143 2.17E-06 1.00E-08 1.44E-07 8.30E-10 1.10E-09 Pr-143 2.05E-06 2.52E-11 7.20E-08 2.40E-09 1.20E-09 Ce-144 1.02E-06 7.31E-10 9.40E-10 5.30E-08 5.20E-09 Pr-144 2.51E-06 1.36E-09 4.57E-07 1.80E-11 5.00E-11 Pr-145 2.28E-06 5.62E-10 2.84E-07 1.70E-10 3.90E-10 Nd-147 1.94E-06 5.00E-09 3.96E-08 2.40E-09 1.10E-09 Pm-147 6.16E-07 1.23E-12 4.32E-12 4.90E-09 2.60E-10 Pm-149 2.17E-06 4.07E-10 1.07E-07 7.30E-10 9.90E-10 Pm-151 1.94E-06 1.13E-08 7.45E-08 4.60E-10 7.30E-10 Sm-153 2.05E-06 2.24E-09 2.56E-08 6.30E-10 7.40E-10 Eu-155 3.31E-07 2.12E-09 2.53E-09 6.90E-09 3.20E-10 Sm-156 1.83E-06 4.21E-09 1.55E-08 2.20E-10 2.50E-10 Eu-156 2.17E-06 4.43E-08 1.82E-07 3.40E-09 2.20E-09 Eu-157 2.17E-06 9.40E-09 1.21E-07 2.80E-10 6.00E-10 Gd-159 2.05E-06 1.81E-09 6.62E-08 2.70E-10 4.90E-10 U-237 6.51E-07 4.79E-09 7.45E-09 1.90E-09 7.60E-10 Np-239 2.63E-06 5.87E-09 9.47E-09 9.30E-10 8.00E-10
A-11
Footnotes to Table A.5______________________________ aDose coefficient for exposure of skin to electrons emitted by radionuclides deposited on surface of skin
obtained from Kocher and Eckerman (1987). bEffective dose coefficient for exposure to photons emitted by radionuclides deposited on ground surface
obtained from Eckerman and Ryman (1993). cDose coefficient for exposure of skin to electrons emitted by radionuclides deposited on ground surface
obtained from Eckerman and Ryman (1993). dEffective dose coefficient obtained from ICRP (2002). No entry means value is not calculated by ICRP due to
short half-life of radionuclide; contributions to dose following intake of longer-lived parent radionuclide are taken into account in dose coefficient for parent.
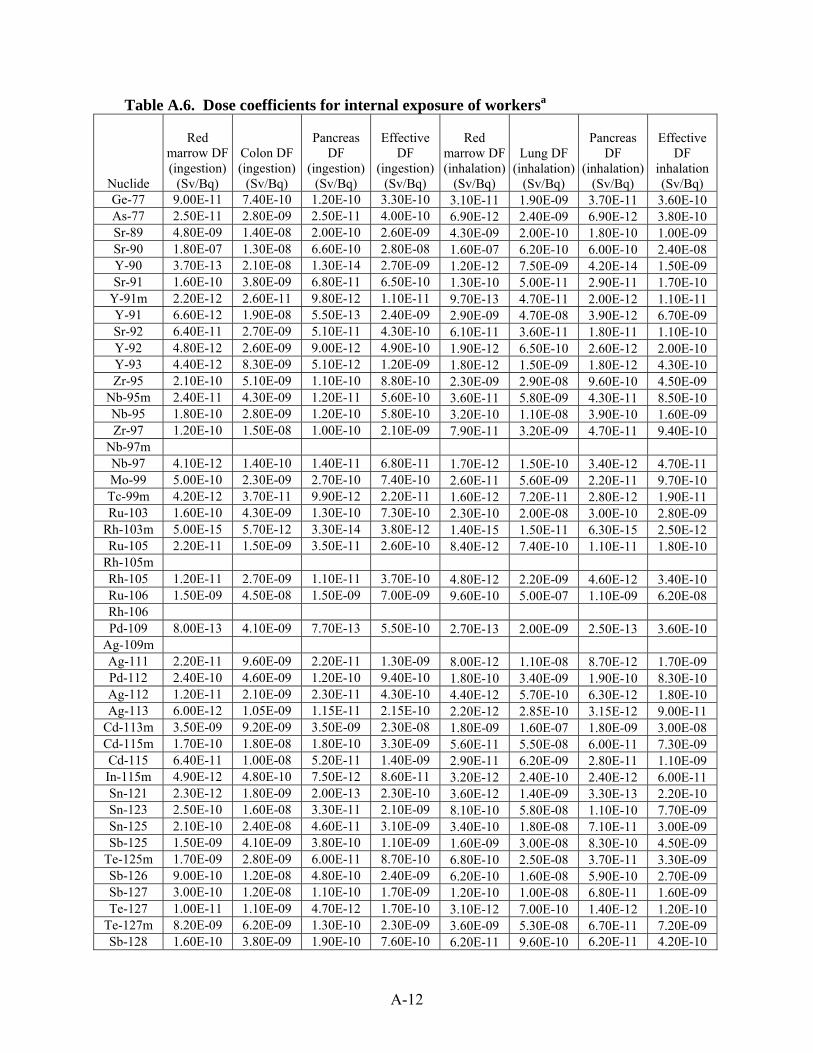
A-12
Table A.6. Dose coefficients for internal exposure of workersa
Nuclide
Red
marrow DF (ingestion)
(Sv/Bq)
Colon DF (ingestion)
(Sv/Bq)
Pancreas
DF (ingestion)
(Sv/Bq)
Effective
DF (ingestion)
(Sv/Bq)
Red marrow DF (inhalation)
(Sv/Bq)
Lung DF (inhalation)
(Sv/Bq)
Pancreas DF
(inhalation) (Sv/Bq)
Effective DF
inhalation (Sv/Bq)
Ge-77 9.00E-11 7.40E-10 1.20E-10 3.30E-10 3.10E-11 1.90E-09 3.70E-11 3.60E-10 As-77 2.50E-11 2.80E-09 2.50E-11 4.00E-10 6.90E-12 2.40E-09 6.90E-12 3.80E-10 Sr-89 4.80E-09 1.40E-08 2.00E-10 2.60E-09 4.30E-09 2.00E-10 1.80E-10 1.00E-09 Sr-90 1.80E-07 1.30E-08 6.60E-10 2.80E-08 1.60E-07 6.20E-10 6.00E-10 2.40E-08 Y-90 3.70E-13 2.10E-08 1.30E-14 2.70E-09 1.20E-12 7.50E-09 4.20E-14 1.50E-09 Sr-91 1.60E-10 3.80E-09 6.80E-11 6.50E-10 1.30E-10 5.00E-11 2.90E-11 1.70E-10
Y-91m 2.20E-12 2.60E-11 9.80E-12 1.10E-11 9.70E-13 4.70E-11 2.00E-12 1.10E-11 Y-91 6.60E-12 1.90E-08 5.50E-13 2.40E-09 2.90E-09 4.70E-08 3.90E-12 6.70E-09 Sr-92 6.40E-11 2.70E-09 5.10E-11 4.30E-10 6.10E-11 3.60E-11 1.80E-11 1.10E-10 Y-92 4.80E-12 2.60E-09 9.00E-12 4.90E-10 1.90E-12 6.50E-10 2.60E-12 2.00E-10 Y-93 4.40E-12 8.30E-09 5.10E-12 1.20E-09 1.80E-12 1.50E-09 1.80E-12 4.30E-10 Zr-95 2.10E-10 5.10E-09 1.10E-10 8.80E-10 2.30E-09 2.90E-08 9.60E-10 4.50E-09
Nb-95m 2.40E-11 4.30E-09 1.20E-11 5.60E-10 3.60E-11 5.80E-09 4.30E-11 8.50E-10 Nb-95 1.80E-10 2.80E-09 1.20E-10 5.80E-10 3.20E-10 1.10E-08 3.90E-10 1.60E-09 Zr-97 1.20E-10 1.50E-08 1.00E-10 2.10E-09 7.90E-11 3.20E-09 4.70E-11 9.40E-10
Nb-97m Nb-97 4.10E-12 1.40E-10 1.40E-11 6.80E-11 1.70E-12 1.50E-10 3.40E-12 4.70E-11 Mo-99 5.00E-10 2.30E-09 2.70E-10 7.40E-10 2.60E-11 5.60E-09 2.20E-11 9.70E-10 Tc-99m 4.20E-12 3.70E-11 9.90E-12 2.20E-11 1.60E-12 7.20E-11 2.80E-12 1.90E-11 Ru-103 1.60E-10 4.30E-09 1.30E-10 7.30E-10 2.30E-10 2.00E-08 3.00E-10 2.80E-09
Rh-103m 5.00E-15 5.70E-12 3.30E-14 3.80E-12 1.40E-15 1.50E-11 6.30E-15 2.50E-12 Ru-105 2.20E-11 1.50E-09 3.50E-11 2.60E-10 8.40E-12 7.40E-10 1.10E-11 1.80E-10
Rh-105m Rh-105 1.20E-11 2.70E-09 1.10E-11 3.70E-10 4.80E-12 2.20E-09 4.60E-12 3.40E-10 Ru-106 1.50E-09 4.50E-08 1.50E-09 7.00E-09 9.60E-10 5.00E-07 1.10E-09 6.20E-08 Rh-106 Pd-109 8.00E-13 4.10E-09 7.70E-13 5.50E-10 2.70E-13 2.00E-09 2.50E-13 3.60E-10
Ag-109m Ag-111 2.20E-11 9.60E-09 2.20E-11 1.30E-09 8.00E-12 1.10E-08 8.70E-12 1.70E-09 Pd-112 2.40E-10 4.60E-09 1.20E-10 9.40E-10 1.80E-10 3.40E-09 1.90E-10 8.30E-10 Ag-112 1.20E-11 2.10E-09 2.30E-11 4.30E-10 4.40E-12 5.70E-10 6.30E-12 1.80E-10 Ag-113 6.00E-12 1.05E-09 1.15E-11 2.15E-10 2.20E-12 2.85E-10 3.15E-12 9.00E-11
Cd-113m 3.50E-09 9.20E-09 3.50E-09 2.30E-08 1.80E-09 1.60E-07 1.80E-09 3.00E-08 Cd-115m 1.70E-10 1.80E-08 1.80E-10 3.30E-09 5.60E-11 5.50E-08 6.00E-11 7.30E-09 Cd-115 6.40E-11 1.00E-08 5.20E-11 1.40E-09 2.90E-11 6.20E-09 2.80E-11 1.10E-09 In-115m 4.90E-12 4.80E-10 7.50E-12 8.60E-11 3.20E-12 2.40E-10 2.40E-12 6.00E-11 Sn-121 2.30E-12 1.80E-09 2.00E-13 2.30E-10 3.60E-12 1.40E-09 3.30E-13 2.20E-10 Sn-123 2.50E-10 1.60E-08 3.30E-11 2.10E-09 8.10E-10 5.80E-08 1.10E-10 7.70E-09 Sn-125 2.10E-10 2.40E-08 4.60E-11 3.10E-09 3.40E-10 1.80E-08 7.10E-11 3.00E-09 Sb-125 1.50E-09 4.10E-09 3.80E-10 1.10E-09 1.60E-09 3.00E-08 8.30E-10 4.50E-09
Te-125m 1.70E-09 2.80E-09 6.00E-11 8.70E-10 6.80E-10 2.50E-08 3.70E-11 3.30E-09 Sb-126 9.00E-10 1.20E-08 4.80E-10 2.40E-09 6.20E-10 1.60E-08 5.90E-10 2.70E-09 Sb-127 3.00E-10 1.20E-08 1.10E-10 1.70E-09 1.20E-10 1.00E-08 6.80E-11 1.60E-09 Te-127 1.00E-11 1.10E-09 4.70E-12 1.70E-10 3.10E-12 7.00E-10 1.40E-12 1.20E-10
Te-127m 8.20E-09 6.20E-09 1.30E-10 2.30E-09 3.60E-09 5.30E-08 6.70E-11 7.20E-09 Sb-128 1.60E-10 3.80E-09 1.90E-10 7.60E-10 6.20E-11 9.60E-10 6.20E-11 4.20E-10

A-13
Table A.6 (continued)
Nuclide
Red
marrow DF (ingestion)
(Sv/Bq)
Colon DF (ingestion)
(Sv/Bq)
Pancreas
DF (ingestion)
(Sv/Bq)
Effective
DF (ingestion)
(Sv/Bq)
Red marrow DF (inhalation)
(Sv/Bq)
Lung DF (inhalation)
(Sv/Bq)
Pancreas DF
(inhalation) (Sv/Bq)
Effective DF
(inhalation) (Sv/Bq)
Sb-129 4.20E-11 2.40E-09 6.00E-11 4.20E-10 1.70E-11 8.20E-10 2.40E-10 1.80E-11 Te-129 9.40E-13 1.20E-10 1.90E-12 6.30E-11 4.40E-13 1.40E-10 3.80E-11 5.70E-13
Te-129m 5.30E-09 1.40E-08 2.30E-10 3.00E-09 2.00E-09 4.50E-08 6.30E-09 1.10E-10 I-130 7.50E-11 1.20E-10 1.20E-10 2.00E-09 3.40E-11 5.60E-11 6.90E-10 3.00E-11
Te-131m 2.60E-10 5.90E-09 1.80E-10 1.90E-09 1.00E-10 4.30E-09 1.10E-09 8.00E-11 Te-131 1.10E-12 1.90E-11 5.30E-12 8.70E-11 5.50E-13 8.70E-11 3.80E-11 1.10E-12 I-131 1.00E-10 1.20E-10 6.10E-11 2.20E-08 3.80E-11 5.90E-11 7.60E-09 1.90E-11
Te-132 5.30E-10 1.30E-08 3.70E-10 3.70E-09 2.40E-10 9.50E-09 2.20E-09 2.20E-10 I-132 2.60E-11 4.60E-11 7.20E-11 2.90E-10 1.20E-11 3.50E-11 9.60E-11 1.50E-11 I-133 4.70E-11 1.10E-10 5.70E-11 4.30E-09 1.90E-11 4.20E-11 1.50E-09 1.60E-11 I-135 4.00E-11 7.30E-11 7.30E-11 9.30E-10 1.70E-11 4.00E-11 3.30E-10 1.80E-11
Cs-136 2.80E-09 3.40E-09 3.40E-09 3.00E-09 1.00E-09 9.80E-10 1.30E-09 1.20E-09 Cs-137 1.30E-08 1.50E-08 1.40E-08 1.30E-08 4.50E-09 4.40E-09 4.80E-09 5.00E-09
Ba-137m Ba-140 7.10E-10 1.70E-08 1.40E-10 2.50E-09 1.40E-09 1.50E-10 1.00E-09 1.60E-10 La-140 2.60E-10 1.30E-08 2.10E-10 2.00E-09 1.40E-10 3.70E-09 1.10E-09 1.20E-10 La-141 9.40E-13 2.00E-09 1.60E-12 3.60E-10 3.00E-12 6.20E-10 1.50E-10 1.50E-12 Ce-141 1.90E-11 5.50E-09 1.10E-11 7.10E-10 3.50E-11 2.80E-08 3.60E-09 4.20E-11 Ce-143 3.50E-11 8.30E-09 2.80E-11 1.10E-09 1.50E-11 4.60E-09 8.10E-10 1.40E-11 Pr-143 1.70E-12 9.30E-09 1.10E-14 1.20E-09 2.00E-12 1.70E-08 2.30E-09 1.30E-14 Ce-144 1.90E-10 4.20E-08 1.90E-11 5.20E-09 1.10E-09 3.90E-07 4.90E-08 2.00E-10 Pr-144 3.40E-14 1.00E-11 2.40E-13 5.00E-11 1.60E-14 5.30E-11 1.90E-11 4.10E-14 Pr-145 4.60E-13 2.60E-09 6.40E-13 3.90E-10 1.90E-13 7.10E-10 1.70E-10 2.10E-13 Nd-147 3.10E-11 8.20E-09 1.80E-11 1.10E-09 3.30E-11 1.70E-08 2.30E-09 3.20E-11 Pm-147 3.50E-11 2.00E-09 3.30E-15 2.60E-10 3.70E-10 3.60E-08 4.60E-09 5.40E-14 Pm-149 2.10E-12 7.80E-09 1.20E-12 9.90E-10 1.20E-12 4.10E-09 7.20E-10 7.20E-10 Pm-151 3.60E-11 5.20E-09 3.00E-11 7.30E-10 1.50E-11 2.40E-09 4.50E-10 1.40E-11 Sm-153 9.50E-12 5.70E-09 7.60E-12 7.40E-10 2.30E-11 3.70E-09 6.10E-10 5.20E-12 Eu-155 7.00E-11 2.20E-09 1.70E-11 3.20E-10 9.80E-09 1.70E-08 6.50E-09 1.40E-09 Sm-156 1.10E-11 1.70E-09 1.00E-11 2.50E-10 2.10E-11 1.20E-09 2.10E-10 1.20E-11 Eu-156 2.30E-10 1.50E-08 1.50E-10 2.20E-09 6.10E-10 2.10E-08 3.30E-09 3.60E-10 Eu-157 2.10E-11 4.30E-09 2.10E-11 6.00E-10 1.40E-11 1.30E-09 3.20E-10 8.70E-12 Gd-159 4.60E-12 3.70E-09 4.40E-12 4.90E-10 8.80E-12 1.40E-09 2.70E-10 2.20E-12 U-237 3.70E-11 5.70E-09 1.90E-11 7.70E-10 1.90E-11 1.30E-08 1.80E-09 2.20E-11 Np-239 2.70E-11 6.00E-09 2.00E-11 8.00E-10 4.50E-11 5.90E-09 9.00E-10 1.40E-11
aDose coefficients for specific organs or tissues and effective dose coefficients obtained from ICRP (2002). No entry means value is not calculated by ICRP due to short half-life of radionuclide; contributions to dose following intake of longer-lived parent radionuclide are taken into account in dose coefficient for parent.
DISTRIBUTION LIST DTRA-TR-07-5
Additional copies are available at:
http://www.dtra.mil/rd/programs/nuclear_personnel/pubs.cfm
DEPARTMENT OF DEFENSE Defense Technical Information Center 8725 John J. Kingman Road, Suite 0944 Fort Belvoir, VA 22060-6201 ATTN: DTIC/OCA Defense Threat Reduction Agency 8725 John J. Kingman Road, RD-NTSN Fort Belvoir, VA 22060-6201 DEPARTMENT OF VETERANS AFFAIRS Department of Veterans Affairs Chief, Public Health & Environmental Hazards VA Central Office (13) 810 Vermont Ave., NW Washington, DC 20420 FEDERAL AGENCY ADVISORY BOARDS Veterans’ Advisory Board on Dose Reconstruction 7910 Woodmont Avenue, Suite 400 Bethesda, MD 20814-3095 Advisory Board on Radiation and Worker Health 4676 Columbia Parkway, MS: C-46 Cincinnati, OH 45226 DEPARTMENT OF DEFENSE CONTRACTORS ITT Industries ITT Systems Corporation 1680 Texas Street, SE Kirtland AFB, NM 87117-5669 ATTN: DTRIAC ATTN: DARE
DL-11
L3 Communications 11410 Isaac Newton Square North, Suite 103 Reston, VA 20190-5005 SAIC 8301 Greensboro Drive, M/S E-5-5 McLean, VA 22102 Senes Oak Ridge, Inc. 102 Donner Drive Oak Ridge, TN 37830 Oak Ridge Associated Universities 210 Badger Avenue Oak Ridge, TN 37830 ATTN: Dr. Toohey
DL-22