Embed Size (px)
Citation preview
Form A2 – School Improvement Plan
Revised 8.2.2016
Principal: Toni Beckler Assistant Superintendent: Steve Flisk
School: Woodland Elementary Date: 2017-18
The School Improvement Plan priorities focus on three areas: reading, mathematics, and student behavior. The School Improvement Plan must include: (1) the utilization of MCAs as a data point for one or more goals; (2) articulated goals related to proficiency rate(s), growth, and achievement gap reduction, (3) student behavior; and, if applicable, (4) a graduation rate goal.
Guidelines
(1) The district will insert the baseline data prior to the scheduled site improvement meeting with the Research, Assessment and Accountability Department.
(2) The district will insert the basic and transformational goals at the start of school using the 2017-18 cohorts. Students enrolled for the 2017-18 school year make up each cohort.
(3) Basic goals represent reasonable student progress or improvement based on trends. Transformational goals represent the scores that are necessary to close the achievement gaps and are based on state expectations.
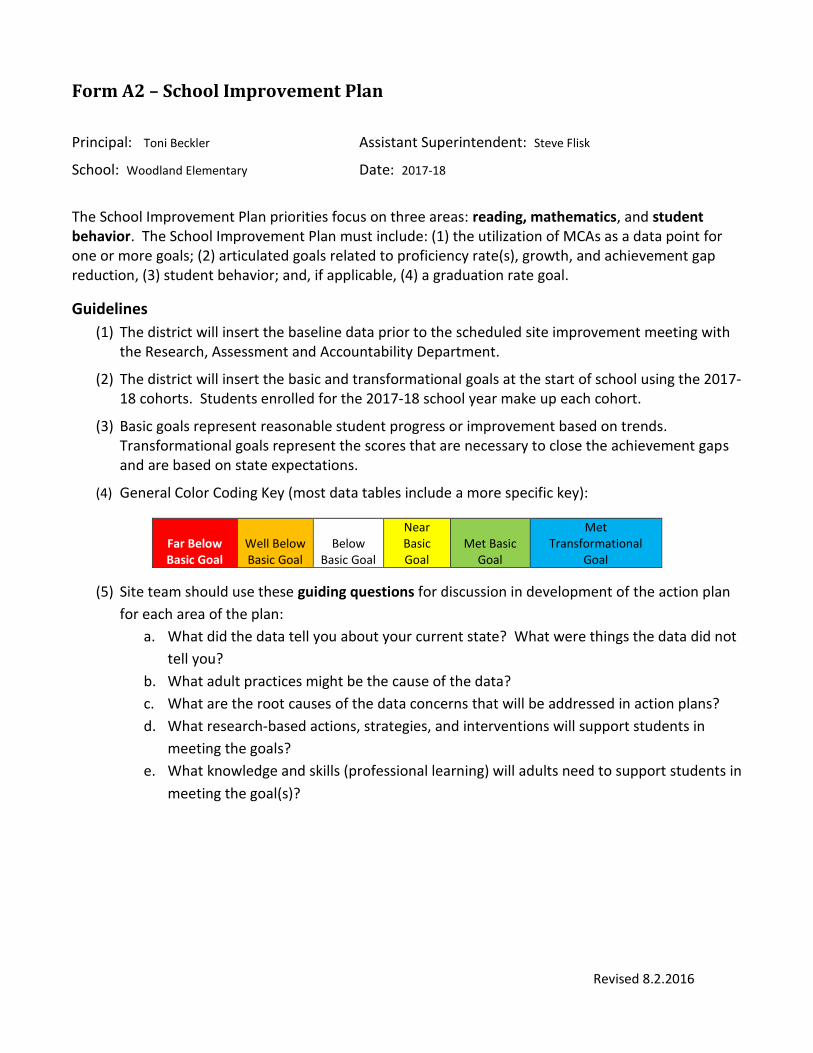
(4) General Color Coding Key (most data tables include a more specific key):
Far Below Basic Goal
Well Below Basic Goal
Below Basic Goal
Near Basic Goal
Met Basic Goal
Met Transformational
Goal
(5) Site team should use these guiding questions for discussion in development of the action plan
for each area of the plan:
a. What did the data tell you about your current state? What were things the data did not
tell you?
b. What adult practices might be the cause of the data?
c. What are the root causes of the data concerns that will be addressed in action plans?
d. What research-based actions, strategies, and interventions will support students in
meeting the goals?
e. What knowledge and skills (professional learning) will adults need to support students in
meeting the goal(s)?
Form A2 – School Improvement Plan
School: Woodland Elementary Date: 2017-18
Page 2 Revised 7.18.2017 revised 6/23/2015
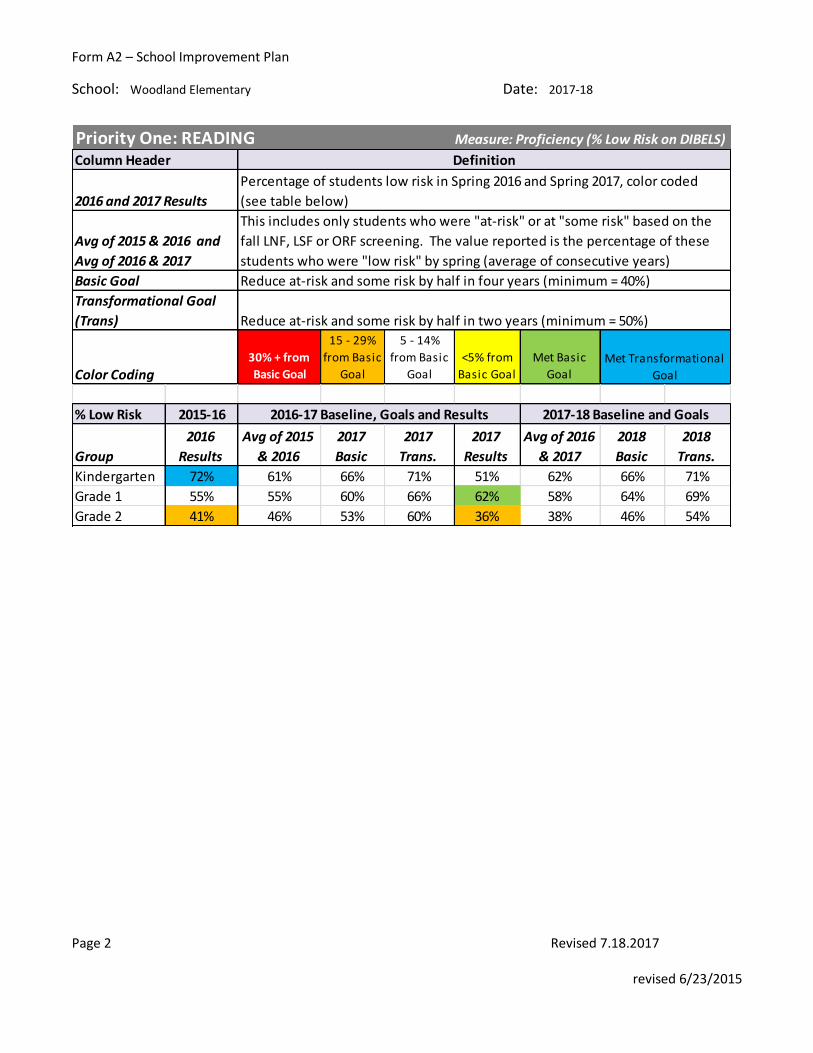
Priority One: READING Measure: Proficiency (% Low Risk on DIBELS)
Column Header
30% + from
Basic Goal
15 - 29%
from Basic
Goal
5 - 14%
from Basic
Goal
<5% from
Basic Goal
Met Basic
Goal
% Low Risk 2015-16
Group
2016
Results
Avg of 2015
& 2016
2017
Basic
2017
Trans.
2017
Results
Avg of 2016
& 2017
2018
Basic
2018
Trans.
Kindergarten 72% 61% 66% 71% 51% 62% 66% 71%
Grade 1 55% 55% 60% 66% 62% 58% 64% 69%
Grade 2 41% 46% 53% 60% 36% 38% 46% 54%
2016-17 Baseline, Goals and Results 2017-18 Baseline and Goals
Avg of 2015 & 2016 and
Avg of 2016 & 2017
Transformational Goal
(Trans) Reduce at-risk and some risk by half in two years (minimum = 50%)
Color CodingMet Transformational
Goal
Definition
2016 and 2017 Results
Percentage of students low risk in Spring 2016 and Spring 2017, color coded
(see table below)
This includes only students who were "at-risk" or at "some risk" based on the
fall LNF, LSF or ORF screening. The value reported is the percentage of these
students who were "low risk" by spring (average of consecutive years)
Basic Goal Reduce at-risk and some risk by half in four years (minimum = 40%)
Form A2 – School Improvement Plan
School: Woodland Elementary Date: 2017-18
Page 3 Revised 7.18.2017 revised 6/23/2015
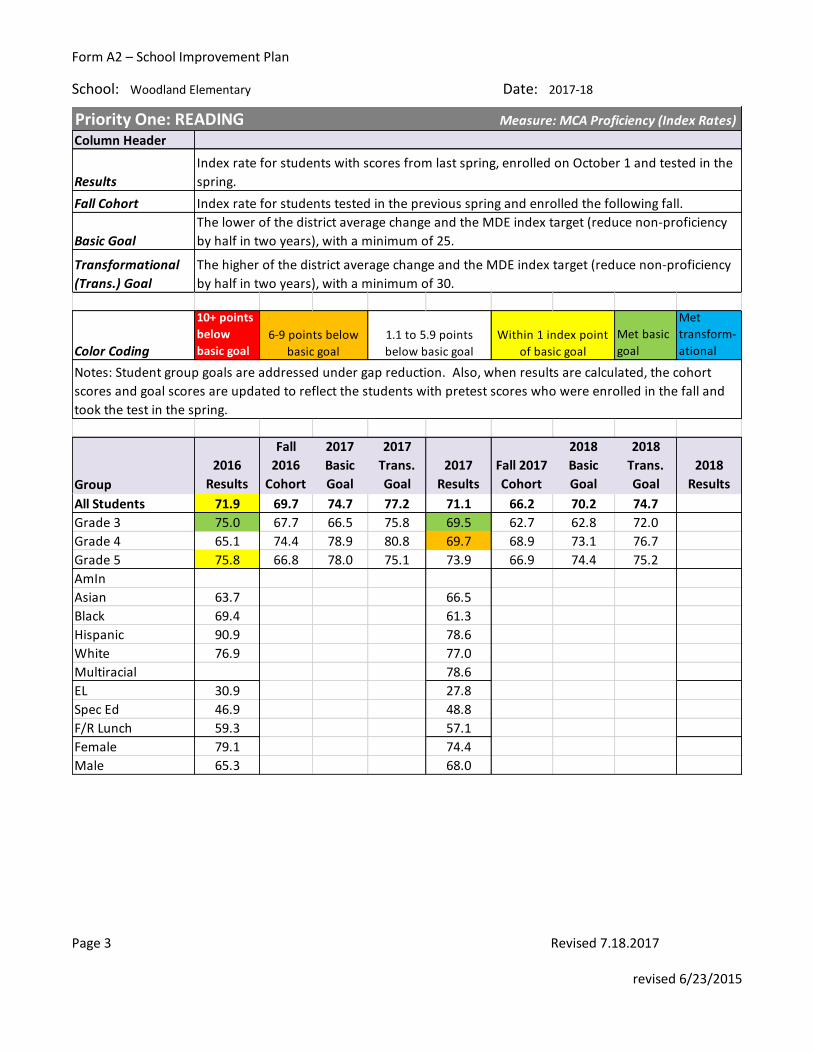
Priority One: READING Measure: MCA Proficiency (Index Rates)
Column Header
Results
Fall Cohort
Basic Goal
Transformational
(Trans.) Goal
Color Coding
10+ points
below
basic goal
Met basic
goal
Met
transform-
ational
Group
2016
Results
Fall
2016
Cohort
2017
Basic
Goal
2017
Trans.
Goal
2017
Results
Fall 2017
Cohort
2018
Basic
Goal
2018
Trans.
Goal
2018
Results
All Students 71.9 69.7 74.7 77.2 71.1 66.2 70.2 74.7
Grade 3 75.0 67.7 66.5 75.8 69.5 62.7 62.8 72.0
Grade 4 65.1 74.4 78.9 80.8 69.7 68.9 73.1 76.7
Grade 5 75.8 66.8 78.0 75.1 73.9 66.9 74.4 75.2
AmIn
Asian 63.7 66.5
Black 69.4 61.3
Hispanic 90.9 78.6
White 76.9 77.0
Multiracial 78.6
EL 30.9 27.8
Spec Ed 46.9 48.8
F/R Lunch 59.3 57.1
Female 79.1 74.4
Male 65.3 68.0
6-9 points below
basic goal
1.1 to 5.9 points
below basic goal
Within 1 index point
of basic goal
Notes: Student group goals are addressed under gap reduction. Also, when results are calculated, the cohort
scores and goal scores are updated to reflect the students with pretest scores who were enrolled in the fall and
took the test in the spring.
Index rate for students with scores from last spring, enrolled on October 1 and tested in the
spring.
Index rate for students tested in the previous spring and enrolled the following fall.
The lower of the district average change and the MDE index target (reduce non-proficiency
by half in two years), with a minimum of 25.
The higher of the district average change and the MDE index target (reduce non-proficiency
by half in two years), with a minimum of 30.
Form A2 – School Improvement Plan
School: Woodland Elementary Date: 2017-18
Page 4 Revised 7.18.2017 revised 6/23/2015
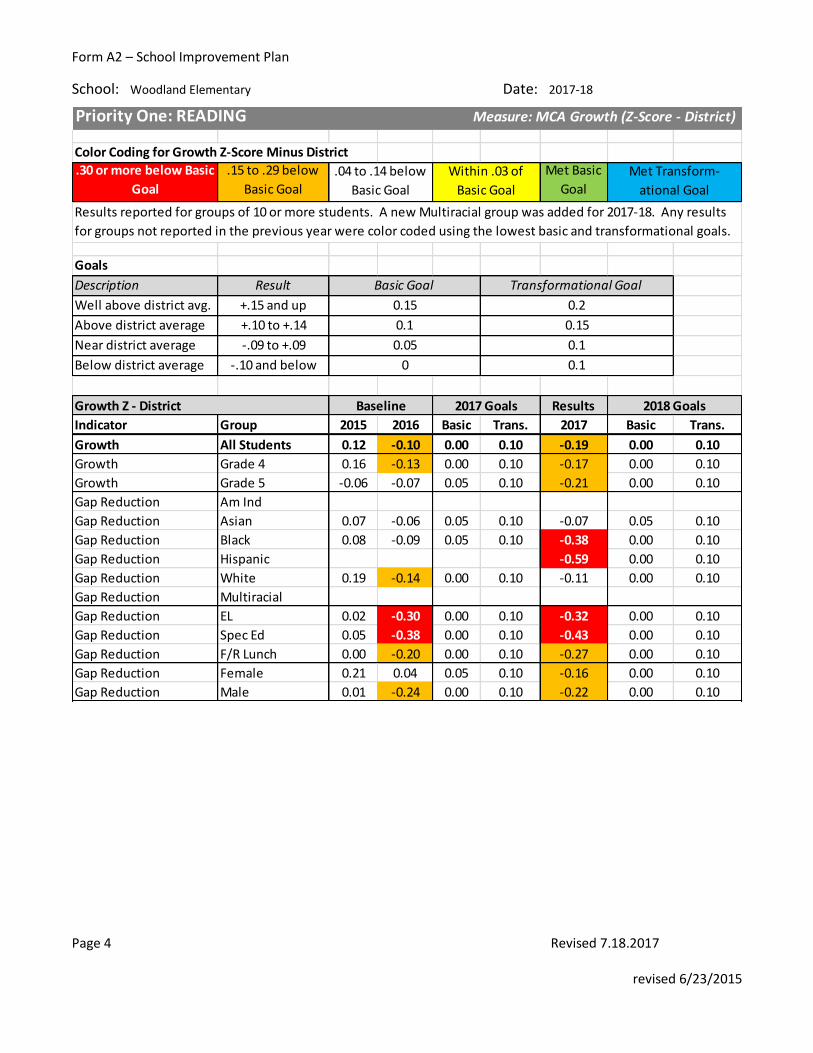
Priority One: READING Measure: MCA Growth (Z-Score - District)
Color Coding for Growth Z-Score Minus District
.30 or more below Basic
Goal
.15 to .29 below
Basic Goal
Met Basic
Goal
Goals
Description Result
Well above district avg. +.15 and up
Above district average +.10 to +.14
Near district average -.09 to +.09
Below district average -.10 and below
Growth Z - District Results
Indicator Group 2015 2016 Basic Trans. 2017 Basic Trans.
Growth All Students 0.12 -0.10 0.00 0.10 -0.19 0.00 0.10
Growth Grade 4 0.16 -0.13 0.00 0.10 -0.17 0.00 0.10
Growth Grade 5 -0.06 -0.07 0.05 0.10 -0.21 0.00 0.10
Gap Reduction Am Ind
Gap Reduction Asian 0.07 -0.06 0.05 0.10 -0.07 0.05 0.10
Gap Reduction Black 0.08 -0.09 0.05 0.10 -0.38 0.00 0.10
Gap Reduction Hispanic -0.59 0.00 0.10
Gap Reduction White 0.19 -0.14 0.00 0.10 -0.11 0.00 0.10
Gap Reduction Multiracial
Gap Reduction EL 0.02 -0.30 0.00 0.10 -0.32 0.00 0.10
Gap Reduction Spec Ed 0.05 -0.38 0.00 0.10 -0.43 0.00 0.10
Gap Reduction F/R Lunch 0.00 -0.20 0.00 0.10 -0.27 0.00 0.10
Gap Reduction Female 0.21 0.04 0.05 0.10 -0.16 0.00 0.10
Gap Reduction Male 0.01 -0.24 0.00 0.10 -0.22 0.00 0.10
0
2018 Goals
Met Transform-
ational Goal
Within .03 of
Basic Goal
.04 to .14 below
Basic Goal
2017 GoalsBaseline
Results reported for groups of 10 or more students. A new Multiracial group was added for 2017-18. Any results
for groups not reported in the previous year were color coded using the lowest basic and transformational goals.
Transformational Goal
0.2
0.15
0.1
0.1
Basic Goal
0.15
0.1
0.05
Form A2 – School Improvement Plan
School: Woodland Elementary Date: 2017-18
Page 5 Revised 7.18.2017 revised 6/23/2015
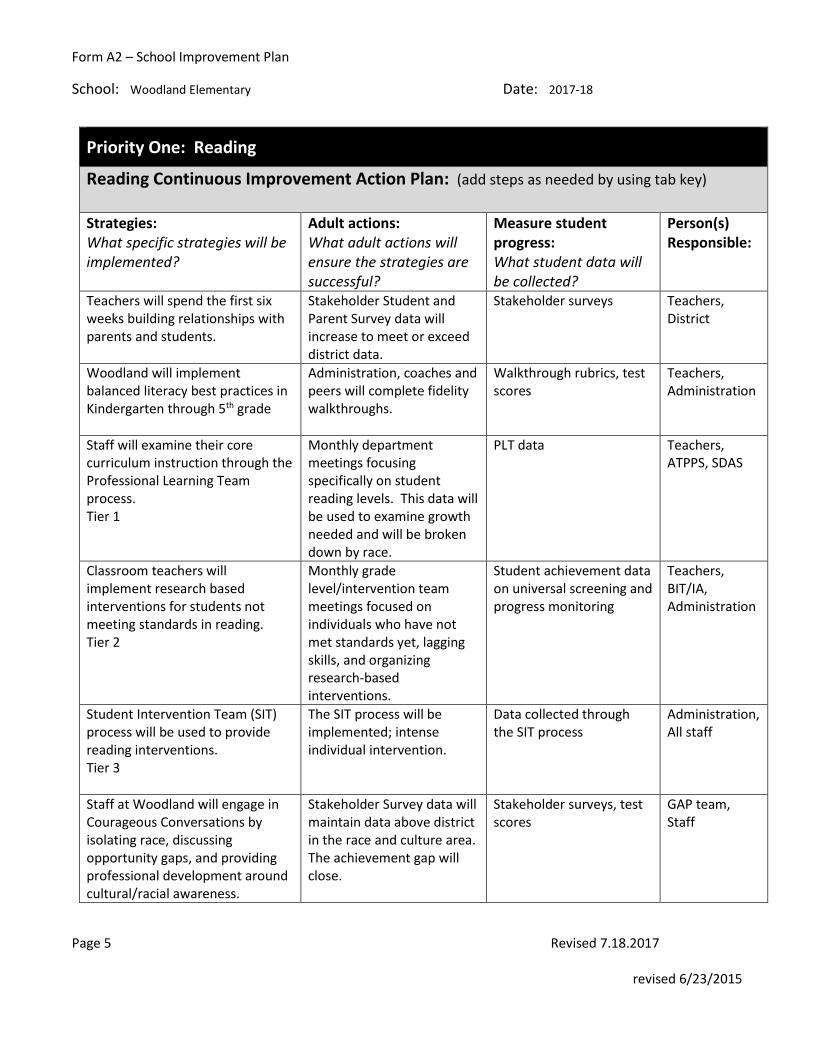
Priority One: Reading
Reading Continuous Improvement Action Plan: (add steps as needed by using tab key)
Strategies: What specific strategies will be implemented?
Adult actions: What adult actions will ensure the strategies are successful?
Measure student progress: What student data will be collected?
Person(s) Responsible:
Teachers will spend the first six weeks building relationships with parents and students.
Stakeholder Student and Parent Survey data will increase to meet or exceed district data.
Stakeholder surveys Teachers, District
Woodland will implement balanced literacy best practices in Kindergarten through 5th grade
Administration, coaches and peers will complete fidelity walkthroughs.
Walkthrough rubrics, test scores
Teachers, Administration
Staff will examine their core curriculum instruction through the Professional Learning Team process. Tier 1
Monthly department meetings focusing specifically on student reading levels. This data will be used to examine growth needed and will be broken down by race.
PLT data Teachers, ATPPS, SDAS
Classroom teachers will implement research based interventions for students not meeting standards in reading. Tier 2
Monthly grade level/intervention team meetings focused on individuals who have not met standards yet, lagging skills, and organizing research-based interventions.
Student achievement data on universal screening and progress monitoring
Teachers, BIT/IA, Administration
Student Intervention Team (SIT) process will be used to provide reading interventions. Tier 3
The SIT process will be implemented; intense individual intervention.
Data collected through the SIT process
Administration, All staff
Staff at Woodland will engage in Courageous Conversations by isolating race, discussing opportunity gaps, and providing professional development around cultural/racial awareness.
Stakeholder Survey data will maintain data above district in the race and culture area. The achievement gap will close.
Stakeholder surveys, test scores
GAP team, Staff
Form A2 – School Improvement Plan
School: Woodland Elementary Date: 2017-18
Page 6 Revised 7.18.2017 revised 6/23/2015
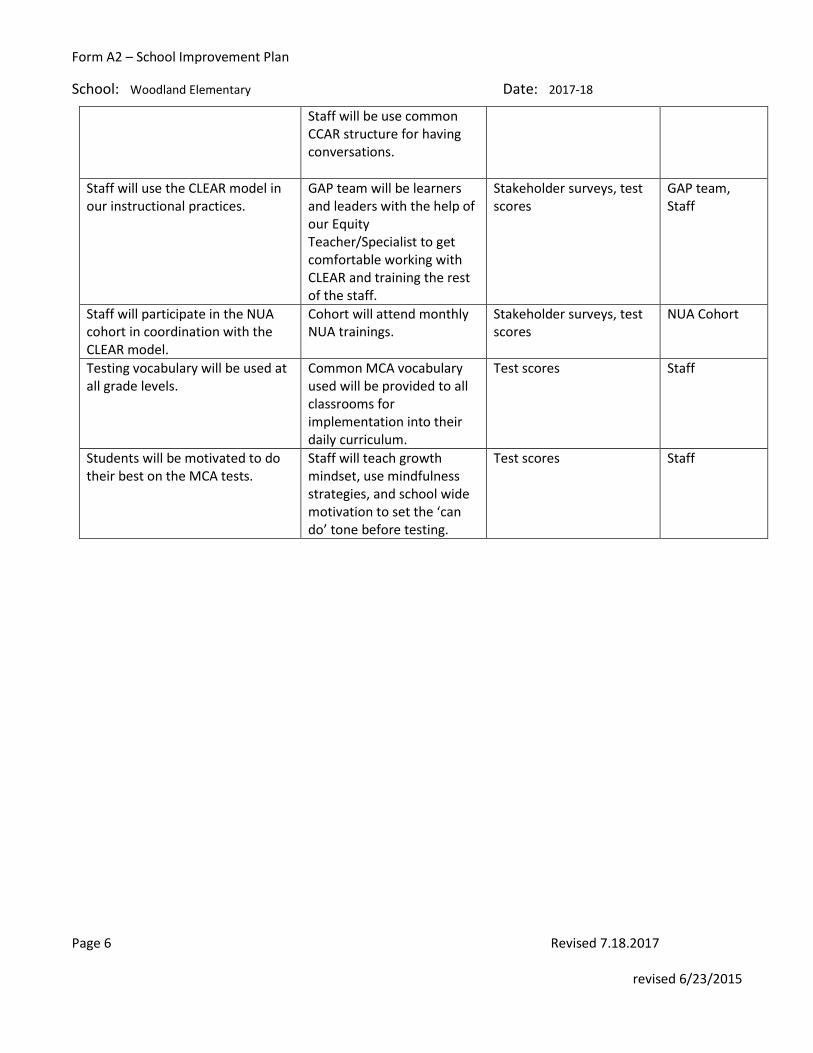
Staff will be use common CCAR structure for having conversations.
Staff will use the CLEAR model in our instructional practices.
GAP team will be learners and leaders with the help of our Equity Teacher/Specialist to get comfortable working with CLEAR and training the rest of the staff.
Stakeholder surveys, test scores
GAP team, Staff
Staff will participate in the NUA cohort in coordination with the CLEAR model.
Cohort will attend monthly NUA trainings.
Stakeholder surveys, test scores
NUA Cohort
Testing vocabulary will be used at all grade levels.
Common MCA vocabulary used will be provided to all classrooms for implementation into their daily curriculum.
Test scores Staff
Students will be motivated to do their best on the MCA tests.
Staff will teach growth mindset, use mindfulness strategies, and school wide motivation to set the ‘can do’ tone before testing.
Test scores Staff
Form A2 – School Improvement Plan
School: Woodland Elementary Date: 2017-18
Page 7 Revised 7.18.2017 revised 6/23/2015
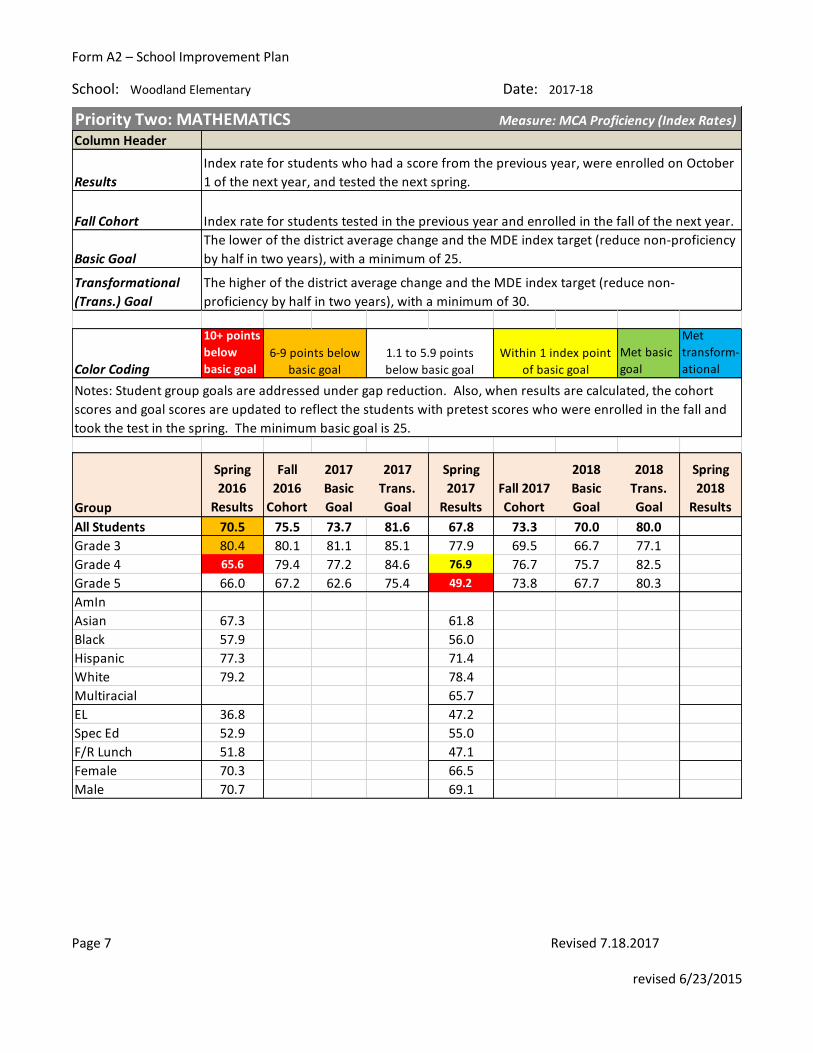
Priority Two: MATHEMATICS Measure: MCA Proficiency (Index Rates)
Column Header
Results
Fall Cohort
Basic Goal
Transformational
(Trans.) Goal
Color Coding
10+ points
below
basic goal
Met basic
goal
Met
transform-
ational
Group
Spring
2016
Results
Fall
2016
Cohort
2017
Basic
Goal
2017
Trans.
Goal
Spring
2017
Results
Fall 2017
Cohort
2018
Basic
Goal
2018
Trans.
Goal
Spring
2018
Results
All Students 70.5 75.5 73.7 81.6 67.8 73.3 70.0 80.0
Grade 3 80.4 80.1 81.1 85.1 77.9 69.5 66.7 77.1
Grade 4 65.6 79.4 77.2 84.6 76.9 76.7 75.7 82.5
Grade 5 66.0 67.2 62.6 75.4 49.2 73.8 67.7 80.3
AmIn
Asian 67.3 61.8
Black 57.9 56.0
Hispanic 77.3 71.4
White 79.2 78.4
Multiracial 65.7
EL 36.8 47.2
Spec Ed 52.9 55.0
F/R Lunch 51.8 47.1
Female 70.3 66.5
Male 70.7 69.1
Notes: Student group goals are addressed under gap reduction. Also, when results are calculated, the cohort
scores and goal scores are updated to reflect the students with pretest scores who were enrolled in the fall and
took the test in the spring. The minimum basic goal is 25.
Index rate for students who had a score from the previous year, were enrolled on October
1 of the next year, and tested the next spring.
Index rate for students tested in the previous year and enrolled in the fall of the next year.
The lower of the district average change and the MDE index target (reduce non-proficiency
by half in two years), with a minimum of 25.
The higher of the district average change and the MDE index target (reduce non-
proficiency by half in two years), with a minimum of 30.
6-9 points below
basic goal
1.1 to 5.9 points
below basic goal
Within 1 index point
of basic goal
Form A2 – School Improvement Plan
School: Woodland Elementary Date: 2017-18
Page 8 Revised 7.18.2017 revised 6/23/2015
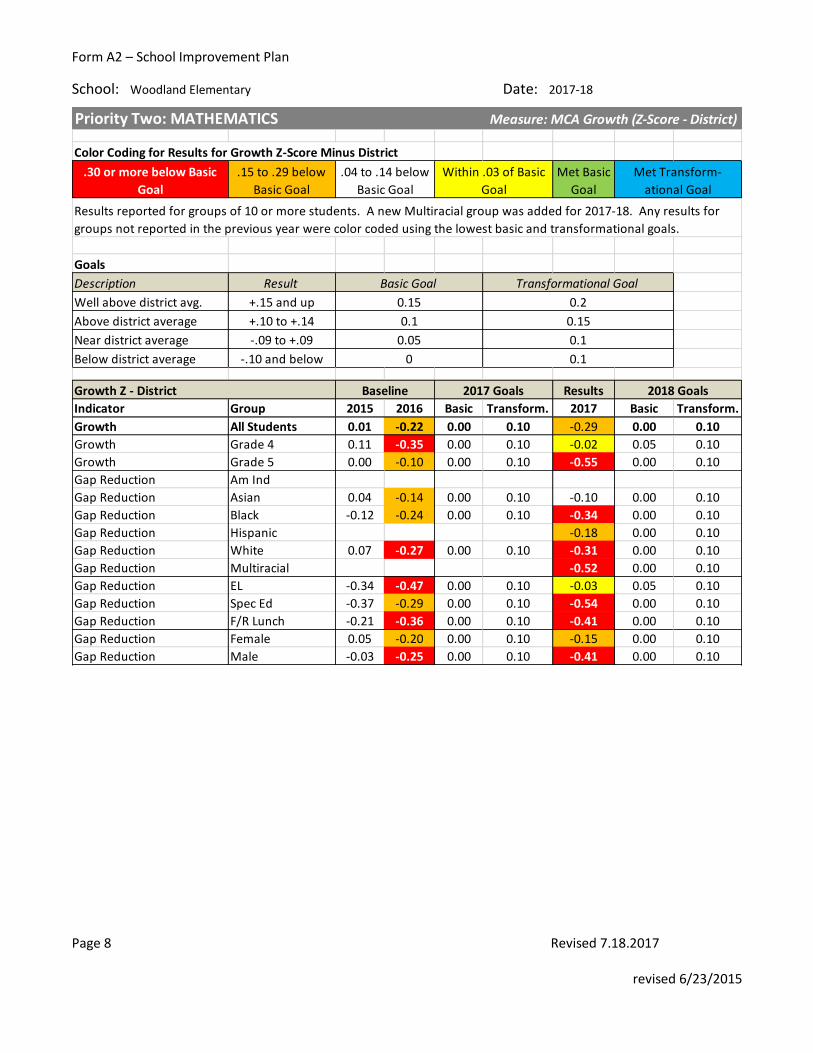
Priority Two: MATHEMATICS Measure: MCA Growth (Z-Score - District)
Color Coding for Results for Growth Z-Score Minus District
.30 or more below Basic
Goal
.15 to .29 below
Basic Goal
Met Basic
Goal
Goals
Description Result
Well above district avg. +.15 and up
Above district average +.10 to +.14
Near district average -.09 to +.09
Below district average -.10 and below
Growth Z - District Results
Indicator Group 2015 2016 Basic Transform. 2017 Basic Transform.
Growth All Students 0.01 -0.22 0.00 0.10 -0.29 0.00 0.10
Growth Grade 4 0.11 -0.35 0.00 0.10 -0.02 0.05 0.10
Growth Grade 5 0.00 -0.10 0.00 0.10 -0.55 0.00 0.10
Gap Reduction Am Ind
Gap Reduction Asian 0.04 -0.14 0.00 0.10 -0.10 0.00 0.10
Gap Reduction Black -0.12 -0.24 0.00 0.10 -0.34 0.00 0.10
Gap Reduction Hispanic -0.18 0.00 0.10
Gap Reduction White 0.07 -0.27 0.00 0.10 -0.31 0.00 0.10
Gap Reduction Multiracial -0.52 0.00 0.10
Gap Reduction EL -0.34 -0.47 0.00 0.10 -0.03 0.05 0.10
Gap Reduction Spec Ed -0.37 -0.29 0.00 0.10 -0.54 0.00 0.10
Gap Reduction F/R Lunch -0.21 -0.36 0.00 0.10 -0.41 0.00 0.10
Gap Reduction Female 0.05 -0.20 0.00 0.10 -0.15 0.00 0.10
Gap Reduction Male -0.03 -0.25 0.00 0.10 -0.41 0.00 0.10
0 0.1
2017 GoalsBaseline 2018 Goals
0.15 0.2
0.1 0.15
0.05 0.1
.04 to .14 below
Basic Goal
Within .03 of Basic
Goal
Met Transform-
ational Goal
Basic Goal Transformational Goal
Results reported for groups of 10 or more students. A new Multiracial group was added for 2017-18. Any results for
groups not reported in the previous year were color coded using the lowest basic and transformational goals.
Form A2 – School Improvement Plan
School: Woodland Elementary Date: 2017-18
Page 9 Revised 7.18.2017 revised 6/23/2015
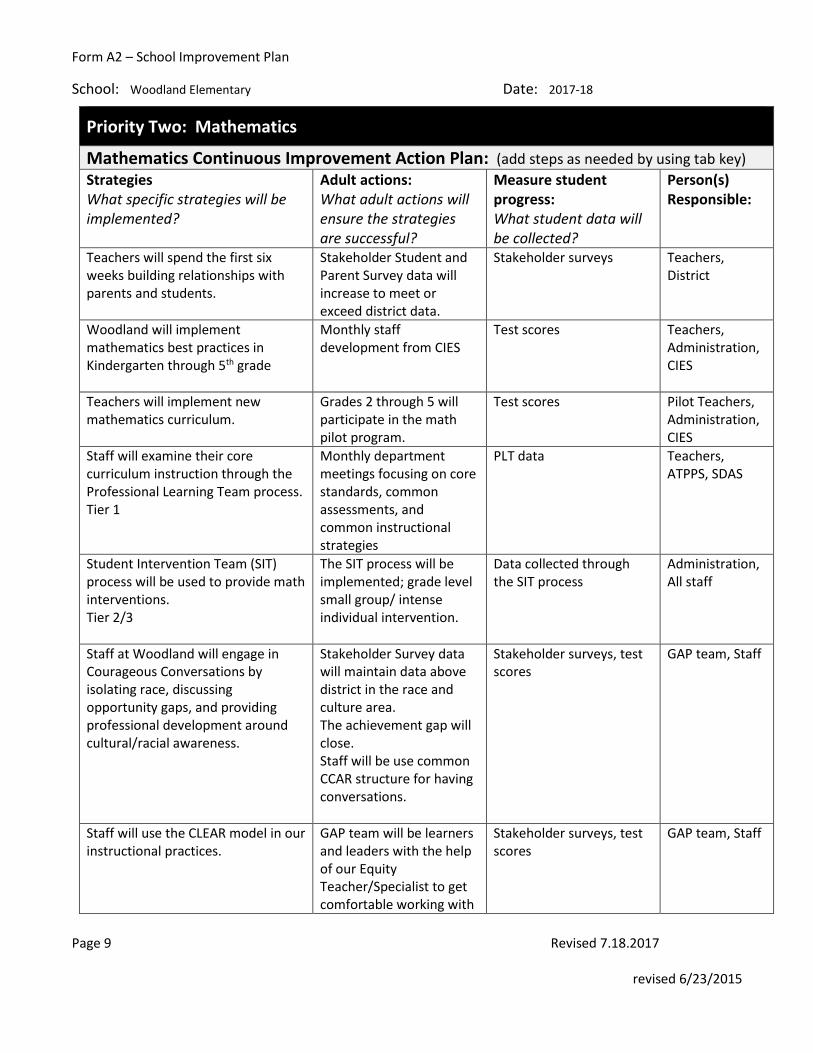
Priority Two: Mathematics
Mathematics Continuous Improvement Action Plan: (add steps as needed by using tab key) Strategies What specific strategies will be implemented?
Adult actions: What adult actions will ensure the strategies are successful?
Measure student progress: What student data will be collected?
Person(s) Responsible:
Teachers will spend the first six weeks building relationships with parents and students.
Stakeholder Student and Parent Survey data will increase to meet or exceed district data.
Stakeholder surveys Teachers, District
Woodland will implement mathematics best practices in Kindergarten through 5th grade
Monthly staff development from CIES
Test scores Teachers, Administration, CIES
Teachers will implement new mathematics curriculum.
Grades 2 through 5 will participate in the math pilot program.
Test scores Pilot Teachers, Administration, CIES
Staff will examine their core curriculum instruction through the Professional Learning Team process. Tier 1
Monthly department meetings focusing on core standards, common assessments, and common instructional strategies
PLT data Teachers, ATPPS, SDAS
Student Intervention Team (SIT) process will be used to provide math interventions. Tier 2/3
The SIT process will be implemented; grade level small group/ intense individual intervention.
Data collected through the SIT process
Administration, All staff
Staff at Woodland will engage in Courageous Conversations by isolating race, discussing opportunity gaps, and providing professional development around cultural/racial awareness.
Stakeholder Survey data will maintain data above district in the race and culture area. The achievement gap will close. Staff will be use common CCAR structure for having conversations.
Stakeholder surveys, test scores
GAP team, Staff
Staff will use the CLEAR model in our instructional practices.
GAP team will be learners and leaders with the help of our Equity Teacher/Specialist to get comfortable working with
Stakeholder surveys, test scores
GAP team, Staff
Form A2 – School Improvement Plan
School: Woodland Elementary Date: 2017-18
Page 10 Revised 7.18.2017 revised 6/23/2015
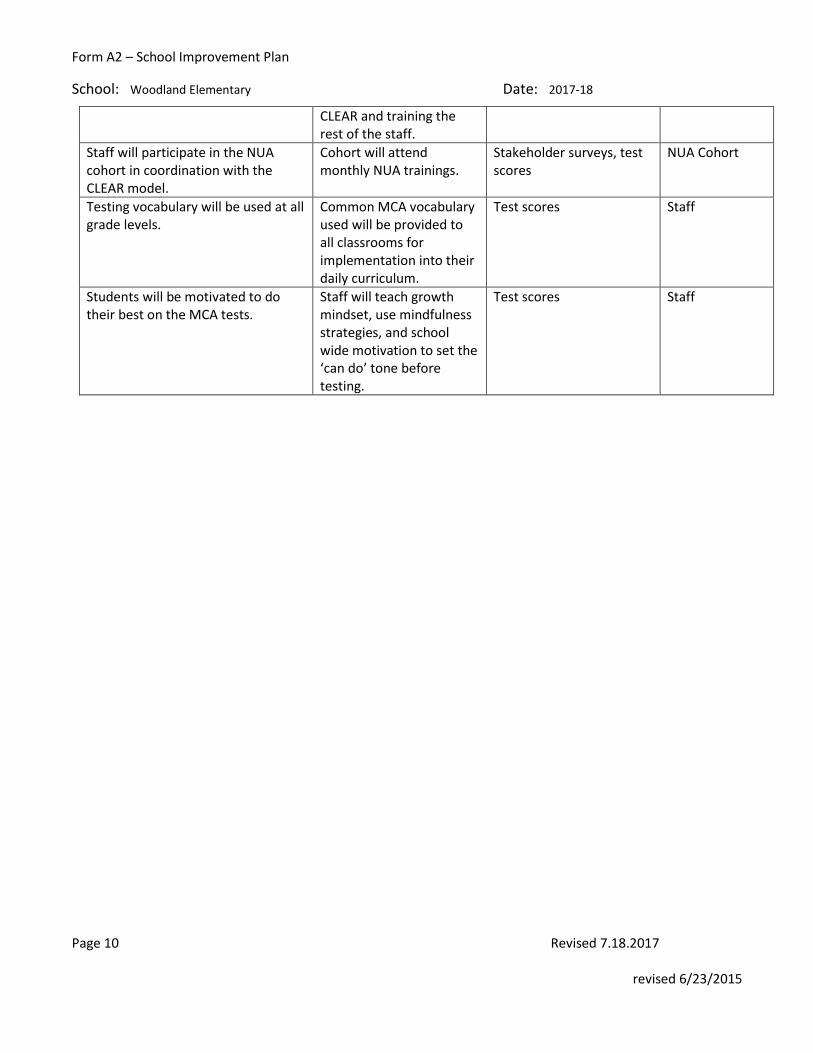
CLEAR and training the rest of the staff.
Staff will participate in the NUA cohort in coordination with the CLEAR model.
Cohort will attend monthly NUA trainings.
Stakeholder surveys, test scores
NUA Cohort
Testing vocabulary will be used at all grade levels.
Common MCA vocabulary used will be provided to all classrooms for implementation into their daily curriculum.
Test scores Staff
Students will be motivated to do their best on the MCA tests.
Staff will teach growth mindset, use mindfulness strategies, and school wide motivation to set the ‘can do’ tone before testing.
Test scores Staff
Form A2 – School Improvement Plan
School: Woodland Elementary Date: 2017-18
Page 11 Revised 7.18.2017 revised 6/23/2015
Form A2 – School Improvement Plan
School: Woodland Elementary Date: 2017-18
Page 12 Revised 7.18.2017 revised 6/23/2015
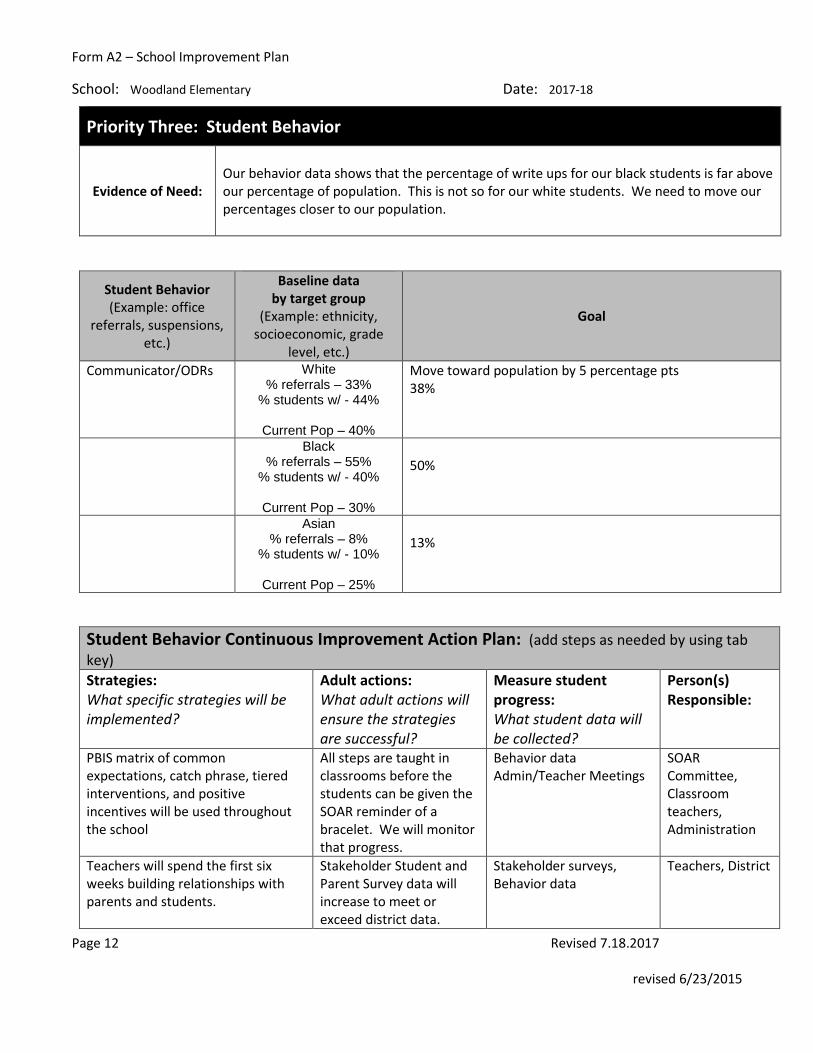
Priority Three: Student Behavior
Evidence of Need:
Our behavior data shows that the percentage of write ups for our black students is far above our percentage of population. This is not so for our white students. We need to move our percentages closer to our population.
Student Behavior (Example: office
referrals, suspensions, etc.)
Baseline data by target group
(Example: ethnicity, socioeconomic, grade
level, etc.)
Goal
Communicator/ODRs White % referrals – 33%
% students w/ - 44%
Current Pop – 40%
Move toward population by 5 percentage pts 38%
Black % referrals – 55%
% students w/ - 40%
Current Pop – 30%
50%
Asian % referrals – 8%
% students w/ - 10%
Current Pop – 25%
13%
Student Behavior Continuous Improvement Action Plan: (add steps as needed by using tab
key) Strategies: What specific strategies will be implemented?
Adult actions: What adult actions will ensure the strategies are successful?
Measure student progress: What student data will be collected?
Person(s) Responsible:
PBIS matrix of common expectations, catch phrase, tiered interventions, and positive incentives will be used throughout the school
All steps are taught in classrooms before the students can be given the SOAR reminder of a bracelet. We will monitor that progress.
Behavior data Admin/Teacher Meetings
SOAR Committee, Classroom teachers, Administration
Teachers will spend the first six weeks building relationships with parents and students.
Stakeholder Student and Parent Survey data will increase to meet or exceed district data.
Stakeholder surveys, Behavior data
Teachers, District
Form A2 – School Improvement Plan
School: Woodland Elementary Date: 2017-18
Page 13 Revised 7.18.2017 revised 6/23/2015
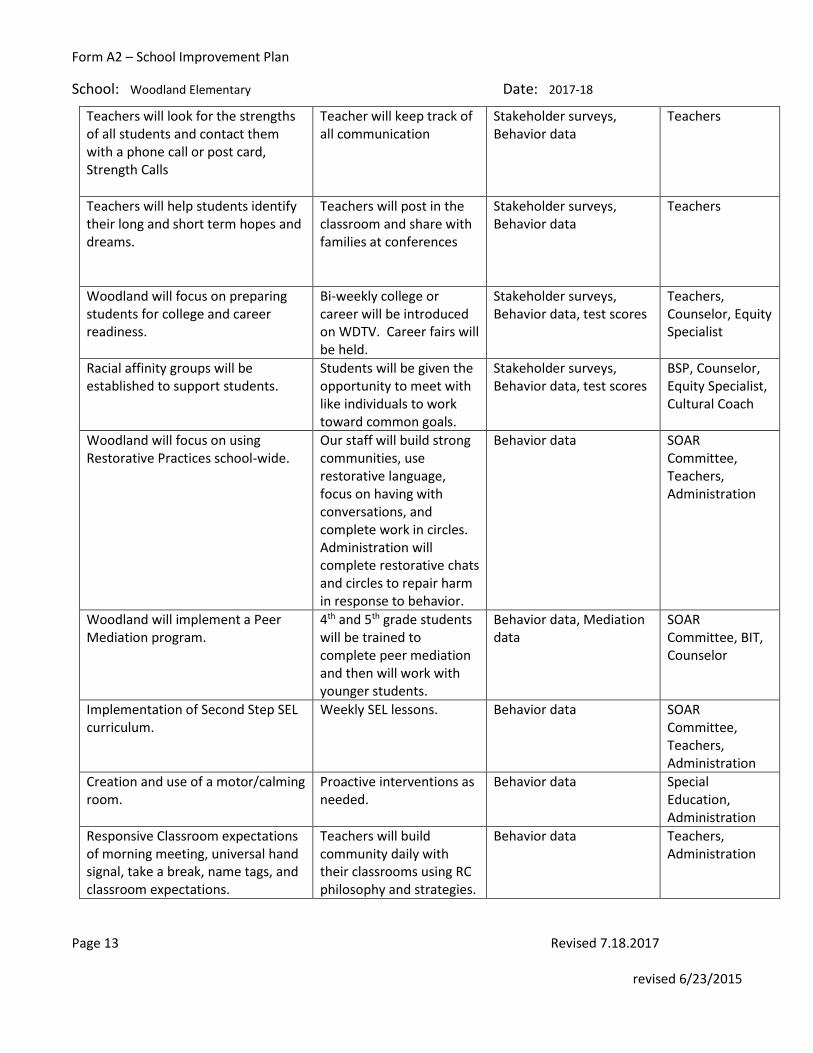
Teachers will look for the strengths of all students and contact them with a phone call or post card, Strength Calls
Teacher will keep track of all communication
Stakeholder surveys, Behavior data
Teachers
Teachers will help students identify their long and short term hopes and dreams.
Teachers will post in the classroom and share with families at conferences
Stakeholder surveys, Behavior data
Teachers
Woodland will focus on preparing students for college and career readiness.
Bi-weekly college or career will be introduced on WDTV. Career fairs will be held.
Stakeholder surveys, Behavior data, test scores
Teachers, Counselor, Equity Specialist
Racial affinity groups will be established to support students.
Students will be given the opportunity to meet with like individuals to work toward common goals.
Stakeholder surveys, Behavior data, test scores
BSP, Counselor, Equity Specialist, Cultural Coach
Woodland will focus on using Restorative Practices school-wide.
Our staff will build strong communities, use restorative language, focus on having with conversations, and complete work in circles. Administration will complete restorative chats and circles to repair harm in response to behavior.
Behavior data SOAR Committee, Teachers, Administration
Woodland will implement a Peer Mediation program.
4th and 5th grade students will be trained to complete peer mediation and then will work with younger students.
Behavior data, Mediation data
SOAR Committee, BIT, Counselor
Implementation of Second Step SEL curriculum.
Weekly SEL lessons. Behavior data SOAR Committee, Teachers, Administration
Creation and use of a motor/calming room.
Proactive interventions as needed.
Behavior data Special Education, Administration
Responsive Classroom expectations of morning meeting, universal hand signal, take a break, name tags, and classroom expectations.
Teachers will build community daily with their classrooms using RC philosophy and strategies.
Behavior data Teachers, Administration
Form A2 – School Improvement Plan
School: Woodland Elementary Date: 2017-18
Page 14 Revised 7.18.2017 revised 6/23/2015
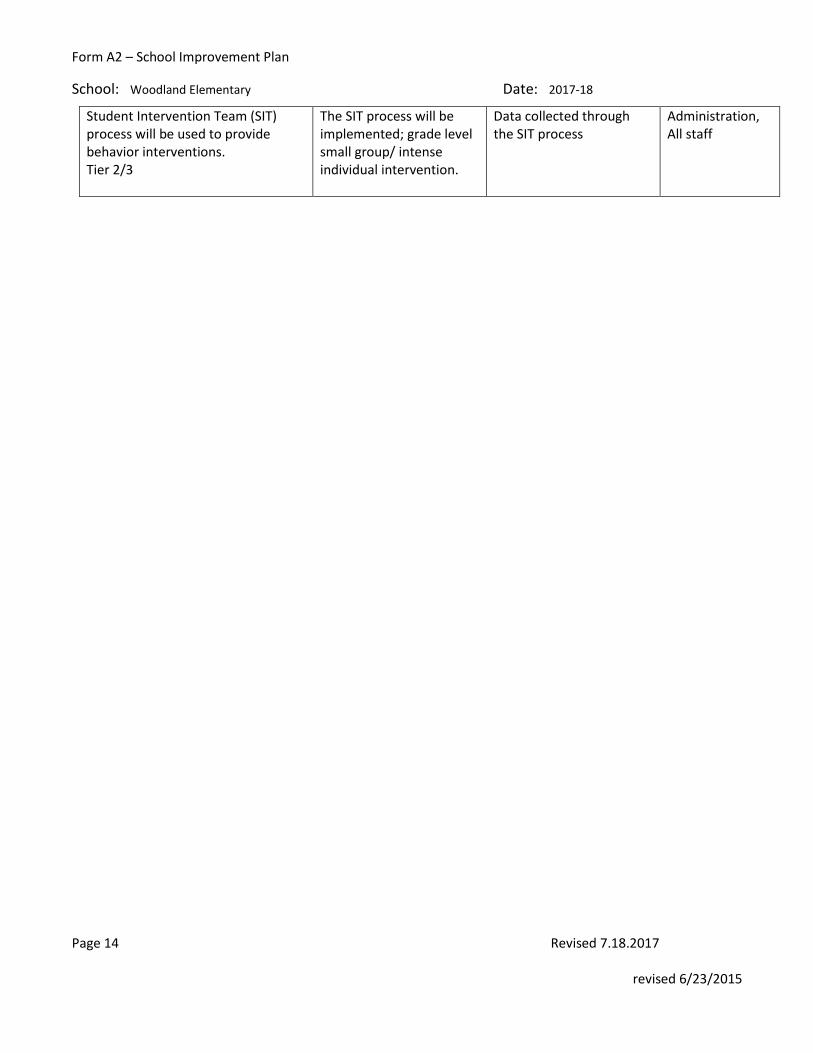
Student Intervention Team (SIT) process will be used to provide behavior interventions. Tier 2/3
The SIT process will be implemented; grade level small group/ intense individual intervention.
Data collected through the SIT process
Administration, All staff
Form A2 – School Improvement Plan
School: Woodland Elementary Date: 2017-18
Page 15 Revised 7.18.2017 revised 6/23/2015
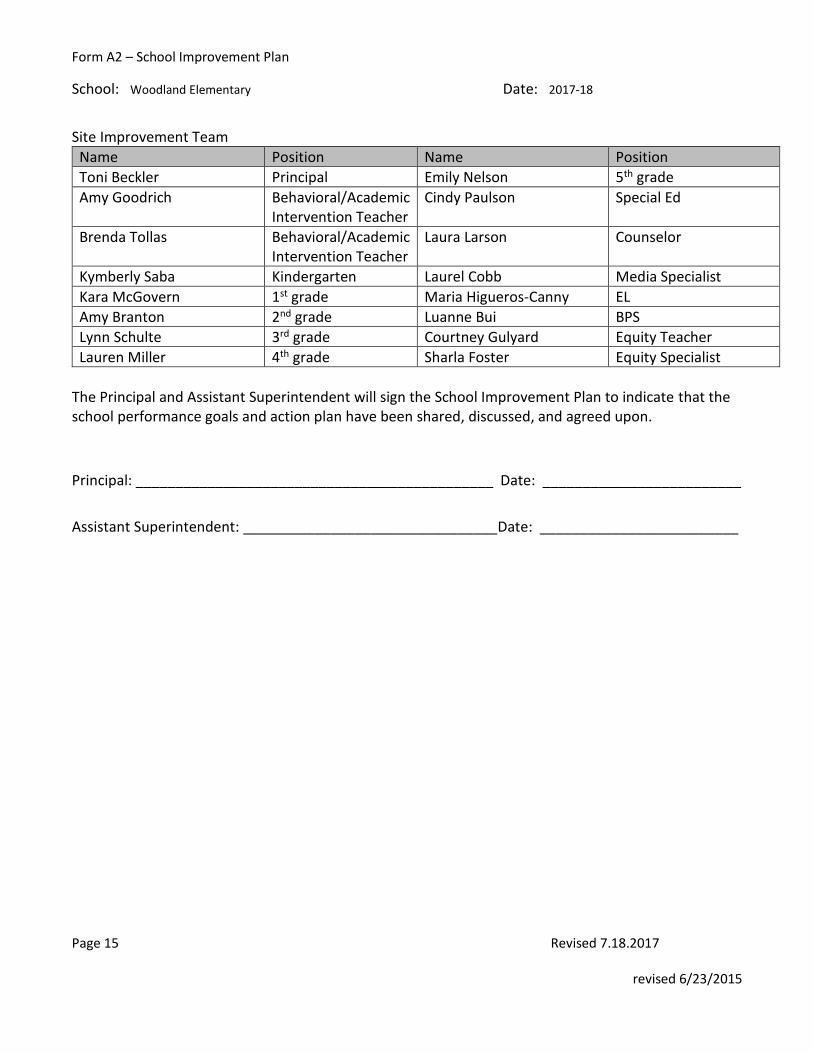
Site Improvement Team
Name Position Name Position
Toni Beckler Principal Emily Nelson 5th grade
Amy Goodrich Behavioral/Academic Intervention Teacher
Cindy Paulson Special Ed
Brenda Tollas
Behavioral/Academic Intervention Teacher
Laura Larson Counselor
Kymberly Saba Kindergarten Laurel Cobb Media Specialist
Kara McGovern 1st grade Maria Higueros-Canny EL
Amy Branton 2nd grade Luanne Bui BPS
Lynn Schulte 3rd grade Courtney Gulyard Equity Teacher
Lauren Miller 4th grade Sharla Foster Equity Specialist
The Principal and Assistant Superintendent will sign the School Improvement Plan to indicate that the school performance goals and action plan have been shared, discussed, and agreed upon.
Principal: _____________________________________________ Date: _________________________
Assistant Superintendent: ________________________________Date: _________________________