Embed Size (px)
Citation preview
UNITED STATES SECURITIES AND EXCHANGE COMMISSION
Washington, D.C. 20549
Form 6-K
REPORT OF FOREIGN PRIVATE ISSUER PURSUANT TO RULE 13a-16 OR 15d-16
UNDER THE SECURITIES EXCHANGE ACT OF 1934
For the month of July 2016
Commission File Number 1-15242
DEUTSCHE BANK CORPORATION (Translation of Registrant’s Name Into English)
Deutsche Bank Aktiengesellschaft Taunusanlage 12
60325 Frankfurt am Main Germany
(Address of Principal Executive Office)
Indicate by check mark whether the registrant files or will file annual reports under cover of Form 20-F or Form 40-F: Form 20-F ⌧ Form 40-F
Indicate by check mark whether the registrant is submitting the Form 6-K in paper as permitted by Regulation S-T Rule 101(b)(1):
Indicate by check mark whether the registrant is submitting the Form 6-K in paper as permitted by Regulation S-T Rule 101(b)(7):
Explanatory note
This Report on Form 6-K contains the following exhibits. This Report on Form 6-K and the exhibits hereto are hereby incorporated by reference into Registration Statement No. 333-206013 of Deutsche Bank AG, provided that the following subsections of the “Management Report” section of the Interim Report (contained in Exhibit 99.1) are not so incorporated by reference: “Outlook—The Global Economy” and “Outlook—The Banking Industry”. For the avoidance of doubt, the subsection of the “Management Report” section of the Interim Report (contained in Exhibit 99.1) entitled “Risk and Opportunities” is intended to supplement, but not replace, the section “Risk Factors” included on pages 13 to 40 of our 2015 Annual Report on Form 20-F.
Exhibit 99.1: The following sections of Deutsche Bank AG’s Interim Report as of June 30, 2016: “The Group at a Glance”, “Management Report”, the “Consolidated Financial Statements”, the “Notes to the Consolidated Financial Statements” and “Other Information (unaudited)”.
Exhibit 99.2: Capitalization table of Deutsche Bank AG as of June 30, 2016 (also incorporated as Exhibit 12.10 to Registration Statement No. 333-206013 of Deutsche Bank AG).
Exhibit 99.3: Statement re: Computation of Ratio of Earnings to Fixed Charges of Deutsche Bank AG for the periods ended June 30, 2016, December 31, 2015, December 31, 2014, December 31, 2013, December 31, 2012 and December 31, 2011 (also incorporated as Exhibit 12.11 to Registration Statement No. 333-206013 of Deutsche Bank AG).
Forward-looking statements contain risks This report contains forward-looking statements. Forward-looking statements are statements that are
not historical facts; they include statements about our beliefs and expectations. Any statement in this report that states our intentions, beliefs, expectations or predictions (and the assumptions underlying them) is a forward-looking statement. These statements are based on plans, estimates and projections as they are currently available to the management of Deutsche Bank. Forward-looking statements therefore speak only as of the date they are made, and we undertake no obligation to update publicly any of them in light of new information or future events.
By their very nature, forward-looking statements involve risks and uncertainties. A number of important factors could therefore cause actual results to differ materially from those contained in any forward-looking statement. Such factors include the conditions in the financial markets in Germany, in Europe, in the United States and elsewhere from which we derive a substantial portion of our trading revenues, potential defaults of borrowers or trading counterparties, the implementation of our strategic initiatives, the reliability of our risk management policies, procedures and methods, and other risks referenced in our filings with the U.S. Securities and Exchange Commission. Such factors are described in detail in our 2015 Annual Report on Form 20-F, which was filed with the SEC on March 11, 2016, on pages 13 through 40 under the heading “Risk Factors.” Copies of this document are readily available upon request or can be downloaded from www.deutsche-bank.com/ir.
2
Use of Non-GAAP Financial Measures
This report and other documents we have published or may publish contain non-GAAP financial measures. Non-GAAP financial measures are measures of our historical or future performance, financial position or cash flows that contain adjustments which exclude or include amounts that are included or excluded, as the case may be, from the most directly comparable measure calculated and presented in accordance with IFRS in our financial statements. Examples of our non-GAAP financial measures, and the most directly comparable IFRS financial measures, are as follows:
For descriptions of certain of these non-GAAP financial measures and the adjustments made to the most directly comparable IFRS financial measures to obtain them, please refer to (i) the subsection “Other Information (unaudited)” of Exhibit 99.1 hereto, (ii) pages 6 and 7 of our 2015 Annual Report on Form 20-F and (iii) “Supplementary Information: Non-GAAP Financial Measures” on pages 438 to 442 of our Annual Report 2015, which constitutes part of our 2015 Annual Report on Form 20-F.
CRR/CRD 4 Solvency Measures
Since January 1, 2014, our regulatory assets, exposures, risk-weighted assets, capital and ratios thereof are calculated for regulatory purposes under the regulation on prudential requirements for credit institutions and investment firms (“CRR”) and the Capital Requirements Directive 4 (“CRD 4”) implementing Basel 3, which were published on June 27, 2013. CRR/CRD 4 provides for “transitional” (or “phase-in”) rules, under which capital instruments that are no longer eligible under the new rules are permitted to be phased out as the new rules on regulatory adjustments are phased in, as well as regarding the risk weighting of certain categories of assets. Unless otherwise noted, our CRR/CRD 4 solvency measures set forth in this report reflect these transitional rules.
We also set forth in this report and other documents such CRR/CRD 4 measures on a “fully loaded” basis, reflecting full application of the rules without consideration of the transitional provisions under CRR/CRD 4. Additionally, as part of our balance sheet management, we use a CRR/CRD 4 fully loaded leverage ratio. Such fully loaded metrics are described in (i) the subsections “Management Report: Risk Report: Risk and Capital Performance: Regulatory Capital” and “Management Report: Risk Report: Leverage Ratio”
3
Non-GAAP Financial Measure Most Directly Comparable IFRS Financial MeasureNet income attributable to Deutsche Bank shareholders
Net income
Adjusted costs Noninterest expensesTangible shareholders’ equity, Tangible book value
Total shareholders’ equity (book value)
Post-tax return on average shareholders’ equity (based on Net income attributable to Deutsche Bank shareholders)
Post-tax return on average shareholders’ equity
Post-tax return on average tangible shareholders’ equity
Post-tax return on average shareholders’ equity
Tangible book value per share outstanding Book value per share outstanding
of Exhibit 99.1 hereto and (ii) “Management Report: Risk Report: Risk and Capital Performance: Capital and Leverage Ratio” on pages 125 to 137 of our Annual Report 2015, which constitutes part of our 2015 Annual Report on Form 20-F. Such sections also provide reconciliation to the respective CRR/CRD 4 transitional or IFRS values. Our Strategy 2020 capital targets are on a fully loaded basis.
As the final implementation of CRR/CRD 4 may differ from our expectations, and our competitors’ assumptions and estimates regarding such implementation may vary, our fully loaded CRR/CRD 4 measures, which are non-GAAP financial measures, may not be comparable with similarly labeled measures used by our competitors.
When used with respect to future periods, our non-GAAP financial measures are also forward-looking statements. We cannot predict or quantify the levels of the most directly comparable financial measures under IFRS (or the CRR/CRD 4 rules) that would correspond to these non-GAAP financial measures for future periods. This is because neither the magnitude of such IFRS (or CRR/CRD 4) financial measures, nor the magnitude of the adjustments to be used to calculate the related non-GAAP financial measures from such IFRS (or CRR/CRD 4) financial measures, can be predicted. Such adjustments, if any, will relate to specific, currently unknown, events and in most cases can be positive or negative, so that it is not possible to predict whether, for a future period, the non-GAAP financial measure will be greater than or less than the related IFRS (or CRR/CRD 4) financial measure.
4
Pursuant to the requirements of the Securities Exchange Act of 1934, the registrant has duly caused this report to be signed on its behalf by the undersigned, thereunto duly authorized.
5
DEUTSCHE BANK AKTIENGESELLSCHAFT
Date: July 27, 2016By: /s/ Peter Burrill
Name: Peter BurrillTitle: Managing Director
By: /s/ Joseph C. Kopec
Name: Joseph C. KopecTitle: Managing Director and Senior
Counsel
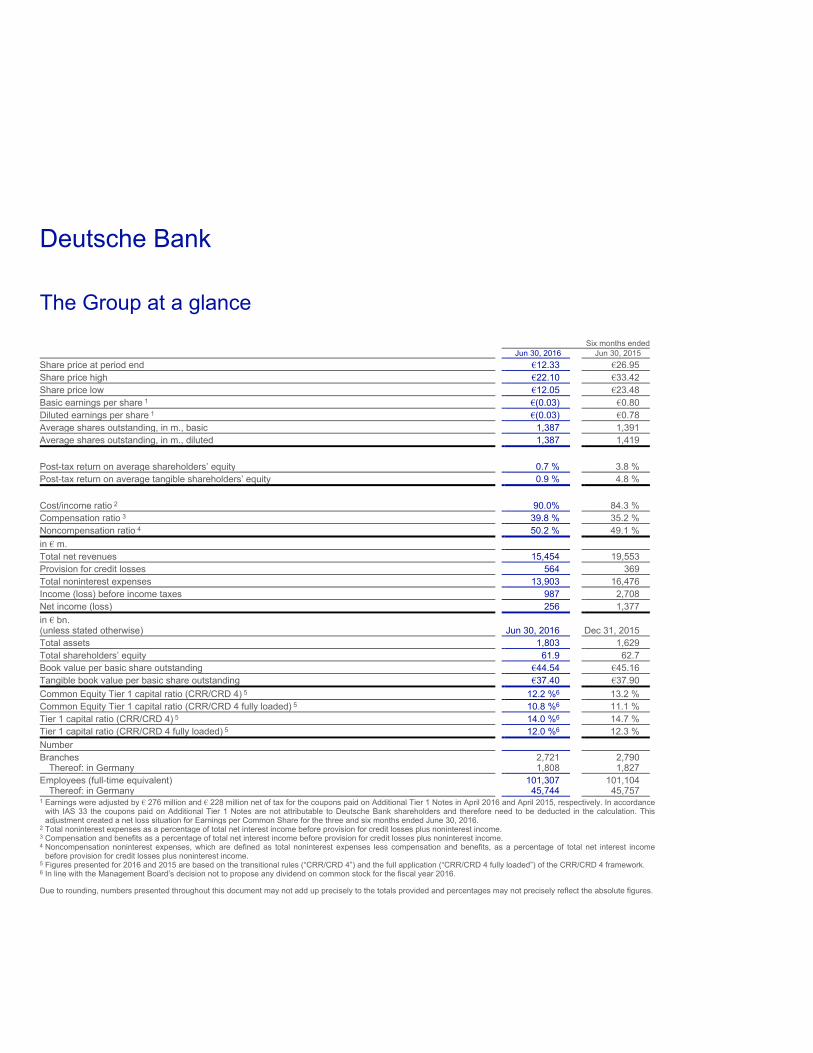
Deutsche Bank The Group at a glance
Due to rounding, numbers presented throughout this document may not add up precisely to the totals provided and percentages may not precisely reflect the absolute figures.
Six months ended Jun 30, 2016 Jun 30, 2015
Share price at period end €12.33 €26.95
Share price high €22.10 €33.42
Share price low €12.05 €23.48
Basic earnings per share 1 €(0.03) €0.80
Diluted earnings per share 1 €(0.03) €0.78
Average shares outstanding, in m., basic 1,387 1,391
Average shares outstanding, in m., diluted 1,387 1,419
Post-tax return on average shareholders’ equity 0.7 % 3.8 %
Post-tax return on average tangible shareholders’ equity 0.9 % 4.8 %
Cost/income ratio 2 90.0% 84.3 %
Compensation ratio 3 39.8 % 35.2 %
Noncompensation ratio 4 50.2 % 49.1 %
in € m.
Total net revenues 15,454 19,553
Provision for credit losses 564 369
Total noninterest expenses 13,903 16,476
Income (loss) before income taxes 987 2,708
Net income (loss) 256 1,377
in € bn. (unless stated otherwise) Jun 30, 2016 Dec 31, 2015
Total assets 1,803 1,629
Total shareholders’ equity 61.9 62.7
Book value per basic share outstanding €44.54 €45.16
Tangible book value per basic share outstanding €37.40 €37.90
Common Equity Tier 1 capital ratio (CRR/CRD 4) 5 12.2 %6 13.2 %
Common Equity Tier 1 capital ratio (CRR/CRD 4 fully loaded) 5 10.8 %6 11.1 %
Tier 1 capital ratio (CRR/CRD 4) 5 14.0 %6 14.7 %
Tier 1 capital ratio (CRR/CRD 4 fully loaded) 5 12.0 %6 12.3 %
Number
Branches Thereof: in Germany
2,721 1,808
2,790 1,827
Employees (full-time equivalent) Thereof: in Germany
101,307 45,744
101,104 45,757
1 Earnings were adjusted by € 276 million and € 228 million net of tax for the coupons paid on Additional Tier 1 Notes in April 2016 and April 2015, respectively. In accordancewith IAS 33 the coupons paid on Additional Tier 1 Notes are not attributable to Deutsche Bank shareholders and therefore need to be deducted in the calculation. Thisadjustment created a net loss situation for Earnings per Common Share for the three and six months ended June 30, 2016.
2 Total noninterest expenses as a percentage of total net interest income before provision for credit losses plus noninterest income. 3 Compensation and benefits as a percentage of total net interest income before provision for credit losses plus noninterest income. 4 Noncompensation noninterest expenses, which are defined as total noninterest expenses less compensation and benefits, as a percentage of total net interest income
before provision for credit losses plus noninterest income. 5 Figures presented for 2016 and 2015 are based on the transitional rules (“CRR/CRD 4”) and the full application (“CRR/CRD 4 fully loaded”) of the CRR/CRD 4 framework. 6 In line with the Management Board’s decision not to propose any dividend on common stock for the fiscal year 2016.
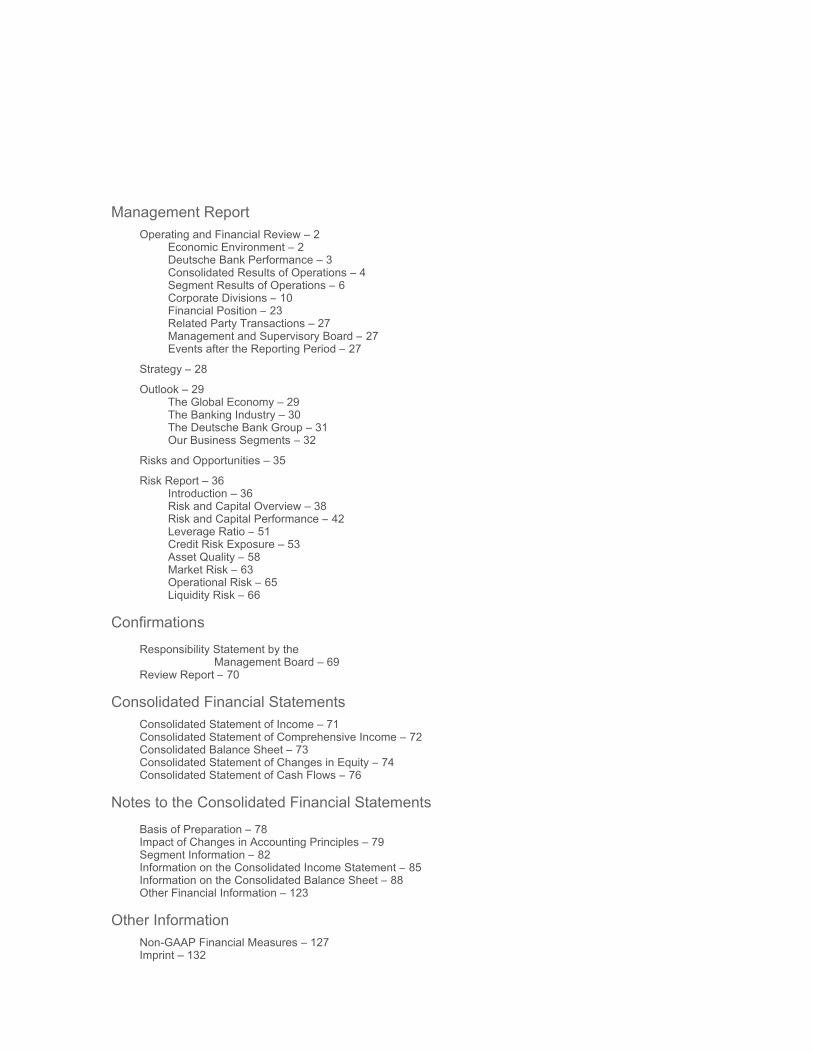
Management ReportOperating and Financial Review – 2
Economic Environment – 2 Deutsche Bank Performance – 3 Consolidated Results of Operations – 4Segment Results of Operations – 6 Corporate Divisions – 10 Financial Position – 23 Related Party Transactions – 27 Management and Supervisory Board – 27Events after the Reporting Period – 27
Strategy – 28
Outlook – 29 The Global Economy – 29 The Banking Industry – 30 The Deutsche Bank Group – 31 Our Business Segments – 32
Risks and Opportunities – 35
Risk Report – 36 Introduction – 36Risk and Capital Overview – 38 Risk and Capital Performance – 42 Leverage Ratio – 51Credit Risk Exposure – 53 Asset Quality – 58Market Risk – 63Operational Risk – 65Liquidity Risk – 66
Confirmations
Responsibility Statement by the Management Board – 69
Review Report – 70
Consolidated Financial Statements Consolidated Statement of Income – 71 Consolidated Statement of Comprehensive Income – 72Consolidated Balance Sheet – 73 Consolidated Statement of Changes in Equity – 74Consolidated Statement of Cash Flows – 76
Notes to the Consolidated Financial Statements
Basis of Preparation – 78Impact of Changes in Accounting Principles – 79 Segment Information – 82Information on the Consolidated Income Statement – 85Information on the Consolidated Balance Sheet – 88Other Financial Information – 123
Other Information Non-GAAP Financial Measures – 127 Imprint – 132
Deutsche Bank 1 – Management Report 2Interim Report as of June 30, 2016
Management Report
Operating and Financial Review
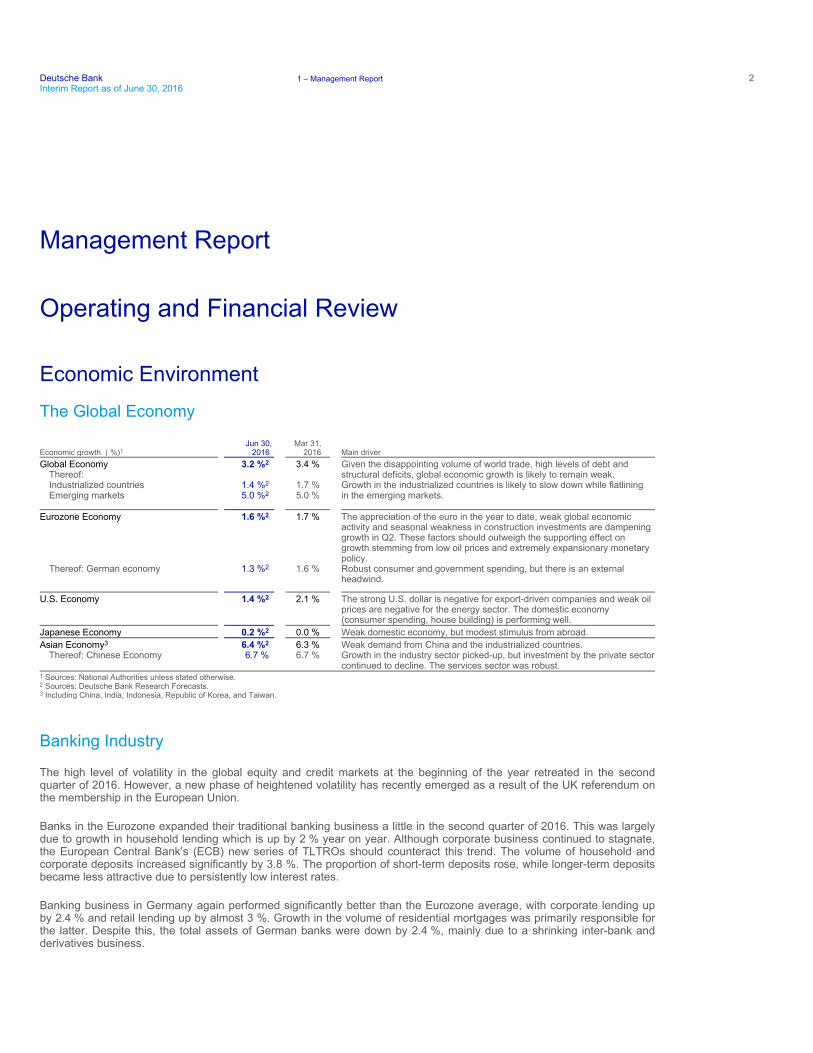
Economic Environment
The Global Economy
Banking Industry
The high level of volatility in the global equity and credit markets at the beginning of the year retreated in the second quarter of 2016. However, a new phase of heightened volatility has recently emerged as a result of the UK referendum on the membership in the European Union.
Banks in the Eurozone expanded their traditional banking business a little in the second quarter of 2016. This was largely due to growth in household lending which is up by 2 % year on year. Although corporate business continued to stagnate, the European Central Bank’s (ECB) new series of TLTROs should counteract this trend. The volume of household and corporate deposits increased significantly by 3.8 %. The proportion of short-term deposits rose, while longer-term deposits became less attractive due to persistently low interest rates.
Banking business in Germany again performed significantly better than the Eurozone average, with corporate lending up by 2.4 % and retail lending up by almost 3 %. Growth in the volume of residential mortgages was primarily responsible for the latter. Despite this, the total assets of German banks were down by 2.4 %, mainly due to a shrinking inter-bank and derivatives business.
Economic growth ( %)1 Jun 30,
2016 Mar 31,
2016 Main driver
Global Economy 3.2 %2 3.4 % Given the disappointing volume of world trade, high levels of debt andThereof: structural deficits, global economic growth is likely to remain weak.Industrialized countries 1.4 %2 1.7 % Growth in the industrialized countries is likely to slow down while flatliningEmerging markets
5.0 %2
5.0 %
in the emerging markets.
Eurozone Economy
1.6 %2 1.7 %
The appreciation of the euro in the year to date, weak global economic activity and seasonal weakness in construction investments are dampening growth in Q2. These factors should outweigh the supporting effect on growth stemming from low oil prices and extremely expansionary monetary policy.
Thereof: German economy
1.3 %2
1.6 %
Robust consumer and government spending, but there is an external headwind.
U.S. Economy
1.4 %2 2.1 %
The strong U.S. dollar is negative for export-driven companies and weak oil prices are negative for the energy sector. The domestic economy (consumer spending, house building) is performing well.
Japanese Economy 0.2 %2 0.0 % Weak domestic economy, but modest stimulus from abroad.
Asian Economy3 6.4 %2 6.3 % Weak demand from China and the industrialized countries.Thereof: Chinese Economy
6.7 % 6.7 %
Growth in the industry sector picked-up, but investment by the private sector continued to decline. The services sector was robust.
1 Sources: National Authorities unless stated otherwise. 2 Sources: Deutsche Bank Research Forecasts. 3 Including China, India, Indonesia, Republic of Korea, and Taiwan.
3
Deutsche Bank Interim Report as of June 30, 2016
Operating and Financial Review – 2 Strategy – 28 Outlook – 29
Risk and Opportunities – 35 Risk Report – 36
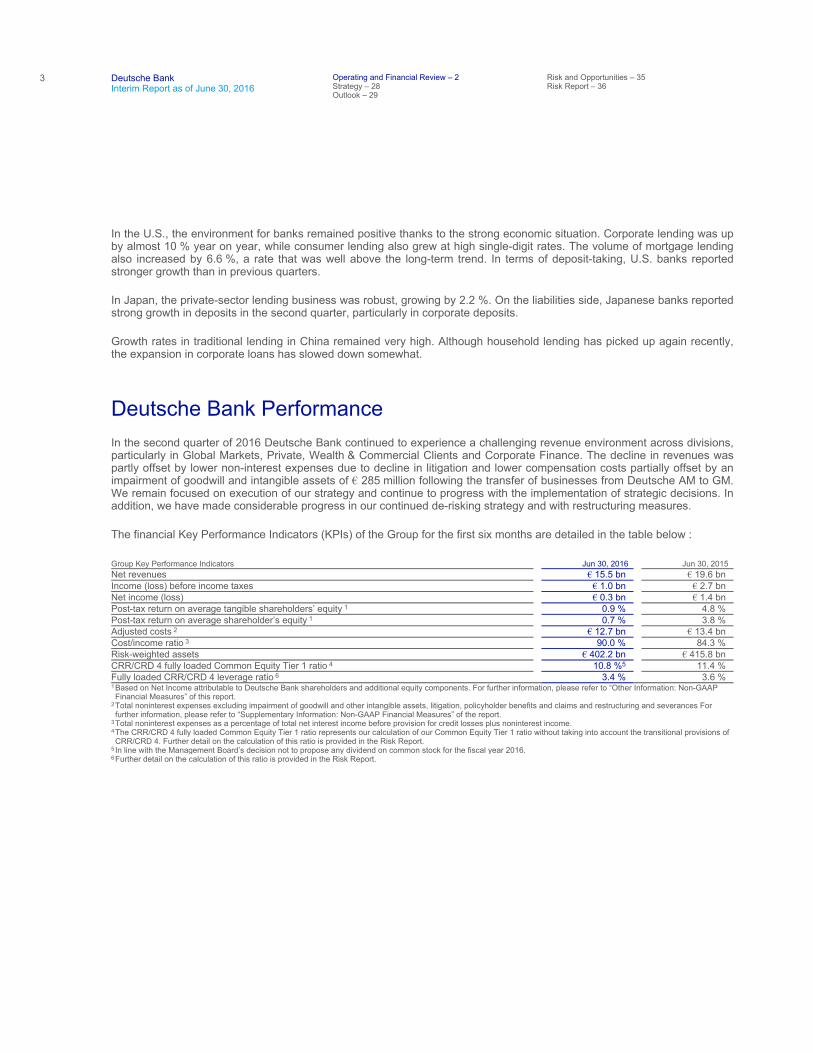
In the U.S., the environment for banks remained positive thanks to the strong economic situation. Corporate lending was up by almost 10 % year on year, while consumer lending also grew at high single-digit rates. The volume of mortgage lending also increased by 6.6 %, a rate that was well above the long-term trend. In terms of deposit-taking, U.S. banks reported stronger growth than in previous quarters.
In Japan, the private-sector lending business was robust, growing by 2.2 %. On the liabilities side, Japanese banks reported strong growth in deposits in the second quarter, particularly in corporate deposits.
Growth rates in traditional lending in China remained very high. Although household lending has picked up again recently, the expansion in corporate loans has slowed down somewhat.
Deutsche Bank Performance In the second quarter of 2016 Deutsche Bank continued to experience a challenging revenue environment across divisions, particularly in Global Markets, Private, Wealth & Commercial Clients and Corporate Finance. The decline in revenues was partly offset by lower non-interest expenses due to decline in litigation and lower compensation costs partially offset by an impairment of goodwill and intangible assets of € 285 million following the transfer of businesses from Deutsche AM to GM. We remain focused on execution of our strategy and continue to progress with the implementation of strategic decisions. In addition, we have made considerable progress in our continued de-risking strategy and with restructuring measures.
The financial Key Performance Indicators (KPIs) of the Group for the first six months are detailed in the table below : Group Key Performance Indicators Jun 30, 2016 Jun 30, 2015Net revenues € 15.5 bn € 19.6 bn Income (loss) before income taxes € 1.0 bn € 2.7 bn Net income (loss) € 0.3 bn € 1.4 bn Post-tax return on average tangible shareholders’ equity 1 0.9 % 4.8 % Post-tax return on average shareholder’s equity 1 0.7 % 3.8 % Adjusted costs 2 € 12.7 bn € 13.4 bn Cost/income ratio 3 90.0 % 84.3 % Risk-weighted assets € 402.2 bn € 415.8 bn CRR/CRD 4 fully loaded Common Equity Tier 1 ratio 4 10.8 %5 11.4 % Fully loaded CRR/CRD 4 leverage ratio 6 3.4 % 3.6 % 1Based on Net Income attributable to Deutsche Bank shareholders and additional equity components. For further information, please refer to “Other Information: Non-GAAP Financial Measures” of this report.
2Total noninterest expenses excluding impairment of goodwill and other intangible assets, litigation, policyholder benefits and claims and restructuring and severances For further information, please refer to “Supplementary Information: Non-GAAP Financial Measures” of the report.
3Total noninterest expenses as a percentage of total net interest income before provision for credit losses plus noninterest income. 4The CRR/CRD 4 fully loaded Common Equity Tier 1 ratio represents our calculation of our Common Equity Tier 1 ratio without taking into account the transitional provisions of CRR/CRD 4. Further detail on the calculation of this ratio is provided in the Risk Report.
5 In line with the Management Board’s decision not to propose any dividend on common stock for the fiscal year 2016. 6Further detail on the calculation of this ratio is provided in the Risk Report.
Deutsche Bank 1 – Management Report 4Interim Report as of June 30, 2016
Consolidated Results of Operations
N/M – Not meaningful
2016 to 2015 Three Months Comparison
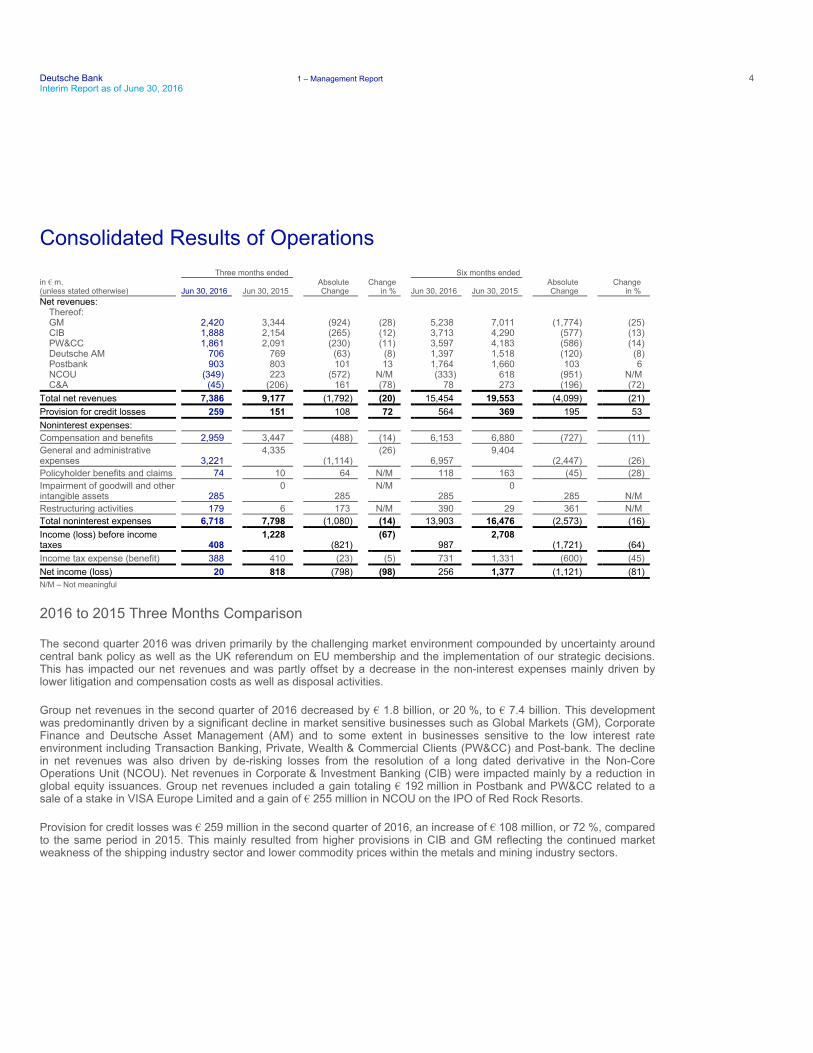
The second quarter 2016 was driven primarily by the challenging market environment compounded by uncertainty around central bank policy as well as the UK referendum on EU membership and the implementation of our strategic decisions. This has impacted our net revenues and was partly offset by a decrease in the non-interest expenses mainly driven by lower litigation and compensation costs as well as disposal activities.
Group net revenues in the second quarter of 2016 decreased by € 1.8 billion, or 20 %, to € 7.4 billion. This development was predominantly driven by a significant decline in market sensitive businesses such as Global Markets (GM), Corporate Finance and Deutsche Asset Management (AM) and to some extent in businesses sensitive to the low interest rate environment including Transaction Banking, Private, Wealth & Commercial Clients (PW&CC) and Post-bank. The decline in net revenues was also driven by de-risking losses from the resolution of a long dated derivative in the Non-Core Operations Unit (NCOU). Net revenues in Corporate & Investment Banking (CIB) were impacted mainly by a reduction in global equity issuances. Group net revenues included a gain totaling € 192 million in Postbank and PW&CC related to a sale of a stake in VISA Europe Limited and a gain of € 255 million in NCOU on the IPO of Red Rock Resorts.
Provision for credit losses was € 259 million in the second quarter of 2016, an increase of € 108 million, or 72 %, compared to the same period in 2015. This mainly resulted from higher provisions in CIB and GM reflecting the continued market weakness of the shipping industry sector and lower commodity prices within the metals and mining industry sectors.
Three months ended Six months ended in € m. (unless stated otherwise) Jun 30, 2016 Jun 30, 2015
Absolute Change
Change in % Jun 30, 2016 Jun 30, 2015
Absolute Change
Change in %
Net revenues: Thereof: GM 2,420 3,344 (924) (28) 5,238 7,011 (1,774) (25) CIB 1,888 2,154 (265) (12) 3,713 4,290 (577) (13) PW&CC 1,861 2,091 (230) (11) 3,597 4,183 (586) (14) Deutsche AM 706 769 (63) (8) 1,397 1,518 (120) (8) Postbank 903 803 101 13 1,764 1,660 103 6 NCOU (349) 223 (572) N/M (333) 618 (951) N/M C&A (45) (206) 161 (78) 78 273 (196) (72)
Total net revenues 7,386 9,177 (1,792) (20) 15,454 19,553 (4,099) (21)
Provision for credit losses 259 151 108 72 564 369 195 53
Noninterest expenses:
Compensation and benefits 2,959 3,447 (488) (14) 6,153 6,880 (727) (11)
General and administrative expenses 3,221
4,335 (1,114)
(26) 6,957
9,404 (2,447) (26)
Policyholder benefits and claims 74 10 64 N/M 118 163 (45) (28)
Impairment of goodwill and other intangible assets 285
0 285
N/M 285
0 285 N/M
Restructuring activities 179 6 173 N/M 390 29 361 N/M
Total noninterest expenses 6,718 7,798 (1,080) (14) 13,903 16,476 (2,573) (16)
Income (loss) before income taxes 408
1,228 (821)
(67) 987
2,708 (1,721) (64)
Income tax expense (benefit) 388 410 (23) (5) 731 1,331 (600) (45)
Net income (loss) 20 818 (798) (98) 256 1,377 (1,121) (81)
5
Deutsche Bank Interim Report as of June 30, 2016
Operating and Financial Review – 2 Strategy – 28 Outlook – 29
Risk and Opportunities – 35 Risk Report – 36
Noninterest expenses were € 6.7 billion, a decrease of € 1.1 billion, or 14 % in the second quarter of 2016 as compared to second quarter of 2015, with lower litigation costs being the main driver. Compensation and benefits amounted to € 3.0 billion, down by € 488 million or 14 %, mainly driven by lower variable compensation, partially offset by higher fixed compensation. General and administrative expenses of € 3.2 billion decreased by € 1.1 billion, or 26 %, primarily due to significantly lower litigation charges as compared to second quarter of 2015, partly offset by higher IT costs. Noninterest expenses were further impacted by restructuring costs of € 179 million, primarily driven by Infrastructure optimization, and by an impairment of Goodwill and intangible assets of € 285 million in GM, following the transfer of certain businesses from Deutsche AM.
Income before income taxes was € 408 million in the second quarter of 2016 versus € 1.2 billion in the second quarter of 2015. This decrease was predominantly driven by a decline in revenues.
Net income in the second quarter 2016 was € 20 million, compared to net income of € 818 million in the second quarter 2015. Income tax expense in the second quarter 2016 was € 388 million versus € 410 million in the second quarter of 2015. The effective tax rate of 95 % was mainly impacted by non-tax deductible goodwill impairment and litigation charges, and tax effects related to share based payments. The prior year’s quarter effective tax rate was 33 %.
2016 to 2015 Six Months Comparison
The first six months of 2016 were impacted by a challenging market environment, lower client activities and the implementation of strategic decisions. This has resulted in lower net revenues and was partly offset by a decrease in non-interest expenses mainly driven by lower litigation and compensation costs as well as disposal activities.
Group net revenues in the first six months of 2016 decreased by € 4.1 billion, or 21 %, to € 15.5 billion compared to € 19.6 billion in the first six months of 2015. Revenues were impacted mainly by challenging market conditions, higher volatility and lower client activity particularly in GM, Corporate Finance and Deutsche AM. The low interest rate environment impacted the revenues for Transaction Banking, PW&CC and Postbank. Revenues in NCOU were lower mainly driven by asset sales and the absence of a specific litigation recovery, as compared to the first six months of 2015.
Provisions for credit losses were € 564 million, in the first six months of 2016, an increase of € 195 million, or 53 %, compared to the same period in 2015. This mainly resulted from higher provisions in CIB and GM reflecting the continued market weakness of the shipping industry sector and lower commodity prices within the metals and mining industry sectors along with higher provisions for IAS 39 reclassified assets within our European Mortgage Portfolios recorded in NCOU. These increases were partly offset by lower provisions in PW&CC as well as in Postbank among others reflecting the quality of the loan portfolio and the benign economic environment.
Noninterest expenses were € 13.9 billion in the first six months of 2016, a decrease of € 2.6 billion, or 16 %, compared to the same period in 2015. The reduction in noninterest expenses was mainly driven by lower litigation related expenses. Compensation and benefits amounted to € 6.2 billion, decreased by € 727 million or 11 % mainly driven by lower variable compensation partially offset by higher fixed compensation. General and administrative expenses were € 7.0 billion, a decline of € 2.4 billion, or 26 %, mainly driven by lower litigation costs, and partially offset by higher IT costs. Noninterest expenses were further impacted by an increase in restructuring costs of € 361 million and by the aforementioned impairment of goodwill and intangible assets of € 285 million in GM.
Deutsche Bank 1 – Management Report 6Interim Report as of June 30, 2016
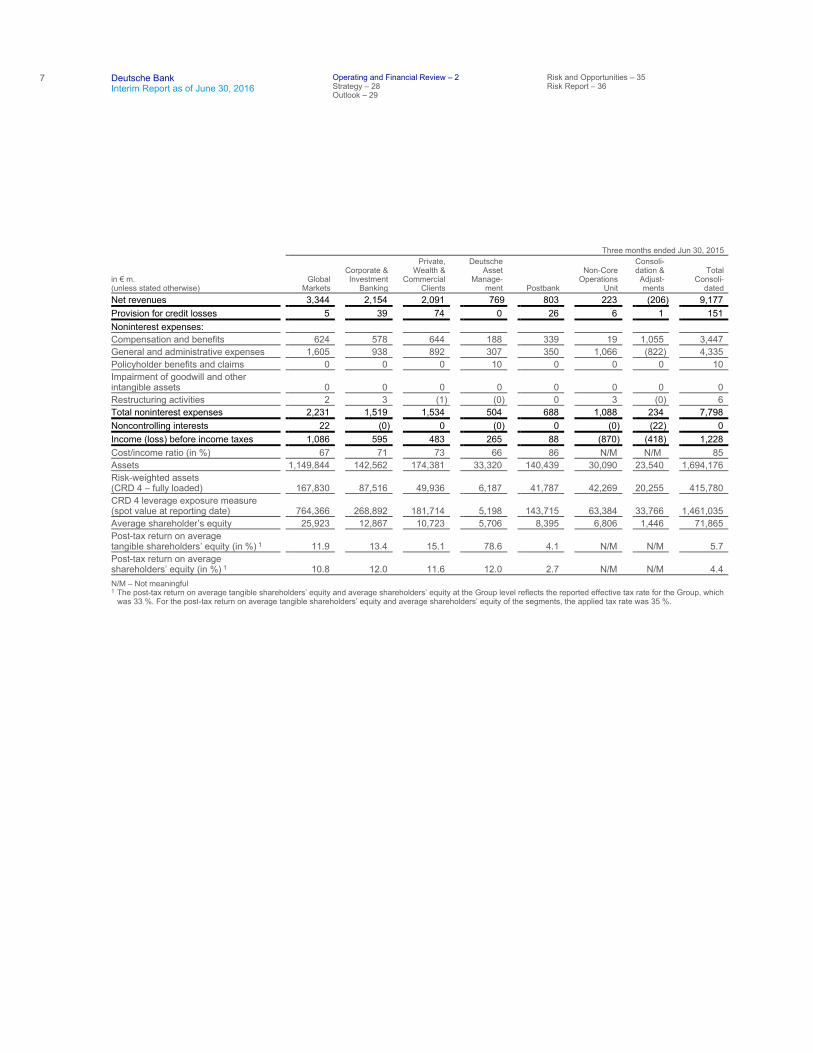
Group income before income taxes was € 1.0 billion in the first six months of 2016 versus € 2.7 billion in the first six months of 2015. This decrease was predominantly driven by lower revenues, partly offset by a decrease in noninterest expenses, mainly from lower litigation costs.
Net income for the first six months of 2016 was € 256 million compared to € 1.4 billion in the first six months of 2015. Income tax expense was € 731 million in the first six months of 2016 against € 1.3 billion in the comparative period. The effective tax rate of 74 % was mainly impacted by non-tax deductible goodwill impairment and litigation charges, and tax effects related to share based payments. In the first half of 2015 the effective tax rate was 49 %.
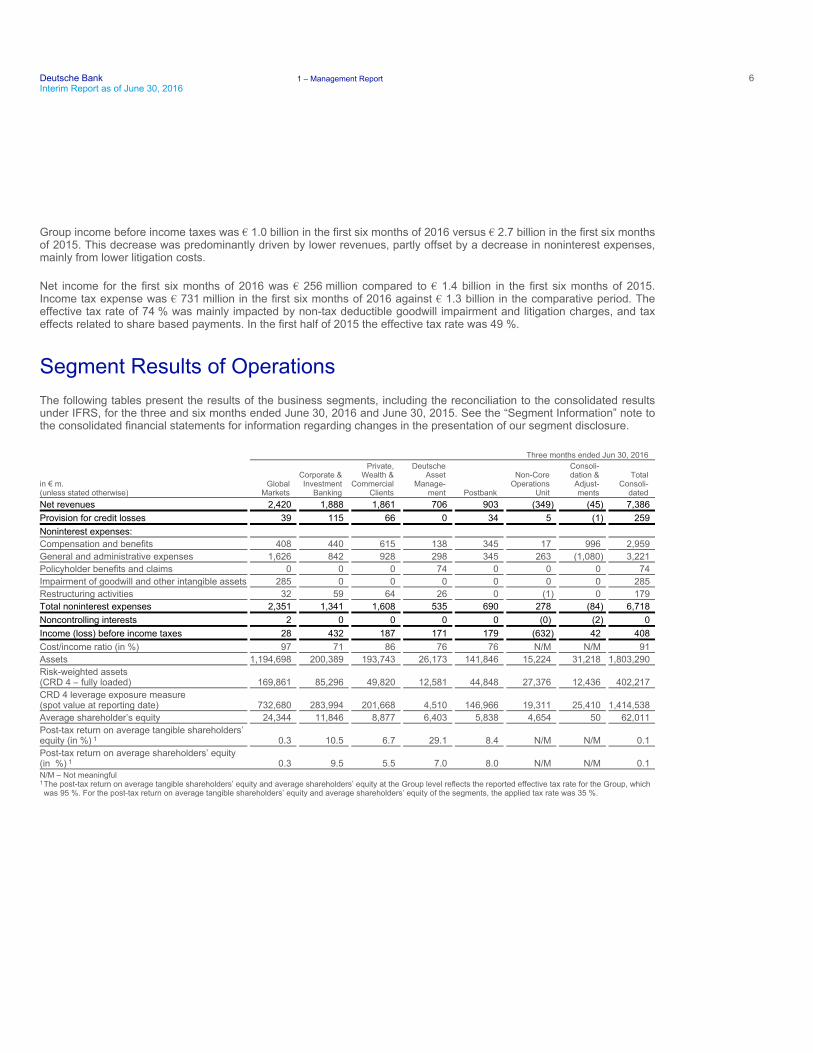
Segment Results of Operations The following tables present the results of the business segments, including the reconciliation to the consolidated results under IFRS, for the three and six months ended June 30, 2016 and June 30, 2015. See the “Segment Information” note to the consolidated financial statements for information regarding changes in the presentation of our segment disclosure.
N/M – Not meaningful
Three months ended Jun 30, 2016
in € m. (unless stated otherwise)
Global Markets
Corporate & Investment
Banking
Private, Wealth &
Commercial Clients
Deutsche Asset
Manage- ment Postbank
Non-Core Operations
Unit
Consoli- dation & Adjust- ments
Total Consoli-
dated
Net revenues 2,420 1,888 1,861 706 903 (349) (45) 7,386
Provision for credit losses 39 115 66 0 34 5 (1) 259
Noninterest expenses:
Compensation and benefits 408 440 615 138 345 17 996 2,959
General and administrative expenses 1,626 842 928 298 345 263 (1,080) 3,221
Policyholder benefits and claims 0 0 0 74 0 0 0 74
Impairment of goodwill and other intangible assets 285 0 0 0 0 0 0 285
Restructuring activities 32 59 64 26 0 (1) 0 179
Total noninterest expenses 2,351 1,341 1,608 535 690 278 (84) 6,718
Noncontrolling interests 2 0 0 0 0 (0) (2) 0
Income (loss) before income taxes 28 432 187 171 179 (632) 42 408
Cost/income ratio (in %) 97 71 86 76 76 N/M N/M 91
Assets 1,194,698 200,389 193,743 26,173 141,846 15,224 31,218 1,803,290
Risk-weighted assets (CRD 4 – fully loaded) 169,861 85,296 49,820 12,581 44,848 27,376 12,436 402,217
CRD 4 leverage exposure measure (spot value at reporting date) 732,680 283,994 201,668 4,510 146,966 19,311 25,410 1,414,538
Average shareholder’s equity 24,344 11,846 8,877 6,403 5,838 4,654 50 62,011
Post-tax return on average tangible shareholders’ equity (in %) 1 0.3 10.5 6.7 29.1 8.4 N/M N/M 0.1
Post-tax return on average shareholders’ equity (in %) 1 0.3 9.5 5.5 7.0 8.0 N/M N/M 0.1
1The post-tax return on average tangible shareholders’ equity and average shareholders’ equity at the Group level reflects the reported effective tax rate for the Group, which was 95 %. For the post-tax return on average tangible shareholders’ equity and average shareholders’ equity of the segments, the applied tax rate was 35 %.
7
Deutsche Bank Interim Report as of June 30, 2016
Operating and Financial Review – 2 Strategy – 28 Outlook – 29
Risk and Opportunities – 35 Risk Report – 36
N/M – Not meaningful
Three months ended Jun 30, 2015
in € m. (unless stated otherwise)
Global Markets
Corporate & Investment
Banking
Private, Wealth &
Commercial Clients
Deutsche Asset
Manage- ment Postbank
Non-Core Operations
Unit
Consoli- dation &
Adjust- ments
Total Consoli-
dated
Net revenues 3,344 2,154 2,091 769 803 223 (206) 9,177
Provision for credit losses 5 39 74 0 26 6 1 151
Noninterest expenses:
Compensation and benefits 624 578 644 188 339 19 1,055 3,447
General and administrative expenses 1,605 938 892 307 350 1,066 (822) 4,335
Policyholder benefits and claims 0 0 0 10 0 0 0 10
Impairment of goodwill and other intangible assets 0 0 0 0 0 0 0 0
Restructuring activities 2 3 (1) (0) 0 3 (0) 6
Total noninterest expenses 2,231 1,519 1,534 504 688 1,088 234 7,798
Noncontrolling interests 22 (0) 0 (0) 0 (0) (22) 0
Income (loss) before income taxes 1,086 595 483 265 88 (870) (418) 1,228
Cost/income ratio (in %) 67 71 73 66 86 N/M N/M 85
Assets 1,149,844 142,562 174,381 33,320 140,439 30,090 23,540 1,694,176
Risk-weighted assets (CRD 4 – fully loaded) 167,830 87,516 49,936 6,187 41,787 42,269 20,255 415,780
CRD 4 leverage exposure measure (spot value at reporting date) 764,366 268,892 181,714 5,198 143,715 63,384 33,766 1,461,035
Average shareholder’s equity 25,923 12,867 10,723 5,706 8,395 6,806 1,446 71,865
Post-tax return on average tangible shareholders’ equity (in %) 1 11.9 13.4 15.1 78.6 4.1 N/M N/M 5.7
Post-tax return on average shareholders’ equity (in %) 1 10.8 12.0 11.6 12.0 2.7 N/M N/M 4.4
1 The post-tax return on average tangible shareholders’ equity and average shareholders’ equity at the Group level reflects the reported effective tax rate for the Group, which was 33 %. For the post-tax return on average tangible shareholders’ equity and average shareholders’ equity of the segments, the applied tax rate was 35 %.
Deutsche Bank 1 – Management Report 8Interim Report as of June 30, 2016
N/M – Not meaningful
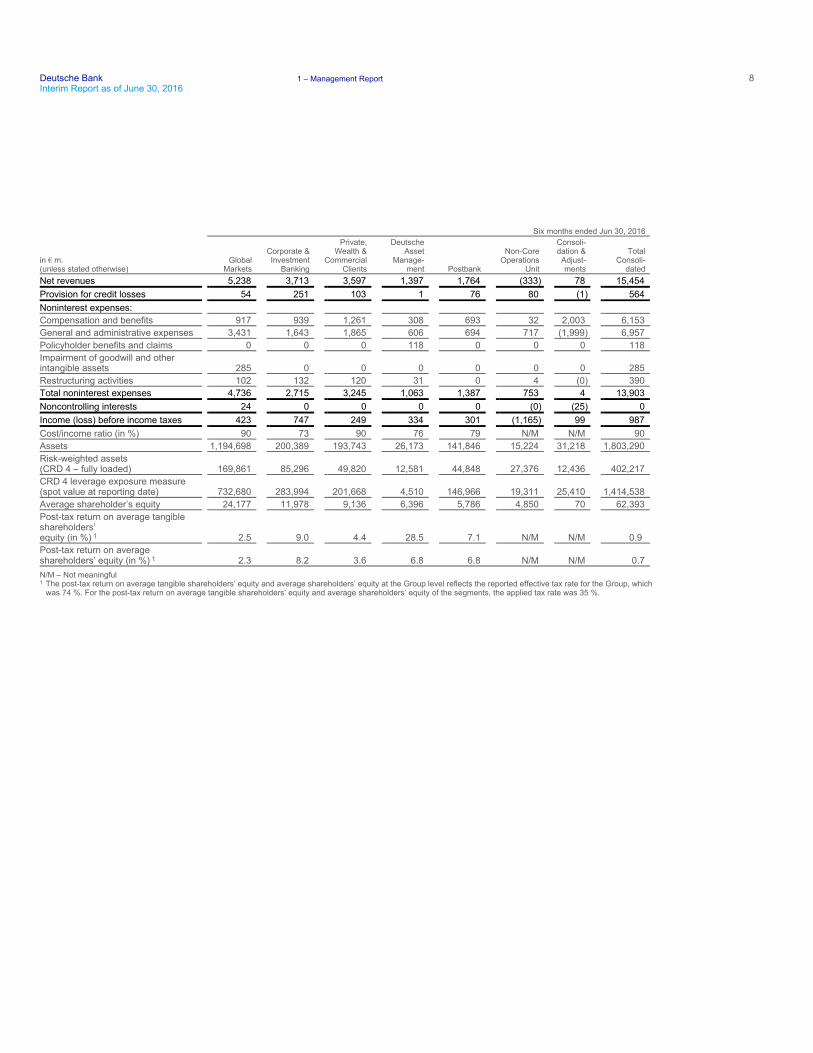
Six months ended Jun 30, 2016
in € m. (unless stated otherwise)
Global Markets
Corporate & Investment
Banking
Private, Wealth &
Commercial Clients
Deutsche Asset
Manage- ment Postbank
Non-Core Operations
Unit
Consoli- dation &
Adjust- ments
Total Consoli-
dated
Net revenues 5,238 3,713 3,597 1,397 1,764 (333) 78 15,454
Provision for credit losses 54 251 103 1 76 80 (1) 564
Noninterest expenses:
Compensation and benefits 917 939 1,261 308 693 32 2,003 6,153
General and administrative expenses 3,431 1,643 1,865 606 694 717 (1,999) 6,957
Policyholder benefits and claims 0 0 0 118 0 0 0 118
Impairment of goodwill and other intangible assets 285 0 0 0 0 0 0 285
Restructuring activities 102 132 120 31 0 4 (0) 390
Total noninterest expenses 4,736 2,715 3,245 1,063 1,387 753 4 13,903
Noncontrolling interests 24 0 0 0 0 (0) (25) 0
Income (loss) before income taxes 423 747 249 334 301 (1,165) 99 987
Cost/income ratio (in %) 90 73 90 76 79 N/M N/M 90
Assets 1,194,698 200,389 193,743 26,173 141,846 15,224 31,218 1,803,290
Risk-weighted assets (CRD 4 – fully loaded) 169,861 85,296 49,820 12,581 44,848 27,376 12,436 402,217
CRD 4 leverage exposure measure (spot value at reporting date) 732,680 283,994 201,668 4,510 146,966 19,311 25,410 1,414,538
Average shareholder’s equity 24,177 11,978 9,136 6,396 5,786 4,850 70 62,393
Post-tax return on average tangible shareholders’ equity (in %) 1 2.5 9.0 4.4 28.5 7.1 N/M N/M 0.9
Post-tax return on average shareholders’ equity (in %) 1 2.3 8.2 3.6 6.8 6.8 N/M N/M 0.7
1 The post-tax return on average tangible shareholders’ equity and average shareholders’ equity at the Group level reflects the reported effective tax rate for the Group, which was 74 %. For the post-tax return on average tangible shareholders’ equity and average shareholders’ equity of the segments, the applied tax rate was 35 %.
9
Deutsche Bank Interim Report as of June 30, 2016
Operating and Financial Review – 2 Strategy – 28 Outlook – 29
Risk and Opportunities – 35 Risk Report – 36
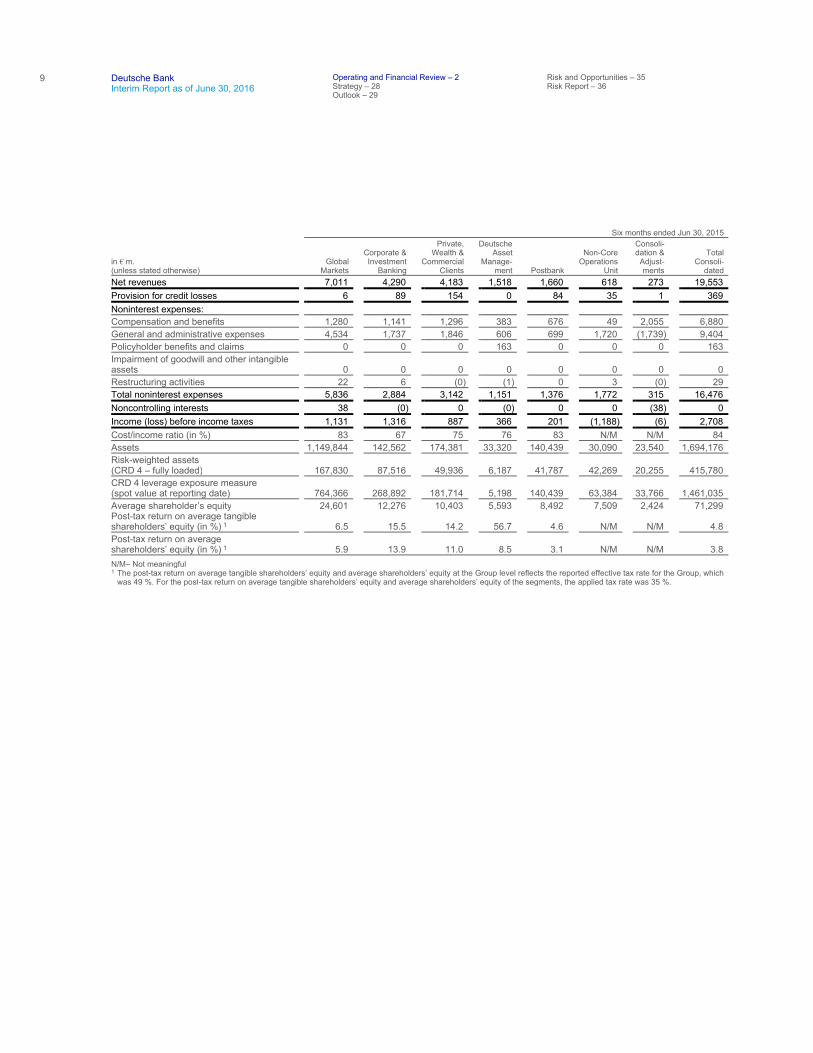
Six months ended Jun 30, 2015
in € m. (unless stated otherwise)
Global Markets
Corporate & Investment
Banking
Private, Wealth &
Commercial Clients
Deutsche Asset
Manage- ment Postbank
Non-Core Operations
Unit
Consoli- dation &
Adjust- ments
Total Consoli-
dated
Net revenues 7,011 4,290 4,183 1,518 1,660 618 273 19,553
Provision for credit losses 6 89 154 0 84 35 1 369
Noninterest expenses:
Compensation and benefits 1,280 1,141 1,296 383 676 49 2,055 6,880
General and administrative expenses 4,534 1,737 1,846 606 699 1,720 (1,739) 9,404
Policyholder benefits and claims 0 0 0 163 0 0 0 163
Impairment of goodwill and other intangible assets 0 0 0 0 0 0 0 0
Restructuring activities 22 6 (0) (1) 0 3 (0) 29
Total noninterest expenses 5,836 2,884 3,142 1,151 1,376 1,772 315 16,476
Noncontrolling interests 38 (0) 0 (0) 0 0 (38) 0
Income (loss) before income taxes 1,131 1,316 887 366 201 (1,188) (6) 2,708
Cost/income ratio (in %) 83 67 75 76 83 N/M N/M 84
Assets 1,149,844 142,562 174,381 33,320 140,439 30,090 23,540 1,694,176
Risk-weighted assets (CRD 4 – fully loaded) 167,830 87,516 49,936 6,187 41,787 42,269 20,255 415,780
CRD 4 leverage exposure measure (spot value at reporting date) 764,366 268,892 181,714 5,198 140,439 63,384 33,766 1,461,035
Average shareholder’s equity 24,601 12,276 10,403 5,593 8,492 7,509 2,424 71,299 Post-tax return on average tangible shareholders’ equity (in %) 1 6.5 15.5 14.2 56.7 4.6 N/M N/M 4.8
Post-tax return on average shareholders’ equity (in %) 1 5.9 13.9 11.0 8.5 3.1 N/M N/M 3.8
N/M– Not meaningful 1 The post-tax return on average tangible shareholders’ equity and average shareholders’ equity at the Group level reflects the reported effective tax rate for the Group, which
was 49 %. For the post-tax return on average tangible shareholders’ equity and average shareholders’ equity of the segments, the applied tax rate was 35 %.
Deutsche Bank 1 – Management Report 10Interim Report as of June 30, 2016
Corporate Divisions
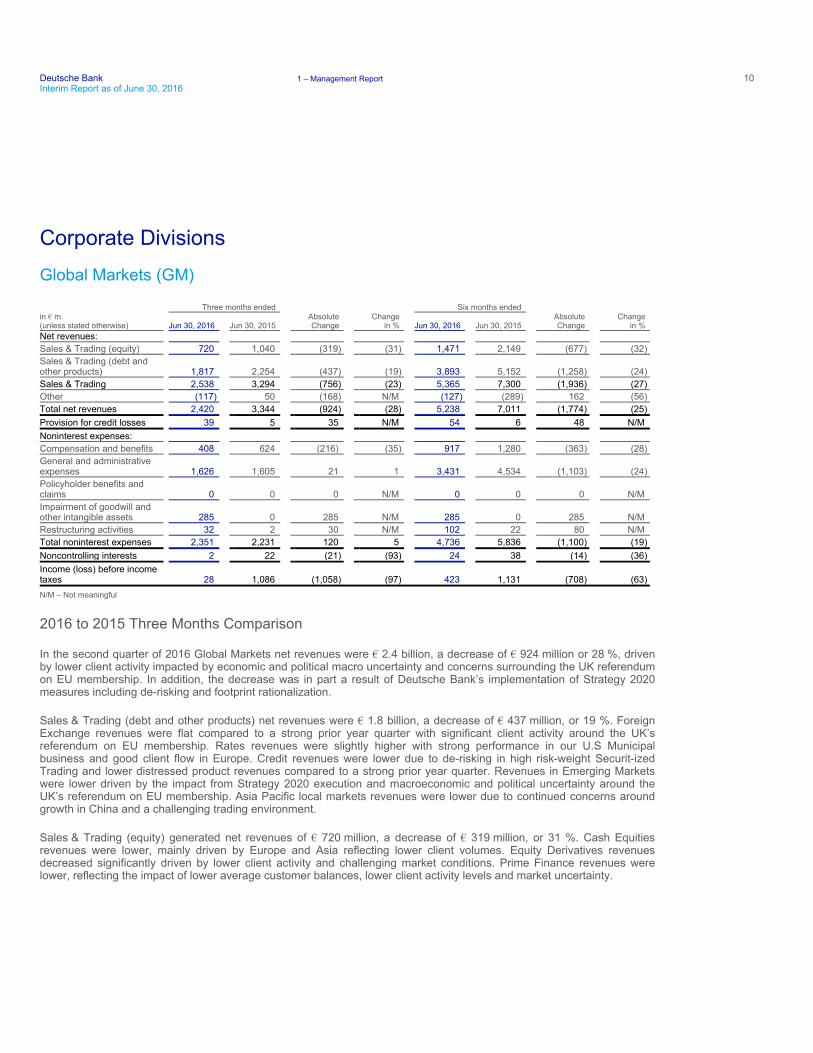
Global Markets (GM)
N/M – Not meaningful
2016 to 2015 Three Months Comparison
In the second quarter of 2016 Global Markets net revenues were € 2.4 billion, a decrease of € 924 million or 28 %, driven by lower client activity impacted by economic and political macro uncertainty and concerns surrounding the UK referendum on EU membership. In addition, the decrease was in part a result of Deutsche Bank’s implementation of Strategy 2020 measures including de-risking and footprint rationalization.
Sales & Trading (debt and other products) net revenues were € 1.8 billion, a decrease of € 437 million, or 19 %. Foreign Exchange revenues were flat compared to a strong prior year quarter with significant client activity around the UK’s referendum on EU membership. Rates revenues were slightly higher with strong performance in our U.S Municipal business and good client flow in Europe. Credit revenues were lower due to de-risking in high risk-weight Securit-ized Trading and lower distressed product revenues compared to a strong prior year quarter. Revenues in Emerging Markets were lower driven by the impact from Strategy 2020 execution and macroeconomic and political uncertainty around the UK’s referendum on EU membership. Asia Pacific local markets revenues were lower due to continued concerns around growth in China and a challenging trading environment.
Sales & Trading (equity) generated net revenues of € 720 million, a decrease of € 319 million, or 31 %. Cash Equities revenues were lower, mainly driven by Europe and Asia reflecting lower client volumes. Equity Derivatives revenues decreased significantly driven by lower client activity and challenging market conditions. Prime Finance revenues were lower, reflecting the impact of lower average customer balances, lower client activity levels and market uncertainty.
Three months ended Six months ended in € m. (unless stated otherwise) Jun 30, 2016 Jun 30, 2015
Absolute Change
Change in % Jun 30, 2016 Jun 30, 2015
Absolute Change
Change in %
Net revenues:
Sales & Trading (equity) 720 1,040 (319) (31) 1,471 2,149 (677) (32)
Sales & Trading (debt and other products) 1,817 2,254 (437) (19) 3,893 5,152 (1,258) (24)
Sales & Trading 2,538 3,294 (756) (23) 5,365 7,300 (1,936) (27)
Other (117) 50 (168) N/M (127) (289) 162 (56)
Total net revenues 2,420 3,344 (924) (28) 5,238 7,011 (1,774) (25)
Provision for credit losses 39 5 35 N/M 54 6 48 N/M
Noninterest expenses:
Compensation and benefits 408 624 (216) (35) 917 1,280 (363) (28)
General and administrative expenses 1,626 1,605 21 1 3,431 4,534 (1,103) (24)
Policyholder benefits and claims 0 0 0 N/M 0 0 0 N/M
Impairment of goodwill and other intangible assets 285 0 285 N/M 285 0 285 N/M
Restructuring activities 32 2 30 N/M 102 22 80 N/M
Total noninterest expenses 2,351 2,231 120 5 4,736 5,836 (1,100) (19)
Noncontrolling interests 2 22 (21) (93) 24 38 (14) (36)
Income (loss) before income taxes 28 1,086 (1,058) (97) 423 1,131 (708) (63)
11
Deutsche Bank Interim Report as of June 30, 2016
Operating and Financial Review – 2 Strategy – 28 Outlook – 29
Risk and Opportunities – 35 Risk Report – 36
Other revenues were negative € 117 million, compared to a gain of € 50 million in 2015. Other revenues included transfers from and to Corporate & Investment Banking resulting from client coverage and product distribution, as well as three offsetting valuation adjustment items. First, a mark-to-market gain of € 43 million (2015: a gain of € 98 million) relating to RWA mitigation efforts arising on Credit Valuation Adjustment (CVA). Second, a Funding Valuation Adjustment (FVA) loss of € 30 million (2015: a loss of € 40 million). Third, a loss of € 11 million (2015: a gain of € 105 million) relating to the impact of a Debt Valuation Adjustment (DVA) on certain derivative liabilities.
In provisions for credit losses, Global Markets recorded a net charge of € 39 million (2015: net charge of € 5 million), driven by a small number of exposures mainly in the metals & mining industry sector.
Noninterest expenses were € 2.4 billion, an increase of € 120 million compared to the prior year quarter and included an impairment of € 285 million for goodwill. In the second quarter of 2016, the Fund Solutions and Certificates and Warrants businesses were transferred to Global Markets from Deutsche Asset Management. As part of the transferred businesses from Deutsche Asset Management, goodwill was also re-assigned to Global Markets based on relative values in accordance with IFRS. The subsequent impairment review led to an impairment loss of € 285 million in Global Markets. Lower compensation and benefit costs and litigation charges were partly offset by higher spend on technology and control.
Income before income taxes was a gain of € 28 million (2015: income € 1.1 billion). The decrease was mainly driven by lower revenues.
2016 to 2015 Six Months Comparison
In the first six months of 2016, Global Markets performance was impacted by a challenging market environment and lower client activity reflecting uncertainty around central bank policy decisions and the UK referendum on EU membership. Revenues also reflected the impact of the implementation of several Strategy 2020 initiatives, including de-risking and footprint rationalization. Net revenues were € 5.2 billion, a decrease of € 1.8 billion or 25 %.
Sales & Trading (debt and other products) net revenues were € 3.9 billion, a decrease of € 1.3 billion, or 24 %. Foreign Exchange revenues were lower compared to a strong first half of 2015. Rates revenues were lower due to a challenging market environment particularly in the first quarter of 2016. Credit revenues were lower with challenging market conditions impacting flow businesses while financing products continued to perform well. Revenues were also impacted by de-risking in high risk-weight securitized trading under Strategy 2020. Revenues in Emerging Markets were lower driven by country exits as part of Strategy 2020 implementation and a weak environment impacted by macro uncertainty.
Sales & Trading (equity) generated net revenues of € 1.5 billion, a decrease of € 677 million, or 32 %. Cash Equities revenues were significantly lower, mainly driven by Europe and Asia reflecting lower client volumes. Equity Derivatives revenues decreased significantly due to lower client activity and challenging market conditions. Revenues in Prime Finance were in line with the prior year comparative period.
Other revenues were negative € 127 million (2015: negative € 289 million). Other revenues included transfers from and to Corporate & Investment Banking resulting from client coverage and product distribution, as well as three valuation adjustment items totaling a gain of € 145 million. First, a mark-to-market gain of € 65 million (2015: a gain of € 80 million) relating to RWA mitigation efforts arising on Credit Valuation Adjustment (CVA). Second, a Funding Valuation Adjustment (FVA) loss of € 112 million (2015: a loss of € 184 million including a negative impact of € 84 million due to a calculation refinement). Third, a gain of € 191 million (2015: a gain of € 92 million) relating to the impact of a Debt Valuation Adjustment (DVA) on certain derivative liabilities.
In provisions for credit losses, Global Markets recorded a net charge of € 54 million (2015: net charge of € 6 million), driven by a small number of exposures mainly in the metals & mining industry sector.
Deutsche Bank 1 – Management Report 12Interim Report as of June 30, 2016
Noninterest expenses decreased by € 1.1 billion, or 19 %. This decrease was primarily due to a reduction in litigation costs of € 1.4 billion, lower cash bonus and retention costs and favorable exchange rate movements, partially offset by the aforementioned impairment of € 285 million of goodwill, which had been re-assigned from Deutsche Asset Management to Global Markets as part of business transfers based on relative values in accordance with IFRS.
Income before income taxes was € 423 million (2015: income of € 1.1 billion). The decrease was mainly driven by lower revenues, partly offset by lower litigation charges.
Corporate & Investment Banking Corporate Division (CIB)
N/M – Not meaningful
2016 to 2015 Three Months Comparison
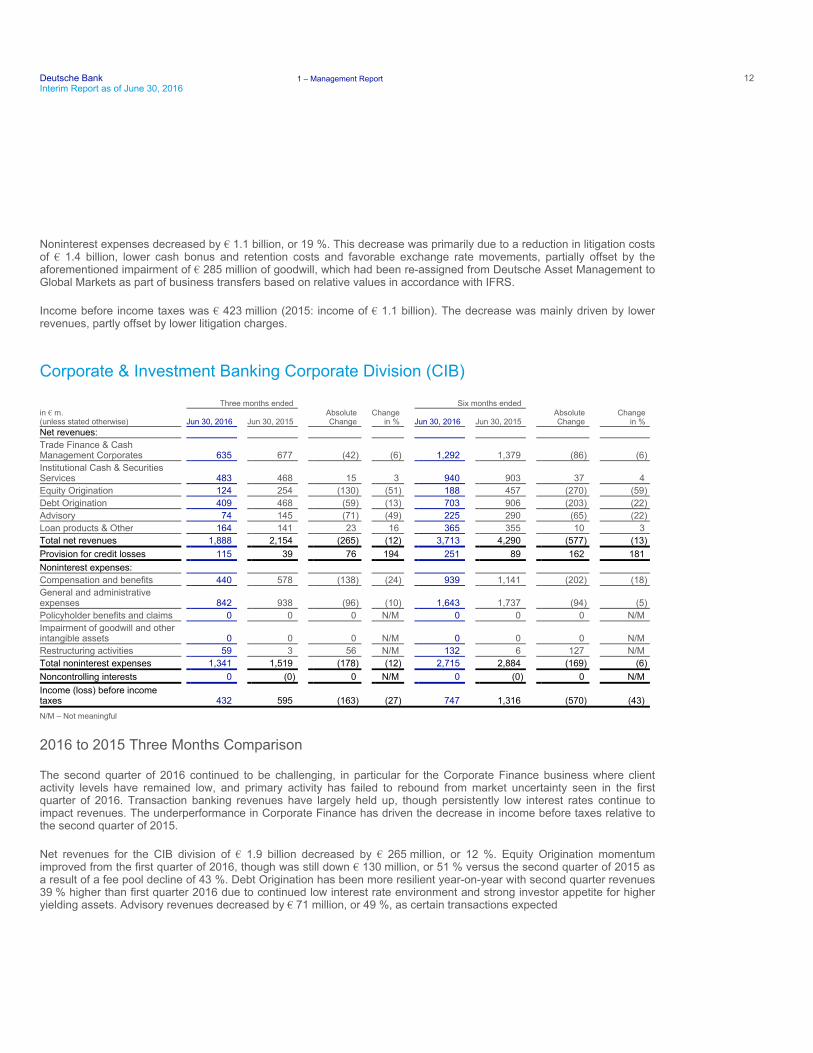
The second quarter of 2016 continued to be challenging, in particular for the Corporate Finance business where client activity levels have remained low, and primary activity has failed to rebound from market uncertainty seen in the first quarter of 2016. Transaction banking revenues have largely held up, though persistently low interest rates continue to impact revenues. The underperformance in Corporate Finance has driven the decrease in income before taxes relative to the second quarter of 2015.
Net revenues for the CIB division of € 1.9 billion decreased by € 265 million, or 12 %. Equity Origination momentum improved from the first quarter of 2016, though was still down € 130 million, or 51 % versus the second quarter of 2015 as a result of a fee pool decline of 43 %. Debt Origination has been more resilient year-on-year with second quarter revenues 39 % higher than first quarter 2016 due to continued low interest rate environment and strong investor appetite for higher yielding assets. Advisory revenues decreased by € 71 million, or 49 %, as certain transactions expected
Three months ended Six months ended in € m. (unless stated otherwise) Jun 30, 2016 Jun 30, 2015
Absolute Change
Change in % Jun 30, 2016 Jun 30, 2015
Absolute Change
Change in %
Net revenues:
Trade Finance & Cash Management Corporates 635 677 (42) (6) 1,292 1,379 (86) (6)
Institutional Cash & Securities Services 483 468 15 3 940 903 37 4
Equity Origination 124 254 (130) (51) 188 457 (270) (59)
Debt Origination 409 468 (59) (13) 703 906 (203) (22)
Advisory 74 145 (71) (49) 225 290 (65) (22)
Loan products & Other 164 141 23 16 365 355 10 3
Total net revenues 1,888 2,154 (265) (12) 3,713 4,290 (577) (13)
Provision for credit losses 115 39 76 194 251 89 162 181
Noninterest expenses:
Compensation and benefits 440 578 (138) (24) 939 1,141 (202) (18)
General and administrative expenses 842 938 (96) (10) 1,643 1,737 (94) (5)
Policyholder benefits and claims 0 0 0 N/M 0 0 0 N/M
Impairment of goodwill and other intangible assets 0 0 0 N/M 0 0 0 N/M
Restructuring activities 59 3 56 N/M 132 6 127 N/M
Total noninterest expenses 1,341 1,519 (178) (12) 2,715 2,884 (169) (6)
Noncontrolling interests 0 (0) 0 N/M 0 (0) 0 N/M
Income (loss) before income taxes 432 595 (163) (27) 747 1,316 (570) (43)
13
Deutsche Bank Interim Report as of June 30, 2016
Operating and Financial Review – 2 Strategy – 28 Outlook – 29
Risk and Opportunities – 35 Risk Report – 36
to close were aborted, with others slipping to the third and fourth quarters. Trade Finance & Cash Management Corporates revenues decreased by € 42 million, or 6 %, with the persistently low interest rate environment in Europe putting pressure on Cash Management business for corporate clients. Institutional Cash and Securities Services showed a solid performance with an increase of € 15 million, or 3 %, supported by higher interest rates in the US as well as transaction volume growth. Loan products and Other revenues improved € 23 million or 16 %, related to corporate lending activity as well as transfers to and from Global Markets.
Provision for credit losses increased by € 76 million compared to the second quarter of 2015 driven by continued provisioning on exposures in shipping and metals & mining
Noninterest expenses of € 1.3 billion decreased significantly by € 178 million, or 12 %. This was driven by non-recurring litigation costs that were reported in the second quarter of 2015 along with a positive impact of lower compensation costs and tighter cost discipline. These more than offset the impact of an industry wide voluntary remediation scheme for derivatives sold to SME clients in the Netherlands prior to Deutsche Bank’s acquisition of the respective business.
Income before income taxes of € 432 million decreased by € 163 million, or 27 %, with reduced costs only partially offsetting the slowdown of revenues and an increase in provisions for credit losses.
2016 to 2015 Six Months Comparison
The first half of 2016 has seen a significant underperformance for the division compared to the first half of 2015. Transaction Banking revenues have stayed largely flat despite the continued low interest rate environment, while non interest expenses have decreased. This however, has been unable to fully offset the revenue reduction within the Corporate Finance business driven by market uncertainty and resulting lack of primary client activity.
Net revenues of € 3.7 billion were down € 577 million, or 13 %. Corporate Finance revenues are down 25 % reflecting challenging market conditions. The reduction in Equity Origination was driven by the uncertain equity market environment, primary markets having failed to rebound from market uncertainty. On the Debt side, the continued low rate environment and strong investor appetite for higher yielding assets saw an improvement of revenues during the first six months, but not enough to offset first half performance compared to 2015. Advisory revenues were down € 65 million or 22 %. Some significant transactions in the second quarter were aborted, while others expected to close in the second quarter slipped to later quarters. Within Transaction Banking, Trade Finance & Cash Management Corporates revenues decreased by € 86 million, or 6 %. Macroeconomic trends such as the low interest environment with further rate cuts in Europe, market volatility and lower trade loan volumes specifically within the Asia Pacific region all contributed downward pressure. This has been partially mitigated by a solid performance in Institutional Cash and Securities Services, for which net revenues were up € 37 million or 4 %, benefiting from increased rates and transaction volume growth both within the US.
Provision for credit losses increased by € 162 million compared to the first half of 2015 driven by continued provisioning on exposures in shipping and metals & mining (including one specific case in emerging markets in the first quarter of 2016).
Noninterest expenses of € 2.7 billion declined by € 169 million, or 6 %. Reduced fixed and variable compensation, tighter discipline on non-compensation costs and lower litigation provisions have more than offset the increase from restructuring costs within the division, in addition to the impact of an industry wide voluntary remediation scheme for derivatives sold to SME clients in the Netherlands prior to Deutsche Bank’s acquisition of the respective business.
Income before income taxes of € 747 million decreased by € 570 million, or 43 %, with reduced costs only partially offsetting the slowdown of revenues and an increase in provisions for credit losses.
Deutsche Bank 1 – Management Report 14Interim Report as of June 30, 2016
Private, Wealth & Commercial Clients Corporate Division (PW&CC)
N/M – Not meaningful
2016 to 2015 Three Months Comparison
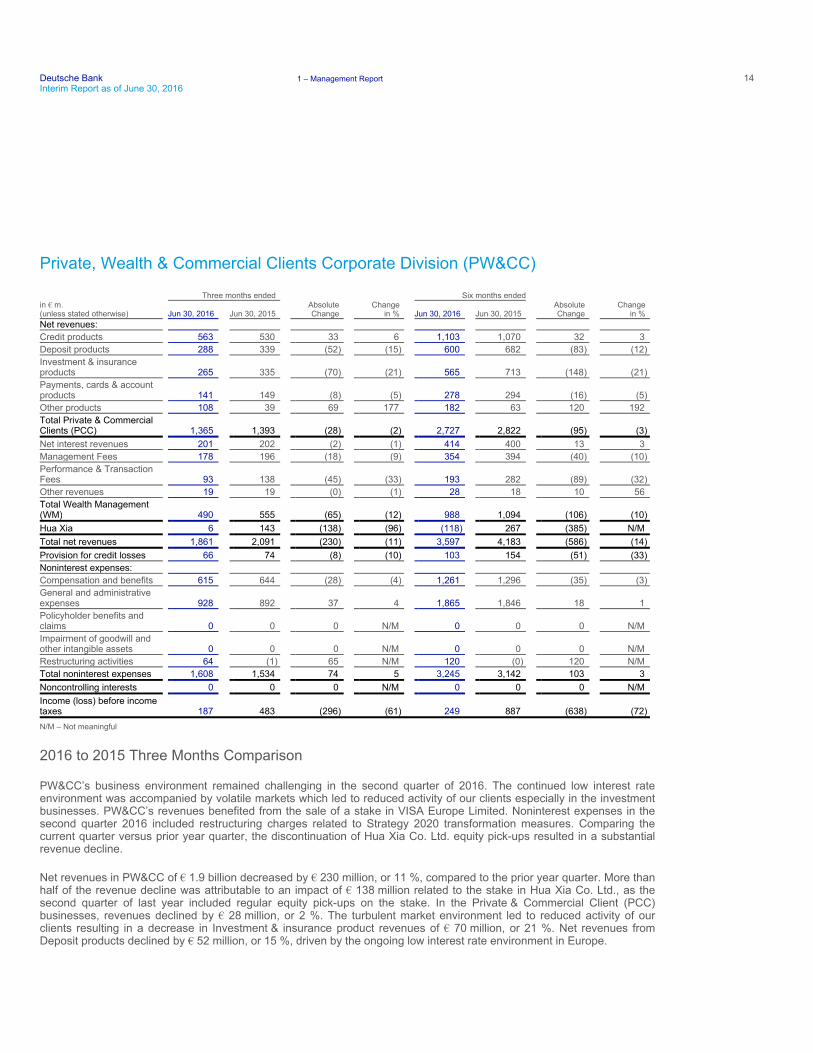
PW&CC’s business environment remained challenging in the second quarter of 2016. The continued low interest rate environment was accompanied by volatile markets which led to reduced activity of our clients especially in the investment businesses. PW&CC’s revenues benefited from the sale of a stake in VISA Europe Limited. Noninterest expenses in the second quarter 2016 included restructuring charges related to Strategy 2020 transformation measures. Comparing the current quarter versus prior year quarter, the discontinuation of Hua Xia Co. Ltd. equity pick-ups resulted in a substantial revenue decline.
Net revenues in PW&CC of € 1.9 billion decreased by € 230 million, or 11 %, compared to the prior year quarter. More than half of the revenue decline was attributable to an impact of € 138 million related to the stake in Hua Xia Co. Ltd., as the second quarter of last year included regular equity pick-ups on the stake. In the Private & Commercial Client (PCC) businesses, revenues declined by € 28 million, or 2 %. The turbulent market environment led to reduced activity of our clients resulting in a decrease in Investment & insurance product revenues of € 70 million, or 21 %. Net revenues from Deposit products declined by € 52 million, or 15 %, driven by the ongoing low interest rate environment in Europe.
Three months ended Six months ended in € m. (unless stated otherwise) Jun 30, 2016 Jun 30, 2015
Absolute Change
Change in % Jun 30, 2016 Jun 30, 2015
Absolute Change
Change in %
Net revenues:
Credit products 563 530 33 6 1,103 1,070 32 3
Deposit products 288 339 (52) (15) 600 682 (83) (12)
Investment & insurance products 265 335 (70) (21) 565 713 (148) (21)
Payments, cards & account products 141 149 (8) (5) 278 294 (16) (5)
Other products 108 39 69 177 182 63 120 192
Total Private & Commercial Clients (PCC) 1,365 1,393 (28) (2) 2,727 2,822 (95) (3)
Net interest revenues 201 202 (2) (1) 414 400 13 3
Management Fees 178 196 (18) (9) 354 394 (40) (10)
Performance & Transaction Fees 93 138 (45) (33) 193 282 (89) (32)
Other revenues 19 19 (0) (1) 28 18 10 56
Total Wealth Management (WM) 490 555 (65) (12) 988 1,094 (106) (10)
Hua Xia 6 143 (138) (96) (118) 267 (385) N/M
Total net revenues 1,861 2,091 (230) (11) 3,597 4,183 (586) (14)
Provision for credit losses 66 74 (8) (10) 103 154 (51) (33)
Noninterest expenses:
Compensation and benefits 615 644 (28) (4) 1,261 1,296 (35) (3)
General and administrative expenses 928 892 37 4 1,865 1,846 18 1
Policyholder benefits and claims 0 0 0 N/M 0 0 0 N/M
Impairment of goodwill and other intangible assets 0 0 0 N/M 0 0 0 N/M
Restructuring activities 64 (1) 65 N/M 120 (0) 120 N/M
Total noninterest expenses 1,608 1,534 74 5 3,245 3,142 103 3
Noncontrolling interests 0 0 0 N/M 0 0 0 N/M
Income (loss) before income taxes 187 483 (296) (61) 249 887 (638) (72)
15
Deutsche Bank Interim Report as of June 30, 2016
Operating and Financial Review – 2 Strategy – 28 Outlook – 29
Risk and Opportunities – 35 Risk Report – 36
These revenue declines were partly mitigated by an increase in Credit product revenues of € 33 million, or 6 %, reflecting higher loan volumes and a modest margin increase. Other revenues included a € 88 million gain attributable to the sale of the stake in VISA Europe Limited. Revenues in Wealth Management (WM) businesses decreased by € 65 million, or 12 %, compared to a very strong second quarter in the prior year. This was mainly caused by € 45 million, or 33 %, lower Performance & Transaction Fees, driven by the more difficult market environment with reduced activity of our clients, and € 18 million, or 9 %, lower Management Fees reflecting lower market levels. The decline in WM’s revenues in the current quarter also reflected very low levels of equity capital markets activity in the U.S., which resulted in a decline of revenues in our Private Client Services unit (“PCS”). Net interest revenues remained almost stable compared to the prior year quarter.
Provision for credit losses of € 66 million decreased by € 8 million, or 10 %, reflecting the continued good quality of the loan portfolio and the benign economic environment. Provision for credit losses in the second quarter last year benefited from selective portfolio sales.
Noninterest expenses of € 1.6 billion increased by € 74 million, or 5 %, compared to the second quarter of 2015. The increase included € 65 million higher restructuring charges and € 8 million higher litigation related expenses. Excluding these charges, noninterest expenses remained stable, despite higher software amortization, investments in digitalization as well as further spending related to Strategy 2020. This reflects PW&CC’s strict cost discipline in the second quarter of the year.
Income before income taxes of € 187 million decreased by € 296 million, or 61 %, compared to the second quarter of 2015. Almost half of the decline was attributable to the aforementioned impact from Hua Xia Co. Ltd. The charges related to Strategy 2020 and the challenging market environment resulting in reduced revenues impacted the results in PW&CC and were only partly offset by the positive impact from the VISA transaction.
PW&CC’s Invested Assets increased by € 2 billion compared to March 31, 2016, mainly due to market appreciation and foreign exchange related effects. These effects were partly offset by € 2 billion net outflows in WM businesses. In Asia-Pacific, Americas and Europe, net outflows reflected continued deleveraging activities of our clients as well as efforts to optimize risk management. This was partly compensated by German WM businesses with net inflows of € 3 billion mainly in deposits. In the PCC businesses, net outflows in securities were more than compensated by € 1 billion net inflows in deposits.
2016 to 2015 Six Months Comparison
The first half of 2016 was characterized by persistently low interest rates in key markets and a turbulent market environment that resulted in reduced activity of our clients especially in the investment business. In addition, noninterest expenses included restructuring and severance of € 139 million related to Strategy 2020 transformation measures. Revenues benefited from a € 50 million dividend payment from one of PCC’s shareholdings and a € 88 million one-off impact from the sale of the stake in VISA Europe Limited. However, the discontinuation of Hua Xia Co. Ltd. equity pickups as well as a negative net valuation impact of € 118 million relating to the stake in Hua Xia Co. Ltd. resulted in a substantial revenue decline of € 385 million compared to the prior year period.
Deutsche Bank 1 – Management Report 16Interim Report as of June 30, 2016
Net revenues in PW&CC of € 3.6 billion decreased by € 586 million, or 14 %, compared to the prior year period. Almost two-thirds of this revenue decline was attributable to an impact of € 385 million related to the stake in Hua Xia Co. Ltd. The first half of 2016 included the aforementioned € 118 million negative net valuation impact, whereas the first half 2015 included regular equity pick-ups on the stake. In our Private & Commercial Client (PCC) businesses, revenues declined by € 95 million, or 3 %, mainly driven by a decrease in Investment & insurance product revenues of € 148 million, or 21 %, reflecting the turbulent market environment with reduced activity of our clients. Net revenues from Deposit products declined by € 83 million, or 12 %, compared to first half of 2015, driven by the further declining interest rate environment in Europe. These decreases in PCC revenues were partly mitigated by better Credit product revenues of € 32 million, or 3 %, caused by higher loan volumes and a modest margin increase. Other revenues included a € 88 million gain attributable to the sale of the stake in VISA Europe Limited as well as a € 50 million dividend payment from one of PCC’s shareholdings subsequent to a sales transaction by the investee in 2015. Wealth Management (WM) businesses decreased by € 106 million, or 10 %, mainly caused by € 89 million, or 32 %, lower Performance & Transaction Fees and € 40 million, or 10 %, lower Management Fees, reflecting the turbulent market environment and reduced activity of our clients. The decline in WM’s revenues in the first half of 2016 also reflected very low levels of equity capital markets activity in the U.S., which resulted in a decline of revenues in our Private Client Services unit (“PCS”). This was partly compensated by higher net interest revenues of € 13 million, or 3 %, mainly from deposits, and higher other revenues of € 10 million.
Provision for credit losses of € 103 million decreased by € 51 million, or 33 %, compared to prior year period reflecting the continued good quality of the loan portfolio and the benign economic environment. Provision for credit losses also benefited from selective portfolio sales in 2015 and in 2016 on a comparable level.
Noninterest expenses of € 3.2 billion increased by € 103 million, or 3 %, compared to the first half of 2015, driven by higher charges of € 120 million for restructuring and € 14 million for severances within compensation and benefits. Excluding these charges, noninterest expenses slightly decreased, despite investments in digitalization and further spending related to Strategy 2020 measures as well as higher software amortization and thus reflected PW&CC’s strict cost discipline in the first half of the year.
Income before income taxes of € 249 million decreased by € 638 million, or 72 %, compared to the first half of 2015. The decline was attributable to the aforementioned year-on-year impact of € 385 million from Hua Xia Co. Ltd. and the charges related to Strategy 2020 as well as reduced revenues due to the challenging market environment.
PW&CC’s Invested Assets decreased by € 21 billion compared to December 31, 2015, mainly due to market depreciation and foreign exchange related effects of € 16 billion. Net outflows in the first half of 2016 were € 6 billion. Net outflows in the WM businesses of € 4 billion were mainly driven by continued deleveraging activities of our clients as well as efforts to optimize risk management practices and to improve efficiencies as in cross-border servicing. This was partly offset by inflows of new deposits and advisory mandates. In the PCC businesses, net outflows were € 2 billion. Net outflows in deposits were partly compensated by inflows in securities.
17
Deutsche Bank Interim Report as of June 30, 2016
Operating and Financial Review – 2 Strategy – 28 Outlook – 29
Risk and Opportunities – 35 Risk Report – 36
Deutsche Asset Management Corporate Division (Deutsche AM)
N/M – Not meaningful
2016 to 2015 Three Months Comparison
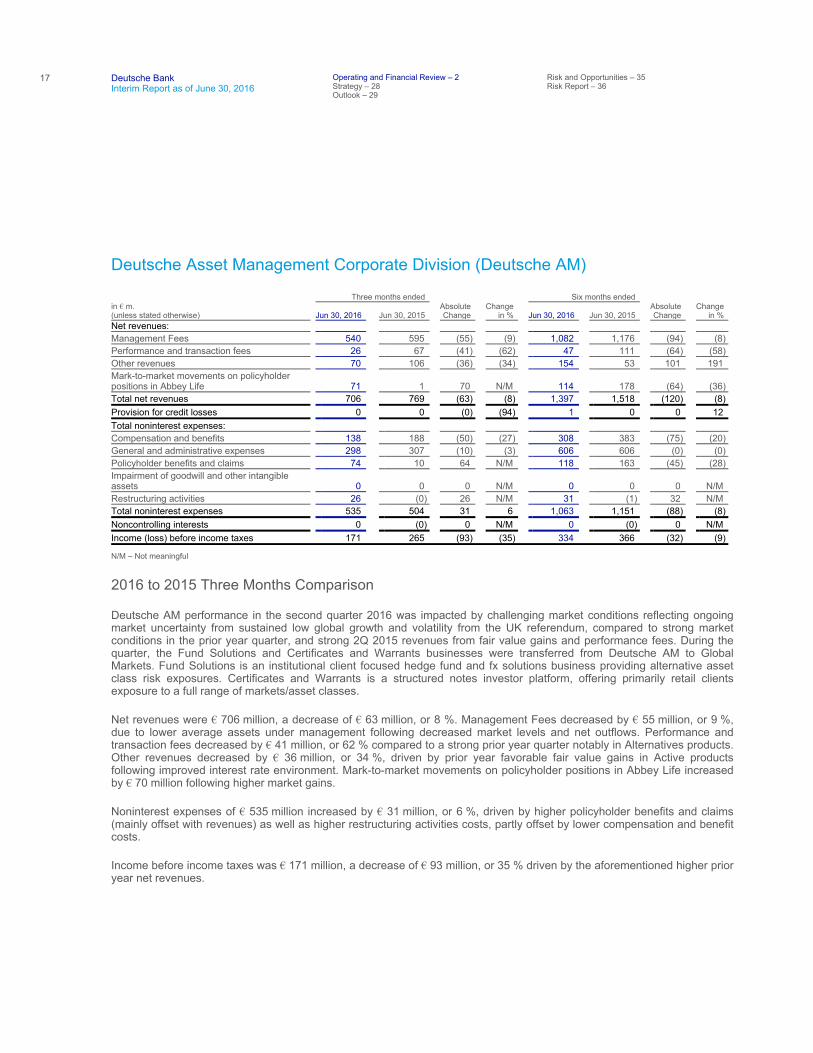
Deutsche AM performance in the second quarter 2016 was impacted by challenging market conditions reflecting ongoing market uncertainty from sustained low global growth and volatility from the UK referendum, compared to strong market conditions in the prior year quarter, and strong 2Q 2015 revenues from fair value gains and performance fees. During the quarter, the Fund Solutions and Certificates and Warrants businesses were transferred from Deutsche AM to Global Markets. Fund Solutions is an institutional client focused hedge fund and fx solutions business providing alternative asset class risk exposures. Certificates and Warrants is a structured notes investor platform, offering primarily retail clients exposure to a full range of markets/asset classes.
Net revenues were € 706 million, a decrease of € 63 million, or 8 %. Management Fees decreased by € 55 million, or 9 %, due to lower average assets under management following decreased market levels and net outflows. Performance and transaction fees decreased by € 41 million, or 62 % compared to a strong prior year quarter notably in Alternatives products. Other revenues decreased by € 36 million, or 34 %, driven by prior year favorable fair value gains in Active products following improved interest rate environment. Mark-to-market movements on policyholder positions in Abbey Life increased by € 70 million following higher market gains.
Noninterest expenses of € 535 million increased by € 31 million, or 6 %, driven by higher policyholder benefits and claims (mainly offset with revenues) as well as higher restructuring activities costs, partly offset by lower compensation and benefit costs.
Income before income taxes was € 171 million, a decrease of € 93 million, or 35 % driven by the aforementioned higher prior year net revenues.
Three months ended Six months ended in € m. (unless stated otherwise) Jun 30, 2016 Jun 30, 2015
Absolute Change
Change in % Jun 30, 2016 Jun 30, 2015
Absolute Change
Change in %
Net revenues:
Management Fees 540 595 (55) (9) 1,082 1,176 (94) (8)
Performance and transaction fees 26 67 (41) (62) 47 111 (64) (58)
Other revenues 70 106 (36) (34) 154 53 101 191
Mark-to-market movements on policyholder positions in Abbey Life 71 1 70 N/M 114 178 (64) (36)
Total net revenues 706 769 (63) (8) 1,397 1,518 (120) (8)
Provision for credit losses 0 0 (0) (94) 1 0 0 12
Total noninterest expenses:
Compensation and benefits 138 188 (50) (27) 308 383 (75) (20)
General and administrative expenses 298 307 (10) (3) 606 606 (0) (0)
Policyholder benefits and claims 74 10 64 N/M 118 163 (45) (28)
Impairment of goodwill and other intangible assets 0 0 0 N/M 0 0 0 N/M
Restructuring activities 26 (0) 26 N/M 31 (1) 32 N/M
Total noninterest expenses 535 504 31 6 1,063 1,151 (88) (8)
Noncontrolling interests 0 (0) 0 N/M 0 (0) 0 N/M
Income (loss) before income taxes 171 265 (93) (35) 334 366 (32) (9)
Deutsche Bank 1 – Management Report 18Interim Report as of June 30, 2016
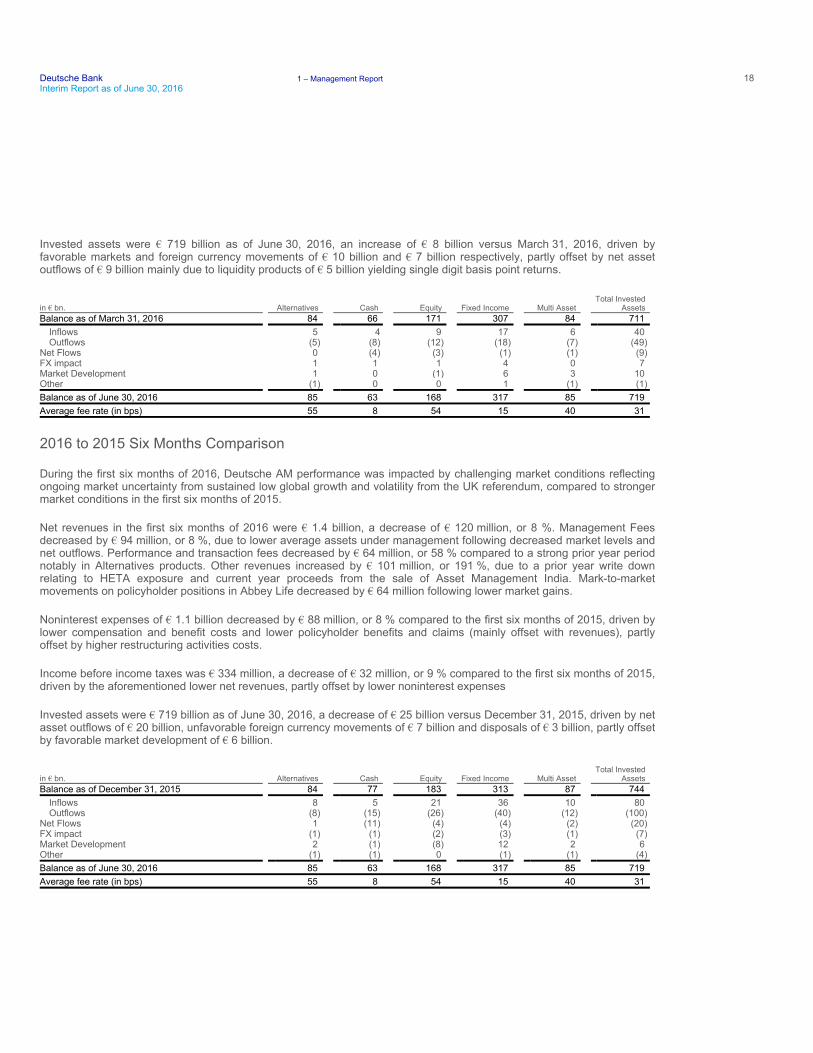
Invested assets were € 719 billion as of June 30, 2016, an increase of € 8 billion versus March 31, 2016, driven by favorable markets and foreign currency movements of € 10 billion and € 7 billion respectively, partly offset by net asset outflows of € 9 billion mainly due to liquidity products of € 5 billion yielding single digit basis point returns.
2016 to 2015 Six Months Comparison
During the first six months of 2016, Deutsche AM performance was impacted by challenging market conditions reflecting ongoing market uncertainty from sustained low global growth and volatility from the UK referendum, compared to stronger market conditions in the first six months of 2015.
Net revenues in the first six months of 2016 were € 1.4 billion, a decrease of € 120 million, or 8 %. Management Fees decreased by € 94 million, or 8 %, due to lower average assets under management following decreased market levels and net outflows. Performance and transaction fees decreased by € 64 million, or 58 % compared to a strong prior year period notably in Alternatives products. Other revenues increased by € 101 million, or 191 %, due to a prior year write down relating to HETA exposure and current year proceeds from the sale of Asset Management India. Mark-to-market movements on policyholder positions in Abbey Life decreased by € 64 million following lower market gains.
Noninterest expenses of € 1.1 billion decreased by € 88 million, or 8 % compared to the first six months of 2015, driven by lower compensation and benefit costs and lower policyholder benefits and claims (mainly offset with revenues), partly offset by higher restructuring activities costs.
Income before income taxes was € 334 million, a decrease of € 32 million, or 9 % compared to the first six months of 2015, driven by the aforementioned lower net revenues, partly offset by lower noninterest expenses
Invested assets were € 719 billion as of June 30, 2016, a decrease of € 25 billion versus December 31, 2015, driven by net asset outflows of € 20 billion, unfavorable foreign currency movements of € 7 billion and disposals of € 3 billion, partly offset by favorable market development of € 6 billion.
in € bn. Alternatives Cash Equity Fixed Income Multi Asset Total Invested
Assets Balance as of March 31, 2016 84 66 171 307 84 711
Inflows 5 4 9 17 6 40 Outflows (5) (8) (12) (18) (7) (49)
Net Flows 0 (4) (3) (1) (1) (9) FX impact 1 1 1 4 0 7 Market Development 1 0 (1) 6 3 10 Other (1) 0 0 1 (1) (1)
Balance as of June 30, 2016 85 63 168 317 85 719
Average fee rate (in bps) 55 8 54 15 40 31
in € bn. Alternatives Cash Equity Fixed Income Multi Asset Total Invested
Assets Balance as of December 31, 2015 84 77 183 313 87 744
Inflows 8 5 21 36 10 80 Outflows (8) (15) (26) (40) (12) (100)
Net Flows 1 (11) (4) (4) (2) (20) FX impact (1) (1) (2) (3) (1) (7) Market Development 2 (1) (8) 12 2 6 Other (1) (1) 0 (1) (1) (4)
Balance as of June 30, 2016 85 63 168 317 85 719
Average fee rate (in bps) 55 8 54 15 40 31
19
Deutsche Bank Interim Report as of June 30, 2016
Operating and Financial Review – 2 Strategy – 28 Outlook – 29
Risk and Opportunities – 35 Risk Report – 36
Postbank
N/M – Not meaningful
2016 to 2015 Three Months Comparison
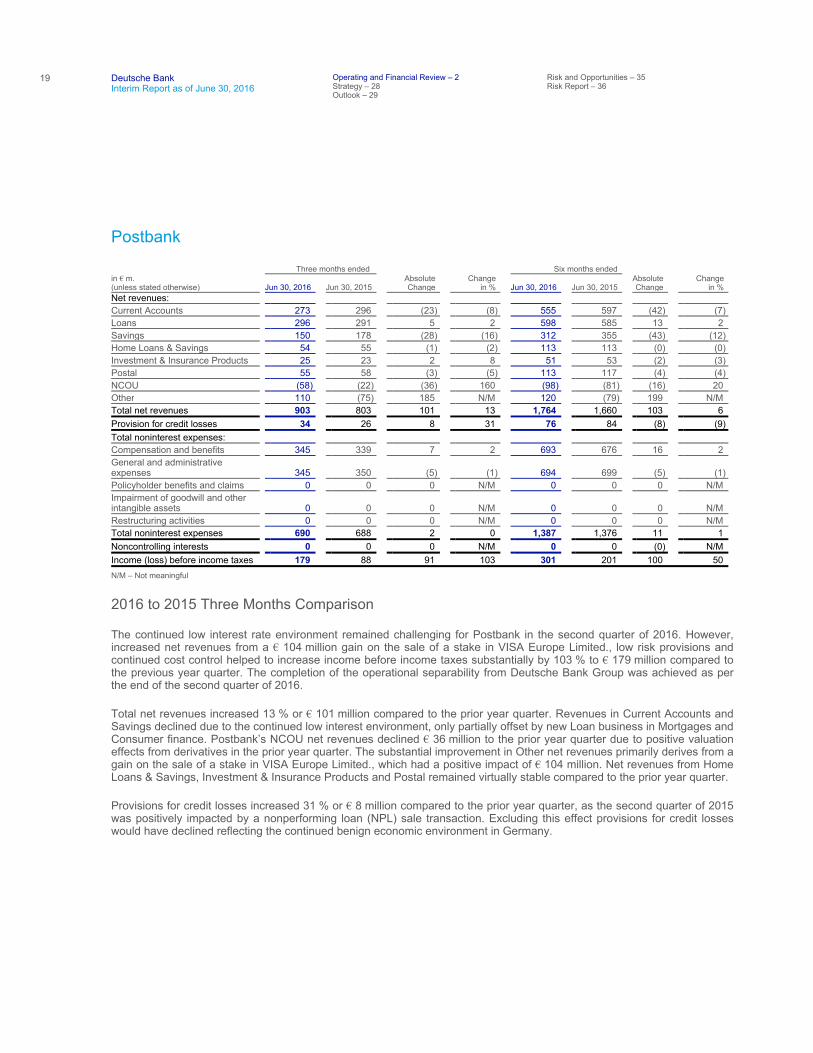
The continued low interest rate environment remained challenging for Postbank in the second quarter of 2016. However, increased net revenues from a € 104 million gain on the sale of a stake in VISA Europe Limited., low risk provisions and continued cost control helped to increase income before income taxes substantially by 103 % to € 179 million compared to the previous year quarter. The completion of the operational separability from Deutsche Bank Group was achieved as per the end of the second quarter of 2016.
Total net revenues increased 13 % or € 101 million compared to the prior year quarter. Revenues in Current Accounts and Savings declined due to the continued low interest environment, only partially offset by new Loan business in Mortgages and Consumer finance. Postbank’s NCOU net revenues declined € 36 million to the prior year quarter due to positive valuation effects from derivatives in the prior year quarter. The substantial improvement in Other net revenues primarily derives from a gain on the sale of a stake in VISA Europe Limited., which had a positive impact of € 104 million. Net revenues from Home Loans & Savings, Investment & Insurance Products and Postal remained virtually stable compared to the prior year quarter.
Provisions for credit losses increased 31 % or € 8 million compared to the prior year quarter, as the second quarter of 2015 was positively impacted by a nonperforming loan (NPL) sale transaction. Excluding this effect provisions for credit losses would have declined reflecting the continued benign economic environment in Germany.
Three months ended Six months ended in € m. (unless stated otherwise) Jun 30, 2016 Jun 30, 2015
Absolute Change
Change in % Jun 30, 2016 Jun 30, 2015
Absolute Change
Change in %
Net revenues:
Current Accounts 273 296 (23) (8) 555 597 (42) (7)
Loans 296 291 5 2 598 585 13 2
Savings 150 178 (28) (16) 312 355 (43) (12)
Home Loans & Savings 54 55 (1) (2) 113 113 (0) (0)
Investment & Insurance Products 25 23 2 8 51 53 (2) (3)
Postal 55 58 (3) (5) 113 117 (4) (4)
NCOU (58) (22) (36) 160 (98) (81) (16) 20
Other 110 (75) 185 N/M 120 (79) 199 N/M
Total net revenues 903 803 101 13 1,764 1,660 103 6
Provision for credit losses 34 26 8 31 76 84 (8) (9)
Total noninterest expenses:
Compensation and benefits 345 339 7 2 693 676 16 2
General and administrative expenses 345 350 (5) (1) 694 699 (5) (1)
Policyholder benefits and claims 0 0 0 N/M 0 0 0 N/M
Impairment of goodwill and other intangible assets 0 0 0 N/M 0 0 0 N/M
Restructuring activities 0 0 0 N/M 0 0 0 N/M
Total noninterest expenses 690 688 2 0 1,387 1,376 11 1
Noncontrolling interests 0 0 0 N/M 0 0 (0) N/M
Income (loss) before income taxes 179 88 91 103 301 201 100 50
Deutsche Bank 1 – Management Report 20Interim Report as of June 30, 2016
Postbank continued to focus on cost control and efficiency measures as total noninterest expenses were unchanged compared to the prior year quarter despite lower synergies due to the completion of the operational separability from Deutsche Bank Group, expenses for the European deposit insurance scheme (EDIS) and investments in efficiency and digitalization. Excluding litigation charges, noninterest expenses were down 4 % or € 25 million compared to the prior year quarter.
Postbank recorded an income before income taxes of € 179 million, which reflects an increase of 103 % or € 91 million compared to the prior year quarter. The substantial increase was primarily driven by higher revenues from the sale of a stake in VISA Europe Limited.
2016 to 2015 Six Months Comparison
The continued low interest rate environment remained challenging for Postbank in the first half of 2016. However, increased net revenues from a € 104 million gain on the sale of a stake in VISA Europe Limited., low risk provisions and continued cost control helped to increase income before income taxes significantly by 50 % to € 301 million compared to the previous half-year period. The completion of the operational separability from Deutsche Bank Group was achieved as per the end of the first half of 2016.
Total net revenues increased 6 % or € 103 million compared to the prior year period. Revenues in Current accounts and Savings declined due to the continued low interest environment, only partially offset by new Loan business in Mortgages and Consumer finance. Postbank’s NCOU net revenues declined € 16 million to the prior year period partially due to positive valuation effects from derivatives in the prior year period. The substantial improvement in other net revenues primarily derives from a gain on the sale of a stake in VISA Europe Limited., which had a positive impact of € 104 million. Net revenues from Home Loans & Savings, Investment & Insurance Products and Postal remained virtually stable compared to the prior year period.
Provisions for credit losses decreased by 9 % or € 8 million compared to the prior year period. The second quarter of 2015 was however positively impacted by a nonperforming loan (NPL) sale transaction. Excluding the positive effect from the NPL sale provisions for credit losses would have declined further reflecting the continued benign economic environment in Germany.
Postbank continued to focus on cost control and efficiency measures with virtually unchanged total noninterest expenses, despite lower synergies due to the completion of the operational separability from Deutsche Bank Group, expenses for the European deposit insurance scheme (EDIS) and investments in efficiency and digitalization. Excluding litigation charges, noninterest expenses were down 1 % or € 20 million compared to the prior year period.
Postbank recorded an income before income taxes of € 301 million, which reflects an increase of 50 % or € 100 million compared to the prior year period. The significant increase was primarily driven by higher revenues from the sale of a stake in VISA Europe Limited. in the second quarter of 2016.
Invested assets were € 72 billion as of June 30, 2016, a decrease of € 3 billion versus December 31, 2015. Client assets were € 110 billion as of June 30, 2016, unchanged versus December 31, 2015.
21
Deutsche Bank Interim Report as of June 30, 2016
Operating and Financial Review – 2 Strategy – 28 Outlook – 29
Risk and Opportunities – 35 Risk Report – 36
Non-Core Operations Unit Corporate Division (NCOU)
N/M – Not meaningful
2016 to 2015 Three Months Comparison
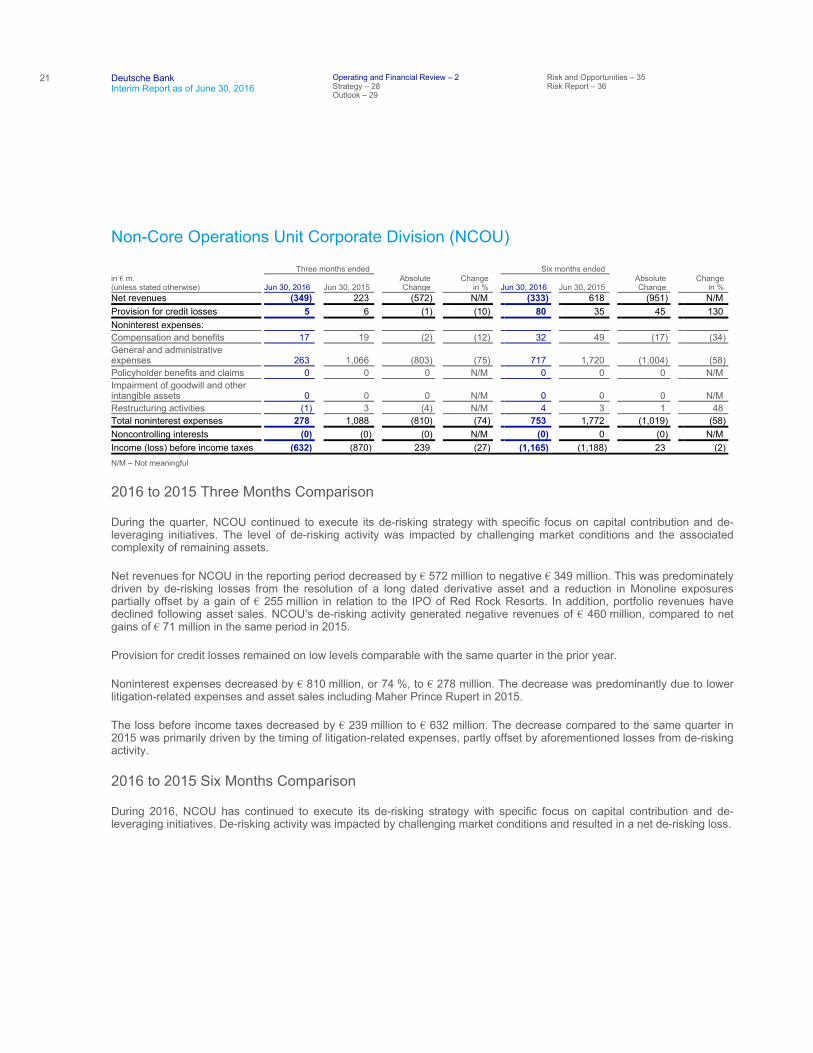
During the quarter, NCOU continued to execute its de-risking strategy with specific focus on capital contribution and de-leveraging initiatives. The level of de-risking activity was impacted by challenging market conditions and the associated complexity of remaining assets.
Net revenues for NCOU in the reporting period decreased by € 572 million to negative € 349 million. This was predominately driven by de-risking losses from the resolution of a long dated derivative asset and a reduction in Monoline exposures partially offset by a gain of € 255 million in relation to the IPO of Red Rock Resorts. In addition, portfolio revenues have declined following asset sales. NCOU’s de-risking activity generated negative revenues of € 460 million, compared to net gains of € 71 million in the same period in 2015.
Provision for credit losses remained on low levels comparable with the same quarter in the prior year.
Noninterest expenses decreased by € 810 million, or 74 %, to € 278 million. The decrease was predominantly due to lower litigation-related expenses and asset sales including Maher Prince Rupert in 2015.
The loss before income taxes decreased by € 239 million to € 632 million. The decrease compared to the same quarter in 2015 was primarily driven by the timing of litigation-related expenses, partly offset by aforementioned losses from de-risking activity.
2016 to 2015 Six Months Comparison
During 2016, NCOU has continued to execute its de-risking strategy with specific focus on capital contribution and de-leveraging initiatives. De-risking activity was impacted by challenging market conditions and resulted in a net de-risking loss.
Three months ended Six months ended in € m. (unless stated otherwise) Jun 30, 2016 Jun 30, 2015
Absolute Change
Change in % Jun 30, 2016 Jun 30, 2015
Absolute Change
Change in %
Net revenues (349) 223 (572) N/M (333) 618 (951) N/M
Provision for credit losses 5 6 (1) (10) 80 35 45 130
Noninterest expenses:
Compensation and benefits 17 19 (2) (12) 32 49 (17) (34)
General and administrative expenses 263 1,066 (803) (75) 717 1,720 (1,004) (58)
Policyholder benefits and claims 0 0 0 N/M 0 0 0 N/M
Impairment of goodwill and other intangible assets 0 0 0 N/M 0 0 0 N/M
Restructuring activities (1) 3 (4) N/M 4 3 1 48
Total noninterest expenses 278 1,088 (810) (74) 753 1,772 (1,019) (58)
Noncontrolling interests (0) (0) (0) N/M (0) 0 (0) N/M
Income (loss) before income taxes (632) (870) 239 (27) (1,165) (1,188) 23 (2)
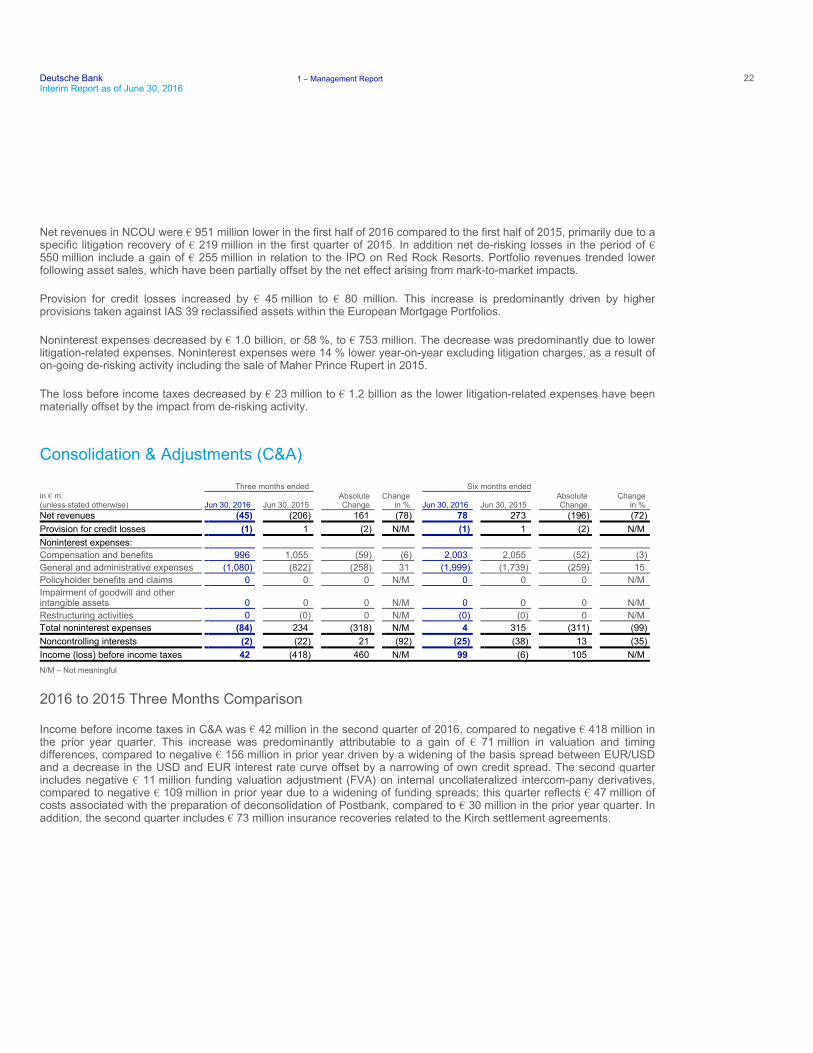
Deutsche Bank 1 – Management Report 22Interim Report as of June 30, 2016
Net revenues in NCOU were € 951 million lower in the first half of 2016 compared to the first half of 2015, primarily due to a specific litigation recovery of € 219 million in the first quarter of 2015. In addition net de-risking losses in the period of € 550 million include a gain of € 255 million in relation to the IPO on Red Rock Resorts. Portfolio revenues trended lower following asset sales, which have been partially offset by the net effect arising from mark-to-market impacts.
Provision for credit losses increased by € 45 million to € 80 million. This increase is predominantly driven by higher provisions taken against IAS 39 reclassified assets within the European Mortgage Portfolios.
Noninterest expenses decreased by € 1.0 billion, or 58 %, to € 753 million. The decrease was predominantly due to lower litigation-related expenses. Noninterest expenses were 14 % lower year-on-year excluding litigation charges, as a result of on-going de-risking activity including the sale of Maher Prince Rupert in 2015.
The loss before income taxes decreased by € 23 million to € 1.2 billion as the lower litigation-related expenses have been materially offset by the impact from de-risking activity.
Consolidation & Adjustments (C&A)
N/M – Not meaningful
2016 to 2015 Three Months Comparison
Income before income taxes in C&A was € 42 million in the second quarter of 2016, compared to negative € 418 million in the prior year quarter. This increase was predominantly attributable to a gain of € 71 million in valuation and timing differences, compared to negative € 156 million in prior year driven by a widening of the basis spread between EUR/USD and a decrease in the USD and EUR interest rate curve offset by a narrowing of own credit spread. The second quarter includes negative € 11 million funding valuation adjustment (FVA) on internal uncollateralized intercom-pany derivatives, compared to negative € 109 million in prior year due to a widening of funding spreads; this quarter reflects € 47 million of costs associated with the preparation of deconsolidation of Postbank, compared to € 30 million in the prior year quarter. In addition, the second quarter includes € 73 million insurance recoveries related to the Kirch settlement agreements.
Three months ended Six months ended in € m. (unless stated otherwise) Jun 30, 2016 Jun 30, 2015
Absolute Change
Change in % Jun 30, 2016 Jun 30, 2015
Absolute Change
Change in %
Net revenues (45) (206) 161 (78) 78 273 (196) (72)
Provision for credit losses (1) 1 (2) N/M (1) 1 (2) N/M
Noninterest expenses:
Compensation and benefits 996 1,055 (59) (6) 2,003 2,055 (52) (3)
General and administrative expenses (1,080) (822) (258) 31 (1,999) (1,739) (259) 15
Policyholder benefits and claims 0 0 0 N/M 0 0 0 N/M
Impairment of goodwill and other intangible assets 0 0 0 N/M 0 0 0 N/M
Restructuring activities 0 (0) 0 N/M (0) (0) 0 N/M
Total noninterest expenses (84) 234 (318) N/M 4 315 (311) (99)
Noncontrolling interests (2) (22) 21 (92) (25) (38) 13 (35)
Income (loss) before income taxes 42 (418) 460 N/M 99 (6) 105 N/M
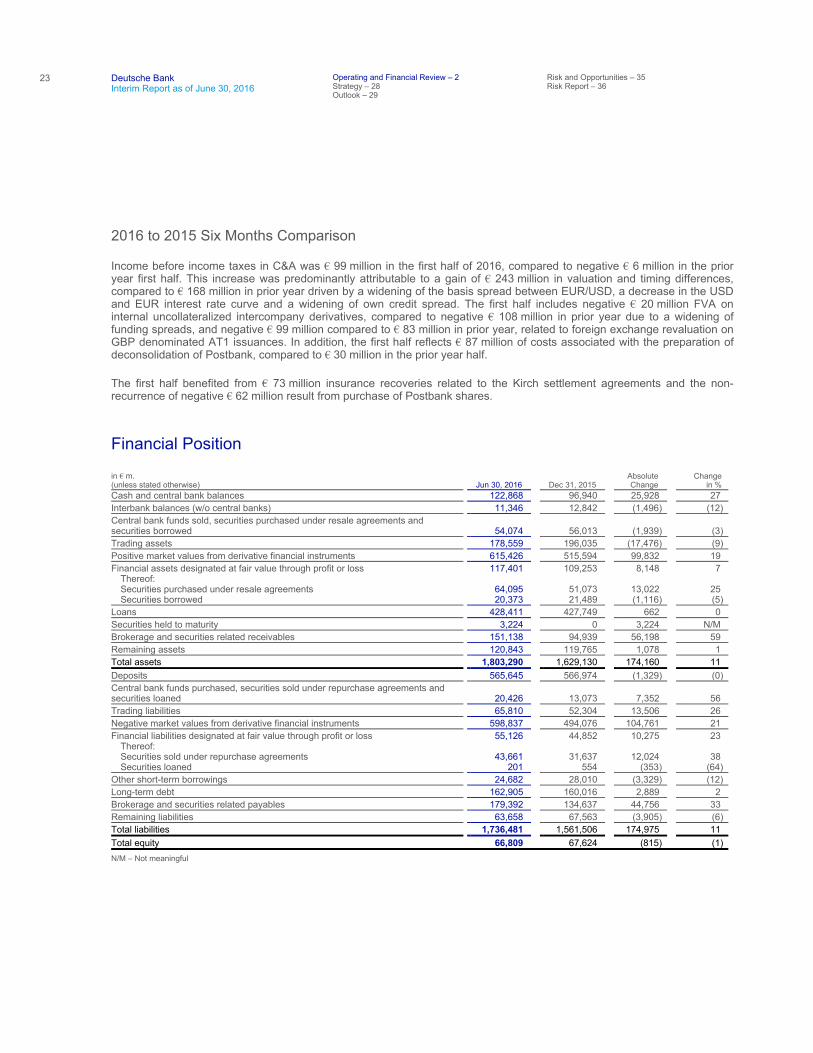
23
Deutsche Bank Interim Report as of June 30, 2016
Operating and Financial Review – 2 Strategy – 28 Outlook – 29
Risk and Opportunities – 35 Risk Report – 36
2016 to 2015 Six Months Comparison
Income before income taxes in C&A was € 99 million in the first half of 2016, compared to negative € 6 million in the prior year first half. This increase was predominantly attributable to a gain of € 243 million in valuation and timing differences, compared to € 168 million in prior year driven by a widening of the basis spread between EUR/USD, a decrease in the USD and EUR interest rate curve and a widening of own credit spread. The first half includes negative € 20 million FVA on internal uncollateralized intercompany derivatives, compared to negative € 108 million in prior year due to a widening of funding spreads, and negative € 99 million compared to € 83 million in prior year, related to foreign exchange revaluation on GBP denominated AT1 issuances. In addition, the first half reflects € 87 million of costs associated with the preparation of deconsolidation of Postbank, compared to € 30 million in the prior year half.
The first half benefited from € 73 million insurance recoveries related to the Kirch settlement agreements and the non-recurrence of negative € 62 million result from purchase of Postbank shares.
Financial Position
N/M – Not meaningful
in € m. (unless stated otherwise) Jun 30, 2016 Dec 31, 2015
Absolute Change
Change in %
Cash and central bank balances 122,868 96,940 25,928 27
Interbank balances (w/o central banks) 11,346 12,842 (1,496) (12)
Central bank funds sold, securities purchased under resale agreements and securities borrowed 54,074 56,013 (1,939) (3)
Trading assets 178,559 196,035 (17,476) (9)
Positive market values from derivative financial instruments 615,426 515,594 99,832 19
Financial assets designated at fair value through profit or loss 117,401 109,253 8,148 7 Thereof: Securities purchased under resale agreements 64,095 51,073 13,022 25 Securities borrowed 20,373 21,489 (1,116) (5)
Loans 428,411 427,749 662 0
Securities held to maturity 3,224 0 3,224 N/M
Brokerage and securities related receivables 151,138 94,939 56,198 59
Remaining assets 120,843 119,765 1,078 1
Total assets 1,803,290 1,629,130 174,160 11
Deposits 565,645 566,974 (1,329) (0)
Central bank funds purchased, securities sold under repurchase agreements and securities loaned 20,426 13,073 7,352 56
Trading liabilities 65,810 52,304 13,506 26
Negative market values from derivative financial instruments 598,837 494,076 104,761 21
Financial liabilities designated at fair value through profit or loss 55,126 44,852 10,275 23 Thereof: Securities sold under repurchase agreements 43,661 31,637 12,024 38 Securities loaned 201 554 (353) (64)
Other short-term borrowings 24,682 28,010 (3,329) (12)
Long-term debt 162,905 160,016 2,889 2
Brokerage and securities related payables 179,392 134,637 44,756 33
Remaining liabilities 63,658 67,563 (3,905) (6)
Total liabilities 1,736,481 1,561,506 174,975 11
Total equity 66,809 67,624 (815) (1)
Deutsche Bank 1 – Management Report 24Interim Report as of June 30, 2016
Movements in Assets
As of June 30, 2016, total assets increased by € 174.2 billion (or 11 %) compared to year-end 2015.
The primary drivers of this growth were a € 99.8 billion increase in positive market values from derivative financial instruments, attributable to interest and foreign exchange rate movements as a result of dropping swap spreads, and a € 56.2 billion increase in brokerage and securities related receivables, following the seasonality pattern we typically observe of lower year-end levels versus higher volumes over the course of the year as well as from higher collateral requirements corresponding to the increase in negative market values from derivative financial instruments.
Cash and central bank balances together with interbank balances increased by € 24.4 billion, driven by our liquidity management activities including a shift out of liquid securities into cash at central banks.
Central bank funds sold, securities purchased under resale agreements and securities borrowed, under both accrual and fair value accounting, increased by € 10.0 billion, mainly driven by cash borrowings on the back of low trading inventory available as collateral and increased client short positions.
Trading assets decreased by € 17.5 billion primarily driven by equity securities due to reduced client appetite and falling markets.
Starting 2016, certain holdings in securities as part of our strategic liquidity reserve are re-classified from financial assets available for sale to securities held to maturity. As of June 2016, the reported € 3.2 billion in securities held to maturity correspond to a decrease in the same amount in financial assets available for sale (reported as part of remaining assets).
The overall increase of the balance sheet included a decrease of € 15.0 billion due to foreign exchange rate movements mainly driven by the appreciation of the euro against the pound sterling and the U.S. dollar. The effects from foreign exchange rate movements are also reflected in the development of the balance sheet line items discussed in this section.
Movements in Liabilities
As of June 30, 2016, total liabilities increased by € 175.0 billion (or 11 %) compared to year-end 2015.
The main drivers of this growth were negative market values from derivative financial instruments and brokerage and securities related payables, which increased by € 104.8 billion and € 44.8 billion, respectively, primarily due to the same factors as the movements in positive market values from derivative financial instruments and brokerage and securities related receivables as discussed above.
Central bank funds purchased, securities sold under repurchase agreements and securities loaned, under both accrual and fair value accounting, increased by € 19.0 billion in total, driven by an increase of € 13.6 billion in the first quarter largely due to higher secured funding of highly liquid inventory and an increase of € 5.4 billion in the second quarter of 2016 due to increased client activity.
Trading liabilities increased by € 13.5 billion mainly due to new business and hedging activity coupled with decreased netting due to reduced client positions.
25
Deutsche Bank Interim Report as of June 30, 2016
Operating and Financial Review – 2 Strategy – 28 Outlook – 29
Risk and Opportunities – 35 Risk Report – 36
Long-term debt increased by € 2.9 billion, with a decrease of € 8.7 billion in the first quarter of 2016, driven by high volume of maturities which exceeded our regular issuance activity together with the impact of our public tender offer, more than offset by a € 11.5 billion increase in the second quarter, primarily due to higher funding activities which exceeded the amount of debt that matured during the quarter.
Other short term liabilities decreased by € 3.3 billion mainly driven by reduction in commercial paper balances during the period, being replaced by other funding sources.
Deposits decreased by € 1.3 billion during the period, with a decrease in the first quarter by € 7.8 billion primarily related to foreign exchange rate movements, partially offset by a € 6.5 billion increase in the second quarter mainly due to increased liquidity being invested.
Similar to total assets, foreign exchange rate movements during the period had an offsetting impact which is already embedded in the overall movements in liabilities as discussed in this section.
Liquidity
Liquidity reserves amounted to € 223 billion as of June 30, 2016 (compared to € 215 billion as of December 31, 2015). We maintained a positive internal liquidity stress result as of June 30, 2016 (under the combined scenario), and our Liquidity Coverage Ratio for June 30, 2016 was 124 % (compared to 119 % as of December 31, 2015).
Equity
Total equity as of June 30, 2016 decreased by € 815 million. The main factors contributing to this development were a net loss from exchange rate changes of € 720 million (especially the U.S. dollar), coupons paid on additional equity components of € 276 million net of tax, remeasurement losses related to defined benefit plans of € 274 million and a net increase in treasury shares of € 181 million. Partly offsetting were unrealized net gains of € 319 million from financial assets available for sale and € 232 million from net income attributable to Deutsche Bank shareholders and additional equity components.
Regulatory Capital
Based on the transitional rules, our CET 1 capital according to CRR/CRD 4 decreased in the first half of 2016 by € 3.5 billion to € 49.0 billion. RWA according to CRR/CRD were € 402.7 billion as of June 30, 2016, compared with € 397.4 billion at the end of 2015. The decrease in CRR/CRD 4 CET 1 capital and the increase in RWA resulted in a CRR/CRD 4 CET 1 capital ratio of 12.2 % as of June 30, 2016, compared with 13.2 % at the end of 2015.
Our fully loaded CRR/CRD 4 Common Equity Tier 1 (CET 1) capital as of June 30, 2016 amounted to € 43.5 billion, € 0.6 billion below the € 44.1 billion as of December 31, 2015. Risk-weighted assets according to CRR/CRD 4 fully loaded were € 402.2 billion as of June 30, 2016 compared with € 396.7 billion at the end of 2015. Due to the decrease in CET 1 capital and the RWA increase our fully loaded CRR/CRD 4 CET 1 capital ratio as of June 30, 2016 decreased to 10.8 % compared with 11.1 % at the end of 2015.
Further details on the development of Regulatory Capital and RWA can be found in the Risk Report-section of this report under chapter ‘Regulatory Capital’.
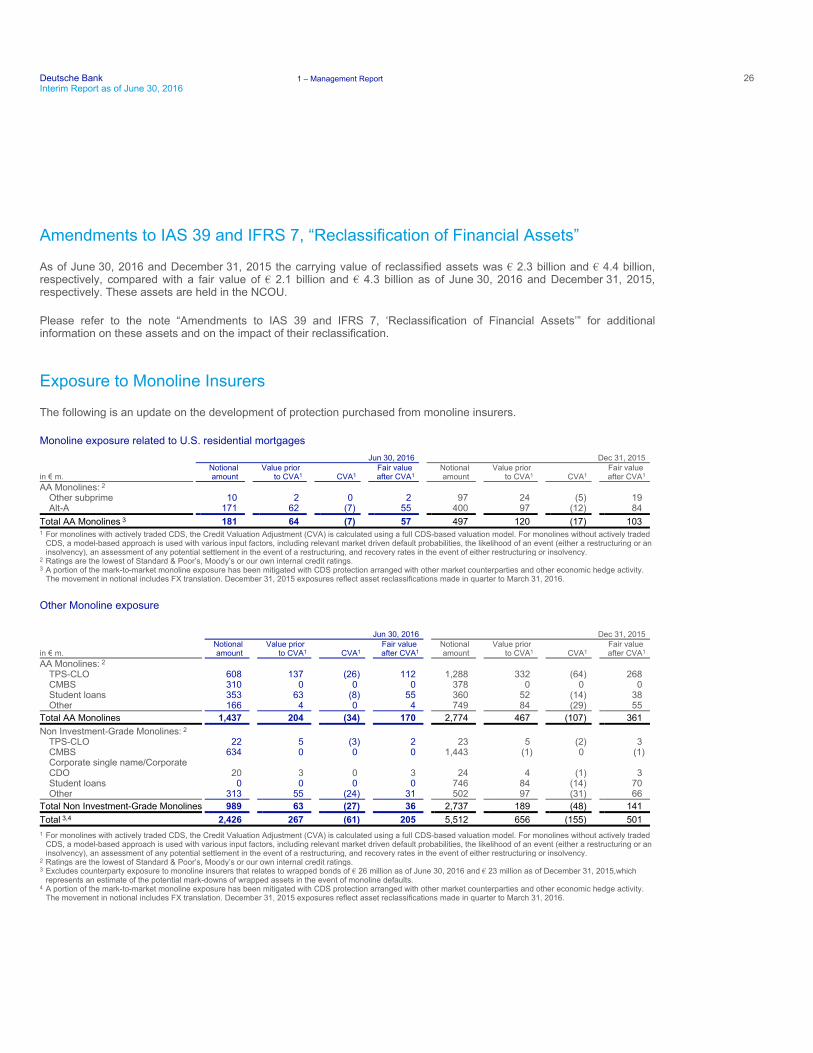
Deutsche Bank 1 – Management Report 26Interim Report as of June 30, 2016
Amendments to IAS 39 and IFRS 7, “Reclassification of Financial Assets”
As of June 30, 2016 and December 31, 2015 the carrying value of reclassified assets was € 2.3 billion and € 4.4 billion, respectively, compared with a fair value of € 2.1 billion and € 4.3 billion as of June 30, 2016 and December 31, 2015, respectively. These assets are held in the NCOU.
Please refer to the note “Amendments to IAS 39 and IFRS 7, ‘Reclassification of Financial Assets’” for additional information on these assets and on the impact of their reclassification.
Exposure to Monoline Insurers
The following is an update on the development of protection purchased from monoline insurers.
Monoline exposure related to U.S. residential mortgages
Other Monoline exposure
Jun 30, 2016 Dec 31, 2015
in € m. Notional
amount Value prior
to CVA1 CVA1 Fair value
after CVA1 Notional
amount Value prior
to CVA1 CVA1 Fair value
after CVA1 AA Monolines: 2
Other subprime 10 2 0 2 97 24 (5) 19 Alt-A 171 62 (7) 55 400 97 (12) 84
Total AA Monolines 3 181 64 (7) 57 497 120 (17) 103
1 For monolines with actively traded CDS, the Credit Valuation Adjustment (CVA) is calculated using a full CDS-based valuation model. For monolines without actively traded CDS, a model-based approach is used with various input factors, including relevant market driven default probabilities, the likelihood of an event (either a restructuring or an insolvency), an assessment of any potential settlement in the event of a restructuring, and recovery rates in the event of either restructuring or insolvency.
2 Ratings are the lowest of Standard & Poor’s, Moody’s or our own internal credit ratings. 3 A portion of the mark-to-market monoline exposure has been mitigated with CDS protection arranged with other market counterparties and other economic hedge activity.
The movement in notional includes FX translation. December 31, 2015 exposures reflect asset reclassifications made in quarter to March 31, 2016.
Jun 30, 2016 Dec 31, 2015
in € m. Notional
amount Value prior
to CVA1 CVA1 Fair value
after CVA1 Notional
amount Value prior
to CVA1 CVA1 Fair value
after CVA1 AA Monolines: 2
TPS-CLO 608 137 (26) 112 1,288 332 (64) 268 CMBS 310 0 0 0 378 0 0 0 Student loans 353 63 (8) 55 360 52 (14) 38 Other 166 4 0 4 749 84 (29) 55
Total AA Monolines 1,437 204 (34) 170 2,774 467 (107) 361
Non Investment-Grade Monolines: 2 TPS-CLO 22 5 (3) 2 23 5 (2) 3 CMBS 634 0 0 0 1,443 (1) 0 (1) Corporate single name/Corporate CDO 20 3 0 3 24 4 (1) 3 Student loans 0 0 0 0 746 84 (14) 70 Other 313 55 (24) 31 502 97 (31) 66
Total Non Investment-Grade Monolines 989 63 (27) 36 2,737 189 (48) 141
Total 3,4 2,426 267 (61) 205 5,512 656 (155) 501
1 For monolines with actively traded CDS, the Credit Valuation Adjustment (CVA) is calculated using a full CDS-based valuation model. For monolines without actively traded CDS, a model-based approach is used with various input factors, including relevant market driven default probabilities, the likelihood of an event (either a restructuring or an insolvency), an assessment of any potential settlement in the event of a restructuring, and recovery rates in the event of either restructuring or insolvency.
2 Ratings are the lowest of Standard & Poor’s, Moody’s or our own internal credit ratings. 3 Excludes counterparty exposure to monoline insurers that relates to wrapped bonds of € 26 million as of June 30, 2016 and € 23 million as of December 31, 2015,which
represents an estimate of the potential mark-downs of wrapped assets in the event of monoline defaults. 4 A portion of the mark-to-market monoline exposure has been mitigated with CDS protection arranged with other market counterparties and other economic hedge activity.
The movement in notional includes FX translation. December 31, 2015 exposures reflect asset reclassifications made in quarter to March 31, 2016.

27
Deutsche Bank Interim Report as of June 30, 2016
Operating and Financial Review – 2 Strategy – 28 Outlook – 29
Risk and Opportunities – 35 Risk Report – 36
Related Party Transactions We have business relationships with several companies in which we own significant equity interests. We also have business relationships with a number of companies where members of our Management Board hold positions on boards of directors or non-executive boards. Our business relationships with these companies cover many of the financial services we provide to our clients generally. For more detailed information, please refer to the section “Other Financial Information” of this Interim Report.
Management and Supervisory Board Jürgen Fitschen retired from the bank’s Management Board effective with the conclusion of the General Meeting on May 19, 2016, and since then John Cryan has been the sole Chairman of the bank’s Management Board.
At his own request, Quintin Price left the bank’s Management Board effective June 15, 2016.
At the conclusion of the General Meeting on May 19, 2016, Katherine Garrett-Cox’s period of office ended as scheduled as member of the Supervisory Board.
Ms. Katherine Garrett-Cox and Mr. Richard Meddings, who was appointed member of the bank’s Supervisory Board by the court in October 2015, were elected members of the Supervisory Board by the General Meeting on May 19, 2016, for the period until the end of the General Meeting that resolves on the ratification of the acts of management for the 2020 financial year.
Mr. Georg F. Thoma notified the bank on April 28, 2016, of his resignation as Supervisory Board member. Pursuant to the Articles of Association, his duties concluded after a one-month notice period on May 28, 2016. He also resigned with immediate effect from his role as Chairman of the Supervisory Board’s Integrity Committee and as member of the Integrity Committee.
Events after the Reporting Period Please refer to the section “Other Financial Information” of this Interim Report.
Deutsche Bank 1 – Management Report 28Interim Report as of June 30, 2016
Strategy
In our Annual Report 2015, we have provided details of our new strategic plan “Strategy 2020” that is intended to focus our universal offering of products and services to become a less complex, more efficient, less risky and a better capitalized bank.
In detail, we have set ourselves four goals:
These four goals are backed by clear financial targets. Starting with the key regulatory ratios, we aim to strengthen our capital position, with a Common Equity Tier 1 capital ratio of at least 12.5 % from the end of 2018, and a leverage ratio of at least 4.5 % at the end of 2018 and 5 % at the end of 2020. We further aim to reduce adjusted costs to below € 22 billion by 2018, achieving a cost-income ratio of approximately 70 % by 2018 and approximately 65 % by 2020. In respect of returns to our shareholders, we aim to achieve post-tax return on average tangible equity of greater than 10 % by 2018.
The implementation of Strategy 2020 is well underway. We have concluded the first round of negotiations with employee representatives in Germany at the end of June 2016, reaching agreement on a range of organizational topics across several areas. In the affected areas in PW&CC, GTB, Risk, Finance, and COO, a total of almost 3,000 jobs will be rationalized in Germany. Following the agreement on the negotiations with employee representatives, PW&CC branches for closure in Germany have been identified and preparation for closure has started. The majority of the branch closures is expected to occur by year-end 2017. CIB continues to pursue focused growth and continued enhancement of our client franchise through focused attention and resources on higher returning products and client relationships. GM has reshaped its Securitized Trading business in line with Strategy 2020 targets and completed over half of the Strategy 2020 leverage reductions in Agency RMBS. 50 % of Global Markets country exits have also been completed. The NCOU wind-down continued to progress in the second quarter of 2016, with substantial reduction of RWA of approximately € 3 billion, CRD 4 leverage exposure of approximately € 12 billion and IFRS assets of approximately € 4 billion since the beginning of the year. We continued to rationalize our geographic footprint and exited Den-mark and Norway in the second quarter of 2016. Finally, as per the comprehensive IHC implementation plan filed with the Federal Reserve, on July 1 2016, Deutsche Bank launched DB USA Corporation, our U.S. Intermediate Holding Company (IHC), which will hold a substantial part of our U.S. businesses and infrastructure. This is a milestone in the implementation of Strategy 2020 and underlines our commitment to a strong operating platform in the U.S. We have accordingly strengthened corporate governance, capital and risk management and reporting for our U.S. operations.
– First, to become simpler and more efficient, – Second, to become less risky, – Third, to become better capitalized, – Finally, to run the bank with more disciplined execution.
29
Deutsche Bank Interim Report as of June 30, 2016
Operating and Financial Review – 2 Strategy – 28 Outlook – 29
Risk and Opportunities – 35 Risk Report – 36
Outlook
The following section should be read in conjunction with the Outlook section in the Management Report provided in the Annual Report 2015.
The Global Economy In 2016, global economic growth is likely to remain more or less unchanged at 3.0 %, thus remaining below the trend growth rate for the fifth consecutive year. The global inflation rate is likely to accelerate to 4.4 %, largely because commodity prices are expected to have less of a dampening effect on total inflation than in 2015. For the industrialized countries, we expect growth to slow to 1.4 % and consumer prices to increase to 0.8 %. By contrast, we expect the growth rate in the emerging markets to remain almost unchanged at 4.1 %. The inflation rate in the emerging markets is likely to be 6.9 %, which is also higher than in the prior year.
Eurozone GDP is expected to grow by 1.6 % in 2016 due to the low oil price and the gradual improvement in the labor market. The eurozone economy also remains supported by the expansionary monetary policy adopted by the Europe-an Central Bank (ECB), whose targeted credit-easing package in March 2016 made its monetary policy even more expansionary. However, geopolitical risks, faltering structural reforms, the high level of private and public-sector debt and the stronger euro are dampening the economic outlook. The expected weakening of demand and the uncertainty following the UK referendum on European Union membership, in which a narrow majority decided in favor of leaving the EU, have also a negative impact on European growth. Consumer prices in the eurozone are likely to rise by 0.2 %. The German economy is likely to grow by 1.7 % in 2016, driven solely by the domestic economy.
For the U.S., we are forecasting a growth of 1.5 % in 2016. While the external environment as a consequence of the strength of the U.S. dollar, subdued global demand the negative effect of the low oil price on the energy sector and the fact that the destocking process is not yet complete are dampening the outlook, the robust labor market and the housing market are providing stimulus for economic growth. Consumer prices will probably rise by 1.4 %. Overall, the Federal Reserve’s monetary policy is likely to continue to support the US economy. We expect the key interest rate will be raised to 0.6 % at the end of 2016.
The Japanese economy is likely to grow by 0.2 % in 2016, with a slight increase in domestic and external demand. Monetary policy will probably become even more expansionary, with a possibility of the deposit rate being cut even further. The price level for consumer goods is likely to fall slightly. Growth in the emerging markets as a whole in 2016 will probably be approximately equal to that of the previous year. Growth in Asia (ex Japan) is likely to slow down slightly to 6.0 %, with inflation at 2.6 %. China’s economy is only likely to grow by 6.6 % in 2016, largely due to the slowdown in the industrial sector and in capital investment. Its inflation rate is likely to reach 1.8 %. Monetary policy may well become even more expansionary in order to support the economy.
Numerous risks are currently increasing the uncertainty of our global forecasts to an unusual extent. The outlook for U.S. monetary policy still remains very uncertain. There could also be an escalation in geopolitical risks, particularly with regard to the conflicts in the Middle East. Equally, a hard landing for China could give rise to global turbulence. In Europe, the political and economic costs of the UK referendum could prove higher than expected. Our forecasts could potentially be severely knocked off course by debate flaring up about the direction of monetary policy and the future of the Eurozone, a lack of consolidation in the public or private sectors, a stalling of the implementation of structural reforms or increased support for populist parties. Regional independence movements and further difficult negotiations with Greece represent additional risks. The refugee crisis could also re-ignite political division in the European Union.
Deutsche Bank 1 – Management Report 30Interim Report as of June 30, 2016
The Banking Industry Following the UK referendum, the global banking sector will need to be prepared for heightened volatility in the equity and credit markets in the coming months. Further political risks in Europe will also return to the fore, i.e. mimicking effects, populism or the refugee crisis. Economic risk factors are also present in the prolonged economic slowdown in the emerging markets, particularly China, and in the doubts about the solvency of some Eurozone periphery countries and their banking sectors.
In the Eurozone, the profitability of banks remains under structural pressure due to intense competition and the prolonged phase of low – and in some cases negative – interest rates. However, the TLTRO-II framework should provide European banks with an incentive to expand lending to the private sector. On the liabilities side, bank deposits are expected to continue to grow. The trend towards a decline in the proportion of medium to long-term deposits is also likely to continue as a result of low interest rates.
Credit growth in Germany is stronger than in the Eurozone as a whole and is likely to continue. However, rigorous implementation of the EU mortgage credit directive could depress mortgage lending business in Germany in the medium term.
Banks in the U.S., should continue to benefit from the upturn in the labor market. Consumer lending, in particular, is predicted to continue to grow with high rates. In the corporate sector, it remains to be seen whether the high growth in lending will be sustained in light of the strong U.S. dollar and modest global demand. Based on an expectation of further interest rate hikes by the Federal Reserve in the medium term, the profitability of U.S. banks should improve as interest margins increase.
Following a setback in the second quarter of 2016, the Japanese economy is likely to recover again over the further course of the year which will help to stimulate lending growth. In China, lending is at a high level but could become a little subdued going forward as a result of the slowdown in economic growth and the tightening of financial market regulation.
From a regulatory perspective, banks anticipate further final agreements on minimum capital requirements over the coming twelve months. The Basel Committee on Banking Supervision is expected to finalize the revised Standardized Approach for calculating risk-weighted assets, to set the leverage ratio requirements for global systemically important banks and to put forward a proposal in respect of capital requirements for sovereign risk exposures. In the Eurozone, the Single Resolution Board will determine the level of own funds and bail-in capable liabilities that major banks will be required to hold for a potential resolution (MREL, Minimum Requirement for Own Funds and Eligible Liabilities). In addition, European banks will be informed of the outcome of the stress test carried out by the European Central Bank (ECB) and the European Banking Authority (EBA). Banks can also expect a decision from European legislators on the so-called banking structural reform.
31
Deutsche Bank Interim Report as of June 30, 2016
Operating and Financial Review – 2 Strategy – 28 Outlook – 29
Risk and Opportunities – 35 Risk Report – 36
The Deutsche Bank Group In October 2015, Deutsche Bank presented the details of Strategy 2020. Since then, we have made significant progress. We further reduced risks on our balance sheet and we are simplifying structures and processes. Financial targets were announced by Deutsche Bank to underpin the financial objectives of our Strategy 2020. The most important financial Key Performance Indicators (KPIs) of the Group can be found in the table below.
Key Performance Indicators
Within our strategic plan, we used underlying foreign exchange rates of EUR/USD at 1.07 and EUR/GBP at 0.72 in setting the financial targets for 2018 and 2020.
For 2016, we expect revenues to continue to be impacted by the low interest rate environment, challenging market environment and macro-economic uncertainties. In addition, the implementation of strategic decision relating to restructuring activities across country, client and product portfolio reductions are likely to impact our revenue generation capacity. We intend to invest in growth areas of Transaction Banking, Asset Management, Wealth Management and Equities to improve revenue. We expect to incur the majority of our restructuring costs by the end of 2016 with restructuring activities to be mostly completed in 2017. Our total costs will continue to be burdened by litigation and restructuring charges in 2016.
Capital management remains focused on keeping the CRR/CRD 4 fully loaded Common Equity Tier 1 capital ratio (CET 1 ratio) on track to reach the Strategy 2020 target level of minimum 12.5 % by 2018. In 2016, we expect the fully loaded CET 1 ratio to remain broadly flat so that we would remain capitalized above regulatory minimum and SREP requirements. We expect CET 1 capital to be impacted by restructuring cost, litigation, and NCOU de-risking.
Over 2016, risk-weighted assets are expected to decrease mainly driven by the planned acceleration of our NCOU de-risking program, partly offset by the increase of Operational Risk related risk-weighted assets.
In order to support our overall capitalization, the Management Board proposed to the Supervisory Board to recommend no common share dividend for the fiscal year 2016. In our Strategy 2020 announcement, we articulated that we aspire to pay a competitive common share dividend payout ratio in the medium term.
We stay committed to reaching a fully loaded CRR/CRD 4 Leverage Ratio of at least 4.5 % in 2018 and at least 5 % in 2020 per Strategy 2020. While we continue our active CRD 4 exposure management, we expect the CRR/CRD 4 Leverage Ratio to be mainly affected by capital supply development in 2016.
Group Key Performance Indicators Jun 30, 2016 Target for 2018 Target for 2020 CRR/CRD 4 Common Equity Tier 1 capital ratio (fully loaded) 1 10.8 %2 At least 12.5 % At least 12.5 %
CRR/CRD 4 leverage ratio (fully loaded) 3 3.4 % At least 4.5 % At least 5.0 %
Post-tax Return on Average Tangible Equity 4 0.9 % Greater than 10.0 % Greater than 10.0 %
Adjusted costs 5 €12.7 bn Less than € 22 bn per annum Less than € 22 bn per annum
Cost-income ratio 6 90.0 % ~ 70.0 % ~ 65.0 %
Risk weighted assets 7 €402 bn € 320 bn € 310 bn
1 The CRR/CRD 4 fully loaded Common Equity Tier 1 ratio represents our calculation of our Common Equity Tier 1 ratio without taking into account the transitional provisions ofCRR/CRD 4. Further detail on the calculation of this ratio is provided in the Risk Report.
2 In line with the Management Board’s decision not to propose any dividend on common stock for the fiscal year 2016. 3 Further detail on the calculation of the CRR/CRD 4 leverage ratio (fully loaded) is provided in the Risk Report. 4 Based on Net Income attributable to Deutsche Bank shareholders. Calculation is based on an effective tax rate of 74 % for six months ended June 30, 2016. For further
information, please refer to “Other information Non-GAAP Financial Measures” of the report. 5 Total noninterest expense excluding restructuring & severance, litigation, impairment of goodwill and other intangibles and policyholder benefits and claims. For further
information please refer to “Other information Non-GAAP Financial Measures” of the report. 6 Total noninterest expenses as a percentage of total net interest income before provision for credit losses plus noninterest income. 7 Excluding expected regulatory inflation.
Deutsche Bank 1 – Management Report 32Interim Report as of June 30, 2016
The implementation of Strategy 2020 is well underway. We expect restructuring and severance expenses of approximately € 1 billion in the current year. Furthermore, timely and complete achievement of our Strategy 2020 aspirations may be adversely impacted by a continued burden from litigation, continued pressure from regulatory induced costs, bank levy charges, and reduced revenue-generating capacities of some of our core businesses in the current challenging market environment. We are nonetheless committed to work towards our target of 10 % Post-tax Return on Average Tangible Equity, when Strategy 2020 is to be fully implemented. The measures planned for implementation in 2016, whilst a burden in this year, are key elements to progress towards that target. Overall, we expect a partial improvement of our Post-tax Return on Average Tangible Equity in 2016.
Achieving a structurally affordable cost base is one of our top priorities. We remain committed to our Strategy 2020 target of an adjusted cost base of less than € 22 billion and a cost-income ratio of approximately 70 % by 2018. However, 2016 will remain a difficult year for us as it will take some time for our restructuring program to become visible in our cost base. We intend to continue to further identify cost savings and efficiencies, but at the same time we will invest in technology and regulatory compliance programs, and we will face higher costs from software amortization. We therefore expect our adjusted costs to be broadly flat in 2016 compared to 2015. In addition, our total costs will continue to be burdened by litigation and restructuring charges in 2016. As a result we expect our cost-income ratio to improve, but remain at an elevated level in 2016 as we also expect challenges on the revenue side driven by the low interest rate environment, market driven uncertainties and strategic decisions like KYC enhancements and high risk country exits.
Following the UK referendum on EU membership, we do not currently believe significant changes will be required to our current UK structure or business model in the short term as a result of the referendum. As a bank headquartered in Germany and with a strong presence in the UK, we are well prepared to mitigate the consequences of the UK leaving the EU. We will continue to ensure we are present where our clients are active, whatever the outcome of the negotiations.
By the nature of our business, we are involved in litigation, arbitration and regulatory proceedings and investigations in Germany and in a number of jurisdictions outside Germany, especially in the U.S. Such matters are subject to many uncertainties. While we have resolved a number of important legal matters and made progress on others, we expect the litigation and enforcement environment to continue to be challenging, and could impact the achievement of the above described expectations regarding our performance.
Our Business Segments The following paragraphs contain the outlook of our business segments.
For Global Markets (GM), we expect the business environment to remain challenging, especially in the light of recent macroeconomic events. In Debt Sales & Trading, we expect industry revenues to decline in 2016 versus 2015 levels, driven by an uncertain market environment leading to lower client activity. Equity Sales & Trading revenues for the industry are also expected to be lower for the year versus a very strong 2015. The United Kingdom’s vote to leave the European Union brings with it material uncertainty that is likely to impact economic growth particularly in Europe, and with it industry investment banking revenues potentially beyond 2016. Other ongoing risks and uncertainties also include exposure of global macroeconomic growth to event risks specifically in Europe, lower than expected growth rates and ongoing regulatory developments. Additionally, financial market turbulence, lower client activity, ongoing regulatory pressure, continued pressure on resources, Strategy 2020 execution, e.g. EM Debt hubbing and exiting high risk weight securitized trading, KYC enhancements and litigation charges continue to pose headwinds. However, despite challenging market conditions, we believe that continued implementation of Strategy 2020 will position us favorably to face potential challenges and capitalize on future opportunities.
33
Deutsche Bank Interim Report as of June 30, 2016
Operating and Financial Review – 2 Strategy – 28 Outlook – 29
Risk and Opportunities – 35 Risk Report – 36
For Corporate & Investment Banking (CIB), the business environment is expected to remain challenging throughout second half of 2016 with negative rates in key markets, volatile market conditions, ongoing regulatory pressures and the potential impact of geopolitical events putting downward pressure on our business. The UK referendum on Europe-an Union membership and the continued uncertainty of how it will proceed is likely to put further pressure on the Corporate Finance fee pool as deals may be postponed or pulled.
In second half of 2016, CIB is focused on continuing to enhance and refine our client franchise while improving the soundness and stability of our business model. Our client relationships remain a key priority, with the target of being a top three bank for our key corporate clients. This comprises shifting resources to higher returning products and relationships while rationalizing lower return, higher risk clients and high risk countries. This may have short term revenue impact to CIB but will be the framework for deepening our client relationships. We will continue to strengthen our processes and IT platforms, while maintaining strict risk, cost and capital discipline to further enhance the resilience and soundness of our business model. Finally, CIB will continue to focus on regulatory compliance, KYC and Client on-boarding process enhancements, control and conduct along with system stability in order to provide a strong foundation for future growth of CIB.
Private, Wealth & Commercial Clients (PW&CC) pursues a strategy of creating a leading, digitally enabled advisory bank with a strong focus on growth in Private Banking, Commercial Banking and Wealth Management. Our objectives include the provision of seamless client coverage with a distinct Private Banking and Wealth Management approach. We expect to realize synergies to improve efficiency in product offering, digital investment, operations, overhead and support functions. We also intend to further strengthen advisory capabilities and to put less emphasis on capital intensive products to improve capital efficiency. In our Private & Commercial Clients business we will adapt our distribution model in line with changing client behavior. Through the optimization of our branch network, the establishment of advisory centers, mobile sales force and 3rd party distribution partners and a strengthened digital offering, we create a seamless omni-channel model. In our Wealth-Management business we will strengthen our European presence and expand our services to (Ultra) High Net Worth clients in Asia, the Americas and the Middle East. The completion of the Hua Xia sales transaction is subject to customary closing conditions and regulatory approvals, including that of the China Banking Regulatory Commission. The application has been formally accepted by the China Banking Regulatory Commission in June 2016 and the approval process is now anticipated to be finalized in the third quarter of 2016.
For the remainder of 2016, we will continue our focus on investment and insurance products, but revenue dynamics in this business continue to be highly dependent on the impact of the current challenging market environment on customer confidence. We also expect revenues from deposit products to continue to suffer from the low interest rate environment while revenues from credit products are expected to slightly grow, reflecting continued customer demand as well as our strategy to selectively expand our loan book. Loan loss provisions were on very low levels and benefited in the first quarter from portfolio sales, so that we expect a higher level in the remaining half of 2016. Noninterest expenses in 2016 will continue to include charges and investment spend related to the execution of the above-mentioned transformation measures. In addition, both our revenues and noninterest expenses could be impacted by further regulatory requirements.
In Deutsche Asset Management (Deutsche AM), our outlook centers around the UK referendum result’s impact on markets, in the context of already fragile investor confidence. The immediate affect was a dramatic fall in sterling, accompanied by a global flight from risk into safe haven assets. Recurring bouts of further volatility across markets are anticipated, but whether longer term market sentiment settles upon United Kingdom referendum as a UK and Europe-an event - as opposed to a globally systemic event - will only be determined in the weeks and months ahead. Throughout this uncertain period for investors, Deutsche AM remains focused on delivering as a trusted partner and solutions provider to our clients.
Deutsche Bank 1 – Management Report 34Interim Report as of June 30, 2016
Longer term growth trends will continue to favor our capabilities in beta (passive) product and alternative investments, as well as active multi-asset solutions. Nonetheless, we continue to foresee challenging net new asset and revenue expectations for 2016, following the effect of net outflows and declining market values in the first half of the year. Difficult investment conditions have exacerbated pressure on industry economics, already challenged by margin compression, rising costs of regulation, and competition. In the face of this challenge, we intend to maintain a disciplined cost base. Investment in our platform and control environment will continue as we ensure stability, enhance our client service, and increase efficiency in our business.
For Postbank (PB), we expect total net revenues generated by our business to decrease moderately in the second half of 2016 compared to the first half of 2016, primarily driven by substantially lower Other net revenues.
Due to the continued low interest rate environment, we expect a moderate decrease in net revenues in Savings and Current Accounts. We expect Investment & Insurance to increase moderately, while revenue dynamics in this business remains highly dependent on the customer behavior in the current challenging market environment. We expect a stable development of net revenues for Current accounts, Loans, Home Loans & Savings, Postal and NCOU.
Following the successful completion of the operational separability of Postbank as per the end of the first half 2016, our main efforts include improving our efficiency, strengthening and broadening our lending profile and investing in digitalization, besides continued investments in measures to adapt to and comply with regulatory requirements. Despite these efforts the low interest rate levels as well as increasing regulatory requirements may continue to adversely impact our profitability.
The Non-Core Operations Unit (NCOU) continues to focus on reducing leverage and risk-weighted assets with an ambition to materially unwind the remaining positions by the end of 2016, such that residual risk-weighted assets are less than € 10 billion in aggregate. The aforementioned resolution of a long dated derivative asset will result in RWA relief of approximately € 2 billion in the third quarter of 2016. Challenges in the overall market environment may impact the execution of NCOU’s strategy, specifically in terms of the associated timeline and financial impact. This includes any potential economic slowdown or financial market volatility following the outcome of the UK referendum on EU membership. This uncertainty covers a number of factors that can impact the de-risking activity, however we expect this accelerated wind down to be accretive to the Group’s capital ratios in 2016. We continue to expect the litigation and enforcement environment to remain challenging for the foreseeable future.
35
Deutsche Bank Interim Report as of June 30, 2016
Operating and Financial Review – 2 Strategy – 28 Outlook – 29
Risk and Opportunities – 35 Risk Report – 36
Risks and Opportunities
The risks and opportunities that we believe are likely to occur have been incorporated into our Outlook. The following section focuses on future trends or events that may result in downside risk or upside potential of what we have anticipated in our Outlook.
Our aspirations are subject to various external and internal factors. In particular, timely and complete achievement of our Strategy 2020 aspirations may be adversely impacted by the reduced revenue-generating capacities of some of our core businesses in the current challenging macro-economic and market environment, the ongoing headwinds posed by regulatory reforms and/or legal and regulatory proceedings.
Depending on whether the economic and market conditions worsen or improve compared to forecasted levels, this could either adversely affect or positively impact our business, results of operations or strategic plans.
The overall macro-economic impact of the United Kingdom’s decision to leave the European Union, which will depend on Europe’s political response to Brexit, is difficult to predict. In general, weaker investment and thereby slower economic growth are expected to persist during the UK exit negotiations. As a consequence, we will closely monitor the developments and their impact on our business and operating model. This may potentially require taking impairments on assets.
Sentiment towards the Italian banking sector deteriorated in the second quarter of 2016 driven by concerns around capitalization, non-performing loans and the expected impact of the EU-wide stress test results on July 29, 2016. Discussions with the EU around a potential bailout package risk increasing tensions at a time when the United Kingdom’s decision to leave the European Union may strengthen populist and separatist voices across Europe. The Senate reform referendum in October presents a further potential risk to political stability. These developments could have an adverse impact on our business, results of operations or strategic plans.
In case Deutsche Bank AG’s parent entity solo HGB results do not provide sufficient available distributable items (ADI) for Deutsche Bank AG, this could impact our ability to service AT1 coupons, leading to higher funding costs.
Similarly, a downgrade in credit rating could affect our funding costs and business activities, although we are unable to predict whether this would be the case or the extent of any such effect.
The regulatory reforms enacted and proposed in response to weaknesses in the financial sector together with the increased regulatory scrutiny and discretion will impose material costs on us, create significant uncertainty for us and may adversely affect our business plans as well as our ability to execute our strategic plans. In addition, regulatory reforms in respect of resolvability or resolution measures may also impact our shareholders and creditors.
We are subject to a number of legal proceedings and regulatory investigations whose outcome is difficult to estimate and which may substantially and adversely affect our planned results of operations, financial condition and reputation.
Although we have devoted significant resources to develop our risk management policies, procedures and methods, including with respect to market, credit, liquidity and operational risk, they may not be fully effective in mitigating our risk exposures.
Deutsche Bank 1 – Management Report 36Interim Report as of June 30, 2016
Risk Report
Introduction The following Risk Report provides qualitative and quantitative disclosures about credit, market and other risks following the principles of the International Financial Reporting Standard (IFRS 7). Consequently, the reporting is generally based on IFRS principles of valuation and consolidation. However, for dedicated regulatory disclosures the regulatory principles of consolidation are relevant which differ from those applied for our financial statements. Details on the main differences between these two consolidation regimes are provided in our annual Pillar 3 Report 2015.
CRR/CRD 4 Capital Framework
In the European Union, the Basel 3 capital framework was implemented by the “Regulation (EU) No 575/2013 on prudential requirements for credit institutions and investment firms” (Capital Requirements Regulation, or “CRR”) published on June 27, 2013, and the “Directive 2013/36/EU on access to the activity of credit institutions and the prudential supervision of credit institutions and investment firms” (Capital Requirements Directive 4, or “CRD 4”) published on June 27, 2013. The new regulatory framework became effective on January 1, 2014, subject to transitional rules. When referring to Deutsche Bank results according to transitional rules we use the term “CRR/CRD 4”. When referring to results according to full application of the final framework (without consideration of applicable transitional methodology) we use the term “CRR/CRD 4 fully loaded”. In some cases, CRR/CRD 4 maintains transitional rules that had been adopted in earlier capital adequacy frameworks through Basel 2 or Basel 2.5.
Details on our regulatory exposures as well as applicable ratios are provided further below in this report or in our dedicated Pillar 3 Report as per June 30, 2016.
ICAAP/ILAAP and SREP
The lnternal Capital Adequacy Assessment Process (“ICAAP”) as stipulated in Pillar 2 of Basel 3 requires banks to identify and assess risks, maintain sufficient capital to face these risks and apply appropriate risk management techniques to maintain adequate capitalization. The Internal Liquidity Adequacy Assessment Process (“ILAAP”) similar to ICAAP focuses on maintaining sufficient liquidity risk management. The Supervisory Review and Evaluation Process (“SREP”) refers to the common methodology and standards used by the European Central Bank (ECB) in its role under the Single Supervisory Mechanism (SSM). In accordance with Article 97 of the Capital Requirements Directive (CRD 4), supervisors regularly review the arrangement, strategies, process and mechanisms implemented by banks and evaluate: (a) the risks to which the institution might be exposed; (b) the risks the institution might pose to the financial system in general; and (c) the risks revealed by stress testing.
Risk Management Framework
The diversity of our business model requires us to identify, assess, measure, aggregate and manage our risks, and to allocate our capital among our businesses. Risk and capital are managed via a framework of principles, organizational structures and measurement and monitoring processes that are closely aligned with the activities of the divisions and business units. Further details can be found in our Annual Report 2015 sections “Risk Management Principles and Governance” and “Risk Governance”.
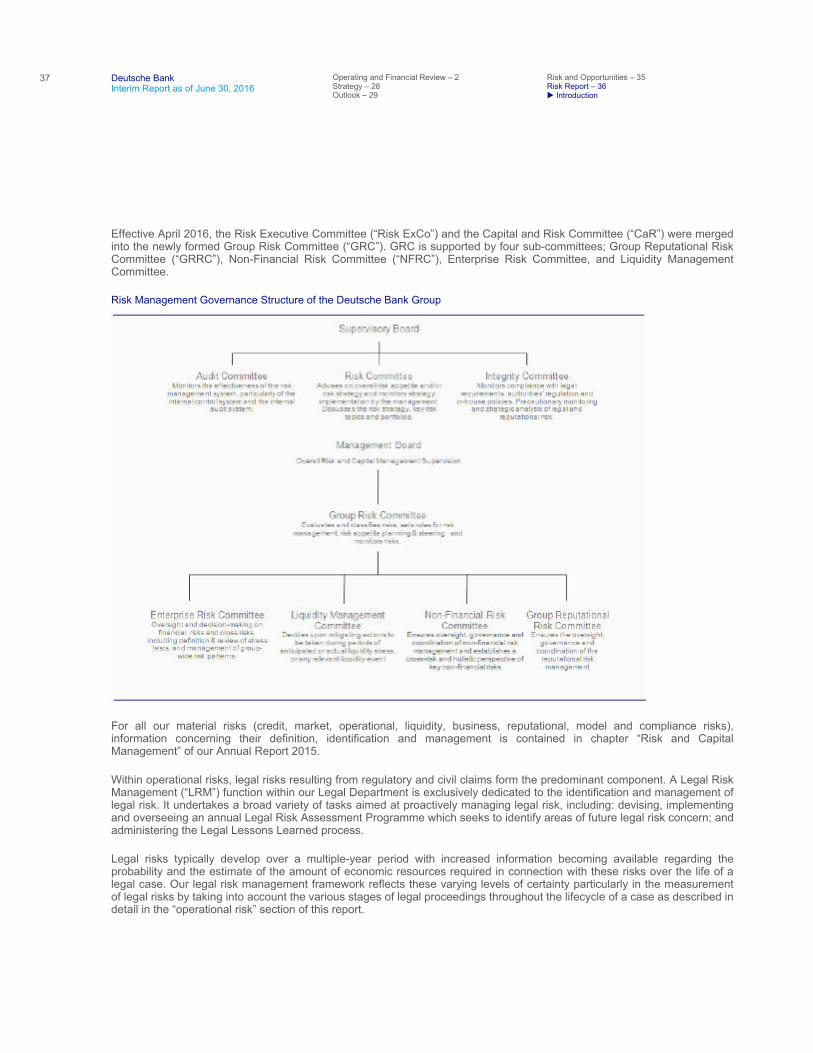
37
Deutsche Bank Interim Report as of June 30, 2016
Operating and Financial Review – 2 Strategy – 28 Outlook – 29
Risk and Opportunities – 35 Risk Report – 36
Introduction
Effective April 2016, the Risk Executive Committee (“Risk ExCo”) and the Capital and Risk Committee (“CaR”) were merged into the newly formed Group Risk Committee (“GRC”). GRC is supported by four sub-committees; Group Reputational Risk Committee (“GRRC”), Non-Financial Risk Committee (“NFRC”), Enterprise Risk Committee, and Liquidity Management Committee.
Risk Management Governance Structure of the Deutsche Bank Group
For all our material risks (credit, market, operational, liquidity, business, reputational, model and compliance risks), information concerning their definition, identification and management is contained in chapter “Risk and Capital Management” of our Annual Report 2015.
Within operational risks, legal risks resulting from regulatory and civil claims form the predominant component. A Legal Risk Management (“LRM”) function within our Legal Department is exclusively dedicated to the identification and management of legal risk. It undertakes a broad variety of tasks aimed at proactively managing legal risk, including: devising, implementing and overseeing an annual Legal Risk Assessment Programme which seeks to identify areas of future legal risk concern; and administering the Legal Lessons Learned process.
Legal risks typically develop over a multiple-year period with increased information becoming available regarding the probability and the estimate of the amount of economic resources required in connection with these risks over the life of a legal case. Our legal risk management framework reflects these varying levels of certainty particularly in the measurement of legal risks by taking into account the various stages of legal proceedings throughout the lifecycle of a case as described in detail in the “operational risk” section of this report.
Deutsche Bank 1 – Management Report 38Interim Report as of June 30, 2016
All risks assessed as material are covered by the Internal Capital Adequacy Assessment Process as described in the section “Internal Capital Adequacy” of this report. Modeling and measurement approaches for quantifying capital and demand are implemented across major risk classes. Our material non-standard risks (i.e. reputational risk, model risk, compliance risk) are implicitly covered in our economic capital framework, primarily within operational and strategic risk. Further details on the measurement approaches can be found in our 2015 Pillar 3 Report in the section “Risk Quantification and Measurement”.
Risk and Capital Overview
Key Risk Metrics
The following selected key risk ratios and corresponding metrics form part of our holistic risk management across individual risk types. Common Equity Tier 1 Ratio (CET1), Internal Capital Adequacy Ratio (ICA), Leverage Ratio (LR), Liquidity Coverage Ratio (LCR) and Stressed Net Liquidity Position (SNLP) as high level metrics are fully integrated across strategic planning, risk appetite framework, stress testing, and recovery & resolution planning practices, which are reviewed and approved by our Management Board at least annually. Apart from Internal Capital Adequacy Ratio and Total Economic Capital, the following ratios and metrics are based on the fully loaded CRR/CRD 4 rules.
For further details please refer to this report under sections “Risk Profile”, “Internal Capital Adequacy”, “Capital Instruments”, “Development of Regulatory Capital”, “Development of Risk-Weighted Assets”, and “Leverage Ratio”, and our Annual Report 2015 section “Risk Appetite and Capacity”, “Recovery and Resolution Planning”, “Stress Testing”, and “Internal Capital Adequacy Assessment Process”.
Common Equity Tier 1 Ratio 30.6.20161 10.8 % 31.12.2015 11.1 %
Total Risk-Weighted Assets 30.6.2016 €402.2 bn 31.12.2015 €396.7 bn
Internal Capital Adequacy Ratio2 30.6.2016 149 % 31.12.2015 158 %
Total Economic Capital 30.6.2016 €39.2 bn 31.12.2015 €38.4 bn
Leverage Ratio 30.6.2016 3.4 % 31.12.2015 3.5 %
Leverage Exposure 30.6.2016 €1,415 bn 31.12.2015 €1.395 bn
Liquidity Coverage Ratio 30.6.2016 124 % 31.12.2015 119 %
Stressed Net Liquidity Position (sNLP) 30.6.2016 €29 bn3 31.12.2015 €46 bn
1 In line with the Management Board’s decision not to propose any dividend on common stock for the fiscal year 2016. 2 The definition of Capital Supply for the purpose of calculating the Internal Capital Adequacy ratio has been further aligned to CRR/CRD 4 rules in that, goodwill and other
intangible assets are now deducted from Capital Supply instead of being added to economic capital demand. More information is provided in section “Internal Capital Adequacy”.
3 Preliminary amount.
39
Deutsche Bank Interim Report as of June 30, 2016
Operating and Financial Review – 2 Strategy – 28 Outlook – 29
Risk and Opportunities – 35 Risk Report – 36
Risk and Capital Overview
Overall Risk Assessment
Key risk categories include 1) financial risks such as credit risk (counterparty risk, industry risk, country risk and product risk), market risk (trading, non-trading and traded default risk), liquidity risk, business risk (including tax and strategic risk), and 2) non-financial risks (NFRs) including reputational risk and operational risk (with important sub-categories compliance risk, legal risk, model risk, information security risks, fraud risks, and money laundering risks). We manage the identification, assessment and mitigation of top and emerging risks through an internal governance process and the use of risk management tools and processes. Our approach to identification and impact assessment aims to ensure that we mitigate the impact of these risks on our financial results, long term strategic goals and reputation. Please refer to our Annual Report 2015 under section “Risk and Capital Management” for detailed information on the management of our material risks.
As part of our regular risk and cross-risk analysis, sensitivities of the key portfolio risks are reviewed using a bottom-up risk assessment and through a top-down macro-economic and political scenario analysis. This two-pronged approach allows us to capture not only risks that have an impact across our risk inventories and business divisions but also those that are relevant only to specific portfolios.
The United Kingdom’s decision to leave the European Union on June 23, 2016 was the key portfolio focus during the second quarter. The referendum result led to significant financial market volatility and although major equity markets subsequently recovered, Sterling remains substantially weaker, Bund and Treasury yields reached new record lows and EU bank shares underperformed. We are likely to see a prolonged period of uncertainty regarding the UK’s future status with the EU. We conducted extensive preparations ahead of the vote with the aim to ensure that Risk portfolios were well-positioned. We are closely monitoring the impact on the UK economy as well as broader European political risks and the potential for contagion.
The assessment of the potential impacts of these risk factors is integrated into our group-wide stress tests which assess our ability to absorb stress events should they occur. The results of these tests showed that we currently have adequate capital and liquidity reserves to absorb the impact of these risks if they were to materialize in line with the tests’ parameters.
The first six months of 2016 continued to demonstrate the trend of increasing global regulation of the financial services industry, which we view as likely to persist through the coming years. We are focused on identifying potential political and regulatory changes and assessing the possible impact on our business model and processes.
The overall focus of Risk and Capital Management is maintaining our risk profile in line with our risk strategy, increasing our capital base and supporting our strategic management initiatives with a focus on balance sheet optimization.
On June 29, 2016, the Federal Reserve announced the results of its 2016 Comprehensive Capital Analysis and Review (CCAR). 33 banks participated in this exercise, including Deutsche Bank Trust Corporation (DBTC). DBTC is an entity through which we conduct our US Wealth Management and Global Transaction Banking businesses, and covers less than 15 % of the bank’s US assets and 3 % of global assets. While the Federal Reserve previously announced that it approved the DBTC Capital Plan on a quantitative basis, and while noting progress, it objected to the Capital Plan for qualitative reasons. We will endeavor to implement the lessons learned this year in order to strengthen our capital planning process for future CCAR submissions.
Deutsche Bank 1 – Management Report 40Interim Report as of June 30, 2016
Risk Profile
The table below shows our overall risk position as measured by the economic capital usage calculated for credit, market, operational and business risk for the dates specified. To determine our overall (non-regulatory) risk position, we generally consider diversification benefits across risk types.
Overall risk position as measured by economic capital usage by risk type
As of June 30, 2016, our economic capital usage amounted to € 39.2 billion, which was € 715 million or 2 %, above the € 38.4 billion economic capital usage as of December 31, 2015.
The economic capital usage for credit risk increased by € 742 million or 5 % higher compared to year-end 2015. This increase was mainly driven by higher risk exposures in Global Markets.
The economic capital usage for trading market risk increased to € 4.8 billion as of June 30, 2016, compared with € 4.6 billion at year-end 2015. The change was primarily driven by an increase in the fair value banking book component. The nontrading market risk economic capital usage decreased by € 258 million or 2 %, mainly driven by a lower structural foreign exchange risk exposure, partly offset by a higher pension risk.
The operational risk economic capital usage totaled € 11.1 billion as of June 30, 2016, which was € 823 million or 8 % higher than the € 10.2 billion economic capital usage as of December 31, 2015. The increase was mainly driven by legal operational risk losses including legal provisions and an increased operational risk loss profile of the industry as a whole. This is reflected in the operational risk loss data that has given rise to the increased economic capital usage which is largely due to the outflows related to litigation, investigations and regulatory enforcement actions.
Our business risk economic capital methodology captures strategic risk, which also implicitly includes elements of non-standard risks including refinancing and reputational risk, and a tax risk component. The business risk decreased by € 983 million to € 4.9 billion as of June 30, 2016. This decrease reflected a lower economic capital usage for the strategic risk component.
The inter-risk diversification effect of the economic capital usage across credit, market, operational and strategic risk decreased by € 121 million, or 1 %, reflecting an update of the model parameters in the first quarter 2016, partly offset by an increase in economic capital usage before diversification.
Our mix of various business activities results in diverse risk taking by our business divisions. We measure the key risks inherent in their respective business models through the undiversified Total Economic Capital (EC) metric, which mirrors each business division’s risk profile before taking into account cross-risk effects at the Group level.
2016 increase (decrease)
from 2015 in € m. (unless stated otherwise) Jun 30, 2016 Dec 31, 2015 in € m. in % Credit risk 14,427 13,685 742 5
Market risk 17,447 17,436 11 0 Trading market risk 4,827 4,557 270 6 Nontrading market risk 12,620 12,878 (258) (2)
Operational risk 11,066 10,243 823 8
Business risk 4,948 5,931 (983) (17)
Diversification benefit1 (8,731) (8,852) 121 (1)
Total economic capital usage 39,157 38,442 715 2
1Diversification benefit across credit, market, operational and strategic risk (largest part of business risk).
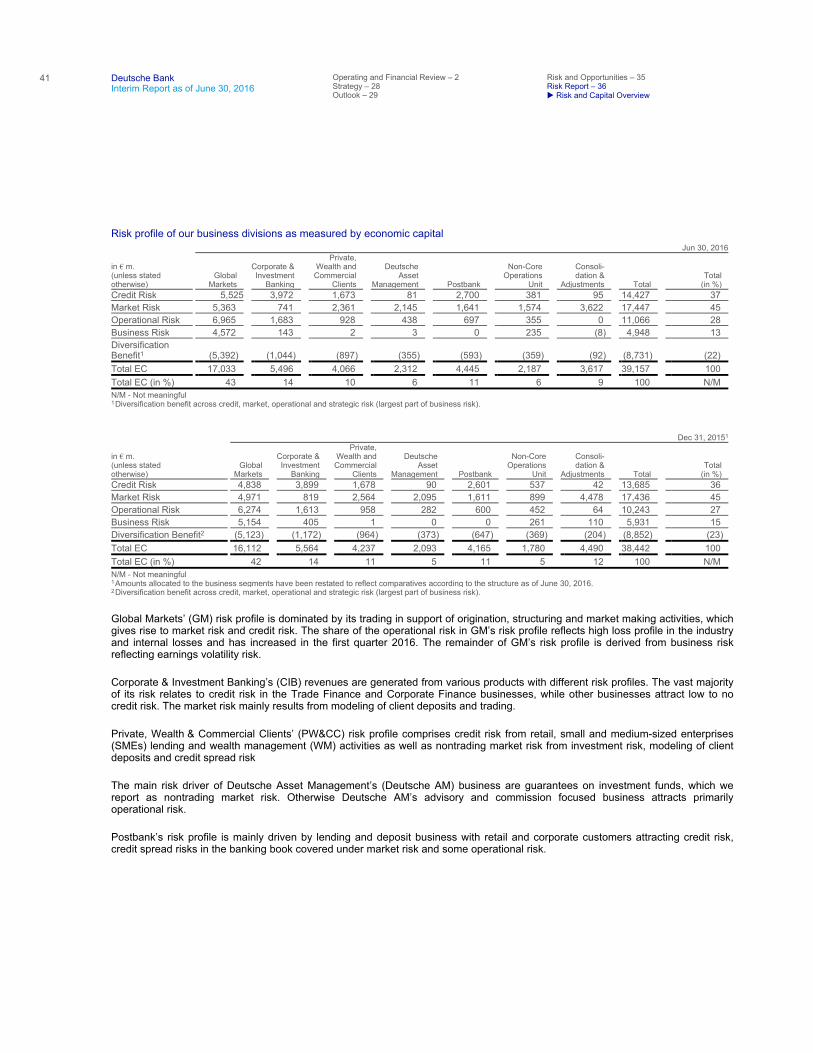
41
Deutsche Bank Interim Report as of June 30, 2016
Operating and Financial Review – 2 Strategy – 28 Outlook – 29
Risk and Opportunities – 35 Risk Report – 36
Risk and Capital Overview
Risk profile of our business divisions as measured by economic capital
N/M - Not meaningful
N/M - Not meaningful
Global Markets’ (GM) risk profile is dominated by its trading in support of origination, structuring and market making activities, which gives rise to market risk and credit risk. The share of the operational risk in GM’s risk profile reflects high loss profile in the industry and internal losses and has increased in the first quarter 2016. The remainder of GM’s risk profile is derived from business risk reflecting earnings volatility risk.
Corporate & Investment Banking’s (CIB) revenues are generated from various products with different risk profiles. The vast majority of its risk relates to credit risk in the Trade Finance and Corporate Finance businesses, while other businesses attract low to no credit risk. The market risk mainly results from modeling of client deposits and trading.
Private, Wealth & Commercial Clients’ (PW&CC) risk profile comprises credit risk from retail, small and medium-sized enterprises (SMEs) lending and wealth management (WM) activities as well as nontrading market risk from investment risk, modeling of client deposits and credit spread risk
The main risk driver of Deutsche Asset Management’s (Deutsche AM) business are guarantees on investment funds, which we report as nontrading market risk. Otherwise Deutsche AM’s advisory and commission focused business attracts primarily operational risk.
Postbank’s risk profile is mainly driven by lending and deposit business with retail and corporate customers attracting credit risk, credit spread risks in the banking book covered under market risk and some operational risk.
Jun 30, 2016
in € m. (unless stated otherwise)
Global Markets
Corporate & Investment
Banking
Private, Wealth and
Commercial Clients
Deutsche Asset
Management Postbank
Non-Core Operations
Unit
Consoli- dation &
Adjustments Total Total
(in %) Credit Risk 5,525 3,972 1,673 81 2,700 381 95 14,427 37
Market Risk 5,363 741 2,361 2,145 1,641 1,574 3,622 17,447 45
Operational Risk 6,965 1,683 928 438 697 355 0 11,066 28
Business Risk 4,572 143 2 3 0 235 (8) 4,948 13
Diversification Benefit1 (5,392) (1,044) (897) (355) (593) (359) (92) (8,731) (22)
Total EC 17,033 5,496 4,066 2,312 4,445 2,187 3,617 39,157 100
Total EC (in %) 43 14 10 6 11 6 9 100 N/M
1Diversification benefit across credit, market, operational and strategic risk (largest part of business risk).
Dec 31, 20151
in € m. (unless stated otherwise)
Global Markets
Corporate & Investment
Banking
Private, Wealth and Commercial
Clients
Deutsche Asset
Management Postbank
Non-Core Operations
Unit
Consoli- dation &
Adjustments Total Total
(in %) Credit Risk 4,838 3,899 1,678 90 2,601 537 42 13,685 36
Market Risk 4,971 819 2,564 2,095 1,611 899 4,478 17,436 45
Operational Risk 6,274 1,613 958 282 600 452 64 10,243 27
Business Risk 5,154 405 1 0 0 261 110 5,931 15
Diversification Benefit2 (5,123) (1,172) (964) (373) (647) (369) (204) (8,852) (23)
Total EC 16,112 5,564 4,237 2,093 4,165 1,780 4,490 38,442 100
Total EC (in %) 42 14 11 5 11 5 12 100 N/M
1Amounts allocated to the business segments have been restated to reflect comparatives according to the structure as of June 30, 2016. 2Diversification benefit across credit, market, operational and strategic risk (largest part of business risk).
Deutsche Bank 1 – Management Report 42Interim Report as of June 30, 2016
The Non-Core Operations Unit (NCOU) portfolio includes activities that are non-core to the Bank’s future strategy, assets earmarked for de-risking, assets suitable for separation, assets with significant capital absorption but low returns, and assets exposed to legal risks. NCOU’s risk profile covers risks across the entire range of our operations primarily comprising credit and market risks targeted where possible for accelerated de-risking. The increase of NCOU’s risk profile over the six months of 2016 was driven by CVA risk from the inclusion of additional positions in the fair value banking book market risk calculation.
Consolidation & Adjustments mainly comprises nontrading market risk for structural foreign exchange risk, pension risk and equity compensation risk. The decrease of nontrading market risk in the first six months of 2016 was mainly driven by a lower structural foreign exchange risk.
Risk and Capital Performance
Regulatory Capital
Capital Adequacy
The calculation of our regulatory capital incorporates the capital requirements following the “Regulation (EU) No 575/2013 on prudential requirements for credit institutions and investment firms” (Capital Requirements Regulation or “CRR”) and the “Directive 2013/36/EU on access to the activity of credit institutions and the prudential supervision of credit institutions and investment firms” (Capital Requirements Directive 4 or “CRD 4”) as implemented into German law. The information in this section as well as in the section “Development of risk-weighted Assets” is based on the regulatory principles of consolidation.
Under the CRR/CRD 4 transitional rules, capital instruments no longer eligible are phased out while the new rules on regulatory adjustments are phased in. These provisions are allowed in order to ease the transition for banks to the fully loaded capital rules. The fully loaded CRR/CRD 4 metrics do not take these transitional rules into account (i.e. all capital instruments no longer eligible are excluded and all new regulatory adjustments are applied). At the same time, CRR/CRD 4 left in place unchanged transitional rules that had been adopted in earlier capital adequacy frameworks through Basel 2.5 regarding the risk weighting of certain categories of assets, e.g. the rule permitting the grandfathering of equity investments at a risk-weight of 100 %. In this case, our CRR/CRD 4 methodology assumes that the impact of the expiration of these transitional rules will be mitigated through sales of the underlying assets or other measures prior to the expiration of the grandfathering provisions at the end of 2017.
Capital Instruments
Our Management Board received approval from the 2015 Annual General Meeting to buy back up to 137.9 million shares before the end of April 2020. Thereof 69.0 million shares can be purchased by using derivatives. These authorizations substitute the authorizations of the previous year. We have received approval from the BaFin for share buybacks for 2015 and from the ECB for 2016 according to new CRR/CRD 4 rules. During the period from the 2015 Annual General Meeting until the 2016 Annual General Meeting (May 19, 2016), 37.9 million shares have been purchased, of which 4.7 million shares through exercise of call options. The shares purchased were used for equity compensation purposes in the same period or are to be used in the upcoming period so that the number of shares held in Treasury from buybacks was 12.1 million as of the 2016 Annual General Meeting.
43
Deutsche Bank Interim Report as of June 30, 2016
Operating and Financial Review – 2 Strategy – 28 Outlook – 29
Risk and Opportunities – 35 Risk Report – 36
Risk and Capital Performance
The 2016 Annual General Meeting granted our Management Board the approval to buy back up to 137.9 million shares before the end of April 2021. Thereof 69.0 million shares can be purchased by using derivatives. These authorizations substitute the authorizations of the previous year. During the period from the 2016 Annual General Meeting until June 30, 2016, no further shares were purchased. The number of shares held in Treasury from buybacks was 12.1 million as of June 30, 2016.
Since the 2015 Annual General Meeting authorized capital available to the Management Board is € 1,760 million (688 million shares). The conditional capital stands at € 486 million (190 million shares).
Our legacy Hybrid Tier 1 capital instruments (substantially all noncumulative trust preferred securities) are not fully recognized under fully loaded CRR/CRD 4 rules, mainly because they have no write-down or equity conversion feature. However, they are to a large extent recognized as Additional Tier 1 capital under CRR/CRD 4 transitional provisions and can still be partially recognized as Tier 2 capital under the fully loaded CRR/CRD 4 rules. During the transitional phase-out period the maximum recognizable amount of Additional Tier 1 instruments from Basel 2.5 compliant issuances as of December 31, 2012 will be reduced at the beginning of each financial year by 10 % or € 1.3 billion, through 2022. For June 30, 2016, this resulted in eligible Additional Tier 1 instruments of € 10.9 billion (i.e. € 4.6 billion newly issued AT1 Notes plus € 6.3 billion of legacy Hybrid Tier 1 instruments recognizable during the transition period). € 5.8 billion of the legacy Hybrid Tier 1 instruments can still be recognized as Tier 2 capital under the fully loaded CRR/CRD 4 rules. One Hybrid Tier 1 capital instrument with a notional of $ 0.2 billion and an eligible equivalent amount of € 0.1 billion has been called during the first quarter 2016.
The total of our Tier 2 capital instruments as of June 30, 2016 recognized during the transition period under CRR/CRD 4 was € 6.9 billion. As of June 30, 2016, there are no further legacy Hybrid Tier 1 instruments that are counted as Tier 2 capital under transitional rules. The gross notional value of the Tier 2 capital instruments was € 8.1 billion as of June 30, 2016. No Tier 2 capital instruments have been called since year-end 2015.
On May 19, 2016, we issued fixed rate subordinated Tier 2 notes with an aggregate amount of € 750 million. The notes have a denomination of € 100,000 and are due April 19, 2026. They were issued in transactions outside of the United States, not subject to the registration requirements of the US Securities Act of 1933, as amended, and were not offered or sold in the United States.
Furthermore, we issued fixed rate subordinated Tier 2 notes with an aggregate amount of € 31 million on June 15, 2016. The notes have a denomination of € 100,000 and are due June 15, 2026. They were issued in transactions outside of the United States, not subject to the registration requirements of the US Securities Act of 1933, as amended, and were not offered or sold in the United States.
Minimum capital requirements and additional capital buffers
Since 2015 the CET 1 minimum capital requirement applicable to the Group is 4.5 % of RWA. The total capital requirement of 8 % demands further resources that may be met with up to 1.5 % AT1 capital and up to 2 % Tier 2 capital.
In addition to these minimum capital requirements, the following capital buffer requirements were phased-in starting 2016 and will become fully effective from 2019 onwards. In March 2015, Deutsche Bank was designated as a global systemically important institution (G-SII) by the German Federal Financial Supervisory Authority (BaFin) in agreement with Deutsche Bundesbank. The resulting G-SII buffer requirement of 2 % CET 1 capital of RWA in 2019 is phased in with 0.5 % in 2016. The capital conservation buffer requirement of 2.5 % CET 1 capital of RWA in 2019 implemented in Section 10c German Banking Act, based on Article 129 CRD 4 is phased in with 0.625 % in 2016. The institution-specific countercyclical buffer that applies to Deutsche Bank is the weighted average of the countercyclical capital buffers that apply in the jurisdictions where our relevant credit exposures are located. As per June 30, 2016 the coun-tercyclical capital buffer is at 0.01 %.
Deutsche Bank 1 – Management Report 44Interim Report as of June 30, 2016
In addition, pursuant to the Supervisory Review and Evaluation Process (SREP), the ECB may impose capital requirements on individual banks which are more stringent than statutory requirements. On December 4, 2015, the ECB informed Deutsche Bank that the consolidated Group has to keep a CET 1 ratio of at least 10.25 % on a phase-in basis under applicable transitional rules under CRR/CRD 4 at all times. Considering the G-SII buffer of 0.5 % and the coun-tercyclical buffer of 0.01 %, our overall CET 1 requirements amount to 10.76 % as per June 30, 2016.
Further information about minimum capital requirements and additional capital buffers can be found in our Annual Report 2015.
Development of regulatory capital
Our CRR/CRD 4 Tier 1 capital as of June 30, 2016 amounted to € 56.4 billion, consisting of a Common Equity Tier 1 (CET 1) capital of € 49.0 billion and Additional Tier 1 (AT1) capital of € 7.4 billion. The CRR/CRD 4 Tier 1 capital was € 1.8 billion lower than at the end of 2015, primarily driven by a decrease in CET 1 capital of € 3.5 billion since year end 2015 while AT1 capital increased by € 1.6 billion in the same period.
The € 3.5 billion decrease of CRR/CRD 4 CET 1 capital was largely the result of increased regulatory adjustments due to the higher phase-in rate of 60 % in 2016 compared to 40 % in 2015. Moreover the negative impact from Currency Translation Adjustments of € 0.7 billion and losses from remeasurement effects relating to defined benefit pension plans of € 0.3 billion in 2016 contributed to the decrease of CET1 capital in 2016. Deutsche Bank’s revised common share dividend policy refers to the ECB Decision (EU) (2015/4) on the recognition of interim or year-end profits in CET1 capital as long as the Management Board does not decide and officially announce a different dividend level for the respective year. In line with the Management Board’s decision not to propose any dividend on common stock for the fiscal year 2016, no share dividend has been accrued for the first half of 2016.
The € 1.6 billion increase in CRR/CRD 4 AT1 capital was mainly the result of reduced regulatory adjustments (€ 1.8 bil- lion lower than at year end 2015) that were phased out from AT1 capital. These deductions reflect the residual amount of certain CET 1 deductions that are subtracted from CET 1 capital under fully loaded rules, but are allowed to reduce AT1 capital during the transitional period. The phase-in rate for these deductions on the level of CET 1 capital increased to 60 % in 2016 (40 % in 2015) and decreased correspondingly on the level of AT1 capital to 40 % in 2016 (60 % in 2015). The reduction of regulatory adjustments on the level of AT1 capital over-compensated the decrease in our CRR/CRD 4 AT1 capital instruments of € 0.2 billion (compared to December 31, 2015) that resulted mainly from our redemptions of legacy Hybrid Tier 1 capital and negative foreign exchange effects in our USD-denominated instruments.
Our fully loaded CRR/CRD 4 Tier 1 capital as of June 30, 2016 was € 48.1 billion, compared to € 48.7 billion at the end of 2015. Our fully loaded CRR/CRD 4 CET 1 capital amounted to € 43.5 billion as of June 30, 2016, compared to € 44.1 billion as of December 31, 2015. Our fully loaded CRR/CRD 4 Additional Tier 1 capital amounted to € 4.6 billion as per end of June 2016, unchanged compared to year end 2015.
The decrease of our fully loaded CET 1 capital of € 0.6 billion compared to year end 2015 capital was largely the result of a negative impact from Currency Translation Adjustments of € 0.7 billion with partially positive foreign exchange counter-effects in capital deduction items. The decrease was furthermore driven by remeasurement losses related to defined benefit pension plans of € 0.3 billion.
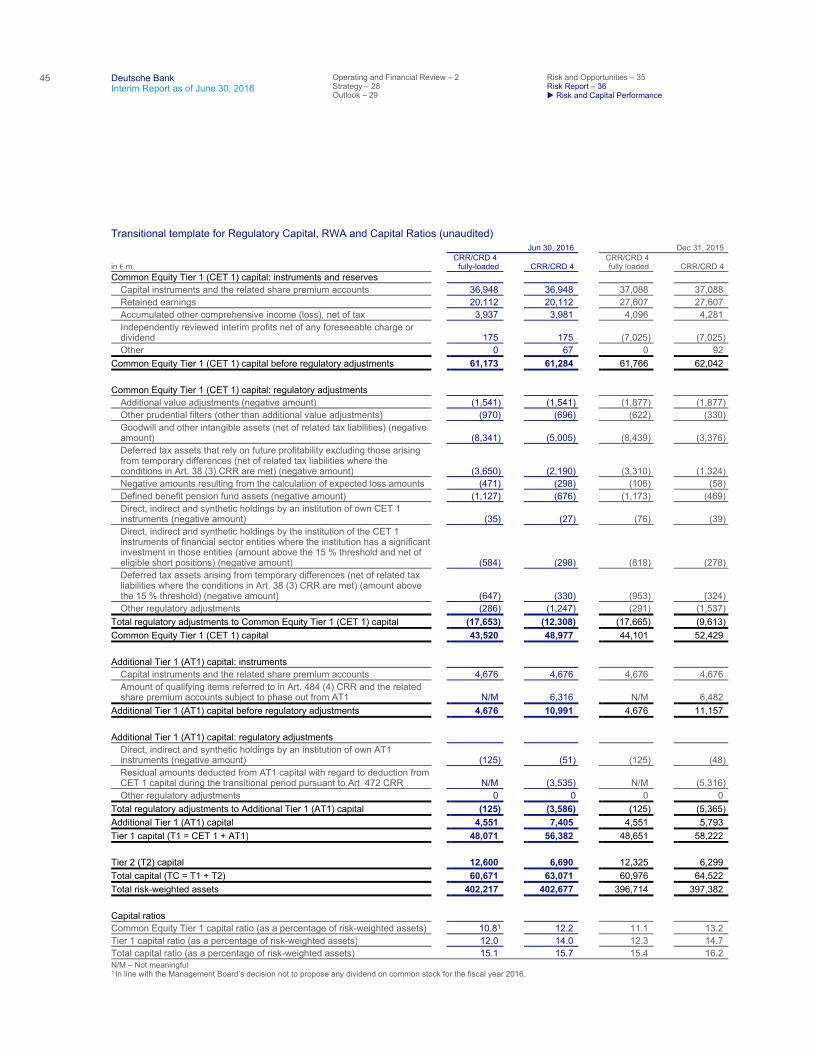
45
Deutsche Bank Interim Report as of June 30, 2016
Operating and Financial Review – 2 Strategy – 28 Outlook – 29
Risk and Opportunities – 35 Risk Report – 36
Risk and Capital Performance
Transitional template for Regulatory Capital, RWA and Capital Ratios (unaudited)
N/M – Not meaningful
Jun 30, 2016 Dec 31, 2015
in € m. CRR/CRD 4
fully-loaded CRR/CRD 4 CRR/CRD 4
fully loaded CRR/CRD 4 Common Equity Tier 1 (CET 1) capital: instruments and reserves
Capital instruments and the related share premium accounts 36,948 36,948 37,088 37,088
Retained earnings 20,112 20,112 27,607 27,607
Accumulated other comprehensive income (loss), net of tax 3,937 3,981 4,096 4,281
Independently reviewed interim profits net of any foreseeable charge or dividend 175 175 (7,025) (7,025)
Other 0 67 0 92
Common Equity Tier 1 (CET 1) capital before regulatory adjustments 61,173 61,284 61,766 62,042
Common Equity Tier 1 (CET 1) capital: regulatory adjustments
Additional value adjustments (negative amount) (1,541) (1,541) (1,877) (1,877)
Other prudential filters (other than additional value adjustments) (970) (696) (622) (330)
Goodwill and other intangible assets (net of related tax liabilities) (negative amount) (8,341) (5,005) (8,439) (3,376)
Deferred tax assets that rely on future profitability excluding those arising from temporary differences (net of related tax liabilities where the conditions in Art. 38 (3) CRR are met) (negative amount) (3,650) (2,190) (3,310) (1,324)
Negative amounts resulting from the calculation of expected loss amounts (471) (298) (106) (58)
Defined benefit pension fund assets (negative amount) (1,127) (676) (1,173) (469)
Direct, indirect and synthetic holdings by an institution of own CET 1 instruments (negative amount) (35) (27) (76) (39)
Direct, indirect and synthetic holdings by the institution of the CET 1 instruments of financial sector entities where the institution has a significant investment in those entities (amount above the 15 % threshold and net of eligible short positions) (negative amount) (584) (298) (818) (278)
Deferred tax assets arising from temporary differences (net of related tax liabilities where the conditions in Art. 38 (3) CRR are met) (amount above the 15 % threshold) (negative amount) (647) (330) (953) (324)
Other regulatory adjustments (286) (1,247) (291) (1,537)
Total regulatory adjustments to Common Equity Tier 1 (CET 1) capital (17,653) (12,308) (17,665) (9,613)
Common Equity Tier 1 (CET 1) capital 43,520 48,977 44,101 52,429
Additional Tier 1 (AT1) capital: instruments
Capital instruments and the related share premium accounts 4,676 4,676 4,676 4,676
Amount of qualifying items referred to in Art. 484 (4) CRR and the related share premium accounts subject to phase out from AT1 N/M 6,316 N/M 6,482
Additional Tier 1 (AT1) capital before regulatory adjustments 4,676 10,991 4,676 11,157
Additional Tier 1 (AT1) capital: regulatory adjustments
Direct, indirect and synthetic holdings by an institution of own AT1 instruments (negative amount) (125) (51) (125) (48)
Residual amounts deducted from AT1 capital with regard to deduction from CET 1 capital during the transitional period pursuant to Art. 472 CRR N/M (3,535) N/M (5,316)
Other regulatory adjustments 0 0 0 0
Total regulatory adjustments to Additional Tier 1 (AT1) capital (125) (3,586) (125) (5,365)
Additional Tier 1 (AT1) capital 4,551 7,405 4,551 5,793
Tier 1 capital (T1 = CET 1 + AT1) 48,071 56,382 48,651 58,222
Tier 2 (T2) capital 12,600 6,690 12,325 6,299
Total capital (TC = T1 + T2) 60,671 63,071 60,976 64,522
Total risk-weighted assets 402,217 402,677 396,714 397,382
Capital ratios
Common Equity Tier 1 capital ratio (as a percentage of risk-weighted assets) 10.81 12.2 11.1 13.2
Tier 1 capital ratio (as a percentage of risk-weighted assets) 12.0 14.0 12.3 14.7
Total capital ratio (as a percentage of risk-weighted assets) 15.1 15.7 15.4 16.2
1 In line with the Management Board’s decision not to propose any dividend on common stock for the fiscal year 2016.
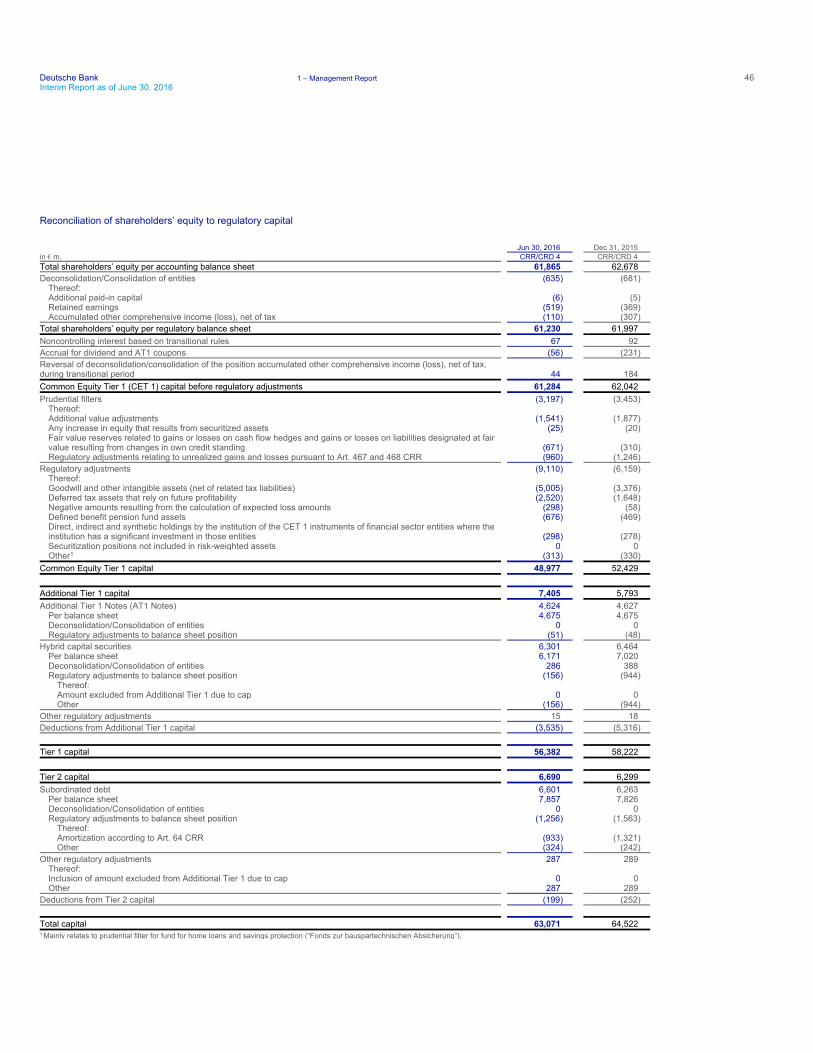
Deutsche Bank 1 – Management Report 46Interim Report as of June 30, 2016
Reconciliation of shareholders’ equity to regulatory capital
Jun 30, 2016 Dec 31, 2015 in € m. CRR/CRD 4 CRR/CRD 4 Total shareholders’ equity per accounting balance sheet 61,865 62,678
Deconsolidation/Consolidation of entities (635) (681) Thereof: Additional paid-in capital (6) (5) Retained earnings (519) (369) Accumulated other comprehensive income (loss), net of tax (110) (307)
Total shareholders’ equity per regulatory balance sheet 61,230 61,997
Noncontrolling interest based on transitional rules 67 92
Accrual for dividend and AT1 coupons (56) (231)
Reversal of deconsolidation/consolidation of the position accumulated other comprehensive income (loss), net of tax, during transitional period 44 184
Common Equity Tier 1 (CET 1) capital before regulatory adjustments 61,284 62,042
Prudential filters (3,197) (3,453) Thereof: Additional value adjustments (1,541) (1,877) Any increase in equity that results from securitized assets (25) (20) Fair value reserves related to gains or losses on cash flow hedges and gains or losses on liabilities designated at fair value resulting from changes in own credit standing (671) (310) Regulatory adjustments relating to unrealized gains and losses pursuant to Art. 467 and 468 CRR (960) (1,246)
Regulatory adjustments (9,110) (6,159) Thereof: Goodwill and other intangible assets (net of related tax liabilities) (5,005) (3,376) Deferred tax assets that rely on future profitability (2,520) (1,648) Negative amounts resulting from the calculation of expected loss amounts (298) (58) Defined benefit pension fund assets (676) (469) Direct, indirect and synthetic holdings by the institution of the CET 1 instruments of financial sector entities where the institution has a significant investment in those entities (298) (278) Securitization positions not included in risk-weighted assets 0 0 Other1 (313) (330)
Common Equity Tier 1 capital 48,977 52,429
Additional Tier 1 capital 7,405 5,793
Additional Tier 1 Notes (AT1 Notes) 4,624 4,627 Per balance sheet 4,675 4,675 Deconsolidation/Consolidation of entities 0 0 Regulatory adjustments to balance sheet position (51) (48)
Hybrid capital securities 6,301 6,464 Per balance sheet 6,171 7,020 Deconsolidation/Consolidation of entities 286 388 Regulatory adjustments to balance sheet position (156) (944)
Thereof: Amount excluded from Additional Tier 1 due to cap 0 0 Other (156) (944)
Other regulatory adjustments 15 18
Deductions from Additional Tier 1 capital (3,535) (5,316)
Tier 1 capital 56,382 58,222
Tier 2 capital 6,690 6,299
Subordinated debt 6,601 6,263 Per balance sheet 7,857 7,826 Deconsolidation/Consolidation of entities 0 0 Regulatory adjustments to balance sheet position (1,256) (1,563)
Thereof: Amortization according to Art. 64 CRR (933) (1,321) Other (324) (242)
Other regulatory adjustments 287 289 Thereof: Inclusion of amount excluded from Additional Tier 1 due to cap 0 0 Other 287 289
Deductions from Tier 2 capital (199) (252)
Total capital 63,071 64,522
1Mainly relates to prudential filter for fund for home loans and savings protection (“Fonds zur bauspartechnischen Absicherung”).
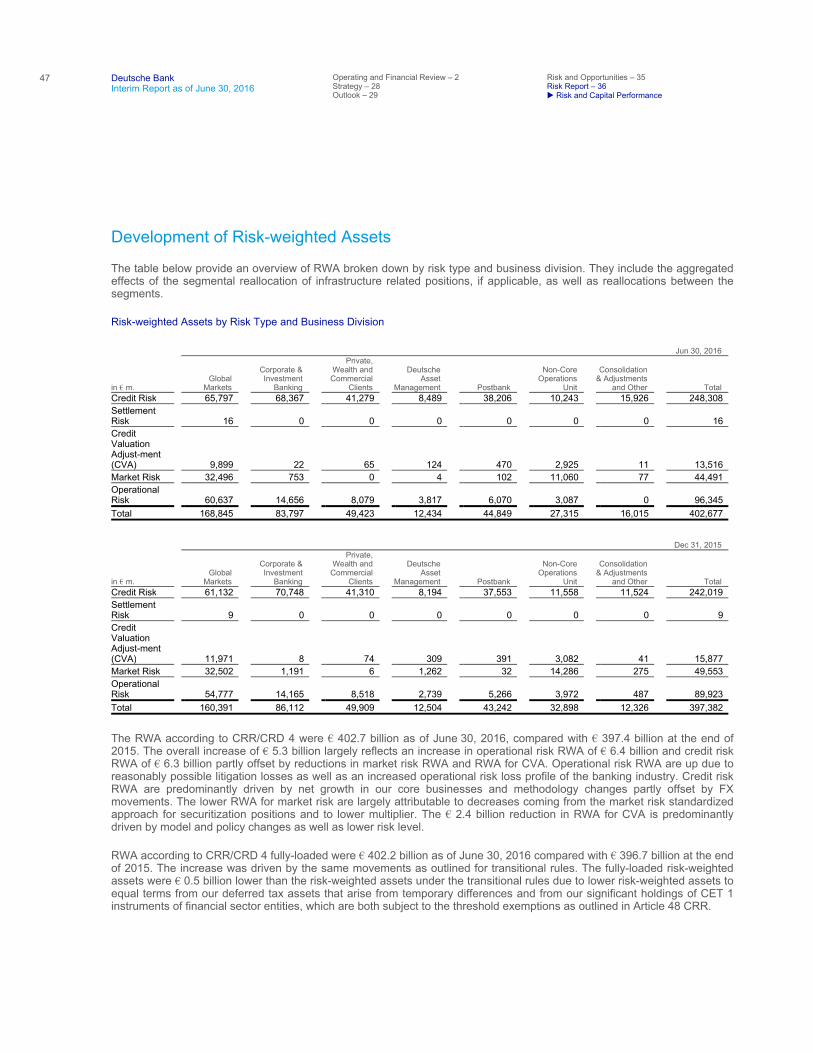
47
Deutsche Bank Interim Report as of June 30, 2016
Operating and Financial Review – 2 Strategy – 28 Outlook – 29
Risk and Opportunities – 35 Risk Report – 36
Risk and Capital Performance
Development of Risk-weighted Assets
The table below provide an overview of RWA broken down by risk type and business division. They include the aggregated effects of the segmental reallocation of infrastructure related positions, if applicable, as well as reallocations between the segments.
Risk-weighted Assets by Risk Type and Business Division
The RWA according to CRR/CRD 4 were € 402.7 billion as of June 30, 2016, compared with € 397.4 billion at the end of 2015. The overall increase of € 5.3 billion largely reflects an increase in operational risk RWA of € 6.4 billion and credit risk RWA of € 6.3 billion partly offset by reductions in market risk RWA and RWA for CVA. Operational risk RWA are up due to reasonably possible litigation losses as well as an increased operational risk loss profile of the banking industry. Credit risk RWA are predominantly driven by net growth in our core businesses and methodology changes partly offset by FX movements. The lower RWA for market risk are largely attributable to decreases coming from the market risk standardized approach for securitization positions and to lower multiplier. The € 2.4 billion reduction in RWA for CVA is predominantly driven by model and policy changes as well as lower risk level.
RWA according to CRR/CRD 4 fully-loaded were € 402.2 billion as of June 30, 2016 compared with € 396.7 billion at the end of 2015. The increase was driven by the same movements as outlined for transitional rules. The fully-loaded risk-weighted assets were € 0.5 billion lower than the risk-weighted assets under the transitional rules due to lower risk-weighted assets to equal terms from our deferred tax assets that arise from temporary differences and from our significant holdings of CET 1 instruments of financial sector entities, which are both subject to the threshold exemptions as outlined in Article 48 CRR.
Jun 30, 2016
in € m. Global
Markets
Corporate & Investment
Banking
Private, Wealth and
Commercial Clients
Deutsche Asset
Management Postbank
Non-Core Operations
Unit
Consolidation & Adjustments
and Other Total Credit Risk 65,797 68,367 41,279 8,489 38,206 10,243 15,926 248,308
Settlement Risk 16 0 0 0 0 0 0 16
Credit Valuation Adjust-ment (CVA) 9,899 22 65 124 470 2,925 11 13,516
Market Risk 32,496 753 0 4 102 11,060 77 44,491
Operational Risk 60,637 14,656 8,079 3,817 6,070 3,087 0 96,345
Total 168,845 83,797 49,423 12,434 44,849 27,315 16,015 402,677
Dec 31, 2015
in € m. Global
Markets
Corporate & Investment
Banking
Private, Wealth and
Commercial Clients
Deutsche Asset
Management Postbank
Non-Core Operations
Unit
Consolidation & Adjustments
and Other Total Credit Risk 61,132 70,748 41,310 8,194 37,553 11,558 11,524 242,019
Settlement Risk 9 0 0 0 0 0 0 9
Credit Valuation Adjust-ment (CVA) 11,971 8 74 309 391 3,082 41 15,877
Market Risk 32,502 1,191 6 1,262 32 14,286 275 49,553
Operational Risk 54,777 14,165 8,518 2,739 5,266 3,972 487 89,923
Total 160,391 86,112 49,909 12,504 43,242 32,898 12,326 397,382
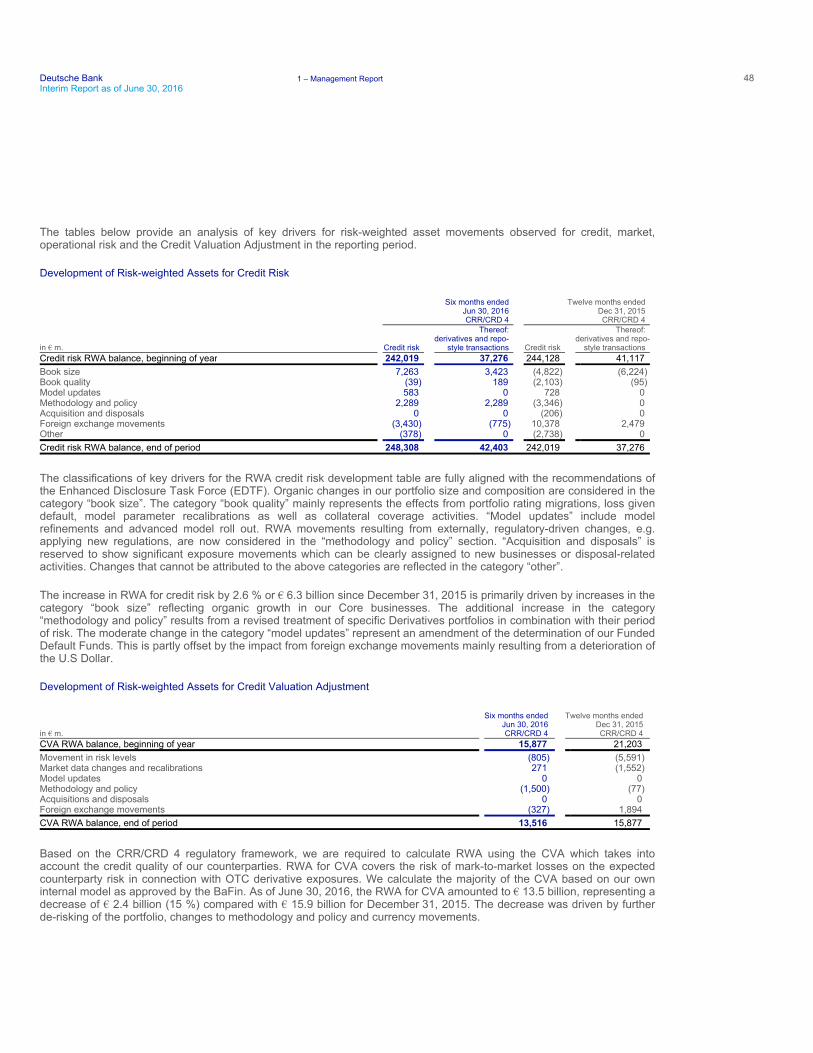
Deutsche Bank 1 – Management Report 48Interim Report as of June 30, 2016
The tables below provide an analysis of key drivers for risk-weighted asset movements observed for credit, market, operational risk and the Credit Valuation Adjustment in the reporting period.
Development of Risk-weighted Assets for Credit Risk
The classifications of key drivers for the RWA credit risk development table are fully aligned with the recommendations of the Enhanced Disclosure Task Force (EDTF). Organic changes in our portfolio size and composition are considered in the category “book size”. The category “book quality” mainly represents the effects from portfolio rating migrations, loss given default, model parameter recalibrations as well as collateral coverage activities. “Model updates” include model refinements and advanced model roll out. RWA movements resulting from externally, regulatory-driven changes, e.g. applying new regulations, are now considered in the “methodology and policy” section. “Acquisition and disposals” is reserved to show significant exposure movements which can be clearly assigned to new businesses or disposal-related activities. Changes that cannot be attributed to the above categories are reflected in the category “other”.
The increase in RWA for credit risk by 2.6 % or € 6.3 billion since December 31, 2015 is primarily driven by increases in the category “book size” reflecting organic growth in our Core businesses. The additional increase in the category “methodology and policy” results from a revised treatment of specific Derivatives portfolios in combination with their period of risk. The moderate change in the category “model updates” represent an amendment of the determination of our Funded Default Funds. This is partly offset by the impact from foreign exchange movements mainly resulting from a deterioration of the U.S Dollar.
Development of Risk-weighted Assets for Credit Valuation Adjustment
Based on the CRR/CRD 4 regulatory framework, we are required to calculate RWA using the CVA which takes into account the credit quality of our counterparties. RWA for CVA covers the risk of mark-to-market losses on the expected counterparty risk in connection with OTC derivative exposures. We calculate the majority of the CVA based on our own internal model as approved by the BaFin. As of June 30, 2016, the RWA for CVA amounted to € 13.5 billion, representing a decrease of € 2.4 billion (15 %) compared with € 15.9 billion for December 31, 2015. The decrease was driven by further de-risking of the portfolio, changes to methodology and policy and currency movements.
Six months ended Jun 30, 2016 CRR/CRD 4
Twelve months ended Dec 31, 2015 CRR/CRD 4
in € m. Credit risk
Thereof: derivatives and repo-
style transactions Credit risk
Thereof: derivatives and repo- style transactions
Credit risk RWA balance, beginning of year 242,019 37,276 244,128 41,117
Book size 7,263 3,423 (4,822) (6,224) Book quality (39) 189 (2,103) (95) Model updates 583 0 728 0 Methodology and policy 2,289 2,289 (3,346) 0 Acquisition and disposals 0 0 (206) 0 Foreign exchange movements (3,430) (775) 10,378 2,479 Other (378) 0 (2,738) 0
Credit risk RWA balance, end of period 248,308 42,403 242,019 37,276
in € m.
Six months ended Jun 30, 2016 CRR/CRD 4
Twelve months ended Dec 31, 2015 CRR/CRD 4
CVA RWA balance, beginning of year 15,877 21,203
Movement in risk levels (805) (5,591) Market data changes and recalibrations 271 (1,552) Model updates 0 0 Methodology and policy (1,500) (77) Acquisitions and disposals 0 0 Foreign exchange movements (327) 1,894
CVA RWA balance, end of period 13,516 15,877
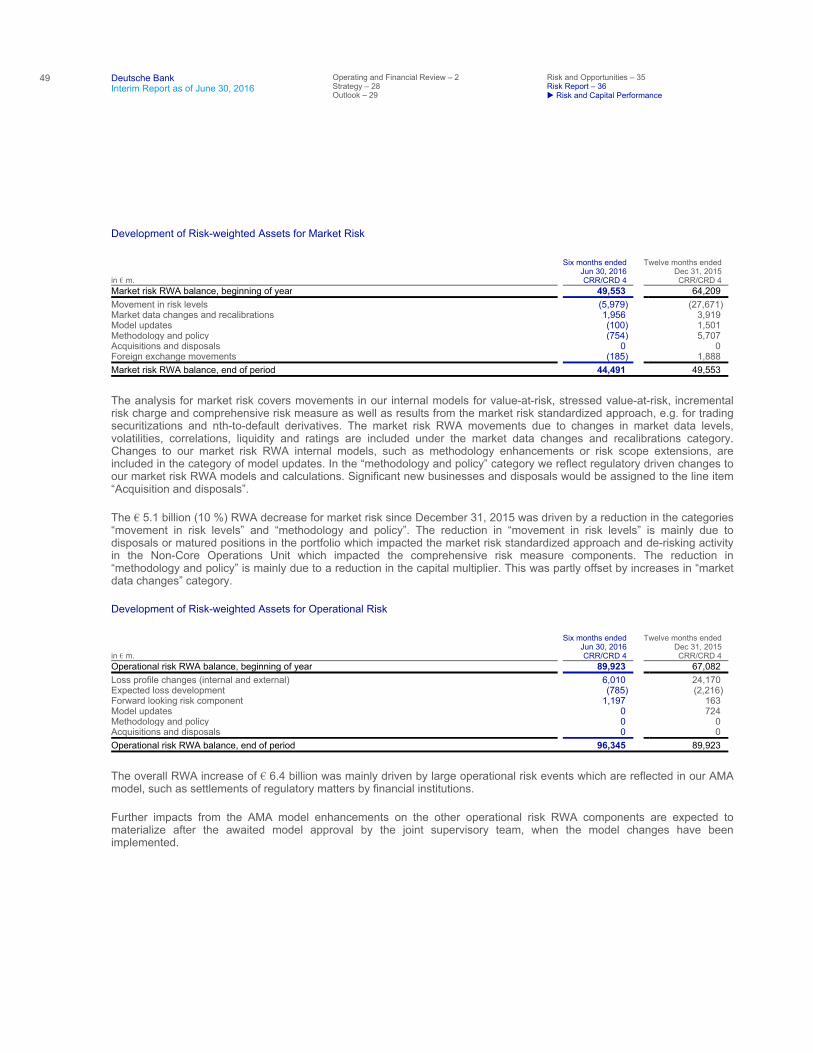
49
Deutsche Bank Interim Report as of June 30, 2016
Operating and Financial Review – 2 Strategy – 28 Outlook – 29
Risk and Opportunities – 35 Risk Report – 36
Risk and Capital Performance
Development of Risk-weighted Assets for Market Risk
The analysis for market risk covers movements in our internal models for value-at-risk, stressed value-at-risk, incremental risk charge and comprehensive risk measure as well as results from the market risk standardized approach, e.g. for trading securitizations and nth-to-default derivatives. The market risk RWA movements due to changes in market data levels, volatilities, correlations, liquidity and ratings are included under the market data changes and recalibrations category. Changes to our market risk RWA internal models, such as methodology enhancements or risk scope extensions, are included in the category of model updates. In the “methodology and policy” category we reflect regulatory driven changes to our market risk RWA models and calculations. Significant new businesses and disposals would be assigned to the line item “Acquisition and disposals”.
The € 5.1 billion (10 %) RWA decrease for market risk since December 31, 2015 was driven by a reduction in the categories “movement in risk levels” and “methodology and policy”. The reduction in “movement in risk levels” is mainly due to disposals or matured positions in the portfolio which impacted the market risk standardized approach and de-risking activity in the Non-Core Operations Unit which impacted the comprehensive risk measure components. The reduction in “methodology and policy” is mainly due to a reduction in the capital multiplier. This was partly offset by increases in “market data changes” category.
Development of Risk-weighted Assets for Operational Risk
The overall RWA increase of € 6.4 billion was mainly driven by large operational risk events which are reflected in our AMA model, such as settlements of regulatory matters by financial institutions.
Further impacts from the AMA model enhancements on the other operational risk RWA components are expected to materialize after the awaited model approval by the joint supervisory team, when the model changes have been implemented.
in € m.
Six months ended Jun 30, 2016 CRR/CRD 4
Twelve months ended Dec 31, 2015 CRR/CRD 4
Market risk RWA balance, beginning of year 49,553 64,209
Movement in risk levels (5,979) (27,671) Market data changes and recalibrations 1,956 3,919 Model updates (100) 1,501 Methodology and policy (754) 5,707 Acquisitions and disposals 0 0 Foreign exchange movements (185) 1,888
Market risk RWA balance, end of period 44,491 49,553
in € m.
Six months ended Jun 30, 2016 CRR/CRD 4
Twelve months ended Dec 31, 2015 CRR/CRD 4
Operational risk RWA balance, beginning of year 89,923 67,082
Loss profile changes (internal and external) 6,010 24,170 Expected loss development (785) (2,216) Forward looking risk component 1,197 163 Model updates 0 724 Methodology and policy 0 0 Acquisitions and disposals 0 0
Operational risk RWA balance, end of period 96,345 89,923
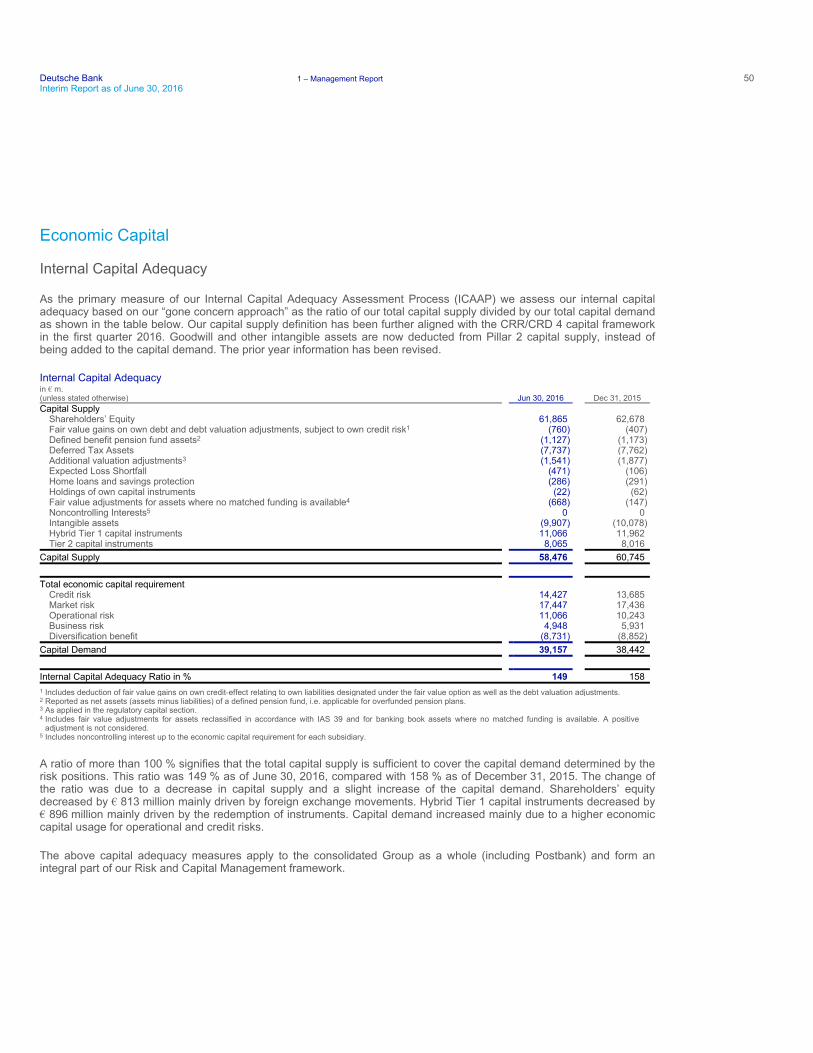
Deutsche Bank 1 – Management Report 50Interim Report as of June 30, 2016
Economic Capital
Internal Capital Adequacy
As the primary measure of our Internal Capital Adequacy Assessment Process (ICAAP) we assess our internal capital adequacy based on our “gone concern approach” as the ratio of our total capital supply divided by our total capital demand as shown in the table below. Our capital supply definition has been further aligned with the CRR/CRD 4 capital framework in the first quarter 2016. Goodwill and other intangible assets are now deducted from Pillar 2 capital supply, instead of being added to the capital demand. The prior year information has been revised.
Internal Capital Adequacy
A ratio of more than 100 % signifies that the total capital supply is sufficient to cover the capital demand determined by the risk positions. This ratio was 149 % as of June 30, 2016, compared with 158 % as of December 31, 2015. The change of the ratio was due to a decrease in capital supply and a slight increase of the capital demand. Shareholders’ equity decreased by € 813 million mainly driven by foreign exchange movements. Hybrid Tier 1 capital instruments decreased by € 896 million mainly driven by the redemption of instruments. Capital demand increased mainly due to a higher economic capital usage for operational and credit risks.
The above capital adequacy measures apply to the consolidated Group as a whole (including Postbank) and form an integral part of our Risk and Capital Management framework.
in € m. (unless stated otherwise) Jun 30, 2016 Dec 31, 2015 Capital Supply
Shareholders’ Equity 61,865 62,678 Fair value gains on own debt and debt valuation adjustments, subject to own credit risk1 (760) (407) Defined benefit pension fund assets2 (1,127) (1,173) Deferred Tax Assets (7,737) (7,762) Additional valuation adjustments3 (1,541) (1,877) Expected Loss Shortfall (471) (106) Home loans and savings protection (286) (291) Holdings of own capital instruments (22) (62) Fair value adjustments for assets where no matched funding is available4 (668) (147) Noncontrolling Interests5 0 0 Intangible assets (9,907) (10,078) Hybrid Tier 1 capital instruments 11,066 11,962 Tier 2 capital instruments 8,065 8,016
Capital Supply 58,476 60,745
Total economic capital requirement Credit risk 14,427 13,685 Market risk 17,447 17,436 Operational risk 11,066 10,243 Business risk 4,948 5,931 Diversification benefit (8,731) (8,852)
Capital Demand 39,157 38,442
Internal Capital Adequacy Ratio in % 149 158
1 Includes deduction of fair value gains on own credit-effect relating to own liabilities designated under the fair value option as well as the debt valuation adjustments. 2 Reported as net assets (assets minus liabilities) of a defined pension fund, i.e. applicable for overfunded pension plans. 3 As applied in the regulatory capital section. 4 Includes fair value adjustments for assets reclassified in accordance with IAS 39 and for banking book assets where no matched funding is available. A positive
adjustment is not considered. 5 Includes noncontrolling interest up to the economic capital requirement for each subsidiary.
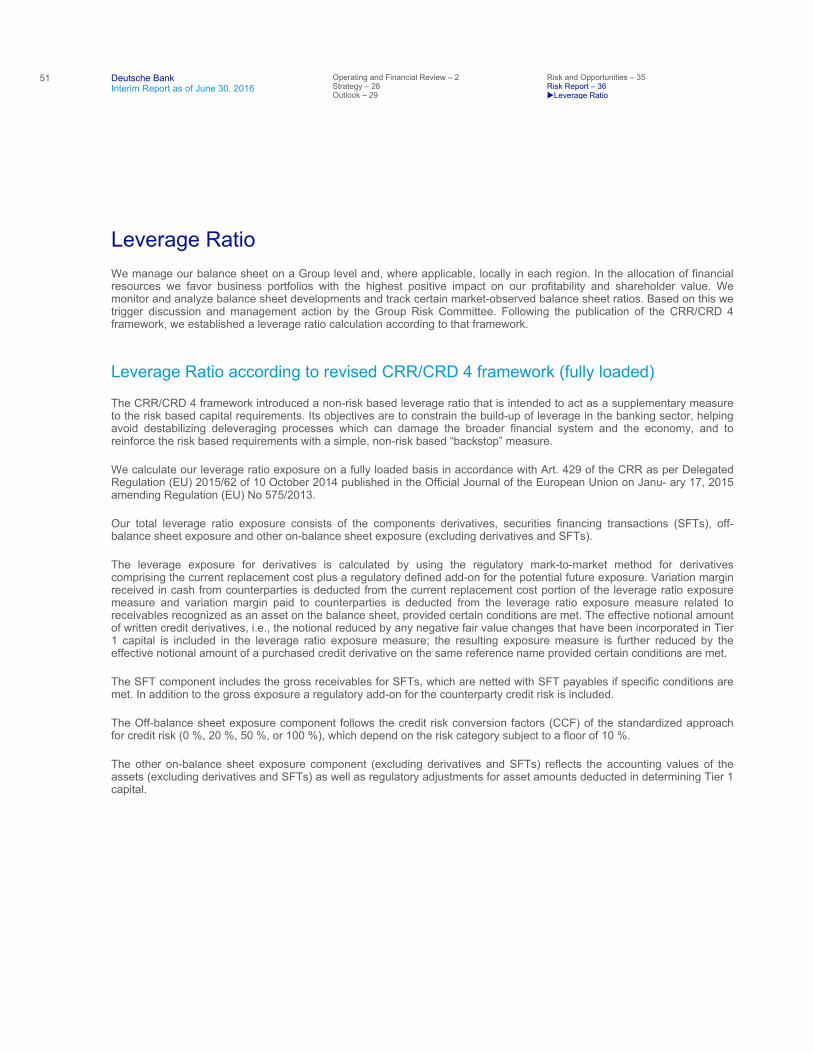
51
Deutsche Bank Interim Report as of June 30, 2016
Operating and Financial Review – 2 Strategy – 28 Outlook – 29
Risk and Opportunities – 35 Risk Report – 36
Leverage Ratio
Leverage Ratio We manage our balance sheet on a Group level and, where applicable, locally in each region. In the allocation of financial resources we favor business portfolios with the highest positive impact on our profitability and shareholder value. We monitor and analyze balance sheet developments and track certain market-observed balance sheet ratios. Based on this we trigger discussion and management action by the Group Risk Committee. Following the publication of the CRR/CRD 4 framework, we established a leverage ratio calculation according to that framework.
Leverage Ratio according to revised CRR/CRD 4 framework (fully loaded)
The CRR/CRD 4 framework introduced a non-risk based leverage ratio that is intended to act as a supplementary measure to the risk based capital requirements. Its objectives are to constrain the build-up of leverage in the banking sector, helping avoid destabilizing deleveraging processes which can damage the broader financial system and the economy, and to reinforce the risk based requirements with a simple, non-risk based “backstop” measure.
We calculate our leverage ratio exposure on a fully loaded basis in accordance with Art. 429 of the CRR as per Delegated Regulation (EU) 2015/62 of 10 October 2014 published in the Official Journal of the European Union on Janu- ary 17, 2015 amending Regulation (EU) No 575/2013.
Our total leverage ratio exposure consists of the components derivatives, securities financing transactions (SFTs), off-balance sheet exposure and other on-balance sheet exposure (excluding derivatives and SFTs).
The leverage exposure for derivatives is calculated by using the regulatory mark-to-market method for derivatives comprising the current replacement cost plus a regulatory defined add-on for the potential future exposure. Variation margin received in cash from counterparties is deducted from the current replacement cost portion of the leverage ratio exposure measure and variation margin paid to counterparties is deducted from the leverage ratio exposure measure related to receivables recognized as an asset on the balance sheet, provided certain conditions are met. The effective notional amount of written credit derivatives, i.e., the notional reduced by any negative fair value changes that have been incorporated in Tier 1 capital is included in the leverage ratio exposure measure; the resulting exposure measure is further reduced by the effective notional amount of a purchased credit derivative on the same reference name provided certain conditions are met.
The SFT component includes the gross receivables for SFTs, which are netted with SFT payables if specific conditions are met. In addition to the gross exposure a regulatory add-on for the counterparty credit risk is included.
The Off-balance sheet exposure component follows the credit risk conversion factors (CCF) of the standardized approach for credit risk (0 %, 20 %, 50 %, or 100 %), which depend on the risk category subject to a floor of 10 %.
The other on-balance sheet exposure component (excluding derivatives and SFTs) reflects the accounting values of the assets (excluding derivatives and SFTs) as well as regulatory adjustments for asset amounts deducted in determining Tier 1 capital.
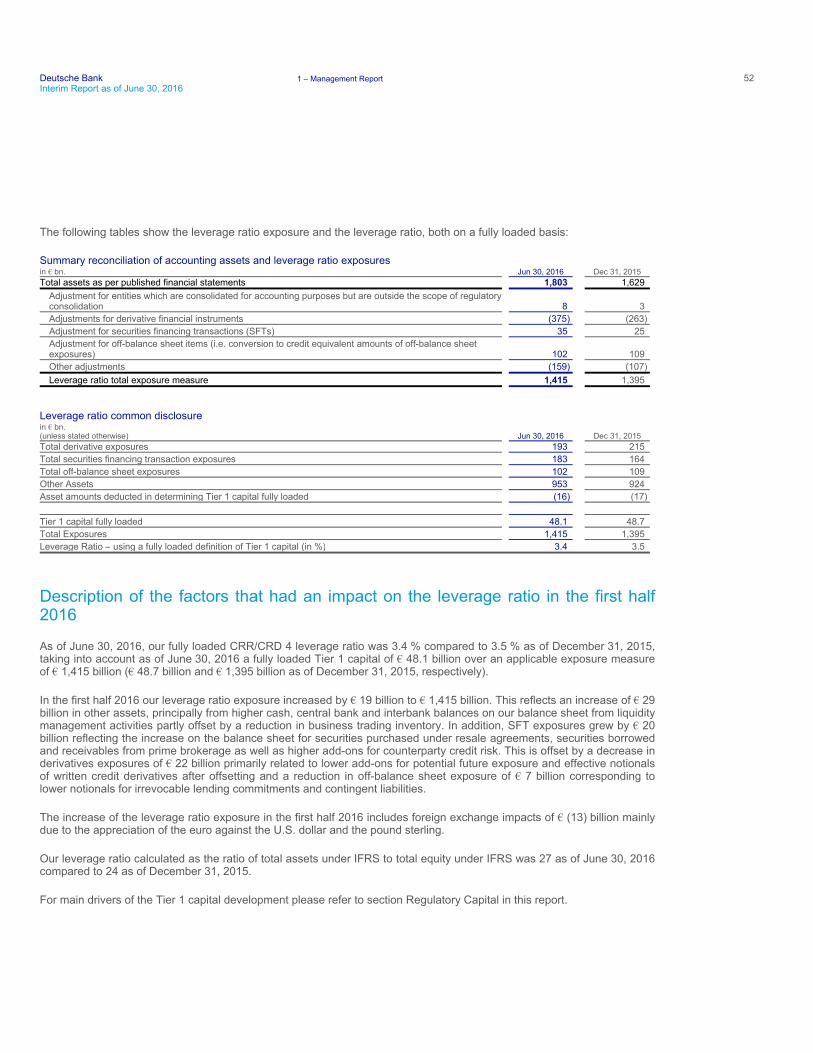
Deutsche Bank 1 – Management Report 52Interim Report as of June 30, 2016
The following tables show the leverage ratio exposure and the leverage ratio, both on a fully loaded basis:
Summary reconciliation of accounting assets and leverage ratio exposures
Leverage ratio common disclosure
Description of the factors that had an impact on the leverage ratio in the first half 2016
As of June 30, 2016, our fully loaded CRR/CRD 4 leverage ratio was 3.4 % compared to 3.5 % as of December 31, 2015, taking into account as of June 30, 2016 a fully loaded Tier 1 capital of € 48.1 billion over an applicable exposure measure of € 1,415 billion (€ 48.7 billion and € 1,395 billion as of December 31, 2015, respectively).
In the first half 2016 our leverage ratio exposure increased by € 19 billion to € 1,415 billion. This reflects an increase of € 29 billion in other assets, principally from higher cash, central bank and interbank balances on our balance sheet from liquidity management activities partly offset by a reduction in business trading inventory. In addition, SFT exposures grew by € 20 billion reflecting the increase on the balance sheet for securities purchased under resale agreements, securities borrowed and receivables from prime brokerage as well as higher add-ons for counterparty credit risk. This is offset by a decrease in derivatives exposures of € 22 billion primarily related to lower add-ons for potential future exposure and effective notionals of written credit derivatives after offsetting and a reduction in off-balance sheet exposure of € 7 billion corresponding to lower notionals for irrevocable lending commitments and contingent liabilities.
The increase of the leverage ratio exposure in the first half 2016 includes foreign exchange impacts of € (13) billion mainly due to the appreciation of the euro against the U.S. dollar and the pound sterling.
Our leverage ratio calculated as the ratio of total assets under IFRS to total equity under IFRS was 27 as of June 30, 2016 compared to 24 as of December 31, 2015.
For main drivers of the Tier 1 capital development please refer to section Regulatory Capital in this report.
in € bn. Jun 30, 2016 Dec 31, 2015 Total assets as per published financial statements 1,803 1,629
Adjustment for entities which are consolidated for accounting purposes but are outside the scope of regulatory consolidation 8 3
Adjustments for derivative financial instruments (375) (263)
Adjustment for securities financing transactions (SFTs) 35 25
Adjustment for off-balance sheet items (i.e. conversion to credit equivalent amounts of off-balance sheet exposures) 102 109
Other adjustments (159) (107)
Leverage ratio total exposure measure 1,415 1,395
in € bn. (unless stated otherwise) Jun 30, 2016 Dec 31, 2015 Total derivative exposures 193 215
Total securities financing transaction exposures 183 164
Total off-balance sheet exposures 102 109
Other Assets 953 924
Asset amounts deducted in determining Tier 1 capital fully loaded (16) (17)
Tier 1 capital fully loaded 48.1 48.7
Total Exposures 1,415 1,395
Leverage Ratio – using a fully loaded definition of Tier 1 capital (in %) 3.4 3.5
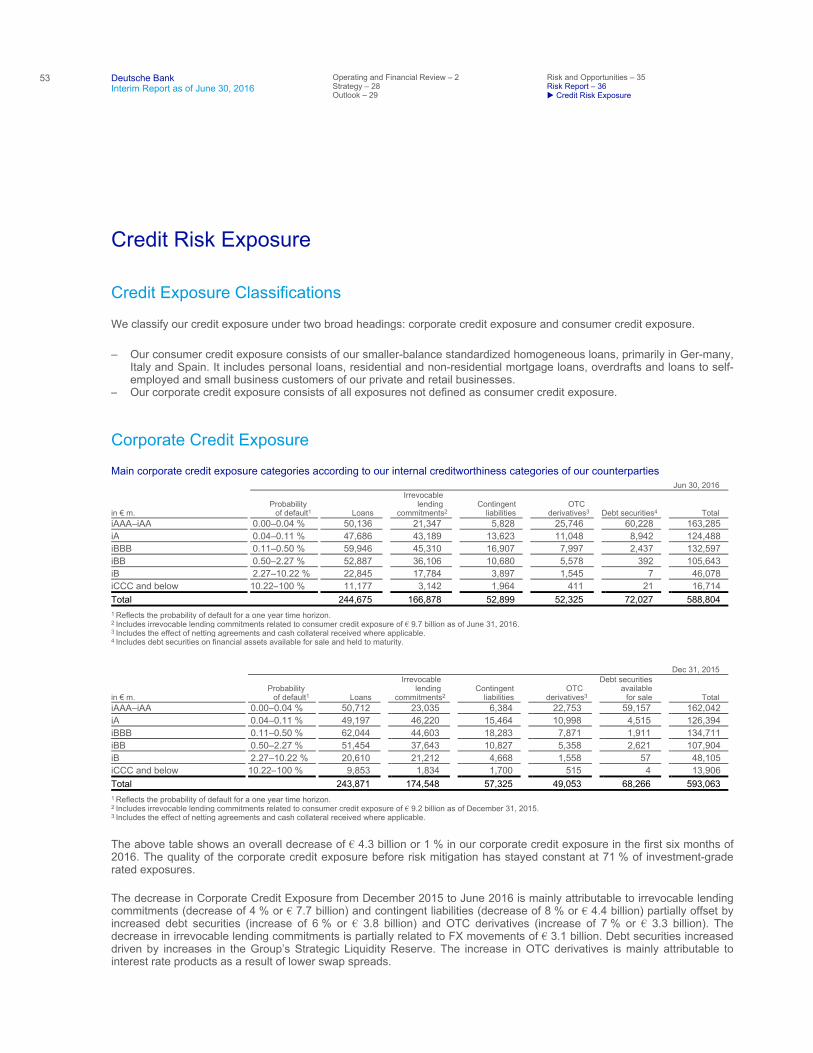
53
Deutsche Bank Interim Report as of June 30, 2016
Operating and Financial Review – 2 Strategy – 28 Outlook – 29
Risk and Opportunities – 35 Risk Report – 36
Credit Risk Exposure
Credit Risk Exposure
Credit Exposure Classifications
We classify our credit exposure under two broad headings: corporate credit exposure and consumer credit exposure.
Corporate Credit Exposure
Main corporate credit exposure categories according to our internal creditworthiness categories of our counterparties
The above table shows an overall decrease of € 4.3 billion or 1 % in our corporate credit exposure in the first six months of 2016. The quality of the corporate credit exposure before risk mitigation has stayed constant at 71 % of investment-grade rated exposures.
The decrease in Corporate Credit Exposure from December 2015 to June 2016 is mainly attributable to irrevocable lending commitments (decrease of 4 % or € 7.7 billion) and contingent liabilities (decrease of 8 % or € 4.4 billion) partially offset by increased debt securities (increase of 6 % or € 3.8 billion) and OTC derivatives (increase of 7 % or € 3.3 billion). The decrease in irrevocable lending commitments is partially related to FX movements of € 3.1 billion. Debt securities increased driven by increases in the Group’s Strategic Liquidity Reserve. The increase in OTC derivatives is mainly attributable to interest rate products as a result of lower swap spreads.
– Our consumer credit exposure consists of our smaller-balance standardized homogeneous loans, primarily in Ger-many,Italy and Spain. It includes personal loans, residential and non-residential mortgage loans, overdrafts and loans to self-employed and small business customers of our private and retail businesses.
– Our corporate credit exposure consists of all exposures not defined as consumer credit exposure.
Jun 30, 2016
in € m. Probability
of default1 Loans
Irrevocable lending
commitments2 Contingent
liabilities OTC
derivatives3 Debt securities4 Total iAAA–iAA 0.00–0.04 % 50,136 21,347 5,828 25,746 60,228 163,285
iA 0.04–0.11 % 47,686 43,189 13,623 11,048 8,942 124,488
iBBB 0.11–0.50 % 59,946 45,310 16,907 7,997 2,437 132,597
iBB 0.50–2.27 % 52,887 36,106 10,680 5,578 392 105,643
iB 2.27–10.22 % 22,845 17,784 3,897 1,545 7 46,078
iCCC and below 10.22–100 % 11,177 3,142 1,964 411 21 16,714
Total 244,675 166,878 52,899 52,325 72,027 588,804
1 Reflects the probability of default for a one year time horizon. 2 Includes irrevocable lending commitments related to consumer credit exposure of € 9.7 billion as of June 31, 2016. 3 Includes the effect of netting agreements and cash collateral received where applicable. 4 Includes debt securities on financial assets available for sale and held to maturity.
Dec 31, 2015
in € m. Probability
of default1 Loans
Irrevocable lending
commitments2 Contingent
liabilities OTC
derivatives3
Debt securities available
for sale Total iAAA–iAA 0.00–0.04 % 50,712 23,035 6,384 22,753 59,157 162,042
iA 0.04–0.11 % 49,197 46,220 15,464 10,998 4,515 126,394
iBBB 0.11–0.50 % 62,044 44,603 18,283 7,871 1,911 134,711
iBB 0.50–2.27 % 51,454 37,643 10,827 5,358 2,621 107,904
iB 2.27–10.22 % 20,610 21,212 4,668 1,558 57 48,105
iCCC and below 10.22–100 % 9,853 1,834 1,700 515 4 13,906
Total 243,871 174,548 57,325 49,053 68,266 593,063
1 Reflects the probability of default for a one year time horizon. 2 Includes irrevocable lending commitments related to consumer credit exposure of € 9.2 billion as of December 31, 2015. 3 Includes the effect of netting agreements and cash collateral received where applicable.
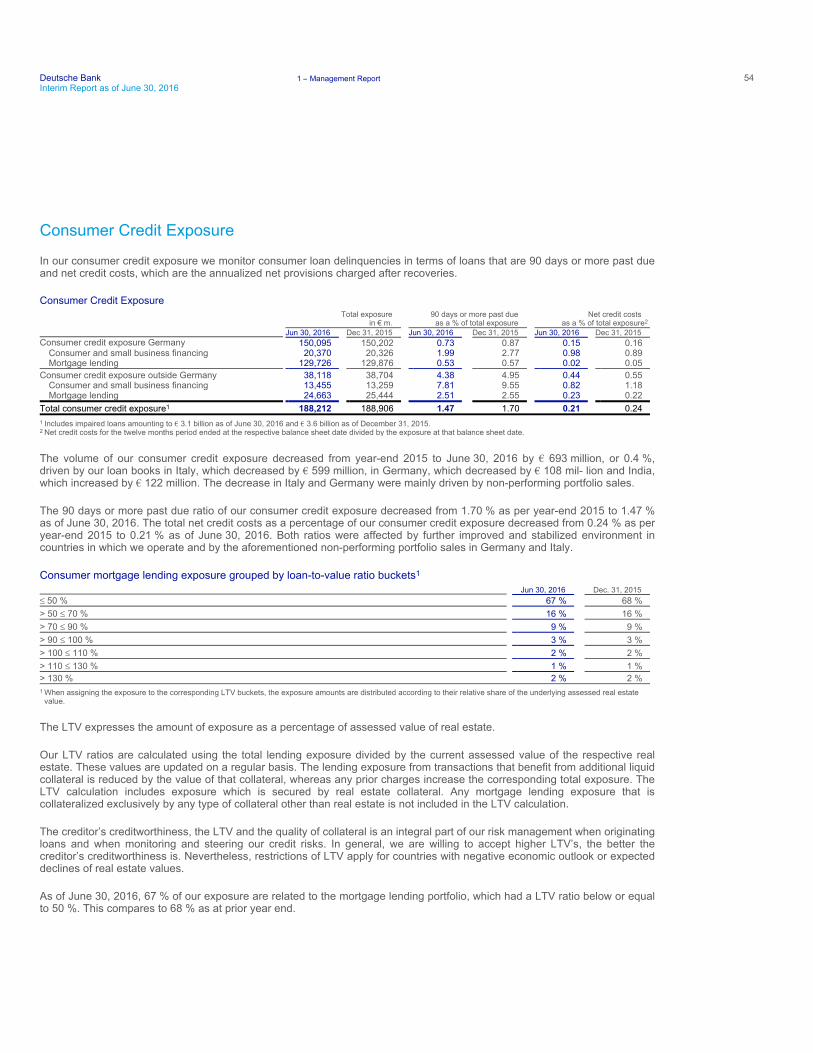
Deutsche Bank 1 – Management Report 54Interim Report as of June 30, 2016
Consumer Credit Exposure
In our consumer credit exposure we monitor consumer loan delinquencies in terms of loans that are 90 days or more past due and net credit costs, which are the annualized net provisions charged after recoveries.
Consumer Credit Exposure
The volume of our consumer credit exposure decreased from year-end 2015 to June 30, 2016 by € 693 million, or 0.4 %, driven by our loan books in Italy, which decreased by € 599 million, in Germany, which decreased by € 108 mil- lion and India, which increased by € 122 million. The decrease in Italy and Germany were mainly driven by non-performing portfolio sales.
The 90 days or more past due ratio of our consumer credit exposure decreased from 1.70 % as per year-end 2015 to 1.47 % as of June 30, 2016. The total net credit costs as a percentage of our consumer credit exposure decreased from 0.24 % as per year-end 2015 to 0.21 % as of June 30, 2016. Both ratios were affected by further improved and stabilized environment in countries in which we operate and by the aforementioned non-performing portfolio sales in Germany and Italy.
Consumer mortgage lending exposure grouped by loan-to-value ratio buckets1
The LTV expresses the amount of exposure as a percentage of assessed value of real estate.
Our LTV ratios are calculated using the total lending exposure divided by the current assessed value of the respective real estate. These values are updated on a regular basis. The lending exposure from transactions that benefit from additional liquid collateral is reduced by the value of that collateral, whereas any prior charges increase the corresponding total exposure. The LTV calculation includes exposure which is secured by real estate collateral. Any mortgage lending exposure that is collateralized exclusively by any type of collateral other than real estate is not included in the LTV calculation.
The creditor’s creditworthiness, the LTV and the quality of collateral is an integral part of our risk management when originating loans and when monitoring and steering our credit risks. In general, we are willing to accept higher LTV’s, the better the creditor’s creditworthiness is. Nevertheless, restrictions of LTV apply for countries with negative economic outlook or expected declines of real estate values.
As of June 30, 2016, 67 % of our exposure are related to the mortgage lending portfolio, which had a LTV ratio below or equal to 50 %. This compares to 68 % as at prior year end.
Total exposure
in € m. 90 days or more past due
as a % of total exposure Net credit costs
as a % of total exposure2 Jun 30, 2016 Dec 31, 2015 Jun 30, 2016 Dec 31, 2015 Jun 30, 2016 Dec 31, 2015 Consumer credit exposure Germany 150,095 150,202 0.73 0.87 0.15 0.16
Consumer and small business financing 20,370 20,326 1.99 2.77 0.98 0.89 Mortgage lending 129,726 129,876 0.53 0.57 0.02 0.05
Consumer credit exposure outside Germany 38,118 38,704 4.38 4.95 0.44 0.55 Consumer and small business financing 13,455 13,259 7.81 9.55 0.82 1.18 Mortgage lending 24,663 25,444 2.51 2.55 0.23 0.22
Total consumer credit exposure1 188,212 188,906 1.47 1.70 0.21 0.24
1 Includes impaired loans amounting to € 3.1 billion as of June 30, 2016 and € 3.6 billion as of December 31, 2015. 2 Net credit costs for the twelve months period ended at the respective balance sheet date divided by the exposure at that balance sheet date.
Jun 30, 2016 Dec. 31, 2015 ≤ 50 % 67 % 68 %
> 50 ≤ 70 % 16 % 16 %
> 70 ≤ 90 % 9 % 9 %
> 90 ≤ 100 % 3 % 3 %
> 100 ≤ 110 % 2 % 2 %
> 110 ≤ 130 % 1 % 1 %
> 130 % 2 % 2 %
1 When assigning the exposure to the corresponding LTV buckets, the exposure amounts are distributed according to their relative share of the underlying assessed real estate value.
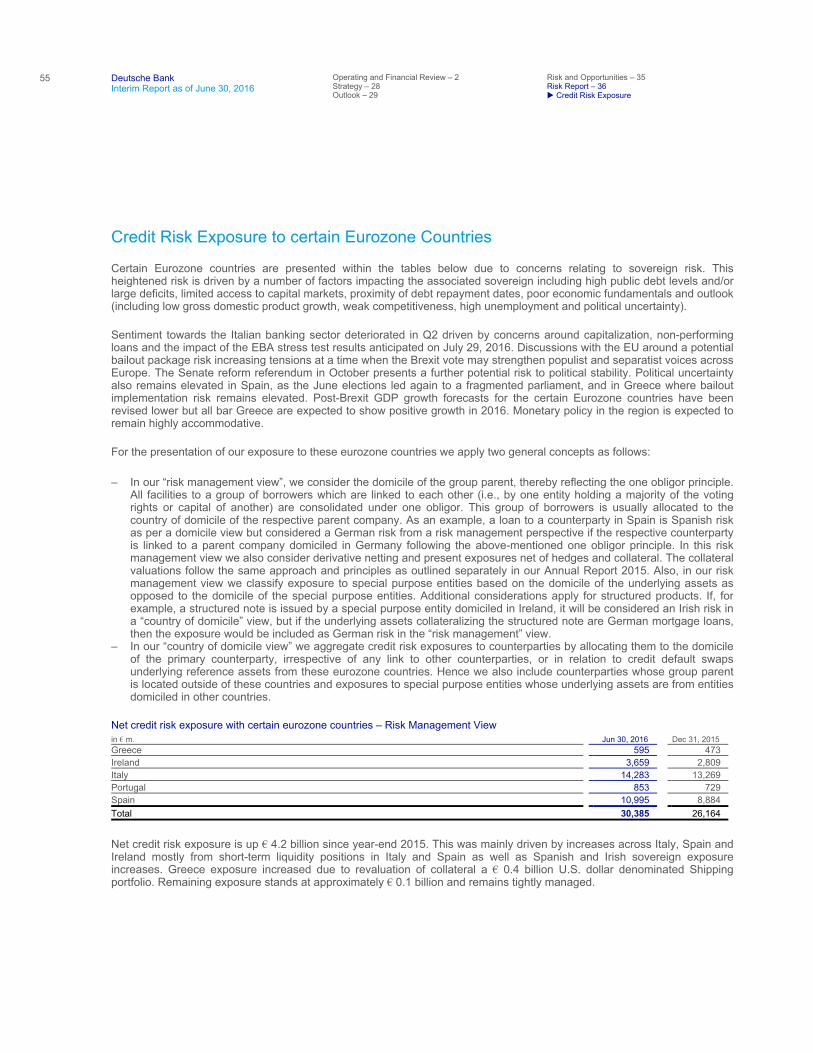
55
Deutsche Bank Interim Report as of June 30, 2016
Operating and Financial Review – 2 Strategy – 28 Outlook – 29
Risk and Opportunities – 35 Risk Report – 36
Credit Risk Exposure
Credit Risk Exposure to certain Eurozone Countries
Certain Eurozone countries are presented within the tables below due to concerns relating to sovereign risk. This heightened risk is driven by a number of factors impacting the associated sovereign including high public debt levels and/or large deficits, limited access to capital markets, proximity of debt repayment dates, poor economic fundamentals and outlook (including low gross domestic product growth, weak competitiveness, high unemployment and political uncertainty).
Sentiment towards the Italian banking sector deteriorated in Q2 driven by concerns around capitalization, non-performing loans and the impact of the EBA stress test results anticipated on July 29, 2016. Discussions with the EU around a potential bailout package risk increasing tensions at a time when the Brexit vote may strengthen populist and separatist voices across Europe. The Senate reform referendum in October presents a further potential risk to political stability. Political uncertainty also remains elevated in Spain, as the June elections led again to a fragmented parliament, and in Greece where bailout implementation risk remains elevated. Post-Brexit GDP growth forecasts for the certain Eurozone countries have been revised lower but all bar Greece are expected to show positive growth in 2016. Monetary policy in the region is expected to remain highly accommodative.
For the presentation of our exposure to these eurozone countries we apply two general concepts as follows:
Net credit risk exposure with certain eurozone countries – Risk Management View
Net credit risk exposure is up € 4.2 billion since year-end 2015. This was mainly driven by increases across Italy, Spain and Ireland mostly from short-term liquidity positions in Italy and Spain as well as Spanish and Irish sovereign exposure increases. Greece exposure increased due to revaluation of collateral a € 0.4 billion U.S. dollar denominated Shipping portfolio. Remaining exposure stands at approximately € 0.1 billion and remains tightly managed.
– In our “risk management view”, we consider the domicile of the group parent, thereby reflecting the one obligor principle.All facilities to a group of borrowers which are linked to each other (i.e., by one entity holding a majority of the votingrights or capital of another) are consolidated under one obligor. This group of borrowers is usually allocated to thecountry of domicile of the respective parent company. As an example, a loan to a counterparty in Spain is Spanish riskas per a domicile view but considered a German risk from a risk management perspective if the respective counterpartyis linked to a parent company domiciled in Germany following the above-mentioned one obligor principle. In this risk management view we also consider derivative netting and present exposures net of hedges and collateral. The collateralvaluations follow the same approach and principles as outlined separately in our Annual Report 2015. Also, in our riskmanagement view we classify exposure to special purpose entities based on the domicile of the underlying assets asopposed to the domicile of the special purpose entities. Additional considerations apply for structured products. If, forexample, a structured note is issued by a special purpose entity domiciled in Ireland, it will be considered an Irish risk ina “country of domicile” view, but if the underlying assets collateralizing the structured note are German mortgage loans,then the exposure would be included as German risk in the “risk management” view.
– In our “country of domicile view” we aggregate credit risk exposures to counterparties by allocating them to the domicileof the primary counterparty, irrespective of any link to other counterparties, or in relation to credit default swapsunderlying reference assets from these eurozone countries. Hence we also include counterparties whose group parentis located outside of these countries and exposures to special purpose entities whose underlying assets are from entitiesdomiciled in other countries.
in € m. Jun 30, 2016 Dec 31, 2015 Greece 595 473
Ireland 3,659 2,809
Italy 14,283 13,269
Portugal 853 729
Spain 10,995 8,884
Total 30,385 26,164
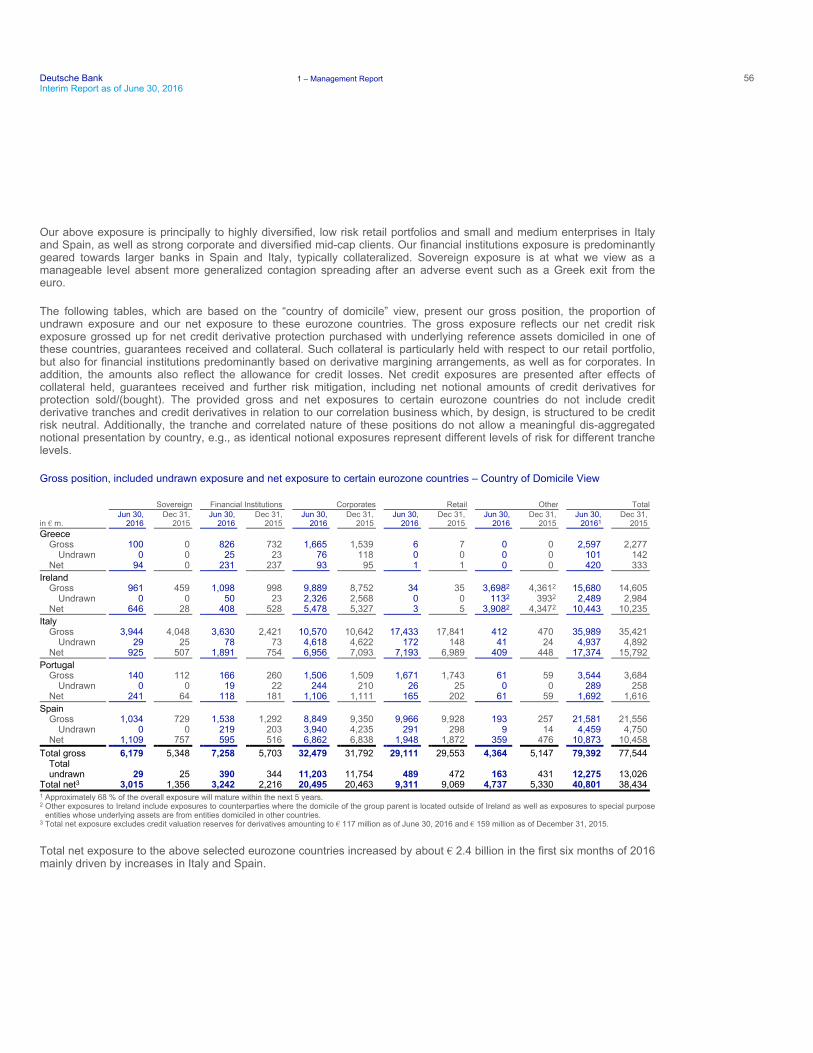
Deutsche Bank 1 – Management Report 56Interim Report as of June 30, 2016
Our above exposure is principally to highly diversified, low risk retail portfolios and small and medium enterprises in Italy and Spain, as well as strong corporate and diversified mid-cap clients. Our financial institutions exposure is predominantly geared towards larger banks in Spain and Italy, typically collateralized. Sovereign exposure is at what we view as a manageable level absent more generalized contagion spreading after an adverse event such as a Greek exit from the euro.
The following tables, which are based on the “country of domicile” view, present our gross position, the proportion of undrawn exposure and our net exposure to these eurozone countries. The gross exposure reflects our net credit risk exposure grossed up for net credit derivative protection purchased with underlying reference assets domiciled in one of these countries, guarantees received and collateral. Such collateral is particularly held with respect to our retail portfolio, but also for financial institutions predominantly based on derivative margining arrangements, as well as for corporates. In addition, the amounts also reflect the allowance for credit losses. Net credit exposures are presented after effects of collateral held, guarantees received and further risk mitigation, including net notional amounts of credit derivatives for protection sold/(bought). The provided gross and net exposures to certain eurozone countries do not include credit derivative tranches and credit derivatives in relation to our correlation business which, by design, is structured to be credit risk neutral. Additionally, the tranche and correlated nature of these positions do not allow a meaningful dis-aggregated notional presentation by country, e.g., as identical notional exposures represent different levels of risk for different tranche levels.
Gross position, included undrawn exposure and net exposure to certain eurozone countries – Country of Domicile View
Total net exposure to the above selected eurozone countries increased by about € 2.4 billion in the first six months of 2016 mainly driven by increases in Italy and Spain.
Sovereign Financial Institutions Corporates Retail Other Total
in € m. Jun 30,
2016 Dec 31,
2015 Jun 30,
2016 Dec 31,
2015 Jun 30,
2016 Dec 31,
2015 Jun 30,
2016 Dec 31,
2015 Jun 30,
2016 Dec 31,
2015 Jun 30,
20161 Dec 31,
2015 Greece
Gross 100 0 826 732 1,665 1,539 6 7 0 0 2,597 2,277 Undrawn 0 0 25 23 76 118 0 0 0 0 101 142
Net 94 0 231 237 93 95 1 1 0 0 420 333
Ireland Gross 961 459 1,098 998 9,889 8,752 34 35 3,6982 4,3612 15,680 14,605
Undrawn 0 0 50 23 2,326 2,568 0 0 1132 3932 2,489 2,984 Net 646 28 408 528 5,478 5,327 3 5 3,9082 4,3472 10,443 10,235
Italy Gross 3,944 4,048 3,630 2,421 10,570 10,642 17,433 17,841 412 470 35,989 35,421
Undrawn 29 25 78 73 4,618 4,622 172 148 41 24 4,937 4,892 Net 925 507 1,891 754 6,956 7,093 7,193 6,989 409 448 17,374 15,792
Portugal Gross 140 112 166 260 1,506 1,509 1,671 1,743 61 59 3,544 3,684
Undrawn 0 0 19 22 244 210 26 25 0 0 289 258 Net 241 64 118 181 1,106 1,111 165 202 61 59 1,692 1,616
Spain Gross 1,034 729 1,538 1,292 8,849 9,350 9,966 9,928 193 257 21,581 21,556
Undrawn 0 0 219 203 3,940 4,235 291 298 9 14 4,459 4,750 Net 1,109 757 595 516 6,862 6,838 1,948 1,872 359 476 10,873 10,458
Total gross 6,179 5,348 7,258 5,703 32,479 31,792 29,111 29,553 4,364 5,147 79,392 77,544 Total undrawn 29 25 390 344 11,203 11,754 489 472 163 431 12,275 13,026
Total net3 3,015 1,356 3,242 2,216 20,495 20,463 9,311 9,069 4,737 5,330 40,801 38,434
1 Approximately 68 % of the overall exposure will mature within the next 5 years. 2 Other exposures to Ireland include exposures to counterparties where the domicile of the group parent is located outside of Ireland as well as exposures to special purpose
entities whose underlying assets are from entities domiciled in other countries. 3 Total net exposure excludes credit valuation reserves for derivatives amounting to € 117 million as of June 30, 2016 and € 159 million as of December 31, 2015.
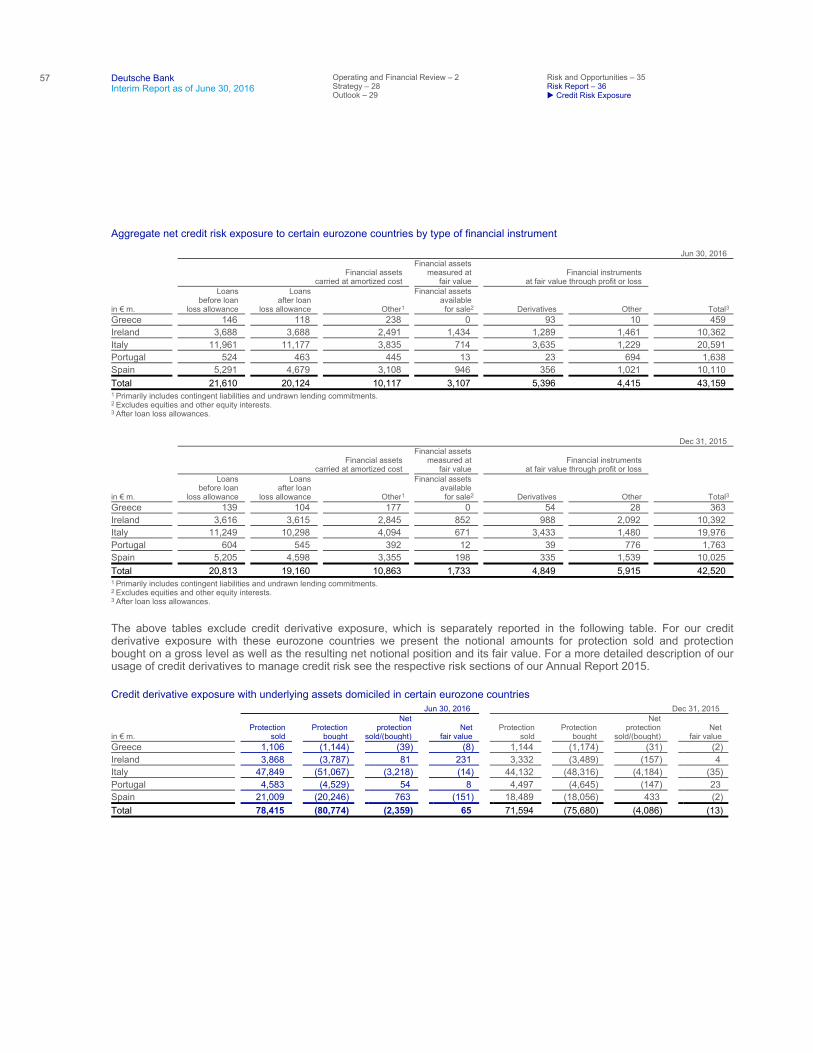
57
Deutsche Bank Interim Report as of June 30, 2016
Operating and Financial Review – 2 Strategy – 28 Outlook – 29
Risk and Opportunities – 35 Risk Report – 36
Credit Risk Exposure
Aggregate net credit risk exposure to certain eurozone countries by type of financial instrument
The above tables exclude credit derivative exposure, which is separately reported in the following table. For our credit derivative exposure with these eurozone countries we present the notional amounts for protection sold and protection bought on a gross level as well as the resulting net notional position and its fair value. For a more detailed description of our usage of credit derivatives to manage credit risk see the respective risk sections of our Annual Report 2015.
Credit derivative exposure with underlying assets domiciled in certain eurozone countries
Jun 30, 2016
Financial assets
carried at amortized cost
Financial assets measured at
fair value Financial instruments
at fair value through profit or loss
in € m.
Loans before loan
loss allowance
Loans after loan
loss allowance Other1
Financial assets available for sale2 Derivatives Other Total3
Greece 146 118 238 0 93 10 459
Ireland 3,688 3,688 2,491 1,434 1,289 1,461 10,362
Italy 11,961 11,177 3,835 714 3,635 1,229 20,591
Portugal 524 463 445 13 23 694 1,638
Spain 5,291 4,679 3,108 946 356 1,021 10,110
Total 21,610 20,124 10,117 3,107 5,396 4,415 43,159
1 Primarily includes contingent liabilities and undrawn lending commitments. 2 Excludes equities and other equity interests. 3 After loan loss allowances.
Dec 31, 2015
Financial assets
carried at amortized cost
Financial assets measured at
fair value Financial instruments
at fair value through profit or loss
in € m.
Loans before loan
loss allowance
Loans after loan
loss allowance Other1
Financial assets available for sale2 Derivatives Other Total3
Greece 139 104 177 0 54 28 363
Ireland 3,616 3,615 2,845 852 988 2,092 10,392
Italy 11,249 10,298 4,094 671 3,433 1,480 19,976
Portugal 604 545 392 12 39 776 1,763
Spain 5,205 4,598 3,355 198 335 1,539 10,025
Total 20,813 19,160 10,863 1,733 4,849 5,915 42,520
1 Primarily includes contingent liabilities and undrawn lending commitments. 2 Excludes equities and other equity interests. 3 After loan loss allowances.
Jun 30, 2016 Dec 31, 2015
in € m. Protection
sold Protection
bought
Net protection
sold/(bought) Net
fair value Protection
sold Protection
bought
Net protection
sold/(bought) Net
fair value Greece 1,106 (1,144) (39) (8) 1,144 (1,174) (31) (2)
Ireland 3,868 (3,787) 81 231 3,332 (3,489) (157) 4
Italy 47,849 (51,067) (3,218) (14) 44,132 (48,316) (4,184) (35)
Portugal 4,583 (4,529) 54 8 4,497 (4,645) (147) 23
Spain 21,009 (20,246) 763 (151) 18,489 (18,056) 433 (2)
Total 78,415 (80,774) (2,359) 65 71,594 (75,680) (4,086) (13)
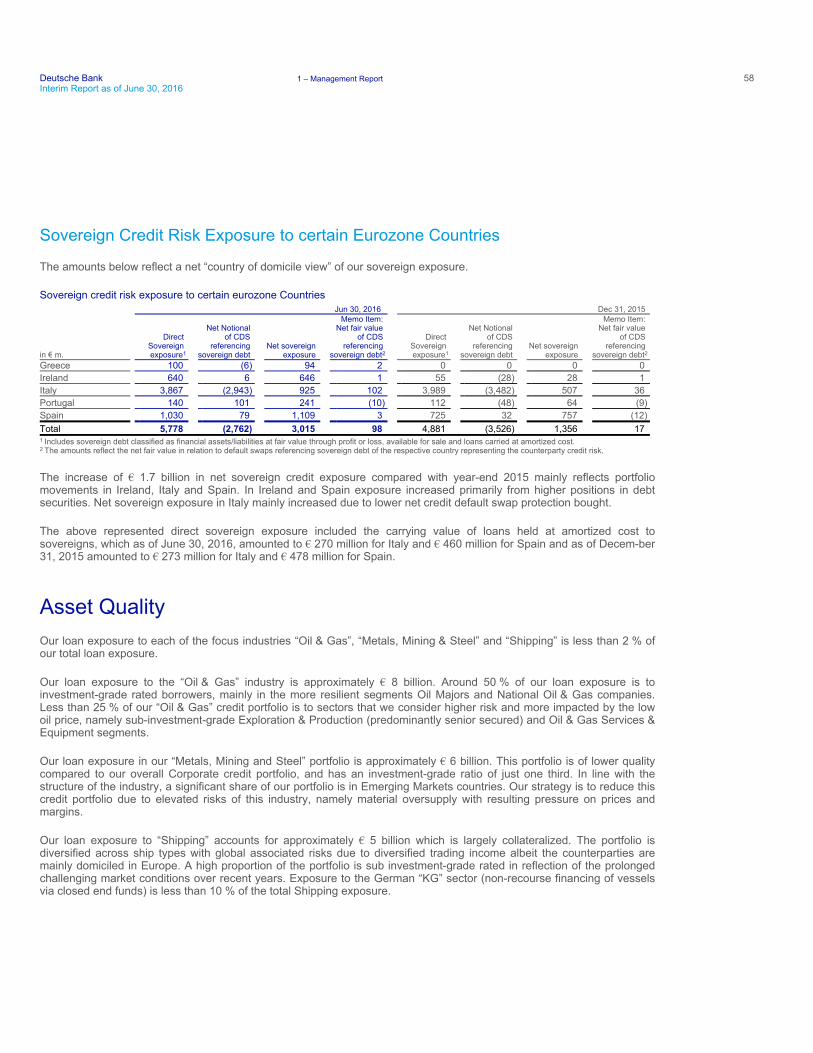
Deutsche Bank 1 – Management Report 58Interim Report as of June 30, 2016
Sovereign Credit Risk Exposure to certain Eurozone Countries
The amounts below reflect a net “country of domicile view” of our sovereign exposure.
Sovereign credit risk exposure to certain eurozone Countries
The increase of € 1.7 billion in net sovereign credit exposure compared with year-end 2015 mainly reflects portfolio movements in Ireland, Italy and Spain. In Ireland and Spain exposure increased primarily from higher positions in debt securities. Net sovereign exposure in Italy mainly increased due to lower net credit default swap protection bought.
The above represented direct sovereign exposure included the carrying value of loans held at amortized cost to sovereigns, which as of June 30, 2016, amounted to € 270 million for Italy and € 460 million for Spain and as of Decem-ber 31, 2015 amounted to € 273 million for Italy and € 478 million for Spain.
Asset Quality Our loan exposure to each of the focus industries “Oil & Gas”, “Metals, Mining & Steel” and “Shipping” is less than 2 % of our total loan exposure.
Our loan exposure to the “Oil & Gas” industry is approximately € 8 billion. Around 50 % of our loan exposure is to investment-grade rated borrowers, mainly in the more resilient segments Oil Majors and National Oil & Gas companies. Less than 25 % of our “Oil & Gas” credit portfolio is to sectors that we consider higher risk and more impacted by the low oil price, namely sub-investment-grade Exploration & Production (predominantly senior secured) and Oil & Gas Services & Equipment segments.
Our loan exposure in our “Metals, Mining and Steel” portfolio is approximately € 6 billion. This portfolio is of lower quality compared to our overall Corporate credit portfolio, and has an investment-grade ratio of just one third. In line with the structure of the industry, a significant share of our portfolio is in Emerging Markets countries. Our strategy is to reduce this credit portfolio due to elevated risks of this industry, namely material oversupply with resulting pressure on prices and margins.
Our loan exposure to “Shipping” accounts for approximately € 5 billion which is largely collateralized. The portfolio is diversified across ship types with global associated risks due to diversified trading income albeit the counterparties are mainly domiciled in Europe. A high proportion of the portfolio is sub investment-grade rated in reflection of the prolonged challenging market conditions over recent years. Exposure to the German “KG” sector (non-recourse financing of vessels via closed end funds) is less than 10 % of the total Shipping exposure.
Jun 30, 2016 Dec 31, 2015
in € m.
Direct Sovereign
exposure1
Net Notional of CDS
referencing sovereign debt
Net sovereign exposure
Memo Item: Net fair value
of CDS referencing
sovereign debt2
Direct Sovereign
exposure1
Net Notional of CDS
referencing sovereign debt
Net sovereign exposure
Memo Item: Net fair value
of CDS referencing
sovereign debt2 Greece 100 (6) 94 2 0 0 0 0
Ireland 640 6 646 1 55 (28) 28 1
Italy 3,867 (2,943) 925 102 3,989 (3,482) 507 36
Portugal 140 101 241 (10) 112 (48) 64 (9)
Spain 1,030 79 1,109 3 725 32 757 (12)
Total 5,778 (2,762) 3,015 98 4,881 (3,526) 1,356 17
1 Includes sovereign debt classified as financial assets/liabilities at fair value through profit or loss, available for sale and loans carried at amortized cost. 2 The amounts reflect the net fair value in relation to default swaps referencing sovereign debt of the respective country representing the counterparty credit risk.
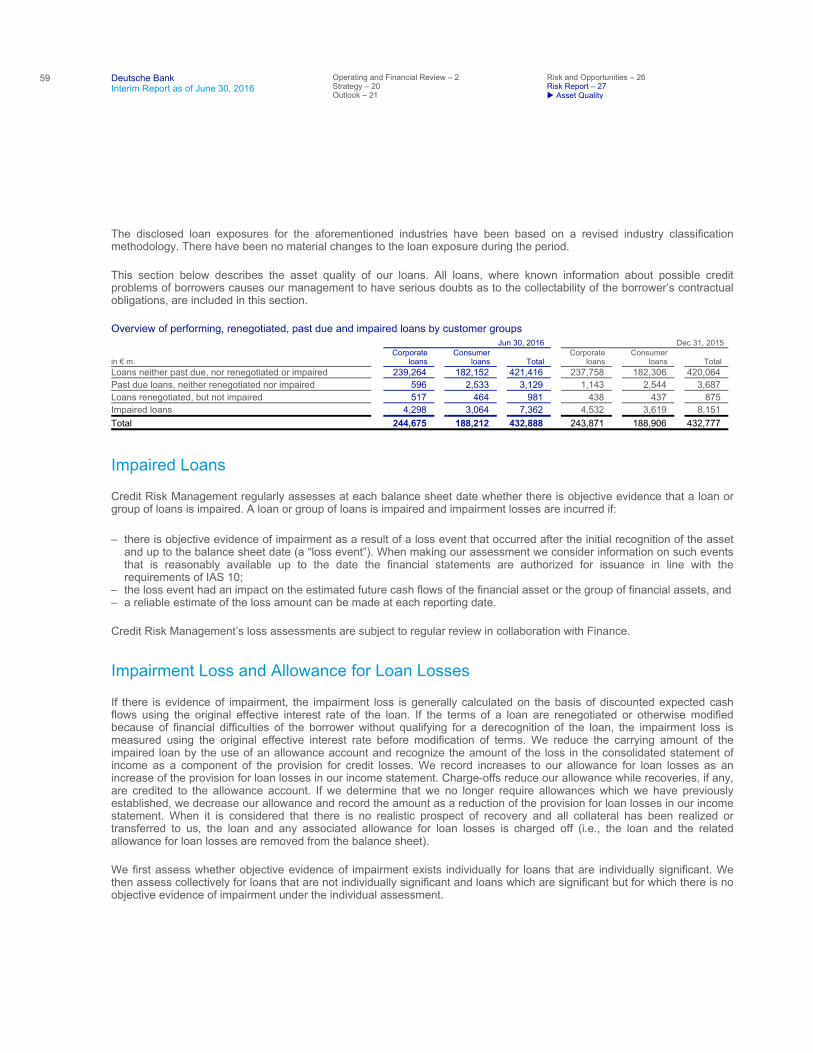
59
Deutsche Bank Interim Report as of June 30, 2016
Operating and Financial Review – 2 Strategy – 20 Outlook – 21
Risk and Opportunities – 26 Risk Report – 27
Asset Quality
The disclosed loan exposures for the aforementioned industries have been based on a revised industry classification methodology. There have been no material changes to the loan exposure during the period.
This section below describes the asset quality of our loans. All loans, where known information about possible credit problems of borrowers causes our management to have serious doubts as to the collectability of the borrower’s contractual obligations, are included in this section.
Overview of performing, renegotiated, past due and impaired loans by customer groups
Impaired Loans
Credit Risk Management regularly assesses at each balance sheet date whether there is objective evidence that a loan or group of loans is impaired. A loan or group of loans is impaired and impairment losses are incurred if:
Credit Risk Management’s loss assessments are subject to regular review in collaboration with Finance.
Impairment Loss and Allowance for Loan Losses
If there is evidence of impairment, the impairment loss is generally calculated on the basis of discounted expected cash flows using the original effective interest rate of the loan. If the terms of a loan are renegotiated or otherwise modified because of financial difficulties of the borrower without qualifying for a derecognition of the loan, the impairment loss is measured using the original effective interest rate before modification of terms. We reduce the carrying amount of the impaired loan by the use of an allowance account and recognize the amount of the loss in the consolidated statement of income as a component of the provision for credit losses. We record increases to our allowance for loan losses as an increase of the provision for loan losses in our income statement. Charge-offs reduce our allowance while recoveries, if any, are credited to the allowance account. If we determine that we no longer require allowances which we have previously established, we decrease our allowance and record the amount as a reduction of the provision for loan losses in our income statement. When it is considered that there is no realistic prospect of recovery and all collateral has been realized or transferred to us, the loan and any associated allowance for loan losses is charged off (i.e., the loan and the related allowance for loan losses are removed from the balance sheet).
We first assess whether objective evidence of impairment exists individually for loans that are individually significant. We then assess collectively for loans that are not individually significant and loans which are significant but for which there is no objective evidence of impairment under the individual assessment.
Jun 30, 2016 Dec 31, 2015
in € m. Corporate
loans Consumer
loans Total Corporate
loans Consumer
loans Total Loans neither past due, nor renegotiated or impaired 239,264 182,152 421,416 237,758 182,306 420,064
Past due loans, neither renegotiated nor impaired 596 2,533 3,129 1,143 2,544 3,687
Loans renegotiated, but not impaired 517 464 981 438 437 875
Impaired loans 4,298 3,064 7,362 4,532 3,619 8,151
Total 244,675 188,212 432,888 243,871 188,906 432,777
– there is objective evidence of impairment as a result of a loss event that occurred after the initial recognition of the assetand up to the balance sheet date (a “loss event”). When making our assessment we consider information on such eventsthat is reasonably available up to the date the financial statements are authorized for issuance in line with therequirements of IAS 10;
– the loss event had an impact on the estimated future cash flows of the financial asset or the group of financial assets, and – a reliable estimate of the loss amount can be made at each reporting date.
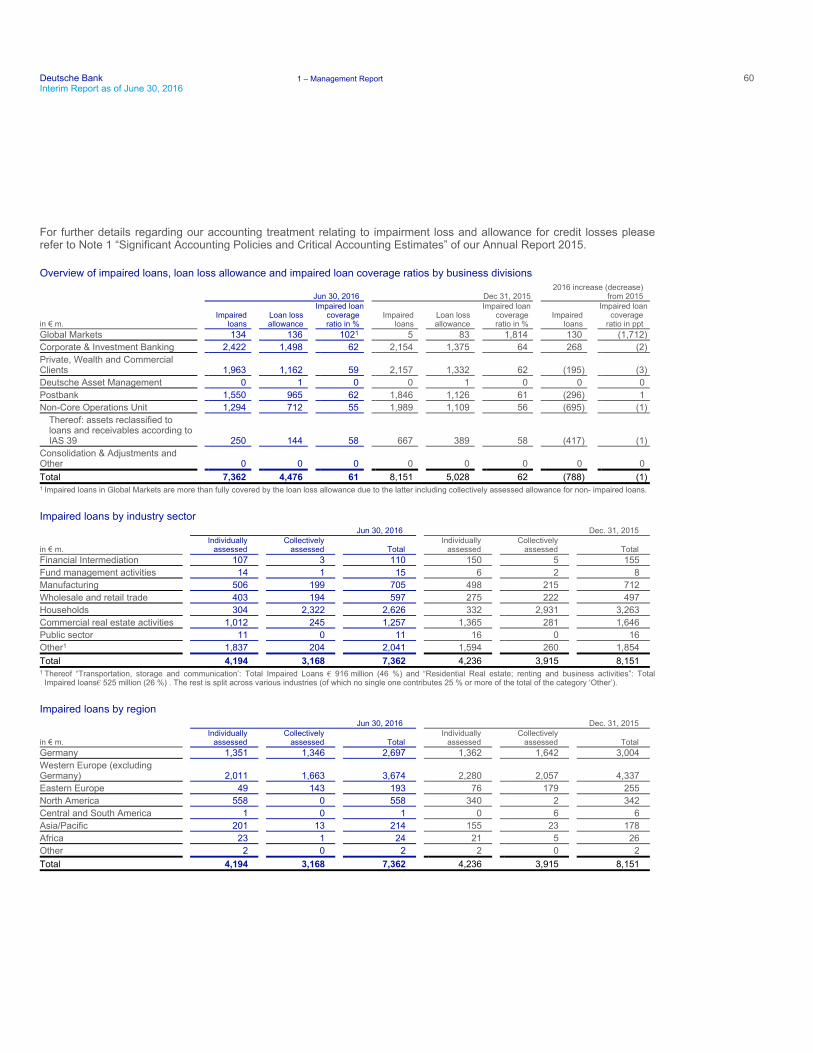
Deutsche Bank 1 – Management Report 60Interim Report as of June 30, 2016
For further details regarding our accounting treatment relating to impairment loss and allowance for credit losses please refer to Note 1 “Significant Accounting Policies and Critical Accounting Estimates” of our Annual Report 2015.
Overview of impaired loans, loan loss allowance and impaired loan coverage ratios by business divisions
Impaired loans by industry sector
Impaired loans by region
Jun 30, 2016 Dec 31, 2015 2016 increase (decrease)
from 2015
in € m. Impaired
loans Loan loss
allowance
Impaired loancoverage ratio in %
Impaired loans
Loan loss allowance
Impaired loan coverage ratio in %
Impaired loans
Impaired loan coverage
ratio in ppt Global Markets 134 136 1021 5 83 1,814 130 (1,712)
Corporate & Investment Banking 2,422 1,498 62 2,154 1,375 64 268 (2)
Private, Wealth and Commercial Clients 1,963 1,162 59 2,157 1,332 62 (195) (3)
Deutsche Asset Management 0 1 0 0 1 0 0 0
Postbank 1,550 965 62 1,846 1,126 61 (296) 1
Non-Core Operations Unit 1,294 712 55 1,989 1,109 56 (695) (1)
Thereof: assets reclassified to loans and receivables according to IAS 39 250 144 58 667 389 58 (417) (1)
Consolidation & Adjustments and Other 0 0 0 0 0 0 0 0
Total 7,362 4,476 61 8,151 5,028 62 (788) (1)
1 Impaired loans in Global Markets are more than fully covered by the loan loss allowance due to the latter including collectively assessed allowance for non- impaired loans.
Jun 30, 2016 Dec. 31, 2015
in € m. Individually
assessed Collectively
assessed Total Individually
assessed Collectively
assessed Total Financial Intermediation 107 3 110 150 5 155
Fund management activities 14 1 15 6 2 8
Manufacturing 506 199 705 498 215 712
Wholesale and retail trade 403 194 597 275 222 497
Households 304 2,322 2,626 332 2,931 3,263
Commercial real estate activities 1,012 245 1,257 1,365 281 1,646
Public sector 11 0 11 16 0 16
Other1 1,837 204 2,041 1,594 260 1,854
Total 4,194 3,168 7,362 4,236 3,915 8,151
1 Thereof “Transportation, storage and communication’: Total Impaired Loans € 916 million (46 %) and “Residential Real estate; renting and business activities”: TotalImpaired loans€ 525 million (26 %) . The rest is split across various industries (of which no single one contributes 25 % or more of the total of the category ‘Other’).
Jun 30, 2016 Dec. 31, 2015
in € m. Individually
assessed Collectively
assessed Total Individually
assessed Collectively
assessed Total Germany 1,351 1,346 2,697 1,362 1,642 3,004
Western Europe (excluding Germany) 2,011 1,663 3,674 2,280 2,057 4,337
Eastern Europe 49 143 193 76 179 255
North America 558 0 558 340 2 342
Central and South America 1 0 1 0 6 6
Asia/Pacific 201 13 214 155 23 178
Africa 23 1 24 21 5 26
Other 2 0 2 2 0 2
Total 4,194 3,168 7,362 4,236 3,915 8,151
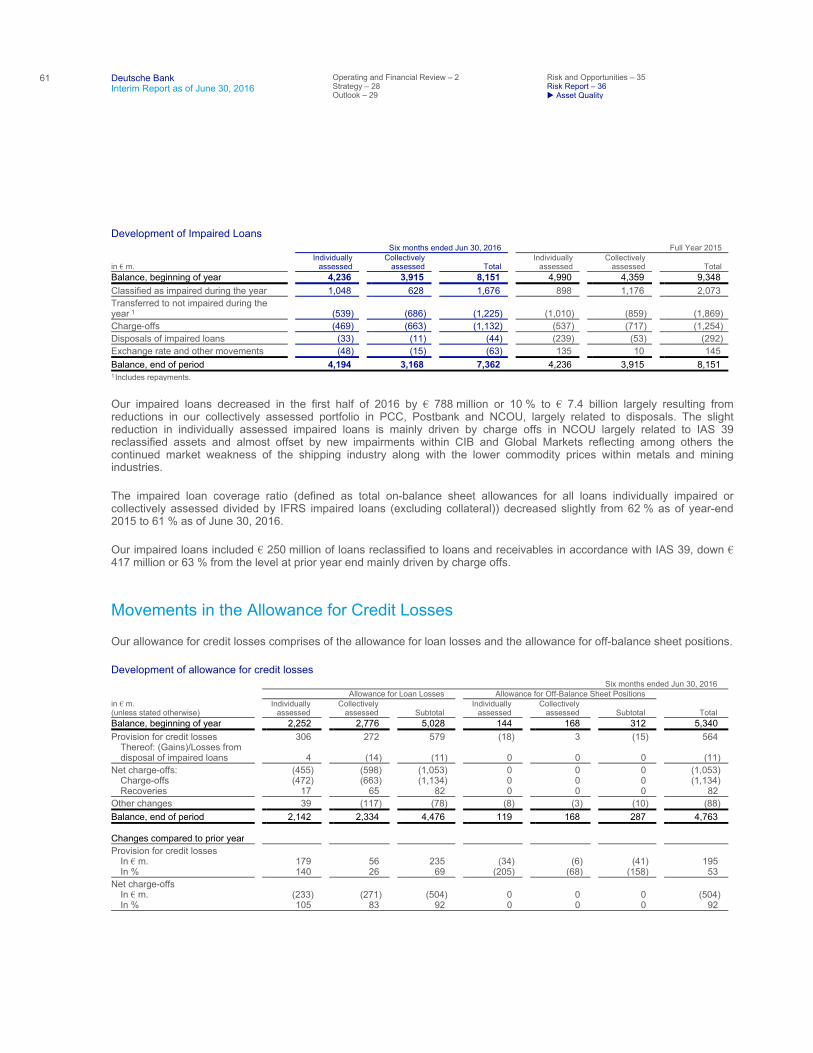
61
Deutsche Bank Interim Report as of June 30, 2016
Operating and Financial Review – 2 Strategy – 28 Outlook – 29
Risk and Opportunities – 35 Risk Report – 36
Asset Quality
Development of Impaired Loans
Our impaired loans decreased in the first half of 2016 by € 788 million or 10 % to € 7.4 billion largely resulting from reductions in our collectively assessed portfolio in PCC, Postbank and NCOU, largely related to disposals. The slight reduction in individually assessed impaired loans is mainly driven by charge offs in NCOU largely related to IAS 39 reclassified assets and almost offset by new impairments within CIB and Global Markets reflecting among others the continued market weakness of the shipping industry along with the lower commodity prices within metals and mining industries.
The impaired loan coverage ratio (defined as total on-balance sheet allowances for all loans individually impaired or collectively assessed divided by IFRS impaired loans (excluding collateral)) decreased slightly from 62 % as of year-end 2015 to 61 % as of June 30, 2016.
Our impaired loans included € 250 million of loans reclassified to loans and receivables in accordance with IAS 39, down € 417 million or 63 % from the level at prior year end mainly driven by charge offs.
Movements in the Allowance for Credit Losses
Our allowance for credit losses comprises of the allowance for loan losses and the allowance for off-balance sheet positions.
Development of allowance for credit losses
Six months ended Jun 30, 2016 Full Year 2015
in € m. Individually
assessed Collectively
assessed Total Individually
assessed Collectively
assessed Total Balance, beginning of year 4,236 3,915 8,151 4,990 4,359 9,348
Classified as impaired during the year 1,048 628 1,676 898 1,176 2,073
Transferred to not impaired during the year 1 (539) (686) (1,225) (1,010) (859) (1,869)
Charge-offs (469) (663) (1,132) (537) (717) (1,254)
Disposals of impaired loans (33) (11) (44) (239) (53) (292)
Exchange rate and other movements (48) (15) (63) 135 10 145
Balance, end of period 4,194 3,168 7,362 4,236 3,915 8,151
1 Includes repayments.
Six months ended Jun 30, 2016 Allowance for Loan Losses Allowance for Off-Balance Sheet Positions in € m. (unless stated otherwise)
Individually assessed
Collectively assessed Subtotal
Individually assessed
Collectively assessed Subtotal Total
Balance, beginning of year 2,252 2,776 5,028 144 168 312 5,340
Provision for credit losses 306 272 579 (18) 3 (15) 564 Thereof: (Gains)/Losses from disposal of impaired loans 4 (14) (11) 0 0 0 (11)
Net charge-offs: (455) (598) (1,053) 0 0 0 (1,053) Charge-offs (472) (663) (1,134) 0 0 0 (1,134) Recoveries 17 65 82 0 0 0 82
Other changes 39 (117) (78) (8) (3) (10) (88)
Balance, end of period 2,142 2,334 4,476 119 168 287 4,763
Changes compared to prior year
Provision for credit losses In € m. 179 56 235 (34) (6) (41) 195 In % 140 26 69 (205) (68) (158) 53
Net charge-offs In € m. (233) (271) (504) 0 0 0 (504) In % 105 83 92 0 0 0 92
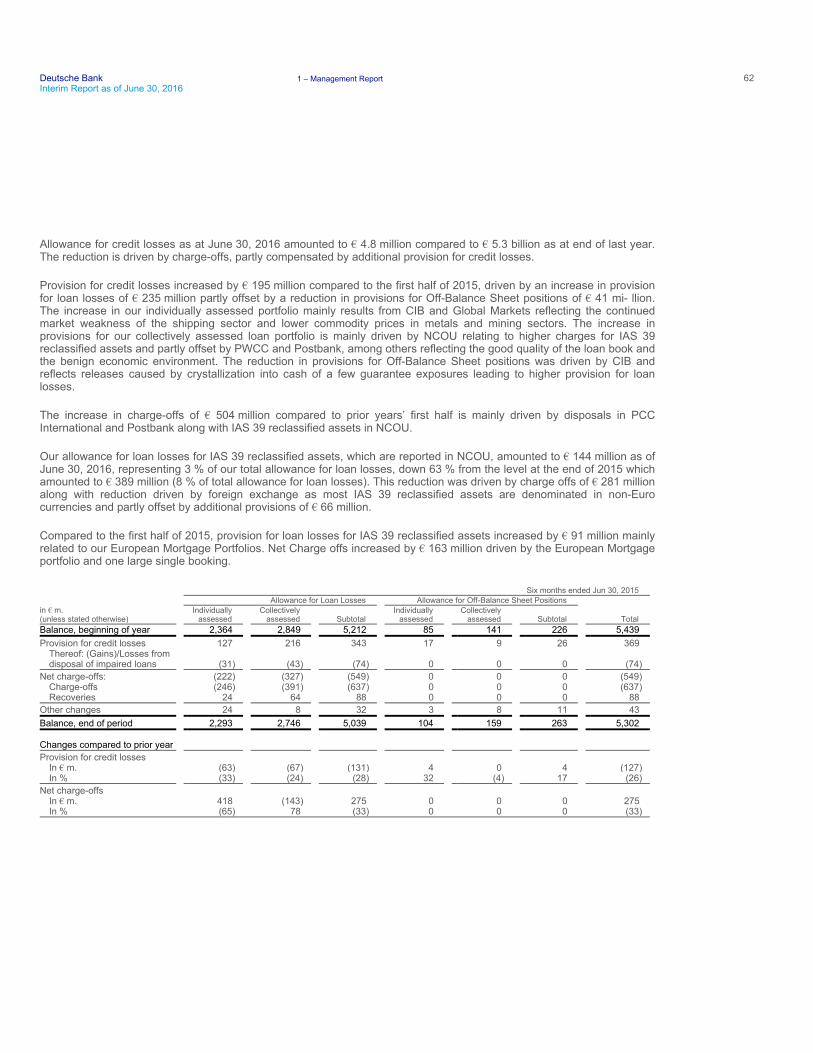
Deutsche Bank 1 – Management Report 62Interim Report as of June 30, 2016
Allowance for credit losses as at June 30, 2016 amounted to € 4.8 million compared to € 5.3 billion as at end of last year. The reduction is driven by charge-offs, partly compensated by additional provision for credit losses.
Provision for credit losses increased by € 195 million compared to the first half of 2015, driven by an increase in provision for loan losses of € 235 million partly offset by a reduction in provisions for Off-Balance Sheet positions of € 41 mi- llion. The increase in our individually assessed portfolio mainly results from CIB and Global Markets reflecting the continued market weakness of the shipping sector and lower commodity prices in metals and mining sectors. The increase in provisions for our collectively assessed loan portfolio is mainly driven by NCOU relating to higher charges for IAS 39 reclassified assets and partly offset by PWCC and Postbank, among others reflecting the good quality of the loan book and the benign economic environment. The reduction in provisions for Off-Balance Sheet positions was driven by CIB and reflects releases caused by crystallization into cash of a few guarantee exposures leading to higher provision for loan losses.
The increase in charge-offs of € 504 million compared to prior years’ first half is mainly driven by disposals in PCC International and Postbank along with IAS 39 reclassified assets in NCOU.
Our allowance for loan losses for IAS 39 reclassified assets, which are reported in NCOU, amounted to € 144 million as of June 30, 2016, representing 3 % of our total allowance for loan losses, down 63 % from the level at the end of 2015 which amounted to € 389 million (8 % of total allowance for loan losses). This reduction was driven by charge offs of € 281 million along with reduction driven by foreign exchange as most IAS 39 reclassified assets are denominated in non-Euro currencies and partly offset by additional provisions of € 66 million.
Compared to the first half of 2015, provision for loan losses for IAS 39 reclassified assets increased by € 91 million mainly related to our European Mortgage Portfolios. Net Charge offs increased by € 163 million driven by the European Mortgage portfolio and one large single booking. Six months ended Jun 30, 2015 Allowance for Loan Losses Allowance for Off-Balance Sheet Positions in € m. (unless stated otherwise)
Individually assessed
Collectively assessed Subtotal
Individually assessed
Collectively assessed Subtotal Total
Balance, beginning of year 2,364 2,849 5,212 85 141 226 5,439
Provision for credit losses 127 216 343 17 9 26 369 Thereof: (Gains)/Losses from disposal of impaired loans (31) (43) (74) 0 0 0 (74)
Net charge-offs: (222) (327) (549) 0 0 0 (549) Charge-offs (246) (391) (637) 0 0 0 (637) Recoveries 24 64 88 0 0 0 88
Other changes 24 8 32 3 8 11 43
Balance, end of period 2,293 2,746 5,039 104 159 263 5,302
Changes compared to prior year
Provision for credit losses In € m. (63) (67) (131) 4 0 4 (127) In % (33) (24) (28) 32 (4) 17 (26)
Net charge-offs In € m. 418 (143) 275 0 0 0 275 In % (65) 78 (33) 0 0 0 (33)
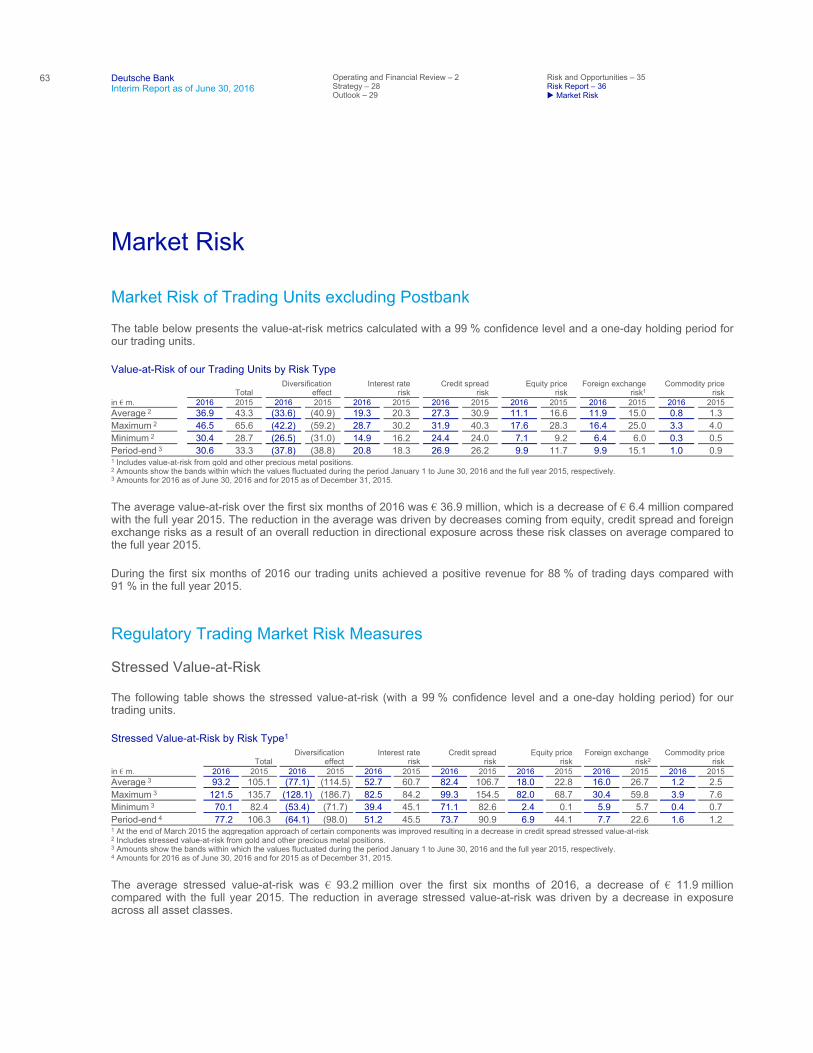
63
Deutsche Bank Interim Report as of June 30, 2016
Operating and Financial Review – 2 Strategy – 28 Outlook – 29
Risk and Opportunities – 35 Risk Report – 36
Market Risk
Market Risk
Market Risk of Trading Units excluding Postbank
The table below presents the value-at-risk metrics calculated with a 99 % confidence level and a one-day holding period for our trading units.
Value-at-Risk of our Trading Units by Risk Type
The average value-at-risk over the first six months of 2016 was € 36.9 million, which is a decrease of € 6.4 million compared with the full year 2015. The reduction in the average was driven by decreases coming from equity, credit spread and foreign exchange risks as a result of an overall reduction in directional exposure across these risk classes on average compared to the full year 2015.
During the first six months of 2016 our trading units achieved a positive revenue for 88 % of trading days compared with 91 % in the full year 2015.
Regulatory Trading Market Risk Measures
Stressed Value-at-Risk
The following table shows the stressed value-at-risk (with a 99 % confidence level and a one-day holding period) for our trading units.
Stressed Value-at-Risk by Risk Type1
The average stressed value-at-risk was € 93.2 million over the first six months of 2016, a decrease of € 11.9 million compared with the full year 2015. The reduction in average stressed value-at-risk was driven by a decrease in exposure across all asset classes.
Total Diversification
effect Interest rate
risk Credit spread
risk Equity price
risk Foreign exchange
risk1 Commodity price
risk in € m. 2016 2015 2016 2015 2016 2015 2016 2015 2016 2015 2016 2015 2016 2015 Average 2 36.9 43.3 (33.6) (40.9) 19.3 20.3 27.3 30.9 11.1 16.6 11.9 15.0 0.8 1.3
Maximum 2 46.5 65.6 (42.2) (59.2) 28.7 30.2 31.9 40.3 17.6 28.3 16.4 25.0 3.3 4.0
Minimum 2 30.4 28.7 (26.5) (31.0) 14.9 16.2 24.4 24.0 7.1 9.2 6.4 6.0 0.3 0.5
Period-end 3 30.6 33.3 (37.8) (38.8) 20.8 18.3 26.9 26.2 9.9 11.7 9.9 15.1 1.0 0.9
1 Includes value-at-risk from gold and other precious metal positions. 2 Amounts show the bands within which the values fluctuated during the period January 1 to June 30, 2016 and the full year 2015, respectively. 3 Amounts for 2016 as of June 30, 2016 and for 2015 as of December 31, 2015.
Total Diversification
effect Interest rate
risk Credit spread
risk Equity price
risk Foreign exchange
risk2 Commodity price
risk in € m. 2016 2015 2016 2015 2016 2015 2016 2015 2016 2015 2016 2015 2016 2015 Average 3 93.2 105.1 (77.1) (114.5) 52.7 60.7 82.4 106.7 18.0 22.8 16.0 26.7 1.2 2.5
Maximum 3 121.5 135.7 (128.1) (186.7) 82.5 84.2 99.3 154.5 82.0 68.7 30.4 59.8 3.9 7.6
Minimum 3 70.1 82.4 (53.4) (71.7) 39.4 45.1 71.1 82.6 2.4 0.1 5.9 5.7 0.4 0.7
Period-end 4 77.2 106.3 (64.1) (98.0) 51.2 45.5 73.7 90.9 6.9 44.1 7.7 22.6 1.6 1.2
1 At the end of March 2015 the aggregation approach of certain components was improved resulting in a decrease in credit spread stressed value-at-risk 2 Includes stressed value-at-risk from gold and other precious metal positions. 3 Amounts show the bands within which the values fluctuated during the period January 1 to June 30, 2016 and the full year 2015, respectively. 4 Amounts for 2016 as of June 30, 2016 and for 2015 as of December 31, 2015.
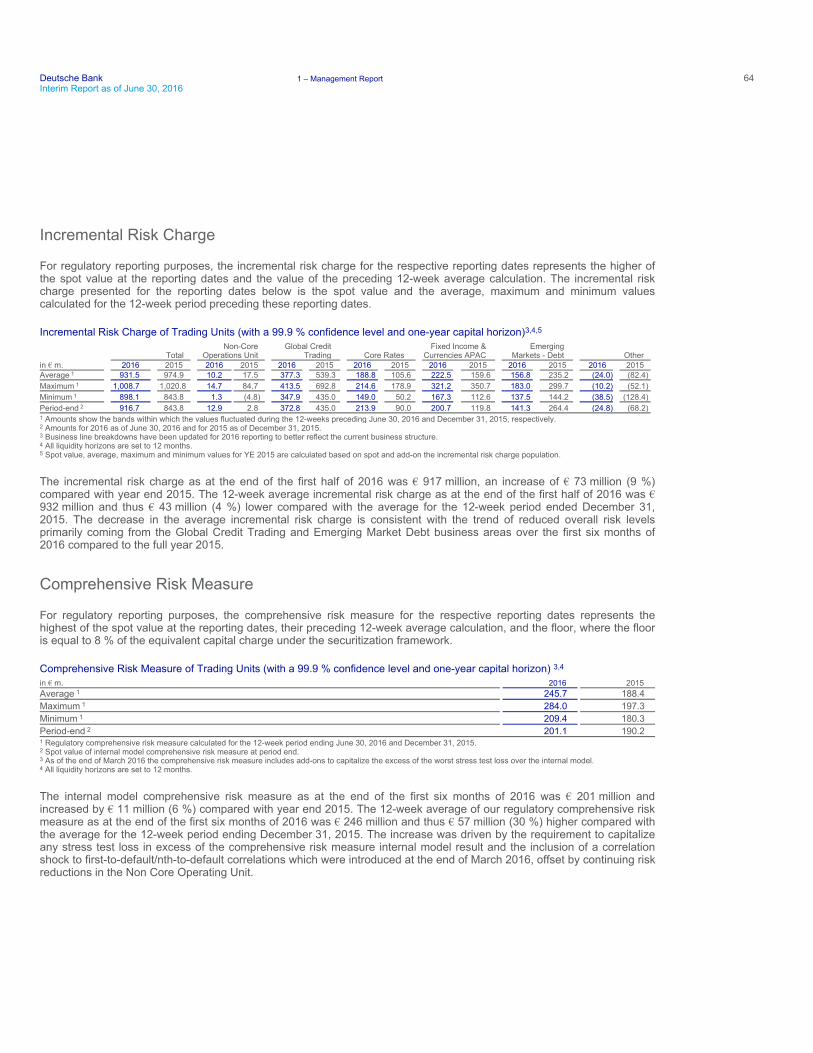
Deutsche Bank 1 – Management Report 64Interim Report as of June 30, 2016
Incremental Risk Charge
For regulatory reporting purposes, the incremental risk charge for the respective reporting dates represents the higher of the spot value at the reporting dates and the value of the preceding 12-week average calculation. The incremental risk charge presented for the reporting dates below is the spot value and the average, maximum and minimum values calculated for the 12-week period preceding these reporting dates.
Incremental Risk Charge of Trading Units (with a 99.9 % confidence level and one-year capital horizon)3,4,5
The incremental risk charge as at the end of the first half of 2016 was € 917 million, an increase of € 73 million (9 %) compared with year end 2015. The 12-week average incremental risk charge as at the end of the first half of 2016 was € 932 million and thus € 43 million (4 %) lower compared with the average for the 12-week period ended December 31, 2015. The decrease in the average incremental risk charge is consistent with the trend of reduced overall risk levels primarily coming from the Global Credit Trading and Emerging Market Debt business areas over the first six months of 2016 compared to the full year 2015.
Comprehensive Risk Measure
For regulatory reporting purposes, the comprehensive risk measure for the respective reporting dates represents the highest of the spot value at the reporting dates, their preceding 12-week average calculation, and the floor, where the floor is equal to 8 % of the equivalent capital charge under the securitization framework.
Comprehensive Risk Measure of Trading Units (with a 99.9 % confidence level and one-year capital horizon) 3,4
The internal model comprehensive risk measure as at the end of the first six months of 2016 was € 201 million and increased by € 11 million (6 %) compared with year end 2015. The 12-week average of our regulatory comprehensive risk measure as at the end of the first six months of 2016 was € 246 million and thus € 57 million (30 %) higher compared with the average for the 12-week period ending December 31, 2015. The increase was driven by the requirement to capitalize any stress test loss in excess of the comprehensive risk measure internal model result and the inclusion of a correlation shock to first-to-default/nth-to-default correlations which were introduced at the end of March 2016, offset by continuing risk reductions in the Non Core Operating Unit.
Total Non-Core
Operations Unit Global Credit
Trading Core Rates Fixed Income &
Currencies APAC Emerging
Markets - Debt Other in € m. 2016 2015 2016 2015 2016 2015 2016 2015 2016 2015 2016 2015 2016 2015 Average 1 931.5 974.9 10.2 17.5 377.3 539.3 188.8 105.6 222.5 159.6 156.8 235.2 (24.0) (82.4)
Maximum 1 1,008.7 1,020.8 14.7 84.7 413.5 692.8 214.6 178.9 321.2 350.7 183.0 299.7 (10.2) (52.1)
Minimum 1 898.1 843.8 1.3 (4.8) 347.9 435.0 149.0 50.2 167.3 112.6 137.5 144.2 (38.5) (128.4)
Period-end 2 916.7 843.8 12.9 2.8 372.8 435.0 213.9 90.0 200.7 119.8 141.3 264.4 (24.8) (68.2)
1 Amounts show the bands within which the values fluctuated during the 12-weeks preceding June 30, 2016 and December 31, 2015, respectively. 2 Amounts for 2016 as of June 30, 2016 and for 2015 as of December 31, 2015. 3 Business line breakdowns have been updated for 2016 reporting to better reflect the current business structure. 4 All liquidity horizons are set to 12 months. 5 Spot value, average, maximum and minimum values for YE 2015 are calculated based on spot and add-on the incremental risk charge population.
in € m. 2016 2015 Average 1 245.7 188.4
Maximum 1 284.0 197.3
Minimum 1 209.4 180.3
Period-end 2 201.1 190.2
1 Regulatory comprehensive risk measure calculated for the 12-week period ending June 30, 2016 and December 31, 2015. 2 Spot value of internal model comprehensive risk measure at period end. 3 As of the end of March 2016 the comprehensive risk measure includes add-ons to capitalize the excess of the worst stress test loss over the internal model. 4 All liquidity horizons are set to 12 months.
65
Deutsche Bank Interim Report as of June 30, 2016
Operating and Financial Review – 2 Strategy – 28 Outlook – 29
Risk and Opportunities – 35 Risk Report – 36
Operational Risk
Market Risk Standardized Approach As of June 30, 2016, the securitization positions, for which the specific interest rate risk is calculated using the market risk standardized approach, generated capital requirements of € 615.7 million corresponding to risk weighted-assets of € 7.7 billion. As of December 31, 2015 these positions generated capital requirements of € 811 million corresponding to risk weighted-assets of € 10.1 billion.
For nth-to-default credit default swaps the capital requirement decreased to € 3.7 million corresponding to risk weighted-assets of € 46.8 million compared with € 6 million and € 78 million as of December 31, 2015.
The capital requirement for collective investment undertakings under the market risk standardized approach was € 60 million corresponding to risk-weighted assets of € 755 million as of June 30, 2016, compared with € 70 million and € 873 million as of December 31, 2015.
The capital requirement for longevity risk under the market risk standardized approach was € 35 million corresponding to risk-weighted assets of € 440 million as of June 30, 2016, compared with € 36 million and € 451 million as of December 31, 2015.
Market Risk of Trading Book at Postbank
The value-at-risk of Postbank’s trading book calculated with a 99 % confidence level and a one-day holding period amounted to zero as of June 30, 2016 and at year-end 2015. Postbank’s current trading strategy does not allow any new trading activities with regard to the trading book. Therefore, Postbank’s trading book did not contain any positions as of June 30, 2016 and at year-end 2015. Nevertheless, Postbank will remain classified as a trading book institution.
Operational Risk In the first six months of 2016 our operational risk losses continued to be predominantly driven by legal operational risk losses and legal provisions which represent the majority of our operational risk. Since legal losses account for more than 90 % of operational risk losses, legal risks account for the majority of operational risk regulatory and economic capital demand. For a description of our current legal and regulatory proceedings, please see section “Current Individual Proceedings” of this Interim Report. Our non-legal operational risk losses were higher compared to the first six months of 2015. The outlook for the rest of year remains cautious, due to the legal and regulatory environment that we believe will continue to affect our business.
Our operational risk management fosters a forward-looking risk management with regard to monitoring of potential profits and losses, focusing on regular review of legal risks/contingencies, trend analysis based upon available losses and key risk indicator data.
This is particularly reflected in the management and measurement of our legal risks where the bank relies both on information from internal as well as external data sources to consider developments in legal matters that affect DB specifically but also the banking industry as a whole. Reflecting the multi-year nature of legal proceedings the measurement of our legal risks furthermore takes into account changing levels of certainty by capturing the legal risks at various stages throughout the lifecycle of a legal matter.
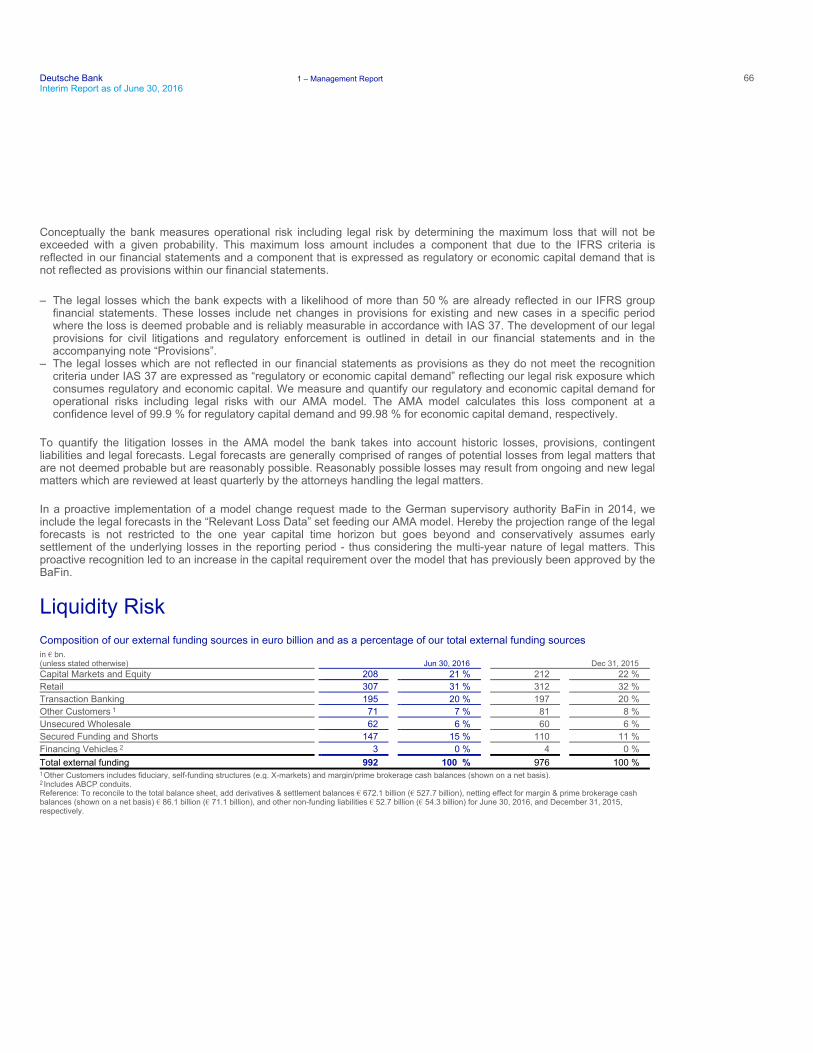
Deutsche Bank 1 – Management Report 66Interim Report as of June 30, 2016
Conceptually the bank measures operational risk including legal risk by determining the maximum loss that will not be exceeded with a given probability. This maximum loss amount includes a component that due to the IFRS criteria is reflected in our financial statements and a component that is expressed as regulatory or economic capital demand that is not reflected as provisions within our financial statements.
To quantify the litigation losses in the AMA model the bank takes into account historic losses, provisions, contingent liabilities and legal forecasts. Legal forecasts are generally comprised of ranges of potential losses from legal matters that are not deemed probable but are reasonably possible. Reasonably possible losses may result from ongoing and new legal matters which are reviewed at least quarterly by the attorneys handling the legal matters.
In a proactive implementation of a model change request made to the German supervisory authority BaFin in 2014, we include the legal forecasts in the “Relevant Loss Data” set feeding our AMA model. Hereby the projection range of the legal forecasts is not restricted to the one year capital time horizon but goes beyond and conservatively assumes early settlement of the underlying losses in the reporting period - thus considering the multi-year nature of legal matters. This proactive recognition led to an increase in the capital requirement over the model that has previously been approved by the BaFin.
Liquidity Risk Composition of our external funding sources in euro billion and as a percentage of our total external funding sources
Reference: To reconcile to the total balance sheet, add derivatives & settlement balances € 672.1 billion (€ 527.7 billion), netting effect for margin & prime brokerage cash balances (shown on a net basis) € 86.1 billion (€ 71.1 billion), and other non-funding liabilities € 52.7 billion (€ 54.3 billion) for June 30, 2016, and December 31, 2015, respectively.
– The legal losses which the bank expects with a likelihood of more than 50 % are already reflected in our IFRS groupfinancial statements. These losses include net changes in provisions for existing and new cases in a specific periodwhere the loss is deemed probable and is reliably measurable in accordance with IAS 37. The development of our legalprovisions for civil litigations and regulatory enforcement is outlined in detail in our financial statements and in theaccompanying note “Provisions”.
– The legal losses which are not reflected in our financial statements as provisions as they do not meet the recognitioncriteria under IAS 37 are expressed as “regulatory or economic capital demand” reflecting our legal risk exposure whichconsumes regulatory and economic capital. We measure and quantify our regulatory and economic capital demand foroperational risks including legal risks with our AMA model. The AMA model calculates this loss component at aconfidence level of 99.9 % for regulatory capital demand and 99.98 % for economic capital demand, respectively.
in € bn. (unless stated otherwise) Jun 30, 2016 Dec 31, 2015 Capital Markets and Equity 208 21 % 212 22 %
Retail 307 31 % 312 32 %
Transaction Banking 195 20 % 197 20 %
Other Customers 1 71 7 % 81 8 %
Unsecured Wholesale 62 6 % 60 6 %
Secured Funding and Shorts 147 15 % 110 11 %
Financing Vehicles 2 3 0 % 4 0 %
Total external funding 992 100 % 976 100 %
1Other Customers includes fiduciary, self-funding structures (e.g. X-markets) and margin/prime brokerage cash balances (shown on a net basis). 2 Includes ABCP conduits.
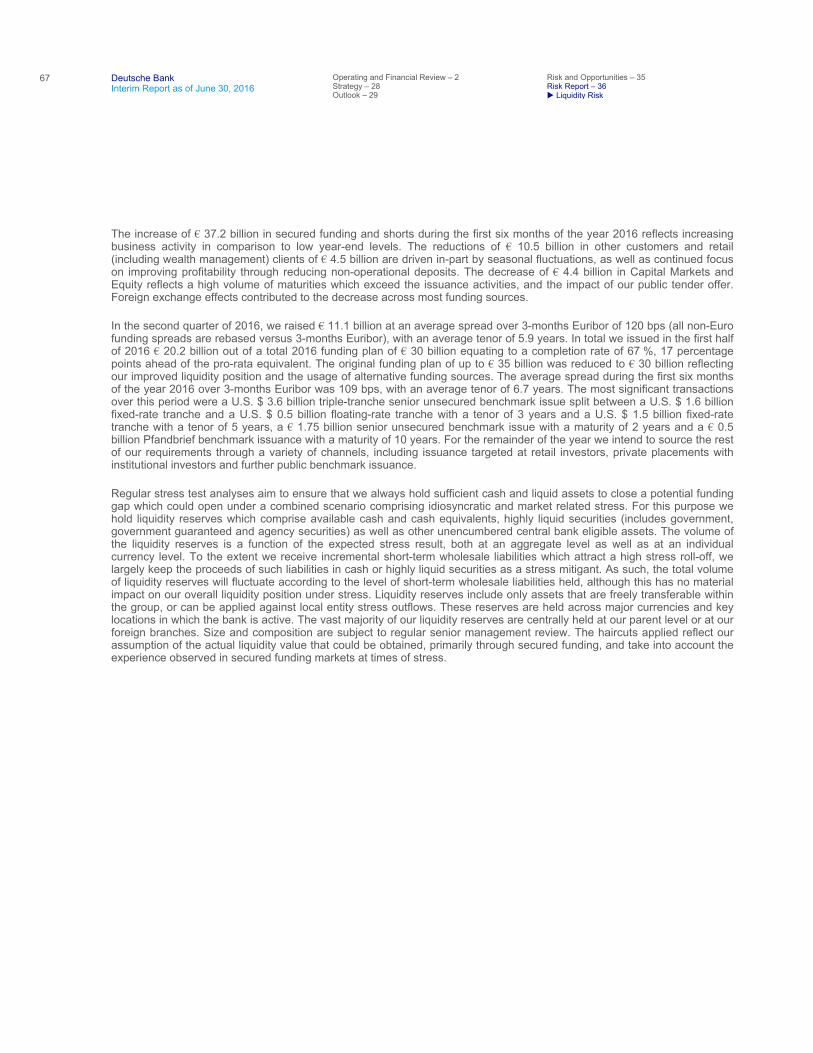
67
Deutsche Bank Interim Report as of June 30, 2016
Operating and Financial Review – 2 Strategy – 28 Outlook – 29
Risk and Opportunities – 35 Risk Report – 36
Liquidity Risk
The increase of € 37.2 billion in secured funding and shorts during the first six months of the year 2016 reflects increasing business activity in comparison to low year-end levels. The reductions of € 10.5 billion in other customers and retail (including wealth management) clients of € 4.5 billion are driven in-part by seasonal fluctuations, as well as continued focus on improving profitability through reducing non-operational deposits. The decrease of € 4.4 billion in Capital Markets and Equity reflects a high volume of maturities which exceed the issuance activities, and the impact of our public tender offer. Foreign exchange effects contributed to the decrease across most funding sources.
In the second quarter of 2016, we raised € 11.1 billion at an average spread over 3-months Euribor of 120 bps (all non-Euro funding spreads are rebased versus 3-months Euribor), with an average tenor of 5.9 years. In total we issued in the first half of 2016 € 20.2 billion out of a total 2016 funding plan of € 30 billion equating to a completion rate of 67 %, 17 percentage points ahead of the pro-rata equivalent. The original funding plan of up to € 35 billion was reduced to € 30 billion reflecting our improved liquidity position and the usage of alternative funding sources. The average spread during the first six months of the year 2016 over 3-months Euribor was 109 bps, with an average tenor of 6.7 years. The most significant transactions over this period were a U.S. $ 3.6 billion triple-tranche senior unsecured benchmark issue split between a U.S. $ 1.6 billion fixed-rate tranche and a U.S. $ 0.5 billion floating-rate tranche with a tenor of 3 years and a U.S. $ 1.5 billion fixed-rate tranche with a tenor of 5 years, a € 1.75 billion senior unsecured benchmark issue with a maturity of 2 years and a € 0.5 billion Pfandbrief benchmark issuance with a maturity of 10 years. For the remainder of the year we intend to source the rest of our requirements through a variety of channels, including issuance targeted at retail investors, private placements with institutional investors and further public benchmark issuance.
Regular stress test analyses aim to ensure that we always hold sufficient cash and liquid assets to close a potential funding gap which could open under a combined scenario comprising idiosyncratic and market related stress. For this purpose we hold liquidity reserves which comprise available cash and cash equivalents, highly liquid securities (includes government, government guaranteed and agency securities) as well as other unencumbered central bank eligible assets. The volume of the liquidity reserves is a function of the expected stress result, both at an aggregate level as well as at an individual currency level. To the extent we receive incremental short-term wholesale liabilities which attract a high stress roll-off, we largely keep the proceeds of such liabilities in cash or highly liquid securities as a stress mitigant. As such, the total volume of liquidity reserves will fluctuate according to the level of short-term wholesale liabilities held, although this has no material impact on our overall liquidity position under stress. Liquidity reserves include only assets that are freely transferable within the group, or can be applied against local entity stress outflows. These reserves are held across major currencies and key locations in which the bank is active. The vast majority of our liquidity reserves are centrally held at our parent level or at our foreign branches. Size and composition are subject to regular senior management review. The haircuts applied reflect our assumption of the actual liquidity value that could be obtained, primarily through secured funding, and take into account the experience observed in secured funding markets at times of stress.
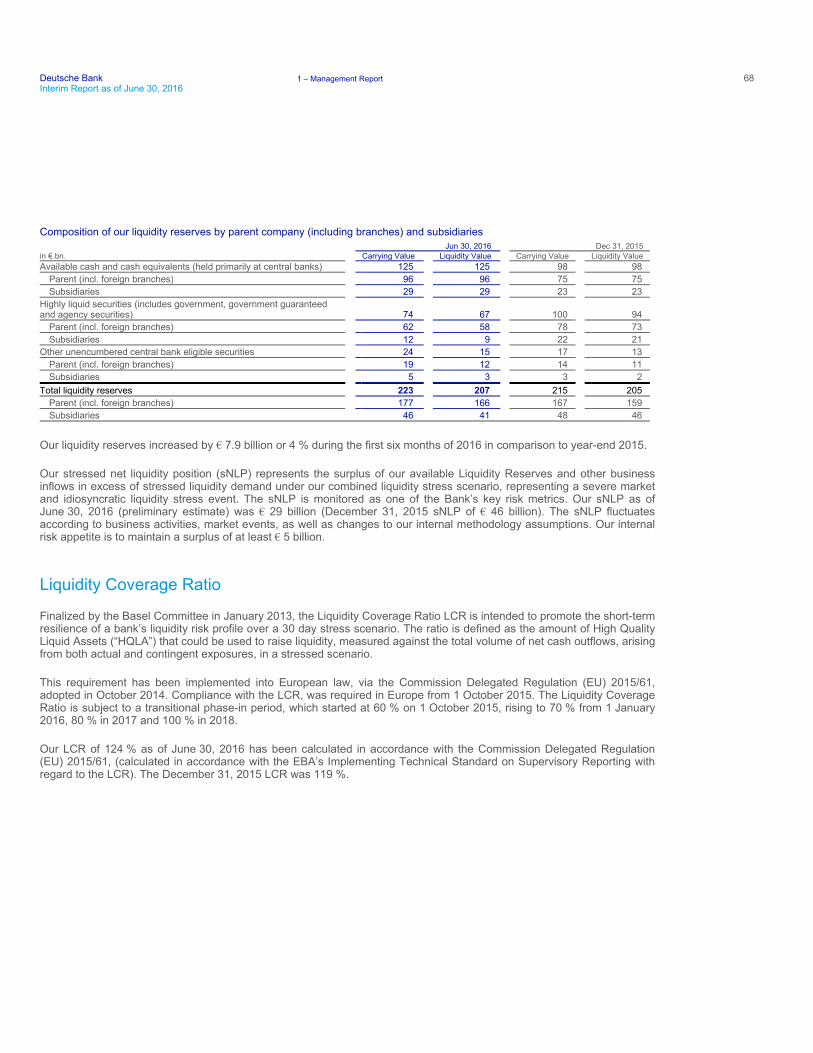
Deutsche Bank 1 – Management Report 68Interim Report as of June 30, 2016
Composition of our liquidity reserves by parent company (including branches) and subsidiaries
Our liquidity reserves increased by € 7.9 billion or 4 % during the first six months of 2016 in comparison to year-end 2015.
Our stressed net liquidity position (sNLP) represents the surplus of our available Liquidity Reserves and other business inflows in excess of stressed liquidity demand under our combined liquidity stress scenario, representing a severe market and idiosyncratic liquidity stress event. The sNLP is monitored as one of the Bank’s key risk metrics. Our sNLP as of June 30, 2016 (preliminary estimate) was € 29 billion (December 31, 2015 sNLP of € 46 billion). The sNLP fluctuates according to business activities, market events, as well as changes to our internal methodology assumptions. Our internal risk appetite is to maintain a surplus of at least € 5 billion.
Liquidity Coverage Ratio
Finalized by the Basel Committee in January 2013, the Liquidity Coverage Ratio LCR is intended to promote the short-term resilience of a bank’s liquidity risk profile over a 30 day stress scenario. The ratio is defined as the amount of High Quality Liquid Assets (“HQLA”) that could be used to raise liquidity, measured against the total volume of net cash outflows, arising from both actual and contingent exposures, in a stressed scenario.
This requirement has been implemented into European law, via the Commission Delegated Regulation (EU) 2015/61, adopted in October 2014. Compliance with the LCR, was required in Europe from 1 October 2015. The Liquidity Coverage Ratio is subject to a transitional phase-in period, which started at 60 % on 1 October 2015, rising to 70 % from 1 January 2016, 80 % in 2017 and 100 % in 2018.
Our LCR of 124 % as of June 30, 2016 has been calculated in accordance with the Commission Delegated Regulation (EU) 2015/61, (calculated in accordance with the EBA’s Implementing Technical Standard on Supervisory Reporting with regard to the LCR). The December 31, 2015 LCR was 119 %.
Jun 30, 2016 Dec 31, 2015 in € bn. Carrying Value Liquidity Value Carrying Value Liquidity Value Available cash and cash equivalents (held primarily at central banks) 125 125 98 98
Parent (incl. foreign branches) 96 96 75 75
Subsidiaries 29 29 23 23
Highly liquid securities (includes government, government guaranteed and agency securities) 74 67 100 94
Parent (incl. foreign branches) 62 58 78 73
Subsidiaries 12 9 22 21
Other unencumbered central bank eligible securities 24 15 17 13
Parent (incl. foreign branches) 19 12 14 11
Subsidiaries 5 3 3 2
Total liquidity reserves 223 207 215 205
Parent (incl. foreign branches) 177 166 167 159
Subsidiaries 46 41 48 46

69
Deutsche Bank Interim Report as of June 30, 2016
Responsibility Statement by the Management Board – 2 Review Report – 70

Deutsche Bank 2 – Confirmations 70Interim Report as of June 30, 2016
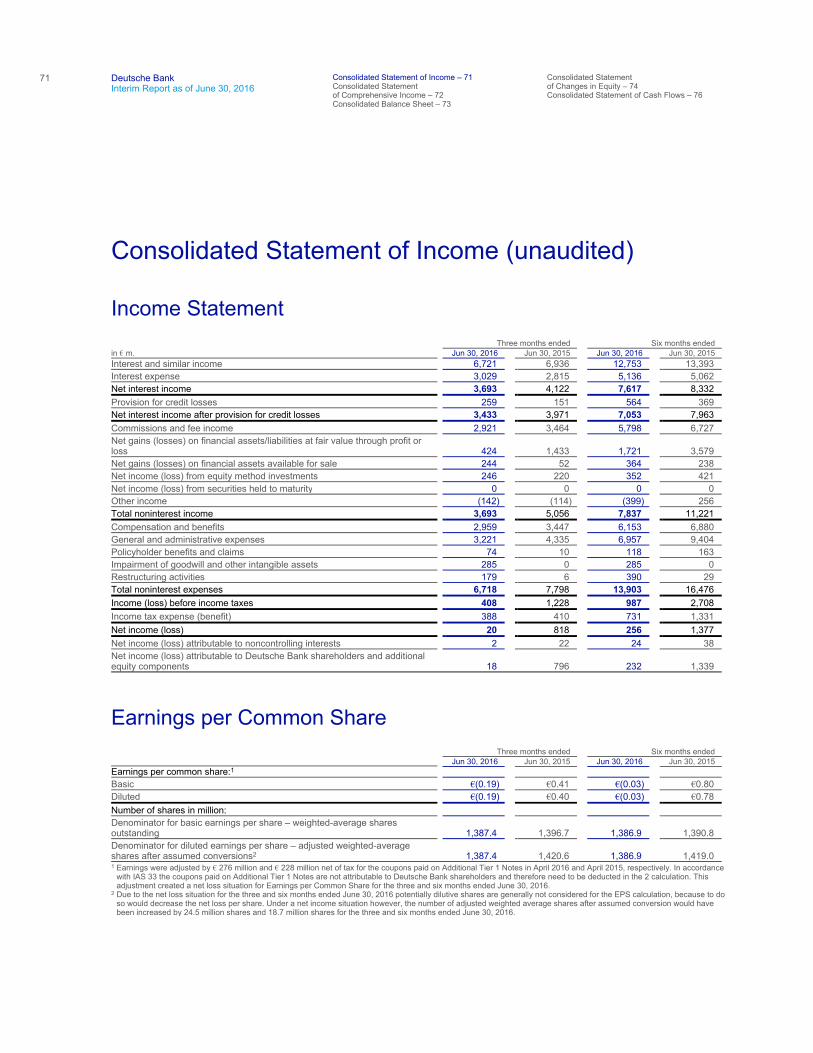
71
Deutsche Bank Interim Report as of June 30, 2016
Consolidated Statement of Income – 71 Consolidated Statement of Comprehensive Income – 72 Consolidated Balance Sheet – 73
Consolidated Statement of Changes in Equity – 74 Consolidated Statement of Cash Flows – 76
Consolidated Statement of Income (unaudited)
Income Statement Three months ended Six months ended in € m. Jun 30, 2016 Jun 30, 2015 Jun 30, 2016 Jun 30, 2015 Interest and similar income 6,721 6,936 12,753 13,393
Interest expense 3,029 2,815 5,136 5,062
Net interest income 3,693 4,122 7,617 8,332
Provision for credit losses 259 151 564 369
Net interest income after provision for credit losses 3,433 3,971 7,053 7,963
Commissions and fee income 2,921 3,464 5,798 6,727
Net gains (losses) on financial assets/liabilities at fair value through profit or loss 424 1,433 1,721 3,579
Net gains (losses) on financial assets available for sale 244 52 364 238
Net income (loss) from equity method investments 246 220 352 421
Net income (loss) from securities held to maturity 0 0 0 0
Other income (142) (114) (399) 256
Total noninterest income 3,693 5,056 7,837 11,221
Compensation and benefits 2,959 3,447 6,153 6,880
General and administrative expenses 3,221 4,335 6,957 9,404
Policyholder benefits and claims 74 10 118 163
Impairment of goodwill and other intangible assets 285 0 285 0
Restructuring activities 179 6 390 29
Total noninterest expenses 6,718 7,798 13,903 16,476
Income (loss) before income taxes 408 1,228 987 2,708
Income tax expense (benefit) 388 410 731 1,331
Net income (loss) 20 818 256 1,377
Net income (loss) attributable to noncontrolling interests 2 22 24 38
Net income (loss) attributable to Deutsche Bank shareholders and additional equity components 18 796 232 1,339
Earnings per Common Share
Three months ended Six months ended Jun 30, 2016 Jun 30, 2015 Jun 30, 2016 Jun 30, 2015 Earnings per common share:1
Basic €(0.19) €0.41 €(0.03) €0.80
Diluted €(0.19) €0.40 €(0.03) €0.78
Number of shares in million:
Denominator for basic earnings per share – weighted-average shares outstanding 1,387.4 1,396.7 1,386.9 1,390.8
Denominator for diluted earnings per share – adjusted weighted-average shares after assumed conversions2 1,387.4 1,420.6 1,386.9 1,419.0
1 Earnings were adjusted by € 276 million and € 228 million net of tax for the coupons paid on Additional Tier 1 Notes in April 2016 and April 2015, respectively. In accordance with IAS 33 the coupons paid on Additional Tier 1 Notes are not attributable to Deutsche Bank shareholders and therefore need to be deducted in the 2 calculation. This adjustment created a net loss situation for Earnings per Common Share for the three and six months ended June 30, 2016.
2 Due to the net loss situation for the three and six months ended June 30, 2016 potentially dilutive shares are generally not considered for the EPS calculation, because to do so would decrease the net loss per share. Under a net income situation however, the number of adjusted weighted average shares after assumed conversion would have been increased by 24.5 million shares and 18.7 million shares for the three and six months ended June 30, 2016.
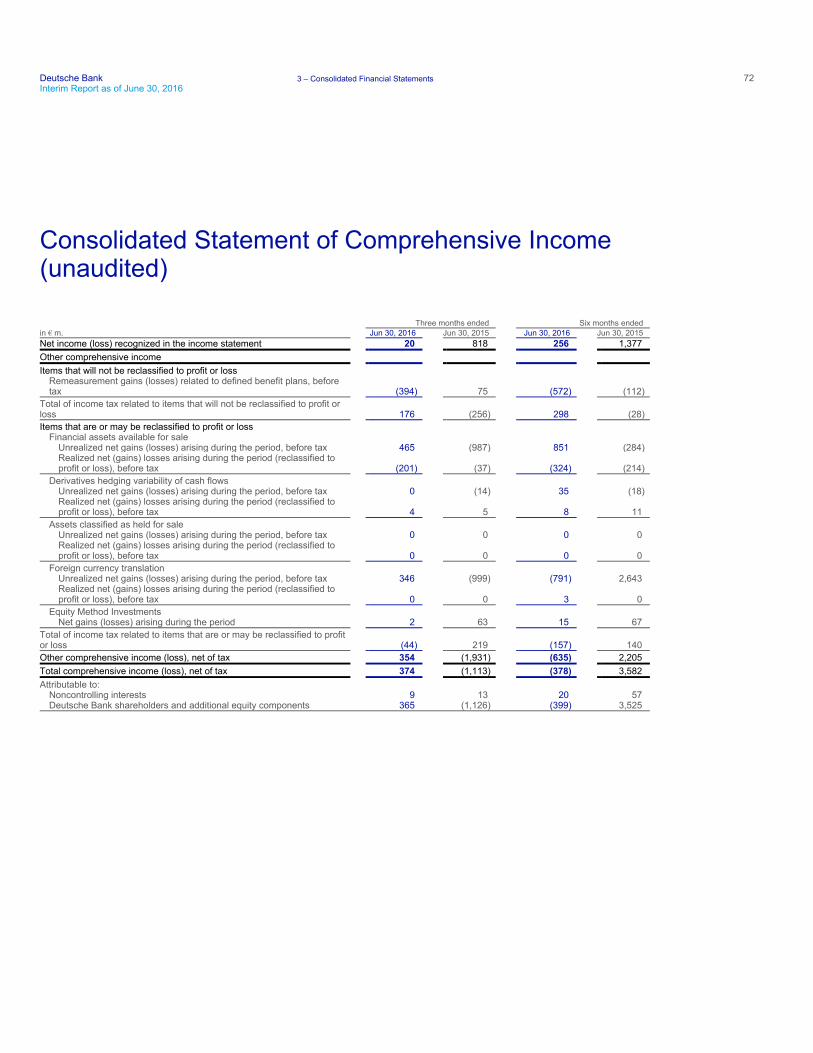
Deutsche Bank 3 – Consolidated Financial Statements 72Interim Report as of June 30, 2016
Consolidated Statement of Comprehensive Income (unaudited)
Three months ended Six months ended in € m. Jun 30, 2016 Jun 30, 2015 Jun 30, 2016 Jun 30, 2015 Net income (loss) recognized in the income statement 20 818 256 1,377
Other comprehensive income
Items that will not be reclassified to profit or loss Remeasurement gains (losses) related to defined benefit plans, before tax (394) 75 (572) (112)
Total of income tax related to items that will not be reclassified to profit or loss 176 (256) 298 (28)
Items that are or may be reclassified to profit or loss Financial assets available for sale
Unrealized net gains (losses) arising during the period, before tax 465 (987) 851 (284) Realized net (gains) losses arising during the period (reclassified to profit or loss), before tax (201) (37) (324) (214)
Derivatives hedging variability of cash flows Unrealized net gains (losses) arising during the period, before tax 0 (14) 35 (18) Realized net (gains) losses arising during the period (reclassified to profit or loss), before tax 4 5 8 11
Assets classified as held for sale Unrealized net gains (losses) arising during the period, before tax 0 0 0 0 Realized net (gains) losses arising during the period (reclassified to profit or loss), before tax 0 0 0 0
Foreign currency translation Unrealized net gains (losses) arising during the period, before tax 346 (999) (791) 2,643 Realized net (gains) losses arising during the period (reclassified to profit or loss), before tax 0 0 3 0
Equity Method Investments Net gains (losses) arising during the period 2 63 15 67
Total of income tax related to items that are or may be reclassified to profit or loss (44) 219 (157) 140
Other comprehensive income (loss), net of tax 354 (1,931) (635) 2,205
Total comprehensive income (loss), net of tax 374 (1,113) (378) 3,582
Attributable to: Noncontrolling interests 9 13 20 57 Deutsche Bank shareholders and additional equity components 365 (1,126) (399) 3,525
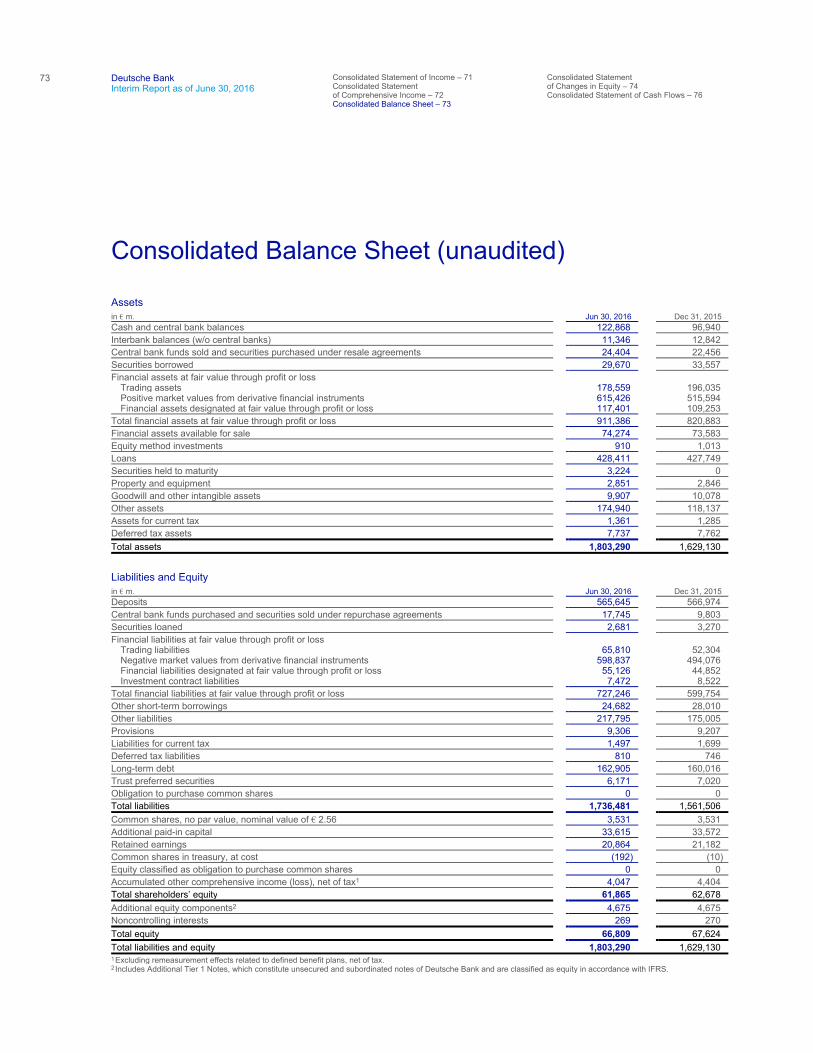
73
Deutsche Bank Interim Report as of June 30, 2016
Consolidated Statement of Income – 71 Consolidated Statement of Comprehensive Income – 72 Consolidated Balance Sheet – 73
Consolidated Statement of Changes in Equity – 74 Consolidated Statement of Cash Flows – 76
Consolidated Balance Sheet (unaudited)
Assets
Liabilities and Equity
in € m. Jun 30, 2016 Dec 31, 2015 Cash and central bank balances 122,868 96,940
Interbank balances (w/o central banks) 11,346 12,842
Central bank funds sold and securities purchased under resale agreements 24,404 22,456
Securities borrowed 29,670 33,557
Financial assets at fair value through profit or loss Trading assets 178,559 196,035 Positive market values from derivative financial instruments 615,426 515,594 Financial assets designated at fair value through profit or loss 117,401 109,253
Total financial assets at fair value through profit or loss 911,386 820,883
Financial assets available for sale 74,274 73,583
Equity method investments 910 1,013
Loans 428,411 427,749
Securities held to maturity 3,224 0
Property and equipment 2,851 2,846
Goodwill and other intangible assets 9,907 10,078
Other assets 174,940 118,137
Assets for current tax 1,361 1,285
Deferred tax assets 7,737 7,762
Total assets 1,803,290 1,629,130
in € m. Jun 30, 2016 Dec 31, 2015 Deposits 565,645 566,974
Central bank funds purchased and securities sold under repurchase agreements 17,745 9,803
Securities loaned 2,681 3,270
Financial liabilities at fair value through profit or loss Trading liabilities 65,810 52,304 Negative market values from derivative financial instruments 598,837 494,076 Financial liabilities designated at fair value through profit or loss 55,126 44,852 Investment contract liabilities 7,472 8,522
Total financial liabilities at fair value through profit or loss 727,246 599,754
Other short-term borrowings 24,682 28,010
Other liabilities 217,795 175,005
Provisions 9,306 9,207
Liabilities for current tax 1,497 1,699
Deferred tax liabilities 810 746
Long-term debt 162,905 160,016
Trust preferred securities 6,171 7,020
Obligation to purchase common shares 0 0
Total liabilities 1,736,481 1,561,506
Common shares, no par value, nominal value of € 2.56 3,531 3,531
Additional paid-in capital 33,615 33,572
Retained earnings 20,864 21,182
Common shares in treasury, at cost (192) (10)
Equity classified as obligation to purchase common shares 0 0
Accumulated other comprehensive income (loss), net of tax1 4,047 4,404
Total shareholders’ equity 61,865 62,678
Additional equity components2 4,675 4,675
Noncontrolling interests 269 270
Total equity 66,809 67,624
Total liabilities and equity 1,803,290 1,629,130
1Excluding remeasurement effects related to defined benefit plans, net of tax. 2 Includes Additional Tier 1 Notes, which constitute unsecured and subordinated notes of Deutsche Bank and are classified as equity in accordance with IFRS.
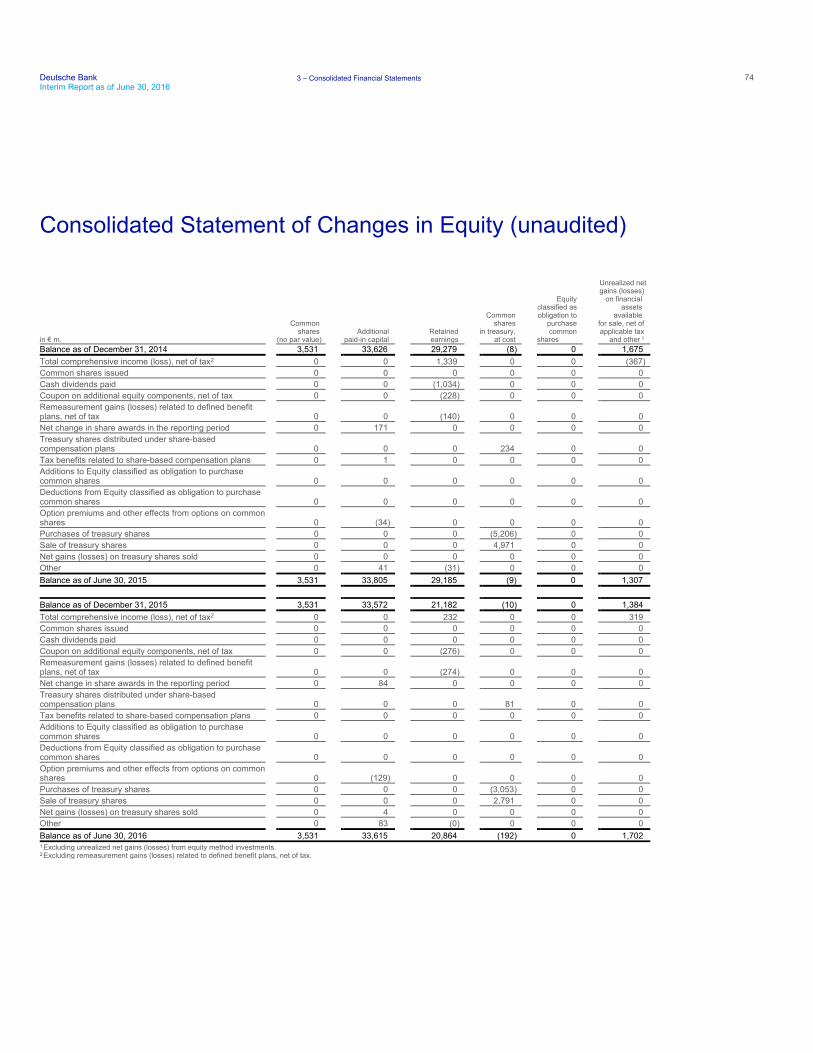
Deutsche Bank 3 – Consolidated Financial Statements 74Interim Report as of June 30, 2016
Consolidated Statement of Changes in Equity (unaudited)
in € m.
Common shares
(no par value) Additional
paid-in capital Retained earnings
Common shares
in treasury, at cost
Equity classified as obligation to
purchase common
shares
Unrealized net gains (losses)
on financial assets
available for sale, net of applicable tax
and other 1 Balance as of December 31, 2014 3,531 33,626 29,279 (8) 0 1,675
Total comprehensive income (loss), net of tax2 0 0 1,339 0 0 (367)
Common shares issued 0 0 0 0 0 0
Cash dividends paid 0 0 (1,034) 0 0 0
Coupon on additional equity components, net of tax 0 0 (228) 0 0 0
Remeasurement gains (losses) related to defined benefit plans, net of tax 0 0 (140) 0 0 0
Net change in share awards in the reporting period 0 171 0 0 0 0
Treasury shares distributed under share-based compensation plans 0 0 0 234 0 0
Tax benefits related to share-based compensation plans 0 1 0 0 0 0
Additions to Equity classified as obligation to purchase common shares 0 0 0 0 0 0
Deductions from Equity classified as obligation to purchase common shares 0 0 0 0 0 0
Option premiums and other effects from options on common shares 0 (34) 0 0 0 0
Purchases of treasury shares 0 0 0 (5,206) 0 0
Sale of treasury shares 0 0 0 4,971 0 0
Net gains (losses) on treasury shares sold 0 0 0 0 0 0
Other 0 41 (31) 0 0 0
Balance as of June 30, 2015 3,531 33,805 29,185 (9) 0 1,307
Balance as of December 31, 2015 3,531 33,572 21,182 (10) 0 1,384
Total comprehensive income (loss), net of tax2 0 0 232 0 0 319
Common shares issued 0 0 0 0 0 0
Cash dividends paid 0 0 0 0 0 0
Coupon on additional equity components, net of tax 0 0 (276) 0 0 0
Remeasurement gains (losses) related to defined benefit plans, net of tax 0 0 (274) 0 0 0
Net change in share awards in the reporting period 0 84 0 0 0 0
Treasury shares distributed under share-based compensation plans 0 0 0 81 0 0
Tax benefits related to share-based compensation plans 0 0 0 0 0 0
Additions to Equity classified as obligation to purchase common shares 0 0 0 0 0 0
Deductions from Equity classified as obligation to purchase common shares 0 0 0 0 0 0
Option premiums and other effects from options on common shares 0 (129) 0 0 0 0
Purchases of treasury shares 0 0 0 (3,053) 0 0
Sale of treasury shares 0 0 0 2,791 0 0
Net gains (losses) on treasury shares sold 0 4 0 0 0 0
Other 0 83 (0) 0 0 0
Balance as of June 30, 2016 3,531 33,615 20,864 (192) 0 1,702
1Excluding unrealized net gains (losses) from equity method investments. 2Excluding remeasurement gains (losses) related to defined benefit plans, net of tax.
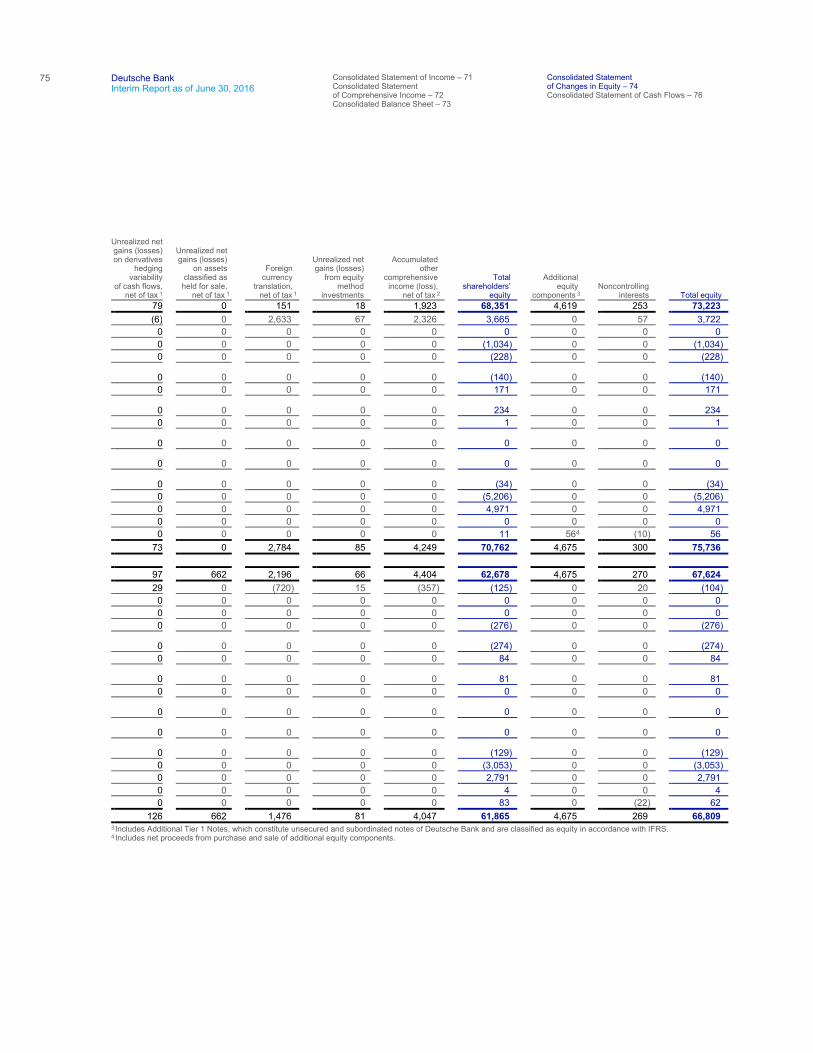
75
Deutsche Bank Interim Report as of June 30, 2016
Consolidated Statement of Income – 71 Consolidated Statement of Comprehensive Income – 72 Consolidated Balance Sheet – 73
Consolidated Statement of Changes in Equity – 74 Consolidated Statement of Cash Flows – 76
Unrealized netgains (losses)on derivatives
hedgingvariability
of cash flows,net of tax 1
Unrealized net gains (losses)
on assets classified as
held for sale, net of tax 1
Foreign currency
translation, net of tax 1
Unrealized net gains (losses)
from equity method
investments
Accumulated other
comprehensive income (loss),
net of tax 2
Total shareholders’
equity
Additional equity
components 3 Noncontrolling
interests Total equity 79 0 151 18 1,923 68,351 4,619 253 73,223
(6) 0 2,633 67 2,326 3,665 0 57 3,722
0 0 0 0 0 0 0 0 0
0 0 0 0 0 (1,034) 0 0 (1,034)
0 0 0 0 0 (228) 0 0 (228)
0 0 0 0 0 (140) 0 0 (140)
0 0 0 0 0 171 0 0 171
0 0 0 0 0 234 0 0 234
0 0 0 0 0 1 0 0 1
0 0 0 0 0 0 0 0 0
0 0 0 0 0 0 0 0 0
0 0 0 0 0 (34) 0 0 (34)
0 0 0 0 0 (5,206) 0 0 (5,206)
0 0 0 0 0 4,971 0 0 4,971
0 0 0 0 0 0 0 0 0
0 0 0 0 0 11 564 (10) 56
73 0 2,784 85 4,249 70,762 4,675 300 75,736
97 662 2,196 66 4,404 62,678 4,675 270 67,624
29 0 (720) 15 (357) (125) 0 20 (104)
0 0 0 0 0 0 0 0 0
0 0 0 0 0 0 0 0 0
0 0 0 0 0 (276) 0 0 (276)
0 0 0 0 0 (274) 0 0 (274)
0 0 0 0 0 84 0 0 84
0 0 0 0 0 81 0 0 81
0 0 0 0 0 0 0 0 0
0 0 0 0 0 0 0 0 0
0 0 0 0 0 0 0 0 0
0 0 0 0 0 (129) 0 0 (129)
0 0 0 0 0 (3,053) 0 0 (3,053)
0 0 0 0 0 2,791 0 0 2,791
0 0 0 0 0 4 0 0 4
0 0 0 0 0 83 0 (22) 62
126 662 1,476 81 4,047 61,865 4,675 269 66,809
3 Includes Additional Tier 1 Notes, which constitute unsecured and subordinated notes of Deutsche Bank and are classified as equity in accordance with IFRS. 4 Includes net proceeds from purchase and sale of additional equity components.
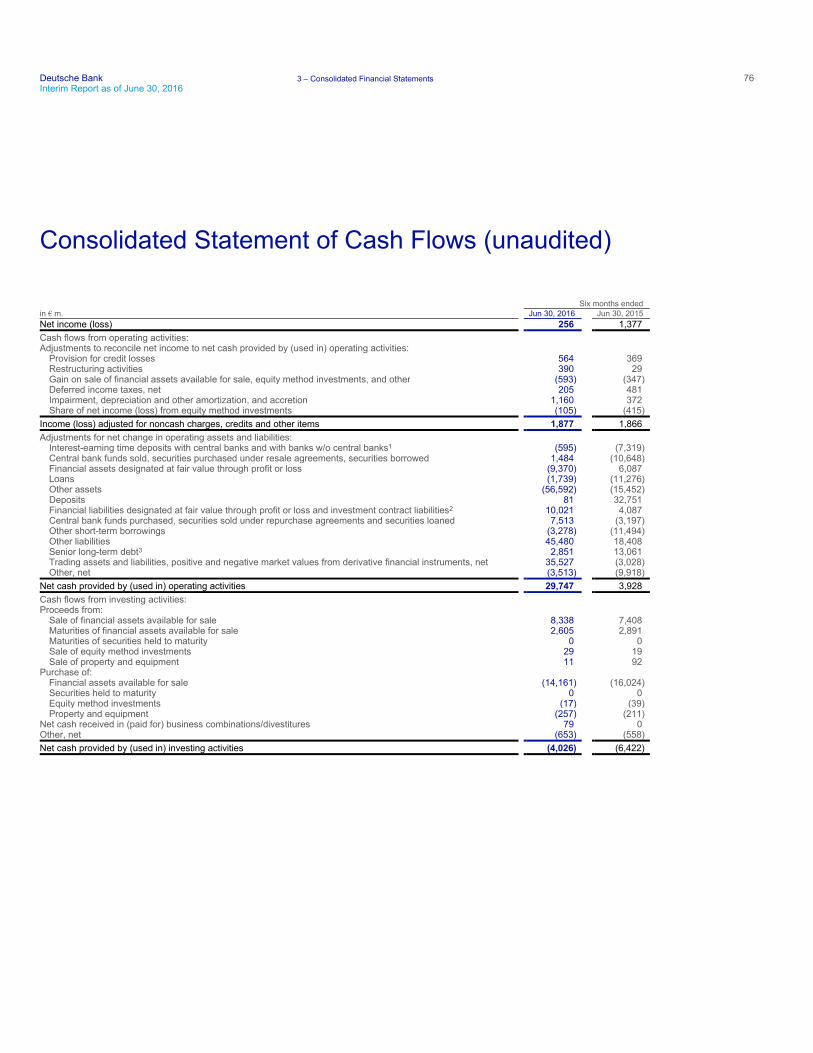
Deutsche Bank 3 – Consolidated Financial Statements 76Interim Report as of June 30, 2016
Consolidated Statement of Cash Flows (unaudited)
Six months ended in € m. Jun 30, 2016 Jun 30, 2015 Net income (loss) 256 1,377
Cash flows from operating activities: Adjustments to reconcile net income to net cash provided by (used in) operating activities:
Provision for credit losses 564 369 Restructuring activities 390 29 Gain on sale of financial assets available for sale, equity method investments, and other (593) (347) Deferred income taxes, net 205 481 Impairment, depreciation and other amortization, and accretion 1,160 372 Share of net income (loss) from equity method investments (105) (415)
Income (loss) adjusted for noncash charges, credits and other items 1,877 1,866
Adjustments for net change in operating assets and liabilities: Interest-earning time deposits with central banks and with banks w/o central banks1 (595) (7,319) Central bank funds sold, securities purchased under resale agreements, securities borrowed 1,484 (10,648) Financial assets designated at fair value through profit or loss (9,370) 6,087 Loans (1,739) (11,276) Other assets (56,592) (15,452) Deposits 81 32,751 Financial liabilities designated at fair value through profit or loss and investment contract liabilities2 10,021 4,087 Central bank funds purchased, securities sold under repurchase agreements and securities loaned 7,513 (3,197) Other short-term borrowings (3,278) (11,494) Other liabilities 45,480 18,408 Senior long-term debt3 2,851 13,061 Trading assets and liabilities, positive and negative market values from derivative financial instruments, net 35,527 (3,028) Other, net (3,513) (9,918)
Net cash provided by (used in) operating activities 29,747 3,928
Cash flows from investing activities: Proceeds from:
Sale of financial assets available for sale 8,338 7,408 Maturities of financial assets available for sale 2,605 2,891 Maturities of securities held to maturity 0 0 Sale of equity method investments 29 19 Sale of property and equipment 11 92
Purchase of: Financial assets available for sale (14,161) (16,024) Securities held to maturity 0 0 Equity method investments (17) (39) Property and equipment (257) (211)
Net cash received in (paid for) business combinations/divestitures 79 0 Other, net (653) (558)
Net cash provided by (used in) investing activities (4,026) (6,422)
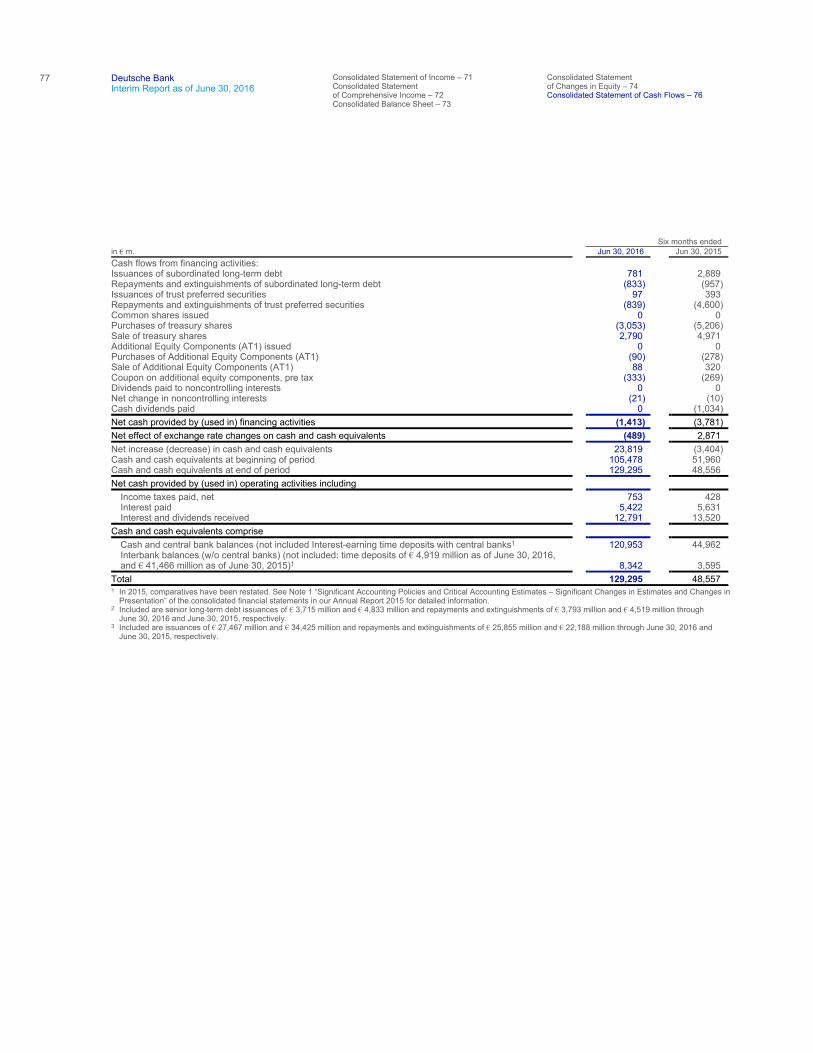
77
Deutsche Bank Interim Report as of June 30, 2016
Consolidated Statement of Income – 71 Consolidated Statement of Comprehensive Income – 72 Consolidated Balance Sheet – 73
Consolidated Statement of Changes in Equity – 74 Consolidated Statement of Cash Flows – 76
Six months ended in € m. Jun 30, 2016 Jun 30, 2015 Cash flows from financing activities: Issuances of subordinated long-term debt 781 2,889 Repayments and extinguishments of subordinated long-term debt (833) (957) Issuances of trust preferred securities 97 393 Repayments and extinguishments of trust preferred securities (839) (4,600) Common shares issued 0 0 Purchases of treasury shares (3,053) (5,206) Sale of treasury shares 2,790 4,971 Additional Equity Components (AT1) issued 0 0 Purchases of Additional Equity Components (AT1) (90) (278) Sale of Additional Equity Components (AT1) 88 320 Coupon on additional equity components, pre tax (333) (269) Dividends paid to noncontrolling interests 0 0 Net change in noncontrolling interests (21) (10) Cash dividends paid 0 (1,034)
Net cash provided by (used in) financing activities (1,413) (3,781)
Net effect of exchange rate changes on cash and cash equivalents (489) 2,871
Net increase (decrease) in cash and cash equivalents 23,819 (3,404) Cash and cash equivalents at beginning of period 105,478 51,960 Cash and cash equivalents at end of period 129,295 48,556
Net cash provided by (used in) operating activities including
Income taxes paid, net 753 428 Interest paid 5,422 5,631 Interest and dividends received 12,791 13,520
Cash and cash equivalents comprise
Cash and central bank balances (not included Interest-earning time deposits with central banks1 120,953 44,962 Interbank balances (w/o central banks) (not included: time deposits of € 4,919 million as of June 30, 2016, and € 41,466 million as of June 30, 2015)1 8,342 3,595
Total 129,295 48,557
1 In 2015, comparatives have been restated. See Note 1 “Significant Accounting Policies and Critical Accounting Estimates – Significant Changes in Estimates and Changes in Presentation” of the consolidated financial statements in our Annual Report 2015 for detailed information.
2 Included are senior long-term debt issuances of € 3,715 million and € 4,833 million and repayments and extinguishments of € 3,793 million and € 4,519 million through June 30, 2016 and June 30, 2015, respectively.
3 Included are issuances of € 27,467 million and € 34,425 million and repayments and extinguishments of € 25,855 million and € 22,188 million through June 30, 2016 and June 30, 2015, respectively.
Deutsche Bank 4 – Notes to the Consolidated Financial Statements 78Interim Report as of June 30, 2016
Basis of Preparation (unaudited)
The accompanying condensed consolidated interim financial statements, which include Deutsche Bank AG and its subsidiaries (collectively the “Group”), are stated in euros, the presentation currency of the Group. They are presented in accordance with the requirements of IAS 34, “Interim Financial Reporting”, and have been prepared in accordance with International Financial Reporting Standards (“IFRS”) as issued by the International Accounting Standards Board (“IASB”) and endorsed by the European Union (“EU”). The Group’s application of IFRS results in no differences between IFRS as issued by the IASB and IFRS as endorsed by the EU.
Some IFRS disclosures incorporated in the Management Report are an integral part of the consolidated interim financial statements. These include the Segmental Results of Operations of the Segmental Information note which is presented in the Operating and Financial Review: Segmental Results of the Management Report. The presentation of this information is in compliance with IAS 34 and IFRS 8, “Operating Segments”.
Deutsche Bank’s condensed consolidated interim financial statements are unaudited and include supplementary disclosures on segment information, which was restated in the first quarter 2016 to reflect Deutsche Bank’s new structure and business operations. The condensed consolidated interim financial statements also include supplementary disclosures on the income statement, balance sheet and other financial information. They should be read in conjunction with the audited consolidated financial statements of Deutsche Bank for 2015, for which the same accounting policies and critical accounting estimates have been applied with the exception of the newly adopted accounting pronouncements outlined in section “Impact of Changes in Accounting Principles”.
The preparation of financial statements under IFRS requires management to make estimates and assumptions for certain categories of assets and liabilities.
These estimates and assumptions affect the reported amounts of assets and liabilities and disclosure of contingent assets and liabilities at the balance sheet date, and the reported amounts of revenue and expenses during the reporting period. Actual results could differ from management’s estimates and the results reported should not be regarded as necessarily indicative of results that may be expected for the entire year.
79
Deutsche Bank Interim Report as of June 30, 2016
Basis of Preparation – 78 Impact of Changes in Accountion Principles – 79 Segment Information – 82
Information on the Consolidated Income Statement – 85 Information on the Consolidated Balance Sheet – 88 Other Financial Information – 123
Impact of Changes in Accounting Principles (unaudited)
Recently Adopted Accounting Pronouncements The following are those accounting pronouncements which are relevant to the Group and which have been applied in the preparation of these condensed consolidated interim financial statements.
IAS 1
On January 1, 2016, the Group adopted the amendments to IAS 1 “Presentation of Financial Statements”, which resulted as part of an initiative to improve presentation and disclosure in financial reports. These amendments clarify that the principle of materiality is applicable to the whole of the financial statements, professional judgment should be applied in determining disclosures and that inclusion of immaterial data can reduce the effectiveness of disclosures. The amendments did not have a material impact on the Group’s consolidated financial statements.
Improvements to IFRS 2012-2014 Cycle
On January 1, 2016, the Group adopted amendments to multiple IFRS standards, which resulted from the IASB’s annual improvement projects for the 2012-2014 cycle. They comprise amendments that result in accounting changes for presentation, recognition or measurement purposes as well as terminology or editorial amendments related to a variety of individual IFRS standards. The amendments did not have a material impact on the Group’s consolidated financial statements.
New Accounting Pronouncements The following accounting pronouncements which are relevant to the Group were not effective as of June 30, 2016 and therefore have not been applied in preparing these condensed consolidated interim financial statements.
IFRS 2 Share-based Payments
In June 2016, the IASB issued narrow-scope amendments to IFRS 2, “Share-based Payment” which clarify the accounting for certain types of share-based payment transactions. The amendments which were developed through the IFRS Interpretations Committee clarify the accounting for cash-settled share-based payment transactions that include a performance condition, the classification of share-based payment transactions with net settlement features and the accounting for modifications of share-based payment transactions from cash-settled to equity-settled. They are effective for annual periods beginning on or after January 1, 2018. The Group is currently assessing the impact of the clarifications to IFRS 2. The amendments have yet to be endorsed by the EU.
Deutsche Bank 4 – Notes to the Consolidated Financial Statements 80Interim Report as of June 30, 2016
IFRS 9 Financial Instruments
In July 2014, the IASB issued IFRS 9 “Financial Instruments”, which replaces IAS 39, “Financial Instruments: Recognition and Measurement”. IFRS 9 introduces new requirements for how an entity should classify and measure financial assets, requires changes to the reporting of ‘own credit’ with respect to issued debt liabilities that are designated at fair value, replaces the current rules for impairment of financial assets and amends the requirements for hedge accounting. IFRS 9 is effective for annual periods beginning on or after January 1, 2018. The Group is currently assessing the impact of IFRS 9. The standard has yet to be endorsed by the EU.
The Group has implemented a centrally managed IFRS 9 program sponsored by the Group’s chief financial officer and includes subject matter experts on methodology, data sourcing and modeling, IT processing and reporting. Overall governance is through the IFRS 9 Steering Committee which includes joint representation from Finance and Risk. Guidance and training on IFRS 9 is delivered across businesses and functions as part of the Group’s internal control system in preparation for IFRS 9 becoming effective for the Group from January 1, 2018.
Classification and Measurement of Financial Assets and Liabilities
IFRS 9 requires that an entity’s business model and a financial instrument’s contractual cash flows will determine its classification and measurement in the financial statements. Upon initial recognition each financial asset will be classified as either fair value through profit or loss (‘FVTPL’), amortized cost, or fair value through Other Comprehensive Income (‘FVOCI’). As these requirements are different than the assessments under the existing IAS 39 rules, some differences to the classification and measurement of financial assets under IAS 39 are expected.
The classification and measurement of financial liabilities remain largely unchanged under IFRS 9 from current requirements. However, where issued debt liabilities are designated at fair value, the fair value movements attributable to an entity’s own credit risk will be recognized in Other Comprehensive Income rather than in the Statement of Income. The standard also allows the election to apply the presentation of fair value movements of an entity’s credit risk in Other Comprehensive Income prior to adopting IFRS 9 in full. The Group has not early adopted these requirements of the standard as IFRS 9 has not been endorsed by the EU yet.
Impairment of Financial Assets
The impairment rules under IFRS 9 will apply to financial assets that are measured at amortized cost or FVOCI, and off balance sheet lending commitments such as loan commitments and financial guarantees. The determination of impairment losses and allowances will move from an incurred credit loss model whereby credit losses are recognized when a ‘trigger’ event occurs under IAS 39 to an expected credit loss model, where provisions are taken upon initial recognition of the financial asset (or the date that the Group becomes a party to the loan commitment or financial guarantee) based on expectations of potential credit losses at that time.
Under the IFRS 9 expected credit loss approach, the Group will recognize expected credit losses resulting from default events that are possible within the next 12 months for both the homogeneous and non-homogeneous performing loan pools (stage 1). IFRS 9 also requires the recognition of credit losses expected over the remaining life of the assets (‘lifetime expected losses’) which have significantly deteriorated in credit quality since origination or purchase but have yet to default (stage 2) and for assets that are credit impaired (stage 3). Under IFRS 9 expected credit losses are measured by taking into account forward-looking information, including macro-economic factors.
81
Deutsche Bank Interim Report as of June 30, 2016
Basis of Preparation – 78 Impact of Changes in Accountion Principles – 79 Segment Information – 82
Information on the Consolidated Income Statement – 85 Information on the Consolidated Balance Sheet – 88 Other Financial Information – 123
As a result of the changes to the impairment rules, IFRS 9 will result in an increase in subjectivity as allowances will be based on reasonable and supportable forward-looking information which probability weights future economic situations that are continuously monitored and updated over the life of the financial asset. This is in contrast to impairment recognition under IAS 39 which requires the occurrence of one or more loss events before an allowance is recorded. IFRS 9 is expected to result in an increase in the overall level of impairment allowances, due to the requirement to record an allowance equal to 12 month expected credit losses on those instruments whose credit risk has not significantly increased since initial recognition and the likelihood that there will be a larger population of financial assets to which lifetime expected losses apply as compared to the population of financial assets for which loss events have already occurred under IAS 39.
Hedge accounting
IFRS 9 also incorporates new hedge accounting rules that intend to align hedge accounting with risk management practices. Generally, some restrictions under current rules have been removed and a greater variety of hedging instruments and hedged items become available for hedge accounting.
IFRS 15 Revenue from Contracts with Customers
In May 2014, the IASB issued IFRS 15, “Revenue from Contracts with Customers”, which specifies how and when revenue is recognized, but does not impact income recognition related to financial instruments in scope of IAS 39/ IFRS 9. IFRS 15 replaces several other IFRS standards and interpretations that currently govern revenue recognition under IFRS and provides a single, principles-based five-step model to be applied to all contracts with customers. The standard also requires entities to provide users of financial statements with more informative and relevant disclosures. IFRS 15 is effective for annual periods beginning on or after January 1, 2018. The Group is currently assessing the impact of IFRS 15. The standard has yet to be endorsed by the EU.
IFRS 16 Leases
In January 2016, the IASB issued IFRS 16, “Leases”, which introduces a single lessee accounting model and requires a lessee to recognize assets and liabilities for all leases with a term of more than 12 months, unless the underlying asset is of low value. A lessee is required to recognize a right-of-use asset representing its right to use the underlying leased asset and a lease liability representing its obligation to make lease payments. There will be only minor changes to the current accounting for lessors. The standard also requires entities to provide users of financial statements with more informative and relevant disclosures. IFRS 16 is effective for annual periods beginning on or after January 1, 2019. The Group is currently assessing the impact of IFRS 16. The standard has yet to be endorsed by the EU.
Deutsche Bank 4 – Notes to the Consolidated Financial Statements 82Interim Report as of June 30, 2016
Segment Information (unaudited)
The following segment information has been prepared in accordance with the “management approach”, which requires presentation of the segments on the basis of the internal management reports of the entity which are regularly reviewed by the chief operating decision maker, which is the Deutsche Bank Management Board, in order to allocate resources to a segment and to assess its financial performance.
Business Segments The Group’s segment reporting follows the organizational structure as reflected in its internal management reporting systems, which are the basis for assessing the financial performance of the business segments and for allocating resources to the business segments. Generally, restatements due to changes in the organizational structure were implemented in the presentation of prior period comparables if they were considered in the Group’s management reporting systems.
From 2016 onwards and in accordance with our Strategy 2020 our business operations have been organized under the following segments:
The key changes in 2016 are outlined below.
Global Markets (“GM”) – Effective from first quarter of 2016, GM included the sales and trading related activities of our former Corporate Banking & Securities (“CB&S”) segment. Revenues related to certain financing activities previously included within “Loan Products” in CB&S were included within “Sales &Trading—debt and other products”. Mark-to-market gains/losses relating to RWA mitigation on Credit Valuation Adjustment (CVA) RWA, Funding Valuation Adjustment (FVA) and certain CVA calculation methodology refinements previously reported under “Sales & Trading” revenues were included in “Other”. Debt Valuation Adjustment (DVA) continued to be reported within “Other”. This category also included transfers from and to our segment Corporate & Investment Banking (“CIB”) resulting from client coverage and product distribution. Additionally in the second quarter the transfer of businesses from Deutsche AM to GM resulted in the re-assignment of goodwill based on relative values in accordance with IFRS. The subsequent impairment review led to an impairment loss of € 285 million in Global Markets.
Corporate & Investment Banking (“CIB”) – Effective from first quarter of 2016, CIB combined the Corporate Finance business components of our former Corporate Banking and Securities (“CB&S”) and Global Transaction Banking (“GTB”) businesses. Transfers from and to our segment Global Markets related to client coverage and product distribution were included in “Loan Products & Other”.
– Global Markets (“GM”), – Corporate & Investment Banking (“CIB”), – Private, Wealth and Commercial Clients (“PW&CC”), – Deutsche Asset Management (“Deutsche AM”), – Postbank (“PB”) and – Non-core Operations Unit (“NCOU”)
83
Deutsche Bank Interim Report as of June 30, 2016
Basis of Preparation – 78 Impact of Changes in Accountion Principles – 79 Segment Information – 82
Information on the Consolidated Income Statement – 85 Information on the Consolidated Balance Sheet – 88 Other Financial Information – 123
Private, Wealth and Commercial Clients (“PW&CC”) – Within the segment PW&CC, in the first quarter of 2016, we had combined our German and International Private and Commercial Clients (“PCC”) businesses formerly included in the Private & Business Clients (“PBC”) segment with the Wealth Management (“WM”) activities formerly included in Deutsche Asset & Wealth management (“DeAWM”). Revenues from Hua Xia Bank are presented separately within PW&CC to reflect the expected disposal of this investment as part of our Strategy 2020.
Deutsche Asset Management (“Deutsche AM”) –Since the first quarter of 2016, Deutsche AM contained the Asset Management activities included in our former DeAWM segment and focused on providing investment solutions to institutions and intermediaries that serve individual clients. In the second quarter of 2016 the transfer of businesses to GM resulted in a re-assignment of, goodwill from Deutsche AM to GM based on relative values in accordance with IFRS.
Postbank (“PB”) – To reflect the planned deconsolidation as formulated in our Strategy 2020, effective from first quarter of 2016, PB was presented as a separate segment, which combined both core components and non-core components of Postbank previously recorded in our NCOU segment. The reported numbers in the Postbank segment will deviate from Postbank’s stand-alone reporting as a consequence of consolidation effects and the impact of purchase price allocation items.
Non-core Operations Unit (“NCOU”) – As a key change compared to our former structure, effective from first quarter 2016, our NCOU segment no longer contains the aforementioned non-core components related to Postbank.
The goodwill impairment losses in our 2015 results related to CB&S and PBC were allocated to the new segments Global Markets/Corporate & Investment Banking and PW&CC/Postbank respectively based on the goodwill balances related to these business units prior to the third quarter of 2015 impairment.
Certain Liquidity Management activities previously included within our business segments are centrally managed by Treasury and therefore have been transferred to Consolidation & Adjustments, since first quarter of 2016, and are reflected in our business segments on an allocated basis. In the second quarter of 2016, the Liquidity Portfolio business of Asia excluding Japan has been transferred from Global Markets to Treasury.
The bank levy for the Single Resolution Fund (SRF) was recognized with its full annual amount directly in the business segments in the first quarter. Consequently, there will be no accrual over the year in the business segments and no recognition of a timing effect in Consolidation & Adjustments. We have restated the prior period to reflect this changed timing in the segments.
In the first quarter of 2016, a stricter definition for Invested Assets became effective and Client Assets were introduced as additional metric. Accordingly, Invested Assets include assets held on behalf of customers for investment purposes and/or client assets that are managed by DB on a discretionary or advisory basis and/or assets that are deposited with DB; Client Assets include Invested Assets plus other assets over which DB provides non investment services such as custody, risk management, administration and reporting (including execution only brokerage).
Deutsche Bank 4 – Notes to the Consolidated Financial Statements 84Interim Report as of June 30, 2016
Capital Expenditures and Divestitures
During the first half of 2016, the Group has made the following capital expenditures or divestitures:
In November 2015, Visa Inc. announced a definitive agreement to acquire Visa Europe Limited. As part of this acquisition VISA Europe Limited. has requested all its shareholders, inter alia several Deutsche Bank Group entities, to return their shares against consideration. Deutsche Bank has returned its shares in Visa Europe Limited. in January 2016 and received the cash and preferred shares consideration at closing on June 21, 2016 as well as an entitlement to a deferred cash payment including interest upon the third anniversary of the closing date.
On April 15, 2016 the Group announced an agreement reached with Macquarie Infrastructure Partners III (“MIP III”), a fund managed by Macquarie Infrastructure and Real Assets, to sell Maher Terminals USA, LLC, a multi-user container terminal in Port Elizabeth, New Jersey. Under the transaction, MIP III has agreed to acquire 100 % of Maher Terminals USA, LLC. This is subject to Port Authority and other regulatory approvals. The transaction is not expected to have a material impact on Deutsche Bank’s financials.
Allocation of Average Shareholders’ Equity The total amount of average shareholders’ equity allocated is determined based on the higher of the Group’s overall economic risk exposure and the regulatory capital demand. Starting 2016, the Group refined its capital allocation and moved to allocating average shareholders’ equity instead of average active equity to the business segments. Under the new methodology, capital held against goodwill and other intangibles is now more comprehensively allocated, allowing the determination of allocated tangible shareholders’ equity to reflect the communicated profitability target. The Group’s overall economic risk exposure requirement is driven by our internal capital adequacy thresholds for status “normal” as defined in DB Group’s risk appetite framework. The regulatory capital demand is based on our externally communicated target ratios, i.e. a Common Equity Tier 1 target ratio of 12.5 % (10 % in early 2015 and 11 % from June 2015 onwards) and on a Leverage target ratio of 4.5 % (3.5 % in early 2015 and 5 % from June 2015 onwards) both at a Group level and assuming full implementation of CRR/CRD 4 rules. If the Group exceeds the Common Equity Tier 1 target ratio and the Leverage target ratio, excess average shareholders’ equity is assigned to C&A. The allocation of average shareholders’ equity to business segments reflects the contribution to both aforementioned targets.
Segmental Results of Operations For the results of the business segments, including the reconciliation to the consolidated results of operations under IFRS, please see “Management Report: Operating and Financial Review: Results of Operations: Segment Results of Operations” of this Interim Report.
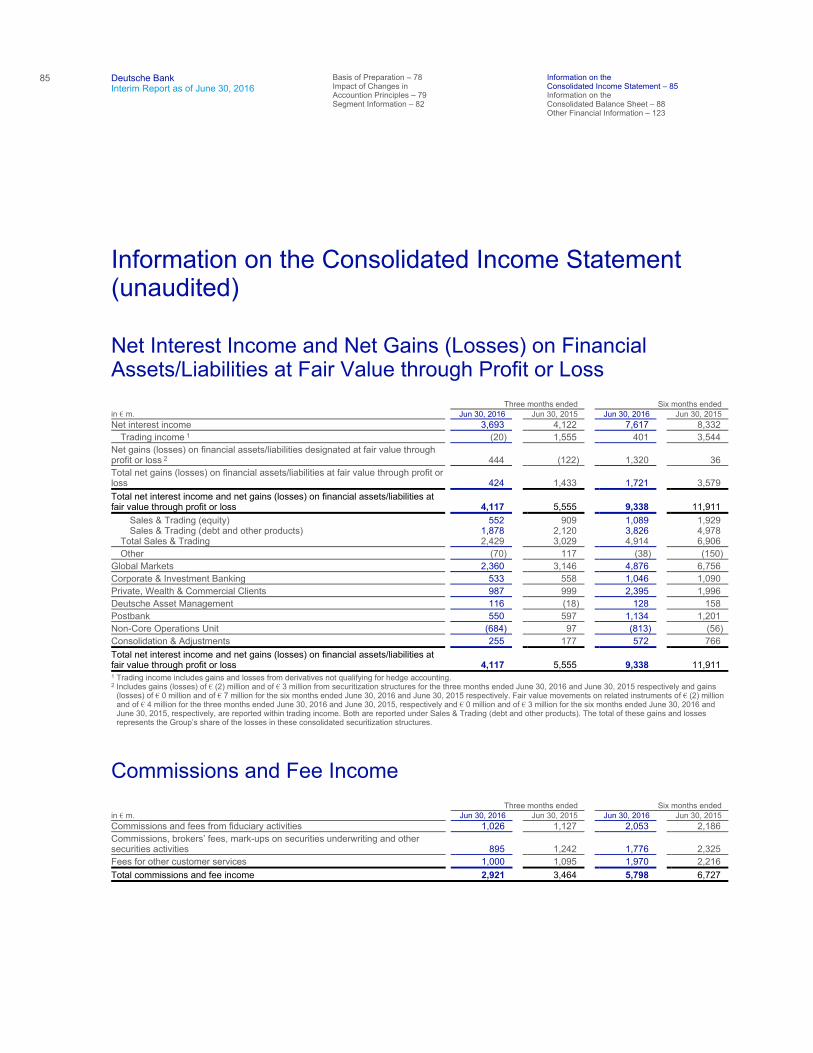
85
Deutsche Bank Interim Report as of June 30, 2016
Basis of Preparation – 78 Impact of Changes in Accountion Principles – 79 Segment Information – 82
Information on the Consolidated Income Statement – 85 Information on the Consolidated Balance Sheet – 88 Other Financial Information – 123
Information on the Consolidated Income Statement (unaudited)
Net Interest Income and Net Gains (Losses) on Financial Assets/Liabilities at Fair Value through Profit or Loss
Commissions and Fee Income
Three months ended Six months ended in € m. Jun 30, 2016 Jun 30, 2015 Jun 30, 2016 Jun 30, 2015 Net interest income 3,693 4,122 7,617 8,332
Trading income 1 (20) 1,555 401 3,544
Net gains (losses) on financial assets/liabilities designated at fair value through profit or loss 2 444 (122) 1,320 36
Total net gains (losses) on financial assets/liabilities at fair value through profit or loss 424 1,433 1,721 3,579
Total net interest income and net gains (losses) on financial assets/liabilities at fair value through profit or loss 4,117 5,555 9,338 11,911
Sales & Trading (equity) 552 909 1,089 1,929 Sales & Trading (debt and other products) 1,878 2,120 3,826 4,978
Total Sales & Trading 2,429 3,029 4,914 6,906
Other (70) 117 (38) (150)
Global Markets 2,360 3,146 4,876 6,756
Corporate & Investment Banking 533 558 1,046 1,090
Private, Wealth & Commercial Clients 987 999 2,395 1,996
Deutsche Asset Management 116 (18) 128 158
Postbank 550 597 1,134 1,201
Non-Core Operations Unit (684) 97 (813) (56)
Consolidation & Adjustments 255 177 572 766
Total net interest income and net gains (losses) on financial assets/liabilities at fair value through profit or loss 4,117 5,555 9,338 11,911
1 Trading income includes gains and losses from derivatives not qualifying for hedge accounting. 2 Includes gains (losses) of € (2) million and of € 3 million from securitization structures for the three months ended June 30, 2016 and June 30, 2015 respectively and gains
(losses) of € 0 million and of € 7 million for the six months ended June 30, 2016 and June 30, 2015 respectively. Fair value movements on related instruments of € (2) million and of € 4 million for the three months ended June 30, 2016 and June 30, 2015, respectively and € 0 million and of € 3 million for the six months ended June 30, 2016 and June 30, 2015, respectively, are reported within trading income. Both are reported under Sales & Trading (debt and other products). The total of these gains and losses represents the Group’s share of the losses in these consolidated securitization structures.
Three months ended Six months ended in € m. Jun 30, 2016 Jun 30, 2015 Jun 30, 2016 Jun 30, 2015 Commissions and fees from fiduciary activities 1,026 1,127 2,053 2,186
Commissions, brokers’ fees, mark-ups on securities underwriting and other securities activities 895 1,242 1,776 2,325
Fees for other customer services 1,000 1,095 1,970 2,216
Total commissions and fee income 2,921 3,464 5,798 6,727
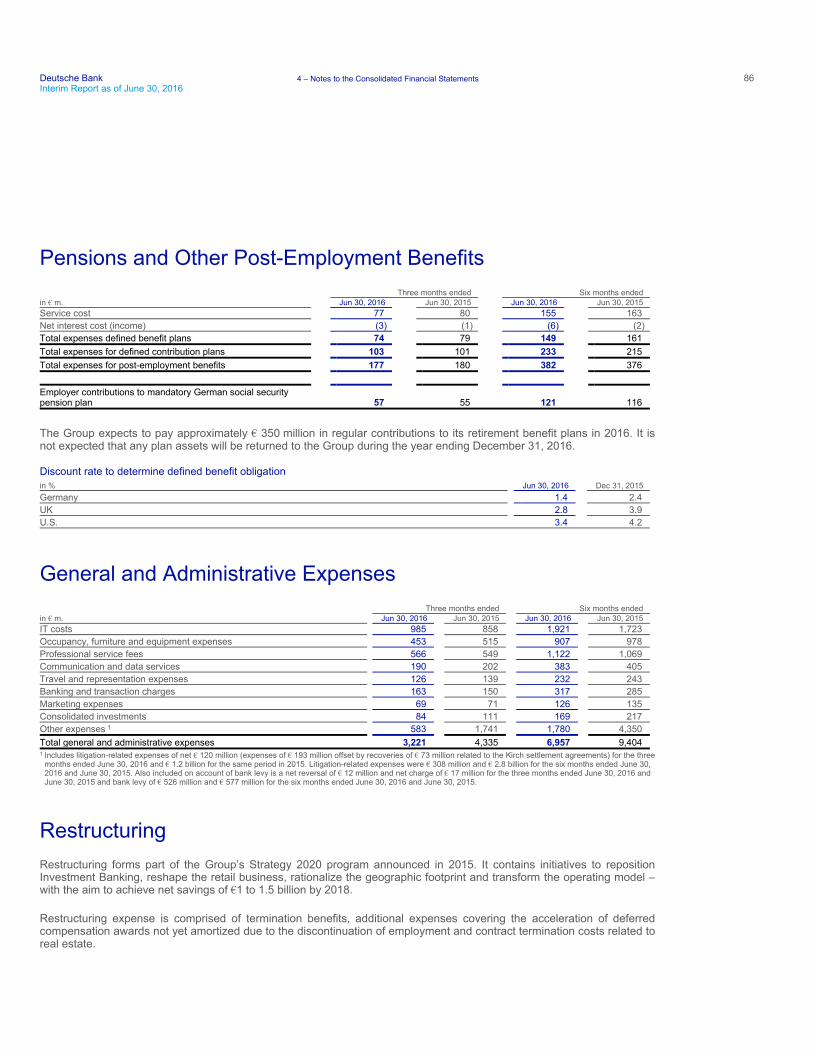
Deutsche Bank 4 – Notes to the Consolidated Financial Statements 86Interim Report as of June 30, 2016
Pensions and Other Post-Employment Benefits
The Group expects to pay approximately € 350 million in regular contributions to its retirement benefit plans in 2016. It is not expected that any plan assets will be returned to the Group during the year ending December 31, 2016.
Discount rate to determine defined benefit obligation
General and Administrative Expenses
Restructuring Restructuring forms part of the Group’s Strategy 2020 program announced in 2015. It contains initiatives to reposition Investment Banking, reshape the retail business, rationalize the geographic footprint and transform the operating model – with the aim to achieve net savings of €1 to 1.5 billion by 2018.
Restructuring expense is comprised of termination benefits, additional expenses covering the acceleration of deferred compensation awards not yet amortized due to the discontinuation of employment and contract termination costs related to real estate.
Three months ended Six months ended in € m. Jun 30, 2016 Jun 30, 2015 Jun 30, 2016 Jun 30, 2015 Service cost 77 80 155 163
Net interest cost (income) (3) (1) (6) (2)
Total expenses defined benefit plans 74 79 149 161
Total expenses for defined contribution plans 103 101 233 215
Total expenses for post-employment benefits 177 180 382 376
Employer contributions to mandatory German social security pension plan 57 55 121 116
in % Jun 30, 2016 Dec 31, 2015
Germany 1.4 2.4
UK 2.8 3.9
U.S. 3.4 4.2
Three months ended Six months ended in € m. Jun 30, 2016 Jun 30, 2015 Jun 30, 2016 Jun 30, 2015 IT costs 985 858 1,921 1,723
Occupancy, furniture and equipment expenses 453 515 907 978
Professional service fees 566 549 1,122 1,069
Communication and data services 190 202 383 405
Travel and representation expenses 126 139 232 243
Banking and transaction charges 163 150 317 285
Marketing expenses 69 71 126 135
Consolidated investments 84 111 169 217
Other expenses 1 583 1,741 1,780 4,350
Total general and administrative expenses 3,221 4,335 6,957 9,404
1 Includes litigation-related expenses of net € 120 million (expenses of € 193 million offset by recoveries of € 73 million related to the Kirch settlement agreements) for the threemonths ended June 30, 2016 and € 1.2 billion for the same period in 2015. Litigation-related expenses were € 308 million and € 2.8 billion for the six months ended June 30, 2016 and June 30, 2015. Also included on account of bank levy is a net reversal of € 12 million and net charge of € 17 million for the three months ended June 30, 2016 and June 30, 2015 and bank levy of € 526 million and € 577 million for the six months ended June 30, 2016 and June 30, 2015.
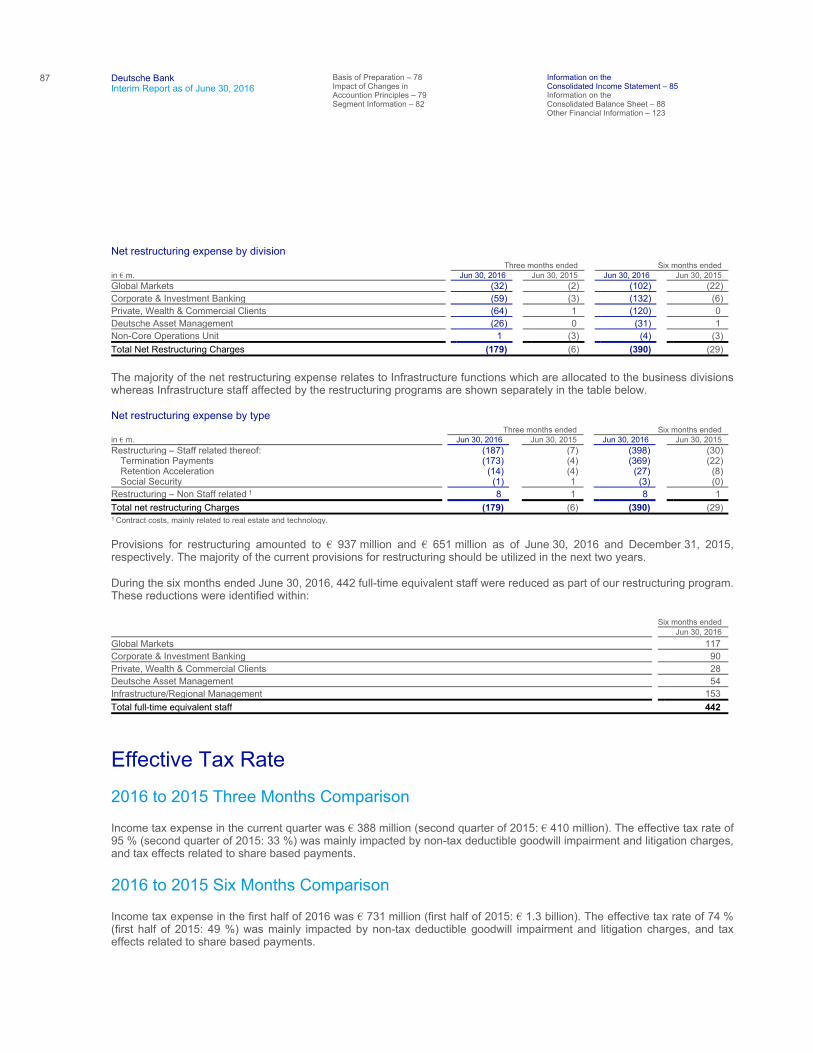
87
Deutsche Bank Interim Report as of June 30, 2016
Basis of Preparation – 78 Impact of Changes in Accountion Principles – 79 Segment Information – 82
Information on the Consolidated Income Statement – 85 Information on the Consolidated Balance Sheet – 88 Other Financial Information – 123
Net restructuring expense by division
The majority of the net restructuring expense relates to Infrastructure functions which are allocated to the business divisions whereas Infrastructure staff affected by the restructuring programs are shown separately in the table below.
Net restructuring expense by type
Provisions for restructuring amounted to € 937 million and € 651 million as of June 30, 2016 and December 31, 2015, respectively. The majority of the current provisions for restructuring should be utilized in the next two years.
During the six months ended June 30, 2016, 442 full-time equivalent staff were reduced as part of our restructuring program. These reductions were identified within:
Effective Tax Rate
2016 to 2015 Three Months Comparison
Income tax expense in the current quarter was € 388 million (second quarter of 2015: € 410 million). The effective tax rate of 95 % (second quarter of 2015: 33 %) was mainly impacted by non-tax deductible goodwill impairment and litigation charges, and tax effects related to share based payments.
2016 to 2015 Six Months Comparison
Income tax expense in the first half of 2016 was € 731 million (first half of 2015: € 1.3 billion). The effective tax rate of 74 % (first half of 2015: 49 %) was mainly impacted by non-tax deductible goodwill impairment and litigation charges, and tax effects related to share based payments.
Three months ended Six months ended in € m. Jun 30, 2016 Jun 30, 2015 Jun 30, 2016 Jun 30, 2015 Global Markets (32) (2) (102) (22)
Corporate & Investment Banking (59) (3) (132) (6)
Private, Wealth & Commercial Clients (64) 1 (120) 0
Deutsche Asset Management (26) 0 (31) 1
Non-Core Operations Unit 1 (3) (4) (3)
Total Net Restructuring Charges (179) (6) (390) (29)
Three months ended Six months ended in € m. Jun 30, 2016 Jun 30, 2015 Jun 30, 2016 Jun 30, 2015 Restructuring – Staff related thereof: (187) (7) (398) (30)
Termination Payments (173) (4) (369) (22) Retention Acceleration (14) (4) (27) (8) Social Security (1) 1 (3) (0)
Restructuring – Non Staff related 1 8 1 8 1
Total net restructuring Charges (179) (6) (390) (29)
1 Contract costs, mainly related to real estate and technology.
Six months ended Jun 30, 2016
Global Markets 117
Corporate & Investment Banking 90
Private, Wealth & Commercial Clients 28
Deutsche Asset Management 54
Infrastructure/Regional Management 153
Total full-time equivalent staff 442
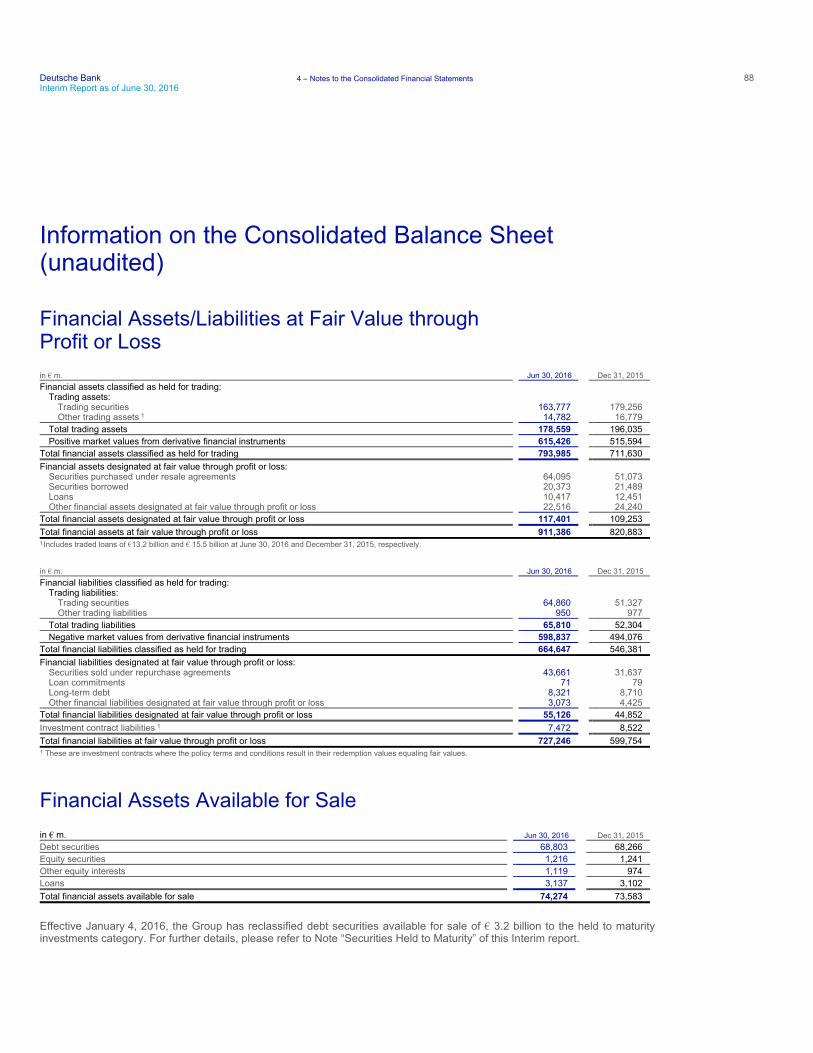
Deutsche Bank 4 – Notes to the Consolidated Financial Statements 88Interim Report as of June 30, 2016
Information on the Consolidated Balance Sheet (unaudited)
Financial Assets/Liabilities at Fair Value through Profit or Loss
Financial Assets Available for Sale
Effective January 4, 2016, the Group has reclassified debt securities available for sale of € 3.2 billion to the held to maturity investments category. For further details, please refer to Note “Securities Held to Maturity” of this Interim report.
in € m. Jun 30, 2016 Dec 31, 2015
Financial assets classified as held for trading: Trading assets:
Trading securities 163,777 179,256 Other trading assets 1 14,782 16,779
Total trading assets 178,559 196,035
Positive market values from derivative financial instruments 615,426 515,594
Total financial assets classified as held for trading 793,985 711,630
Financial assets designated at fair value through profit or loss: Securities purchased under resale agreements 64,095 51,073 Securities borrowed 20,373 21,489 Loans 10,417 12,451 Other financial assets designated at fair value through profit or loss 22,516 24,240
Total financial assets designated at fair value through profit or loss 117,401 109,253
Total financial assets at fair value through profit or loss 911,386 820,883
1 Includes traded loans of €13.2 billion and € 15.5 billion at June 30, 2016 and December 31, 2015, respectively.
in € m. Jun 30, 2016 Dec 31, 2015
Financial liabilities classified as held for trading: Trading liabilities:
Trading securities 64,860 51,327 Other trading liabilities 950 977
Total trading liabilities 65,810 52,304
Negative market values from derivative financial instruments 598,837 494,076
Total financial liabilities classified as held for trading 664,647 546,381
Financial liabilities designated at fair value through profit or loss: Securities sold under repurchase agreements 43,661 31,637 Loan commitments 71 79 Long-term debt 8,321 8,710 Other financial liabilities designated at fair value through profit or loss 3,073 4,425
Total financial liabilities designated at fair value through profit or loss 55,126 44,852
Investment contract liabilities 1 7,472 8,522
Total financial liabilities at fair value through profit or loss 727,246 599,754
1 These are investment contracts where the policy terms and conditions result in their redemption values equaling fair values.
in € m. Jun 30, 2016 Dec 31, 2015
Debt securities 68,803 68,266
Equity securities 1,216 1,241
Other equity interests 1,119 974
Loans 3,137 3,102
Total financial assets available for sale 74,274 73,583
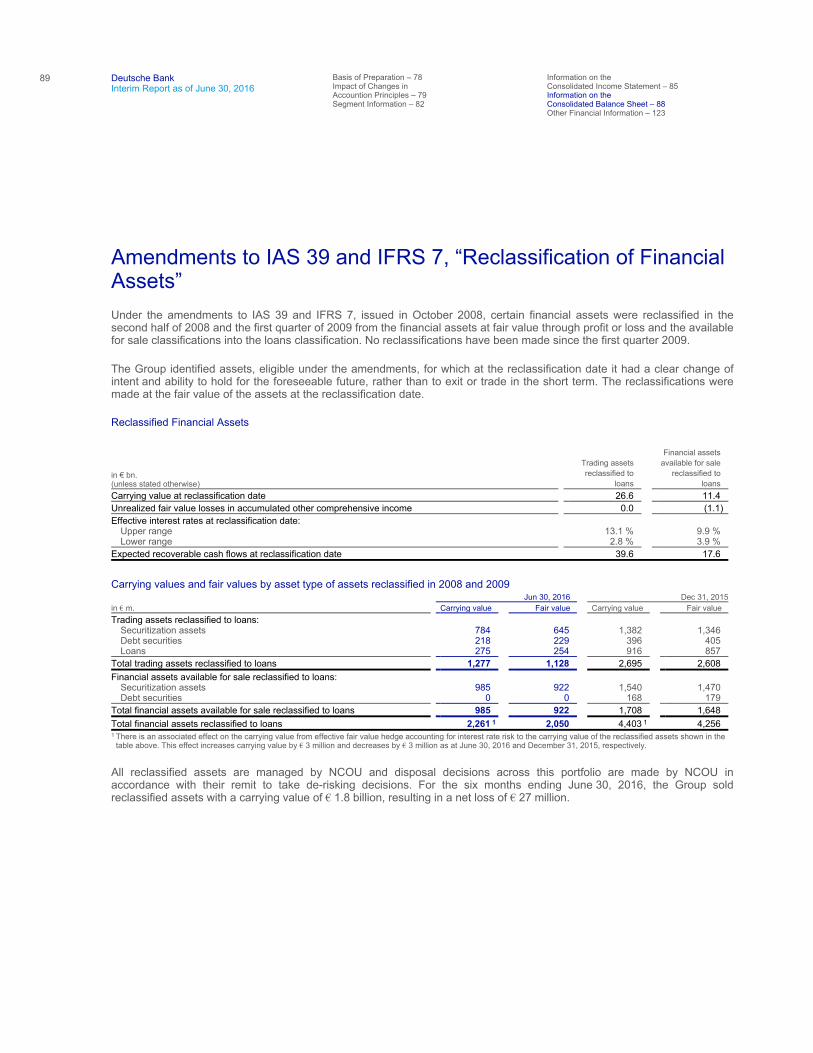
89
Deutsche Bank Interim Report as of June 30, 2016
Basis of Preparation – 78 Impact of Changes in Accountion Principles – 79 Segment Information – 82
Information on the Consolidated Income Statement – 85 Information on the Consolidated Balance Sheet – 88 Other Financial Information – 123
Amendments to IAS 39 and IFRS 7, “Reclassification of Financial Assets” Under the amendments to IAS 39 and IFRS 7, issued in October 2008, certain financial assets were reclassified in the second half of 2008 and the first quarter of 2009 from the financial assets at fair value through profit or loss and the available for sale classifications into the loans classification. No reclassifications have been made since the first quarter 2009.
The Group identified assets, eligible under the amendments, for which at the reclassification date it had a clear change of intent and ability to hold for the foreseeable future, rather than to exit or trade in the short term. The reclassifications were made at the fair value of the assets at the reclassification date.
Reclassified Financial Assets
Carrying values and fair values by asset type of assets reclassified in 2008 and 2009
All reclassified assets are managed by NCOU and disposal decisions across this portfolio are made by NCOU in accordance with their remit to take de-risking decisions. For the six months ending June 30, 2016, the Group sold reclassified assets with a carrying value of € 1.8 billion, resulting in a net loss of € 27 million.
in € bn. (unless stated otherwise)
Trading assets reclassified to
loans
Financial assets available for sale
reclassified to loans
Carrying value at reclassification date 26.6 11.4
Unrealized fair value losses in accumulated other comprehensive income 0.0 (1.1)
Effective interest rates at reclassification date: Upper range 13.1 % 9.9 % Lower range 2.8 % 3.9 %
Expected recoverable cash flows at reclassification date 39.6 17.6
Jun 30, 2016 Dec 31, 2015
in € m. Carrying value Fair value Carrying value Fair value
Trading assets reclassified to loans: Securitization assets 784 645 1,382 1,346 Debt securities 218 229 396 405 Loans 275 254 916 857
Total trading assets reclassified to loans 1,277 1,128 2,695 2,608
Financial assets available for sale reclassified to loans: Securitization assets 985 922 1,540 1,470 Debt securities 0 0 168 179
Total financial assets available for sale reclassified to loans 985 922 1,708 1,648
Total financial assets reclassified to loans 2,261 1 2,050 4,403 1 4,256
1 There is an associated effect on the carrying value from effective fair value hedge accounting for interest rate risk to the carrying value of the reclassified assets shown in the table above. This effect increases carrying value by € 3 million and decreases by € 3 million as at June 30, 2016 and December 31, 2015, respectively.
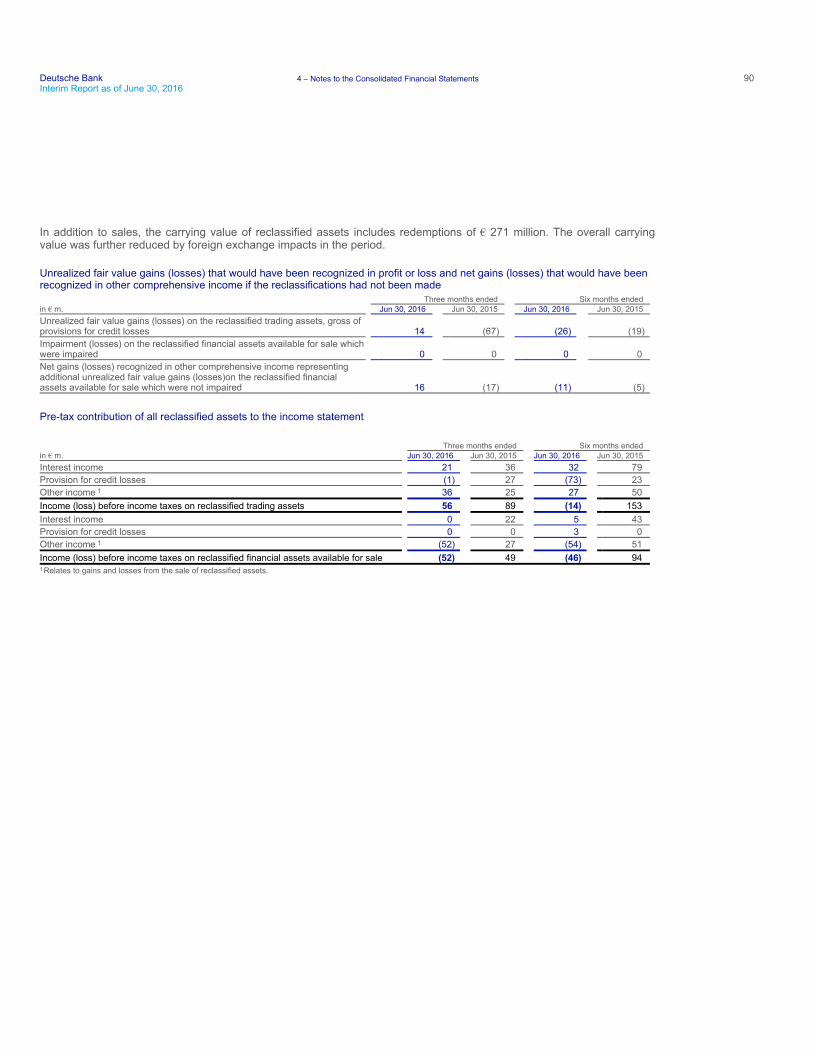
Deutsche Bank 4 – Notes to the Consolidated Financial Statements 90Interim Report as of June 30, 2016
In addition to sales, the carrying value of reclassified assets includes redemptions of € 271 million. The overall carrying value was further reduced by foreign exchange impacts in the period.
Unrealized fair value gains (losses) that would have been recognized in profit or loss and net gains (losses) that would have been recognized in other comprehensive income if the reclassifications had not been made
Pre-tax contribution of all reclassified assets to the income statement
Three months ended Six months ended in € m. Jun 30, 2016 Jun 30, 2015 Jun 30, 2016 Jun 30, 2015
Unrealized fair value gains (losses) on the reclassified trading assets, gross of provisions for credit losses 14 (67) (26) (19)
Impairment (losses) on the reclassified financial assets available for sale which were impaired 0 0 0 0
Net gains (losses) recognized in other comprehensive income representing additional unrealized fair value gains (losses)on the reclassified financial assets available for sale which were not impaired 16 (17) (11) (5)
Three months ended Six months ended in € m. Jun 30, 2016 Jun 30, 2015 Jun 30, 2016 Jun 30, 2015
Interest income 21 36 32 79
Provision for credit losses (1) 27 (73) 23
Other income 1 36 25 27 50
Income (loss) before income taxes on reclassified trading assets 56 89 (14) 153
Interest income 0 22 5 43
Provision for credit losses 0 0 3 0
Other income 1 (52) 27 (54) 51
Income (loss) before income taxes on reclassified financial assets available for sale (52) 49 (46) 94
1Relates to gains and losses from the sale of reclassified assets.
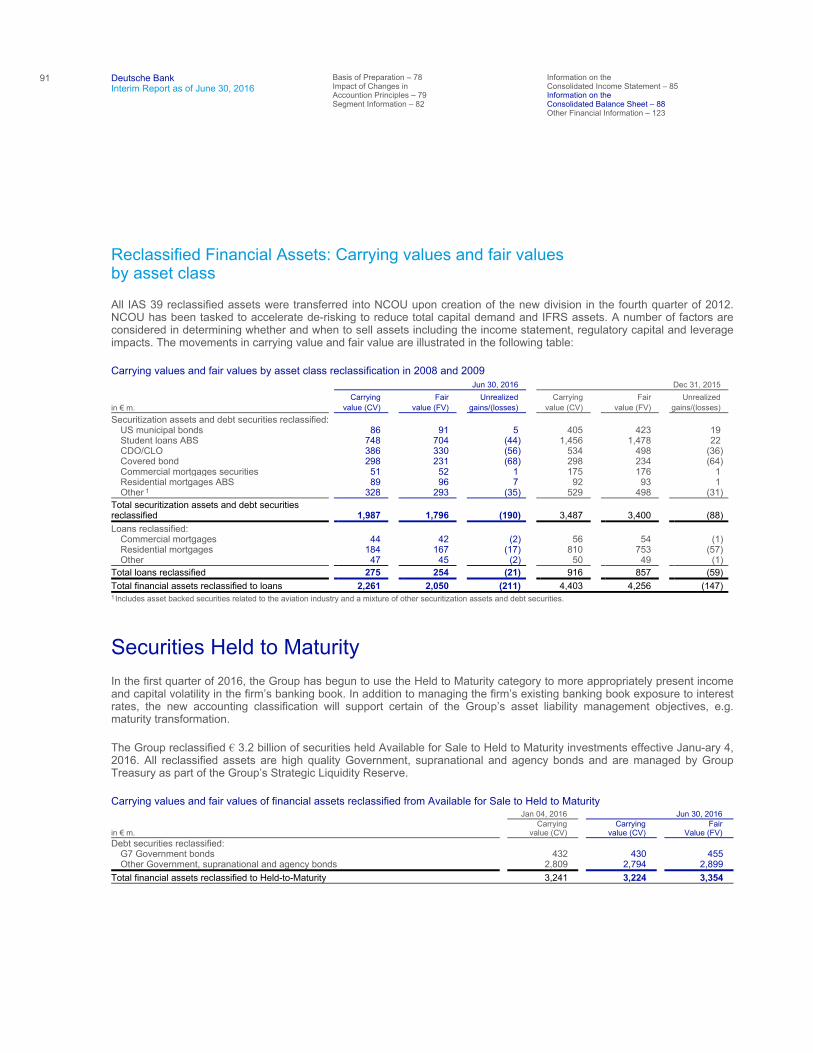
91
Deutsche Bank Interim Report as of June 30, 2016
Basis of Preparation – 78 Impact of Changes in Accountion Principles – 79 Segment Information – 82
Information on the Consolidated Income Statement – 85 Information on the Consolidated Balance Sheet – 88 Other Financial Information – 123
Reclassified Financial Assets: Carrying values and fair values by asset class
All IAS 39 reclassified assets were transferred into NCOU upon creation of the new division in the fourth quarter of 2012. NCOU has been tasked to accelerate de-risking to reduce total capital demand and IFRS assets. A number of factors are considered in determining whether and when to sell assets including the income statement, regulatory capital and leverage impacts. The movements in carrying value and fair value are illustrated in the following table:
Carrying values and fair values by asset class reclassification in 2008 and 2009
Securities Held to Maturity In the first quarter of 2016, the Group has begun to use the Held to Maturity category to more appropriately present income and capital volatility in the firm’s banking book. In addition to managing the firm’s existing banking book exposure to interest rates, the new accounting classification will support certain of the Group’s asset liability management objectives, e.g. maturity transformation.
The Group reclassified € 3.2 billion of securities held Available for Sale to Held to Maturity investments effective Janu-ary 4, 2016. All reclassified assets are high quality Government, supranational and agency bonds and are managed by Group Treasury as part of the Group’s Strategic Liquidity Reserve.
Carrying values and fair values of financial assets reclassified from Available for Sale to Held to Maturity
Jun 30, 2016 Dec 31, 2015
in € m. Carrying
value (CV) Fair
value (FV) Unrealized
gains/(losses) Carrying
value (CV) Fair
value (FV) Unrealized
gains/(losses)
Securitization assets and debt securities reclassified: US municipal bonds 86 91 5 405 423 19 Student loans ABS 748 704 (44) 1,456 1,478 22 CDO/CLO 386 330 (56) 534 498 (36) Covered bond 298 231 (68) 298 234 (64) Commercial mortgages securities 51 52 1 175 176 1 Residential mortgages ABS 89 96 7 92 93 1 Other 1 328 293 (35) 529 498 (31)
Total securitization assets and debt securities reclassified 1,987 1,796 (190) 3,487 3,400 (88)
Loans reclassified: Commercial mortgages 44 42 (2) 56 54 (1) Residential mortgages 184 167 (17) 810 753 (57) Other 47 45 (2) 50 49 (1)
Total loans reclassified 275 254 (21) 916 857 (59)
Total financial assets reclassified to loans 2,261 2,050 (211) 4,403 4,256 (147)
1 Includes asset backed securities related to the aviation industry and a mixture of other securitization assets and debt securities.
Jan 04, 2016 Jun 30, 2016
in € m. Carrying
value (CV) Carrying
value (CV) Fair
Value (FV) Debt securities reclassified:
G7 Government bonds 432 430 455 Other Government, supranational and agency bonds 2,809 2,794 2,899
Total financial assets reclassified to Held-to-Maturity 3,241 3,224 3,354
Deutsche Bank 4 – Notes to the Consolidated Financial Statements 92Interim Report as of June 30, 2016
Financial Instruments carried at Fair Value
Fair Value Hierarchy
The financial instruments carried at fair value have been categorized under the three levels of the IFRS fair value hierarchy as follows:
Level 1 – Instruments valued using quoted prices in active markets are instruments where the fair value can be determined directly from prices which are quoted in active, liquid markets and where the instrument observed in the market is representative of that being priced in the Group’s inventory.
These include: government bonds, exchange-traded derivatives and equity securities traded on active, liquid exchanges.
Level 2 – Instruments valued with valuation techniques using observable market data are instruments where the fair value can be determined by reference to similar instruments trading in active markets, or where a technique is used to derive the valuation but where all inputs to that technique are observable.
These include: many OTC derivatives; many investment-grade listed credit bonds; some CDS; many collateralized debt obligations (CDO); and many less-liquid equities.
Level 3 – Instruments valued using valuation techniques using market data which is not directly observable are instruments where the fair value cannot be determined directly by reference to market-observable information, and some other pricing technique must be employed. Instruments classified in this category have an element which is unobservable and which has a significant impact on the fair value.
These include: more-complex OTC derivatives; distressed debt; highly-structured bonds; illiquid asset-backed securities (ABS); illiquid CDO’s (cash and synthetic); monoline exposures; some private equity placements; many commercial real estate (CRE) loans; illiquid loans; and some municipal bonds.
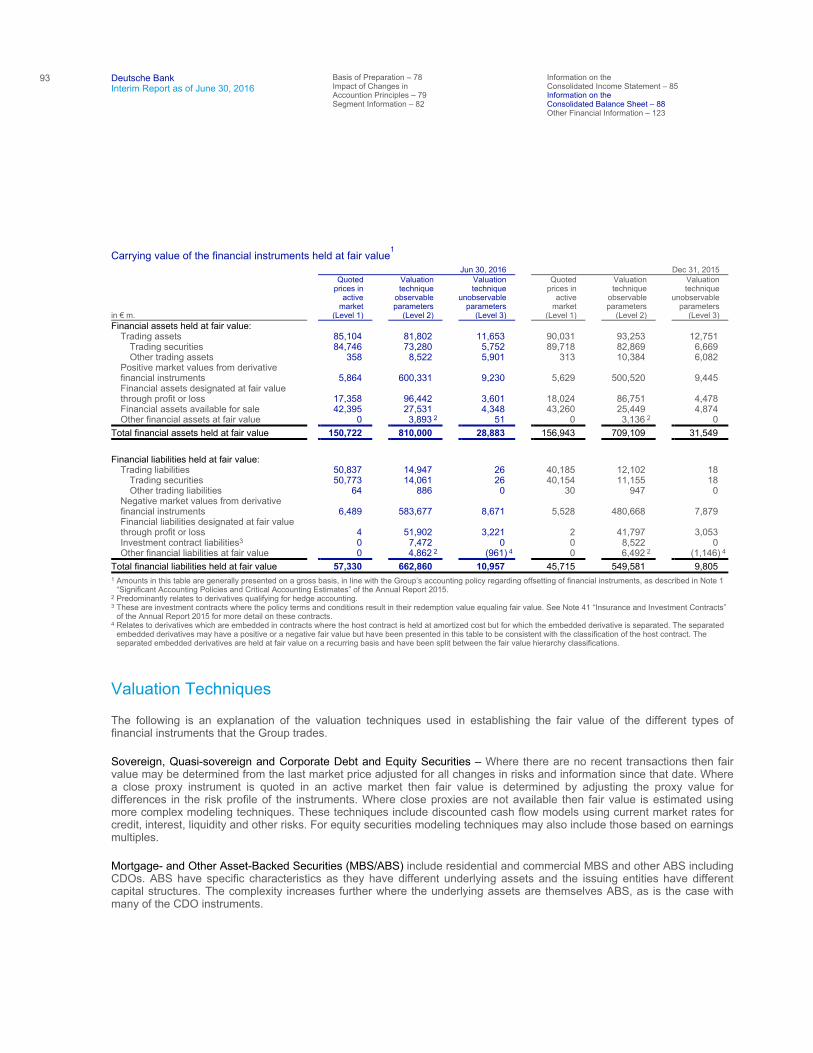
93
Deutsche Bank Interim Report as of June 30, 2016
Basis of Preparation – 78 Impact of Changes in Accountion Principles – 79 Segment Information – 82
Information on the Consolidated Income Statement – 85 Information on the Consolidated Balance Sheet – 88 Other Financial Information – 123
Carrying value of the financial instruments held at fair value1
Valuation Techniques
The following is an explanation of the valuation techniques used in establishing the fair value of the different types of financial instruments that the Group trades.
Sovereign, Quasi-sovereign and Corporate Debt and Equity Securities – Where there are no recent transactions then fair value may be determined from the last market price adjusted for all changes in risks and information since that date. Where a close proxy instrument is quoted in an active market then fair value is determined by adjusting the proxy value for differences in the risk profile of the instruments. Where close proxies are not available then fair value is estimated using more complex modeling techniques. These techniques include discounted cash flow models using current market rates for credit, interest, liquidity and other risks. For equity securities modeling techniques may also include those based on earnings multiples.
Mortgage- and Other Asset-Backed Securities (MBS/ABS) include residential and commercial MBS and other ABS including CDOs. ABS have specific characteristics as they have different underlying assets and the issuing entities have different capital structures. The complexity increases further where the underlying assets are themselves ABS, as is the case with many of the CDO instruments.
Jun 30, 2016 Dec 31, 2015
in € m.
Quoted prices in
active market
(Level 1)
Valuation technique
observable parameters
(Level 2)
Valuation technique
unobservable parameters
(Level 3)
Quoted prices in
active market
(Level 1)
Valuation technique
observable parameters
(Level 2)
Valuation technique
unobservable parameters
(Level 3) Financial assets held at fair value:
Trading assets 85,104 81,802 11,653 90,031 93,253 12,751 Trading securities 84,746 73,280 5,752 89,718 82,869 6,669 Other trading assets 358 8,522 5,901 313 10,384 6,082
Positive market values from derivative financial instruments 5,864 600,331 9,230 5,629 500,520 9,445 Financial assets designated at fair value through profit or loss 17,358 96,442 3,601 18,024 86,751 4,478 Financial assets available for sale 42,395 27,531 4,348 43,260 25,449 4,874 Other financial assets at fair value 0 3,893 2 51 0 3,136 2 0
Total financial assets held at fair value 150,722 810,000 28,883 156,943 709,109 31,549
Financial liabilities held at fair value: Trading liabilities 50,837 14,947 26 40,185 12,102 18
Trading securities 50,773 14,061 26 40,154 11,155 18 Other trading liabilities 64 886 0 30 947 0
Negative market values from derivative financial instruments 6,489 583,677 8,671 5,528 480,668 7,879 Financial liabilities designated at fair value through profit or loss 4 51,902 3,221 2 41,797 3,053 Investment contract liabilities3 0 7,472 0 0 8,522 0 Other financial liabilities at fair value 0 4,862 2 (961) 4 0 6,492 2 (1,146) 4
Total financial liabilities held at fair value 57,330 662,860 10,957 45,715 549,581 9,805
1 Amounts in this table are generally presented on a gross basis, in line with the Group’s accounting policy regarding offsetting of financial instruments, as described in Note 1 “Significant Accounting Policies and Critical Accounting Estimates” of the Annual Report 2015.
2 Predominantly relates to derivatives qualifying for hedge accounting. 3 These are investment contracts where the policy terms and conditions result in their redemption value equaling fair value. See Note 41 “Insurance and Investment Contracts”
of the Annual Report 2015 for more detail on these contracts. 4 Relates to derivatives which are embedded in contracts where the host contract is held at amortized cost but for which the embedded derivative is separated. The separated
embedded derivatives may have a positive or a negative fair value but have been presented in this table to be consistent with the classification of the host contract. The separated embedded derivatives are held at fair value on a recurring basis and have been split between the fair value hierarchy classifications.
Deutsche Bank 4 – Notes to the Consolidated Financial Statements 94Interim Report as of June 30, 2016
Where no reliable external pricing is available, ABS are valued, where applicable, using either relative value analysis which is performed based on similar transactions observable in the market, or industry standard valuation models incorporating available observable inputs. The industry standard external models calculate principal and interest payments for a given deal based on assumptions that can be independently price tested. The inputs include prepayment speeds, loss assumptions (timing and severity) and a discount rate (spread, yield or discount margin). These inputs/assumptions are derived from actual transactions, external market research and market indices where appropriate.
Loans – For certain loans fair value may be determined from the market price on a recently occurring transaction adjusted for all changes in risks and information since that transaction date. Where there are no recent market transactions then broker quotes, consensus pricing, proxy instruments or discounted cash flow models are used to determine fair value. Discounted cash flow models incorporate parameter inputs for credit risk, interest rate risk, foreign exchange risk, loss given default estimates and amounts utilized given default, as appropriate. Credit risk, loss given default and utilization given default parameters are determined using information from the loan or CDS markets, where available and appropriate.
Leveraged loans can have transaction-specific characteristics which can limit the relevance of market-observed transactions. Where similar transactions exist for which observable quotes are available from external pricing services then this information is used with appropriate adjustments to reflect the transaction differences. When no similar transactions exist, a discounted cash flow valuation technique is used with credit spreads derived from the appropriate leveraged loan index, incorporating the industry classification, subordination of the loan, and any other relevant information on the loan and loan counterparty.
Over-The-Counter Derivative Financial Instruments – Market standard transactions in liquid trading markets, such as interest rate swaps, foreign exchange forward and option contracts in G7 currencies, and equity swap and option contracts on listed securities or indices are valued using market standard models and quoted parameter inputs. Parameter inputs are obtained from pricing services, consensus pricing services and recently occurring transactions in active markets wherever possible.
More complex instruments are modeled using more sophisticated modeling techniques specific for the instrument and are calibrated to available market prices. Where the model output value does not calibrate to a relevant market reference then valuation adjustments are made to the model output value to adjust for any difference. In less active markets, data is obtained from less frequent market transactions, broker quotes and through extrapolation and interpolation techniques. Where observable prices or inputs are not available, management judgment is required to determine fair values by assessing other relevant sources of information such as historical data, fundamental analysis of the economics of the transaction and proxy information from similar transactions.
Financial Liabilities Designated at Fair Value through Profit or Loss under the Fair Value Option – The fair value of financial liabilities designated at fair value through profit or loss under the fair value option incorporates all market risk factors including a measure of the Group’s credit risk relevant for that financial liability. The financial liabilities include structured note issuances, structured deposits, and other structured securities issued by consolidated vehicles, which may not be quoted in an active market. The fair value of these financial liabilities is determined by discounting the contractual cash flows using the relevant credit-adjusted yield curve. The market risk parameters are valued consistently to similar instruments held as assets, for example, any derivatives embedded within the structured notes are valued using the same methodology discussed in the “Over-The-Counter Derivative Financial Instruments” section above.
Where the financial liabilities designated at fair value through profit or loss under the fair value option are collateralized, such as securities loaned and securities sold under repurchase agreements, the credit enhancement is factored into the fair valuation of the liability.
Investment Contract Liabilities – Assets which are linked to the investment contract liabilities are owned by the Group. The investment contract obliges the Group to use these assets to settle these liabilities. Therefore, the fair value of investment contract liabilities is determined by the fair value of the underlying assets (i.e., amount payable on surrender of the policies).
95
Deutsche Bank Interim Report as of June 30, 2016
Basis of Preparation – 78 Impact of Changes in Accountion Principles – 79 Segment Information – 82
Information on the Consolidated Income Statement – 85 Information on the Consolidated Balance Sheet – 88 Other Financial Information – 123
Analysis of Financial Instruments with Fair Value Derived from Valuation Techniques Containing Significant Unobservable Parameters (Level 3)
Some of the instruments in level 3 of the fair value hierarchy have identical or similar offsetting exposures to the unobservable input. However, according to IFRS they are required to be presented as gross assets and liabilities.
Trading Securities – Certain illiquid emerging market corporate bonds and illiquid highly structured corporate bonds are included in this level of the hierarchy. In addition, some of the holdings of notes issued by securitization entities, commercial and residential MBS, collateralized debt obligation securities and other ABS are reported here. The decrease in the period was mainly due to sales supported by settlements partially offset by transfers between levels 2 and 3 and Purchases.
Positive and Negative Market Values from Derivative Instruments categorized in this level of the fair value hierarchy are valued based on one or more significant unobservable parameters. The unobservable parameters may include certain correlations, certain longer-term volatilities, certain prepayment rates, credit spreads and other transaction-specific parameters.
Level 3 derivatives include customized CDO derivatives in which the underlying reference pool of corporate assets is not closely comparable to regularly market-traded indices; certain tranched index credit derivatives; certain options where the volatility is unobservable; certain basket options in which the correlations between the referenced underlying assets are unobservable; longer-term interest rate option derivatives; multi-currency foreign exchange derivatives; and certain credit default swaps for which the credit spread is not observable. The decrease in the period refers to settlements partially offset by gains.
Other Trading Instruments classified in level 3 of the fair value hierarchy mainly consist of traded loans valued using valuation models based on one or more significant unobservable parameters. Level 3 loans comprise illiquid leveraged loans and illiquid residential and commercial mortgage loans. The marginal decrease in the period refers to settlements mostly offset by transfers between levels 2 and 3.
Financial Assets/Liabilities designated at Fair Value through Profit or Loss – Certain corporate loans and structured liabilities which were designated at fair value through profit or loss under the fair value option are categorized in this level of the fair value hierarchy. The corporate loans are valued using valuation techniques which incorporate observable credit spreads, recovery rates and unobservable utilization parameters. Revolving loan facilities are reported in the third level of the hierarchy because the utilization in the event of the default parameter is significant and unobservable. In addition, certain hybrid debt issuances designated at fair value through profit or loss containing embedded derivatives are valued based on significant unobservable parameters. These unobservable parameters include single stock volatility correlations. The decrease in assets during the period is primarily due to settlements and transfers between levels 2 and 3. Liabilities increased due to Issuances partially offset by settlements and transfers between level 2 and 3.
Financial Assets Available for Sale include non-performing loan portfolios where there is no trading intent and unlisted equity instruments where there is no close proxy and the market is very illiquid. Assets decreased mostly due to settlements.
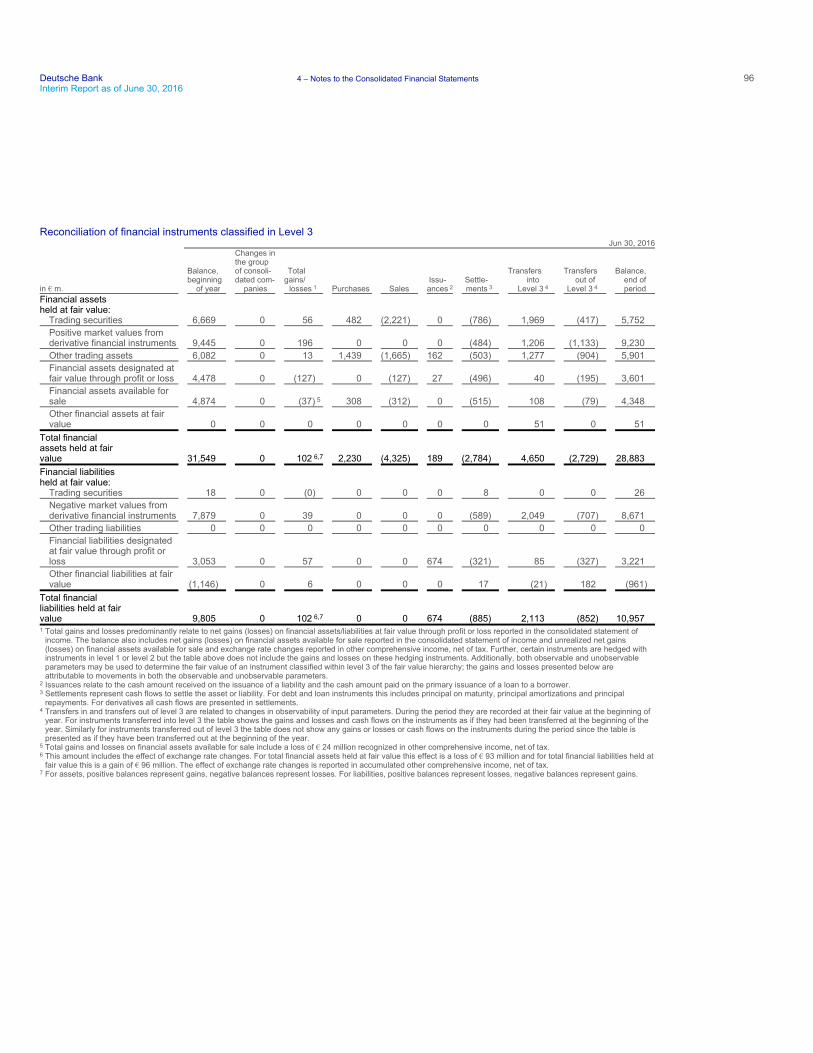
Deutsche Bank 4 – Notes to the Consolidated Financial Statements 96Interim Report as of June 30, 2016
Reconciliation of financial instruments classified in Level 3
Jun 30, 2016
in € m.
Balance, beginning of year
Changes inthe group of consoli- dated com- panies
Total gains/
losses 1 Purchases Sales Issu- ances 2
Settle- ments 3
Transfers into
Level 3 4
Transfers out of
Level 3 4
Balance, end of period
Financial assets held at fair value:
Trading securities 6,669 0 56 482 (2,221) 0 (786) 1,969 (417) 5,752
Positive market values from derivative financial instruments 9,445 0 196 0 0 0 (484) 1,206 (1,133) 9,230
Other trading assets 6,082 0 13 1,439 (1,665) 162 (503) 1,277 (904) 5,901
Financial assets designated at fair value through profit or loss 4,478 0 (127) 0 (127) 27 (496) 40 (195) 3,601
Financial assets available for sale 4,874 0 (37) 5 308 (312) 0 (515) 108 (79) 4,348
Other financial assets at fair value 0 0 0 0 0 0 0 51 0 51
Total financial assets held at fair value 31,549 0 102 6,7 2,230 (4,325) 189 (2,784) 4,650 (2,729) 28,883
Financial liabilities held at fair value:
Trading securities 18 0 (0) 0 0 0 8 0 0 26
Negative market values from derivative financial instruments 7,879 0 39 0 0 0 (589) 2,049 (707) 8,671
Other trading liabilities 0 0 0 0 0 0 0 0 0 0
Financial liabilities designated at fair value through profit or loss 3,053 0 57 0 0 674 (321) 85 (327) 3,221
Other financial liabilities at fair value (1,146) 0 6 0 0 0 17 (21) 182 (961)
Total financial liabilities held at fair value 9,805 0 102 6,7 0 0 674 (885) 2,113 (852) 10,957
1 Total gains and losses predominantly relate to net gains (losses) on financial assets/liabilities at fair value through profit or loss reported in the consolidated statement of income. The balance also includes net gains (losses) on financial assets available for sale reported in the consolidated statement of income and unrealized net gains (losses) on financial assets available for sale and exchange rate changes reported in other comprehensive income, net of tax. Further, certain instruments are hedged with instruments in level 1 or level 2 but the table above does not include the gains and losses on these hedging instruments. Additionally, both observable and unobservable parameters may be used to determine the fair value of an instrument classified within level 3 of the fair value hierarchy; the gains and losses presented below are attributable to movements in both the observable and unobservable parameters.
2 Issuances relate to the cash amount received on the issuance of a liability and the cash amount paid on the primary issuance of a loan to a borrower. 3 Settlements represent cash flows to settle the asset or liability. For debt and loan instruments this includes principal on maturity, principal amortizations and principal
repayments. For derivatives all cash flows are presented in settlements. 4 Transfers in and transfers out of level 3 are related to changes in observability of input parameters. During the period they are recorded at their fair value at the beginning of
year. For instruments transferred into level 3 the table shows the gains and losses and cash flows on the instruments as if they had been transferred at the beginning of the year. Similarly for instruments transferred out of level 3 the table does not show any gains or losses or cash flows on the instruments during the period since the table is presented as if they have been transferred out at the beginning of the year.
5 Total gains and losses on financial assets available for sale include a loss of € 24 million recognized in other comprehensive income, net of tax. 6 This amount includes the effect of exchange rate changes. For total financial assets held at fair value this effect is a loss of € 93 million and for total financial liabilities held at
fair value this is a gain of € 96 million. The effect of exchange rate changes is reported in accumulated other comprehensive income, net of tax. 7 For assets, positive balances represent gains, negative balances represent losses. For liabilities, positive balances represent losses, negative balances represent gains.
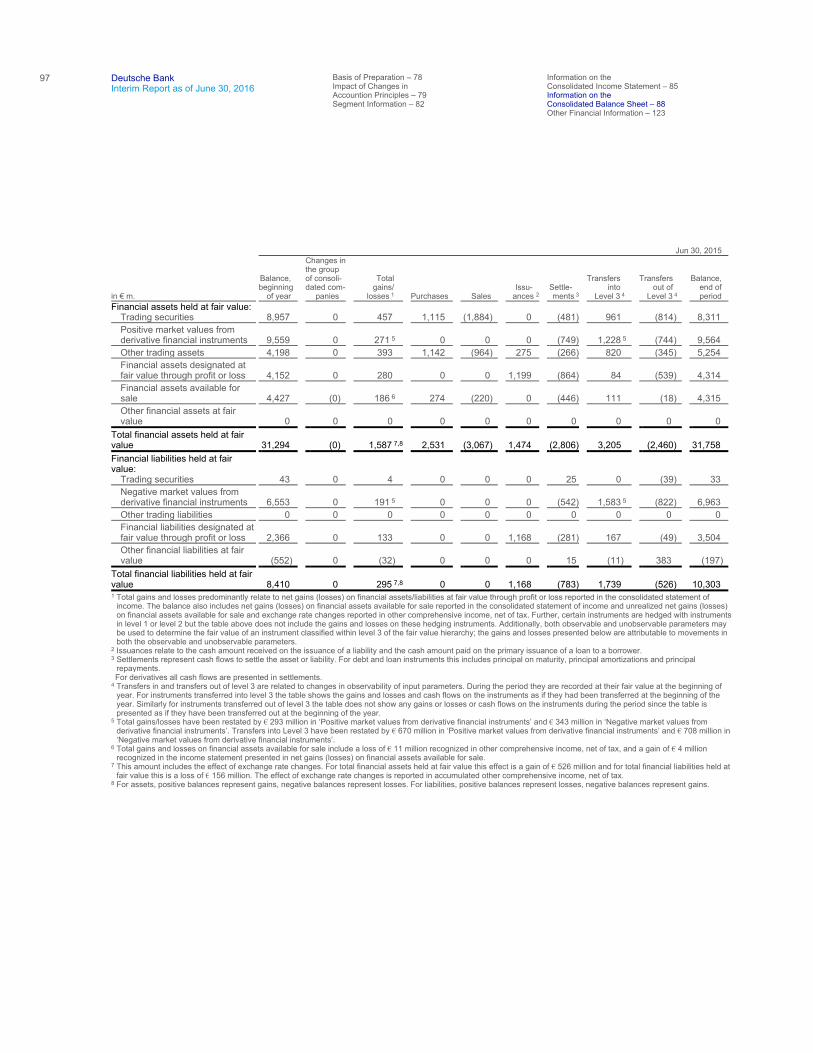
97
Deutsche Bank Interim Report as of June 30, 2016
Basis of Preparation – 78 Impact of Changes in Accountion Principles – 79 Segment Information – 82
Information on the Consolidated Income Statement – 85 Information on the Consolidated Balance Sheet – 88 Other Financial Information – 123
Jun 30, 2015
in € m.
Balance, beginning
of year
Changes inthe group of consoli- dated com-
panies
Total gains/
losses 1 Purchases Sales Issu-
ances 2Settle- ments 3
Transfers into
Level 3 4
Transfers out of
Level 3 4
Balance, end of period
Financial assets held at fair value: Trading securities 8,957 0 457 1,115 (1,884) 0 (481) 961 (814) 8,311
Positive market values from derivative financial instruments 9,559 0 271 5 0 0 0 (749) 1,228 5 (744) 9,564
Other trading assets 4,198 0 393 1,142 (964) 275 (266) 820 (345) 5,254
Financial assets designated at fair value through profit or loss 4,152 0 280 0 0 1,199 (864) 84 (539) 4,314
Financial assets available for sale 4,427 (0) 186 6 274 (220) 0 (446) 111 (18) 4,315
Other financial assets at fair value 0 0 0 0 0 0 0 0 0 0
Total financial assets held at fair value 31,294 (0) 1,587 7,8 2,531 (3,067) 1,474 (2,806) 3,205 (2,460) 31,758
Financial liabilities held at fair value:
Trading securities 43 0 4 0 0 0 25 0 (39) 33
Negative market values from derivative financial instruments 6,553 0 191 5 0 0 0 (542) 1,583 5 (822) 6,963
Other trading liabilities 0 0 0 0 0 0 0 0 0 0
Financial liabilities designated at fair value through profit or loss 2,366 0 133 0 0 1,168 (281) 167 (49) 3,504
Other financial liabilities at fair value (552) 0 (32) 0 0 0 15 (11) 383 (197)
Total financial liabilities held at fair value 8,410 0 295 7,8 0 0 1,168 (783) 1,739 (526) 10,303
1 Total gains and losses predominantly relate to net gains (losses) on financial assets/liabilities at fair value through profit or loss reported in the consolidated statement of income. The balance also includes net gains (losses) on financial assets available for sale reported in the consolidated statement of income and unrealized net gains (losses) on financial assets available for sale and exchange rate changes reported in other comprehensive income, net of tax. Further, certain instruments are hedged with instruments in level 1 or level 2 but the table above does not include the gains and losses on these hedging instruments. Additionally, both observable and unobservable parameters may be used to determine the fair value of an instrument classified within level 3 of the fair value hierarchy; the gains and losses presented below are attributable to movements in both the observable and unobservable parameters.
2 Issuances relate to the cash amount received on the issuance of a liability and the cash amount paid on the primary issuance of a loan to a borrower. 3 Settlements represent cash flows to settle the asset or liability. For debt and loan instruments this includes principal on maturity, principal amortizations and principal
repayments. For derivatives all cash flows are presented in settlements. 4 Transfers in and transfers out of level 3 are related to changes in observability of input parameters. During the period they are recorded at their fair value at the beginning of
year. For instruments transferred into level 3 the table shows the gains and losses and cash flows on the instruments as if they had been transferred at the beginning of the year. Similarly for instruments transferred out of level 3 the table does not show any gains or losses or cash flows on the instruments during the period since the table is presented as if they have been transferred out at the beginning of the year.
5 Total gains/losses have been restated by € 293 million in ‘Positive market values from derivative financial instruments’ and € 343 million in ‘Negative market values from derivative financial instruments’. Transfers into Level 3 have been restated by € 670 million in ‘Positive market values from derivative financial instruments’ and € 708 million in ‘Negative market values from derivative financial instruments’.
6 Total gains and losses on financial assets available for sale include a loss of € 11 million recognized in other comprehensive income, net of tax, and a gain of € 4 million recognized in the income statement presented in net gains (losses) on financial assets available for sale.
7 This amount includes the effect of exchange rate changes. For total financial assets held at fair value this effect is a gain of € 526 million and for total financial liabilities held at fair value this is a loss of € 156 million. The effect of exchange rate changes is reported in accumulated other comprehensive income, net of tax.
8 For assets, positive balances represent gains, negative balances represent losses. For liabilities, positive balances represent losses, negative balances represent gains.
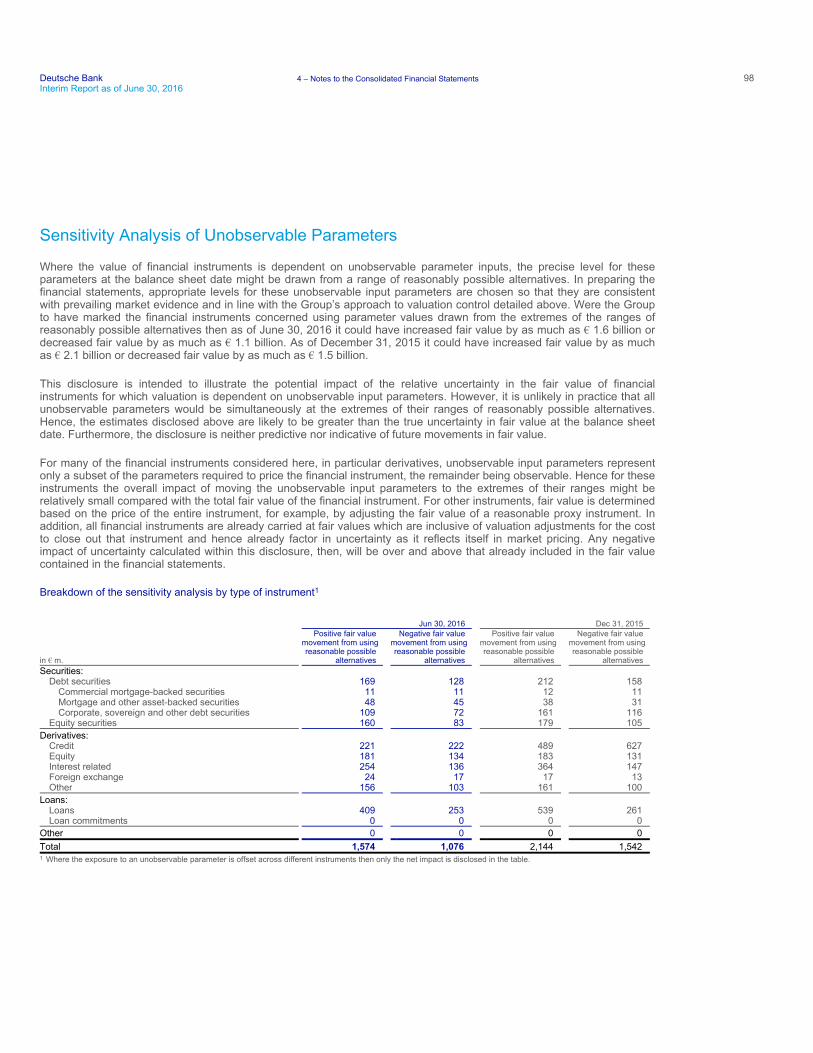
Deutsche Bank 4 – Notes to the Consolidated Financial Statements 98Interim Report as of June 30, 2016
Sensitivity Analysis of Unobservable Parameters
Where the value of financial instruments is dependent on unobservable parameter inputs, the precise level for these parameters at the balance sheet date might be drawn from a range of reasonably possible alternatives. In preparing the financial statements, appropriate levels for these unobservable input parameters are chosen so that they are consistent with prevailing market evidence and in line with the Group’s approach to valuation control detailed above. Were the Group to have marked the financial instruments concerned using parameter values drawn from the extremes of the ranges of reasonably possible alternatives then as of June 30, 2016 it could have increased fair value by as much as € 1.6 billion or decreased fair value by as much as € 1.1 billion. As of December 31, 2015 it could have increased fair value by as much as € 2.1 billion or decreased fair value by as much as € 1.5 billion.
This disclosure is intended to illustrate the potential impact of the relative uncertainty in the fair value of financial instruments for which valuation is dependent on unobservable input parameters. However, it is unlikely in practice that all unobservable parameters would be simultaneously at the extremes of their ranges of reasonably possible alternatives. Hence, the estimates disclosed above are likely to be greater than the true uncertainty in fair value at the balance sheet date. Furthermore, the disclosure is neither predictive nor indicative of future movements in fair value.
For many of the financial instruments considered here, in particular derivatives, unobservable input parameters represent only a subset of the parameters required to price the financial instrument, the remainder being observable. Hence for these instruments the overall impact of moving the unobservable input parameters to the extremes of their ranges might be relatively small compared with the total fair value of the financial instrument. For other instruments, fair value is determined based on the price of the entire instrument, for example, by adjusting the fair value of a reasonable proxy instrument. In addition, all financial instruments are already carried at fair values which are inclusive of valuation adjustments for the cost to close out that instrument and hence already factor in uncertainty as it reflects itself in market pricing. Any negative impact of uncertainty calculated within this disclosure, then, will be over and above that already included in the fair value contained in the financial statements.
Breakdown of the sensitivity analysis by type of instrument1
Jun 30, 2016 Dec 31, 2015
in € m.
Positive fair value movement from using reasonable possible
alternatives
Negative fair value movement from using reasonable possible
alternatives
Positive fair value movement from using reasonable possible
alternatives
Negative fair value movement from using reasonable possible
alternatives Securities:
Debt securities 169 128 212 158 Commercial mortgage-backed securities 11 11 12 11 Mortgage and other asset-backed securities 48 45 38 31 Corporate, sovereign and other debt securities 109 72 161 116
Equity securities 160 83 179 105
Derivatives: Credit 221 222 489 627 Equity 181 134 183 131 Interest related 254 136 364 147 Foreign exchange 24 17 17 13 Other 156 103 161 100
Loans: Loans 409 253 539 261 Loan commitments 0 0 0 0
Other 0 0 0 0
Total 1,574 1,076 2,144 1,542
1 Where the exposure to an unobservable parameter is offset across different instruments then only the net impact is disclosed in the table.
99
Deutsche Bank Interim Report as of June 30, 2016
Basis of Preparation – 78 Impact of Changes in Accountion Principles – 79 Segment Information – 82
Information on the Consolidated Income Statement – 85 Information on the Consolidated Balance Sheet – 88 Other Financial Information – 123
Quantitative Information about the Sensitivity of Significant Unobservable Inputs
The behavior of the unobservable parameters on Level 3 fair value measurement is not necessarily independent, and dynamic relationships often exist between the other unobservable parameters and the observable parameters. Such relationships, where material to the fair value of a given instrument, are explicitly captured via correlation parameters, or are otherwise controlled via pricing models or valuation techniques. Frequently, where a valuation technique utilizes more than one input, the choice of a certain input will bound the range of possible values for other inputs. In addition, broader market factors (such as interest rates, equity, credit or commodity indices or foreign exchange rates) can also have effects.
The range of values shown below represents the highest and lowest inputs used to value the significant exposures within Level 3. The diversity of financial instruments that make up the disclosure is significant and therefore the ranges of certain parameters can be large. For example, the range of credit spreads on mortgage backed securities represents performing, more liquid positions with lower spreads then the less liquid, non-performing positions which will have higher credit spreads. As Level 3 contains the less liquid fair value instruments, the wide ranges of parameters seen is to be expected, as there is a high degree of pricing differentiation within each exposure type to capture the relevant market dynamics. There follows a brief description of each of the principle parameter types, along with a commentary on significant interrelationships between them.
Credit Parameters are used to assess the creditworthiness of an exposure, by enabling the probability of default and resulting losses of a default to be represented. The credit spread is the primary reflection of creditworthiness, and represents the premium or yield return above the benchmark reference instrument (typically LIBOR, or relevant Treasury Instrument, depending upon the asset being assessed), that a bond holder would require to allow for the credit quality difference between that entity and the reference benchmark. Higher credit spreads will indicate lower credit quality, and lead to a lower value for a given bond, or other loan-asset that is to be repaid to the Bank by the borrower. Recovery Rates represent an estimate of the amount a lender would receive in the case of a default of a loan, or a bond holder would receive in the case of default of the bond. Higher recovery rates will give a higher valuation for a given bond position, if other parameters are held constant. Constant Default Rate (CDR) and Constant Prepayment Rate (CPR) allow more complex loan and debt assets to be assessed, as these parameters estimate the ongoing defaults arising on scheduled repayments and coupons, or whether the borrower is making additional (usually voluntary) prepayments. These parameters are particularly relevant when forming a fair value opinion for mortgage or other types of lending, where repayments are delivered by the borrower through time, or where the borrower may pre-pay the loan (seen for example in some residential mortgages). Higher CDR will lead to lower valuation of a given loan or mortgage as the lender will ultimately receive less cash.
Interest rates, credit spreads, inflation rates, foreign exchange rates and equity prices are referenced in some option instruments, or other complex derivatives, where the payoff a holder of the derivative will receive is dependent upon the behavior of these underlying references through time. Volatility parameters describe key attributes of option behavior by enabling the variability of returns of the underlying instrument to be assessed. This volatility is a measure of probability, with higher volatilities denoting higher probabilities of a particular outcome occurring. The underlying references (interest rates, credit spreads etc.) have an effect on the valuation of options, by describing the size of the return that can be expected from the option. Therefore the value of a given option is dependent upon the value of the underlying instrument, and the volatility of that instrument, representing the size of the payoff, and the probability of that payoff occurring. Where volatilities are high, the option holder will see a higher option value as there is greater probability of positive returns. A higher option value will also occur where the payoff described by the option is significant.
Correlations are used to describe influential relationships between underlying references where a derivative or other instrument has more than one underlying reference. Behind some of these relationships, for example commodity correlation and interest rate-foreign exchange correlations, typically lie macroeconomic factors such as the impact of global demand on groups of commodities, or the pricing parity effect of interest rates on foreign exchange rates. More specific relationships can exist between credit references or equity stocks in the case of credit derivatives and equity basket
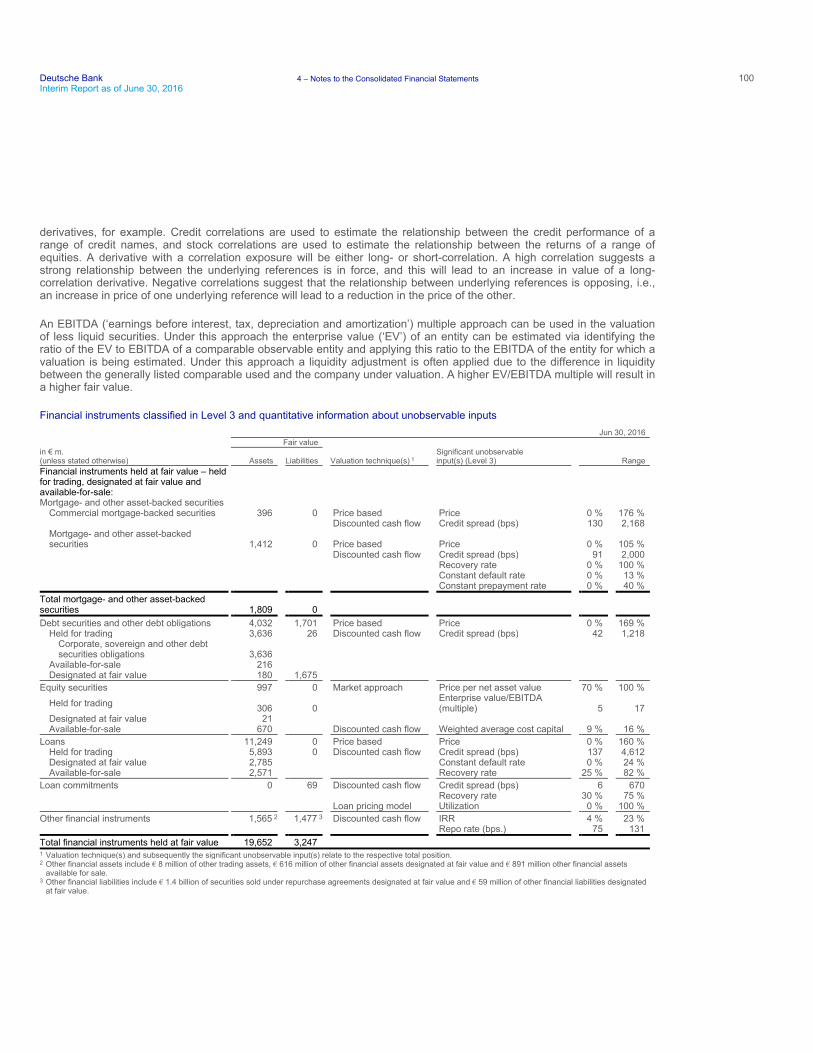
Deutsche Bank 4 – Notes to the Consolidated Financial Statements 100Interim Report as of June 30, 2016
derivatives, for example. Credit correlations are used to estimate the relationship between the credit performance of a range of credit names, and stock correlations are used to estimate the relationship between the returns of a range of equities. A derivative with a correlation exposure will be either long- or short-correlation. A high correlation suggests a strong relationship between the underlying references is in force, and this will lead to an increase in value of a long-correlation derivative. Negative correlations suggest that the relationship between underlying references is opposing, i.e., an increase in price of one underlying reference will lead to a reduction in the price of the other.
An EBITDA (‘earnings before interest, tax, depreciation and amortization’) multiple approach can be used in the valuation of less liquid securities. Under this approach the enterprise value (‘EV’) of an entity can be estimated via identifying the ratio of the EV to EBITDA of a comparable observable entity and applying this ratio to the EBITDA of the entity for which a valuation is being estimated. Under this approach a liquidity adjustment is often applied due to the difference in liquidity between the generally listed comparable used and the company under valuation. A higher EV/EBITDA multiple will result in a higher fair value.
Financial instruments classified in Level 3 and quantitative information about unobservable inputs
Jun 30, 2016 Fair value in € m. (unless stated otherwise) Assets Liabilities Valuation technique(s) 1
Significant unobservable input(s) (Level 3) Range
Financial instruments held at fair value – held for trading, designated at fair value and available-for-sale: Mortgage- and other asset-backed securities
Commercial mortgage-backed securities 396 0 Price based Price 0 % 176 % Discounted cash flow Credit spread (bps) 130 2,168
Mortgage- and other asset-backed securities 1,412 0 Price based Price 0 % 105 %
Discounted cash flow Credit spread (bps) 91 2,000 Recovery rate 0 % 100 % Constant default rate 0 % 13 % Constant prepayment rate 0 % 40 %
Total mortgage- and other asset-backed securities 1,809 0
Debt securities and other debt obligations 4,032 1,701 Price based Price 0 % 169 % Held for trading 3,636 26 Discounted cash flow Credit spread (bps) 42 1,218
Corporate, sovereign and other debt securities obligations 3,636
Available-for-sale 216 Designated at fair value 180 1,675
Equity securities 997 0 Market approach Price per net asset value 70 % 100 %
Held for trading 306 0 Enterprise value/EBITDA (multiple)
5 17
Designated at fair value 21 Available-for-sale 670 Discounted cash flow Weighted average cost capital 9 % 16 %
Loans 11,249 0 Price based Price 0 % 160 % Held for trading 5,893 0 Discounted cash flow Credit spread (bps) 137 4,612 Designated at fair value 2,785 Constant default rate 0 % 24 % Available-for-sale 2,571 Recovery rate 25 % 82 %
Loan commitments 0 69 Discounted cash flow Credit spread (bps) 6 670 Recovery rate 30 % 75 % Loan pricing model Utilization 0 % 100 %
Other financial instruments 1,565 2 1,477 3 Discounted cash flow IRR 4 % 23 % Repo rate (bps.) 75 131
Total financial instruments held at fair value 19,652 3,247
1 Valuation technique(s) and subsequently the significant unobservable input(s) relate to the respective total position. 2 Other financial assets include € 8 million of other trading assets, € 616 million of other financial assets designated at fair value and € 891 million other financial assets
available for sale. 3 Other financial liabilities include € 1.4 billion of securities sold under repurchase agreements designated at fair value and € 59 million of other financial liabilities designated
at fair value.
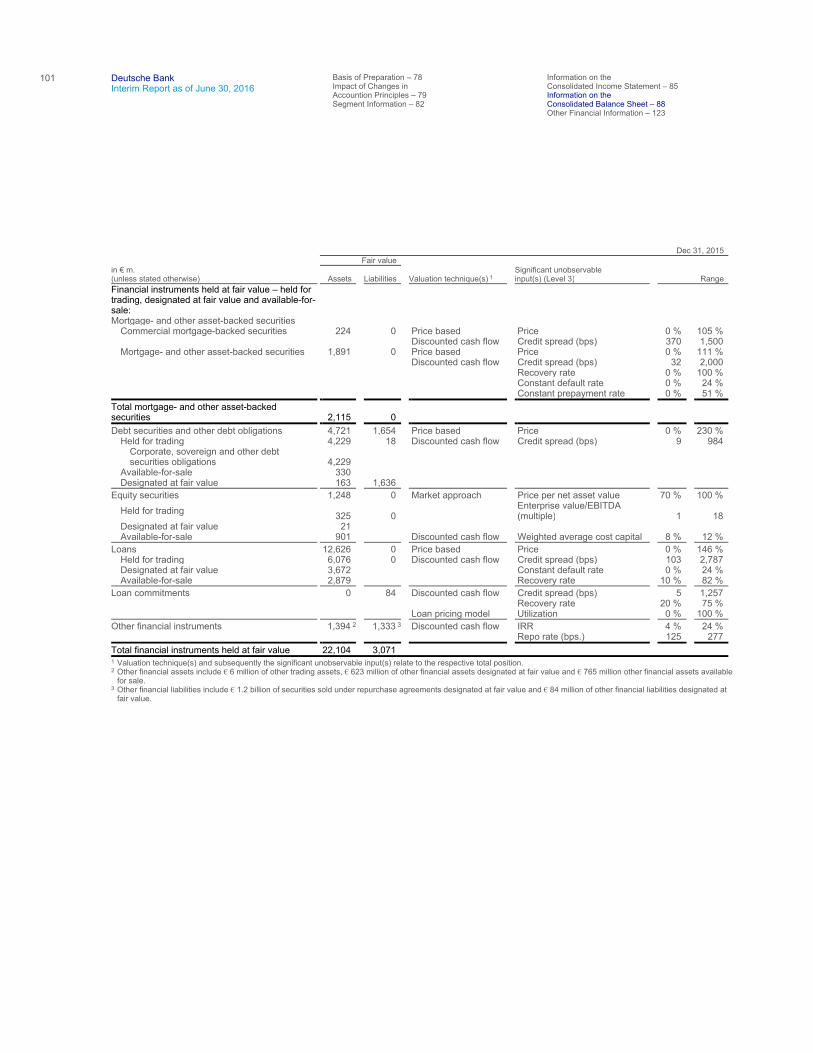
101
Deutsche Bank Interim Report as of June 30, 2016
Basis of Preparation – 78 Impact of Changes in Accountion Principles – 79 Segment Information – 82
Information on the Consolidated Income Statement – 85 Information on the Consolidated Balance Sheet – 88 Other Financial Information – 123
Dec 31, 2015 Fair value in € m. (unless stated otherwise) Assets Liabilities Valuation technique(s) 1
Significant unobservable input(s) (Level 3) Range
Financial instruments held at fair value – held for trading, designated at fair value and available-for-sale: Mortgage- and other asset-backed securities
Commercial mortgage-backed securities 224 0 Price based Price 0 % 105 % Discounted cash flow Credit spread (bps) 370 1,500
Mortgage- and other asset-backed securities 1,891 0 Price based Price 0 % 111 % Discounted cash flow Credit spread (bps) 32 2,000 Recovery rate 0 % 100 % Constant default rate 0 % 24 % Constant prepayment rate 0 % 51 %
Total mortgage- and other asset-backed securities 2,115 0
Debt securities and other debt obligations 4,721 1,654 Price based Price 0 % 230 % Held for trading 4,229 18 Discounted cash flow Credit spread (bps) 9 984
Corporate, sovereign and other debt securities obligations 4,229
Available-for-sale 330 Designated at fair value 163 1,636
Equity securities 1,248 0 Market approach Price per net asset value 70 % 100 %
Held for trading 325 0 Enterprise value/EBITDA (multiple)
1 18
Designated at fair value 21 Available-for-sale 901 Discounted cash flow Weighted average cost capital 8 % 12 %
Loans 12,626 0 Price based Price 0 % 146 % Held for trading 6,076 0 Discounted cash flow Credit spread (bps) 103 2,787 Designated at fair value 3,672 Constant default rate 0 % 24 % Available-for-sale 2,879 Recovery rate 10 % 82 %
Loan commitments 0 84 Discounted cash flow Credit spread (bps) 5 1,257 Recovery rate 20 % 75 % Loan pricing model Utilization 0 % 100 %
Other financial instruments 1,394 2 1,333 3 Discounted cash flow IRR 4 % 24 % Repo rate (bps.) 125 277
Total financial instruments held at fair value 22,104 3,071
1 Valuation technique(s) and subsequently the significant unobservable input(s) relate to the respective total position. 2 Other financial assets include € 6 million of other trading assets, € 623 million of other financial assets designated at fair value and € 765 million other financial assets available
for sale. 3 Other financial liabilities include € 1.2 billion of securities sold under repurchase agreements designated at fair value and € 84 million of other financial liabilities designated at
fair value.
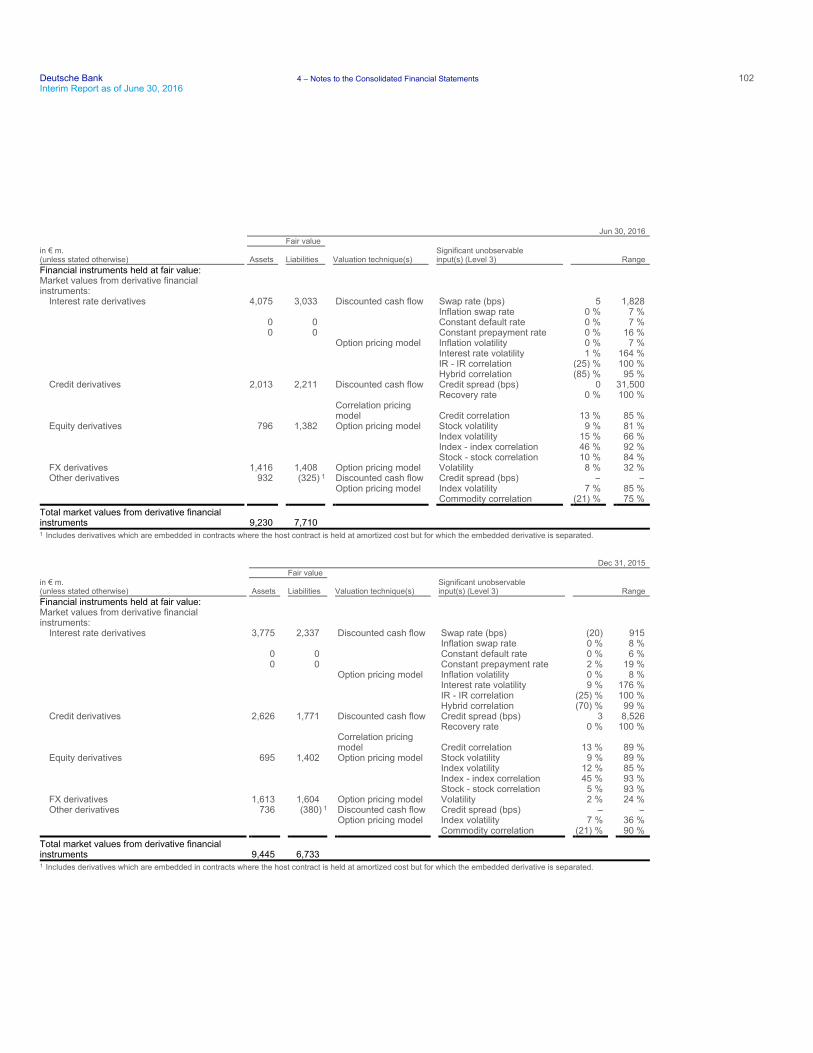
Deutsche Bank 4 – Notes to the Consolidated Financial Statements 102Interim Report as of June 30, 2016
Jun 30, 2016 Fair value in € m. (unless stated otherwise) Assets Liabilities Valuation technique(s)
Significant unobservable input(s) (Level 3) Range
Financial instruments held at fair value: Market values from derivative financial instruments:
Interest rate derivatives 4,075 3,033 Discounted cash flow Swap rate (bps) 5 1,828 Inflation swap rate 0 % 7 %
0 0 Constant default rate 0 % 7 % 0 0 Constant prepayment rate 0 % 16 %
Option pricing model Inflation volatility 0 % 7 % Interest rate volatility 1 % 164 % IR - IR correlation (25) % 100 % Hybrid correlation (85) % 95 %
Credit derivatives 2,013 2,211 Discounted cash flow Credit spread (bps) 0 31,500 Recovery rate 0 % 100 %
Correlation pricing model
Credit correlation 13 % 85 %
Equity derivatives 796 1,382 Option pricing model Stock volatility 9 % 81 % Index volatility 15 % 66 % Index - index correlation 46 % 92 % Stock - stock correlation 10 % 84 %
FX derivatives 1,416 1,408 Option pricing model Volatility 8 % 32 % Other derivatives 932 (325) 1 Discounted cash flow Credit spread (bps) – –
Option pricing model Index volatility 7 % 85 % Commodity correlation (21) % 75 %
Total market values from derivative financial instruments 9,230 7,710
1 Includes derivatives which are embedded in contracts where the host contract is held at amortized cost but for which the embedded derivative is separated.
Dec 31, 2015 Fair value in € m. (unless stated otherwise) Assets Liabilities Valuation technique(s)
Significant unobservable input(s) (Level 3) Range
Financial instruments held at fair value: Market values from derivative financial instruments:
Interest rate derivatives 3,775 2,337 Discounted cash flow Swap rate (bps) (20) 915 Inflation swap rate 0 % 8 %
0 0 Constant default rate 0 % 6 % 0 0 Constant prepayment rate 2 % 19 %
Option pricing model Inflation volatility 0 % 8 % Interest rate volatility 9 % 176 % IR - IR correlation (25) % 100 % Hybrid correlation (70) % 99 %
Credit derivatives 2,626 1,771 Discounted cash flow Credit spread (bps) 3 8,526 Recovery rate 0 % 100 %
Correlation pricing model
Credit correlation 13 % 89 %
Equity derivatives 695 1,402 Option pricing model Stock volatility 9 % 89 % Index volatility 12 % 85 % Index - index correlation 45 % 93 % Stock - stock correlation 5 % 93 %
FX derivatives 1,613 1,604 Option pricing model Volatility 2 % 24 % Other derivatives 736 (380) 1 Discounted cash flow Credit spread (bps) – –
Option pricing model Index volatility 7 % 36 % Commodity correlation (21) % 90 %
Total market values from derivative financial instruments 9,445 6,733
1 Includes derivatives which are embedded in contracts where the host contract is held at amortized cost but for which the embedded derivative is separated.
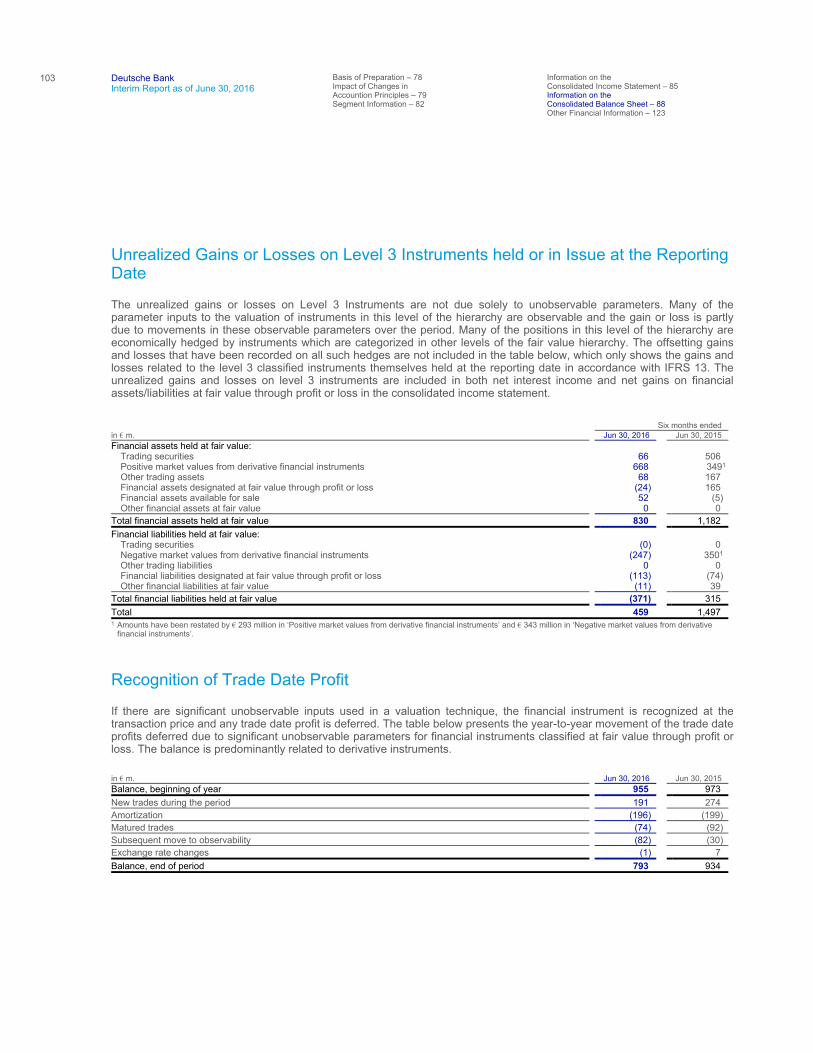
103
Deutsche Bank Interim Report as of June 30, 2016
Basis of Preparation – 78 Impact of Changes in Accountion Principles – 79 Segment Information – 82
Information on the Consolidated Income Statement – 85 Information on the Consolidated Balance Sheet – 88 Other Financial Information – 123
Unrealized Gains or Losses on Level 3 Instruments held or in Issue at the Reporting Date
The unrealized gains or losses on Level 3 Instruments are not due solely to unobservable parameters. Many of the parameter inputs to the valuation of instruments in this level of the hierarchy are observable and the gain or loss is partly due to movements in these observable parameters over the period. Many of the positions in this level of the hierarchy are economically hedged by instruments which are categorized in other levels of the fair value hierarchy. The offsetting gains and losses that have been recorded on all such hedges are not included in the table below, which only shows the gains and losses related to the level 3 classified instruments themselves held at the reporting date in accordance with IFRS 13. The unrealized gains and losses on level 3 instruments are included in both net interest income and net gains on financial assets/liabilities at fair value through profit or loss in the consolidated income statement.
Recognition of Trade Date Profit
If there are significant unobservable inputs used in a valuation technique, the financial instrument is recognized at the transaction price and any trade date profit is deferred. The table below presents the year-to-year movement of the trade date profits deferred due to significant unobservable parameters for financial instruments classified at fair value through profit or loss. The balance is predominantly related to derivative instruments.
Six months ended in € m. Jun 30, 2016 Jun 30, 2015 Financial assets held at fair value:
Trading securities 66 506 Positive market values from derivative financial instruments 668 3491 Other trading assets 68 167 Financial assets designated at fair value through profit or loss (24) 165 Financial assets available for sale 52 (5) Other financial assets at fair value 0 0
Total financial assets held at fair value 830 1,182
Financial liabilities held at fair value: Trading securities (0) 0 Negative market values from derivative financial instruments (247) 3501 Other trading liabilities 0 0 Financial liabilities designated at fair value through profit or loss (113) (74) Other financial liabilities at fair value (11) 39
Total financial liabilities held at fair value (371) 315
Total 459 1,497
1 Amounts have been restated by € 293 million in ‘Positive market values from derivative financial instruments’ and € 343 million in ‘Negative market values from derivative financial instruments’.
in € m. Jun 30, 2016 Jun 30, 2015 Balance, beginning of year 955 973
New trades during the period 191 274
Amortization (196) (199)
Matured trades (74) (92)
Subsequent move to observability (82) (30)
Exchange rate changes (1) 7
Balance, end of period 793 934
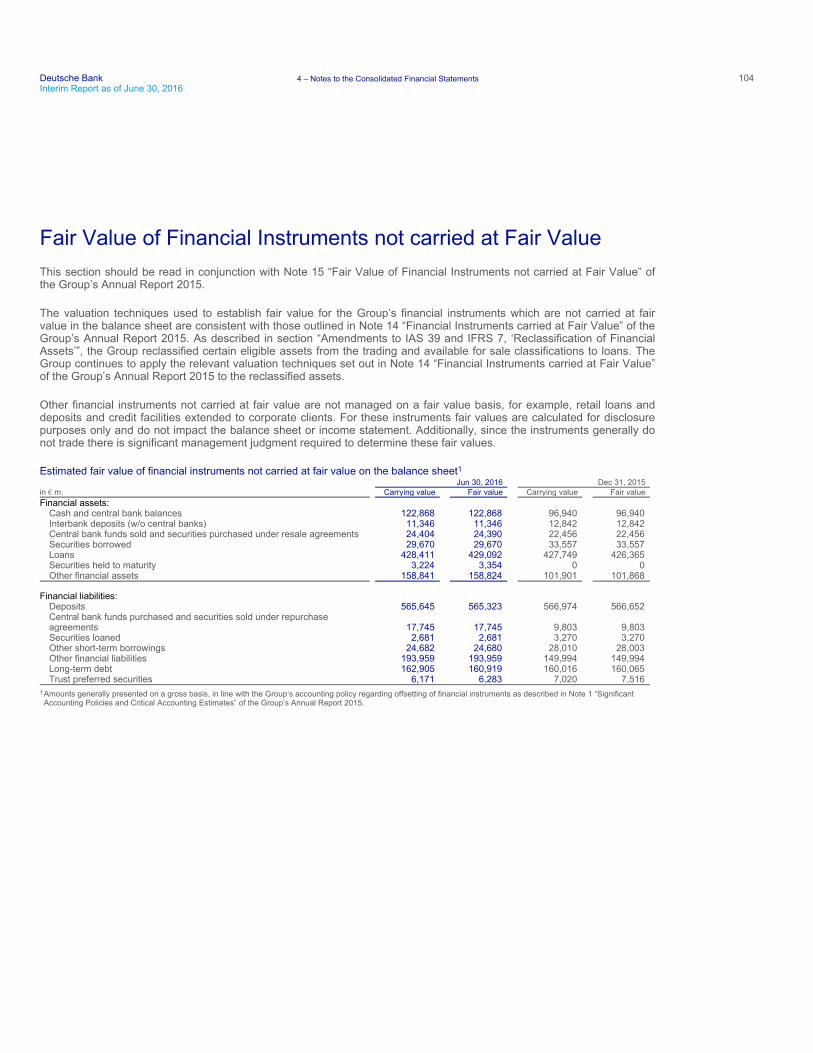
Deutsche Bank 4 – Notes to the Consolidated Financial Statements 104Interim Report as of June 30, 2016
Fair Value of Financial Instruments not carried at Fair Value This section should be read in conjunction with Note 15 “Fair Value of Financial Instruments not carried at Fair Value” of the Group’s Annual Report 2015.
The valuation techniques used to establish fair value for the Group’s financial instruments which are not carried at fair value in the balance sheet are consistent with those outlined in Note 14 “Financial Instruments carried at Fair Value” of the Group’s Annual Report 2015. As described in section “Amendments to IAS 39 and IFRS 7, ‘Reclassification of Financial Assets’”, the Group reclassified certain eligible assets from the trading and available for sale classifications to loans. The Group continues to apply the relevant valuation techniques set out in Note 14 “Financial Instruments carried at Fair Value” of the Group’s Annual Report 2015 to the reclassified assets.
Other financial instruments not carried at fair value are not managed on a fair value basis, for example, retail loans and deposits and credit facilities extended to corporate clients. For these instruments fair values are calculated for disclosure purposes only and do not impact the balance sheet or income statement. Additionally, since the instruments generally do not trade there is significant management judgment required to determine these fair values.
Estimated fair value of financial instruments not carried at fair value on the balance sheet1
Jun 30, 2016 Dec 31, 2015 in € m. Carrying value Fair value Carrying value Fair value Financial assets:
Cash and central bank balances 122,868 122,868 96,940 96,940 Interbank deposits (w/o central banks) 11,346 11,346 12,842 12,842 Central bank funds sold and securities purchased under resale agreements 24,404 24,390 22,456 22,456 Securities borrowed 29,670 29,670 33,557 33,557 Loans 428,411 429,092 427,749 426,365 Securities held to maturity 3,224 3,354 0 0 Other financial assets 158,841 158,824 101,901 101,868
Financial liabilities: Deposits 565,645 565,323 566,974 566,652 Central bank funds purchased and securities sold under repurchase agreements 17,745 17,745 9,803 9,803 Securities loaned 2,681 2,681 3,270 3,270 Other short-term borrowings 24,682 24,680 28,010 28,003 Other financial liabilities 193,959 193,959 149,994 149,994 Long-term debt 162,905 160,919 160,016 160,065 Trust preferred securities 6,171 6,283 7,020 7,516
1Amounts generally presented on a gross basis, in line with the Group’s accounting policy regarding offsetting of financial instruments as described in Note 1 “Significant Accounting Policies and Critical Accounting Estimates” of the Group’s Annual Report 2015.
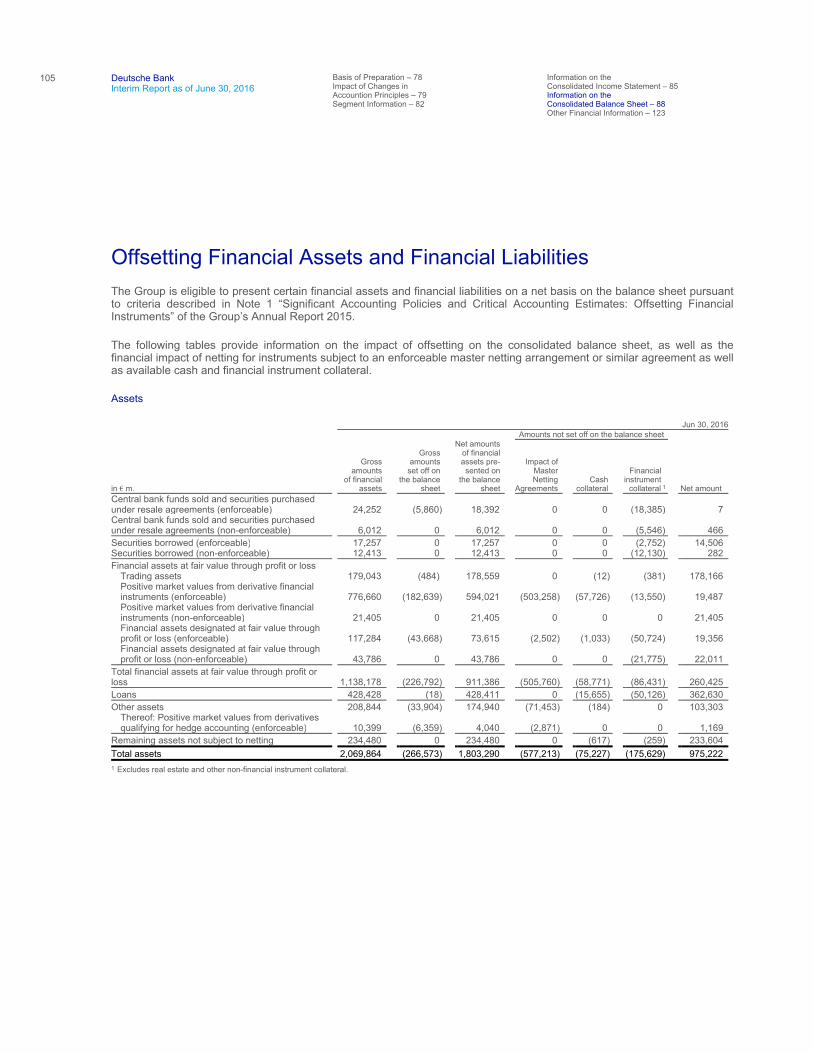
105
Deutsche Bank Interim Report as of June 30, 2016
Basis of Preparation – 78 Impact of Changes in Accountion Principles – 79 Segment Information – 82
Information on the Consolidated Income Statement – 85 Information on the Consolidated Balance Sheet – 88 Other Financial Information – 123
Offsetting Financial Assets and Financial Liabilities The Group is eligible to present certain financial assets and financial liabilities on a net basis on the balance sheet pursuant to criteria described in Note 1 “Significant Accounting Policies and Critical Accounting Estimates: Offsetting Financial Instruments” of the Group’s Annual Report 2015.
The following tables provide information on the impact of offsetting on the consolidated balance sheet, as well as the financial impact of netting for instruments subject to an enforceable master netting arrangement or similar agreement as well as available cash and financial instrument collateral.
Assets
Jun 30, 2016 Amounts not set off on the balance sheet
in € m.
Gross amounts
of financial assets
Gross amounts
set off on the balance
sheet
Net amounts of financial assets pre-
sented on the balance
sheet
Impact of Master Netting
Agreements Cash
collateral
Financial instrument
collateral 1 Net amount Central bank funds sold and securities purchased under resale agreements (enforceable) 24,252 (5,860) 18,392 0 0 (18,385) 7 Central bank funds sold and securities purchased under resale agreements (non-enforceable) 6,012 0 6,012 0 0 (5,546) 466
Securities borrowed (enforceable) 17,257 0 17,257 0 0 (2,752) 14,506 Securities borrowed (non-enforceable) 12,413 0 12,413 0 0 (12,130) 282
Financial assets at fair value through profit or loss Trading assets 179,043 (484) 178,559 0 (12) (381) 178,166 Positive market values from derivative financial instruments (enforceable) 776,660 (182,639) 594,021 (503,258) (57,726) (13,550) 19,487 Positive market values from derivative financial instruments (non-enforceable) 21,405 0 21,405 0 0 0 21,405 Financial assets designated at fair value through profit or loss (enforceable) 117,284 (43,668) 73,615 (2,502) (1,033) (50,724) 19,356 Financial assets designated at fair value through profit or loss (non-enforceable) 43,786 0 43,786 0 0 (21,775) 22,011
Total financial assets at fair value through profit or loss 1,138,178 (226,792) 911,386 (505,760) (58,771) (86,431) 260,425
Loans 428,428 (18) 428,411 0 (15,655) (50,126) 362,630
Other assets 208,844 (33,904) 174,940 (71,453) (184) 0 103,303 Thereof: Positive market values from derivatives qualifying for hedge accounting (enforceable) 10,399 (6,359) 4,040 (2,871) 0 0 1,169
Remaining assets not subject to netting 234,480 0 234,480 0 (617) (259) 233,604
Total assets 2,069,864 (266,573) 1,803,290 (577,213) (75,227) (175,629) 975,222
1 Excludes real estate and other non-financial instrument collateral.
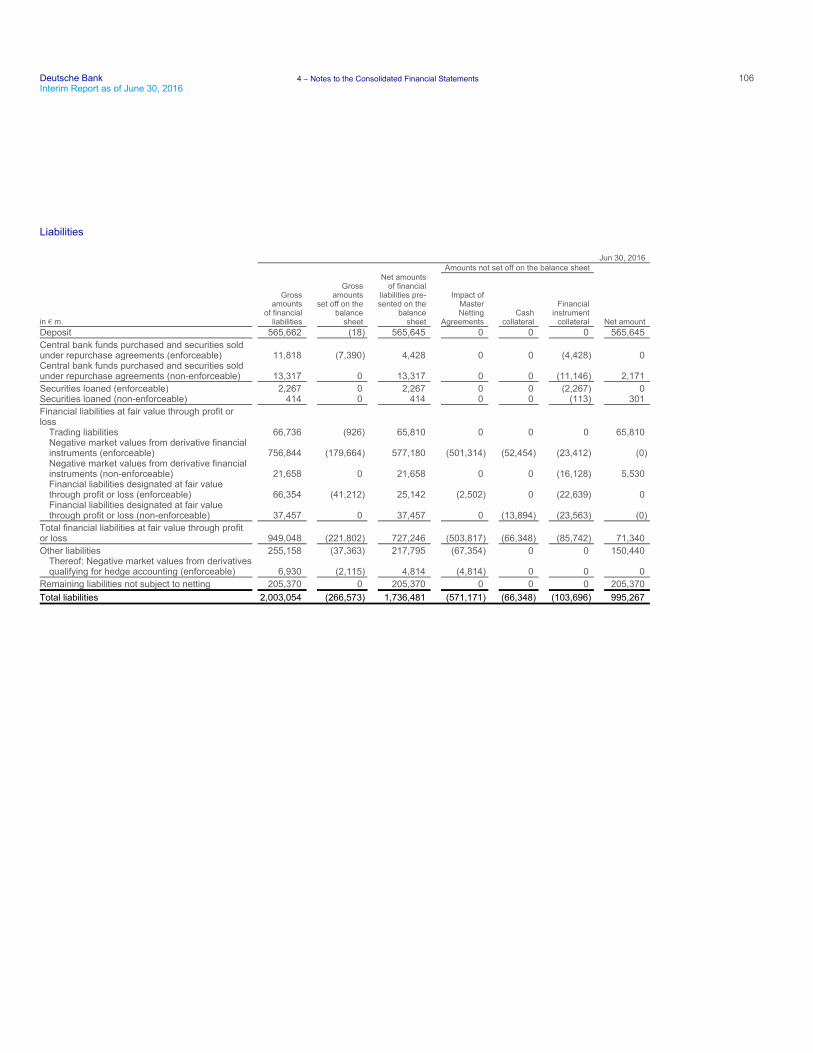
Deutsche Bank 4 – Notes to the Consolidated Financial Statements 106Interim Report as of June 30, 2016
Liabilities
Jun 30, 2016 Amounts not set off on the balance sheet
in € m.
Gross amounts
of financial liabilities
Gross amounts
set off on the balance
sheet
Net amounts of financial
liabilities pre- sented on the
balance sheet
Impact of Master Netting
Agreements Cash
collateral
Financial instrument
collateral Net amount Deposit 565,662 (18) 565,645 0 0 0 565,645
Central bank funds purchased and securities sold under repurchase agreements (enforceable) 11,818 (7,390) 4,428 0 0 (4,428) 0 Central bank funds purchased and securities sold under repurchase agreements (non-enforceable) 13,317 0 13,317 0 0 (11,146) 2,171
Securities loaned (enforceable) 2,267 0 2,267 0 0 (2,267) 0 Securities loaned (non-enforceable) 414 0 414 0 0 (113) 301
Financial liabilities at fair value through profit or loss
Trading liabilities 66,736 (926) 65,810 0 0 0 65,810 Negative market values from derivative financial instruments (enforceable) 756,844 (179,664) 577,180 (501,314) (52,454) (23,412) (0) Negative market values from derivative financial instruments (non-enforceable) 21,658 0 21,658 0 0 (16,128) 5,530 Financial liabilities designated at fair value through profit or loss (enforceable) 66,354 (41,212) 25,142 (2,502) 0 (22,639) 0 Financial liabilities designated at fair value through profit or loss (non-enforceable) 37,457 0 37,457 0 (13,894) (23,563) (0)
Total financial liabilities at fair value through profit or loss 949,048 (221,802) 727,246 (503,817) (66,348) (85,742) 71,340
Other liabilities 255,158 (37,363) 217,795 (67,354) 0 0 150,440 Thereof: Negative market values from derivatives qualifying for hedge accounting (enforceable) 6,930 (2,115) 4,814 (4,814) 0 0 0
Remaining liabilities not subject to netting 205,370 0 205,370 0 0 0 205,370
Total liabilities 2,003,054 (266,573) 1,736,481 (571,171) (66,348) (103,696) 995,267
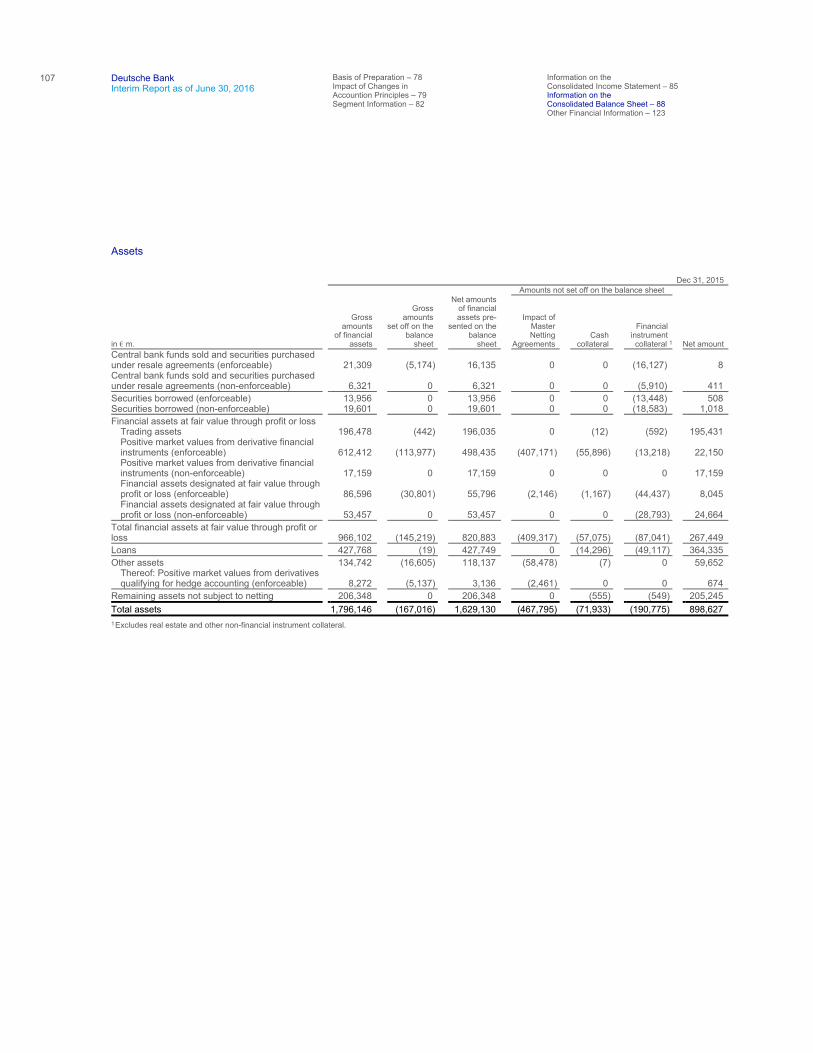
107
Deutsche Bank Interim Report as of June 30, 2016
Basis of Preparation – 78 Impact of Changes in Accountion Principles – 79 Segment Information – 82
Information on the Consolidated Income Statement – 85 Information on the Consolidated Balance Sheet – 88 Other Financial Information – 123
Assets
Dec 31, 2015 Amounts not set off on the balance sheet
in € m.
Gross amounts
of financial assets
Gross amounts
set off on the balance
sheet
Net amounts of financial assets pre-
sented on the balance
sheet
Impact of Master Netting
Agreements Cash
collateral
Financial instrument collateral 1 Net amount
Central bank funds sold and securities purchased under resale agreements (enforceable) 21,309 (5,174) 16,135 0 0 (16,127) 8 Central bank funds sold and securities purchased under resale agreements (non-enforceable) 6,321 0 6,321 0 0 (5,910) 411
Securities borrowed (enforceable) 13,956 0 13,956 0 0 (13,448) 508 Securities borrowed (non-enforceable) 19,601 0 19,601 0 0 (18,583) 1,018
Financial assets at fair value through profit or loss Trading assets 196,478 (442) 196,035 0 (12) (592) 195,431 Positive market values from derivative financial instruments (enforceable) 612,412 (113,977) 498,435 (407,171) (55,896) (13,218) 22,150 Positive market values from derivative financial instruments (non-enforceable) 17,159 0 17,159 0 0 0 17,159 Financial assets designated at fair value through profit or loss (enforceable) 86,596 (30,801) 55,796 (2,146) (1,167) (44,437) 8,045 Financial assets designated at fair value through profit or loss (non-enforceable) 53,457 0 53,457 0 0 (28,793) 24,664
Total financial assets at fair value through profit or loss 966,102 (145,219) 820,883 (409,317) (57,075) (87,041) 267,449
Loans 427,768 (19) 427,749 0 (14,296) (49,117) 364,335
Other assets 134,742 (16,605) 118,137 (58,478) (7) 0 59,652 Thereof: Positive market values from derivatives qualifying for hedge accounting (enforceable) 8,272 (5,137) 3,136 (2,461) 0 0 674
Remaining assets not subject to netting 206,348 0 206,348 0 (555) (549) 205,245
Total assets 1,796,146 (167,016) 1,629,130 (467,795) (71,933) (190,775) 898,627
1Excludes real estate and other non-financial instrument collateral.
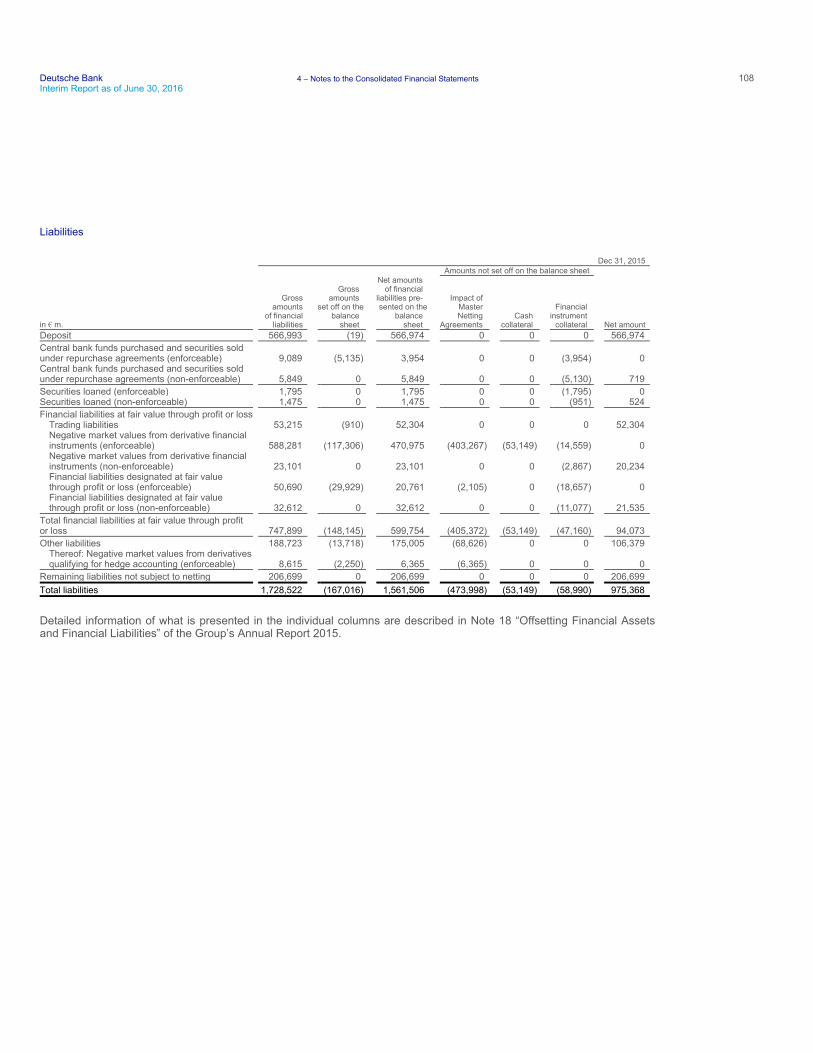
Deutsche Bank 4 – Notes to the Consolidated Financial Statements 108Interim Report as of June 30, 2016
Liabilities
Detailed information of what is presented in the individual columns are described in Note 18 “Offsetting Financial Assets and Financial Liabilities” of the Group’s Annual Report 2015.
Dec 31, 2015 Amounts not set off on the balance sheet
in € m.
Gross amounts
of financial liabilities
Gross amounts
set off on the balance
sheet
Net amounts of financial
liabilities pre- sented on the
balance sheet
Impact of Master Netting
Agreements Cash
collateral
Financial instrument
collateral Net amount Deposit 566,993 (19) 566,974 0 0 0 566,974
Central bank funds purchased and securities sold under repurchase agreements (enforceable) 9,089 (5,135) 3,954 0 0 (3,954) 0 Central bank funds purchased and securities sold under repurchase agreements (non-enforceable) 5,849 0 5,849 0 0 (5,130) 719
Securities loaned (enforceable) 1,795 0 1,795 0 0 (1,795) 0 Securities loaned (non-enforceable) 1,475 0 1,475 0 0 (951) 524
Financial liabilities at fair value through profit or loss Trading liabilities 53,215 (910) 52,304 0 0 0 52,304 Negative market values from derivative financial instruments (enforceable) 588,281 (117,306) 470,975 (403,267) (53,149) (14,559) 0 Negative market values from derivative financial instruments (non-enforceable) 23,101 0 23,101 0 0 (2,867) 20,234 Financial liabilities designated at fair value through profit or loss (enforceable) 50,690 (29,929) 20,761 (2,105) 0 (18,657) 0 Financial liabilities designated at fair value through profit or loss (non-enforceable) 32,612 0 32,612 0 0 (11,077) 21,535
Total financial liabilities at fair value through profit or loss 747,899 (148,145) 599,754 (405,372) (53,149) (47,160) 94,073
Other liabilities 188,723 (13,718) 175,005 (68,626) 0 0 106,379 Thereof: Negative market values from derivatives qualifying for hedge accounting (enforceable) 8,615 (2,250) 6,365 (6,365) 0 0 0
Remaining liabilities not subject to netting 206,699 0 206,699 0 0 0 206,699
Total liabilities 1,728,522 (167,016) 1,561,506 (473,998) (53,149) (58,990) 975,368
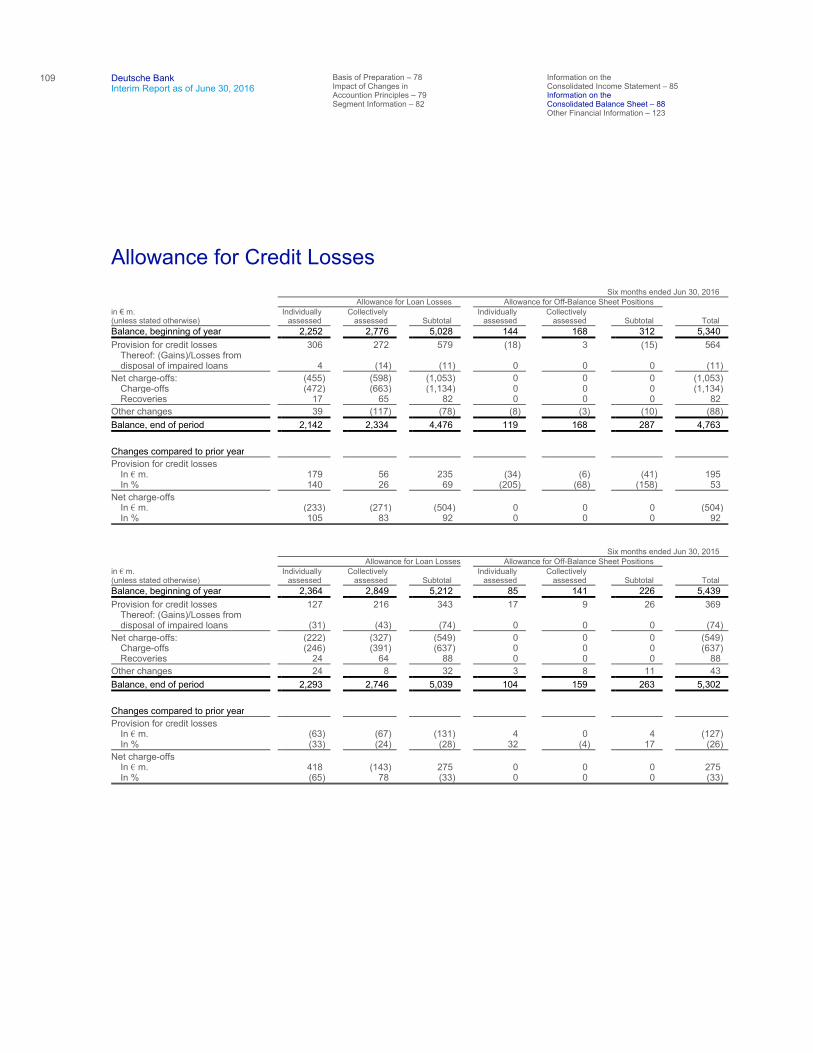
109
Deutsche Bank Interim Report as of June 30, 2016
Basis of Preparation – 78 Impact of Changes in Accountion Principles – 79 Segment Information – 82
Information on the Consolidated Income Statement – 85 Information on the Consolidated Balance Sheet – 88 Other Financial Information – 123
Allowance for Credit Losses Six months ended Jun 30, 2016 Allowance for Loan Losses Allowance for Off-Balance Sheet Positions in € m. (unless stated otherwise)
Individually assessed
Collectively assessed Subtotal
Individually assessed
Collectively assessed Subtotal Total
Balance, beginning of year 2,252 2,776 5,028 144 168 312 5,340
Provision for credit losses 306 272 579 (18) 3 (15) 564 Thereof: (Gains)/Losses from disposal of impaired loans 4 (14) (11) 0 0 0 (11)
Net charge-offs: (455) (598) (1,053) 0 0 0 (1,053) Charge-offs (472) (663) (1,134) 0 0 0 (1,134) Recoveries 17 65 82 0 0 0 82
Other changes 39 (117) (78) (8) (3) (10) (88)
Balance, end of period 2,142 2,334 4,476 119 168 287 4,763
Changes compared to prior year
Provision for credit losses In € m. 179 56 235 (34) (6) (41) 195 In % 140 26 69 (205) (68) (158) 53
Net charge-offs In € m. (233) (271) (504) 0 0 0 (504) In % 105 83 92 0 0 0 92
Six months ended Jun 30, 2015 Allowance for Loan Losses Allowance for Off-Balance Sheet Positions in € m. (unless stated otherwise)
Individually assessed
Collectively assessed Subtotal
Individually assessed
Collectively assessed Subtotal Total
Balance, beginning of year 2,364 2,849 5,212 85 141 226 5,439
Provision for credit losses 127 216 343 17 9 26 369 Thereof: (Gains)/Losses from disposal of impaired loans (31) (43) (74) 0 0 0 (74)
Net charge-offs: (222) (327) (549) 0 0 0 (549) Charge-offs (246) (391) (637) 0 0 0 (637) Recoveries 24 64 88 0 0 0 88
Other changes 24 8 32 3 8 11 43
Balance, end of period 2,293 2,746 5,039 104 159 263 5,302
Changes compared to prior year
Provision for credit losses In € m. (63) (67) (131) 4 0 4 (127) In % (33) (24) (28) 32 (4) 17 (26)
Net charge-offs In € m. 418 (143) 275 0 0 0 275 In % (65) 78 (33) 0 0 0 (33)
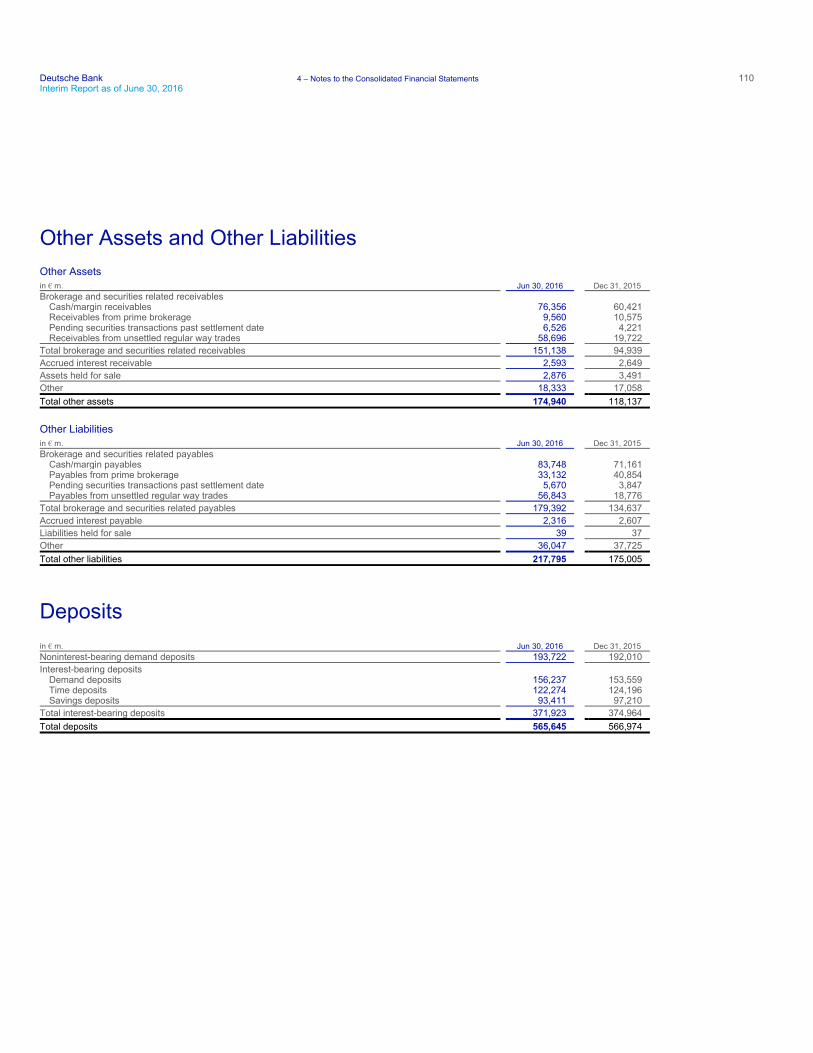
Deutsche Bank 4 – Notes to the Consolidated Financial Statements 110Interim Report as of June 30, 2016
Other Assets and Other Liabilities Other Assets
Other Liabilities
Deposits
in € m. Jun 30, 2016 Dec 31, 2015 Brokerage and securities related receivables
Cash/margin receivables 76,356 60,421 Receivables from prime brokerage 9,560 10,575 Pending securities transactions past settlement date 6,526 4,221 Receivables from unsettled regular way trades 58,696 19,722
Total brokerage and securities related receivables 151,138 94,939
Accrued interest receivable 2,593 2,649
Assets held for sale 2,876 3,491
Other 18,333 17,058
Total other assets 174,940 118,137
in € m. Jun 30, 2016 Dec 31, 2015 Brokerage and securities related payables
Cash/margin payables 83,748 71,161 Payables from prime brokerage 33,132 40,854 Pending securities transactions past settlement date 5,670 3,847 Payables from unsettled regular way trades 56,843 18,776
Total brokerage and securities related payables 179,392 134,637
Accrued interest payable 2,316 2,607
Liabilities held for sale 39 37
Other 36,047 37,725
Total other liabilities 217,795 175,005
in € m. Jun 30, 2016 Dec 31, 2015 Noninterest-bearing demand deposits 193,722 192,010
Interest-bearing deposits Demand deposits 156,237 153,559 Time deposits 122,274 124,196 Savings deposits 93,411 97,210
Total interest-bearing deposits 371,923 374,964
Total deposits 565,645 566,974
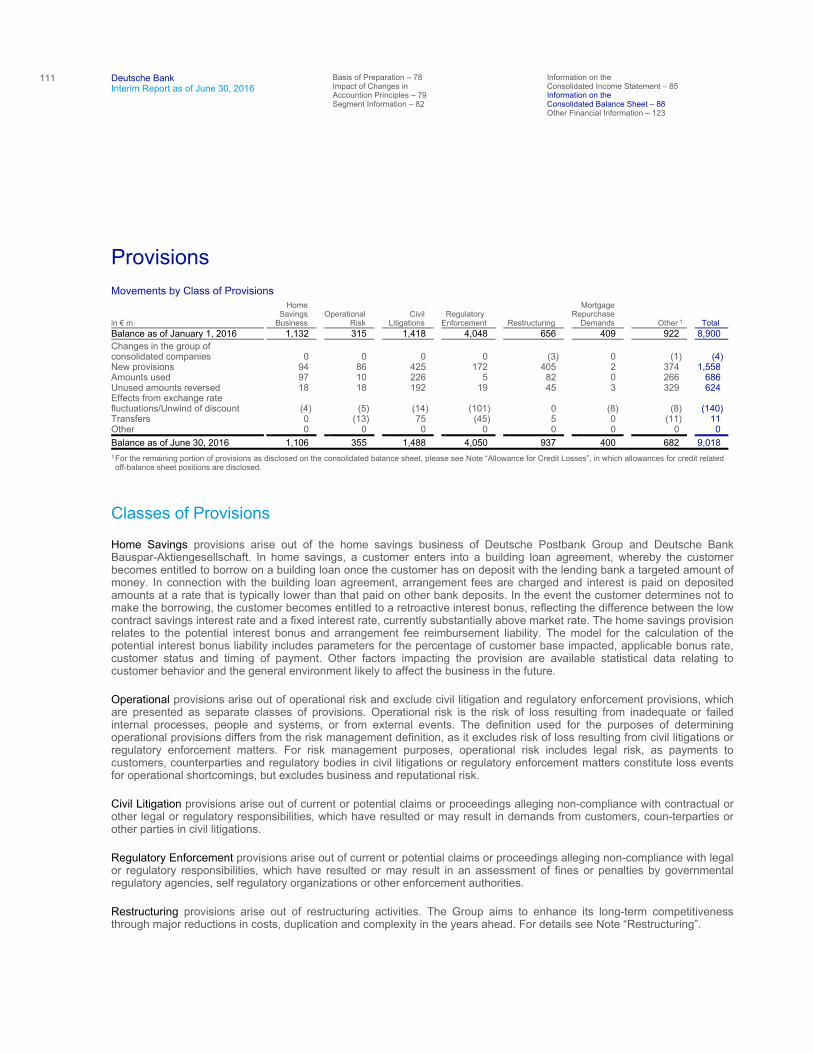
111
Deutsche Bank Interim Report as of June 30, 2016
Basis of Preparation – 78 Impact of Changes in Accountion Principles – 79 Segment Information – 82
Information on the Consolidated Income Statement – 85 Information on the Consolidated Balance Sheet – 88 Other Financial Information – 123
Provisions Movements by Class of Provisions
Classes of Provisions
Home Savings provisions arise out of the home savings business of Deutsche Postbank Group and Deutsche Bank Bauspar-Aktiengesellschaft. In home savings, a customer enters into a building loan agreement, whereby the customer becomes entitled to borrow on a building loan once the customer has on deposit with the lending bank a targeted amount of money. In connection with the building loan agreement, arrangement fees are charged and interest is paid on deposited amounts at a rate that is typically lower than that paid on other bank deposits. In the event the customer determines not to make the borrowing, the customer becomes entitled to a retroactive interest bonus, reflecting the difference between the low contract savings interest rate and a fixed interest rate, currently substantially above market rate. The home savings provision relates to the potential interest bonus and arrangement fee reimbursement liability. The model for the calculation of the potential interest bonus liability includes parameters for the percentage of customer base impacted, applicable bonus rate, customer status and timing of payment. Other factors impacting the provision are available statistical data relating to customer behavior and the general environment likely to affect the business in the future.
Operational provisions arise out of operational risk and exclude civil litigation and regulatory enforcement provisions, which are presented as separate classes of provisions. Operational risk is the risk of loss resulting from inadequate or failed internal processes, people and systems, or from external events. The definition used for the purposes of determining operational provisions differs from the risk management definition, as it excludes risk of loss resulting from civil litigations or regulatory enforcement matters. For risk management purposes, operational risk includes legal risk, as payments to customers, counterparties and regulatory bodies in civil litigations or regulatory enforcement matters constitute loss events for operational shortcomings, but excludes business and reputational risk.
Civil Litigation provisions arise out of current or potential claims or proceedings alleging non-compliance with contractual or other legal or regulatory responsibilities, which have resulted or may result in demands from customers, coun-terparties or other parties in civil litigations.
Regulatory Enforcement provisions arise out of current or potential claims or proceedings alleging non-compliance with legal or regulatory responsibilities, which have resulted or may result in an assessment of fines or penalties by governmental regulatory agencies, self regulatory organizations or other enforcement authorities.
Restructuring provisions arise out of restructuring activities. The Group aims to enhance its long-term competitiveness through major reductions in costs, duplication and complexity in the years ahead. For details see Note “Restructuring”.
in € m.
Home Savings
Business Operational
Risk Civil
Litigations Regulatory
Enforcement Restructuring
Mortgage Repurchase
Demands Other 1 Total Balance as of January 1, 2016 1,132 315 1,418 4,048 656 409 922 8,900
Changes in the group of consolidated companies 0 0 0 0 (3) 0 (1) (4) New provisions 94 86 425 172 405 2 374 1,558 Amounts used 97 10 226 5 82 0 266 686 Unused amounts reversed 18 18 192 19 45 3 329 624 Effects from exchange rate fluctuations/Unwind of discount (4) (5) (14) (101) 0 (8) (8) (140) Transfers 0 (13) 75 (45) 5 0 (11) 11 Other 0 0 0 0 0 0 0 0
Balance as of June 30, 2016 1,106 355 1,488 4,050 937 400 682 9,018
1For the remaining portion of provisions as disclosed on the consolidated balance sheet, please see Note “Allowance for Credit Losses”, in which allowances for credit related off-balance sheet positions are disclosed.
Deutsche Bank 4 – Notes to the Consolidated Financial Statements 112Interim Report as of June 30, 2016
Mortgage Repurchase Demands provisions arise out of Deutsche Bank’s U.S. residential mortgage loan business. From 2005 through 2008, as part of Deutsche Bank’s U.S. residential mortgage loan business, Deutsche Bank sold approximately U.S.$ 84 billion of private label securities and U.S.$ 71 billion of loans through whole loan sales. Deutsche Bank has been presented with demands to repurchase loans from or to indemnify purchasers, investors or financial insurers with respect to losses allegedly caused by material breaches of representations and warranties. Deutsche Bank’s general practice is to process valid repurchase demands that are presented in compliance with contractual rights.
As of June 30, 2016, Deutsche Bank has approximately U.S.$ 2.4 billion of mortgage repurchase demands outstanding and not subject to agreements to rescind (based on original principal balance of the loans). These demands consist primarily of demands made in respect of private label securitizations by the trustees or servicers thereof. Against these outstanding demands, Deutsche Bank recorded provisions of U.S.$ 445 million (€ 400 million) as of June 30, 2016. Deutsche Bank is the beneficiary of indemnity agreements from the originators or sellers of certain of the mortgage loans subject to these demands, with respect to which Deutsche Bank has recognized receivables of U.S.$ 110 million (€ 99 million) as of June 30, 2016. The net provisions against these demands following deduction of such receivables were U.S.$ 335 million (€ 301 million) as of June 30, 2016.
As of June 30, 2016, Deutsche Bank has completed repurchases, obtained agreements to rescind, settled or rejected as untimely claims on loans with an original principal balance of approximately U.S.$ 7.3 billion. In connection with those repurchases, agreements and settlements, Deutsche Bank has obtained releases for potential claims on approximately U.S.$ 93.1 billion of loans sold by Deutsche Bank as described above.
Deutsche Bank has entered into agreements with certain entities that have threatened to assert mortgage loan repurchase demands against Deutsche Bank to toll the relevant statutes of limitations. It is possible that these potential demands may have a material impact on Deutsche Bank.
Deutsche Bank anticipates that additional mortgage repurchase demands may be made in respect of mortgage loans that it has sold, but cannot reliably estimate their timing or amount. On June 11, 2015, the New York Court of Appeals issued a ruling affirming dismissal of mortgage repurchase claims asserted in litigation relating to a residential mortgage-backed security issued by Deutsche Bank on the grounds that the action was not timely commenced. This and related decisions could impact the extent to which future repurchase demands are made to Deutsche Bank and the likelihood of success of any such claims. Deutsche Bank did not act as servicer for the loans sold to third parties as whole loans (which constitute almost half of all U.S. residential mortgage loans sold from 2005 through 2008) and, once sold, Deutsche Bank ceased to have access to information about their performance. While loan performance is publicly available on the mortgage loans that Deutsche Bank securitized, no direct correlation has been observed between their performance and repurchase demands received. Demands have been received on loans that have defaulted, as well as loans that are current and loans that have been repaid in full.
Other provisions include several specific items arising from a variety of different circumstances, including the provision for the reimbursement of loan processing fees, deferred sales commissions, provisions for bank levies and a provision under the credit card business cooperation of Deutsche Bank and Hua Xia Bank Co. Ltd.
Provisions and Contingent Liabilities
The Group recognizes a provision for potential loss only when there is a present obligation arising from a past event that is probable to result in an economic outflow that can be reliably estimated. Where a reliable estimate cannot be made for such an obligation, no provision is recognized and the obligation is deemed a contingent liability. Contingent liabilities also include possible obligations for which the possibility of future economic outflow is more than remote but less than probable. Where a provision has been taken for a particular claim, no contingent liability is recorded; for matters or sets of matters consisting of more than one claim, however, provisions may be recorded for some claims, and contingent liabilities (or neither a provision nor a contingent liability) may be recorded for others.
113
Deutsche Bank Interim Report as of June 30, 2016
Basis of Preparation – 78 Impact of Changes in Accountion Principles – 79 Segment Information – 82
Information on the Consolidated Income Statement – 85 Information on the Consolidated Balance Sheet – 88 Other Financial Information – 123
The Group operates in a legal and regulatory environment that exposes it to significant litigation risks. As a result, the Group is involved in litigation, arbitration and regulatory proceedings and investigations in Germany and in a number of jurisdictions outside Germany, including the United States. In recent years, regulation and supervision in a number of areas have increased, and regulators, governmental bodies and others have sought to subject financial services providers to increasing oversight and scrutiny, which in turn has led to additional regulatory investigations and enforcement actions which are often followed by civil litigation. This trend has accelerated markedly as a result of the global financial crisis and the European sovereign debt crisis.
In determining for which of the claims the possibility of a loss is probable, or less than probable but more than remote, and then estimating the possible loss for those claims, the Group takes into consideration a number of factors, including but not limited to the nature of the claim and its underlying facts, the procedural posture and litigation history of each case, rulings by the courts or tribunals, the Group’s experience and the experience of others in similar cases (to the extent this is known to the Group), prior settlement discussions, settlements by others in similar cases (to the extent this is known to the Group), available indemnities and the opinions and views of legal counsel and other experts.
The provisions the Group has recognized for civil litigation and regulatory enforcement matters as of June 30, 2016 are set forth in the table above. For some matters for which the Group believes an outflow of funds is probable, no provisions were recognized as the Group could not reliably estimate the amount of the potential outflow.
For the matters for which a reliable estimate can be made, the Group currently estimates that, as of June 30, 2016, the aggregate future loss of which the possibility is more than remote but less than probable is approximately € 1.0 billion for civil litigation matters (December 31, 2015: € 1.4 billion) and € 0.7 billion for regulatory enforcement matters (December 31, 2015: € 1.0 billion). These figures include matters where the Group’s potential liability is joint and several and where the Group expects any such liability to be paid by a third party. For other significant civil litigation and regulatory enforcement matters, the Group believes the possibility of an outflow of funds is more than remote but less than probable but the amount is not reliably estimable, and accordingly such matters are not included in the contingent liability estimates. For still other significant civil litigation and regulatory enforcement matters, the Group believes the possibility of an outflow of funds is remote and therefore has neither recognized a provision nor included them in the contingent liability estimates.
This estimated possible loss, as well as any provisions taken, is based upon currently available information and is subject to significant judgment and a variety of assumptions, variables and known and unknown uncertainties. These uncertainties may include inaccuracies in or incompleteness of the information available to the Group, particularly at the preliminary stages of matters, and assumptions by the Group as to future rulings of courts or other tribunals or the likely actions or positions taken by regulators or adversaries may prove incorrect. Moreover, estimates of possible loss for these matters are often not amenable to the use of statistical or other quantitative analytical tools frequently used in making judgments and estimates, and are subject to even greater degrees of uncertainty than in many other areas where the Group must exercise judgment and make estimates. The estimated possible loss, as well as any provisions taken, can be and often are substantially less than the amount initially requested by regulators or adversaries or the maximum potential loss that could be incurred were the matters to result in a final adjudication adverse to the Group. Moreover, in several regions in which the Group operates, an adversary often is not required to set forth the amount it is seeking, and where it is, the amount may not be subject to the same requirements that generally apply to pleading factual allegations or legal claims.
The matters for which the Group determines that the possibility of a future loss is more than remote will change from time to time, as will the matters as to which a reliable estimate can be made and the estimated possible loss for such matters. Actual results may prove to be significantly higher or lower than the estimate of possible loss in those matters where such an estimate was made. In addition, loss may be incurred in matters with respect to which the Group believed the likelihood of loss was remote. In particular, the estimated aggregate possible loss does not represent the Group’s potential maximum loss exposure for those matters.
The Group may settle litigation or regulatory proceedings or investigations prior to a final judgment or determination of liability. It may do so to avoid the cost, management efforts or negative business, regulatory or reputational consequences of continuing to contest liability, even when the Group believes it has valid defenses to liability. It may also do so when the potential consequences of failing to prevail would be disproportionate to the costs of settlement. Furthermore, the Group may, for similar reasons, reimburse counterparties for their losses even in situations where it does not believe that it is legally compelled to do so.
Deutsche Bank 4 – Notes to the Consolidated Financial Statements 114Interim Report as of June 30, 2016
Current Individual Proceedings
Set forth below are descriptions of civil litigation and regulatory enforcement matters or groups of matters for which the Group has taken material provisions, or for which there are material contingent liabilities that are more than remote, or for which there is the possibility of material business or reputational risk; similar matters are grouped together and some matters consist of a number of proceedings or claims. The disclosed matters include matters for which the possibility of a loss is more than remote but for which the Group cannot reliably estimate the possible loss.
Esch Funds Litigation. Sal. Oppenheim jr. & Cie. AG & Co. KGaA (“Sal. Oppenheim”) was prior to its acquisition by Deutsche Bank in 2010 involved in the marketing and financing of participations in closed end real estate funds. These funds were structured as Civil Law Partnerships under German law. Usually, Josef Esch Fonds-Projekt GmbH performed the planning and project development. Sal. Oppenheim held an indirect interest in this company via a joint-venture. In relation to this business a number of civil claims have been filed against Sal. Oppenheim. Some but not all of these claims are also directed against former managing partners of Sal. Oppenheim and other individuals. The claims brought against Sal. Oppenheim relate to investments of originally approximately € 1.1 billion. After certain claims have either been dismissed or settled, claims relating to investments of originally approximately € 400 million are still pending. Currently, the aggregate amounts claimed in the pending proceedings are approximately € 490 million. The investors are seeking to unwind their fund participation and to be indemnified against potential losses and debt related to the investment. The claims are based in part on an alleged failure of Sal. Oppenheim to provide adequate information on related risks and other material aspects important for the investors’ decision. Based on the facts of the individual cases, some courts have decided in favor and some against Sal. Oppenheim. Appeals are pending. The Group has recorded provisions and contingent liabilities with respect to these cases but has not disclosed the amounts thereof because it has concluded that such disclosure can be expected to prejudice seriously their outcome.
FX Investigations and Litigations. Deutsche Bank has received requests for information from certain regulatory and law enforcement agencies globally who are investigating trading in, and various other aspects of, the foreign exchange market. Deutsche Bank is cooperating with these investigations. Relatedly, Deutsche Bank is conducting its own internal global review of foreign exchange trading and other aspects of its foreign exchange business.
Deutsche Bank also is a defendant in three putative class actions brought in the U.S. District Court for the Southern District of New York relating to the alleged manipulation of foreign exchange rates. The complaints in the class actions do not specify the damages sought. The pending consolidated action is brought on behalf of a putative class of over-the-counter traders and a putative class of central-exchange traders, who are domiciled in or traded in the United States or its territories, and alleges illegal agreements to restrain competition with respect to and to manipulate both benchmark rates and spot rates, particularly the spreads quoted on those spot rates; the complaint further alleges that those supposed conspiracies, in turn, resulted in artificial prices on centralized exchanges for foreign exchange futures and options. A second action tracks the allegations in the consolidated action and asserts that such alleged conduct gave rise to, and resulted in a breach of, defendants’ fiduciary duties under the U.S. Employment Retirement Income Security Act of 1974 (ERISA). The third putative class action was filed by Axiom Investment Advisors, LLC alleging that Deutsche Bank rejected FX orders placed over electronic trading platforms through the application of a function referred to as “Last Look” and that these orders were later filled at prices less favorable to putative class members. Plaintiff has asserted claims for breach of contract, quasi-contractual claims, and claims under New York statutory law. Motions to dismiss all three actions have been filed and are pending. Discovery has commenced in all three actions.
Deutsche Bank also has been named as a defendant in two Canadian class proceedings brought in the provinces of Ontario and Quebec. Filed on September 10, 2015, these class actions assert factual allegations similar to those made in the consolidated action in the United States and seek damages pursuant to the Canadian Competition Act as well as other causes of action.
115
Deutsche Bank Interim Report as of June 30, 2016
Basis of Preparation – 78 Impact of Changes in Accountion Principles – 79 Segment Information – 82
Information on the Consolidated Income Statement – 85 Information on the Consolidated Balance Sheet – 88 Other Financial Information – 123
The Group has not disclosed whether it has established a provision or contingent liability with respect to these matters because it has concluded that such disclosure can be expected to prejudice seriously their outcome.
High Frequency Trading/Dark Pool Trading. Deutsche Bank has received requests for information from certain regulatory authorities related to high frequency trading and the operation of Deutsche Bank’s alternative trading system (“ATS” or “Dark Pool”), SuperX. The Bank is cooperating with these requests. The Group has recorded a provision with respect to this matter. The Group has not disclosed the amount of this provision because it has concluded that such disclosure can be expected to prejudice seriously the outcome of this matter.
Interbank Offered Rates Matters. Regulatory Enforcement Matters. Deutsche Bank has received requests for information from various regulatory and law enforcement agencies in Europe, North America and Asia/Pacific, including various U.S. state attorneys general, in connection with industry-wide investigations concerning the setting of the Lon-don Interbank Offered Rate (LIBOR), Euro Interbank Offered Rate (EURIBOR), Tokyo Interbank Offered Rate (TIBOR) and other interbank offered rates. Deutsche Bank is cooperating with these investigations.
As previously reported, Deutsche Bank reached a settlement with the European Commission on December 4, 2013 as part of a collective settlement to resolve the European Commission’s investigations in relation to anticompetitive conduct in the trading of Euro interest rate derivatives and Yen interest rate derivatives. Under the terms of the settlement agreement, Deutsche Bank agreed to pay € 725 million in total. This fine has been paid in full and does not form part of the Bank’s provisions.
Also as previously reported, on April 23, 2015, Deutsche Bank entered into separate settlements with the U.S. Department of Justice (DOJ), the U.S. Commodity Futures Trading Commission (CFTC), the U.K. Financial Conduct Authority (FCA), and the New York State Department of Financial Services (NYSDFS) to resolve investigations into misconduct concerning the setting of LIBOR, EURIBOR, and TIBOR. Under the terms of these agreements, Deutsche Bank agreed to pay penalties of U.S.$ 2.175 billion to the DOJ, CFTC and NYSDFS and GBP 226.8 million to the FCA. These fines have been paid in full and do not form part of the Bank’s provisions, save for U.S. $ 150 million that is payable to the DOJ, subject to court approval, following the sentencing of DB Group Services (UK) Ltd. (an indirectly-held, wholly-owned subsidiary of Deutsche Bank) in connection with its guilty plea to one count of wire fraud (currently scheduled for October 7, 2016). As part of the resolution with the DOJ, Deutsche Bank entered into a Deferred Prosecution Agreement with a three year term pursuant to which it agreed (among other things) to the filing of an Information in the U.S. District Court for the District of Connecticut charging Deutsche Bank with one count of wire fraud and one count of price fixing in violation of the Sherman Act.
As reported above, Deutsche Bank is subject to an inquiry by a working group of U.S. state attorneys general in relation to the setting of LIBOR, EURIBOR, and TIBOR. The Bank continues to cooperate with the U.S. state attorneys generals’ inquiry.
Other regulatory investigations of Deutsche Bank concerning the setting of various interbank offered rates remain ongoing, and Deutsche Bank remains exposed to further regulatory action. The Group has recorded provisions with respect to certain of the regulatory investigations. The Group has not disclosed the amount of such provisions because it has concluded that such disclosure can be expected to prejudice seriously the outcome of these regulatory investigations.
Overview of Civil Litigations. Deutsche Bank is party to 47 civil actions concerning alleged manipulation relating to the setting of various Interbank Offered Rates which are described in the following paragraphs. Most of the civil actions, including putative class actions, are pending in the U.S. District Court for the Southern District of New York (SDNY), against Deutsche Bank and numerous other defendants. All but six of the civil actions were filed on behalf of parties who allege losses as a result of manipulation relating to the setting of U.S. dollar LIBOR. The six civil actions pending against Deutsche Bank that do not relate to U.S. dollar LIBOR are also pending in the SDNY, and include two actions concerning Yen LIBOR and Euroyen TIBOR, one action concerning EURIBOR, one consolidated action concerning Pound Sterling (GBP) LIBOR, one action concerning Swiss franc (CHF) LIBOR and one action concerning two Singa-pore Dollar (SGD) benchmark rates, the Singapore Interbank Offered Rate (SIBOR) and the Swap Offer Rate (SOR).
Deutsche Bank 4 – Notes to the Consolidated Financial Statements 116Interim Report as of June 30, 2016
With one exception, all of the civil actions pending in the SDNY concerning U.S. dollar LIBOR are being coordinated as part of a multidistrict litigation (the “U.S. dollar LIBOR MDL”). There is one non-MDL class action concerning U.S. dollar LIBOR that was dismissed and for which an appeal is pending in the U.S. Court of Appeals for the Ninth Circuit.
Claims for damages for all 47 of the civil actions discussed have been asserted under various legal theories, including violations of the U.S. Commodity Exchange Act (CEA), federal and state antitrust laws, the U.S. Racketeer Influenced and Corrupt Organizations Act (RICO), and other federal and state laws. In all but five cases, the amount of damages has not been formally articulated by the plaintiffs. The five cases that allege a specific amount of damages are individual actions consolidated in the U.S. dollar LIBOR MDL and seek a minimum of more than U.S.$ 1.25 billion in damages in the aggregate from all defendants including Deutsche Bank. The Group has not disclosed whether it has established a provision or contingent liability with respect to these matters because it has concluded that such disclosure can be expected to prejudice seriously their outcome.
U.S. dollar LIBOR. Following a series of decisions between March 2013 and November 2015 narrowing their claims, plaintiffs are currently asserting CEA claims and state law fraud, contract, unjust enrichment, and other tort claims. The court has also issued decisions dismissing certain plaintiffs’ claims for lack of personal jurisdiction and on statute of limitations grounds, which are currently the subject of additional briefing; further decisions are pending.
In May 2016, the U.S. Court of Appeals for the Second Circuit reversed the MDL court’s rulings dismissing plaintiffs’ antitrust claims and remanded for further consideration the issue of whether plaintiffs have standing to pursue their antitrust claims. That issue is currently being briefed. In addition, certain plaintiffs whose claims against Deutsche Bank and other foreign defendants were dismissed for lack of personal jurisdiction are in the process of pursuing an appeal from that decision to the Second Circuit.
Finally, discovery is underway in three of the earliest-filed cases, with motions for class certification currently scheduled to be briefed by August 2017.
The court in an additional action concerning U.S. dollar LIBOR that was independently pending in the SDNY, outside of the U.S. dollar LIBOR MDL, has granted defendants’ motions to dismiss. The plaintiff has filed a motion to amend its complaint, which is pending.
Deutsche Bank also was named as a defendant in a civil action in the Central District of California concerning U.S. dollar LIBOR. The court granted Deutsche Bank’s motion to dismiss. The plaintiff is currently pursuing an appeal to the U.S. Court of Appeals for the Ninth Circuit.
Yen LIBOR and Euroyen TIBOR. There are two separate actions pending in the SDNY concerning the alleged manipulation of Yen LIBOR and Euroyen TIBOR. The first case, Laydon, is currently in discovery. The second, Sonterra, is the subject of a fully briefed and argued motion to dismiss; a decision is pending.
EURIBOR, GBP LIBOR and CHF LIBOR. These actions, pending in the SDNY, are the subject of fully briefed motions to dismiss. Decisions are pending.
SIBOR and SOR: This complaint was filed in the SDNY on July 1, 2016, and has not yet been served on Deutsche Bank.
Kaupthing CLN Claims. In June 2012, Kaupthing hf, an Icelandic stock corporation, acting through its winding-up committee, issued Icelandic law clawback claims for approximately € 509 million (plus costs, as well as interest calculated on a damages rate basis and a late payment rate basis) against Deutsche Bank in both Iceland and England. The claims relate to leveraged credit linked notes (“CLNs”), referencing Kaupthing, issued by Deutsche Bank to two British Virgin Island special purpose vehicles (“SPVs”) in 2008. The SPVs were ultimately owned by high net worth individuals. Kaupthing claims to have funded the SPVs and alleges that Deutsche Bank was or should have been aware that Kaupthing itself was economically exposed in the transactions. Kaupthing claims that the transactions are voidable by Kaupthing on a number of alternative grounds, including the ground that the transactions were improper because one of the alleged purposes of the transactions was to allow Kaupthing to influence the market in its own CDS (credit
117
Deutsche Bank Interim Report as of June 30, 2016
Basis of Preparation – 78 Impact of Changes in Accountion Principles – 79 Segment Information – 82
Information on the Consolidated Income Statement – 85 Information on the Consolidated Balance Sheet – 88 Other Financial Information – 123
default swap) spreads and thereby its listed bonds. Additionally, in November 2012, an English law claim (with allegations similar to those featured in the Icelandic law claims) was commenced by Kaupthing against Deutsche Bank in London. Deutsche Bank filed a defense in the Icelandic proceedings in late February 2013 and continues to defend the claims. In February 2014, proceedings in England were stayed pending final determination of the Icelandic proceedings. Additionally, in December 2014, the SPVs and their joint liquidators served Deutsche Bank with substantively similar claims arising out of the CLN transactions against Deutsche Bank and other defendants in England. The SPVs are also claiming approximately € 509 million (plus costs, as well as interest), although the amount of that interest claim is less than in Iceland. Deutsche Bank has filed a defense in these proceedings and continues to defend them. The SPVs’ claims are not expected to increase Deutsche Bank’s overall potential liability in respect of the CLN transactions beyond the amount already claimed by Kaupthing. The Group has not disclosed whether it has established a provision or contingent liability with respect to these matters because it has concluded that such disclosure can be expected to prejudice seriously their outcome.
Kirch. The public prosecutor’s office in Munich (Staatsanwaltschaft München I) has conducted and is currently conducting criminal investigations in connection with the Kirch case inter alia with regard to former Deutsche Bank Management Board members. The Kirch case involved several civil proceedings between Deutsche Bank AG and Dr. Leo Kirch as well as media companies controlled by him. The key issue was whether an interview given by Dr. Rolf Breuer, then Spokesman of Deutsche Bank’s Management Board, in 2002 with Bloomberg television, during which Dr. Breuer commented on Dr. Kirch’s (and his companies’) inability to obtain financing, caused the insolvency of the Kirch companies. In February 2014, Deutsche Bank and the Kirch heirs reached a comprehensive settlement, which has ended all legal disputes between them.
The allegations of the public prosecutor are that the relevant former Management Board members failed to correct in a timely manner factual statements made by Deutsche Bank’s litigation counsel in submissions filed in one of the civil cases between Kirch and Deutsche Bank AG before the Munich Higher Regional Court and the Federal Court of Justice, after allegedly having become aware that such statements were not correct, and/or made incorrect statements in such proceedings, respectively.
The main investigation involving Mr. Juergen Fitschen and four other former Management Board members has been concluded and an indictment against all accused was filed on August 6, 2014. The court ordered the secondary participation of Deutsche Bank AG, which could have resulted in the imposition of a monetary fine on the Bank. On April 25, 2016, the Munich District Court acquitted Mr. Fitschen and the four other former Management Board members. Further, the court acquitted the Bank. On April 26, 2016, the public prosecutor filed an appeal. An appeal is limited to a review of legal errors rather than facts.
The other investigation by the public prosecutor is ongoing. Deutsche Bank is fully cooperating with the Munich public prosecutor’s office.
The Group does not expect these proceedings to have significant economic consequences for it and has not recorded a provision or contingent liability with respect thereto.
KOSPI Index Unwind Matters. Following the decline of the Korea Composite Stock Price Index 200 (the “KOSPI 200”) in the closing auction on November 11, 2010 by approximately 2.7 %, the Korean Financial Supervisory Service (“FSS”) commenced an investigation and expressed concerns that the fall in the KOSPI 200 was attributable to a sale by Deutsche Bank of a basket of stocks, worth approximately € 1.6 billion, that was held as part of an index arbitrage position on the KOSPI 200. On February 23, 2011, the Korean Financial Services Commission, which oversees the work of the FSS, reviewed the FSS’ findings and recommendations and resolved to take the following actions: (i) to file a criminal complaint to the Korean Prosecutor’s Office for alleged market manipulation against five employees of the Deutsche Bank group and Deutsche Bank’s subsidiary Deutsche Securities Korea Co. (DSK) for vicarious corporate criminal liability; and (ii) to impose a suspension of six months, commencing April 1, 2011 and ending Septem-ber 30, 2011, of DSK’s business for proprietary trading of cash equities and listed derivatives and DMA (direct market access) cash equities trading, and the requirement that DSK suspend the employment of one named employee for six months. There was an exemption to the business suspension which permitted DSK to continue acting as liquidity provider for existing derivatives linked securities. On August 19, 2011, the Korean Prosecutor’s Office announced its
Deutsche Bank 4 – Notes to the Consolidated Financial Statements 118Interim Report as of June 30, 2016
decision to indict DSK and four employees of the Deutsche Bank group on charges of spot/futures linked market manipulation. The criminal trial commenced in January 2012. On January 25, 2016, the Seoul Central District Court rendered a guilty verdict against a DSK trader and a guilty verdict against DSK. A criminal fine of KRW 1.5 billion (less than € 2.0 million) was imposed on DSK. The Court also ordered forfeiture of the profits generated on the underlying trading activity. The Group disgorged the profits on the underlying trading activity in 2011. The criminal trial verdict has been appealed by both the prosecutor and the defendants.
In addition, a number of civil actions have been filed in Korean courts against Deutsche Bank and DSK by certain parties who allege they incurred losses as a consequence of the fall in the KOSPI 200 on November 11, 2010. First instance court decisions were rendered against the Bank and DSK in some of these cases starting in the fourth quarter of 2015. The outstanding known claims have an aggregate claim amount of less than € 50 million (at present exchange rates). The Group has recorded a provision with respect to these outstanding civil matters. The Group has not disclosed the amount of this provision because it has concluded that such disclosure can be expected to prejudice seriously the outcome of these matters.
Mortgage-Related and Asset-Backed Securities Matters and Investigation. Regulatory and Governmental Matters. Deutsche Bank, along with certain affiliates (collectively referred in these paragraphs to as “Deutsche Bank”), have received subpoenas and requests for information from certain regulators and government entities, including members of the Residential Mortgage-Backed Securities Working Group of the U.S. Financial Fraud Enforcement Task Force, concerning its activities regarding the origination, purchase, securitization, sale and/or trading of mortgage loans, residential mortgage-backed securities (RMBS), commercial mortgage-backed securities (CMBS), collateralized debt obligations (CDOs), other asset-backed securities and credit derivatives. Deutsche Bank is cooperating fully in response to those subpoenas and requests for information. Deutsche Bank has begun discussions with the U.S. Department of Justice (DOJ) concerning a potential settlement of claims that the DOJ may consider bringing based on its investigation of Deutsche Bank’s RMBS origination and securitization activities. Deutsche Bank has entered into a tolling agreement with the DOJ in connection with various RMBS offerings to toll the relevant statutes of limitations. The Group has recorded provisions with respect to some of the regulatory investigations but not others. The Group has not disclosed the amount of these provisions because it has concluded that such disclosure can be expected to prejudice seriously the outcome of these regulatory investigations.
Issuer and Underwriter Civil Litigation. Deutsche Bank has been named as defendant in numerous civil litigations brought by private parties in connection with its various roles, including issuer or underwriter, in offerings of RMBS and other asset-backed securities. These cases, described below, allege that the offering documents contained material misrepresentations and omissions, including with regard to the underwriting standards pursuant to which the underlying mortgage loans were issued, or assert that various representations or warranties relating to the loans were breached at the time of origination. The Group has recorded provisions with respect to several of these civil cases, but has not recorded provisions with respect to all of these matters. The Group has not disclosed the amount of these provisions because it has concluded that such disclosure can be expected to prejudice seriously the outcome of these matters.
Deutsche Bank is a defendant in a putative class action relating to its role as underwriter of six RMBS offerings issued by Novastar Mortgage Corporation. No specific damages are alleged in the complaint. Discovery is ongoing.
Deutsche Bank currently is a defendant in various non-class action lawsuits by alleged purchasers of, and counterpar-ties involved in transactions relating to, RMBS, and their affiliates, including: (1) Aozora Bank, Ltd. (alleging U.S.$ 31 million in damages); (2) the Federal Deposit Insurance Corporation (FDIC) as receiver for: (a) Colonial Bank (alleging no less than U.S.$ 189 million in damages against all defendants), (b) Guaranty Bank (alleging no less than U.S.$ 901 million in damages against all defendants), and (c) Citizens National Bank and Strategic Capital Bank (alleging no less than U.S.$ 66 million in damages against all defendants); (3) the Federal Home Loan Bank of San Francis-co; (4) Phoenix Light SF Limited (as purported assignee of claims of special purpose vehicles created and/or managed by former WestLB AG); and (5) Royal Park Investments (as purported assignee of claims of a special-purpose vehicle created to acquire certain assets of Fortis Bank). Unless otherwise indicated, the complaints in these matters did not specify the damages sought.
119
Deutsche Bank Interim Report as of June 30, 2016
Basis of Preparation – 78 Impact of Changes in Accountion Principles – 79 Segment Information – 82
Information on the Consolidated Income Statement – 85 Information on the Consolidated Balance Sheet – 88 Other Financial Information – 123
On January 14, 2015, the court granted Deutsche Bank’s motion to dismiss the action brought against it by Aozora Bank, Ltd., relating to a CDO identified as Blue Edge ABS CDO, Ltd. Aozora appealed this decision and on March 30, 2016, an appellate court affirmed the lower court’s dismissal. Deutsche Bank also is a defendant, along with UBS AG and affiliates, in an action brought by Aozora Bank, Ltd. relating to a CDO identified as Brooklyn Structured Finance CDO, Ltd. On October 14, 2015, the court denied defendants’ motion to dismiss Aozora’s fraud claims, and defendants have appealed the decision. On July 7, 2016, the lower court ordered the parties to begin limited discovery pending the appeal.
On or about June 6, 2016, the actions brought by the FDIC as receiver for Franklin Bank, Guaranty Bank and Colonial Bank, against Deutsche Bank in connection with its role as underwriter of RMBS issued by entities affiliated with Countrywide were dismissed in connection with a settlement reached between the FDIC and Deutsche Bank and other financial institutions who also were sued as underwriters. Deutsche Bank’s contribution to the settlement was covered by a non-party to the litigation.
Deutsche Bank remains as a defendant in three actions brought by the FDIC relating to other RMBS offerings. In separate actions brought by the FDIC as receiver for Colonial Bank and Guaranty Bank, the appellate courts have reinstated claims previously dismissed on statute of limitations grounds, and discovery in these cases is ongoing. In the case concerning Colonial Bank, petitions for rehearing and certiorari to the U.S. Supreme Court were denied. In the case concerning Guaranty Bank, a petition for rehearing is pending. A similar appeal remains pending in the action brought by the FDIC as receiver for Citizens National Bank and Strategic Capital Bank.
Following two partial settlements of claims brought by the Federal Home Loan Bank of San Francisco, Deutsche Bank remains a defendant with respect to one RMBS offering and two offerings described as resecuritizations of RMBS certificates. No specific damages are alleged in the complaint. The case is in expert discovery. Deutsche Bank’s trial is scheduled for December 5, 2016.
Residential Funding Company brought a repurchase action against Deutsche Bank for breaches of representations and warranties on loans sold to Residential Funding Company and for indemnification for losses incurred as a result of RMBS-related claims and actions asserted against Residential Funding Company. The complaint did not specify the amount of damages sought. On June 24, 2016, pursuant to a confidential settlement agreement, the Court dismissed the case with prejudice. The financial terms of the settlement are not material to Deutsche Bank.
In March 2012, RMBS Recovery Holdings 4, LLC and VP Structured Products, LLC brought an action in New York state court against Deutsche Bank alleging breaches of representations and warranties made by Deutsche Bank concerning the mortgage loans in the ACE Securities Corp. 2006-SL2 RMBS offering. The complaint did not specify the amount of damages sought. On May 13, 2013, the court denied Deutsche Bank’s motion to dismiss the action as time-barred. On December 19, 2013, the appellate court reversed the lower court’s decision and dismissed the case. On June 11, 2015, the New York Court of Appeals affirmed the appellate court’s dismissal of the case. The court found that plaintiff’s cause of action accrued more than six years before the filing of the complaint and was therefore barred by the statute of limitations. On March 29, 2016, the court dismissed a substantially similar action commenced by HSBC as trustee, and on April 29, 2016, plaintiff filed a notice of appeal.
On February 18, 2016, Deutsche Bank and Amherst Advisory & Management LLC (Amherst) executed settlement agreements to resolve breach of contract actions relating to five RMBS trusts. On June 30, 2016, the parties executed settlement agreements, amending and restating the prior agreements. The settlement agreements were sent to the trustee to solicit approval from certificate holders, who must submit votes on the settlements by August 24, 2016. The deadline for the trustee to accept the settlements is September 29, 2016. The actions remain stayed. A substantial portion of the settlement funds that would be paid by Deutsche Bank with respect to one of the five trusts, if the proposed settlement is consummated as to that trust, would be reimbursed by a non-party to that litigation. The net economic impact of the settlements was materially reflected in prior periods.
On February 3, 2016, Lehman Brothers Holding, Inc. instituted an adversary proceeding in United States Bankruptcy Court for the Southern District of New York against, among others, MortgageIT, Inc. (MIT) and Deutsche Bank AG, as alleged successor to MIT, asserting breaches of representations and warranties set forth in certain 2003 and 2004 loan
Deutsche Bank 4 – Notes to the Consolidated Financial Statements 120Interim Report as of June 30, 2016
purchase agreements concerning 63 mortgage loans that MIT sold to Lehman, which Lehman in turn sold to the Federal National Mortgage Association (Fannie Mae) and the Federal Home Loan Mortgage Corporation (Freddie Mac). The complaint seeks indemnification for losses incurred by Lehman in connection with settlements entered into with Fannie Mae and Freddie Mac as part of the Lehman bankruptcy proceedings to resolve claims concerning those loans. No specific damages are alleged in the complaint. The time to respond to the complaint has not yet expired.
In the actions against Deutsche Bank solely as an underwriter of other issuers’ RMBS offerings, Deutsche Bank has contractual rights to indemnification from the issuers, but those indemnity rights may in whole or in part prove effectively unenforceable where the issuers are now or may in the future be in bankruptcy or otherwise defunct.
Trustee Civil Litigation. Deutsche Bank is a defendant in eight separate civil lawsuits brought by various groups of investors concerning its role as trustee of certain RMBS trusts. The actions generally allege claims for breach of contract, breach of fiduciary duty, breach of the duty to avoid conflicts of interest, negligence and/or violations of the Trust Indenture Act of 1939, based on Deutsche Bank’s alleged failure to perform adequately certain obligations and/or duties as trustee for the trusts. The eight actions include two putative class actions brought by a group of investors, including funds managed by BlackRock Advisors, LLC, PIMCO-Advisors, L.P., and others (the BlackRock Class Actions), one putative class action brought by Royal Park Investments SA/NV, and five individual lawsuits. One of the BlackRock Class Actions is pending in the U.S. District Court for the Southern District of New York in relation to 62 trusts, which allegedly suffered total realized collateral losses of U.S. $ 9.8 billion, although the complaint does not specify a damage amount. On July 15, 2016, a motion to dismiss was filed in that action, and discovery is ongoing. The second BlackRock Class Action is pending in the Superior Court of California in relation to 465 trusts, which allegedly suffered total realized collateral losses of U.S. $ 75.7 billion, although the complaint does not specify a damage amount. Discovery has not yet commenced in that action. The putative class action brought by Royal Park Investments SA/NV is pending in the U.S. District Court for the Southern District of New York and concerns ten trusts, which allegedly suffered total realized collateral losses of more than U.S.$ 3.1 billion, although the complaint does not specify a damage amount. Discovery is ongoing.
The other five individual lawsuits include actions by (a) the National Credit Union Administration Board (“NCUA”), as an investor in 97 trusts, which allegedly suffered total realized collateral losses of U.S.$ 17.2 billion, although the complaint does not specify a damage amount; (b) certain CDOs (collectively, “Phoenix Light SF Limited”) that hold RMBS certificates issued by 51 RMBS trusts, and seeking over U.S. $ 527 million of damages; (c) the Western and Southern Life Insurance Company and five related entities (collectively “Western & Southern”), as investors in 18 RMBS trusts, which allegedly suffered total realized collateral losses of U.S.$ 1 billion, although the complaint does not specify a damage amount; (d) Commerzbank AG, as an investor in 50 RMBS trusts, seeking recovery for alleged “hundreds of millions of dollars in losses;” and (e) IKB International, S.A. in Liquidation and IKB Deutsche Industriebank A.G. (collectively, “IKB”), as an investor in 37 RMBS trusts, seeking more than U.S.$ 268 million of damages. In the NCUA case, Deutsche Bank’s motion to dismiss for failure to state a claim is pending and discovery is stayed. In the Western & Southern and Commerzbank cases, Deutsche Bank’s motions to dismiss for failure to state a claim is pending and discovery is ongoing. In the IKB case, a motion to dismiss has not yet been filed, and discovery has not commenced. In the remaining actions, certain claims were dismissed, and other claims survived motions to dismiss. Discovery is generally ongoing as to the claims that survived motions to dismiss.
The Group believes a contingent liability exists with respect to these eight cases, but at present the amount of the contingent liability is not reliably estimable.
Precious Metals Investigations and Litigations. Deutsche Bank has received inquiries from certain regulatory and law enforcement authorities, including requests for information and documents, pertaining to investigations of precious metals trading and related conduct. Deutsche Bank is cooperating with these investigations, and engaging with relevant authorities, as appropriate. Relatedly, Deutsche Bank has been conducting its own internal review of Deutsche Bank’s historic participation in the precious metals benchmarks and other aspects of its precious metals trading and precious metals business.
121
Deutsche Bank Interim Report as of June 30, 2016
Basis of Preparation – 78 Impact of Changes in Accountion Principles – 79 Segment Information – 82
Information on the Consolidated Income Statement – 85 Information on the Consolidated Balance Sheet – 88 Other Financial Information – 123
Deutsche Bank is a defendant in two consolidated class action lawsuits pending in the U.S. District Court for the Southern District of New York. The suits allege violations of U.S. antitrust law, the U.S. Commodity Exchange Act and related state law arising out of the alleged manipulation of gold and silver prices through participation in the Gold and Silver Fixes, but do not specify the damages sought. Motions to dismiss both actions are pending. Deutsche Bank has reached confidential agreements in principle to settle both actions, the financial terms of which are not material to Deutsche Bank. The agreements remain subject to court approval.
In addition, Deutsche Bank is a defendant in Canadian class action proceedings in the province of Ontario concerning gold and in the provinces of Ontario and Quebec concerning silver. Each of the proceedings seeks damages for alleged violations of the Canadian Competition Act and other causes of action.
The Group has recorded provisions with respect to certain of these matters, including provisions sufficient to satisfy Deutsche Bank’s obligations under the agreements in principle to settle both of the U.S. class actions. The Group has not disclosed the amount of these provisions, nor has it disclosed whether it has established provisions with respect to other matters referred above or any contingent liability with respect to any of those matters, because it has concluded that such disclosure can be expected to prejudice seriously their outcome.
Referral Hiring Practices Investigations. Certain regulators are investigating, among other things, Deutsche Bank’s compliance with the U.S. Foreign Corrupt Practices Act and other laws with respect to the Bank’s hiring practices related to candidates referred by clients, potential clients and government officials, and its engagement of finders and consultants. Deutsche Bank is responding to and continuing to cooperate with these investigations. The Group has recorded a provision with respect to certain of these regulatory investigations. The Group has not disclosed the amount of this provision because it has concluded that such disclosure can be expected to prejudice seriously the outcome of these regulatory investigations.
Russia/UK Equities Trading Investigation. Deutsche Bank is investigating the circumstances around equity trades entered into by certain clients with Deutsche Bank in Moscow and London that offset one another. The total volume of the transactions under review is significant. Deutsche Bank’s internal investigation of potential violations of law, regulation and policy and into the related internal control environment remains ongoing; to date it has identified certain violations of Deutsche Bank’s policies and deficiencies in Deutsche Bank’s control environment. Deutsche Bank has advised regulators and law enforcement authorities in several jurisdictions (including Germany, Russia, the U.K. and U.S.) of this investigation. Deutsche Bank has taken disciplinary measures with regards to certain individuals in this matter and will continue to do so with respect to others as warranted. The Group has recorded a provision with respect to this matter. The Group has not disclosed the amount of this provision because it has concluded that such disclosure can be expected to prejudice seriously the outcome of this matter.
Sovereign, Supranational and Agency Bonds (SSA) Investigations and Litigations. Deutsche Bank has received inquiries from certain regulatory and law enforcement authorities, including requests for information and documents, pertaining to SSA bond trading. Deutsche Bank is cooperating with these investigations.
Deutsche Bank is a defendant in several putative class action complaints filed in the U.S. District Court for the Southern District of New York alleging violations of U.S. antitrust law and common law related to alleged manipulation of the secondary trading market for SSA bonds. These cases are in their early stages and are in the process of being consolidated.
The Group has not disclosed whether it has established a provision or contingent liability with respect to these matters because it has concluded that such disclosure can be expected to prejudice seriously their outcome.
U.S. Embargoes-Related Matters. Deutsche Bank has received requests for information from certain U.S. regulatory and law enforcement agencies concerning its historical processing of U.S. dollar payment orders through U.S. financial institutions for parties from countries subject to U.S. embargo laws. These agencies are investigating whether such processing complied with U.S. federal and state laws. In 2006, Deutsche Bank voluntarily decided that it would not engage in new U.S. dollar business with counterparties in Iran, Sudan, North Korea and Cuba and with certain Syrian banks, and to exit existing U.S. dollar business with such counterparties to the extent legally possible. In 2007, Deutsche Bank decided that it would not engage in any new business, in any currency, with counterparties in Iran, Syria, Sudan and North Korea and to exit existing business, in any currency, with such counterparties to the extent
Deutsche Bank 4 – Notes to the Consolidated Financial Statements 122Interim Report as of June 30, 2016
legally possible; it also decided to limit its non-U.S. dollar business with counterparties in Cuba. On November 3, 2015, Deutsche Bank entered into agreements with the New York State Department of Financial Services and the Federal Reserve Bank of New York to resolve their investigations of Deutsche Bank. Deutsche Bank paid the two agencies U.S.$ 200 million and U.S.$ 58 million, respectively, and agreed to terminate certain employees, not rehire certain former employees and install an independent monitor for one year. In addition, the Federal Reserve Bank of New York ordered certain remedial measures, specifically, the requirement to ensure an effective OFAC compliance program and an annual review of such program by an independent party until the Federal Reserve Bank of New York is satisfied as to its effectiveness. The investigations of the U.S. law enforcement agencies remain ongoing.
The Group has not disclosed whether it has established a provision or contingent liability with respect to this matter because it has concluded that such disclosure can be expected to prejudice seriously its outcome.
U.S. Treasury Securities Investigations and Litigations. Deutsche Bank has received inquiries from certain regulatory and law enforcement authorities, including requests for information and documents, pertaining to U.S. Treasuries auctions, trading, and related market activity. Deutsche Bank is cooperating with these investigations.
Deutsche Bank is a defendant in several putative class actions alleging violations of U.S. antitrust law, the U.S. Commodity Exchange Act and common law related to the alleged manipulation of the U.S. Treasury securities market. These cases are in their early stages and have been consolidated in the Southern District of New York.
The Group has not disclosed whether it has established a provision or contingent liability with respect to these matters because it has concluded that such disclosure can be expected to prejudice seriously their outcome.
Long-Term Debt
Shares Issued and Outstanding
in € m. Jun 30, 2016 Dec 31, 2015 Senior debt:
Bonds and notes Fixed rate 84,925 86,255 Floating rate 37,313 38,963
Subordinated debt:
Bonds and notes Fixed rate 4,866 4,602 Floating rate 1,960 1,811
Other 33,841 28,385
Total long-term debt 162,905 160,016
in million Jun 30, 2016 Dec 31, 2015 Shares issued 1,379.3 1,379.3
Shares in treasury 12.3 0.4
Thereof:
Buyback 12.1 0.3
Other 0.1 0.1
Shares outstanding 1,367.0 1,378.9
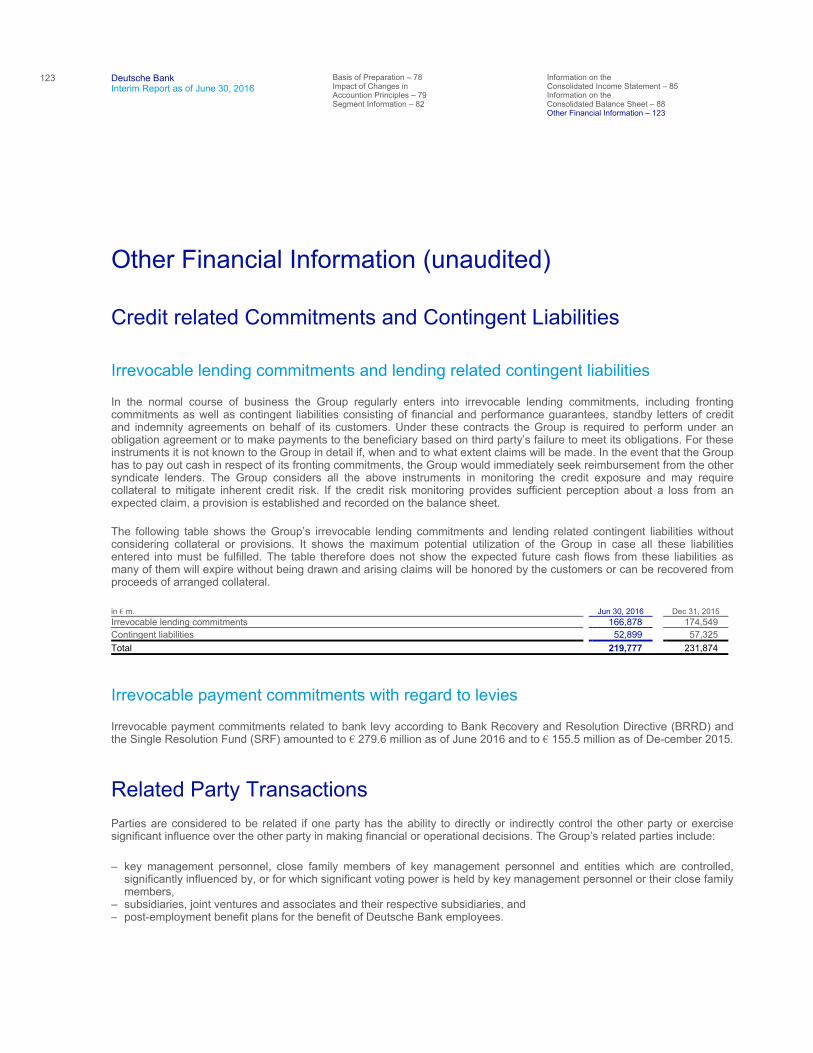
123
Deutsche Bank Interim Report as of June 30, 2016
Basis of Preparation – 78 Impact of Changes in Accountion Principles – 79 Segment Information – 82
Information on the Consolidated Income Statement – 85 Information on the Consolidated Balance Sheet – 88 Other Financial Information – 123
Other Financial Information (unaudited)
Credit related Commitments and Contingent Liabilities
Irrevocable lending commitments and lending related contingent liabilities
In the normal course of business the Group regularly enters into irrevocable lending commitments, including fronting commitments as well as contingent liabilities consisting of financial and performance guarantees, standby letters of credit and indemnity agreements on behalf of its customers. Under these contracts the Group is required to perform under an obligation agreement or to make payments to the beneficiary based on third party’s failure to meet its obligations. For these instruments it is not known to the Group in detail if, when and to what extent claims will be made. In the event that the Group has to pay out cash in respect of its fronting commitments, the Group would immediately seek reimbursement from the other syndicate lenders. The Group considers all the above instruments in monitoring the credit exposure and may require collateral to mitigate inherent credit risk. If the credit risk monitoring provides sufficient perception about a loss from an expected claim, a provision is established and recorded on the balance sheet.
The following table shows the Group’s irrevocable lending commitments and lending related contingent liabilities without considering collateral or provisions. It shows the maximum potential utilization of the Group in case all these liabilities entered into must be fulfilled. The table therefore does not show the expected future cash flows from these liabilities as many of them will expire without being drawn and arising claims will be honored by the customers or can be recovered from proceeds of arranged collateral.
Irrevocable payment commitments with regard to levies
Irrevocable payment commitments related to bank levy according to Bank Recovery and Resolution Directive (BRRD) and the Single Resolution Fund (SRF) amounted to € 279.6 million as of June 2016 and to € 155.5 million as of De-cember 2015.
Related Party Transactions Parties are considered to be related if one party has the ability to directly or indirectly control the other party or exercise significant influence over the other party in making financial or operational decisions. The Group’s related parties include:
in € m. Jun 30, 2016 Dec 31, 2015 Irrevocable lending commitments 166,878 174,549
Contingent liabilities 52,899 57,325
Total 219,777 231,874
– key management personnel, close family members of key management personnel and entities which are controlled,significantly influenced by, or for which significant voting power is held by key management personnel or their close familymembers,
– subsidiaries, joint ventures and associates and their respective subsidiaries, and – post-employment benefit plans for the benefit of Deutsche Bank employees.
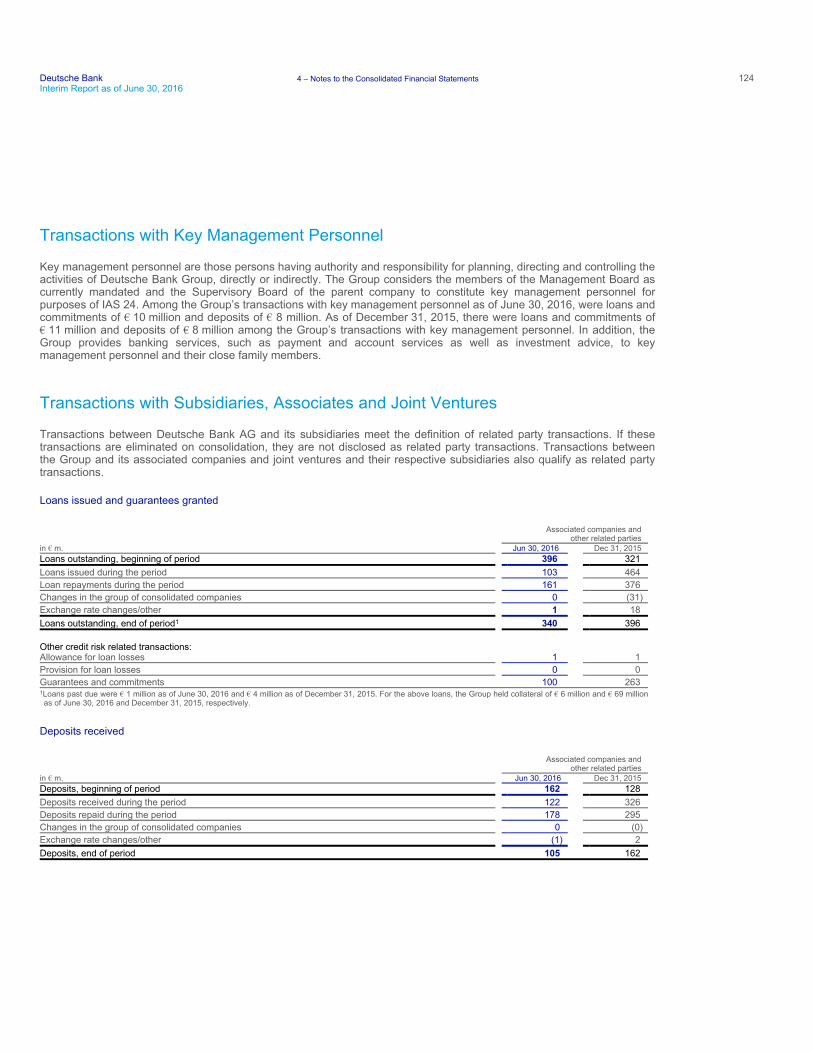
Deutsche Bank 4 – Notes to the Consolidated Financial Statements 124Interim Report as of June 30, 2016
Transactions with Key Management Personnel
Key management personnel are those persons having authority and responsibility for planning, directing and controlling the activities of Deutsche Bank Group, directly or indirectly. The Group considers the members of the Management Board as currently mandated and the Supervisory Board of the parent company to constitute key management personnel for purposes of IAS 24. Among the Group’s transactions with key management personnel as of June 30, 2016, were loans and commitments of € 10 million and deposits of € 8 million. As of December 31, 2015, there were loans and commitments of € 11 million and deposits of € 8 million among the Group’s transactions with key management personnel. In addition, the Group provides banking services, such as payment and account services as well as investment advice, to key management personnel and their close family members.
Transactions with Subsidiaries, Associates and Joint Ventures
Transactions between Deutsche Bank AG and its subsidiaries meet the definition of related party transactions. If these transactions are eliminated on consolidation, they are not disclosed as related party transactions. Transactions between the Group and its associated companies and joint ventures and their respective subsidiaries also qualify as related party transactions.
Loans issued and guarantees granted
Associated companies and
other related parties in € m. Jun 30, 2016 Dec 31, 2015 Loans outstanding, beginning of period 396 321
Loans issued during the period 103 464
Loan repayments during the period 161 376
Changes in the group of consolidated companies 0 (31)
Exchange rate changes/other 1 18
Loans outstanding, end of period1 340 396
Other credit risk related transactions: Allowance for loan losses 1 1
Provision for loan losses 0 0
Guarantees and commitments 100 263
1Loans past due were € 1 million as of June 30, 2016 and € 4 million as of December 31, 2015. For the above loans, the Group held collateral of € 6 million and € 69 millionas of June 30, 2016 and December 31, 2015, respectively.
Deposits received
Associated companies and
other related parties in € m. Jun 30, 2016 Dec 31, 2015 Deposits, beginning of period 162 128
Deposits received during the period 122 326
Deposits repaid during the period 178 295
Changes in the group of consolidated companies 0 (0)
Exchange rate changes/other (1) 2
Deposits, end of period 105 162
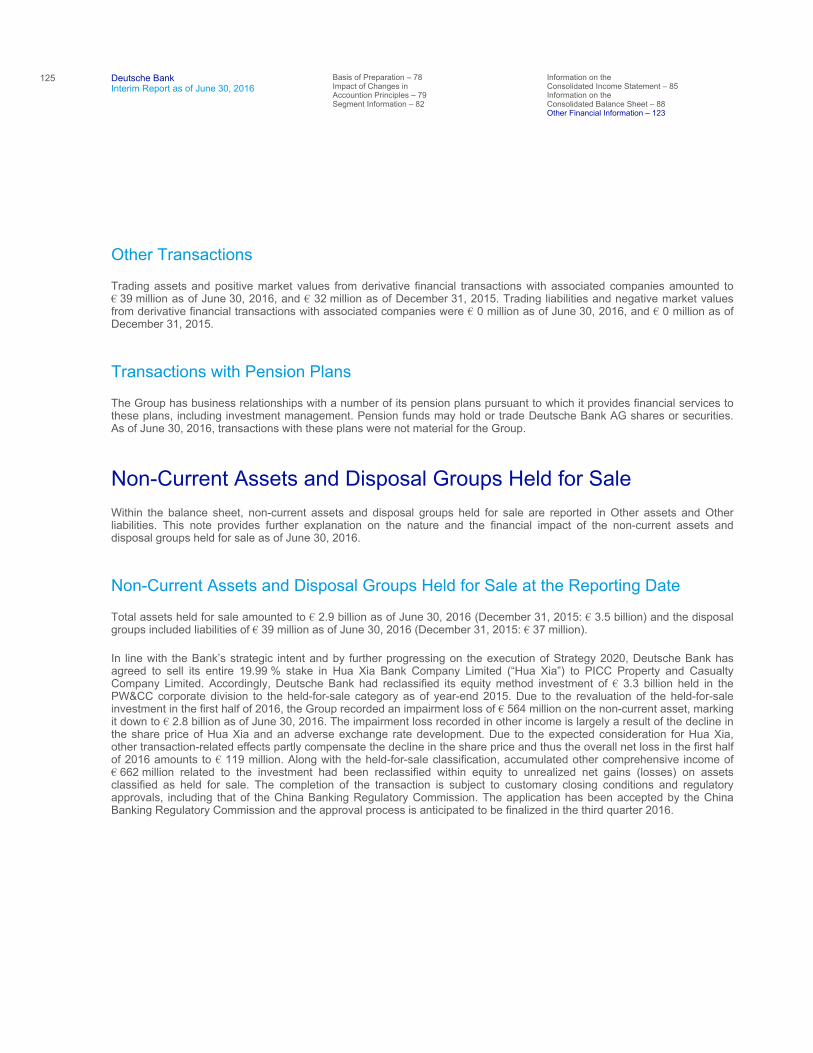
125
Deutsche Bank Interim Report as of June 30, 2016
Basis of Preparation – 78 Impact of Changes in Accountion Principles – 79 Segment Information – 82
Information on the Consolidated Income Statement – 85 Information on the Consolidated Balance Sheet – 88 Other Financial Information – 123
Other Transactions
Trading assets and positive market values from derivative financial transactions with associated companies amounted to € 39 million as of June 30, 2016, and € 32 million as of December 31, 2015. Trading liabilities and negative market values from derivative financial transactions with associated companies were € 0 million as of June 30, 2016, and € 0 million as of December 31, 2015.
Transactions with Pension Plans
The Group has business relationships with a number of its pension plans pursuant to which it provides financial services to these plans, including investment management. Pension funds may hold or trade Deutsche Bank AG shares or securities. As of June 30, 2016, transactions with these plans were not material for the Group.
Non-Current Assets and Disposal Groups Held for Sale Within the balance sheet, non-current assets and disposal groups held for sale are reported in Other assets and Other liabilities. This note provides further explanation on the nature and the financial impact of the non-current assets and disposal groups held for sale as of June 30, 2016.
Non-Current Assets and Disposal Groups Held for Sale at the Reporting Date
Total assets held for sale amounted to € 2.9 billion as of June 30, 2016 (December 31, 2015: € 3.5 billion) and the disposal groups included liabilities of € 39 million as of June 30, 2016 (December 31, 2015: € 37 million).
In line with the Bank’s strategic intent and by further progressing on the execution of Strategy 2020, Deutsche Bank has agreed to sell its entire 19.99 % stake in Hua Xia Bank Company Limited (“Hua Xia”) to PICC Property and Casualty Company Limited. Accordingly, Deutsche Bank had reclassified its equity method investment of € 3.3 billion held in the PW&CC corporate division to the held-for-sale category as of year-end 2015. Due to the revaluation of the held-for-sale investment in the first half of 2016, the Group recorded an impairment loss of € 564 million on the non-current asset, marking it down to € 2.8 billion as of June 30, 2016. The impairment loss recorded in other income is largely a result of the decline in the share price of Hua Xia and an adverse exchange rate development. Due to the expected consideration for Hua Xia, other transaction-related effects partly compensate the decline in the share price and thus the overall net loss in the first half of 2016 amounts to € 119 million. Along with the held-for-sale classification, accumulated other comprehensive income of € 662 million related to the investment had been reclassified within equity to unrealized net gains (losses) on assets classified as held for sale. The completion of the transaction is subject to customary closing conditions and regulatory approvals, including that of the China Banking Regulatory Commission. The application has been accepted by the China Banking Regulatory Commission and the approval process is anticipated to be finalized in the third quarter 2016.
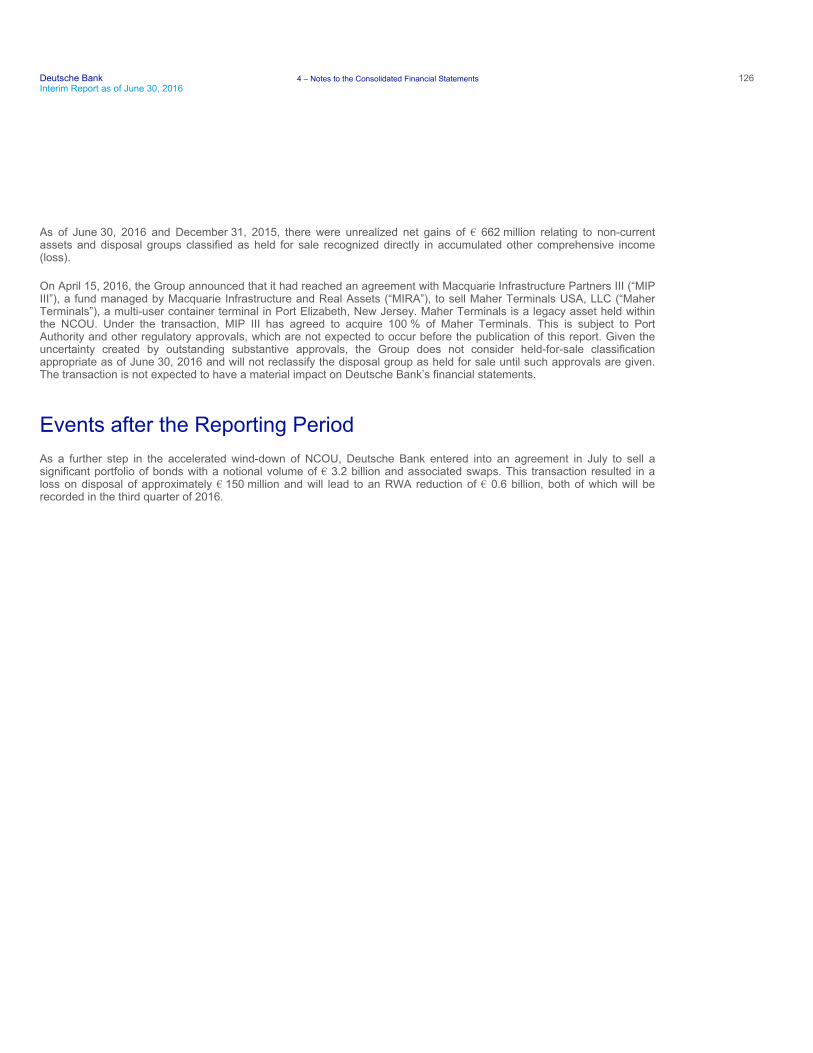
Deutsche Bank 4 – Notes to the Consolidated Financial Statements 126Interim Report as of June 30, 2016
As of June 30, 2016 and December 31, 2015, there were unrealized net gains of € 662 million relating to non-current assets and disposal groups classified as held for sale recognized directly in accumulated other comprehensive income (loss).
On April 15, 2016, the Group announced that it had reached an agreement with Macquarie Infrastructure Partners III (“MIP III”), a fund managed by Macquarie Infrastructure and Real Assets (“MIRA”), to sell Maher Terminals USA, LLC (“Maher Terminals”), a multi-user container terminal in Port Elizabeth, New Jersey. Maher Terminals is a legacy asset held within the NCOU. Under the transaction, MIP III has agreed to acquire 100 % of Maher Terminals. This is subject to Port Authority and other regulatory approvals, which are not expected to occur before the publication of this report. Given the uncertainty created by outstanding substantive approvals, the Group does not consider held-for-sale classification appropriate as of June 30, 2016 and will not reclassify the disposal group as held for sale until such approvals are given. The transaction is not expected to have a material impact on Deutsche Bank’s financial statements.
Events after the Reporting Period As a further step in the accelerated wind-down of NCOU, Deutsche Bank entered into an agreement in July to sell a significant portfolio of bonds with a notional volume of € 3.2 billion and associated swaps. This transaction resulted in a loss on disposal of approximately € 150 million and will lead to an RWA reduction of € 0.6 billion, both of which will be recorded in the third quarter of 2016.
127
Deutsche Bank Interim Report as of June 30, 2016
Non-GAAP Financial Measures – 127 Imprint – 132
Other Information (unaudited)
Non-GAAP Financial Measures This document and other documents the Group has published or may publish contain non-GAAP financial measures. Non-GAAP financial measures are measures of the Group’s historical or future performance, financial position or cash flows that contain adjustments that exclude or include amounts that are included or excluded, as the case may be, from the most directly comparable measure calculated and presented in accordance with IFRS in the Group’s financial statements.
Fully loaded CRR/CRD 4 Measures
As part of its measurements, the Group uses fully loaded CRR/CRD 4 metrics, including with respect to regulatory assets, risk-weighted assets, capital and ratios thereof. Such fully loaded metrics are described for example in the “Management Report: Risk Report: Risk and Capital Performance: Capital and Leverage Ratio”, in our Interim Report as of June 30, 2016 which also provides reconciliation to the respective CRR/CRD 4 transitional or IFRS values.
Return on Equity Ratios
The Group reports a post tax return on average shareholders’ equity and a post-tax return on average tangible shareholders’ equity, each of which is a non-GAAP financial measure.
The post-tax returns on average shareholders’ equity and average tangible shareholders’ equity are calculated as net income (loss) attributable to Deutsche Bank shareholders as a percentage of average shareholders’ equity and average tangible shareholders’ equity, respectively.
Net income (loss) attributable to Deutsche Bank shareholders is a non-GAAP financial measure and is defined as net income (loss) excluding post-tax income (loss) attributable to noncontrolling interests. For the Group, it reflects the reported effective tax rate, which was 95 % for the second quarter of 2016 and 33 % for the second quarter 2015. The tax rate was 74 % for the six months ended June 30, 2016 and 49 % for the prior year’s comparative period. For the segments, the applied tax rate was 35 % for all reported periods.
At the Group level, tangible shareholders’ equity is shareholders’ equity as reported in the Consolidated Balance Sheet excluding goodwill and other intangible assets. Tangible shareholders´ equity for the segments is calculated by deducting goodwill and other intangible assets from shareholders’ equity as allocated to the segments, as described in the section “Allocation of Average Shareholders’ Equity”. Shareholders’ equity and tangible shareholders’ equity are presented on an average basis.
The Group believes that a presentation of average tangible shareholders’ equity makes comparisons to its competitors easier, and refers to this measure in the return on equity ratios presented by the Group. However, average tangible shareholders’ equity is not a measure provided for in IFRS, and the Group’s ratios based on this measure should not be compared to other companies’ ratios without considering differences in the calculations.
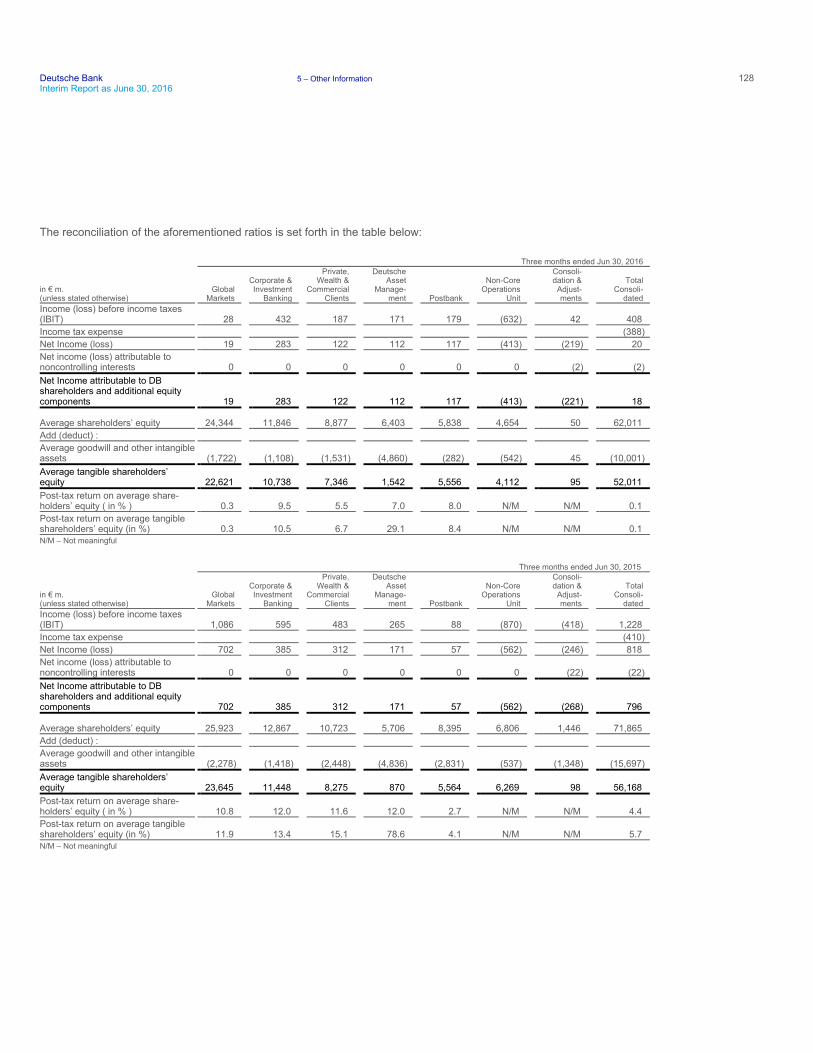
Deutsche Bank 5 – Other Information 128Interim Report as June 30, 2016
The reconciliation of the aforementioned ratios is set forth in the table below:
N/M – Not meaningful
Three months ended Jun 30, 2016
in € m. (unless stated otherwise)
Global Markets
Corporate & Investment
Banking
Private, Wealth &
Commercial Clients
Deutsche Asset
Manage- ment Postbank
Non-Core Operations
Unit
Consoli- dation &
Adjust- ments
Total Consoli-
dated Income (loss) before income taxes (IBIT) 28 432 187 171 179 (632) 42 408
Income tax expense (388)
Net Income (loss) 19 283 122 112 117 (413) (219) 20
Net income (loss) attributable to noncontrolling interests 0 0 0 0 0 0 (2) (2)
Net Income attributable to DB shareholders and additional equity components 19 283 122 112 117 (413) (221) 18
Average shareholders’ equity 24,344 11,846 8,877 6,403 5,838 4,654 50 62,011
Add (deduct) :
Average goodwill and other intangible assets (1,722) (1,108) (1,531) (4,860) (282) (542) 45 (10,001)
Average tangible shareholders’ equity 22,621 10,738 7,346 1,542 5,556 4,112 95 52,011
Post-tax return on average share-holders’ equity ( in % ) 0.3 9.5 5.5 7.0 8.0 N/M N/M 0.1
Post-tax return on average tangible shareholders’ equity (in %) 0.3 10.5 6.7 29.1 8.4 N/M N/M 0.1
N/M – Not meaningful
Three months ended Jun 30, 2015
in € m. (unless stated otherwise)
Global Markets
Corporate & Investment
Banking
Private, Wealth &
Commercial Clients
Deutsche Asset
Manage- ment Postbank
Non-Core Operations
Unit
Consoli- dation &
Adjust- ments
Total Consoli-
dated Income (loss) before income taxes (IBIT) 1,086 595 483 265 88 (870) (418) 1,228
Income tax expense (410)
Net Income (loss) 702 385 312 171 57 (562) (246) 818
Net income (loss) attributable to noncontrolling interests 0 0 0 0 0 0 (22) (22)
Net Income attributable to DB shareholders and additional equity components 702 385 312 171 57 (562) (268) 796
Average shareholders’ equity 25,923 12,867 10,723 5,706 8,395 6,806 1,446 71,865
Add (deduct) :
Average goodwill and other intangible assets (2,278) (1,418) (2,448) (4,836) (2,831) (537) (1,348) (15,697)
Average tangible shareholders’ equity 23,645 11,448 8,275 870 5,564 6,269 98 56,168
Post-tax return on average share-holders’ equity ( in % ) 10.8 12.0 11.6 12.0 2.7 N/M N/M 4.4
Post-tax return on average tangible shareholders’ equity (in %) 11.9 13.4 15.1 78.6 4.1 N/M N/M 5.7
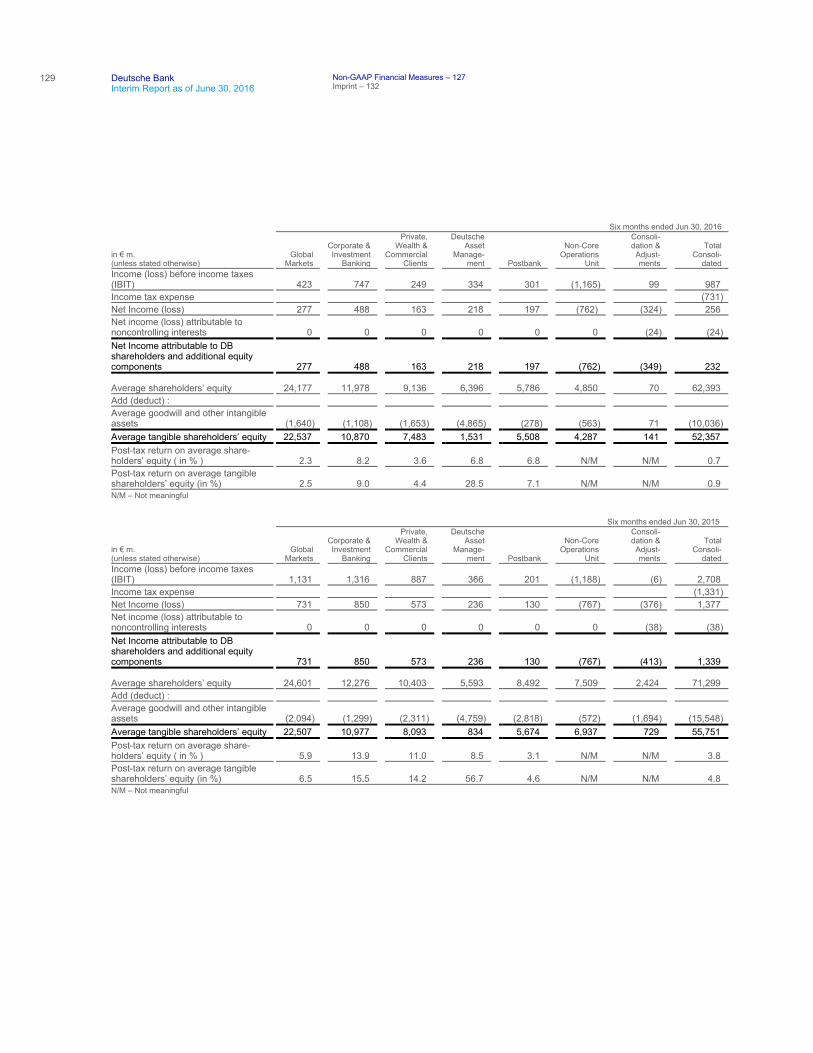
129
Deutsche Bank Interim Report as of June 30, 2016
Non-GAAP Financial Measures – 127 Imprint – 132
N/M – Not meaningful
Six months ended Jun 30, 2016
in € m. (unless stated otherwise)
Global Markets
Corporate & Investment
Banking
Private, Wealth &
Commercial Clients
Deutsche Asset
Manage- ment Postbank
Non-Core Operations
Unit
Consoli- dation &
Adjust- ments
Total Consoli-
dated Income (loss) before income taxes (IBIT) 423 747 249 334 301 (1,165) 99 987
Income tax expense (731)
Net Income (loss) 277 488 163 218 197 (762) (324) 256
Net income (loss) attributable to noncontrolling interests 0 0 0 0 0 0 (24) (24)
Net Income attributable to DB shareholders and additional equity components 277 488 163 218 197 (762) (349) 232
Average shareholders’ equity 24,177 11,978 9,136 6,396 5,786 4,850 70 62,393
Add (deduct) :
Average goodwill and other intangible assets (1,640) (1,108) (1,653) (4,865) (278) (563) 71 (10,036)
Average tangible shareholders’ equity 22,537 10,870 7,483 1,531 5,508 4,287 141 52,357
Post-tax return on average share-holders’ equity ( in % ) 2.3 8.2 3.6 6.8 6.8 N/M N/M 0.7
Post-tax return on average tangible shareholders’ equity (in %) 2.5 9.0 4.4 28.5 7.1 N/M N/M 0.9
N/M – Not meaningful
Six months ended Jun 30, 2015
in € m. (unless stated otherwise)
Global Markets
Corporate & Investment
Banking
Private, Wealth &
Commercial Clients
Deutsche Asset
Manage- ment Postbank
Non-Core Operations
Unit
Consoli- dation &
Adjust- ments
Total Consoli-
dated Income (loss) before income taxes (IBIT) 1,131 1,316 887 366 201 (1,188) (6) 2,708
Income tax expense (1,331)
Net Income (loss) 731 850 573 236 130 (767) (376) 1,377
Net income (loss) attributable to noncontrolling interests 0 0 0 0 0 0 (38) (38)
Net Income attributable to DB shareholders and additional equity components 731 850 573 236 130 (767) (413) 1,339
Average shareholders’ equity 24,601 12,276 10,403 5,593 8,492 7,509 2,424 71,299
Add (deduct) :
Average goodwill and other intangible assets (2,094) (1,299) (2,311) (4,759) (2,818) (572) (1,694) (15,548)
Average tangible shareholders’ equity 22,507 10,977 8,093 834 5,674 6,937 729 55,751
Post-tax return on average share-holders’ equity ( in % ) 5.9 13.9 11.0 8.5 3.1 N/M N/M 3.8
Post-tax return on average tangible shareholders’ equity (in %) 6.5 15.5 14.2 56.7 4.6 N/M N/M 4.8
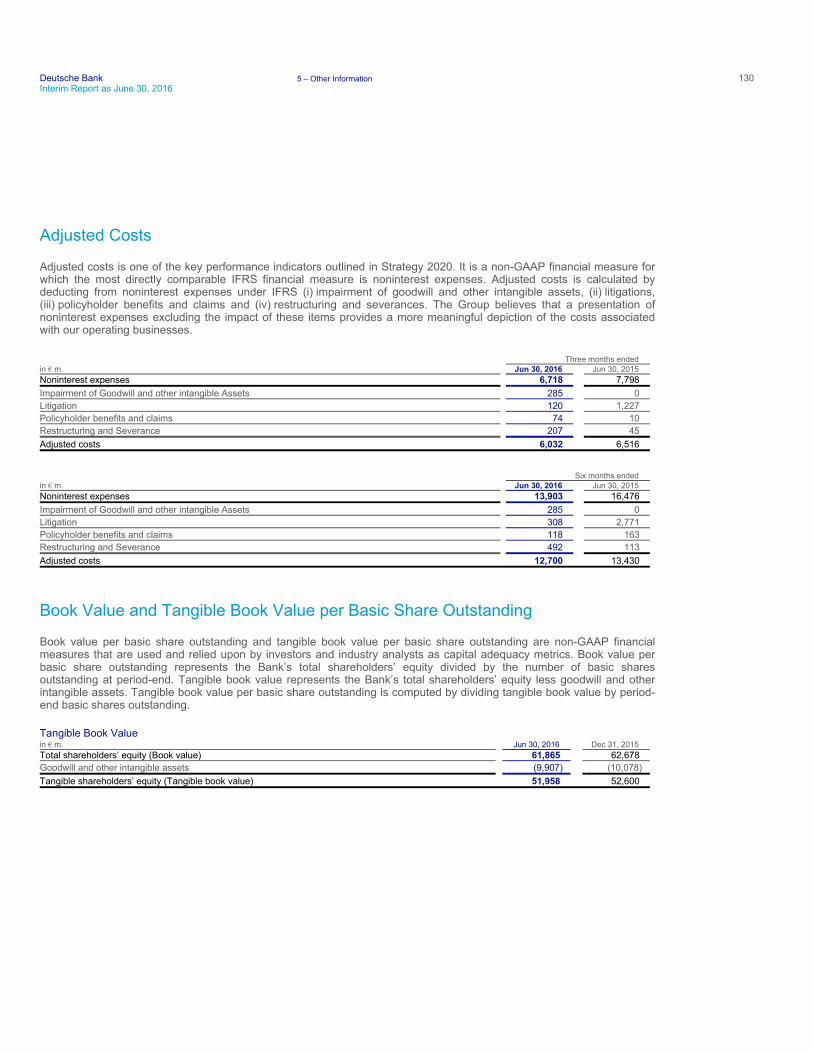
Deutsche Bank 5 – Other Information 130Interim Report as June 30, 2016
Adjusted Costs
Adjusted costs is one of the key performance indicators outlined in Strategy 2020. It is a non-GAAP financial measure for which the most directly comparable IFRS financial measure is noninterest expenses. Adjusted costs is calculated by deducting from noninterest expenses under IFRS (i) impairment of goodwill and other intangible assets, (ii) litigations, (iii) policyholder benefits and claims and (iv) restructuring and severances. The Group believes that a presentation of noninterest expenses excluding the impact of these items provides a more meaningful depiction of the costs associated with our operating businesses.
Book Value and Tangible Book Value per Basic Share Outstanding
Book value per basic share outstanding and tangible book value per basic share outstanding are non-GAAP financial measures that are used and relied upon by investors and industry analysts as capital adequacy metrics. Book value per basic share outstanding represents the Bank’s total shareholders’ equity divided by the number of basic shares outstanding at period-end. Tangible book value represents the Bank’s total shareholders’ equity less goodwill and other intangible assets. Tangible book value per basic share outstanding is computed by dividing tangible book value by period-end basic shares outstanding.
Tangible Book Value
Three months ended in € m. Jun 30, 2016 Jun 30, 2015 Noninterest expenses 6,718 7,798
Impairment of Goodwill and other intangible Assets 285 0
Litigation 120 1,227
Policyholder benefits and claims 74 10
Restructuring and Severance 207 45
Adjusted costs 6,032 6,516
Six months ended in € m. Jun 30, 2016 Jun 30, 2015 Noninterest expenses 13,903 16,476
Impairment of Goodwill and other intangible Assets 285 0
Litigation 308 2,771
Policyholder benefits and claims 118 163
Restructuring and Severance 492 113
Adjusted costs 12,700 13,430
in € m. Jun 30, 2016 Dec 31, 2015 Total shareholders’ equity (Book value) 61,865 62,678
Goodwill and other intangible assets (9,907) (10,078)
Tangible shareholders’ equity (Tangible book value) 51,958 52,600
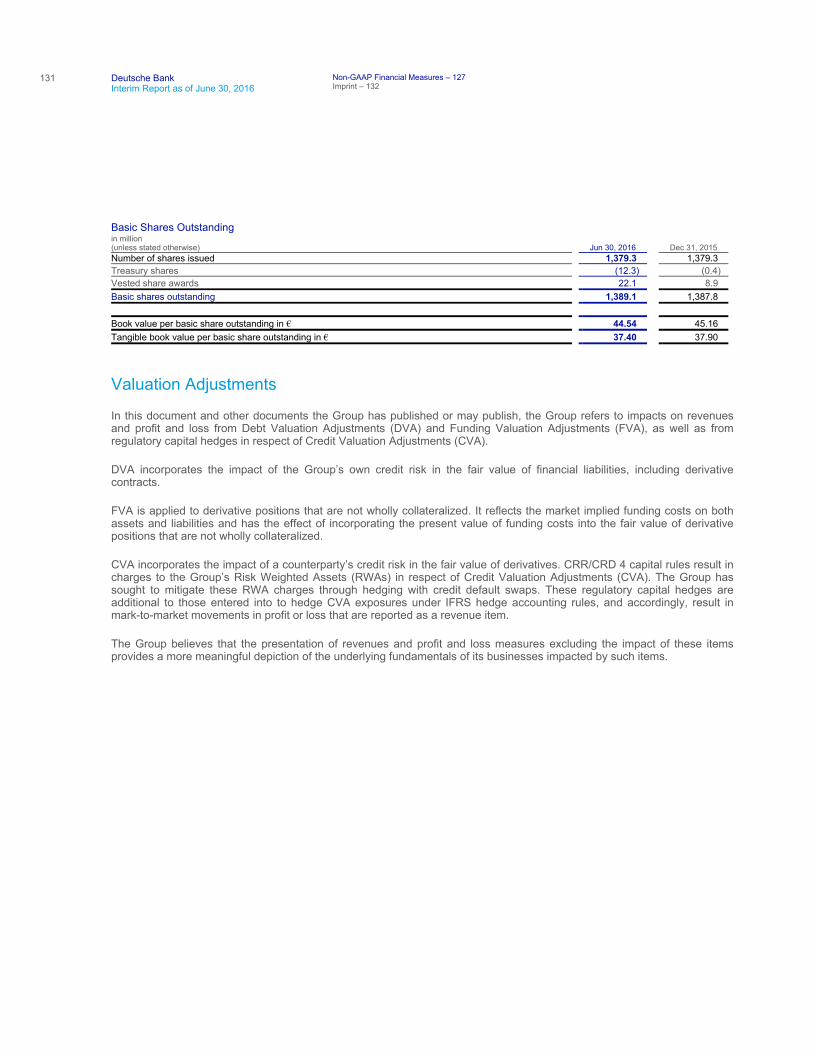
131
Deutsche Bank Interim Report as of June 30, 2016
Non-GAAP Financial Measures – 127 Imprint – 132
Basic Shares Outstanding
Valuation Adjustments
In this document and other documents the Group has published or may publish, the Group refers to impacts on revenues and profit and loss from Debt Valuation Adjustments (DVA) and Funding Valuation Adjustments (FVA), as well as from regulatory capital hedges in respect of Credit Valuation Adjustments (CVA).
DVA incorporates the impact of the Group’s own credit risk in the fair value of financial liabilities, including derivative contracts.
FVA is applied to derivative positions that are not wholly collateralized. It reflects the market implied funding costs on both assets and liabilities and has the effect of incorporating the present value of funding costs into the fair value of derivative positions that are not wholly collateralized.
CVA incorporates the impact of a counterparty’s credit risk in the fair value of derivatives. CRR/CRD 4 capital rules result in charges to the Group’s Risk Weighted Assets (RWAs) in respect of Credit Valuation Adjustments (CVA). The Group has sought to mitigate these RWA charges through hedging with credit default swaps. These regulatory capital hedges are additional to those entered into to hedge CVA exposures under IFRS hedge accounting rules, and accordingly, result in mark-to-market movements in profit or loss that are reported as a revenue item.
The Group believes that the presentation of revenues and profit and loss measures excluding the impact of these items provides a more meaningful depiction of the underlying fundamentals of its businesses impacted by such items.
in million (unless stated otherwise) Jun 30, 2016 Dec 31, 2015 Number of shares issued 1,379.3 1,379.3
Treasury shares (12.3) (0.4)
Vested share awards 22.1 8.9
Basic shares outstanding 1,389.1 1,387.8
Book value per basic share outstanding in € 44.54 45.16
Tangible book value per basic share outstanding in € 37.40 37.90
Imprint
Deutsche Bank 5 – Other Information 132Interim Report as of June 30, 2016
Deutsche Bank Aktiengesellschaft Taunusanlage 12 60262 Frankfurt am Main Germany Telephone: +49 69 9 10 00 [email protected]
Investor Relations: +49 69 9 10-3 80 80 [email protected]
Publication Published on July 27, 2016.
Cautionary statement regarding forward-looking statements
This report contains forward-looking statements. Forward-looking statements are statements that are not historical facts; they include statements about our beliefs and expectations and the assumptions underlying them. These statements are based on plans, estimates and projections as they are currently available to the management of Deutsche Bank. Forward-looking statements therefore speak only as of the date they are made, and we undertake no obligation to update publicly any of them in light of new information or future events.
By their very nature, forward-looking statements involve risks and uncertainties. A number of important factors could therefore cause actual results to differ materially from those contained in any forward-looking statement. Such factors include the conditions in the financial markets in Germany, in Europe, in the United States and elsewhere from which we derive a substantial portion of our revenues and in which we hold a substantial portion of our assets, the development of asset prices and market volatility, potential defaults of borrowers or trading counterparties, the implementation of our strategic initiatives, the reliability of our risk management policies, procedures and methods, and other risks referenced in our filings with the U.S. Securities and Exchange Commission. Such factors are described in detail in our SEC Form 20-F of March 11, 2016 under the heading “Risk Factors”.
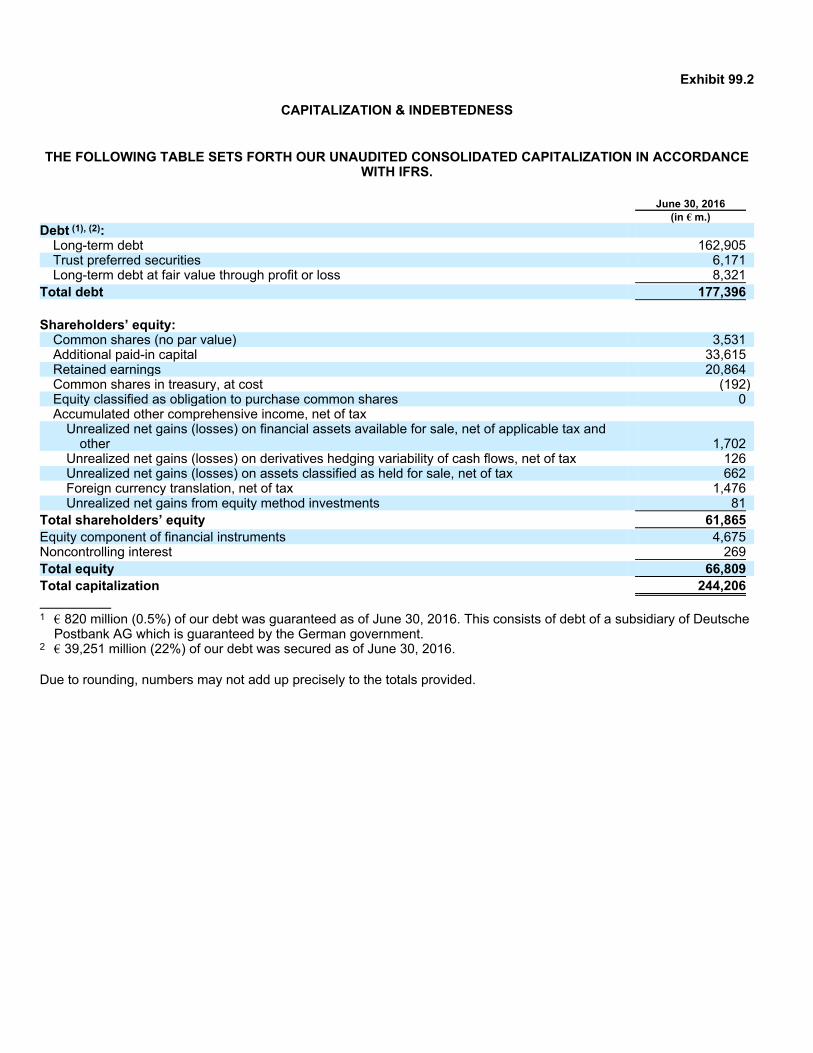
Exhibit 99.2
CAPITALIZATION & INDEBTEDNESS
THE FOLLOWING TABLE SETS FORTH OUR UNAUDITED CONSOLIDATED CAPITALIZATION IN ACCORDANCE WITH IFRS.
Due to rounding, numbers may not add up precisely to the totals provided.
June 30, 2016 (in € m.)Debt (1), (2):
Long-term debt 162,905 Trust preferred securities 6,171 Long-term debt at fair value through profit or loss 8,321
Total debt 177,396
Shareholders’ equity: Common shares (no par value) 3,531 Additional paid-in capital 33,615 Retained earnings 20,864 Common shares in treasury, at cost (192) Equity classified as obligation to purchase common shares 0 Accumulated other comprehensive income, net of tax
Unrealized net gains (losses) on financial assets available for sale, net of applicable tax and other 1,702
Unrealized net gains (losses) on derivatives hedging variability of cash flows, net of tax 126 Unrealized net gains (losses) on assets classified as held for sale, net of tax 662 Foreign currency translation, net of tax 1,476 Unrealized net gains from equity method investments 81
Total shareholders’ equity 61,865
Equity component of financial instruments 4,675 Noncontrolling interest 269
Total equity 66,809
Total capitalization 244,206
1 € 820 million (0.5%) of our debt was guaranteed as of June 30, 2016. This consists of debt of a subsidiary of Deutsche Postbank AG which is guaranteed by the German government.
2 € 39,251 million (22%) of our debt was secured as of June 30, 2016.
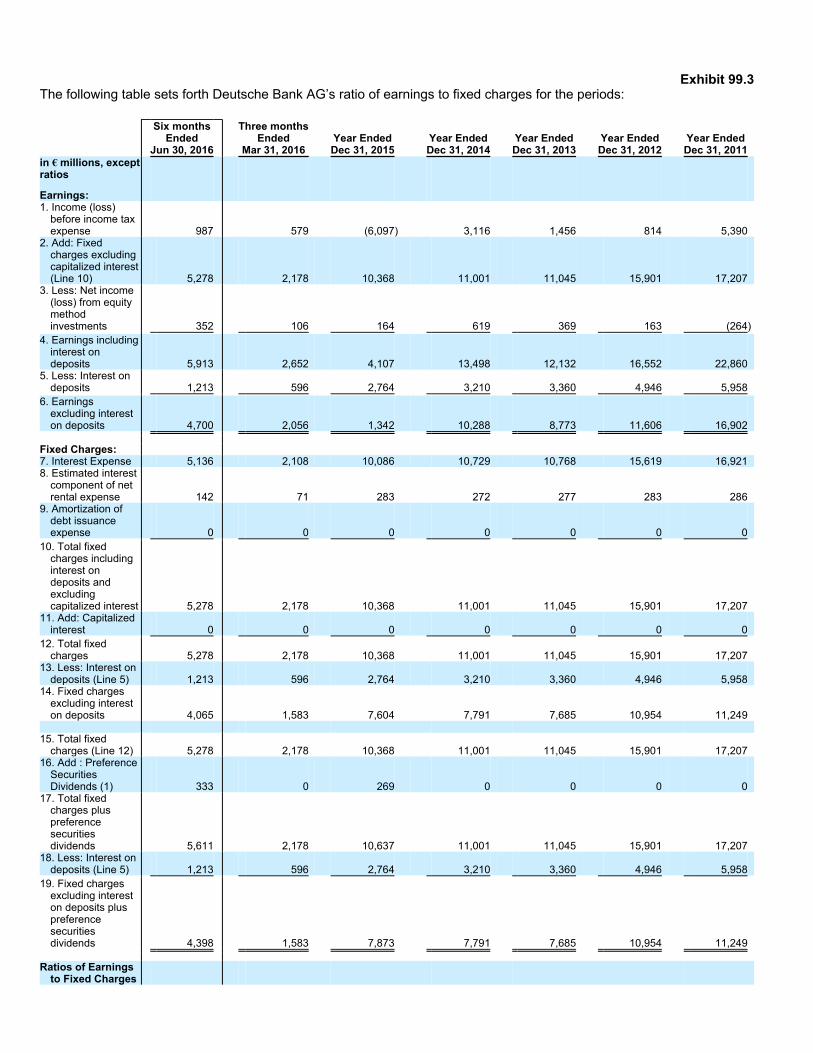
Exhibit 99.3 The following table sets forth Deutsche Bank AG’s ratio of earnings to fixed charges for the periods:
Six months Ended
Jun 30, 2016
Three monthsEnded
Mar 31, 2016 Year EndedDec 31, 2015
Year EndedDec 31, 2014
Year Ended Dec 31, 2013
Year Ended Dec 31, 2012
Year EndedDec 31, 2011
in € millions, except ratios Earnings: 1. Income (loss)
before income tax expense 987 579 (6,097) 3,116 1,456 814 5,390
2. Add: Fixed charges excluding capitalized interest (Line 10) 5,278 2,178 10,368 11,001 11,045 15,901 17,207
3. Less: Net income (loss) from equity method investments 352 106 164 619 369 163 (264)
4. Earnings including interest on deposits 5,913 2,652 4,107 13,498 12,132 16,552 22,860
5. Less: Interest on deposits 1,213 596 2,764 3,210 3,360 4,946 5,958
6. Earnings excluding interest on deposits 4,700 2,056 1,342 10,288 8,773 11,606 16,902
Fixed Charges: 7. Interest Expense 5,136 2,108 10,086 10,729 10,768 15,619 16,921 8. Estimated interest
component of net rental expense 142 71 283 272 277 283 286
9. Amortization of debt issuance expense 0 0 0 0 0 0 0
10. Total fixed charges including interest on deposits and excluding capitalized interest 5,278 2,178 10,368 11,001 11,045 15,901 17,207
11. Add: Capitalized interest 0 0 0 0 0 0 0
12. Total fixed charges 5,278 2,178 10,368 11,001 11,045 15,901 17,207
13. Less: Interest on deposits (Line 5) 1,213 596 2,764 3,210 3,360 4,946 5,958
14. Fixed charges excluding interest on deposits 4,065 1,583 7,604 7,791 7,685 10,954 11,249
15. Total fixed
charges (Line 12) 5,278 2,178 10,368 11,001 11,045 15,901 17,207 16. Add : Preference
Securities Dividends (1) 333 0 269 0 0 0 0
17. Total fixed charges plus preference securities dividends 5,611 2,178 10,637 11,001 11,045 15,901 17,207
18. Less: Interest on deposits (Line 5) 1,213 596 2,764 3,210 3,360 4,946 5,958
19. Fixed charges excluding interest on deposits plus preference securities dividends 4,398 1,583 7,873 7,791 7,685 10,954 11,249
Ratios of Earnings to Fixed Charges
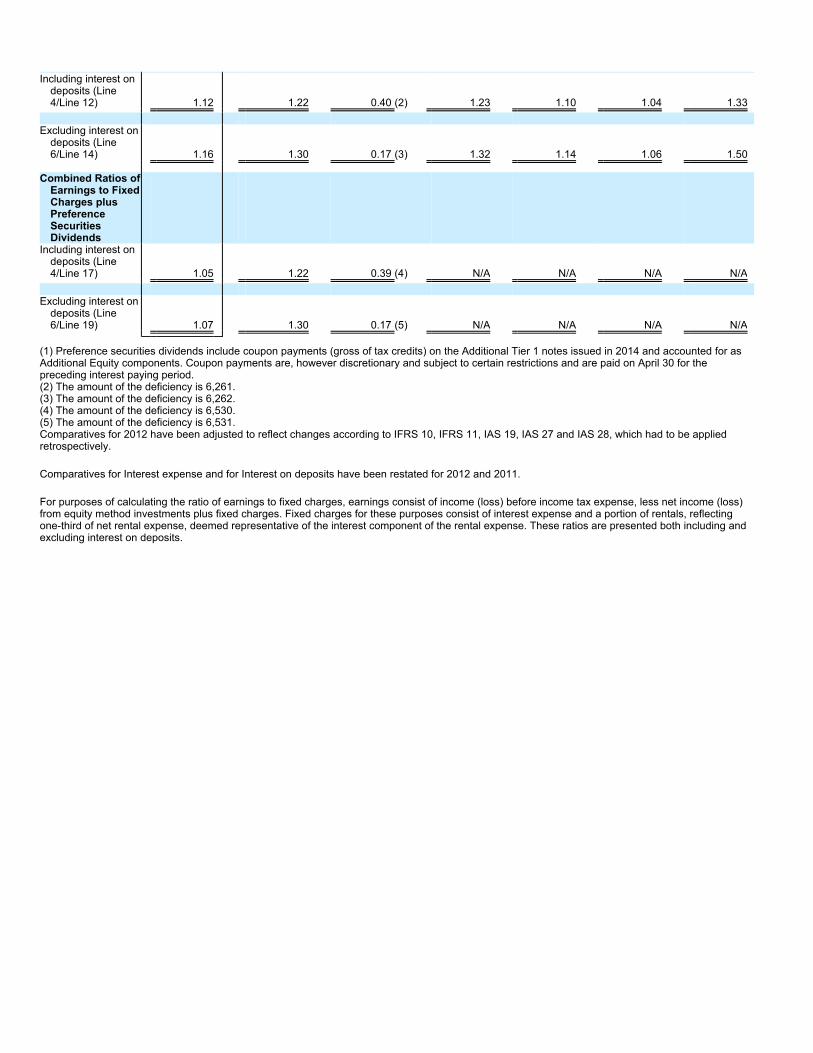
(1) Preference securities dividends include coupon payments (gross of tax credits) on the Additional Tier 1 notes issued in 2014 and accounted for as Additional Equity components. Coupon payments are, however discretionary and subject to certain restrictions and are paid on April 30 for the preceding interest paying period. (2) The amount of the deficiency is 6,261. (3) The amount of the deficiency is 6,262. (4) The amount of the deficiency is 6,530. (5) The amount of the deficiency is 6,531. Comparatives for 2012 have been adjusted to reflect changes according to IFRS 10, IFRS 11, IAS 19, IAS 27 and IAS 28, which had to be applied retrospectively.
Comparatives for Interest expense and for Interest on deposits have been restated for 2012 and 2011.
For purposes of calculating the ratio of earnings to fixed charges, earnings consist of income (loss) before income tax expense, less net income (loss) from equity method investments plus fixed charges. Fixed charges for these purposes consist of interest expense and a portion of rentals, reflecting one-third of net rental expense, deemed representative of the interest component of the rental expense. These ratios are presented both including and excluding interest on deposits.
Including interest on deposits (Line 4/Line 12) 1.12 1.22 0.40 (2) 1.23 1.10 1.04 1.33
Excluding interest on
deposits (Line 6/Line 14) 1.16 1.30 0.17 (3) 1.32 1.14 1.06 1.50
Combined Ratios of Earnings to Fixed Charges plus Preference Securities Dividends
Including interest on deposits (Line 4/Line 17) 1.05 1.22 0.39 (4) N/A N/A N/A N/A
Excluding interest on
deposits (Line 6/Line 19) 1.07 1.30 0.17 (5) N/A N/A N/A N/A