Embed Size (px)
Citation preview
UNITED STATES
SECURITIES AND EXCHANGE COMMISSION
WASHINGTON, D.C. 20549
Form 6-K
Report of Foreign Private Issuer
Pursuant to Rule 13a-16 or 15d-16 of
the Securities Exchange Act of 1934
For the six months ended June 30, 2019
Commission File Number 001-10882
Aegon N.V.
(Translation of registrant’s name into English)
Aegonplein 50
P.O. Box 85
2501 CB The Hague
The Netherlands
(Address of principal executive offices)
Indicate by check mark whether the registrant files or will file annual reports under cover of
Form 20-F or Form 40-F.
☒ Form 20-F ☐ Form 40-F
Indicate by check mark if the registrant is submitting the Form 6-K in paper as permitted by
Regulation S-T Rule 101(b)(1):_____
Indicate by check mark if the registrant is submitting the Form 6-K in paper as permitted by
Regulation S-T Rule 101(b)(7):_____
The financial statements, notes thereto and Operating and Financial Review and Prospects of Aegon N.V. listed below are attached hereto as
Exhibit 99.1. Such financial statements and discussion and analysis are incorporated by reference herein and in Aegon’s Registration
Statements under the Securities Act of 1933 on Form F-3 (333-220276 and 333-222212) and on Form S-8 (Nos 333-196156, 333-183176,
333-157843, and 333-150774).
Item 1: Interim Financial Statements
Condensed consolidated income statement for the six months ended June 30, 2019 and June 30, 2018
Condensed consolidated statement of comprehensive income for the six months ended June 30, 2019 and June 30, 2018
Condensed consolidated statement of financial position at June 30, 2019 and December 31, 2018
Condensed consolidated statement of changes in equity for the six months ended June 30, 2019 and June 30, 2018
Condensed consolidated cash flow statement for the six months ended June 30, 2019 and June 30, 2018
Notes to the Condensed consolidated interim financial statements
Item 2: Operating and financial review and prospects
SIGNATURE
Pursuant to the requirements of the Securities Exchange Act of 1934, the registrant has duly caused this report to be signed on its behalf by the
undersigned, thereunto duly authorized.
Aegon N.V.
(Registrant)
Date: August 15, 2019
/s/ J.H.P.M. van Rossum
J.H.P.M. van Rossum
Executive Vice President and
Head of Corporate Financial Center
Unaudited
Exhibit 99.1
Index Page Number
Item 1: Condensed consolidated interim financial statements
Condensed consolidated income statement 1
Condensed consolidated statement of comprehensive income 2
Condensed consolidated statement of financial position 3
Condensed consolidated statement of changes in equity 4
Condensed consolidated cash flow statement 5
Notes to the Condensed consolidated interim financial statements 6
Item 2: Operating and financial review and prospects 24
Unaudited
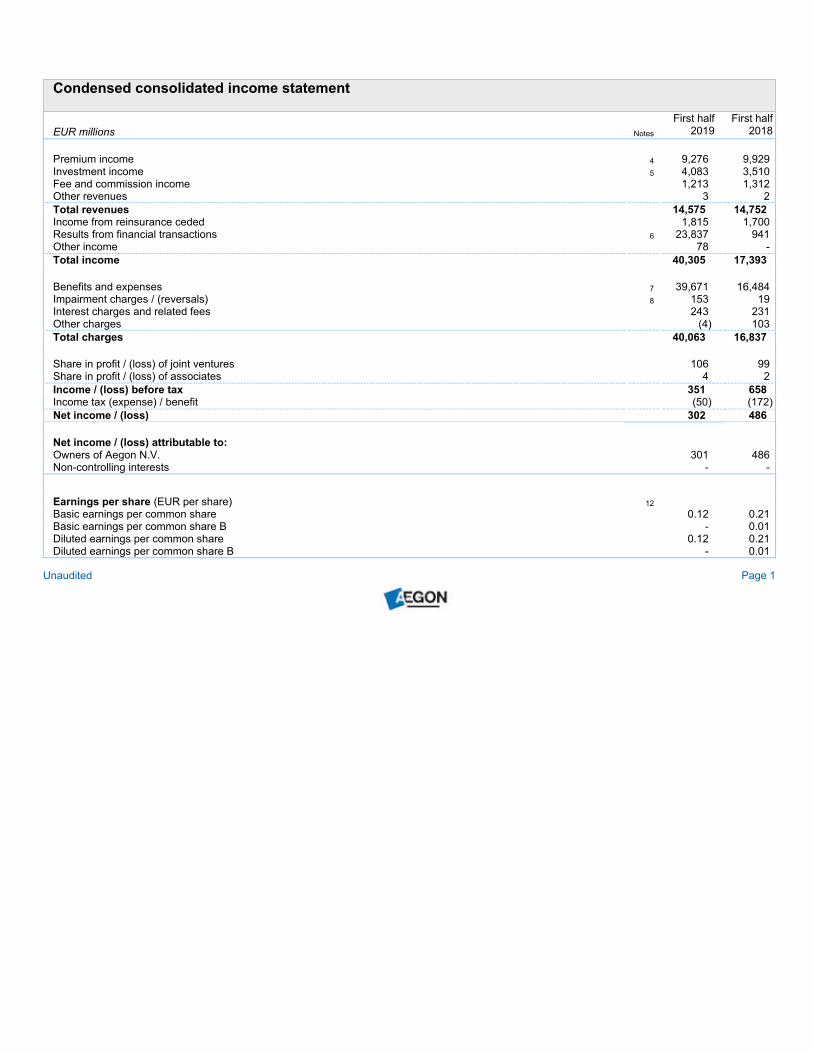
Condensed consolidated income statement
EUR millions Notes
First half
2019
First half
2018
Premium income 4 9,276 9,929
Investment income 5 4,083 3,510
Fee and commission income 1,213 1,312
Other revenues 3 2
Total revenues 14,575 14,752
Income from reinsurance ceded 1,815 1,700
Results from financial transactions 6 23,837 941
Other income 78 -
Total income 40,305 17,393
Benefits and expenses 7 39,671 16,484
Impairment charges / (reversals) 8 153 19
Interest charges and related fees 243 231
Other charges (4) 103
Total charges 40,063 16,837
Share in profit / (loss) of joint ventures 106 99
Share in profit / (loss) of associates 4 2
Income / (loss) before tax 351 658
Income tax (expense) / benefit (50) (172)
Net income / (loss) 302 486
Net income / (loss) attributable to:
Owners of Aegon N.V. 301 486
Non-controlling interests - -
Earnings per share (EUR per share) 12
Basic earnings per common share 0.12 0.21
Basic earnings per common share B - 0.01
Diluted earnings per common share 0.12 0.21
Diluted earnings per common share B - 0.01
Unaudited Page 1
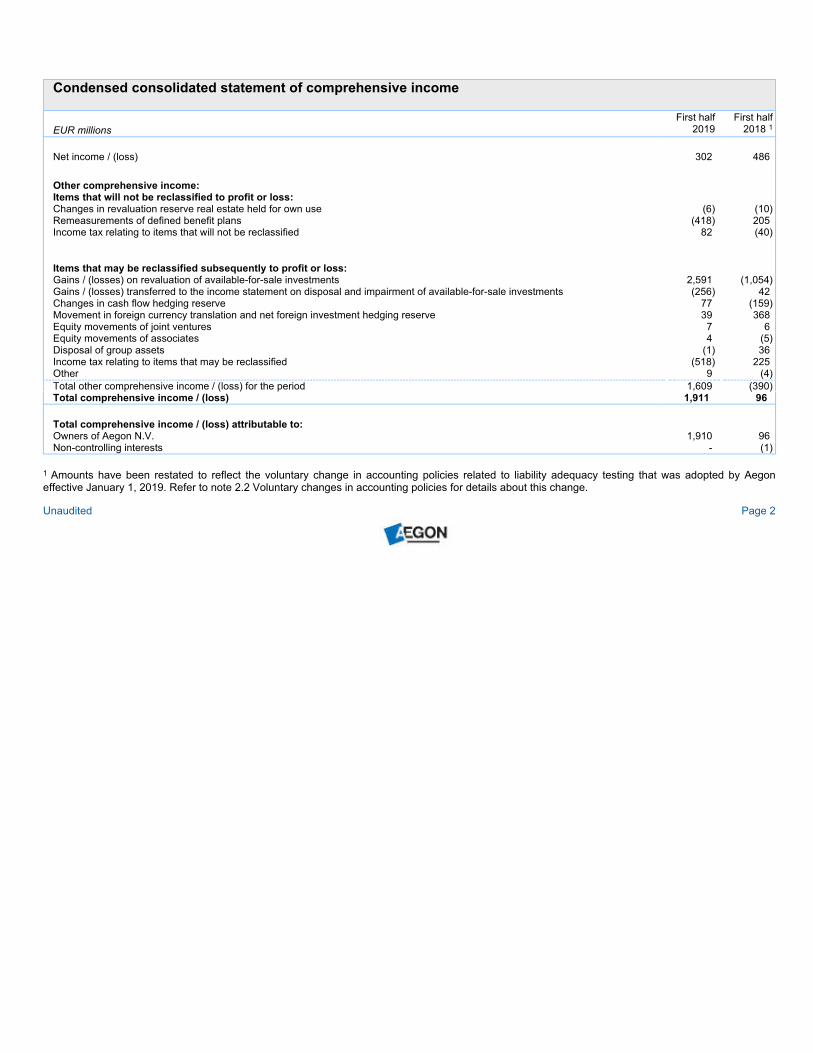
Condensed consolidated statement of comprehensive income
EUR millions
First half
2019
First half
2018 1
Net income / (loss) 302 486
Other comprehensive income:
Items that will not be reclassified to profit or loss:
Changes in revaluation reserve real estate held for own use (6) (10)
Remeasurements of defined benefit plans (418) 205
Income tax relating to items that will not be reclassified 82 (40)
Items that may be reclassified subsequently to profit or loss:
Gains / (losses) on revaluation of available-for-sale investments 2,591 (1,054)
Gains / (losses) transferred to the income statement on disposal and impairment of available-for-sale investments (256) 42
Changes in cash flow hedging reserve 77 (159)
Movement in foreign currency translation and net foreign investment hedging reserve 39 368
Equity movements of joint ventures 7 6
Equity movements of associates 4 (5)
Disposal of group assets (1) 36
Income tax relating to items that may be reclassified (518) 225
Other 9 (4)
Total other comprehensive income / (loss) for the period 1,609 (390)
Total comprehensive income / (loss) 1,911 96
Total comprehensive income / (loss) attributable to:
Owners of Aegon N.V. 1,910 96
Non-controlling interests - (1)
1 Amounts have been restated to reflect the voluntary change in accounting policies related to liability adequacy testing that was adopted by Aegon
effective January 1, 2019. Refer to note 2.2 Voluntary changes in accounting policies for details about this change.
Unaudited Page 2
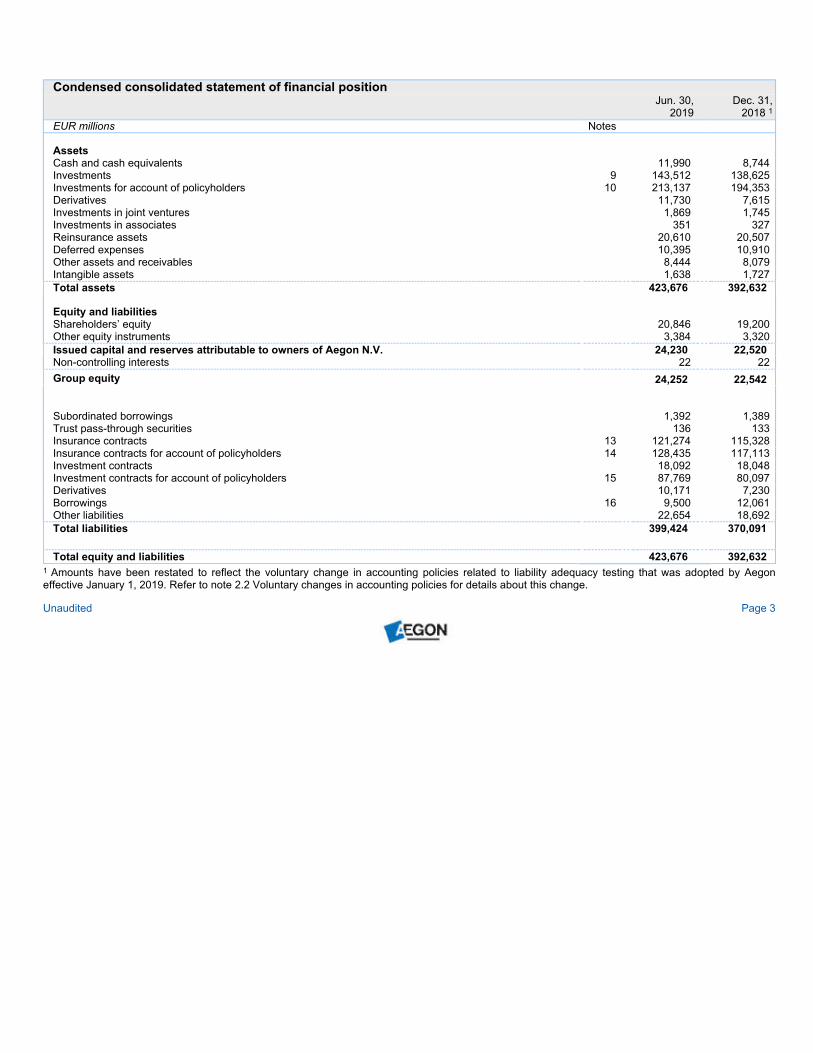
Condensed consolidated statement of financial position
Jun. 30,
2019
Dec. 31,
2018 1
EUR millions Notes
Assets
Cash and cash equivalents 11,990 8,744
Investments 9 143,512 138,625
Investments for account of policyholders 10 213,137 194,353
Derivatives 11,730 7,615
Investments in joint ventures 1,869 1,745
Investments in associates 351 327
Reinsurance assets 20,610 20,507
Deferred expenses 10,395 10,910
Other assets and receivables 8,444 8,079
Intangible assets 1,638 1,727
Total assets 423,676 392,632
Equity and liabilities
Shareholders’ equity 20,846 19,200
Other equity instruments 3,384 3,320
Issued capital and reserves attributable to owners of Aegon N.V. 24,230 22,520
Non-controlling interests 22 22
Group equity 24,252 22,542
Subordinated borrowings 1,392 1,389
Trust pass-through securities 136 133
Insurance contracts 13 121,274 115,328
Insurance contracts for account of policyholders 14 128,435 117,113
Investment contracts 18,092 18,048
Investment contracts for account of policyholders 15 87,769 80,097
Derivatives 10,171 7,230
Borrowings 16 9,500 12,061
Other liabilities 22,654 18,692
Total liabilities 399,424 370,091
Total equity and liabilities 423,676 392,632
1 Amounts have been restated to reflect the voluntary change in accounting policies related to liability adequacy testing that was adopted by Aegon
effective January 1, 2019. Refer to note 2.2 Voluntary changes in accounting policies for details about this change.
Unaudited Page 3
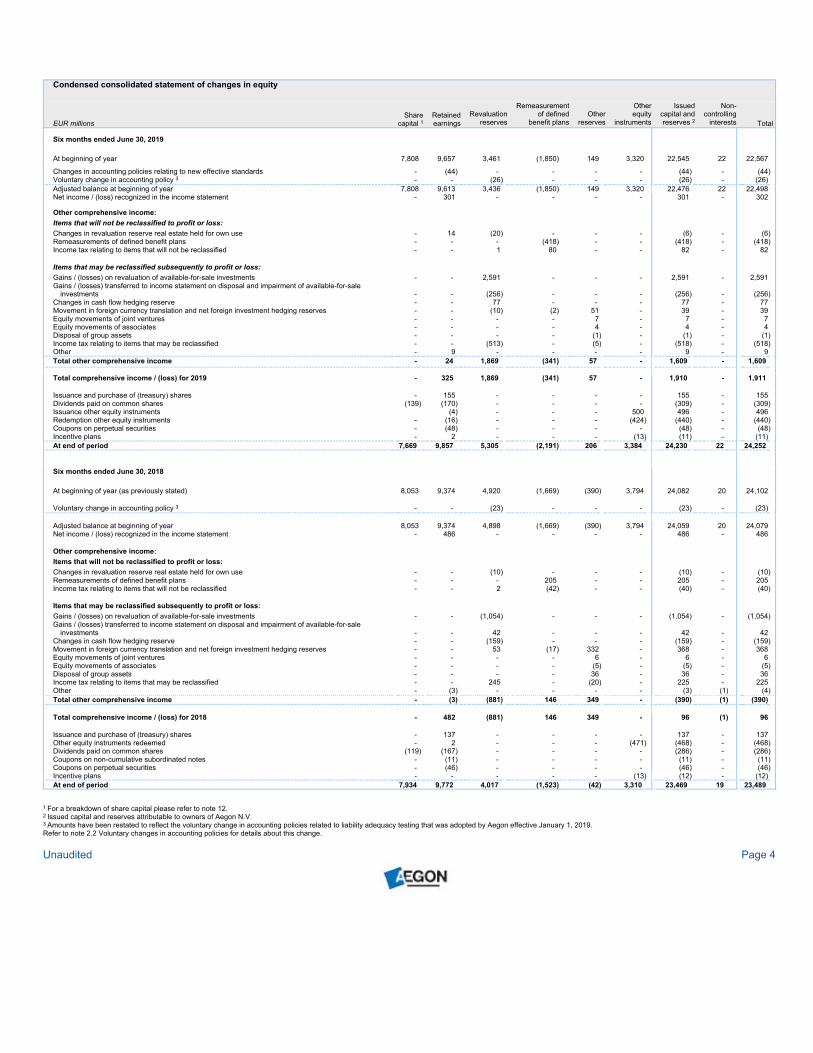
Condensed consolidated statement of changes in equity
EUR millions
Share
capital 1
Retained
earnings
Revaluation
reserves
Remeasurement
of defined
benefit plans
Other
reserves
Other
equity
instruments
Issued
capital and
reserves 2
Non-
controlling
interests Total
Six months ended June 30, 2019
At beginning of year 7,808 9,657 3,461 (1,850) 149 3,320 22,545 22 22,567
Changes in accounting policies relating to new effective standards - (44) - - - - (44) - (44)
Voluntary change in accounting policy 3 - - (26) - - - (26) - (26)
Adjusted balance at beginning of year 7,808 9,613 3,436 (1,850) 149 3,320 22,476 22 22,498
Net income / (loss) recognized in the income statement - 301 - - - - 301 - 302
Other comprehensive income:
Items that will not be reclassified to profit or loss:
Changes in revaluation reserve real estate held for own use - 14 (20) - - - (6) - (6)
Remeasurements of defined benefit plans - - - (418) - - (418) - (418)
Income tax relating to items that will not be reclassified - - 1 80 - - 82 - 82
Items that may be reclassified subsequently to profit or loss:
Gains / (losses) on revaluation of available-for-sale investments - - 2,591 - - - 2,591 - 2,591
Gains / (losses) transferred to income statement on disposal and impairment of available-for-sale
investments - - (256) - - - (256) - (256)
Changes in cash flow hedging reserve - - 77 - - - 77 - 77
Movement in foreign currency translation and net foreign investment hedging reserves - - (10) (2) 51 - 39 - 39
Equity movements of joint ventures - - - - 7 - 7 - 7
Equity movements of associates - - - - 4 - 4 - 4
Disposal of group assets - - - - (1) - (1) - (1)
Income tax relating to items that may be reclassified - - (513) - (5) - (518) - (518)
Other - 9 - - - - 9 - 9
Total other comprehensive income - 24 1,869 (341) 57 - 1,609 - 1,609
Total comprehensive income / (loss) for 2019 - 325 1,869 (341) 57 - 1,910 - 1,911
Issuance and purchase of (treasury) shares - 155 - - - - 155 - 155
Dividends paid on common shares (139) (170) - - - - (309) - (309)
Issuance other equity instruments (4) - - - 500 496 - 496
Redemption other equity instruments - (16) - - - (424) (440) - (440)
Coupons on perpetual securities - (48) - - - - (48) - (48)
Incentive plans - 2 - - - (13) (11) - (11)
At end of period 7,669 9,857 5,305 (2,191) 206 3,384 24,230 22 24,252
Six months ended June 30, 2018
At beginning of year (as previously stated) 8,053 9,374 4,920 (1,669) (390) 3,794 24,082 20 24,102
Voluntary change in accounting policy 3 - - (23) - - - (23) - (23)
Adjusted balance at beginning of year 8,053 9,374 4,898 (1,669) (390) 3,794 24,059 20 24,079
Net income / (loss) recognized in the income statement - 486 - - - - 486 - 486
Other comprehensive income:
Items that will not be reclassified to profit or loss:
Changes in revaluation reserve real estate held for own use - - (10) - - - (10) - (10)
Remeasurements of defined benefit plans - - - 205 - - 205 - 205
Income tax relating to items that will not be reclassified - - 2 (42) - - (40) - (40)
Items that may be reclassified subsequently to profit or loss:
Gains / (losses) on revaluation of available-for-sale investments - - (1,054) - - - (1,054) - (1,054)
Gains / (losses) transferred to income statement on disposal and impairment of available-for-sale
investments - - 42 - - - 42 - 42
Changes in cash flow hedging reserve - - (159) - - - (159) - (159)
Movement in foreign currency translation and net foreign investment hedging reserves - - 53 (17) 332 - 368 - 368
Equity movements of joint ventures - - - - 6 - 6 - 6
Equity movements of associates - - - - (5) - (5) - (5)
Disposal of group assets - - - - 36 - 36 - 36
Income tax relating to items that may be reclassified - - 245 - (20) - 225 - 225
Other - (3) - - - - (3) (1) (4)
Total other comprehensive income - (3) (881) 146 349 - (390) (1) (390)
Total comprehensive income / (loss) for 2018 - 482 (881) 146 349 - 96 (1) 96
Issuance and purchase of (treasury) shares - 137 - - - - 137 - 137
Other equity instruments redeemed - 2 - - - (471) (468) - (468)
Dividends paid on common shares (119) (167) - - - - (286) - (286)
Coupons on non-cumulative subordinated notes - (11) - - - - (11) - (11)
Coupons on perpetual securities - (46) - - - - (46) - (46)
Incentive plans - - - - - (13) (12) - (12)
At end of period 7,934 9,772 4,017 (1,523) (42) 3,310 23,469 19 23,489
1 For a breakdown of share capital please refer to note 12.
2 Issued capital and reserves attributable to owners of Aegon N.V.
3 Amounts have been restated to reflect the voluntary change in accounting policies related to liability adequacy testing that was adopted by Aegon effective January 1, 2019.
Refer to note 2.2 Voluntary changes in accounting policies for details about this change.
Unaudited Page 4
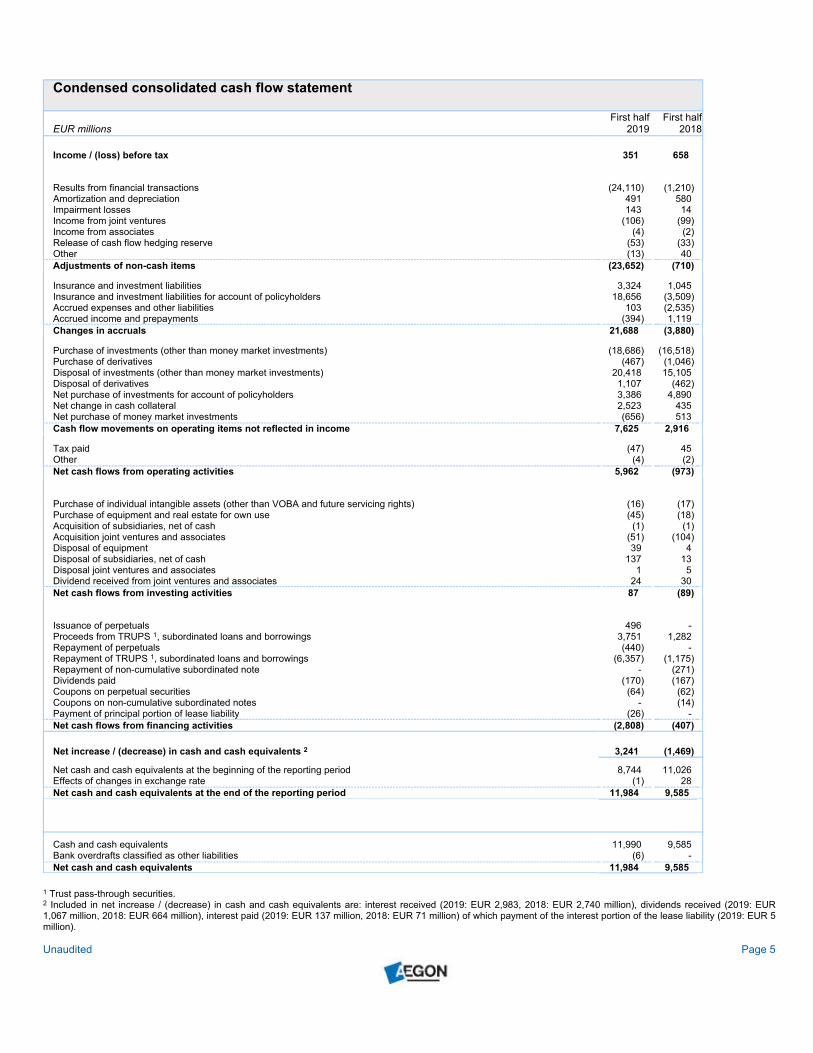
Condensed consolidated cash flow statement
EUR millions
First half
2019
First half
2018
Income / (loss) before tax 351 658
Results from financial transactions (24,110) (1,210)
Amortization and depreciation 491 580
Impairment losses 143 14
Income from joint ventures (106) (99)
Income from associates (4) (2)
Release of cash flow hedging reserve (53) (33)
Other (13) 40
Adjustments of non-cash items (23,652) (710)
Insurance and investment liabilities 3,324 1,045
Insurance and investment liabilities for account of policyholders 18,656 (3,509)
Accrued expenses and other liabilities 103 (2,535)
Accrued income and prepayments (394) 1,119
Changes in accruals 21,688 (3,880)
Purchase of investments (other than money market investments) (18,686) (16,518)
Purchase of derivatives (467) (1,046)
Disposal of investments (other than money market investments) 20,418 15,105
Disposal of derivatives 1,107 (462)
Net purchase of investments for account of policyholders 3,386 4,890
Net change in cash collateral 2,523 435
Net purchase of money market investments (656) 513
Cash flow movements on operating items not reflected in income 7,625 2,916
Tax paid (47) 45
Other (4) (2)
Net cash flows from operating activities 5,962 (973)
Purchase of individual intangible assets (other than VOBA and future servicing rights) (16) (17)
Purchase of equipment and real estate for own use (45) (18)
Acquisition of subsidiaries, net of cash (1) (1)
Acquisition joint ventures and associates (51) (104)
Disposal of equipment 39 4
Disposal of subsidiaries, net of cash 137 13
Disposal joint ventures and associates 1 5
Dividend received from joint ventures and associates 24 30
Net cash flows from investing activities 87 (89)
Issuance of perpetuals 496 -
Proceeds from TRUPS 1, subordinated loans and borrowings 3,751 1,282
Repayment of perpetuals (440) -
Repayment of TRUPS 1, subordinated loans and borrowings (6,357) (1,175)
Repayment of non-cumulative subordinated note - (271)
Dividends paid (170) (167)
Coupons on perpetual securities (64) (62)
Coupons on non-cumulative subordinated notes - (14)
Payment of principal portion of lease liability (26) -
Net cash flows from financing activities (2,808) (407)
Net increase / (decrease) in cash and cash equivalents 2 3,241 (1,469)
Net cash and cash equivalents at the beginning of the reporting period 8,744 11,026
Effects of changes in exchange rate (1) 28
Net cash and cash equivalents at the end of the reporting period 11,984 9,585
Cash and cash equivalents 11,990 9,585
Bank overdrafts classified as other liabilities (6) -
Net cash and cash equivalents 11,984 9,585
1 Trust pass-through securities.
2 Included in net increase / (decrease) in cash and cash equivalents are: interest received (2019: EUR 2,983, 2018: EUR 2,740 million), dividends received (2019: EUR
1,067 million, 2018: EUR 664 million), interest paid (2019: EUR 137 million, 2018: EUR 71 million) of which payment of the interest portion of the lease liability (2019: EUR 5
million).
Unaudited Page 5
Notes to the condensed consolidated interim financial statements of Aegon N.V. (unaudited)
Amounts in EUR millions, unless otherwise stated
Aegon N.V., incorporated and domiciled in the Netherlands, is a public limited liability company organized under Dutch law and recorded in the
Commercial Register of The Hague under number 27076669 and with its registered address at Aegonplein 50, 2591 TV, The Hague, the Netherlands.
Aegon N.V. serves as the holding company for The Aegon Group and has listings of its common shares in Amsterdam and New York.
Aegon N.V. (or ‘the Company’) and its subsidiaries (‘Aegon’ or ‘the Group’) have life insurance and pensions operations in more than 20 countries in the
Americas, Europe and Asia and are also active in savings and asset management operations, accident and health insurance, general insurance and - to
a limited extent - banking operations. Headquarters are located in The Hague, the Netherlands. The Group employs almost 26,000 people worldwide.
Aegon Funding Company LLC
Aegon Funding Company LLC (AFC) is an indirect wholly owned subsidiary of Aegon that has been established as a financing vehicle to raise funds for
the US subsidiaries of Aegon. AFC has been fully consolidated in the financial statements of Aegon under IFRS. If AFC issues debt securities, Aegon will
fully and unconditionally guarantee the due and punctual payment of the principal, any premium and any interest on those debt securities when and as
these payments become due and payable, whether at maturity, upon redemption or declaration of acceleration, or otherwise. The guarantees of senior
debt securities will constitute an unsecured, unsubordinated obligation of Aegon and will rank equally with all other unsecured and unsubordinated
obligations of Aegon. The guarantees of subordinated debt securities will constitute an unsecured obligation of Aegon and will be subordinated in right of
payment to all senior indebtedness of Aegon.
1. Basis of presentation
The condensed consolidated interim financial statements as at, and for the six months period ended, June 30, 2019 (first half 2019), have been prepared
in accordance with IAS 34 “Interim Financial Reporting”, as issued by the International Accounting Standards Board (hereafter “IFRS”). They do not
include all of the information required for a full set of financial statements prepared in accordance with IFRS and should therefore be read together with
the 2018 consolidated financial statements of Aegon N.V. as included in Aegon’s Integrated Annual Report on Form 20-F for 2018. Aegon’s Integrated
Annual Report on Form 20-F for 2018 is available on its website (aegon.com).
The condensed consolidated interim financial statements have been prepared in accordance with the historical cost convention as modified by the
revaluation of investment properties and those financial instruments (including derivatives) and financial liabilities that have been measured at fair value.
The condensed consolidated interim financial statements are presented in euro (EUR) and all values are rounded to the nearest million unless otherwise
stated. The consequence is that the rounded amounts may not add up to the rounded total in all cases.
The condensed consolidated interim financial statements as at, and for the six-month period ended, June 30, 2019, were approved by the Executive
Board on August 14, 2019.
The published figures in these condensed consolidated interim financial statements are unaudited.
Unaudited Page 6
Other than for SEC reporting purposes, Aegon prepares its condensed consolidated interim financial statements under International Financial Reporting
Standards as adopted by the European Union, including the decisions Aegon made with regard to the options available under International Financial
Reporting Standards as adopted by the EU (IFRS-EU). IFRS-EU differs from IFRS in respect of certain paragraphs in IAS 39 ‘Financial Instruments:
Recognition and Measurement’ regarding hedge accounting for portfolio hedges of interest rate risk. Under IFRS-EU, Aegon applies fair value hedge
accounting for portfolio hedges of interest rate risk (fair value macro hedges) in accordance with the EU ‘carve out’ version of IAS 39. Under IFRS, hedge
accounting for fair value macro hedges cannot be applied to mortgage loans and ineffectiveness arises whenever the revised estimate of the amount of
cash flows in scheduled time buckets is either more or less than the original designated amount of that bucket.
This information is prepared by reversing the hedge accounting impacts that are applied under the EU ‘carve out’ version of IAS 39. Financial information
under IFRS accordingly does not take account of the possibility that had Aegon applied IFRS as its primary accounting framework it might have applied
alternative hedge strategies where those alternative hedge strategies could have qualified for IFRS compliant hedge accounting. These decisions could
have resulted in different shareholders’ equity and net income amounts compared with those indicated in this condensed consolidated interim financial
statements on Form 6-K.
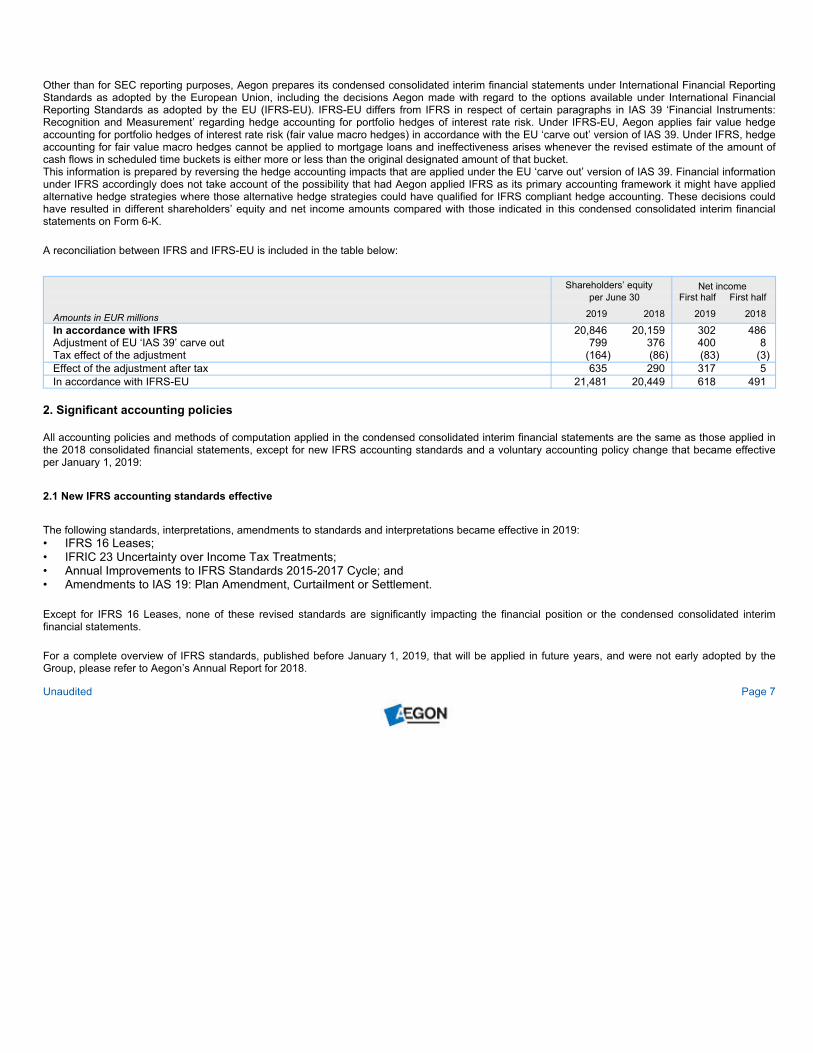
A reconciliation between IFRS and IFRS-EU is included in the table below:
Shareholders’ equity Net income
per June 30 First half First half
Amounts in EUR millions2019 2018 2019 2018
In accordance with IFRS 20,846 20,159 302 486
Adjustment of EU ‘IAS 39’ carve out 799 376 400 8
Tax effect of the adjustment (164) (86) (83) (3)
Effect of the adjustment after tax 635 290 317 5
In accordance with IFRS-EU 21,481 20,449 618 491
2. Significant accounting policies
All accounting policies and methods of computation applied in the condensed consolidated interim financial statements are the same as those applied in
the 2018 consolidated financial statements, except for new IFRS accounting standards and a voluntary accounting policy change that became effective
per January 1, 2019:
2.1 New IFRS accounting standards effective
The following standards, interpretations, amendments to standards and interpretations became effective in 2019:
• IFRS 16 Leases;
• IFRIC 23 Uncertainty over Income Tax Treatments;
• Annual Improvements to IFRS Standards 2015-2017 Cycle; and
• Amendments to IAS 19: Plan Amendment, Curtailment or Settlement.
Except for IFRS 16 Leases, none of these revised standards are significantly impacting the financial position or the condensed consolidated interim
financial statements.
For a complete overview of IFRS standards, published before January 1, 2019, that will be applied in future years, and were not early adopted by the
Group, please refer to Aegon’s Annual Report for 2018.
Unaudited Page 7
IFRS 16 Leases
IFRS 16 Leases was issued by the IASB in January 2016 and replaced IAS 17 Leases and IFRIC 4 on January 2019. The most significant change of
IFRS 16 is related to leases that were identified as operational leases held by a lessee under IAS 17. Under IAS 17 these leases were reported as (off-
balance) Operating lease obligations, and after January 1, 2019 reported as (on-balance) lease liabilities with the accompanying lease assets.
The Group has applied IFRS 16 using the modified retrospective approach and therefore the comparative information has not been restated and
continues to be reported under IAS 17 and IFRIC 4.
Policy applicable from January 1, 2019
As a lessee
The Group recognises a right-of-use asset and a lease liability at the lease commencement date. The right-of-use asset is initially measured at cost,
which comprises the initial amount of the lease liability adjusted for any lease payments made at or before the commencement date, plus any initial direct
costs incurred and an estimate of costs to dismantle and remove the underlying asset or to restore the underlying asset or the site on which it is located,
less any lease incentives received.
The right-of-use asset is subsequently depreciated using the straight-line method from the commencement date to the earlier of the end of the useful life
of the right-of-use asset or the end of the lease term. The estimated useful lives of right-of-use assets are determined on the same basis as those of real
estate and equipment. In addition, the right-of-use asset is periodically reduced by impairment losses (using the same rate to measure the lease liability),
if any, and adjusted for certain remeasurements of the lease liability.
The lease liability is initially measured at the present value of the lease payments that are not paid at the commencement date, discounted using the
interest rate implicit in the lease or, if that rate cannot be readily determined, the Group’s incremental borrowing rate. Generally, the Group uses its
incremental borrowing rate as the discount rate.
The lease liability is measured at amortised cost using the effective interest method. It is remeasured when there is a change in future lease payments
arising from a change in an index or rate, if there is a change in the Group’s estimate of the amount expected to be payable under a residual value
guarantee, or if the Group changes its assessment of whether it will exercise a purchase, extension or termination option.
The Group presents right-of-use assets that do not meet the definition of investment property in ‘Other assets and receivables’ and lease liabilities in
‘Other liabilities’ in the statement of financial position.
Short-term leases and leases of low-value assets
The Group has elected not to recognise right-of-use assets and lease liabilities for short-term leases that have a lease term of 12 months or less and
leases of low-value assets, including small office equipment. The Group recognises the lease payments associated with these leases as an expense on a
straight-line basis over the lease term.
As a lessor
From a lessor perspective, IFRS 16 substantially carries forward the lessor accounting requirements in IAS 17, only with additional disclosure
requirements. Accordingly, a lessor continues to classify its leases as operating leases or finance leases, and to account for those two types of leases
differently.
Unaudited Page 8
Transitional disclosures
The Group applied IFRS 16 using the modified retrospective approach, under which the cumulative effect of initial application is recognised in retained
earnings at January 1, 2019.
As a lessee
The Group has adopted a number of key options and practical expedients allowed under IFRS 16 as disclosed in the 2018 consolidated financial
statements.
As a lessor
The Group is not required to make any adjustments on transition to IFRS 16 for leases in which it acts as a lessor, except for a sub-lease. The Group
accounted for its leases in accordance with IFRS 16 from the date of initial application.
Impacts on financial statements
At transition, the Group recognized EUR 235 million of right-of-use assets and lease liabilities of EUR 285 million, recognising the adverse impact of EUR
41 million in shareholders’ equity, in retained earnings. The right-of-use assets mainly consist of approximately EUR 212 million real estate and of
approximately EUR 23 million equipment. The largest right-of-use assets are office buildings located in the United Kingdom and US for an amount of EUR
116 million and EUR 50 million respectively. The Group does not expect material movements in net income going forward.
When measuring lease liabilities, the Group discounted lease payments using its incremental borrowing rate at January 1, 2019. The weighted-average
rate applied is 3.46%.
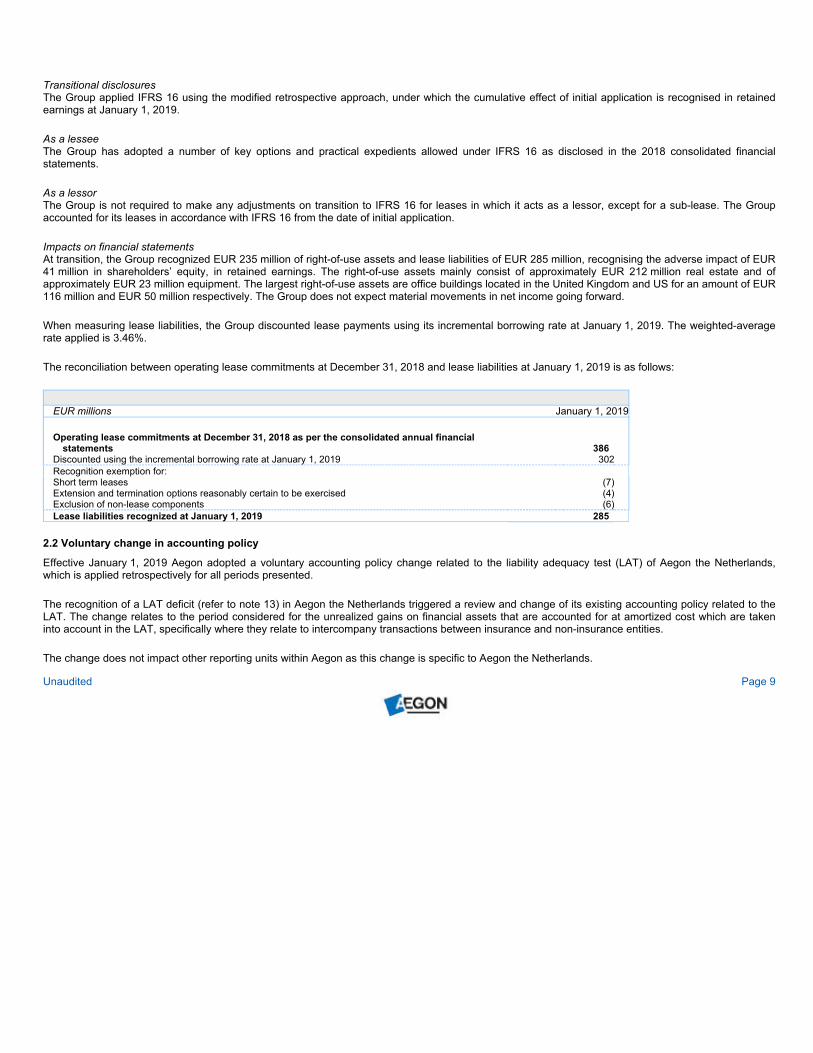
The reconciliation between operating lease commitments at December 31, 2018 and lease liabilities at January 1, 2019 is as follows:
EUR millions January 1, 2019
Operating lease commitments at December 31, 2018 as per the consolidated annual financial
statements 386
Discounted using the incremental borrowing rate at January 1, 2019 302
Recognition exemption for:
Short term leases (7)
Extension and termination options reasonably certain to be exercised (4)
Exclusion of non-lease components (6)
Lease liabilities recognized at January 1, 2019 285
2.2 Voluntary change in accounting policy
Effective January 1, 2019 Aegon adopted a voluntary accounting policy change related to the liability adequacy test (LAT) of Aegon the Netherlands,
which is applied retrospectively for all periods presented.
The recognition of a LAT deficit (refer to note 13) in Aegon the Netherlands triggered a review and change of its existing accounting policy related to the
LAT. The change relates to the period considered for the unrealized gains on financial assets that are accounted for at amortized cost which are taken
into account in the LAT, specifically where they relate to intercompany transactions between insurance and non-insurance entities.
The change does not impact other reporting units within Aegon as this change is specific to Aegon the Netherlands.
Unaudited Page 9
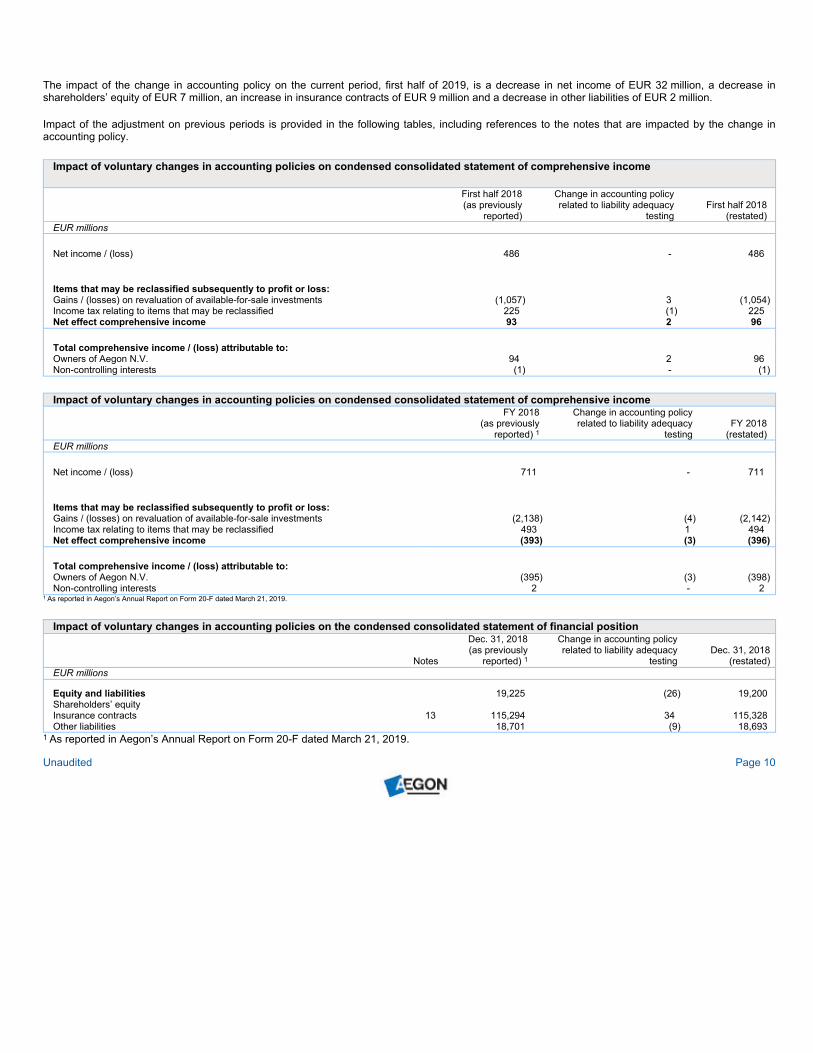
The impact of the change in accounting policy on the current period, first half of 2019, is a decrease in net income of EUR 32 million, a decrease in
shareholders’ equity of EUR 7 million, an increase in insurance contracts of EUR 9 million and a decrease in other liabilities of EUR 2 million.
Impact of the adjustment on previous periods is provided in the following tables, including references to the notes that are impacted by the change in
accounting policy.
Impact of voluntary changes in accounting policies on condensed consolidated statement of comprehensive income
First half 2018
(as previously
reported)
Change in accounting policy
related to liability adequacy
testing
First half 2018
(restated)
EUR millions
Net income / (loss) 486 - 486
Items that may be reclassified subsequently to profit or loss:
Gains / (losses) on revaluation of available-for-sale investments (1,057) 3 (1,054)
Income tax relating to items that may be reclassified 225 (1) 225
Net effect comprehensive income 93 2 96
Total comprehensive income / (loss) attributable to:
Owners of Aegon N.V. 94 2 96
Non-controlling interests (1) - (1)
Impact of voluntary changes in accounting policies on condensed consolidated statement of comprehensive income
FY 2018
(as previously
reported) 1
Change in accounting policy
related to liability adequacy
testing
FY 2018
(restated)
EUR millions
Net income / (loss) 711 - 711
Items that may be reclassified subsequently to profit or loss:
Gains / (losses) on revaluation of available-for-sale investments (2,138) (4) (2,142)
Income tax relating to items that may be reclassified 493 1 494
Net effect comprehensive income (393) (3) (396)
Total comprehensive income / (loss) attributable to:
Owners of Aegon N.V. (395) (3) (398)
Non-controlling interests 2 - 2
1 As reported in Aegon’s Annual Report on Form 20-F dated March 21, 2019.
Impact of voluntary changes in accounting policies on the condensed consolidated statement of financial position
Notes
Dec. 31, 2018
(as previously
reported) 1
Change in accounting policy
related to liability adequacy
testing
Dec. 31, 2018
(restated)
EUR millions
Equity and liabilities 19,225 (26) 19,200
Shareholders’ equity
Insurance contracts 13 115,294 34 115,328
Other liabilities 18,701 (9) 18,693
1 As reported in Aegon’s Annual Report on Form 20-F dated March 21, 2019.
Unaudited Page 10
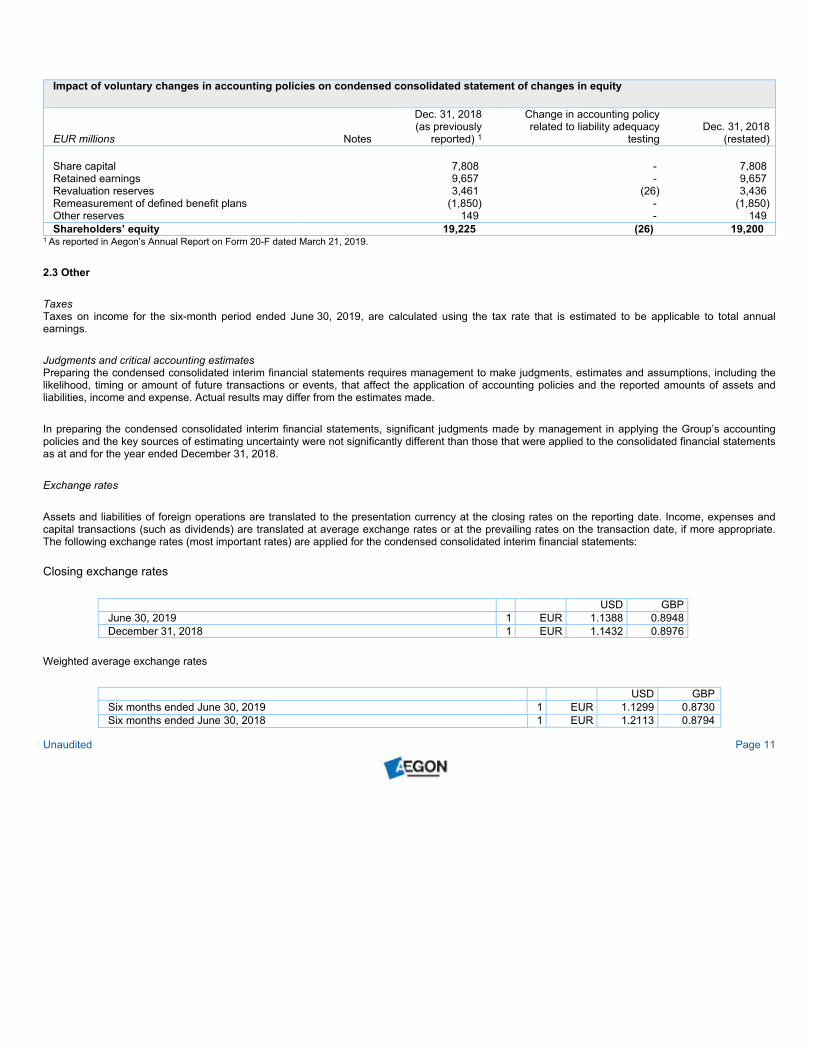
Impact of voluntary changes in accounting policies on condensed consolidated statement of changes in equity
EUR millions Notes
Dec. 31, 2018
(as previously
reported) 1
Change in accounting policy
related to liability adequacy
testing
Dec. 31, 2018
(restated)
Share capital 7,808 - 7,808
Retained earnings 9,657 - 9,657
Revaluation reserves 3,461 (26) 3,436
Remeasurement of defined benefit plans (1,850) - (1,850)
Other reserves 149 - 149
Shareholders’ equity 19,225 (26) 19,200
1 As reported in Aegon’s Annual Report on Form 20-F dated March 21, 2019.
2.3 Other
Taxes
Taxes on income for the six-month period ended June 30, 2019, are calculated using the tax rate that is estimated to be applicable to total annual
earnings.
Judgments and critical accounting estimates
Preparing the condensed consolidated interim financial statements requires management to make judgments, estimates and assumptions, including the
likelihood, timing or amount of future transactions or events, that affect the application of accounting policies and the reported amounts of assets and
liabilities, income and expense. Actual results may differ from the estimates made.
In preparing the condensed consolidated interim financial statements, significant judgments made by management in applying the Group’s accounting
policies and the key sources of estimating uncertainty were not significantly different than those that were applied to the consolidated financial statements
as at and for the year ended December 31, 2018.
Exchange rates
Assets and liabilities of foreign operations are translated to the presentation currency at the closing rates on the reporting date. Income, expenses and
capital transactions (such as dividends) are translated at average exchange rates or at the prevailing rates on the transaction date, if more appropriate.
The following exchange rates (most important rates) are applied for the condensed consolidated interim financial statements:
Closing exchange rates
USD GBP
June 30, 2019 1 EUR 1.1388 0.8948
December 31, 2018 1 EUR 1.1432 0.8976
Weighted average exchange rates
USD GBP
Six months ended June 30, 2019 1 EUR 1.1299 0.8730
Six months ended June 30, 2018 1 EUR 1.2113 0.8794
Unaudited Page 11
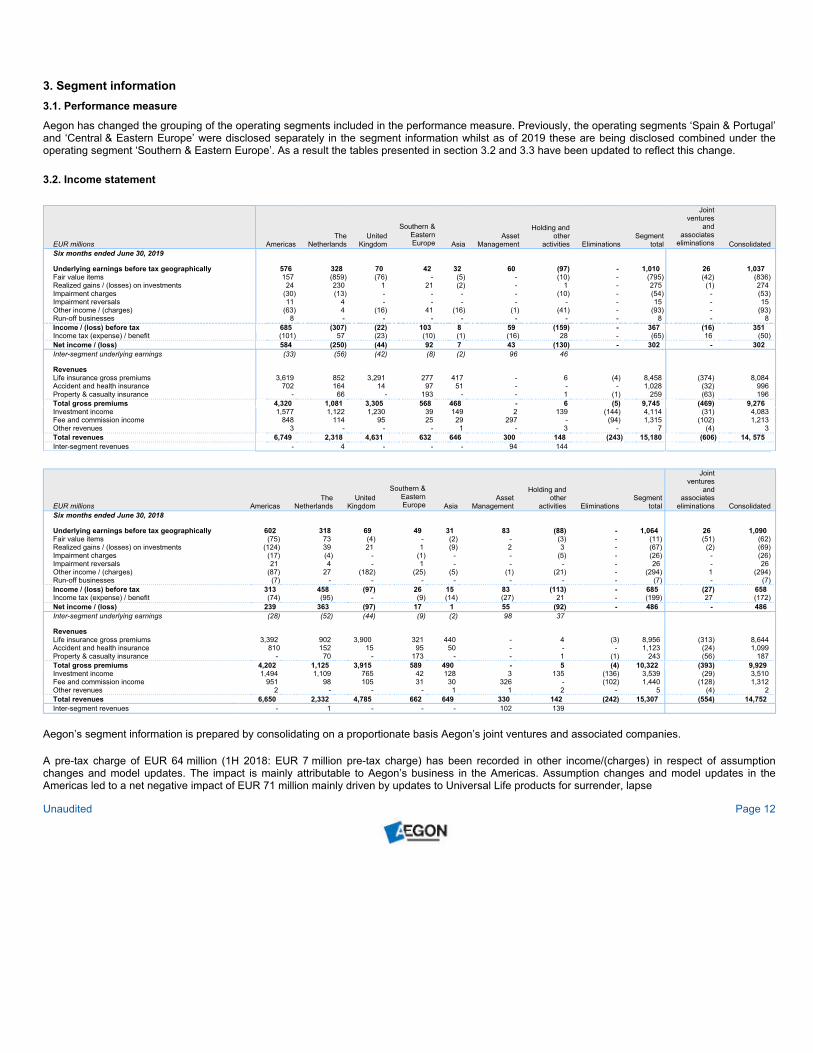
3. Segment information
3.1. Performance measure
Aegon has changed the grouping of the operating segments included in the performance measure. Previously, the operating segments ‘Spain & Portugal’
and ‘Central & Eastern Europe’ were disclosed separately in the segment information whilst as of 2019 these are being disclosed combined under the
operating segment ‘Southern & Eastern Europe’. As a result the tables presented in section 3.2 and 3.3 have been updated to reflect this change.
3.2. Income statement
EUR millions Americas
The
Netherlands
United
Kingdom
Southern &
Eastern
Europe Asia
Asset
Management
Holding and
other
activities Eliminations
Segment
total
Joint
ventures
and
associates
eliminations Consolidated
Six months ended June 30, 2019
Underlying earnings before tax geographically 576 328 70 42 32 60 (97) - 1,010 26 1,037
Fair value items 157 (859) (76) - (5) - (10) - (795) (42) (836)
Realized gains / (losses) on investments 24 230 1 21 (2) - 1 - 275 (1) 274
Impairment charges (30) (13) - - - - (10) - (54) - (53)
Impairment reversals 11 4 - - - - - - 15 - 15
Other income / (charges) (63) 4 (16) 41 (16) (1) (41) - (93) - (93)
Run-off businesses 8 - - - - - - - 8 - 8
Income / (loss) before tax 685 (307) (22) 103 8 59 (159) - 367 (16) 351
Income tax (expense) / benefit (101) 57 (23) (10) (1) (16) 28 - (65) 16 (50)
Net income / (loss) 584 (250) (44) 92 7 43 (130) - 302 - 302
Inter-segment underlying earnings (33) (56) (42) (8) (2) 96 46
Revenues
Life insurance gross premiums 3,619 852 3,291 277 417 - 6 (4) 8,458 (374) 8,084
Accident and health insurance 702 164 14 97 51 - - - 1,028 (32) 996
Property & casualty insurance - 66 - 193 - - 1 (1) 259 (63) 196
Total gross premiums 4,320 1,081 3,305 568 468 - 6 (5) 9,745 (469) 9,276
Investment income 1,577 1,122 1,230 39 149 2 139 (144) 4,114 (31) 4,083
Fee and commission income 848 114 95 25 29 297 - (94) 1,315 (102) 1,213
Other revenues 3 - - - 1 - 3 - 7 (4) 3
Total revenues 6,749 2,318 4,631 632 646 300 148 (243) 15,180 (606) 14, 575
Inter-segment revenues - 4 - - - 94 144
EUR millions Americas
The
Netherlands
United
Kingdom
Southern &
Eastern
Europe Asia
Asset
Management
Holding and
other
activities Eliminations
Segment
total
Joint
ventures
and
associates
eliminations Consolidated
Six months ended June 30, 2018
Underlying earnings before tax geographically 602 318 69 49 31 83 (88) - 1,064 26 1,090
Fair value items (75) 73 (4) - (2) - (3) - (11) (51) (62)
Realized gains / (losses) on investments (124) 39 21 1 (9) 2 3 - (67) (2) (69)
Impairment charges (17) (4) - (1) - - (5) - (26) - (26)
Impairment reversals 21 4 - 1 - - - - 26 - 26
Other income / (charges) (87) 27 (182) (25) (5) (1) (21) - (294) 1 (294)
Run-off businesses (7) - - - - - - - (7) - (7)
Income / (loss) before tax 313 458 (97) 26 15 83 (113) - 685 (27) 658
Income tax (expense) / benefit (74) (95) - (9) (14) (27) 21 - (199) 27 (172)
Net income / (loss) 239 363 (97) 17 1 55 (92) - 486 - 486
Inter-segment underlying earnings (28) (52) (44) (9) (2) 98 37
Revenues
Life insurance gross premiums 3,392 902 3,900 321 440 - 4 (3) 8,956 (313) 8,644
Accident and health insurance 810 152 15 95 50 - - - 1,123 (24) 1,099
Property & casualty insurance - 70 - 173 - - 1 (1) 243 (56) 187
Total gross premiums 4,202 1,125 3,915 589 490 - 5 (4) 10,322 (393) 9,929
Investment income 1,494 1,109 765 42 128 3 135 (136) 3,539 (29) 3,510
Fee and commission income 951 98 105 31 30 326 - (102) 1,440 (128) 1,312
Other revenues 2 - - - 1 1 2 - 5 (4) 2
Total revenues 6,650 2,332 4,785 662 649 330 142 (242) 15,307 (554) 14,752
Inter-segment revenues - 1 - - - 102 139
Aegon’s segment information is prepared by consolidating on a proportionate basis Aegon’s joint ventures and associated companies.
A pre-tax charge of EUR 64 million (1H 2018: EUR 7 million pre-tax charge) has been recorded in other income/(charges) in respect of assumption
changes and model updates. The impact is mainly attributable to Aegon’s business in the Americas. Assumption changes and model updates in the
Americas led to a net negative impact of EUR 71 million mainly driven by updates to Universal Life products for surrender, lapse
Unaudited Page 12
and mortality to reflect actual experience, partially offset by gains driven by updates to the annuitization of Variable Deferred Annuities Guaranteed
Minimum Income Benefit and to the returns on Equity-Index Universal Life.
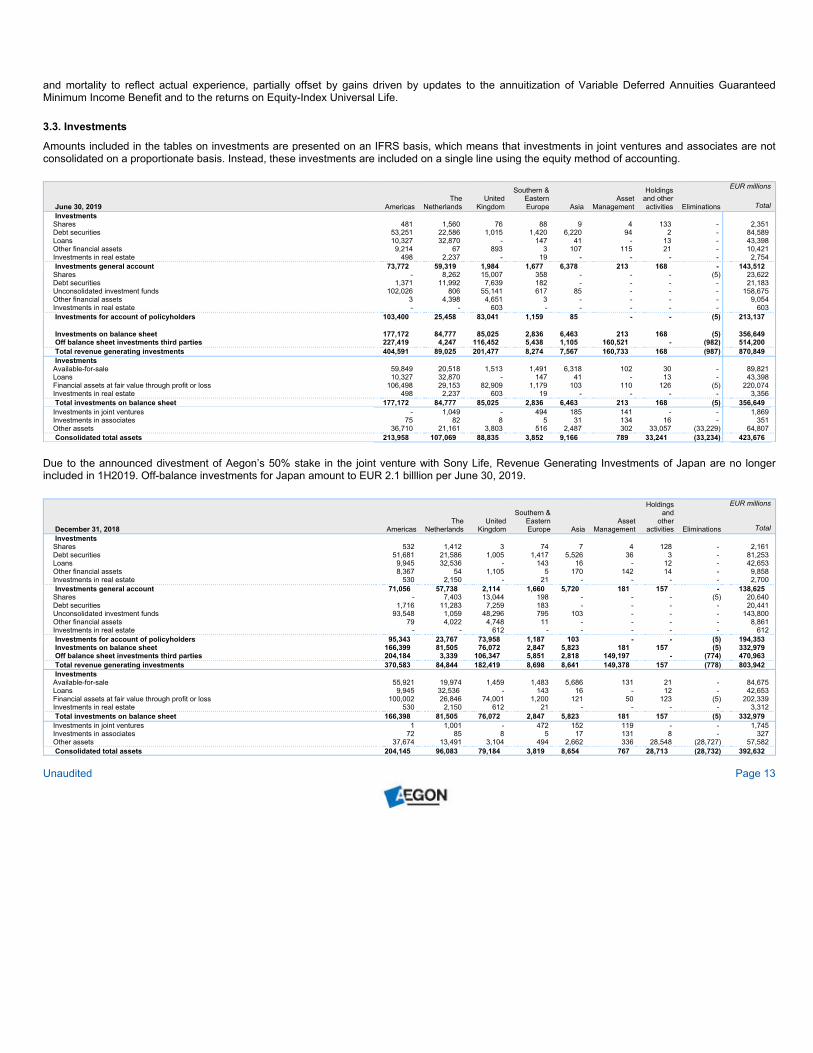
3.3. Investments
Amounts included in the tables on investments are presented on an IFRS basis, which means that investments in joint ventures and associates are not
consolidated on a proportionate basis. Instead, these investments are included on a single line using the equity method of accounting.
June 30, 2019 Americas
The
Netherlands
United
Kingdom
Southern &
Eastern
Europe Asia
Asset
Management
Holdings
and other
activities Eliminations
EUR millions
Total
Investments
Shares 481 1,560 76 88 9 4 133 - 2,351
Debt securities 53,251 22,586 1,015 1,420 6,220 94 2 - 84,589
Loans 10,327 32,870 - 147 41 - 13 - 43,398
Other financial assets 9,214 67 893 3 107 115 21 - 10,421
Investments in real estate 498 2,237 - 19 - - - - 2,754
Investments general account 73,772 59,319 1,984 1,677 6,378 213 168 - 143,512
Shares - 8,262 15,007 358 - - - (5) 23,622
Debt securities 1,371 11,992 7,639 182 - - - - 21,183
Unconsolidated investment funds 102,026 806 55,141 617 85 - - - 158,675
Other financial assets 3 4,398 4,651 3 - - - - 9,054
Investments in real estate - - 603 - - - - - 603
Investments for account of policyholders 103,400 25,458 83,041 1,159 85 - - (5) 213,137
Investments on balance sheet 177,172 84,777 85,025 2,836 6,463 213 168 (5) 356,649
Off balance sheet investments third parties 227,419 4,247 116,452 5,438 1,105 160,521 - (982) 514,200
Total revenue generating investments 404,591 89,025 201,477 8,274 7,567 160,733 168 (987) 870,849
Investments
Available-for-sale 59,849 20,518 1,513 1,491 6,318 102 30 - 89,821
Loans 10,327 32,870 - 147 41 - 13 - 43,398
Financial assets at fair value through profit or loss 106,498 29,153 82,909 1,179 103 110 126 (5) 220,074
Investments in real estate 498 2,237 603 19 - - - - 3,356
Total investments on balance sheet 177,172 84,777 85,025 2,836 6,463 213 168 (5) 356,649
Investments in joint ventures - 1,049 - 494 185 141 - - 1,869
Investments in associates 75 82 8 5 31 134 16 - 351
Other assets 36,710 21,161 3,803 516 2,487 302 33,057 (33,229) 64,807
Consolidated total assets 213,958 107,069 88,835 3,852 9,166 789 33,241 (33,234) 423,676
Due to the announced divestment of Aegon’s 50% stake in the joint venture with Sony Life, Revenue Generating Investments of Japan are no longer
included in 1H2019. Off-balance investments for Japan amount to EUR 2.1 billlion per June 30, 2019.
December 31, 2018 Americas
The
Netherlands
United
Kingdom
Southern &
Eastern
Europe Asia
Asset
Management
Holdings
and
other
activities Eliminations
EUR millions
Total
Investments
Shares 532 1,412 3 74 7 4 128 - 2,161
Debt securities 51,681 21,586 1,005 1,417 5,526 36 3 - 81,253
Loans 9,945 32,536 - 143 16 - 12 - 42,653
Other financial assets 8,367 54 1,105 5 170 142 14 - 9,858
Investments in real estate 530 2,150 - 21 - - - - 2,700
Investments general account 71,056 57,738 2,114 1,660 5,720 181 157 - 138,625
Shares - 7,403 13,044 198 - - - (5) 20,640
Debt securities 1,716 11,283 7,259 183 - - - - 20,441
Unconsolidated investment funds 93,548 1,059 48,296 795 103 - - - 143,800
Other financial assets 79 4,022 4,748 11 - - - - 8,861
Investments in real estate - - 612 - - - - - 612
Investments for account of policyholders 95,343 23,767 73,958 1,187 103 - - (5) 194,353
Investments on balance sheet 166,399 81,505 76,072 2,847 5,823 181 157 (5) 332,979
Off balance sheet investments third parties 204,184 3,339 106,347 5,851 2,818 149,197 - (774) 470,963
Total revenue generating investments 370,583 84,844 182,419 8,698 8,641 149,378 157 (778) 803,942
Investments
Available-for-sale 55,921 19,974 1,459 1,483 5,686 131 21 - 84,675
Loans 9,945 32,536 - 143 16 - 12 - 42,653
Financial assets at fair value through profit or loss 100,002 26,846 74,001 1,200 121 50 123 (5) 202,339
Investments in real estate 530 2,150 612 21 - - - - 3,312
Total investments on balance sheet 166,398 81,505 76,072 2,847 5,823 181 157 (5) 332,979
Investments in joint ventures 1 1,001 - 472 152 119 - - 1,745
Investments in associates 72 85 8 5 17 131 8 - 327
Other assets 37,674 13,491 3,104 494 2,662 336 28,548 (28,727) 57,582
Consolidated total assets 204,145 96,083 79,184 3,819 8,654 767 28,713 (28,732) 392,632
Unaudited Page 13
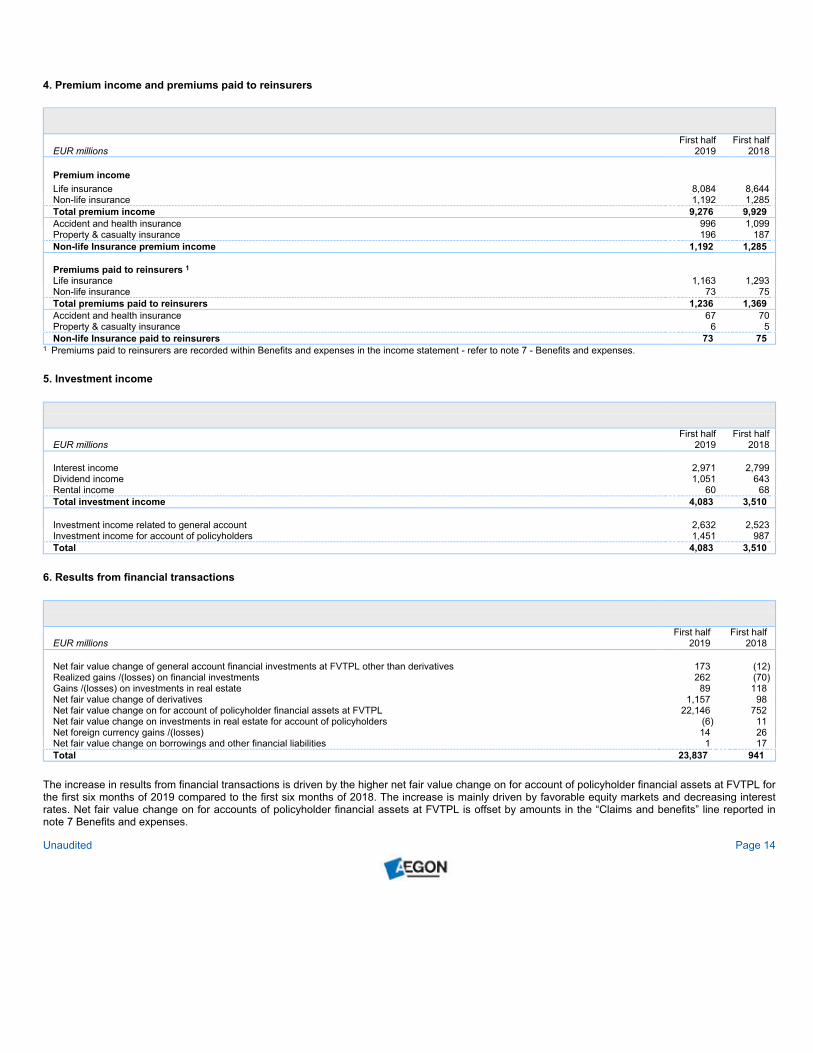
4. Premium income and premiums paid to reinsurers
EUR millions
First half
2019
First half
2018
Premium income
Life insurance 8,084 8,644
Non-life insurance 1,192 1,285
Total premium income 9,276 9,929
Accident and health insurance 996 1,099
Property & casualty insurance 196 187
Non-life Insurance premium income 1,192 1,285
Premiums paid to reinsurers 1
Life insurance 1,163 1,293
Non-life insurance 73 75
Total premiums paid to reinsurers 1,236 1,369
Accident and health insurance 67 70
Property & casualty insurance 6 5
Non-life Insurance paid to reinsurers 73 75
1 Premiums paid to reinsurers are recorded within Benefits and expenses in the income statement - refer to note 7 - Benefits and expenses.
5. Investment income
EUR millions
First half
2019
First half
2018
Interest income 2,971 2,799
Dividend income 1,051 643
Rental income 60 68
Total investment income 4,083 3,510
Investment income related to general account 2,632 2,523
Investment income for account of policyholders 1,451 987
Total 4,083 3,510
6. Results from financial transactions
EUR millions
First half
2019
First half
2018
Net fair value change of general account financial investments at FVTPL other than derivatives 173 (12)
Realized gains /(losses) on financial investments 262 (70)
Gains /(losses) on investments in real estate 89 118
Net fair value change of derivatives 1,157 98
Net fair value change on for account of policyholder financial assets at FVTPL 22,146 752
Net fair value change on investments in real estate for account of policyholders (6) 11
Net foreign currency gains /(losses) 14 26
Net fair value change on borrowings and other financial liabilities 1 17
Total 23,837 941
The increase in results from financial transactions is driven by the higher net fair value change on for account of policyholder financial assets at FVTPL for
the first six months of 2019 compared to the first six months of 2018. The increase is mainly driven by favorable equity markets and decreasing interest
rates. Net fair value change on for accounts of policyholder financial assets at FVTPL is offset by amounts in the “Claims and benefits” line reported in
note 7 Benefits and expenses.
Unaudited Page 14
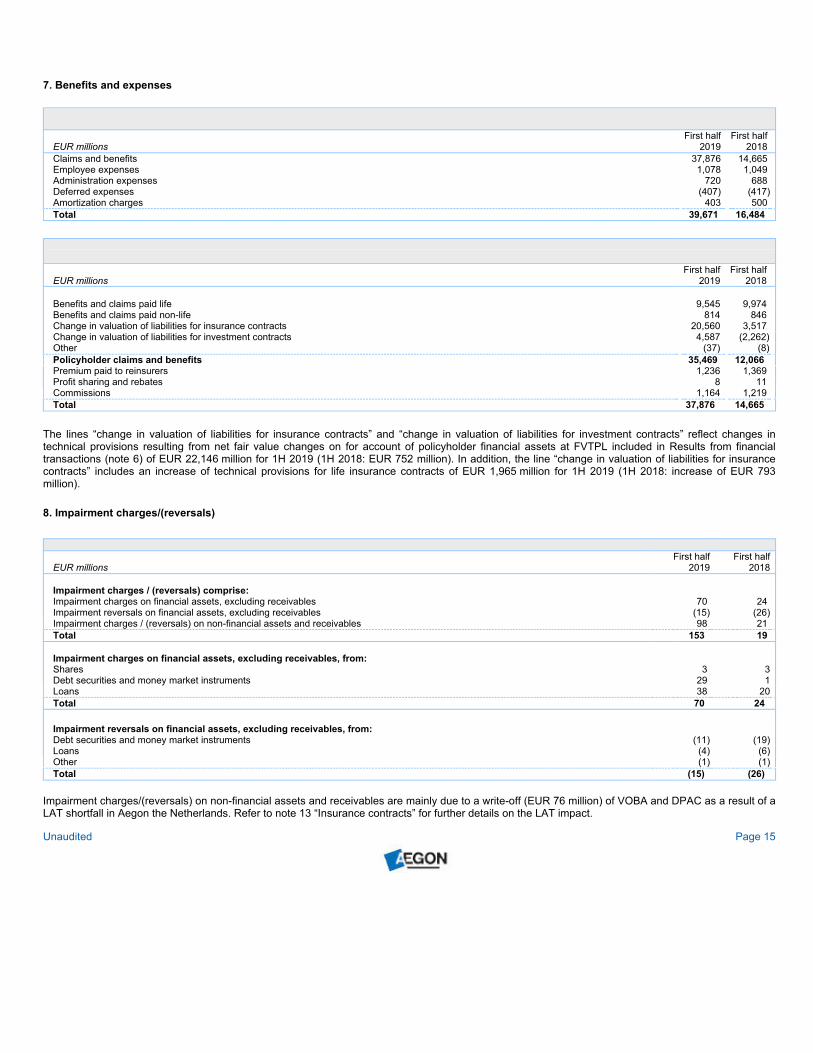
7. Benefits and expenses
EUR millions
First half
2019
First half
2018
Claims and benefits 37,876 14,665
Employee expenses 1,078 1,049
Administration expenses 720 688
Deferred expenses (407) (417)
Amortization charges 403 500
Total 39,671 16,484
EUR millions
First half
2019
First half
2018
Benefits and claims paid life 9,545 9,974
Benefits and claims paid non-life 814 846
Change in valuation of liabilities for insurance contracts 20,560 3,517
Change in valuation of liabilities for investment contracts 4,587 (2,262)
Other (37) (8)
Policyholder claims and benefits 35,469 12,066
Premium paid to reinsurers 1,236 1,369
Profit sharing and rebates 8 11
Commissions 1,164 1,219
Total 37,876 14,665
The lines “change in valuation of liabilities for insurance contracts” and “change in valuation of liabilities for investment contracts” reflect changes in
technical provisions resulting from net fair value changes on for account of policyholder financial assets at FVTPL included in Results from financial
transactions (note 6) of EUR 22,146 million for 1H 2019 (1H 2018: EUR 752 million). In addition, the line “change in valuation of liabilities for insurance
contracts” includes an increase of technical provisions for life insurance contracts of EUR 1,965 million for 1H 2019 (1H 2018: increase of EUR 793
million).
8. Impairment charges/(reversals)
EUR millions
First half
2019
First half
2018
Impairment charges / (reversals) comprise:
Impairment charges on financial assets, excluding receivables 70 24
Impairment reversals on financial assets, excluding receivables (15) (26)
Impairment charges / (reversals) on non-financial assets and receivables 98 21
Total 153 19
Impairment charges on financial assets, excluding receivables, from:
Shares 3 3
Debt securities and money market instruments 29 1
Loans 38 20
Total 70 24
Impairment reversals on financial assets, excluding receivables, from:
Debt securities and money market instruments (11) (19)
Loans (4) (6)
Other (1) (1)
Total (15) (26)
Impairment charges/(reversals) on non-financial assets and receivables are mainly due to a write-off (EUR 76 million) of VOBA and DPAC as a result of a
LAT shortfall in Aegon the Netherlands. Refer to note 13 “Insurance contracts” for further details on the LAT impact.
Unaudited Page 15
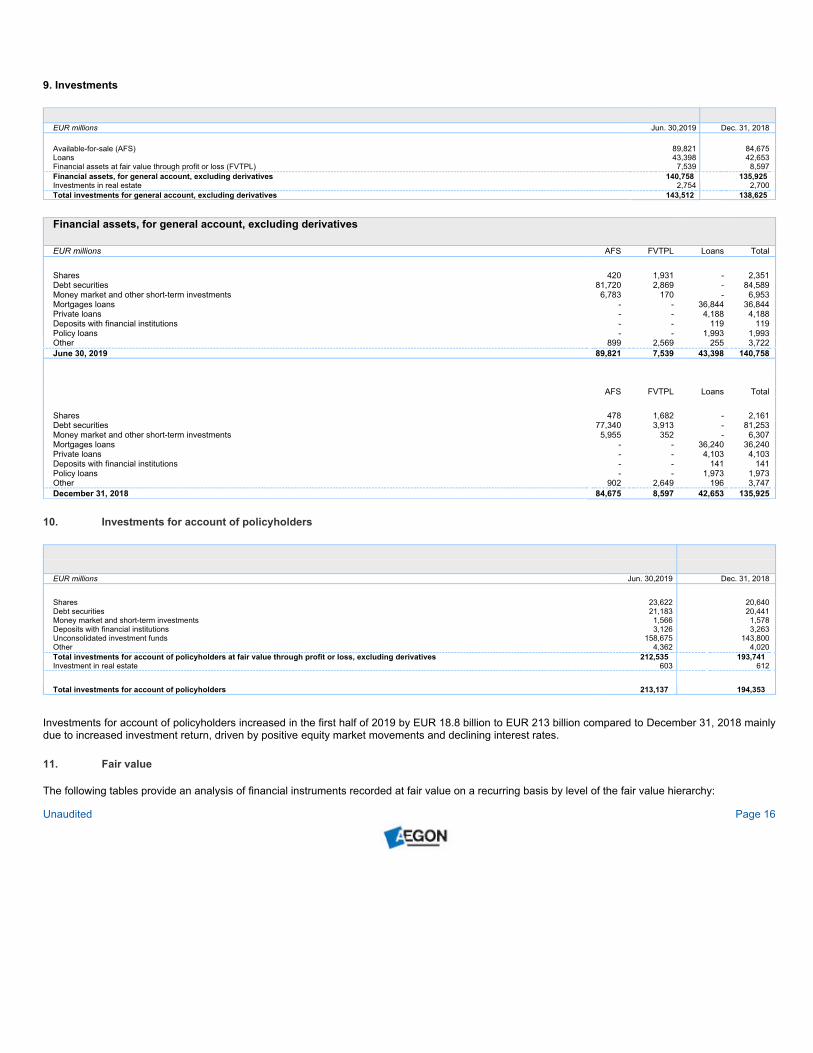
9. Investments
EUR millions Jun. 30,2019 Dec. 31, 2018
Available-for-sale (AFS) 89,821 84,675
Loans 43,398 42,653
Financial assets at fair value through profit or loss (FVTPL) 7,539 8,597
Financial assets, for general account, excluding derivatives 140,758 135,925
Investments in real estate 2,754 2,700
Total investments for general account, excluding derivatives 143,512 138,625
Financial assets, for general account, excluding derivatives
EUR millions AFS FVTPL Loans Total
Shares 420 1,931 - 2,351
Debt securities 81,720 2,869 - 84,589
Money market and other short-term investments 6,783 170 - 6,953
Mortgages loans - - 36,844 36,844
Private loans - - 4,188 4,188
Deposits with financial institutions - - 119 119
Policy loans - - 1,993 1,993
Other 899 2,569 255 3,722
June 30, 2019 89,821 7,539 43,398 140,758
AFS FVTPL Loans Total
Shares 478 1,682 - 2,161
Debt securities 77,340 3,913 - 81,253
Money market and other short-term investments 5,955 352 - 6,307
Mortgages loans - - 36,240 36,240
Private loans - - 4,103 4,103
Deposits with financial institutions - - 141 141
Policy loans - - 1,973 1,973
Other 902 2,649 196 3,747
December 31, 2018 84,675 8,597 42,653 135,925
10. Investments for account of policyholders
EUR millions Jun. 30,2019 Dec. 31, 2018
Shares 23,622 20,640
Debt securities 21,183 20,441
Money market and short-term investments 1,566 1,578
Deposits with financial institutions 3,126 3,263
Unconsolidated investment funds 158,675 143,800
Other 4,362 4,020
Total investments for account of policyholders at fair value through profit or loss, excluding derivatives 212,535 193,741
Investment in real estate 603 612
Total investments for account of policyholders 213,137 194,353
Investments for account of policyholders increased in the first half of 2019 by EUR 18.8 billion to EUR 213 billion compared to December 31, 2018 mainly
due to increased investment return, driven by positive equity market movements and declining interest rates.
11. Fair value
The following tables provide an analysis of financial instruments recorded at fair value on a recurring basis by level of the fair value hierarchy:
Unaudited Page 16
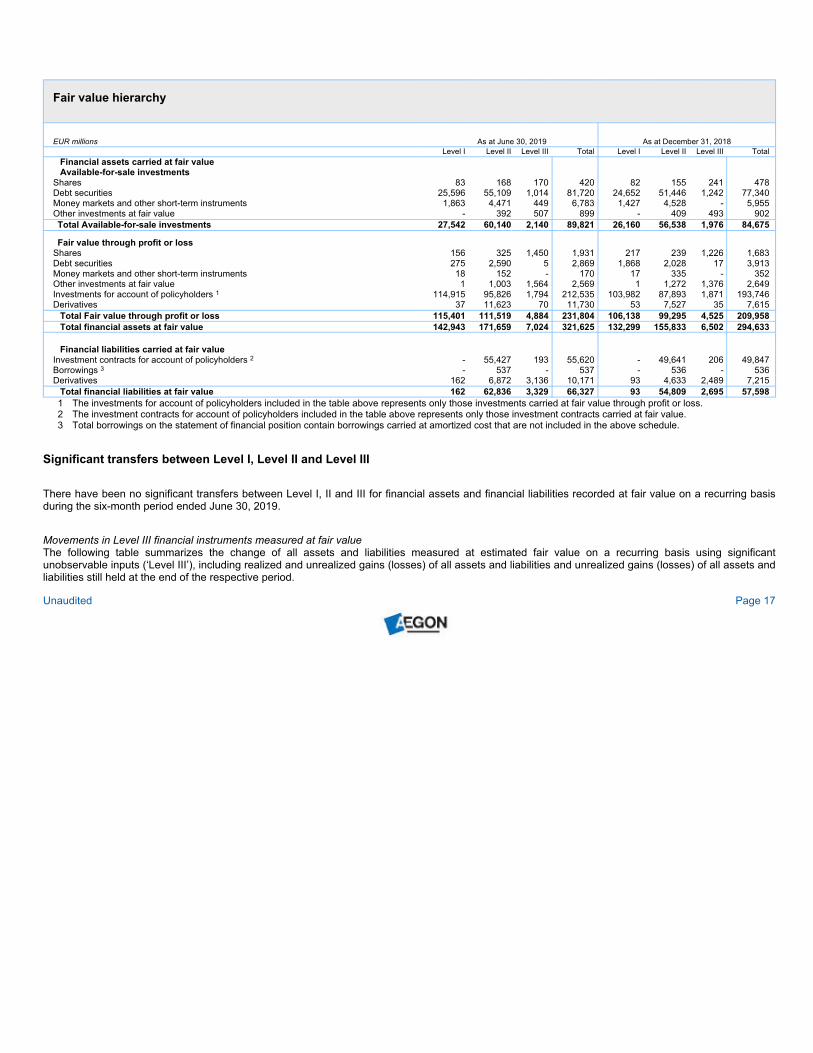
Fair value hierarchy
EUR millions As at June 30, 2019 As at December 31, 2018
Level I Level II Level III Total Level I Level II Level III Total
Financial assets carried at fair value
Available-for-sale investments
Shares 83 168 170 420 82 155 241 478
Debt securities 25,596 55,109 1,014 81,720 24,652 51,446 1,242 77,340
Money markets and other short-term instruments 1,863 4,471 449 6,783 1,427 4,528 - 5,955
Other investments at fair value - 392 507 899 - 409 493 902
Total Available-for-sale investments 27,542 60,140 2,140 89,821 26,160 56,538 1,976 84,675
Fair value through profit or loss
Shares 156 325 1,450 1,931 217 239 1,226 1,683
Debt securities 275 2,590 5 2,869 1,868 2,028 17 3,913
Money markets and other short-term instruments 18 152 - 170 17 335 - 352
Other investments at fair value 1 1,003 1,564 2,569 1 1,272 1,376 2,649
Investments for account of policyholders 1 114,915 95,826 1,794 212,535 103,982 87,893 1,871 193,746
Derivatives 37 11,623 70 11,730 53 7,527 35 7,615
Total Fair value through profit or loss 115,401 111,519 4,884 231,804 106,138 99,295 4,525 209,958
Total financial assets at fair value 142,943 171,659 7,024 321,625 132,299 155,833 6,502 294,633
Financial liabilities carried at fair value
Investment contracts for account of policyholders 2 - 55,427 193 55,620 - 49,641 206 49,847
Borrowings 3 - 537 - 537 - 536 - 536
Derivatives 162 6,872 3,136 10,171 93 4,633 2,489 7,215
Total financial liabilities at fair value 162 62,836 3,329 66,327 93 54,809 2,695 57,598
1 The investments for account of policyholders included in the table above represents only those investments carried at fair value through profit or loss.
2 The investment contracts for account of policyholders included in the table above represents only those investment contracts carried at fair value.
3 Total borrowings on the statement of financial position contain borrowings carried at amortized cost that are not included in the above schedule.
Significant transfers between Level I, Level II and Level III
There have been no significant transfers between Level I, II and III for financial assets and financial liabilities recorded at fair value on a recurring basis
during the six-month period ended June 30, 2019.
Movements in Level III financial instruments measured at fair value
The following table summarizes the change of all assets and liabilities measured at estimated fair value on a recurring basis using significant
unobservable inputs (‘Level III’), including realized and unrealized gains (losses) of all assets and liabilities and unrealized gains (losses) of all assets and
liabilities still held at the end of the respective period.
Unaudited Page 17
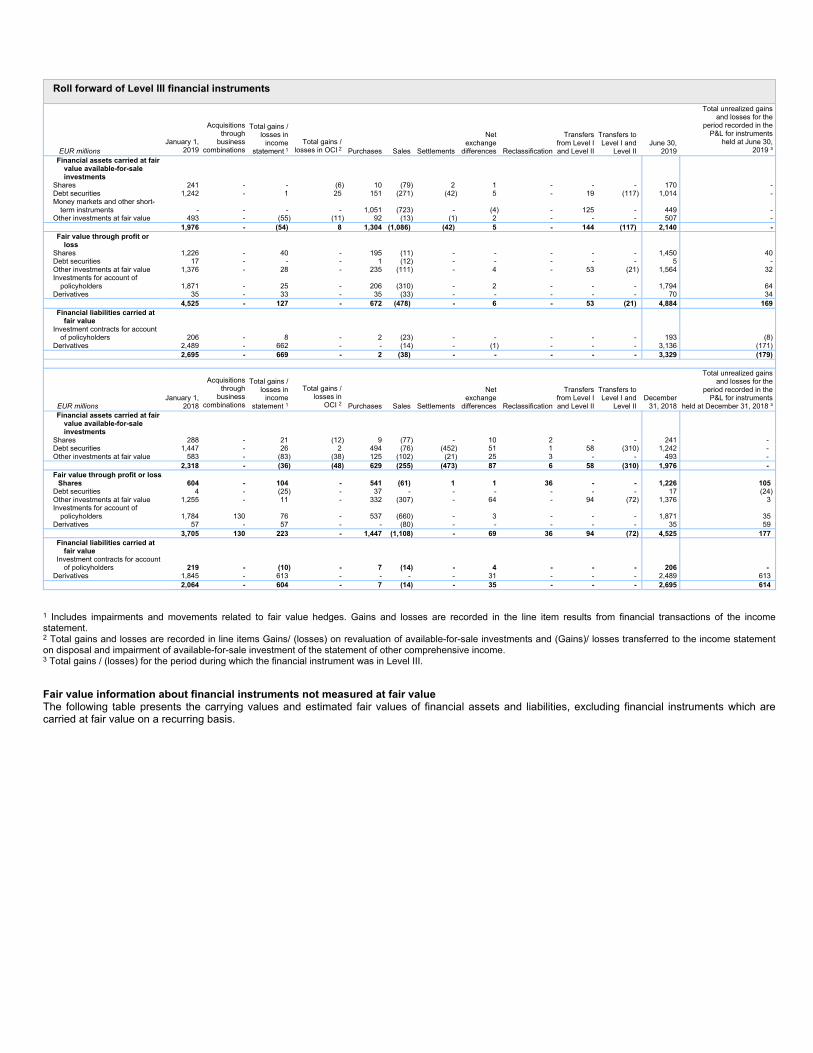
Roll forward of Level III financial instruments
EUR millions
January 1,
2019
Acquisitions
through
business
combinations
Total gains /
losses in
income
statement 1
Total gains /
losses in OCI 2 Purchases Sales Settlements
Net
exchange
differences Reclassification
Transfers
from Level I
and Level II
Transfers to
Level I and
Level II
June 30,
2019
Total unrealized gains
and losses for the
period recorded in the
P&L for instruments
held at June 30,
2019 ³
Financial assets carried at fair
value available-for-sale
investments
Shares 241 - - (6) 10 (79) 2 1 - - - 170 -
Debt securities 1,242 - 1 25 151 (271) (42) 5 - 19 (117) 1,014 -
Money markets and other short-
term instruments - - - - 1,051 (723) - (4) - 125 - 449 -
Other investments at fair value 493 - (55) (11) 92 (13) (1) 2 - - - 507 -
1,976 - (54) 8 1,304 (1,086) (42) 5 - 144 (117) 2,140 -
Fair value through profit or
loss
Shares 1,226 - 40 - 195 (11) - - - - - 1,450 40
Debt securities 17 - - - 1 (12) - - - - - 5 -
Other investments at fair value 1,376 - 28 - 235 (111) - 4 - 53 (21) 1,564 32
Investments for account of
policyholders 1,871 - 25 - 206 (310) - 2 - - - 1,794 64
Derivatives 35 - 33 - 35 (33) - - - - - 70 34
4,525 - 127 - 672 (478) - 6 - 53 (21) 4,884 169
Financial liabilities carried at
fair value
Investment contracts for account
of policyholders 206 - 8 - 2 (23) - - - - - 193 (8)
Derivatives 2,489 - 662 - - (14) - (1) - - - 3,136 (171)
2,695 - 669 - 2 (38) - - - - - 3,329 (179)
EUR millions
January 1,
2018
Acquisitions
through
business
combinations
Total gains /
losses in
income
statement 1
Total gains /
losses in
OCI 2 Purchases Sales Settlements
Net
exchange
differences Reclassification
Transfers
from Level I
and Level II
Transfers to
Level I and
Level II
December
31, 2018
Total unrealized gains
and losses for the
period recorded in the
P&L for instruments
held at December 31, 2018 ³
Financial assets carried at fair
value available-for-sale
investments
Shares 288 - 21 (12) 9 (77) - 10 2 - - 241 -
Debt securities 1,447 - 26 2 494 (76) (452) 51 1 58 (310) 1,242 -
Other investments at fair value 583 - (83) (38) 125 (102) (21) 25 3 - - 493 -
2,318 - (36) (48) 629 (255) (473) 87 6 58 (310) 1,976 -
Fair value through profit or loss
Shares 604 - 104 - 541 (61) 1 1 36 - - 1,226 105
Debt securities 4 - (25) - 37 - - - - - - 17 (24)
Other investments at fair value 1,255 - 11 - 332 (307) - 64 - 94 (72) 1,376 3
Investments for account of
policyholders 1,784 130 76 - 537 (660) - 3 - - - 1,871 35
Derivatives 57 - 57 - - (80) - - - - - 35 59
3,705 130 223 - 1,447 (1,108) - 69 36 94 (72) 4,525 177
Financial liabilities carried at
fair value
Investment contracts for account
of policyholders 219 - (10) - 7 (14) - 4 - - - 206 -
Derivatives 1,845 - 613 - - - - 31 - - - 2,489 613
2,064 - 604 - 7 (14) - 35 - - - 2,695 614
1 Includes impairments and movements related to fair value hedges. Gains and losses are recorded in the line item results from financial transactions of the income
statement.
2 Total gains and losses are recorded in line items Gains/ (losses) on revaluation of available-for-sale investments and (Gains)/ losses transferred to the income statement
on disposal and impairment of available-for-sale investment of the statement of other comprehensive income.
3 Total gains / (losses) for the period during which the financial instrument was in Level III.
Fair value information about financial instruments not measured at fair value
The following table presents the carrying values and estimated fair values of financial assets and liabilities, excluding financial instruments which are
carried at fair value on a recurring basis.
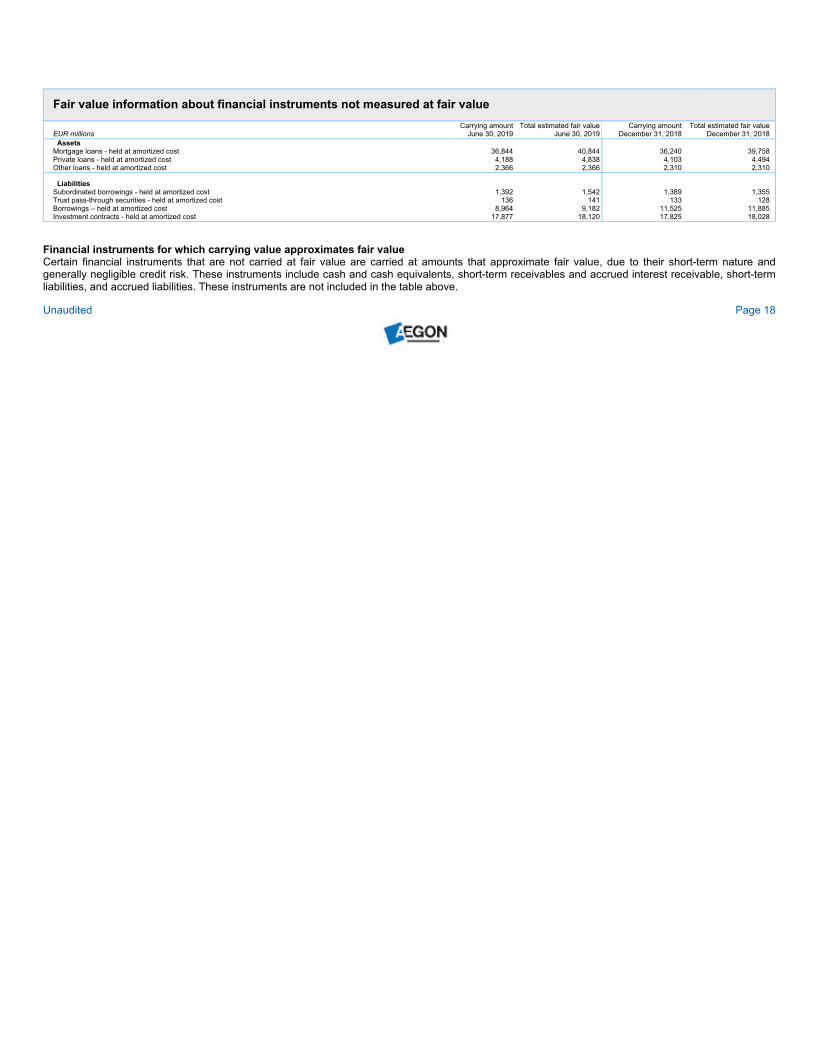
Fair value information about financial instruments not measured at fair value
EUR millions
Carrying amount
June 30, 2019
Total estimated fair value
June 30, 2019
Carrying amount
December 31, 2018
Total estimated fair value
December 31, 2018
Assets
Mortgage loans - held at amortized cost 36,844 40,844 36,240 39,758
Private loans - held at amortized cost 4,188 4,838 4,103 4,494
Other loans - held at amortized cost 2,366 2,366 2,310 2,310
Liabilities
Subordinated borrowings - held at amortized cost 1,392 1,542 1,389 1,355
Trust pass-through securities - held at amortized cost 136 141 133 128
Borrowings – held at amortized cost 8,964 9,182 11,525 11,885
Investment contracts - held at amortized cost 17,877 18,120 17,825 18,028
Financial instruments for which carrying value approximates fair value
Certain financial instruments that are not carried at fair value are carried at amounts that approximate fair value, due to their short-term nature and
generally negligible credit risk. These instruments include cash and cash equivalents, short-term receivables and accrued interest receivable, short-term
liabilities, and accrued liabilities. These instruments are not included in the table above.
Unaudited Page 18
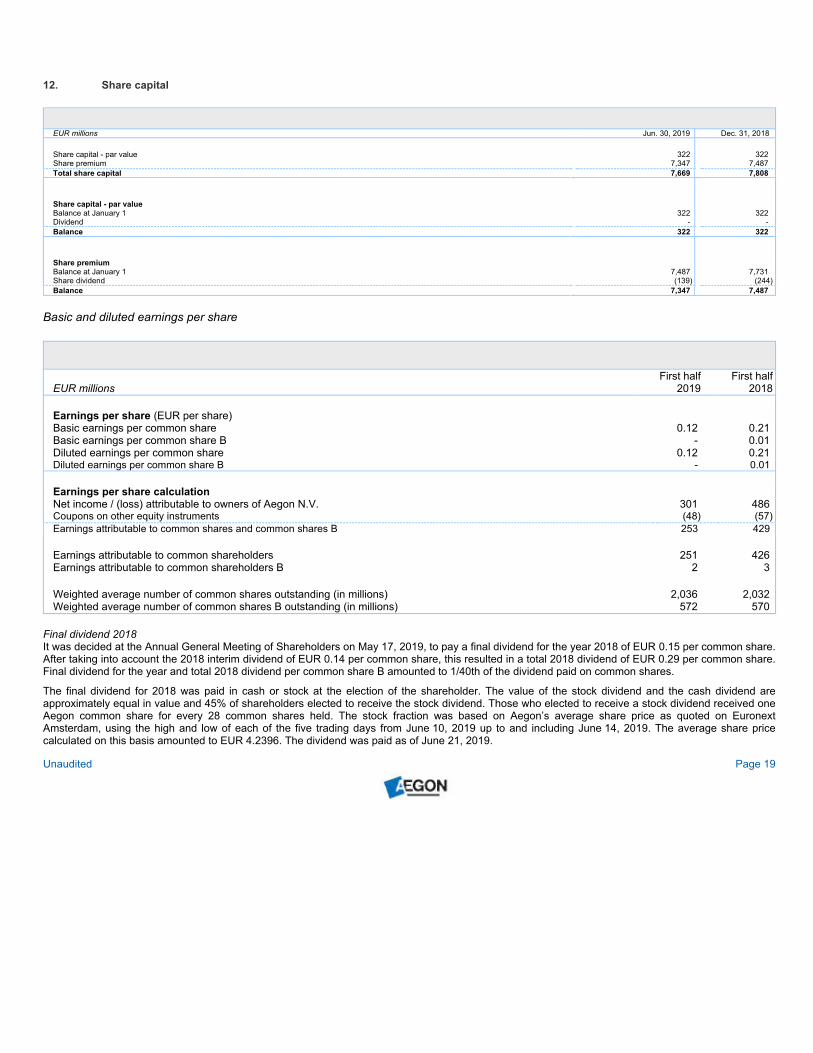
12. Share capital
EUR millions Jun. 30, 2019 Dec. 31, 2018
Share capital - par value 322 322
Share premium 7,347 7,487
Total share capital 7,669 7,808
Share capital - par value
Balance at January 1 322 322
Dividend - -
Balance 322 322
Share premium
Balance at January 1 7,487 7,731
Share dividend (139) (244)
Balance 7,347 7,487
Basic and diluted earnings per share
EUR millions
First half
2019
First half
2018
Earnings per share (EUR per share)
Basic earnings per common share 0.12 0.21
Basic earnings per common share B - 0.01
Diluted earnings per common share 0.12 0.21
Diluted earnings per common share B - 0.01
Earnings per share calculation
Net income / (loss) attributable to owners of Aegon N.V. 301 486
Coupons on other equity instruments (48) (57)
Earnings attributable to common shares and common shares B 253 429
Earnings attributable to common shareholders 251 426
Earnings attributable to common shareholders B 2 3
Weighted average number of common shares outstanding (in millions) 2,036 2,032
Weighted average number of common shares B outstanding (in millions) 572 570
Final dividend 2018
It was decided at the Annual General Meeting of Shareholders on May 17, 2019, to pay a final dividend for the year 2018 of EUR 0.15 per common share.
After taking into account the 2018 interim dividend of EUR 0.14 per common share, this resulted in a total 2018 dividend of EUR 0.29 per common share.
Final dividend for the year and total 2018 dividend per common share B amounted to 1/40th of the dividend paid on common shares.
The final dividend for 2018 was paid in cash or stock at the election of the shareholder. The value of the stock dividend and the cash dividend are
approximately equal in value and 45% of shareholders elected to receive the stock dividend. Those who elected to receive a stock dividend received one
Aegon common share for every 28 common shares held. The stock fraction was based on Aegon’s average share price as quoted on Euronext
Amsterdam, using the high and low of each of the five trading days from June 10, 2019 up to and including June 14, 2019. The average share price
calculated on this basis amounted to EUR 4.2396. The dividend was paid as of June 21, 2019.
Unaudited Page 19
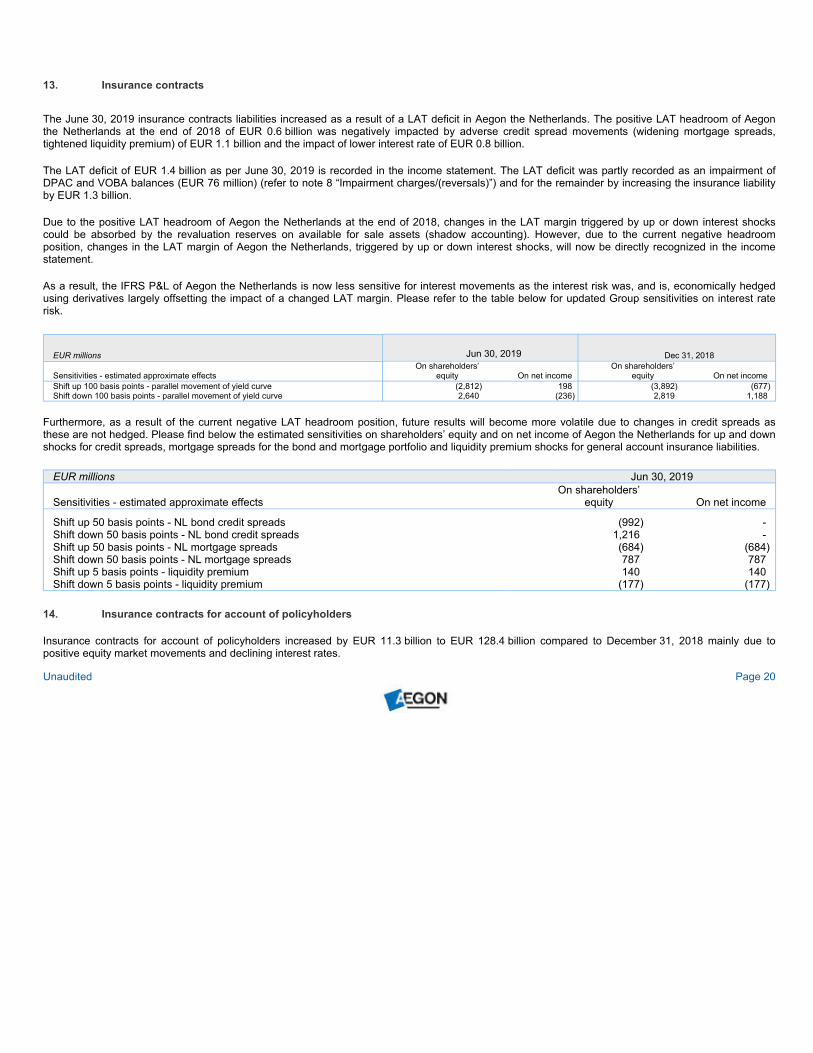
13. Insurance contracts
The June 30, 2019 insurance contracts liabilities increased as a result of a LAT deficit in Aegon the Netherlands. The positive LAT headroom of Aegon
the Netherlands at the end of 2018 of EUR 0.6 billion was negatively impacted by adverse credit spread movements (widening mortgage spreads,
tightened liquidity premium) of EUR 1.1 billion and the impact of lower interest rate of EUR 0.8 billion.
The LAT deficit of EUR 1.4 billion as per June 30, 2019 is recorded in the income statement. The LAT deficit was partly recorded as an impairment of
DPAC and VOBA balances (EUR 76 million) (refer to note 8 “Impairment charges/(reversals)”) and for the remainder by increasing the insurance liability
by EUR 1.3 billion.
Due to the positive LAT headroom of Aegon the Netherlands at the end of 2018, changes in the LAT margin triggered by up or down interest shocks
could be absorbed by the revaluation reserves on available for sale assets (shadow accounting). However, due to the current negative headroom
position, changes in the LAT margin of Aegon the Netherlands, triggered by up or down interest shocks, will now be directly recognized in the income
statement.
As a result, the IFRS P&L of Aegon the Netherlands is now less sensitive for interest movements as the interest risk was, and is, economically hedged
using derivatives largely offsetting the impact of a changed LAT margin. Please refer to the table below for updated Group sensitivities on interest rate
risk.
EUR millions Jun 30, 2019 Dec 31, 2018
Sensitivities - estimated approximate effects
On shareholders’
equity On net income
On shareholders’
equity On net income
Shift up 100 basis points - parallel movement of yield curve (2,812) 198 (3,892) (677)
Shift down 100 basis points - parallel movement of yield curve 2,640 (236) 2,819 1,188
Furthermore, as a result of the current negative LAT headroom position, future results will become more volatile due to changes in credit spreads as
these are not hedged. Please find below the estimated sensitivities on shareholders’ equity and on net income of Aegon the Netherlands for up and down
shocks for credit spreads, mortgage spreads for the bond and mortgage portfolio and liquidity premium shocks for general account insurance liabilities.
EUR millions Jun 30, 2019
Sensitivities - estimated approximate effects
On shareholders’
equity On net income
Shift up 50 basis points - NL bond credit spreads (992) -
Shift down 50 basis points - NL bond credit spreads 1,216 -
Shift up 50 basis points - NL mortgage spreads (684) (684)
Shift down 50 basis points - NL mortgage spreads 787 787
Shift up 5 basis points - liquidity premium 140 140
Shift down 5 basis points - liquidity premium (177) (177)
14. Insurance contracts for account of policyholders
Insurance contracts for account of policyholders increased by EUR 11.3 billion to EUR 128.4 billion compared to December 31, 2018 mainly due to
positive equity market movements and declining interest rates.
Unaudited Page 20
15. Investment contracts for account of policyholders
Investment contracts for account of policyholders increased by EUR 7.7 billion to EUR 87.8 billion compared to December 31, 2018 mainly due to positive
equity market movements and declining interest rates.
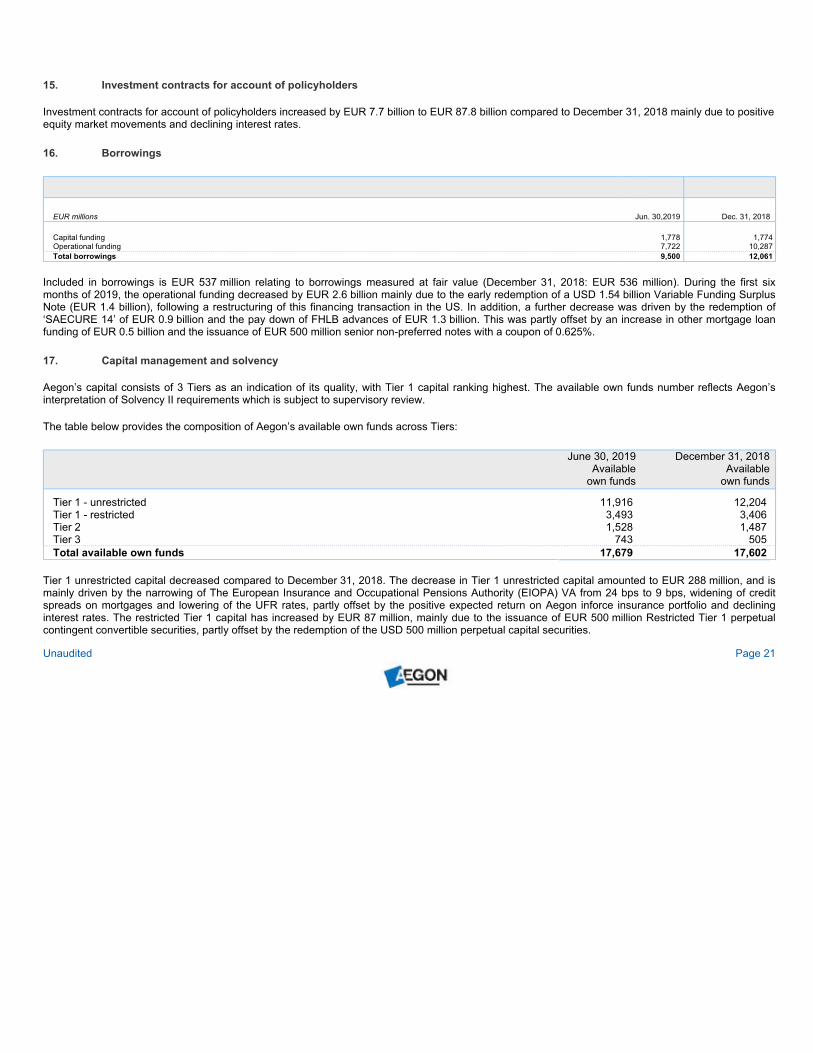
16. Borrowings
EUR millions Jun. 30,2019 Dec. 31, 2018
Capital funding 1,778 1,774
Operational funding 7,722 10,287
Total borrowings 9,500 12,061
Included in borrowings is EUR 537 million relating to borrowings measured at fair value (December 31, 2018: EUR 536 million). During the first six
months of 2019, the operational funding decreased by EUR 2.6 billion mainly due to the early redemption of a USD 1.54 billion Variable Funding Surplus
Note (EUR 1.4 billion), following a restructuring of this financing transaction in the US. In addition, a further decrease was driven by the redemption of
‘SAECURE 14’ of EUR 0.9 billion and the pay down of FHLB advances of EUR 1.3 billion. This was partly offset by an increase in other mortgage loan
funding of EUR 0.5 billion and the issuance of EUR 500 million senior non-preferred notes with a coupon of 0.625%.
17. Capital management and solvency
Aegon’s capital consists of 3 Tiers as an indication of its quality, with Tier 1 capital ranking highest. The available own funds number reflects Aegon’s
interpretation of Solvency II requirements which is subject to supervisory review.
The table below provides the composition of Aegon’s available own funds across Tiers:
June 30, 2019
Available
own funds
December 31, 2018
Available
own funds
Tier 1 - unrestricted 11,916 12,204
Tier 1 - restricted 3,493 3,406
Tier 2 1,528 1,487
Tier 3 743 505
Total available own funds 17,679 17,602
Tier 1 unrestricted capital decreased compared to December 31, 2018. The decrease in Tier 1 unrestricted capital amounted to EUR 288 million, and is
mainly driven by the narrowing of The European Insurance and Occupational Pensions Authority (EIOPA) VA from 24 bps to 9 bps, widening of credit
spreads on mortgages and lowering of the UFR rates, partly offset by the positive expected return on Aegon inforce insurance portfolio and declining
interest rates. The restricted Tier 1 capital has increased by EUR 87 million, mainly due to the issuance of EUR 500 million Restricted Tier 1 perpetual
contingent convertible securities, partly offset by the redemption of the USD 500 million perpetual capital securities.
Unaudited Page 21
Tier 2 capital increased by EUR 41 million as a result of increased market value of Tier 2 instruments.
Tier 3 capital as of June 30, 2019 is comprised of deferred tax assets balances related to Solvency II entities. The increase of EUR 238 million is mainly
driven by Aegon the Netherlands as a result of declined interest rates which increase liabilities, the remaining increase is contributed by Aegon US
non-regulated entities.
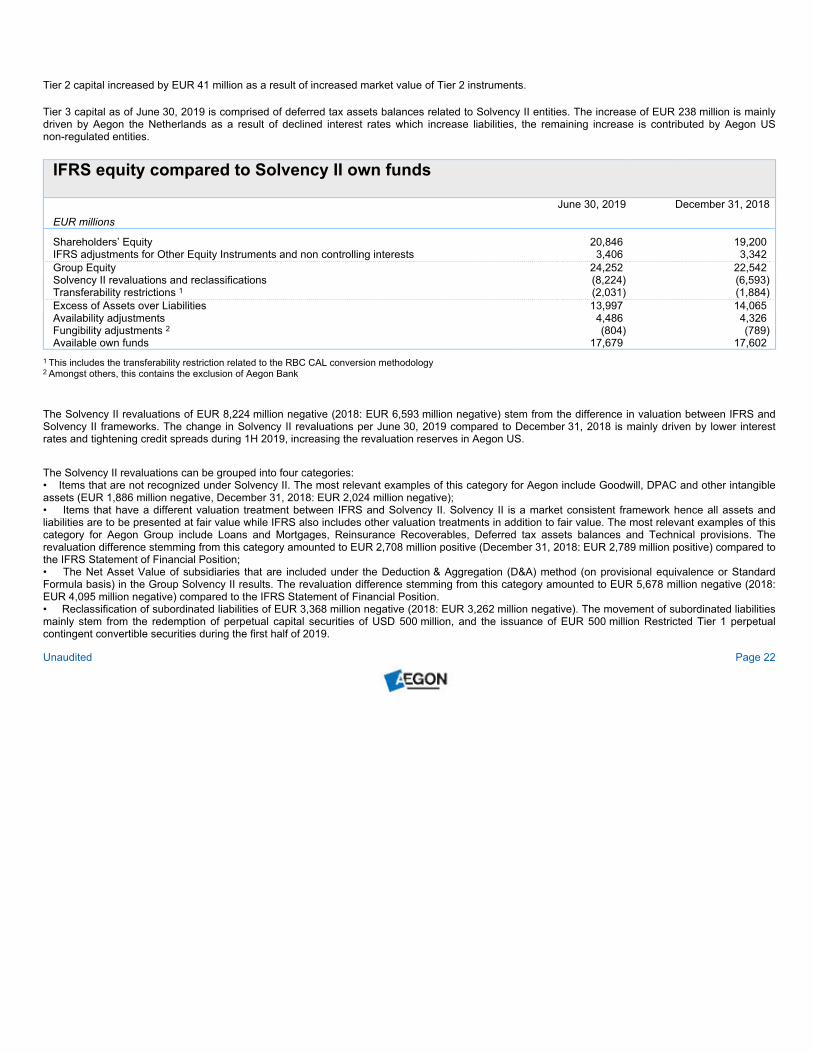
IFRS equity compared to Solvency II own funds
EUR millions
June 30, 2019 December 31, 2018
Shareholders’ Equity 20,846 19,200
IFRS adjustments for Other Equity Instruments and non controlling interests 3,406 3,342
Group Equity 24,252 22,542
Solvency II revaluations and reclassifications (8,224) (6,593)
Transferability restrictions 1 (2,031) (1,884)
Excess of Assets over Liabilities 13,997 14,065
Availability adjustments 4,486 4,326
Fungibility adjustments 2 (804) (789)
Available own funds 17,679 17,602
1 This includes the transferability restriction related to the RBC CAL conversion methodology
2 Amongst others, this contains the exclusion of Aegon Bank
The Solvency II revaluations of EUR 8,224 million negative (2018: EUR 6,593 million negative) stem from the difference in valuation between IFRS and
Solvency II frameworks. The change in Solvency II revaluations per June 30, 2019 compared to December 31, 2018 is mainly driven by lower interest
rates and tightening credit spreads during 1H 2019, increasing the revaluation reserves in Aegon US.
The Solvency II revaluations can be grouped into four categories:
• Items that are not recognized under Solvency II. The most relevant examples of this category for Aegon include Goodwill, DPAC and other intangible
assets (EUR 1,886 million negative, December 31, 2018: EUR 2,024 million negative);
• Items that have a different valuation treatment between IFRS and Solvency II. Solvency II is a market consistent framework hence all assets and
liabilities are to be presented at fair value while IFRS also includes other valuation treatments in addition to fair value. The most relevant examples of this
category for Aegon Group include Loans and Mortgages, Reinsurance Recoverables, Deferred tax assets balances and Technical provisions. The
revaluation difference stemming from this category amounted to EUR 2,708 million positive (December 31, 2018: EUR 2,789 million positive) compared to
the IFRS Statement of Financial Position;
• The Net Asset Value of subsidiaries that are included under the Deduction & Aggregation (D&A) method (on provisional equivalence or Standard
Formula basis) in the Group Solvency II results. The revaluation difference stemming from this category amounted to EUR 5,678 million negative (2018:
EUR 4,095 million negative) compared to the IFRS Statement of Financial Position.
• Reclassification of subordinated liabilities of EUR 3,368 million negative (2018: EUR 3,262 million negative). The movement of subordinated liabilities
mainly stem from the redemption of perpetual capital securities of USD 500 million, and the issuance of EUR 500 million Restricted Tier 1 perpetual
contingent convertible securities during the first half of 2019.
Unaudited Page 22
The increase in availability adjustments compared to December 31, 2018 is mainly driven by the movement of treasury shares, which has decreased by
EUR 191 million due to the final dividend payout over 2018 of stock dividend.
18. Commitments and contingencies
In March 2019, affiliates of Transamerica Corporation entered into a series of agreements with LTCG, an independent third party administrator, to transfer
the administration and claims management of its long term care insurance business line. The transaction enables Transamerica to accelerate the
enhancement of its digital capabilities and the modernization of its long term care insurance platform. Services are expected to commence in the second
half of 2019. LTCG will provide comprehensive third party administration services for Transamerica’s long term care insurance product line including new
business, policyholder service, claims processing and care management. The contract is a multi-year contract and the agreement also contains a
termination clause in which case Transamerica- subject to certain limitations – agrees to compensate LTCG, on a specified schedule, for early
termination.
There have been no other material changes in commitments and contingencies as reported in the 2018 consolidated financial statements.
19. Acquisitions / divestments
Aegon Czech Republic and Slovakia
On January 8, 2019, Aegon completed the sale of its businesses in Czech Republic and Slovakia. The businesses consisted mainly of unit linked life
insurance coverage, term life products and pension reserves. The proceeds of the sale amount to EUR 155 million and the book gain amounts to
approximately EUR 70 million, which were reflected in other income. As a consequence of the transaction, annual income before tax and underlying
earnings before tax have decreased. In 2018, the underlying earnings before tax of the combined operations amounted to EUR 17 million.
Aegon Japan
On May 17, 2019, Aegon announced an agreement to sell its 50% stake in the variable annuity joint ventures in Japan for total cash proceeds of
approximately EUR 130 million (JPY 16 billion). The divestment will not have a material impact on Aegon’s capital position and is expected to lead to an
IFRS gain of approximately EUR 50 million. This divestment has no material impact on underlying earnings before tax going forward. Closing of the
transaction is subject to normal regulatory approvals for transactions of this nature and is expected to be completed by the end of 2019.
20. Post reporting date events
On July 9, 2019, Aegon closed a transaction under the Dutch SAECURE program to sell Class A mortgage backed securities (RMBS). ‘SAECURE 18
NHG’ consists of EUR 512 million of class A notes with an expected weighted average life of 4.8 years and a coupon of 3 month Euribor plus 40bps.
Between July 1, 2019 and August 2, 2019, Aegon has completed the share buyback program to neutralize the dilutive effect of the 2018 final dividend
paid in shares, and repurchased a total of 32,873,805 common shares, at an average price of EUR 4.52 per share.
Unaudited Page 23
ITEM 2: OPERATING AND FINANCIAL REVIEW AND PROSPECTS
2.1 Introduction
Aegon is committed to providing information on key factors that drive its business and affect its financial condition, results and value. Aegon’s disclosure
practices have been developed over many years with due consideration of the needs and requirements of its stakeholders, including regulators, investors
and research analysts.
Aegon has substantive supplemental information in its annual and semi-annual accounts to provide transparency of its financial results. Aegon has
provided insight into its critical accounting policies and the methodologies Aegon applies to manage its risks. For a discussion of critical accounting
policies see “Application of Critical Accounting Policies – IFRS Accounting Policies”. For a discussion of Aegon’s risk management methodologies see
Item 11, “Quantitative and Qualitative Disclosures About Market Risk” as included in the Cross reference table in Aegon’s 2018 Annual Report on Form
20-F filed with the SEC on March 22, 2019.
2.2 Application of Critical Accounting Policies - IFRS Accounting Policies
The Operating and Financial Review and Prospects are based upon Aegon’s consolidated financial statements, which have been prepared in accordance
with IFRS as issued by the International Accounting Standards Board (IFRS).
Application of the accounting policies in the preparation of the financial statements requires management to apply judgment involving assumptions and
estimates concerning future results or other developments, including the likelihood, timing or amount of future transactions or events. There can be no
assurance that actual results will not differ materially from those estimates. Accounting policies that are critical to the financial statement presentation and
that require complex estimates or significant judgment are described in the following sections.
The description of Aegon’s methods of determining fair value and fair value hierarchy is included in Aegon’s 2018 Annual Report on Form 20-F (i.e. note
3 and note 47 of the notes to the consolidated financial statements). For reference purposes, note 11 of the notes to the condensed consolidated interim
financial statements in Item 1 includes a roll-forward of Level III financial instruments for the first half of 2019.
i Valuation of assets and liabilities arising from life insurance contracts
The liability for life insurance contracts with guaranteed or fixed account terms is either based on current assumptions, on the assumptions established at
inception of the contract, reflecting the best estimates at the time increased with a margin for adverse deviation or on the valuation assumptions (historical
cost), without risk margin. All contracts are subject to liability adequacy testing which reflects management’s current estimates of future cash flows
(including investment returns). To the extent that the liability is based on current assumptions, a change in assumptions will have an immediate impact on
the income statement. Also, if a change in assumption results in not passing the liability adequacy test, the entire deficiency is recognized in the income
statement. To the extent that the deficiency relates to unrealized gains and losses on available-for-sale investments, the additional liability is recognized
in the revaluation reserve in shareholder’s equity.
Some insurance contracts without a guaranteed or fixed contractual term contain guaranteed minimum benefits. Depending on the nature of the
guarantee, it may either be bifurcated and presented as a derivative or be reflected in the value of the insurance liability in accordance with local
accounting principles. Given the dynamic and complex nature of these guarantees, stochastic techniques under a variety of market return scenarios are
often used for measurement purposes. Such models require management to make numerous
Unaudited Page 24
estimates based on historical experience and market expectations. Changes in these estimates will immediately affect the income statement.
In addition, certain acquisition costs related to the sale of new policies and the purchase of policies already in force are recorded as DPAC and VOBA
assets respectively, and are amortized to the income statement over time. If the assumptions relating to the future profitability of these policies are not
realized, the amortization of these costs could be accelerated and may require write-offs due to unrecoverability.
ii Actuarial and economic assumptions
The main assumptions used in measuring DPAC, VOBA and the liabilities for life insurance contracts with fixed or guaranteed terms relate to mortality,
morbidity, investment return and future expenses. Depending on local accounting principles, surrender, lapse and utilization rates may be considered.
Mortality tables applied are generally developed based on a blend of company experience and industry wide studies, taking into consideration product
characteristics, own risk selection criteria, target market and distribution method. Mortality experience is monitored through regular studies, the results of
which are fed into the pricing cycle for new products and reflected in the liability calculation when appropriate. For contracts insuring survivorship or
mortality, allowance may be made for further longevity or mortality improvements. Morbidity assumptions are based on own claims severity and frequency
experience, adjusted where appropriate for industry information.
Investment assumptions are prescribed by the local regulator, market observable or based on management’s future expectations. In the latter case, the
anticipated future investment returns are set by management on a countrywide basis, considering available market information and economic indicators.
A significant assumption related to estimated gross profits on variable annuities and variable life insurance products in the United States and some of the
smaller countries, is the annual long-term growth rate of the underlying assets. The reconsideration of this assumption may affect the original DPAC or
VOBA amortization schedule, referred to as DPAC or VOBA unlocking. The difference between the original DPAC or VOBA amortization schedule and
the revised schedule, which is based on actual gross profits and estimates of future gross profits, is recognized in the income statement as an expense or
a benefit in the period of determination.
Assumptions on future expenses are based on the current level of expenses, adjusted for expected expense inflation if appropriate. In Aegon the
Netherlands, the expense basis makes an allowance for planned future cost savings, which are included in the liability adequacy test.
Surrender and lapse rates depend on product features, policy duration and external circumstances such as the interest rate environment and competitor
behavior. For policies with account value guarantees based on equity market movements, a dynamic lapse assumption is utilized to reflect policyholder
behavior based on whether the guarantee is in the money. Own experience, as well as industry published data, are used in establishing assumptions.
Lapse experience is correlated to mortality and morbidity levels, as higher or lower levels of surrenders may indicate future claims will be higher or lower
than anticipated. Such correlations are accounted for in the mortality and morbidity assumptions based on the emerging analysis of experience.
Actuarial assumption and model updates
Assumptions are reviewed periodically, in the second quarter for the US and Asia and in the fourth quarter for Europe, based on historical experience,
observable market data, including market transactions such as acquisitions and reinsurance transactions, anticipated trends and legislative changes.
Similarly, the models and systems used for determining our liabilities are reviewed periodically and, if deemed necessary, updated based on emerging
best practices and available technology.
Unaudited Page 25
During the first half of 2019, Aegon implemented actuarial assumptions and model updates resulting in a pre-tax charge of EUR 64 million (1H 2018: EUR
7 million pre-tax charge). Refer to note 3 Segment Information for further detail.
Sensitivity on variable annuities and variable life insurance products in the United States
A 1% decrease in the expected long-term equity growth rate with regard to Aegon’s variable annuities and variable life insurance products in the United
States would result in a decrease in DPAC and VOBA balances and reserve strengthening of approximately EUR 112 million (December 31, 2018: EUR
148 million). The DPAC and VOBA balances for these products in the United States amounted to EUR 2.7 billion at June 30, 2019 (December 31, 2018:
EUR 2.6 billion).
A relative increase of 10% to the mortality assumption was used, dependent on product and characteristics of the block of business, would reduce net
income by approximately EUR 197 million (December 31, 2018: reduce net income by EUR 207 million). A relative 20% increase in the lapse rate
assumption would increase net income by approximately EUR 119 million (December 31, 2018: EUR 89 million).
Any reasonably possible changes in the other assumptions Aegon uses to determine EGP margins (i.e. maintenance expenses) would reduce net income
by EUR 9 million (December 31, 2018: EUR 9 million).
Sensitivity on long term care products (LTC) in the United States
Sensitivities of significant product liability assumptions on the LTC IFRS after-tax Gross Present Value Reserve (GPV) margin are indicated below. The
GPV is the liability as determined on a best estimate assumption basis. Until an assumption change is of significant amount to breach the current margin
of EUR 35 million (loss recognition block of LTC), there will be no IFRS financial impact (2018: EUR 35 million). The GPV margin is the amount by which
the IFRS reserve exceeds the GPV liability.
A 5% increase in the incidence rates with regard to Aegon’s long term care products would result in a GPV increase of approximately EUR 177 million
(2018: EUR 170 million). A 5% decrease in the incidence rates with regard to Aegon’s long term care products would result in a GPV decrease of
approximately EUR 177 million (2018: EUR 170 million).
Removing the morbidity improvement, which is a component of the incidence assumption, would result in a GPV increase of approximately EUR
531 million (2018: EUR 500 million), of which EUR 443 million (2018: EUR 425 million) relates to the loss recognition block.
Reducing mortality 10% would result in a GPV increase of approximately EUR 89 million (2018: EUR 85 million). Increasing mortality 10% would result in
a GPV decrease of approximately EUR 89 million (2018: EUR 85 million).
Removing future mortality improvement would result in a GPV decrease of approximately EUR 89 million (2018: EUR 85 million).
Unaudited Page 26
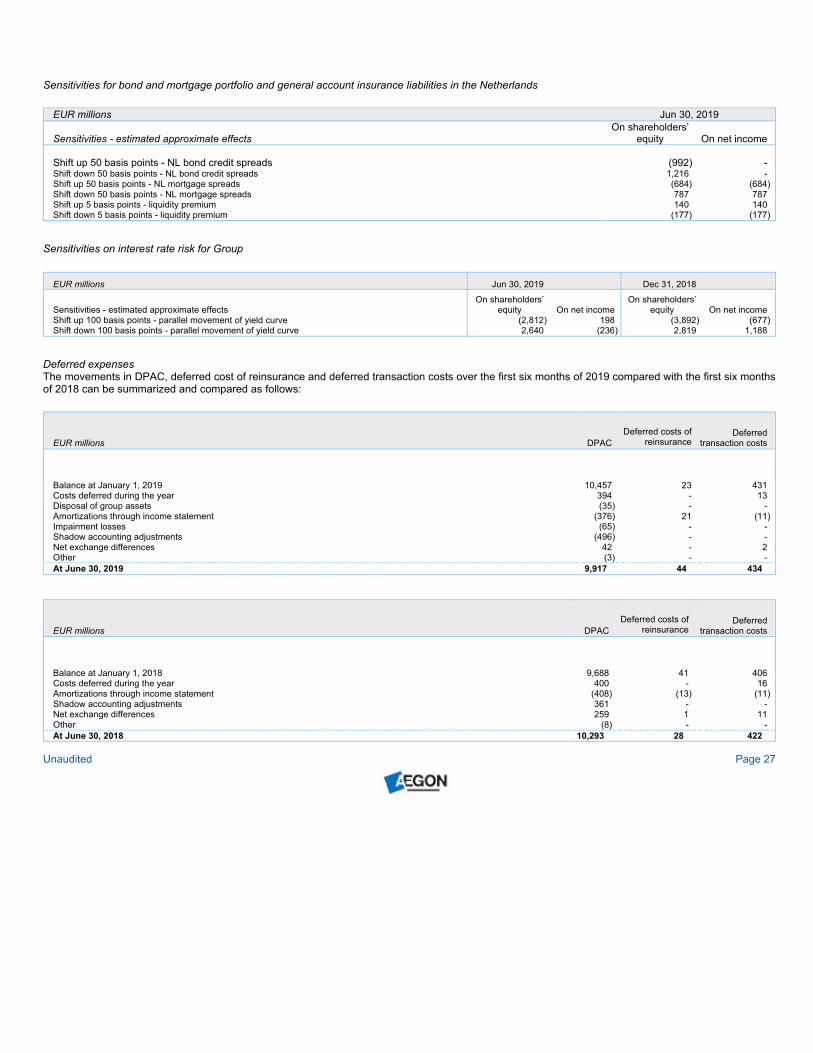
Sensitivities for bond and mortgage portfolio and general account insurance liabilities in the Netherlands
EUR millions Jun 30, 2019
Sensitivities - estimated approximate effects
On shareholders’
equity On net income
Shift up 50 basis points - NL bond credit spreads (992) -
Shift down 50 basis points - NL bond credit spreads 1,216 -
Shift up 50 basis points - NL mortgage spreads (684) (684)
Shift down 50 basis points - NL mortgage spreads 787 787
Shift up 5 basis points - liquidity premium 140 140
Shift down 5 basis points - liquidity premium (177) (177)
Sensitivities on interest rate risk for Group
EUR millions Jun 30, 2019 Dec 31, 2018
Sensitivities - estimated approximate effects
On shareholders’
equity On net income
On shareholders’
equity On net income
Shift up 100 basis points - parallel movement of yield curve (2,812) 198 (3,892) (677)
Shift down 100 basis points - parallel movement of yield curve 2,640 (236) 2,819 1,188
Deferred expenses
The movements in DPAC, deferred cost of reinsurance and deferred transaction costs over the first six months of 2019 compared with the first six months
of 2018 can be summarized and compared as follows:
EUR millions DPAC
Deferred costs of
reinsurance
Deferred
transaction costs
Balance at January 1, 2019 10,457 23 431
Costs deferred during the year 394 - 13
Disposal of group assets (35) - -
Amortizations through income statement (376) 21 (11)
Impairment losses (65) - -
Shadow accounting adjustments (496) - -
Net exchange differences 42 - 2
Other (3) - -
At June 30, 2019 9,917 44 434
EUR millions DPAC
Deferred costs of
reinsurance
Deferred
transaction costs
Balance at January 1, 2018 9,688 41 406
Costs deferred during the year 400 - 16
Amortizations through income statement (408) (13) (11)
Shadow accounting adjustments 361 - -
Net exchange differences 259 1 11
Other (8) - -
At June 30, 2018 10,293 28 422
Unaudited Page 27
VOBA
The movement in VOBA over the first six months of 2019 compared with the first six months of 2018 can be summarized and compared as follows:
EUR millions
First half
2019
First half
2018
At January 1 1,123 1,153
Amortization/depreciation through income statement (37) (63)
Shadow accounting adjustments (45) 41
Impairment losses (11) -
Net exchange differences 5 29
At June 30 1,035 1,160
2.3 Guarantees in insurance contracts
For financial reporting purposes Aegon distinguishes between the following types of minimum guarantees:
a. Financial guarantees: these guarantees are treated as bifurcated embedded derivatives, carried at fair value and presented as derivatives;
b. Total return annuities: these guarantees are not bifurcated from their host contracts because they are presented and valued at fair value together
with the underlying insurance contracts;
c. Life contingent guarantees in the United States: these guarantees are not bifurcated from their host contracts, presented and valued in
accordance with insurance accounting together with the underlying insurance contracts; and
d. Minimum investment return guarantees in the Netherlands: these guarantees are not bifurcated from their host contracts, valued at fair value and
presented together with the underlying insurance contracts.
In addition to the guarantees mentioned above, Aegon has traditional life insurance contracts that include minimum guarantees that are not valued
explicitly; however, the adequacy of all insurance liabilities, net of VOBA and DPAC, and including all guarantees, are assessed periodically.
a. Financial guarantees
In the United States and in the United Kingdom, a guaranteed minimum withdrawal benefit (GMWB) is offered directly on some variable annuity products
Aegon issues and is also assumed from a ceding company. Additionally, Aegon offers guarantees on variable annuities sold through its joint venture in
Japan. Variable annuities allow a customer to provide for the future on a tax-deferred basis and to participate in equity or bond market performance.
Variable annuities allow a customer to select payout options designed to help meet the customer’s need for income upon maturity, including lump sum
payment or income for life or for a period of time. This benefit guarantees that a policyholder can withdraw a certain percentage of the account value,
starting at a certain age or duration, for either a fixed period or during the life of the policyholder.
In the Netherlands, individual variable unit-linked products have a minimum benefit guarantee if premiums are invested in certain funds. The sum insured
at maturity or upon the death of the beneficiary has a minimum guaranteed return (in the range of 3% to 4%) if the premium has been paid for a
consecutive period of at least ten years and is invested in a mixed fund and/or fixed-income funds. No guarantees are given for equity investments only.
Unaudited Page 28
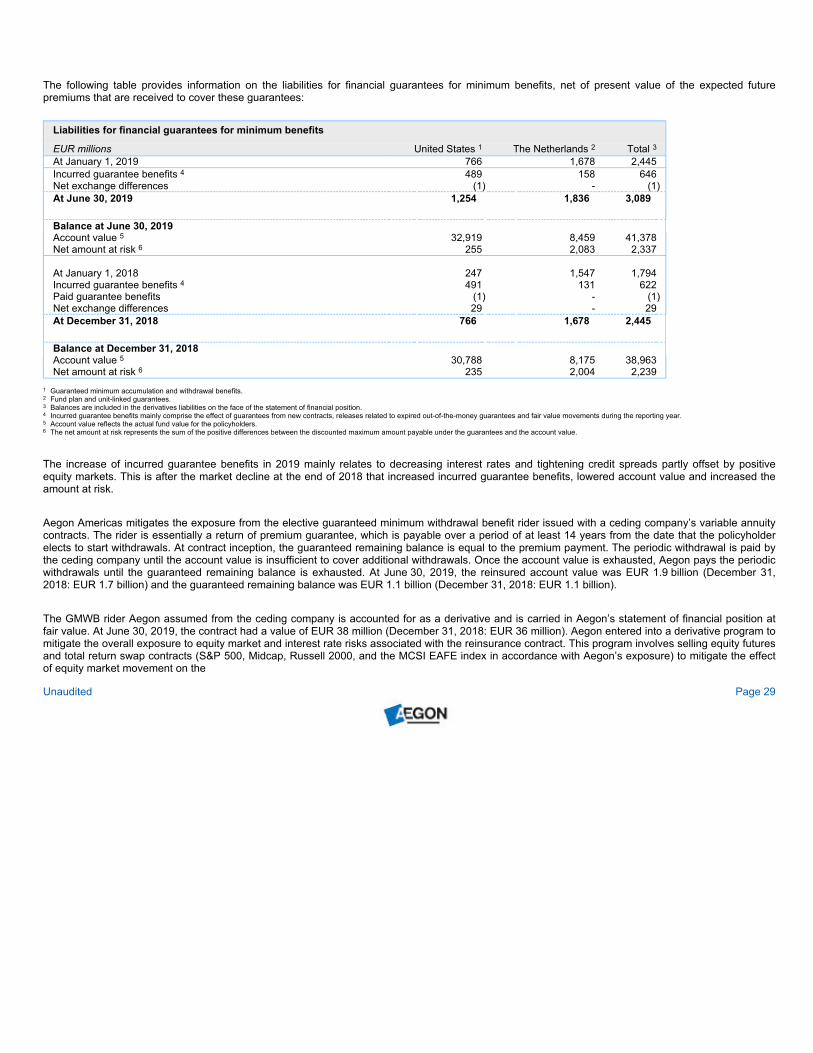
The following table provides information on the liabilities for financial guarantees for minimum benefits, net of present value of the expected future
premiums that are received to cover these guarantees:
Liabilities for financial guarantees for minimum benefits
EUR millions United States 1 The Netherlands 2 Total 3
At January 1, 2019 766 1,678 2,445
Incurred guarantee benefits 4 489 158 646
Net exchange differences (1) - (1)
At June 30, 2019 1,254 1,836 3,089
Balance at June 30, 2019
Account value 5 32,919 8,459 41,378
Net amount at risk 6 255 2,083 2,337
At January 1, 2018 247 1,547 1,794
Incurred guarantee benefits 4 491 131 622
Paid guarantee benefits (1) - (1)
Net exchange differences 29 - 29
At December 31, 2018 766 1,678 2,445
Balance at December 31, 2018
Account value 5 30,788 8,175 38,963
Net amount at risk 6 235 2,004 2,239
1 Guaranteed minimum accumulation and withdrawal benefits.
2 Fund plan and unit-linked guarantees.
3 Balances are included in the derivatives liabilities on the face of the statement of financial position.
4 Incurred guarantee benefits mainly comprise the effect of guarantees from new contracts, releases related to expired out-of-the-money guarantees and fair value movements during the reporting year.
5 Account value reflects the actual fund value for the policyholders.
6 The net amount at risk represents the sum of the positive differences between the discounted maximum amount payable under the guarantees and the account value.
The increase of incurred guarantee benefits in 2019 mainly relates to decreasing interest rates and tightening credit spreads partly offset by positive
equity markets. This is after the market decline at the end of 2018 that increased incurred guarantee benefits, lowered account value and increased the
amount at risk.
Aegon Americas mitigates the exposure from the elective guaranteed minimum withdrawal benefit rider issued with a ceding company’s variable annuity
contracts. The rider is essentially a return of premium guarantee, which is payable over a period of at least 14 years from the date that the policyholder
elects to start withdrawals. At contract inception, the guaranteed remaining balance is equal to the premium payment. The periodic withdrawal is paid by
the ceding company until the account value is insufficient to cover additional withdrawals. Once the account value is exhausted, Aegon pays the periodic
withdrawals until the guaranteed remaining balance is exhausted. At June 30, 2019, the reinsured account value was EUR 1.9 billion (December 31,
2018: EUR 1.7 billion) and the guaranteed remaining balance was EUR 1.1 billion (December 31, 2018: EUR 1.1 billion).
The GMWB rider Aegon assumed from the ceding company is accounted for as a derivative and is carried in Aegon’s statement of financial position at
fair value. At June 30, 2019, the contract had a value of EUR 38 million (December 31, 2018: EUR 36 million). Aegon entered into a derivative program to
mitigate the overall exposure to equity market and interest rate risks associated with the reinsurance contract. This program involves selling equity futures
and total return swap contracts (S&P 500, Midcap, Russell 2000, and the MCSI EAFE index in accordance with Aegon’s exposure) to mitigate the effect
of equity market movement on the
Unaudited Page 29
reinsurance contract and the purchase of interest rate swaps, treasury forwards and treasury futures to mitigate the effect of movements in interest rates
on the reinsurance contracts.
Aegon the Netherlands provides guarantees to its customers on expiry date for certain insurance contracts. In order to mitigate the risks related to the
guarantees Aegon the Netherlands has setup a hedging program. Aegon the Netherlands does not use reinsurance in order to mitigate risks related to
insurance contracts with a guarantee component. The net amount at risk represents the sum of the positive differences between the discounted maximum
amount payable under the guarantees and the account value, which is the actual fund value of the policyholder.
b. Total return annuities
Total Return Annuity (TRA) is an annuity product in the United States which provides customers with a pass-through of the total return on an underlying
portfolio of investment securities (typically a mix of corporate and convertible bonds) subject to a cumulative minimum guarantee. Both the assets and
liabilities are carried at fair value, however, due to the minimum guarantee not all of the changes in the market value of the asset will be offset in the
valuation of the liability. This product exists for the fixed annuity line of business and represents a closed block.
The fixed annuities product balance as of June 30, 2019, amounted to EUR 241 million (December 31, 2018: EUR 243 million).
c. Life contingent guarantees in the United States
Certain variable insurance contracts in the United States also provide guaranteed minimum death benefits (GMDB) and guaranteed minimum income
benefits (GMIB). Under a GMDB, the beneficiaries receive the greater of the account balance or the guaranteed amount upon the death of the insured.
The net amount at risk for GMDB contracts is defined as the current GMDB in excess of the capital account balance at the reporting date.
The GMIB feature provides for minimum payments if the contract holder elects to convert to an immediate payout annuity. The guaranteed amount is
calculated using the total deposits made by the contract holder, less any withdrawals and sometimes includes a roll-up or step-up feature that increases
the value of the guarantee with interest or with increases in the account value.
The additional liability for guaranteed minimum benefits that are not bifurcated are determined each period by estimating the expected value of benefits in
excess of the projected account balance and recognizing the excess over the accumulation period based on total expected assessments. The estimates
are reviewed regularly and any resulting adjustment to the additional liability is recognized in the income statement. The benefits used in calculating the
liabilities are based on the average benefits payable over a range of stochastic scenarios. Where applicable, the calculation of the liability incorporates a
percentage of the potential annuitizations that may be elected by the contract holder.
The following table provides information on the liabilities for guarantees for minimum benefits that are included in the valuation of the host contracts:
Unaudited Page 30
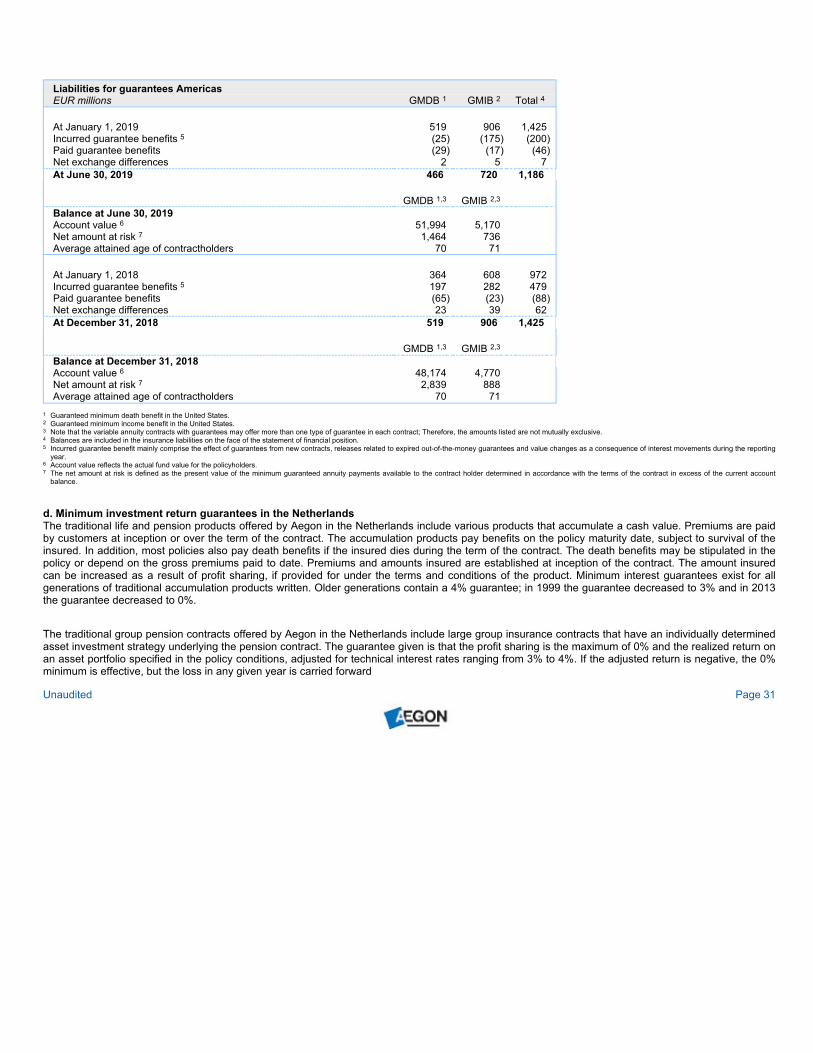
Liabilities for guarantees Americas
EUR millions GMDB 1 GMIB 2 Total 4
At January 1, 2019 519 906 1,425
Incurred guarantee benefits 5 (25) (175) (200)
Paid guarantee benefits (29) (17) (46)
Net exchange differences 2 5 7
At June 30, 2019 466 720 1,186
GMDB 1,3 GMIB 2,3
Balance at June 30, 2019
Account value 6 51,994 5,170
Net amount at risk 7 1,464 736
Average attained age of contractholders 70 71
At January 1, 2018 364 608 972
Incurred guarantee benefits 5 197 282 479
Paid guarantee benefits (65) (23) (88)
Net exchange differences 23 39 62
At December 31, 2018 519 906 1,425
GMDB 1,3 GMIB 2,3
Balance at December 31, 2018
Account value 6 48,174 4,770
Net amount at risk 7 2,839 888
Average attained age of contractholders 70 71
1 Guaranteed minimum death benefit in the United States.
2 Guaranteed minimum income benefit in the United States.
3 Note that the variable annuity contracts with guarantees may offer more than one type of guarantee in each contract; Therefore, the amounts listed are not mutually exclusive.
4 Balances are included in the insurance liabilities on the face of the statement of financial position.
5 Incurred guarantee benefit mainly comprise the effect of guarantees from new contracts, releases related to expired out-of-the-money guarantees and value changes as a consequence of interest movements during the reporting
year.
6 Account value reflects the actual fund value for the policyholders.
7 The net amount at risk is defined as the present value of the minimum guaranteed annuity payments available to the contract holder determined in accordance with the terms of the contract in excess of the current account
balance.
d. Minimum investment return guarantees in the Netherlands
The traditional life and pension products offered by Aegon in the Netherlands include various products that accumulate a cash value. Premiums are paid
by customers at inception or over the term of the contract. The accumulation products pay benefits on the policy maturity date, subject to survival of the
insured. In addition, most policies also pay death benefits if the insured dies during the term of the contract. The death benefits may be stipulated in the
policy or depend on the gross premiums paid to date. Premiums and amounts insured are established at inception of the contract. The amount insured
can be increased as a result of profit sharing, if provided for under the terms and conditions of the product. Minimum interest guarantees exist for all
generations of traditional accumulation products written. Older generations contain a 4% guarantee; in 1999 the guarantee decreased to 3% and in 2013
the guarantee decreased to 0%.
The traditional group pension contracts offered by Aegon in the Netherlands include large group insurance contracts that have an individually determined
asset investment strategy underlying the pension contract. The guarantee given is that the profit sharing is the maximum of 0% and the realized return on
an asset portfolio specified in the policy conditions, adjusted for technical interest rates ranging from 3% to 4%. If the adjusted return is negative, the 0%
minimum is effective, but the loss in any given year is carried forward
Unaudited Page 31
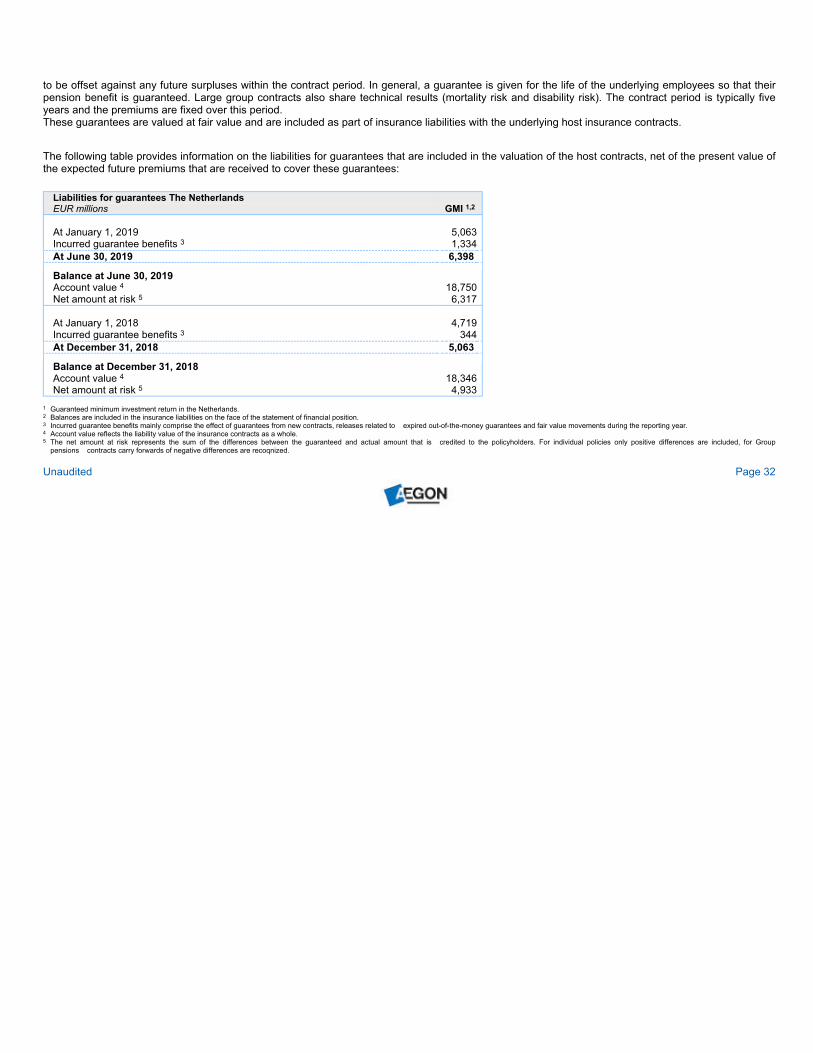
to be offset against any future surpluses within the contract period. In general, a guarantee is given for the life of the underlying employees so that their
pension benefit is guaranteed. Large group contracts also share technical results (mortality risk and disability risk). The contract period is typically five
years and the premiums are fixed over this period.
These guarantees are valued at fair value and are included as part of insurance liabilities with the underlying host insurance contracts.
The following table provides information on the liabilities for guarantees that are included in the valuation of the host contracts, net of the present value of
the expected future premiums that are received to cover these guarantees:
Liabilities for guarantees The Netherlands
EUR millions GMI 1,2
At January 1, 2019 5,063
Incurred guarantee benefits 3 1,334
At June 30, 2019 6,398
Balance at June 30, 2019
Account value 4 18,750
Net amount at risk 5 6,317
At January 1, 2018 4,719
Incurred guarantee benefits 3 344
At December 31, 2018 5,063
Balance at December 31, 2018
Account value 4 18,346
Net amount at risk 5 4,933
1 Guaranteed minimum investment return in the Netherlands.
2 Balances are included in the insurance liabilities on the face of the statement of financial position.
3 Incurred guarantee benefits mainly comprise the effect of guarantees from new contracts, releases related to expired out-of-the-money guarantees and fair value movements during the reporting year.
4 Account value reflects the liability value of the insurance contracts as a whole.
5 The net amount at risk represents the sum of the differences between the guaranteed and actual amount that is credited to the policyholders. For individual policies only positive differences are included, for Group
pensions contracts carry forwards of negative differences are recoqnized.
Unaudited Page 32
Fair value measurement of guarantees in insurance contracts
The fair values of guarantees mentioned above (with the exception of life contingent guarantees in the United States) are calculated as the present value
of future expected payments to policyholders less the present value of assessed rider fees attributable to the guarantees. For further details refer to note
47 of Aegon’s Integrated Annual Report on Form 20-F for 2018.
For equity volatility, Aegon uses a term structure assumption with market-based implied volatility inputs for the first five years and a long-term forward rate
assumption of 25% thereafter. The volume of observable option trading from which volatilities are derived generally declines as the contracts’ term
increases, therefore, the volatility curve grades from implied volatilities for five years to the ultimate rate. The resulting volatility assumption in year 20 for
the S&P 500 index (expressed as a spot rate) was 22.9% at June 30, 2019, and 23.3% at December 31, 2018. Correlations of market returns across
underlying indices are based on historical market returns and their inter-relationships over a number of years preceding the valuation date. Assumptions
regarding policyholder behavior, such as lapses, included in the models are derived in the same way as the assumptions used to measure insurance
liabilities.
These assumptions are reviewed at each valuation date, and updated based on historical experience and observable market data, including market
transactions such as acquisitions and reinsurance transactions. Disclosure on interest rate risk, including interest rate risk sensitivity is included in note 4
Financial risks of the 2018 Annual Report on Form 20-F.
Aegon utilizes different risk management strategies to mitigate the financial impact of the valuation of these guarantees on the results including asset and
liability management and derivative hedging strategies to hedge certain aspects of the market risks embedded in these guarantees.
Guarantees valued at fair value contributed a net gain before tax of EUR 335 million for the six months ended June 30, 2019 (six months ended June 30,
2018: gain of EUR 28 million). Contributing to this net gain before tax are fair value gains on guarantee reserve hedges of EUR 2,068 million (six months
ended June 30, 2018: EUR 394 million loss), a gain of EUR 957 million related to increase in equity markets (six months ended June 30, 2018: EUR
55 million gain), a gain of EUR 156 million related to DPAC offset and other (the first six months of 2018: EUR 99 million loss), a gain of EUR 108 million
related to widening of own credit spreads (six months ended June 30, 2018: EUR 132 million gain) and EUR 18 million gain (six months ended June 30,
2018: EUR 2 million loss) from increases in equity volatilities. This was partly offset by negative results related to decrease in risk free rates of EUR
2,937 million (six months ended June 30, 2018: EUR 332 million gain).
Guarantee reserves increased EUR 1,994 million in the first six months of 2019 (six months ended June 30, 2018: decrease of EUR 288 million).
Unaudited Page 33
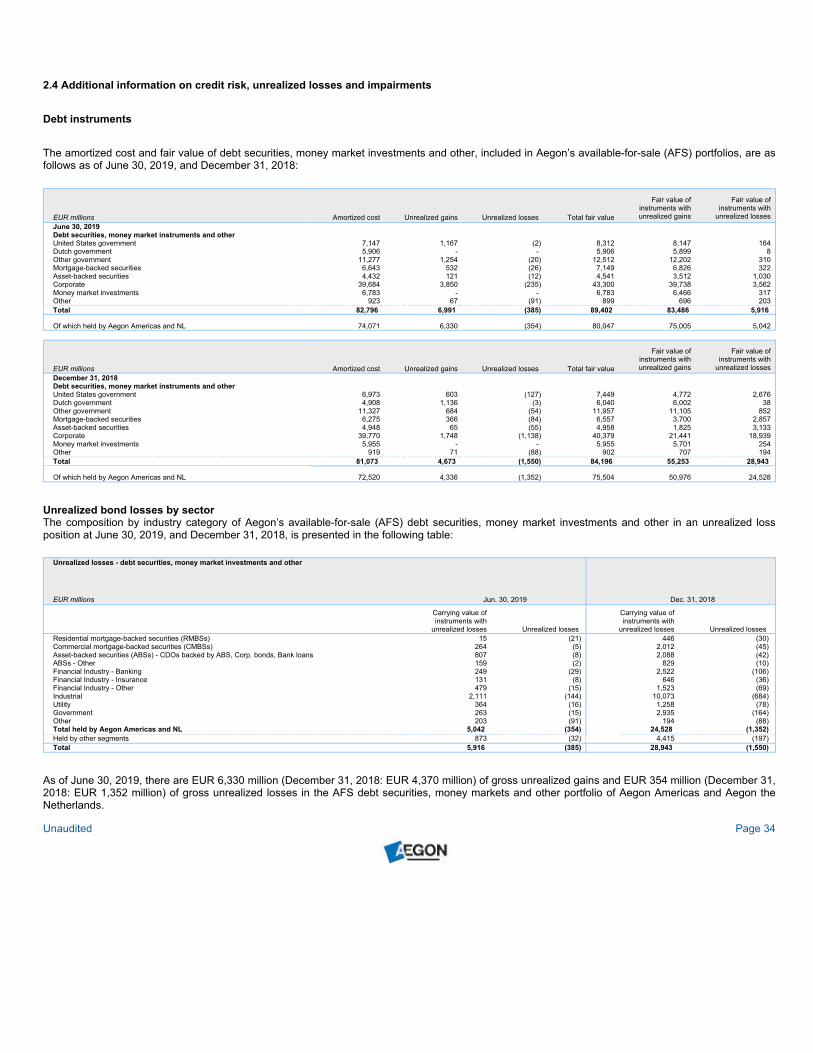
2.4 Additional information on credit risk, unrealized losses and impairments
Debt instruments
The amortized cost and fair value of debt securities, money market investments and other, included in Aegon’s available-for-sale (AFS) portfolios, are as
follows as of June 30, 2019, and December 31, 2018:
EUR millions Amortized cost Unrealized gains Unrealized losses Total fair value
Fair value of
instruments with
unrealized gains
Fair value of
instruments with
unrealized losses
June 30, 2019
Debt securities, money market instruments and other
United States government 7,147 1,167 (2) 8,312 8,147 164
Dutch government 5,906 - - 5,906 5,899 8
Other government 11,277 1,254 (20) 12,512 12,202 310
Mortgage-backed securities 6,643 532 (26) 7,149 6,826 322
Asset-backed securities 4,432 121 (12) 4,541 3,512 1,030
Corporate 39,684 3,850 (235) 43,300 39,738 3,562
Money market investments 6,783 - - 6,783 6,466 317
Other 923 67 (91) 899 696 203
Total 82,796 6,991 (385) 89,402 83,486 5,916
Of which held by Aegon Americas and NL 74,071 6,330 (354) 80,047 75,005 5,042
EUR millions Amortized cost Unrealized gains Unrealized losses Total fair value
Fair value of
instruments with
unrealized gains
Fair value of
instruments with
unrealized losses
December 31, 2018
Debt securities, money market instruments and other
United States government 6,973 603 (127) 7,449 4,772 2,676
Dutch government 4,908 1,136 (3) 6,040 6,002 38
Other government 11,327 684 (54) 11,957 11,105 852
Mortgage-backed securities 6,275 366 (84) 6,557 3,700 2,857
Asset-backed securities 4,948 65 (55) 4,958 1,825 3,133
Corporate 39,770 1,748 (1,138) 40,379 21,441 18,939
Money market investments 5,955 - - 5,955 5,701 254
Other 919 71 (88) 902 707 194
Total 81,073 4,673 (1,550) 84,196 55,253 28,943
Of which held by Aegon Americas and NL 72,520 4,336 (1,352) 75,504 50,976 24,528
Unrealized bond losses by sector
The composition by industry category of Aegon’s available-for-sale (AFS) debt securities, money market investments and other in an unrealized loss
position at June 30, 2019, and December 31, 2018, is presented in the following table:
Unrealized losses - debt securities, money market investments and other
EUR millions Jun. 30, 2019 Dec. 31, 2018
Carrying value of
instruments with
unrealized losses Unrealized losses
Carrying value of
instruments with
unrealized losses Unrealized losses
Residential mortgage-backed securities (RMBSs) 15 (21) 446 (30)
Commercial mortgage-backed securities (CMBSs) 264 (5) 2,012 (45)
Asset-backed securities (ABSs) - CDOs backed by ABS, Corp. bonds, Bank loans 807 (8) 2,088 (42)
ABSs - Other 159 (2) 829 (10)
Financial Industry - Banking 249 (29) 2,522 (106)
Financial Industry - Insurance 131 (8) 646 (36)
Financial Industry - Other 479 (15) 1,523 (69)
Industrial 2,111 (144) 10,073 (684)
Utility 364 (16) 1,258 (78)
Government 263 (15) 2,935 (164)
Other 203 (91) 194 (88)
Total held by Aegon Americas and NL 5,042 (354) 24,528 (1,352)
Held by other segments 873 (32) 4,415 (197)
Total 5,916 (385) 28,943 (1,550)
As of June 30, 2019, there are EUR 6,330 million (December 31, 2018: EUR 4,370 million) of gross unrealized gains and EUR 354 million (December 31,
2018: EUR 1,352 million) of gross unrealized losses in the AFS debt securities, money markets and other portfolio of Aegon Americas and Aegon the
Netherlands.
Unaudited Page 34
US credit and equity market returns were strong in the first half of 2019, rebounding from extreme sell-offs in December of 2018. Credit spreads tightened
significantly, and US equity markets were sharply higher. Developed-world strength was mostly steady, with the US generally outperforming most other
developed economies. Outside of the US, global equity markets were also higher. The dollar was modestly stronger versus the Euro, and slightly weaker
versus the Yen. The US Federal Reserve paused its tightening cycle and left the Fed Funds rate target unchanged during the first half of 2019, reflecting
a benign inflation environment and concerns about prospective economic growth. Treasury rates declined materially, and rates 10 years to maturity and
shorter ended the half lower than the Fed Funds rate target range. Corporate default rates remained low. Oil prices at mid-year were higher than year-end
2018 levels, but much below the highs of the half as the market became increasingly concerned with global growth prospectively. Tighter credit spreads
and lower US Treasury rates increased the market values of fixed income holdings.
GDP growth in the first half of 2019 was fairly robust. However, the outlook for the Eurozone is clouded by a number of factors. The trade war between
the US and China has resulted in a drag on exports. Also the uncertainly of further tariffs is a drag on confidence and investment. Meanwhile the domestic
focused parts of the economy are holding up better. Labour growth slowed, but remained strong. Also consumption growth is still supported by wage
gains and labour reforms. Several peripheral countries, like Spain maintained a high growth rate in 2018 and in the first half of 2019. Italy is the exception,
where the confrontation with the European Commission has resulted in tighter lending conditions and lower confidence. The Brexit deadline was
postponed again, after the UK parliament didn’t ratify the withdrawal deal and didn’t agree on an alternative arrangement. The ECB has introduced new
targeted longer-term refinancing operations (TLTROs) to ease credit conditions. Draghi, the ECB president, has also underscored the ECB’s ability to
decrease the depo rate or to restart the Asset Purchase Programme (APP) if economic conditions require that.
Impairment of financial assets
Aegon regularly monitors industry sectors and individual debt securities for indicators of impairment. These indicators may include one or more of the
following: 1) deteriorating market to book ratio, 2) increasing industry risk factors, 3) deteriorating financial condition of the issuer, 4) covenant violations
by the issuer, 5) high probability of bankruptcy of the issuer, or 6) downgrades by internationally recognized credit rating agency. Additionally, for asset-
backed securities, cash flow trends and underlying levels of collateral are monitored. A security is impaired if there is objective evidence that a loss event
has occurred after the initial recognition of the asset that has a negative impact on the estimated future cash flows.
In the sections below a description is provided on the composition of the categories of debt securities and money market investments. Individual issuers
rated below investment grade in any sector which have unrealized loss positions greater than EUR 25 million are disclosed separately. Furthermore,
quality ratings of investment portfolios are based on a composite of the main rating agencies (S&P, Moody’s and Fitch) and Aegon’s internal rating of the
counterparty.
Residential mortgage-backed securities
Aegon Americas and Aegon the Netherlands hold EUR 3,115 million (December 31, 2018: EUR 2,497 million) of residential mortgage-backed securities
available-for-sale (RMBS), of which EUR 2,763 million (December 31, 2018: EUR 2,102 million) is held by Aegon Americas and EUR 352 million
(December 31, 2018: EUR 395 million) by Aegon the Netherlands. Residential mortgage-backed securities are securitizations of underlying pools of
non-commercial mortgages on real estate. The underlying residential mortgages have varying credit characteristics and are pooled together and sold in
tranches. The following table shows the breakdown of Aegon Americas RMBS available-for-sale (AFS) portfolio.
Unaudited Page 35
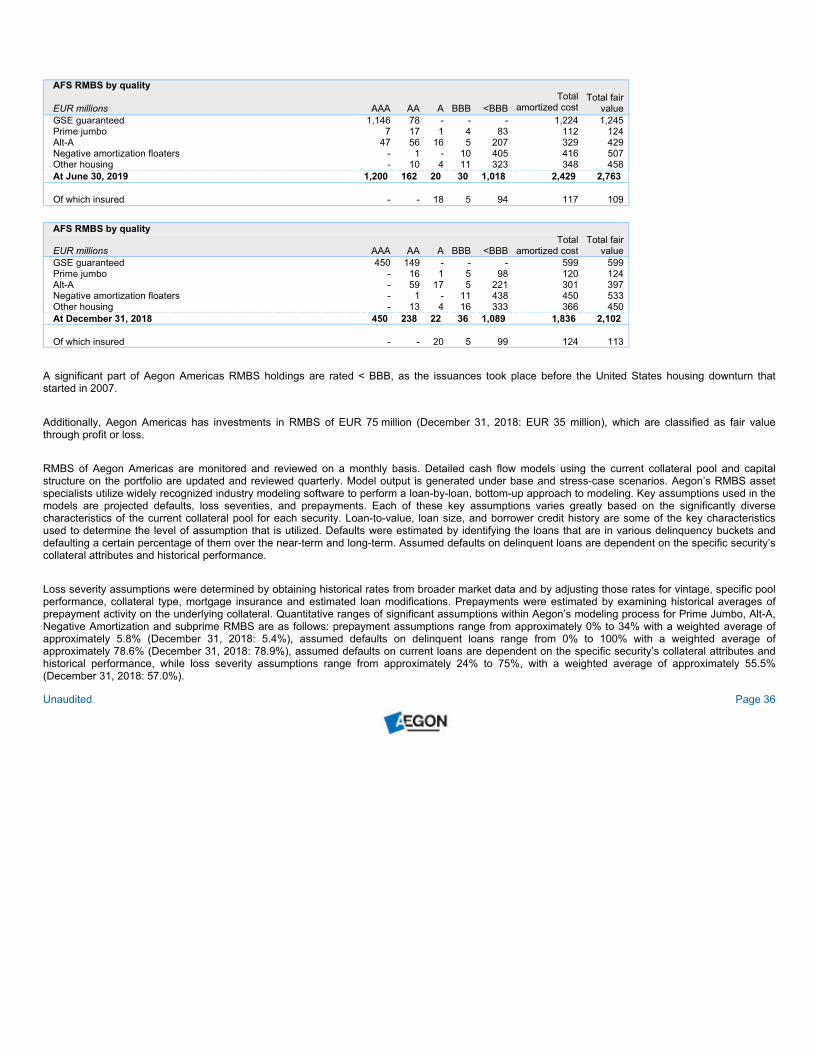
AFS RMBS by quality
EUR millions AAA AA A BBB <BBB
Total
amortized cost
Total fair
value
GSE guaranteed 1,146 78 - - - 1,224 1,245
Prime jumbo 7 17 1 4 83 112 124
Alt-A 47 56 16 5 207 329 429
Negative amortization floaters - 1 - 10 405 416 507
Other housing - 10 4 11 323 348 458
At June 30, 2019 1,200 162 20 30 1,018 2,429 2,763
Of which insured - - 18 5 94 117 109
AFS RMBS by quality
EUR millions AAA AA A BBB <BBB
Total
amortized cost
Total fair
value
GSE guaranteed 450 149 - - - 599 599
Prime jumbo - 16 1 5 98 120 124
Alt-A - 59 17 5 221 301 397
Negative amortization floaters - 1 - 11 438 450 533
Other housing - 13 4 16 333 366 450
At December 31, 2018 450 238 22 36 1,089 1,836 2,102
Of which insured - - 20 5 99 124 113
A significant part of Aegon Americas RMBS holdings are rated < BBB, as the issuances took place before the United States housing downturn that
started in 2007.
Additionally, Aegon Americas has investments in RMBS of EUR 75 million (December 31, 2018: EUR 35 million), which are classified as fair value
through profit or loss.
RMBS of Aegon Americas are monitored and reviewed on a monthly basis. Detailed cash flow models using the current collateral pool and capital
structure on the portfolio are updated and reviewed quarterly. Model output is generated under base and stress-case scenarios. Aegon’s RMBS asset
specialists utilize widely recognized industry modeling software to perform a loan-by-loan, bottom-up approach to modeling. Key assumptions used in the
models are projected defaults, loss severities, and prepayments. Each of these key assumptions varies greatly based on the significantly diverse
characteristics of the current collateral pool for each security. Loan-to-value, loan size, and borrower credit history are some of the key characteristics
used to determine the level of assumption that is utilized. Defaults were estimated by identifying the loans that are in various delinquency buckets and
defaulting a certain percentage of them over the near-term and long-term. Assumed defaults on delinquent loans are dependent on the specific security’s
collateral attributes and historical performance.
Loss severity assumptions were determined by obtaining historical rates from broader market data and by adjusting those rates for vintage, specific pool
performance, collateral type, mortgage insurance and estimated loan modifications. Prepayments were estimated by examining historical averages of
prepayment activity on the underlying collateral. Quantitative ranges of significant assumptions within Aegon’s modeling process for Prime Jumbo, Alt-A,
Negative Amortization and subprime RMBS are as follows: prepayment assumptions range from approximately 0% to 34% with a weighted average of
approximately 5.8% (December 31, 2018: 5.4%), assumed defaults on delinquent loans range from 0% to 100% with a weighted average of
approximately 78.6% (December 31, 2018: 78.9%), assumed defaults on current loans are dependent on the specific security’s collateral attributes and
historical performance, while loss severity assumptions range from approximately 24% to 75%, with a weighted average of approximately 55.5%
(December 31, 2018: 57.0%).
Unaudited Page 36
Once the entire pool is modeled, the results are closely analyzed by Aegon’s asset specialists to determine whether or not Aegon’s particular tranche or
holding is at risk for not collecting all contractual cash flows taking into account the seniority and other terms of the tranches held.
Aegon the Netherlands has mandated Aegon Asset Management to invest in RMBS transactions. Aegon Asset Management uses its own proprietary
cash flow tools to analyse and stress test RMBS transactions. The key input parameters are default rates and loss given default assumptions, which are
established based on historical pool characteristics and current loan level data. Cash flows for each bond are modelled in 225 scenarios of varying
severity, ranging from our base case to extreme stress to even unrealistic scenarios to establish breaking points of the tranche. The model takes all deal
characteristics, such as waterfall or reserve funds, into account and gives us detailed insight in the risk of principal loss or deferral of contractual cash
flows.
The total gross unrealized loss on available-for-sale RMBS of Aegon Americas and Aegon the Netherlands amounted to EUR 21 million (December 31,
2018: 30 million), of which EUR 20 million (December 31, 2018: EUR 29 million) relates to positions of Aegon Americas. The total net unrealized gain on
available-for-sale RMBS was EUR 336 million (December 31, 2018: EUR 268 million), including a EUR 333 million (December 31, 2018: EUR 266 million)
net unrealized gain relating to positions of Aegon Americas.
The United States’ housing market remains buoyant but has transitioned to a more moderate growth trajectory. The housing market continues to benefit
from strong employment, historically low inventory, rising household formation rates, income growth, and modest credit easing. This is manifesting itself in
low borrower delinquencies, better recoveries upon liquidation, and short timelines to sell properties. However, housing affordability has now come under
pressure from years of price appreciation outpacing wage growth, somewhat mitigated by declining mortgage rates during the first half of 2019. Home
price appreciation and existing home sales volume have begun to decelerate. These confluence of factors will leave limited room for spread tightening
across the asset class.
In general, the European housing market showed further improvement in the first half of 2019. House prices are increasing and affordability remains high
given the low level of interest rates. Although the economy was healthy, markets are expecting (global) growth rate to slow. Unemployment levels
meanwhile continue to drop which is clearly beneficial for consumer risk in general and retail mortgages in particular. Despite net supply in the European
RMBS markets remaining negative, primary markets are very active. Also, while RMBS backed by new origination is increasing, securitizations backed by
legacy mortgage pools continue to be part of the primary supply. Improving fundamentals, deleveraging of the deals and collateral, and negative net
supply (together with increasing demand) in the sector were compensated, political related turmoil and expectations of a less benign macroeconomic
climate due to increased trade tensions and resulted in a marginal widening of credit spreads.
There are no individual issuers rated below investment grade in this RMBS sector which have unrealized loss position greater than EUR 25 million.
The fair values of Aegon Americas’ available-for-sale (AFS) RMBS instruments were determined as follows:
EUR millions Level II Level III
Jun. 30,
2019 Level II Level III
Dec. 31,
2018
RMBS 2,729 34 2,763 2,060 42 2,102
Unaudited Page 37
Commercial mortgage-backed securities
As of June, 30, 2019, Aegon Americas and Aegon the Netherlands hold EUR 3,283 million (December 31, 2018: EUR 3,349 million) of AFS commercial
mortgage-backed securities (CMBS), of which EUR 3,265 million (December 31, 2018: EUR 3,314 million) is held by Aegon Americas and EUR 19 million
(December 31, 2018: EUR 35 million) by Aegon the Netherlands. CMBS are securitizations of underlying pools of mortgages on commercial real estate.
The underlying mortgages have varying risk characteristics and are pooled together and sold in different rated tranches. The company’s CMBS include
conduit, large loan, single borrower, commercial real estate collateralized debt obligations (CRE CDOs), collateralized debt obligations (CDOs),
government agency, and franchise loan receivable trusts.
The total gross unrealized loss on available-for-sale CMBS of Aegon Americas amounted to EUR 5 million as of June 30, 2019 (December 31, 2018:
EUR 44 million). The total net unrealized gain on the available-for-sale CMBS as of June 30, 2019, is EUR 111 million (December 31, 2018: EUR 17
million), of which EUR 111 million (December 31, 2018: EUR 17 million gain) relates to positions of Aegon Americas. CMBS fundamentals remain stable.
The delinquency rate continues to fall, led by distressed legacy loan resolutions. Higher prices in the US CMBS sector since the start of the year are
mostly driven by broader market moves from lower interest rates and tighter spreads.
The tables below summarizes the credit quality of Aegon America’s available-for-sale (AFS) CMBS portfolio. Additionally, as of June 30, 2019, Aegon
Americas has no investments in CMBS (December 31, 2018: EUR nil), which are classified as fair value through profit or loss.
CMBS by quality
EUR millions AAA AA A BBB <BBB
Total
amortized
cost
Total fair
value
CMBS 2,385 638 83 3 44 3,154 3,265
CMBS and CRE CDOs - - - - - - -
At June 30, 2019 2,385 638 83 3 44 3,154 3,265
CMBS by quality
EUR millions AAA AA A BBB <BBB
Total
amortized
cost
Total fair
value
CMBS 2,635 567 65 3 57 3,326 3,310
CMBS and CRE CDOs - - - - 5 5 4
At December 31, 2018 2,635 567 65 3 62 3,331 3,314
CMBS of Aegon Americas are monitored and reviewed on a monthly basis. Detailed cash flow models using the current collateral pool and capital
structure on the portfolio are updated and reviewed quarterly. Model output is generated under base and several stress-case scenarios by Aegon’s
internal CMBS asset specialists. For conduit securities, a widely recognized industry modeling software is used to perform a loan-by-loan, bottom-up
approach. For non-conduit securities, a CMBS asset specialist works closely with Aegon’s real estate valuation group to determine underlying asset
valuation and risk. Both methodologies incorporate external estimates on the property market, capital markets, property cash flows, and loan structure.
Results are then closely analyzed by the asset specialist to determine whether or not a principal or interest loss is expected to occur.
As the remaining unrealized losses in the CMBS portfolio relate to holdings where Aegon expects to receive full principal and interest, Aegon does not
consider the underlying investments to be impaired as of June 30, 2019.
Unaudited Page 38
There are no individual issuers rated below investment grade in the CMBS sector which have unrealized loss position greater than EUR 25 million.
The fair values of Aegon Americas available-for-sale (AFS) CMBS instruments were determined as follows:
EUR millions Level II Level III
Jun. 30,
2019 Level II Level III
Dec. 31,
2018
CMBS 3,265 - 3,265 3,310 4 3,314
Asset-backed securities
Aegon Americas and Aegon the Netherlands hold EUR 4,016 million (December 31, 2018: EUR 4,503 million) of AFS ABS instruments of which EUR
2,332 million (December 31, 2018: EUR 2,626 million) is held by Aegon Americas and EUR 1,684 million (December 31, 2018: EUR 1,877 million) by
Aegon the Netherlands. Additionally, as of June 30, 2019, Aegon Americas has investments in ABS of EUR 4 million (December 31, 2018: EUR 6
million), which are classified as fair value through profit or loss. ABS are securitizations of underlying pools of credit card receivables, auto financing
loans, small business loans, bank loans, and other receivables. The underlying assets of the asset backed securities have been pooled together and sold
in tranches with varying credit ratings.
The total gross unrealized loss on available-for-sale ABS of Aegon Americas and Aegon the Netherlands amounted to EUR 11 million as of June 30,
2019 (December 31, 2018: EUR 52 million). Aegon Americas has EUR 5 million (December 31, 2018: EUR 18 million) of this gross unrealized loss and
Aegon the Netherlands, EUR 6 million (December 31, 2018: EUR 34 million). In the United States, increasing investor demand has been met with new
issuance in the asset-backed sector. Spreads in the asset- backed sector tightened in the first part of 2019. The European ABS market did well in the first
half of 2019. The spread widening of the last months of 2018 has been reversed across most European ABS sectors. This resulted in positive
performance. We remain moderately positive on European ABS markets for the short to medium term. Despite the bleaker macroeconomic picture, we
still consider ABS fundamentals to be supportive for most sectors. In addition, favorable technicals will persist for the European ABS markets. Alongside
ECB demand, lower issuance with similar demand has provided a strong technical backdrop for European ABS markets. It seems that European ABS
was broadly immune to the wider volatility and spreads remained broadly stable. Investor demand is increasingly moving towards longer-maturity and
lower-rated assets, but it remains to be seen whether that will continue or that technical factors are the main driver of demand.
The breakdown by quality of the available-for-sale (AFS) ABS portfolio of Aegon Americas and Aegon the Netherlands is as follows:
Unaudited Page 39
ABS Americas and NL
EUR millions AAA AA A BBB <BBB
Total
amortized
cost
Total fair
value
Credit cards 68 19 - - - 87 98
Autos 178 7 58 2 - 245 247
Small business loans - - 2 9 29 40 40
CDOs backed by ABS, Corp. bonds, Bank loans 1,384 503 75 63 46 2,072 2,073
Other ABS 437 118 842 97 6 1,501 1,559
At June 30, 2019 2,068 647 978 171 81 3,944 4,017
ABS Americas and NL
EUR millions AAA AA A BBB <BBB
Total
amortized
cost
Total fair
value
Credit cards 174 19 - - - 193 201
Autos 230 - 58 2 - 290 289
Small business loans - - 2 12 46 60 63
CDOs backed by ABS, Corp. bonds, Bank loans 1,535 479 216 146 46 2,423 2,386
Other ABS 525 151 774 88 8 1,547 1,563
At December 31, 2018 2,464 649 1,051 248 100 4,512 4,503
There were no individual issuers rated below investment grade in this ABS sector which has unrealized loss position greater than EUR 25 million.
The fair values of Aegon Americas and Aegon the Netherlands available-for-sale (AFS) ABS instruments were determined as follows:
EUR millions Level II Level III Jun. 30, 2019 Level II Level III Dec. 31, 2018
ABSs 3,375 642 4,017 3,650 853 4,503
Corporate - Industrial sector
The Industrial sector is further subdivided into various sub-sectors. A majority of Aegon’s available-for-sale portfolio gross unrealized loss is in the
Consumer Non-Cyclical and Energy sub-sectors.
Corporate – industrial sector – Energy sub-sector
Within the Energy sub-sector, Aegon Americas and Aegon the Netherlands hold EUR 3,881 million (December 31, 2018: EUR 3,802 million) of AFS
bonds, of which EUR 3,696 million (December 31, 2018: EUR 3,592 million) is held by Aegon Americas and EUR 185 million (December 31, 2018: EUR
211 million) by Aegon the Netherlands. In aggregate, the gross unrealized loss on these bonds amounted to EUR 55 million (December 31, 2018: EUR
138 million) and the net unrealized gain on these bonds amounted to EUR 308 million (December 31, 2018: EUR 13 million).
The Energy sub-sector encompasses various industries including integrated oil and gas producers, independent oil and gas producers, midstream
processing and transport, oil field services and drilling, and refining. Lower oil and natural gas prices have reduced cash flow for upstream producers. Oil
field service and drilling companies have been pressured by reduced capital spending by their upstream client base and margin compression from price
concessions and new capacity additions. While refiners have seen positive impacts from lower feedstock costs, margins have softened due to high
refined product inventory levels. Commodity price pressure has been the result of strong non-OPEC supply growth, high global inventories and concerns
on trade and softening global demand, partially offset by supply disruptions and geo-political tensions. In response, OPEC coordinated an agreement to
cut production levels in an effort to reduce global inventories and increase prices. Aegon evaluated the near-term prospects of the issuers in relation to
the severity and duration of the unrealized loss and does not consider those investments to be impaired as of June 30, 2019.
Unaudited Page 40
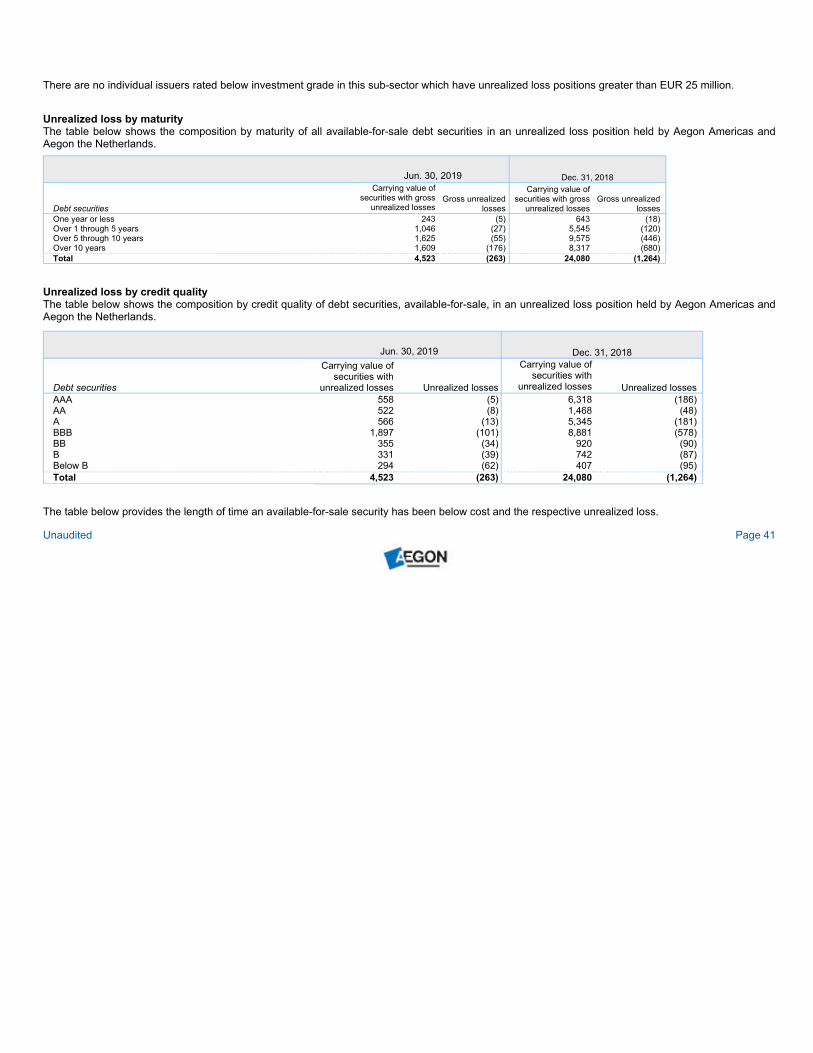
There are no individual issuers rated below investment grade in this sub-sector which have unrealized loss positions greater than EUR 25 million.
Unrealized loss by maturity
The table below shows the composition by maturity of all available-for-sale debt securities in an unrealized loss position held by Aegon Americas and
Aegon the Netherlands.
Jun. 30, 2019 Dec. 31, 2018
Debt securities
Carrying value of
securities with gross
unrealized losses
Gross unrealized
losses
Carrying value of
securities with gross
unrealized losses
Gross unrealized
losses
One year or less 243 (5) 643 (18)
Over 1 through 5 years 1,046 (27) 5,545 (120)
Over 5 through 10 years 1,625 (55) 9,575 (446)
Over 10 years 1,609 (176) 8,317 (680)
Total 4,523 (263) 24,080 (1,264)
Unrealized loss by credit quality
The table below shows the composition by credit quality of debt securities, available-for-sale, in an unrealized loss position held by Aegon Americas and
Aegon the Netherlands.
Jun. 30, 2019 Dec. 31, 2018
Debt securities
Carrying value of
securities with
unrealized losses Unrealized losses
Carrying value of
securities with
unrealized losses Unrealized losses
AAA 558 (5) 6,318 (186)
AA 522 (8) 1,468 (48)
A 566 (13) 5,345 (181)
BBB 1,897 (101) 8,881 (578)
BB 355 (34) 920 (90)
B 331 (39) 742 (87)
Below B 294 (62) 407 (95)
Total 4,523 (263) 24,080 (1,264)
The table below provides the length of time an available-for-sale security has been below cost and the respective unrealized loss.
Unaudited Page 41
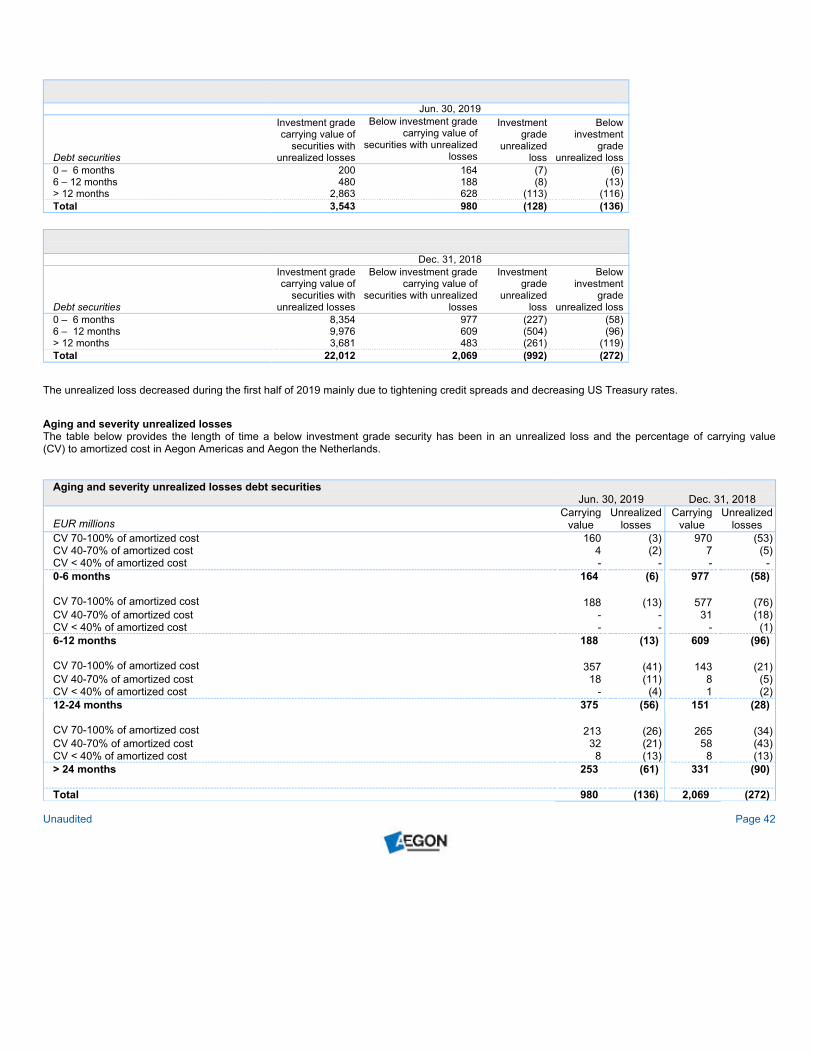
Jun. 30, 2019
Debt securities
Investment grade
carrying value of
securities with
unrealized losses
Below investment grade
carrying value of
securities with unrealized
losses
Investment
grade
unrealized
loss
Below
investment
grade
unrealized loss
0 – 6 months 200 164 (7) (6)
6 – 12 months 480 188 (8) (13)
> 12 months 2,863 628 (113) (116)
Total 3,543 980 (128) (136)
Dec. 31, 2018
Debt securities
Investment grade
carrying value of
securities with
unrealized losses
Below investment grade
carrying value of
securities with unrealized
losses
Investment
grade
unrealized
loss
Below
investment
grade
unrealized loss
0 – 6 months 8,354 977 (227) (58)
6 – 12 months 9,976 609 (504) (96)
> 12 months 3,681 483 (261) (119)
Total 22,012 2,069 (992) (272)
The unrealized loss decreased during the first half of 2019 mainly due to tightening credit spreads and decreasing US Treasury rates.
Aging and severity unrealized losses
The table below provides the length of time a below investment grade security has been in an unrealized loss and the percentage of carrying value
(CV) to amortized cost in Aegon Americas and Aegon the Netherlands.
Aging and severity unrealized losses debt securities
Jun. 30, 2019 Dec. 31, 2018
EUR millions
Carrying
value
Unrealized
losses
Carrying
value
Unrealized
losses
CV 70-100% of amortized cost 160 (3) 970 (53)
CV 40-70% of amortized cost 4 (2) 7 (5)
CV < 40% of amortized cost - - - -
0-6 months 164 (6) 977 (58)
CV 70-100% of amortized cost 188 (13) 577 (76)
CV 40-70% of amortized cost - - 31 (18)
CV < 40% of amortized cost - - - (1)
6-12 months 188 (13) 609 (96)
CV 70-100% of amortized cost 357 (41) 143 (21)
CV 40-70% of amortized cost 18 (11) 8 (5)
CV < 40% of amortized cost - (4) 1 (2)
12-24 months 375 (56) 151 (28)
CV 70-100% of amortized cost 213 (26) 265 (34)
CV 40-70% of amortized cost 32 (21) 58 (43)
CV < 40% of amortized cost 8 (13) 8 (13)
> 24 months 253 (61) 331 (90)
Total 980 (136) 2,069 (272)
Unaudited Page 42
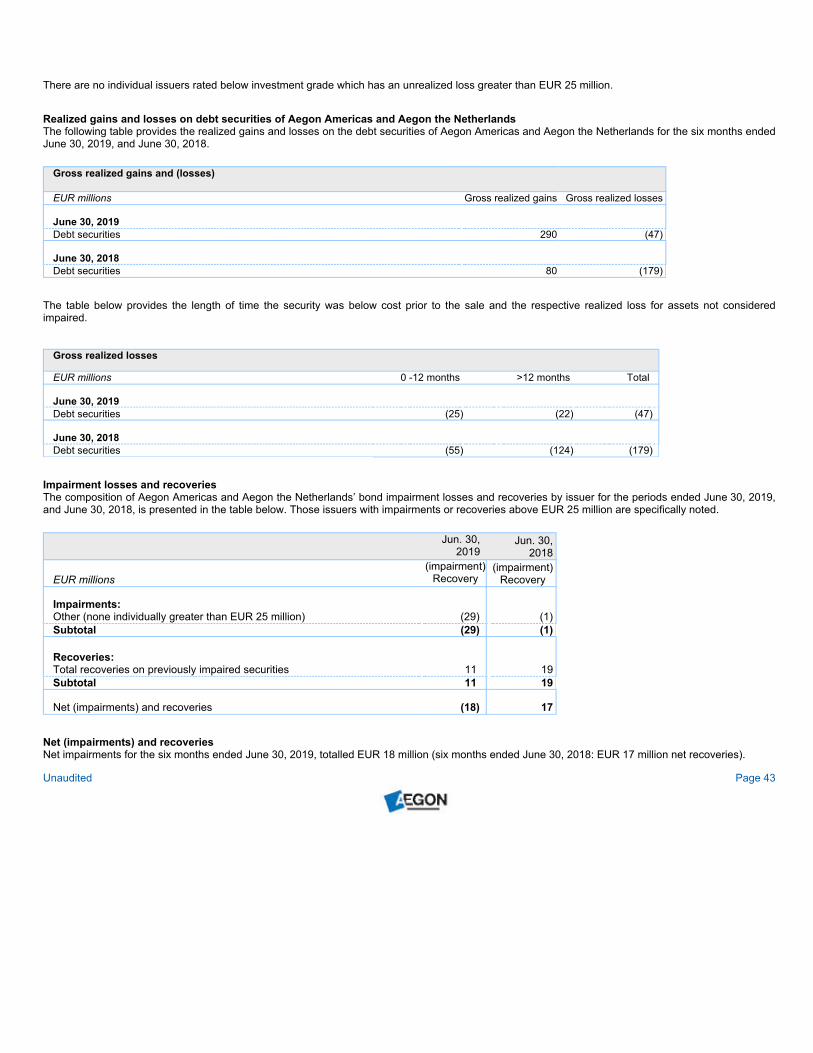
There are no individual issuers rated below investment grade which has an unrealized loss greater than EUR 25 million.
Realized gains and losses on debt securities of Aegon Americas and Aegon the Netherlands
The following table provides the realized gains and losses on the debt securities of Aegon Americas and Aegon the Netherlands for the six months ended
June 30, 2019, and June 30, 2018.
Gross realized gains and (losses)
EUR millions Gross realized gains Gross realized losses
June 30, 2019
Debt securities 290 (47)
June 30, 2018
Debt securities 80 (179)
The table below provides the length of time the security was below cost prior to the sale and the respective realized loss for assets not considered
impaired.
Gross realized losses
EUR millions 0 -12 months >12 months Total
June 30, 2019
Debt securities (25) (22) (47)
June 30, 2018
Debt securities (55) (124) (179)
Impairment losses and recoveries
The composition of Aegon Americas and Aegon the Netherlands’ bond impairment losses and recoveries by issuer for the periods ended June 30, 2019,
and June 30, 2018, is presented in the table below. Those issuers with impairments or recoveries above EUR 25 million are specifically noted.
Jun. 30,
2019
Jun. 30,
2018
EUR millions
(impairment)
Recovery
(impairment)
Recovery
Impairments:
Other (none individually greater than EUR 25 million) (29) (1)
Subtotal (29) (1)
Recoveries:
Total recoveries on previously impaired securities 11 19
Subtotal 11 19
Net (impairments) and recoveries (18) 17
Net (impairments) and recoveries
Net impairments for the six months ended June 30, 2019, totalled EUR 18 million (six months ended June 30, 2018: EUR 17 million net recoveries).
Unaudited Page 43
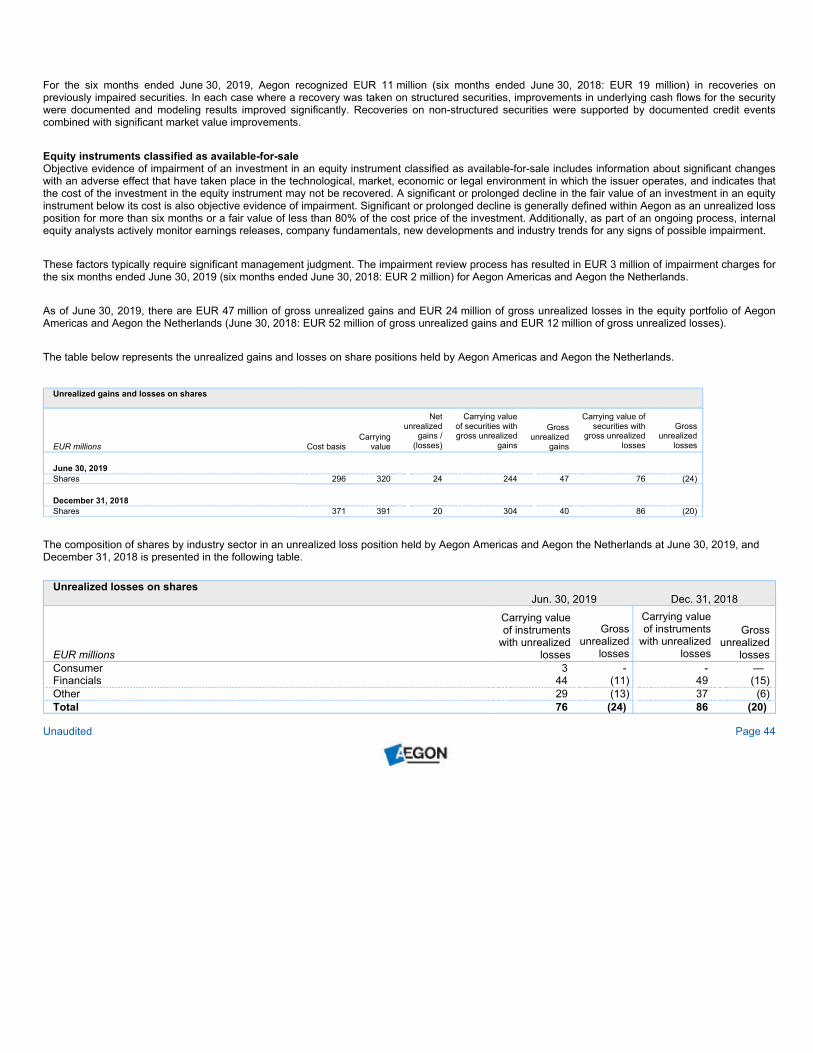
For the six months ended June 30, 2019, Aegon recognized EUR 11 million (six months ended June 30, 2018: EUR 19 million) in recoveries on
previously impaired securities. In each case where a recovery was taken on structured securities, improvements in underlying cash flows for the security
were documented and modeling results improved significantly. Recoveries on non-structured securities were supported by documented credit events
combined with significant market value improvements.
Equity instruments classified as available-for-sale
Objective evidence of impairment of an investment in an equity instrument classified as available-for-sale includes information about significant changes
with an adverse effect that have taken place in the technological, market, economic or legal environment in which the issuer operates, and indicates that
the cost of the investment in the equity instrument may not be recovered. A significant or prolonged decline in the fair value of an investment in an equity
instrument below its cost is also objective evidence of impairment. Significant or prolonged decline is generally defined within Aegon as an unrealized loss
position for more than six months or a fair value of less than 80% of the cost price of the investment. Additionally, as part of an ongoing process, internal
equity analysts actively monitor earnings releases, company fundamentals, new developments and industry trends for any signs of possible impairment.
These factors typically require significant management judgment. The impairment review process has resulted in EUR 3 million of impairment charges for
the six months ended June 30, 2019 (six months ended June 30, 2018: EUR 2 million) for Aegon Americas and Aegon the Netherlands.
As of June 30, 2019, there are EUR 47 million of gross unrealized gains and EUR 24 million of gross unrealized losses in the equity portfolio of Aegon
Americas and Aegon the Netherlands (June 30, 2018: EUR 52 million of gross unrealized gains and EUR 12 million of gross unrealized losses).
The table below represents the unrealized gains and losses on share positions held by Aegon Americas and Aegon the Netherlands.
Unrealized gains and losses on shares
EUR millions Cost basis
Carrying
value
Net
unrealized
gains /
(losses)
Carrying value
of securities with
gross unrealized
gains
Gross
unrealized
gains
Carrying value of
securities with
gross unrealized
losses
Gross
unrealized
losses
June 30, 2019
Shares 296 320 24 244 47 76 (24)
December 31, 2018
Shares 371 391 20 304 40 86 (20)
The composition of shares by industry sector in an unrealized loss position held by Aegon Americas and Aegon the Netherlands at June 30, 2019, and
December 31, 2018 is presented in the following table.
Unrealized losses on shares
Jun. 30, 2019 Dec. 31, 2018
EUR millions
Carrying value
of instruments
with unrealized
losses
Gross
unrealized
losses
Carrying value
of instruments
with unrealized
losses
Gross
unrealized
losses
Consumer 3 - - —
Financials 44 (11) 49 (15)
Other 29 (13) 37 (6)
Total 76 (24) 86 (20)
Unaudited Page 44
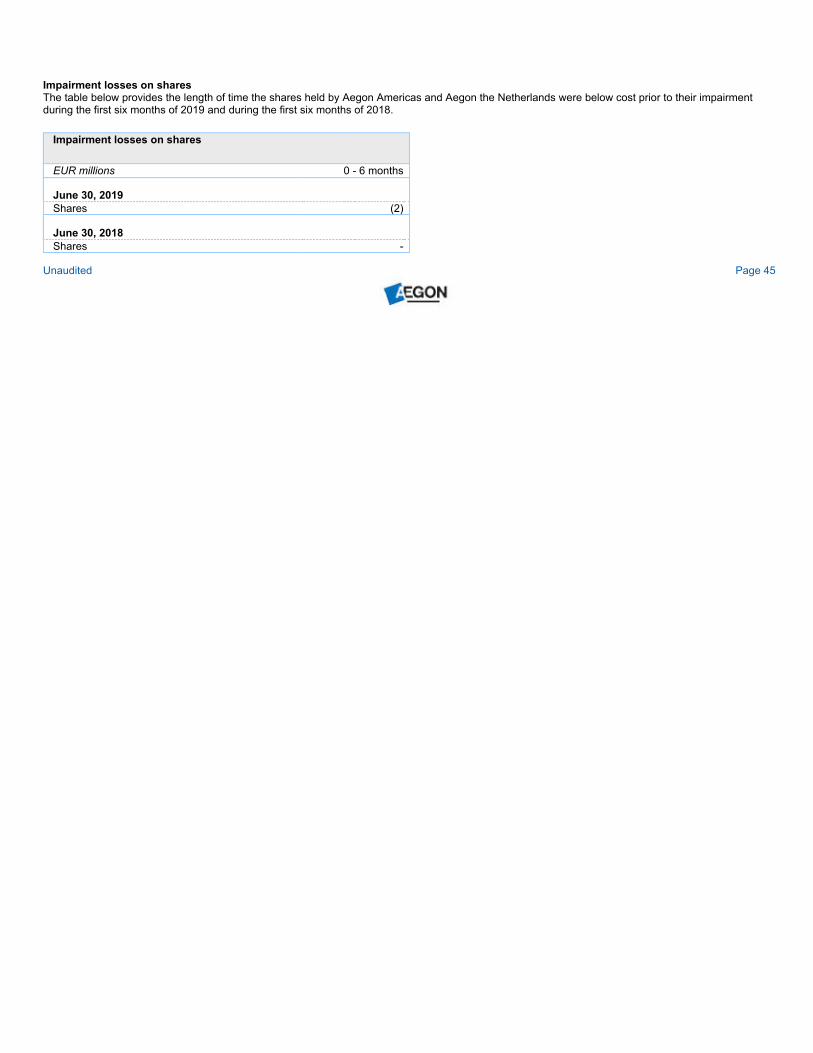
Impairment losses on shares
The table below provides the length of time the shares held by Aegon Americas and Aegon the Netherlands were below cost prior to their impairment
during the first six months of 2019 and during the first six months of 2018.
Impairment losses on shares
EUR millions 0 - 6 months
June 30, 2019
Shares (2)
June 30, 2018
Shares -
Unaudited Page 45
2.5 Results of Operations – first half 2019 compared with first half 2018
This report includes the non-IFRS financial measure: underlying earnings before tax. The reconciliation of this measure to the most comparable IFRS
measure is presented in the table below in addition to note 3 Segment information of the condensed consolidated interim financial statements of Aegon
N.V. (unaudited) included in Item 1. This non-IFRS measure is calculated by consolidating on a proportionate basis the revenues and expenses of
Aegon’s joint ventures in the Netherlands, Mexico, Spain, Portugal, China and Japan and Aegon’s associates in India, Brazil, the Netherlands, United
Kingdom and Mexico.
The table also includes the non-IFRS financial measure: net underlying earnings. This is the after-tax equivalent of underlying earnings before tax. The
reconciliation of net underlying earnings to the most comparable IFRS measure is presented in the following table.
Aegon’s senior management is compensated based in part on Aegon’s results against targets using the non-IFRS measures presented in this report.
While many other insurers in Aegon’s peer group present substantially similar non-IFRS measures, the non-IFRS measures presented in this document
may nevertheless differ from the non-IFRS measures presented by other insurers. There is no standardized meaning to these measures under IFRS or
any other recognized set of accounting standards and readers are cautioned to consider carefully the different ways in which Aegon and its peers present
similar information before making a comparison. Aegon believes the non-IFRS measures present within this report, when read together with Aegon’s
reported IFRS financial statements, provides meaningful supplemental information for the investing public about the underlying operating results of
Aegon’s businesses, including insight into the financial measures that senior management uses in managing the businesses. This enables them to
evaluate Aegon’s businesses after eliminating the impact of current IFRS accounting policies for financial instruments and insurance contracts, which
embed a number of accounting policy alternatives that companies may select in presenting their results (as companies may use different local generally
accepted accounting principles (GAAPs)), and this may make the comparability difficult between time periods.
Unaudited Page 46
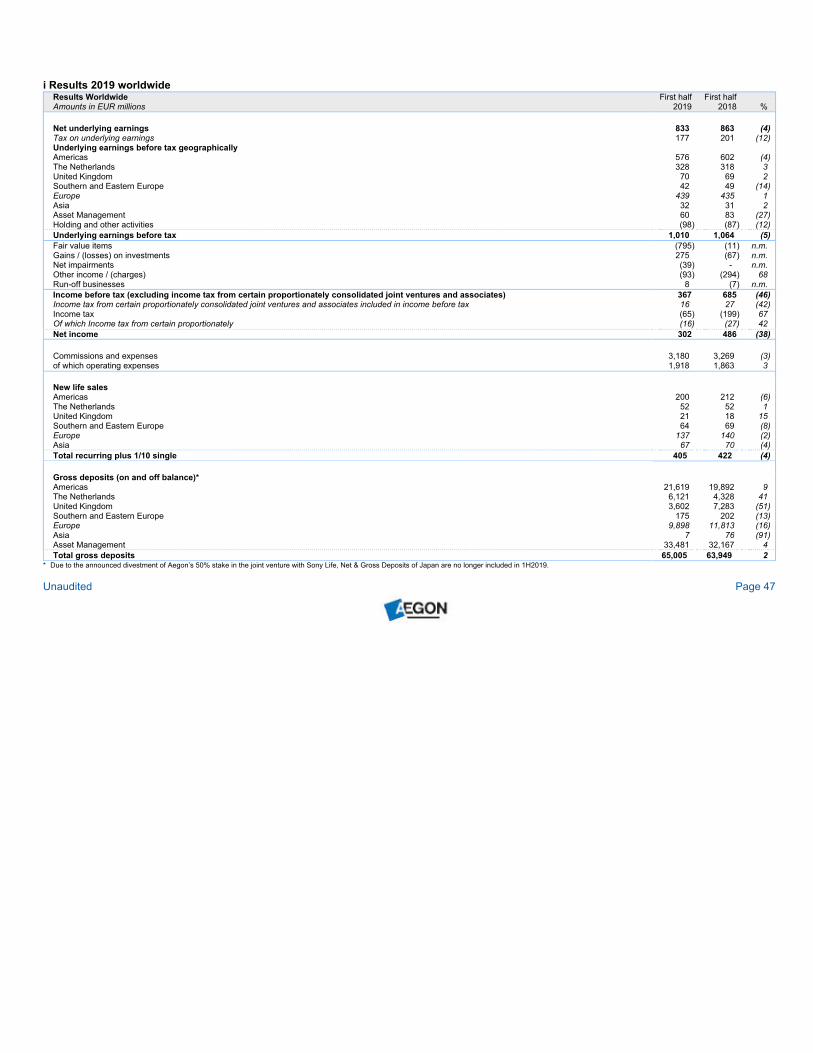
i Results 2019 worldwide
Results Worldwide First half First half
Amounts in EUR millions 2019 2018 %
Net underlying earnings 833 863 (4)
Tax on underlying earnings 177 201 (12)
Underlying earnings before tax geographically
Americas 576 602 (4)
The Netherlands 328 318 3
United Kingdom 70 69 2
Southern and Eastern Europe 42 49 (14)
Europe 439 435 1
Asia 32 31 2
Asset Management 60 83 (27)
Holding and other activities (98) (87) (12)
Underlying earnings before tax 1,010 1,064 (5)
Fair value items (795) (11) n.m.
Gains / (losses) on investments 275 (67) n.m.
Net impairments (39) - n.m.
Other income / (charges) (93) (294) 68
Run-off businesses 8 (7) n.m.
Income before tax (excluding income tax from certain proportionately consolidated joint ventures and associates) 367 685 (46)
Income tax from certain proportionately consolidated joint ventures and associates included in income before tax 16 27 (42)
Income tax (65) (199) 67
Of which Income tax from certain proportionately (16) (27) 42
Net income 302 486 (38)
Commissions and expenses 3,180 3,269 (3)
of which operating expenses 1,918 1,863 3
New life sales
Americas 200 212 (6)
The Netherlands 52 52 1
United Kingdom 21 18 15
Southern and Eastern Europe 64 69 (8)
Europe 137 140 (2)
Asia 67 70 (4)
Total recurring plus 1/10 single 405 422 (4)
Gross deposits (on and off balance)*
Americas 21,619 19,892 9
The Netherlands 6,121 4,328 41
United Kingdom 3,602 7,283 (51)
Southern and Eastern Europe 175 202 (13)
Europe 9,898 11,813 (16)
Asia 7 76 (91)
Asset Management 33,481 32,167 4
Total gross deposits 65,005 63,949 2
* Due to the announced divestment of Aegon’s 50% stake in the joint venture with Sony Life, Net & Gross Deposits of Japan are no longer included in 1H2019.
Unaudited Page 47
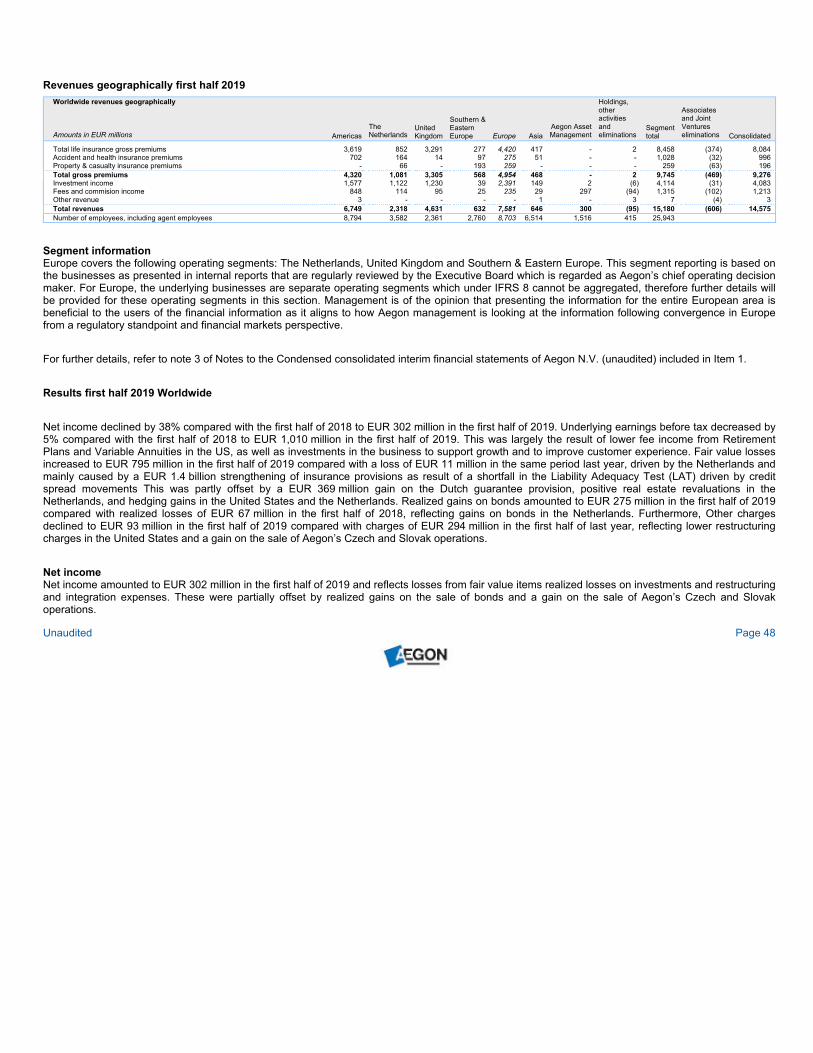
Revenues geographically first half 2019
Worldwide revenues geographically
Amounts in EUR millions Americas
The
Netherlands
United
Kingdom
Southern &
Eastern
Europe Europe Asia
Aegon Asset
Management
Holdings,
other
activities
and
eliminations
Segment
total
Associates
and Joint
Ventures
eliminations Consolidated
Total life insurance gross premiums 3,619 852 3,291 277 4,420 417 - 2 8,458 (374) 8,084
Accident and health insurance premiums 702 164 14 97 275 51 - - 1,028 (32) 996
Property & casualty insurance premiums - 66 - 193 259 - - - 259 (63) 196
Total gross premiums 4,320 1,081 3,305 568 4,954 468 - 2 9,745 (469) 9,276
Investment income 1,577 1,122 1,230 39 2,391 149 2 (6) 4,114 (31) 4,083
Fees and commision income 848 114 95 25 235 29 297 (94) 1,315 (102) 1,213
Other revenue 3 - - - - 1 - 3 7 (4) 3
Total revenues 6,749 2,318 4,631 632 7,581 646 300 (95) 15,180 (606) 14,575
Number of employees, including agent employees 8,794 3,582 2,361 2,760 8,703 6,514 1,516 415 25,943
Segment information
Europe covers the following operating segments: The Netherlands, United Kingdom and Southern & Eastern Europe. This segment reporting is based on
the businesses as presented in internal reports that are regularly reviewed by the Executive Board which is regarded as Aegon’s chief operating decision
maker. For Europe, the underlying businesses are separate operating segments which under IFRS 8 cannot be aggregated, therefore further details will
be provided for these operating segments in this section. Management is of the opinion that presenting the information for the entire European area is
beneficial to the users of the financial information as it aligns to how Aegon management is looking at the information following convergence in Europe
from a regulatory standpoint and financial markets perspective.
For further details, refer to note 3 of Notes to the Condensed consolidated interim financial statements of Aegon N.V. (unaudited) included in Item 1.
Results first half 2019 Worldwide
Net income declined by 38% compared with the first half of 2018 to EUR 302 million in the first half of 2019. Underlying earnings before tax decreased by
5% compared with the first half of 2018 to EUR 1,010 million in the first half of 2019. This was largely the result of lower fee income from Retirement
Plans and Variable Annuities in the US, as well as investments in the business to support growth and to improve customer experience. Fair value losses
increased to EUR 795 million in the first half of 2019 compared with a loss of EUR 11 million in the same period last year, driven by the Netherlands and
mainly caused by a EUR 1.4 billion strengthening of insurance provisions as result of a shortfall in the Liability Adequacy Test (LAT) driven by credit
spread movements This was partly offset by a EUR 369 million gain on the Dutch guarantee provision, positive real estate revaluations in the
Netherlands, and hedging gains in the United States and the Netherlands. Realized gains on bonds amounted to EUR 275 million in the first half of 2019
compared with realized losses of EUR 67 million in the first half of 2018, reflecting gains on bonds in the Netherlands. Furthermore, Other charges
declined to EUR 93 million in the first half of 2019 compared with charges of EUR 294 million in the first half of last year, reflecting lower restructuring
charges in the United States and a gain on the sale of Aegon’s Czech and Slovak operations.
Net income
Net income amounted to EUR 302 million in the first half of 2019 and reflects losses from fair value items realized losses on investments and restructuring
and integration expenses. These were partially offset by realized gains on the sale of bonds and a gain on the sale of Aegon’s Czech and Slovak
operations.
Unaudited Page 48
Underlying earnings before tax
Aegon’s underlying earnings before tax decreased by 5% compared with the first half of 2018 to EUR 1,010 million in the first half of 2019. Excluding
favorable currency movements, underlying earnings before tax decreased by 9% compared with the first half of 2018. This was largely the result of lower
fee income from Retirement Plans and Variable Annuities in the US, as well as investments in the business to support growth and to improve customer
experience. Furthermore, Asset Management recorded lower performance fees compared with the first half of 2018, while the loss in the Holding
increased compared with the first half of 2018 as more interest expenses were reported through the profit & loss account instead of directly through
shareholders’ equity.
- Underlying earnings before tax from the Americas decreased by 4% compared with the same period in 2018 to EUR 576 million in the first half of
2019. Excluding favorable currency effects, underlying earnings before tax declined by 11% compared with the same period in 2018, mainly caused
by lower fee income in Retirement Plans and Variable Annuities from lower average asset balances. Furthermore, expenses increased as a result
of investments to support growth and improve customer experience. This was partly offset by better claims experience in Life, higher underlying
earnings before tax in Fixed Annuities and EUR 23 million higher one-time benefits in Accident & Health.
- Underlying earnings before tax from Aegon’s operations in Europe increased by 1% compared with the first half of last year to EUR 439 million in
the first half of 2019. This was driven by higher investment results in the Netherlands, supported by a shift to higher-yielding assets, as well as
higher Digital Solutions underlying earnings before tax in the UK, reflecting higher average asset balances. This was largely offset by lower
underlying earnings before tax in Southern and Eastern Europe (SEE) caused by the loss of underlying earnings before tax due to the sale of the
Czech and Slovak operations. Furthermore, non-life underlying earnings before tax in the Netherlands declined compared with the first half of 2018
due to lower disability provision releases.
- Aegon’s underlying earnings before tax in Asia increased by 2% compared with the first half of last year to EUR 32 million in the first half of 2019.
Excluding favorable currency movements, underlying earnings before tax decreased by 5% compared with the first half of last year, caused by the
High-Net-Worth (HNW) business due to lower interest rates. This was largely offset by better underlying earnings before tax from the strategic
partnerships in China, driven by business growth and favorable persistency, and in India, reflecting lower investment in new business in the
traditional channel as the business pivots towards digital channels.
- Underlying earnings before tax from Aegon Asset Management were down by 27% compared with the first six months of last year to EUR 60 million
in the first half of 2019. This decrease was largely the result of lower performance fees in Aegon’s Chinese asset management joint venture Aegon
Industrial Fund Management Company (AIFMC), which were exceptionally high last year. Furthermore, underlying earnings before tax in Europe
declined compared with the first six months of last year, mainly due to outflows in the United Kingdom.
- The underlying earnings before tax from the Holding declined compared with the same period last year to a loss of EUR 98 million in the first half of
2019, mainly as a result of interest expenses on USD 800 million Tier 2 securities issued in April 2018 to replace perpetual securities. Interest
expenses for these Tier 2 securities are reported through the P&L, while the interest expenses for the perpetuals were recognized directly through
equity.
Unaudited Page 49
Fair value items
The loss from fair value items amounted to EUR 795 million in the first half of 2019.
Fair value losses in the Netherlands were EUR 859 million in the first half of 2019, caused by a EUR 1.4 billion strengthening of insurance provisions as
result of a shortfall in the Liability Adequacy Test (LAT) driven by credit spread movements. The LAT assesses the adequacy of the insurance technical
provisions by comparing their fair value with the IFRS carrying amount of the insurance liabilities. Aegon the Netherlands adjusts the outcome of the LAT
for certain unrealized gains and the difference between the fair value and the book value of those assets measured at amortized cost, mainly residential
mortgages. In the first half of 2019, mortgage spreads widened as a result of the drop in risk-free interest rates. This decreased the value of Aegon’s
mortgage portfolio, while unrealized gains on the value of the bond portfolio reduced through the sale of bonds to optimize the investment portfolio in the
Netherlands. In addition, the reduction in liquidity premium increased the value of IFRS insurance liabilities. The LAT shortfall was partially offset by EUR
484 million fair value gains on hedges and a gain on the guarantee provision of EUR 369 million both mainly driven by lower interest rates. Furthermore,
fair value items included EUR 100 million positive real estate revaluations.
Fair value gains of EUR 157 million in the Americas in the first half of 2019 were driven by gains on the macro hedge net of reserve movements.
Fair value losses in the United Kingdom amounted to EUR 76 million in the first half of 2019 and were mainly due to negative fair value movements on
equity hedges following rising equity markets.
Realized gains on investments
Realized gains on investments totaled EUR 275 million in the first half of 2019, reflecting by EUR 224 million gains on the sale of bonds to optimize the
investment portfolio in the Netherlands.
Net impairments
Net impairments were EUR 39 million in the first half of 2019, predominantly caused by the impairment of corporate bonds resulting from bankruptcy
filings in the United States.
Other charges
Other charges of EUR 93 million in the first half of 2019 were driven by EUR 64 million model & assumption changes, mainly in the United States, EUR
72 million restructuring expenses in the United Kingdom and the United States, including the wind down of the Akaan Transamerica joint venture in
Mexico, as well as EUR 41 million IFRS 9 / 17 implementation expenses. These were partly offset by a EUR 70 million gain on the sale of Aegon’s Czech
and Slovak operations and a EUR 21 million gain resulting from the restructuring of financing agreements related to the merger of two reinsurance
captives in the United States.
Run-off businesses
The result from run-off businesses amounted to a profit of EUR 8 million in the first half of 2019, driven by higher results on the retained individual life
reinsurance business, which can be volatile.
Income tax
Income tax amounted to a charge of EUR 65 million in the first half of 2019, while income before tax was EUR 367 million in the first half of 2019,
resulting in an effective tax rate on net income of 17.8% for the first half of 2019. The effective tax rate reflects the tax exempt gain on the divestment of
Aegon’s Czech and Slovak operations, and tax exempt income and the use of tax credits in the United States.
Unaudited Page 50
Commissions and expenses
Commissions and expenses decreased by 3%, compared with the first half of 2018, to EUR 3.2 billion in the first six months of 2019 as lower
commissions were partly offset by higher operating expenses Operating expenses increased by 3% to EUR 1,918 million in the first half of 2019
compared with the first half of 2018, but were flat on a constant currency basis. This reflects investments to support growth and improve customer
experience in the United States, the acquisition of Robidus in the Netherlands, and higher IFRS 9 / 17 implementation expenses. These were offset by
lower restructuring expenses in the United States and the divestment of Aegon’s Czech, Slovak and Irish operations.
Production
Gross deposits increased by 2% compared with the first six months of 2018 to EUR 65 billion in the first half of 2019, and were essentially stable
excluding favorable currency movements, as higher deposits in the Americas, the Netherlands and Asset Management were offset by lower deposits in
the United Kingdom. Gross deposits in the Americas increased by 9% in the first half of 2019 compared with the first half of 2018, and 1% on constant
currencies, driven by higher takeover deposits in Retirement Plans, higher Variable Annuity deposits reflecting product enhancements, as well as
increased fixed indexed annuity sales. Asset Management’s gross deposits rose 4% in the first half of 2019 compared with the same period last year,
driven by AIFMC, Aegon’s joint venture in China. In the Netherlands gross deposits increased by 41%, driven by continued momentum at Aegon’s
Premium Pension Institution (PPI) and online bank Knab. The 51% decline in the United Kingdom in the first half of 2019 compared with the first half of
2018 was mainly the result of lower institutional platform flows, which have a low margin.
Net outflows amounted to EUR 2.7 billion for the first half of 2019 due to EUR 3.5 billion net outflows in the United States, mainly due to contract
discontinuances in Retirement Plans. Variable Annuities and Fixed Annuities also recorded outflows, as these businesses mature. Furthermore, the
United Kingdom had net outflows of EUR 2.8 billion, following lower gross deposits. This was partly offset by EUR 3.2 billion external third-party net
inflows at Asset Management, driven by new mandates at AIFMC.
New life sales declined by 4% compared with the first half of 2018 to EUR 405 million in the first half of 2019, as a result of lower term life, universal life
and whole life sales in the United States and lower sales in the Asian HNW business. The latter was impacted by macro uncertainties and a shift of the
market towards whole life type products.
New premium production for accident & health insurance decreased by 45% compared with the first half of 2018 to EUR 117 million in the first half of
2019. This was predominantly caused by lower sales in the travel insurance, affinity and stop loss segments in the United States, which resulted from the
previously announced strategic decision to exit these segments. Furthermore, workplace voluntary benefits sales declined. New premium production for
property & casualty insurance increased by 7% compared with the same period in 2018 to EUR 65 million in the first half of 2019, driven by Hungary.
Capital management
Shareholders’ equity increased by EUR 1.6 billion to EUR 20.8 billion on June 30, 2019 compared with year-end 2018, primarily driven by higher
revaluation reserves as a result of lower interest rates and tightening credit spreads. Shareholders’ equity excluding revaluation reserves on June 30,
2019 decreased by EUR 0.2 billion compared with year-end 2018 to EUR 15.5 billion – or EUR 7.46 per common share – at the end of the first half 2019.
Net income more than offset dividends paid to shareholders and the impact of adverse market movements on defined benefit obligations.
Unaudited Page 51
The gross financial leverage ratio increased by 10 basis points compared with year-end 2018 to 29.3% in the first half of 2019, which is within Aegon’s 26
– 30% target range. In the first half of 2019, Aegon successfully issued EUR 500 million Restricted Tier 1 perpetual contingent convertible securities, with
a fixed coupon of 5.625%. The proceeds thereof were used to redeem USD 500 million grandfathered Tier 1 securities with a coupon of 6.5%. This
resulted in a slight increase in leverage, which more than offset higher shareholders’ equity excluding revaluation reserves.
Solvency II ratio
Despite a decrease of Aegon’s Group Solvency II ratio from 211% to 197% during the first half of 2019, the ratio was at the upper end of the target zone
of 150 – 200%. The ratio decreased, as normalized capital generation was more than offset by payment of the final 2018 dividend, adverse market
impacts, and one-time items, including model & assumption changes in Asia.
The estimated RBC ratio in the United States increased to 472% on June 30, 2019, from 465% on December 31, 2018, and remained well above the
bottom-end of the target range of 350%. The increase mainly resulted from retained capital generation and favorable one-time items. Market impacts
were on balance slightly adverse, as the benefit from higher equity markets was more than offset by the impact from lower interest rates.
The estimated Solvency II ratio in the Netherlands decreased to 152% on June 30, 2019, from 181% on December 31, 2018 mainly driven by adverse
market impacts. Negative market impacts of -38%-points resulted from adverse credit spread movements on both assets and insurance liabilities. Aegon
expects a significant part of these market impacts to reverse over time. The widening of credit spreads on mortgages was driven by the drop in risk-free
interest rates while customer mortgage rates hardly moved, and resulted in a decrease in the value of Aegon’s mortgage portfolio. In Aegon’s view, this
development is not a reflection of deterioration of credit quality in the portfolio. At the same time, credit spreads on bonds tightened and led to a 15 basis
points reduction of the EIOPA (European Insurance and Occupational Pensions Authority) volatility adjustment from 24 to 9 basis points. This resulted in
a lower discount rate for Aegon’s insurance liabilities and a corresponding reduction of the Solvency II ratio.
After discussions with Dutch Central Bank, illiquid investments are now treated as equities under the standard formula instead of as loans under the
internal model. This resulted in a significant increase in required capital and reduced the Solvency II ratio of Aegon the Netherlands by 8%-points.
Furthermore, the lowering of the UFR had an adverse impact of 4% points. Management actions contributed positively to the Solvency II ratio of Aegon
the Netherlands and consisted mainly of the benefit from the merger between Aegon Leven and Optas as well as the optimization of the investment
portfolio, including the sale of bonds. In line with its peers and consistent with the calculation of Aegon’s Group Solvency II ratio, Aegon Bank has been
removed from the calculation of the Solvency II ratio of Aegon the Netherlands, which had a positive impact of 3%-points on the unit’s ratio. Furthermore,
management actions had a positive impact of 9%-points on the Solvency II ratio of Aegon the Netherlands.
As previously announced, Aegon reviewed its Solvency II target zone for the Netherlands following a change to the modeling of the dynamic volatility
adjustment in the second half of 2018. This model change was made to align with EIOPA guidance, and resulted in increased credit sensitivities for
Aegon the Netherlands. As a result, management decided to increase the bottom end of the target range from 150% to 155%.
Unaudited Page 52
The estimated Solvency II ratio in the United Kingdom decreased to 165% on June 30, 2019, from 184% on December 31, 2018, and remained well
above the bottom-end of the target range of 145%. The decrease was mainly driven by GBP 160 million remittances to the Holding, including an
extraordinary dividend of GBP 100 million on the back of Aegon UK’s solid and resilient capital positon. Adverse market impacts were mainly caused by
tightening credit spreads, which led to a lower discount rate for the own employee pension plan.
Dividends from and capital contributions to business units
Aegon received EUR 765 million in gross remittances from subsidiaries in the first half of 2019, of which EUR 397 million came from the Americas, EUR
344 million from Europe and EUR 24 million from Asset Management. This included an extraordinary dividend from the United Kingdom of EUR
112 million and EUR 131 million proceeds from the divestment of Aegon’s activities in the Czech Republic and Slovakia. Aegon the Netherlands retained
its planned remittance over the first half of the year, as the unit is currently below its Solvency II target zone. Aegon the Netherlands intends to resume
remittances once it returns to its target zone.
Capital injections of EUR 142 million in the first half of 2019, primarily related to investments in business growth. Aegon Bank received capital of EUR
45 million to fund increased capital requirements as a result of a shift to consumer and small business loans, as well as overall balance sheet growth.
Other capital injections in Europe of EUR 45 million mainly related to Aegon’s own business in Spain and Turkey. Capital injections related to digital
distribution initiatives in Asia amounted to EUR 29 million, while those in the variable annuity joint ventures in Japan were EUR 24 million. As part of the
sale of Aegon’s 50% stake in these joint ventures, which was announced on May 17, 2019, it was agreed that the purchase price will be increased for
EUR 22 million of capital injections.
Unaudited Page 53
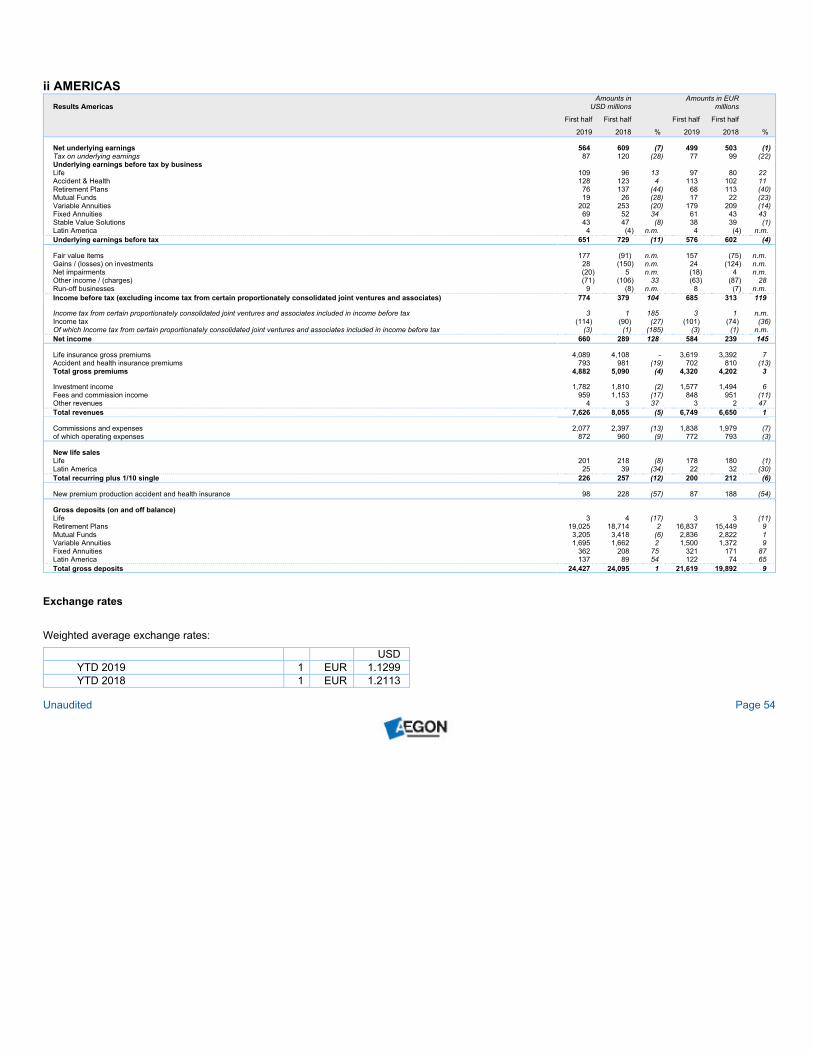
ii AMERICAS
Results Americas
Amounts in
USD millions
Amounts in EUR
millions
First half First half First half First half
2019 2018 % 2019 2018 %
Net underlying earnings 564 609 (7) 499 503 (1)
Tax on underlying earnings 87 120 (28) 77 99 (22)
Underlying earnings before tax by business
Life 109 96 13 97 80 22
Accident & Health 128 123 4 113 102 11
Retirement Plans 76 137 (44) 68 113 (40)
Mutual Funds 19 26 (28) 17 22 (23)
Variable Annuities 202 253 (20) 179 209 (14)
Fixed Annuities 69 52 34 61 43 43
Stable Value Solutions 43 47 (8) 38 39 (1)
Latin America 4 (4) n.m. 4 (4) n.m.
Underlying earnings before tax 651 729 (11) 576 602 (4)
Fair value items 177 (91) n.m. 157 (75) n.m.
Gains / (losses) on investments 28 (150) n.m. 24 (124) n.m.
Net impairments (20) 5 n.m. (18) 4 n.m.
Other income / (charges) (71) (106) 33 (63) (87) 28
Run-off businesses 9 (8) n.m. 8 (7) n.m.
Income before tax (excluding income tax from certain proportionately consolidated joint ventures and associates) 774 379 104 685 313 119
Income tax from certain proportionately consolidated joint ventures and associates included in income before tax 3 1 185 3 1 n.m.
Income tax (114) (90) (27) (101) (74) (36)
Of which Income tax from certain proportionately consolidated joint ventures and associates included in income before tax (3) (1) (185) (3) (1) n.m.
Net income 660 289 128 584 239 145
Life insurance gross premiums 4,089 4,108 - 3,619 3,392 7
Accident and health insurance premiums 793 981 (19) 702 810 (13)
Total gross premiums 4,882 5,090 (4) 4,320 4,202 3
Investment income 1,782 1,810 (2) 1,577 1,494 6
Fees and commission income 959 1,153 (17) 848 951 (11)
Other revenues 4 3 37 3 2 47
Total revenues 7,626 8,055 (5) 6,749 6,650 1
Commissions and expenses 2,077 2,397 (13) 1,838 1,979 (7)
of which operating expenses 872 960 (9) 772 793 (3)
New life sales
Life 201 218 (8) 178 180 (1)
Latin America 25 39 (34) 22 32 (30)
Total recurring plus 1/10 single 226 257 (12) 200 212 (6)
New premium production accident and health insurance 98 228 (57) 87 188 (54)
Gross deposits (on and off balance)
Life 3 4 (17) 3 3 (11)
Retirement Plans 19,025 18,714 2 16,837 15,449 9
Mutual Funds 3,205 3,418 (6) 2,836 2,822 1
Variable Annuities 1,695 1,662 2 1,500 1,372 9
Fixed Annuities 362 208 75 321 171 87
Latin America 137 89 54 122 74 65
Total gross deposits 24,427 24,095 1 21,619 19,892 9
Exchange rates
Weighted average exchange rates:
USD
YTD 2019 1 EUR 1.1299
YTD 2018 1 EUR 1.2113
Unaudited Page 54
Net income
Net income from Aegon’s businesses in the Americas increased by USD 371 million to USD 660 million in the first half of 2019 compared with the first half
of 2018. A decrease in underlying earnings before tax was more than offset by improved fair value items and realized gains.
The results from fair value items in the first half of 2019 amounted to a profit of USD 177 million.
- The gain on fair value hedges without an accounting match under IFRS was USD 174 million, driven by gains on the macro hedge net of reserve
movements reflecting favorable equity markets.
- The result on fair value hedges with an accounting match amounted to a loss of USD 24 million, mainly caused by credit spread tightening.
- The results on fair value investments amounted to a profit of USD 27 million, mainly from the impact of credit spreads on derivatives.
Realized gains on investments of USD 28 million in the first half of 2019 resulted from normal trading activity. Net impairments amounted to USD
20 million in the first half of 2019, reflecting impairments of corporate bonds resulting from bankruptcy filings. The run-off businesses increased to a profit
of USD 9 million in the first half of 2019 compared with the same period last year, driven by higher results on the retained individual life reinsurance
business, which can be volatile.
Other charges of USD 71 million in the first half of 2019 were mainly caused by model and assumption changes of USD 80 million. These mainly related
to charges for surrender, lapse and mortality updates in Life, partly offset by gains driven by updates to variable annuity and indexed universal life model
and assumptions. Other charges also included USD 16 million restructuring charges related to the TCS partnership and the decision to exit the Akaan
Transamerica joint venture in Mexico. These were partly offset by a USD 24 million gain resulting from the restructuring of financing agreements related
to the merger of two reinsurance captives.
Income tax expenses in the first half of 2019 amounted to USD 114 million or a 15% effective tax rate. This is below the statutory rate of 21% due to tax
exempt income and the use of tax credits.
Underlying earnings before tax
Underlying earnings before tax from the Americas decreased by 11% compared with the first half of 2018 to USD 651 million in the first half of 2019,
largely due to lower fee income in Retirement Plans and Variable Annuities, as well as investments in the business to support growth and improve
customer experience. This was partly offset by better claims experience in Life and higher underlying earnings before tax in Fixed Annuities.
- Life underlying earnings before tax increased by 13% compared with the first half of 2018 to USD 109 million in the first half of 2019, driven by
better persistency and mortality experience. Adverse persistency experience in the first half of 2019 was USD 23 million compared with USD
55 million in the same period last year, while adverse mortality experience was USD 57 million this half year versus USD 67 million in the first half
of 2018. This was partially offset by the one-time impact from lower interest rates on intangibles and higher expenses to support growth and
improve customer experience.
- Underlying earnings before tax from Accident & Health increased by 4% compared with the first half of 2018 to USD 128 million in the first half of
2019, as one-time benefits increased by USD 26 million, related to reserve releases for paid-up Long-Term Care policies where the insured was
found to be deceased. This was partly offset by the impact of product exits in travel, affinity and stop loss insurance.
Unaudited Page 55
- Underlying earnings before tax from Retirement Plans decreased by 44% compared with the first six months of 2018 to USD 76 million in the first
half of 2019. This was caused by higher operating expenses to support growth and improve the Workplace experience, lower fee income from
lower average asset balances, and a lower investment margin.
- Mutual Funds underlying earnings before tax decreased by 28% compared with the first half of 2018 to USD 19 million in the first half of 2019, as a
result of lower fee income from lower balances and lower margins, as well as higher operating expenses.
- Underlying earnings before tax from Variable Annuities amounted to USD 202 million in the first half of 2019, a decrease of 20% compared with the
same period last year, primarily caused by lower fee income from lower average balances.
- Underlying earnings before tax from Fixed Annuities increased by 34% compared with the first half of 2018 to USD 69 million in the first half of
2019, driven by favorable intangible adjustments and improved persistency, both driven by lower interest rates.
- Stable Value Solutions underlying earnings before tax declined by 8% compared with the first half of 2018 to USD 43 million in the first half of 2019,
caused by margin pressure.
- Underlying earnings before tax from Latin America increased by USD 8 million compared with the first half of 2018 to USD 4 million in the first half
of 2019, reflecting growth from the Aegon Mongeral joint venture in Brazil and the strategic decision to wind down the loss-making Akaan
Transamerica joint venture in Mexico.
Operating expenses
Operating expenses decreased by 9% compared with the first half of 2018 to USD 872 million in the first six months of 2019, as restructuring expenses
related to the TCS partnership were USD 100 million lower than in the same period last year. This was partly offset by investments to support growth and
improve customer experience.
Sales and deposits
Gross deposits amounted to USD 24.4 billion in the first half of 2019, an increase by 1% compared with the same period last year. Deposits in Retirement
Plans rose by 2% compared with the first half of 2018 to USD 19.0 billion in the first half of 2019, due to higher takeover deposits and growth through the
Advice Center. Deposits in Fixed Annuities increased by 75% compared with the first half of 2018 to USD 0.4 billion in the first half of this year, as a result
of higher fixed indexed annuity sales, reflecting product enhancements and a new distribution partnership. Gross deposits in Variable Annuities were up
by 2% compared with the first half of 2018 to USD 1.7 billion in the first half of 2019, driven by product enhancements.
Total net outflows amounted to USD 4.4 billion in the first half of 2019. Net outflows in Retirement Plans totaled USD 1.7 billion for the first half of 2019,
mainly caused by contract discontinuances of USD 7.7 billion, and increased participant withdrawals. Net outflows in Variable Annuities amounted to USD
1.5 billion in the first half of 2019, due to surrenders as the business matures. Net outflows in Mutual Funds of USD 0.2 billion in the first six months of
2019 were the result of increased withdrawals from equity and bonds funds, reflecting market volatility. Fixed Annuities experienced net outflows of USD
0.6 billion in the first half of 2019 as the traditional book matures.
Unaudited Page 56

New life sales were down by 12% to USD 226 million in the first half of 2019 compared with the first half of 2018, mainly caused by lower term life,
universal life and whole life sales. Indexed universal life sales were stable.
New premium production for Accident & Health insurance declined by 57% compared with the same period last year to USD 98 million in the first half of
2019, as a result of the previously announced strategic decision to exit the travel insurance, affinity and stop loss insurance segments, and lower
workplace voluntary benefits sales.
Unaudited Page 57
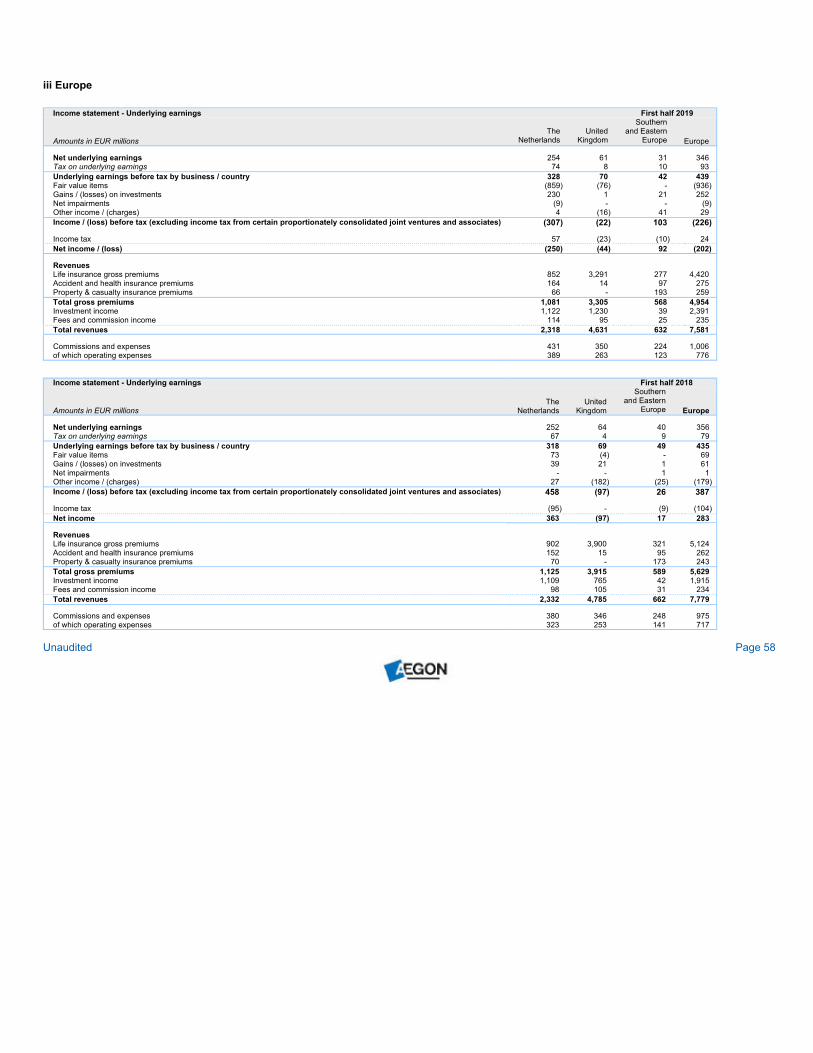
iii Europe
Income statement - Underlying earnings First half 2019
Amounts in EUR millions
The
Netherlands
United
Kingdom
Southern
and Eastern
Europe Europe
Net underlying earnings 254 61 31 346
Tax on underlying earnings 74 8 10 93
Underlying earnings before tax by business / country 328 70 42 439
Fair value items (859) (76) - (936)
Gains / (losses) on investments 230 1 21 252
Net impairments (9) - - (9)
Other income / (charges) 4 (16) 41 29
Income / (loss) before tax (excluding income tax from certain proportionately consolidated joint ventures and associates) (307) (22) 103 (226)
Income tax 57 (23) (10) 24
Net income / (loss) (250) (44) 92 (202)
Revenues
Life insurance gross premiums 852 3,291 277 4,420
Accident and health insurance premiums 164 14 97 275
Property & casualty insurance premiums 66 - 193 259
Total gross premiums 1,081 3,305 568 4,954
Investment income 1,122 1,230 39 2,391
Fees and commission income 114 95 25 235
Total revenues 2,318 4,631 632 7,581
Commissions and expenses 431 350 224 1,006
of which operating expenses 389 263 123 776
Income statement - Underlying earnings First half 2018
Amounts in EUR millions
The
Netherlands
United
Kingdom
Southern
and Eastern
Europe Europe
Net underlying earnings 252 64 40 356
Tax on underlying earnings 67 4 9 79
Underlying earnings before tax by business / country 318 69 49 435
Fair value items 73 (4) - 69
Gains / (losses) on investments 39 21 1 61
Net impairments - - 1 1
Other income / (charges) 27 (182) (25) (179)
Income / (loss) before tax (excluding income tax from certain proportionately consolidated joint ventures and associates) 458 (97) 26 387
Income tax (95) - (9) (104)
Net income 363 (97) 17 283
Revenues
Life insurance gross premiums 902 3,900 321 5,124
Accident and health insurance premiums 152 15 95 262
Property & casualty insurance premiums 70 - 173 243
Total gross premiums 1,125 3,915 589 5,629
Investment income 1,109 765 42 1,915
Fees and commission income 98 105 31 234
Total revenues 2,332 4,785 662 7,779
Commissions and expenses 380 346 248 975
of which operating expenses 323 253 141 717
Unaudited Page 58
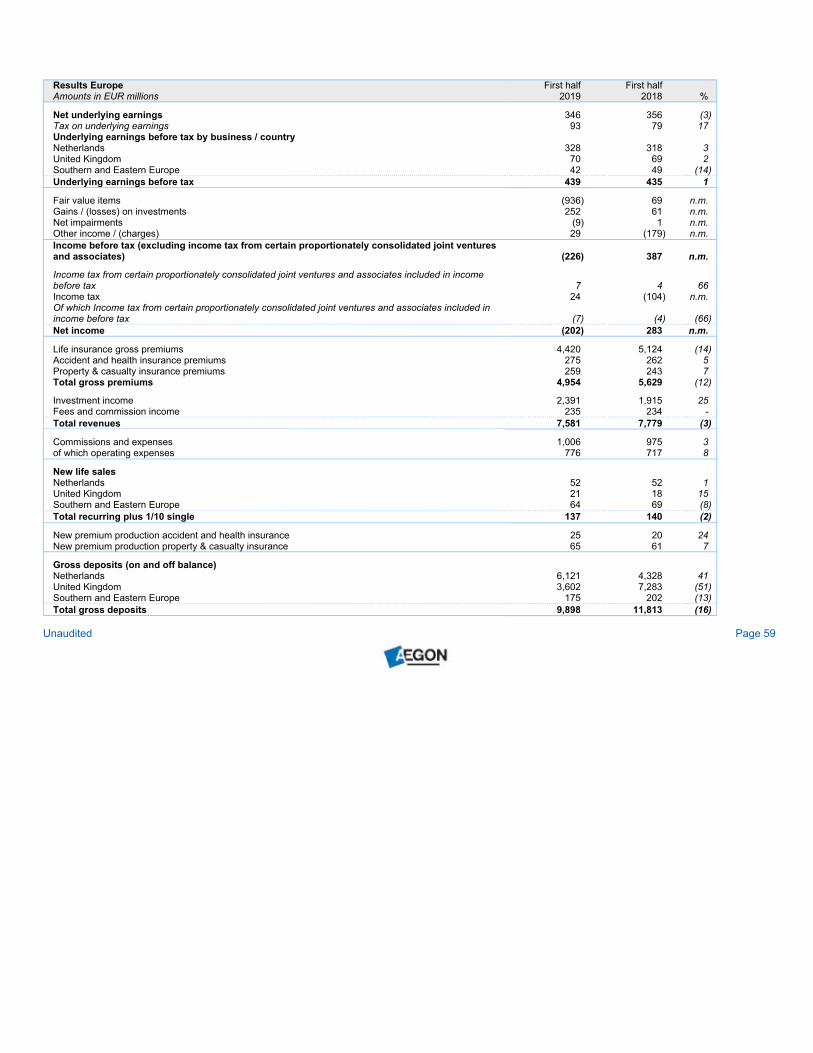
Results Europe First half First half
Amounts in EUR millions 2019 2018 %
Net underlying earnings 346 356 (3)
Tax on underlying earnings 93 79 17
Underlying earnings before tax by business / country
Netherlands 328 318 3
United Kingdom 70 69 2
Southern and Eastern Europe 42 49 (14)
Underlying earnings before tax 439 435 1
Fair value items (936) 69 n.m.
Gains / (losses) on investments 252 61 n.m.
Net impairments (9) 1 n.m.
Other income / (charges) 29 (179) n.m.
Income before tax (excluding income tax from certain proportionately consolidated joint ventures
and associates) (226) 387 n.m.
Income tax from certain proportionately consolidated joint ventures and associates included in income
before tax 7 4 66
Income tax 24 (104) n.m.
Of which Income tax from certain proportionately consolidated joint ventures and associates included in
income before tax (7) (4) (66)
Net income (202) 283 n.m.
Life insurance gross premiums 4,420 5,124 (14)
Accident and health insurance premiums 275 262 5
Property & casualty insurance premiums 259 243 7
Total gross premiums 4,954 5,629 (12)
Investment income 2,391 1,915 25
Fees and commission income 235 234 -
Total revenues 7,581 7,779 (3)
Commissions and expenses 1,006 975 3
of which operating expenses 776 717 8
New life sales
Netherlands 52 52 1
United Kingdom 21 18 15
Southern and Eastern Europe 64 69 (8)
Total recurring plus 1/10 single 137 140 (2)
New premium production accident and health insurance 25 20 24
New premium production property & casualty insurance 65 61 7
Gross deposits (on and off balance)
Netherlands 6,121 4,328 41
United Kingdom 3,602 7,283 (51)
Southern and Eastern Europe 175 202 (13)
Total gross deposits 9,898 11,813 (16)
Unaudited Page 59
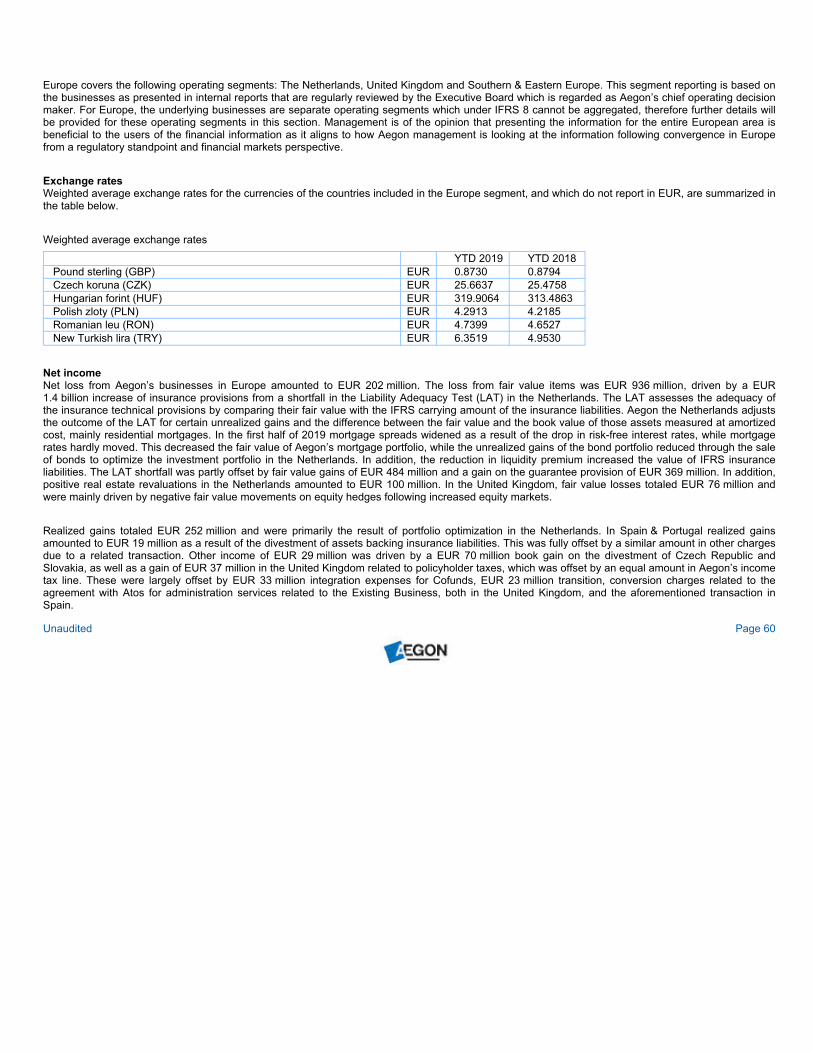
Europe covers the following operating segments: The Netherlands, United Kingdom and Southern & Eastern Europe. This segment reporting is based on
the businesses as presented in internal reports that are regularly reviewed by the Executive Board which is regarded as Aegon’s chief operating decision
maker. For Europe, the underlying businesses are separate operating segments which under IFRS 8 cannot be aggregated, therefore further details will
be provided for these operating segments in this section. Management is of the opinion that presenting the information for the entire European area is
beneficial to the users of the financial information as it aligns to how Aegon management is looking at the information following convergence in Europe
from a regulatory standpoint and financial markets perspective.
Exchange rates
Weighted average exchange rates for the currencies of the countries included in the Europe segment, and which do not report in EUR, are summarized in
the table below.
Weighted average exchange rates
YTD 2019 YTD 2018
Pound sterling (GBP) EUR 0.8730 0.8794
Czech koruna (CZK) EUR 25.6637 25.4758
Hungarian forint (HUF) EUR 319.9064 313.4863
Polish zloty (PLN) EUR 4.2913 4.2185
Romanian leu (RON) EUR 4.7399 4.6527
New Turkish lira (TRY) EUR 6.3519 4.9530
Net income
Net loss from Aegon’s businesses in Europe amounted to EUR 202 million. The loss from fair value items was EUR 936 million, driven by a EUR
1.4 billion increase of insurance provisions from a shortfall in the Liability Adequacy Test (LAT) in the Netherlands. The LAT assesses the adequacy of
the insurance technical provisions by comparing their fair value with the IFRS carrying amount of the insurance liabilities. Aegon the Netherlands adjusts
the outcome of the LAT for certain unrealized gains and the difference between the fair value and the book value of those assets measured at amortized
cost, mainly residential mortgages. In the first half of 2019 mortgage spreads widened as a result of the drop in risk-free interest rates, while mortgage
rates hardly moved. This decreased the fair value of Aegon’s mortgage portfolio, while the unrealized gains of the bond portfolio reduced through the sale
of bonds to optimize the investment portfolio in the Netherlands. In addition, the reduction in liquidity premium increased the value of IFRS insurance
liabilities. The LAT shortfall was partly offset by fair value gains of EUR 484 million and a gain on the guarantee provision of EUR 369 million. In addition,
positive real estate revaluations in the Netherlands amounted to EUR 100 million. In the United Kingdom, fair value losses totaled EUR 76 million and
were mainly driven by negative fair value movements on equity hedges following increased equity markets.
Realized gains totaled EUR 252 million and were primarily the result of portfolio optimization in the Netherlands. In Spain & Portugal realized gains
amounted to EUR 19 million as a result of the divestment of assets backing insurance liabilities. This was fully offset by a similar amount in other charges
due to a related transaction. Other income of EUR 29 million was driven by a EUR 70 million book gain on the divestment of Czech Republic and
Slovakia, as well as a gain of EUR 37 million in the United Kingdom related to policyholder taxes, which was offset by an equal amount in Aegon’s income
tax line. These were largely offset by EUR 33 million integration expenses for Cofunds, EUR 23 million transition, conversion charges related to the
agreement with Atos for administration services related to the Existing Business, both in the United Kingdom, and the aforementioned transaction in
Spain.
Unaudited Page 60
Underlying earnings before tax
Underlying earnings before tax from Aegon’s operations in Europe increased by 1% compared with the first half of 2018 to EUR 439 million. Underlying
earnings before tax were up in all regions adjusting for the lower underlying earnings before tax as a result of the divestment of Czech Republic and
Slovakia, which closed in January 2019.
- Underlying earnings before tax in the Netherlands were up by 3%, compared with the first half of 2018, to EUR 328 million. Life underlying earnings
before tax increased to EUR 262 million compared with the same period last year as a result of an improved investment margin, reflecting the shift
to higher-yielding assets and lower profit sharing. Underlying earnings before tax from Non-life decreased to EUR 10 million, compared with the first
half of 2018 due to lower disability provision releases compared with last year. Compared with the first half of 2018, Banking underlying earnings
before tax decreased by 2% to EUR 48 million, as higher net interest margin, reflecting balance sheet growth and lower funding costs, was offset by
higher expenses in line with the bank’s growth. Service Business underlying earnings before tax declined to EUR 8 million compared with the same
period last year.
- In the United Kingdom underlying earnings before tax increased by 2% compared with the first half of 2018 to EUR 70 million. Digital Solutions
underlying earnings before tax rose to EUR 16 million, compared with the same period last year, driven by higher fee income as a result of
increased assets on the platform. Underlying earnings before tax of the Existing Business declined to EUR 53 million compared with the first half of
2018, caused by net outflows, including upgrades to the digital platform, and lower investment income following bond sales.
- Compared with the first half of 2018, SEE’s underlying earnings before tax decreased by 14% to EUR 42 million, mainly due to the loss of
underlying earnings before tax from Czech Republic and Slovakia following the divestment, and lower underlying earnings before tax from
Romania, Hungary and Poland compared with the same period last year. Underlying earnings before tax in Spain & Portugal increased by EUR
12 million to EUR 19 million compared with the same period last year, driven by portfolio growth and better underwriting results in the joint ventures
with Santander in Portugal.
Operating expenses
Operating expenses increased by 8% to EUR 776 million compared with the first half of 2018 as a result of higher expenses in the Netherlands and the
United Kingdom, partly offset by lower expenses in SEE. The main drivers in the Netherlands were the impact of Robidus, acquired in September 2018,
higher expenses related to the own employee pension plan compared with the first half of 2018, following a decrease of the discount rate, and
investments in growth businesses. Higher expenses in the United Kingdom compared with the same period last year were mainly driven by higher
restructuring expenses as a result of transition and conversion charges related to the agreement with Atos. Lower expenses in SEE, compared with the
first half of 2018, were mainly due to the divestment of the businesses in Czech Republic and Slovakia and lower restructuring expenses compared with
the first half of 2018.
Sales and deposits
New life sales decreased by 2% compared to the first half of 2018 to EUR 137 million. Lower sales in SEE, compared with the same period last year,
were driven by the divestment of Aegon’s businesses in Czech Republic and Slovakia. These were partly offset by increasing protection sales in the
United Kingdom compared with the same period last year. New life sales in the Netherlands remained stable compared with the first half of 2018, as
higher sales following pension indexation premiums were offset by lower pension sales as a result of a continued shift in demand from defined benefit to
defined contribution solutions, such as PPIs.
Unaudited Page 61

New premium production for Accident & Health was up by 24% compared with the first half of 2018 to EUR 25 million as a result of higher sales in Spain
following the launch of a new accidental death and disability product. New premium production for property & casualty insurance increased by 7%
compared with the same period last year to EUR 65 million, driven by Hungary.
Gross deposits declined by 16% to EUR 9.9 billion compared with the first half of 2018 as gross deposits in the United Kingdom were down by 51% to
EUR 3.6 billion compared with the same period last year mainly due to lower institutional platform flows, which have a low margin. Gross deposits in SEE
declined by 13% compared with last the same period last year to EUR 175 million, largely as a result of the loss of deposits from Czech Republic and
Slovakia following the divestment. This was partly offset by a 41% increase to EUR 6.1 billion in the Netherlands compared with the first half of 2018,
driven by continued momentum at Aegon’s Premium Pension Institution (PPI) and online bank Knab.
Unaudited Page 62
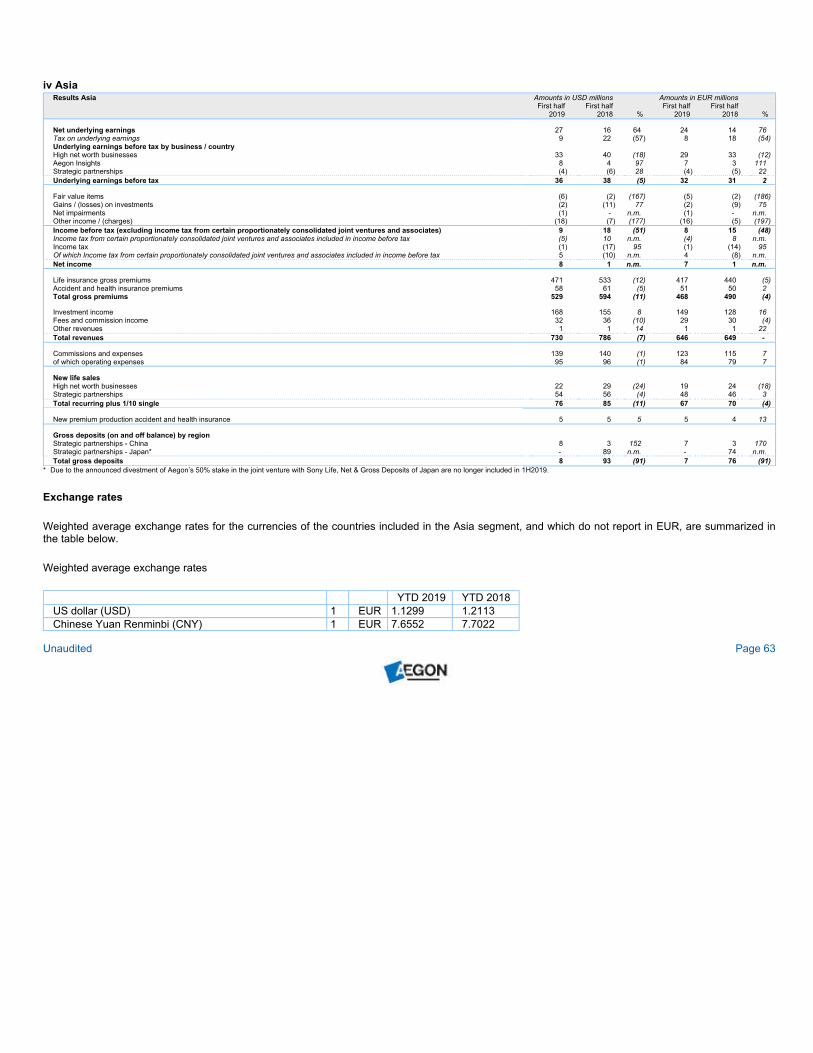
iv Asia
Results Asia Amounts in USD millions Amounts in EUR millions
First half
2019
First half
2018 %
First half
2019
First half
2018 %
Net underlying earnings 27 16 64 24 14 76
Tax on underlying earnings 9 22 (57) 8 18 (54)
Underlying earnings before tax by business / country
High net worth businesses 33 40 (18) 29 33 (12)
Aegon Insights 8 4 97 7 3 111
Strategic partnerships (4) (6) 28 (4) (5) 22
Underlying earnings before tax 36 38 (5) 32 31 2
Fair value items (6) (2) (167) (5) (2) (186)
Gains / (losses) on investments (2) (11) 77 (2) (9) 75
Net impairments (1) - n.m. (1) - n.m.
Other income / (charges) (18) (7) (177) (16) (5) (197)
Income before tax (excluding income tax from certain proportionately consolidated joint ventures and associates) 9 18 (51) 8 15 (48)
Income tax from certain proportionately consolidated joint ventures and associates included in income before tax (5) 10 n.m. (4) 8 n.m.
Income tax (1) (17) 95 (1) (14) 95
Of which Income tax from certain proportionately consolidated joint ventures and associates included in income before tax 5 (10) n.m. 4 (8) n.m.
Net income 8 1 n.m. 7 1 n.m.
Life insurance gross premiums 471 533 (12) 417 440 (5)
Accident and health insurance premiums 58 61 (5) 51 50 2
Total gross premiums 529 594 (11) 468 490 (4)
Investment income 168 155 8 149 128 16
Fees and commission income 32 36 (10) 29 30 (4)
Other revenues 1 1 14 1 1 22
Total revenues 730 786 (7) 646 649 -
Commissions and expenses 139 140 (1) 123 115 7
of which operating expenses 95 96 (1) 84 79 7
New life sales
High net worth businesses 22 29 (24) 19 24 (18)
Strategic partnerships 54 56 (4) 48 46 3
Total recurring plus 1/10 single 76 85 (11) 67 70 (4)
New premium production accident and health insurance 5 5 5 5 4 13
Gross deposits (on and off balance) by region
Strategic partnerships - China 8 3 152 7 3 170
Strategic partnerships - Japan* - 89 n.m. - 74 n.m.
Total gross deposits 8 93 (91) 7 76 (91)
* Due to the announced divestment of Aegon’s 50% stake in the joint venture with Sony Life, Net & Gross Deposits of Japan are no longer included in 1H2019.
Exchange rates
Weighted average exchange rates for the currencies of the countries included in the Asia segment, and which do not report in EUR, are summarized in
the table below.
Weighted average exchange rates
YTD 2019 YTD 2018
US dollar (USD) 1 EUR 1.1299 1.2113
Chinese Yuan Renminbi (CNY) 1 EUR 7.6552 7.7022
Unaudited Page 63
Net income
Net income from Aegon’s operations in Asia increased to USD 8 million in the first half of 2019 compared with a net income of USD 1 million in the first
half of 2018.
Fair value items amounted to a loss of USD 6 million mainly from hedging losses in Japan. Realized losses on investments in Asia of USD 2 million were
driven by normal trading activity and net impairments of USD 1 million resulted from several write-offs. Other charges of USD 18 million were mainly
caused by a USD 9 million correction of modelled premium paying periods for a specific Accident & Health book, a USD 5 million provision for
remediation of policies sold via the telemarketing channel in the run-off book of Aegon Insights, and a USD 3 million charge for the regular annual model
and assumption updates in the High net worth businesses.
In China, the banking and insurance regulator, CBRIC, has revised the tax deductibility of insurance sales commission from a cap of 10% of gross
premium to 18% while also enabling the excess portion above the cap to be treated as a temporary difference rather than a permanent difference. This
positive change, made retrospectively to 2018, will improve the profitability and capital generation of Aegon’s joint venture in China, Aegon THTF,
compared to the situation before the change as new sales growth in recent years has led to commission tax payments under the old rule.
Resulting from the commission tax law change, income tax benefited in the first half of 2019 from a one-off tax credit for 2018 of USD 5 million and from
lower income tax rates in China as of 2019 compared to the income tax rates before the commission tax law change. Consequentially, Asia’s effective tax
rate on underlying earnings before tax changed from 57% in the first half of 2018 to 26% in the first half of 2019.
Underlying earnings before tax
Asia generated underlying earnings before tax of USD 36 million in the first half of 2019, which was USD 2 million or 5% below underlying earnings before
tax of USD 38 million for the first half of 2018. Underlying earnings before tax from Strategic partnerships increased by USD 2 million compared to the first
half of 2018. Underlying earnings before tax from Aegon Insights increased by USD 4 million compared to the first half of 2018. Underlying earnings
before tax from High net worth businesses decreased by USD 7 million compared to the first half of 2018 largely due to lower interest rates.
- Underlying earnings before tax from High net worth businesses amounted to USD 33 million in the first half of 2019, 18% lower than the first half of
2018. Lower interest rates led to intangible adjustments, which were partly offset by favorable claims experience.
- Aegon Insights, the direct marketing business that is in run-off, raised its underlying earnings before tax by USD 4 million to USD 8 million in the
first half of 2019 compared to the first half of 2018, largely driven by expense savings and favorable claims experience.
- Underlying earnings before tax from Strategic partnerships improved by USD 2 million to a loss of USD 4 million in the first half of 2019 compared
to the first half of 2018, mainly driven by business growth and favorable persistency in China, and lower investments in new business in the
traditional channel in India as it pivots towards digital channels. Underlying earnings before tax were offset by an investment in an eBroker initiative
designed to connect the existing digital assets in Asia. The joint ventures in Japan remained loss-making in the first half of 2019. Aegon and Sony
Life signed transaction agreements related to the divestment of Aegon’s 50% stake in the variable annuity joint ventures in Japan on June 28,
2019.
Unaudited Page 64
Operating expenses
Operating expenses were stable at USD 95 million in the first half of 2019 compared with operating expense of USD 96 million in the first half of 2018.
Expense reductions in India and from the run-off of Aegon Insights were compensated by investments in growth in the High net worth businesses, China
and the eBroker initiative.
Sales and deposits
Aegon has agreed to divest its 50% stake in the variable annuity joint ventures in Japan. Therefore, deposits from Japan are no longer reported. Aegon
Insights is in run-off and does not report new sales.
Total new life sales declined by 11% to USD 76 million for the first half of 2019 compared to the first half of 2018.
- New life sales from High net worth businesses decreased by 24% to USD 22 million for the first half of 2019 compared to the first half of 2018
reflecting continued pressure on the universal life business resulting from macro uncertainties and a shift of the market towards whole life type
products.
- In Strategic partnerships, total new life sales declined by USD 2 million to USD 54 million for the first half of 2019 compared to the first half of 2018.
Sales growth in China was offset by adverse currency movements and lower sales in the traditional channel in India.
New premium production in Accident and Health insurance, produced in Aegon’s joint venture in China, Aegon THTF, was stable at USD 5 million in the
first half of 2019 compared to the first half of 2018.
Gross deposits from Strategic partnerships in China amount to USD 8 million in the first half of 2019 and more than doubled compared to the first half of
2018. Net deposits amount to USD 7 million in the first half of 2019, and increased from USD 1 million in the first half of 2018.
Unaudited Page 65
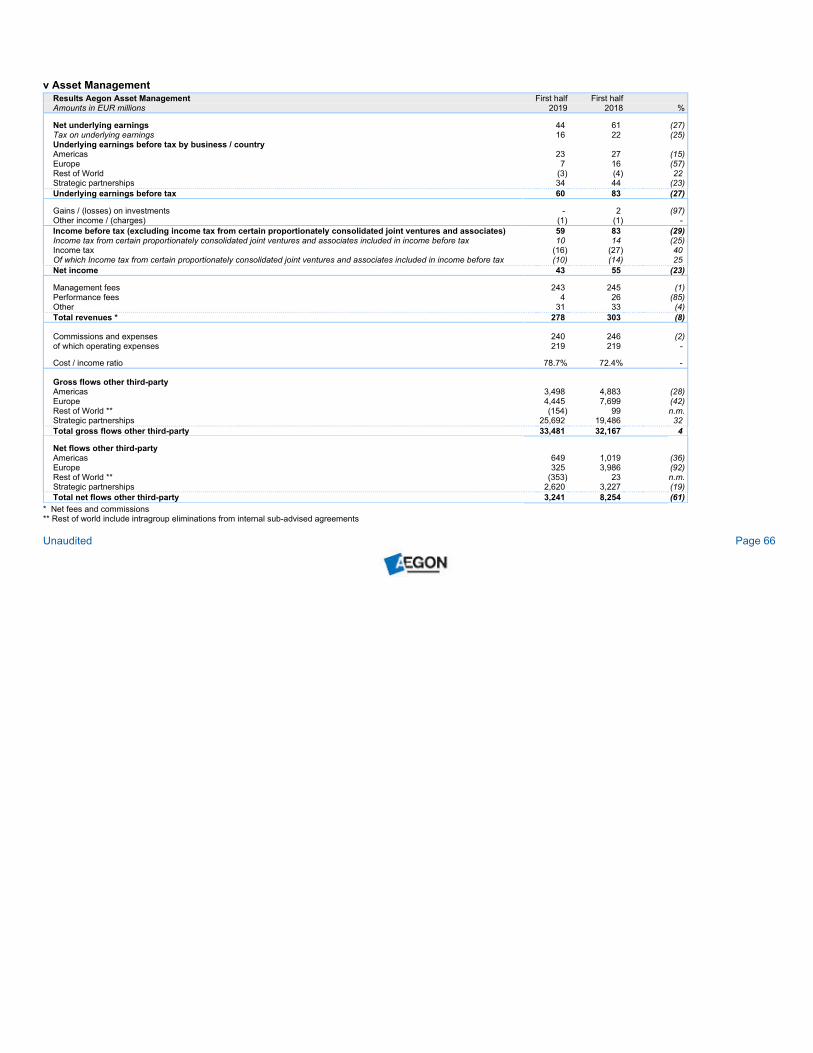
v Asset Management
Results Aegon Asset Management First half First half
Amounts in EUR millions 2019 2018 %
Net underlying earnings 44 61 (27)
Tax on underlying earnings 16 22 (25)
Underlying earnings before tax by business / country
Americas 23 27 (15)
Europe 7 16 (57)
Rest of World (3) (4) 22
Strategic partnerships 34 44 (23)
Underlying earnings before tax 60 83 (27)
Gains / (losses) on investments - 2 (97)
Other income / (charges) (1) (1) -
Income before tax (excluding income tax from certain proportionately consolidated joint ventures and associates) 59 83 (29)
Income tax from certain proportionately consolidated joint ventures and associates included in income before tax 10 14 (25)
Income tax (16) (27) 40
Of which Income tax from certain proportionately consolidated joint ventures and associates included in income before tax (10) (14) 25
Net income 43 55 (23)
Management fees 243 245 (1)
Performance fees 4 26 (85)
Other 31 33 (4)
Total revenues * 278 303 (8)
Commissions and expenses 240 246 (2)
of which operating expenses 219 219 -
Cost / income ratio 78.7% 72.4% -
Gross flows other third-party
Americas 3,498 4,883 (28)
Europe 4,445 7,699 (42)
Rest of World ** (154) 99 n.m.
Strategic partnerships 25,692 19,486 32
Total gross flows other third-party 33,481 32,167 4
Net flows other third-party
Americas 649 1,019 (36)
Europe 325 3,986 (92)
Rest of World ** (353) 23 n.m.
Strategic partnerships 2,620 3,227 (19)
Total net flows other third-party 3,241 8,254 (61)
* Net fees and commissions
** Rest of world include intragroup eliminations from internal sub-advised agreements
Unaudited Page 66
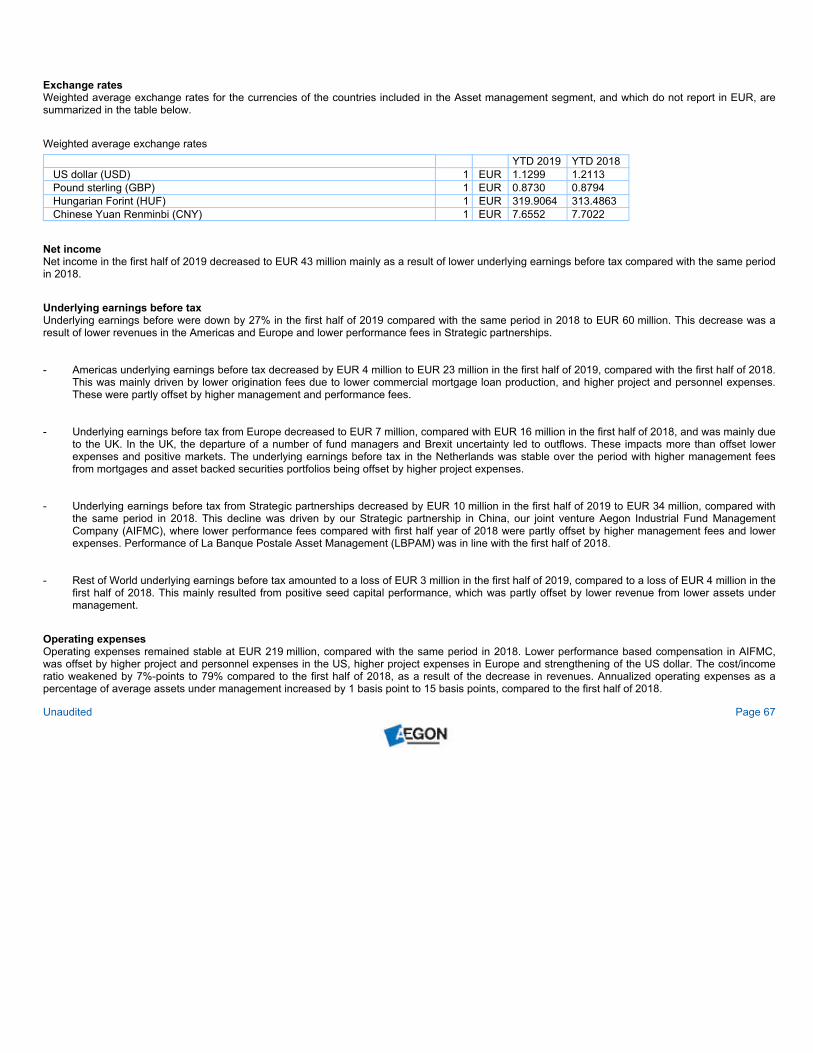
Exchange rates
Weighted average exchange rates for the currencies of the countries included in the Asset management segment, and which do not report in EUR, are
summarized in the table below.
Weighted average exchange rates
YTD 2019 YTD 2018
US dollar (USD) 1 EUR 1.1299 1.2113
Pound sterling (GBP) 1 EUR 0.8730 0.8794
Hungarian Forint (HUF) 1 EUR 319.9064 313.4863
Chinese Yuan Renminbi (CNY) 1 EUR 7.6552 7.7022
Net income
Net income in the first half of 2019 decreased to EUR 43 million mainly as a result of lower underlying earnings before tax compared with the same period
in 2018.
Underlying earnings before tax
Underlying earnings before were down by 27% in the first half of 2019 compared with the same period in 2018 to EUR 60 million. This decrease was a
result of lower revenues in the Americas and Europe and lower performance fees in Strategic partnerships.
- Americas underlying earnings before tax decreased by EUR 4 million to EUR 23 million in the first half of 2019, compared with the first half of 2018.
This was mainly driven by lower origination fees due to lower commercial mortgage loan production, and higher project and personnel expenses.
These were partly offset by higher management and performance fees.
- Underlying earnings before tax from Europe decreased to EUR 7 million, compared with EUR 16 million in the first half of 2018, and was mainly due
to the UK. In the UK, the departure of a number of fund managers and Brexit uncertainty led to outflows. These impacts more than offset lower
expenses and positive markets. The underlying earnings before tax in the Netherlands was stable over the period with higher management fees
from mortgages and asset backed securities portfolios being offset by higher project expenses.
- Underlying earnings before tax from Strategic partnerships decreased by EUR 10 million in the first half of 2019 to EUR 34 million, compared with
the same period in 2018. This decline was driven by our Strategic partnership in China, our joint venture Aegon Industrial Fund Management
Company (AIFMC), where lower performance fees compared with first half year of 2018 were partly offset by higher management fees and lower
expenses. Performance of La Banque Postale Asset Management (LBPAM) was in line with the first half of 2018.
- Rest of World underlying earnings before tax amounted to a loss of EUR 3 million in the first half of 2019, compared to a loss of EUR 4 million in the
first half of 2018. This mainly resulted from positive seed capital performance, which was partly offset by lower revenue from lower assets under
management.
Operating expenses
Operating expenses remained stable at EUR 219 million, compared with the same period in 2018. Lower performance based compensation in AIFMC,
was offset by higher project and personnel expenses in the US, higher project expenses in Europe and strengthening of the US dollar. The cost/income
ratio weakened by 7%-points to 79% compared to the first half of 2018, as a result of the decrease in revenues. Annualized operating expenses as a
percentage of average assets under management increased by 1 basis point to 15 basis points, compared to the first half of 2018.
Unaudited Page 67
Production
Gross inflows in external third-party increased by 4% in the first half of 2019 to EUR 33.5 billion compared with the same period in 2018. This resulted
from increased inflows in AIFMC, mainly supported a new mandate in the first quarter. In the Americas gross inflows decreased due to lower sales in a
number of product categories. In Europe gross inflows decreased driven by the loss of key fund managers in the UK and Brexit uncertainty, which had a
considerable impact.
The external third-party net inflows were solid at EUR 3.2 billion for the first half year of 2019. This amount was primarily due to AIFMC, which contributed
EUR 2.6 billion. Net inflows in the Americas were EUR 0.6 billion while flows in Europe showed a slight positive of EUR 0.3 billion, despite the outflows in
the United Kingdom caused by key fund managers leaving. The Rest of World showed net outflows of EUR 0.4 billion, mainly due to increased
competition in local markets, such as in Hungary.
Assets under management
Assets under management increased by EUR 23 billion in the first half of 2019 to EUR 325 billion compared with the end of 2018. This increase mainly
resulted from positive market movements and external third-party net inflows, more than offsetting negative net flows in affiliates and the general account.
2.6 Post reporting date events
Post reporting date events are disclosed in note 20 of the condensed consolidated interim financial statements included in Item 1.
2.7 Capital and Liquidity Management
Guiding principles
The management of capital and liquidity is of vital importance for the Aegon Group, for its customers, investors in Aegon securities and for Aegon’s other
stakeholders. In line with its risk tolerance, the goal of Aegon’s capital and liquidity management is to promote strong and stable capital adequacy levels
for its businesses, in addition to maintaining adequate liquidity to ensure that the Company is able to meet its obligations.
Aegon follows a number of guiding principles in terms of capital and liquidity management:
• Promoting strong capital adequacy in Aegon’s businesses and operating units;
• Managing and allocating capital efficiently in support of the strategy and in line with its risk tolerance;
• Maintaining an efficient capital structure, with an emphasis on optimizing Aegon’s cost of capital;
• Maintaining adequate liquidity in the operating units and at the holding to ensure that the Company is able to meet its obligations by enforcing
stringent liquidity risk policies; and
• Maintaining continued access to international capital markets on competitive terms.
Aegon believes that the combination of these guiding principles strengthens the Company’s ability to withstand adverse market conditions, enhances its
financial flexibility, and serves both the short-term and the long-term interests of the Company, its customers and other stakeholders.
The management and monitoring of capital and liquidity is firmly embedded in Aegon’s ERM framework, and is in line with Aegon’s risk tolerance.
Aegon’s risk tolerance focuses on financial strength, continuity, steering the risk balance and the desired risk culture. Its core aim is to assist
management in carrying out Aegon’s strategy within the Group’s capital and liquidity resources.
Unaudited Page 68
Management of capital
The Company’s overall capital management strategy is based on adequate solvency capital, capital quality and the use of leverage.
Capital adequacy
Aegon’s goal for both its operating units and for the Aegon Group as a whole is to maintain a strong financial position and to be able to sustain losses
resulting from adverse business and market conditions. The capitalization of Aegon and its operating units is managed in accordance with the most
stringent of local regulatory requirements, rating agency requirements and self-imposed criteria.
Regulatory capital requirements
For EU domiciled insurance and reinsurance entities, the Solvency II regulatory framework determines the regulatory capital requirements. In Aegon’s
Non-EEA (European Economic Arena) regions, (re)insurance entities domiciled in third-countries deemed (provisionally) equivalent (US, Bermuda,
Japan, Mexico and Brazil), the capital requirement is based on local capital requirements.
Please note that numbers and ratios related to Solvency II as disclosed in this section represent Aegon’s estimates and are subject to supervisory review.
Aegon has applied a Loss Absorbing Capacity of Deferred Taxes (LAC-DT) factor in the Netherlands of 75%, which remained unchanged from
December 31, 2018. The LAC-DT factor will be recalibrated on a quarterly basis using the agreed methodology. The Solvency II capital ratios of the
Group and Aegon the Netherlands do not include any contingent liability potentially arising from unit-linked products sold, issued or advised on by Aegon
in the Netherlands in the past, as the potential liability cannot be reliably quantified at this point.
Adequate capitalization
To calculate its Group Solvency Ratio, Aegon applies a combination of the Group consolidation methods available under Solvency II which are the
Accounting Consolidation (AC) and Deduction & Aggregation (D&A) based methods. Solvency II capital requirements are mainly used for the EEA-based
insurance and reinsurance entities, applying the Accounting Consolidation method.
The methodology used to calculate the Solvency II contribution of the Aegon US insurance entities encompasses two adjustments to the local capital
position. To calculate the SCR, a conversion factor is applied of 150% Risk-Based Capital Company Action Level (RBC CAL). To calculate own funds, a
100% RBC CAL haircut to own funds by decreasing Americas regulated entities deferred tax assets and subsequently reducing Tier 1 unrestricted capital
is applied to reflect transferability restrictions.
The allocation of restricted Tier 1 and Tier 2 capital instruments is based on the share of AC and D&A entities in the total available own funds (OF).
Aegon Bank is excluded from the Group Solvency ratio, as required by the Group Solvency II supervisor, DNB.
Unaudited Page 69
On June 30, 2019, Aegon’s estimated capital position was:
June 30, 2019 1), 2), 3) December 31, 2018 2), 3)
Group own funds 17,679 17,602
Group SCR 8,996 8,349
Group Solvency II ratio 197% 211%
1 The Solvency II ratios are estimates and, are not final until filed with the regulator and subject to supervisory review.
2 The Solvency II ratios are based on Aegon’s partial internal model.
3 Aegon Bank is not included in the Group Solvency II ratio.
Aegon Group own funds amounted to EUR 17,679 million at June 30, 2019. The increase of EUR 77 million in own funds since December 31, 2018, is
mostly driven by the positive expected return on Aegon inforce insurance portfolio and declining interest rates. This increase was partly offset by the
negative market impact primarily from the EIOPA VA narrowing from 24 bps to 9 bps (negative impact of EUR 870 million on own funds) and widened
mortgage spreads from 114 bps to 171 bps (negative impact of EUR 412 million on own funds). Furthermore, the lowering of the UFR from 4.05% to
3.90% led to a decrease in Own Funds as well.
Aegon Group PIM SCR amounted to EUR 8,996 million at June 30, 2019. The SCR increased by EUR 647 million since December 31, 2018 and is
mainly due to negative market movements as a result of decline of interest rates, SCR for new business also contribute to the increase of SCR.
As a result of the above changes in own funds and PIM SCR, the Group Solvency II ratio decreased by 14% to 197% in first half 2019.
The capitalization levels of the most relevant country units are as follows:
Capitalization
June 30, 2019 1), 2), 3)
Capitalization
December 31, 2018 1), 2), 3)
Aegon USA (Life entities) (RBC CAL) 472% 465%
Aegon the Netherlands (Solvency II ratio) 152% 189%
Aegon United Kingdom (Solvency II ratio) 165% 184%
1 The Solvency II ratios are estimates and, are not final until filed with the regulator and subject to supervisory review.
2 Refer to section ‘internal capital management framework’ for Aegon’s capitalization target ranges.
3 Aegon Bank is not included in the Aegon NL Solvency II ratio
Aegon Americas
The RBC CAL ratio of Aegon Americas insurance entities increased from 465% at December 31, 2018 to 472% mainly due to positive capital generation
as a result of positive expected earnings on inforce partly offset by negative impact from higher than expected new business strain and paid dividend from
US regulated companies. There are other large offsetting impacts in market impact, mainly due to gain from rising equity markets and partly offset by the
decline of interest rates result in increase in VA required capital.
Aegon the Netherlands
The estimated Solvency II ratio in the Netherlands decreased to 152% on June 30, 2019, from 181% at the end of 2018. The decrease is mainly driven by
negative market impacts primarily from the EIOPA VA narrowing from 24bps to 9bps, widening mortgage spreads and a decline of interest rates.
Furthermore, the
Unaudited Page 70
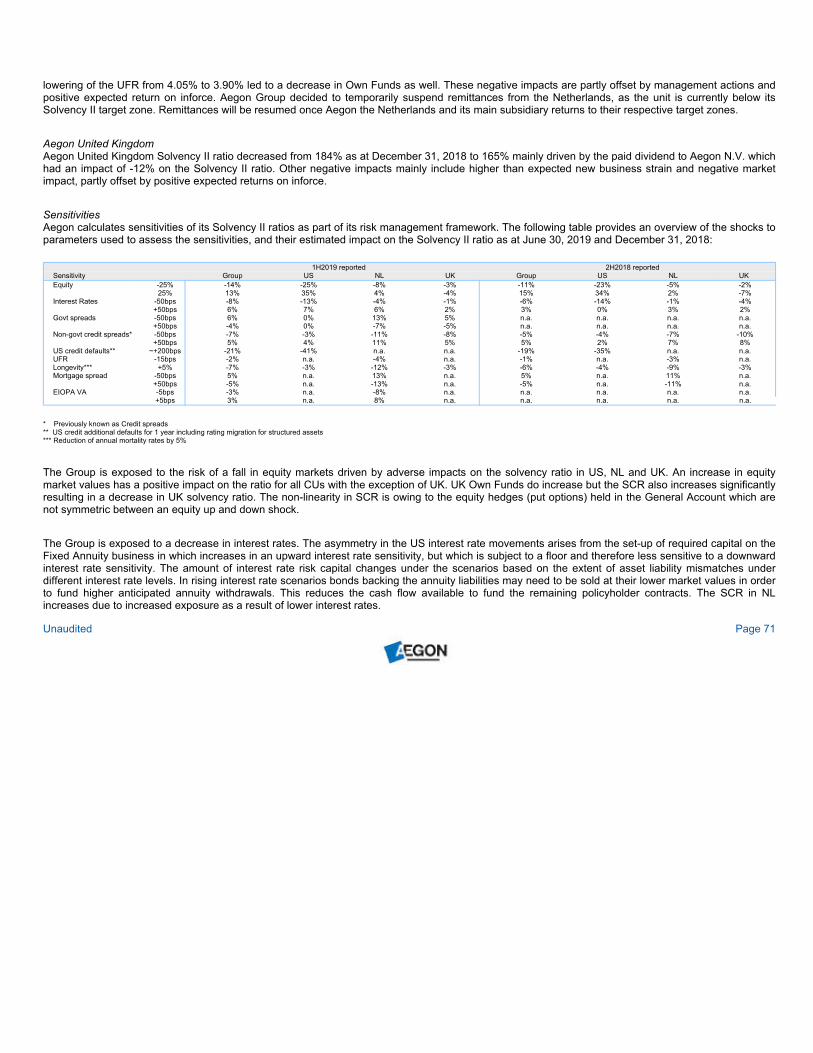
lowering of the UFR from 4.05% to 3.90% led to a decrease in Own Funds as well. These negative impacts are partly offset by management actions and
positive expected return on inforce. Aegon Group decided to temporarily suspend remittances from the Netherlands, as the unit is currently below its
Solvency II target zone. Remittances will be resumed once Aegon the Netherlands and its main subsidiary returns to their respective target zones.
Aegon United Kingdom
Aegon United Kingdom Solvency II ratio decreased from 184% as at December 31, 2018 to 165% mainly driven by the paid dividend to Aegon N.V. which
had an impact of -12% on the Solvency II ratio. Other negative impacts mainly include higher than expected new business strain and negative market
impact, partly offset by positive expected returns on inforce.
Sensitivities
Aegon calculates sensitivities of its Solvency II ratios as part of its risk management framework. The following table provides an overview of the shocks to
parameters used to assess the sensitivities, and their estimated impact on the Solvency II ratio as at June 30, 2019 and December 31, 2018:
1H2019 reported 2H2018 reported
Sensitivity Group US NL UK Group US NL UK
Equity -25% -14% -25% -8% -3% -11% -23% -5% -2%
25% 13% 35% 4% -4% 15% 34% 2% -7%
Interest Rates -50bps -8% -13% -4% -1% -6% -14% -1% -4%
+50bps 6% 7% 6% 2% 3% 0% 3% 2%
Govt spreads -50bps 6% 0% 13% 5% n.a. n.a. n.a. n.a.
+50bps -4% 0% -7% -5% n.a. n.a. n.a. n.a.
Non-govt credit spreads* -50bps -7% -3% -11% -8% -5% -4% -7% -10%
+50bps 5% 4% 11% 5% 5% 2% 7% 8%
US credit defaults** ~+200bps -21% -41% n.a. n.a. -19% -35% n.a. n.a.
UFR -15bps -2% n.a. -4% n.a. -1% n.a. -3% n.a.
Longevity*** +5% -7% -3% -12% -3% -6% -4% -9% -3%
Mortgage spread -50bps 5% n.a. 13% n.a. 5% n.a. 11% n.a.
+50bps -5% n.a. -13% n.a. -5% n.a. -11% n.a.
EIOPA VA -5bps -3% n.a. -8% n.a. n.a. n.a. n.a. n.a.
+5bps 3% n.a. 8% n.a. n.a. n.a. n.a. n.a.
* Previously known as Credit spreads
** US credit additional defaults for 1 year including rating migration for structured assets
*** Reduction of annual mortality rates by 5%
The Group is exposed to the risk of a fall in equity markets driven by adverse impacts on the solvency ratio in US, NL and UK. An increase in equity
market values has a positive impact on the ratio for all CUs with the exception of UK. UK Own Funds do increase but the SCR also increases significantly
resulting in a decrease in UK solvency ratio. The non-linearity in SCR is owing to the equity hedges (put options) held in the General Account which are
not symmetric between an equity up and down shock.
The Group is exposed to a decrease in interest rates. The asymmetry in the US interest rate movements arises from the set-up of required capital on the
Fixed Annuity business in which increases in an upward interest rate sensitivity, but which is subject to a floor and therefore less sensitive to a downward
interest rate sensitivity. The amount of interest rate risk capital changes under the scenarios based on the extent of asset liability mismatches under
different interest rate levels. In rising interest rate scenarios bonds backing the annuity liabilities may need to be sold at their lower market values in order
to fund higher anticipated annuity withdrawals. This reduces the cash flow available to fund the remaining policyholder contracts. The SCR in NL
increases due to increased exposure as a result of lower interest rates.
Unaudited Page 71
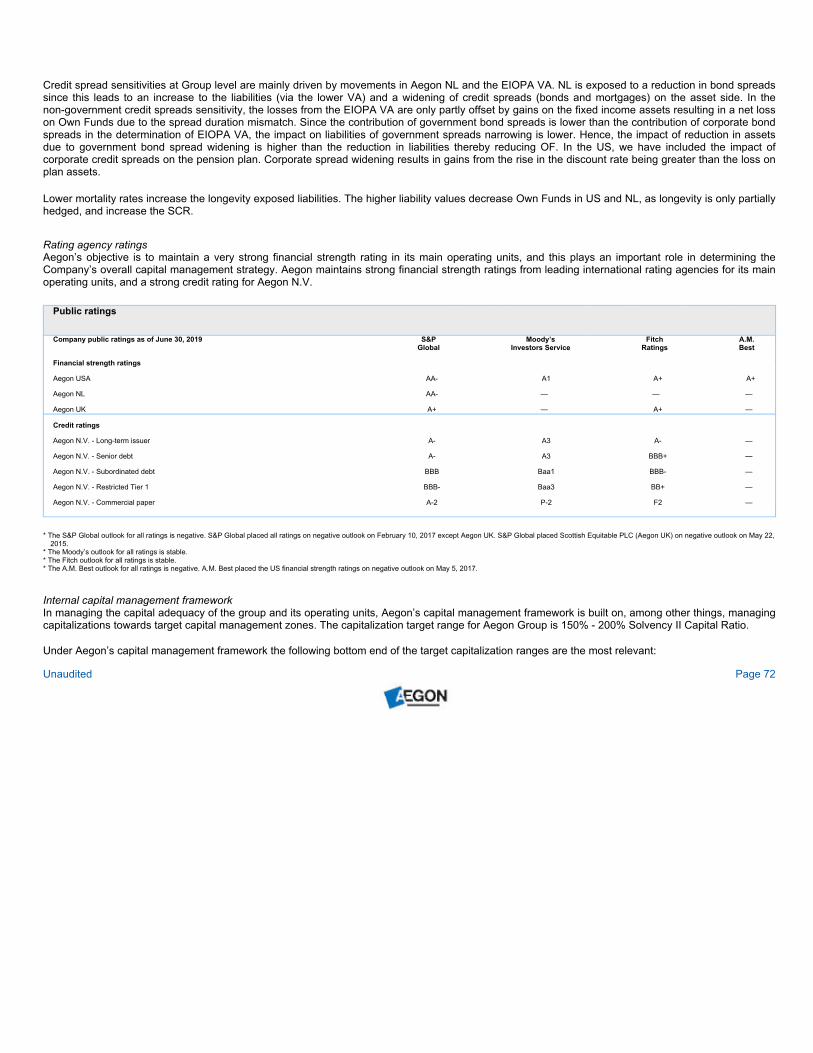
Credit spread sensitivities at Group level are mainly driven by movements in Aegon NL and the EIOPA VA. NL is exposed to a reduction in bond spreads
since this leads to an increase to the liabilities (via the lower VA) and a widening of credit spreads (bonds and mortgages) on the asset side. In the
non-government credit spreads sensitivity, the losses from the EIOPA VA are only partly offset by gains on the fixed income assets resulting in a net loss
on Own Funds due to the spread duration mismatch. Since the contribution of government bond spreads is lower than the contribution of corporate bond
spreads in the determination of EIOPA VA, the impact on liabilities of government spreads narrowing is lower. Hence, the impact of reduction in assets
due to government bond spread widening is higher than the reduction in liabilities thereby reducing OF. In the US, we have included the impact of
corporate credit spreads on the pension plan. Corporate spread widening results in gains from the rise in the discount rate being greater than the loss on
plan assets.
Lower mortality rates increase the longevity exposed liabilities. The higher liability values decrease Own Funds in US and NL, as longevity is only partially
hedged, and increase the SCR.
Rating agency ratings
Aegon’s objective is to maintain a very strong financial strength rating in its main operating units, and this plays an important role in determining the
Company’s overall capital management strategy. Aegon maintains strong financial strength ratings from leading international rating agencies for its main
operating units, and a strong credit rating for Aegon N.V.
Public ratings
Company public ratings as of June 30, 2019 S&P
Global
Moody’s
Investors Service
Fitch
Ratings
A.M.
Best
Financial strength ratings
Aegon USA AA- A1 A+ A+
Aegon NL AA- — — —
Aegon UK A+ — A+ —
Credit ratings
Aegon N.V. - Long-term issuer A- A3 A- —
Aegon N.V. - Senior debt A- A3 BBB+ —
Aegon N.V. - Subordinated debt BBB Baa1 BBB- —
Aegon N.V. - Restricted Tier 1 BBB- Baa3 BB+ —
Aegon N.V. - Commercial paper A-2 P-2 F2 —
* The S&P Global outlook for all ratings is negative. S&P Global placed all ratings on negative outlook on February 10, 2017 except Aegon UK. S&P Global placed Scottish Equitable PLC (Aegon UK) on negative outlook on May 22,
2015.
* The Moody’s outlook for all ratings is stable.
* The Fitch outlook for all ratings is stable.
* The A.M. Best outlook for all ratings is negative. A.M. Best placed the US financial strength ratings on negative outlook on May 5, 2017.
Internal capital management framework
In managing the capital adequacy of the group and its operating units, Aegon’s capital management framework is built on, among other things, managing
capitalizations towards target capital management zones. The capitalization target range for Aegon Group is 150% - 200% Solvency II Capital Ratio.
Under Aegon’s capital management framework the following bottom end of the target capitalization ranges are the most relevant:
Unaudited Page 72

Bottom end of capitalization target range
Aegon USA (Life entities) 350% RBC Company Action Level
Aegon the Netherlands 155% Solvency II Capital Ratio
Aegon United Kingdom 145% Solvency II Capital Ratio
Aegon reviewed its Solvency II target zone for the Netherlands following a change to the modeling of the dynamic volatility adjuster in the second half of
2018. This model change was made to align with the guidance from EIOPA, and resulted in increased credit sensitivities for Aegon the Netherlands. As a
result, management decided to increase the bottom end of the target range from 150% to 155%.
The frequent monitoring of actual and forecast capitalization levels of both the Aegon Group and of its underlying businesses is an important element in
Aegon’s capital framework in order to actively steer and manage towards maintaining adequate capitalization levels. Aegon’s capital framework is based
on several capital management zones in which escalating management actions are called for in a timely manner to ensure there is always adequate
capitalization of both the Aegon Group and its operating units.
The capital management zones and the management interventions connected to these zones are set throughout the Group.
Minimum solvency requirements
Insurance laws and regulations in local regulatory jurisdictions often contain minimum regulatory capital requirements. For insurance companies in the
European Union, Solvency II formally defines a lower capital requirement, the Minimum Capital Requirement (MCR). An irreparable breach of the MCR
would lead to the withdrawal of the insurance license. Similarly, for the US insurance entities the withdrawal of the insurance license is triggered by a
breach of 100% of the Authorized Control Level (ACL), which is 50% of the Company Action Level (CAL).
With the introduction of Solvency II for EEA countries, Aegon views these minimum regulatory capital requirements as the level around which regulators
will formally require management to provide regulatory recovery plans. For the US insurance entities this is set at 100% Company Action Level (CAL) and
for insurance companies in the European Union this is set at 100% SCR.
The minimum regulatory capital requirements, as viewed by Aegon, for its main operating units and the capitalization levels on June 30, 2019, are
included in the following table:
Capital requirements
Minimum capital
requirement Actual capitalization
Excess over minimum
capital requirement
100% Company Action Level
Aegon USA (Life entities) 1), 3) (NAIC RBC CAL) 472% of combined CAL €7.6 bln
Aegon the Netherlands 2), 3) 100% Solvency II SCR 152% Solvency II SCR €1.9 bln
Aegon United Kingdom 3) 100% Solvency II SCR 165% Solvency II SCR €1.1 bln
1 Capitalization for the United States represents the internally defined combined risk-based capital (“RBC”) ratio of Aegon’s life insurance subsidiaries in the United States.
The combined RBC ratio utilizes the NAIC RBC ratio excluding affiliated notes and taking into account excess or deficient amounts related to offshore life affiliates
2 Excluding Aegon Bank
3 Please note, this reflects Aegon’s estimated Capitalization levels
Unaudited Page 73
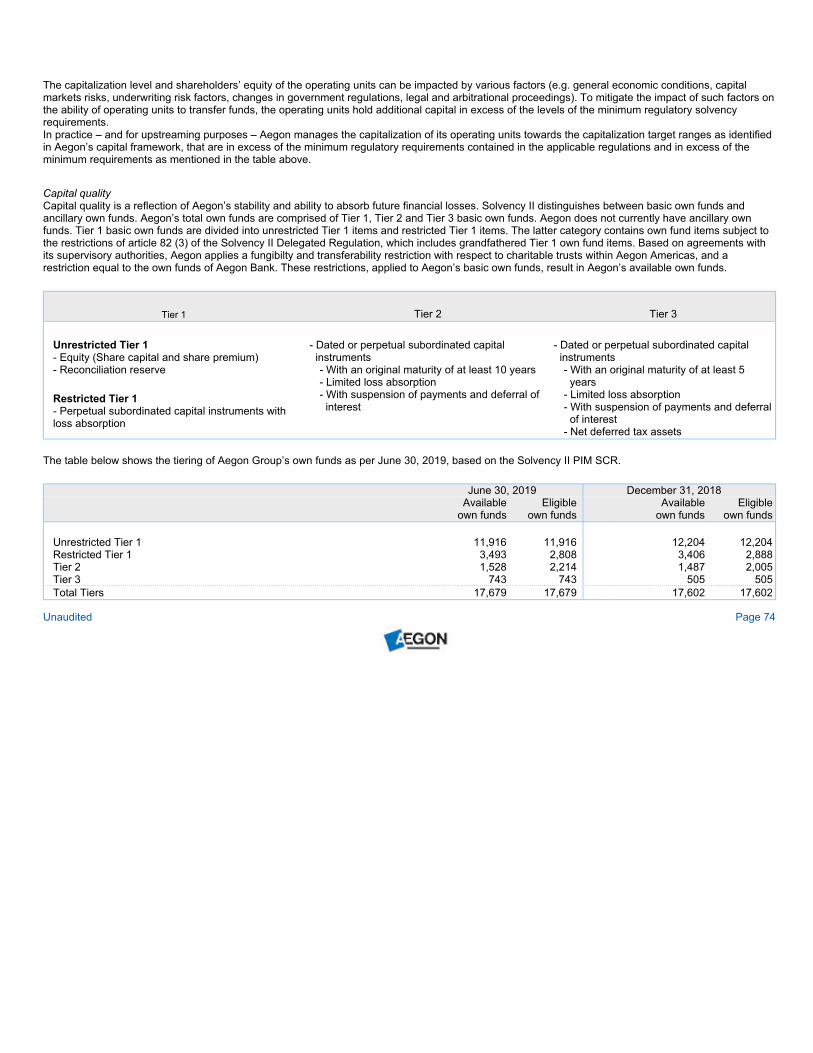
The capitalization level and shareholders’ equity of the operating units can be impacted by various factors (e.g. general economic conditions, capital
markets risks, underwriting risk factors, changes in government regulations, legal and arbitrational proceedings). To mitigate the impact of such factors on
the ability of operating units to transfer funds, the operating units hold additional capital in excess of the levels of the minimum regulatory solvency
requirements.
In practice – and for upstreaming purposes – Aegon manages the capitalization of its operating units towards the capitalization target ranges as identified
in Aegon’s capital framework, that are in excess of the minimum regulatory requirements contained in the applicable regulations and in excess of the
minimum requirements as mentioned in the table above.
Capital quality
Capital quality is a reflection of Aegon’s stability and ability to absorb future financial losses. Solvency II distinguishes between basic own funds and
ancillary own funds. Aegon’s total own funds are comprised of Tier 1, Tier 2 and Tier 3 basic own funds. Aegon does not currently have ancillary own
funds. Tier 1 basic own funds are divided into unrestricted Tier 1 items and restricted Tier 1 items. The latter category contains own fund items subject to
the restrictions of article 82 (3) of the Solvency II Delegated Regulation, which includes grandfathered Tier 1 own fund items. Based on agreements with
its supervisory authorities, Aegon applies a fungibilty and transferability restriction with respect to charitable trusts within Aegon Americas, and a
restriction equal to the own funds of Aegon Bank. These restrictions, applied to Aegon’s basic own funds, result in Aegon’s available own funds.
Tier 1 Tier 2 Tier 3
Unrestricted Tier 1
- Equity (Share capital and share premium)
- Reconciliation reserve
Restricted Tier 1
- Perpetual subordinated capital instruments with
loss absorption
- Dated or perpetual subordinated capital
instruments
- With an original maturity of at least 10 years
- Limited loss absorption
- With suspension of payments and deferral of
interest
- Dated or perpetual subordinated capital
instruments
- With an original maturity of at least 5
years
- Limited loss absorption
- With suspension of payments and deferral
of interest
- Net deferred tax assets
The table below shows the tiering of Aegon Group’s own funds as per June 30, 2019, based on the Solvency II PIM SCR.
June 30, 2019 December 31, 2018
Available Eligible Available Eligible
own funds own funds own funds own funds
Unrestricted Tier 1 11,916 11,916 12,204 12,204
Restricted Tier 1 3,493 2,808 3,406 2,888
Tier 2 1,528 2,214 1,487 2,005
Tier 3 743 743 505 505
Total Tiers 17,679 17,679 17,602 17,602
Unaudited Page 74
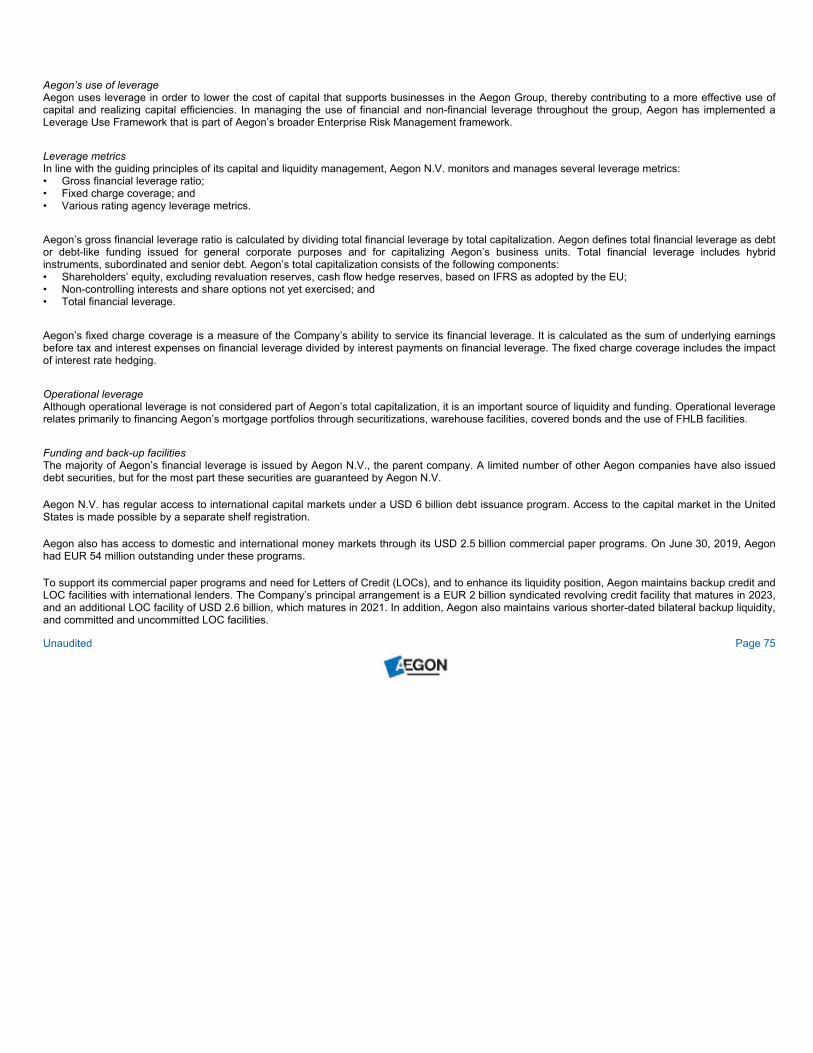
Aegon’s use of leverage
Aegon uses leverage in order to lower the cost of capital that supports businesses in the Aegon Group, thereby contributing to a more effective use of
capital and realizing capital efficiencies. In managing the use of financial and non-financial leverage throughout the group, Aegon has implemented a
Leverage Use Framework that is part of Aegon’s broader Enterprise Risk Management framework.
Leverage metrics
In line with the guiding principles of its capital and liquidity management, Aegon N.V. monitors and manages several leverage metrics:
• Gross financial leverage ratio;
• Fixed charge coverage; and
• Various rating agency leverage metrics.
Aegon’s gross financial leverage ratio is calculated by dividing total financial leverage by total capitalization. Aegon defines total financial leverage as debt
or debt-like funding issued for general corporate purposes and for capitalizing Aegon’s business units. Total financial leverage includes hybrid
instruments, subordinated and senior debt. Aegon’s total capitalization consists of the following components:
• Shareholders’ equity, excluding revaluation reserves, cash flow hedge reserves, based on IFRS as adopted by the EU;
• Non-controlling interests and share options not yet exercised; and
• Total financial leverage.
Aegon’s fixed charge coverage is a measure of the Company’s ability to service its financial leverage. It is calculated as the sum of underlying earnings
before tax and interest expenses on financial leverage divided by interest payments on financial leverage. The fixed charge coverage includes the impact
of interest rate hedging.
Operational leverage
Although operational leverage is not considered part of Aegon’s total capitalization, it is an important source of liquidity and funding. Operational leverage
relates primarily to financing Aegon’s mortgage portfolios through securitizations, warehouse facilities, covered bonds and the use of FHLB facilities.
Funding and back-up facilities
The majority of Aegon’s financial leverage is issued by Aegon N.V., the parent company. A limited number of other Aegon companies have also issued
debt securities, but for the most part these securities are guaranteed by Aegon N.V.
Aegon N.V. has regular access to international capital markets under a USD 6 billion debt issuance program. Access to the capital market in the United
States is made possible by a separate shelf registration.
Aegon also has access to domestic and international money markets through its USD 2.5 billion commercial paper programs. On June 30, 2019, Aegon
had EUR 54 million outstanding under these programs.
To support its commercial paper programs and need for Letters of Credit (LOCs), and to enhance its liquidity position, Aegon maintains backup credit and
LOC facilities with international lenders. The Company’s principal arrangement is a EUR 2 billion syndicated revolving credit facility that matures in 2023,
and an additional LOC facility of USD 2.6 billion, which matures in 2021. In addition, Aegon also maintains various shorter-dated bilateral backup liquidity,
and committed and uncommitted LOC facilities.
Unaudited Page 75
Liquidity management
Liquidity management is a fundamental building block of Aegon’s overall financial planning and capital allocation processes. The Company’s liquidity risk
policy sets guidelines for its operating companies and the holding in order to achieve a prudent liquidity profile and to meet cash demands even under
extreme conditions.
Liquidity is coordinated centrally and managed both at Aegon N.V. and at the operating unit level. Aegon maintains a liquidity policy that requires all
operating units to project and assess their sources and uses of liquidity over a two-year period under normal and severe business and market scenarios.
This policy ensures that liquidity is measured and managed consistently across the Company, and that liquidity stress management plans are in place.
Sources and uses of liquidity
Liquidity in Aegon’s subsidiaries
Aegon’s operating units are primarily engaged in the life insurance and pensions business, which is a long-term activity with relatively illiquid liabilities and
generally matching assets. Liquidity consists of liquid assets held in investment portfolios, in addition to inflows generated by premium payments and
customer deposits. These are used primarily to purchase investments, as well as to fund benefit payments to policyholders, policy surrenders, operating
expenses, and, if the subsidiary’s capital position allows, to pay dividends to the holding.
After investments have been made in new business to generate organic growth, capital generated by Aegon’s operating units is available for distribution
to the holding company, while maintaining a capital and liquidity position in the operating units in line with Aegon’s capital management and liquidity risk
policies. In addition, the ability of Aegon’s insurance subsidiaries to transfer funds to the holding company is also constrained by the need for these
subsidiaries to remain adequately capitalized at the levels set by local insurance regulations, and as administered by local insurance regulatory
authorities.
Aegon N.V.
At the holding company Aegon N.V., liquidity is sourced from internal dividends from operating units and through the capital markets. The main sources
and uses of liquidity at the holding company Aegon N.V. are dividends from operating units, movements in debt, net expenses (including interest), funding
operations, capital returns to shareholders, and the balance of acquisitions and divestitures. In addition, contingent internal and external liquidity
programs are maintained to provide additional safeguards against extreme unexpected liquidity stresses.
Aegon uses cash flows from its operating units to pay for holding expenses, including funding costs. The remaining cash flow is available to execute
Aegon’s strategy and to fund dividends on its shares.
When determining whether to declare or propose a dividend, Aegon’s Executive Board balances prudence with offering an attractive return to
shareholders. This is particularly important during adverse economic and/or financial market conditions. Furthermore, Aegon’s operating subsidiaries are
subject to local insurance regulations that could restrict dividends to be paid to the holding company. There is no requirement or assurance that Aegon
will declare and pay any dividends.
Unaudited Page 76

Aegon’s holding excess cash
The ability of the holding company to meet its cash obligations depends on the amount of liquid assets on its balance sheet and on the ability of the
operating units to pay dividends to the holding company. In order to ensure the holding company’s ability to fulfill its cash obligations and maintain
sufficient management flexibility to manage capital and liquidity support for Aegon’s operating units and external dividend stability, it is the Company’s
policy that the holding excess cash position, including Aegon’s centrally managed (unregulated) holding companies, is managed to a target range of EUR
1.0 to 1.5 billion.
On June 30, 2019, Aegon held a balance of EUR 1.6 billion in excess cash at the holding, compared with EUR 1.3 billion on December 31, 2018. The
increase of EUR 0.3 billion reflects the net impact of dividends from subsidiaries and capital injections in subsidiaries, divestments, net interest charges,
holding expenses, debt issuance and redemption and capital returns to shareholders. Refinancing activities led to a temporary increase in holding excess
cash of EUR 50 million.
Aegon’s liquidity is invested in accordance with the Company’s internal risk management policies. Aegon believes that its working capital, backed by its
external funding programs and facilities, is ample for the Company’s present requirements.
Unaudited Page 77
Disclaimer
Cautionary note regarding non-IFRS measures
This document includes the following non-IFRS financial measures: underlying earnings before tax, income tax and income before tax. These non-IFRS measures are calculated by consolidating on
a proportionate basis Aegon’s joint ventures and associated companies. The reconciliation of these measures to the most comparable IFRS measure is provided in note 3 ‘Segment information’ of
Aegon’s Condensed Consolidated Interim Financial Statements. Aegon believes that these non-IFRS measures, together with the IFRS information, provide meaningful supplemental information
about the underlying operating results of Aegon’s business including insight into the financial measures that senior management uses in managing the business.
Forward-looking statements
The statements contained in this document that are not historical facts are forward-looking statements as defined in the US Private Securities Litigation Reform Act of 1995. The following are words
that identify such forward-looking statements: aim, believe, estimate, target, intend, may, expect, anticipate, predict, project, counting on, plan, continue, want, forecast, goal, should, would, is
confident, will, and similar expressions as they relate to Aegon. These statements are not guarantees of future performance and involve risks, uncertainties and assumptions that are difficult to
predict. Aegon undertakes no obligation to publicly update or revise any forward-looking statements. Readers are cautioned not to place undue reliance on these forward-looking statements, which
merely reflect company expectations at the time of writing. Actual results may differ materially from expectations conveyed in forward-looking statements due to changes caused by various risks and
uncertainties. Such risks and uncertainties include but are not limited to the following:
o Changes in general economic conditions, particularly in the United States, the Netherlands and the United Kingdom;
o Changes in the performance of financial markets, including emerging markets, such as with regard to:
– The frequency and severity of defaults by issuers in Aegon’s fixed income investment portfolios;
– The effects of corporate bankruptcies and/or accounting restatements on the financial markets and the resulting decline in the value of equity and debt securities Aegon holds; and
– The effects of declining creditworthiness of certain private sector securities and the resulting decline in the value of government exposure that Aegon holds;
o Changes in the performance of Aegon’s investment portfolio and decline in ratings of Aegon’s counterparties;
o Consequences of a potential (partial) break-up of the euro;
o Consequences of the anticipated exit of the United Kingdom from the European Union;
o The frequency and severity of insured loss events;
o Changes affecting longevity, mortality, morbidity, persistence and other factors that may impact the profitability of Aegon’s insurance products;
o Reinsurers to whom Aegon has ceded significant underwriting risks may fail to meet their obligations;
o Changes affecting interest rate levels and continuing low or rapidly changing interest rate levels;
o Changes affecting currency exchange rates, in particular the EUR/USD and EUR/GBP exchange rates;
o Changes in the availability of, and costs associated with, liquidity sources such as bank and capital markets funding, as well as conditions in the credit markets in general such as changes in borrower and
counterparty creditworthiness;
o Increasing levels of competition in the United States, the Netherlands, the United Kingdom and emerging markets;
o Changes in laws and regulations, particularly those affecting Aegon’s operations’ ability to hire and retain key personnel, taxation of Aegon companies, the products Aegon sells, and the attractiveness of
certain products to its consumers;
o Regulatory changes relating to the pensions, investment, and insurance industries in the jurisdictions in which Aegon operates;
o Standard setting initiatives of supranational standard setting bodies such as the Financial Stability Board and the International Association of Insurance Supervisors or changes to such standards that may
have an impact on regional (such as EU), national or US federal or state level financial regulation or the application thereof to Aegon, including the designation of Aegon by the Financial Stability Board as a
Global Systemically Important Insurer (G-SII);
o Changes in customer behavior and public opinion in general related to, among other things, the type of products Aegon sells, including legal, regulatory or commercial necessity to meet changing customer
expectations;
o Acts of God, acts of terrorism, acts of war and pandemics;
o Changes in the policies of central banks and/or governments;
o Lowering of one or more of Aegon’s debt ratings issued by recognized rating organizations and the adverse impact such action may have on Aegon’s ability to raise capital and on its liquidity and financial
condition;
o Lowering of one or more of insurer financial strength ratings of Aegon’s insurance subsidiaries and the adverse impact such action may have on the premium writings, policy retention, profitability and liquidity
of its insurance subsidiaries;
o The effect of the European Union’s Solvency II requirements and other regulations in other jurisdictions affecting the capital Aegon is required to maintain;
o Litigation or regulatory action that could require Aegon to pay significant damages or change the way Aegon does business;
o As Aegon’s operations support complex transactions and are highly dependent on the proper functioning of information technology, a computer system failure or security breach may disrupt Aegon’s
business, damage its reputation and adversely affect its results of operations, financial condition and cash flows;
o Customer responsiveness to both new products and distribution channels;
o Competitive, legal, regulatory, or tax changes that affect profitability, the distribution cost of or demand for Aegon’s products;
o Changes in accounting regulations and policies or a change by Aegon in applying such regulations and policies, voluntarily or otherwise, which may affect Aegon’s reported results and shareholders’ equity;
o Aegon’s projected results are highly sensitive to complex mathematical models of financial markets, mortality, longevity, and other dynamic systems subject to shocks and unpredictable volatility. Should
assumptions to these models later prove incorrect, or should errors in those models escape the controls in place to detect them, future performance will vary from projected results;
o The impact of acquisitions and divestitures, restructurings, product withdrawals and other unusual items, including Aegon’s ability to integrate acquisitions and to obtain the anticipated results and synergies
from acquisitions;
o Catastrophic events, either manmade or by nature, could result in material losses and significantly interrupt Aegon’s business; and
o Aegon’s failure to achieve anticipated levels of earnings or operational efficiencies as well as other cost saving and excess cash and leverage ratio management initiatives.
This press release contains information that qualifies, or may qualify, as inside information within the meaning of Article 7(1) of the EU Market Abuse Regulation (596/2014). Further details of
potential risks and uncertainties affecting Aegon are described in its filings with the Netherlands Authority for the Financial Markets and the US Securities and Exchange Commission, including the
Annual Report. These forward-looking statements speak only as of the date of this document. Except as required by any applicable law or regulation, Aegon expressly disclaims any obligation or
undertaking to release publicly any updates or revisions to any forward-looking statements contained herein to reflect any change in Aegon’s expectations with regard thereto or any change in
events, conditions or circumstances on which any such statement is based.
Unaudited Page 78