Embed Size (px)
Citation preview


UNITED STATESSECURITIES AND EXCHANGE COMMISSION
Washington, D.C. 20549
FORM 20-F(Mark One)
☐ REGISTRATION STATEMENT PURSUANT TO SECTION 12(b) OR (g) OF THE SECURITIES EXCHANGE ACTOF 1934
or☒ ANNUAL REPORT PURSUANT TO SECTION 13 OR 15(d) OF THE SECURITIES EXCHANGE ACT OF 1934
For the fiscal year ended December 31, 2018Or
☐ TRANSITION REPORT PURSUANT TO SECTION 13 OR 15(d) OF THE SECURITIES EXCHANGE ACT OF 1934Or
☐ SHELL COMPANY REPORT PURSUANT TO SECTION 13 OR 15(d) OF THE SECURITIES EXCHANGE ACT OF 1934
Date of event requiring this shell company reportFor the transition period from to
Commission File Number: 001-31368
Sanofi(Exact name of registrant as specified in its charter)
N/A(Translation of registrant’s name into English)
France(Jurisdiction of incorporation or organization)
54, Rue La Boétie, 75008 Paris, France(Address of principal executive offices)
Karen Linehan, Executive Vice President Legal Affairs and General Counsel54, Rue La Boétie, 75008 Paris, France. Fax: 011 + 33 1 53 77 43 03. Tel: 011 + 33 1 53 77 40 00
(Name, Telephone, E-mail and/or Facsimile number and Address of Company Contact Person)
Securities registered or to be registered pursuant to Section 12(b) of the Act:Title of each class: Name of each exchange on which registered:
American Depositary Shares, each representing one halfof one ordinary share, par value €2 per share NASDAQ Global Select Market
Ordinary shares, par value €2 per share NASDAQ Global Select Market*Contingent Value Rights NASDAQ Global Market
Securities registered pursuant to Section 12(g) of the Act: NoneThe number of outstanding shares of each of the issuer’s classes of capital or common stock as of December 31,
2018 was:Ordinary shares: 1,245,454,385
Indicate by check mark if the registrant is a well-known seasoned issuer, as defined in Rule 405 of the SecuritiesAct. YES ☒ NO ☐.If this report is an annual or transition report, indicate by check mark if the registrant is not required to file reports pursuant toSection 13 or 15(d) of the Securities Exchange Act of 1934. YES ☐ NO ☒.Indicate by check mark whether the registrant (1) has filed all reports required to be filed by Section 13 or 15(d) of the SecuritiesExchange Act of 1934 during the preceding 12 months (or for such shorter period that the registrant was required to file suchreports), and (2) has been subject to such filing requirements for the past 90 days. Yes ☒ No ☐Indicate by check mark whether the registrant has submitted electronically every Interactive Data File required to be submittedpursuant to Rule 405 of Regulation S-T (§232.405 of this chapter) during the preceding 12 months (or for such shorter period thatthe registrant was required to submit such files). Yes ☒ No ☐Indicate by check mark whether the registrant is a large accelerated filer, an accelerated filer, a non-accelerated filer or anemerging growth company. See definition of “large accelerated filer,” “accelerated filer” or “emerging growth company” inRule 12b-2 of the Exchange Act.
Large accelerated filer ☒ Accelerated filer ☐ Non-accelerated filer ☐ Emerging growth company ☐If an emerging growth company that prepares its financial statements in accordance with U.S. GAAP, indicate by check mark if theregistrant has elected not to use the extended transition period for complying with any new or revised financial accounting standards†provided pursuant to Section 13(a) of the Exchange Act. ☐
† The term “new or revised financial accounting standard” refers to any update issued by the Financial Accounting StandardsBoard to its Accounting Standards Codification after April 5, 2012.
Indicate by check mark which basis of accounting the registrant has used to prepare the financial statements included inthis filing:
U.S. GAAP ☐International Financial Reporting Standards as issued by
the International Accounting Standards Board ☒ Other ☐If “Other” has been checked in response to the previous question, indicate by check mark which financial statement item theregistrant has elected to follow. Item 17 ☐ Item 18 ☐If this is an annual report, indicate by check mark whether the registrant is a shell company (as defined in Rule 12b-2 of theExchange Act). Yes ☐ No ☒.*Not for trading but only in connection with the registration of American Depositary Shares representing such ordinary shares.
Presentation of financial and otherinformationThe consolidated financial statements contained in this annualreport on Form 20-F have been prepared in accordance withInternational Financial Reporting Standards (IFRS) as issued bythe International Accounting Standards Board (IASB) and withIFRS as adopted by the European Union, as ofDecember 31, 2018.
Unless the context requires otherwise, the terms “Sanofi,” the“Company,” the “Group,” “we,” “our” or “us” refer to Sanofi and itsconsolidated subsidiaries.
All references herein to “United States” or “US” are to theUnited States of America, references to “dollars” or “$” are to thecurrency of the United States, references to “France” are to theRepublic of France, and references to “euro” and “€” are to thecurrency of the European Union member states (includingFrance) participating in the European Monetary Union.
Brand names appearing in this annual report are trademarks ofSanofi and/or its affiliates, with the exception of:
◆ trademarks used or that may be or have been used underlicense by Sanofi and/or its affiliates, such as Actonel®, atrademark of Actavis; Aldurazyme®, a trademark of the JointVenture Biomarin/Genzyme LLC; Cialis® OTC, a trademark ofEli Lilly; Leukine®, a trademark of Alcafleu; UshStat®, atrademark of Oxford Biomedica; Vaxelis®, a trademark of MCMVaccine Co (USA) and MCM Vaccine B.V. (Netherlands); andZaltrap®, a trademark of Regeneron in the United States;
◆ trademarks sold by Sanofi and/or its affiliates to a third party,such as Altace®, a trademark of King Pharmaceuticals in theUnited States; Hyalgan®, a trademark of Fidia FarmaceuticiS.p.A.; Insulia®, a trademark of Voluntis; LibertyLink® Rice601, LibertyLink® Rice 604 and StarLink®, trademarks ofBayer; and
◆ other third party trademarks such as Aabasaglar®, Basaglar®
and Humalog®, trademarks of Eli Lilly; Eylia®, a trademark ofRegeneron; GLAAS®, a trademark of Immune Design ;Kyprolis®, a trademark of Onyx Pharmaceuticals Inc.;Revlimid® trademark of Celgene Corporation; Semglee™, atrademark of Mylan Pharmaceuticals Inc.; Velcade®, atrademark of Millenium Pharmaceuticals Inc ; Xyzal® Allergy24, a trademark of GSK in some countries and UCB Farchim inother countries; and Zantac®, a trademark of Glaxo GroupLimited.
Not all trademarks related to investigational agents have beenauthorized as of the date of this annual report by the relevanthealth authorities; for instance, the Lyxumia® trade name has notbeen approved by the FDA.
The data relating to market shares and ranking information forpharmaceutical products, in particular as presented in “Item 4.Information on the Company – B. Business Overview –B.6. Markets – B.6.1. Marketing and distribution,” are basedmainly on sales data excluding vaccines and in constant euros(unless otherwise indicated) on a September 2018 MAT (Moving
Annual Total) basis. The data are mainly from IQVIA local salesaudit, supplemented by country-specific sources.
Data relating to market shares and ranking information presentedherein for our Consumer Healthcare products are based on salesdata from Nicholas Hall.
Data relating to market shares and ranking information presentedherein for our vaccines business are based on internal estimatesunless stated otherwise.
Product indications described in this annual report are compositesummaries of the major indications approved in the product’sprincipal markets. Not all indications are necessarily available ineach of the markets in which the products are approved. Thesummaries presented herein for the purpose of financial reportingdo not substitute for careful consideration of the full labelingapproved in each market.
Cautionary statement regardingforward-looking statementsThis Annual Report contains certain forward-looking statementswithin the meaning of the Private Securities Litigation Reform Actof 1995, as amended. We may also make written or oral forward-looking statements in our periodic reports to the Securities andExchange Commission on Form 6-K, in our annual report toshareholders, in our offering circulars and prospectuses, in pressreleases and other written materials and in oral statements madeby our officers, directors or employees to third parties. Examplesof such forward-looking statements include:
◆ projections of operating revenues, net income, business netincome, earnings per share, business earnings per share,capital expenditures, cost savings, restructuring costs, positiveor negative synergies, dividends, capital structure or otherfinancial items or ratios;
◆ statements of our profit forecasts, trends, plans, objectives orgoals, including those relating to products, clinical trials,regulatory approvals and competition; and
◆ statements about our future events and economic performanceor that of France, the United States or any other countries inwhich we operate.
This information is based on data, assumptions and estimatesconsidered as reasonable by Sanofi as at the date of this annualreport and undue reliance should not be placed on suchstatements.
Words such as “believe,” “anticipate,” “plan,” “expect,” “intend,”“target,” “estimate,” “project,” “predict,” “forecast,” “guideline,”“should” and similar expressions are intended to identify forward-looking statements but are not the exclusive means of identifyingsuch statements.
Forward-looking statements involve inherent, known andunknown, risks and uncertainties associated with the regulatory,economic, financial and competitive environment, and otherfactors that could cause future results and objectives to differmaterially from those expressed or implied in the forward-lookingstatements.

Risk factors which could affect future results and cause actualresults to differ materially from those contained in any forward-looking statements are discussed under “Item 3. KeyInformation – D. Risk Factors”. Additional risks, not currentlyknown or considered immaterial by the Group, may have the
same unfavorable effect and investors may lose all or part of theirinvestment.
Forward-looking statements speak only as of the date they aremade. Other than required by law, we do not undertake anyobligation to update them in light of new information or futuredevelopments.

AbbreviationsPrincipal abbreviations used in the Annual Report on Form 20-F
ADR American Depositary Receipt
ADS American Depositary Share
AFEPAssociation française des entreprises privées (FrenchAssociation of Large Companies)
AMFAutorité des marchés financiers (the French marketregulator)
ANDA Abbreviated New Drug Application
BLA Biologic License Application
BMS Bristol-Myers Squibb
CEO Chief Executive Officer
CER Constant exchange rates
CGU Cash generating unit
CHC Consumer Healthcare
CHMP Committee for Medicinal Products for Human Use
CVR Contingent value right
ECB European Central Bank
EFPIAEuropean Federation of Pharmaceutical Industries andAssociations
EMA European Medicines Agency
EU European Union
FDA US Food and Drug Administration
GAVI Global Alliance for Vaccines and Immunisation
GBU Global Business Unit
GCP Good clinical practices
GDP Good distribution practices
GLP Good laboratory practices
GLP-1 Glucagon-like peptide-1
GMP Good manufacturing practices
Hib Haemophilus influenzae type b
HSE Health, Safety and Environment
IASB International Accounting Standards Board
ICH International Council for Harmonization
IFPMAInternational Federation of PharmaceuticalManufacturers & Associations
IFRS International Financial Reporting Standards
IPV Inactivated polio vaccine
ISIN International Securities Identification Number
J-MHLW Japanese Ministry of Health, Labor and Welfare
LSD Lysosomal storage disorder
MEDEFMouvement des entreprises de France (French businessconfederation)
MS Multiple sclerosis
NASDAQNational Association of Securities Dealers AutomatedQuotations
NDA New Drug Application
NHI National Health Insurance (Japan)
NYSE New York Stock Exchange
OECD Organisation for Economic Co-operation and Development
OPV Oral polio vaccine
OTC Over the counter
PhRMA Pharmaceutical Research and Manufacturers of America
PMDA Pharmaceuticals and Medical Devices Agency (Japan)
PRV Priority Review Voucher
PTE Patent Term Extension
QIV Quadrivalent influenza vaccine
R&D Research and development
ROA Return on assets
SA Société anonyme (French public limited corporation)
SEC US Securities and Exchange Commission
SPC Supplementary Protection Certificate
TSR Total shareholder return
UNICEF United Nations Children’s Emergency Fund
US United States of America
WHO World Health Organization

TABLE OF CONTENTS 1 PART I 1
Item 1. IDENTITY OF DIRECTORS, SENIOR MANAGEMENT AND ADVISERS 1
Item 2. OFFER STATISTICS AND EXPECTED TIMETABLE 1
Item 3. KEY INFORMATION 1
A. Selected Financial Data 1
B. Capitalization and Indebtedness 3
C. Reasons for Offer and Use of Proceeds 3
D. Risk Factors 4
Item 4. INFORMATION ON THE COMPANY 20
A/ History and Development of the Company 21
B/ Business Overview 22
C/ Organizational Structure 70
D/ Property, Plant and Equipment 71
Item 5. OPERATING AND FINANCIAL REVIEW AND PROSPECTS 74
A/ Operating results 74
B. Liquidity and Capital Resources 123
C. Off-Balance Sheet Arrangements / Contractual Obligations and Other Commercial Commitments 128
Item 6. DIRECTORS, SENIOR MANAGEMENT AND EMPLOYEES 130
A. Directors and Senior Management 130
B. Compensation 160
C. Board Practices 180
D. Employees 187
E. Share Ownership 188
Item 7. MAJOR SHAREHOLDERS AND RELATED PARTY TRANSACTIONS 192
A. Major Shareholders 192
B. Related Party Transactions 193
C. Interests of Experts and Counsel 193
Item 8. FINANCIAL INFORMATION 194
A. Consolidated Financial Statements and Other Financial Information 194
B. Significant Changes 198
Item 9. THE OFFER AND LISTING 199
A. Offer and Listing Details 199
B. Plan of Distribution 200
C. Markets 200
D. Selling Shareholders 200
E. Dilution 200
F. Expenses of the Issue 200
Item 10. ADDITIONAL INFORMATION 217
A. Memorandum and Articles of Association 201
C. Material Contracts 213
D. Exchange Controls 214
E. Taxation 214
F. Dividends and Paying Agents 218
G. Statement by Experts 218
H. Documents on Display 218
I. Subsidiary Information 218
Item 11. QUANTITATIVE AND QUALITATIVE DISCLOSURES ABOUT MARKET RISK 219
Item 12. DESCRIPTION OF SECURITIES OTHER THAN EQUITY SECURITIES 223
2 PART II 229 Item 13. DEFAULTS, DIVIDEND ARREARAGES
AND DELINQUENCIES 229
Item 14. MATERIAL MODIFICATIONS TO THE RIGHTS OF SECURITY HOLDERS 229
Item 15. CONTROLS AND PROCEDURES 229
Item 16A. AUDIT COMMITTEE FINANCIAL EXPERT 230
Item 16B. CODE OF ETHICS 230
Item 16C. PRINCIPAL ACCOUNTANTS’ FEES AND SERVICES 230
Item 16D. EXEMPTIONS FROM THE LISTING STANDARDS FOR AUDIT COMMITTEES 230
Item 16E. PURCHASES OF EQUITY SECURITIES BY THE ISSUER AND AFFILIATED PURCHASERS 231
Item 16F. CHANGE IN REGISTRANT’S CERTIFYING ACCOUNTANT 231
Item 16G. CORPORATE GOVERNANCE 231
Item 16H. MINE SAFETY DISCLOSURE 232
3 PART III 233 Item 17. FINANCIAL STATEMENTS 233
Item 18. FINANCIAL STATEMENTS 233
Item 19. EXHIBITS 233

[THIS PAGE INTENTIONALLY LEFT BLANK]

ITEM 1. IDENTITY OF DIRECTORS, SENIOR MANAGEMENT AND ADVISERS
Part I
Item 1. Identity of Directors, Senior Management and Advisers N/A
Item 2. Offer Statistics and Expected Timetable N/A
Item 3. Key Information
A. Selected financial data
Summary of selected financial data
The tables below set forth selected consolidated financial data for Sanofi. These financial data are derived from the Sanofi consolidated financial statements. The Sanofi consolidated financial statements for the years ended December 31, 2018, 2017 and 2016 are included in Item 18 of this annual report.
The consolidated financial statements of Sanofi for the years ended December 31, 2018, 2017 and 2016 have been prepared in compliance with IFRS as issued by the International Accounting Standards Board (IASB) and with IFRS as adopted by the European Union as of December 31, 2018. The term “IFRS” refers collectively to international accounting and financial reporting standards (IAS and IFRS) and to interpretations of the interpretations committees (SIC and IFRIC) mandatorily applicable as of December 31, 2018.
Sanofi reports its financial results in euros.
SANOFI / FORM 20-F 2018 1
ITEM 3. KEY INFORMATION
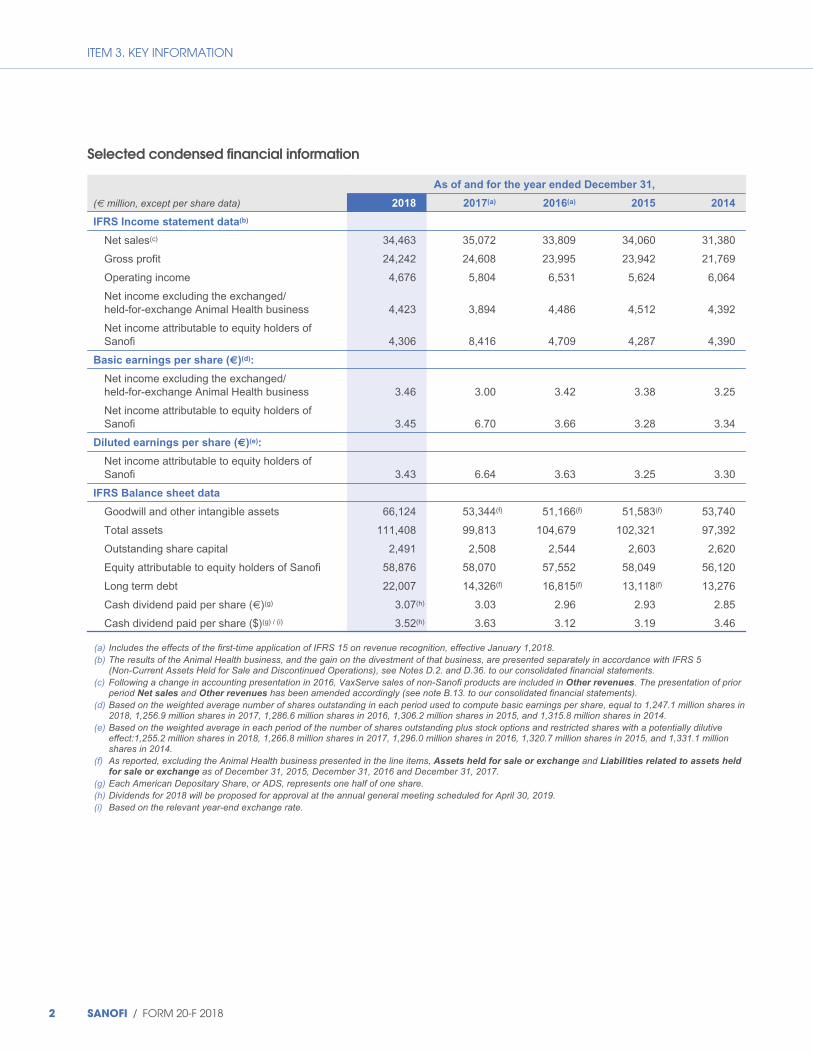
Selected condensed financial information
As of and for the year ended December 31,
(€ million, except per share data) 2018 2017(a) 2016(a) 2015 2014
IFRS Income statement data(b)
Net sales(c) 34,463 35,072 33,809 34,060 31,380
Gross profit 24,242 24,608 23,995 23,942 21,769
Operating income 4,676 5,804 6,531 5,624 6,064
Net income excluding the exchanged/held-for-exchange Animal Health business 4,423 3,894 4,486 4,512 4,392
Net income attributable to equity holders of Sanofi 4,306 8,416 4,709 4,287 4,390
Basic earnings per share (€)(d):
Net income excluding the exchanged/held-for-exchange Animal Health business 3.46 3.00 3.42 3.38 3.25
Net income attributable to equity holders of Sanofi 3.45 6.70 3.66 3.28 3.34
Diluted earnings per share (€)(e):
Net income attributable to equity holders of Sanofi 3.43 6.64 3.63 3.25 3.30
IFRS Balance sheet data
Goodwill and other intangible assets 66,124 53,344(f) 51,166(f) 51,583(f) 53,740
Total assets 111,408 99,813 104,679 102,321 97,392
Outstanding share capital 2,491 2,508 2,544 2,603 2,620
Equity attributable to equity holders of Sanofi 58,876 58,070 57,552 58,049 56,120
Long term debt 22,007 14,326(f) 16,815(f) 13,118(f) 13,276
Cash dividend paid per share (€)(g) 3.07(h) 3.03 2.96 2.93 2.85
Cash dividend paid per share ($)(g) / (i) 3.52(h) 3.63 3.12 3.19 3.46
(a) Includes the effects of the first-time application of IFRS 15 on revenue recognition, effective January 1,2018. (b) The results of the Animal Health business, and the gain on the divestment of that business, are presented separately in accordance with IFRS 5
(Non-Current Assets Held for Sale and Discontinued Operations), see Notes D.2. and D.36. to our consolidated financial statements. (c) Following a change in accounting presentation in 2016, VaxServe sales of non-Sanofi products are included in Other revenues. The presentation of prior
period Net sales and Other revenues has been amended accordingly (see note B.13. to our consolidated financial statements). (d) Based on the weighted average number of shares outstanding in each period used to compute basic earnings per share, equal to 1,247.1 million shares in
2018, 1,256.9 million shares in 2017, 1,286.6 million shares in 2016, 1,306.2 million shares in 2015, and 1,315.8 million shares in 2014. (e) Based on the weighted average in each period of the number of shares outstanding plus stock options and restricted shares with a potentially dilutive
effect:1,255.2 million shares in 2018, 1,266.8 million shares in 2017, 1,296.0 million shares in 2016, 1,320.7 million shares in 2015, and 1,331.1 million shares in 2014.
(f) As reported, excluding the Animal Health business presented in the line items, Assets held for sale or exchange and Liabilities related to assets held for sale or exchange as of December 31, 2015, December 31, 2016 and December 31, 2017.
(g) Each American Depositary Share, or ADS, represents one half of one share. (h) Dividends for 2018 will be proposed for approval at the annual general meeting scheduled for April 30, 2019. (i) Based on the relevant year-end exchange rate.
2 SANOFI / FORM 20-F 2018

ITEM 3. KEY INFORMATION
Selected exchange rate information
The following table sets forth, for the periods and dates indicated, certain information concerning the exchange rates for the euro from 2014 through March 2019 expressed in US dollars per euro. The information concerning the US dollar exchange rate is based on the noon buying rate in New York City for cable transfers in foreign currencies as certified for customs purposes by the
Federal Reserve Bank of New York (the “Noon Buying Rate”). We provide the exchange rates below solely for your convenience. We do not represent that euros were, could have been, or could be, converted into US dollars at these rates or at any other rate. For information regarding the effect of currency fluctuations on our results of operations, see “Item 5. Operating and Financial Review and Prospects” and “Item 11. Quantitative and Qualitative Disclosures about Market Risk.”
Period- Average
(U.S. dollar per euro) end Rate Rate(a) High Low
2014 1.21 1.32 1.39 1.21
2015 1.09 1.10 1.20 1.05
2016 1.06 1.10 1.15 1.04
2017 1.20 1.14 1.20 1.04
2018 1.15 1.18 1.25 1.13
Last 6 months
2018
September 1.16 1.17 1.18 1.16
October 1.13 1.15 1.16 1.13
November 1.13 1.14 1.15 1.13
December 1.15 1.14 1.15 1.13
2019
January 1.15 1.14 1.15 1.13
February 1.13 1.14 1.15 1.13
March(b) 1.13 1.13 1.14 1.13
(a) The average of the Noon Buying Rates on the last business day of each month during the relevant period for the full year average, and on each business day of the month for the monthly average. The latest available Noon Buying Rate being March 1, 2019, we have used European Central Bank Rates for the period from March 4, 2019 through March 7, 2019.
(b) In each case, measured through March 7, 2019.
On March 7, 2019 the European Central Bank Rate was 1.13 per euro.
B. Capitalization and indebtedness N/A
C. Reasons for offer and use of proceeds N/A
SANOFI / FORM 20-F 2018 3

ITEM 3. KEY INFORMATION
D. Risk factors Important factors that could cause actual financial, business, research or operating results to differ materially from expectations are disclosed in this annual report, including without limitation the following risk factors. Investors should carefully consider all the information set forth in the following risk factors before deciding to invest in any of the Company’s securities. In addition to the risks listed below, we may be subject to other material risks that as of the date of this report are not currently known to us or that we deem immaterial at this time.
Risks relating to legal and regulatory matters
We rely on our patents and other proprietary rights to
provide exclusive rights to market certain of our
products, and if such patents and other rights were
limited, invalidated or circumvented, our financial results
could be materially and adversely affected.
Through patent and other proprietary rights such as data exclusivity or supplementary protection certificates in Europe, we hold exclusivity rights for a number of our research-based products. However, the protection that we are able to obtain varies in its duration and scope from product to product and country by country. This protection may not be sufficient to maintain effective product exclusivity because of local differences in the patents, in national laws, applicable legal systems or developments in law or jurisprudence, which may give rise to inconsistent judgments when we assert or defend our patents.
Moreover, patent and other proprietary rights do not always provide effective protection for our products. Manufacturers of generic products or biosimilars are increasingly seeking to challenge patent validity or coverage before the patents expire, and manufacturers of biosimilars or interchangeable versions of the products are seeking to have their version of the product approved before the exclusivity period ends. Furthermore, in an infringement suit against a third-party, we may not prevail and the decision rendered may not conclude that our patent or other proprietary rights are valid, enforceable or infringed. Our competitors may also successfully avoid patents, for example through design innovation, and we may not hold sufficient evidence of infringement to bring suit.
We are involved in litigation worldwide to enforce certain of our patent rights against generics, proposed generics and biosimilars of our small molecule and biological pharmaceutical products (see “Item 8. Financial Information – A. Consolidated Financial Statements and Other Financial Information – Information on Legal or Arbitration Proceedings” for additional information). Even in cases where we ultimately prevail in an infringement claim, legal remedies available for harm caused to us by infringing products may be inadequate to make us whole. A competitor may launch a generic or a biosimilar product “at risk” before the initiation or completion of the court proceedings, and the court may decline to grant us a preliminary injunction to halt
further “at risk” sales and order removal of the infringing product from the market. Additionally, while we would be entitled to obtain damages in such a case, the amount that we may ultimately be awarded and able to collect may be insufficient to compensate all harm caused to us. A successful result against a competing product for a given patent or in a specific country is not necessarily predictive of our future success against another competing product or in another country because of local variations in the patents and patent laws.
In addition, if we lose patent protection as a result of an adverse court decision or a settlement, we face the risk that government and private third-party payers and purchasers of pharmaceutical products may claim damages alleging they have over-reimbursed or overpaid for a drug. For example, in Australia, our patent on clopidogrel was ultimately held invalid. Following this decision, the Australian Government is seeking damages for its alleged over-reimbursement of clopidogrel drugs due to the preliminary injunction we had secured against the sale of generic clopidogrel during the course of the litigation.
In certain cases to terminate or avoid patent litigation, we or our collaborators may be required to obtain licenses from the holders of third-party intellectual property rights that already cover aspects of our existing and future products in order to manufacture, use and/or sell them. Any payments under these licenses may reduce our profits from such products and we may not be able to obtain these licenses on favorable terms or at all.
Third parties may also request a preliminary or a permanent injunction in a country from a court of law to prevent us from marketing a product if they consider that we infringe their patent rights in that country. For example, Sanofi is currently party to patent infringement proceedings in several countries initiated against us and Regeneron by Amgen relating to Praluent® in which Amgen has requested injunctive relief (see Note D.22.b) to the consolidated financial statements included at Item 18 of this annual report for more information). If third parties obtain a preliminary or permanent injunction or if we fail to obtain a required license for a country where a valid third-party intellectual property rights as confirmed by a court of law exist, or if we are unable to alter the design of our technology to fall outside the scope of third-party intellectual property rights, we may be unable to market some of our products in certain countries, which may limit our profitability.
Also, some countries may consider granting a compulsory license to a third-party to use patents protecting an innovator’s product, which limits the value of the patent protection granted to such products.
We have increased the proportion of biological therapeutics in our pipeline relative to traditional small molecule pharmaceutical products. Typically, the development, manufacture, sale and distribution of biological therapeutics is complicated by third-party intellectual property rights (otherwise known as freedom to operate (FTO) issues), to a greater extent than for the development, manufacture, sale and distribution of small molecule therapeutics, because of the types of patents allowed
4 SANOFI / FORM 20-F 2018
ITEM 3. KEY INFORMATION
by national patent offices. Further, our ability to successfully challenge third-party patent rights is dependent on the laws of national courts. Certain countries have laws that provide stronger bases for challenging third-party patent rights compared to the laws that are available to challenge patents in other countries. Therefore, we may be able to invalidate a certain third-party patent in one country but not invalidate counterpart patents in other countries. In addition, we expect to face increasing competition from biosimilars in the future. With the accelerated regulatory pathways provided in the US and Europe for biosimilar drug approval, biosimilars can be a threat to the exclusivity of any biological therapeutics we sell or may market in the future and can pose the same issues as the small molecule generic threat described above. Governments may adopt more permissive approval frameworks (for example, shortening the duration of data exclusivity, or narrowing the scope of new products receiving data exclusivity) which could allow competitors to obtain broader marketing approval for biosimilars including as a substitutable product, increasing competition for our products (see also “– Changes in the laws or regulations that apply to us could affect our business, results of operations and financial condition” below). If a biosimilar version of one of our products were to be approved, it could reduce our sales and/or profitability of that product.
However, through our presence as a manufacturer of generics and biosimilars, we will also utilize patent challenge strategies against other innovators’ patents similar to those of long-established generic companies, though there is no assurance that these strategies will be successful.
If our patents and/or proprietary rights to our products were limited or circumvented, our financial results could be materially and adversely affected.
Product liability claims could adversely affect our
business, results of operations and financial condition.
Product liability is a significant risk for any pharmaceutical company and our product liability exposure could increase given that liability claims relating to our businesses may differ with regard to their nature, scope and level from the types of product liability claims that we have handled in the past. Substantial damages have been awarded and/or settlements agreed – notably in the United States and other common law jurisdictions – against pharmaceutical companies based on claims for injuries allegedly caused by the use of their products. Such claims can also be accompanied by consumer fraud claims by customers or third-party payers seeking reimbursement of the cost of the product.
We are currently defending a number of product liability claims (see Note D.22.a) to the consolidated financial statements included at Item 18 of this annual report) and there can be no assurance that the Company will be successful in defending against these claims or will not face additional claims in the future.
Often establishing the full side effect profile of a pharmaceutical drug goes beyond data derived from preapproval clinical studies which may only involve several hundred to several thousand patients. Routine review and analysis of the continually growing body of post-marketing safety surveillance and clinical trials provide additional information – for example, potential evidence of rare, population-specific or long-term adverse reactions or of drug interactions that were not observed in preapproval clinical studies – and may cause product labeling to evolve over time following interactions with regulatory authorities, including restrictions of therapeutic indications, new contraindications, warnings or precautions and occasionally even the suspension or withdrawal of a product marketing authorization. Following any of these events, pharmaceutical companies can face significant product liability claims.
Furthermore, we commercialize several devices (some of which use new technologies) which, if they malfunction, could cause unexpected damage and lead to product liability claims (see “– Breaches of data security, disruptions of information technology systems and cyber threats could result in financial, legal, business or reputational harm”).
Although we continue to insure a portion of our product liability with third-party carriers, product liability coverage is increasingly difficult and costly to obtain, particularly in the United States. In the future, it is possible that self-insurance may become the sole commercially reasonable means available for managing the product liability financial risk of our pharmaceuticals and vaccines businesses (see “Item 4. Information on the Company – B. Business Overview – B.9. Insurance and Risk Coverage”). In cases where we self-insure, the legal costs that we would bear for handling such claims and potential indemnifications to be paid to claimants could have a negative impact on our financial condition.
Due to insurance conditions, even when we have insurance coverage, recoveries from insurers may not be totally successful. Moreover, insolvency of an insurer could affect our ability to recover claims on policies for which we have already paid a premium.
Product liability claims, regardless of their merits or the ultimate success of the Company’s defense, are costly, divert management’s attention, may harm our reputation and can impact the demand for our products. Substantial product liability claims could materially adversely affect our business, results of operations and financial condition.
Our products and manufacturing facilities are subject to
significant government regulations and approvals, which
are often costly and could result in adverse
consequences to our business if we fail to anticipate the
regulations, comply with them and/or maintain
the required approvals.
Obtaining marketing authorization is a long and highly regulated process requiring us to present extensive documentation and data to the regulatory authorities. Regulatory processes differ
SANOFI / FORM 20-F 2018 5
ITEM 3. KEY INFORMATION
from one jurisdiction and regulatory authority to another. Either at the time of the filing of the application for a marketing authorization or later during its review, each regulatory authority may impose its own requirements which can evolve over time, including requiring local clinical studies, and it may delay or refuse to grant approval even though a product has already been approved in another country. Health authorities are increasingly focusing on product safety and on the risk/benefit profile of pharmaceutical products. In particular, the FDA and the EMA have increased their requirements, particularly in terms of the volume of data needed to demonstrate a product’s efficacy and safety. Even after regulatory approval, marketed products are subject to continual review, risk evaluations or comparative effectiveness studies including post-marketing studies to which at times we have committed as a condition of approval. In addition, following the implementation of European pharmacovigilance legislation in 2012, the Company and the European Regulatory Agencies (under the supervision of the PRAC (Pharmacovigilance Risk Assessment Committee)) have reinforced their systematic and intensive safety signal detection systems, which may detect safety issues even with mature products that have been on the market for a considerable time. This system may result in negative risk/benefit assessments and additional market authorization suspensions or withdrawals. All of these requirements have increased the costs associated with maintaining regulatory approvals and achieving reimbursement for our products. Post-regulatory approval reviews and data analyses can lead to the issuance of recommendations by government agencies, healthcare professional and patient or other specialized organizations regarding the use of products; for example, a recommendation to limit the patient population of a drug’s indication, the imposition of marketing restrictions, or the suspension or withdrawal of the product can result in a reduction in sales volume as well as an increased risk of litigation.
Moreover, to monitor our compliance with applicable regulations, the FDA, the EMA and comparable agencies in other jurisdictions routinely conduct inspections of our facilities and may identify potential deficiencies. We have received notices of deficiencies and FDA Warning Letters in the past following the inspection of some of our facilities and may receive such letters in the future. More generally, if we fail to adequately respond to Regulatory Inspection observations identifying a deficiency during an inspection, or fail to comply with applicable regulatory requirements at all or within the targeted timeline, we could be subject to enforcement, remedial and/or punitive actions by the FDA (such as a Warning Letter), the EMA or other regulatory authorities.
In addition, in order to comply with our duty to report adverse events and safety signals to regulatory authorities, we must regularly train our employees and third parties (such as external sales forces and distributor employees) on regulatory matters. If we fail to train these people, or fail to train them appropriately, or they do not comply with contractual requirements, we may be exposed to the risk that safety events are not reported or not reported in a timely manner in breach of our reporting obligations.
To the extent that new regulations raise the costs of obtaining and maintaining product authorizations, or limit the economic value of a new product to its originator, the growth prospects of our industry and of Sanofi would be diminished. At least 50% of our current development portfolio consists of biological products that may in the future bring new therapeutic responses to current unmet medical needs, but that may also lead to more regulatory and technical constraints. Regulations applicable to biologics are often more complex and extensive than the regulations applicable to other pharmaceutical products. Biologics are also costly investments from an industrial standpoint as biological products are complex to produce. These constraints and costs could adversely affect our business, results of operations and financial condition.
Claims and investigations relating to compliance, ethics,
competition law, marketing practices, pricing, human
rights of workers, data protection and other legal matters
could adversely affect our business, results of
operations and financial condition.
Our industry is heavily regulated. Our business covers an extremely wide range of activities worldwide and involves numerous partners. We are therefore obligated to comply with the laws of all countries in which we operate. However, legal requirements may vary from country to country and new requirements may be imposed on us from time to time. We have adopted a Code of Ethics (the “Code”) that requires employees to comply with applicable laws and regulations, as well as the specific principles and rules of conduct set forth in the Code. We also have policies and procedures designed to help ensure that we, our employees, officers, agents, intermediaries and other third parties comply with applicable laws and regulations (including the US Foreign Corrupt Practices Act (FCPA), the UK Bribery Act, the OECD Anti-Bribery Convention, the French Anti-Corruption measures law (Sapin II) and the French duty of vigilance law and other anti-bribery laws and regulations).
Notwithstanding these efforts, non compliance with laws and regulations may occur and there can be no assurance that we, our officers and/or our directors will not face liability for actions taken with respect to our business.
Any failure to comply directly or indirectly (including as a result of a business partner’s breach) with the laws and regulations applicable to us, including new regulations, could result in substantial liabilities for the Company and harm the Company’s reputation. Governments and regulatory authorities around the world have been strengthening implementation and enforcement activities in recent years, including in relation to anti-bribery, anti-corruption, ethical requirements with respect to medical and scientific research, respect of human rights of workers and data protection legislation.
With respect to data protection legislation, the General Data Protection Regulation (“GDPR”) has created a range of compliance obligations since it came into force within the European Union in May 2018. Violations of the GDPR carry
6 SANOFI / FORM 20-F 2018

ITEM 3. KEY INFORMATION
financial risks due to penalties for data breach or improper processing of personal data (including a possible fine of up to 4% of total worldwide annual turnover for the preceding financial year for the most serious infringements) and may also harm our reputation. Also some uncertainty remains around the legal and regulatory environment for these evolving privacy and data protection laws.
Sanofi and certain of its subsidiaries are under investigation or could become the subject of additional investigations or legal proceedings by various government entities and are defending a number of lawsuits relating to pricing and marketing practices (including, for example, “whistleblower” litigation in the United States). We also face litigation and government investigations or audits, including allegations of corruption, claims related to employment matters, patent and intellectual property disputes, consumer law claims and tax audits. See “Item 8. Financial Information – A. Consolidated Financial Statements and Other Financial Information – Information on Legal or Arbitration Proceedings” and Note D.22. to our consolidated financial statements included at Item 18 of this annual report. Responding to such investigations is costly and may divert management’s attention from our business.
Unfavorable outcomes in any of these matters, or in similar matters that may arise in the future, could preclude the commercialization of our products, harm our reputation, negatively affect the profitability of existing products and subject us to substantial fines (including treble damages and fines based on our sales), punitive damages, penalties and injunctive or administrative remedies, potentially leading to the imposition of additional regulatory controls, monitoring or self-reporting obligations, or exclusion from government reimbursement programs or markets, all of which could have a material adverse effect on our business, results of operations or financial condition.
As such proceedings are unpredictable, we may, after consideration of all relevant factors, decide to enter into settlement agreements to settle certain claims. Such settlements may involve significant monetary payments and/or criminal penalties and may include admissions of wrongdoing. Settlement of healthcare fraud cases in the United States may require companies to enter into a Corporate Integrity Agreement, which is intended to regulate company behavior for a specified period of years.
In September 2018, Sanofi has reached a civil settlement with the US Securities and Exchange Commission (SEC) fully resolving the SEC’s investigation into possible violation of the US Foreign Corrupt Practices Act. Sanofi did not admit any wrongdoing in connection with the settlement but agreed to pay $25 million in penalties and also agreed to a two-year period of self-reporting on the effectiveness of its enhanced internal controls. The DOJ has also completed its related investigation and has declined to pursue any action.
Changes in the laws or regulations that apply to us could
affect our business, results of operations and financial
condition.
All aspects of our business, including research and development, manufacturing, marketing, pricing and sales, are subject to extensive legislation and governmental regulation. Changes in applicable laws and the costs of compliance with such laws and regulations could have a material adverse effect on our business.
For example, governmental authorities are increasingly looking to facilitate generic and biosimilar competition to existing products through new regulatory proposals intended to achieve, or resulting in, changes to the scope of patent or data exclusivity rights and use of accelerated regulatory pathways for generic and biosimilar drug approvals. Such regulatory proposals could make patent prosecution for new products more difficult and time consuming or could adversely affect the exclusivity period for our products (see “– We rely on our patents and other proprietary rights to provide exclusive rights to market certain of our products, and if such patents and other rights were limited, invalidated or circumvented, our financial results could be materially and adversely affected” above). Regarding the United States market, on December 11, 2018, in line with the Trump Administration’s stated goal of enhancing competition for biologicals, the FDA released final guidance defining biologics, transitioning biological products approved under an NDA to a deemed biologics license application (BLA), and outlining an abbreviated pathway for biosimilar licensure. As part of the publication of the final guidance, the FDA is allowing for ongoing comments from the public, which may result in further changes or revisions to such guidance. The potential impact of ongoing comments that may result in revisions to the final guidance is unknown and may negatively affect our market exclusivity or impact pricing considerations in the future. As discussed below, however, the overall status of the Biologics Price Competition and Incentives Act (BPCIA) is uncertain, based on a December 14, 2018 federal court decision which declared the Affordable Care Act (ACA), of which the BPCIA is a part, to be unconstitutional. (see “– The pricing and reimbursement of our products is increasingly affected by decisions of governments and other third parties and cost reduction initiatives” below)
This new competitive environment and the potential regulatory changes and agency guidance may further limit the exclusivity available to innovative products on the market and directly impact pricing, access and reimbursement levels, which may adversely affect our business and future results. See “Item 4. Information on the Company – B. Business Overview – B.6. Markets – B.6.2. Competition” and “– B.6.3. Regulatory framework”.
Also, in Europe, the implementation of new regulations on Medical Devices and In-Vitro Diagnostics that will apply respectively in May 2020 and May 2022, may cause delays in approvals (for new drug-device combination products and new drug-device combination products and new medical devices/IVDs), product discontinuation (for some legacy medical devices & IVDs), and non-compliance risks (regarding post
SANOFI / FORM 20-F 2018 7
ITEM 3. KEY INFORMATION
marketing safety reporting, Unique Device Identification (UDI), European Databank on Medical Devices (EUDAMED)), due to increased requirements in terms of approval process, post-marketing surveillance, traceability and transparency.
In addition to international tax law and regulatory changes such as the OECD Base Erosion and Profit Shifting initiatives and EU directives being implemented (such as EU directive rules against tax avoidance practices or relating to the mandatory automatic exchange of information in relation to reportable cross-border arrangements) changes in tax frameworks, tax reforms and other changes to the way existing tax laws are applied in jurisdictions and major countries where Sanofi and its subsidiaries and affiliates operate could affect our income, our effective tax rate, and consequently our future net income. This particularly applies to French and US tax reforms enacted respectively in December 2018 and December 2017 for which French tax administration and some Internal Revenue Services comments, guidelines and regulations are still expected. Additional tax changes may be enacted in France for instance with respect to the corporate tax rate which could be increased back to 34.4%. These changes may cover matters such as taxation of our operations, intercompany transactions, internal restructuring and more generally taxable income, tax rates, indirect taxation, transfer pricing, R&D tax credits, taxation of intellectual property, dividend taxation, controlled companies or a restriction in certain forms of tax relief. Any of these changes could have a material adverse effect on our business and future results. Additionally, due to the complexity of the fiscal environment, the ultimate resolution of any tax matters may result in payments greater or lesser than amounts accrued.
For information regarding risks related to changes in environmental rules and regulations, see “– Environmental liabilities and costs related to compliance with applicable regulations may have a significant adverse effect on our results of operations” below.
Risks relating to our business
Our research and development efforts may not succeed
in adequately renewing our product portfolio.
Discovering and developing a new product is a costly, lengthy and uncertain process. To be successful in the highly competitive pharmaceutical industry, we must commit substantial resources each year to research and development in order to develop new products to compensate for decreasing sales of products facing patent expiration and termination of regulatory data exclusivity, introduction of lower-priced generics, increasingly aggressive generic commercialization tactics or competition from new products of competitors that are perceived as being superior or equivalent. We must pursue both early stage research and early and late development stages in order to propose a sustainable and well-balanced portfolio of products. In 2018, we spent €5,894 million on research and development, amounting to 17.1% of our net sales.
Our industry is driven by the need for constant innovation, but we may spread ourselves across too many areas of inquiry to be successful and may not be able to improve internal research productivity sufficiently to sustain our pipeline. We may also fail to invest in the right technology platforms, therapeutic areas, and product classes, or fail to build a robust pipeline and fulfill unmet medical needs in a timely manner. Also when we perform portfolio review we may miscalculate the probabilities of success at each phase of the development. Fields of discovery, particularly biotechnology, are highly competitive and characterized by significant and rapid technological changes. Numerous companies are working on the same targets and a product considered as promising at the very beginning of its development may become less attractive if a competitor addressing the same unmet need reaches the market earlier.
The research and development process can generally take 12 to 15 years from discovery to commercial product launch. This process is conducted in various stages in order to test, along with other features, the efficacy, effectiveness and safety of a product. There can be no assurance that any of these product candidates will be proven safe or effective. See “Item 4. Information on the Company – B. Business Overview – B.5. Global Research & Development”. Accordingly, there is a substantial risk at each stage of development – including clinical studies – that we will not achieve our goals of safety and/or efficacy and that we will have to abandon a product in which we have invested substantial amounts of money and human resources, even in late stage development (Phase III). More and more trials are designed with clinical endpoints of superiority; failure to achieve those endpoints could damage the product’s reputation and our overall program. Decisions concerning the studies to be carried out can have a significant impact on the marketing strategy for a given product. Multiple in-depth studies can demonstrate that a product has additional benefits, facilitating the product’s marketing, but such studies are expensive and time consuming and may delay the product’s submission to health authorities for approval. Our ongoing investments in new product launches and research and development for future products could therefore result in increased costs without a proportionate increase in revenues, which would negatively affect our operating results and profitability.
In 2015 we announced that we had up to 18 new medicines and vaccines on track to arrive on the market between 2014-2020, including six key launches. As of the end of 2018, all of those six products have already been approved and launched: Toujeo®, Praluent®, Dengvaxia®, Soliqua® 100/33 / Suliqua®, Kevzara® and Dupixent®. However, there can be no assurance that all of the products approved or launched will achieve commercial success.
In addition, following (or in some cases contemporaneously with) review of a product for a marketing authorization, the medical need served by the product and the corresponding reimbursement are evaluated by governmental agencies and/or third-party payers, requiring in some cases additional studies,
8 SANOFI / FORM 20-F 2018
ITEM 3. KEY INFORMATION
including comparative studies, which may effectively delay marketing, change the population which the new product treats, and add to its development costs.
After marketing approval of our products, other companies or investigators, whether independently or with our authorization, may conduct studies or analysis beyond our control that may ultimately report results negatively affecting our sales either permanently or temporarily, it may take time for us to address these reported findings, leading among other things to a material adverse impact on sales.
The pricing and reimbursement of our products is
increasingly affected by decisions of governments and
other third parties and cost reduction initiatives.
The commercial success of our existing products and our product candidates depends in part on their pricing and the conditions under which our products are reimbursed. Our products continue to be subject to increasing price and reimbursement pressure due, inter alia, to:
◆ price controls imposed by governments in many countries;
◆ increased public attention to the price of drugs and particularly price increases, limiting our ability to set the price, or to manage or increase the price of our products based upon their value;
◆ removal of a number of drugs from government reimbursement schemes (for example products determined to be less cost-effective than alternatives);
◆ partial reimbursement of patient populations within a labelled indication;
◆ increased difficulty in obtaining and maintaining satisfactory drug reimbursement rates;
◆ increase in cost containment policies (including budget limitations) related to health expenses;
◆ governmental and private health care provider policies that favor prescription of generic medicines or substitution of branded products with generic medicines;
◆ more demanding evaluation criteria applied by Health Technology Assessment (HTA) agencies when considering whether to cover new drugs at a certain price level;
◆ more governments using international reference pricing to set or manage the price of drugs based on an external benchmark of a product’s price in other countries;
◆ aggressive pricing strategies by some of our competitors; and
◆ entry of new consumer healthcare competitors offering online sales.
In addition to the pricing pressures they exert, governmental and private third-party payers and purchasers of pharmaceutical products may reduce volumes of sales by restricting access to formularies (including exclusive formularies), managing prescribing via various conditions (including prior authorisations
and step edits) or otherwise discouraging physicians from prescribing our products (see also “– The concentration of the US market exposes us to greater pricing pressure” below).
In the United States, the Affordable Care Act (ACA) has increased the government’s role with respect to price, reimbursement, and coverage levels for healthcare services and products. This law also imposed rebates and fees on pharmaceutical companies. In May 2018, the Trump Administration published its American Patients First proposal, which indicates its plans to investigate the ACA’s impact on private market drug prices and potentially alter the ACA taxes and rebates for Medicaid and Medicaid managed care organizations. On December 14, 2018, a federal judge for the Northern District of Texas, Fort Worth Division, issued a ruling declaring the ACA unconstitutional, which sets the stage for another hearing on the law by the Federal Court of Appeals for the Fifth Circuit and possibly the United States Supreme Court thereafter. Included in the many parts of the ACA that could potentially be affected by the continued litigation is the Biologics Price Competition and Incentives Act. In addition to further judicial review of the ACA, the Trump Administration and other United States federal and state officials are continuing to focus on the cost of health coverage, health care and pharmaceuticals although future policy or the timing of any changes remains unclear, creating significant risks for the sector. At the federal level, legislation like the Bipartisan Budget Act of 2018 amends the ACA, effective January 1, 2019, to close the coverage gap in most Medicare drug plans, and also increases in 2019 the percentage by which a drug manufacturer must discount the cost of prescription drugs from 50 percent under current law to 70 percent. Further, from 2017-2018, at least seven states enacted and an additional 22 states proposed legislation which will require price transparency and reporting of certain manufacturer information. This trend is anticipated to continue to 2019, where legislation is expected regarding pricing transparency, marketing, access to drugs and other measures related to pricing.
Government price reporting obligations are complex, and we face risks related to the reporting of pricing data that could affect the reimbursement of and discount provided for our products to US government healthcare programs.
We also encounter cost containment issues in countries outside the United States. In certain countries, including countries in the European Union, China and Canada, the coverage of prescription drugs, and pricing and levels of reimbursement, are subject to governmental control. For example, in Europe various authorities are developing the use of tenders for expensive products and are considering joint procurement mechanisms to negotiate lower prices. See also below “– Global economic conditions and an unfavorable financial environment could have negative consequences for our business”.
In China, the health authorities continue to develop measures around post loss-of-exclusivity (LOE) brands including the selection of the generics validated through bioequivalence. The health authorities are testing new procurement systems targeting
SANOFI / FORM 20-F 2018 9
ITEM 3. KEY INFORMATION
post LOE brands with generics demonstrating bioequivalence in four municipalities and seven major cities.
While we are trying to predict the availability or level of reimbursement and related restrictions for our product candidates, external events and unexpected decisions can occur that go against our expectations.
Price negotiations in a country may result in a price that is incompatible with the global price positioning of our products, which may lead us not to launch the product in that country, damaging our image and resulting in a decrease in initially anticipated sales.
Finally, our operating results may also be affected by parallel imports, particularly within the European Union, whereby distributors engage in arbitrage based on national price differences to buy products in low cost markets for resale in higher cost markets.
The concentration of the US market exposes us to
greater pricing pressure.
In the United States, price is increasingly important to managed care organizations (MCOs) and pharmacy benefit managers (PBMs), and as the MCOs/PBMs grow in size following market consolidation, pharmaceutical companies have faced increased pressure in discounting and usage negotiations, and competition among pharmaceutical companies to have their products included in the payers’ formularies is robust. This can lead to price discounts or rebates in connection with the placement of products.
Exclusion of one of our drugs from a formulary can significantly reduce sales in the MCO/PBM patient population (for instance, effective 2017 Lantus®/Toujeo® were excluded from certain template formularies covering millions of people).
Also, some payers in the United States have put in place significant restrictions on the usage of Praluent®, which has resulted in significant out-of-pocket expenditures for patients. As a result in 2018 we reduced the net price of Praluent for US payers that agreed to reduce burdensome access barriers for patients.
Due to these pressures on our prices, our revenues and margins are, and could continue to be, negatively affected.
We may lose market share to competing therapeutic
options, biosimilar or generic products.
We are faced with intense competition from generic products, biosimilars and brand-name drugs including from retail chains and distributors.
Doctors or patients may choose competitors’ products over ours or alternative therapeutic options such as surgery if they perceive them to be safer, more reliable, more effective, easier to administer or less expensive, which could cause our revenues to decline and adversely affect our results of operations.
The success of any product also depends on our ability to meet patient expectations and in certain areas such as diabetes to
deliver a positive patient experience. We need also to educate patients when permissible and promote our products to healthcare providers by providing them with innovative data about the product and its uses including through the use of digital tools. If these education efforts are not effective, we may not be able to increase the sales of our products or realize the full value of our investment in their development.
We may not be able to anticipate precisely the date of market entry of generics or biosimilars or the potential impact on our sales, both of which depend on numerous parameters. The introduction of a generic version of a branded medicine typically results in a significant and rapid reduction in net sales for the branded product because generic manufacturers typically offer their unbranded versions at significantly lower prices, resulting in adverse price and volume effects for our genericized products. For example, although we do not believe it is possible to state with certainty what level of net sales would have been achieved in the absence of generic competition, a comparison of our consolidated net sales for 2018 and 2017 for products affected by generic and biosimilar competition shows a loss of €1,749 million of net sales on a reported basis. However, other parameters may have contributed to the loss of sales, such as a fall in the average price of certain products (e.g. Lantus®). Also mandatory price regulations apply in certain countries to off-patent products and classes of products, and generics prices are taken into account for international reference pricing and tenders. Substitution is often permitted for generic products that are considered to be interchangeable or clinically identical. Competition, including from non-substitutable biosimilars, would likely result in a decrease in prices, additional rebates, increased promotion efforts and lower margins.
Approval of a generic or biosimilar that is substitutable for one of our products would increase the risk of accelerated market penetration by that generic or biosimilar to a greater extent than would be the case for a non-substitutable product.
These trends are exacerbated by applicable legislation which encourages the use of generic products to reduce spending on prescription drugs in many countries such as the United States, France and Germany. Therefore, the market for our products could also be affected if a competitor’s innovative drug in the same market were to become available as a generic because a certain number of patients can be expected to switch to a lower-cost alternative therapy. We expect this generic competition to continue and to affect more of our products, including those with relatively modest sales.
The manufacture of our products is technically complex,
and supply interruptions, product recalls or inventory
losses caused by unforeseen events may reduce sales,
adversely affect our operating results and financial
condition, delay the launch of new products and
negatively impact our image.
Many of our products are manufactured using technically complex processes requiring specialized facilities, highly specific raw materials and other production constraints and are heavily
10 SANOFI / FORM 20-F 2018
ITEM 3. KEY INFORMATION
regulated by governmental health authorities around the world. Whether our products and the related raw materials are manufactured at our own dedicated manufacturing facilities or by third parties, we must ensure that all manufacturing processes comply with current Good Manufacturing Practices (cGMP) and other applicable regulations, as well as with our own quality standards. Third parties supply us with a portion of our raw materials, active ingredients and medical devices, which exposes us to the risk of a supply shortage or interruption in the event that these suppliers are unable to manufacture our products in line with quality standards or if they experience financial difficulties. Further, some raw materials essential to the manufacture of our products are not widely available from sources we consider reliable; for example, we have approved only a limited number of suppliers of heparins for use in the manufacture of Lovenox®. Any of these factors could adversely affect our business, operating results or financial condition. See “Item 4. Information on the Company – B. Business Overview – B.8. Production and Raw Materials” for a description of these outsourcing arrangements.
Our products are also increasingly reliant on the use of product-specific devices for administration which may result in technical issues. For example, Praluent® is administered with an auto-injector manufactured by a third party.
We must also be able to produce sufficient quantities of our products to satisfy demand. We may have difficulties transforming and adapting our existing plants to manufacture new products, including biologics, and scaling up production of our products currently under development once they are approved. We may fail to develop and maintain technology platforms for developing, launching and manufacturing our biological products. We also need to be and remain competitive in the biologic area in terms of manufacturing capabilities. Our biological products, in particular, are subject to the risk of manufacturing stoppages or the risk of loss of inventory because of the difficulties inherent in the processing of biological materials and the potential difficulties in accessing adequate amounts of raw materials meeting required standards. These difficulties may also be encountered during testing, which is a mandatory requirement for the products to be released. For example, in China, we encountered supply constraints of Pentaxim® vaccine in 2018 due to a problem with a supplier of a raw material used in the formulation of Pentaxim® vaccine for China. As a result we had to find an alternative raw material to meet the Chinese requirements. Effective insurance coverage for biological products may also be difficult to obtain in the event of contaminated batches as the cause of the contamination can be difficult to ascertain (for the impact on our financial statements see “– Impairment charges or write-downs in our books and changes in accounting standards could have a significant adverse effect on Sanofi’s results of operations and financial results.” below)
Additionally, specific conditions must be respected both by Sanofi and our customers for the storage and distribution of many of our
biological products. For example, cold storage is required for certain vaccines, insulin-based products and some hemophilia products. Failure to adhere to these requirements may result in lost product inventory or products becoming out of specification, which in turn may result in efficacy or safety issues for patients.
The complexity of these processes, as well as strict internal and health authority standards for the manufacture of our products, subject us to risks because the investigation and remediation of any identified or suspected problems can cause production delays, substantial expense, product recalls or lost sales and inventories, and delay the launch of new products; this could adversely affect our operating results and financial condition, and cause reputational damage and the risk of product liability (see – “Product liability claims could adversely affect our business, results of operations and financial condition” above).
When manufacturing disruptions occur, we may not have alternate manufacturing capacity, particularly for certain biologics. In the event of manufacturing disruptions, our ability to use backup facilities or set up new facilities is more limited because biologics are more complex to manufacture and generally require dedicated facilities. Even though we aim to have backup sources of supply whenever possible, including by manufacturing backup supplies of our principal active ingredients at additional facilities when practicable, we cannot be certain they will be sufficient if our principal sources become unavailable. Switching sources and manufacturing facilities requires significant time and prior approval by health authorities.
Supply shortages generate even greater negative reactions when they occur with respect to life saving medicines with limited or no viable therapeutic alternatives. Shortages of products can have a negative impact on the confidence of patients, customers and professional healthcare providers and the image of Sanofi and may lead to lower product revenues. Government authorities and regulators in the United States, in the European Union and other agencies worldwide are also considering measures to reduce these risks, such as through Supply Risk Management Plans for some products with high medical need, e.g. the French decree of July 2016 concerning the preparation of shortage management plans (“plans de gestion des pénuries”). It cannot be ruled out that these ongoing initiatives may generate additional costs for Sanofi if they result in a requirement to establish backup supply channels or to increase inventory levels to avoid shortages.
We are sometimes required to use animals to test our products in the development phase and to test our vaccines before distributing them. Animal testing activities have been the subject of controversy and adverse publicity. Testing on animals can be vital for the development or commercialization of a product. If applicable regulations were to ban this practice or if, due to pressure from animal welfare groups, we were no longer able to source animals to perform such tests, it would be difficult and in some cases impossible to develop or distribute our products in certain jurisdictions under the applicable marketing authorizations.
SANOFI / FORM 20-F 2018 11
ITEM 3. KEY INFORMATION
We rely on third parties for the discovery, manufacture
and marketing of some of our products.
Our industry is both highly collaborative and competitive, whether in the discovery and development of new products, in-licensing, the marketing and distribution of approved products, or manufacturing activities. We expect that we will continue to rely on third parties for key aspects of our business and we need to ensure our attractiveness as a potential partner.
We conduct a number of significant research and development programs and market some of our products in collaboration with other biotechnology and pharmaceutical companies. For example, we currently have a global strategic collaboration with Regeneron on monoclonal antibodies. In immuno-oncology, we have a global collaboration for the joint development and commercialization of cemiplimab, a programmed cell death protein 1 (PD-1) inhibitor antibody. We have also an immuno-oncology discovery and development agreement on the development of two clinical-stage bispecific antibody programs targeting respectively (i) BCMA and CD3 and (ii) MUC16 and CD3. (See “Item 4. Information on the Company – B. Business Overview”). In addition we may also rely on partners to design and manufacture medical devices, notably for the administration of our products.
As regards products recently launched or under development in our R&D portfolio for which we have an alliance arrangement with a partner, the terms of the alliance agreements may require us to share profits and losses arising from commercialization of such products with our partners. This differs from the treatment of revenue and costs generated by other products for which we have no alliance agreement, and such profit sharing may deliver a lower contribution to our financial results.
If disruptions or quality concerns were to arise in the third-party supply of raw materials, active ingredients or medical devices or if our partners were unable to manufacture a product, this could also adversely affect our ability to sell our products in the quantities demanded by the market and could damage our reputation and relationships with our customers. See also “– The manufacture of our products is technically complex, and supply interruptions, product recalls or inventory losses caused by unforeseen events may reduce sales, adversely affect our operating results and financial condition, delay the launch of new products and negatively impact our image” above.
When we research and market our products through collaboration agreements, we are also subject to the risk that we may not adequately manage our alliance. For instance, we may not properly manage the decision making process with our partners. Decisions may also be under the control of or subject to the approval of our collaboration partners, who may have views that differ from ours. We are also subject to the risk that our partners may not perform effectively, which could have a detrimental effect when the performance of certain key tasks or functions is the responsibility of our collaboration partners. Failures in the development process or differing priorities may adversely affect the activities conducted through the collaboration arrangements.
Any conflicts or difficulties that we may have with our partners during the course of these agreements or at the time of their renewal or renegotiation, or any disruption in the relationships with our partners, may affect the development, the launch and/or the marketing of certain of our products or product candidates and may cause a decline in our revenues or otherwise negatively affect our results of operations.
A substantial share of the revenue and income of Sanofi
continues to depend on the performance of certain
flagship products.
We generate a substantial share of our revenues from the sale of certain key products (see “Item 5. Operating and Financial Review and Prospects – Results of Operations – Year ended December 31, 2018 compared with year ended December 31, 2017 – Net Sales – Pharmaceuticals segment”).
Among our flagship products, Lantus®, Lovenox® and Plavix® already face generic competition on the market. Lantus® is particularly important; it was Sanofi’s leading product with revenues of €3,565 million in 2018, representing 10.3% of Sanofi’s net sales for the year. Aubagio®, following a settlement agreement entered into in 2017, is expected to face generic competition starting from August 2023. The launch of new medicines and vaccines in other therapeutic areas and the performance of our other businesses may not be sufficient to reduce the relative contribution of the products mentioned above to our overall performance. More generally expiration of effective intellectual property protections for our products typically results in the entry of one or more lower-priced generic competitors, often leading to a rapid and severe decline in revenues on those products (for information on the expected impact of biosimilar entry on the market see “– We may lose market share to competing therapeutic options, biosimilar or generic products” above and for information regarding ongoing patent litigation see Note D.22. to the consolidated financial statements included at Item 18 of this annual report).
Furthermore, in general, if one or more of our flagship products were to encounter problems such as material product liability litigation, unexpected side effects, recall, regulatory proceedings, publicity affecting doctor or patient confidence, pressure from existing competitive products, exclusion from formularies or changes in labeling, or if a new, more effective treatment were introduced, or if there were a reduction in sales or a decline in sales growth of one or more of our flagship products, the adverse impact on our business, results of operations and financial condition could be significant.
Breaches of data security, disruptions of information
technology systems and cyber threats could result in
financial, legal, business or reputational harm.
Our business depends heavily on the use of interdependent information technology systems, including Internet-based systems and digital tools. Certain key areas such as research and development, production and sales are to a large extent dependent on our information systems (including cloud-based
12 SANOFI / FORM 20-F 2018
ITEM 3. KEY INFORMATION
computing) or those of third-party providers (including for the storage and transfer of critical, confidential, sensitive or personal information regarding our patients, clinical trials, vendors, customers, employees, collaborators and others). We and our third-party service providers use secure information technology systems for the protection of data and threat detection. Like many companies, we may experience certain of these events given that the external cyber-attack threat continues to grow and there can be no assurance that our efforts or those of our third-party service providers to implement adequate security and control measures would be sufficient to protect against breakdowns, service disruption, data deterioration or loss in the event of a system malfunction, or prevent data from being stolen or corrupted in the event of a cyber-attack, security breach, industrial espionage attacks or insider threat attacks which could result in financial, legal, business or reputational harm.
Any such event could negatively impact important processes, such as the conduct of scientific research and clinical trials, the submission of the results of such efforts to health authorities in support of requests for product approvals, the functioning of our manufacturing and supply chain processes, our compliance with legal obligations and other key business activities, including our employees’ ability to communicate with one another and with third parties. (see “– Product liability claims could adversely affect our business, results of operations and financial condition” above)
In addition, if we do not allocate and effectively manage the resources necessary to build and maintain our information systems, and require our third-party service providers, suppliers, contract manufacturers, distributors or other third parties to do the same, or if we or they fail to timely identify or appropriately respond to cyberattacks or other incidents, our business could be disrupted, potentially damaging our customers’ health or business and negatively impacting our reputation, business and results of operations.
Although we maintain insurance coverage, this insurance may not be sufficiently available in the future to cover the financial, legal, business or reputational losses that may result from an interruption or breach of our systems. For example, certain types of cyber-attacks could be considered as an Act of War subject to insurance exclusion.
Failure of our business continuity planning in the event
of a crisis incident may affect our results of operations
and our reputation.
We may not be adequately prepared and/or able to respond effectively to a crisis incident (for instance in the event of a pandemic, natural disaster, a manufacturing, logistics or information technology systems breakdown, or a cyber-attack).
This could result in a delay or interruption of supply, or a threat to our business and assets, as well as to the safety of our employees. If we cannot mitigate the impact of the incident because we cannot react rapidly or because we cannot implement a business continuity plan in line with the magnitude of the incident, we could be prevented from restoring our operations in a timely manner and our operating results may be negatively impacted, as well as our image and reputation.
We are subject to the risk of non-payment by our
customers.(1)
We run the risk of delayed payments or even non-payment by our customers, which consist principally of wholesalers, distributors, pharmacies, hospitals, clinics and government agencies. This risk is accentuated by recent concentrations among distributors, as well as by uncertainties around global credit and economic conditions, in particular in emerging markets. The United States poses particular customer credit risk issues because of the concentrated distribution system: our three main customers represented respectively 9%, 6% and 4% of our consolidated net sales in 2018. We are also exposed to large wholesalers in other markets, particularly in Europe. Although we assigned receivables to factoring companies or banks, an inability of one or more of these wholesalers to honor their debts to us could adversely affect our financial condition (see Note D.34. to our consolidated financial statements included at Item 18 of this annual report).
In some countries, some customers are public or subsidized health systems. The economic and credit conditions in these countries may lead to an increase in the average length of time needed to collect on accounts receivable or the ability to collect 100% of receivables outstanding. Because of this context, we may need to reassess the recoverable amount of our debts in these countries during future financial years (see also “Item 5. Operating and Financial Review and Prospects – Liquidity and Capital Resources – Liquidity.”).
Global economic conditions and an unfavorable financial
environment could have negative consequences for our
business.(2)
Over the past several years, growth of the global pharmaceutical market has become increasingly tied to global economic growth. In this context, a substantial and lasting slowdown of the global economy, major national economies or emerging markets could negatively affect growth in the global pharmaceutical market and, as a result, adversely affect our business.
Unfavorable economic conditions have reduced the sources of funding for national social security systems, leading to austerity measures including heightened pressure on drug prices,
(1) Information in this section is supplementary to Notes B.8.8. (with respect to information required by IFRS 7), D.10 and D.34 to our consolidated financial statements included at Item 18 of this annual report.
(2) Information in this section is supplementary to Note B.8.8. to our consolidated financial statements included at Item 18 of this annual report, with respect to information required by IFRS 7.
SANOFI / FORM 20-F 2018 13
ITEM 3. KEY INFORMATION
increased substitution of generic drugs, and the exclusion of certain products from formularies.
Further, our net sales may be negatively impacted by the continuing challenging global economic environment, as high unemployment, increases in cost-sharing, and lack of developed third-party payer systems in certain regions may lead some patients to switch to generic products, delay treatments, skip doses or use other treatments to reduce their costs. In the United States there is a consistent increase in the number of patients in the Medicaid program, under which sales of pharmaceuticals are subject to substantial rebates and, in many US states, to formulary restrictions limiting access to brand-name drugs, including ours. Also, employers may seek to transfer a greater portion of healthcare costs to their employees due to rising costs.
Our Consumer Healthcare business could also be adversely impacted by difficult economic conditions that limit the financial resources of our customers.
If economic conditions worsen, or in the event of default or failure of major players including wholesalers or public sector buyers financed by insolvent states, the financial situation of the Company, its results of operations and the distribution channels of its products may be adversely affected. See also “We are subject to the risk of non-payment by our customers” above.
Economic and financial difficulties may have an adverse impact on third parties who are important to our business, including collaboration partners and suppliers, which could cause such third parties to delay or disrupt performance of their obligations to us and could materially adversely affect our business or results of operations. See “– We rely on third parties for the discovery, manufacture and marketing of some of our products” above. For more information see “Item 5. Operating and Financial Review and Prospects – Liquidity and Capital Resources – Liquidity.”
The impact of “Brexit” could negatively affect our
business
Following the “Brexit” vote in the UK, the EU decided to move the headquarters of the EU’s health authority, the EMA, from the UK to the Netherlands by March 2019. It is expected that a significant percentage of the current employees of the EMA will decide not to make the move to the Netherlands. This raises the possibility that new drug approvals in the EU could be delayed as a result. We are also addressing the impact of Brexit on our supply chain management and quality oversight between the UK and the EU and our internal Brexit Task Force is developing and deploying appropriate contingency plans aiming at avoiding interruption of supply to patients in the event of a ‘hard Brexit’ – see Item 4. Business Overview – B.6.3.8. Other new legislation proposed or pending implementation – Brexit and “– The globalization of our business exposes us to increased risks in specific areas” below).
Counterfeit versions of our products harm our business.
Counterfeiting activities and the presence of counterfeit products in a number of markets and over the Internet continue to be a challenge for maintaining a safe drug supply. Counterfeit products are frequently unsafe or ineffective, and can be life-threatening. To distributors and users, counterfeit products may be visually indistinguishable from the authentic version. Reports of adverse reactions to counterfeit drugs along with increased levels of counterfeiting could be mistakenly attributed to the authentic product, affect patient confidence in the authentic product, and harm the business of companies such as Sanofi. If one of our products were to be the subject of counterfeits, we could incur substantial reputational and financial harm. See “Item 4. Information on the Company – B. Business Overview – B.6. Markets – B.6.2. Competition.”
The expansion of social media platforms and new
technologies present risks and challenges for our
business and reputation.
We increasingly rely on social media, new technologies and digital tools to communicate about our products and diseases or to provide health services. The use of these media requires specific attention, monitoring programs and moderation of comments. For example, patients may use these channels to comment on the effectiveness of a product and to report an alleged adverse event. When such questions arise, the nature of evidence-based health care and restrictions on what pharmaceutical manufacturers may say about their products are not always well suited to rapidly defending Sanofi or the public’s legitimate interests in the face of the political and market pressures generated by social media and rapid news cycles, and this may result in commercial harm, overly restrictive regulatory actions and erratic share price performance. In addition, unauthorized communications, such as press releases or posts on social media, purported to be issued by Sanofi, may contain information that is false or otherwise damaging and could have an adverse impact on our stock price. Negative or inaccurate posts or comments about Sanofi, our business, directors or officers on any social networking website could seriously damage our reputation. In addition, our employees and partners may use social media and mobile technologies inappropriately, which may give rise to liability for Sanofi, or which could lead to breaches of data security, loss of trade secrets or other intellectual property or public disclosure of sensitive information, including information about our employees, clinical trials or customers or other information. Such uses of social media and mobile technologies could have a material adverse effect on our reputation, business, financial condition and results of operations.
14 SANOFI / FORM 20-F 2018

ITEM 3. KEY INFORMATION
Impairment charges or write-downs in our books and
changes in accounting standards could have a
significant adverse effect on Sanofi’s results of
operations and financial results.
Substantial value is allocated to intangible assets and goodwill resulting from business combinations, as disclosed at Note D.4. to our consolidated financial statements included in this annual report at Item 18, which could be substantially written down in value upon indications of impairment (primarily relating to pharmacovigilance, discontinued research and development projects, patent litigation and the launch of competing products), with adverse effects on our financial condition and the value of our assets.
If any of our strategic equity investments decline in value and remain below cost for an extended period, we may be required to write down our investment. We own a significant stake in Regeneron Pharmaceuticals, Inc. (21.7% of its share capital as of December 31, 2018), which is listed on NASDAQ and has been accounted for using the equity method since 2014. Any material deterioration in Regeneron’s share price or financial performance would be an indicator that the value of our investment might have become impaired. This would require us to perform an impairment test, which could have a negative impact on our financial statements.
In addition, the inherent variability of biologics manufacturing increases the risk of write-offs of these products. Due to the value of the materials used, the carrying amount of biological products is much higher than that of small-molecule products.
The financial environment and the economic difficulties affecting some countries could also negatively affect the value of our assets (see “– Global economic conditions and an unfavorable financial environment could have negative consequences for our business” above and “– Fluctuations in currency exchange rates could adversely affect our results of operations and financial condition” below).
Any new or revised accounting standards, rules and interpretations issued by the IASB (International Accounting Standards Board) could also result in changes to the recognition of income and expense that may materially and adversely affect Sanofi’s financial results.
Our pension liabilities are affected by factors such as the
performance of plan assets, interest rates, actuarial data
and experience and changes in laws and regulations.
Our future funding obligations for our main defined-benefit pension plans depend on changes in the future performance of assets held in trust for these plans, the interest rates used to determine funding levels (or company liabilities), actuarial data and experience, inflation trends, the level of benefits provided for by the plans, as well as changes in laws and regulations. Adverse changes in those factors could increase our unfunded obligations under such plans, which would require more funds to be contributed and hence negatively affect our cash flow and results (see Note D.19.1. to our consolidated financial statements included at Item 18 of this annual report).
Risks relating to Sanofi’s structure and strategy Our strategic objectives for long-term growth may not be
fully realized.
In November 2015, we outlined our strategic roadmap for the period 2015-2020. Our strategy rests on four pillars: reshape our portfolio, deliver outstanding launches, sustain innovation in R&D and simplify our organization.
We may not be able to fully realize our strategic objectives and, even if we are able to do so, these strategic objectives may not deliver the expected benefits or within the expected timeline.
We are looking to reshape our portfolio through acquisitions and divestitures and may not reach this objective if we are unable to identify opportunities, or enter into agreements in a timely manner or on sufficiently attractive terms. In addition, we may fail to (i) adopt the best strategy for our acquisitions / divestitures or (ii) compete successfully in an intensively competitive, increasingly focused market environment. (see “– We may fail to successfully identify external business opportunities or realize the anticipated benefits from our strategic investments or divestments” below and “Our research and development efforts may not succeed in adequately renewing our product portfolio” above). We may also not have the necessary flexibility to appropriately reallocate resources toward our priority businesses.
The successful launch of a new pharmaceutical product involves substantial investment in sales and marketing activities. In 2015 we announced that we have up to 18 new medicines and vaccines on track to arrive on the market between 2014-2020 including six key launches. As of the end of 2018, all of those six products have already been approved and launched: Toujeo®, Praluent®, Dengvaxia® and Soliqua® 100/33 / Suliqua®, Kevzara® and Dupixent®. However there can be no assurance that all of these products will achieve commercial success. We may also encounter failures or delays in our launch strategy. For example, Dengvaxia® sales suffer from political changes and economic volatility in Latin America and also from the recommendation to update the label at the end of 2017 following new clinical studies. In addition, in the Philippines, Sanofi received a legal order revoking the Dengvaxia® License in early 2019. In addition, the implementation of utilization management restrictions by payers in the United States and limited market access in Europe hampered our launch strategy on Praluent®. The launch strategy we develop (in terms of timing, pricing, market access, marketing efforts and dedicated sales forces) may not deliver the benefits that we expect. The competitive environment for a given product may also have changed by the time of the actual launch, modifying our initial expectations. The need to prioritize the allocation of resources may also cause delays in or hamper the launch of some of our products.
Sustaining innovation in R&D is inherently risky due to the high rate of failure and we may not be able to allocate our resources to obtain optimal results (see also “– Our research and development efforts may not succeed in adequately renewing our product portfolio” above).
Our global organization through the implementation from January 2016 of five global business units (GBUs), and their reorganization
SANOFI / FORM 20-F 2018 15
ITEM 3. KEY INFORMATION
from 2019 to refocus two GBUs (Primary Care and China and Emerging Markets) to meet significant growth objectives, requires substantial attention from our management. There is no guarantee that this organization will enable Sanofi to concentrate its efforts around the businesses most likely to deliver growth, or that these GBUs will grow in line with anticipated growth rates or deliver the expected benefits. Also we need to simplify our organization to gain agility and generate savings. There is no certainty that we will manage to implement these changes within the appropriate time-frames to support our growth strategy.
We have also defined a focused, competitive digital strategy (see Item 4. Information on the Company – B. Business Overview – B.1. Strategy). Our seven priority digital initiatives use digital to create value in two ways: (i) helping us run our business better, faster, and cheaper as we use digital across our value chain to increase productivity, and (ii) introducing new business models (in diabetes). Nevertheless we may fail to capture the benefits of digital at an appropriate cost and/or in a timely manner. Competitors, including new entrants such as tech companies, may outpace us in this fast-moving area.
Failure to support and grow our marketed products, successfully execute the launches of newly approved products, advance our late-stage pipeline, manage the change of our organization or deliver digital transformation would have an adverse impact on our business, prospects and results of operations.
We may fail to successfully identify external business
opportunities or realize the anticipated benefits from our
strategic investments or divestments.
We pursue a strategy of selective acquisitions, in-licensing and collaborations in order to reinforce our pipeline and portfolio. We are also proceeding to selective divestments to focus on key business areas. The implementation of this strategy depends on our ability to identify transaction opportunities, mobilize the appropriate resources and execute these transactions on acceptable financing terms. Moreover, entering into in-licensing or collaboration agreements generally requires the payment of significant “milestones” well before the relevant products reach the market, without any assurance that such investments will ultimately become profitable in the long term (see Note D.21.1. to the consolidated financial statements included at Item 18 of this annual report and also – “We rely on third parties for the discovery, manufacture and marketing of some of our products” above).
For newly acquired activities or businesses our growth objectives could be delayed or ultimately not realized, and expected synergies could be adversely impacted if:
◆ we are unable to quickly or efficiently integrate those activities or businesses;
◆ integration takes longer than expected;
◆ key employees leave; or
◆ we have higher than anticipated integration costs.
For divestments, the financial benefit could be impacted if we face significant financial claims or price adjustment post closing.
In March 2018 and June 2018, we completed the acquisitions of Bioverativ and Ablynx respectively, but the expected benefits of those transactions may never be fully realized or may take longer to realize than expected.
We may miscalculate the risks associated with business development transactions at the time they are made or not have the resources or ability to access all the relevant information to evaluate them properly, including with regard to the potential of research and development pipelines, manufacturing issues, compliance issues, or the outcome of ongoing legal and other proceedings. It may also take a considerable amount of time and be difficult to implement a risk analysis and risk mitigation plan after the acquisition of an activity or business is completed due to lack of historical data. As a result, risk management and coverage of such risks, particularly through insurance policies, may prove to be insufficient or ill-adapted.
Because of the active competition among pharmaceutical groups for such business development opportunities, there can be no assurance of our success in completing these transactions when such opportunities are identified.
The globalization of our business exposes us to
increased risks in specific areas.
We continue to focus on emerging markets. However, difficulties in operating in emerging markets, a significant decline in the anticipated growth rate in these regions or an unfavorable movement of the exchange rates of these countries’ currencies against the euro could impair our ability to take advantage of these growth opportunities and could affect our business, results of operations or financial condition (see also “– Global economic conditions and an unfavorable financial environment could have negative consequences for our business” above).
The expansion of our activities in emerging markets also exposes us to more volatile economic conditions, political instability (including a backlash in certain areas against free trade), competition from multinational or locally based companies that are already well established in these markets, the inability to adequately respond to the unique characteristics of emerging markets (particularly with respect to their underdeveloped judicial systems and regulatory frameworks), difficulties in recruiting qualified personnel or maintaining the necessary internal control systems, potential exchange controls, weaker intellectual property protection, higher crime levels (particularly with respect to counterfeit products (see “– Counterfeit versions of our products harm our business” above)), and compliance issues including corruption and fraud (see “– Claims and investigations relating to compliance, ethics, competition law, marketing practices, pricing, human rights of workers, data protection and other legal matters could adversely affect our business, results of operations and financial condition” above).
We may also face compliance and internal control systems issues in mature markets due to increased competition and more complex and stringent regulations.
16 SANOFI / FORM 20-F 2018
ITEM 3. KEY INFORMATION
In Europe, there is a risk that barriers to free trade and the free movement of people may rise following the United Kingdom’s “Brexit” vote and the rise of nationalist, separatist and populist sentiment in various countries. Also, international conflicts, barriers to free trade and related restrictions could collectively disturb the international flow of goods and increase the costs and difficulties of international transactions.
As a global healthcare leader, we are exposed to a number of risks inherent in sectors in which we were previously less active such as consumer healthcare. The business models and trade channels in consumer healthcare, in particular regarding promotional efforts and trade terms for example, are different from those in our traditional pharmaceuticals business.
Our success depends in part on our senior management
team and other key employees and our ability to attract,
integrate and retain key personnel and qualified
individuals in the face of intense competition.
We depend on the expertise of our senior management team and other key employees. In addition, we rely heavily on recruiting and retaining talented people to help us meet our strategic objectives. We face intense competition for qualified individuals for senior management positions, or in specific geographic regions or in specialized fields such as clinical development, biosciences and devices, or digital and artificial intelligence. In addition, our ability to hire qualified personnel also depends in part on our ability to reward performance, incentivize our employees and to pay competitive compensation. Laws and regulations on executive compensation may restrict our ability to attract, motivate and retain the required level of talented people. The inability to attract, integrate and/or retain highly skilled personnel, in particular those in leadership positions, may weaken our succession plans, may materially adversely affect the implementation of our strategy and our ability to meet our strategic objectives and could ultimately adversely impact our business or results of operations.
Environmental risks of our industrial activities
Risks from the handling of hazardous materials could
adversely affect our results of operations.
Manufacturing activities, such as the chemical manufacturing of the active ingredients in our products and the related storage and transportation of raw materials, products and waste, expose us to various risks, including:
◆ fires and/or explosions;
◆ storage tank leaks and ruptures; or
◆ discharges or releases of toxic or pathogen substances.
These operating risks can cause personal injury, property damage and environmental contamination, and may result in the shutdown of affected facilities and/or the imposition of civil, administrative, criminal penalties and/or civil damages.
The occurrence of any of these events may significantly reduce the productivity and profitability of a particular manufacturing facility and adversely affect our operating results and reputation.
Although we maintain property, business interruption and casualty insurance that we believe is in accordance with customary industry practices, this insurance may not be adequate to fully cover all potential hazards incidental to our business.
Environmental liabilities and costs related to compliance
with applicable regulations may have a significant
adverse effect on our results of operations.
The environmental laws of various jurisdictions impose actual and potential obligations on our Company to remediate contaminated sites. These obligations may relate to sites:
◆ that we currently own or operate;
◆ that we formerly owned or operated; or
◆ where waste from our operations was disposed.
These environmental remediation obligations could significantly reduce our operating results. Sanofi accrues provisions for remediation when our management believes the need is probable and that it is reasonably possible to estimate the cost. See “Item 4. Information on the Company – B. Business Overview – B.10. Health, Safety and Environment (HSE)” for additional information regarding our environmental policies. In particular, our provisions for these obligations may be insufficient if the assumptions underlying these provisions prove incorrect or if we are held responsible for additional, currently undiscovered contamination. These judgments and estimates may later prove inaccurate, and any shortfalls could have a material adverse effect on our results of operations and financial condition.
We are or may become involved in claims, lawsuits and administrative proceedings relating to environmental matters. Some current and former Sanofi subsidiaries have been named as “potentially responsible parties” or the equivalent under the US Comprehensive Environmental Response, Compensation and Liability Act of 1980, as amended (also known as “Superfund”), and similar statutes in France, Germany, Italy, Brazil and elsewhere. As a matter of statutory or contractual obligation, we and/or our subsidiaries may retain responsibility for environmental liabilities at some of the sites of our predecessor companies, or of subsidiaries that we demerged, divested or may divest. We have disputes outstanding regarding certain sites no longer owned by the Company. An adverse outcome in such disputes might have a significant adverse effect on our operating results. See Note D.22.d) to the consolidated financial statements included at Item 18 of this annual report and “Item 8. Financial Information – A. Consolidated Financial Statements and Other Financial Information – Information on Legal or Arbitration Proceedings”.
Environmental regulations are evolving. For example, in Europe, new or evolving regulatory regimes include REACH, CLP/GHS, SEVESO, IPPC/IED, the Waste Framework Directive, the
SANOFI / FORM 20-F 2018 17
ITEM 3. KEY INFORMATION
Emission Trading Scheme Directive, the Water Framework Directive, the Directive on Taxation of Energy Products and Electricity and several other regulations aimed at preventing global warming. Stricter environmental, safety and health laws and enforcement policies could result in substantial costs and liabilities to our Company and could subject our handling, manufacture, use, reuse or disposal of substances or pollutants, site restoration and compliance to more rigorous scrutiny than is currently the case. Consequently, compliance with these laws could result in significant capital expenditures as well as other costs and liabilities, thereby adversely affecting our business, results of operations or financial condition. For more detailed information on environmental issues, see “Item 4. Information on the Company – B. Business Overview – B.10. Health, Safety and Environment (HSE).”
Natural disasters prevalent in certain regions in which we
do business could affect our operations.
Some of our production sites are located in areas exposed to natural disasters, such as earthquakes, floods and hurricanes. Such disasters could be exacerbated in a context of global warming. In the event of a major disaster we could experience severe destruction or interruption of our operations and production capacity. As a result, our operations and our employees could suffer serious harm which could have a material adverse effect on our business, financial condition and results of operations.
Risks related to financial markets(1)
Fluctuations in currency exchange rates could adversely
affect our results of operations and financial condition.
Because we sell our products in numerous countries, our results of operations and financial condition could be adversely affected by fluctuations in currency exchange rates. We are particularly sensitive to movements in exchange rates between the euro and the US dollar, the Japanese yen, the Chinese Yuan and to currencies in emerging markets. In 2018, 33.5% of our net sales were generated in the United States; 22.2% in Emerging Markets other than China (see the definition in “Item 5. Operating and Financial Review and Prospects – A/ Operating results”), including countries that are, or may in future become, subject to exchange controls; 7.1% in China; and 5.0% in Japan. While we incur expenses in those currencies, the impact of currency exchange rates on these expenses does not fully offset the impact of currency exchange rates on our revenues. As a result, currency exchange rate movements can have a considerable impact on our earnings. When deemed appropriate and when technically feasible, we enter into transactions to hedge our exposure to foreign exchange risks. These efforts, when undertaken, may fail to offset the effect of adverse currency exchange rate fluctuations on our results of operations or financial condition. For more information concerning our
exchange rate exposure, see “Item 11. Quantitative and Qualitative Disclosures about Market Risk.”
Risks relating to an investment in our shares or ADSs
Foreign exchange fluctuations may adversely affect the
US dollar value of our ADSs and dividends (if any).
Holders of ADSs face exchange rate risk. Our ADSs trade in US dollars and our shares trade in euros. The value of the ADSs and our shares could fluctuate as the exchange rates between these currencies fluctuate. If and when we pay dividends, they would be denominated in euros. Fluctuations in the exchange rate between the euro and the US dollar will affect the US dollar amounts received by owners of ADSs upon conversion by the depositary of cash dividends, if any. Moreover, these fluctuations may affect the US dollar price of the ADSs on the Nasdaq Global Select Market (Nasdaq) whether or not we pay dividends, in addition to any amounts that a holder would receive upon our liquidation or in the event of a sale of assets, merger, tender offer or similar transaction denominated in euros or any foreign currency other than US dollars.
Persons holding ADSs rather than shares may have
difficulty exercising certain rights as a shareholder.
Holders of ADSs may have more difficulty exercising their rights as a shareholder than if they directly held shares. For example, if we issue new shares and existing shareholders have the right to subscribe for a pro rata portion of the new issuance, the depositary is allowed, at its own discretion, to sell this right to subscribe for new shares for the benefit of the ADS holders instead of making that right available to such holders. In that case, ADS holders could be substantially diluted. Holders of ADSs must also instruct the depositary how to vote their shares. Because of this additional procedural step involving the depositary, the process for exercising voting rights will take longer for holders of ADSs than for holders of shares. ADSs for which the depositary does not receive timely voting instructions will not be voted at any meeting.
Our largest shareholder owns a significant percentage of
the share capital and voting rights of Sanofi.
As of December 31, 2018, L’Oréal held approximately 9.48% of our issued share capital, accounting for approximately 16.95% of the voting rights (excluding treasury shares) of Sanofi. See “Item 7. Major Shareholders and Related Party Transactions – A. Major Shareholders.” Affiliates of L’Oréal currently serve on our Board of Directors. To the extent L’Oréal continues to hold a large percentage of our share capital and voting rights, it will remain in a position to exert greater influence in the appointment of the directors and officers of Sanofi and in other corporate actions that require shareholders’ approval.
18 SANOFI / FORM 20-F 2018
(1) Information in this section is supplementary to Note B.8.8. to our consolidated financial statements included at Item 18 of this annual report with respect to information required by IFRS 7.
ITEM 3. KEY INFORMATION
Sales of our shares may cause the market price of our
shares or ADSs to decline.
Sales of large numbers of our shares, or a perception that such sales may occur, could adversely affect the market price for our shares and ADSs. To our knowledge, L’Oréal, our largest shareholder, is not subject to any contractual restrictions on the sale of the shares it holds in our Company. L’Oréal does not consider its stake in our Company as strategic.
Risks relating to our Contingent Value Rights (CVRs)
In addition to the risks relating to our shares, CVR
holders are subject to additional risks.
In connection with our acquisition of Genzyme, we issued CVRs under a CVR agreement entered into by and between us and American Stock Transfer & Trust Company, the trustee (see also Note D.18. to the consolidated financial statements included at Item 18 of this annual report). A copy of the form of the CVR agreement is on file with the SEC as Annex B to Amendment No. 2 to the Registration Statement on Form F-4 filed with the Securities and Exchange Commission on March 24, 2011. Pursuant to the CVR agreement, each holder of a CVR is entitled to receive cash payments upon the achievement of certain milestones, if any, based on the achievement of certain cumulative net sales thresholds by Lemtrada® (alemtuzumab for treatment of multiple sclerosis). See “Item 10. Additional Information – C. Material Contracts – The Contingent Value Rights Agreement.”
CVR holders are subject to additional risks, including:
◆ the public market for the CVRs may not be active or the CVRs may trade at low volumes, both of which could have an adverse effect on the resale price, if any, of the CVRs;
◆ the market price and trading volume of the CVRs may be volatile;
◆ no payment will be made on the CVRs without the achievement of certain agreed upon milestones. As such, it
may be difficult to value the CVRs and accordingly it may be difficult or impossible to resell the CVRs;
◆ if net sales do not exceed the thresholds set forth in the CVR agreement for any reason within the time periods specified therein, no payment will be made under the CVRs and the CVRs will expire without value;
◆ since the US federal income tax treatment of the CVRs is unclear, any part of any CVR payment could be treated as ordinary income and required to be included in income prior to the receipt of the CVR payment;
◆ any payments in respect of the CVRs rank at parity with our other unsecured unsubordinated indebtedness;
◆ we are not prohibited from acquiring the CVRs, whether in open market transactions, private transactions or otherwise and we have already purchased CVRs on several occasions (for more information see “Item 5. Operating and Financial Review and Prospects – Liquidity and Capital Resources – Liquidity.”);
◆ we may, under certain circumstances, purchase and cancel all outstanding CVRs; and
◆ while we have agreed to use diligent efforts (as defined in the CVR agreement), until the CVR agreement is terminated, to achieve each of the remaining Lemtrada® related CVR milestones set forth in the CVR agreement, we are not required to take all possible actions to achieve these goals. On July 5, 2016 Sanofi disclosed that, based upon actual sales of Lemtrada® in Qualifying Major Markets and in other markets during the respective applicable periods since the Product Launch, Product Sales Milestone #1 has not been met. On February 7, 2018, Sanofi disclosed that, based upon actual sales trends to date, it does not expect that product sales milestones #2, #3 and #4 will be met. Failure to achieve the remaining sales milestones could have an adverse effect on the value of the CVRs (see also Note D.22.c to the consolidated financial statements included at Item 18 of the annual report regarding the ongoing CVR Trustee Claim).
SANOFI / FORM 20-F 2018 19
ITEM 4. INFORMATION ON THE COMPANY
Item 4. Information on the Company
Introduction Sanofi is a leading global healthcare company, focused on patient needs and engaged in the research, development, manufacture and marketing of therapeutic solutions.
In the remainder of this section:
◆ A product is referred to either by its international non-proprietary name (INN) or its brand name, which is generally exclusive to the company that markets it. In most cases, the brand names of our products, which may vary from country to country, are protected by specific registrations. In this document, products are identified by their brand names used in France and/or in the US.
◆ For our Pharmaceuticals activity, unless otherwise stated, all market share percentages and rankings are calculated based on consolidated national pharmaceutical sales data, excluding vaccines and in constant euros, on a September 2018 MAT (Moving Annual Total) basis. The data are mainly from IQVIA local sales audit supplemented by various other country-specific sources including Knobloch (Mexico), GERS (France) and HMR (Portugal).
◆ For our Vaccines activity, market share percentages and rankings are based on our own estimates. These estimates have been made from information in the public domain collated from various sources, including statistical data collected by industry associations and information published by our competitors.
Sanofi has three principal activities: Pharmaceuticals, Consumer Healthcare (CHC), and Vaccines via Sanofi Pasteur. These activities are operating segments within the meaning of the IFRS 8 accounting standard (see Note D.35. to our consolidated financial statements, included at Item 18 of this annual report).
We invest in the following activities: Rare Diseases, Multiple Sclerosis, Immunology, Rare Blood Disorder, Oncology, Diabetes, Cardiovascular, Established Prescription Products(1), Generics, Consumer Healthcare, and Vaccines. Unlike our Vaccines and Consumer Healthcare activities, which are operating segments within the meaning of IFRS 8, our Rare Diseases, Multiple Sclerosis, Immunology, Rare Blood Disorder, Oncology, Diabetes, Cardiovascular, Established Prescription Products and Generics activities are franchises whose performance is monitored primarily on the basis of net sales; the
products sold by each of those franchises are included in our Pharmaceuticals operating segment. We are also active in emerging markets selling products from our three activities; the performance of our Emerging Markets(2) operations is monitored primarily on the basis of net sales.
For a presentation of the net sales of our activities for the year ended December 31, 2018, refer to “Item 5 – Results of Operations – Year Ended December 31, 2018 Compared with Year Ended December 31, 2017”.
The most important pharmaceutical products marketed by us are described below.
◆ Rare Diseases: a portfolio of enzyme replacement therapies including Cerezyme® for Gaucher disease, Myozyme® and Lumizyme® for Pompe disease, and Fabrazyme® for Fabry disease; Cerdelga®, an oral ceramide analog for Gaucher disease; and Aldurazyme® for mucopolysaccharidosis Type 1 (MPS 1).
◆ Multiple sclerosis: Aubagio®, a once-daily oral immunomodulator; and Lemtrada®, a monoclonal antibody. Both products were developed to treat patients with relapsing forms of multiple sclerosis.
◆ Immunology: Dupixent®, a monoclonal antibody against the Interleukin-4 receptor alpha, indicated for adults with moderate-to-severe atopic dermatitis and (in the US) for moderate-to-severe asthma; and Kevzara®, a monoclonal antibody against the Interleukin-6 receptor, indicated for adults with moderate to severe rheumatoid arthritis.
◆ Rare Blood Disorder: Elocate® and Alprolix®, extended half-life clotting-factor therapies for the treatment of adults and children with hemophilia A and B, respectively; and Cablivi®, a bivalent nanobody for the treatment of adults experiencing an episode of acquired thrombotic thrombocytopenic purpura.
◆ Oncology: Libtayo®, a fully human monoclonal antibody targeting the immune checkpoint receptor PD-1 (programmed cell death protein-1), for the treatment of certain patients with metastatic cutaneous squamous cell carcinoma (CSCC) or locally advanced CSCC; Jevtana®, a taxane, indicated for patients with prostate cancer; Taxotere®, a taxane representing a cornerstone therapy for several cancer types; Eloxatin®, a platinum-based agent used as an adjuvant treatment for certain people with stage III colon cancer; Thymoglobulin®, a broad immuno-suppressive and immuno- modulating agent; Mozobil®, a hematopoietic stem cell mobilizer for patients with hematologic malignancies; and
20 SANOFI / FORM 20-F 2018
(1) Established Prescription Products comprises mature products including Plavix®, Lovenox®, Aprovel®, Renagel® and Renvela®. (2) World excluding the US, Canada, Western & Eastern Europe (apart from Russia, Ukraine, Georgia, Belarus, Armenia and Turkey), Japan, South Korea,
Australia, New Zealand and Puerto Rico.
ITEM 4. INFORMATION ON THE COMPANY
Zaltrap®, a recombinant fusion protein, indicated for certain patients with metastatic colorectal cancer.
◆ Diabetes: Lantus® (insulin glargine), a long-acting human insulin analog which is the world-leading brand in the insulin market; Toujeo® (insulin glargine 300 U/mL); Amaryl®, an oral once-daily sulfonylurea; Apidra®, a rapid-acting human insulin analog; Insuman®, a range of rapid-acting or intermediate-acting human insulins; Lyxumia®/Adlyxin® (lixisenatide), a once-daily GLP-1 receptor agonist; Soliqua® 100/33 / Suliqua®, a once-daily combination of insulin glargine and lixisenatide; and Admelog® / Insulin lispro Sanofi® (insulin lispro), a rapid-acting insulin.
◆ Cardiovascular diseases: Praluent®, a cholesterol-lowering drug that inhibits PCSK9; and Multaq®, an anti-arrhythmic drug in atrial fibrillation.
◆ Established Prescription Products: Plavix®, an anti-platelet agent indicated for a number of atherothrombotic conditions; Lovenox®, a low molecular weight heparin for the prophylaxis and treatment of venous thromboembolism and of acute coronary syndrome; Aprovel® and CoAprovel®, anti-hypertensives; Renagel® and Renvela®, oral phosphate binders for use in patients undergoing dialysis; Synvisc® and Synvisc-One®, viscosupplements used to reduce pain in patients suffering from osteoarthritis of certain joints; Stilnox®, for the short-term treatment of insomnia; and Allegra®, a long-lasting (12- and 24-hour) non-sedating anti-histamine for the treatment of seasonal allergic rhinitis (hay fever) and uncomplicated hives.
◆ Generics: our pharmaceuticals portfolio also includes a wide range of generics. In September 2018, we completed the divestment of our European generics business Zentiva to Advent International, a US global private equity firm.
Our Consumer Healthcare (CHC) activity is focused around four strategic categories: Allergy Cough & Cold, Pain, Digestive and Nutritionals.
Our Vaccines activity is operated through Sanofi Pasteur. We sell vaccines in five areas: pediatric vaccines, influenza vaccines, adult and adolescent booster vaccines, meningitis vaccines, and travel and endemics vaccines.
In 2018, we obtained regulatory approval for two new products: Cablivi® in the EU and the US and Libtayo® in the US. We also obtained regulatory approval in the US for Dupixent® in an additional indication: moderate-to-severe asthma in certain patients.
Collaborations are essential to our business and a certain number of our products, whether on the market or under development, are in-licensed products relying on third-party rights or technologies.
A/ History and development of the Company The current Sanofi corporation was incorporated under the laws of France in 1994 as a société anonyme, a form of limited liability company, for a term of 99 years. Since May 2011, we have operated under the commercial name “Sanofi” (formerly known as Sanofi-Aventis). Our registered office is located at 54, rue La Boétie, 75008 Paris, France, our main telephone number is +33 1 53 77 40 00 and our website is www.sanofi.com. Our principal US subsidiary’s office is located at 55 Corporate Drive, Bridgewater, NJ 08807; telephone: +1 (908) 981 5000.
The SEC maintains an internet site at http://www.sec.gov that contains reports, information statements, and other information regarding issuers that file electronically with the SEC.
Main changes over the last five years
At the end of December 2016, Sanofi Pasteur and MSD ended their vaccines joint venture in Europe and integrated their respective European vaccines businesses into their own operations.
On January 1, 2017, Sanofi and Boehringer Ingelheim (BI) successfully closed in most markets a transaction to swap Sanofi’s Animal Health business for BI’s CHC business.
On March 8, 2018, following a tender offer, we acquired control of Bioverativ Inc., a US biopharmaceutical company headquartered in Waltham, Massachusetts. Bioverativ is engaged in the research, development and commercialization of therapies for people with hemophilia and other rare blood disorders.
On June 19, 2018, Sanofi finalized the acquisition of Ablynx, a Belgian biopharmaceutical company engaged in the development of Nanobodies® – which combine the advantages of conventional antibody drugs with some of the features of small-molecule drugs – in various therapeutic areas.
On September 30, 2018, we completed the divestment of our European generics business Zentiva to Advent International, a US global private equity firm.
SANOFI / FORM 20-F 2018 21
ITEM 4. INFORMATION ON THE COMPANY
B/ Business overview
B.1. Strategy
The market context for Sanofi
A number of fundamental trends point to a positive outlook for the pharmaceutical industry. The global population is growing and aging. Unmet medical needs remain high. The industry has increased R&D productivity, and is launching a high number of innovative medicines. Patients around the world, and a rising middle class in emerging markets, are demanding better care, empowered by access to new information. It is a particularly exciting time scientifically and technologically: the promise of genomics is being realized, immuno-oncology is transforming cancer treatments, and big data is generating new insights into disease. Digital technologies are having a transformative effect across sales, R&D and manufacturing, and acting as enablers for new businesses.
At the same time, increased geopolitical uncertainties, funding challenges, budget tightening and affordability will continue to put the entire healthcare value chain under significant pressure. Although we believe that pharmaceuticals will remain a fundamentally attractive business within that value chain, the bar for innovation will most likely continue to rise. Payers will continue to put scrutiny on prices and reimbursement, and demand demonstration of real life outcomes. This will be coupled with more innovative pricing and contracting practices; pricing pressure is already increasing in the US and China.
There are two other significant trends. Firstly, in the innovation race, good ideas are quickly recognized by competitors who can move fast to implement them. Secondly, biosimilars are now firmly part of the competitive landscape in both the US and Europe.
Implementing the strategic roadmap
To compete and win in this market, we announced our 2020 strategic roadmap in November 2015. We have made significant progress against each of the four pillars of that strategy: reshape the portfolio, deliver outstanding launches, sustain innovation in R&D, and simplify the organization.
Reshape the portfolio
To reshape the portfolio, we focused on three targets: sustaining our leadership, building competitive positions, and exploring strategic options. As a result, we have achieved several important milestones:
Building a leading Rare Blood Disorder franchise
We began the year by creating a new global Rare Blood Disorder franchise, with three strategic deals announced within the space of a month. The first was a reshaping of our alliance with Alnylam, under which we obtained global development and
commercialization rights to fitusiran, an investigational RNAi therapeutic currently in development for the treatment of hemophilia A and B. The second was the acquisition of Bioverativ, a biotechnology company focused on therapies for hemophilia and other rare blood disorders. Completed in early March 2018 at a price of $11.6 billion, this deal brought us a portfolio of products including the flagship hemophilia treatments Eloctate® and Alprolix®. The third was the acquisition of Ablynx, a company engaged in the discovery and development of Nanobodies®. This deal was completed in June 2018 at a price of €3.9 billion; it enhances our portfolio with the addition of Cablivi® (caplacizumab) - the first therapeutic specifically indicated for the treatment of acquired thrombotic thrombocytopenic purpura (aTTP) - which received marketing approval from the European Commission in September 2018 and from the FDA in February 2019.
Rebuilding our competitive position in Oncology
We have entered the Immuno-Oncology (IO) market with the US launch of Libtayo® (cemiplimab), the first anti PD-1 agent to be approved for metastatic cutaneous squamous cell carcinoma (CSCC) and certain locally advanced CSCCs. In January 2018, Sanofi and Regeneron announced that the two companies had more than doubled their investment in cemiplimab, to $1.6 billion. This will fund a broad clinical program in a range of cancers including basal cell carcinoma, cervical and non-small cell lung cancer.
As regards isatuximab, our fully-owned oncology asset, we see significant potential for the CD38 antibody in multiple myeloma and have several Phase III trials underway that address the entire disease continuum. In February 2019, we announced that the isatuximab Phase III trial in combination with standard of care therapies had met its primary endpoint of prolonging progression free survival in patients with relapsed/refractory multiple myeloma. We also believe strongly that isatuximab has potential beyond multiple myeloma.
In January 2019, we announced that we had restructured our IO collaboration with Regeneron. Under the revised agreement, our earlier stage IO efforts with Regeneron will now focus entirely on two bispecific antibodies. This gives us more flexibility to develop our own novel IO programs. Importantly, we will be able to focus on our platform of multi-specific T-cell engagers. This is a key milestone given our significantly enhanced capabilities in multi-specific biologics following the acquisition of Ablynx.
Divesting our European Generics business
In September, 2018, we completed the divestment of our European generics business Zentiva to Advent International, a US global private equity firm, for €1.9 billion (enterprise value).
Bolstering our Consumer Healthcare operations
In January 2017, Sanofi and Boehringer Ingelheim (BI) successfully closed a transaction to swap our Animal Health business for BI’s Consumer Healthcare (CHC) business,
22 SANOFI / FORM 20-F 2018
ITEM 4. INFORMATION ON THE COMPANY
enhancing our position in four strategic categories: Allergy Cough & Cold, Pain, Digestive and Nutritionals as well as our geographical footprint.
Sustaining our leadership in Specialty Care, Vaccines and
Emerging Markets
In Rare Diseases, we are sustaining our market share leadership in rare genetic diseases through the patient-centered approach unique to Sanofi Genzyme, supported by product differentiation and market access. We continue to grow the market through screening expansion.
In Multiple Sclerosis, investing for the future, we have signed a licensing agreement with Principia to develop their experimental oral treatment (Bruton’s tyrosine kinase inhibitor) that shows promise in multiple sclerosis and, potentially, other central nervous system diseases.
In Vaccines, the influenza vaccine market is highly competitive and to retain our leadership in this category we have built a differentiated product offering. This includes converting our influenza portfolio from trivalent to quadrivalent and offering age-specific products (such as Fluzone® High-Dose for the over-65s), and the recent US launch of Flublok®, the first recombinant protein-based influenza vaccine. Demand typically exceeds supply, so producing more is a key priority for us. We are investing to secure and expand influenza and pediatric vaccines capacity: in April 2018, we announced an investment of €350 million for the construction of a new state-of-the-art vaccine manufacturing facility at the Sanofi Pasteur Canadian headquarters in Toronto, Ontario.
We are the pharmaceutical industry leader in Emerging Markets, and a major multinational player in Brazil, Russia, India, China and Mexico.
Out-licensing our infectious disease research and
development portfolio
We have out-licensed most of our infectious disease research and early-stage development portfolio and transferred our infectious disease research unit to Evotec AG, though we continue to be involved in infectious diseases through our vaccine R&D and global health programs.
Deliver outstanding launches
Launching our Immunology franchise
We have the cornerstones of an important new franchise in immunology through Dupixent® (for atopic dermatitis, asthma) and Kevzara® (for rheumatoid arthritis). Both drugs were developed in collaboration with Regeneron and both were launched in 2017.
In 2017 we launched Dupixent®, the first and only biologic medicine for the treatment of adults with moderate-to-severe atopic dermatitis. In October 2018, Dupixent® was approved in
the US as an add-on maintenance therapy in some patients with moderate-to-severe asthma. In November 2018, the FDA accepted for Priority Review a supplemental application in certain adolescent patients with moderate-to-severe atopic dermatitis. Dupilumab is being evaluated in a broad range of clinical development programs for diseases that are driven by Type 2 inflammation. Dupixent® uptake to date is being driven by high patient need, healthcare professional engagement and market access. By the end of 2018, we had launched Dupixent® in the US and 16 other countries, including Japan.
Other new launches
In diabetes, we continued the global launch and ramp-up of Toujeo® and Soliqua® 100/33/ Suliqua®, a lixisenatide and insulin glargine combination treatment for diabetes.
In cardiovascular diseases, we continued the global launch and ramp-up of Praluent® for hypercholesterolemia. The European Medicines Agency’s Committee for Medicinal Products for Human Use (CHMP) has adopted a positive opinion recommending a new indication for Praluent® to reduce cardiovascular risk by lowering low-density lipoprotein cholesterol (LDL-C) levels as an adjunct to correction of other risk factors in adults with established atherosclerotic cardiovascular disease.
In December 2018, the European Commission granted marketing authorization for Dengvaxia® for use in European endemic areas in individuals aged 9 to 45 years with a documented prior dengue infection.
Sustain innovation in R&D
Our strategy depends on continued innovation in R&D. We continue to strengthen our R&D pipeline, increasing the number of high-quality projects in the early stage pipeline and replenishing the late development pipeline as products launch. We have aligned the R&D organization with the new Global Business Unit structure, reorganized research into thematic clusters, continued to build capability in translational science, and recruited important new talent. Sanofi has engaged a strong reshaping of its R&D strategy, strengthening the development of innovative products that promise to substantially elevate the standard of care for patients, and prioritizing the therapeutic areas where the patient need is most urgent and where the scientific and medical landscape is richest with opportunity. This shift in priorities translates into an increase in the proportion of R&D projects representing specialty care compared to primary care, while maintaining a strong commitment to Vaccines. In the long-term the aspiration is that roughly 80% of the Sanofi portfolio will consist of molecules with first-in-class or truly differentiated best-in-class potential, with two thirds of biologics compounds and two thirds of the pipeline directly derived from Sanofi internal research.
Implementing rigorous portfolio prioritization processes
To prioritize the most promising molecules in the pipeline, we undertook a rigorous portfolio review in 2018. This exercise
SANOFI / FORM 20-F 2018 23
ITEM 4. INFORMATION ON THE COMPANY
resulted in termination of 13 development stage molecules. In addition, we discontinued 25 research projects. This illustrates Sanofi’s commitment to managing a more focused portfolio to accelerate development of the most promising molecules in the pipeline.
Developing technology platforms and an in-house
Nanobody® platform
R&D is leveraging the investments made a few years ago to establish competency in several therapeutic modalities, going beyond small molecules and conventional monoclonal antibodies, to produce differentiated molecules that tackle targets in novel and innovative ways. Besides the expansions of complex antibodies such as bi or tri specifics and the addition of nanobodies with the integration of the Ablynx platform, Sanofi has made important steps forward in genomic medicines. This includes enhancements to our internal capabilities in gene therapy based on the AAV platform, as well as new collaborations in virus based gene therapy, zinc finger based genome editing and mRNA therapeutics.
Simplify the organization
We are creating a more agile organization through:
◆ A new Global Business Unit (GBU) structure, implemented in 2016, integrating global franchises and country-level commercial and medical organizations for each of our major businesses (Sanofi Genzyme; Diabetes and Cardiovascular; General Medicines and Emerging Markets; Sanofi Pasteur and Consumer Healthcare) and also saw the creation of Global Functions (Finance, Human Resources, Information Technology and Solutions, etc).
◆ The refocusing of two of our GBUs, changing their organizational structure to provide greater focus on our operations in mature markets and across emerging markets. We have created a new Primary Care GBU, focused exclusively on mature markets, that combines the product portfolios of our previous Diabetes & Cardiovascular GBU and the Established Prescription Products franchise. Alongside this, we have created a second new GBU: China & Emerging Markets. The two new GBUs launched at the start of 2019.
◆ In order to accelerate Sanofi’s transformation, in 2018 we decided to combine all of our efforts into one new department: Business Transformation. This new department has been created to simplify our operating models, bring innovative practices to our organization, and create lasting, positive changes.
◆ Dissolving our vaccines joint venture with MSD: at the end of 2016, Sanofi Pasteur and MSD ended their vaccines joint venture in Europe and integrated their respective European vaccines businesses into their own operations.
We have also defined a focused, competitive digital strategy with seven key initiatives to create value in two ways: help us run our
business better, faster, and cheaper; and pursue new business models.
For example, digital technologies offer the promise of speeding up our trials and getting our drugs to market faster; our plants will be connected with data flowing automatically from equipment sensors; and advanced analytics on supply chain data will enable real-time optimization. We are engaging physicians through a variety of channels, building precision marketing capabilities globally in CHC; and pursuing new business models to integrate drugs, devices, data, and service, and bring innovative solutions to people living with diabetes. Finally, digital transformation opens up the potential for Sanofi to become a much more data-driven organization.
B.2. Main pharmaceutical products
The sections below provide additional information on our main products. Our intellectual property rights over our pharmaceutical products are material to our operations and are described at “B.7. Patents, Intellectual Property and Other Rights” below. As disclosed in “Item 8. Financial Information – A. Consolidated Financial Statements and Other Financial Information – Patents” of this annual report, we are involved in significant litigation concerning the patent protection of a number of these products. For more information on sales performance, see “Item 5. Operating and Financial Review and Prospects – Results of Operations”.
a) Rare Diseases
Our Rare Diseases business is focused on products for the treatment of rare genetic diseases and other rare chronic debilitating diseases, including lysosomal storage disorders (LSDs), a group of metabolic disorders caused by enzyme deficiencies.
Cerezyme®
Cerezyme® (imiglucerase, intravenous infusion) is an enzyme replacement therapy used to treat Gaucher disease, an inherited and potentially life-threatening LSD. It is estimated that Gaucher disease occurs in approximately one in 120,000 newborns in the general population and one in 850 in the Ashkenazi Jewish population worldwide, but the incidence and patient severity vary among regions. Cerezyme® has been marketed in the US since 1994, in the EU since 1997, in Japan since 1998 and in China since 2008, and is approved to treat Type 1 Gaucher disease in more than 85 countries. It has also been approved to treat the systemic symptoms of Type 3 Gaucher disease in most non-US markets, including the EU and Japan.
Cerdelga®
Cerdelga® (eliglustat) is the first and only first-line oral therapy for Gaucher disease Type 1 adult patients. A potent, highly specific ceramide analog inhibitor of GL-1 synthesis with broad tissue distribution, Cerdelga® has demonstrated efficacy in the treatment of naive Gaucher disease patients and in patients who
24 SANOFI / FORM 20-F 2018
ITEM 4. INFORMATION ON THE COMPANY
switch from enzyme replacement therapy. Cerdelga® has been approved to treat Type 1 Gaucher disease in the US (2014), and in the EU and Japan (2015). Regulatory submissions are ongoing in other countries.
There are ongoing patent infringement proceedings in the US. For further information, see Item 8 – “Information on Legal or Arbitration Proceedings – Cerdelga® Patent Litigation.
Myozyme® and Lumizyme®
Myozyme® and Lumizyme® (alglucosidase alfa, intravenous infusion) are recombinant forms of the same human enzyme and are enzyme replacement therapies used to treat Infantile- and Late Onset Pompe disease (IOPD and LOPD), an inherited, progressive and often fatal neuromuscular disease. Pompe disease occurs in approximately one in 40,000 newborns worldwide, but incidence and patient severity vary among regions.
Myozyme® was first approved in 2006 in the EU and has since been approved in more than 70 countries. In the US, alglucosidase alfa has been marketed as Lumizyme® since 2010.
Fabrazyme®
Fabrazyme® (agalsidase beta, intravenous infusion) is an enzyme replacement therapy used to treat Fabry disease, an inherited, progressive and potentially life threatening LSD. Fabry disease occurs in approximately one in 35,000 newborns worldwide, but incidence and patient severity vary among regions. Fabrazyme® has been marketed in the EU since 2001 and in the US since 2003, and is approved in more than 70 countries.
Aldurazyme®
Aldurazyme® (laronidase, intravenous infusion) is the first and only approved treatment for mucopolysaccharidosis type 1 (MPS I). MPS I occurs in approximately one per 100,000 live births worldwide, but incidence and patient severity vary among regions. Aldurazyme® has been marketed in the EU and the US since 2003, and is approved in more than 75 countries.
b) Multiple Sclerosis
Multiple sclerosis (MS) is an autoimmune disease in which a person’s immune system attacks the central nervous system, damaging myelin, the protective sheath that covers nerve fibers. This causes a break in communication between the brain and the rest of the body, ultimately destroying the nerves themselves, and causing irreversible damage. More than 2.5 million people suffer from MS worldwide.
Our MS franchise consists of Aubagio® (teriflunomide), a once-daily, oral immunomodulator, and Lemtrada® (alemtuzumab), a monoclonal antibody. Both products treat patients with relapsing forms of MS.
Aubagio®
Aubagio® (teriflunomide), a small molecule immunomodulatory agent with anti-inflammatory properties, is a once-daily oral therapy.
Aubagio® is approved in more than 70 countries around the world including the US (since September 2012) for the treatment of patients with relapsing forms of MS, the EU (since August 2013) for the treatment of adult patients with relapsing remitting MS), and China (since July 2018). Ongoing development efforts include the TeriKIDS study to assess the safety and efficacy of teriflunomide in children (see “B.5. Global research & development”) and global post-marketing registries for pregnancy.
In 2017, Sanofi reached settlement with all 20 generic Aubagio® ANDA first filers, granting each a royalty-free license to enter the US market on March 12, 2023.
Lemtrada®
Lemtrada® (alemtuzumab) is a humanized monoclonal antibody targeting the CD52 antigen. Lemtrada® is administered by intravenous infusion as two short courses 12 months apart; for the majority of patients no further treatment is necessary, making Lemtrada® the only disease-modifying therapy (DMT) that can provide long term durable efficacy in the absence of continuous dosing.
Lemtrada® is approved in more than 60 countries including the EU (since September 2013) for the treatment of adult patients with relapsing forms of MS with active disease defined by clinical or imaging features, and the US (since November 2014) for the treatment of patients with relapsing forms of MS. Because of its safety profile, the FDA approval limited use of Lemtrada® to patients who have had an inadequate response to two or more drugs indicated for the treatment of MS, and included a black-box warning on potential side effects. In the US, Lemtrada® is only available through a restricted distribution program called the Lemtrada® Risk Evaluation and Mitigation Strategy (REMS) Program.
Alemtuzumab is being evaluated in a Phase III study in pediatric patients (see “B.5. Global research & development”).
Bayer Healthcare receives contingent payments based on alemtuzumab global sales revenue. For additional information, see Note D.18. to our consolidated financial statements, included at Item 18 of this annual report.
c) Immunology
Our Immunology franchise consists of Dupixent® (dupilumab) for the treatment of adults with moderate-to-severe atopic dermatitis (AD) and as add-on maintenance therapy for some patients with moderate to severe asthma, and Kevzara® (sarilumab) for the treatment of adult patients with moderately to severely active rheumatoid arthritis (RA).
SANOFI / FORM 20-F 2018 25

ITEM 4. INFORMATION ON THE COMPANY
Dupixent®
Dupixent® (dupilumab), a human monoclonal antibody, binds to the interleukin-4 receptor (IL-4R) and has been shown to specifically inhibit overactive signaling of two key proteins (IL-4 and IL-13), which are believed to be major drivers of the persistent underlying inflammation in atopic dermatitis, and in certain other allergic or atopic diseases or that may underlie moderate-to-severe asthma. Dupixent® comes in a pre-filled syringe and can be self-administered as a subcutaneous injection.
Moderate-to-severe atopic dermatitis, a form of eczema and a chronic inflammatory disease, is characterized by rashes sometimes covering much of the body and can include intense, persistent itching and skin dryness, cracking, redness, crusting and oozing.
Dupixent® was granted marketing authorization by the FDA in March 2017 for the treatment of adults with moderate-to-severe atopic dermatitis (AD) whose disease is not adequately controlled with topical prescription therapies, or when those therapies are not advisable, and in October 2018 as an add-on maintenance therapy in patients with moderate-to-severe asthma aged 12 years and older with an eosinophilic phenotype or with oral corticosteroid-dependent asthma. The European Commission approved Dupixent® in September 2017 for use in adults with moderate-to-severe AD who are candidates for systemic therapy, and is reviewing an application for authorization as an add-on maintenance therapy for moderate-to-severe asthma: the European Medicines Agency’s Committee for Medicinal Products for Human Use (CHMP) adopted a positive opinion in March 2019. Dupixent® is also approved for use in certain adult patients with moderate-to-severe atopic dermatitis in other countries including Canada and Japan.
Dupixent® is available in 17 countries including the US (since April 2017), several European Union countries (the first launch was in Germany in December 2017) and Japan (since April 2018). Applications for regulatory approval in certain patients with moderate to severe AD and in certain patients with moderate-to-severe asthma are being reviewed in several other countries. In November 2018, the FDA accepted for Priority Review a supplemental application in certain adolescent patients with moderate-to-severe atopic dermatitis.
Dupilumab is currently being evaluated in a broad range of clinical development programs for diseases that are driven by Type 2 inflammation, including pediatric atopic dermatitis, pediatric asthma, nasal polyps and eosinophilic esophagitis. See “– B.5. Global Research & Development”.
Dupixent® is developed and commercialized in collaboration with Regeneron Pharmaceuticals, Inc. For additional information on the commercialization of this product, see “Item 5. Financial Presentation of Alliances – Alliance Arrangements with Regeneron”.
There are ongoing patent infringement proceedings in several countries initiated by Sanofi and Regeneron against Amgen and
Immunex relating to Dupixent®. See Note D.22.b) to the consolidated financial statements included at Item 18 of this annual report.
Kevzara®
Kevzara® (sarilumab) is a human monoclonal antibody that binds to the interleukin-6 receptor (IL-6R) and has been shown to inhibit IL-6R mediated signaling. IL-6 is a cytokine in the body that, in excess and over time, can contribute to the inflammation associated with rheumatoid arthritis.
Rheumatoid arthritis (RA) is a chronic inflammatory autoimmune disease causing inflammation, pain, and eventually joint damage and disability.
In May 2017, the FDA approved Kevzara® for the treatment of adult patients with moderately to severely active RA who have had an inadequate response or intolerance to one or more disease modifying anti-rheumatic drugs (DMARDs), such as methotrexate. In June 2017, the European Commission granted marketing authorization for Kevzara® in combination with methotrexate for the treatment of moderately to severely active RA in adult patients who have responded inadequately to – or who are intolerant to – one or more DMARDs, such as methotrexate. Kevzara® is approved for use in certain adult patients with moderately to severely active RA in other countries including Canada, Russia, Taiwan, Israel, Hong Kong and Argentina. Additionally, Kevzara® is indicated in Japan for patients with inadequate response to conventional treatments irrespective of disease severity.
Kevzara® is available in 20 countries, including the US.
Sarilumab is being evaluated in children and adolescents with polyarticular-course juvenile idiopathic arthritis (JIA) or with systemic juvenile arthritis, and in adults with giant cell arteritis or with Polymyalgia Rheumatica. See “– B.5. Global Research & Development”.
Kevzara® is developed and commercialized in collaboration with Regeneron Pharmaceuticals, Inc. For additional information on the commercialization of this product, see “Item 5. Financial Presentation of Alliances – Alliance Arrangements with Regeneron”.
d) Rare Blood Disorder
Rare Blood Disorder is a new franchise created in 2018 following the acquisition of Bioverativ. Bioverativ, including its two marketed products Eloctate® and Alprolix®, is being consolidated in our financial statements with effect from March 8, 2018 (see “– A. History and Development of the Company”).
Eloctate®
Eloctate® (antihemophilic factor (recombinant), Fc fusion protein), is an extended half-life clotting-factor therapy to control and prevent bleeding episodes in adults and children with hemophilia A. In the US, it is indicated for use in adults and children with hemophilia A for on-demand treatment and control of bleeding
26 SANOFI / FORM 20-F 2018
ITEM 4. INFORMATION ON THE COMPANY
episodes, perioperative management of bleeding, and routine prophylaxis to reduce the frequency of bleeding episodes.
Hemophilia A is a rare, x-linked genetic bleeding disorder characterized by a deficiency of functional coagulation Factor VIII, resulting in a prolonged patient plasma-clotting time. As a consequence, people with hemophilia A bleed for a longer time than normal. Eloctate® temporarily replaces the missing coagulation Factor VIII by intravenous use.
We market Eloctate® primarily in the United States (since 2014), Japan, Canada, Australia, Colombia and Taiwan.
Eloctate® is developed and commercialized in collaboration with Swedish Orphan Biovitrum AB (publ), whose territories include Europe, Russia, Middle East and some countries in North Africa.
Alprolix®
Alprolix® (coagulation Factor IX (recombinant), Fc fusion protein) is an extended half-life clotting-factor therapy to control and prevent bleeding episodes in adults and children with hemophilia B. In the US, it is indicated for use in adults and children with hemophilia B for control and prevention of bleeding episodes, perioperative management, and routine prophylaxis to reduce the frequency of bleeding episodes.
Hemophilia B is a rare, x-linked genetic bleeding disorder characterized by a deficiency of functional coagulation Factor IX, which leads to a prolonged clotting time similar to hemophilia A. Hemophilia B is a less common type of hemophilia than hemophilia A. Alprolix® temporarily replaces the missing coagulation Factor IX, and is administered by intravenous injection.
We market Alprolix® primarily in the United States (since 2014), Japan, Canada, Australia and Colombia.
Alprolix® is developed and commercialized in collaboration with Swedish Orphan Biovitrum AB (publ), whose territories include Europe, Russia, Middle East and some countries in North Africa.
Cablivi®
Cablivi® (caplacizumab) is a bivalent anti-von Willebrand Factor (vWF) Nanobody® for the treatment of adults experiencing an episode of acquired thrombotic thrombocytopenic purpura (aTTP). Cablivi® is the first therapeutic specifically indicated for the treatment of aTTP.
Acquired thrombotic thrombocytopenic purpura is a life-threatening, autoimmune-based blood clotting disorder characterized by extensive clot formation in small blood vessels throughout the body, leading to severe thrombocytopenia (very low platelet count), microangiopathic hemolytic anemia (loss of red blood cells through destruction), ischemia (restricted blood supply to parts of the body) and widespread organ damage especially in the brain and heart. Cablivi® has an immediate effect on platelet adhesion and the ensuing formation and accumulation of the micro-clots.
Cablivi® was granted marketing authorization by the European Commission in September 2018 and by the FDA in February 2019.
Cablivi® is marketed in Germany and available in France under a temporary user license (autorisation temporaire d´utilisation).
Cablivi® was developed by Ablynx, a Sanofi company since mid 2018. See “– A. History and Development of the Company”.
e) Oncology
Libtayo®
Libtayo® (cemiplimab-rwlc), an immune therapy drug, is a fully human monoclonal antibody targeting the immune checkpoint receptor PD-1 (programmed cell death protein-1). This may restore immune function through the activation of cytotoxic T cells, thereby avoiding tumor evasion from host immunity.
In September 2018, the FDA approved Libtayo® for the treatment of patients with metastatic cutaneous squamous cell carcinoma (CSCC) or locally advanced CSCC who are not candidates for curative surgery or curative radiation. Libtayo® is the only treatment specifically approved and available for advanced CSCC in the US. CSCC is the second most common form of skin cancer. Libtayo® is under regulatory review by the EMA and a number of other countries.
Cemiplimab is being investigated in several clinical development programs. See “– B.5. Global Research & Development”.
Libtayo® is developed and commercialized in collaboration with Regeneron Pharmaceuticals, Inc. For additional information on the commercialization of this product, see “Item 5. Financial Presentation of Alliances – Alliance Arrangements with Regeneron”.
Jevtana®
Jevtana® (cabazitaxel), a chemotherapy drug and cytotoxic agent, is a semi-synthetic second-generation taxane promoting tubulin assembly and stabilizing microtubules; this prevents many cancer cells from dividing, which ultimately results in destroying many such cells. It is approved in combination with prednisone for the treatment of patients with castration resistant metastatic prostate cancer previously treated with a docetaxel-containing treatment regimen.
Jevtana® was granted marketing authorization by the FDA in June 2010, by the European Commission in March 2011, and in Japan in July 2014. The product is marketed in over 75 countries.
Thymoglobulin®
Thymoglobulin® (anti-thymocyte Globulin) is a polyclonal anti-human thymocyte antibody preparation that acts as a broad immunosuppressive and immunomodulating agent. The product’s primary mechanism of action is T-cell depletion, which is complemented by a host of other immunomodulating effects. In the US, Thymoglobulin® is indicated for for the prophylaxis and treatment of acute rejection in patients receiving a kidney transplant. Thymoglobulin® is to be used in conjunction with concomitant immunosuppression. Outside the US, depending on the country, Thymoglobulin® is indicated for the treatment and/or
SANOFI / FORM 20-F 2018 27

ITEM 4. INFORMATION ON THE COMPANY
prevention of acute rejection in organ transplantation; immunosuppressive therapy in aplastic anemia; and the treatment and/or prevention of Graft-versus-Host Disease (GvHD) after allogeneic hematopoietic stem cell transplantation.
Thymoglobulin® is currently marketed in over 65 countries.
Taxotere®
Taxotere® (docetaxel), a chemotherapy drug and cytotoxic agent, is a semi-synthetic taxane promoting tubulin assembly and stabilizing microtubules. It has been approved for use in 11 indications in five different tumor types (breast, prostate, gastric, lung, and head and neck).
Taxotere® is available in more than 90 countries. Generics of docetaxel have been launched globally.
Sanofi is involved in Taxotere® product litigation in the US. See Note D.22.a) to our consolidated financial statements, included at Item 18 of this annual report.
Eloxatin®
Eloxatin® (oxaliplatin), a chemotherapy drug, is a platinum-based cytotoxic agent. In combination with the infusional administration of two other chemotherapy drugs (5-fluorouracil/leucovorin, in the FOLFOX regimen), Eloxatin® is approved by the FDA for adjuvant treatment of people with stage III colon cancer who have had their primary tumors surgically removed.
Eloxatin® is in-licensed from Debiopharm and is marketed in more than 70 countries worldwide. Generics of oxaliplatin have been launched globally.
Mozobil®
Mozobil® (plerixafor injection) is a hematopoietic stem cell mobilizer indicated in combination with granulocyte-colony stimulating factor (G-CSF) to mobilize hematopoietic stem cells to the peripheral blood for collection and subsequent autologous transplantation in patients with non-Hodgkin’s lymphoma (NHL) and multiple myeloma (MM). Mozobil® is marketed in over 50 countries.
Zaltrap®
Zaltrap® (aflibercept/ziv-aflibercept) is a recombinant fusion protein which acts as a soluble decoy receptor that binds to Vascular Endothelial Growth Factor-A (VEGF-A), Vascular Endothelial Growth Factor-B (VEGF-B) and placental growth factor (PIGF), preventing the bound VEGFs from binding to their native receptors. VEGF-A is one of the mediators contributing to tumor angiogenesis that helps provide the blood flow tumors need to grow. VEGF-B and PlGF may also contribute to tumor angiogenesis.
The FDA approved Zaltrap® in August 2012 for use in combination with FOLFIRI (a chemotherapy regimen made up of 5-fluorouracil/leucovorin/irinotecan), in patients with metastatic colorectal cancer (mCRC) that is resistant to or has progressed
following an oxaliplatin-containing regimen. To avoid confusion with Eylea®, the FDA assigned a new name, ziv-aflibercept, to the active ingredient. The European Commission approved Zaltrap® (aflibercept) in February 2013 to treat mCRC that is resistant to or has progressed after an oxaliplatin-containing regimen.
Zaltrap® is now approved in more than 70 countries worldwide. For additional information on the commercialization of Zaltrap®, see “Item 5 – Financial Presentation of Alliances – Alliance Arrangements with Regeneron”.
f) Diabetes
Lantus®
Lantus® (insulin glargine 100 units/mL) is a long-acting analog of human insulin, indicated for the treatment of diabetes mellitus in adults, adolescents and children aged 2 years and above. Approved in the US and in EU in 2000 and in Japan in 2008, Lantus® is available in over 130 countries worldwide.
A biosimilar of Lantus® from Eli Lilly and Company (Lilly) was launched in most European markets under the name Abasaglar® in 2015, and as Basaglar® in the US in December 2016. It has also been launched in Japan and in several other countries worldwide. In 2018, the FDA issued a complete response letter to Mylan for its biosimilar insulin glargine, which has been approved in Europe under the trade name of SemgleeTM and is available in several European countries. In 2018, Merck & Co and Samsung Bioepis announced that they had abandoned global plans to commercialize Lusduna®, their biosimilar of Lantus®.
There are ongoing patent infringement proceedings in the US against Mylan. See “Item 8. Financial Information – B. Significant changes of this annual report for more information.
Toujeo®
Toujeo® (insulin glargine 300 units/mL) is a long-acting analog of human insulin, indicated for the treatment of diabetes mellitus in adults.
Toujeo® has been granted marketing authorization by the FDA (February 2015); the European Commission (April 2015); and the Ministry of Health, Labor and Welfare (J-MHLW) in Japan, where its approved brand name is Lantus® XR (June 2015). Toujeo® has now been launched in more than 40 countries.
Toujeo® is available in Toujeo® SoloSTAR®, a disposable prefilled pen which contains 450 units of insulin glargine and requires one third of the injection volume to deliver the same number of insulin units as Lantus® SoloSTAR®. In the US, since 2018, Toujeo® is also available in a disposable prefilled pen which contains 900 units of insulin glargine.
Apidra®
Apidra® (insulin glulisine) is a rapid-acting analog of human insulin, indicated for the treatment of diabetes mellitus in adults, for supplementary glycemic control. Apidra® has a more rapid
28 SANOFI / FORM 20-F 2018
ITEM 4. INFORMATION ON THE COMPANY
onset and shorter duration of action than fast-acting human insulin and can be used in combination with long-acting insulins such as Toujeo® for supplementary glycemic control at mealtimes. Apidra® can be administered subcutaneously using syringes or specific pens including the Apidra® SoloSTAR® disposable pen. Apidra® is available in over 100 countries worldwide.
Adlyxin®/Lyxumia®
Adlyxin® or Lyxumia® (lixisenatide) is a once-daily injectable prandial GLP-1 receptor agonist and is indicated for the treatment of adults with type 2 diabetes to achieve glycemic control in combination with oral glucose-lowering medicinal products and/or basal insulin when these, together with diet and exercise, do not provide adequate glycemic control.
Lixisenatide was approved in the EU and in Japan in 2013 under the brand name of Lyxumia® and in the US in 2016 under the brand name of Adlyxin® . Lixisenatide is now marketed under the proprietary name Lyxumia® in more than 40 countries. Lixisenatide was in-licensed from Zealand Pharma A/S.
Soliqua® 100/33 / Suliqua®
Soliqua® 100/33 or Suliqua® is a once-daily fixed-ratio combination of insulin glargine 100 Units/mL, a long-acting analog of human insulin, and lixisenatide, a GLP-1 receptor agonist.
The FDA approved Soliqua® 100/33 in November 2016 for the treatment of adults with type 2 diabetes inadequately controlled on basal insulin (less than 60 units daily) or lixisenatide; and in February 2019, for patients uncontrolled on oral antidiabetic medicines. In January 2017, the European Commission granted marketing authorization in Europe for Suliqua® (the product’s brand name in Europe) for use in combination with metformin for the treatment of adults with type 2 diabetes to improve glycemic control when this has not been provided by metformin alone or metformin combined with another oral glucose-lowering medicinal product or with basal insulin. In Europe, Suliqua® is available in two pens providing different dosing options. Suliqua® is approved in more than 30 countries and currently marketed in over 20.
Admelog® / Insulin lispro Sanofi®
Admelog® or Insulin lispro Sanofi® is a rapid-acting insulin similar to Humalog®, another insulin lispro 100 Units/mL. Admelog® was approved by the FDA in December 2017, and was also granted marketing authorization as a biosimilar (under the proprietary name Insulin lispro Sanofi®) by the European Commission in July 2017. It is used to improve blood sugar control in adults with Type 2 diabetes and adults and children (3 years and older) with Type 1 diabetes.
Admelog® comes in both vials and the SoloSTAR® pen, and was launched in the US and several European countries during 2018.
Insuman®
Insuman® (human insulin) is a range of insulin solutions and suspensions for injection and is indicated for diabetes patients when treatment with insulin is required. Human insulin is produced by recombinant DNA technology in Escherichia coli strains. Insuman® is supplied in vials, cartridges, and pre-filled disposable pens (SoloSTAR®). The Insuman® range is comprised of rapid-acting insulin solutions (Insuman® Rapid and Insuman® Infusat) that contain soluble insulin, an intermediate-acting insulin suspension (Insuman® Basal) that contains isophane insulin, and combinations of fast-acting and intermediate-acting insulins in various proportions (Insuman® Comb). Insuman® is principally sold in emerging markets.
Integrated Care Solutions
Sanofi and Verily Life Sciences LLC (formerly Google Life Sciences), an Alphabet company, announced in September 2016 the launch of Onduo, a joint venture created through Sanofi and Verily’s diabetes-focused collaboration. Based in Cambridge, Massachusetts (United States), Onduo is a virtual care program with diabetes tools, coaching and clinical support. In 2018 Onduo started commercial pilots in several states in the US.
Sanofi, Sensile Medical and Verily Life Sciences LLC announced in June 2018 a joint development of an “all-in-one” pre-filled insulin patch pump, primarily to serve people living with type 2 diabetes. The alliance leverages Sanofi’s expertise in patient-centered diabetes solutions and insulins, Sensile Medical’s leadership in developing micro-pump technologies for medical use, and Verily’s experience in micro-electronic integration and digital healthcare technology.
In France, Sanofi commercializes digital insulin titration solutions (under the names of Diabeo® and Insulia®), developed with Voluntis, a French company. Sanofi’s digital titration solutions, embedded in a blood glucose meter (MyStarDoseCoach®) and a smartphone app (MyDoseCoach®), plus collaborations with Voluntis (including the Insulia® smartphone app), are being used by people with diabetes in ten pilot programs and some active commercial launches around the world. These tools use patients’ daily blood sugar measurements to recommend a dose that is aligned with a blood sugar target agreed with their physician.
g) Cardiovascular Diseases
Praluent®
Praluent® (alirocumab) is a human monoclonal antibody (mAb) for self-administered injection every two weeks that blocks the interaction of proprotein convertase subtilisin/kexin type 9 (PCSK9) with low-density lipoprotein (LDL) receptors, increasing the recycling of LDL receptors and reducing LDL cholesterol levels.
SANOFI / FORM 20-F 2018 29
ITEM 4. INFORMATION ON THE COMPANY
Praluent® is indicated as an adjunct to diet and maximally tolerated statin therapy in certain adult patients with uncontrolled LDL cholesterol.
Praluent® has been approved in more than 60 countries worldwide, including the US (in 2015), Japan (in 2016), Canada, Switzerland, Mexico and Brazil, as well as the European Union (in 2015).
In 2018, the FDA approved a Praluent® label update for some patients currently requiring LDL apheresis therapy. The FDA has also accepted a supplemental Biologics License Application (sBLA) which outlines a proposed update to the Prescribing Information to include the effect of Praluent® in reducing the overall risk of major adverse cardiovascular events with a target action date of April 28, 2019. The sBLA is supported by data from the ODYSSEY OUTCOMES trial that assessed the effect of Praluent® on cardiovascular morbidity and mortality within a post-acute coronary syndrome (ACS) patient population. In early February 2019, the European Medicines Agency’s Committee for Medicinal Products for Human Use (CHMP) adopted a positive opinion for Praluent® recommending a new indication to reduce cardiovascular risk in adults with established atherosclerotic cardiovascular disease.
On February 11, 2019, Sanofi and Regeneron announced that Praluent® will be made available at a new reduced US list price beginning in early March 2019. The new lower-priced Praluent® is expected to result in lower patient out-of-pocket costs and represents another step in Sanofi’s efforts to help improve patient affordability and access.
Praluent® is developed and commercialized in collaboration with Regeneron Pharmaceuticals, Inc. For additional information on the commercialization of this product, see “Item 5. Financial Presentation of Alliances – Alliance Arrangements with Regeneron”.
There are ongoing patent infringement proceedings in several countries initiated against us and Regeneron Pharmaceuticals, Inc. by Amgen relating to Praluent® in which Amgen has requested injunctive reliefs. See Note D.22.b) to the consolidated financial statements included at Item 18 of this annual report.
Multaq®
Multaq® (dronedarone) is an oral multichannel blocker with anti-arrhythmic properties for prevention of atrial fibrillation recurrences in certain patients with a history of paroxysmal or persistent atrial fibrillation. Multaq® was approved in the US and in the EU in 2009. Multaq® is available in about 35 countries.
h) Established Prescription Products
Plavix® / Iscover ®
Plavix® or Iscover® (clopidogrel bisulfate), a platelet adenosine diphosphate (ADP) receptor antagonist with a rapid onset of action that selectively inhibits platelet aggregation induced by ADP, is indicated for the prevention of atherothrombotic events in
patients with a history of recent myocardial infarction (MI), recent ischemic stroke or established peripheral arterial disease (PAD)m and for patients with acute coronary syndrome (ACS).
Plavix® is also indicated in combination with acetylsalicylic acid (ASA) for the prevention of atherothrombotic and thromboembolic events in atrial fibrillation, including stroke.
CoPlavix® / DuoPlavin®, a fixed-dose combination of clopidogrel bisulfate and ASA, is indicated for the prevention of atherothrombotic events in adult patients with acute coronary syndrome who are already taking both clopidogrel and ASA.
Plavix® or Iscover® are marketed in more than 80 countries. For additional information on the commercialization of these products, see “Item 5. Financial Presentation of Alliances – Alliance Arrangements with Bristol-Myers Squibb”.
A number of generics have been launched in Europe, the US, Japan and other markets.
Sanofi is involved in Plavix® product litigation in the US. See Note D.22.a) to our consolidated financial statements, included at Item 18 of this annual report.
Lovenox® / Clexane®
Lovenox® or Clexane® (enoxaparin sodium) is a low molecular weight heparin (LMWH). Its comprehensive clinical dossier has demonstrated a favorable risk-benefit ratio, notably in the prophylaxis and treatment of venous thromboembolism and in the treatment of acute coronary syndrome.
Lovenox® or Clexane® is marketed in more than 100 countries. Enoxaparin generics are available in the US, and biosimilar enoxaparin products have gradually become available across various European countries since 2016: Poland, Germany, UK, Italy, Spain, France and Austria.
Aprovel® / Avapro® / Karvea®
Aprovel® or Avapro ® or Karvea® (irbesartan) is an angiotensin II receptor antagonist. We also market CoAprovel® / Avalide® / Karvezide®, a fixed-dose combination of irbesartan and the diuretic hydrochlorothiazide.
Aprovel® is indicated as a first-line treatment for hypertension and for the treatment of nephropathy in hypertensive patients with type 2 diabetes. CoAprovel® is indicated for patients whose blood pressure is not adequately controlled with a monotherapy, but also as initial therapy in patients at high risk or with markedly high baseline blood pressure or who are likely to need multiple drugs to achieve their blood pressure goals. A fixed-dose combination with amlodipine (Aprovasc®) has been launched in several emerging market countries.
Aprovel® and CoAprovel® are marketed in more than 80 countries. For additional information on the commercialization of this product, see “Item 5. Financial Presentation of Alliances – Alliance Arrangements with Bristol-Myers Squibb”. In Japan, the product is licensed to Shionogi Co. Ltd and BMS KK. BMS KK has sublicensed the agreement to Dainippon Pharma Co. Ltd.
30 SANOFI / FORM 20-F 2018
ITEM 4. INFORMATION ON THE COMPANY
A number of generics have been launched in Europe, the US and other markets.
Renagel® and Renvela®
Renagel® (sevelamer hydrochloride) and Renvela® (sevelamer carbonate) are oral phosphate binders used by chronic kidney disease (CKD) patients on dialysis as well as late stage CKD patients in Europe to treat hyperphosphatemia, or elevated phosphorus levels, which is associated with heart and bone disease. Renvela® is a second-generation buffered phosphate binder.
Renagel® and Renvela® are marketed in more than 85 countries. In Japan and several Pacific Rim countries, Renagel® is marketed by Chugai Pharmaceutical Co., Ltd and its sublicensee, Kyowa Hakko Kirin Co., Ltd.
In the US, several sevelamer carbonate tablets generics and two sevelamer carbonate powder generics have been approved. Sanofi has launched authorized generics of Renvela® in the US market, in both tablet form (October 2017) and powder form (in January 2018). Generics of sevelamer carbonate are currently marketed in various European countries. As of December 31, 2018, there are no generics of sevelamer hydrochloride approved in either Europe or in the US. We anticipate the first approvals of generics of sevelamer hydrochloride in the US in 2019.
Allegra® / Telfast®
Allegra® or Telfast® (fexofenadine hydrochloride) is a long-lasting (12- and 24-hour) non-sedating anti-histamine for the treatment of seasonal allergic rhinitis (hay fever) and uncomplicated hives. We also market Allegra-D® 12 Hour and Allegra-D® 24 Hour, anti-histamine/decongestant combination products with an extended-release decongestant. This combination is marketed in Japan under the Dellegra® brand name.
Allegra® / Telfast® is marketed in approximately 80 countries. Generics of most forms of Allegra® / Telfast® have been approved in most markets.
The Allegra® family is also available for over-the-counter (OTC) use. See “B.3. Consumer Healthcare” below.
Stilnox® / Ambien® / Myslee®
Stilnox® (zolpidem tartrate) is indicated for the short-term treatment of insomnia. Stilnox® is marketed in over 100 countries. It is available under the brand name Ambien® / Ambien®CR in the US and Myslee® in Japan, where it is co-promoted jointly with Astellas.
Stilnox® and Ambien CR® are subject to generic competition in most markets, including the US, Europe and Japan.
Synvisc® / Synvisc-One®
Synvisc® and Synvisc-One® (hylan G-F 20) are viscosupplements used to treat pain associated with osteoarthritis. Synvisc® is indicated for the treatment of pain associated with osteoarthritis of the knee, hip, ankle, and shoulder joint in countries that have adopted CE marking, and for pain due to knee osteoarthritis in the US. Synvisc-One® is approved for use in patients with osteoarthritis of the knee in the US and countries that require CE marking.
Synvisc® and Synvisc-One® are administered directly into the intra-articular space of the joint to temporarily restore synovial fluid. Synvisc® and Synvisc-One® are marketed in over 60 countries.
Depakine®
Depakine® (sodium valproate) is a broad-spectrum anti-epileptic that has been prescribed for more than 40 years and remains a reference treatment for epilepsy worldwide. Depakine® is also a mood stabilizer, registered in the treatment of manic episodes associated with bipolar disorder3.
Depakine® is marketed in over 100 countries. We hold no rights to Depakine® in the US, and sodium valproate generics are available in most markets.
Sanofi is involved in product litigation related to Depakine®. See Note D.22.a) to the consolidated financial statements included at Item 18 of this annual report.
i) Generics
On September 30, 2018, we completed the divestment of our European generics business Zentiva to Advent International, a US global private equity firm. We have retained our presence in Generics in Emerging Markets, especially in Latin America with two top-of-mind brands – Medley (Brazil) and Genfar (Colombia, Peru, Ecuador and Central America) – and also in Russia, South Africa and Turkey.
B.3. Consumer healthcare
Our CHC sales are supported by a range of products including the following brands:
Allergy, Cough & Cold
◆ Allegra® is a range of fexofenadine HCl–based products. Fexofenadine is an anti-histamine for relief from allergy symptoms including sneezing, runny nose, itchy nose or throat, and itchy, watery eyes. Allegra® OTC is sold in more than 80 countries across the world.
SANOFI / FORM 20-F 2018 31
(3) In some countries this indication is branded differently (e.g. Depakote® in France).
ITEM 4. INFORMATION ON THE COMPANY
◆ Mucosolvan® is a cough brand with many different formulations. It contains the mucoactive agent ambroxol; this stimulates synthesis and release of surfactant. It is sold in various countries in Europe and Asia and in Russia.
Pain
◆ Doliprane® offers a range of paracetamol/acetaminophen-based products for pain and fever with a wide range of dosage options and pharmaceutical forms, and is sold mainly in France and various African countries.
◆ The Buscopan® range (hyoscine butylbromide) has an antispasmodic action that specifically targets the source of abdominal pain and discomfort. It is sold across the globe.
Digestive
◆ Dulcolax® products offer a range of constipation solutions from predictable overnight relief to comfortable natural-feeling relief. The products are sold in over 80 countries. Dulcolax® tablets contain the active ingredient bisacodyl, which works directly on the colon to produce a bowel movement.
◆ Enterogermina® is a probiotic indicated for the maintenance and restoration of intestinal flora in the treatment of acute or chronic intestinal disorders. Enterogermina® is sold primarily in Europe and in Latin America and parts of Asia.
◆ Essentiale® is a natural soybean remedy to improve liver health. It is composed of essential phospholipids extracted from highly purified soya and contains a high percentage of phosphatidylcholine, a major component of the cell membrane. Essentiale® is used in fatty liver disease and is sold mainly in Russia, Eastern Europe, various countries in Southeast Asia, and China.
◆ Zantac® products are for the prevention and relief of heartburn. Zantac® is sold in the US and Canada.
Nutritionals
◆ Nutritionals include a range of products to maintain general health, provide immune system support, or supplement vitamin deficiencies. These products help manage energy, stress, sleep and anxiety, and include a number of brands across the globe including Nature’s Own® in Australia to improve and maintain health, Pharmaton® (mainly in Europe and Latin America), and Magne B6® in Europe.
Other
◆ Gold Bond® offers a broad range of products including daily body lotions, anti-itch products, moisturizing and soothing lotions, body and foot creams and powders for eczema. Gold Bond® is only sold in the US.
B.4. Vaccine products
Sanofi Pasteur, the Vaccines division of Sanofi, is a world leader in the vaccine industry and a key supplier of life-saving vaccines all over the world and in publicly funded international markets such as UNICEF, the Pan American Health Organization (PAHO) and the Global Alliance for Vaccines and Immunization (GAVI).
The Sanofi Pasteur portfolio includes the following vaccines:
a) Poliomyelitis, Pertussis and Hib pediatric vaccines
Sanofi Pasteur is one of the key players in pediatric vaccines in both developed and emerging markets, with a broad portfolio of standalone and combination vaccines protecting against up to six diseases in a single injection. Due to the diversity of immunization schedules throughout the world, vaccines vary in composition according to regional specificities.
Tetraxim®, a pediatric combination vaccine protecting against diphtheria, tetanus, pertussis and poliomyelitis (polio), was first marketed in 1998. To date, the vaccine has been launched in close to 90 countries outside the US.
Pentaxim®, a pediatric combination vaccine protecting against diphtheria, tetanus, pertussis, polio and Hemophilus influenzae type b (Hib), was first marketed in 1997. To date, the vaccine has been launched in more than 100 countries outside the US. In most European, Latin American and Middle Eastern markets, Pentaxim® is being gradually replaced by Hexaxim®.
Hexaxim® / Hexyon® / Hexacima® is a fully liquid, ready-to-use 6-in-1 (hexavalent) pediatric vaccine that provides protection against diphtheria, tetanus, pertussis, polio, Hib and hepatitis B. In December 2014 the WHO granted prequalification status to Hexaxim® in a one-dose vial presentation. Hexaxim® is the only combination vaccine including acellular pertussis (acP) and inactivated polio vaccines (IPV) currently prequalified by the WHO. Hexaxim® is now available in 100 countries outside the US.
Pentacel®, a pediatric combination vaccine protecting against diphtheria, tetanus, pertussis, polio and Hib, was launched in the US in 2008.
Shan5® is a 5-in-1 (whole-cell pertussis based) vaccine protecting against five diseases (diphtheria, tetanus, pertussis, polio and hepatitis B). It regained WHO pre-qualification (which provides access to the product in low-income countries) in May 2014, and was launched in the Indian market in the last quarter of 2014. Shan5® has been retained for the GAVI/UNICEF tender for the 2017-2019 period and in Thailand through local tender.
Act’Hib® is a standalone vaccine protecting against Hib, and is mainly distributed in the US, Japan and China in conjunction with pertussis combination vaccines that do not contain the Hib valence.
Polio vaccines: Sanofi Pasteur is a leading provider of polio vaccines and has been a partner of the Global Polio Eradication Initiative (GPEI) for over 30 years, with more than 13 billion doses of oral polio vaccines (OPV) delivered during that time.
32 SANOFI / FORM 20-F 2018

ITEM 4. INFORMATION ON THE COMPANY
Over the 2014-2017 period, Sanofi Pasteur provided 130 million doses of inactivated polio vaccine (IPV) to support the WHO “Polio End Game” strategy for the 73 world poorest countries, representing 80% of the total IPV volumes used in those countries. On October 1, 2018, the ShanIPVTM 5-dose vial received WHO pre-qualification.
Vaxelis®: In 2017, Sanofi Pasteur (in partnership with Merck) made its PR5i hexavalent combination vaccine protecting against diphtheria, tetanus, pertussis, polio, Hib and hepatitis B available on the market under the trademark Vaxelis®. This vaccine is approved and distributed in various EU countries and was approved by the FDA in December 2018. Sanofi and Merck are working to maximize production to allow for a sustainable supply to meet anticipated US demand. Commercial supply will not be available in the US prior to 2020.
b) Influenza vaccines
Sanofi Pasteur is a world leader in the production and marketing of influenza vaccines.
Sanofi Pasteur has several distinct vaccines that are sold globally to meet growing demand for influenza vaccines and innovative solutions in the market.
Fluzone® Quadrivalent is a quadrivalent inactivated influenza vaccine, produced in the US, containing two type A antigens and two type B antigens in order to provide increased protection against more circulating strains of influenza viruses. Fluzone® Quadrivalent/FluQuadri® is available in 27 countries (including the US) for children aged over six months, adolescents and adults. Fluzone® 0.5ml QIV is the currently-licensed standard dose (15 µg/strain) quadrivalent influenza vaccine for ages 3 years and older. A half dose (0.25mL or 7.5 µg) is licensed for children aged 6-35 months.In January 2019, the FDA has approved the use of the 0.5 mL dose to include children age 6 through 35 months.
Fluzone® High-Dose vaccine, launched in the US in 2010, was specifically designed to provide greater protection against influenza in people aged 65 and older. Fluzone® High-Dose is sold in the US, Canada and Australia.
Flublok® is a quadrivalent influenza vaccine for adults age 18 and older. It is the only recombinant protein-based influenza vaccine approved by the FDA. Flublok® is currently sold in the US, with global expansion planned over the next several years.
Vaxigrip® is licensed in over 150 countries globally for people aged six months and older. It is a trivalent influenza vaccine, containing two antigens against type A influenza viruses and one antigen against type B influenza viruses.
Vaxigrip® Tetra is the quadrivalent (QIV) version of Vaxigrip®, including 2 antigens against A strains of influenza viruses and 2 antigens against B strains. Compared to the trivalent influenza vaccine, the addition of a second B strain to the vaccine provides increased protection against more influenza virus circulating strains. This quadrivalent formulation, VaxigripTetra®, was licensed in 2016 and has been launched in more than 40 countries since 2017.
c) Adult booster vaccines
Adacel® is the first trivalent adolescent and adult booster offering protection against diphtheria, tetanus and pertussis. It also reduces exposure for infants who are not immunized or only partially immunized. It is available in 40 countries (including the United States, and otherwise mostly in Europe and Latin America).
Repevax® / Adacel®-Polio is a combination vaccine that provides protection against diphtheria, tetanus, pertussis and polio. It is currently marketed in 20 countries, with a strong focus on European markets (France, Germany, UK).
d) Meningitis vaccines
Menactra® is the first quadrivalent conjugate vaccine against meningococcal meningitis (serogroups: A, C, Y, and W-135), one of the deadliest forms of meningitis in the world. Menactra® is indicated for people aged 9 months through 55 years in the US, Canada, several Middle Eastern countries including Saudi Arabia, and numerous other countries in all regions of the world. It is a strong leader in the meningitis quadrivalent market in the US, and is licensed in 70 countries worldwide. More than 100 million doses of Menactra® have been distributed since launch. It is the only fully liquid (no reconstitution needed) meningitis quadrivalent conjugated vaccine available in the market.
e) Travel and endemics vaccines
Sanofi Pasteur provides a wide range of travel and endemics vaccines including hepatitis A, typhoid, cholera, yellow fever, Japanese encephalitis and dengue, as well as rabies vaccines and immunoglobulins. These products are used in endemic settings in the developing world and are the foundation for important partnerships with governments and organizations such as UNICEF. They are also used by travelers and military personnel in industrialized countries and in endemic areas.
Focus on Dengue:
Dengvaxia® is licensed in 19 countries. The Philippines FDA revoked the Dengvaxia® license in early 2019 and Sanofi has filed a motion for reconsideration which has been denied. For more information, please see “Item 8. Financial information – Information on legal or arbitration proceedings”. In 2018, the European Commission granted marketing authorization for Dengvaxia® to prevent dengue disease in individuals 9-45 years of age with a documented prior dengue infection who are living in endemic areas, and the FDA granted Dengvaxia® a priority review.
In most countries where Dengvaxia® is approved, the indication is for individuals aged 9 years or older living in a dengue-endemic area. Based on new results from a supplemental analysis of the long term clinical data on the vaccine reported in November 2017, Sanofi Pasteur is recommending a label update for Dengvaxia® to target its use at people with prior dengue infection: the review process is ongoing in three countries, is expected to start soon in another country and revised label content has been agreed in all other relevant countries.
SANOFI / FORM 20-F 2018 33

ITEM 4. INFORMATION ON THE COMPANY
The WHO has recognized the public health value of introducing Dengvaxia® in public immunization programs. In September 2018, the WHO issued a recommendation indicating a preference for a pre-vaccination screening strategy to target those at risk of re-infection for protection, and increase the potential of such programs to reduce the overall burden of dengue and severe dengue. As part of our long-standing commitment to ensure access to vaccination in the global effort to reduce the dengue burden, we are pursuing potential collaborations with experienced dengue test manufacturers in order to develop a new, rapid point-of-care dengue test. The aim of the new test is to broaden access to vaccination for those with prior infection who could benefit from the prevention of secondary infections with dengue, which carry a higher risk of being severe.
B.5. GLOBAL RESEARCH & DEVELOPMENT
In 2018 Sanofi engaged in a strong reshaping of its R&D strategy, strengthening the development of innovative products that promise to substantially elevate the standard of care for patients, and prioritizing the therapeutic areas where the patient need is most urgent and where the scientific and medical landscape is richest with opportunity.
R&D is leveraging the investments made a few years ago to establish competency in several therapeutic modalities, going beyond small molecules and conventional monoclonal antibodies, to produce differentiated molecules that tackle targets in novel and innovative ways. Besides the expansions of complex antibodies such as bi or tri specifics and the addition of nanobodies with the integration of the Ablynx platform, Sanofi has made important steps forward in genomic medicines. This includes enhancements to our internal capabilities in gene therapy based on the AAV (adeno-associated vectors) platform, as well as, new collaborations in virus based gene therapy, zinc finger based genome editing and mRNA therapeutics.
In development, sustained efforts are being made to accelerate the pace of delivery for patients, adopting a quick win, fast-fail approach that is underpinned by streamlined governance and pushing decision-making downward with strong team empowerment.
In the long term the aspiration is that roughly 80% of the Sanofi portfolio will consist of molecules with first-in-class or truly differentiated best-in-class potential, with two thirds of biologics compounds and two thirds of the pipeline directly derived from Sanofi internal research.
B.5.1. Pharmaceuticals
B.5.1.1. Organization
Our Global R&D organization is committed to responding to the real needs of patients by providing them with safe, cost-effective and appropriate therapeutic solutions, improving their access to treatment and delivering better health outcomes. In offering new solutions to patients, it is vital to understand the complexity of
human diseases, to sustain innovation and to foster scientific excellence without losing sight of the need for operational efficiency.
To meet these challenges, Sanofi R&D has evolved towards an integrated organization encompassing a wide range of therapeutic areas aligned with the Global Business Units (GBUs), which are dedicated to supporting our commercial operations and reflect our strengths and expertise as well as the most pressing health issues.
For Pharmaceuticals, six therapeutic areas (TAs) have been rolled out:
◆ Diabetes and Cardiovascular
◆ Oncology
◆ Immunology & Inflammation
◆ Multiple Sclerosis and Neurology
◆ Rare Blood Disorders
◆ Rare Diseases
These TAs drive a portfolio of R&D projects, ensuring a strategically coherent approach and flawless implementation.
Each TA has its own experts who are responsible for analyzing medical needs, defining project strategy and development plans, and leading the Global Project Teams.
Our R&D Operations department handles all operational activities and delivers effective development through integrated, collaborative project teams. Those teams harness high caliber functional expertise and the most appropriate technologies across chemical, biological and pharmaceuticals operations, translational medicine and early development, and clinical sciences.
In Research, a dedicated, integrated platform working across multiple disease areas and methods drives collaboration with internal and external partners to translate human biology research and state-of-the art technologies and processes into novel drug targets and world-class safe and effective drugs.
Sanofi’s R&D operations are concentrated in three major hubs: North America, Germany and France. These hubs help build our scientific intelligence network and facilitate connections and knowledge-sharing between in-house scientists, and with external partners and scientific communities, in order to accelerate our research activities.
B.5.1.2. Governance
Global Project Teams (GPTs) are responsible for developing project strategy and driving the execution of projects through functional sub-teams. GPTs are led by a Global Project Head (GPH) who works in collaboration with a Project Manager (PM), and are built around core functional team members representing each department collaborating in the development project.
Various committees assess product and project development across the R&D value chain, carry out in-depth scientific review, make go and no-go decisions and determine portfolio priorities.
34 SANOFI / FORM 20-F 2018
ITEM 4. INFORMATION ON THE COMPANY
The Research Working Group (RWG) tracks progress on research programs, and endorses entry into preclinical and the path to the First in Human phase (Phase I).
The Benefit-Risk Assessment Committee (BRAC) reviews the preclinical and clinical data before dossier submission.
The Development Working Group (DWG) endorses the path to Proof of Concept (POC), generally before Phase I, and tracks the development of products all along the value chain. This group is also responsible for the portfolio prioritization exercise.
The Integrated Development and Commercialization Council (IDCC) gives prior input to proof of clinical and commercial concept criteria, and endorses go to late development (Phase III start) and go to file.
The clinical portfolio is the result of decisions taken by these committees during their reviews, plus compounds entering the portfolio from the discovery phase or from third parties via acquisition, collaboration or alliances.
As described at “Item 3. Key Information – D. Risk Factors – Risks Relating to Our Business – research and development efforts may not succeed in adequately renewing the product portfolio and – Risks Relating to the Group Structure and Strategy – We may fail to successfully identify external business opportunities or realize the anticipated benefits from our strategic investments”, our product development efforts are subject to the risks and uncertainties inherent in any new product development program.
B.5.1.3. Products
For 2018, the main events related to the pharmaceuticals portfolio were:
Regulatory Approvals:
In 2018, Sanofi obtained regulatory approval for caplacizumab (Cablivi®) in Europe and the US for the treatment of acquired thrombotic thrombocytopenic purpura and cemiplimab (Libtayo®) in the US for the treatment of cutaneous squamous cell carcinoma. Dupilumab (Dupixent®) was also approved in the US for asthma in adults and adolescents (12 to 17 years old), and for atopic dermatitis (adults) in Japan.
Regulatory Submissions:
◆ sotaglifozin (Zinquista™) was submitted for type I diabetes in Europe and the US;
◆ cemiplimab (Libtayo®) was submitted for the treatment of cutaneous squamous cell carcinoma in Europe and the US (now approved in the US);
◆ dupilumab (Dupixent®) was submitted in the US for the treatment of chronic rhinosinusitis with nasal polyposis. It was also submitted for the treatment of atopic dermatitis (adolescents 12 to 17 years old) in Europe and the US;
◆ Praluent® was submitted in Europe and the US in the reduction of cardiovascular events after acute coronary syndrome.
Phase III starts
In 2018, the following products moved into Phase III:
◆ fitusiran, indicated for the treatment of:
– hemophilia A/B in adults;
◆ dupilumab (Dupixent®) for the treatment of:
– eosinophilic esophagitis;
◆ sarilumab (Kevzara®) for the treatment of:
– giant cell arteritis;
– polymyalgia rheumatica;
◆ isatuximab:
– in combination with lenalidomide, bortezomib, and dexamethasone (VRd) for induction treatment in patients with newly diagnosed multiple myeloma who are eligible for transplant;
◆ sotaglifozin (Zinquista™) for the treatment of:
– worsening heart failure.
Phase II starts
In 2018, the following products moved into Phase II:
◆ SAR440340, an anti-IL33 monoclonal antibody for the treatment of :
– asthma;
– chronic obstructive pulmonary disease (COPD);
– atopic dermatitis;
◆ dupilumab (Dupixent®) as an adjunct therapy for:
– peanut allergy;
– grass allergy;
◆ sarilumab (Kevzara®) for the treatment of:
– systemic juvenile idiopathic arthritis (sJiA);
◆ isatuximab,
– in combination with cemiplimab for the treatment of relapsed refractory multiple myeloma (RRMM) and solid tumors;
– In combination with atezolizumab for the treatment of solid tumors and advanced malignancies.
Phase I Starts
In 2018, the following products entered Phase I:
◆ SAR441344, an anti-CD40L mAb indicated for the treatment of multiple sclerosis;
SANOFI / FORM 20-F 2018 35
ITEM 4. INFORMATION ON THE COMPANY
◆ SAR440234, a T-Cell engaging bispecific (CD3/CD123) antibody for the treatment of acute myeloid leukemia;
◆ SAR442720, an SHP2 inhibitor for the treatment of advanced non-small cell lung cancer;
◆ SAR 441000, a cytokine mRNA for the treatment of melanoma.
Entries to the Portfolio
In 2018, the following products entered the R&D Portfolio:
◆ From our deal with Bioverativ:
– Sutimlimab (BIVV009), an anti-complement C1s mAb in Phase III for the treatment of cold agglutin disease and Phase I for the treatment of idiopathic thrombocytopenic purpura;
– BIVV001, an investigational von Willebrand factor (VWF)-independent factor VIII therapy in Phase I for the treatment of hemophilia A;
– ST400, a zinc finger nuclease (ZFN) gene editing technology in Phase I for the treatment of ß thalassemia;
– BIVV003, a zinc finger nuclease (ZFN) gene editing technology for the treatment of sickle cell disease.
◆ From our collaboration with Regulus: SAR339375, an anti-miR21 RNA in Phase II for the treatment of Alport syndrome.
◆ From our deal with Denali: SAR443060 (DNL747), an RIPK1 inhibitor in Phase I for the treatment of amyotrophic lateral sclerosis and Alzheimer’s disease.
36 SANOFI / FORM 20-F 2018
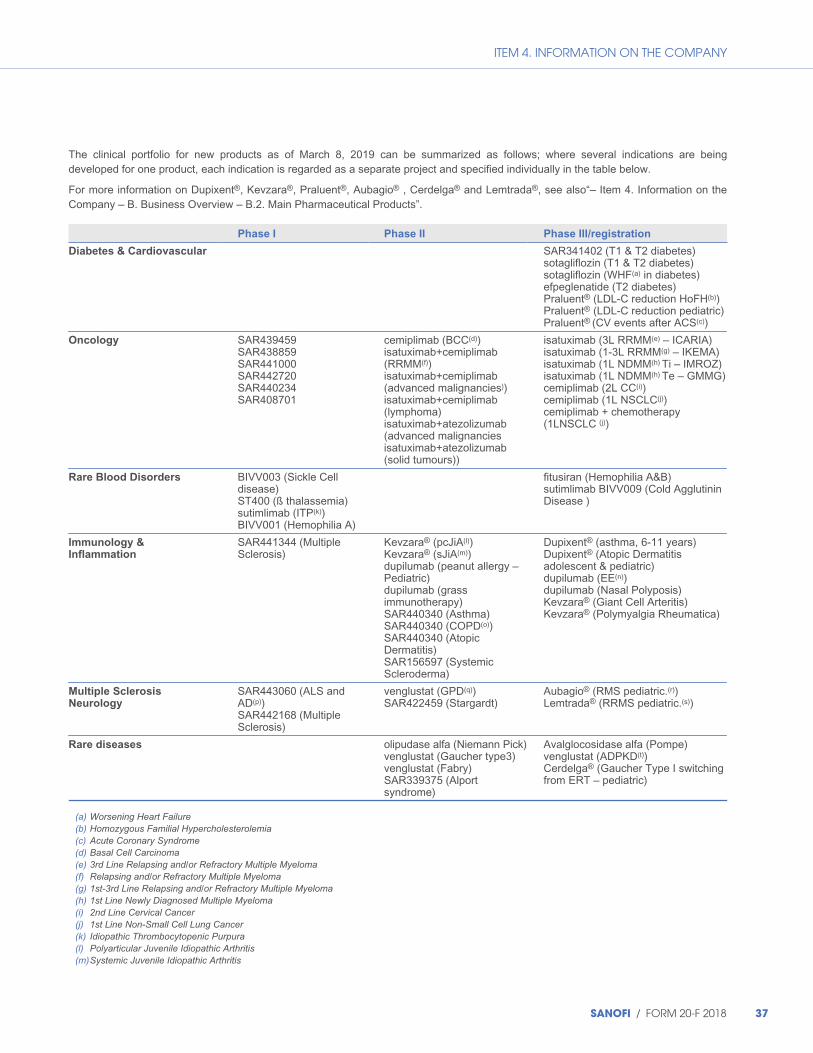
ITEM 4. INFORMATION ON THE COMPANY
The clinical portfolio for new products as of March 8, 2019 can be summarized as follows; where several indications are being developed for one product, each indication is regarded as a separate project and specified individually in the table below.
For more information on Dupixent®, Kevzara®, Praluent®, Aubagio® , Cerdelga® and Lemtrada®, see also“– Item 4. Information on the Company – B. Business Overview – B.2. Main Pharmaceutical Products”.
Phase I Phase II Phase III/registration
Diabetes & Cardiovascular SAR341402 (T1 & T2 diabetes) sotagliflozin (T1 & T2 diabetes) sotagliflozin (WHF(a) in diabetes) efpeglenatide (T2 diabetes) Praluent® (LDL-C reduction HoFH(b)) Praluent® (LDL-C reduction pediatric) Praluent® (CV events after ACS(c))
Oncology SAR439459 SAR438859 SAR441000 SAR442720 SAR440234 SAR408701
cemiplimab (BCC(d)) isatuximab+cemiplimab (RRMM(f)) isatuximab+cemiplimab (advanced malignancies)) isatuximab+cemiplimab (lymphoma) isatuximab+atezolizumab (advanced malignancies isatuximab+atezolizumab (solid tumours))
isatuximab (3L RRMM(e) – ICARIA) isatuximab (1-3L RRMM(g) – IKEMA) isatuximab (1L NDMM(h) Ti – IMROZ) isatuximab (1L NDMM(h) Te – GMMG) cemiplimab (2L CC(i)) cemiplimab (1L NSCLC(j)) cemiplimab + chemotherapy (1LNSCLC (j))
Rare Blood Disorders BIVV003 (Sickle Cell disease) ST400 (ß thalassemia) sutimlimab (ITP(k)) BIVV001 (Hemophilia A)
fitusiran (Hemophilia A&B) sutimlimab BIVV009 (Cold Agglutinin Disease )
Immunology & Inflammation
SAR441344 (Multiple Sclerosis)
Kevzara® (pcJiA(l)) Kevzara® (sJiA(m)) dupilumab (peanut allergy – Pediatric) dupilumab (grass immunotherapy) SAR440340 (Asthma) SAR440340 (COPD(o)) SAR440340 (Atopic Dermatitis) SAR156597 (Systemic Scleroderma)
Dupixent® (asthma, 6-11 years) Dupixent® (Atopic Dermatitis adolescent & pediatric) dupilumab (EE(n)) dupilumab (Nasal Polyposis) Kevzara® (Giant Cell Arteritis) Kevzara® (Polymyalgia Rheumatica)
Multiple Sclerosis Neurology
SAR443060 (ALS and AD(p)) SAR442168 (Multiple Sclerosis)
venglustat (GPD(q)) SAR422459 (Stargardt)
Aubagio® (RMS pediatric.(r)) Lemtrada® (RRMS pediatric.(s))
Rare diseases olipudase alfa (Niemann Pick) venglustat (Gaucher type3) venglustat (Fabry) SAR339375 (Alport syndrome)
Avalglocosidase alfa (Pompe) venglustat (ADPKD(t)) Cerdelga® (Gaucher Type I switching from ERT – pediatric)
(a) Worsening Heart Failure (b) Homozygous Familial Hypercholesterolemia (c) Acute Coronary Syndrome (d) Basal Cell Carcinoma (e) 3rd Line Relapsing and/or Refractory Multiple Myeloma (f) Relapsing and/or Refractory Multiple Myeloma (g) 1st-3rd Line Relapsing and/or Refractory Multiple Myeloma (h) 1st Line Newly Diagnosed Multiple Myeloma (i) 2nd Line Cervical Cancer (j) 1st Line Non-Small Cell Lung Cancer (k) Idiopathic Thrombocytopenic Purpura (l) Polyarticular Juvenile Idiopathic Arthritis (m) Systemic Juvenile Idiopathic Arthritis
SANOFI / FORM 20-F 2018 37

ITEM 4. INFORMATION ON THE COMPANY
(n) Eosinophilic Esophagitis (o) Chronic Obstructive Pulmonary Disease (p) Amyotrophic Lateral Sclerosis and Alzheimer’s disease (q) Gaucher related Parkinson’s Disease (r) Relapsing Multiple Sclerosis pediatric (s) Relapsing Remitting Multiple Sclerosis pediatric (t) Autosomal Dominant Polycystic Kidney Disease
Phase I studies are the first studies performed in humans, who are mainly healthy volunteers, except for studies in oncology, where Phase I studies are performed in patients. Their main objective is to assess the tolerability, the pharmacokinetic profile (the way the product is distributed and metabolized in the body and the manner by which it is eliminated) and where possible the pharmacodynamic profiles of the new drug (i.e. how the product may react on some receptors).
Phase II studies are early controlled studies in a limited number of patients under closely monitored conditions to show efficacy and short-term safety and to determine the dose and regimen for Phase III studies.
Phase III studies have the primary objective of demonstrating or confirming the therapeutic benefit and the safety of the new drug in the intended indication and population. They are designed to provide an adequate basis for registration.
a) Diabetes & Cardiovascular
Diabetes
Sotagliflozin (SAR439954), an oral dual inhibitor of SGLT1/2, is in-licensed from Lexicon. Results of the Phase III program in type 1 diabetes were released in 2017. An NDA for sotagliflozin was filed in the US and EU in type 1 diabetes in March 2018. The European Medicines Agency’s Committee for Medicinal Products for Human Use (CHMP) adopted a positive opinion in March 2019. A large Phase III program including a Cardiovascular Outcome Trial is currently ongoing to investigate the use of sotagliflozin for the treatment of type 2 diabetes. A Phase III study in patients with worsening heart failure was initiated in the second quarter of 2018.
Efpeglenatide (SAR439977) is a long-acting GLP1 receptor agonist derived from our license agreement with Hanmi Pharmaceuticals. A Phase III development program in type 2 diabetes is ongoing. A cardiovascular outcome study, AMPLITUDE-O, evaluating efpeglenatide was initiated in the second quarter of 2018.
Rapid Acting Insulin (SAR341402) is in Phase III for the treatment of type 1 and type 2 diabetes.
Admelog® (a rapid acting insulin – SAR342434) was approved in the US in October 2018.
Products removed from the portfolio in 2018
SAR425899, a dual GLP-1/glucagon receptors was terminated in November 2018
SAR438335, a dual GLP-1/GIP receptor agonists was terminated in November 2018
Cardiovascular
Praluent® (collaboration with Regeneron): The results of the ODYSSEY OUTCOMES study, which showed Praluent® significantly reduced the risk of major adverse cardiovascular events in patients who had suffered a recent acute coronary syndrome, were submitted to the FDA and EMA in the second quarter of 2018. A Praluent® treatment regimen (administration every 4 weeks) was approved in Japan in Nov 2018. A study evaluating Praluent® in children with heterozygous familial hypercholesterolemia (HeFH) was initiated.
Products removed from the portfolio in 2018
SAR407899, a novel Rho-kinase inhibitor, was discontinued in Nov 2018
SAR247799, a S1P1 agonist, was discontinued in Nov 2018.
Further to the termination in January 2019 of the agreement with MyoKardia to jointly develop small-molecule therapeutics targeting genetic mutations associated with certain heart diseases, the following two projects were removed from the portfolio:
◆ SAR439152 (Mavacamten), a myosin inhibitor;
◆ SAR440181, an allosteric activator of cardiac myosin ATPase .
b) Oncology
Products in development
Isatuximab (SAR650984), in-licensed from ImmunoGen, is a monoclonal antibody which selectively binds to CD38, a cell surface antigen expressed in multiple myeloma cancer cells, and other hematological malignancies. Isatuximab kills tumor cells via multiple biological mechanisms including:
◆ antibody-dependent cellular-mediated cytotoxicity (ADCC);
◆ complement-dependent cytotoxicity (CDC);
◆ antibody-dependent cellular phagocytosis (ADCP); and
◆ direct induction of apoptosis (pro-apoptosis) without cross-linking.
Isatuximab also inhibits CD38 ectoenzymatic activity and the expansion of immune-suppressive regulatory T cells and myeloid derived suppressor cells.
The program is currently in Phase III clinical development, with multiple studies ongoing in multiple myeloma (MM), including four pivotal Phase III trials.
The Phase III ICARIA-MM trial is a randomized, open label, multicenter study comparing isatuximab in combination with
38 SANOFI / FORM 20-F 2018
ITEM 4. INFORMATION ON THE COMPANY
pomalidomide and dexamethasone against pomalidomide and dexamethasone in patients with relapsed and refractory multiple myeloma.
The Phase III IKEMA trial is a randomized, open label, multicenter study assessing the clinical benefit of isatuximab combined with carfilzomib (Kyprolis®) and dexamethasone versus carfilzomib with dexamethasone in patients with relapsed and/or refractory multiple myeloma previously treated with one to three prior lines.
The Phase III IMROZ trial is a randomized, open-label, multicenter study assessing the clinical benefit of isatuximab in combination with bortezomib (Velcade®), lenalidomide (Revlimid®) and dexamethasone versus bortezomib, lenalidomide and dexamethasone in patients with newly diagnosed multiple myeloma not eligible for transplant.
The Phase III GMMG HD7 trial is a randomized, open-label, multicenter study assessing the clinical benefit of isatuximab in combination with lenalidomide, bortezomib, and dexamethasone (RVd) for induction and with lenalidomide for maintenance in patients with newly diagnosed multiple myeloma. This study is conducted in collaboration with the German-speaking Myeloma Multicenter Group (GMMG) and was initiated in the last quarter of 2018.
A Phase I study in combination with cyclophosphamide, bortezomib and dexamethasone is ongoing in the treatment of adult patients newly diagnosed with multiple myeloma not eligible for transplant.
A Phase I/II study in combination with cemiplimab in the treatment of patients suffering from RRMM (relapsing and/or refractory multiple myeloma) was initiated in 2018.
In addition, early development studies in solid tumors are ongoing.
◆ A Phase I/II study with isatuximab in combination with cemiplimab in patients with advanced malignancies (prostate and non-small cell lung cancer),
◆ A Phase II study in combination with cemiplimab in the treatment of lymphoma,
◆ A Phase I/II study with isatuximab alone or in combination with atezolizumab in patients with advanced malignancies (hepatocellular carcinoma, squamous cell carcinoma of the head and neck, epithelial ovarian cancer or glioblastoma multiform),
◆ A Phase II study in combination with atezolizumab in the treatment of solid tumors.
Libtayo® – cemiplimab (SAR439684), a PD-1 inhibitor derived from our alliance with Regeneron, was approved by the FDA for the treatment of advanced CSCC (Sept 2018) and is anticipated to be approved in EU by the second quarter of 2019.
A Phase II program in the treatment of basal cell carcinoma was initiated in July 2017 and is ongoing.
Additional Phase III studies are also running in different indications:
◆ in the first-line treatment of patients with advanced or metastatic non-small cell lung cancer (NSCLC) whose tumors express PD-L1, versus Platinum Based Chemotherapy; and
◆ in the treatment of patients with recurrent or metastatic platinum-refractory cervical cancer. In this study, cemiplimab is assessed versus investigator’s choice chemotherapy.
SAR439859 is a potent, orally bioavailable, and selective estrogen receptor (ER) inhibitor that belongs to the SERD class of compounds. SAR439859 antagonizes the binding of estradiol to ER but also promotes the transition of ER to an inactive conformation that leads to receptor degradation (98%) at sub-nanomolar concentrations in tumor cells harboring either wild type or mutant ER. The compound is in Phase I in the treatment of metastatic breast cancer, in monotherapy and in combination with palbociclib.
SAR439459 is a monoclonal antibody which inhibits the activity of transforming growth factor beta (TGFß). TGFß regulates several biological processes (including wound healing, embryonic development, and malignant transformation) by controlling many key cellular functions including proliferation, differentiation, survival, migration, and epithelial mesenchyme transition. TGFß is expected to alleviate the suppressive tumor microenvironment and allow checkpoint modulators, such as anti-programmed cell death 1 (PD-1), to better induce immune responses and thus increase the proportion of patients benefitting from anti-PD-1 treatment. The compound is in Phase I in the treatment of advanced solid tumors in monotherapy and in combination with cemiplimab.
SAR408701 is an antibody drug conjugate (ADC) that binds to CEACAM-5, a membrane glycoprotein originally identified as a surface marker on adenocarcinomas of the human gastrointestinal tract. A study is ongoing to evaluate the activity of the drug in the treatment of non-small-cell lung cancer, colorectal cancer and gastric cancer. In addition, there is an active Phase I trial in Japan.
SAR440234: is a novel bispecific T-cell engager (TCE) that has been engineered incorporating the proprietary Cross-Over-Dual-Variable-Domain (CODV) format, a fully humanized Fc-silenced IgG1 backbone, and variable domains from two antibodies, targeting CD3 (T-cell co-receptor) and CD123, respectively with the goal of developing a therapeutic molecule active against leukemic stem cells and blasts. The First in Human testing of dose-escalation of SAR440234 in patients with acute myeloid leukemia, acute lymphoid leukemia and myelodysplastic syndrome was initiated in 2018.
SAR441000: is an immunostimulatory mRNA mixture designed to stimulate both innate and adaptive arms of the immune system to maximize anti-tumor activity. It is developed in collaboration with BioNTech. The set-up phase of the First in Human study in patients with advanced melanoma is ongoing.
SANOFI / FORM 20-F 2018 39

ITEM 4. INFORMATION ON THE COMPANY
SAR442720 is an inhibitor of SHP2 designed to reduce cell growth signaling that is overactive in patients with non-small cell lung cancer and other types of cancers having specific types of genetic mutations. This compound is developed jointly by Sanofi and Revolution Medicines and the First in Human study in advanced non-small cell lung cancer with mutations (KRAS or in NF1) was initiated in 2018.
Products removed from the portfolio in 2018
SAR566658 is an antibody drug conjugate (ADC) loaded with a maytansinoid derivative DM4 (huDS6-SPDB-DM4) targeting CA6. It was discontinued in April 2018. The product was in Phase II in the treatment of triple-negative breast cancer.
c) Immunology & Inflammation
Main products in Phase III and in the registration phase
Dupixent® – dupilumab (SAR231893), an interleukin-4 receptor alpha antagonist, is a human monoclonal antibody of the IgG4 subclass that binds to the IL-4Rα subunit and inhibits IL-4 and IL-13 signaling. Dupilumab is jointly developed with Regeneron in several indications:
◆ atopic dermatitis: the product was approved for adults by the FDA in March 2017, by the European Commission in September 2017, and by the Japanese PMDA in January 2018, and launched under the trade name Dupixent®. A supplemental filing for the adolescent population has been accepted for priority review by the FDA, with a target action date of March 11, 2019. Several Phase III pediatric studies (6 months to 5 years and 6 to 11 years) are currently ongoing;
◆ asthma: the product was approved for adults & adolescents by the FDA in October 2018, and the CHMP adopted a positive opinion in March 2019. A Phase III study in children (6-11 years) is ongoing;
◆ nasal polyposis: positive Phase III results were announced in October 2018;
◆ eosinophilic esophagitis: Phase II/III study started screening in September 2018;
◆ adjunct to immunotherapy: Proof-of-concept studies were initiated in 2018 to evaluate dupilumab as an adjunct to immunotherapy (peanut and grass allergies);
◆ chronic obstructive pulmonary disease: a Phase III study is on track to start early 2019.
Kevzara® – sarilumab (SAR153191), a monoclonal antibody against the Interleukin-6 Receptor derived from our alliance with Regeneron, already marketed in the treatment of moderate to severe rheumatoid arthritis.
The product is in Phase IIb in pediatric populations for two indications: polyarticular juvenile idiopathic arthritis and systemic juvenile idiopathic arthritis.
Two Phase III studies were initiated in 2018 for the treatment of polymyalgia rheumatic and giant cell arteritis.
Main products in early stage
SAR441344, an anti-CD40L mAb, is in Phase I for the treatment of multiple sclerosis.
SAR156597 a humanized bi-specific monoclonal antibody targeting the cytokines IL-4 and IL-13, is in Phase IIa for the treatment of diffuse systemic sclerosis.
SAR440340, a human anti-IL33 monoclonal antibody derived from our alliance with Regeneron, has completed Phase I. Three Phase II studies started in 2018, in moderate-to-severe asthma, in atopic dermatitis and in chronic obstructive pulmonary disease.
Products removed from the portfolio in 2018
SAR439794, a TLR4 agonist, was discontinued in October 2018.
GZ389988 (TrKA), a small molecule which inhibits binding of nerve growth factor (NGF), was terminated in November 2018.
Ferroquine (OZ439) is a first in class combination for malaria, developed in collaboration with the Medicines for Malaria Venture (MMV). In December 2018, Sanofi and MMV agreed to transfer operational responsibility to MMV such that MMV assumes leadership while Sanofi remains the sponsor of the studies and also retains responsibility for fulfilling drug supply, regulatory and legal obligations.
d) Multiple Sclerosis and Neurology
SAR442168 (PRN2246), an orally administered Bruton’s tyrosine kinase (BTK) inhibitor which was designed to access the brain and spinal cord by crossing the blood-brain barrier and impact immune cell and brain cell signaling. The Phase I studies were completed in the second half of 2018. The investigational new drug (IND) application was submitted December 2018, and a Phase IIb Proof of Concept/dose-ranging study in relapsing multiple sclerosis patients is planned to be initiated in early 2019.
SAR443060 (DNL747) is a best-in-class orally administered receptor-interacting serine/threonine protein kinases (RIPK1) inhibitor. It was designed to be brain penetrant and inhibit two major components of neurodegenerative diseases (inflammation and necroptosis), and is being developed for multiple sclerosis and neurodegenerative diseases. A Phase I study was completed in 2018 and two Phase Ib studies in amyotrophic lateral sclerosis and Alzheimer’s disease were started in late 2018.
Venglustat (GZ402671), an orally administered brain penetrant glucosylceramide synthase (GCS) inhibitor, has completed Part 1 (dose escalation phase) of a Phase II study in patients with early-stage Parkinson’s disease carrying a ß-glucocerebrosidase (GBA) gene mutation (GBA-PD) or other prespecified variant. Part 2 (treatment phase) of the study was started in early 2018. The product is also being developed in other rare disease indications (Gaucher disease type 3, Fabry disease and autosomal dominant polycystic kidney disease – see Rare Diseases section).
40 SANOFI / FORM 20-F 2018
ITEM 4. INFORMATION ON THE COMPANY
Aubagio® (teriflunomide) is currently marketed for the treatment of relapsing forms of multiple sclerosis and relapsing remitting multiple sclerosis. Teriflunomide is being evaluated in a Phase III study to assess safety and efficacy in pediatric patients with relapsing forms of multiple sclerosis.
Lemtrada® (alemtuzumab) is currently marketed for the treatment of relapsing forms of multiple sclerosis. Alemtuzumab is being evaluated in a Phase III study to assess safety and efficacy in pediatric patients with the relapsing remitting form of multiple sclerosis.
SAR422459 is a gene therapy product which uses a lentivector gene delivery technology to introduce a functional ABCR gene into photoreceptors in patients with autosomal recessive Stargardt’s disease. an orphan inherited condition that leads to progressive vision loss from childhood. The product is currently in Phase IIa.
Products removed from the portfolio in 2018
SAR228810, an anti-protofibrillar Abeta monoclonal antibody, completed a Phase I study in mild cognitive impairment due to Alzheimer’s Disease (AD) and in mild AD. The project has been discontinued.
UshStat® (SAR421869), a gene therapy product which uses a lentivector gene delivery technology to introduce a functional MYO7A gene into the photoreceptors and retinal pigment epithelium (RPE) cells in patients with Usher 1B syndrome, an orphan inherited condition that leads to progressive visual field constriction and vision loss from childhood. The product, in Phase I/IIa, will be discontinued contingent upon identification of out-licensing partner.
e) Rare Diseases
Main products in Phase III and in the registration phase
Avalglucosidase alfa (GZ402666 Neo GAA) is a second generation enzyme replacement therapy targeting the treatment of Pompe disease. The Phase III program was launched in November 2016, with the COMET study targeting treatment naïve late onset Pompe disease patients. The Phase IIb/III mini-COMET study started in 2017, targeting treatment experienced infantile onset Pompe disease patients.
GZ402665 (rhASM) olipudase alfa is an enzyme replacement therapy targeting the treatment of non-neurological manifestations of acid sphingomyelinase deficiency (ASMD), also known as Niemann-Pick B disease. Both the open label pivotal Phase I/II trial in the pediatric population and the Phase II/III trial in the adult population have successfully completed enrollment for the target number of patients. Data from the pediatric and adult patients will be assessed one year after enrollment to support registration.
Cerdelga® (eliglustat) is already marketed as a first line oral therapy for Gaucher disease Type 1. It is also currently in Phase III for the treatment of Gaucher disease Type I in pediatric patients.
Main products in early stage
Venglustat (GZ402671 GCS inhibitor) is in development in Fabry disease, Gaucher disease type 3 (GD3) and Autosomal Dominant Polycystic Kidney Disease (ADPKD). The extension study of the Phase II trial for the treatment of Fabry disease to understand the long term effects of venglustat therapy in Fabry patients is completed. A Phase II study in Gaucher disease type 3 (LEAP) is ongoing; the first enrolled patient is about to reach two-year treatment and preliminary results have shown pharmacokinetic evidence that venglustat crosses the blood–CSF barrier. A Phase III pivotal study (STAGED-PKD) in rapidly progressive Autosomal Dominant Polycystic Kidney Disease (ADPKD) patients was initiated in 2018.
SAR339375, an anti-miR21 RNA is being developed in collaboration with Regulus. It is in Phase II for the treatment of Alport syndrome.
f) Rare Blood Disorders
Main products in Phase III and in the registration phase
Sutimlimab (formerly BIVV009/TNT009) is a monoclonal antibody targeting C1. It is a product candidate intended to selectively inhibit the classical complement pathway of the immune system. The Phase III program includes two parallel Phase III trials which are evaluating the efficacy and safety of Sutimlimab in adult patients with primary Cold Agglutinin Disease (CAD/CAgD). Sutimlimab was awarded Breakthrough Therapy Designation by the US Food and Drug Administration in 2018. Sutimlimab is also currently enrolling an open-label Phase Ib trial to evaluate the safety and tolerability of multi-dose in adult patients with Idiopathic Thrombocytopenic Purpura (ITP).
Fitusiran (SAR439774 ALN-AT3) is a program in collaboration with Alnylam for the development of a siRNA therapeutic agent to treat hemophilia (A and B). It uses a novel approach targeting antithrombin (AT), with AT knockdown leading to increase in thrombin generation. The Phase III program (ATLAS) started in 2018.
Main products in early stage
BIVV001 (rFVIIIFc-VWF-XTEN) is an investigational von Willebrand factor (VWF)-independent factor VIII therapy for people with hemophilia A designed to potentially extend protection from bleeds with prophylactic dosing of once weekly or longer. Bioverativ recently dosed the last patient in EXTEN-A, a Phase I/IIa study to evaluate the safety and pharmacokinetic (PK) of BIVV001 in both a 25 IU/kg dose and 65 IU/kg dose cohort of subjects aged 18-65 years with severe hemophilia A. A Phase I repeat dose study to inform the selection of the Phase III dose and regimen started in October 2018.
SANOFI / FORM 20-F 2018 41
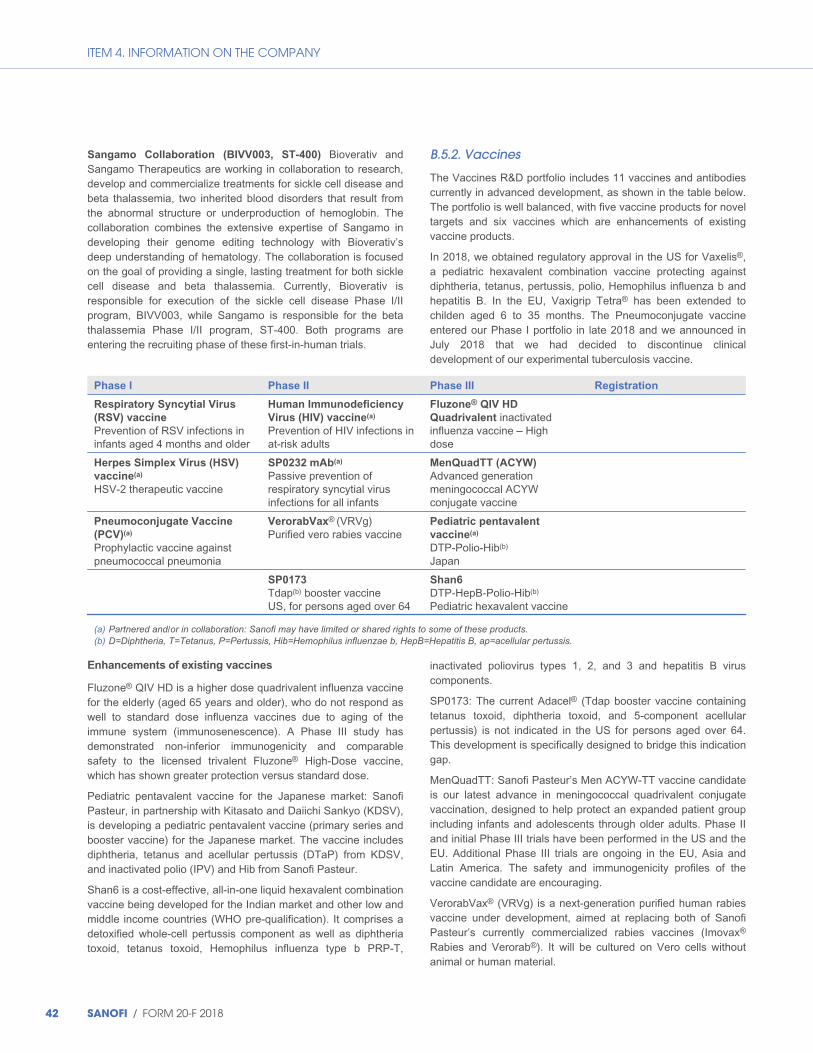
ITEM 4. INFORMATION ON THE COMPANY
Sangamo Collaboration (BIVV003, ST-400) Bioverativ and Sangamo Therapeutics are working in collaboration to research, develop and commercialize treatments for sickle cell disease and beta thalassemia, two inherited blood disorders that result from the abnormal structure or underproduction of hemoglobin. The collaboration combines the extensive expertise of Sangamo in developing their genome editing technology with Bioverativ’s deep understanding of hematology. The collaboration is focused on the goal of providing a single, lasting treatment for both sickle cell disease and beta thalassemia. Currently, Bioverativ is responsible for execution of the sickle cell disease Phase I/II program, BIVV003, while Sangamo is responsible for the beta thalassemia Phase I/II program, ST-400. Both programs are entering the recruiting phase of these first-in-human trials.
B.5.2. Vaccines
The Vaccines R&D portfolio includes 11 vaccines and antibodies currently in advanced development, as shown in the table below. The portfolio is well balanced, with five vaccine products for novel targets and six vaccines which are enhancements of existing vaccine products.
In 2018, we obtained regulatory approval in the US for Vaxelis®, a pediatric hexavalent combination vaccine protecting against diphtheria, tetanus, pertussis, polio, Hemophilus influenza b and hepatitis B. In the EU, Vaxigrip Tetra® has been extended to childen aged 6 to 35 months. The Pneumoconjugate vaccine entered our Phase I portfolio in late 2018 and we announced in July 2018 that we had decided to discontinue clinical development of our experimental tuberculosis vaccine.
Phase I Phase II Phase III Registration
Respiratory Syncytial Virus
(RSV) vaccine
Prevention of RSV infections in infants aged 4 months and older
Human Immunodeficiency
Virus (HIV) vaccine(a) Prevention of HIV infections in at-risk adults
Fluzone® QIV HD
Quadrivalent inactivated influenza vaccine – High dose
Herpes Simplex Virus (HSV)
vaccine(a)
HSV-2 therapeutic vaccine
SP0232 mAb(a)
Passive prevention of respiratory syncytial virus infections for all infants
MenQuadTT (ACYW)
Advanced generation meningococcal ACYW conjugate vaccine
Pneumoconjugate Vaccine
(PCV)(a)
Prophylactic vaccine against pneumococcal pneumonia
VerorabVax® (VRVg) Purified vero rabies vaccine
Pediatric pentavalent
vaccine(a)
DTP-Polio-Hib(b) Japan
SP0173 Tdap(b) booster vaccine US, for persons aged over 64
Shan6 DTP-HepB-Polio-Hib(b) Pediatric hexavalent vaccine
(a) Partnered and/or in collaboration: Sanofi may have limited or shared rights to some of these products. (b) D=Diphtheria, T=Tetanus, P=Pertussis, Hib=Hemophilus influenzae b, HepB=Hepatitis B, ap=acellular pertussis.
Enhancements of existing vaccines
Fluzone® QIV HD is a higher dose quadrivalent influenza vaccine for the elderly (aged 65 years and older), who do not respond as well to standard dose influenza vaccines due to aging of the immune system (immunosenescence). A Phase III study has demonstrated non-inferior immunogenicity and comparable safety to the licensed trivalent Fluzone® High-Dose vaccine, which has shown greater protection versus standard dose.
Pediatric pentavalent vaccine for the Japanese market: Sanofi Pasteur, in partnership with Kitasato and Daiichi Sankyo (KDSV), is developing a pediatric pentavalent vaccine (primary series and booster vaccine) for the Japanese market. The vaccine includes diphtheria, tetanus and acellular pertussis (DTaP) from KDSV, and inactivated polio (IPV) and Hib from Sanofi Pasteur.
Shan6 is a cost-effective, all-in-one liquid hexavalent combination vaccine being developed for the Indian market and other low and middle income countries (WHO pre-qualification). It comprises a detoxified whole-cell pertussis component as well as diphtheria toxoid, tetanus toxoid, Hemophilus influenza type b PRP-T,
inactivated poliovirus types 1, 2, and 3 and hepatitis B virus components.
SP0173: The current Adacel® (Tdap booster vaccine containing tetanus toxoid, diphtheria toxoid, and 5-component acellular pertussis) is not indicated in the US for persons aged over 64. This development is specifically designed to bridge this indication gap.
MenQuadTT: Sanofi Pasteur’s Men ACYW-TT vaccine candidate is our latest advance in meningococcal quadrivalent conjugate vaccination, designed to help protect an expanded patient group including infants and adolescents through older adults. Phase II and initial Phase III trials have been performed in the US and the EU. Additional Phase III trials are ongoing in the EU, Asia and Latin America. The safety and immunogenicity profiles of the vaccine candidate are encouraging.
VerorabVax® (VRVg) is a next-generation purified human rabies vaccine under development, aimed at replacing both of Sanofi Pasteur’s currently commercialized rabies vaccines (Imovax® Rabies and Verorab®). It will be cultured on Vero cells without animal or human material.
42 SANOFI / FORM 20-F 2018
ITEM 4. INFORMATION ON THE COMPANY
New vaccine targets
SP0232 mAb: In March 2017 Sanofi Pasteur announced an agreement with MedImmune/AstraZeneca to develop and commercialize a monoclonal antibody (SP0232, also known as MEDI8897) which has been engineered to have a long half-life, so that only one dose would be needed for the entire RSV season to provide passive immunity and prevent RSV infection in all infants for their first RSV season (and in high-risk infants for their first and second RSV seasons). Positive primary analysis of the Phase IIb trial has demonstrated the safety and efficacy of SP0232. The product received fast-track designation from the FDA in 2015 and is currently under review for EMA PRIME priority medicines designation and for FDA Breakthrough Therapy designation.
Respiratory Syncytial Virus (RSV) infant vaccine: Sanofi Pasteur has a Cooperative Research and Development Agreement (CRADA) with the US National Institutes of Health (NIH) to develop a live attenuated RSV vaccine for immunization in infants aged 4 months and older. The lead candidate(s) are currently under Phase I evaluation in healthy infants without previous RSV exposure.
Pneumoconjugate Vaccine (PCV): Sanofi Pasteur is developing with SK chemicals (South Korea) a pneumococcal conjugate vaccine with broader coverage. This vaccine entered Phase I in December 2018.
Herpes Simplex Virus (HSV) type 2 is a member of the herpes virus family and as such establishes life-long infections – mainly genital herpes – with latent virus established in neural ganglia. Although antivirals currently exist to treat these infections, no vaccine exists. Our vaccine candidate is a live attenuated virus and is being assessed as a therapeutic vaccine to reduce recurrence and transmission. It is currently in Phase I. In 2014, Sanofi Pasteur signed a contract with Immune Design Corp. to
collaborate on the development of this therapeutic herpes simplex virus vaccine candidate by exploring the potential of various combinations of agents.
Human Immunodeficiency Virus (HIV): Sanofi Pasteur is working in a “pox-protein public-private partnership” (P5) to document efficacy of a pox-protein based HIV prophylactic vaccine regimen in South Africa. Specifically, following the modest success of RV144 (the first trial to show supporting evidence that a vaccine could lower the risk of HIV acquisition, the P5 partnership adopted a pox-protein based vaccine regimen to potentially provide greater protection. This is currently being tested in a Phase IIb study in South Africa.
B.5.3. R&D expenditures for late stage development
Expenditures on research and development amounted to €5,894 million in 2018, comprising €4,572 million in the Pharmaceuticals segment; €143 million in the Consumer Healthcare segment; €555 million in the Vaccines segment; and €624 million allocated to “Other”, representing the R&D support function. Research and development expenditures were the equivalent of about 17,1% of net sales in 2018, compared to about 15.6% in 2017 and about 15.3% in 2016. The increase in R&D expenditures as a percentage of sales in 2018 is mainly due to a greater proportion of products being in late stage development. It is also due to the integration of Ablynx and Bioverativ in 2018. Preclinical research in the Pharmaceuticals segment amounted to €983 million in 2018, compared to €1,086 million in 2017 and €1,077 million in 2016. Of the remaining €3,589 million relating to clinical development in the Pharmaceuticals segment (€2,969 million in 2017 and €3,124 million in 2016), the largest portion was generated by Phase III or post-marketing studies, reflecting the cost of monitoring large scale clinical trials.
SANOFI / FORM 20-F 2018 43

ITEM 4. INFORMATION ON THE COMPANY
Compound Entry into Phase III(a) Compound Patent Term(b) Comments
(month/year) US EU Japan
SAR341402 insulin aspart
August 2017 N/A N/A N/A Phase III program ongoing in type 1 and 2 diabetes.
sotagliflozin (SAR439954)
November 2015 2028 2027 2027 NDA filed in Type 1 diabetes. Phase III program ongoing in Type 2 diabetes and in worsening heart failure.
efpeglenatide (SAR439977)
December 2017 2028 2028 2028 Phase III program ongoing in Type 2 diabetes.
dupilumab Dupixent® (SAR231893)
October 2014 2027 2029 2029 Dossier approved in atopic dermatitis (AD) in adults, and in asthma for adults and children over 12 years old. Dossier filed in AD in adolescents (12-17 years old). Phase III program ongoing in AD (children: 6 months-11 years old) and in asthma (children: 6–11 years old). Phase III program ongoing in nasal polyposis and eosinophilic esophagitis. Phase II program ongoing in grass immunotherapy and peanut allergy.
sarilumab Kevzara® (SAR153191)
August 2011 2028(c) 2027 2027 Dossier approved in rheumatoid arthritis. Phase III program ongoing in giant cell arteritis and polymyalgia rheumatica. Phase II program ongoing in systemic juvenile arthritis and polyarticular juvenile idiopathic arthritis.
avalglucosidase alfa (GZ402666)
November 2016 2030 2028 2028 Phase III program ongoing in Pompe disease.
Venglustat (GZ402671)
February 2019 2032 2032 2032 Phase III study in autosomal dominant polycystic kidney disease (ADPKD) initiated. Phase II program ongoing in Fabry disease, Gaucher disease Type 3 and Gaucher related Parkinson’s disease.
fitusiran (SAR439774)
March 2018 2033 2033 2033 Phase III program hemophilia A&B.
ongoing for the treatment of
sutimlimab (BIVV009)
March 2018 2033 2033 2033 Phase III program ongoing in Cold Agglutinin Disease.
isatuximab (SAR650984)
December 2016 2028 2027 2027 Phase Ill program ongoing in relapsing refractory multiple myeloma (RRMM) and in newly diagnosed multiple myeloma. Phase II program ongoing in combination with atezolizumab in advanced malignancies and solid tumors and in combination with cemiplimab in RRMM, advanced malignancies and lymphoma.
cemiplimab (SAR439684)
May 2017 2035 2035 2035 Dossier approved for the treatment of advanced cutaneous squamous cell carcinoma. Phase III program ongoing in 1L non-small cell lung cancer (monotherapy and combination) and 2L cervical cancer. Registration Phase II study ongoing in advanced basal cell carcinoma.
(a) First patient included in Phase III in any indication. (b) Subject to any future supplementary protection certificates and patent term extensions. (c) With Patent Term Adjustment.
With respect to the compound patent information set out above, investors should bear in mind the following additional factors:
◆ The listed compound patent expiration dates do not reflect possible extensions of up to five years available in the US, the EU, and Japan for pharmaceutical products. See “– B.7. Patents, Intellectual Property and Other Rights – Patent Protection” for a description of supplementary protection certificates and patent term extensions.
◆ Depending on the circumstances surrounding any final regulatory approval of the compound, there may be other listed patents or patent applications pending that could have relevance to the product as finally approved; the relevance of any such application would depend upon the claims that ultimately may be granted and the nature of the final regulatory approval of the product.
◆ Regulatory exclusivity tied to the protection of clinical data is complementary to patent protection, and may provide more
44 SANOFI / FORM 20-F 2018
ITEM 4. INFORMATION ON THE COMPANY
efficacious or longer lasting marketing exclusivity than a compound’s patent estate. See “– B.7. Patents, Intellectual Property and Other Rights – Regulatory Exclusivity” for additional information. In the United States the data protection generally runs five years from first marketing approval of a new chemical entity, extended to seven years for an orphan drug indication and twelve years from first marketing approval of a biological product. In the EU and Japan the corresponding data protection periods are generally ten years and eight years, respectively.
B.6. Markets
A breakdown of revenues by business segment and by geographical region for 2018, 2017, and 2016 can be found at Note D.35. to our consolidated financial statements, included at Item 18 of this annual report.
The following market shares and ranking information are based on consolidated national pharmaceutical sales data (excluding vaccines), in constant euros, on a September 2018 MAT (Moving Annual Total) basis. The data are mainly from IQVIA local sales audit supplemented by various other country-specific sources including Knobloch (Mexico), GERS (France) and HMR (Portugal). For more information on market shares and rankings see “Presentation of Financial and Other Information” at the beginning of this Annual Report on Form 20-F.
B.6.1. Marketing and distribution
We have a commercial presence in approximately 100 countries, and our products are available in more than 170 countries. Sanofi is the sixth largest pharmaceutical company globally by sales. Our main markets in terms of net sales are respectively:
◆ Emerging Markets (see definition in “– Information on the Company – Introduction” above): Sanofi is the leading healthcare company in emerging markets, and the fifth largest pharmaceutical company in China.
◆ The US: we rank twelfth with a market share of 3.4%.
◆ Europe: we are the third largest pharmaceutical company in France where our market share is 6.4% and we rank third in Germany with a 4.5% market share.
◆ Other countries: our market share in Japan is 1.7%.
A breakdown of our aggregate net sales by geographical region is presented in “Item 5. Operating and Financial Review and Prospects – Results of Operations – Year Ended December 31, 2018 Compared with Year Ended December 31, 2017.”
Although specific distribution patterns vary by country, we sell prescription drugs primarily to wholesale drug distributors, independent and chain retail drug outlets, hospitals, clinics, managed-care organizations and government institutions. Rare disease products are also sold directly to physicians. With the exception of Consumer Healthcare products, our drugs are ordinarily dispensed to patients by pharmacies upon presentation of a doctor’s prescription. Our Consumer Healthcare products are
also sold and distributed through e-commerce, which is a growing trend in consumer behavior. Our vaccines are sold and distributed through multiple channels including physicians, pharmacies, hospitals, private companies and distributors in the private sector, and governmental entities and non-governmental organizations in the public and international donor markets.
We use a range of channels from in-person to digital to disseminate information about and promote our products among healthcare professionals, ensuring that the channels not only cover our latest therapeutic advances but also our established prescription products, which satisfy patient needs in some therapy areas. We regularly exhibit at major medical congresses. In some countries, products are also marketed directly to patients by way of television, radio, newspapers and magazines, and digital channels (such as the internet). National education and prevention campaigns can be used to improve patients’ knowledge of their conditions.
Our sales representatives, who work closely with healthcare professionals, use their expertise to promote and provide information on our drugs. They represent our values on a day-to-day basis and are required to adhere to a code of ethics and to internal policies in which they receive training.
Although we market most of our products through our own sales forces, we have entered into and continue to form partnerships to co-promote/co-market certain products in specific geographical areas. Our major alliances are detailed at “Item 5. Operating and Financial Review and Prospects – Financial Presentation of Alliances.” See also “Item 3. Key Information – D. Risk Factors – We rely on third parties for the discovery, manufacture and marketing of some of our products.”
B.6.2. Competition
The pharmaceutical industry continues to experience significant changes in its competitive environment.
There are four types of competition in the prescription pharmaceutical market:
◆ competition between pharmaceutical companies to research and develop new patented products or address unmet medical needs;
◆ competition between different patented pharmaceutical products marketed for the same therapeutic indication;
◆ competition between original and generic products or between original biological products and biosimilars, at the end of regulatory exclusivity or patent protection; and
◆ competition between generic or biosimilar products.
We compete with other pharmaceutical companies in all major markets to develop innovative new products. We may develop new technologies and new patented products wholly in-house, but we also enter into collaborative R&D agreements in order to access new technologies. See Note D.21. to our consolidated financial statements, included at Item 18 of this annual report.
SANOFI / FORM 20-F 2018 45

ITEM 4. INFORMATION ON THE COMPANY
Our prescription drugs compete in all major markets against patented drugs from major pharmaceutical companies. Our competitors in key businesses include: Novo Nordisk, Boehringer Ingelheim and Merck in diabetes; Eli Lilly in diabetes, immunology and oncology; Bristol-Myers Squibb in immunology and oncology; Novartis in diabetes, multiple sclerosis, and oncology; Shire in rare diseases and hemophilia; Pfizer in rare diseases, hemophilia and oncology; Biogen Idec, Teva and Merck Serono in multiple sclerosis; Bayer in multiple sclerosis and hemophilia; Roche in multiple sclerosis, hemophilia, immunology and oncology; AstraZeneca in diabetes, cardiovascular disease and oncology; and Amgen in cardiovascular disease.
In our Consumer Healthcare business, key competitors include Johnson & Johnson, Pfizer, GlaxoSmithKline, Bayer and Reckitt Benckiser as well as local players, especially in emerging markets.
Our generics business competes with multinational corporations such as Teva, Sandoz (a division of Novartis), Mylan and local players, especially in emerging markets.
In our Vaccines business we are one of the top four players, competing primarily with large multinational players including Merck, GlaxoSmithKline, and Pfizer.
We also face competition from generic drugs that enter the market when our patent protection or regulatory exclusivity expires, or when we lose a patent infringement lawsuit (see “– B.7. Patents, Intellectual Property and Other Rights” below). Similarly, when a competing patented drug from another pharmaceutical company faces generic competition, those generic products can also affect the competitive environment of our own patented product. See “Item 3. Key Information – D. Risk factors – Risks relating to our business”.
Competition from producers of generics has increased sharply in response to healthcare cost containment measures and to the increased number of products for which patents or regulatory exclusivity have expired.
Generics manufacturers who have received all necessary regulatory approvals for a product may decide to launch a generic version before the patent expiry date, even in cases where the owner of the original product has already commenced patent infringement litigation against the generics manufacturer. Such launches are said to be “at risk” for the promoter of the generic product because it may be required to pay damages to the owner of the original product in the context of patent infringement litigation; however, such launches may also significantly impair the profitability of the pharmaceutical company whose product is challenged.
Drug manufacturers also face competition through parallel trading, also known as reimportation. This takes place when drugs sold abroad under the same brand name as in a domestic market are imported into that domestic market by parallel traders, who may repackage or resize the original product or sell it through alternative channels such as mail order or the internet.
This situation is of particular relevance to the EU, where such practices have been encouraged by the current regulatory framework. Parallel traders take advantage of the price differentials between markets arising from factors including sales costs, market conditions (such as intermediate trading stages), tax rates, or national regulation of prices.
Finally, pharmaceutical companies face illegal competition from falsified drugs. The WHO estimates that falsified products account for 10% of the market worldwide, rising to 30% in some countries. All therapeutic areas are affected, also including vaccines. However, in markets where powerful regulatory controls are in place, falsified drugs are estimated to represent less than 1% of market value.
B.6.3. Regulatory framework
B.6.3.1. Overview
The pharmaceutical and health-related biotechnology sectors are highly regulated. National and supranational health authorities administer a vast array of legal and regulatory requirements that dictate pre-approval testing and quality standards to maximize the safety and efficacy of a new medical product. These authorities also regulate product labeling, manufacturing, importation/exportation and marketing, as well as mandatory post-approval commitments that may include pediatric development.
The submission of an application to a regulatory authority does not guarantee that a license to market will be granted. Furthermore, each regulatory authority may impose its own requirements during the course of the product development and application review. It may refuse to grant approval and require additional data before granting approval, even though the same product has already been approved in other countries. Regulatory authorities also have the authority to request product recalls and product withdrawals, and to impose penalties for violations of regulations based on data that are made available to them.
Product review and approval can vary from six months or less to several years from the date of application depending upon the country. Factors such as the quality of data, the degree of control exercised by the regulatory authority, the review procedures, the nature of the product and the condition to be treated, play a major role in the length of time a product is under review.
The International Council for Harmonization (ICH) continues to implement its reform mandate.
The aims are to reinforce the foundations of the ICH; expand harmonization globally beyond the traditional ICH members, i.e. the three founding members (EU, Japan, US) plus Canada and Switzerland as standing members; and facilitate the involvement of additional regulators and industry associations around the world. Since the reform started much progress has been made. There are now 10 regulatory agencies (Brazil, China, Chinese Taipei, Singapore and South Korea in addition to the three
46 SANOFI / FORM 20-F 2018
ITEM 4. INFORMATION ON THE COMPANY
founding members and the two standing members) and 28 ICH organizations (including 13 regulatory authorities from around the world) with observer status.
International collaboration between regulatory authorities continues to develop with the implementation of confidentiality arrangements and memoranda of understanding between both ICH and non-ICH regulatory authorities. Examples include work-sharing on Good Manufacturing Practices (GMP) and Good Clinical Practices (GCP) inspections, as well as regular interactions between the US and the EU in the form of “clusters” (pediatrics, oncology, advanced therapy medicinal products, vaccines, pharmacogenomics, orphan drugs, biosimilars, and blood products). In 2017 the United States and the EU completed an exchange of letters to amend the Pharmaceutical Annex to the 1998 US-EU Mutual Recognition Agreement. Under this agreement, US and EU regulators will be able to utilize each other’s good manufacturing practice for inspections of pharmaceutical manufacturing facilities.
In addition to the joint efforts listed above, Free Trade Agreements (FTAs) have proven to be one of the best ways to open up foreign markets to exporters and to allow for discussions on harmonization topics for regulatory authorities. Some agreements, such as the Agreement on Trade Related Aspects of Intellectual Property Rights (TRIPS), are international in nature, while others are between specific countries. The requirements of many countries (including Japan and several EU Member States) to negotiate selling prices or reimbursement rates for pharmaceutical products with government regulators significantly extend the time to market entry beyond the initial marketing approval. While marketing authorizations for new pharmaceutical products in the EU have been largely centralized within the European Commission in collaboration with the EMA, pricing and reimbursement remain a matter of national competence.
In the EU, there are three main procedures for applying for marketing authorization:
◆ The centralized procedure is mandatory for drugs derived from biotechnologies; new active substances designed for human use to treat HIV, viral diseases, cancer, neurodegenerative diseases, diabetes and auto-immune diseases; orphan drugs; and innovative products for veterinary use. When an application is submitted to the EMA, the scientific evaluation of the application is carried out by the Committee for Medicinal Products for Human Use (CHMP) and a scientific opinion is prepared. This opinion is sent to the European Commission which adopts the final decision and grants an EU marketing authorization. Such a marketing authorization is valid throughout the EU and the drug may be marketed within all EU Member States.
◆ If a company is seeking a national marketing authorization in more than one Member State, two procedures are available to facilitate the granting of harmonized national authorizations across member states: the mutual recognition procedure or the decentralized procedure. Both procedures are based on the recognition by national competent authorities of a first assessment performed by the regulatory authority of one Member State.
◆ National authorizations are still possible, but are only for products intended for commercialization in a single EU Member State or for line extensions to existing national product licenses.
In the EU, vaccines are treated as pharmaceutical products, and therefore have to obtain marketing authorization under the same procedures and conditions for registration described above.
On April 26, 2018, the European Commission published its Proposal for a Council Recommendation on “strengthened cooperation against vaccine-preventable diseases in Europe” and a Communication to the European Parliament, the Council, the European Economic and Social Committee and the Committee of the Regions. The Recommendation was adopted by the EU Council on December 7, 2018. The text sets recommendations for action by national governments and the EU to address major vaccination challenges such as vaccination hesitancy, low vaccine uptake and supply issues. Suggested actions include the setting up of a coalition of healthcare professionals for vaccination, an EU vaccination information portal and an EU vaccination card.
The European Trade Association, Vaccines Europe and Sanofi have been working for the past year in support of the adoption of this recommendation as it will be a key lever to increase vaccination coverage rates across Europe.
In parallel, the European Parliament adopted the “Resolution on vaccine hesitancy and the drop in vaccination rates in Europe” on April 19, 2018; and the European Joint Action on vaccination, co-funded by the Health Programme, was launched on September 4, 2018. It will address vaccine hesitancy and seek to increase vaccination coverage in the EU. It is coordinated by INSERM (France) and involves 23 countries (including 20 EU countries). It will also work towards strengthening cooperation of national immunization advisory groups (NITAGs) with a view to increasing transparency and trust in the decision-making process regarding the introduction of new vaccines, and on finding options to better anticipate vaccine demand and secure sustainability of vaccine supply across Europe.
Vaccines industry representatives, via Vaccines Europe (including Sanofi), are involved in Work Packages in areas where industry can contribute such as Research, Development and supply. The European Commission is reinforcing its support for national vaccination efforts to increase coverage, including through the recent publication of three reports: “State of vaccine confidence in the EU 2018”, “Organisation and delivery of vaccination services in the European Union” and “Vaccination programmes and health systems in the EU”.
Generic products are subject to the same marketing authorization procedures. A generic product must contain the same active medicinal substance as a reference product approved in the EU. Generic applications are abridged: generic manufacturers only need to submit quality data and demonstrate that the generic drug is “bioequivalent” to the originator product (i.e. performs in the same manner in the patient’s body), but do not need to submit safety or efficacy data since regulatory authorities can refer to the reference product’s dossier. Generic product
SANOFI / FORM 20-F 2018 47
ITEM 4. INFORMATION ON THE COMPANY
applications can be filed and approved in the EU only after the originator product’s eight-year data exclusivity period has expired. Further, generic manufacturers can only market their generic products after a 10- or 11-year period has elapsed from the date of approval of the originator product. In the case of orphan drugs, generic product applications may not be filed before the expiry of a 10- or 12-year period from the date of approval of the originator product.
Another relevant aspect in the EU regulatory framework is the “sunset clause” under which any marketing authorization ceases to be valid if it is not followed by marketing within three years, or if marketing is interrupted for a period of three consecutive years.
In 2018, the EMA recommended 84 medicines for marketing authorization (versus 92 in 2017), including 42 new active substances (versus 35 in 2017).
Among the 84 medicines recommended, 21 (25%) had an orphan designation (versus 19 in 2017 and 17 in 2016), providing medicines for patients with rare diseases. Four medicines were evaluated under accelerated assessment in 2018 (versus seven in both 2016 and 2017); this mechanism is reserved for medicines that have the potential to address unmet medical needs. One medicine was recommended for a conditional marketing authorization; this is one of the EMA’s early access routes to patients, and is intended for medicines that address an unmet medical need and that target seriously debilitating, life-threatening or rare diseases, or are intended for use in emergency situations in response to a public health threat.
Post-authorization safety monitoring of pharmaceutical products is carefully regulated in Europe. EU pharmaceutical legislation for medicinal products describes the respective obligations of the marketing authorization holder (MAH) and of the regulatory authorities to set up a system for pharmacovigilance in order to collect, collate and evaluate information about suspected adverse reactions.
It is possible for the regulatory authorities to withdraw products from the market for safety reasons. Responsibilities for pharmacovigilance rest with the regulatory authorities of all the EU Member States in which the marketing authorizations are held. In accordance with applicable legislation, each EU Member State has a pharmacovigilance system for the collection and evaluation of information relevant to the risk-benefit balance of medicinal products. The regulatory authority regularly monitors the safety profile of the products available in its territory, takes appropriate action where necessary, and monitors the compliance of MAHs with their pharmacovigilance obligations. All relevant information is shared between the regulatory authorities and the MAH, in order to allow all parties involved in pharmacovigilance activities to fulfill their obligations and responsibilities.
Pharmacovigilance legislation in Europe was amended to strengthen the protection of patient health by promoting prompt and appropriate regulatory action on European medicines.
The measures included the creation of the Pharmacovigilance Risk Assessment Committee (PRAC), a scientific advisory committee at EMA level with a key role in the assessment of all
aspects of risk management relating to the use of medicinal products for human use approved in the European Economic Area (EEA). The PRAC performs reviews of marketed products (by class or on ad hoc basis) through various procedures. For Sanofi, 209 products underwent PRAC review through signal and referral procedures from July 2012 to December 2018, generating 136 safety labeling variations (24 new variations in 2018) and 7 additional risk minimization measures. In only two cases for Sanofi (Myolastan®, and methadone oral solutions containing povidone) did the review lead to the product being withdrawn from the EU market.
On November 22, 2017, as part of the ongoing implementation of EU legislation, the EMA launched a new and improved version of EudraVigilance (the system for managing and analyzing information on suspected adverse reactions to medicines which have been authorized or are being studied in clinical trials within the EEA), with enhanced functionalities to support the fulfilment of pharmacovigilance obligations. Alongside the launch, it became mandatory for national Competent Authorities and MAHs to use simplified electronic reporting to notify EudraVigilance of suspected adverse reactions related to medicines. The EMA and the European Commission have agreed transitional arrangements to streamline the monitoring of EudraVigilance by MAHs. A pilot period started on February 22, 2018 in which MAHs of the active substances included in a dedicated list have to monitor them in EudraVigilance and inform EMA and national competent authorities of validated signals with their medicines. The pilot was initially planned for one year but has been extended until further notice. The EMA will finalize a report at the end of 2019 on the experience of signal monitoring in EudraVigilance since February 2018.
The European database of medicinal products aims to deliver structured and quality assured information on medicinal products authorized in the EU that incorporates the terminology adopted in the EU for products, substances, and organizations underpinning pharmacovigilance and regulatory systems. Since January 1, 2015, MAHs have been required to notify the EMA of any new marketing authorizations and any change in the terms of a marketing authorization. Since July 2018, the EMA has made this list publicly available.
Public hearings are a new tool allowing the EMA to engage with EU citizens in the supervision of medicines and listen to their views and experiences. Public hearings are expected to give EU citizens a voice in the evaluation of the safety of medicines and empower them to express their views on issues related to the safety of certain medicines and the management of risks. Public hearings were held on valproate and related substances in 2017 (with Sanofi participation), and on quinolone and fluoroquinolone antibiotics in 2018.
In the US, applications for approval are submitted for review to the FDA, which has broad regulatory powers over all pharmaceutical and biological products that are intended for sale and marketing in the US. To commercialize a product in the US, a new drug application (NDA) under the Food, Drug and Cosmetic (FD&C) Act, or a Biological License Application (BLA) under the Public Health Service (PHS) Act, must be submitted to
48 SANOFI / FORM 20-F 2018
ITEM 4. INFORMATION ON THE COMPANY
the FDA for filing and pre-market review. Specifically, the FDA must decide whether the product is safe and effective for its proposed use; if the benefits of the drug’s use outweigh its risks; whether the drug’s labeling is adequate; and if the manufacturing of the drug and the controls used for maintaining quality are adequate to preserve the drug’s identity, strength, quality and purity. Based upon this review, the FDA can stipulate post-approval commitments and requirements. Approval for a new indication of a previously approved product requires submission of a supplemental NDA (sNDA) for a drug or a supplemental BLA (sBLA) for a biological product.
Sponsors wishing to market a generic drug can file an Abbreviated NDA (ANDA) under 505(j) of the FD&C Act. These applications are “abbreviated” because they are generally not required to include data to establish safety and effectiveness, but need only demonstrate that their product is bioequivalent (i.e. performs in humans in the same manner as the originator’s product). Consequently, the length of time and cost required for development of generics can be considerably less than for the innovator’s drug. The ANDA pathway in the US can only be used for generics of drugs approved under the FD&C Act.
The FD&C Act provides another abbreviated option for NDA approved products, which is a hybrid between an NDA and ANDA called the 505(b)(2) pathway. This 505(b)(2) pathway enables a sponsor to rely on the FDA’s findings that the reference product is safe and effective, based on the innovator’s preclinical and clinical data.
The FDA Center for Drug Evaluation and Research (CDER) approved 59 novel drugs in 2018 (versus 46 in 2017, 22 in 2016, 45 in 2015, 41 in 2014, and 27 in 2013). Designations and pathways to expedite drug development and review include Fast Track (24/59 = 41%), Breakthrough Therapy (14/59 = 24%), Accelerated approval (4/59 = 7%), and Priority Review (43/59 = 73%). Of the 59 novel drugs approved in 2018, 73% were designated in one or more expedited categories. No new vaccines were approved by the FDA in 2018, although three products (Gardasil 9, Afluira, and Fluarix Quadravalent) had their licenses expanded.
CDER identified 19 of the 59 novel drugs approved in 2018 as First-in-Class (32%) (as compared to 33% in 2017), one indicator of the innovative nature of a drug. Approximately 58% of the novel drugs approved in 2018 were approved to treat rare or “orphan” diseases that affect 200,000 or fewer Americans.
In Japan, the regulatory authorities can require local clinical studies, though they also accept multi-national studies. In some cases, bridging studies have been conducted to verify that foreign clinical data are applicable to Japanese patients and obtain data to determine the appropriateness of the dosages for Japanese patients. The Japanese Ministry of Health, Labor and Welfare (J-MHLW) has introduced a new National Health Insurance (NHI) pricing system. Reductions in NHI prices of new drugs every two years are compensated by a “Premium” for a maximum of 15 years. A “Premium” is granted in exchange for the development of unapproved drugs or off-label indications with
high medical needs. Once an official request for development of an unapproved drug or off-label indication has been made, pharmaceutical companies must file literature-based reports within six months or submit a clinical trial notification for registration within one year after the official development request. For unapproved drugs with high medical needs, clinical trials in Japanese patients are generally required.
To promote the development of innovative drugs and bring them into early practical use in Japan ahead of the world, the Sakigake (a Japanese term meaning “forerunner”) review designation program was introduced in April 2015. The Pharmaceuticals and Medical Devices Agency (PMDA) reviews designated products on a priority basis with the aim of reducing their review time from the normal 12 months to six months. Based on the NHI price system, the “Premium” classification is restricted to new products from companies which conduct R&D on “pharmaceuticals truly conducive to the improvement of healthcare quality,” i.e. (i) pediatric/orphan drugs and (ii) drugs to treat diseases that cannot be adequately controlled with existing drugs. From 2021, all prescription product prices will be reviewed annually instead of once every two years, but price cuts will actually be conducted only for a limited number of products with big gaps between their official reimbursement prices and market prices (e.g. generic drugs and long-listed original products). On the other hand, prices of products that are rapidly adopted after approvals for new indications may from 2017 be reviewed four times a year.
The PMDA has set a target for 80% (as opposed to the current 50%) of all applications to be reviewed in 12 months for products with standard review status, and in nine months for products with priority review status, by the end of 2018.
The PMDA also plans to eliminate the “review lag” between the filing and approval of drugs and medical devices relative to the FDA by the end of 2020.
The Pharmaceuticals and Medical Devices Act (PMDA) was implemented on November 25, 2014. There are three major objectives. The first objective is to strengthen safety measures for drugs and medical devices. In particular, MAHs must prepare a package insert based on the latest knowledge and notify the J-MHLW before placing products on the market or when revisions are made. The second objective is to accelerate the development of medical devices. The third-party accreditation system will be expanded to specially controlled generic medical devices (i.e. Class III devices). Consequently, the PMDA can accelerate the review of innovative medical devices. The third objective is accelerated commercialization of regenerative medicinal products.
The term “Regenerative Medicinal Products” used in the law includes cellular and tissue-based products and gene therapies. This concept is similar to “Advanced Therapy Medicinal Products” (ATMPs) in the EU. The law allows for conditional regulatory approval based on confirmation of probable efficacy and safety in small-scale clinical trials, followed up by comprehensive studies to confirm safety and efficacy in a wider population that would then lead to a regular (full) approval.
SANOFI / FORM 20-F 2018 49

ITEM 4. INFORMATION ON THE COMPANY
For new drugs and biosimilar products with approval applications submitted in or after April 2013, Japan has implemented an RMP (Risk Management Plan), similar to the EU Pharmacogivilance system.
For generic products, the data necessary for filing are similar to EU and US requirements. Companies only need to submit quality data, and data demonstrating bioequivalence to the originator product, unless the drug is administered intravenously. Clinical Trial Data (CTD) submission for generics has been mandatory since March 2017.
B.6.3.2. Biosimilars
Products can be referred to as “biologics” when they are derived from natural sources, including blood products or products manufactured within living cells (such as antibodies). Most biologics are complex molecules or mixtures of molecules which are difficult to characterize and require physico-chemical-biological testing, and an understanding of and control over the manufacturing process.
The concept of “generics” is not scientifically appropriate for biologics due to their high level of complexity. Consequently the concept of “biosimilar” products is more appropriate. A full comparison of the purity, safety and efficacy of the biosimilar product against the reference biological product should be undertaken, including assessment of physical-chemical-biological, non-clinical and clinical similarity.
In the EU, the regulatory framework for developing and evaluating biosimilar products has been in place since 2005. The CHMP has issued several product/disease specific guidelines for biosimilar products including guidance on preclinical and clinical development of biosimilars of Low Molecular Weight Heparin (LMWH) and of insulins. Starting in 2011 and continuing through 2018, the CHMP has been engaged in revising most of the existing biosimilar guidelines (general overarching guidelines, quality, and non-clinical and clinical product-specific guidelines).
While the CHMP has adopted a balanced approach for all biosimilars, allowing evaluation on a case-by-case basis in accordance with relevant biosimilar guidelines, it has also indicated that in specific circumstances, a confirmatory clinical trial may not be necessary. This applies if similar efficacy and safety can clearly be deduced from the similarity of physicochemical characteristics, biological activity/potency, and pharmacokinetic and/or pharmacodynamic profiles of the biosimilar and the reference product. With respect to vaccines, the CHMP currently takes the view that it is at present unlikely that these products can be characterized at the molecular level, and that each vaccine product must be evaluated on a case-by-case basis.
In February 2017, the EMA launched a tailored scientific advice pilot project to support step-by-step development of new biosimilars, based on a review of the quality, analytical and functional data already available. This pilot will encompass six scientific advice requests. The EMA will analyze the outcome after completing the pilot.
In 2017, the EMA and the European Commission published an information guide for healthcare professionals to provide them with reference information on the science and regulation underpinning the use of biosimilar medicines.
In 2018, the EMA gave positive opinions to 19 biosimilars.
In the US, the Patient Protection and Affordable Care Act (Affordable Care Act), signed into law in March 2010, amended the Public Health Service Act to create an abbreviated licensure pathway (351k) for biological products that are demonstrated to be “biosimilar” to or “interchangeable” with an FDA-licensed biological product.
In 2018, the FDA finalized the biosimilar guidance Labeling for Biosimilar Products (first issued in draft in 2016), issued the draft guidance Formal Meetings Between the FDA and Sponsors or Applicants of BsUFA Products and withdrew the 2017 draft guidance Statistical Approaches to Evaluate Analytical Similarity. Another draft guidance published in 2017, Considerations in Demonstrating Interchangeability with a Reference Product, still remains in draft. In December 2018, the FDA also finalized the guidance Questions and Answers on Biosimilar Development and the BPCi Act Guidance for Industry and released the draft guidance New and Revised Draft Q&As on Biosimilar Development and the BPCi Act (Revision2).
The FDA also published a Biosimilars Action Plan: Balancing Innovation and Competition in July 2018, and held a hearing on the Plan in September. The 11-part Action Plan is intended to spur uptake and acceptance of biosimilars in the marketplace by streamlining regulatory review and attempting to address anticompetitive business practices around biosimilar sales. As of the date of this annual report 17 biosimilar products have been approved by the FDA, seven of which were approved in 2018. To date no biosimilar products have been deemed interchangeable.
In Japan, guidelines defining the regulatory approval pathway for follow-on biologics were finalized in March 2009. These guidelines set out the requirements on preclinical, clinical and Chemistry, Manufacturing and Control (CMC) data to be considered for the development of the new application category of biosimilars. Unlike the CHMP guidelines, the main scope of the Japanese guidelines includes recombinant proteins and polypeptides, but not polysaccharides such as LMWH.
Many regulatory authorities worldwide have in place, or are in the process of developing, a regulatory framework for biosimilar development and approval. It should be noted that although many emerging markets are basing their regulations and guidance on WHO or EMA documentation, some markets have approved biosimilars under an existing regulatory framework that is not specific to biosimilars.
B.6.3.3 Regenerative medicine
The US Center for Biologics Evaluation and Research (CBER) released a suite of 6 draft gene therapy guidances in 2018, addressing three general topics (Chemistry Manufacturing and Controls, Long Term Follow-Up After Administration of Human Gene Therapy Products, Testing of Retroviral Vector-Based Human Gene Therapies) and three more disease-specific topics
50 SANOFI / FORM 20-F 2018

ITEM 4. INFORMATION ON THE COMPANY
(Human Gene Therapy for Hemophilia, Human Gene Therapy for Rare Diseases, Human Gene Therapy for Retinal Disorders). These guidance documents compliment an existing comprehensive policy framework to address how the agency plans to support and expedite the development of regenerative medicine products, including human cells, tissues, and cellular and tissue-based products (HCT/Ps), which already included guidance on determining whether HCT/Ps are subject to the FDA’s premarket review requirements (Regulatory Considerations for Human Cell, Tissues, and Cellular and Tissue-Based Products: Minimal Manipulation and Homologous Use) and whether an establishment may qualify for an exception from the requirements under Part 1271 of the Code of Federal Regulations (CFR) Title 21 by meeting the exception in 21 CFR 1271.15(b) (Same Surgical Procedure Exception: Questions and Answers Regarding the Scope of the Exception).
The FDA has continued to move forward with the Regenerative Medicine Advanced Therapy (RMAT) designation program, first established in section 3033 of the 21st Century Cures Act. This program aims to facilitate an efficient development program, expedite review of innovative regenerative medicine therapies, and provide more timely access to potentially life-saving products. Products granted the RMAT designation are eligible for increased early interactions with the FDA, including all the benefits available to breakthrough therapies. As of December 28, 2018, the FDA had granted 24 RMAT designations, as compared with 10 in 2017. Two guidances issued in late 2017 related to the RMAT pathway were finalized in February 2019: Expedited programs for Regenerative Medicine Therapies for Serious Conditions and Evaluation of Devices Used with Regenerative Medicine Advanced Therapies.
Novel regenerative medicine therapies approved by the CBER in 2017 included the first three gene therapies: Novartis AG’s chimeric antigen receptor T-cell (CAR-T) therapy Kymriah (tisagenlecleucel) followed by Kite Pharma Inc.’s CAR-T therapy Yescarta (axicabtagene ciloleucel), both for oncology indications, and Spark Therapeutics Inc.’s Luxturna (voretigene neparvovec-rzyl) for inherited vision loss.
B.6.3.4. Generics
In the EU only 11 positive opinions were issued under the centralized procedure for generics in 2017 (versus 20 in 2017 and 16 in 2016). Most of the generics applications for chemical entities use the mutual recognition and decentralized procedures. Pricing systems for generics remain at national level in the EU.
In the US, to help the FDA ensure that participants in the US generic drug system comply with US quality standards and to increase the likelihood that American consumers get timely access to low cost, high quality generic drugs, the FDA and the industry have jointly agreed to a comprehensive program (Generic Drug User Fee Amendments) to supplement traditional appropriated funding, focused on safety, access, and transparency. The FDA has made review and approval of generics a priority for the Agency, releasing 23 (mostly product-specific) guidance documents between November 1, 2018 and December 28, 2018, and promising to release an umbrella guidance to help address common challenging regulatory and
scientific issues encountered while developing generic drugs. In the period October 1, 2017 through September 30, 2018 (the FDA’s fiscal year), the FDA planned to review and act on 90% of original ANDA submissions within 10 months from the date of submission. During that period, a record number of 781 ANDAs were approved (as compared to 763 in 2017), 190 received tentative approval (174 in 2017), and 2,648 complete responses were issued (1,603 in 2017).
In Japan, the 2018 reforms to the NHI price system included a new special price reduction rule for long-listed drugs. Prices for long-listed drugs (10 years after generic entry) will be gradually brought closer to the generic price (starting at 2.5x generic price 10 years after generic entry). Prices will be reduced based on the generic substitution rate. Reductions are 2.0% if the substitution rate is less than 40%, 1.75% if the rate is 40% or higher but less than 60%, and 1.5% if it is 60% or higher but less than 80%.
NHI prices of first generics (previously set at 60%) were set at 50% of the price of the originator product. A 40% rule is applied to oral first generics once more than ten products with the same ingredients have obtained listing.
In addition, Sakigake premium of 10% was introduced in April 2016 for Sakigake-designated products, which have new mechanisms of action and obtain approval in Japan ahead of the rest of the world.
B.6.3.5. Medical devices
In the EU, there is no pre-market authorization by a regulatory authority. Instead there is a Conformity Assessment Procedure (for medium and high risk devices), possibly involving an independent third party “Notified Body” (NB) depending on the classification of the device. Once certified, medical devices have to bear the CE-mark, allowing them to circulate freely in the EU/EFTA (European Free Trade Association) countries and Turkey.
To align legal requirements across the EU Member States and to strengthen the protection of public health, two new Regulations came into force in 2017 replacing older EU Directives.
◆ Regulation (EU) 2017/745 of the European Parliament and of the Council of April 5, 2017 on medical devices came into force on May 26, 2017 with a transition period of three years.
◆ Regulation (EU) 2017/746 of the European Parliament and of the Council of April 5, 2017 on in vitro diagnostic medical devices came into force on May 26, 2017 with a transition period of five years.
In the US, the FDA Center for Devices and Radiological Health (CDRH) is responsible for regulating firms that manufacture, repackage, relabel and/or import medical devices sold in the US. The CDRH also regulates radiation-emitting electronic products (medical and non-medical) such as lasers, x-ray systems, ultrasound equipment, microwave ovens and color televisions.
Medical devices are classified into Class I, II and III based on their risks and the regulatory controls necessary to provide reasonable assurance of safety and effectiveness. Regulatory control increases from Class I to Class III. The device classification regulation defines the regulatory requirements for a
SANOFI / FORM 20-F 2018 51
ITEM 4. INFORMATION ON THE COMPANY
general device type. Most Class I devices are exempt from Premarket Notification 510(k); most Class II devices require Premarket Notification 510(k); and most Class III devices require Premarket Approval. Low and moderate risk devices (Classes I and II) can also be classified through the de novo pathway if certain conditions are met.
The basic regulatory requirements that manufacturers of medical devices distributed in the US must comply with are: Establishment Registration; Medical Device Listing; Premarket Notification 510(k) (unless exempt) or Premarket Approval; Investigational Device Exemption; Quality System Regulation; Labeling Requirements and Medical Device Reporting. In 2017 the FDA initiated a Software Precertification Program and Pilot. The purpose of the pilot is to test the initial program and model, and for the FDA to learn how companies of varying sizes develop software. As part of the process the FDA hosted a public workshop in January 2018 to gather feedback. The Precertification Program consists of four components: Excellence Appraisal; Review Determination; Streamlined Review; and Real World Performance.
B.6.3.6. OTC drugs
In the EU, four European centralized prescription to OTC (Rx-to-OTC) switches have occurred since 2009. For nationally authorized products, switches follow national rules for OTC classification. In 2017, a European platform for non-prescription medicines was launched to harmonize non-prescription status and to facilitate the switching environment.
In the US, the FDA approved no prescription to OTC switches in 2018 and only one in 2017: Sanofi Consumer Healthcare’s Xyzal® Allergy 24HR (levocetirizine dihydrochloride).
In Japan, the J-MHLW drug safety committee set new rules in 2013 on the details of safety evaluations for drugs newly switched from prescription to OTC, following the passage of a bill to revise the Pharmaceutical Affairs Law (PAL). The J-MHLW gives the green light for online sales of such OTC drugs if no safety concerns arise during an initial three-year safety evaluation period. During this three-year evaluation period, drugs that moved from prescription to OTC are categorized as products that require pharmacist consultations when purchased. Under the new rules, the J-MHLW requires marketing authorization holders to submit interim reports upon completion of their post marketing surveillance (PMS).
The PMS needs to cover 3,000 patients for oral drugs and 1,000 patients for topical drugs. Based on these interim reports and other reports on adverse events, the J-MHLW performs the first evaluation on whether there are any safety concerns three years after the launch. If no safety concerns are identified during this three-year safety evaluation period, the classification of these Rx-to-OTC switches will be downgraded to Category 1 OTC drugs, i.e. drugs which do not require pharmacist consultation and can be sold online. The J-MHLW performs the second safety evaluation one year after the transfer to Category 1 OTC drugs. If
no safety concerns are identified, the classification of the Category 1 OTC drugs will be downgraded to Category 2 OTC drugs, i.e. drugs that can be handled by pharmacists but also by registered salespersons.
Generic OTC drugs can be filed after completion of the three-year PMS period and will be approved in seven months.
The J-MHLW launched a new panel in April 2016 to pick up Rx-to-OTC switch candidates. Under the new scheme, the MHLW accepts requests for Rx-to-OTC switch candidates from various stakeholders such as medical societies, consumers, and pharmaceutical companies, and then these requests are publicly reviewed by the new panel in order to minimize pressures from medical societies. Based on its deliberations, the panel refers shortlisted requests to the Pharmaceutical Affairs and Food Sanitation Council (PAFSC) committee on nonprescription drugs, which effectively makes decisions on marketing approval for OTCs.
B.6.3.7. Transparency and public access to documents
Transparency regarding regulatory information, clinical trials and associated regulatory decision-making
Over the last several years the pharmaceutical industry has been subject to growing pressure for greater transparency about clinical trials (conduct and results). Regulatory authorities are also being pressed for more openness and transparency, for example by making more comprehensive disclosures about the rationale and basis for regulatory decisions on medicinal products, so as to enhance the credibility of the regulatory process. This is a significant driver of the transparency initiatives undertaken in several countries.
Pharmaceutical manufacturers have committed to publishing protocols, study information and results of clinical studies conducted with their products in publicly accessible registries. In addition, both ICH and non-ICH countries often impose mandatory disclosure of clinical trials information.
From a regulatory perspective, ambitious initiatives have been undertaken by the major regulatory authorities and Sanofi has processes in place to address these initiatives.
EU pharmaceutical legislation for medicinal products requires national regulatory authorities and the EMA to actively publish information concerning authorization and supervision of medicinal products. The EMA has introduced a series of initiatives aimed at improving the transparency of its activities, such as improving the format of the European Public Assessment Report and web-published product approvals, withdrawals and rejections. In addition, there is an increased focus on comparative efficacy and effectiveness. EU pharmacovigilance legislation aims at giving greater transparency, especially with regard to communication of safety issues (e.g. public hearings, specific European web portals with information on medicinal products). Finally, patients and consumers are increasingly involved in the work of the EMA’s scientific committees.
52 SANOFI / FORM 20-F 2018
ITEM 4. INFORMATION ON THE COMPANY
The EMA has committed to continuously extend its approach to transparency. A key goal in this process is the proactive publication of clinical trial data for medicines once the decision-making process on an application for an EU-wide marketing authorization is complete.
In 2014, the EMA adopted Policy 70 for publication of clinical trial reports. The policy came into force on January 1, 2015. It applies to clinical reports contained in any new marketing authorization applications for centralized marketing authorizations; to post-authorization procedures for existing centrally authorized medicinal products; and to article 58 applications (medicines that are intended exclusively for markets outside the EU).
For post-authorization procedures for existing centrally authorized medicinal products, the effective date was July 1, 2015 for extension of indication and line extension applications submitted as of that date.
The policy is being implemented in two phases:
◆ The first phase came into force on January 1, 2015; it applies solely to the publication of clinical reports, the data from which are accessible on the EMA website.
◆ In the second phase, the EMA will endeavor to find the most appropriate way to make Individual Patient Data (IPD) available, in compliance with privacy and data protection laws. The EMA will implement this phase at a later stage.
In 2016, the EMA Policy 70 process was fully transitioned to the business operational teams within Sanofi.
As of August 1, 2018 the EMA suspended all new activities related to clinical data publication. This is a result of the implementation of the third phase of the EMA’s business continuity plan ahead of its relocation to the Netherlands in response to Brexit (see – “B.6.3.8. Other new legislation proposed or pending implementation – Brexit” below). The EMA is continuing to publish clinical data submitted on or before July 31, 2018, but no new data packages will be processed until further notice.
In the US, the FDA launched a Transparency Initiative in June 2009, with the aim of making the FDA more transparent and open to the American public by providing the public with useful, user-friendly information about agency activities and decision making.
The FDA Transparency Initiative has three phases: Phase I – Improving the understanding of the FDA basics (completed, with ongoing updates); Phase II – Improving the FDA’s disclosure of information to the public (ongoing); and Phase III – Improving the FDA’s transparency to regulated industry (ongoing). Proposals to improve transparency and access to information have been released for consultation for both Phase II and Phase III. Some of the less controversial proposals have been implemented; others, such as proactive release of information that the Agency has in its possession, may require revisions to US federal regulations.
In September 2016, the US Department of Health and Human Services, National Institute of Health (NIH) published Final
Rule under Section 801 of the Food and Drug Administration Amendments Act of 2007 (FDAAA) on the Dissemination of Clinical Trial Information. The Final Rule requires registration and results submission for applicable clinical trials (ACTs); clarifies and expands registration data elements; expands the scope of results reporting requirements to include trials of unapproved products; clarifies and expands elements of results data; and revises the Quality Control (QC) and posting process. This information is published on a government-run database of clinical trial information (ClinicalTrials.gov) intended to increase the transparency of ongoing clinical trials in humans. In September 2018, the FDA published a draft guidance, Civil Money Penalties Relating to the ClinicalTrials.gov Data Bank, delineating consequences for sponsors that fail to comply with the requirements on clinical trial registration, results posting, and certification.
Separately, in January 2018, the FDA launched a new pilot program to evaluate whether disclosing certain information included within clinical study reports (CSRs) of approved drugs is beneficial to the public. CSRs are scientific reports prepared by the sponsor to summarily address a drug’s efficacy and safety, and include information related to the methods and results of clinical trials supporting the drug. Traditionally, this information has only been released following submission of a Freedom of Information Act (FOIA) request. Under the pilot program, the Agency will continue to protect trade secrets and confidential commercial information from disclosure, as required by law.
In Japan, the J-MHLW/PMDA actively publishes information concerning approvals of medicinal products (ethical drugs, non-prescription drugs, and quasi-drugs) and medical devices. For ethical drugs discussed at the J-MHLW’s Pharmaceutical Affairs and Food Sanitation Council, redacted clinical trials data modules 1 and 2 (excluding commercially confidential information and personal data) have been made publicly available on the PMDA website.
Other transparency initiatives also exist in some other countries.
Transparency regarding Health Care Professionals
In the EU, there is no harmonized approach regarding transparency for Health Care Professionals (HCPs). For transparency purposes, there is increased external scrutiny of interactions between pharmaceutical companies and HCPs at national level, with legal provisions or healthcare industry voluntary undertakings in some countries (such as the UK, Denmark, France and Portugal).
In mid-2013, the European Federation of Pharmaceutical Industries Association (EFPIA) released a Code on Disclosure of Transfers of Value from Pharmaceutical Companies to HCPs and Healthcare Organizations (HCOs), the “EFPIA HCP/HCO Disclosure Code”. EFPIA members are required to comply with this Code and transpose it into their national codes.
The Code includes stricter rules on hospitality and gifts, with the requirement for member associations to include a threshold on hospitality and the prohibition of gifts in their national codes.
SANOFI / FORM 20-F 2018 53
ITEM 4. INFORMATION ON THE COMPANY
In the US, the Physician Payments Sunshine Act, or “Sunshine Act”, was passed as part of the Affordable Care Act. The law is designed to bring transparency to financial relationships between physicians, teaching hospitals, and the pharmaceutical industry. Manufacturers and group purchasing organizations (GPOs) must report certain payments or transfers of value – including payments for research, publication support, travel, honoraria and speaking fees, meals, educational items like textbooks and journal reprints – whether made directly to a physician or teaching hospital or indirectly through a third party. The law also requires manufacturers and GPOs to report physicians or members of their immediate family who have an ownership interest in the company. Reports are made to the Centers for Medicare and Medicaid Services, a government agency.
In Japan, the Japan Pharmaceutical Manufacturers Association (JPMA) member companies started releasing information on their funding of healthcare professionals in 2013 and patient groups in 2014 under the trade group’s voluntary guidelines to boost financial transparency. Under the JPMA’s transparency guidelines for the relations between companies and medical institutions, its members currently report their payments in five categories: R&D, academic research support, manuscript/writing fees, provision of information, and other expenses.
B.6.3.8. Other new legislation proposed or pending
implementation
In the US, in August 2017 the Food and Drug Reauthorization Act (FDARA) was signed into law. The law reauthorized user fee collection for the next five years for drugs (PDUFA VI), devices (MDUFA IV), generics (GDUFA II) and biosimilars (BsUFA II) and reflects a move to a more stable funded program. In addition to user fees, FDARA focuses on modifications and improvements of the regulation of drugs, devices and generics.
In China, since the initial programmatic regulatory reform initiative started in 2015, most of the country’s regulatory processes have been adapted to bring them into line with other major regulatory agencies. These include establishing predictable pathways and timelines (including conditional approvals); a Marketing Application Holder system (pilot); risk-based inspections; and clinical trial processes (including 60 working days IND approval) that allow companies developing innovative drugs to conduct clinical trials simultaneously with other countries (International Multicenter Clinical Trials). The National Medical Products Administration (NMPA), formerly the China Food and Drug Administration (CFDA), also has plans to establish a system for intellectual property protection. China became an ICH management committee member in June 2018, and this is driving the need for full ICH implementation in China. The Changchun Changsheng vaccine incident in August caused the Chinese government to focus attention on the quality of vaccines and forced the NMPA to pivot to regulatory enforcement-related reforms, as well as inviting comments on the draft amendment to the Drug Administration Law (DAL) and a new draft Vaccine Administration Law. Vaccines in China are registered in accordance with the relevant provisions for
Preventive Biological Products in the Drug Registration Regulations. The release of vaccines is managed in phase with batch releases by the National Institute; there is a system for compulsory inspection and audit of each batch of products. Any products that fail the test cannot be approved or imported. Under NMPA reforms implemented to encourage approval of innovative drugs, imported vaccines also benefited from accelerated registration.
Clinical trial regulation in the EU
The Clinical Trial Regulation ((EU) 536/2014) of the European Parliament and of the Council of April 16, 2014 on clinical trials on medicinal products for human use, and repealing Directive 2001/20/EC, was published in the Official Journal of the EU on May 28, 2014.
As a result, pharmaceutical companies and academic researchers will be required to post the results of all their European clinical trials in a publicly-accessible database.
The legislation streamlines the rules on clinical trials across Europe, facilitating cross-border cooperation to enable larger and more reliable trials, as well as trials of products for rare diseases. It simplifies reporting procedures, and gives the European Commission the authority to perform audits. Once a clinical trial sponsor has submitted an application dossier to a Member State, the Member State will have to respond to it within fixed deadlines.
One of the main objectives of the European Commission in introducing the clinical trial regulation was to simplify the clinical trial approval process. The new legislation was drafted in the more stringent form of a regulation rather than as a directive, so as to achieve better harmonization between countries without interfering with Member States’ competencies in terms of ethical issues.
The major points are:
◆ The timeline for approving a clinical trial proposal is set at 60 days without questions (and a maximum of 99 with questions and clock stops). In the case of advanced therapy medicinal products, the timeline can be extended by another 50 days, making 110 days in total.
◆ To make both the reference state and the relevant Member States comply with the timelines, the legislation includes the concept of tacit approval. Selection of reference Member State by the sponsor was maintained.
◆ As regards transparency requirements for clinical trial data submitted through a single EU submission portal and stored in a Union-level database, the new clinical trial regulation allows for protection of personal data of patients and commercially confidential information, which is in line with the industry data sharing laid out in Policy 70 (see previous section). Although the Regulation was adopted and entered into force in 2014, the timing of its application depends on confirmation of full functionality of the EU portal and database through an
54 SANOFI / FORM 20-F 2018
ITEM 4. INFORMATION ON THE COMPANY
independent audit. The Regulation becomes applicable six months after the European Commission publishes notice of this confirmation.
◆ In October 2018, the EMA Management Board heard that the development of the auditable release of the portal and database is complete. The release is now in an intensive phase of pre-testing before formal user acceptance testing can start in early 2019.
◆ Taking into account the rate of progress with testing and bug fixing, and the EMA’s relocation to Amsterdam, the audit field work will take place once the Agency has settled in Amsterdam, after March 2019. Dependent on successful completion of the audit and review by the Management Board around the end of 2019, the system could be ready to go live later in 2020.
Other transparency initiatives also exist in some other countries.
Falsified medicines
The EU has reformed the rules for importing active substances for medicinal products for human use into the EU (Directive 2011/62/EU). Since January 2013, all imported active substances must have been manufactured in compliance with GMP standards or standards at least equivalent to GMP. The manufacturing standards in the EU for active substances are those specified in Q7 as issued by the International Council for Harmonization (ICH). With effect from July 2, 2013, such compliance must be confirmed in writing by the competent authority of the exporting country, except for countries with waivers. Written confirmation must also confirm that the plant where the active substance was manufactured is subject to control and enforcement of GMP at least equivalent to that in the EU.
Several implementing measures for the Falsified Medicines Directive have been adopted. A common EU logo for online pharmacies was adopted in June 2014, giving Member States until July 2015 to prepare for its application. Detailed rules for the safety features appearing on the outer packaging of medicinal products for human use have been adopted, meaning that all prescription drugs or reimbursed drugs commercialized on the European market will have to be serialized by February 2019. Within the scope of this directive, a European system is in place to ensure that the product delivered to the patient is genuine by reading the unique serialized number per medicinal box unit at the point of dispensation (pharmacist or hospital).
In the USA, the Drug Supply Chain Security Act was implemented since November 2018 for some prescription products; it will also help guarantee the traceability of drug products and to address falsified medicines.
Nagoya Protocol
The Nagoya Protocol came into force in October 2014 and was intended to create greater legal certainty and transparency for both providers and users of genetic resources by:
◆ establishing more predictable conditions for access to genetic resources; and
◆ helping to ensure benefit-sharing when genetic resources leave the contracting party providing the genetic resources.
In the EU, the European Commission published the implementation Act in 2015 (Regulation 2015/1866).
It states that the pharmaceutical industry has to implement compliance procedures for non-human biological materials used in the discovery, development, manufacturing and packaging of medicinal products.
The Sanofi Nagoya Ready Project was launched in 2015 to ensure compliance with international treaties on the sustainable use of biodiversity. The Nagoya Ready Project Team has ensured that Sanofi is prepared for compliance with the Nagoya Protocol and ready for full implementation. A Nagoya Expert Group reporting to the Bioethics Committee will continue to monitor the international implementation of the protocol and provide appropriate support and advice to the relevant Sanofi teams.
In Japan, the government submitted the instrument of ratification on May 22, 2017; it became effective on August 20, 2017. Currently the discussion on “benefit-sharing” of genetic resources is ongoing.
NDA electronic clinical trial data submission (eCTD)
In the EU, electronic submission for marketing authorization and variation applications has already been in place for many years.
To allow secure submission over the Internet for all types of eCTD applications for human medicines, the EMA launched the eSubmission Gateway, which is now mandatory for all eCTD submissions through the centralized procedure, in order to improve efficiency and decrease costs for applicants.
As of July 1, 2015, companies are obliged to use electronic application forms provided by the EMA for all centralized marketing authorization applications for human and veterinary medicines. From January 2016, the use of electronic application forms became mandatory for all other EU marketing authorization procedures (i.e. mutual recognition and decentralized procedures, and national submissions).
In Japan, electronic submission of CDISC-based clinical data will become mandatory after the transition period that runs from October 2016 to March 2020, allowing the authority to efficiently store and analyze the data to improve its efficacy and safety predictions.
Such mandatory electronic submissions are expected to be limited to clinical trial data for new drugs newly filed for regulatory approval. The necessity for electronic submission for Phase I trial data will likely be decided on a case-by-case basis, while pharmaceutical companies will be required to file non-clinical toxicity study data in one of the Standard for the Exchange of Non-clinical Data (SEND) formats in due course.
Brexit
The decision by the UK to withdraw from the EU (Brexit) has triggered a need to adapt regulatory activities in the region. Early in 2017, the EMA established a working group to explore options to redistribute across the remaining network the workload related to human and veterinary medicines and inspections currently managed by the UK.
SANOFI / FORM 20-F 2018 55

ITEM 4. INFORMATION ON THE COMPANY
The redistribution takes account of the diverse expertise in the network and the workload associated with the regulation of medicines. In April 2018, the remaining Member States (EU27) and the EMA completed the distribution of the UK’s portfolio of over 370 centrally authorized products in preparation for Brexit. The new rapporteurs and co-rapporteurs in the EU27, Iceland and Norway will take full responsibility for these products as of March 30, 2019.
To safeguard continuity of operations and secure the timely execution of its core tasks, the EMA has launched a Business Continuity Plan (BCP). The BCP defines priority levels for EMA activities according to their impact on public health and the ability of the EMA to manage its tasks in light of the resources available. The plan entered its third phase on October 1, 2018, with the temporary suspension or reduction of activities; guideline development and revision were scaled back, and non-product-related working parties temporarily put on hold. These changes are currently scheduled to last until June 30, 2019, but will be subject to a review in April 2019 once the EMA has moved to its temporary premises in Amsterdam.
Following the 2017 procedure, the EU has published a regulation officially naming Amsterdam as the new seat of the EMA.
On November 25, 2018, the EU officially endorsed the terms of the UK’s withdrawal, bringing to an end negotiations which began in March 2017. The EU leaders have approved the final text of the draft EU Withdrawal Agreement. The Withdrawal Agreement includes provisions for a transition, or “implementation”, period lasting until December 31, 2020, during which EU law will continue to apply in the UK. During this time, the UK Medicines and Healthcare Regulatory Authority (MHRA) will continue to operate under the jurisdiction of the EMA. However, the MHRA will no longer be able to participate in EMA activities unless expressly invited to do so.
The UK Parliament voted against the Withdrawal Agreement on January 15, 2019 by a large majority. Since then there have been two votes in the UK Parliament on various amendments, and the UK Prime Minister has been tasked to go back to Brussels to ask for change to the Withdrawal agreement. There will be a further vote not later than 27 February 2019, and the UK Parliament will be asked to vote in favour of the Withdrawal deal or on further options. If the agreement is not approved by Parliament then this will be a “no deal” or “hard Brexit” scenario in which EU law will cease to apply in the UK as of 11 pm on March 29, 2019. However much could still happen before this date, including a general election, a second referendum or even rescinding Article 50.
Sanofi has set up an internal Brexit Task Force to proactively address issues triggered by Brexit. A Brexit readiness analysis was conducted by a third party. The primary objectives were to provide an external perspective on the level of comprehensiveness and rigor of Sanofi’s Brexit planning activities, surface any potential concerns or risks, and suggest targeted mitigation measures where applicable. The stress test concluded that Sanofi is well prepared for Brexit across most
impact categories, with implementation of strategies generally on track. A plan was put into place to address remaining gaps with the goal of achieving full readiness before 29 March 2019. Sanofi has set up contingency plans, such as stockpiling certain medicines or shifting operations from the UK to the EU in the event of a ”hard Brexit”, as there are no guarantees for effective transitional solutions being in place by March 30, 2019 and because the model for the future UK-EU relationship is still unclear.
B.6.4. Pricing & Reimbursement
Increasingly, efforts to control drug expenditures in most markets in which Sanofi operates result in pricing and market-access controls for pharmaceuticals. The nature and impact of these controls vary from country to country, but some common themes are: reference pricing, systematic price reductions, formularies, volume limitations, patient co-pay requirements, and generic substitution. In addition, governments and third-party payers are increasingly demanding comparative and/or relative effectiveness data and budget impact modelling to support their decision-making process. They are also increasing their use of emerging healthcare information technologies such as electronic prescribing and health records to increase oversight on efficacy and safety and to improve compliance with prescribing guidelines. As a result, the environment in which pharmaceutical companies must operate in order to make their products available to patients and providers who need them becomes more complex each year.
While a drive to expand healthcare coverage has become a noticeable feature in many regions, providing opportunities for the industry, it has also put pressure on these new budgets, bringing with it a wave of price and volume control measures. Many countries and regions have increased pressure on pricing through joint procurement and negotiation. National production, whether through a policy of industrialization, technology transfer agreements or preferential conditions for local production, is also a growing issue.
Significant trends in the US:
Private health insurance is offered widely as part of employee benefit packages, and is the main source of access to subsidized healthcare provision. Some individuals purchase private health plans directly, while publicly-subsidized programs provide cover for retirees, the poor, the disabled, uninsured children, and serving or retired military personnel. Double-coverage can occur. Public health insurances include:
◆ Medicare, which provides health insurance for retirees and for people with permanent disabilities. The basic Medicare scheme (Part A) provides hospital insurance only and the vast majority of retirees purchase additional cover through some or all of three other plans named Part B, Part C and Part D. Part D enables Medicare beneficiaries to obtain outpatient drug subsidies. Almost two-thirds of all Medicare beneficiaries have enrolled in Part D plans.
56 SANOFI / FORM 20-F 2018
ITEM 4. INFORMATION ON THE COMPANY
◆ Medicaid, which provides health insurance for low-income families, certain qualified pregnant woman and children, individuals receiving supplemental security income, and other eligible persons determined on a state-by-state basis.
Managed Care Organizations (MCOs) combine the functions of health insurance, delivery of care, and administration. MCOs use specific provider networks and specific services and products. There are three types of managed care plans: Health Maintenance Organizations (HMOs), Preferred Provider Organizations (PPOs), and Point of Service (POS) plans.
Pharmacy benefit managers (PBMs) serve as intermediaries between insurance companies, pharmacies and manufacturers to secure lower drug costs for commercial health plans, self-insured employer plans, Medicare Part D plans, and federal and state government employee plans.
The US market has seen increased consolidation of key payer organizations. Most notably, the CVS-Aetna and Cigna-ESI mergers point to a strong role for integrated payers and PBMs in terms of product access and affordability. This trend may also impact market pricing for pharmaceuticals going forward. With the largest three PBMs now covering over 75% of the market, consolidation has led to significant negotiating power for commercial plans. Commercial payers continue to employ tools designed to lower plan-level net costs; these include formulary management tools and exclusions, benefit design changes and generic conversions, and the adoption of biosimilars (which are now beginning to transform the US biologics landscape).
The current Administration has increasingly focused on the cost of prescription drugs in order to align policy with the President’s campaign promise to address the disparity between drug prices paid by Americans and the rest of the world (referred to as the “American Patients First” plan). Since the publication of the American Patients First Blueprint in 2018, there has been proposed legislation, rulemaking, and guidance that indicates the Administration’s priorities are to cut list prices, increase competition for Medicare part B drugs, and reduce out of pocket costs for patients. These proposals include action like a proposed International Price Index Model to tether domestic prices to the international markets, and suggested reforms to the rebate system to eliminate incentives that lead to higher list prices. These proposals are not settled and there is ongoing uncertainty regarding if, when, and how the costs of federally funded programs would be lowered. Other major changes at the federal level in line with these trends include (i) the early closure of the Medicare Part D “donut hole” gap in coverage, which saw manufacturer’s share of costs increase from 50% to 70%; and (ii) the increasing use of co-pay accumulator adjustment programs. Additionally, these trends are not limited to the federal level as states are also increasingly concerned with prescription drug prices and are continuing to consider legislation that may further impact the regulatory landscape.
Through all of these changes, we remain committed to responsible business practices. In February 2019, we updated our public commitment to the pricing principles we first published
in 2017, impacting our practices both in the US and in other markets (for more information, see https://www.sanofi.com/en/our-responsibility/documents-center/).
Significant trends in China:
China has a quarter of the cancer deaths in the world, a diabetes prevalence of 10.9% and ongoing supply problems for basic medicines. Compounded with public pressure over a range of scandals (such as fake vaccines and the quality of generics) and the affordability of oncology products, there has been continuing pressure on the Chinese government to modernize the national pharmaceutical landscape. Several policy reforms over the past few years are finally beginning to have their effect. There is now a considerable acceleration in updates of the National Reimbursement Drug List (NRDL) and Essential Drugs List, especially for oncology products. The first major update of the NRDL in February 2017 has been followed by further additions, including 17 oncology products that were added in October 2018. However, there is still no clarity on pricing methods. National negotiations and a recent collective negotiation on 47 oncology products run jointly by 14 provinces show a tendency to push for lower prices to reflect these increased volumes. This is not limited to oncology: following the introduction in 2015 of the Generic Quality Consistency Evaluation, a measure designed to ensure bioequivalency of Chinese generics, it was announced in September 2018 that generics demonstrating bioequivalence would be allowed to participate in a pilot tender involving 4 municipalities and 7 major cities. The tender took place in December 2018, and resulted in significant price decreases. In many other pilots, formal and informal international price referencing has again played a part. It remains to be seen how the Chinese authorities will implement health technology assessment (HTA) following the creation of a new HTA body, or how their orphan drug policy will lead to real market access. While access to the market is increasingly being facilitated, especially following the waiver for local clinical trial data, it remains to be seen how the cost of this potentially massive increase in volume will be managed.
Significant trends in other markets:
In Canada, the international price benchmarking basket is set to grow, a change which will be accompanied by a string of cost-cutting measures applied according to the cost-effectiveness level of a drug’s indications. In Japan, negotiations are still ongoing for the long-awaited implementation of HTA, which is expected in 2019. Already, 2018 saw a number of new measures implemented: cost-containment mechanisms for market expansion and high sales, new international reference pricing rules, and changes to the price maintenance premium system.
In Europe, the UK’s imminent exit from the EU is still uncertain with several possible implications for the pharmaceutical industry. Much remains to be decided on how the two parties, the EC and the UK government, will align and accept the regulations of each other. In the short term, Sanofi has mitigated risk by planning for a no-deal Brexit, stockpiling medicines and vaccines where global supply allows and establishing new supply routes into the
SANOFI / FORM 20-F 2018 57

ITEM 4. INFORMATION ON THE COMPANY
UK. For the most part, prices of medicines and vaccines to the NHS are fixed in sterling, which gives some risk of sterling-to-euro fluctuations in the event of a no-deal. In the longer term, small increased costs could occur with the application of border checks if customs arrangements have not been resolved at the time of the UK’s exit, and as a result of the UK’s exit from the EMA and subsequent need to file submissions with the UK Medicines and Healthcare Products Regulatory Agency (MHRA).
We believe that third-party payers will continue to act to curb the cost of pharmaceutical products. While the impact of those measures cannot be predicted with certainty, we are taking the necessary steps to defend the accessibility and price of our products in order to reflect the value of our innovative product offerings, and we continue to develop and pilot innovative contracting platforms with commercial payers to better align our price and value across multiple therapeutic areas including diabetes, rheumatoid arthritis, multiple sclerosis and asthma.
B.7. Patents, intellectual property and other rights
B.7.1. Patents
Patent protection
We own a broad portfolio of patents, patent applications and patent licenses worldwide. These patents are of various types and may cover:
◆ active ingredients;
◆ pharmaceutical formulations;
◆ product manufacturing processes;
◆ intermediate chemical compounds;
◆ therapeutic indications/methods of use;
◆ delivery systems; and
◆ enabling technologies, such as assays.
Patent protection for individual products typically extends for 20 years from the patent filing date in countries where we seek patent protection. A substantial part of the 20-year life span of a patent on a new molecule (small molecule or biologic) has generally already passed by the time the related product obtains marketing authorization. As a result, the effective period of patent protection for an approved product’s active ingredient is significantly shorter than 20 years. In some cases, the period of effective protection may be extended by procedures established to compensate regulatory delay in Europe (via Supplementary Protection Certificate or SPC), in the US (via Patent Term Extension or PTE) and in Japan (also via PTE).
Additionally, the product may benefit from the protection of patents obtained during development or after the product’s initial marketing authorization. The protection a patent provides to the related product depends upon the type of patent and its scope of coverage, and may also vary from country to country. In Europe for instance, applications for new patents may be submitted to
the European Patent Office (EPO), an intergovernmental organization which centralizes filing and prosecution. As of December 2017, an EPO patent application may cover the 38 European Patent Convention Member States, including all 28 Member States of the EU. The granted “European Patent” establishes corresponding national patents with uniform patent claims among the Member States. However, some older patents were not approved through this centralized process, resulting in patents having claim terms for the same invention that differ between the countries. Additionally, a number of patents prosecuted through the EPO may pre-date the European Patent Convention accession of some current European Patent Convention Member States, resulting in different treatment in those countries.
In 2013, EU legislation was adopted to create a European Unitary Patent and a Unified Patent Court. However, it will only enter into force once the agreement on the Unified Patent Court is ratified by at least 13 Member States including France, Germany, and the United Kingdom. As of the date of this document, 14 countries including France have ratified the agreement, but ratification by the United Kingdom and Germany is still outstanding, and the process is impacted by Brexit.
The Unitary Patent will provide unitary protection within the participating states of the EU (when ratified by the Member States with the exception of Croatia, Spain, and Poland, not currently signatories of the agreement). The Unified Patent Court will be a specialized patent court with exclusive jurisdiction for litigation relating to European patents and Unitary Patents. The Court will be composed of a central division (headquartered in Paris) and several local and regional divisions in the contracting Member States to the agreement. The Court of Appeal will be located in Luxembourg.
We monitor our competitors and vigorously seek to challenge patent infringements when such infringements would negatively impact our business objectives. See “Item 8 – A. Consolidated Financial Statements and Other Financial Information – Information on Legal or Arbitration Proceedings – Patents” of this annual report.
The expiration or loss of a patent covering a new molecule, typically referred to as a compound patent, may result in significant competition from generic products and can result in a dramatic reduction in sales of the original branded product (see “Item 3. Key Information – D. Risk Factors”). In some cases, it is possible to continue to benefit from a commercial advantage through product manufacturing trade secrets or other types of patents, such as patents on processes, intermediates, compound structure, formulations, methods of treatment, indications or delivery systems. Certain categories of products, such as traditional vaccines and insulin, were historically relatively less reliant on patent protection and may in many cases have no patent coverage. It is nowadays increasingly frequent for novel vaccines and insulins also to be patent protected. Finally, patent protection is of comparatively lesser importance to our Consumer Healthcare and generics businesses, which rely principally on trademark protection.
58 SANOFI / FORM 20-F 2018
ITEM 4. INFORMATION ON THE COMPANY
Regulatory exclusivity
In some markets, including the EU and the US, many of our pharmaceutical products may also benefit from multi-year regulatory exclusivity periods, during which a generic competitor may not rely on our clinical trial and safety data in its drug application. Exclusivity is meant to encourage investment in research and development by providing innovators with exclusive use, for a limited time, of the innovation represented by a newly approved drug product. This exclusivity operates independently of patent protection and may protect the product from generic competition even if there is no patent covering the product.
In the US, the FDA will not grant final marketing authorization to a generic competitor for a New Chemical Entity (NCE) until the expiration of the regulatory exclusivity period (five years) that commences upon the first marketing authorization of the reference product. The FDA will accept the filing of an Abbreviated New Drug Application (ANDA) containing a patent challenge one year before the end of this regulatory exclusivity period (see the descriptions of ANDAs in “– Product Overview – Challenges to Patented Products” below). In addition to the regulatory exclusivity granted to NCEs, significant line extensions of existing NCEs may qualify for an additional three years of regulatory exclusivity if certain conditions are met. Also, under certain limited conditions, it is possible to extend unexpired US regulatory and patent-related exclusivities by a pediatric extension. See “– Pediatric Extension”, below.
In the US, a different regulatory exclusivity period applies to biological drugs. The Biologics Price Competition and Innovation Act of 2009 (“BPCIA”) was enacted on March 23, 2010 as part of the Affordable Care Act. The BPCIA introduced an approval pathway for biosimilar products. A biosimilar product is a biologic product that is highly similar to the reference (or innovator) product, and which has no clinically meaningful differences from the reference product in terms of the safety, purity, and potency of the product. The BPCIA provides that an application for a biosimilar product that relies on a reference product may not be submitted to the FDA until four years after the date on which the reference product was first licensed, and that the FDA may not approve a biosimilar application until 12 years after the date on which the reference product was first licensed. US Federal and state officials, including the current Administration, are continuing to focus on the cost of health coverage and health care although the future policy, including the nature and timing of any changes to the Affordable Care Act, remains unclear.
In the EU, regulatory exclusivity is available in two forms: data exclusivity and marketing exclusivity. Generic drug applications will not be accepted for review until eight years after the first marketing authorization (data exclusivity). This eight-year period is followed by a two-year period during which generics cannot be marketed (marketing exclusivity). The marketing exclusivity period can be extended to three years if, during the first eight-year period, the marketing authorization holder obtains an authorization for one or more new therapeutic indications which are deemed to provide a significant clinical benefit over existing therapies. This is known as the “8+2+1” rule.
In Japan, the regulatory exclusivity period varies from four years for medicinal products with new indications, formulations, dosages, or compositions with related prescriptions, to six years for new drugs containing a medicinal composition or requiring a new route of administration; eight years for drugs containing a new chemical entity; and ten years for orphan drugs or new drugs requiring pharmaco-epidemiological study.
Emerging markets
One of the main limitations on our operations in emerging market countries is the lack of effective intellectual property protection or enforcement for our products. The World Trade Organization (WTO) Agreement on Trade-Related Aspects of Intellectual Property Rights (TRIP) required developing countries to amend their intellectual property laws to provide patent protection for pharmaceutical products since January 1, 2005. However, it also provided a limited number of developing countries with an extended period in which to achieve compliance with TRIP. Additionally, these same countries frequently do not provide non-patent exclusivity for innovative products. While the situation has gradually improved, the lack of protection for intellectual property rights or the lack of robust enforcement of intellectual property rights poses difficulties in certain countries. Additionally, in recent years a number of countries facing health crises have waived or threatened to waive intellectual property protection for specific products, for example through compulsory licensing of generics. See “Item 3. Key Information – D. Risk Factors – Risks Relating to Sanofi’s Structure and Strategy – The globalization of our business exposes us to increased risks in specific areas”.
Pediatric extension
In the US and the EU, under certain conditions, it is possible to extend a product’s regulatory exclusivity for an additional period of time by providing data on pediatric studies.
In the US, the FDA may ask a company for pediatric studies if it has determined that information related to the use of the drugs in the pediatric population may produce health benefits. The FDA has invited us by written request to provide additional pediatric data on several of our main products. Under the Hatch-Waxman Act, timely provision of data meeting the FDA’s requirements (regardless of whether the data supports a pediatric indication) may result in the FDA extending regulatory exclusivity and patent life by six months, to the extent these protections have not already expired (the so-called “pediatric exclusivity”).
In Europe, a regulation on pediatric medicines provides for pediatric research obligations with potential associated rewards including extension of patent protection (for patented medicinal products) and six month regulatory exclusivity for pediatric marketing authorization (for off-patent medicinal products).
In Japan, there is no pediatric research extension of patent protection (for patented medicinal products). However, regulatory exclusivity may be extended from eight to ten years.
SANOFI / FORM 20-F 2018 59
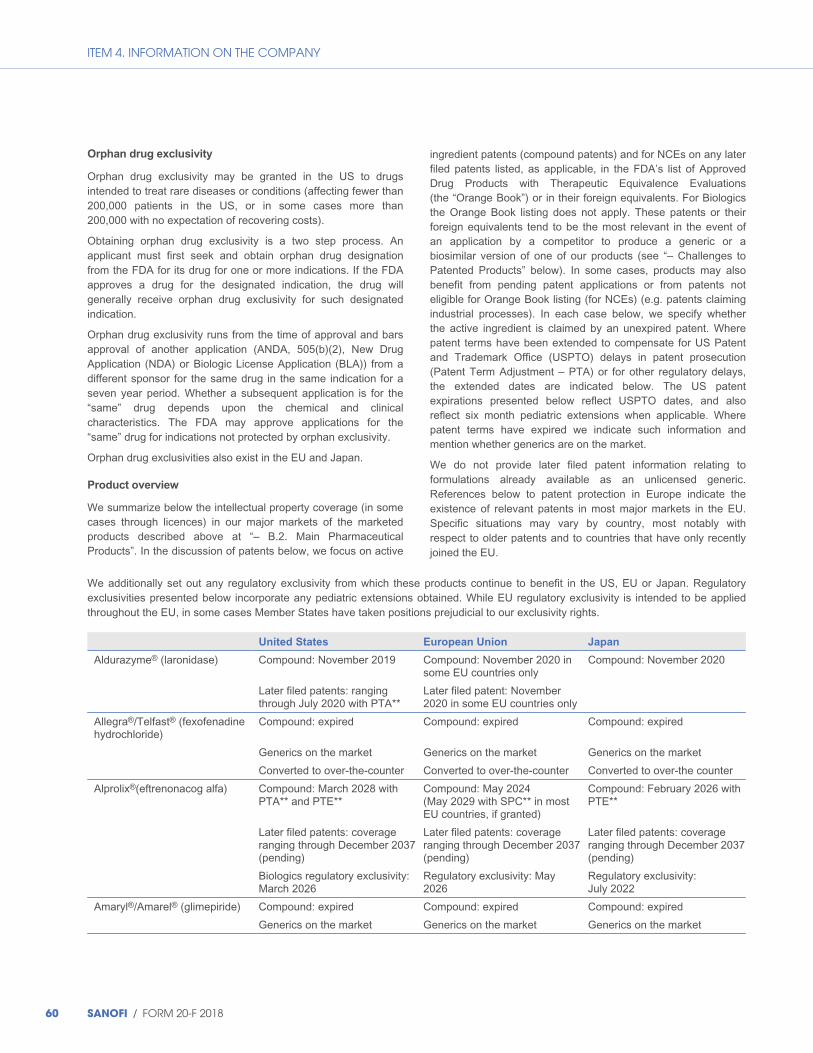
ITEM 4. INFORMATION ON THE COMPANY
Orphan drug exclusivity
Orphan drug exclusivity may be granted in the US to drugs intended to treat rare diseases or conditions (affecting fewer than 200,000 patients in the US, or in some cases more than 200,000 with no expectation of recovering costs).
Obtaining orphan drug exclusivity is a two step process. An applicant must first seek and obtain orphan drug designation from the FDA for its drug for one or more indications. If the FDA approves a drug for the designated indication, the drug will generally receive orphan drug exclusivity for such designated indication.
Orphan drug exclusivity runs from the time of approval and bars approval of another application (ANDA, 505(b)(2), New Drug Application (NDA) or Biologic License Application (BLA)) from a different sponsor for the same drug in the same indication for a seven year period. Whether a subsequent application is for the “same” drug depends upon the chemical and clinical characteristics. The FDA may approve applications for the “same” drug for indications not protected by orphan exclusivity.
Orphan drug exclusivities also exist in the EU and Japan.
Product overview
We summarize below the intellectual property coverage (in some cases through licences) in our major markets of the marketed products described above at “– B.2. Main Pharmaceutical Products”. In the discussion of patents below, we focus on active
ingredient patents (compound patents) and for NCEs on any later filed patents listed, as applicable, in the FDA’s list of Approved Drug Products with Therapeutic Equivalence Evaluations (the “Orange Book”) or in their foreign equivalents. For Biologics the Orange Book listing does not apply. These patents or their foreign equivalents tend to be the most relevant in the event of an application by a competitor to produce a generic or a biosimilar version of one of our products (see “– Challenges to Patented Products” below). In some cases, products may also benefit from pending patent applications or from patents not eligible for Orange Book listing (for NCEs) (e.g. patents claiming industrial processes). In each case below, we specify whether the active ingredient is claimed by an unexpired patent. Where patent terms have been extended to compensate for US Patent and Trademark Office (USPTO) delays in patent prosecution (Patent Term Adjustment – PTA) or for other regulatory delays, the extended dates are indicated below. The US patent expirations presented below reflect USPTO dates, and also reflect six month pediatric extensions when applicable. Where patent terms have expired we indicate such information and mention whether generics are on the market.
We do not provide later filed patent information relating to formulations already available as an unlicensed generic. References below to patent protection in Europe indicate the existence of relevant patents in most major markets in the EU. Specific situations may vary by country, most notably with respect to older patents and to countries that have only recently joined the EU.
We additionally set out any regulatory exclusivity from which these products continue to benefit in the US, EU or Japan. Regulatory exclusivities presented below incorporate any pediatric extensions obtained. While EU regulatory exclusivity is intended to be applied throughout the EU, in some cases Member States have taken positions prejudicial to our exclusivity rights.
United States European Union Japan
Aldurazyme® (laronidase) Compound: November 2019 Compound: November 2020 in some EU countries only
Compound: November 2020
Later filed patents: ranging through July 2020 with PTA**
Later filed patent: November 2020 in some EU countries only
Allegra®/Telfast® (fexofenadine hydrochloride)
Compound: expired Compound: expired Compound: expired
Generics on the market Generics on the market Generics on the market
Converted to over-the-counter Converted to over-the-counter Converted to over-the counter
Alprolix®(eftrenonacog alfa) Compound: March 2028 with PTA** and PTE**
Compound: May 2024 (May 2029 with SPC** in most EU countries, if granted)
Compound: February 2026 with PTE**
Later filed patents: coverage ranging through December 2037 (pending)
Later filed patents: coverage ranging through December 2037 (pending)
Later filed patents: coverage ranging through December 2037 (pending)
Biologics regulatory exclusivity: March 2026
Regulatory exclusivity: May 2026
Regulatory exclusivity: July 2022
Amaryl®/Amarel® (glimepiride) Compound: expired
Generics on the market
Compound: expired
Generics on the market
Compound: expired
Generics on the market
60 SANOFI / FORM 20-F 2018

ITEM 4. INFORMATION ON THE COMPANY
United States European Union Japan
Apidra® (insulin glulisine) Compound: expired Compound: September 2019 with SPC** in most of the EU countries
Compound: May 2022 with PTE**
Later filed patents: ranging through September 2027
Later filed patent: March 2022 Later filed patent: July 2022
Aprovel®/Avapro® (irbesartan) Compound: expired Compound: expired Compound: expired
Later filed patent: June 2021with PTE**
Generics on the market Generics on the market Generics on the market
Aubagio® (teriflunomide)* Compound: expired Compound: expired Compound: expired
Later filed patents: coverage
ranging through February
2034
Later filed patent: coverage
ranging through
September 2030
Later filed patent: coverage
ranging through March 2024
Regulatory exclusivity:
August 2023
Cablivi® (caplacizumabt) Compound: August, 2027 (January 2032 with PTE** if granted)
Compound: May 2026 (May 2031 with SPC** if granted)
Compound: May 2026 (with PTE** if granted)
Later filed patents: coverage ranging through June 2035 (pending)
Later filed patents: coverage ranging through June 2035
Later filed patents: coverage ranging through June 2035
Biologics regulatory exclusivity: August 2031 (with PED)
Regulatory exclusivity: August 31, 2030 (with orphan PED)
Regulatory exclusivity: to be determined
Cerdelga® (eliglustat) Compound: 2026 with PTE** Compound: July 2022 (July 2027 with SPC** if granted)
Compound: March 2025 with PTE**
Later filed patent: November 2030 (pending)
Later filed patent: November 2030
Later filed patent: November 2030 (pending)
Regulatory exclusivity: August 2019
Orphan drug exclusivity: January 2025
Regulatory exclusivity: March 2023
Orphan drug exclusivity: August 2021
Cerezyme® (imiglucerase)* Compound: expired Compound: N/A Compound: N/A
Depakine® (sodium valproate) Compound: N/A(1) Compound: N/A Compound: N/A
Later filed patent: Expired Later filed patent: Expired
Dupixent® (dupilumab)* Compound: October 2027
(Mar 2031 with PTE** if
granted)
Compound: October 2029
(September 2032 with SPC** if
granted)
Compound: October 2029
(June 2034 with PTE** if
granted)
Later filed patents: coverage
ranging through January 2036
with PTA**
Later filed patents: coverage
ranging through
November 2035 (pending)
Later filed patents: coverage
ranging through
November 2035 (pending)
Regulatory exclusivity:
March 2029
Regulatory exclusivity:
September 2027
Regulatory exclusivity:
January 2026
(1) No rights to compounds in the US, EU and Japan.
SANOFI / FORM 20-F 2018 61
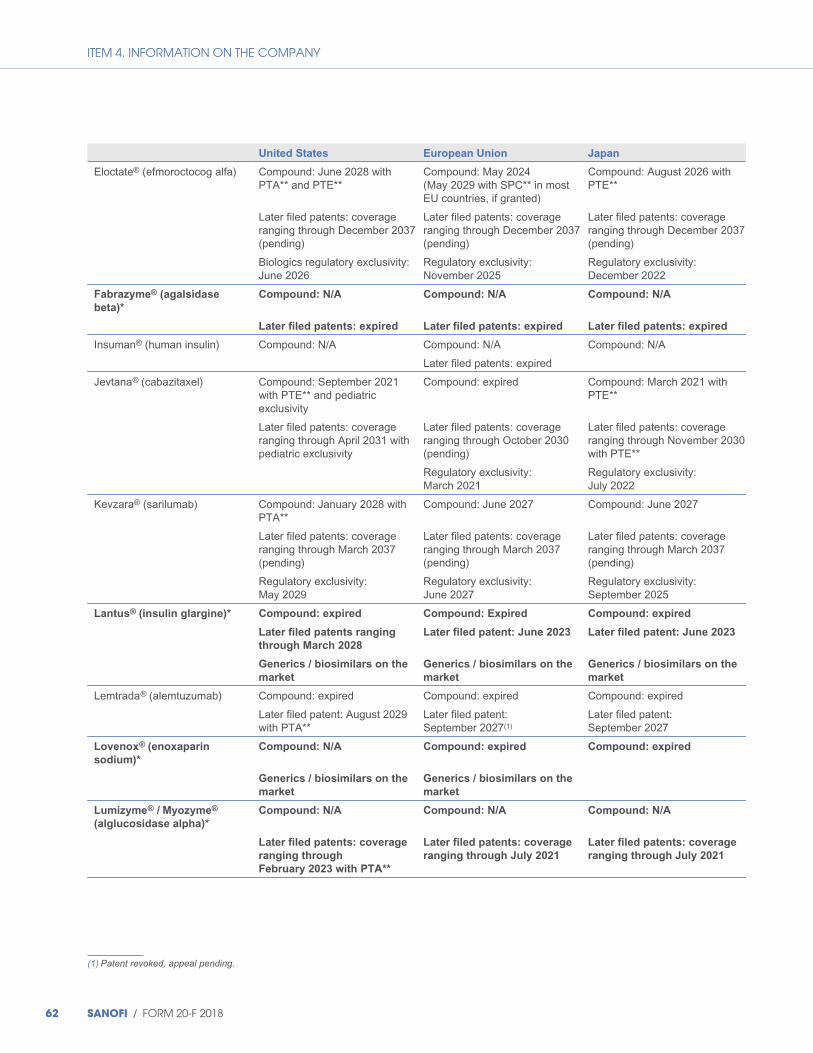
ITEM 4. INFORMATION ON THE COMPANY
United States European Union Japan
Eloctate® (efmoroctocog alfa) Compound: June 2028 with PTA** and PTE**
Compound: May 2024 (May 2029 with SPC** in most EU countries, if granted)
Compound: August 2026 with PTE**
Later filed patents: coverage ranging through December 2037 (pending)
Later filed patents: coverage ranging through December 2037 (pending)
Later filed patents: coverage ranging through December 2037 (pending)
Biologics regulatory exclusivity: June 2026
Regulatory exclusivity: November 2025
Regulatory exclusivity: December 2022
Fabrazyme® (agalsidase
beta)*
Compound: N/A Compound: N/A Compound: N/A
Later filed patents: expired Later filed patents: expired Later filed patents: expired
Insuman® (human insulin) Compound: N/A Compound: N/A Compound: N/A
Later filed patents: expired
Jevtana® (cabazitaxel) Compound: September 2021 with PTE** and pediatric exclusivity
Compound: expired Compound: March 2021 with PTE**
Later filed patents: coverage ranging through April 2031 with pediatric exclusivity
Later filed patents: coverage ranging through October 2030 (pending)
Later filed patents: coverage ranging through November 2030 with PTE**
Regulatory exclusivity: March 2021
Regulatory exclusivity: July 2022
Kevzara® (sarilumab) Compound: January 2028 with PTA**
Compound: June 2027 Compound: June 2027
Later filed patents: coverage ranging through March 2037 (pending)
Later filed patents: coverage ranging through March 2037 (pending)
Later filed patents: coverage ranging through March 2037 (pending)
Regulatory exclusivity: May 2029
Regulatory exclusivity: June 2027
Regulatory exclusivity: September 2025
Lantus® (insulin glargine)* Compound: expired Compound: Expired Compound: expired
Later filed patents ranging
through March 2028
Later filed patent: June 2023 Later filed patent: June 2023
Generics / biosimilars on the
market
Generics / biosimilars on the
market
Generics / biosimilars on the
market
Lemtrada® (alemtuzumab) Compound: expired Compound: expired Compound: expired
Later filed patent: August 2029 with PTA**
Later filed patent: September 2027(1)
Later filed patent: September 2027
Lovenox® (enoxaparin
sodium)*
Compound: N/A Compound: expired Compound: expired
Generics / biosimilars on the
market
Generics / biosimilars on the
market
Lumizyme® / Myozyme®
(alglucosidase alpha)*
Compound: N/A Compound: N/A Compound: N/A
Later filed patents: coverage
ranging through
February 2023 with PTA**
Later filed patents: coverage
ranging through July 2021
Later filed patents: coverage
ranging through July 2021
(1) Patent revoked, appeal pending.
62 SANOFI / FORM 20-F 2018
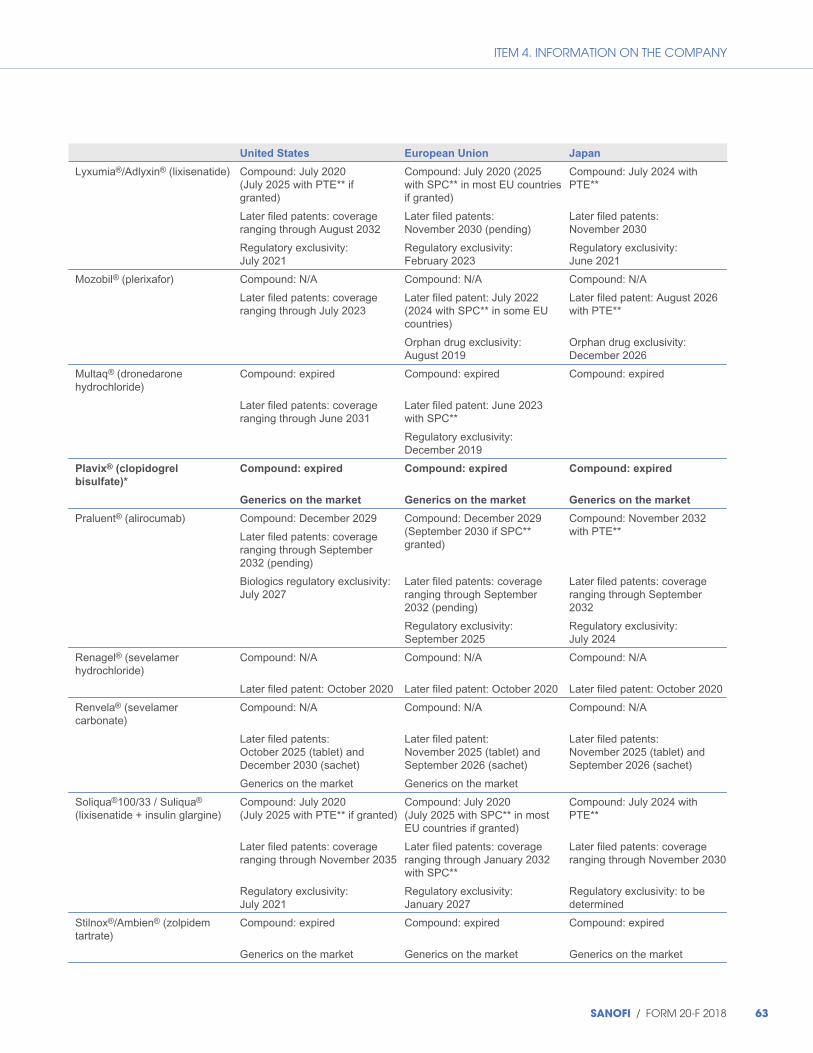
ITEM 4. INFORMATION ON THE COMPANY
United States European Union Japan
Lyxumia®/Adlyxin® (lixisenatide) Compound: July 2020 (July 2025 with PTE** if granted)
Compound: July 2020 (2025 with SPC** in most EU countries if granted)
Compound: July 2024 with PTE**
Later filed patents: coverage ranging through August 2032
Later filed patents: November 2030 (pending)
Later filed patents: November 2030
Regulatory exclusivity: July 2021
Regulatory exclusivity: February 2023
Regulatory exclusivity: June 2021
Mozobil® (plerixafor) Compound: N/A Compound: N/A Compound: N/A
Later filed patents: coverage ranging through July 2023
Later filed patent: July 2022 (2024 with SPC** in some EU countries)
Later filed patent: August 2026 with PTE**
Orphan drug exclusivity: August 2019
Orphan drug exclusivity: December 2026
Multaq® (dronedarone hydrochloride)
Compound: expired Compound: expired Compound: expired
Later filed patents: coverage ranging through June 2031
Later filed patent: June 2023 with SPC**
Regulatory exclusivity: December 2019
Plavix® (clopidogrel
bisulfate)*
Compound: expired Compound: expired Compound: expired
Generics on the market Generics on the market Generics on the market
Praluent® (alirocumab) Compound: December 2029
Later filed patents: coverage ranging through September 2032 (pending)
Compound: December 2029 (September 2030 if SPC** granted)
Compound: November 2032 with PTE**
Biologics regulatory exclusivity: July 2027
Later filed patents: coverage ranging through September 2032 (pending)
Later filed patents: coverage ranging through September 2032
Regulatory exclusivity: September 2025
Regulatory exclusivity: July 2024
Renagel® (sevelamer hydrochloride)
Compound: N/A Compound: N/A Compound: N/A
Later filed patent: October 2020 Later filed patent: October 2020 Later filed patent: October 2020
Renvela® (sevelamer carbonate)
Compound: N/A Compound: N/A Compound: N/A
Later filed patents: October 2025 (tablet) and December 2030 (sachet)
Later filed patent: November 2025 (tablet) and September 2026 (sachet)
Later filed patents: November 2025 (tablet) and September 2026 (sachet)
Generics on the market Generics on the market
Soliqua®100/33 / Suliqua® (lixisenatide + insulin glargine)
Compound: July 2020 (July 2025 with PTE** if granted)
Compound: July 2020 (July 2025 with SPC** in most EU countries if granted)
Compound: July 2024 with PTE**
Later filed patents: coverage ranging through November 2035
Later filed patents: coverage ranging through January 2032 with SPC**
Later filed patents: coverage ranging through November 2030
Regulatory exclusivity: July 2021
Regulatory exclusivity: January 2027
Regulatory exclusivity: to be determined
Stilnox®/Ambien® (zolpidem tartrate)
Compound: expired Compound: expired Compound: expired
Generics on the market Generics on the market Generics on the market
SANOFI / FORM 20-F 2018 63
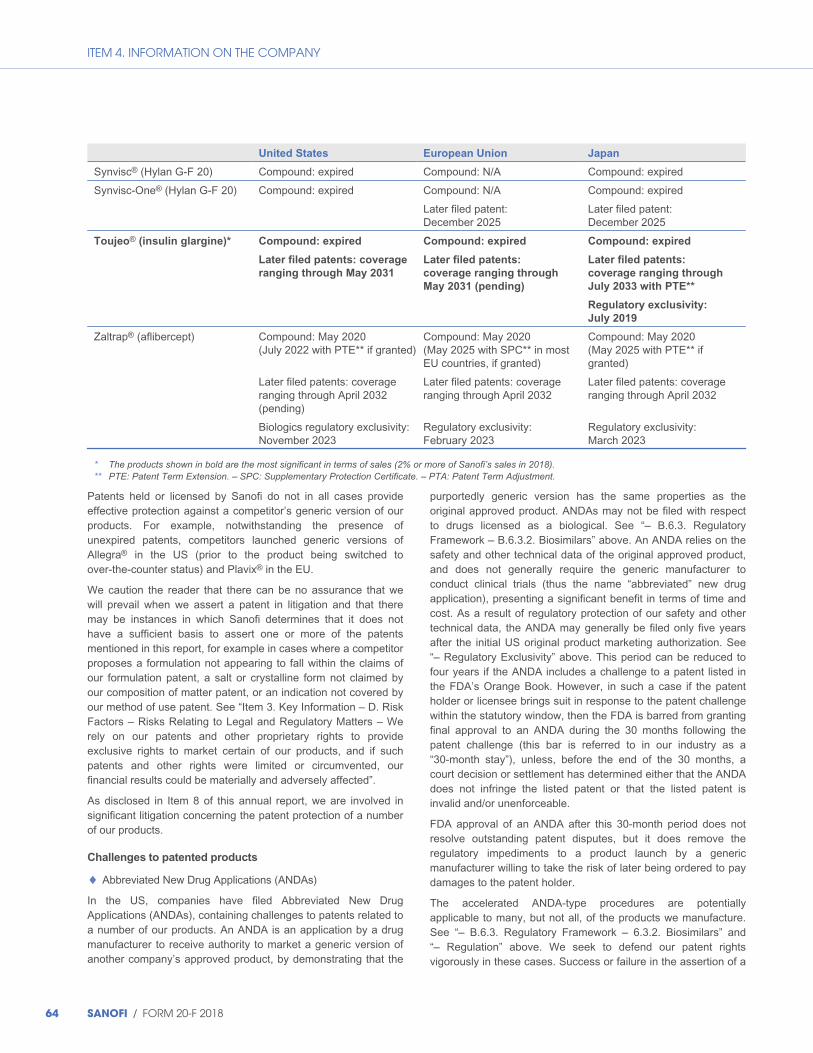
ITEM 4. INFORMATION ON THE COMPANY
United States European Union Japan
Synvisc® (Hylan G-F 20) Compound: expired Compound: N/A Compound: expired
Synvisc-One® (Hylan G-F 20) Compound: expired Compound: N/A Compound: expired
Later filed patent: December 2025
Later filed patent: December 2025
Toujeo® (insulin glargine)* Compound: expired Compound: expired Compound: expired
Later filed patents: coverage
ranging through May 2031
Later filed patents:
coverage ranging through
May 2031 (pending)
Later filed patents:
coverage ranging through
July 2033 with PTE**
Regulatory exclusivity:
July 2019
Zaltrap® (aflibercept) Compound: May 2020 (July 2022 with PTE** if granted)
Compound: May 2020 (May 2025 with SPC** in most EU countries, if granted)
Compound: May 2020 (May 2025 with PTE** if granted)
Later filed patents: coverage ranging through April 2032 (pending)
Later filed patents: coverage ranging through April 2032
Later filed patents: coverage ranging through April 2032
Biologics regulatory exclusivity: November 2023
Regulatory exclusivity: February 2023
Regulatory exclusivity: March 2023
* The products shown in bold are the most significant in terms of sales (2% or more of Sanofi’s sales in 2018). ** PTE: Patent Term Extension. – SPC: Supplementary Protection Certificate. – PTA: Patent Term Adjustment.
Patents held or licensed by Sanofi do not in all cases provide effective protection against a competitor’s generic version of our products. For example, notwithstanding the presence of unexpired patents, competitors launched generic versions of Allegra® in the US (prior to the product being switched to over-the-counter status) and Plavix® in the EU.
We caution the reader that there can be no assurance that we will prevail when we assert a patent in litigation and that there may be instances in which Sanofi determines that it does not have a sufficient basis to assert one or more of the patents mentioned in this report, for example in cases where a competitor proposes a formulation not appearing to fall within the claims of our formulation patent, a salt or crystalline form not claimed by our composition of matter patent, or an indication not covered by our method of use patent. See “Item 3. Key Information – D. Risk Factors – Risks Relating to Legal and Regulatory Matters – We rely on our patents and other proprietary rights to provide exclusive rights to market certain of our products, and if such patents and other rights were limited or circumvented, our financial results could be materially and adversely affected”.
As disclosed in Item 8 of this annual report, we are involved in significant litigation concerning the patent protection of a number of our products.
Challenges to patented products
◆ Abbreviated New Drug Applications (ANDAs)
In the US, companies have filed Abbreviated New Drug Applications (ANDAs), containing challenges to patents related to a number of our products. An ANDA is an application by a drug manufacturer to receive authority to market a generic version of another company’s approved product, by demonstrating that the
purportedly generic version has the same properties as the original approved product. ANDAs may not be filed with respect to drugs licensed as a biological. See “– B.6.3. Regulatory Framework – B.6.3.2. Biosimilars” above. An ANDA relies on the safety and other technical data of the original approved product, and does not generally require the generic manufacturer to conduct clinical trials (thus the name “abbreviated” new drug application), presenting a significant benefit in terms of time and cost. As a result of regulatory protection of our safety and other technical data, the ANDA may generally be filed only five years after the initial US original product marketing authorization. See “– Regulatory Exclusivity” above. This period can be reduced to four years if the ANDA includes a challenge to a patent listed in the FDA’s Orange Book. However, in such a case if the patent holder or licensee brings suit in response to the patent challenge within the statutory window, then the FDA is barred from granting final approval to an ANDA during the 30 months following the patent challenge (this bar is referred to in our industry as a “30-month stay”), unless, before the end of the 30 months, a court decision or settlement has determined either that the ANDA does not infringe the listed patent or that the listed patent is invalid and/or unenforceable.
FDA approval of an ANDA after this 30-month period does not resolve outstanding patent disputes, but it does remove the regulatory impediments to a product launch by a generic manufacturer willing to take the risk of later being ordered to pay damages to the patent holder.
The accelerated ANDA-type procedures are potentially applicable to many, but not all, of the products we manufacture. See “– B.6.3. Regulatory Framework – 6.3.2. Biosimilars” and “– Regulation” above. We seek to defend our patent rights vigorously in these cases. Success or failure in the assertion of a
64 SANOFI / FORM 20-F 2018
ITEM 4. INFORMATION ON THE COMPANY
given patent against a competing product is not necessarily predictive of the future success or failure in the assertion of the same patent – or a fortiori the corresponding foreign patent – against another competing product due to factors such as possible differences in the formulations of the competing products, intervening developments in law or jurisprudence, local variations in the patents and differences in national patent law and legal systems. See “Item 3. Key Information – D. Risk Factors – Risks Relating to Legal and Regulatory Matters – We rely on our patents and other proprietary rights to provide exclusive rights to market certain of our products, and if such patents and other rights were limited or circumvented, our financial results could be materially and adversely affected”.
Section 505(b)(2) New Drug Applications in the US
Our products and patents are also subject to challenge by competitors via another abbreviated approval pathway, under section 505(b)(2) of the Federal Food, Drug, and Cosmetic Act. This provision expressly permits an applicant to rely, at least in part, on the FDA’s prior findings of safety and effectiveness of a drug that has obtained FDA approval. The FDA may still require applicants to provide additional preclinical or clinical data to ensure that differences from the reference drug do not compromise safety and effectiveness. This pathway allows for approval for a wide range of products, especially for those products that represent only a limited change from an existing approved drug. The 505(b)(2) pathway is distinct from the ANDA pathway, which allows for approval of a generic product based on a showing that it is equivalent to a previously approved product.
A 505(b)(2) applicant is required to identify the reference drug on which it relies, as well as to certify to the FDA concerning any patents listed for the referenced product in the Orange Book. Specifically, the applicant must certify in the application that, for each patent that claims the drug or a use of the drug for which the applicant is seeking approval:
◆ there is no patent information listed for the reference drug (paragraph I certification);
◆ the listed patent has expired for the reference drug (paragraph II certification);
◆ the listed patent for the reference drug has not expired, but will expire on a particular date and approval is sought after patent expiration (paragraph III certification); or
◆ the listed patent for the reference drug is invalid, unenforceable, or will not be infringed by the manufacture, use or sale of the product for which the 505(b)(2) NDA is submitted (paragraph IV certification).
A paragraph III certification may delay the approval of an application until the expiration of the patent. A paragraph IV certification generally requires notification of the patent owner and the holder of the NDA for the referenced product. If the patent owner or NDA holder brings patent litigation against the applicant within the statutory window, a 30-month stay is entered on the FDA’s ability to grant final approval to the 505(b)(2) applicant
unless, before the end of the stay, a court decision or settlement determines the listed patent is invalid, not enforceable, and/or not infringed. A 505(b)(2) application may also be subject to non-patent exclusivity, and the FDA may be prohibited from giving final approval to a 505(b)(2) application until the expiration of all applicable non-patent exclusivity periods.
In the EU, a generic drug manufacturer may only reference the data of the regulatory file for the original approved product after data exclusivity has expired. However, there is no patent listing system in Europe comparable to the Orange Book, which would allow the patent holder to prevent the competent authorities from granting marketing authorization by bringing patent infringement litigation prior to approval. As a result, generic products may be approved for marketing following the expiration of marketing exclusivity without regard to the patent holder’s rights. Nevertheless, in most of these jurisdictions once the competing product is launched, and in some jurisdictions even prior to launch (once launch is imminent), the patent holder may seek an injunction against such marketing if it believes its patents are infringed. See Item 8 of this annual report.
B.7.2. Trademarks
Our products are sold around the world under trademarks that we consider to be of material importance in the aggregate. Our trademarks help to identify our products and to protect the sustainability of our growth. Trademarks are particularly important to the commercial success of CHC and generics.
It is our policy to protect and register our trademarks with a strategy adapted to each product or service depending on the countries where they are commercialized: on a worldwide basis for worldwide products or services, or on a regional or local basis for regional or local products or services.
The process and degree of trademark protection vary country by country, as each country applies its own trademark laws and regulations. In most countries, trademark rights may only be obtained through formal trademark application and registration. In some countries, trademark protection can be based primarily on use. Registrations are granted for a fixed term (in most cases ten years) and are renewable indefinitely, except in some countries where maintenance of the trademarks is subject to their effective use.
When trademark protection is based on use, it covers the products and services for which the trademark is used. When trademark protection is based on registration, it covers only the products and services designated in the registration certificate. Additionally, in certain cases, we may enter into a coexistence agreement with a third party that owns potentially conflicting rights in order to avoid any risk of confusion and better protect and defend our trademarks.
Our trademarks are monitored and defended based on this policy and in order to prevent counterfeit, infringement and/or unfair competition.
SANOFI / FORM 20-F 2018 65

ITEM 4. INFORMATION ON THE COMPANY
B.8. Production and raw materials
We have opted to manufacture the majority of our products in-house. There are three principal stages in our production process: the manufacture of active ingredients, the transformation of those ingredients into drug products or vaccines, and packaging those products.
Our general policy is to produce the majority of our active ingredients and principal drug products at our own plants in order to reduce our dependence on external suppliers. We also rely on third parties for the manufacture and supply of certain active ingredients, drug products and medical devices. Active ingredients are manufactured using raw materials sourced from suppliers who have been subject to rigorous selection and approval procedures, in accordance with international standards and our own internal directives. We have outsourced some of our production under supply contracts associated with acquisitions of products or businesses or with plant divestitures, or to establish a local presence to capitalize on growth in emerging markets. Our pharmaceutical subcontractors follow our general quality and logistics policies, as well as meeting other criteria. See ‘‘Item 3. Key Information – D. Risk Factors – Risks Relating to Our Business’’.
At the start of 2017 we launched our “Global External Manufacturing” team, to enhance the way we manage relations with our third-party suppliers of finished products.
We also obtain active ingredients from third parties under collaboration agreements. This applies in particular to the monoclonal antibodies developed with Regeneron.
Our pharmaceutical production sites are divided into three categories:
◆ global sites, which serve all markets: located mainly in Europe, these facilities are dedicated to the manufacture of our active ingredients, injectable products, and a number of our main solid-form products;
◆ regional sites, which serve markets at regional level, in Europe and particularly the BRIC-M countries (Brazil, Russia, India, China and Mexico), giving us a strong industrial presence in emerging markets; and
◆ local sites, which serve their domestic market only.
Sanofi Pasteur produces vaccines at sites located in the United States, Canada, France, Mexico, China and India. The pharmaceutical site at Le Trait (France) also contributes to Sanofi Pasteur’s industrial operations by making available its sterile filling facilities.
All of our production facilities are good manufacturing practice (GMP) compliant, in line with international regulations.
Our principal sites approved by the FDA are:
◆ the Biologics facilities in the United States (Allston, Framingham and Northborough), France (Lyon Gerland, Vitry-sur-Seine), Germany (Frankfurt) and Belgium (Geel);
◆ the Injectables facilities in France (Le Trait), Italy (Anagni), Ireland (Waterford), Germany (Frankfurt) and the United States (Ridgefield);
◆ the Pharmaceuticals facilities in France (Ambarès and Tours) and the United Kingdom (Haverhill);
◆ the Consumer Healthcare facilities in France (Compiègne) and the United States (Chattanooga); and
◆ the Vaccines facilities in France (Marcy l’Étoile and Le Trait, which handle filling and packaging of Fluzone® ID for the US market), the United States (Swiftwater) and Canada (Toronto).
Wherever possible, we seek to have multiple plants approved for the production of key active ingredients and our strategic finished products (this is the case with Lovenox®, for example).
In May 2010, Genzyme’s Allston facility in the United States entered into a consent decree with the US government following FDA inspections at the facility that resulted in observations and a warning letter raising Current Good Manufacturing Practices (CGMP) deficiencies.
The workplan was completed on March 31, 2016. The next step was a third-party certification process. In August 2017, the FDA conducted an inspection of the facility and delivered a favorable conclusion, following which certification was received on October 4, 2017.
The Allston facility is required to engage a third-party expert to audit its manufacturing operations for an additional period of at least five years.
More details about our manufacturing sites are given below at section ‘‘D. Property, Plant and Equipment’’.
B.9. Insurance and risk coverage
We are protected by four key insurance programs, relying not only on the traditional corporate insurance and reinsurance market but also on our direct insurance company, Carraig Insurance DAC (Carraig).
These four key programs cover Property & Business Interruption, General & Product Liability, Stock and Transit, and Directors & Officers Liability.
Carraig participates in our coverage for various lines of insurance including Property & Business Interruption, Stock and Transit, and General & Product Liability. Carraig is run under the supervision of the Irish regulatory authorities, is wholly owned by Sanofi, and has sufficient resources to meet those portions of our risks that it has agreed to cover.
It sets premiums for our entities at market rates. Claims are assessed using the traditional models applied by insurance and reinsurance companies, and the company’s reserves are regularly verified and confirmed by independent actuaries.
Our Property & Business Interruption program covers all our entities worldwide, wherever it is possible to use a centralized
66 SANOFI / FORM 20-F 2018
ITEM 4. INFORMATION ON THE COMPANY
program operated by Carraig. Through risk mutualization between our entities, this approach enabling us to set tailored deductibles and covers to match local entities’ needs before market intervention. It also incorporates a prevention program, including a comprehensive site visit schedule covering our production, storage, research and distribution facilities and standardized repair and maintenance procedures across all sites.
The Stock and Transit program protects all goods owned by Sanofi while they are in transit nationally or internationally whatever the means of transport, and all our inventories wherever they are located. Sharing risk between our entities through Carraig means that we can set deductibles at appropriate levels, for instance differentiating between goods that require temperature controlled distribution and those that do not. We have developed a prevention program with assistance from experts, implementing best practices in this area at our distribution sites.
Our General & Product Liability program was renewed in 2018 for all our subsidiaries worldwide wherever it was possible to do so, despite reluctance in the insurance and reinsurance market to cover product liability risks for large pharmaceutical groups. For several years, insurers have been reducing product liability cover because of the difficulty of transferring risk for some products that have been subject to numerous claims. This applies to a few of our products and has led us to increase, year by year, the extent to which we self-insure.
The principal risk exposure for our pharmaceutical products is covered with low deductibles at country level, the greatest level of risk being retained. The level of risk self-insured by Sanofi (including via Carraig) before the market attachment point, enables us to retain control over the management and prevention of risk. Our negotiations with third-party insurers and reinsurers are tailored to our specific risks. In particular, they allow for differential treatment of products in the development phase, for the discrepancies in risk exposure between European countries and the United States, and for specific issues arising in certain jurisdictions such as generics coverage in the United States. Coverage is adjusted every year in order to take into account the relative weight of new product liability risks, such as those relating to rare diseases or to healthcare products which do not require marketing approval.
Our cover for risks that are not specific to the pharmaceutical industry (general liability) is designed to address the potential impacts of our operations.
For all the insurance programs handled by Carraig, outstanding claims are covered by provisions for the estimated cost of settling all claims incurred but not paid at the balance sheet date, whether reported or not, together with all related claims handling expenses. Where there is sufficient data history from Sanofi or from the market for claims made and settled, management – with assistance from independent actuaries – prepares an actuarial estimate of our exposure to unreported claims for the risks covered. The actuaries perform an actuarial valuation of the
company’s IBNR (Incurred But Not Reported) and ALAE (Allocated Loss Adjustment Expense) liabilities at year end. Two ultimate loss projections (based upon reported losses and paid losses, respectively) are computed each year using various actuarial methods including the Bornhuetter-Ferguson method; those projections form the basis for the provisions set.
The Directors & Officers Liability program protects all legal entities under our control, and their directors and officers. Carraig is not involved in this program.
We also operate other insurance programs, but these are of much lesser importance than those described above.
All our insurance programs are backed by best in class insurers and reinsurers and are designed in such a way that we can integrate most newly acquired businesses without interruption of cover. Our cover has been designed to reflect our risk profile and the capacity available in the insurance market. By centralizing our major programs, we are able to provide world-class protection while reducing costs.
B.10. Health, Safety and Environment
Our manufacturing and research operations are subject to increasingly stringent health, safety and environmental (HSE) laws and regulations. These laws and regulations are complex and rapidly changing, and Sanofi invests the necessary sums in order to comply with them. This investment, which aims to respect health, safety and the environment, varies from year to year.
Applicable environmental laws and regulations may require us to eliminate or reduce the effects of chemical substance discharge at our various sites. The sites in question may belong to Sanofi, and may be currently operational, or may have been owned or operational in the past. In this regard, Sanofi may be held liable for the costs of removal or remediation of hazardous substances on, under or in the sites concerned, or on sites where waste from activities has been stored, without regard to whether the owner or operator knew of or under certain circumstances caused the presence of the contaminants, or at the time site operations occurred the discharge of those substances was authorized.
As is the case for a number of companies in the pharmaceutical, chemical and intense agrochemical industries, soil and groundwater contamination has occurred at some of our sites in the past, and may still occur or be discovered at others. In Sanofi’s case, such sites are mainly located in the United States, Germany, France, Hungary, Italy and the United Kingdom. As part of a program of environmental surveys conducted over the last few years, detailed assessments of the risk of soil and groundwater contamination have been carried out at current and former Sanofi sites. In cooperation with national and local authorities, Sanofi regularly assesses the rehabilitation work required and carries out such work when appropriate. Long-term rehabilitation work is in progress or planned in Mount Pleasant, East Palo Alto and Portland in the United States; Barceloneta in
SANOFI / FORM 20-F 2018 67
ITEM 4. INFORMATION ON THE COMPANY
Puerto Rico; Frankfurt in Germany; Brindisi in Italy; Dagenham in the United Kingdom; Ujpest in Hungary; Beaucaire, Valernes, Limay, Romainville, Neuville and Vitry in France; and on a number of sites divested to third parties and covered by contractual environmental guarantees granted by Sanofi.
We may also have potential liability for investigation and cleanup at several other sites. We have established provisions for the sites already identified and to cover contractual guarantees for environmental liabilities for sites that have been divested. In France specifically, we have provided the financial guarantees for environmental protection required under French regulations.
Potential environmental contingencies arising from certain business divestitures are described in Note D.22.d to the consolidated financial statements. In 2018, Sanofi spent €62 million on rehabilitating sites previously contaminated by soil or groundwater pollution.
Due to changes in environmental regulations governing site remediation, our provisions for remediation obligations may not be adequate due to the multiple factors involved, such as the complexity of operational or previously operational sites, the nature of claims received, the rehabilitation techniques involved, the planned timetable for rehabilitation, and the outcome of discussions with national regulatory authorities or other potentially responsible parties, as in the case of multiparty sites. Given the long industrial history of some of our sites and the legacy obligations arising from the past involvement of Aventis in the chemical and agrochemical industries, it is impossible to quantify the future impact of these laws and regulations with precision. See “Item 3.D. Risk Factors – Environmental Risks of Our Industrial Activities”.
We have established, in accordance with our current knowledge and projections, provisions for cases already identified and to cover contractual guarantees for environmental liabilities relating to sites that have been divested. In accordance with Sanofi standards, a comprehensive review is carried out once a year on the legacy of environmental pollution. In light of data collected during this review, we adjusted our provisions to approximately €680 million as of December 31, 2018 versus €685 million as of December 31, 2017. The terms of certain business divestitures, and the environmental obligations and retained environmental liabilities relating thereto are described in Note D.22. to our consolidated financial statements.
To our knowledge, Sanofi did not incur any liability in 2018 for non-compliance with current HSE laws and regulations that could be expected to significantly jeopardize its activities, financial situation or operating income. We also believe that we are in substantial compliance with current HSE laws and regulations and that all the environmental permits required to operate our facilities have been obtained.
Regular HSE audits are carried out by Sanofi in order to assess compliance with standards (which implies compliance with regulations) and to initiate corrective measures (50 internal audits
performed by 87 auditors in 2018). Moreover, around 200 specific visits were performed jointly with experts representing our insurers.
Sanofi has implemented a worldwide master policy on health, safety and environment to promote the health and well-being of the employees and contractors working on its sites and respect for the environment. We consider this master policy to be an integral part of our commitment to social responsibility. In order to implement this master policy, Sanofi key requirements have been drawn up in the key fields of HSE management, HSE leadership, safety in the workplace, process safety, occupational hygiene, health in the workplace and protection of the environment.
Health
From the development of compounds to the commercial launch of new drugs, Sanofi research scientists continuously assess the effect of products on human health. This expertise is made available to employees through two committees responsible for chemical and biological risk assessment. Sanofi’s COVALIS Committee is responsible for the hazard determination and classification of all active pharmaceutical ingredients and synthesis intermediates handled at Sanofi facilities. This covers all active ingredients handled in production at company sites or in processes sub-contracted for manufacture. Any important issues involving raw materials or other substances that lack established occupational exposure limits may also be reviewed. The COVALIS Committee determines the occupational exposure limits required within Sanofi. Our TRIBIO Committee is responsible for classifying all biological agents according to their degree of pathogenicity, and applies rules for their containment and the preventive measures to be respected throughout Sanofi. See “Item 3. Key Information – D. Risk Factors – Environmental Risks of Our Industrial Activities – Risks from the handling of hazardous materials could adversely affect our results of operations”.
Appropriate occupational hygiene practices and programs are defined and implemented in each site. These practices consist essentially of containment measures for collective and individual protection against exposure in all workplaces where chemical substances or biological agents are handled. All personnel are monitored with an appropriate medical surveillance program, based on the results of professional risk evaluations linked to their duties.
In addition, dedicated resources have been created to implement the EU Regulation on Registration, Evaluation, Authorization and Restriction of Chemicals (REACH). To fully comply with the new European Regulation on Classification, Labeling and Packaging of chemicals, Sanofi has registered the relevant hazardous chemical substances with the European Chemicals Agency (ECHA).
68 SANOFI / FORM 20-F 2018

ITEM 4. INFORMATION ON THE COMPANY
Safety
Sanofi has rigorous policies to identify and evaluate safety risks and to develop preventive safety measures, and methods for checking their efficacy. Additionally, Sanofi invests in training that is designed to instill in all employees a sense of concern for safety, regardless of their duties. These policies are implemented on a worldwide scale to ensure the safety of all employees and to protect their health. Each project, whether in research, development or manufacturing, is subject to evaluation procedures, incorporating the chemical substance and process data communicated by the COVALIS and TRIBIO Committees described above. The preventive measures are designed primarily to reduce the number and seriousness of work accidents and to minimize exposures involving permanent and temporary Sanofi employees as well as our sub-contractors.
The French chemical manufacturing sites in Aramon, Sisteron and Vertolaye, as well as the plants located in the Hoechst Industry Park in Frankfurt, Germany, and the chemical production site in Budapest, Hungary, are listed Seveso III (from the name of the European directive that deals with potentially dangerous sites through a list of activities and substances associated with classification thresholds). In accordance with French law on technological risk prevention, the French sites are also subject to heightened security inspections due to the toxic or flammable materials stored on the sites and used in the operating processes.
Risk assessments of processes and installations are drawn up according to standards and internal guidelines incorporating the best state of the art benchmarks for the industry. These assessments are used to fulfill regulatory requirements and are regularly updated. Particular attention is paid to any risk-generating changes such as process or installation changes, as well as changes in production scale and transfers between industrial or research units.
We have specialized process safety-testing laboratories that are fully integrated into our chemical development activities, apply methods to obtain the physico-chemical parameters of manufactured chemical substances (intermediate chemical compounds and active ingredients) and apply models to measure the effect of potentially leachable substances in the event of a major accident. In these laboratories the parameters for qualifying hazardous reactions are also determined, in order to define scale-up process conditions while transferring from development stage to industrial scale. All these data ensure that our risk assessments are relevant.
We believe that the safety management systems implemented at each site, the hazard studies carried out and the risk management methods implemented, as well as our third-party property insurance policies covering any third-party physical damage, are consistent with legal requirements and the best practices in the industry.
Environment
We have committed to an ambitious policy aimed at limiting the direct and indirect impacts of our activities on the environment, throughout the life cycle of our products. We have identified five major environmental challenges relating to our businesses: greenhouse gas emissions and climate disruption; water; pharmaceuticals in the environment; waste; and biodiversity.
The initiatives already implemented since 2010 are continuing, and we have been keen to give them fresh impetus through the Planet Mobilization program. Reflecting our environment strategy out to 2025, the program sets more ambitious targets for reducing environmental impacts across the entire value chain. Planet Mobilization is a global project that involves all of the Company’s resources in defining objectives and engaging with external partners.
Compared with 2015 figures, we are undertaking to halve our carbon emissions by the end of 2025 and reach carbon-neutral status by 2050 on our scope 1 & 2 (industrial, R&D and tertiary sites, including the medical rep fleet). We have also set ourselves the target of achieving sustainable water resource management, especially at sites which are under hydric stress. On this new scope, by the end of 2018, we had reduced CO2 emissions by 9% and water consumption by 14%.
Overall waste recycling at sites is already above 72% and is expected to be more than 90% by the end of 2025. The discharge rate had dropped to 8% at the end of 2017 and we have committed to move towards a maximum of 1% by 2025. Biodiversity management at sites is also a priority, with the aim of making all employees aware of this challenge and implementing risk assessment and management plans at priority sites.
Finally, we are pursuing the policy we began in 2010 of managing pharmaceutical products in the environment throughout their life cycles. At the end of 2018, all priority chemical sites had been evaluated and were shown to present no risk to the environment. The assessment program was extended to other sites, starting with the pharmaceutical production sites. In 2018, eight sites implemented the program.
In line with this approach, we have committed to the “Roadmap AMR 2020” initiative, which aims to combat microbial resistance to antibiotics. The initiative brings together thirteen of the major players in the pharmaceutical industry, and will involve co-producing reference guides and methodologies for sustainable management of antibiotics in the pharmaceutical sector. The initiative includes a specific commitment with respect to antibiotic production sites that are operated by signatories or their suppliers, involving firstly the definition and deployment of a shared framework for managing potential waste, and secondly the establishment of environmental thresholds. (See “Cautionary statement regarding forward-looking statements”).
SANOFI / FORM 20-F 2018 69

ITEM 4. INFORMATION ON THE COMPANY
C/ Organizational Structure
C.1. Significant Subsidiaries
Sanofi is the holding company of a consolidated group consisting of over 300 companies. The table below sets forth our significant
subsidiaries as of December 31, 2018. For a fuller list of the principal companies in our consolidated group, see Note F. to our consolidated financial statements, included in this annual report at Item 18.
Financial
Date of Country of and voting
Significant subsidiary incorporation incorporation Principal activity interest
Aventis Inc. 07/01/1968 United States Pharmaceuticals 100%
Aventis Pharma SA 09/24/1974 France Pharmaceuticals 100%
Genzyme Corporation 11/21/1991 United States Pharmaceuticals 100%
Hoechst GmbH 07/08/1974 Germany Pharmaceuticals 100%
Sanofi-Aventis Deutschland GmbH 06/30/1997 Germany Pharmaceuticals 100%
Sanofi-Aventis US LLC 06/28/2000 United States Pharmaceuticals 100%
Sanofi-Aventis Participations SAS 02/25/2002 France Pharmaceuticals 100%
Sanofi Pasteur SA 02/08/1989 France Vaccines 100%
Sanofi Pasteur Inc. 01/18/1977 United States Vaccines 100%
Sanofi Winthrop Industrie 12/11/1972 France Pharmaceuticals 100%
Chattem, Inc. 11/11/1909 United States Pharmaceuticals 100%
Since 2009, we have transformed Sanofi through numerous acquisitions (see “A. History and Development of the Company” above), in particular those of Genzyme in April 2011, Merial in September 2009 and Bioverativ and Ablynx in January 2018. The financial effects of the Genzyme acquisition are presented in Note D.1.3. to our consolidated financial statements for the year ended December 31, 2013, included in our annual report on Form 20-F for that year. The financial effects of the Merial acquisition are presented in Note D.1.3. to our consolidated financial statements for the year ended December 31, 2010, included in our annual report on Form 20-F for that year. At the end of December 2016, Sanofi Pasteur and MSD (known as Merck in the United States and Canada) ended their Sanofi Pasteur MSD joint venture. The financial effects of the resulting divestment/acquisition are presented in Note D.1.2. to our consolidated financial statements for the year ended December 31, 2016, included in our annual report on Form 20-F for that year. On January 1, 2017, Sanofi and Boehringer Ingelheim (BI) finalized the strategic transaction agreed in June 2016, involving the exchange of Sanofi’s Animal Health business (Merial) for BI’s Consumer Healthcare business. The financial effects of this transaction are presented in Note D.1. to our consolidated financial statements for the year ended December 31, 2017, included in our annual report on Form 20-F for that year. The financial effects of the Bioverativ and Ablynx acquisitions are presented in Note D.1.1. to our consolidated financial statements, included at Item 18 of this annual report on Form 20 F.
In certain countries, we carry on some of our business operations through joint ventures with local partners. In addition, we have entered into worldwide collaboration agreements (i) with
Regeneron, relating to Zaltrap®, human therapeutic antibodies such as Praluent® and antibodies in immunology such as Dupixent® and Kevzara®; and (ii) with BMS, relating to Plavix®. For further information, refer to Note C. “Principal Alliances” to our consolidated financial statements.
C.2. Internal organization of activities
Sanofi and its subsidiaries collectively form a group organized around three activities: Pharmaceuticals, Consumer Healthcare and Vaccines.
Within Sanofi, responsibility for research and development (R&D) in their respective fields rests with Sanofi SA and Genzyme Corporation in Pharmaceuticals, and with Sanofi Pasteur and Sanofi Pasteur, Inc. in Vaccines. However, within our integrated R&D organization, strategic priorities are set and R&D efforts coordinated on a worldwide scale. In fulfilling their role in R&D, the aforementioned companies subcontract R&D to those of their subsidiaries that have the necessary resources. They also license patents, manufacturing know-how and trademarks to certain of their French and foreign subsidiaries. Those licensee subsidiaries manufacture, commercialize and distribute the majority of our products, either directly or via local distribution entities.
Our industrial property rights, patents and trademarks are mainly held by the following companies:
◆ Pharmaceuticals: Sanofi, Sanofi Mature IP, Sanofi Biotechnology SAS (France), Sanofi-Aventis Deutschland GmbH (Germany), Ablynx (Belgium), and Genzyme Corporation and Bioverativ Inc. (US);
70 SANOFI / FORM 20-F 2018
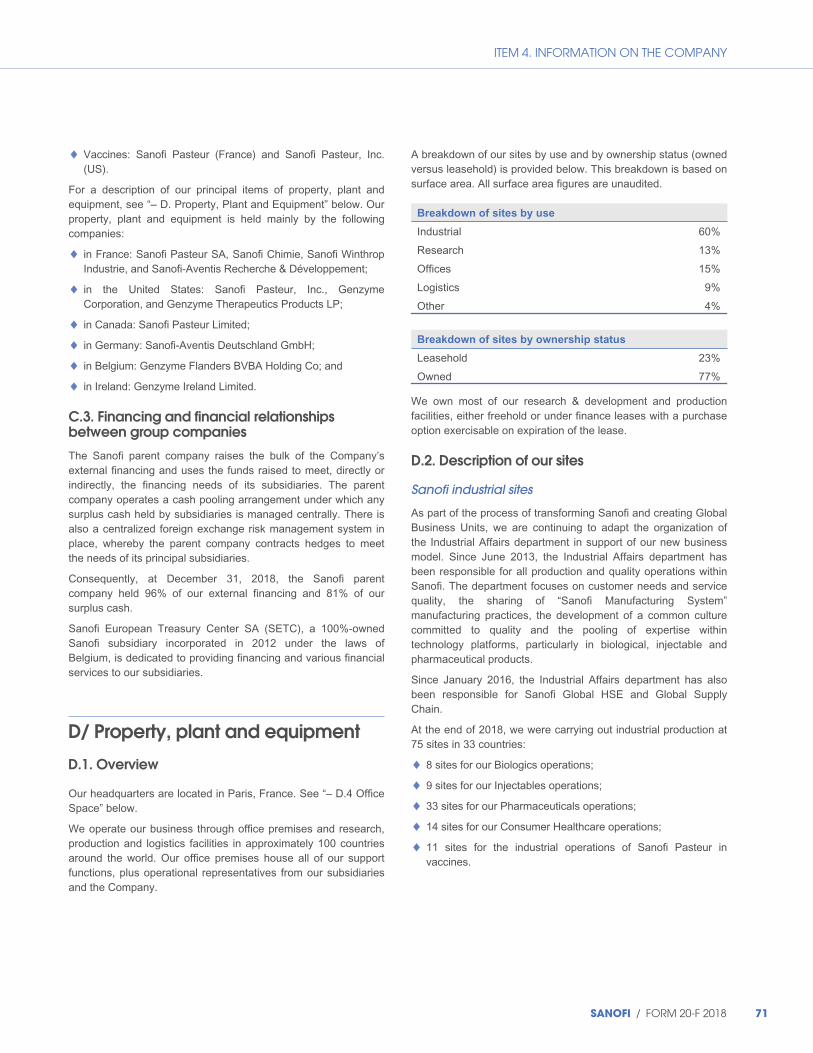
ITEM 4. INFORMATION ON THE COMPANY
◆ Vaccines: Sanofi Pasteur (France) and Sanofi Pasteur, Inc. (US).
For a description of our principal items of property, plant and equipment, see “– D. Property, Plant and Equipment” below. Our property, plant and equipment is held mainly by the following companies:
◆ in France: Sanofi Pasteur SA, Sanofi Chimie, Sanofi Winthrop Industrie, and Sanofi-Aventis Recherche & Développement;
◆ in the United States: Sanofi Pasteur, Inc., Genzyme Corporation, and Genzyme Therapeutics Products LP;
◆ in Canada: Sanofi Pasteur Limited;
◆ in Germany: Sanofi-Aventis Deutschland GmbH;
◆ in Belgium: Genzyme Flanders BVBA Holding Co; and
◆ in Ireland: Genzyme Ireland Limited.
C.3. Financing and financial relationships between group companies
The Sanofi parent company raises the bulk of the Company’s external financing and uses the funds raised to meet, directly or indirectly, the financing needs of its subsidiaries. The parent company operates a cash pooling arrangement under which any surplus cash held by subsidiaries is managed centrally. There is also a centralized foreign exchange risk management system in place, whereby the parent company contracts hedges to meet the needs of its principal subsidiaries.
Consequently, at December 31, 2018, the Sanofi parent company held 96% of our external financing and 81% of our surplus cash.
Sanofi European Treasury Center SA (SETC), a 100%-owned Sanofi subsidiary incorporated in 2012 under the laws of Belgium, is dedicated to providing financing and various financial services to our subsidiaries.
D/ Property, plant and equipment
D.1. Overview
Our headquarters are located in Paris, France. See “– D.4 Office Space” below.
We operate our business through office premises and research, production and logistics facilities in approximately 100 countries around the world. Our office premises house all of our support functions, plus operational representatives from our subsidiaries and the Company.
A breakdown of our sites by use and by ownership status (owned versus leasehold) is provided below. This breakdown is based on surface area. All surface area figures are unaudited.
Breakdown of sites by use
Industrial 60%
Research 13%
Offices 15%
Logistics 9%
Other 4%
Breakdown of sites by ownership status
Leasehold 23%
Owned 77%
We own most of our research & development and production facilities, either freehold or under finance leases with a purchase option exercisable on expiration of the lease.
D.2. Description of our sites
Sanofi industrial sites
As part of the process of transforming Sanofi and creating Global Business Units, we are continuing to adapt the organization of the Industrial Affairs department in support of our new business model. Since June 2013, the Industrial Affairs department has been responsible for all production and quality operations within Sanofi. The department focuses on customer needs and service quality, the sharing of “Sanofi Manufacturing System” manufacturing practices, the development of a common culture committed to quality and the pooling of expertise within technology platforms, particularly in biological, injectable and pharmaceutical products.
Since January 2016, the Industrial Affairs department has also been responsible for Sanofi Global HSE and Global Supply Chain.
At the end of 2018, we were carrying out industrial production at 75 sites in 33 countries:
◆ 8 sites for our Biologics operations;
◆ 9 sites for our Injectables operations;
◆ 33 sites for our Pharmaceuticals operations;
◆ 14 sites for our Consumer Healthcare operations;
◆ 11 sites for the industrial operations of Sanofi Pasteur in vaccines.
SANOFI / FORM 20-F 2018 71
ITEM 4. INFORMATION ON THE COMPANY
In 2018, we produced the following quantities:
◆ Pharmaceuticals: 4,700 million units, comprising:
– units manufactured and packaged: 2,939 million;
– units packaged only: 375 million;
– bulk products in unit equivalents: 454 million;
– outsourced units: 932 million; and
◆ Vaccines: 441 million containers (syringes, vials and lyophilized products) filled, including outsourced production.
We believe that our production facilities are in compliance with all regulatory requirements, are properly maintained and are generally suitable for future needs. Nonetheless, we regularly inspect and evaluate those facilities with regard to environmental, health, safety and security matters, quality compliance and capacity utilization. For more information about our property, plant and equipment, see Note D.3 to our consolidated financial statements, included at Item 18 of this annual report, and section “B.8 Production and Raw Materials” above. Production et matières premières ».
Production of biological, chemical and pharmaceutical products, and of vaccines, is the responsibility of our Industrial Affairs department, which is also in charge of most of our logistics facilities (distribution and storage centers).
Our principal production sites by volume are:
◆ Frankfurt (Germany), Framingham (United States) and Geel (Belgium) for biologics;
◆ Le Trait (France), Frankfurt (Germany), Csanyikvölgy (Hungary) and Waterford (Ireland) for injectables;
◆ Ambarès (France), Lüleburgaz (Turkey), Campinas (Brazil) and Hangzhou (China) for pharmaceutical products;
◆ Aramon and Sisteron (France), Frankfurt (Germany) and Jurong (Singapore) for active pharmaceutical ingredients;
◆ Compiègne and Lisieux (France), Cologne (Germany), Suzano (Brazil) and Ocoyoacac (Mexico) for Consumer Healthcare products; and
◆ Marcy-l’Étoile and Val-de-Reuil (France), Toronto (Canada) and Swiftwater (United States) for vaccines.
Research & Development sites
In Pharmaceuticals, research and development activities are conducted at the following sites:
◆ four operational sites in France: Chilly-Mazarin/Longjumeau, Montpellier, Strasbourg and Vitry-sur-Seine/Alfortville;
◆ three sites in the rest of Europe (Germany, Belgium and the Netherlands), the largest of which is in Frankfurt (Germany);
◆ four sites in the United States: Bridgewater, Cambridge, Framingham/Waltham and Great Valley; and
◆ in Asia, three sites in China (Beijing, Shanghai and Chengdu) and a clinical research unit in Japan.
Vaccines research and development sites are:
◆ Swiftwater, Cambridge and Orlando (United States);
◆ Marcy-l’Étoile/Lyon (France); and
◆ Toronto (Canada).
D.3. Acquisitions, capital expenditures and divestitures
The carrying amount of our property, plant and equipment at December 31, 2018 was €9,651 million. During 2018, we invested €1,459 million (see Note D.3. to our consolidated financial statements, included at Item 18 of this annual report), mainly in increasing capacity and improving productivity at our various production and R&D sites.
Our principal acquisitions, capital expenditures and divestitures in 2016, 2017 and 2018 are described in Notes D.1. (“Impact of changes in the scope of consolidation”), D.3. (“Property, plant and equipment”) and D.4. (“Goodwill and other intangible assets”) to our consolidated financial statements, included at Item 18 of this annual report.
As of December 31, 2018, our firm commitments in respect of future capital expenditures amounted to €535 million. The principal locations involved were: for the Pharmaceuticals segment, the industrial facilities at Frankfurt (Germany), Framingham (United States), Geel (Belgium), Le Trait and Sisteron (France); and for the Vaccines segment, the facilities at Toronto (Canada), Marcy-l’Étoile and Val de Reuil (France).
In the medium term and assuming no changes in the scope of consolidation, we expect to invest on average some €1.7 billion a year in property, plant and equipment. We believe that our own cash resources and the undrawn portion of our existing credit facilities will be sufficient to fund these expenditures.
Our principal ongoing investments are described below.
Biologics
In 2014, a dedicated Biologics platform was launched to develop synergies between Pharmaceuticals, Sanofi Pasteur, Sanofi Genzyme and our Biotherapeutics operations. This platform is helping us extend our footprint in biotechnologies by adopting a multi-disciplinary approach and improving capacity utilization. It also enables us to leverage our expertise in the production of biologics, from active ingredient to integrated manufacturing, including both the medicine itself and associated medical devices.
Three dedicated biotechnology hubs have been developed: Paris/Lyon (France), Frankfurt (Germany) and Boston (United States). Piloting this technology, which relies on cell or microbiological culture or the development of viral vectors, calls for highly specific knowledge and expertise backed by dedicated production platforms to support global product launches.
72 SANOFI / FORM 20-F 2018
ITEM 4. INFORMATION ON THE COMPANY
Injectables
The Frankfurt facility, our principal site for the manufacture of diabetes treatments, is now equipped with an additional sterile filling unit that uses isolator technology. This new filling unit handles Toujeo® and other diabetes products. Our prefilled syringes network mainly delivers Lovenox®/Clexane® from Le Trait (France) to global markets, and from Csanyikvölgy (Hungary) to non-FDA/EMA regulated markets.
Pharmaceuticals
The development of our General Medicines & Emerging Markets platform is built on a network of over 30 regional and local industrial sites in 22 countries, supporting growth in those markets.
At Sidi Abdellah in Algeria we are starting up a new facility that will become our largest industrial complex in Africa, mainly producing dry and liquid formulations.
Our Industrial Affairs Department has an ongoing policy of adapting industrial facilities to market needs. As part of this process, during 2018 we sold various facilities, including those at Holmes Chapel (United Kingdom), Guarenas (Venezuela), as well as those at Prague (Czech Republic) and Bucharest (Romania) as part of the sale of our European Generics business.
Consumer Healthcare
The pharmaceutical industrial operations of our Consumer Healthcare (CHC) business are spread across a dedicated network. Global markets are supplied from our facilities at Compiègne (France) and Cologne (Germany). We have recently invested heavily in major projects intended to build a specialist CHC industrial network. This has included switching some CHC products from non-CHC facilities to the dedicated CHC network, transferring some liquid and effervescent formulations of CHC products to the Cologne site.
Vaccines (Sanofi Pasteur)
Sanofi Pasteur’s industrial operations are in a major investment phase, preparing for the upcoming growth of our influenza and Polio/Pertussis/Hib franchises. Major investments were launched during 2018 in France (including construction of a new influenza
vaccine building at Val-de-Reuil), Canada (a new pertussis vaccine building), the US and Mexico.
Innovation and culture of industrial excellence
In 2018, we highlighted industrial innovation in our various facilities by organizing our tenth annual round of Industrial Trophies, in five categories: Patient Needs, Technological Innovation, Operational Performance, Energy & Environment, and Young Industrial Innovation Talent.
The ambition of our Industrial Affairs department is to continue to raise quality standards in Sanofi’s production activities, and to remain a world leader and a benchmark in the global pharmaceutical industry. To achieve this goal, all our activities share a common culture of industrial excellence, enshrined in the Sanofi Manufacturing System. This sets out a series of priorities (such as customer service, constant improvement, site network optimization and transverse optimization) that constitute our industrial vision and will be crucial to our mutual success.
Industrial Affairs has its own digital strategy, built on five pillars: Integrated Industrialization, Intelligent Quality, Connected Teams and Operations, Connected Factory, and Real-Time Supply Chain.
D.4. Office space
As part of the transformation of Sanofi and the implementation of the ONE SANOFI program, we are undertaking major real estate programs with two core objectives: to bring our teams together on single sites in new workspaces that favor agility, cross-fertilization and communication; and to rationalize office space while achieving a responsible environmental footprint.
Many such projects were completed in 2018, including the rationalization of sites in the United States (Cambridge and Bridgewater), China (Shanghai and Chengdu), Panama, Kenya, Denmark and the Netherlands. In the case of the Netherlands, this involved a masterplan to bring together teams previously located in Gouda and Naarden on a single site in Amsterdam.
This transformation of workspaces to flexible mode has already reached over 16,000 of our people around the globe, and provides strong support for our various operations to attain their objectives. The rollout is due to extend to all regions, with projects including a masterplan for the United Kingdom plus others in Peru, Dubai and China (Beijing).
SANOFI / FORM 20-F 2018 73

ITEM 5. OPERATING AND FINANCIAL REVIEW AND PROSPECTS
Item 5. Operating and Financial Review and Prospects
You should read the following discussion in conjunction with our consolidated financial statements and the notes thereto included in this annual report at Item 18.
Our consolidated financial statements have been prepared in accordance with International Financial Reporting Standards (IFRS) as issued by the International Accounting Standards Board (IASB) and with IFRS adopted by the European Union as of December 31, 2018.
The following discussion contains forward-looking statements that involve inherent risks and uncertainties. Actual results may differ materially from those contained in such forward-looking statements. See “Cautionary Statement Regarding Forward-Looking Statements” at the beginning of this document.
Unless otherwise stated, all financial variations in this item are given on a reported basis.
A. Operating results A.1. Significant operating information
A.1.1. 2018 overview
During 2018, we continued to progress towards our key strategic objectives: reshape the portfolio, deliver outstanding launches, sustain innovation in R&D and simplify the organization.
We began the year by creating a new global Rare Blood Disorder franchise, with three strategic deals announced within the space of a month. The acquisition of Bioverativ, a biotechnology company focused on therapies for hemophilia and other rare blood disorders, was completed in early March 2018 at a price of $11.6 billion. This acquisition brought us a portfolio of products that are delivering growth including the flagship hemophilia treatments Eloctate® and Alprolix®. The acquisition of Ablynx, a company engaged in the discovery and development of nanobodies, was completed in June 2018 at a price of €3.9 billion, and enhances our portfolio with the addition of Cablivi® (caplacizumab), which received marketing approval from the European Commission in September 2018. Finally, the reshaping of our alliance with Alnylam enabled us to obtain global development and commercialization rights to fitusiran, an investigational RNAi therapeutic currently in development for the treatment of hemophilia A and B.
To streamline and refocus our operations, we completed the sale of our European Generics business to Advent International for €1.9 billion on September 30, 2018. We also sold most of our infectious disease research and early-stage development portfolio, and our infectious disease research unit, to Evotec.
At the start of 2018, Sanofi and Regeneron decided to accelerate their investment in the clinical development of three innovative products: cemiplimab (Libtayo®) in oncology, dupilumab (Dupixent®) in the treatment of Type 2 allergies, and REGN3500/SAR440340 (an anti-IL33 monoclonal antibody) in atopic dermatitis, asthma and chronic obstructive pulmonary disease. Our Immuno-Oncology Discovery and Development Agreement with Regeneron has also been restructured, giving us greater flexibility to pursue our own early stage immuno-oncology development projects independently while allowing Regeneron to retain all rights to its other discovery and development programs in that field. The renegotiation of that agreement, effective from December 31, 2018, was signed on January 2, 2019.
We also continued our efforts to secure research and development alliances during 2018, entering into a collaboration agreement with Denali Therapeutics, Inc. to develop several molecules with a view to the potential treatment of various neuro-degenerative conditions and systemic inflammatory diseases.
Our research and development efforts led to a number of products entering Phase III in 2018: fitusiran in the treatment of hemophilia type A and B; Dupixent® in the treatment of eosinophilic esophagitis; Kevzara® in the treatment of giant-cell arteritis and polymyalgia rheumatica; isatuximab in the treatment of recently diagnosed multiple myeloma; sotagliflozin in the treatment of worsening heart failure; and Libtayo® as a first line treatment for patients with advanced or metastatic non small cell lung cancer.
A number of product launches took place in 2018 following approvals from regulatory bodies. These included Dupixent®, which was launched as a treatment for adults with moderate-to-severe atopic dermatitis in Japan, and in a new indication in the United States for adults with moderate-to-severe asthma. Cablivi® was launched in Germany in the treatment of acquired thrombotic thrombocytopenic purpura (aTTP). Admelog® was launched in the United States and some European countries as a biosimilar, under the name Insulin lispro Sanofi®. Libtayo® was launched in the United States in the treatment of advanced cutaneous squamous cell carcinoma (CSCC).
Also in 2018, we invested €350 million (CAD 500 million) in the construction of a new state-of-the-art vaccine manufacturing facility at the Sanofi Pasteur Canadian headquarters in Toronto (Ontario), to meet the growing demand for vaccines.
Net sales for the year ended December 31, 2018 amounted to €34,463 million, 1.7% lower than in 2017. At constant exchange rates (CER)(1), net sales rose by 2.5%, reflecting the acquisition of Bioverativ’s rare blood disorder products. At constant exchange rates and on a constant structure basis (CER/CS)(1),
(1) Non-GAAP financial measure: see definition in “— A.1.6. Presentation of Net Sales” below.
74 SANOFI / FORM 20-F 2018
ITEM 5. OPERATING AND FINANCIAL REVIEW AND PROSPECTS
net sales grew by 0.6%. Lower sales in Diabetes in the United States and for Established Prescription Products in mature markets were offset by the performance of Dupixent® and the Rare Diseases franchise, and more generally by increased sales in Emerging Markets.
Net income attributable to equity holders of Sanofi amounted to €4,306 million, 48.8% lower than in 2017, mainly due to the recognition of the gain on the divestment of our Animal Health business in 2017. Earnings per share was 48.5% lower than in 2017, at €3.45. Business net income(1) was €6,819 million, 1.8%
less than in 2017, while business earnings per share (business EPS)(1) was 0.9% lower at €5.47.
As of December 31, 2018, our net debt(2) had increased to €17,628 million (versus €5,161 million as of December 31, 2017). This was largely due to the impact of acquiring Bioverativ and Ablynx, which was partly offset by the divestment of our European Generics business. At the Annual General Meeting of April 30, 2019, we will ask our shareholders to approve a dividend of €3.07 per share, representing a payout of 56.1% of our business net income.
A.1.2. Impacts of competition from generics and biosimilars
Some of our flagship products continued to suffer sales erosion in 2018 due to competition from generics and biosimilars. We do not believe it is possible to state with certainty what level of net sales would have been achieved in the absence of generic competition.
A comparison of our consolidated net sales for the years ended December 31, 2018 and 2017 (see “– A.2. Results of Operations – Year Ended December 31, 2018 Compared with Year Ended December 31, 2017” below) for products affected by generic and biosimilar competition shows a loss of €1,749 million of net sales on a reported basis. Other parameters may have contributed to the loss of sales, such as a fall in the average price of certain products (e.g. Lantus®).
The table below sets forth the impact by product.
(€ million) 2018 2017(a)
Change on a
reported basis
Change on a
reported basis (%)
Aprovel® Europe 108 115 (7) -6.1%
Lantus® Europe 684 760 (76) -10.0%
Lovenox® Europe 870 951 (81) -8.5%
Plavix® Europe 147 150 (3) -2.0%
Renagel® / Renvela® Europe 60 71 (11) -15.5%
Ambien® United States 45 55 (10) -18.2%
Lantus® United States 1,614 2,542 (928) -36.5%
Lovenox® United States 38 58 (20) -34.5%
Renagel® / Renvela® United States 253 645 (392) -60.8%
Taxotere® United States 1 — 1 —
Allegra® Japan 112 146 (34) -23.3%
Amaryl® Japan 18 27 (9) -33.3%
Aprovel® Japan 28 89 (61) -68.5%
Lantus® Japan 29 43 (14) -32.6%
Myslee® Japan 76 95 (19) -20.0%
Plavix® Japan 156 235 (79) -33.6%
Taxotere® Japan 9 15 (6) -40.0%
Total 4,248 5,997 (1,749) -29.2%
(a) Includes the effects of first-time application of IFRS 15 on revenue recognition (see Note A.2.1.1. to our consolidated financial statements, included at Item 18 of this Annual Report on Form 20-F).
(1) Non-GAAP financial measure: see definition in “— A.1.5. Segment Information — 3. Business Net Income” below. (2) Non-GAAP financial measure: see definition in “— B. Liquidity and Capital Resources” below.
SANOFI / FORM 20-F 2018 75
ITEM 5. OPERATING AND FINANCIAL REVIEW AND PROSPECTS
We expect the erosion caused by generic competition to continue in 2019, with a negative impact on our net income. The products likely to be impacted include those that already faced generic competition in 2018, but whose sales can reasonably be expected to be subject to further sales erosion in 2019: Aprovel®, Lantus®, Lovenox®, Plavix® and Renagel®/Renvela® in Europe; Ambien®, Lantus®, Lovenox®, Renagel® / Renvela® and Taxotere® in the United States; and Allegra®, Amaryl®, Aprovel®, Lantus®, Myslee®, Plavix® and Taxotere® in Japan.
In 2018, the aggregate consolidated net sales of those products in countries where generic competition currently exists or is expected in 2019 amounted to €4,248 million; this comprises €1,951 million in the United States (including €1,614 million in net sales of Lantus® and €253 million in net sales of Renagel®/Renvela®); €1,869 million in Europe; and €428 million in Japan. The negative impact on our 2019 net sales is likely to represent a substantial portion of those sales, but the actual impact will depend on a number of factors such as the prices at which the products are sold and potential litigation outcomes.
A.1.3. Purchase accounting effects
Our results of operations and financial condition for the years ended December 31, 2018, 2017 and 2016 have been significantly affected by our August 2004 acquisition of Aventis, our April 2011 acquisition of Genzyme, our 2018 acquisition of Bioverativ and certain other transactions. See “– A.1.11. Critical accounting and reporting policies – Business combinations” below for an explanation of the impact of business combinations on our results of operations.
The Bioverativ business combination has generated significant amortization of intangible assets (€430 million in 2018). The Genzyme business combination has generated significant amortization of intangible assets (€760 million in 2018, €857 million in 2017 and €866 million in 2016) and impairment of intangible assets (expenses of €183 million in 2018, expenses of €16 million in 2017 and net reversal of €6 million in 2016). The Aventis business combination has also generated significant amortization expenses (€256 million in 2018, €365 million in 2017, and €482 million in 2016).
In order to isolate the purchase accounting effects of all acquisitions and certain other items, we use a non-GAAP financial measure that we refer to as “business net income”(1).
A.1.4. Sources of revenues and expenses
Revenues. Revenue arising from the sale of goods is presented in the income statement within Net sales. Net sales comprise revenue from sales of pharmaceutical products, consumer health care products, active ingredients and vaccines, net of sales returns, of customer incentives and discounts, and of certain sales-based payments paid or payable to the healthcare authorities. Returns, discounts, incentives and rebates are
recognized in the period in which the underlying sales are recognized, as a reduction of sales revenue. See Note B.13.1. to our consolidated financial statements included at Item 18 of this annual report. We sell pharmaceutical products and vaccines directly, through alliances, and by licensing arrangements throughout the world. When we sell products directly, we record sales revenues as part of our consolidated net sales. When we sell products through alliances, the revenues reflected in our consolidated financial statements are based on the contractual arrangements governing those alliances. For more information about our alliances, see “– Financial Presentation of Alliances” below. When our products are sold by licensing arrangements, we receive royalty income that we record in Other revenues. The sales of non-Sanofi products of our US based entity VaxServe are also presented in Other revenues; see Note B.13.2. to the consolidated financial statements included at Item 18 of this annual report.
Cost of Sales. Our cost of sales consists primarily of the cost of purchasing raw materials and active ingredients, labor and other costs relating to our manufacturing activities, packaging materials, payments made under licensing agreements and distribution costs. We have license agreements under which we manufacture, sell and distribute products that are patented by other companies and license agreements under which other companies distribute products that we have patented. When we pay royalties, we record them in Cost of sales.
Operating Income. Our operating income reflects our revenues, our cost of sales and the remainder of our operating expenses, the most significant of which are research and development expenses and selling and general expenses. For our operating segments, we also measure our results of operations through an indicator referred to as “Business Operating Income,” which we describe below under “– A.1.5. Segment Information –2/Business Operating Income of Segments.”
A.1.5. Segment information
1/ Operating segments
In accordance with IFRS 8 (Operating Segments), the segment information reported by Sanofi is prepared on the basis of internal management data provided to the Chief Executive Officer, who is the chief operating decision maker. The performance of those segments is monitored individually using internal reports and common indicators. The operating segment disclosures required under IFRS 8 are provided in Notes B.26. and D.35 (“Segment Information”) to our consolidated financial statements, included at Item 18 of this annual report.
Sanofi has three operating segments: Pharmaceuticals, Consumer Healthcare and Vaccines.
The Pharmaceuticals segment comprises the commercial operations of the following global franchises: Specialty Care (Rare Diseases, Multiple Sclerosis, Oncology, Immunology and Rare Blood Disorder), Diabetes & Cardiovascular, Established
(1) Non-GAAP financial measure: see definition under “A.1.5. Segment information – 3/ Business Net Income” below.
76 SANOFI / FORM 20-F 2018

ITEM 5. OPERATING AND FINANCIAL REVIEW AND PROSPECTS
Prescription Products and Generics, together with research, development and production activities dedicated to our Pharmaceuticals segment. This segment also includes associates whose activities are related to pharmaceuticals, in particular our share of Regeneron.
The Consumer Healthcare segment comprises, for all geographical territories, the commercial operations for our Consumer Healthcare products, together with research, development and production activities dedicated to those products.
The Vaccines segment comprises, for all geographical territories (including from January 1, 2017 certain territories previously included in the Sanofi Pasteur MSD joint venture) the commercial operations of Sanofi Pasteur, together with research, development and production activities dedicated to vaccines.
Inter-segment transactions are not material.
The costs of our global functions (Medical Affairs, External Affairs, Finance, Human Resources, Legal Affairs, Information Solutions & Technologies, Sanofi Business Services, etc.) are managed centrally at group-wide level. The costs of those functions are presented within the “Other” category. That category also includes other reconciling items such as retained commitments in respect of divested activities.
2/ Business operating income
We report segment results on the basis of “business operating income”. This indicator is used internally by Sanofi’s chief
operating decision maker to measure the performance of each operating segment and to allocate resources. For a definition of “business operating income”, and a reconciliation between that indicator and Income before tax and investments accounted
for using the equity method, refer to Note D.35. to our consolidated financial statements.
3/ Business net income
We believe that understanding of our operational performance by our management and our investors is enhanced by reporting “business net income”. This non-GAAP financial measure represents business operating income, less net financial expenses and the relevant income tax effects.
Business net income for 2018 was €6,819 million, 1.8% lower than in 2017 (€6,943 million). Business net income was unchanged year-on-year as a percentage of net sales, at 19.8%.
We also report “business earnings per share” (business EPS), a non-GAAP financial measure which we define as business net income divided by the weighted average number of shares outstanding.
Business EPS was €5.47 for 2018, 0.9% lower than the 2017 figure of €5.52, based on an average number of shares outstanding of 1,247.1 million for 2018 and 1,256.9 million for 2017.
Our business net income for 2016 was €7,308 million, including €476 million of business net income from Animal Health. Business EPS for 2016 was €5.68, based on an average number of shares outstanding of 1,286.6 million.
The table below reconciles our business operating income to our business net income:
(€ million) December 31,
2018
December 31,
2017(a)
December 31,
2016(a)
Business operating income 8,884 9,323 9,284
Financial income and expenses (271) (273) (399)(b)
Income tax expense (1,794) (2,107) (2,053)
Business net income excluding Animal Health 6,819 6,943 6,832
Animal Health business net income — — 476
Business net income 6,819 6,943 7,308
(a) Includes the effects of first-time application of IFRS 15 on revenue recognition (see Note A.2.1.1. to our consolidated financial statements). (b) This amount does not include the €457 million impairment loss charged against our equity investment in Alnylam.
We define business net income as Net income attributable to
equity holders of Sanofi determined under IFRS, excluding the following items:
◆ amortization and impairment losses charged against intangible assets (other than software and other rights of an industrial or operational nature);
◆ fair value remeasurements of contingent consideration relating to business combinations or divestments;
◆ other impacts associated with acquisitions (including impacts of acquisitions on investments accounted for using the equity method);
◆ restructuring costs and similar items(1);
◆ other gains and losses (including gains and losses on major disposals of non-current assets(2));
◆ other costs and provisions related to litigation(2);
(1) Presented in the line item Restructuring costs and similar items in the consolidated income statement. (2) Presented in the line item Other gains and losses, and litigation in the consolidated income statement.
SANOFI / FORM 20-F 2018 77
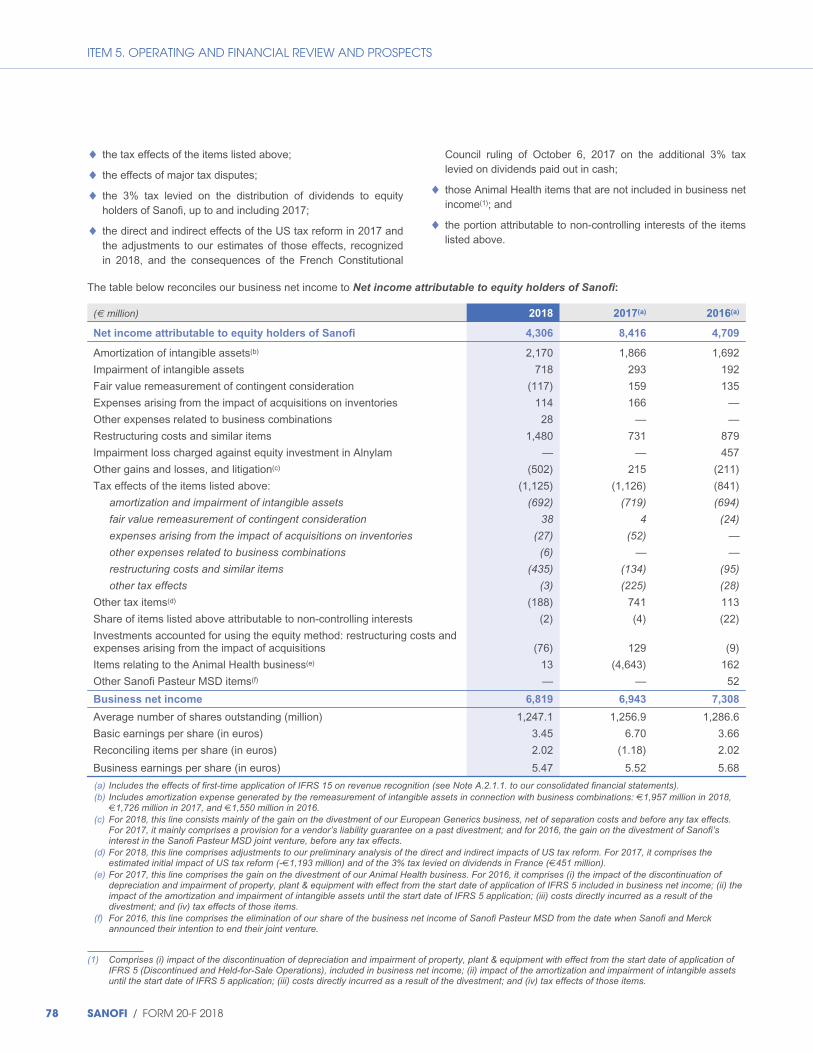
ITEM 5. OPERATING AND FINANCIAL REVIEW AND PROSPECTS
◆ the tax effects of the items listed above;
◆ the effects of major tax disputes;
◆ the 3% tax levied on the distribution of dividends to equity holders of Sanofi, up to and including 2017;
◆ the direct and indirect effects of the US tax reform in 2017 and the adjustments to our estimates of those effects, recognized in 2018, and the consequences of the French Constitutional
Council ruling of October 6, 2017 on the additional 3% tax levied on dividends paid out in cash;
◆ those Animal Health items that are not included in business net income(1); and
◆ the portion attributable to non-controlling interests of the items listed above.
The table below reconciles our business net income to Net income attributable to equity holders of Sanofi:
(€ million) 2018 2017(a) 2016(a)
Net income attributable to equity holders of Sanofi 4,306 8,416 4,709
Amortization of intangible assets(b) 2,170 1,866 1,692
Impairment of intangible assets 718 293 192
Fair value remeasurement of contingent consideration (117) 159 135
Expenses arising from the impact of acquisitions on inventories 114 166 —
Other expenses related to business combinations 28 — —
Restructuring costs and similar items 1,480 731 879
Impairment loss charged against equity investment in Alnylam — — 457
Other gains and losses, and litigation(c) (502) 215 (211)
Tax effects of the items listed above: (1,125) (1,126) (841)
amortization and impairment of intangible assets (692) (719) (694)
fair value remeasurement of contingent consideration 38 4 (24)
expenses arising from the impact of acquisitions on inventories (27) (52) —
other expenses related to business combinations (6) — —
restructuring costs and similar items (435) (134) (95)
other tax effects (3) (225) (28)
Other tax items(d) (188) 741 113
Share of items listed above attributable to non-controlling interests (2) (4) (22)
Investments accounted for using the equity method: restructuring costs and expenses arising from the impact of acquisitions (76) 129 (9)
Items relating to the Animal Health business(e) 13 (4,643) 162
Other Sanofi Pasteur MSD items(f) — — 52
Business net income 6,819 6,943 7,308
Average number of shares outstanding (million) 1,247.1 1,256.9 1,286.6
Basic earnings per share (in euros) 3.45 6.70 3.66
Reconciling items per share (in euros) 2.02 (1.18) 2.02
Business earnings per share (in euros) 5.47 5.52 5.68
(a) Includes the effects of first-time application of IFRS 15 on revenue recognition (see Note A.2.1.1. to our consolidated financial statements). (b) Includes amortization expense generated by the remeasurement of intangible assets in connection with business combinations: €1,957 million in 2018,
€1,726 million in 2017, and €1,550 million in 2016. (c) For 2018, this line consists mainly of the gain on the divestment of our European Generics business, net of separation costs and before any tax effects.
For 2017, it mainly comprises a provision for a vendor’s liability guarantee on a past divestment; and for 2016, the gain on the divestment of Sanofi’s interest in the Sanofi Pasteur MSD joint venture, before any tax effects.
(d) For 2018, this line comprises adjustments to our preliminary analysis of the direct and indirect impacts of US tax reform. For 2017, it comprises the estimated initial impact of US tax reform (-€1,193 million) and of the 3% tax levied on dividends in France (€451 million).
(e) For 2017, this line comprises the gain on the divestment of our Animal Health business. For 2016, it comprises (i) the impact of the discontinuation of depreciation and impairment of property, plant & equipment with effect from the start date of application of IFRS 5 included in business net income; (ii) the impact of the amortization and impairment of intangible assets until the start date of IFRS 5 application; (iii) costs directly incurred as a result of the divestment; and (iv) tax effects of those items.
(f) For 2016, this line comprises the elimination of our share of the business net income of Sanofi Pasteur MSD from the date when Sanofi and Merck announced their intention to end their joint venture.
(1) Comprises (i) impact of the discontinuation of depreciation and impairment of property, plant & equipment with effect from the start date of application of IFRS 5 (Discontinued and Held-for-Sale Operations), included in business net income; (ii) impact of the amortization and impairment of intangible assets until the start date of IFRS 5 application; (iii) costs directly incurred as a result of the divestment; and (iv) tax effects of those items.
78 SANOFI / FORM 20-F 2018

ITEM 5. OPERATING AND FINANCIAL REVIEW AND PROSPECTS
The most significant reconciling items between our business net income and Net income attributable to equity holders of
Sanofi relate to (i) the purchase accounting effects of our acquisitions and business combinations, particularly the amortization and impairment of intangible assets (other than software and other rights of an industrial or operational nature) and (ii)) the impacts of events regarded as non-recurring, where the amounts involved are particularly significant. We believe that excluding those non-cash or non-recurring charges enhances an investor’s understanding of our underlying economic performance, because we do not consider that the excluded charges reflect the combined entity’s ongoing operating performance. Rather, we believe that each of the excluded charges reflects the decision to acquire the businesses concerned.
The principal purchase accounting effects of acquisitions and business combinations on net income are:
◆ amortization and net impairment losses charged against intangible assets (other than software and other rights of an industrial or operational nature), net of taxes and non-controlling interests; and
◆ the incremental cost of sales incurred on the workdown of acquired inventories remeasured at fair value, net of taxes.
We believe (subject to the limitations described below) that disclosing our business net income enhances the comparability of our operating performance, for the following reasons:
◆ the elimination of charges related to the purchase accounting effects of our acquisitions and business combinations (particularly amortization and impairment of finite-lived intangible assets, other than software and other rights of an industrial or operational nature) enhances the comparability of our ongoing operating performance relative to our peers in the pharmaceutical industry that carry those intangible assets (principally patents and trademarks) at low book values either because they are the result of in-house research and development that has already been expensed in prior periods or because they were acquired through business combinations that were accounted for as poolings-of-interest;
◆ the elimination of selected items – such as the incremental cost of sales arising from the workdown of acquired inventories remeasured at fair value in business combinations, major gains and losses on disposals, and costs and provisions associated with major litigation and any other major non-recurring items – improves comparability from one period to the next; and
◆ the elimination of restructuring costs and similar items enhances comparability because those costs are incurred in connection with reorganization and transformation processes intended to optimize our operations.
We remind investors, however, that business net income should not be considered in isolation from, or as a substitute for, Net
income attributable to equity holders of Sanofi reported in accordance with IFRS. In addition, we strongly encourage
investors and potential investors not to rely on any single financial measure but to review our financial statements, including the notes thereto, carefully and in their entirety.
We compensate for the material limitations described above by using business net income only to supplement our IFRS financial reporting and by ensuring that our disclosures provide sufficient information for a full understanding of all adjustments included in business net income.
Because our business net income is not a standardized measure, it may not be directly comparable with the non-GAAP financial measures of other companies using the same or a similar non-GAAP financial measure.
A.1.6. Presentation of net sales
In the discussion below, we present our consolidated net sales for 2018, 2017, and 2016. We analyze our net sales among various categories, including by business, product and geographical region. In addition to reported net sales, we analyze non-GAAP financial measures designed to isolate the impact on our net sales of currency exchange rates and changes in the structure of our group.
When we refer to changes in our net sales at constant exchange rates (CER), that means that we have excluded the effect of exchange rates by recalculating net sales for the relevant period using the exchange rates that were used for the previous period.
When we refer to changes in our net sales on a constant structure basis, that means that we eliminate the effect of changes in structure by restating the net sales for the previous period as follows:
◆ by including sales generated by entities or product rights acquired in the current period for a portion of the previous period equal to the portion of the current period during which we owned them, based on sales information we receive from the party from whom we make the acquisition;
◆ similarly, by excluding sales for a portion of the previous period when we have sold an entity or rights to a product in the current period; and
◆ for a change in consolidation method, by recalculating the previous period on the basis of the method used for the current period.
In section A.2. below, comparatives for 2017 have been restated in accordance with the new standard on revenue recognition, IFRS 15, which became applicable on January 1, 2018. The impact of these restatements is described in detail in Note A.2.1.1. to the consolidated financial statements.
We believe that the impact of the application of IFRS 15 on net sales for the year ended December 31, 2016 is not material (€12 million). Given the significant resources required to restate such information by business, segment and geographical region, we concluded that it would be unduly burdensome to restate such amounts. Therefore, we have chosen to present our
SANOFI / FORM 20-F 2018 79
ITEM 5. OPERATING AND FINANCIAL REVIEW AND PROSPECTS
detailed analysis of net sales for 2016 and comparable information for 2017 before the impact of IFRS 15 as set forth in section A.3.1.1.
A.1.7. Financial presentation of alliances
We have entered into a number of alliances for the development, co-promotion and/or co-marketing of our products. We believe that a presentation of our two principal alliances is useful to an understanding of our financial statements.
The financial impact of the alliances on our income statement is described in “– Results of Operations – Year Ended December 31, 2018 Compared with Year Ended December 31, 2017” and “– Year Ended December 31, 2017 Compared with Year Ended December 31, 2016”, in particular in “– Net Sales”, “– Other Revenues”, “– Share of Profit/Loss from Investments Accounted for using the Equity Method” and “– Net Income Attributable to Non-Controlling Interests”.
1/ Alliance arrangements with Regeneron Pharmaceuticals
Inc. (Regeneron)
Collaboration agreement on the discovery, development and commercialization of human therapeutic antibodies
In November 2007, Sanofi and Regeneron signed new agreements (amended in November 2009) for the discovery, development and commercialization of fully human therapeutic antibodies. Under the 2009 amended agreements Sanofi committed to funding the discovery and pre-clinical development of fully human therapeutic antibodies by a maximum of $160 million per year through 2017, with an option to develop and commercialize antibodies discovered by Regeneron pursuant to the collaboration. Sanofi decided not to extend the discovery agreement, which expired on December 31, 2017.
Following the signature in July 2015 of the immuno-oncology collaboration agreements described below, $75 million of the discovery and pre-clinical development funding was reallocated to the new agreements (spread over three years).
If an option is exercised under the 2009 amended agreements, Sanofi co-develops the antibody with Regeneron and is responsible for funding. Sanofi and Regeneron share co-promotion rights and profits on sales of the co-developed antibodies. On receipt of the first positive Phase III trial results for any such antibody, the subsequent Phase III costs for that antibody are split 80% Sanofi, 20% Regeneron. Amounts received from Regeneron under those arrangements are recognized by Sanofi as a reduction in the line item “Research and development expenses”. Once a product begins to be commercialized, and provided that the share of quarterly results under the agreement represents a profit, Sanofi is entitled to an additional portion of Regeneron’s profit-share (capped at 10% of Regeneron’s share of quarterly profits) until Regeneron has paid 50% of the cumulative development costs incurred by the parties in the collaboration.
As of December 31, 2018 the cumulative development costs incurred by the two parties were €6.0 billion (comprising
€3.2 billion funded 100% by Sanofi, and €2.8 billion funded 80% by Sanofi and 20% by Regeneron, amounts translated into euros at the closing US dollar exchange rate). On the earlier of (i) 24 months before the scheduled launch date or (ii) the first positive Phase III trial results, Sanofi and Regeneron share the commercial expenses of the antibodies co-developed under the license agreement. Sanofi recognizes all the sales of those antibodies. Profits and losses arising from commercial operations in the United States are split 50/50. Outside the United States, Sanofi is entitled to between 55% and 65% of profits depending on sales of the antibodies, and bears 55% of any losses. The share of profits and losses attributable to Regeneron under the agreement is recognized within the line items Other operating
income or Other operating expenses, which are components of operating income. In addition, Regeneron is entitled to receive payments of up to $250 million contingent on the attainment of specified levels of sales outside the United States.
Praluent®, Dupixent®, Kevzara® and REGN3500 (SAR440340) continue to be developed, and commercialized as applicable, with Regeneron under the Antibody License and Collaboration Agreement (LCA) following the expiry of the discovery agreement.
In January 2018, Sanofi and Regeneron signed a set of amendments including an amendment to the collaboration agreement on the development and commercialization of human therapeutic antibodies that allowed for the funding of additional programs on Dupixent® and REGN3500 (SAR440340) which will focus on extending the current range of indications, finding new indications, and improving co-morbidity between multiple pathologies.
Immuno-Oncology (IO) Discovery and Development Agreement and IO License and Collaboration Agreement (IO LCA)
On July 1, 2015, Sanofi and Regeneron entered into a new global collaboration to discover, develop and commercialize new antibody cancer treatments in the emerging field of immuno-oncology. As part of the agreements, Sanofi made an upfront payment of $640 million to Regeneron. The two companies also agreed to reallocate $75 million (spread over three years) to immuno-oncology antibody research and development from Sanofi’s $160 million annual contribution to their existing antibody discovery collaboration.
Under the terms of the IO Discovery and Development Agreement, the two companies agreed to invest approximately $1 billion from discovery through proof of concept (POC) development (usually a Phase IIa study) of monotherapy and novel combinations of immuno-oncology antibody candidates to be funded 25% by Regeneron ($250 million) and 75% by Sanofi ($750 million). Beyond the committed funding, additional funding will be allocated as programs enter post-POC development under the IO LCA.
Upon establishment of POC, Sanofi can exercise its opt-in rights to further development and commercialization under the IO LCA for candidates derived from the IO discovery program. Once
80 SANOFI / FORM 20-F 2018
ITEM 5. OPERATING AND FINANCIAL REVIEW AND PROSPECTS
Sanofi has exercised its opt-in rights for a candidate, future development of that candidate will be conducted under the IO LCA either by Sanofi or Regeneron.
Under the terms of the IO Discovery and Development Agreement, Sanofi is entitled to an additional share of profits of up to 50% of the clinical development costs initially funded by Sanofi. That additional profit-share is capped at 10% of the share of Regeneron’s quarterly profits arising under the IO LCA.
The Amended and restated Immuno-oncology Discovery and Development Agreement (“Amended IO Discovery Agreement”), effective from December 31, 2018, was signed on January 2, 2019. Through this amendment, Sanofi and Regeneron restructured their global Immuno-oncology Discovery and Development Agreement, effective December 31, 2018. The 2015 agreement was due to end in mid-2020, and the revision provides for ongoing collaborative development of two clinical-stage bispecific antibody programs targeting respectively (i) BCMA and CD3 and (ii) MUC16 and CD3. This gives Sanofi increased flexibility to advance its early-stage immuno-oncology pipeline independently, while Regeneron retains all rights to its other immuno-oncology discovery and development programs.
Under the terms of the Amended IO Discovery Agreement Sanofi paid Regeneron $462 million representing the balance of payments due under the original Immuno-oncology Agreement, which covers the Sanofi share of (i) the immuno-oncology discovery program costs for the last quarter of 2018 and up to $120 million in development costs for the two selected clinical-stage bispecific antibodies, plus (ii) the termination fee for the other programs under the original immuno-oncology agreement. Sanofi secured the right to opt-in to the BCMAxCD3 and MUC16xCD3 bispecific programs when proof of concept is achieved or when the allocated funding is expended.
Post opt-in of the BCMAxCD3 bispecific, Sanofi will lead development and commercialization. Post opt-in of the MUC16xCD3 bispecific, Regeneron will lead development, and also lead commercialization in the United States. Sanofi will lead commercialization outside the United States.
The companies’ ongoing collaboration for the development and commercialization of Libtayo® (cemiplimab) is unaffected by the Amended IO Discovery Agreement. As of December 31, 2018, the additional share of profits corresponding to 50% of the clinical development costs initially funded by Sanofi amounts to €53 million. This additional profit-share is capped at 10% of the share of Regeneron’s quarterly profits arising under the IO LCA.
Under the 2015 IO LCA, the two companies have agreed to jointly develop a programmed cell death protein 1 (PD-1) inhibitor antibody (REGN2810) and committed to provide additional funding of no more than $650 million on a 50/50 basis ($325 million per company) for the development of REGN2810, a PD-1 inhibitor antibody. While they share profits on a 50/50 basis, Sanofi will make a one-time milestone payment of $375 million to Regeneron in the event that sales of a PD-1 product and any other collaboration antibody sold for use in
combination with a PD-1 product were to exceed, in the aggregate, $2 billion in any consecutive 12-month period.
In January 2018, Sanofi and Regeneron announced a set of amendments including an amendment to their IO LCA on the development of cemiplimab (REGN 2810) in the field of immuno-oncology, pursuant to which the $650 million development budget for the PD-1 inhibitor antibody was increased to $1.64 billion through 2022, funded equally by the two companies (i.e. from $325 million to $820 million for each partner).
On September 21, 2018, the US Food and Drug Administration (FDA) approved Libtayo® (cemiplimab) for the treatment of patients with metastatic cutaneous squamous cell carcinoma (CSCC) or locally advanced CSCC who are not candidates for curative surgery or curative radiation. Libtayo® is a fully-human monoclonal antibody targeting the immune checkpoint receptor PD-1 (programmed cell death protein-1) and is the first and only treatment specifically approved and available for advanced CSCC in the U.S. A regulatory application for Libtayo® has also been submitted in the EU.
An ongoing joint clinical program is investigating Libtayo® in multiple other cancers, and includes potentially pivotal trials in lung, cervical and skin cancers. The safety and efficacy of Libtayo® have not been fully evaluated by any regulatory authority for indications beyond advanced CSCC.
Investor agreement
In January 2014, Sanofi and Regeneron amended the investor agreement that has existed between the two companies since 2007 (the “Amended Investor Agreement”). Under the terms of the amendment, Sanofi accepted various restrictions. Sanofi is bound by certain “standstill” provisions, which contractually prohibit Sanofi from seeking to directly or indirectly exert control of Regeneron or acquiring more than 30% of Regeneron’s capital stock (consisting of the outstanding shares of common stock and the shares of Class A stock). This prohibition will remain in place until the earlier of (i) the later of the fifth anniversaries of the expiration or earlier termination of the Zaltrap® collaboration agreement with Regeneron (related to the development and commercialization of Zaltrap®) or the collaboration agreement with Regeneron on monoclonal antibodies (see “Collaboration agreement on the discovery, development and commercialization of human therapeutics antibodies” above), each as amended and (ii) other specified events.
Sanofi has also agreed to vote as recommended by Regeneron’s Board of Directors, except that it may elect to vote proportionally with the votes cast by all of Regeneron’s other shareholders with respect to certain change-of-control transactions, and to vote in its sole discretion with respect to liquidation or dissolution, stock issuances equal to or exceeding 20% of the outstanding shares or voting rights of Regeneron’s Class A Stock and Common Stock (taken together), and new equity compensation plans or amendments if not materially consistent with Regeneron’s historical equity compensation practices.
SANOFI / FORM 20-F 2018 81
ITEM 5. OPERATING AND FINANCIAL REVIEW AND PROSPECTS
As soon as it had passed the threshold of 20% ownership of the capital stock, Sanofi exercised its right under the Amended Investor Agreement to designate an independent director, who was appointed to the Board of Directors of Regeneron. The interest held by Sanofi in Regeneron has been consolidated by the equity method since April 2014.
On the conditions set out in the Amended Investor Agreement entered into in January 2014, Sanofi’s right to designate a Regeneron board member was contingent on Sanofi maintaining its percentage share of Regeneron’s outstanding capital stock (measured on a quarterly basis) at a level no lower than the highest percentage level previously achieved, with the maximum requirement capped at 25%. In addition, Sanofi’s interest in Regeneron was subject to a lock-up clause. Those limitations have been amended by the letter agreement of January 2018 (see below).
In November 2015, the Independent Designee (as defined in the Amended Investor Agreement) designated by Sanofi as an independent director resigned from the Regeneron Board of Directors. At Sanofi’s request, pursuant to the Amended Investor Agreement, Regeneron appointed N. Anthony “Tony” Coles, M.D. to its Board of Directors in January 2017 as a successor Sanofi designee.
The Amended Investor Agreement also gives Sanofi the right to receive certain reasonable information as may be agreed upon by the parties and which will facilitate Sanofi’s ability to account for its investment in Regeneron using the equity method of accounting under IFRS.
In January 2018, Sanofi and Regeneron announced a set of amendments (i) to their collaboration agreement on the development and commercialization of human therapeutic antibodies; (ii) to their IO License and Collaboration Agreement on the development of cemiplimab (REGN 2810) in the field of immuno-oncology; and (iii) a limited waiver and amendment of the Amended Investor Agreement pursuant to a letter agreement (the “2018 Letter Agreement”).
Pursuant to the 2018 Letter Agreement, Regeneron has agreed to grant a limited waiver of the lock-up clause” and the obligation to maintain the “Highest Percentage Threshold” in the Amended and Restated Investor Agreement between the companies, so that Sanofi may elect to sell a small percentage of the Regeneron common stock it owns to fund a portion of the cemiplimab and dupilumab development expansion. This waiver will allow Sanofi to sell up to an aggregate of 1.4 million shares of Regeneron common stock to Regeneron in private transactions through the end of 2020. If Regeneron decides not to purchase the shares, Sanofi will be allowed to sell those shares on the open market, subject to certain volume and timing limitations. Upon expiration of the limited waiver under the 2018 Letter Agreement, the Amended Investor Agreement will be amended to define “Highest Percentage Threshold” as the lower of (i) 25% of Regeneron outstanding shares of Class A Stock and Common Stock (taken together) and (ii) the higher of (a) Sanofi’s percentage ownership of Class A Stock and Common Stock (taken together) on such
termination date and (b) the highest percentage ownership of Regeneron outstanding shares of Class A Stock and Common Stock (taken together) Sanofi attains following such termination date. As of December 31, 2018 Sanofi has sold 226,153 shares of Regeneron Stock to Regeneron pursuant to the 2018 Letter Agreement.
2/ Alliance arrangements with Bristol-Myers Squibb (BMS)
Two of Sanofi’s leading products were jointly developed with BMS: the anti-hypertensive agent irbesartan (Aprovel®/Avapro®/Karvea®) and the anti-atherothrombosis treatment clopidogrel bisulfate (Plavix®/Iscover®).
On September 27, 2012, Sanofi and BMS signed an agreement relating to their alliance following the loss of exclusivity of Plavix® and Avapro®/Avalide® in many major markets.
Under the terms of this agreement, effective January 1, 2013, BMS returned to Sanofi its rights to Plavix® and Avapro®/Avalide® in all markets worldwide with the exception of Plavix® in the United States and Puerto Rico, giving Sanofi sole control and freedom to operate commercially in respect of those products. In exchange, BMS received royalty payments on Sanofi’s sales of branded and unbranded Plavix® and Avapro®/Avalide® worldwide (except for Plavix® in the United States and Puerto Rico) until 2018, and also received a payment of $200 million from Sanofi in December 2018, part of which is for buying out the non-controlling interests (see Note D.18. to our consolidated financial statements). Rights to Plavix® in the United States and Puerto Rico remain unchanged and continue to be governed by the terms of the original agreement until December 2019.
In all of the territories managed by Sanofi (including the United States and Puerto Rico for Avapro®/Avalide®) as defined in the new agreement, Sanofi recognizes in its consolidated financial statements the revenue and expenses generated by its own operations. The share of profits reverting to BMS subsidiaries is presented within Net income attributable to non-controlling
interests in the income statement.
In the territory managed by BMS (United States and Puerto Rico for Plavix®), Sanofi recognizes its share of profits and losses within the line item Share of profit/(loss) from investments
accounted for using the equity method.
A.1.8. Impact of Exchange Rates
We report our consolidated financial statements in euros. Because we earn a significant portion of our revenues in countries where the euro is not the local currency, our results of operations can be significantly affected by exchange rate movements between the euro and other currencies, primarily the US dollar and, to a lesser extent, the Japanese yen, and currencies in emerging countries. We experience these effects even though certain of these countries do not account for a large portion of our net sales. In 2018, we earned 33.5% of our net sales in the United States. An increase in the value of the US dollar against the euro has a positive impact on both our
82 SANOFI / FORM 20-F 2018
ITEM 5. OPERATING AND FINANCIAL REVIEW AND PROSPECTS
revenues and our operating income. A decrease in the value of the US dollar against the euro has a negative impact on our revenues, which is not offset by an equal reduction in our costs and therefore negatively affects our operating income. A variation in the value of the US dollar has a particularly significant impact on our operating income, which is higher in the United States than elsewhere, and on the contribution to net income of our collaborations with Regeneron and BMS in the United States (see “– A.1.7. Financial Presentation of Alliances” above).
For a description of arrangements entered into to manage operating foreign exchange risks as well as our hedging policy, see “Item 11. Quantitative and Qualitative Disclosures about Market Risk”, and “Item 3. Key Information – D. Risk Factors – Risks Related to Financial Markets – Fluctuations in currency exchange rates could adversely affect our results of operations and financial condition”.
A.1.9. Divestments
On September 30, 2018, Sanofi finalized the divestment of Zentiva, its European Generics business, generating a pre-tax gain of €510 million euros in 2018.
On January 1, 2017, Sanofi and Boehringer Ingelheim (BI) finalized the strategic transaction agreed in June 2016, involving the exchange of our Animal Health business (Merial) for BI’s Consumer Healthcare business. After final enterprise value adjustments, the exchange values of the two businesses effectively transferred during 2017 were determined to be €10,557 million for Sanofi’s Animal Health business and €6,239 million for BI’s Consumer Healthcare business. The divestment of the Animal Health business generated an after-tax gain of €4,643 million in 2017.
At the end of December 2016, Sanofi Pasteur and MSD ended their European joint venture Sanofi Pasteur MSD (SPMSD). This transaction involved the divestment of Sanofi’s share in the joint venture and the acquisition of the vaccines portfolio that reverts to Sanofi. The consideration for the transfer was (i) a fixed sum of €127 million received on January 4, 2017 and (ii) contingent consideration based on a percentage of MSD sales during the 2017-2024 period of specified products previously distributed by SPMSD, and receivable in annual installments over the same period. As of December 31, 2016, the fair value of the contingent consideration was measured at €458 million and recognized in the “available-for-sale financial assets” category.
For further details about the divestments mentioned above, see Note D.1. and D.2. to our consolidated financial statements included at Item 18 of this annual report.
A.1.10. Acquisitions
Sanofi acquired Bioverativ Inc. (“Bioverativ”) on March 8, 2018 for $11.6 billion (€9.4 billion). The provisional purchase price allocation resulted in the recognition of goodwill amounting to €2,676 million. The contributions from Bioverativ to net sales and business operating income of the Pharmaceuticals segment in
2018 amount to €892 million and €389 million, respectively. Over the same period, Bioverativ made a negative contribution of €325 million to net profit, including expenses charged during the period relating to the fair value remeasurement of assets recognized at the acquisition date. During the year ended December 31, 2018, Bioverativ generated net sales of €1,068 million. The net cash outflow on this acquisition amounted to €8,932 million, and is recorded within Acquisitions
of consolidated undertakings and investments accounted
for using the equity method in the consolidated statements of cash flows.
Sanofi acquired Ablynx on May 14, 2018 for €3,897 million. The provisional purchase price allocation resulted in the recognition of goodwill amounting to €1,372 million. The impacts of this acquisition on Sanofi’s business operating income and consolidated net income for the year ended December 31, 2018 are not material. The net cash outflow on this acquisition amounted to €3,639 million, and is recorded within Acquisitions
of consolidated undertakings and investments accounted
for using the equity method in the consolidated statements of cash flows.
In 2018, Sanofi sold shares in the biopharmaceutical company Regeneron with a carrying amount of €24 million. Sanofi had acquired shares in Regeneron in 2017 (at a cost of €184 million) and in 2016 (at a cost of €115 million in 2016). Our investment in Regeneron had a carrying amount of €3,055 million as of December 31, 2018, compared with €2,496 million as of December 31, 2017 and €2,550 million as of December 31, 2016 (see Note D.1. to our consolidated financial statements). This represents an equity interest of 21.7% as of December 31, 2018, compared with 22.2% as of December 31, 2017 and 22.1% as of December 31, 2016.
In 2017, as part of the strategic transaction between Sanofi and Boehringer Ingelheim (BI), we acquired BI’s Consumer Healthcare business. The goodwill arising on that acquisition represents (i) the capacity to draw on a specialized structure to refresh the existing product portfolio; (ii) the competencies of the staff transferred to Sanofi; (iii) the benefits derived from the creation of new growth platforms; and (iv) the expected future synergies and other benefits from combining the CHC operations of BI and Sanofi. The tax-deductible portion of goodwill amounted to €1,876 million out of total goodwill of €2,222 million. This business generated sales of €1,407 million in the year ended December 31, 2017.
On August 25, 2017, Sanofi acquired 100% of Protein Sciences, a biotechnology company headquartered in Meriden, Connecticut (United States). The principal product of Protein Sciences is Flublok®, the only recombinant protein-based influenza vaccine approved by the FDA in the United States. The acquisition price included two contingent purchase consideration elements of €42 million each. The impacts of this acquisition on Sanofi’s business operating income and consolidated net income for the year ended December 31, 2017 were not material.
In 2016, as part of the dissolution of the Sanofi Pasteur MSD joint venture, we acquired the vaccines portfolio that reverts to us. The
SANOFI / FORM 20-F 2018 83
ITEM 5. OPERATING AND FINANCIAL REVIEW AND PROSPECTS
purchase price essentially comprised (i) a fixed sum of €154 million paid on January 4, 2017 and (ii) contingent consideration of €354 million based on a percentage of future sales made by Sanofi Pasteur during the 2017-2024 period of specified former SPMSD products, to be paid in installments over that period.
For further information about the acquisitions mentioned above, see Notes D.1. and D.2. to our consolidated financial statements included at Item 18 of this annual report.
A.1.11. Critical accounting and reporting policies
Our consolidated financial statements are affected by the accounting and reporting policies that we use. Certain of our accounting and reporting policies are critical to an understanding of our results of operations and financial condition, and in some cases the application of these critical policies can be significantly affected by the estimates, judgments and assumptions made by management during the preparation of our consolidated financial statements. The accounting and reporting policies that we have identified as fundamental to a full understanding of our results of operations and financial condition are the following:
1/ Revenue recognition
Our policies with respect to revenue recognition are discussed in Note B.13. to our consolidated financial statements included at Item 18 of this annual report. Revenue arising from the sale of goods is presented in the income statement within Net sales. Net sales comprise revenue from sales of pharmaceutical products, consumer healthcare products, active ingredients and vaccines, net of sales returns, of customer incentives and discounts, and of certain sales-based payments paid or payable to the healthcare authorities. In accordance with IFRS 15 (Revenue from Contracts with Customers), such revenue is recognized when Sanofi transfers control over the product to the customer. Control refers to the ability to direct the use of, and obtain substantially all of the remaining benefits from the products. For the vast majority of contracts, revenue is recognized when the product is physically transferred, in accordance with the delivery and acceptance terms agreed with the customer.
For contracts entered into by Sanofi Pasteur, transfer of control is usually determined by reference to the terms of release (immediate or deferred) and acceptance of batches of vaccine.
As regards contracts with distributors, Sanofi does not recognize revenue when the product is physically transferred to the distributor in case of products sold on consignment, or if the distributor acts as an agent. In such cases, revenue is recognized when control is transferred to the end customer and the distributor’s commission is presented within the line item Selling and general expenses in the income statement.
We offer various types of price reductions on our products. In particular, products sold in the United States are covered by various programs (such as Medicare and Medicaid) under which
products are sold at a discount. Rebates are granted to healthcare authorities, and under contractual arrangements with certain customers. Some wholesalers are entitled to chargeback incentives based on the selling price to the end customer, under specific contractual arrangements. Cash discounts may also be granted for prompt payment. The discounts, incentives and rebates described above are estimated on the basis of specific contractual arrangements with our customers or of specific terms of the relevant regulations and/or agreements applicable for transactions with healthcare authorities, and of assumptions about the attainment of sales targets. We also estimate the amount of sales returns, on the basis of contractual sales terms and reliable historical data. Discounts, incentives, rebates and sales returns are recognized in the period in which the underlying sales are recognized within Net Sales, as a reduction of gross sales. For additional details regarding the financial impact of discounts, incentives, rebates and sales returns, see Note D.23. to our consolidated financial statements included at Item 18 of this annual report.
Revenues from non-Sanofi products, mainly comprising royalty income from license arrangements and sales of non-Sanofi products by our US-based entity VaxServe, are presented within Other revenues.
2/ Business combinations
As discussed in Note B.3. “Business combinations and transactions with non-controlling interests” to our consolidated financial statements included at Item 18 of this annual report, business combinations are accounted for by the acquisition method. The acquiree’s identifiable assets and liabilities that satisfy the recognition criteria of IFRS 3 (Business Combinations) are measured initially at their fair values as at the acquisition date, except for (i) non-current assets classified as held for sale, which are measured at fair value less costs to sell and (ii) assets and liabilities that fall within the scope of IAS 12 (Income Taxes) and IAS 19 (Employee Benefits). Business combinations completed on or after January 1, 2010 are accounted for in accordance with the revised IFRS 3 and the revised IAS 27, (Consolidated and Individual Financial Statements), now superseded by IFRS 10 (Consolidated Financial Statements). In particular, contingent consideration payable to former owners agreed in a business combination, e.g. in the form of payments upon the achievement of certain R&D milestones, is recognized as a liability at fair value as of the acquisition date irrespective of the probability of payment. If the contingent consideration was originally recognized as a liability, subsequent adjustments to the liability are recognized in profit or loss (see Note D.18. “Liabilities related to business combinations and non-controlling interests” to our consolidated financial statements included at Item 18 of this annual report).
3/ Goodwill impairment and intangible assets
As discussed in Note B.6. “Impairment of property, plant and equipment, intangible assets, and investments accounted for using the equity method” and in Note D.5. “Impairment of
84 SANOFI / FORM 20-F 2018
ITEM 5. OPERATING AND FINANCIAL REVIEW AND PROSPECTS
intangible assets and property, plant and equipment” to our consolidated financial statements included at Item 18 of this annual report, we test our intangible assets for impairment periodically or when there is any internal or external indication of impairment. We test for impairment on the basis of the same objective criteria that were used for the initial valuation. Our initial valuation and ongoing tests are based on the relationship of the value of our projected future cash flows associated with the asset to either the purchase price of the asset (for its initial valuation) or the carrying amount of the asset (for ongoing tests). The determination of the underlying assumptions relating to the recoverability of intangible assets is subjective and requires the exercise of considerable judgment. Key assumptions relating to goodwill impairment and intangible assets are the perpetual growth rate and the post-tax discount rate. Any changes in key assumptions could result in an impairment charge. A sensitivity analysis to the key assumptions is disclosed in Note D.5. “Impairment of intangible assets and property, plant and equipment” to our consolidated financial statements included at Item 18 of this annual report.
4/ Contingent consideration receivable
As described in Note B.8.1 and D.7.2 to our consolidated financial statements included at Item 18 of this annual report, contingent consideration receivable such as earn-outs on disposals, for example in the form of a percentage of future sales of the acquirer, are recognized as an asset at fair value as of the date of divestment. Subsequent remeasurements of the fair value of the asset are recognized in profit or loss.
5/ Pensions and post-retirement benefits
As described in Note B.23. “Employee benefit obligations” to our consolidated financial statements included at Item 18 of this annual report, we recognize our pension and retirement benefit commitments as liabilities on the basis of an actuarial estimate of the rights vested in employees and retirees at the end of the reporting period, net of the fair value of plan assets held to meet these obligations. We prepare this estimate at least on an annual basis taking into account financial assumptions (such as discount rates) and demographic assumptions (such as life expectancy, retirement age, employee turnover, and the rate of salary increases).
We recognize all actuarial gains and losses (including the impact of a change in discount rate) immediately through equity. A sensitivity analysis to the discount rate is set forth in Note D.19.1. “Provisions for pensions and other benefits” to our consolidated financial statements included at Item 18 of this annual report.
Depending on the key assumptions used, the pension and post-retirement benefit expense could vary within a range of outcomes and have a material effect on reported earnings. A sensitivity analysis to these key assumptions is set forth in Note D.19.1. “Provisions for pensions and other benefits” to our consolidated financial statements included at Item 18 of this annual report.
6/ Deferred taxes
As discussed in Note B.22. “Income tax expense” to our consolidated financial statements included at Item 18 of this annual report, we recognize deferred income taxes on tax loss carry-forwards and on temporary differences between the tax base and carrying amount of assets and liabilities. We calculate our deferred tax assets and liabilities using enacted tax rates applicable for the years during which we estimate that the temporary differences are expected to reverse. We do not recognize deferred tax assets when it is more likely than not that the deferred tax assets will not be realized. The recognition of deferred tax assets is determined on the basis of profit forecasts for each tax group, and of the tax consequences of the strategic opportunities available to Sanofi.
7/ Provisions for risks
Sanofi and its subsidiaries and affiliates may be involved in litigation, arbitration or other legal proceedings. These proceedings typically are related to product liability claims, intellectual property rights, compliance and trade practices, commercial claims, employment and wrongful discharge claims, tax assessment claims, waste disposal and pollution claims, and claims under warranties or indemnification arrangements relating to business divestitures. As discussed in Note B.12. “Provisions for risks” at Item 18 of this annual report, we record a provision where we have a present obligation, whether legal or constructive, as a result of a past event; it is probable that an outflow of resources embodying economic benefits will be required to settle the obligation; and a reliable estimate can be made of the amount of the outflow of resources. For additional details regarding the financial impact of provisions for risks see Notes D.19.3. “Other provisions” and D.22. “Legal and Arbitral Proceedings” to our consolidated financial statements included at Item 18 of this annual report.
8/ Provisions for restructuring costs
Provisions for restructuring costs include early retirement benefits, compensation for early termination of contracts, and rationalization costs relating to restructured sites. Refer to Note D.19.2 to our consolidated financial statements included in Item 18 of this annual report.
Provisions are estimated on the basis of events and circumstances related to present obligations at the end of the reporting period and of past experience, and to the best of management’s knowledge at the date of preparation of the financial statements. The assessment of provisions can involve a series of complex judgments about future events and can rely heavily on estimates and assumptions. Given the inherent uncertainties related to these estimates and assumptions, the actual outflows resulting from the realization of those risks could differ from our estimates.
SANOFI / FORM 20-F 2018 85
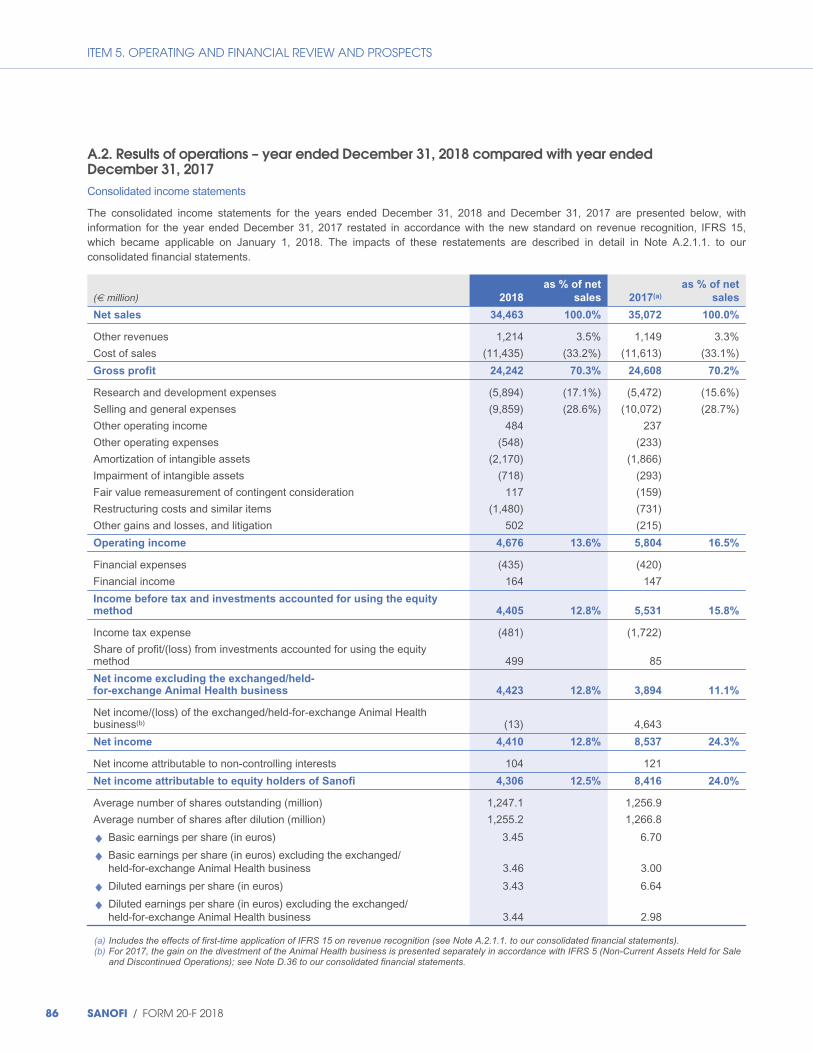
ITEM 5. OPERATING AND FINANCIAL REVIEW AND PROSPECTS
A.2. Results of operations – year ended December 31, 2018 compared with year ended December 31, 2017 Consolidated income statements
The consolidated income statements for the years ended December 31, 2018 and December 31, 2017 are presented below, with information for the year ended December 31, 2017 restated in accordance with the new standard on revenue recognition, IFRS 15, which became applicable on January 1, 2018. The impacts of these restatements are described in detail in Note A.2.1.1. to our consolidated financial statements.
(€ million) 2018
as % of net
sales 2017(a)
as % of net
sales
Net sales 34,463 100.0% 35,072 100.0%
Other revenues 1,214 3.5% 1,149 3.3%
Cost of sales (11,435) (33.2%) (11,613) (33.1%)
Gross profit 24,242 70.3% 24,608 70.2%
Research and development expenses (5,894) (17.1%) (5,472) (15.6%)
Selling and general expenses (9,859) (28.6%) (10,072) (28.7%)
Other operating income 484 237
Other operating expenses (548) (233)
Amortization of intangible assets (2,170) (1,866)
Impairment of intangible assets (718) (293)
Fair value remeasurement of contingent consideration 117 (159)
Restructuring costs and similar items (1,480) (731)
Other gains and losses, and litigation 502 (215)
Operating income 4,676 13.6% 5,804 16.5%
Financial expenses
Financial income
(435)
164
(420)
147
Income before tax and investments accounted for using the equity method 4,405 12.8% 5,531 15.8%
Income tax expense
Share of profit/(loss) from investments accounted for using the equity method
(481)
499
(1,722)
85
Net income excluding the exchanged/held- for-exchange Animal Health business 4,423 12.8% 3,894 11.1%
Net income/(loss) of the exchanged/held-for-exchange Animal Health business(b) (13) 4,643
Net income 4,410 12.8% 8,537 24.3%
Net income attributable to non-controlling interests 104 121
Net income attributable to equity holders of Sanofi 4,306 12.5% 8,416 24.0%
Average number of shares outstanding (million)
Average number of shares after dilution (million)
1,247.1
1,255.2
1,256.9
1,266.8
◆ Basic earnings per share (in euros) 3.45 6.70
◆ Basic earnings per share (in euros) excluding the exchanged/held-for-exchange Animal Health business 3.46 3.00
◆ Diluted earnings per share (in euros) 3.43 6.64
◆ Diluted earnings per share (in euros) excluding the exchanged/held-for-exchange Animal Health business 3.44 2.98
(a) Includes the effects of first-time application of IFRS 15 on revenue recognition (see Note A.2.1.1. to our consolidated financial statements). (b) For 2017, the gain on the divestment of the Animal Health business is presented separately in accordance with IFRS 5 (Non-Current Assets Held for Sale
and Discontinued Operations); see Note D.36 to our consolidated financial statements.
86 SANOFI / FORM 20-F 2018

ITEM 5. OPERATING AND FINANCIAL REVIEW AND PROSPECTS
A.2.1. Net Sales
Information regarding net sales for the year ended December 31, 2017 as presented in this section has been restated in accordance with the new standard on revenue recognition, IFRS 15, which became applicable on January 1, 2018. The impacts of these restatements are described in detail in Note A.2.1.1. to our consolidated financial statements.
Consolidated net sales for the year ended December 31, 2018 amounted to €34,463 million, 1.7% lower than in 2017. Exchange rate fluctuations had a negative effect of 4.2 percentage points overall, due mainly to unfavorable trends in the exchange rate for the euro against the US dollar, Argentinean peso, Brazilian real and Turkish lira. The unfavorable impact of
the Argentinean peso was €196 million, including the effects of applying hyperinflation accounting from July 1, 2018 onwards (see Note A.4. to our consolidated financial statements) and the effects of devaluation on our Argentinean subsidiaries relative to 2017.
At constant exchange rates (CER), net sales rose by 2.5%, reflecting the acquisition of Bioverativ’s rare blood disorder products. At constant exchange rates and on a constant structure basis (CER/CS), net sales grew by 0.6%. Lower sales in Diabetes in the United States and for Established Prescription Products in mature markets were offset by the performance of Dupixent® and the Rare Diseases franchise, and more generally by increased sales in Emerging Markets.
Reconciliation of net sales to net sales at constant exchange rates and on a constant structure basis
(€ million) 2018 2017(a) Change
Net sales 34,463 35,072 -1.7%
Effect of exchange rates 1,492
Net sales at constant exchange rates 35,955 35,072 +2.5%
Impact of changes in structure (Bioverativ and Zentiva) 664
Net sales at constant exchange rates and on a constant structure basis 35,955 35,736 +0.6%
(a) Includes the effects of first-time application of IFRS 15 on revenue recognition (see Note A.2.1.1. to our consolidated financial statements).
When we refer to changes in our net sales at constant exchange rates (CER), that means that we have excluded the effect of exchange rates by recalculating net sales for the relevant period using the exchange rates that were used for the previous period.
When we refer to changes in our net sales on a constant structure (CS) basis, that means that we eliminate the effect of changes in structure by restating the net sales for the previous period as follows:
◆ by including sales generated by entities or product rights acquired in the current period for a portion of the previous period equal to the portion of the current period during which
we owned them, based on sales information we receive from the party from whom we make the acquisition;
◆ similarly, by excluding sales for a portion of the previous period when we have sold an entity or rights to a product in the current period; and
◆ for a change in consolidation method, by recalculating the previous period on the basis of the method used for the current period.
To facilitate analysis and comparisons with prior periods, some figures are given at constant exchange rates and on a constant structure basis (CER/CS).
Analysis of impact on net sales of changes in structure
(€ million) 2017
Net sales of Bioverativ(a) 828
Net sales of Zentiva (European Generics business)(b) (164)
Total impact on net sales of changes in structure 664
(a) Net sales of Bioverativ products (consolidated from March 8, 2018) for the period from March 9, 2017 through December 31, 2017. (b) Net sales of Zentiva (European Generics business), divested on September 30, 2018, for the period from October 1, 2017 through December 31, 2017.
SANOFI / FORM 20-F 2018 87

ITEM 5. OPERATING AND FINANCIAL REVIEW AND PROSPECTS
1/ Net Sales by Operating Segment
Our net sales comprise the net sales generated by our Pharmaceuticals, Consumer Healthcare and Vaccines segments.
(€ million) 2018 2017(a) Change
Pharmaceuticals 24,685 25,173 -1.9%
Consumer Healthcare 4,660 4,798 -2.9%
Vaccines 5,118 5,101 +0.3%
Net sales 34,463 35,072 -1.7%
(a) Includes the effects of first-time application of IFRS 15 on revenue recognition (see Note A.2.1.1. to our consolidated financial statements).
2/ Net Sales by Global Business Unit (GBU)
The table below presents net sales for our Global Business Units (GBUs). Note that Emerging Markets sales of Diabetes & Cardiovascular and Specialty Care products are included in the General Medicines & Emerging Markets GBU.
(€ million) 2018 2017(a)
Change on
a reported
basis
Change at
constant
exchange
rates
Sanofi Genzyme (Specialty Care) GBU(b)(c) 7,226 5,674 +27.4% +30.8%
Diabetes & Cardiovascular GBU(b) 4,511 5,399 -16.4% -13.8%
General Medicines & Emerging Markets GBU(d)(e) 12,948 14,100 -8.2% -2.8%
Total Pharmaceuticals 24,685 25,173 -1.9% +2.4%
Consumer Healthcare GBU 4,660 4,798 -2.9% +3.0%
Sanofi Pasteur (Vaccines) GBU 5,118 5,101 +0.3% +2.4%
Total net sales 34,463 35,072 -1.7% +2.5%
(a) Includes the effects of first-time application of IFRS 15 on revenue recognition (see Note A.2.1.1. to our consolidated financial statements). (b) Does not include Emerging Markets net sales. (c) Rare Diseases, Multiple Sclerosis, Oncology and Immunology, and Rare Blood Disorder. (d) Includes net sales in Emerging Markets of Specialty Care and Diabetes & Cardiovascular products. (e) Emerging Markets: World excluding United States, Canada, Europe (apart from Eurasia: Russia, Ukraine, Georgia, Belarus, Armenia and Turkey), Japan,
South Korea, Australia, New Zealand and Puerto Rico.
New GBUs
We have announced our intention to adjust the structure of two of our GBUs with effect from January 1, 2019, so as to refocus our operations in mature and emerging markets. This involves creating a new Primary Care GBU that combines the product portfolio of the former Diabetes & Cardiovascular GBU with the
Established Products portfolio previously contained in the former General Medicines & Emerging Markets GBU. The new Primary Care GBU will focus exclusively on mature markets. We have also created a second GBU: China and Emerging Markets. This new GBU will focus on the specific characteristics and growth potential of emerging markets and especially China, which is our second-largest market after the United States.
To give investors a better understanding of the presentation of our net sales from 2019 onwards, the table below provides a breakdown of our 2018 net sales based on this new structure:
(€ million) 2018
Sanofi Genzyme (Specialty Care) GBU 7,226
Primary Care GBU 10,406
China & Emerging Markets GBU 7,053
Total Pharmaceuticals 24,685
Consumer Healthcare GBU 4,660
Sanofi Pasteur (Vaccines) GBU 5,118
Total net sales 34,463
88 SANOFI / FORM 20-F 2018
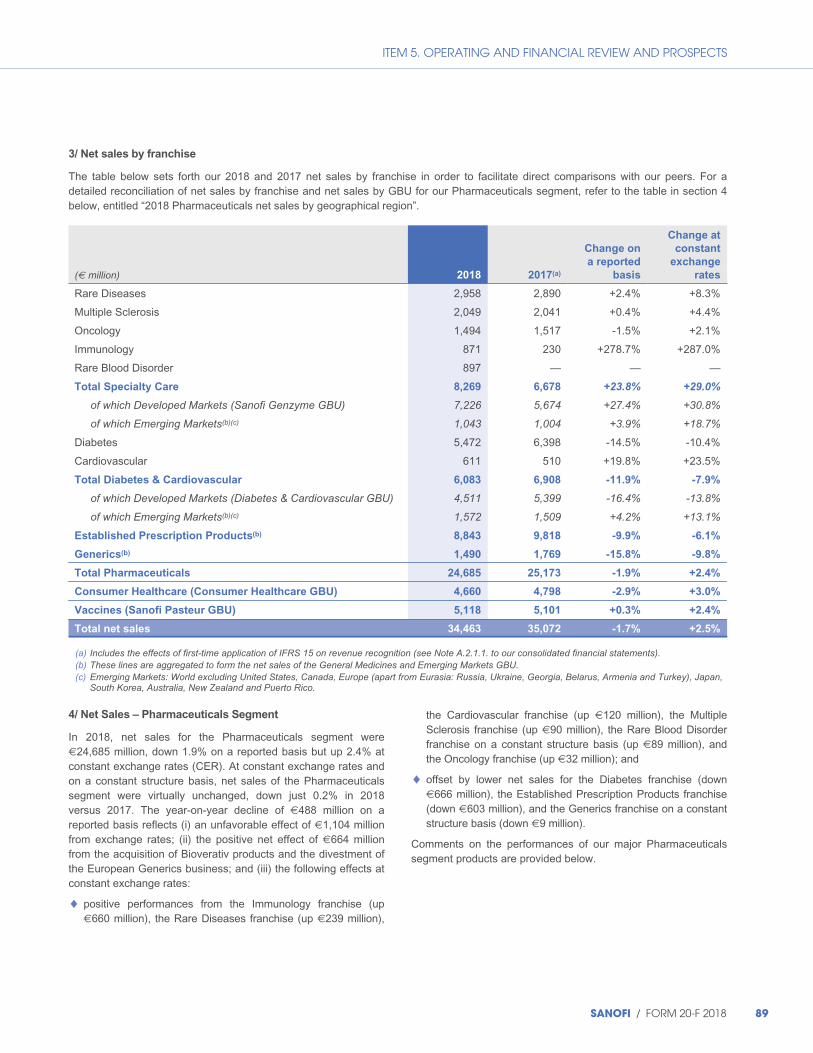
ITEM 5. OPERATING AND FINANCIAL REVIEW AND PROSPECTS
3/ Net sales by franchise
The table below sets forth our 2018 and 2017 net sales by franchise in order to facilitate direct comparisons with our peers. For a detailed reconciliation of net sales by franchise and net sales by GBU for our Pharmaceuticals segment, refer to the table in section 4 below, entitled “2018 Pharmaceuticals net sales by geographical region”.
(€ million) 2018 2017(a)
Change on
a reported
basis
Change at
constant
exchange
rates
Rare Diseases 2,958 2,890 +2.4% +8.3%
Multiple Sclerosis 2,049 2,041 +0.4% +4.4%
Oncology 1,494 1,517 -1.5% +2.1%
Immunology 871 230 +278.7% +287.0%
Rare Blood Disorder 897 — — —
Total Specialty Care 8,269 6,678 +23.8% +29.0%
of which Developed Markets (Sanofi Genzyme GBU) 7,226 5,674 +27.4% +30.8%
of which Emerging Markets(b)(c) 1,043 1,004 +3.9% +18.7%
Diabetes 5,472 6,398 -14.5% -10.4%
Cardiovascular 611 510 +19.8% +23.5%
Total Diabetes & Cardiovascular 6,083 6,908 -11.9% -7.9%
of which Developed Markets (Diabetes & Cardiovascular GBU) 4,511 5,399 -16.4% -13.8%
of which Emerging Markets(b)(c) 1,572 1,509 +4.2% +13.1%
Established Prescription Products(b) 8,843 9,818 -9.9% -6.1%
Generics(b) 1,490 1,769 -15.8% -9.8%
Total Pharmaceuticals 24,685 25,173 -1.9% +2.4%
Consumer Healthcare (Consumer Healthcare GBU) 4,660 4,798 -2.9% +3.0%
Vaccines (Sanofi Pasteur GBU) 5,118 5,101 +0.3% +2.4%
Total net sales 34,463 35,072 -1.7% +2.5%
(a) Includes the effects of first-time application of IFRS 15 on revenue recognition (see Note A.2.1.1. to our consolidated financial statements). (b) These lines are aggregated to form the net sales of the General Medicines and Emerging Markets GBU. (c) Emerging Markets: World excluding United States, Canada, Europe (apart from Eurasia: Russia, Ukraine, Georgia, Belarus, Armenia and Turkey), Japan,
South Korea, Australia, New Zealand and Puerto Rico.
4/ Net Sales – Pharmaceuticals Segment
In 2018, net sales for the Pharmaceuticals segment were €24,685 million, down 1.9% on a reported basis but up 2.4% at constant exchange rates (CER). At constant exchange rates and on a constant structure basis, net sales of the Pharmaceuticals segment were virtually unchanged, down just 0.2% in 2018 versus 2017. The year-on-year decline of €488 million on a reported basis reflects (i) an unfavorable effect of €1,104 million from exchange rates; (ii) the positive net effect of €664 million from the acquisition of Bioverativ products and the divestment of the European Generics business; and (iii) the following effects at constant exchange rates:
◆ positive performances from the Immunology franchise (up €660 million), the Rare Diseases franchise (up €239 million),
the Cardiovascular franchise (up €120 million), the Multiple Sclerosis franchise (up €90 million), the Rare Blood Disorder franchise on a constant structure basis (up €89 million), and the Oncology franchise (up €32 million); and
◆ offset by lower net sales for the Diabetes franchise (down €666 million), the Established Prescription Products franchise (down €603 million), and the Generics franchise on a constant structure basis (down €9 million).
Comments on the performances of our major Pharmaceuticals segment products are provided below.
SANOFI / FORM 20-F 2018 89
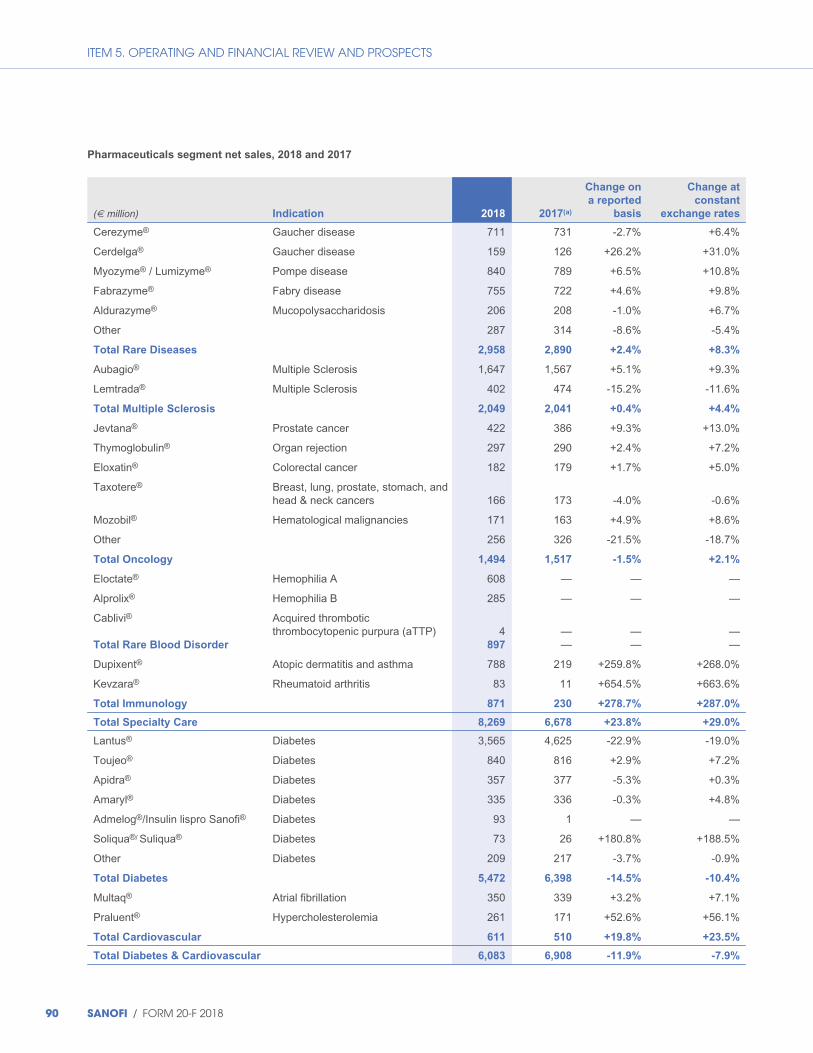
ITEM 5. OPERATING AND FINANCIAL REVIEW AND PROSPECTS
Pharmaceuticals segment net sales, 2018 and 2017
(€ million) Indication 2018 2017(a)
Change on
a reported
basis
Change at
constant
exchange rates
Cerezyme® Gaucher disease 711 731 -2.7% +6.4%
Cerdelga® Gaucher disease 159 126 +26.2% +31.0%
Myozyme® / Lumizyme® Pompe disease 840 789 +6.5% +10.8%
Fabrazyme® Fabry disease 755 722 +4.6% +9.8%
Aldurazyme® Mucopolysaccharidosis 206 208 -1.0% +6.7%
Other 287 314 -8.6% -5.4%
Total Rare Diseases 2,958 2,890 +2.4% +8.3%
Aubagio® Multiple Sclerosis 1,647 1,567 +5.1% +9.3%
Lemtrada® Multiple Sclerosis 402 474 -15.2% -11.6%
Total Multiple Sclerosis 2,049 2,041 +0.4% +4.4%
Jevtana® Prostate cancer 422 386 +9.3% +13.0%
Thymoglobulin® Organ rejection 297 290 +2.4% +7.2%
Eloxatin® Colorectal cancer 182 179 +1.7% +5.0%
Taxotere® Breast, lung, prostate, stomach, and head & neck cancers 166 173 -4.0% -0.6%
Mozobil® Hematological malignancies 171 163 +4.9% +8.6%
Other 256 326 -21.5% -18.7%
Total Oncology 1,494 1,517 -1.5% +2.1%
Eloctate® Hemophilia A 608 — — —
Alprolix® Hemophilia B 285 — — —
Cablivi®
Total Rare Blood Disorder
Acquired thrombotic thrombocytopenic purpura (aTTP)
4 897
— —
— —
— —
Dupixent® Atopic dermatitis and asthma 788 219 +259.8% +268.0%
Kevzara® Rheumatoid arthritis 83 11 +654.5% +663.6%
Total Immunology 871 230 +278.7% +287.0%
Total Specialty Care 8,269 6,678 +23.8% +29.0%
Lantus® Diabetes 3,565 4,625 -22.9% -19.0%
Toujeo® Diabetes 840 816 +2.9% +7.2%
Apidra® Diabetes 357 377 -5.3% +0.3%
Amaryl® Diabetes 335 336 -0.3% +4.8%
Admelog®/Insulin lispro Sanofi® Diabetes 93 1 — —
Soliqua®/ Suliqua® Diabetes 73 26 +180.8% +188.5%
Other Diabetes 209 217 -3.7% -0.9%
Total Diabetes 5,472 6,398 -14.5% -10.4%
Multaq® Atrial fibrillation 350 339 +3.2% +7.1%
Praluent® Hypercholesterolemia 261 171 +52.6% +56.1%
Total Cardiovascular 611 510 +19.8% +23.5%
Total Diabetes & Cardiovascular 6,083 6,908 -11.9% -7.9%
90 SANOFI / FORM 20-F 2018
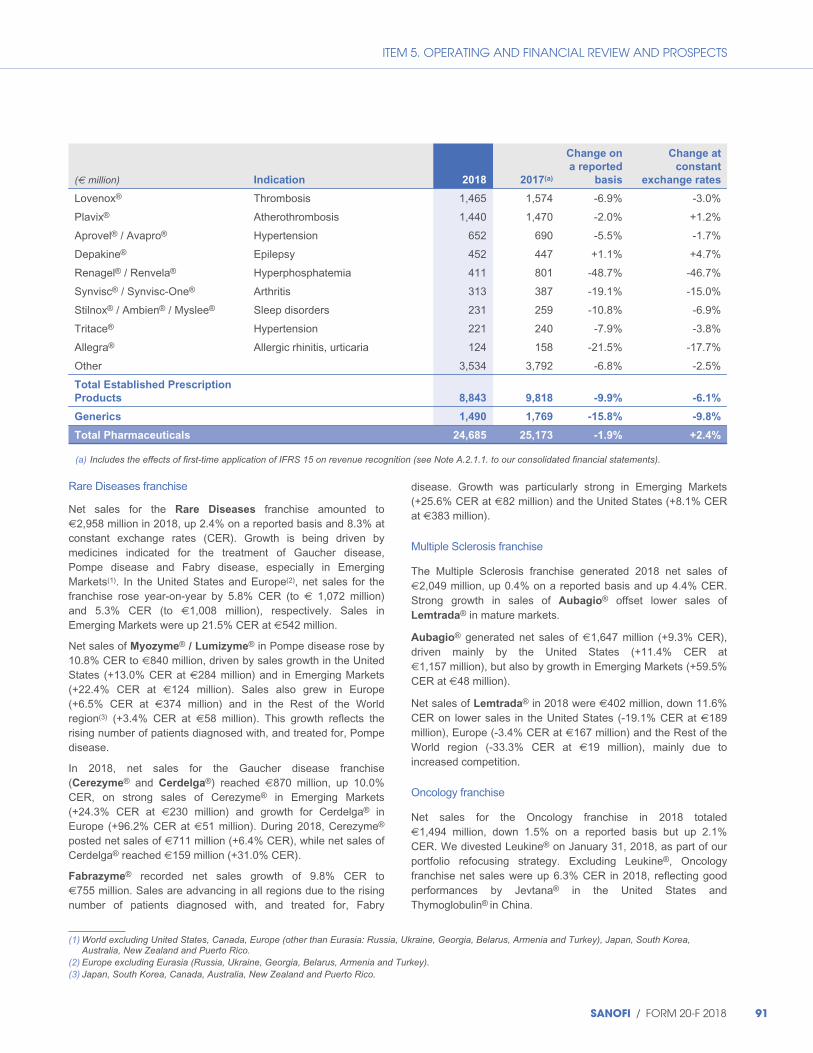
ITEM 5. OPERATING AND FINANCIAL REVIEW AND PROSPECTS
(€ million) Indication 2018 2017(a)
Change on
a reported
basis
Change at
constant
exchange rates
Lovenox® Thrombosis 1,465 1,574 -6.9% -3.0%
Plavix® Atherothrombosis 1,440 1,470 -2.0% +1.2%
Aprovel® / Avapro® Hypertension 652 690 -5.5% -1.7%
Depakine® Epilepsy 452 447 +1.1% +4.7%
Renagel® / Renvela® Hyperphosphatemia 411 801 -48.7% -46.7%
Synvisc® / Synvisc-One® Arthritis 313 387 -19.1% -15.0%
Stilnox® / Ambien® / Myslee® Sleep disorders 231 259 -10.8% -6.9%
Tritace® Hypertension 221 240 -7.9% -3.8%
Allegra® Allergic rhinitis, urticaria 124 158 -21.5% -17.7%
Other 3,534 3,792 -6.8% -2.5%
Total Established Prescription
Products 8,843 9,818 -9.9% -6.1%
Generics 1,490 1,769 -15.8% -9.8%
Total Pharmaceuticals 24,685 25,173 -1.9% +2.4%
(a) Includes the effects of first-time application of IFRS 15 on revenue recognition (see Note A.2.1.1. to our consolidated financial statements).
Rare Diseases franchise
Net sales for the Rare Diseases franchise amounted to €2,958 million in 2018, up 2.4% on a reported basis and 8.3% at constant exchange rates (CER). Growth is being driven by medicines indicated for the treatment of Gaucher disease, Pompe disease and Fabry disease, especially in Emerging Markets(1). In the United States and Europe(2), net sales for the franchise rose year-on-year by 5.8% CER (to € 1,072 million) and 5.3% CER (to €1,008 million), respectively. Sales in Emerging Markets were up 21.5% CER at €542 million.
Net sales of Myozyme® / Lumizyme® in Pompe disease rose by 10.8% CER to €840 million, driven by sales growth in the United States (+13.0% CER at €284 million) and in Emerging Markets (+22.4% CER at €124 million). Sales also grew in Europe (+6.5% CER at €374 million) and in the Rest of the World region(3) (+3.4% CER at €58 million). This growth reflects the rising number of patients diagnosed with, and treated for, Pompe disease.
In 2018, net sales for the Gaucher disease franchise
(Cerezyme® and Cerdelga®) reached €870 million, up 10.0% CER, on strong sales of Cerezyme® in Emerging Markets (+24.3% CER at €230 million) and growth for Cerdelga® in Europe (+96.2% CER at €51 million). During 2018, Cerezyme® posted net sales of €711 million (+6.4% CER), while net sales of Cerdelga® reached €159 million (+31.0% CER).
Fabrazyme® recorded net sales growth of 9.8% CER to €755 million. Sales are advancing in all regions due to the rising number of patients diagnosed with, and treated for, Fabry
disease. Growth was particularly strong in Emerging Markets (+25.6% CER at €82 million) and the United States (+8.1% CER at €383 million).
Multiple Sclerosis franchise
The Multiple Sclerosis franchise generated 2018 net sales of €2,049 million, up 0.4% on a reported basis and up 4.4% CER. Strong growth in sales of Aubagio® offset lower sales of Lemtrada® in mature markets.
Aubagio® generated net sales of €1,647 million (+9.3% CER), driven mainly by the United States (+11.4% CER at €1,157 million), but also by growth in Emerging Markets (+59.5% CER at €48 million).
Net sales of Lemtrada® in 2018 were €402 million, down 11.6% CER on lower sales in the United States (-19.1% CER at €189 million), Europe (-3.4% CER at €167 million) and the Rest of the World region (-33.3% CER at €19 million), mainly due to increased competition.
Oncology franchise
Net sales for the Oncology franchise in 2018 totaled €1,494 million, down 1.5% on a reported basis but up 2.1% CER. We divested Leukine® on January 31, 2018, as part of our portfolio refocusing strategy. Excluding Leukine®, Oncology franchise net sales were up 6.3% CER in 2018, reflecting good performances by Jevtana® in the United States and Thymoglobulin® in China.
(1) World excluding United States, Canada, Europe (other than Eurasia: Russia, Ukraine, Georgia, Belarus, Armenia and Turkey), Japan, South Korea, Australia, New Zealand and Puerto Rico.
(2) Europe excluding Eurasia (Russia, Ukraine, Georgia, Belarus, Armenia and Turkey). (3) Japan, South Korea, Canada, Australia, New Zealand and Puerto Rico.
SANOFI / FORM 20-F 2018 91
ITEM 5. OPERATING AND FINANCIAL REVIEW AND PROSPECTS
Jevtana® reported 2018 net sales of €422 million, up 13.0% CER, mainly on sales growth in the United States (+17.6% CER at €179 million), though sales were also stronger in Europe (+7.4% CER at €158 million) and Japan (+19.6% CER at €54 million).
Net sales of Thymoglobulin® advanced by 7.2% CER to €297 million, largely on a good performance in Emerging Markets (+22.7% CER at €75 million), especially China (+33.% CER at €39 million). Eloxatin® experienced similar trends, with net sales up 5.0% CER at €182 million, generated mainly in Emerging Markets (+6.8% CER at €150 million), particularly China (+17.5% CER at €118 million).
In September 2018, Libtayo® (cemiplimab, developed in collaboration with Regeneron) was approved in the United States for patients with metastatic cutaneous squamous cell carcinoma (CSCC) or locally advanced CSCC who are not candidates for curative surgery or curative radiation. Libtayo® is the only treatment for advanced CSCC to have been approved by the FDA. Sales of this product in the United States are consolidated by Regeneron under the terms of our alliance with Regeneron; see Note C.1, “Alliance Arrangements with Regeneron Pharmaceuticals, Inc.” to our consolidated financial statements.
Rare Blood Disorder franchise
Our Rare Blood Disorder franchise was created in 2018 following two acquisitions. The first was the acquisition of Bioverativ, which added two products to our portfolio: the flagship hemophilia treatments Eloctate® and Alprolix®. This was followed by the acquisition of Ablynx, enhancing our portfolio with the addition of Cablivi® (caplacizumab), which received marketing approval from the European Commission in September 2018 in the treatment of acquired thrombotic thrombocytopenic purpura (aTTP).
Net sales for the Rare Blood Disorder franchise have been consolidated by Sanofi since March 9, 2018, and in the period from that date to December 31, 2018 amounted to €897 million, including €175 million of non-US sales (mainly in Japan). At constant exchange rates and on a constant structure basis, the sales of the franchise grew by 10.7%.
Consolidated sales of Eloctate®, indicated in the treatment of hemophilia A, reached €608 million. At constant exchange rates and on a constant structure basis, that represents growth of 12.5%. This was mainly a result of sales growth in the United States, Japan and Australia, more than offsetting lower sales in Canada due to a failed tender bid.
Consolidated sales of the hemophilia B treatment Alprolix® reached €285 million. At constant exchange rates and on a constant structure basis, that represents growth of 5.8%.
Cablivi® was launched in Germany, its first-ever market, in the last quarter of 2018. The product is also on sale in France under a temporary license for use issued by the healthcare authorities. A temporary license for use allows specialty pharmaceutical products to be used in exceptional circumstances without marketing approval, and may be issued for a product that treats a
serious or rare condition for which there is no appropriate treatment available in the market. In those two countries, the product generated net sales of €4 million.
Immunology franchise
Dupixent® (developed in collaboration with Regeneron) was launched in the United States in April 2017 for moderate-to-severe atopic dermatitis in adults, and in Germany in December 2017. Further launches followed in 2018 in many European countries, Emerging Markets countries, and Japan. Net sales of Dupixent® reached €788 million in 2018, of which €660 million was generated in the United States, where sales were 213.9% higher CER than in 2017. In October 2018, Dupixent® was approved in the United States for moderate-to-severe asthma in adults.
Kevzara® (developed in collaboration with Regeneron) was launched as a rheumatoid arthritis treatment in the United States in June 2017; in Germany, the United Kingdom and the Netherlands in the second half of 2017; and in Japan and many European Union countries in 2018. Net sales of Kevzara® in 2018 amounted to €83 million, of which €64 million was generated in the United States.
Diabetes franchise
Net sales for the Diabetes franchise totaled €5,472 million in 2018, down 14.5% on a reported basis and 10.4% at constant exchange rates. This reflects a decline in sales for the franchise in the United States (-26.9% CER at €2,185 million), especially of insulin glargines (Lantus® and Toujeo®) as a result of changes to Medicare Part D welfare program cover and the ongoing decline in average net prices for insulin glargines in the United States. Elsewhere in the world, net sales for the Diabetes franchise rose in Emerging Markets (+12.7% CER at €1,554 million) and fell slightly in Europe (-0.9% CER at €1,272 million) and in the Rest of the World region (-0.8% CER at €461 million), where good performances from Toujeo® nearly offset lower sales of Lantus®.
Over 2018, net sales of our insulin glargines (Lantus® and Toujeo®) were down 19.0% on a reported basis and 15.1% CER at €4,405 million.
Net sales of Lantus® in 2018 were down 19.0% CER at €3,565 million. In the United States, sales were down 33.3% CER at €1,614 million, for the reasons explained above. Net sales in Europe decreased by 9.7% CER to €684 million, due largely to the launch of a biosimilar of Lantus® and the switching of patients to Toujeo®. In Emerging Markets, sales of Lantus® advanced by 5.3% CER to €977 million. Following Merck’s decision not to commercialize its insulin glargine in the United States and the filing by Merck of motions to dismiss the insulin glargine pen and vial pending legal actions, on October 26, 2018 Sanofi and Merck filed joint requests with the District Courts for the districts of Delaware and New Jersey to discontinue the pending litigation. The courts accepted those requests in October 2018 (Delaware) and
92 SANOFI / FORM 20-F 2018
ITEM 5. OPERATING AND FINANCIAL REVIEW AND PROSPECTS
November 2018 (New Jersey), and the cases are now closed (for further information, refer to “– Item 8.A. – Consolidated Financial Statements and Other Financial Information – Information on Legal or Arbitration Proceedings”).
In 2018, Toujeo® posted net sales of €840 million, up 7.2% CER, driven by strong performances in Europe (+34.6% at €290 million) and Emerging Markets (+83.5% at €130 million). However sales fell in the United States (-20.7% CER at €344 million), mainly as a result of a decrease in the average net selling price.
We expect a further decline in net selling prices for our insulin glargines in 2019, as we offer further rebates in the United States in order to maintain broad coverage by commercial insurers and Medicare. From 2015 to 2018 net sales for the Diabetes franchise have decreased at an annualized average rate of 7.4% CER, in line with our previously-announced guidance of a 6%-8% annualized average decrease over that period.
Net sales of Apidra® were stable year-on-year in 2018 at €357 million (+0.3% CER). Lower sales in the United States (-23.5% CER at €74 million) were compensated for by sales growth in Emerging Markets (+26.5% CER at €109 million).
Amaryl® posted net sales growth of 4.8% CER to €335 million in 2018. Higher sales in Emerging Markets (+9.4% CER at €288 million) offset a decrease in the Rest of the World region (-16.7% CER at €28 million) and Europe (-19.0% CER at €17 million).
Admelog® (injectable insulin lispro 100 units/ml, in vials or the pre-filled SoloStar® pen) was launched in 2018 in the United States, and also as a biosimilar in some European countries under the name Insulin lispro Sanofi®. The product generated net sales of €93 million in 2018, including €86 million in the United States as a result of its being accepted onto the Managed Medicaid program.
Soliqua® 100/33 and Suliqua® (insulin glargine 100 units/ml and lixisenatide 33 mcg/ml injectable) were launched (respectively) in the United States in January 2017, and in various European and Emerging Markets countries during the rest of 2017. The product generated net sales of €73 million, including €62 million in the United States.
Cardiovascular franchise
Net sales of Praluent® (developed in collaboration with Regeneron) increased by 56.1% CER to €261 million in 2018, including €154 million in the United States (+37.1% CER) and €86 million in Europe (+87.0% CER). During 2018, Sanofi and Regeneron negotiated with US payers to streamline the reimbursement criteria in order to improve patient access to the product, in exchange for a significant price reduction.
Net sales of Multaq® in 2018 were €350 million, up 7.1% CER on 2017. Sales were generated primarily in the United States (net sales of €296 million, +8.0% CER) and in Europe (€43 million, +2.4% CER).
Established Prescription Products
Net sales of Established Prescription Products in 2018 amounted to €8,843 million, down 9.9% on a reported basis and 6.1%
CER. Stronger sales in Emerging Markets (+6.6% CER at €3,753 million) failed to offset lower net sales in mature markets (-14.1% CER at €5,090 million). In the United States for example, the franchise saw net sales fall by 38.2% CER to €751 million, mainly due to generic competition for Renvela®/Renagel® (sevelamer). In the Rest of the World region, net sales were down 16.9% CER at €1,009 million, largely as a result of competition from generics of Plavix® and Aprovel® in Japan. In Europe, the franchise posted net sales of €3,330 million, down 4.4% CER, impacted by generic competition for Lovenox®.
Net sales of Lovenox® totaled €1,465 million, down 3.0% CER; this reflects tougher competition in Europe (-8.3% CER at €870 million) with the arrival of biosimilars in various countries including Germany, France, Italy, Poland and the United Kingdom. The impact of generic competition is also being felt in the United States, where the product saw net sales decrease by 29.3% CER to €38 million. A strong performance in Emerging Markets (+11.4% CER at €476 million) failed to fully offset the decline in mature markets.
Plavix® posted 2018 net sales of €1,440 million (+1.2% CER). This reflects a solid performance in Emerging Markets (+8.8% at €1,075 million), especially in China (+10.6% CER at €817 million), more than offsetting the effect of lower sales in the Rest of the World region (-23.5% at €218 million), especially in Japan (-31.5% CER at €156 million) due to competition from generics. Sales of Plavix® in the United States and Puerto Rico are handled by BMS under the terms of the Sanofi-BMS alliance; see Note C.2. (“Alliance Arrangements with Bristol-Myers Squibb (BMS)”) to our consolidated financial statements.
In 2018, net sales of Aprovel® /Avapro® amounted to €652 million, down 1.7% CER, reflecting competition from generics in Japan (-66.3% CER at €28 million) and Europe (-6.1% CER at €108 million). The effect was partly offset by stronger sales in Emerging Markets (+12.7% CER at €465 million), especially China (+15.5% CER at €297 million).
Net sales of Renvela®/Renagel® in 2018 were €411 million, down 46.7% CER, mainly due to competition from generics in the United States (-59.1% CER at €253 million).
Generics
Net sales of Generics were €1,490 million, down 15.8% on a reported basis and 9.8% CER. The main reason for the decrease was the sale of our European Generics business (Zentiva) to Advent International on September 30, 2018. This divestment was in line with our strategy of streamlining and refocusing our operations.
At constant exchange rates and on a constant structure basis, Generics net sales were relatively stable, falling by just 0.6%. Higher sales in Emerging Markets (+3.0% CER at €685 million) and the Rest of the World region (+9.1% CER at €113 million), especially in Japan, failed to fully offset lower sales in Europe (-15.3% CER at €124 million) and the United States (-3.2% at constant exchange rates and on a constant structure basis at €568 million).
SANOFI / FORM 20-F 2018 93

ITEM 5. OPERATING AND FINANCIAL REVIEW AND PROSPECTS
2018 Pharmaceuticals net sales by geographical region
(€ million) Total GBU Europe(a)
Change at CER
United States
Change at CER
Rest of the
World(b) Change at CER
Emerging Markets(c)
Change at CER
Total Franchise
Change at CER
Cerezyme® 481 270 -3.6% 174 +2.8% 37 -9.3% 230 +24.3% 711 +6.4%
Cerdelga® 156 51 +96.2% 98 +7.4% 7 +100.0% 3 +300.0% 159 +31.0%
Myozyme® /Lumizyme® 716 374 +6.5% 284 +13.0% 58 +3.4% 124 +22.4% 840 +10.8%
Fabrazyme® 673 175 +7.4% 383 +8.1% 115 +8.0% 82 +25.6% 755 +9.8%
Aldurazyme® 144 76 +1.3% 44 +9.5% 24 +4.0% 62 +12.1% 206 +6.7%
Other 246 62 0.0% 89 -16.8% 95 0.0% 41 +4.4% 287 -5.4%
Total Rare Diseases 2,416 1,008 +5.3% 1,072 +5.8% 336 +3.6% 542 +21.5% 2,958 +8.3%
Aubagio® 1,599 385 -0.3% 1,157 +11.4% 57 +0.0% 48 +59.5% 1,647 +9.3%
Lemtrada® 375 167 -3.4% 189 -19.1% 19 -33.3% 27 +33.3% 402 -11.6%
Total Multiple
Sclerosis 1,974 552 -1.2% 1,346 +5.8% 76 -11.2% 75 +49.2% 2,049 +4.4%
Jevtana® 399 158 +7.4% 179 +17.6% 62 +20.8% 23 +0.0% 422 +13.0%
Thymoglobulin® 222 37 -5.1% 162 +4.9% 23 +0.0% 75 +22.7% 297 +7.2%
Eloxatin® 32 2 -50.0% — -100.0% 30 +7.1% 150 +6.8% 182 +5.0%
Taxotere® 32 3 +0.0% 1 — 28 -17.6% 134 +2.9% 166 -0.6%
Mozobil® 161 47 +9.1% 96 +5.2% 18 +21.4% 10 +22.2% 171 +8.6%
Other 229 104 +2.9% 85 -47.4% 40 +41.4% 27 +20.8% 256 -18.7%
Total Oncology 1,075 351 +4.1% 523 -6.8% 201 +12.2% 419 +8.8% 1,494 +2.1%
Eloctate® 606 — — 500 — 106 — 2 — 608 —
Alprolix® 285 — — 222 — 63 — — — 285 —
Cablivi® 4 4 — — — — — — — 4 —
Total Rare Blood
Disorder 895 4 — 722 — 169 — 2 — 897 —
Dupixent® 783 75 +3,650.0% 660 +213.9% 48 +4,700.0% 5 — 788 +268.0%
Kevzara® 83 14 +1,300.0% 64 +550.0% 5 — — — 83 +663.6%
Total Immunology 866 89 +2,866.7% 724 +228.8% 53 +5,200.0% 5 — 871 +287.0%
Sanofi Genzyme
(Specialty Care) 7,226 2,004 +7.9% 4,387 +42.3% 835 +40.9% 1,043 +18.7% 8,269 +29.0%
Lantus® 2,588 684 -9.7% 1,614 -33.3% 290 -3.8% 977 +5.3% 3,565 -19.
Toujeo® 710 290 +34.6% 344 -20.7% 76 +18.5% 130 +83.5% 840 +7.
Apidra® 248 136 +0.0% 74 -23.5% 38 -2.4% 109 +26.5% 357 +0.
Amaryl® 47 17 -19.0% 2 +0.0% 28 -16.7% 288 +9.4% 335 +4.
Admelog®/Insulin lispro Sanofi® 93 7 +600.0% 86 — 0 — 0 — 93
Soliqua®/Suliqua® 70 5 — 62 +142.3% 3 — 3 — 73 +188.
Other 162 133 -12.5% 3 +200% 26 -3.6% 47 +44.4% 209 -0.
Total Diabetes 3,918 1,272 -0.9% 2,185 -26.9% 461 -0.8% 1,554 +12.7% 5,472 -10.
Multaq® 343 43 +2.4% 296 +8.0% 4 +0.0% 7 +0.0% 350 +7.
Praluent® 250 86 +87.0% 154 +37.1% 10 +120.0% 11 +175.0% 261 +56.
Total Cardiovascular 593 129 +46.6% 450 +16.4% 14 +66.7% 18 +63.6% 611 +23.
0%
2%
3%
8%
—
5%
9%
4%
1%
1%
5%
Diabetes &
Cardiovascular 4,511 1,401 +2.2% 2,635 -22.0% 475 +0.4% 1,572 +13.1% 6,083 -7.9%
94 SANOFI / FORM 20-F 2018

ITEM 5. OPERATING AND FINANCIAL REVIEW AND PROSPECTS
(€ million) Total GBU Europe(a)
Change at CER
United States
Change at CER
Rest of the
World(b) Change at CER
Emerging Markets(c)
Change at CER
Total Franchise
Change at CER
Lovenox® 1,465 870 -8.3% 38 -29.3% 81 -6.6% 476 +11.4% 1,465 -3.0%
Plavix® 1,440 147 -2.0% 0 -100.0% 218 -23.5% 1,075 +8.8% 1,440 +1.2%
Aprovel®/Avapro® 652 108 -6.1% 10 +0.0% 69 -45.5% 465 +12.7% 652 -1.7%
Depakine® 452 163 -1.2% 0 — 14 -6.7% 275 +9.0% 452 +4.7%
Renagel®/Renvela® 411 60 -15.5% 253 -59.1% 31 -8.6% 67 +42.0% 411 -46.7%
Synvisc®/Synvisc-One® 313 25 -16.7% 217 -22.3% 13 +0.0% 58 +23.5% 313 -15.0%
Stilnox®/Ambien®/Myslee® 231 39 -2.5% 45 -14.5% 86 -16.0% 61 +13.8% 231 -6.9%
Tritace® 221 142 -5.9% 0 — 5 +0.0% 74 +0.0% 221 -3.8%
Allegra® 124 8 -11.1% 0 — 116 -18.1% 0 — 124 -17.7%
Other 3,534 1,768 -2.0% 188 -6.3% 376 -7.1% 1,202 -1.1% 3,534 -2.5%
Total Established
Prescription Products 8,843 3,330 -4.4% 751 -38.2% 1,009 -16.9% 3,753 +6.6% 8,843 -6.1%
Generics 1,490 568 -24.4% 124 -15.3% 113 +9.1% 685 +3.0% 1,490 -9.8%
Total Emerging
Markets – Specialty
Care 1,043 — — — — — — 1,043 +18.7% — —
Total Emerging
Markets – Diabetes &
Cardiovascular 1,572 — — — — — — 1,572 +13.1% — —
General Medicines &
Emerging Markets 12,948 3,898 -7.9% 875 -35.8% 1,122 -14.8% 7,053 +9.3% — —
Total
Pharmaceuticals 24,685 7,303 -2.1% 7,897 +0.9% 2,432 +1.9% 7,053 +9.3% 24,685 +2.4%
(a) Europe excluding Eurasia (Russia, Ukraine, Georgia, Belarus, Armenia and Turkey). (b) Japan, South Korea, Canada, Australia, New Zealand and Puerto Rico. (c) World excluding United States, Canada, Europe (apart from Eurasia), Japan, South Korea, Australia, New Zealand and Puerto Rico.
SANOFI / FORM 20-F 2018 95

ITEM 5. OPERATING AND FINANCIAL REVIEW AND PROSPECTS
5/ Net sales – Consumer Healthcare Segment
Net sales of Consumer Healthcare products for 2018 were €4,660 million, down 2.9% on a reported basis but up 3.0% at constant exchange rates, driven by Emerging Markets (+8.9% CER at €1,588 million) – especially Latin America – and by the Pain (+6.7% CER at €1,254 million) and Digestive (+8.7% CER at €986 million) categories. Sales of Consumer Health products were stable in Europe at €1,403 million, but decreased slightly in the United States (-1.1% CER at €1,066 million).
(€ million) 2018 2017(a)
Change on
a reported
basis
Change at
constant
exchange rates
Allegra® 396 422 -6.2% +1.2%
Mucosolvan® 110 112 -1.8% +1.8%
Other 618 671 -7.9% -4.0%
Allergy, Cough & Cold 1,124 1,205 -6.7% -1.7%
Doliprane® 333 323 +3.1% +4.0%
Buscopan® 194 194 +0.0% +16.0%
Other 727 744 -2.3% +5.4%
Pain 1,254 1,261 -0.6% +6.7%
Dulcolax® 216 210 +2.9% +7.1%
Enterogermina® 183 168 +8.9% +16.1%
Essentiale® 177 172 +2.9% +8.7%
Zantac® 127 117 +8.5% +13.7%
Other 283 287 -1.4% +3.5%
Digestive 986 954 +3.4% +8.7%
Pharmaton® 90 99 -9.1% -1.0%
Other 585 586 -0.2% +5.6%
Nutritionals 675 685 -1.5% +4.7%
Gold Bond® 211 201 +5.0% +9.5%
Other 410 492 -16.7% -11.2%
Other products 621 693 -10.4% -5.2%
Total Consumer Healthcare 4,660 4,798 -2.9% +3.0%
(a) Includes the effects of first-time application of IFRS 15 on revenue recognition (see Note A.2.1.1. to our consolidated financial statements).
In Emerging Markets, Consumer Healthcare net sales reached €1,588 million, up 8.9% CER, boosted by Pain (+14.0% CER at €449 million) and Digestive (+14.4% CER at €423 million), especially in Brazil.
In Europe, Consumer Healthcare net sales remained stable in 2018 at €1,403 million. Sales growth in the Pain (+1.8% CER at €521 million) and Digestive (+2.6% CER at €314 million) categories offset a decrease in sales for Allergy, Cough & Cold (-0.9% CER at €347 million, reflecting a strong comparative base in 2017) and Other Products (-19.7% CER at €96 million, linked to the June 2018 sale of a portfolio of 12 brands to
Cooper-Vemedia, the European subsidiary of Charterhouse Capital Partners.
Sales of Consumer Healthcare products in the United States totaled €1,066 million in 2018, down slightly (-1.1% CER) on 2017. The main category affected was Allergy, Cough & Cold (-12.3% CER at €303 million), reflecting inventory build-ups ahead of the Xyzal® launch during 2017 and competition from retailer own brands, especially in anti-allergy nasal sprays.
In the Rest of the World region, Consumer Healthcare net sales reached €603 million in 2018, up 2.1% CER, driven largely by Japan (+4.7% CER at €302 million).
96 SANOFI / FORM 20-F 2018
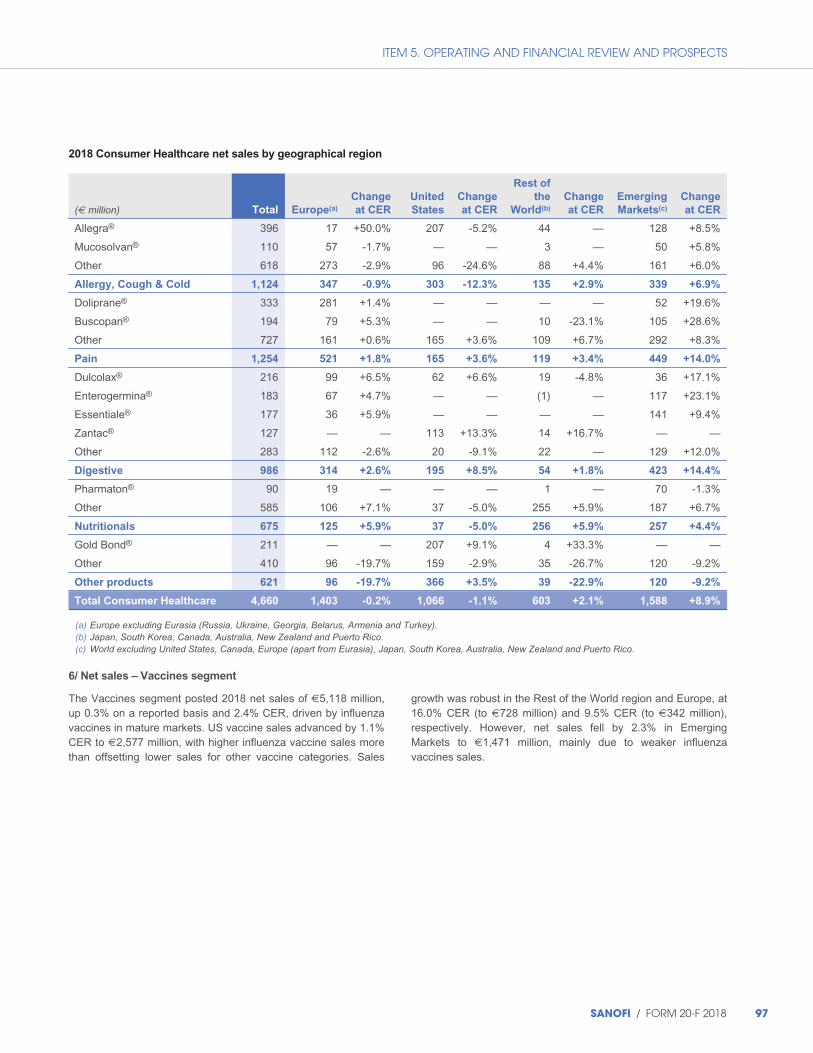
ITEM 5. OPERATING AND FINANCIAL REVIEW AND PROSPECTS
2018 Consumer Healthcare net sales by geographical region
(€ million) Total Europe(a)
Change
at CER
United
States
Change
at CER
Rest of
the
World(b)
Change
at CER
Emerging
Markets(c)
Change
at CER
Allegra® 396 17 +50.0% 207 -5.2% 44 — 128 +8.5%
Mucosolvan® 110 57 -1.7% — — 3 — 50 +5.8%
Other 618 273 -2.9% 96 -24.6% 88 +4.4% 161 +6.0%
Allergy, Cough & Cold 1,124 347 -0.9% 303 -12.3% 135 +2.9% 339 +6.9%
Doliprane® 333 281 +1.4% — — — — 52 +19.6%
Buscopan® 194 79 +5.3% — — 10 -23.1% 105 +28.6%
Other 727 161 +0.6% 165 +3.6% 109 +6.7% 292 +8.3%
Pain 1,254 521 +1.8% 165 +3.6% 119 +3.4% 449 +14.0%
Dulcolax® 216 99 +6.5% 62 +6.6% 19 -4.8% 36 +17.1%
Enterogermina® 183 67 +4.7% — — (1) — 117 +23.1%
Essentiale® 177 36 +5.9% — — — — 141 +9.4%
Zantac® 127 — — 113 +13.3% 14 +16.7% — —
Other 283 112 -2.6% 20 -9.1% 22 — 129 +12.0%
Digestive 986 314 +2.6% 195 +8.5% 54 +1.8% 423 +14.4%
Pharmaton® 90 19 — — — 1 — 70 -1.3%
Other 585 106 +7.1% 37 -5.0% 255 +5.9% 187 +6.7%
Nutritionals 675 125 +5.9% 37 -5.0% 256 +5.9% 257 +4.4%
Gold Bond® 211 — — 207 +9.1% 4 +33.3% — —
Other 410 96 -19.7% 159 -2.9% 35 -26.7% 120 -9.2%
Other products 621 96 -19.7% 366 +3.5% 39 -22.9% 120 -9.2%
Total Consumer Healthcare 4,660 1,403 -0.2% 1,066 -1.1% 603 +2.1% 1,588 +8.9%
(a) Europe excluding Eurasia (Russia, Ukraine, Georgia, Belarus, Armenia and Turkey). (b) Japan, South Korea, Canada, Australia, New Zealand and Puerto Rico. (c) World excluding United States, Canada, Europe (apart from Eurasia), Japan, South Korea, Australia, New Zealand and Puerto Rico.
6/ Net sales – Vaccines segment
The Vaccines segment posted 2018 net sales of €5,118 million, up 0.3% on a reported basis and 2.4% CER, driven by influenza vaccines in mature markets. US vaccine sales advanced by 1.1% CER to €2,577 million, with higher influenza vaccine sales more than offsetting lower sales for other vaccine categories. Sales
growth was robust in the Rest of the World region and Europe, at 16.0% CER (to €728 million) and 9.5% CER (to €342 million), respectively. However, net sales fell by 2.3% in Emerging Markets to €1,471 million, mainly due to weaker influenza vaccines sales.
SANOFI / FORM 20-F 2018 97
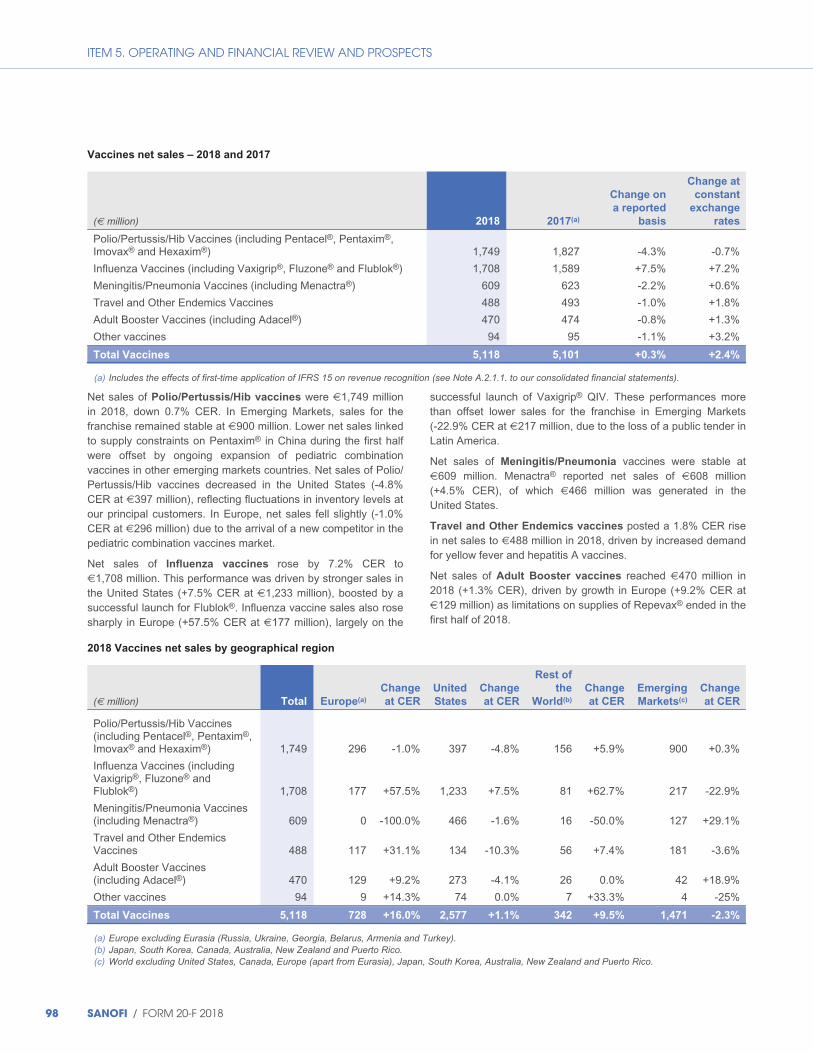
ITEM 5. OPERATING AND FINANCIAL REVIEW AND PROSPECTS
Vaccines net sales – 2018 and 2017
Change at
Change on constant
a reported exchange
(€ million) 2018 2017(a) basis rates
Polio/Pertussis/Hib Vaccines (including Pentacel®, Pentaxim®, Imovax® and Hexaxim®) 1,749 1,827 -4.3% -0.7%
Influenza Vaccines (including Vaxigrip®, Fluzone® and Flublok®) 1,708 1,589 +7.5% +7.2%
Meningitis/Pneumonia Vaccines (including Menactra®) 609 623 -2.2% +0.6%
Travel and Other Endemics Vaccines 488 493 -1.0% +1.8%
Adult Booster Vaccines (including Adacel®) 470 474 -0.8% +1.3%
Other vaccines 94 95 -1.1% +3.2%
Total Vaccines 5,118 5,101 +0.3% +2.4%
(a) Includes the effects of first-time application of IFRS 15 on revenue recognition (see Note A.2.1.1. to our consolidated financial statements).
Net sales of Polio/Pertussis/Hib vaccines were €1,749 million in 2018, down 0.7% CER. In Emerging Markets, sales for the franchise remained stable at €900 million. Lower net sales linked to supply constraints on Pentaxim® in China during the first half were offset by ongoing expansion of pediatric combination vaccines in other emerging markets countries. Net sales of Polio/Pertussis/Hib vaccines decreased in the United States (-4.8% CER at €397 million), reflecting fluctuations in inventory levels at our principal customers. In Europe, net sales fell slightly (-1.0% CER at €296 million) due to the arrival of a new competitor in the pediatric combination vaccines market.
Net sales of Influenza vaccines rose by 7.2% CER to €1,708 million. This performance was driven by stronger sales in the United States (+7.5% CER at €1,233 million), boosted by a successful launch for Flublok®. Influenza vaccine sales also rose sharply in Europe (+57.5% CER at €177 million), largely on the
successful launch of Vaxigrip® QIV. These performances more than offset lower sales for the franchise in Emerging Markets (-22.9% CER at €217 million, due to the loss of a public tender in Latin America.
Net sales of Meningitis/Pneumonia vaccines were stable at €609 million. Menactra® reported net sales of €608 million (+4.5% CER), of which €466 million was generated in the United States.
Travel and Other Endemics vaccines posted a 1.8% CER rise in net sales to €488 million in 2018, driven by increased demand for yellow fever and hepatitis A vaccines.
Net sales of Adult Booster vaccines reached €470 million in 2018 (+1.3% CER), driven by growth in Europe (+9.2% CER at €129 million) as limitations on supplies of Repevax® ended in the first half of 2018.
2018 Vaccines net sales by geographical region
(€ million) Total Europe(a)
Change
at CER
United
States
Change
at CER
Rest of
the
World(b)
Change
at CER
Emerging
Markets(c)
Change
at CER
Polio/Pertussis/Hib Vaccines (including Pentacel®, Pentaxim®, Imovax® and Hexaxim®) 1,749 296 -1.0% 397 -4.8% 156 +5.9% 900 +0.3%
Influenza Vaccines (including Vaxigrip®, Fluzone® and Flublok®) 1,708 177 +57.5% 1,233 +7.5% 81 +62.7% 217 -22.9%
Meningitis/Pneumonia Vaccines (including Menactra®) 609 0 -100.0% 466 -1.6% 16 -50.0% 127 +29.1%
Travel and Other Endemics Vaccines 488 117 +31.1% 134 -10.3% 56 +7.4% 181 -3.6%
Adult Booster Vaccines (including Adacel®) 470 129 +9.2% 273 -4.1% 26 0.0% 42 +18.9%
Other vaccines 94 9 +14.3% 74 0.0% 7 +33.3% 4 -25%
Total Vaccines 5,118 728 +16.0% 2,577 +1.1% 342 +9.5% 1,471 -2.3%
(a) Europe excluding Eurasia (Russia, Ukraine, Georgia, Belarus, Armenia and Turkey). (b) Japan, South Korea, Canada, Australia, New Zealand and Puerto Rico. (c) World excluding United States, Canada, Europe (apart from Eurasia), Japan, South Korea, Australia, New Zealand and Puerto Rico.
98 SANOFI / FORM 20-F 2018

ITEM 5. OPERATING AND FINANCIAL REVIEW AND PROSPECTS
7/ Net sales by geographical region
The table below sets forth our net sales for 2018 and 2017 by geographical region:
Change on Change at
a reported constant
(€ million) 2018 2017(a) basis exchange rates
United States 11,540 11,855 -2.7% +0.7%
Emerging Markets(b) 10,112 10,275 -1.6% +7.5%
of which Asia (including South Asia(c)) 3,962 3,755 +5.5% +9.3%
of which Latin America 2,612 2,837 -7.9% +8.1%
of which Africa and Middle East 2,232 2,311 -3.4% +1.1%
of which Eurasia(d) 1,152 1,251 -7.9% +10.1%
Europe(e) 9,434 9,525 -1.0% -0.6%
Rest of the World(f) 3,377 3,417 -1.2% +2.7%
of which Japan 1,710 1,803 -5.2% -2.0%
of which South Korea 432 426 +1.4% +3.3%
Total net sales 34,463 35,072 -1.7% +2.5%
(a) Includes the effects of first-time application of IFRS 15 on revenue recognition (see Note A.2.1.1. to our consolidated financial statements). (b) World excluding United States, Canada, Europe (apart from Eurasia), Japan, South Korea, Australia, New Zealand and Puerto Rico. (c) India, Bangladesh and Sri Lanka. (d) Russia, Ukraine, Georgia, Belarus, Armenia and Turkey. (e) Europe excluding Eurasia. (f) Japan, South Korea, Canada, Australia, New Zealand and Puerto Rico.
Net sales in the United States were €11,540 million in 2018, down 2.7% on a reported basis but up 0.7% at constant exchange rates. Good performances from Dupixent® and Aubagio® and the first-time consolidation of sales of Eloctate® and Alprolix® offset lower sales for the Diabetes franchise (-26.9% CER at €2,185 million) and Renvela®/Renagel® (-59.1% CER at €253 million).
Net sales in Emerging Markets reached €10,112 million, down 1.6% on a reported basis but up 7.5% CER. All Pharmaceuticals segment franchises saw net sales growth in Emerging Markets, as did Consumer Healthcare; the only exception was vaccines, with net sales down 2.3% CER at €1,471 million. The biggest contributors to growth in Emerging Markets were Established Prescription Products (+6.6% CER at €3,753 million), Diabetes (+12.7% CER at €1,554 million) and Consumer Healthcare (+8.9% CER at €1,588 million). In Asia, net sales rose by 9.3% CER to €3,962 million on a solid performance in China (+12.7% CER at €2,464 million), despite local supply constraints on Pentaxim® in the first half. In Latin America, net sales reached €2,612 million, up 8.1% CER, fueled by Brazil (+7.0% CER at €1,023 million). The best performers in this zone were Consumer Healthcare (+15.4% CER at €641 million) and Rare Diseases (+32.8% CER at €231 million). In Africa and the Middle East, net sales were up 1.1% CER at €2,232 million, boosted by the Diabetes franchise (+10.3% CER at €426 million) and Consumer Healthcare (+7.1% CER at €274 million), which offset lower Vaccines sales. In Eurasia, net sales were 10.1% higher CER at €1,152 million, reflecting strong sales growth in Turkey (+17.6% CER at €426 million) and Russia (+4.6% CER at €605 million).
In Europe, net sales remained stable in 2018 at €9,434 million. Robust performances by Vaccines (+16.0% CER at €728 million) and from Dupixent® and Praluent® offset lower sales of Established Prescription Products (-4.4% CER at €3,330 million), and of Generics following the divestment of Zentiva on September 30, 2018. At constant exchange rates and on a constant structure basis, sales in Europe rose by 1.1%.
In the Rest of the World region, net sales advanced by 2.7% CER to €3,377 million. Net sales in Japan totaled €1,710 million, down 2.0% CER. Good performances from Dupixent® and the first-time consolidation of sales of Eloctate® and Alprolix® failed to fully offset a sharp decline in net sales of Established Prescription Products (-16.9% CER at €1,009 million), attributable in part to generic competition for Plavix® and Aprovel®.
A.2.2. Other income statement items
Comparable information for the year ended December 31, 2017 has been restated in accordance with the new standard on revenue recognition, IFRS 15, which became applicable on January 1, 2018. The impact of these restatements is described in detail in Note A.2.1.1. to our consolidated financial statements, and affects not only Net sales but also some of the line items discussed below.
1/ Other revenues
Other revenues increased by 5.7% to €1,214 million in 2018 (versus €1,149 million in 2017). This line item mainly comprises
SANOFI / FORM 20-F 2018 99
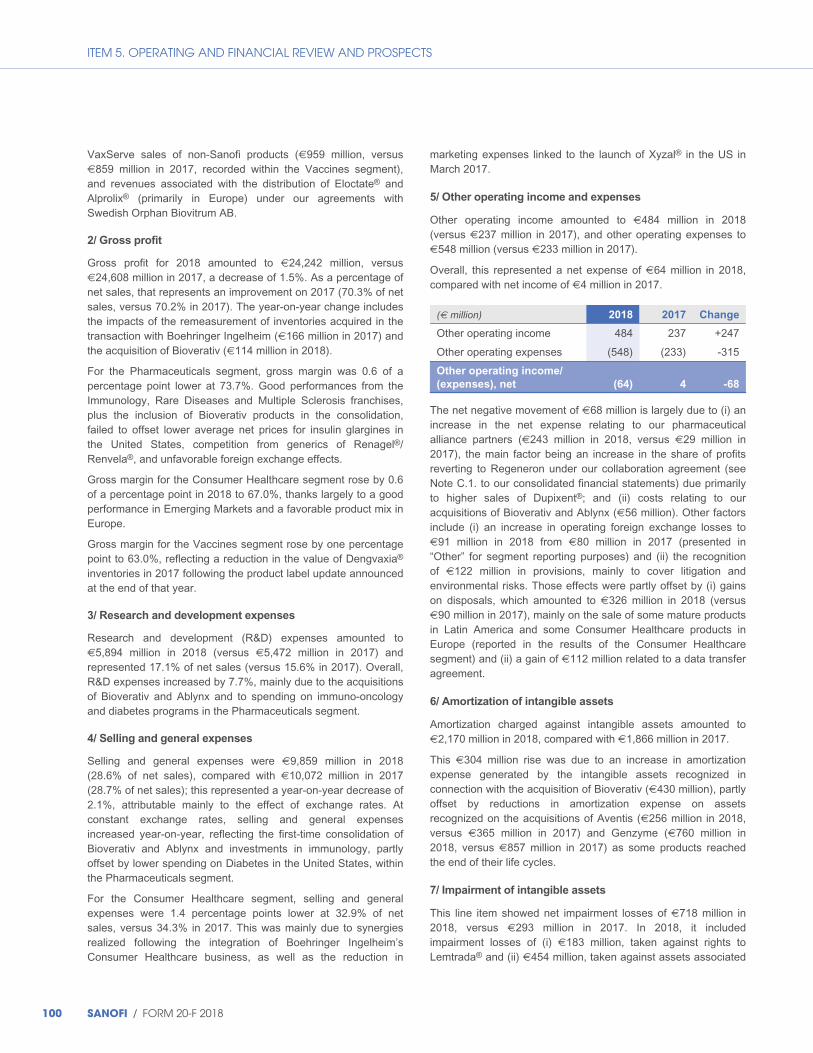
ITEM 5. OPERATING AND FINANCIAL REVIEW AND PROSPECTS
VaxServe sales of non-Sanofi products (€959 million, versus €859 million in 2017, recorded within the Vaccines segment), and revenues associated with the distribution of Eloctate® and Alprolix® (primarily in Europe) under our agreements with Swedish Orphan Biovitrum AB.
2/ Gross profit
Gross profit for 2018 amounted to €24,242 million, versus €24,608 million in 2017, a decrease of 1.5%. As a percentage of net sales, that represents an improvement on 2017 (70.3% of net sales, versus 70.2% in 2017). The year-on-year change includes the impacts of the remeasurement of inventories acquired in the transaction with Boehringer Ingelheim (€166 million in 2017) and the acquisition of Bioverativ (€114 million in 2018).
For the Pharmaceuticals segment, gross margin was 0.6 of a percentage point lower at 73.7%. Good performances from the Immunology, Rare Diseases and Multiple Sclerosis franchises, plus the inclusion of Bioverativ products in the consolidation, failed to offset lower average net prices for insulin glargines in the United States, competition from generics of Renagel®/Renvela®, and unfavorable foreign exchange effects.
Gross margin for the Consumer Healthcare segment rose by 0.6 of a percentage point in 2018 to 67.0%, thanks largely to a good performance in Emerging Markets and a favorable product mix in Europe.
Gross margin for the Vaccines segment rose by one percentage point to 63.0%, reflecting a reduction in the value of Dengvaxia® inventories in 2017 following the product label update announced at the end of that year.
3/ Research and development expenses
Research and development (R&D) expenses amounted to €5,894 million in 2018 (versus €5,472 million in 2017) and represented 17.1% of net sales (versus 15.6% in 2017). Overall, R&D expenses increased by 7.7%, mainly due to the acquisitions of Bioverativ and Ablynx and to spending on immuno-oncology and diabetes programs in the Pharmaceuticals segment.
4/ Selling and general expenses
Selling and general expenses were €9,859 million in 2018 (28.6% of net sales), compared with €10,072 million in 2017 (28.7% of net sales); this represented a year-on-year decrease of 2.1%, attributable mainly to the effect of exchange rates. At constant exchange rates, selling and general expenses increased year-on-year, reflecting the first-time consolidation of Bioverativ and Ablynx and investments in immunology, partly offset by lower spending on Diabetes in the United States, within the Pharmaceuticals segment.
For the Consumer Healthcare segment, selling and general expenses were 1.4 percentage points lower at 32.9% of net sales, versus 34.3% in 2017. This was mainly due to synergies realized following the integration of Boehringer Ingelheim’s Consumer Healthcare business, as well as the reduction in
marketing expenses linked to the launch of Xyzal® in the US in March 2017.
5/ Other operating income and expenses
Other operating income amounted to €484 million in 2018 (versus €237 million in 2017), and other operating expenses to €548 million (versus €233 million in 2017).
Overall, this represented a net expense of €64 million in 2018, compared with net income of €4 million in 2017.
(€ million) 2018 2017 Change
Other operating income 484 237 +247
Other operating expenses (548) (233) -315
Other operating income/
(expenses), net (64) 4 -68
The net negative movement of €68 million is largely due to (i) an increase in the net expense relating to our pharmaceutical alliance partners (€243 million in 2018, versus €29 million in 2017), the main factor being an increase in the share of profits reverting to Regeneron under our collaboration agreement (see Note C.1. to our consolidated financial statements) due primarily to higher sales of Dupixent®; and (ii) costs relating to our acquisitions of Bioverativ and Ablynx (€56 million). Other factors include (i) an increase in operating foreign exchange losses to €91 million in 2018 from €80 million in 2017 (presented in “Other” for segment reporting purposes) and (ii) the recognition of €122 million in provisions, mainly to cover litigation and environmental risks. Those effects were partly offset by (i) gains on disposals, which amounted to €326 million in 2018 (versus €90 million in 2017), mainly on the sale of some mature products in Latin America and some Consumer Healthcare products in Europe (reported in the results of the Consumer Healthcare segment) and (ii) a gain of €112 million related to a data transfer agreement.
6/ Amortization of intangible assets
Amortization charged against intangible assets amounted to €2,170 million in 2018, compared with €1,866 million in 2017.
This €304 million rise was due to an increase in amortization expense generated by the intangible assets recognized in connection with the acquisition of Bioverativ (€430 million), partly offset by reductions in amortization expense on assets recognized on the acquisitions of Aventis (€256 million in 2018, versus €365 million in 2017) and Genzyme (€760 million in 2018, versus €857 million in 2017) as some products reached the end of their life cycles.
7/ Impairment of intangible assets
This line item showed net impairment losses of €718 million in 2018, versus €293 million in 2017. In 2018, it included impairment losses of (i) €183 million, taken against rights to Lemtrada® and (ii) €454 million, taken against assets associated
100 SANOFI / FORM 20-F 2018
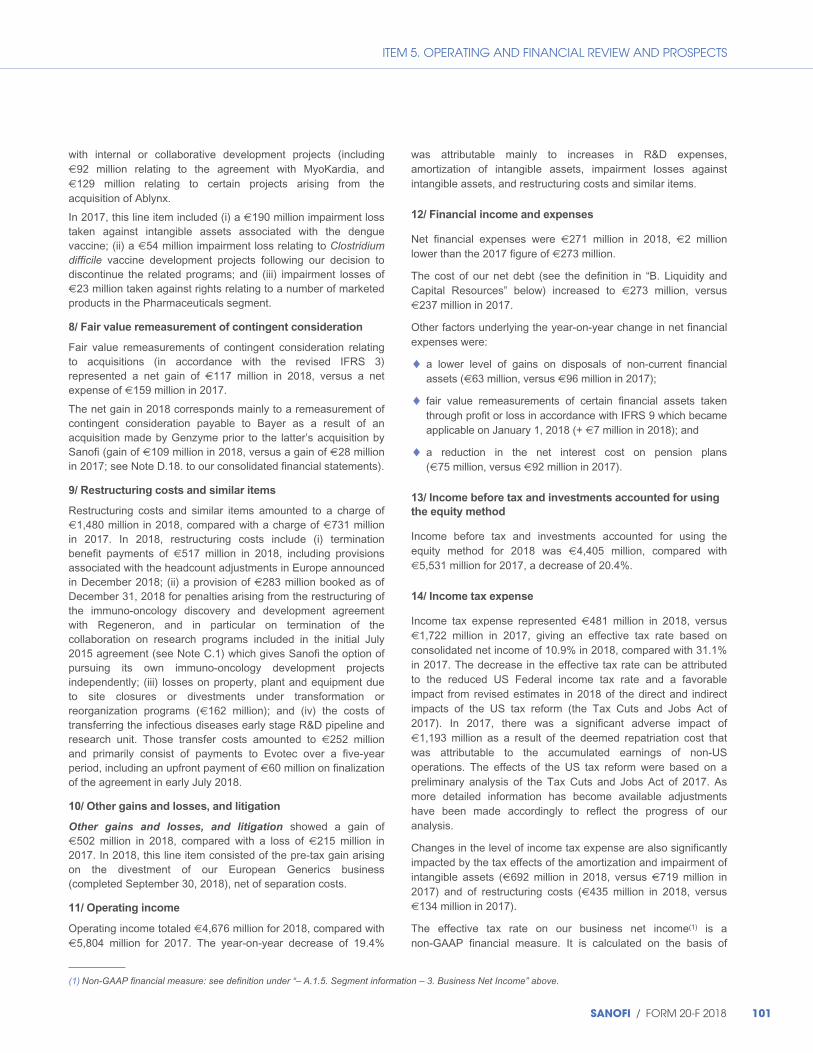
ITEM 5. OPERATING AND FINANCIAL REVIEW AND PROSPECTS
with internal or collaborative development projects (including €92 million relating to the agreement with MyoKardia, and €129 million relating to certain projects arising from the acquisition of Ablynx.
In 2017, this line item included (i) a €190 million impairment loss taken against intangible assets associated with the dengue vaccine; (ii) a €54 million impairment loss relating to Clostridium difficile vaccine development projects following our decision to discontinue the related programs; and (iii) impairment losses of €23 million taken against rights relating to a number of marketed products in the Pharmaceuticals segment.
8/ Fair value remeasurement of contingent consideration
Fair value remeasurements of contingent consideration relating to acquisitions (in accordance with the revised IFRS 3) represented a net gain of €117 million in 2018, versus a net expense of €159 million in 2017.
The net gain in 2018 corresponds mainly to a remeasurement of contingent consideration payable to Bayer as a result of an acquisition made by Genzyme prior to the latter’s acquisition by Sanofi (gain of €109 million in 2018, versus a gain of €28 million in 2017; see Note D.18. to our consolidated financial statements).
9/ Restructuring costs and similar items
Restructuring costs and similar items amounted to a charge of €1,480 million in 2018, compared with a charge of €731 million in 2017. In 2018, restructuring costs include (i) termination benefit payments of €517 million in 2018, including provisions associated with the headcount adjustments in Europe announced in December 2018; (ii) a provision of €283 million booked as of December 31, 2018 for penalties arising from the restructuring of the immuno-oncology discovery and development agreement with Regeneron, and in particular on termination of the collaboration on research programs included in the initial July 2015 agreement (see Note C.1) which gives Sanofi the option of pursuing its own immuno-oncology development projects independently; (iii) losses on property, plant and equipment due to site closures or divestments under transformation or reorganization programs (€162 million); and (iv) the costs of transferring the infectious diseases early stage R&D pipeline and research unit. Those transfer costs amounted to €252 million and primarily consist of payments to Evotec over a five-year period, including an upfront payment of €60 million on finalization of the agreement in early July 2018.
10/ Other gains and losses, and litigation
Other gains and losses, and litigation showed a gain of €502 million in 2018, compared with a loss of €215 million in 2017. In 2018, this line item consisted of the pre-tax gain arising on the divestment of our European Generics business (completed September 30, 2018), net of separation costs.
11/ Operating income
Operating income totaled €4,676 million for 2018, compared with €5,804 million for 2017. The year-on-year decrease of 19.4%
was attributable mainly to increases in R&D expenses, amortization of intangible assets, impairment losses against intangible assets, and restructuring costs and similar items.
12/ Financial income and expenses
Net financial expenses were €271 million in 2018, €2 million lower than the 2017 figure of €273 million.
The cost of our net debt (see the definition in “B. Liquidity and Capital Resources” below) increased to €273 million, versus €237 million in 2017.
Other factors underlying the year-on-year change in net financial expenses were:
◆ a lower level of gains on disposals of non-current financial assets (€63 million, versus €96 million in 2017);
◆ fair value remeasurements of certain financial assets taken through profit or loss in accordance with IFRS 9 which became applicable on January 1, 2018 (+ €7 million in 2018); and
◆ a reduction in the net interest cost on pension plans (€75 million, versus €92 million in 2017).
13/ Income before tax and investments accounted for using
the equity method
Income before tax and investments accounted for using the equity method for 2018 was €4,405 million, compared with €5,531 million for 2017, a decrease of 20.4%.
14/ Income tax expense
Income tax expense represented €481 million in 2018, versus €1,722 million in 2017, giving an effective tax rate based on consolidated net income of 10.9% in 2018, compared with 31.1% in 2017. The decrease in the effective tax rate can be attributed to the reduced US Federal income tax rate and a favorable impact from revised estimates in 2018 of the direct and indirect impacts of the US tax reform (the Tax Cuts and Jobs Act of 2017). In 2017, there was a significant adverse impact of €1,193 million as a result of the deemed repatriation cost that was attributable to the accumulated earnings of non-US operations. The effects of the US tax reform were based on a preliminary analysis of the Tax Cuts and Jobs Act of 2017. As more detailed information has become available adjustments have been made accordingly to reflect the progress of our analysis.
Changes in the level of income tax expense are also significantly impacted by the tax effects of the amortization and impairment of intangible assets (€692 million in 2018, versus €719 million in 2017) and of restructuring costs (€435 million in 2018, versus €134 million in 2017).
The effective tax rate on our business net income(1) is a non-GAAP financial measure. It is calculated on the basis of
(1) Non-GAAP financial measure: see definition under “– A.1.5. Segment information – 3. Business Net Income” above.
SANOFI / FORM 20-F 2018 101
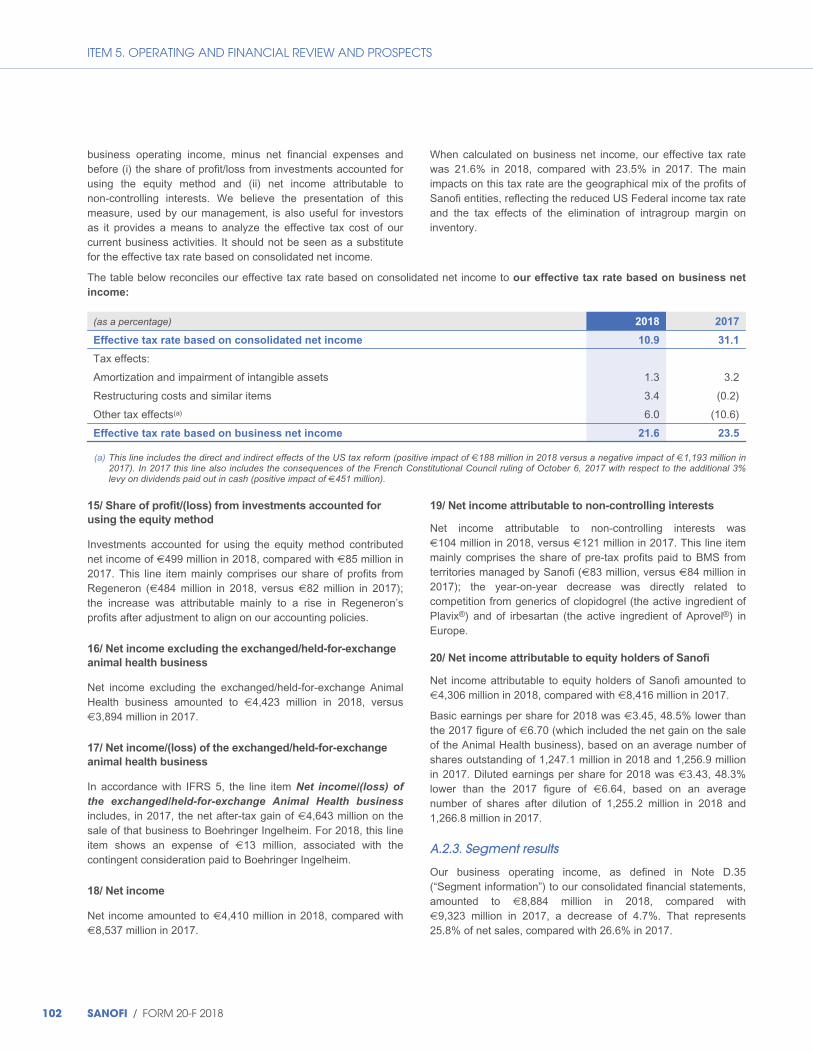
ITEM 5. OPERATING AND FINANCIAL REVIEW AND PROSPECTS
business operating income, minus net financial expenses and before (i) the share of profit/loss from investments accounted for using the equity method and (ii) net income attributable to non-controlling interests. We believe the presentation of this measure, used by our management, is also useful for investors as it provides a means to analyze the effective tax cost of our current business activities. It should not be seen as a substitute for the effective tax rate based on consolidated net income.
When calculated on business net income, our effective tax rate was 21.6% in 2018, compared with 23.5% in 2017. The main impacts on this tax rate are the geographical mix of the profits of Sanofi entities, reflecting the reduced US Federal income tax rate and the tax effects of the elimination of intragroup margin on inventory.
The table below reconciles our effective tax rate based on consolidated net income to our effective tax rate based on business net
income:
(as a percentage) 2018 2017
Effective tax rate based on consolidated net income 10.9 31.1
Tax effects:
Amortization and impairment of intangible assets 1.3 3.2
Restructuring costs and similar items 3.4 (0.2)
Other tax effects(a) 6.0 (10.6)
Effective tax rate based on business net income 21.6 23.5
(a) This line includes the direct and indirect effects of the US tax reform (positive impact of €188 million in 2018 versus a negative impact of €1,193 million in 2017). In 2017 this line also includes the consequences of the French Constitutional Council ruling of October 6, 2017 with respect to the additional 3% levy on dividends paid out in cash (positive impact of €451 million).
15/ Share of profit/(loss) from investments accounted for
using the equity method
Investments accounted for using the equity method contributed net income of €499 million in 2018, compared with €85 million in 2017. This line item mainly comprises our share of profits from Regeneron (€484 million in 2018, versus €82 million in 2017); the increase was attributable mainly to a rise in Regeneron’s profits after adjustment to align on our accounting policies.
16/ Net income excluding the exchanged/held-for-exchange
animal health business
Net income excluding the exchanged/held-for-exchange Animal Health business amounted to €4,423 million in 2018, versus €3,894 million in 2017.
17/ Net income/(loss) of the exchanged/held-for-exchange
animal health business
In accordance with IFRS 5, the line item Net income/(loss) of
the exchanged/held-for-exchange Animal Health business
includes, in 2017, the net after-tax gain of €4,643 million on the sale of that business to Boehringer Ingelheim. For 2018, this line item shows an expense of €13 million, associated with the contingent consideration paid to Boehringer Ingelheim.
18/ Net income
Net income amounted to €4,410 million in 2018, compared with €8,537 million in 2017.
19/ Net income attributable to non-controlling interests
Net income attributable to non-controlling interests was €104 million in 2018, versus €121 million in 2017. This line item mainly comprises the share of pre-tax profits paid to BMS from territories managed by Sanofi (€83 million, versus €84 million in 2017); the year-on-year decrease was directly related to competition from generics of clopidogrel (the active ingredient of Plavix®) and of irbesartan (the active ingredient of Aprovel®) in Europe.
20/ Net income attributable to equity holders of Sanofi
Net income attributable to equity holders of Sanofi amounted to €4,306 million in 2018, compared with €8,416 million in 2017.
Basic earnings per share for 2018 was €3.45, 48.5% lower than the 2017 figure of €6.70 (which included the net gain on the sale of the Animal Health business), based on an average number of shares outstanding of 1,247.1 million in 2018 and 1,256.9 million in 2017. Diluted earnings per share for 2018 was €3.43, 48.3% lower than the 2017 figure of €6.64, based on an average number of shares after dilution of 1,255.2 million in 2018 and 1,266.8 million in 2017.
A.2.3. Segment results
Our business operating income, as defined in Note D.35 (“Segment information”) to our consolidated financial statements, amounted to €8,884 million in 2018, compared with €9,323 million in 2017, a decrease of 4.7%. That represents 25.8% of net sales, compared with 26.6% in 2017.
102 SANOFI / FORM 20-F 2018
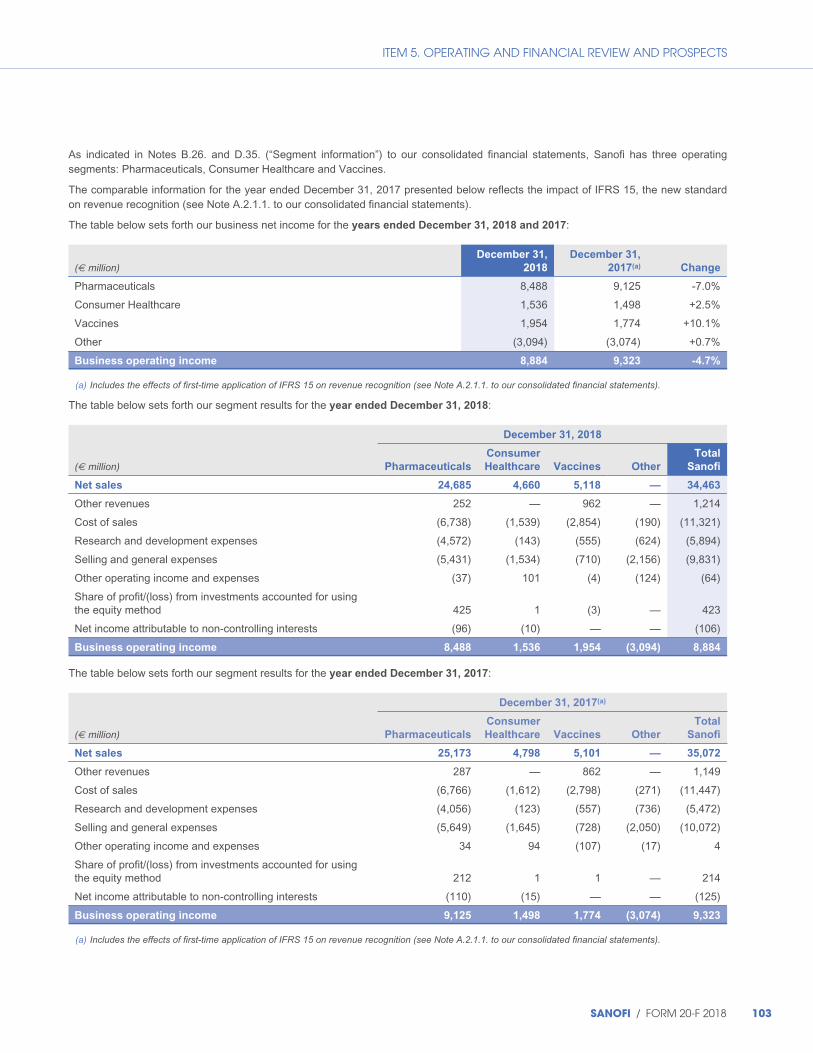
ITEM 5. OPERATING AND FINANCIAL REVIEW AND PROSPECTS
As indicated in Notes B.26. and D.35. (“Segment information”) to our consolidated financial statements, Sanofi has three operating segments: Pharmaceuticals, Consumer Healthcare and Vaccines.
The comparable information for the year ended December 31, 2017 presented below reflects the impact of IFRS 15, the new standard on revenue recognition (see Note A.2.1.1. to our consolidated financial statements).
The table below sets forth our business net income for the years ended December 31, 2018 and 2017:
December 31, December 31,
(€ million) 2018 2017(a) Change
Pharmaceuticals 8,488 9,125 -7.0%
Consumer Healthcare 1,536 1,498 +2.5%
Vaccines 1,954 1,774 +10.1%
Other (3,094) (3,074) +0.7%
Business operating income 8,884 9,323 -4.7%
(a) Includes the effects of first-time application of IFRS 15 on revenue recognition (see Note A.2.1.1. to our consolidated financial statements).
The table below sets forth our segment results for the year ended December 31, 2018:
December 31, 2018
Consumer Total
(€ million) Pharmaceuticals Healthcare Vaccines Other Sanofi
Net sales 24,685 4,660 5,118 — 34,463
Other revenues 252 — 962 — 1,214
Cost of sales (6,738) (1,539) (2,854) (190) (11,321)
Research and development expenses (4,572) (143) (555) (624) (5,894)
Selling and general expenses (5,431) (1,534) (710) (2,156) (9,831)
Other operating income and expenses (37) 101 (4) (124) (64)
Share of profit/(loss) from investments accounted for using the equity method 425 1 (3) — 423
Net income attributable to non-controlling interests (96) (10) — — (106)
Business operating income 8,488 1,536 1,954 (3,094) 8,884
The table below sets forth our segment results for the year ended December 31, 2017:
December 31, 2017(a)
Consumer Total
(€ million) Pharmaceuticals Healthcare Vaccines Other Sanofi
Net sales 25,173 4,798 5,101 — 35,072
Other revenues 287 — 862 — 1,149
Cost of sales (6,766) (1,612) (2,798) (271) (11,447)
Research and development expenses (4,056) (123) (557) (736) (5,472)
Selling and general expenses (5,649) (1,645) (728) (2,050) (10,072)
Other operating income and expenses 34 94 (107) (17) 4
Share of profit/(loss) from investments accounted for using the equity method 212 1 1 — 214
Net income attributable to non-controlling interests (110) (15) — — (125)
Business operating income 9,125 1,498 1,774 (3,074) 9,323
(a) Includes the effects of first-time application of IFRS 15 on revenue recognition (see Note A.2.1.1. to our consolidated financial statements).
SANOFI / FORM 20-F 2018 103
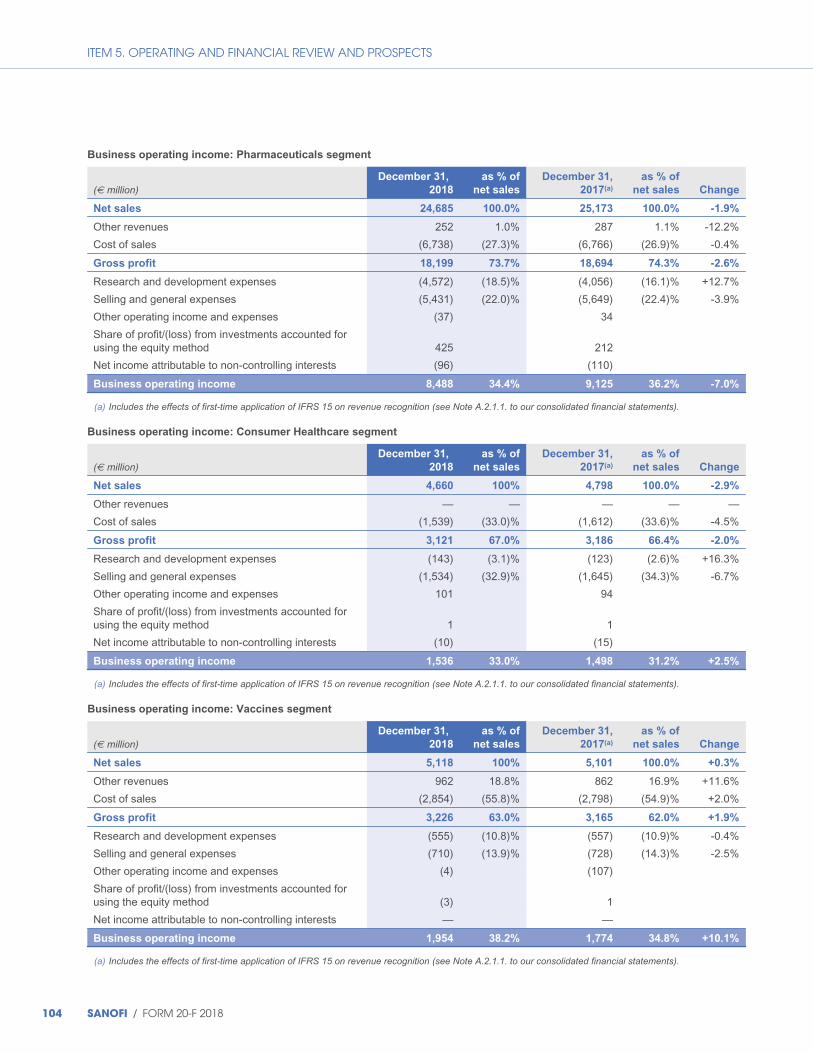
ITEM 5. OPERATING AND FINANCIAL REVIEW AND PROSPECTS
Business operating income: Pharmaceuticals segment
(€ million) December 31,
2018
as % of
net sales
December 31,
2017(a)
as % of
net sales Change
Net sales 24,685 100.0% 25,173 100.0% -1.9%
Other revenues 252 1.0% 287 1.1% -12.2%
Cost of sales (6,738) (27.3)% (6,766) (26.9)% -0.4%
Gross profit 18,199 73.7% 18,694 74.3% -2.6%
Research and development expenses (4,572) (18.5)% (4,056) (16.1)% +12.7%
Selling and general expenses (5,431) (22.0)% (5,649) (22.4)% -3.9%
Other operating income and expenses (37) 34
Share of profit/(loss) from investments accounted for using the equity method 425 212
Net income attributable to non-controlling interests (96) (110)
Business operating income 8,488 34.4% 9,125 36.2% -7.0%
(a) Includes the effects of first-time application of IFRS 15 on revenue recognition (see Note A.2.1.1. to our consolidated financial statements).
Business operating income: Consumer Healthcare segment
(€ million) December 31,
2018
as % of
net sales
December 31,
2017(a)
as % of
net sales Change
Net sales 4,660 100% 4,798 100.0% -2.9%
Other revenues — — — — —
Cost of sales (1,539) (33.0)% (1,612) (33.6)% -4.5%
Gross profit 3,121 67.0% 3,186 66.4% -2.0%
Research and development expenses (143) (3.1)% (123) (2.6)% +16.3%
Selling and general expenses (1,534) (32.9)% (1,645) (34.3)% -6.7%
Other operating income and expenses 101 94
Share of profit/(loss) from investments accounted for using the equity method 1 1
Net income attributable to non-controlling interests (10) (15)
Business operating income 1,536 33.0% 1,498 31.2% +2.5%
(a) Includes the effects of first-time application of IFRS 15 on revenue recognition (see Note A.2.1.1. to our consolidated financial statements).
Business operating income: Vaccines segment
(€ million) December 31,
2018
as % of
net sales
December 31,
2017(a)
as % of
net sales Change
Net sales 5,118 100% 5,101 100.0% +0.3%
Other revenues 962 18.8% 862 16.9% +11.6%
Cost of sales (2,854) (55.8)% (2,798) (54.9)% +2.0%
Gross profit 3,226 63.0% 3,165 62.0% +1.9%
Research and development expenses (555) (10.8)% (557) (10.9)% -0.4%
Selling and general expenses (710) (13.9)% (728) (14.3)% -2.5%
Other operating income and expenses (4) (107)
Share of profit/(loss) from investments accounted for using the equity method (3) 1
Net income attributable to non-controlling interests — —
Business operating income 1,954 38.2% 1,774 34.8% +10.1%
(a) Includes the effects of first-time application of IFRS 15 on revenue recognition (see Note A.2.1.1. to our consolidated financial statements).
104 SANOFI / FORM 20-F 2018
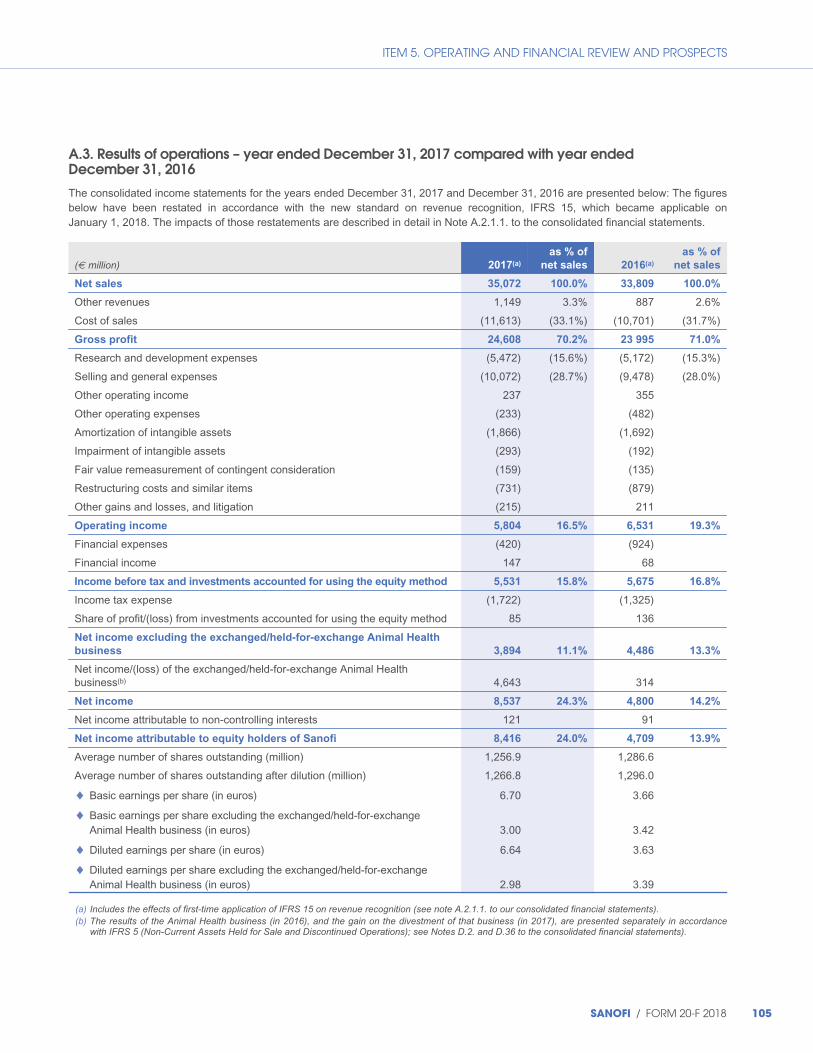
ITEM 5. OPERATING AND FINANCIAL REVIEW AND PROSPECTS
A.3. Results of operations – year ended December 31, 2017 compared with year ended December 31, 2016
The consolidated income statements for the years ended December 31, 2017 and December 31, 2016 are presented below: The figures below have been restated in accordance with the new standard on revenue recognition, IFRS 15, which became applicable on January 1, 2018. The impacts of those restatements are described in detail in Note A.2.1.1. to the consolidated financial statements.
(€ million) 2017(a)
as % of
net sales 2016(a)
as % of
net sales
Net sales 35,072 100.0% 33,809 100.0%
Other revenues 1,149 3.3% 887 2.6%
Cost of sales (11,613) (33.1%) (10,701) (31.7%)
Gross profit 24,608 70.2% 23 995 71.0%
Research and development expenses (5,472) (15.6%) (5,172) (15.3%)
Selling and general expenses (10,072) (28.7%) (9,478) (28.0%)
Other operating income 237 355
Other operating expenses (233) (482)
Amortization of intangible assets (1,866) (1,692)
Impairment of intangible assets (293) (192)
Fair value remeasurement of contingent consideration (159) (135)
Restructuring costs and similar items (731) (879)
Other gains and losses, and litigation (215) 211
Operating income 5,804 16.5% 6,531 19.3%
Financial expenses (420) (924)
Financial income 147 68
Income before tax and investments accounted for using the equity method 5,531 15.8% 5,675 16.8%
Income tax expense (1,722) (1,325)
Share of profit/(loss) from investments accounted for using the equity method 85 136
Net income excluding the exchanged/held-for-exchange Animal Health
business 3,894 11.1% 4,486 13.3%
Net income/(loss) of the exchanged/held-for-exchange Animal Health business(b) 4,643 314
Net income 8,537 24.3% 4,800 14.2%
Net income attributable to non-controlling interests 121 91
Net income attributable to equity holders of Sanofi 8,416 24.0% 4,709 13.9%
Average number of shares outstanding (million) 1,256.9 1,286.6
Average number of shares outstanding after dilution (million) 1,266.8 1,296.0
◆ Basic earnings per share (in euros) 6.70 3.66
◆ Basic earnings per share excluding the exchanged/held-for-exchange Animal Health business (in euros) 3.00 3.42
◆ Diluted earnings per share (in euros) 6.64 3.63
◆ Diluted earnings per share excluding the exchanged/held-for-exchange Animal Health business (in euros) 2.98 3.39
(a) Includes the effects of first-time application of IFRS 15 on revenue recognition (see note A.2.1.1. to our consolidated financial statements). (b) The results of the Animal Health business (in 2016), and the gain on the divestment of that business (in 2017), are presented separately in accordance
with IFRS 5 (Non-Current Assets Held for Sale and Discontinued Operations); see Notes D.2. and D.36 to the consolidated financial statements).
SANOFI / FORM 20-F 2018 105
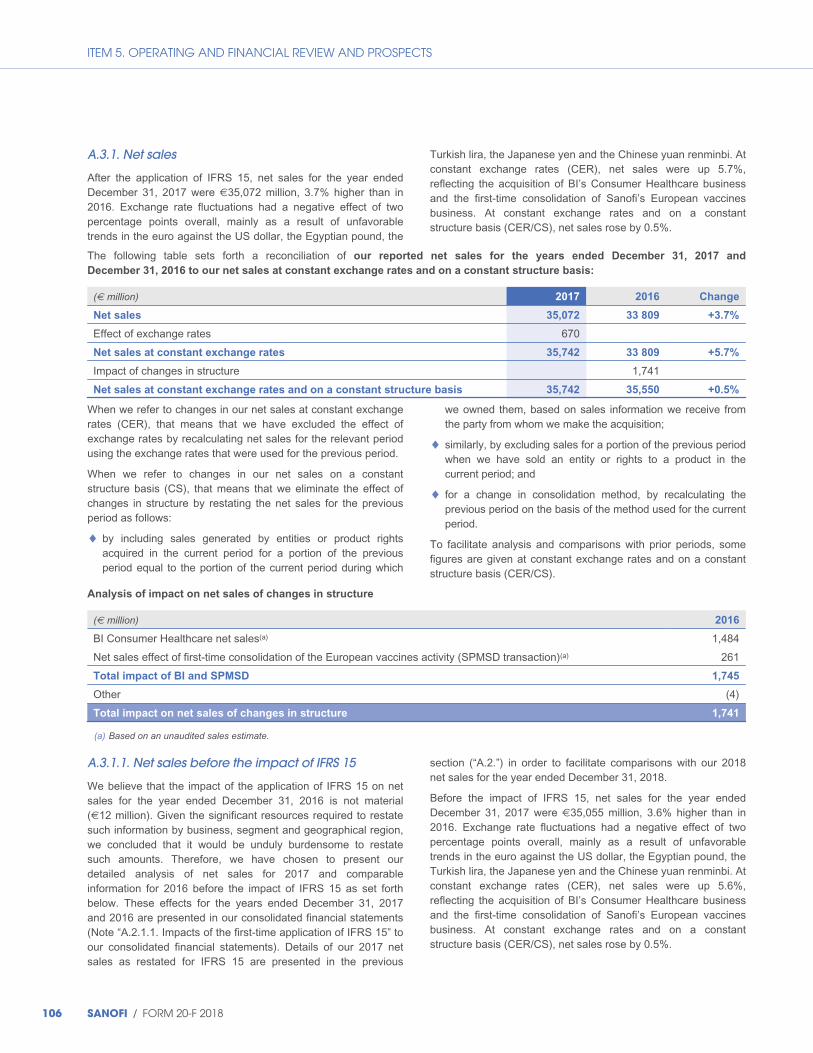
ITEM 5. OPERATING AND FINANCIAL REVIEW AND PROSPECTS
A.3.1. Net sales
After the application of IFRS 15, net sales for the year ended December 31, 2017 were €35,072 million, 3.7% higher than in 2016. Exchange rate fluctuations had a negative effect of two percentage points overall, mainly as a result of unfavorable trends in the euro against the US dollar, the Egyptian pound, the
Turkish lira, the Japanese yen and the Chinese yuan renminbi. At constant exchange rates (CER), net sales were up 5.7%, reflecting the acquisition of BI’s Consumer Healthcare business and the first-time consolidation of Sanofi’s European vaccines business. At constant exchange rates and on a constant structure basis (CER/CS), net sales rose by 0.5%.
The following table sets forth a reconciliation of our reported net sales for the years ended December 31, 2017 and
December 31, 2016 to our net sales at constant exchange rates and on a constant structure basis:
(€ million) 2017 2016 Change
Net sales 35,072 33 809 +3.7%
Effect of exchange rates 670
Net sales at constant exchange rates 35,742 33 809 +5.7%
Impact of changes in structure 1,741
Net sales at constant exchange rates and on a constant structure basis 35,742 35,550 +0.5%
When we refer to changes in our net sales at constant exchange rates (CER), that means that we have excluded the effect of exchange rates by recalculating net sales for the relevant period using the exchange rates that were used for the previous period.
When we refer to changes in our net sales on a constant structure basis (CS), that means that we eliminate the effect of changes in structure by restating the net sales for the previous period as follows:
◆ by including sales generated by entities or product rights acquired in the current period for a portion of the previous period equal to the portion of the current period during which
we owned them, based on sales information we receive from the party from whom we make the acquisition;
◆ similarly, by excluding sales for a portion of the previous period when we have sold an entity or rights to a product in the current period; and
◆ for a change in consolidation method, by recalculating the previous period on the basis of the method used for the current period.
To facilitate analysis and comparisons with prior periods, some figures are given at constant exchange rates and on a constant structure basis (CER/CS).
Analysis of impact on net sales of changes in structure
(€ million) 2016
BI Consumer Healthcare net sales(a) 1,484
Net sales effect of first-time consolidation of the European vaccines activity (SPMSD transaction)(a) 261
Total impact of BI and SPMSD 1,745
Other (4)
Total impact on net sales of changes in structure 1,741
(a) Based on an unaudited sales estimate.
A.3.1.1. Net sales before the impact of IFRS 15
We believe that the impact of the application of IFRS 15 on net sales for the year ended December 31, 2016 is not material (€12 million). Given the significant resources required to restate such information by business, segment and geographical region, we concluded that it would be unduly burdensome to restate such amounts. Therefore, we have chosen to present our detailed analysis of net sales for 2017 and comparable information for 2016 before the impact of IFRS 15 as set forth below. These effects for the years ended December 31, 2017 and 2016 are presented in our consolidated financial statements (Note “A.2.1.1. Impacts of the first-time application of IFRS 15” to our consolidated financial statements). Details of our 2017 net sales as restated for IFRS 15 are presented in the previous
section (“A.2.”) in order to facilitate comparisons with our 2018 net sales for the year ended December 31, 2018.
Before the impact of IFRS 15, net sales for the year ended December 31, 2017 were €35,055 million, 3.6% higher than in 2016. Exchange rate fluctuations had a negative effect of two percentage points overall, mainly as a result of unfavorable trends in the euro against the US dollar, the Egyptian pound, the Turkish lira, the Japanese yen and the Chinese yuan renminbi. At constant exchange rates (CER), net sales were up 5.6%, reflecting the acquisition of BI’s Consumer Healthcare business and the first-time consolidation of Sanofi’s European vaccines business. At constant exchange rates and on a constant structure basis (CER/CS), net sales rose by 0.5%.
106 SANOFI / FORM 20-F 2018
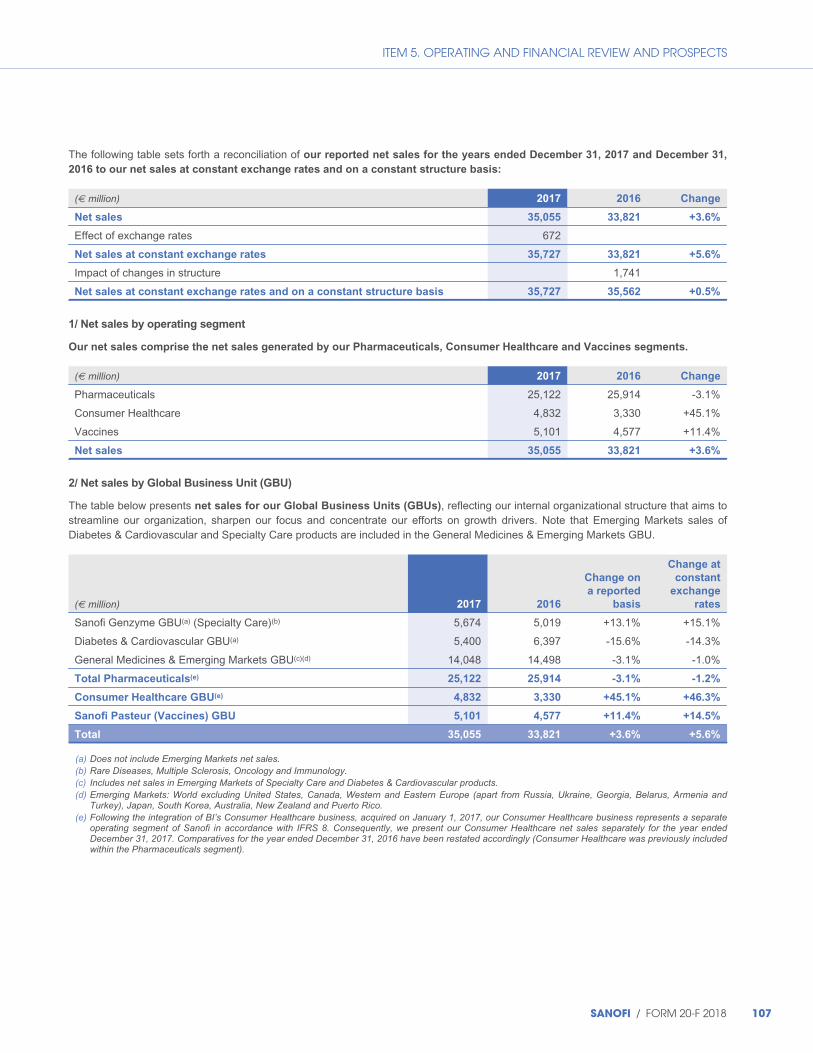
ITEM 5. OPERATING AND FINANCIAL REVIEW AND PROSPECTS
The following table sets forth a reconciliation of our reported net sales for the years ended December 31, 2017 and December 31,
2016 to our net sales at constant exchange rates and on a constant structure basis:
(€ million) 2017 2016 Change
Net sales 35,055 33,821 +3.6%
Effect of exchange rates 672
Net sales at constant exchange rates 35,727 33,821 +5.6%
Impact of changes in structure 1,741
Net sales at constant exchange rates and on a constant structure basis 35,727 35,562 +0.5%
1/ Net sales by operating segment
Our net sales comprise the net sales generated by our Pharmaceuticals, Consumer Healthcare and Vaccines segments.
(€ million) 2017 2016 Change
Pharmaceuticals 25,122 25,914 -3.1%
Consumer Healthcare 4,832 3,330 +45.1%
Vaccines 5,101 4,577 +11.4%
Net sales 35,055 33,821 +3.6%
2/ Net sales by Global Business Unit (GBU)
The table below presents net sales for our Global Business Units (GBUs), reflecting our internal organizational structure that aims to streamline our organization, sharpen our focus and concentrate our efforts on growth drivers. Note that Emerging Markets sales of Diabetes & Cardiovascular and Specialty Care products are included in the General Medicines & Emerging Markets GBU.
(€ million) 2017 2016
Change on
a reported
basis
Change at
constant
exchange
rates
Sanofi Genzyme GBU(a) (Specialty Care)(b) 5,674 5,019 +13.1% +15.1%
Diabetes & Cardiovascular GBU(a) 5,400 6,397 -15.6% -14.3%
General Medicines & Emerging Markets GBU(c)(d) 14,048 14,498 -3.1% -1.0%
Total Pharmaceuticals(e) 25,122 25,914 -3.1% -1.2%
Consumer Healthcare GBU(e) 4,832 3,330 +45.1% +46.3%
Sanofi Pasteur (Vaccines) GBU 5,101 4,577 +11.4% +14.5%
Total 35,055 33,821 +3.6% +5.6%
(a) Does not include Emerging Markets net sales. (b) Rare Diseases, Multiple Sclerosis, Oncology and Immunology. (c) Includes net sales in Emerging Markets of Specialty Care and Diabetes & Cardiovascular products. (d) Emerging Markets: World excluding United States, Canada, Western and Eastern Europe (apart from Russia, Ukraine, Georgia, Belarus, Armenia and
Turkey), Japan, South Korea, Australia, New Zealand and Puerto Rico. (e) Following the integration of BI’s Consumer Healthcare business, acquired on January 1, 2017, our Consumer Healthcare business represents a separate
operating segment of Sanofi in accordance with IFRS 8. Consequently, we present our Consumer Healthcare net sales separately for the year ended December 31, 2017. Comparatives for the year ended December 31, 2016 have been restated accordingly (Consumer Healthcare was previously included within the Pharmaceuticals segment).
SANOFI / FORM 20-F 2018 107
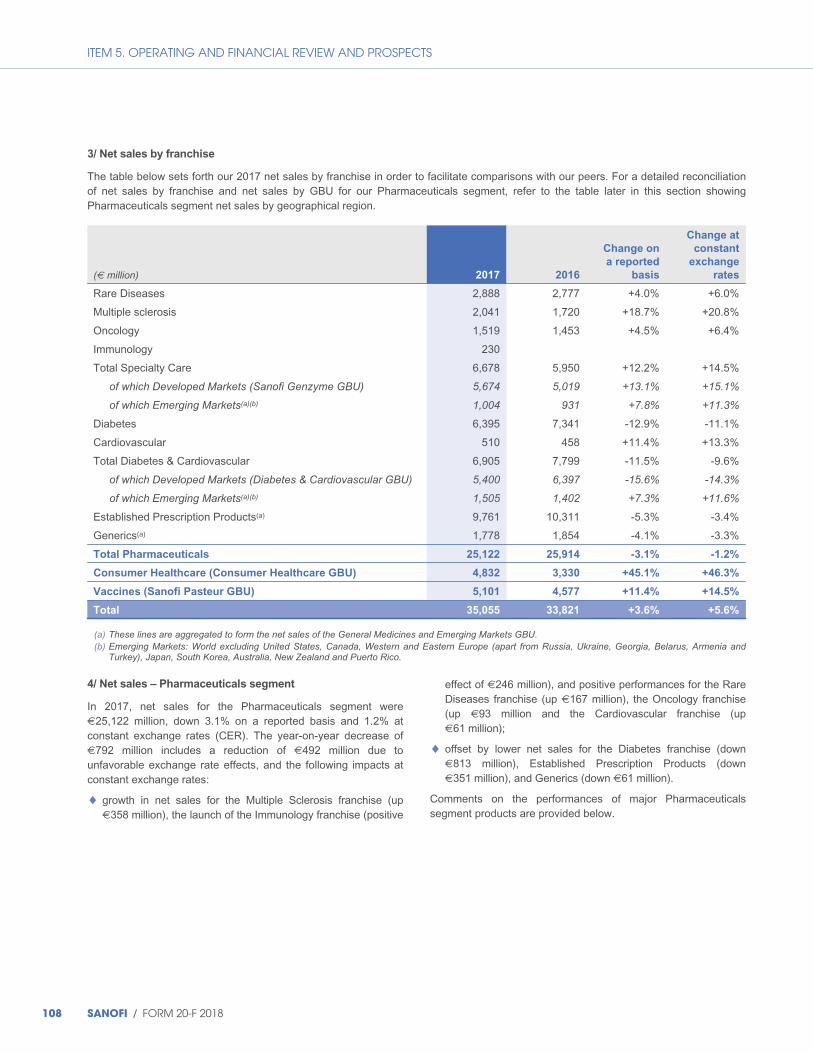
ITEM 5. OPERATING AND FINANCIAL REVIEW AND PROSPECTS
3/ Net sales by franchise
The table below sets forth our 2017 net sales by franchise in order to facilitate comparisons with our peers. For a detailed reconciliation of net sales by franchise and net sales by GBU for our Pharmaceuticals segment, refer to the table later in this section showing Pharmaceuticals segment net sales by geographical region.
(€ million) 2017 2016
Change on
a reported
basis
Change at
constant
exchange
rates
Rare Diseases 2,888 2,777 +4.0% +6.0%
Multiple sclerosis 2,041 1,720 +18.7% +20.8%
Oncology 1,519 1,453 +4.5% +6.4%
Immunology 230
Total Specialty Care 6,678 5,950 +12.2% +14.5%
of which Developed Markets (Sanofi Genzyme GBU) 5,674 5,019 +13.1% +15.1%
of which Emerging Markets(a)(b) 1,004 931 +7.8% +11.3%
Diabetes 6,395 7,341 -12.9% -11.1%
Cardiovascular 510 458 +11.4% +13.3%
Total Diabetes & Cardiovascular 6,905 7,799 -11.5% -9.6%
of which Developed Markets (Diabetes & Cardiovascular GBU) 5,400 6,397 -15.6% -14.3%
of which Emerging Markets(a)(b) 1,505 1,402 +7.3% +11.6%
Established Prescription Products(a) 9,761 10,311 -5.3% -3.4%
Generics(a) 1,778 1,854 -4.1% -3.3%
Total Pharmaceuticals 25,122 25,914 -3.1% -1.2%
Consumer Healthcare (Consumer Healthcare GBU) 4,832 3,330 +45.1% +46.3%
Vaccines (Sanofi Pasteur GBU) 5,101 4,577 +11.4% +14.5%
Total 35,055 33,821 +3.6% +5.6%
(a) These lines are aggregated to form the net sales of the General Medicines and Emerging Markets GBU. (b) Emerging Markets: World excluding United States, Canada, Western and Eastern Europe (apart from Russia, Ukraine, Georgia, Belarus, Armenia and
Turkey), Japan, South Korea, Australia, New Zealand and Puerto Rico.
4/ Net sales – Pharmaceuticals segment
In 2017, net sales for the Pharmaceuticals segment were €25,122 million, down 3.1% on a reported basis and 1.2% at constant exchange rates (CER). The year-on-year decrease of €792 million includes a reduction of €492 million due to unfavorable exchange rate effects, and the following impacts at constant exchange rates:
◆ growth in net sales for the Multiple Sclerosis franchise (up €358 million), the launch of the Immunology franchise (positive
effect of €246 million), and positive performances for the Rare Diseases franchise (up €167 million), the Oncology franchise (up €93 million and the Cardiovascular franchise (up €61 million);
◆ offset by lower net sales for the Diabetes franchise (down €813 million), Established Prescription Products (down €351 million), and Generics (down €61 million).
Comments on the performances of major Pharmaceuticals segment products are provided below.
108 SANOFI / FORM 20-F 2018
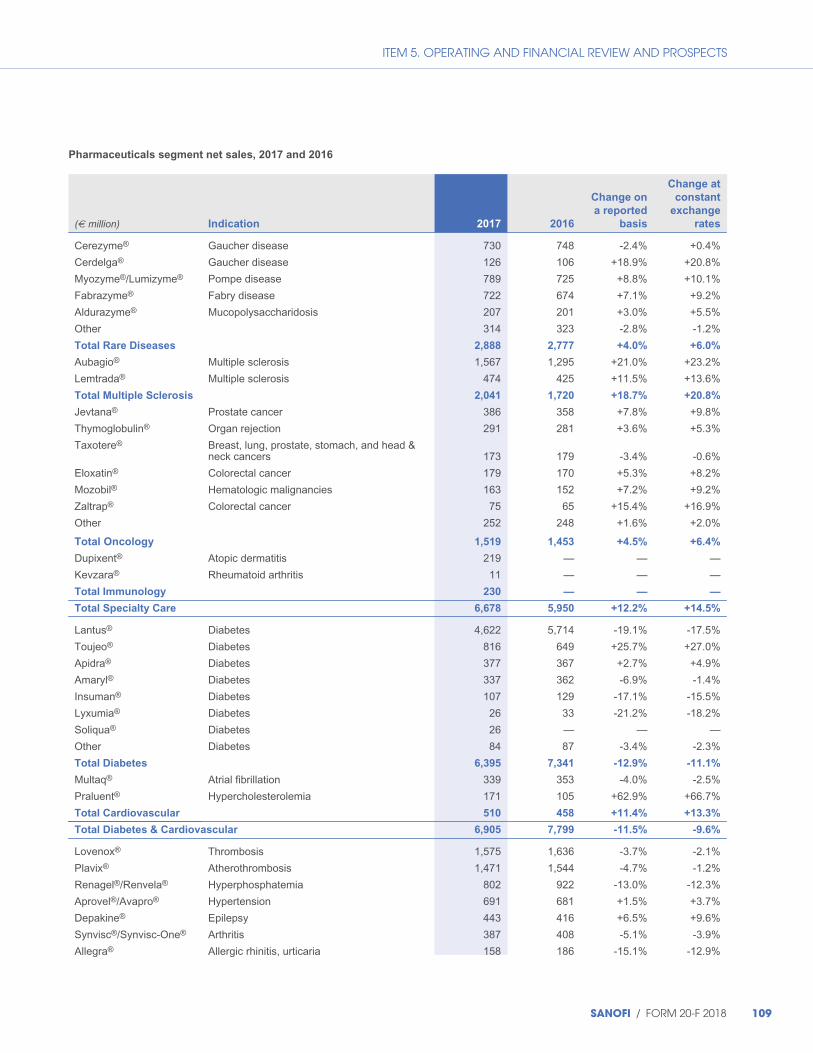
ITEM 5. OPERATING AND FINANCIAL REVIEW AND PROSPECTS
Pharmaceuticals segment net sales, 2017 and 2016
Change at
Change on constant
a reported exchange
(€ million) Indication 2017 2016 basis rates
Cerezyme® Gaucher disease 730 748 -2.4% +0.4%
Cerdelga® Gaucher disease 126 106 +18.9% +20.8%
Myozyme®/Lumizyme® Pompe disease 789 725 +8.8% +10.1%
Fabrazyme® Fabry disease 722 674 +7.1% +9.2%
Aldurazyme® Mucopolysaccharidosis 207 201 +3.0% +5.5%
Other 314 323 -2.8% -1.2%
Total Rare Diseases 2,888 2,777 +4.0% +6.0%
Aubagio® Multiple sclerosis 1,567 1,295 +21.0% +23.2%
Lemtrada® Multiple sclerosis 474 425 +11.5% +13.6%
Total Multiple Sclerosis 2,041 1,720 +18.7% +20.8%
Jevtana® Prostate cancer 386 358 +7.8% +9.8%
Thymoglobulin® Organ rejection 291 281 +3.6% +5.3%
Taxotere® Breast, lung, prostate, stomach, and head & neck cancers 173 179 -3.4% -0.6%
Eloxatin® Colorectal cancer 179 170 +5.3% +8.2%
Mozobil® Hematologic malignancies 163 152 +7.2% +9.2%
Zaltrap® Colorectal cancer 75 65 +15.4% +16.9%
Other 252 248 +1.6% +2.0%
Total Oncology 1,519 1,453 +4.5% +6.4%
Dupixent® Atopic dermatitis 219 — — —
Kevzara® Rheumatoid arthritis 11 — — —
Total Immunology 230 — — —
Total Specialty Care 6,678 5,950 +12.2% +14.5%
Lantus® Diabetes 4,622 5,714 -19.1% -17.5%
Toujeo® Diabetes 816 649 +25.7% +27.0%
Apidra® Diabetes 377 367 +2.7% +4.9%
Amaryl® Diabetes 337 362 -6.9% -1.4%
Insuman® Diabetes 107 129 -17.1% -15.5%
Lyxumia® Diabetes 26 33 -21.2% -18.2%
Soliqua® Diabetes 26 — — —
Other Diabetes 84 87 -3.4% -2.3%
Total Diabetes 6,395 7,341 -12.9% -11.1%
Multaq® Atrial fibrillation 339 353 -4.0% -2.5%
Praluent® Hypercholesterolemia 171 105 +62.9% +66.7%
Total Cardiovascular 510 458 +11.4% +13.3%
Total Diabetes & Cardiovascular 6,905 7,799 -11.5% -9.6%
Lovenox® Thrombosis 1,575 1,636 -3.7% -2.1%
Plavix® Atherothrombosis 1,471 1,544 -4.7% -1.2%
Renagel®/Renvela® Hyperphosphatemia 802 922 -13.0% -12.3%
Aprovel®/Avapro® Hypertension 691 681 +1.5% +3.7%
Depakine® Epilepsy 443 416 +6.5% +9.6%
Synvisc®/Synvisc-One® Arthritis 387 408 -5.1% -3.9%
Allegra® Allergic rhinitis, urticaria 158 186 -15.1% -12.9%
SANOFI / FORM 20-F 2018 109

ITEM 5. OPERATING AND FINANCIAL REVIEW AND PROSPECTS
(€ million) Indication 2017 2016
Change on
a reported
basis
Change at
constant
exchange
rates
Stilnox®/Ambien®/Myslee® Sleep disorders 259 304 -14.8% -13.5%
Tritace® Hypertension 241 245 -1.6% +1.2%
Targocid® Bacterial infections 130 149 -12.8% -10.1%
Lasix® Edema, hypertension 137 148 -7.4% -4.7%
Other 3,467 3,672 -5.6% -4.1%
Total Established Prescription Products 9,761 10,311 -5.3% -3.4%
Generics 1,778 1,854 -4.1% -3.3%
Total Pharmaceuticals 25,122 25,914 -3.1% -1.2%
Rare diseases franchise
Net sales for the Rare Diseases franchise reached €2,888 million in 2017, up 4.0% on a reported basis and 6.0% at constant exchange rates (CER). Sales growth was recorded across all geographies: 8.5% CER in Emerging Markets(1), 6.4% CER in the United States, 5.0% CER in Europe(2) and 3.9% CER in the Rest of the World region(3).
In Gaucher disease, net sales of Cerezyme® were stable year-on-year at €730 million. Sales growth in Emerging Markets (+2.1% CER at €229 million) offset a decrease in the Rest of the World region (-8.3% CER at €43 million). Cerdelga® reported net sales of €126 million (+20.8% CER), of which €95 million were generated in the United States (+14.1% CER). In Europe, net sales of Cerdelga® rose by 52.9% CER to €26 million.
Net sales of Myozyme® / Lumizyme® in Pompe disease rose by 10.1% CER to €789 million, driven by sales in the United States (+11.3% CER, at €262 million) and Europe (+8.6% CER, at €352 million). Net sales also rose in Emerging Markets (+12.7% CER, at €116 million) and in the Rest of the World region (+8.9% CER, at €59 million). This sales growth was fueled by increased diagnosis and treatment of Pompe disease.
Fabrazyme® achieved net sales growth of 9.2% CER, to €722 million. Sales are advancing in many countries due to growth in the number of patients diagnosed with, and treated for, Fabry disease. Net sales of the product were up 9.3% CER in the United States (at €369 million); 5.8% CER in Europe (at €163 million) despite the launch of new rival products; 9.5% CER in the Rest of the World region (at €112 million); and 16.2% CER in Emerging Markets (at €78 million).
Multiple sclerosis franchise
Net sales for the Multiple Sclerosis franchise reached €2,041 million in 2017, up 18.7% on a reported basis and 20.8% CER, on strong performances by Aubagio® and Lemtrada® in the United States and Europe.
Aubagio® posted net sales of €1,567 million (+23.2% CER), driven by the United States (+22.0% CER, at €1,084 million) and Europe (+26.0% CER, at €387 million).
Net sales of Lemtrada® amounted to €474 million (+13.6% CER), including €246 million in the United States (+7.3% CER) and €174 million in Europe (+18.5% CER).
Oncology franchise
The Oncology franchise generated net sales of €1,519 million, up 4.5% on a reported basis and 6.4% CER, due largely to public-sector orders for Leukine® in the United States, a good performance for the franchise in Emerging Markets, and overall growth in sales of Jevtana® and Thymoglobulin®.
Net sales of Jevtana® totaled €386 million in 2017 (+9.8% CER), driven by growth in the United States (+6.6% CER, at €159 million), Europe (+7.2% CER, at €148 million) and Japan (+17.1% CER, at €46 million).
Thymoglobulin® net sales rose by 5.3% CER to €291 million, largely on a good performance in Emerging Markets (+13.6% CER, at €66 million).
Net sales of Taxotere® were stable year-on-year at €173 million. This reflects stronger sales in Emerging Markets (+7.7% CER, at €136 million), especially in China (+13.6% CER, at €65 million), which more than offset the effect of competition from generics, especially in Japan (-38.5% CER, at €15 million).
Net sales of Eloxatin® rose by 8.2% CER to €179 million. This reflects stronger sales in Emerging Markets (+13.4% CER, at €147 million), especially in China (+15.2% CER, at €103 million), which more than offset a fall in Canadian sales due to competition from generics.
(1) World excluding United States, Canada, Western and Eastern Europe (apart from Russia, Ukraine, Georgia, Belarus, Armenia and Turkey), Japan, South Korea, Australia, New Zealand and Puerto Rico.
(2) Western Europe and Eastern Europe excluding Eurasia (Russia, Ukraine, Georgia, Belarus, Armenia and Turkey). (3) Japan, South Korea, Canada, Australia, New Zealand and Puerto Rico.
110 SANOFI / FORM 20-F 2018
ITEM 5. OPERATING AND FINANCIAL REVIEW AND PROSPECTS
Immunology franchise
Dupixent® (dupilumab, developed in collaboration with Regeneron), for adults with moderate to severe atopic dermatitis, was approved by the FDA in March 2017 and made available in the US market. Since then, the product has generated US net sales of €216 million, reflecting substantial unmet medical needs and rapid access to the market. In Europe, Dupixent® was approved at the end of September 2017 for the treatment of adults with moderate to severe atopic dermatitis requiring systemic treatment; the product was made available at the end of the year in Germany, where it generated net sales of €2 million.
Kevzara® (sarilumab, developed in collaboration with Regeneron), a treatment for rheumatoid arthritis, was approved by the FDA on May 22, 2017 and made available in June 2017 in the US market, where it achieved net sales of €10 million. The product has also been approved in Europe, and has been launched in a number of countries (Germany, the Netherlands and the United Kingdom).
Diabetes franchise
Net sales for the Diabetes franchise amounted to €6,395 million in 2017, down 12.9% on a reported basis and 11.1% CER. The main factor was a fall in sales of Lantus® in the United States, where Diabetes franchise net sales were down 22.8% CER at €3,128 million. As previously indicated, the decline in US net sales for the Diabetes franchise accelerated during 2017, following the consecutive exclusion of a number of diabetes treatments from the reimbursement lists of two of the country’s leading healthcare insurance providers: UnitedHealth (from April 1, 2017) and CVS. Outside the United States, Diabetes franchise net sales advanced in Emerging Markets (+11.4% CER, at €1,494 million) but fell in Europe (-2.0% CER, at €1,287 million), where a good performance from Toujeo® partially compensated for weaker sales of Lantus®.
In 2017, net sales of insulin glargines (Lantus® and Toujeo®) were down 13.0% CER at €5,438 million.
Net sales of Lantus® were down 17.5% CER in 2017, at €4,622 million. In the United States, sales were down 26.6% CER at €2,542 million, due mainly to a lower average net price, the switching of patients to Toujeo®, and the effect of the product’s exclusion from reimbursement lists as described above. Net sales in Europe fell by 12.8% CER to €760 million, due largely to the launch of a biosimilar of Lantus® and the switching of patients to Toujeo®. Over the same period, sales of Lantus® in Emerging Markets reached €1,005 million, up 9.2% CER, driven largely by Africa and Middle East (+18.8% CER, at €288 million) and Asia (+10.6% CER, at €424 million), especially China (+15.8% CER, at €319 million). During 2017, Sanofi filed two patent infringement suits relating to Lantus® in the United States District Court for the District of New Jersey (United States): one against Merck (in August) and the other against Mylan (in October). For further information, refer to “Item 8 – Information on Legal or Arbitration Proceedings”.
The new-generation basal insulin Toujeo® posted net sales growth of 27.0% CER in 2017, to €816 million. Net sales in the United States decreased by 2.1% CER to €455 million essentially as the result of a decrease in the average net price of the product during the fourth quarter of 2017. However, this was more than offset by sales growth in Europe (+80.8% CER, at €217 million), Emerging Markets (+300.0% CER, at €79 million) and the Rest of the World region (+88.6% CER, at €65 million).
Net sales of Amaryl® fell by 1.4% CER in 2017, to €337 million. Sales growth in Emerging Markets (+2.1% CER, at €278 million) did not fully compensate for lower net sales in the Rest of the World region (-10.0% CER, at €36 million) and in Europe (-22.2% CER, at €21 million).
Net sales of Apidra® rose by 4.9% CER in 2017, to €377 million. Lower sales in the United States (-10.4% CER, at €102 million) were offset by sales growth in Emerging Markets (+25.9% CER, at €97 million) and in Europe (+7.1% CER, at €136 million).
Soliqua® 100/33 / Suliqua® (injectable insulin glargine 100 Units/mL and lixisenatide 33 mcg/mL) were launched at the start of 2017 in the United States, and at the end of 2017 in the Netherlands. Soliqua® 100/33 has generated €26 million of net sales in the United States since launch.
Cardiovascular franchise
In 2017, net sales of Praluent® (alirocumab, developed in collaboration with Regeneron) reached €171 million, of which €116 million was generated in the United States and €46 million in Europe. The relatively limited rise in sales during the period reflects significant restrictions by US payers and limited access to the European market. In October 2017, the US Court of Appeals for the Federal Circuit ordered a new trial and vacated the permanent injunction in the dispute concerning Amgen’s asserted patent claims for antibodies targeting PCSK9. This ruling means that Sanofi and Regeneron will continue marketing, selling and manufacturing Praluent® in the US. For further information on litigation relating to Praluent®, refer to Note D.22. to our consolidated financial statements (included as Item 18 of this Annual Report on Form 20-F) and “– Item 8 – Information on Legal or Arbitration Proceedings”.
Net sales of Multaq® amounted to €339 million in 2017, down 2.5% CER year-on-year. The bulk of the sales were generated in the United States (-2.7% CER, at €286 million) and Europe (-2.3% CER, at €42 million).
Established prescription products
Net sales of Established Prescription Products in 2017 were €9,761 million, down 5.3% on a reported basis and 3.4% CER. Growth in Emerging Markets net sales (+4.8% CER, at €3,800 million) failed to offset lower net sales in Europe (-4.4% CER, at €3,473 million), the start of generic competition for Renvela®/Renagel® in the United States, and the impact of
SANOFI / FORM 20-F 2018 111

ITEM 5. OPERATING AND FINANCIAL REVIEW AND PROSPECTS
competition from generics of Plavix® in Japan. In the United States and the Rest of the World region, net sales of Established Prescription Products fell by 13.8% CER (to €1,269 million) and 11.7% CER (to €1,219 million), respectively.
Net sales of Lovenox® were €1,575 million, down 2.1% CER, due largely to increased competition in Europe (-7.1% CER, at €951 million) with the arrival of biosimilars in the United Kingdom and Germany. This decline canceled out a good performance in Emerging Markets (+7.8% CER, at €475 million).
Net sales of Plavix® in 2017 were €1,471 million (-1.2% CER), reflecting generic competition in Japan (-30.7% CER, at €235 million) and Europe (-7.4% CER, at €150 million). The effect was partly offset by growth in sales of Plavix® in Emerging Markets (+10.4% CER, at €1,026 million), especially in China where the product posted net sales of €758 million (+12.1% CER). Sales of Plavix® in the United States and Puerto Rico are handled by BMS under the terms of the Sanofi-BMS alliance (see Note C.2., “Alliance Arrangements with Bristol-Myers Squibb (BMS)”, to our consolidated financial statements, included at Item 18 of this Annual Report on Form 20-F).
Renvela®/Renagel® posted net sales of €802 million in 2017, down 12.3% CER, mainly on generic competition in the United States (-14.8% CER, at €645 million) where the first generic versions in powder and pill form were approved in June and July 2017, respectively. In October 2017, Sanofi launched an approved generic version of Renvela®/Renagel® in the United States. In Europe, sales of Renvela®/Renagel® fell by 13.4% CER to €71 million, also due to competition from generics.
Net sales of Aprovel®/Avapro® for 2017 were €691 million (+3.7% CER), largely on sales growth in Emerging Markets (+8.7% CER, at €433 million), especially China (+14.2% CER, at €264 million), and in the Rest of the World region (+3.1% CER, at €132 million). In Europe, net sales of Aprovel®/Avapro® were down 9.4% CER at €115 million, due to competition from generics.
We have no comments on sales of our other Established Prescription Products.
Generics
Generics net sales for 2017 were €1,778 million, down 4.1% on a reported basis and 3.3% CER.
Emerging Markets generated net sales of €758 million, down 2.9% CER, due mainly to lower sales in Asia (-68.5% CER, at €22 million) following the divestment of a distribution business in China. The decrease in net sales in Asia more than offset increased Generics sales in Latin America (+1.7% CER, at €428 million), Africa and Middle East (+1.6% CER, at €117 million) and Eurasia (+9.3% CER, at €190 million). Generics sales were also lower in Europe (-4.9% CER, at €760 million) and the United States (-12.0% CER, at €150 million), but increased in the Rest of the World region (+23.9% CER, at €110 million).
We have confirmed our commitment to our Generics business in other parts of the world, and will focus more on Emerging Markets in order to develop the business in those countries.
The following table breaks down 2017 net sales of our Pharmaceuticals segment products by geographical region:
Rest
Total Change United Change of the Change Emerging Change Total Change
(€ million) GBU Europe(a) at CER States at CER world(b) at CER Markets(c) at CER Franchise at CER
Cerezyme® 501 281 +0.7% 177 0.0% 43 -8.3% 229 +2.1% 730 +0.4%
Cerdelga® 125 26 +52.9% 95 +14.1% 4 0.0% 1 — 126 +20.8%
Myozyme®/Lumizyme® 673 352 +8.6% 262 +11.3% 59 +8.9% 116 +12.7% 789 +10.1%
Fabrazyme® 644 163 +5.8% 369 +9.3% 112 +9.5% 78 +16.2% 722 +9.2%
Aldurazyme® 142 75 +1.3% 42 +2.4% 25 +8.3% 65 +11.7% 207 +5.5%
Other 269 64 -4.5% 113 -5.8% 92 0.0% 45 +15.8% 314 -1.2%
Total Rare Diseases 2,354 961 +5.0% 1,058 +6.4% 335 +3.9% 534 +8.5% 2,888 +6.0%
Aubagio® 1,530 387 +26.0% 1,084 +22.0% 59 +31.1% 37 +17.6% 1,567 +23.2%
Lemtrada® 450 174 +18.5% 246 +7.3% 30 +26.1% 24 +38.9% 474 +13.6%
Total Multiple Sclerosis 1,980 561 +23.5% 1,330 +19.0% 89 +29.4% 61 +25.0% 2,041 +20.8%
Jevtana® 359 148 +7.2% 159 +6.6% 52 +25.0% 27 +17.4% 386 +9.8%
Thymoglobulin® 225 39 +2.6% 162 +3.8% 24 0.0% 66 +13.6% 291 +5.3%
Taxotere® 37 3 -25.0% — -100.0% 34 -14.6% 136 +7.7% 173 -0.6%
Eloxatin® 32 4 0.0% 1 — 27 -15.6% 147 +13.4% 179 +8.2%
Mozobil® 154 44 +4.8% 96 +3.2% 14 +87.5% 9 +28.6% 163 +9.2%
Zaltrap® 67 51 +8.5% 9 -35.7% 7 — 8 +125.0% 75 +16.9%
Other 236 51 +1.9% 162 +3.8% 23 -16.7% 16 +13.3% 252 +2.0%
112 SANOFI / FORM 20-F 2018

ITEM 5. OPERATING AND FINANCIAL REVIEW AND PROSPECTS
(€ million) Total
GBU Europe(a)
Change
at CER
United
States
Change
at CER
Rest
of the
world(b)
Change
at CER
Emerging
Markets(c)
Change
at CER
Total
Franchise
Change
at CER
Total Oncology
Dupixent®
Kevzara®
1,110
219
11
340
2
1
+5.2%
—
—
589
216
10
+2.9%
—
—
181
1
—
+5.8%
—
—
409
—
—
+13.2%
—
—
1,519
219
11
+6.4%
—
—
Total Immunology 230 3 — 226 — 1 — — — 230 —
Sanofi Genzyme
(Specialty Care) 5,674 1,865 +10.2% 3,203 +19.8% 606 +7.7% 1,004 +11.3% 6,678 +14.5%
Lantus® 3,617 760 -12.8% 2,542 -26.6% 315 -10.7% 1,005 +9.2% 4,622 -17.5%
Toujeo® 737 217 +80.8% 455 -2.1% 65 +88.6% 79 +300.0% 816 +27.0%
Apidra® 280 136 +7.1% 102 -10.4% 42 0.0% 97 +25.9% 377 +4.9%
Amaryl® 59 21 -22.2% 2 -33.3% 36 -10.0% 278 +2.1% 337 -1.4%
Insuman® 78 76 -7.3% 2 -33.3% — — 29 -29.5% 107 -15.5%
Lyxumia® 24 16 -23.8% — — 8 0.0% 2 -33.3% 26 -18.2%
Soliqua® 26 — — 26 — — — — — 26 —
Other 80 61 -4.7% -1 -133.3% 20 +23.5% 4 +33.3% 84 -2.3%
Total Diabetes 4,901 1,287 -2.0% 3,128 -22.8% 486 -1.4% 1,494 +11.4% 6,395 -11.1%
Multaq® 332 42 -2.3% 286 -2.7% 4 -25.0% 7 +16.7% 339 -2.5%
Praluent® 167 46 +155.6% 116 +40.0% 5 +500.0% 4 +300.0% 171 +66.7%
Total Cardiovascular 499 88 +43.5% 402 +6.8% 9 +80.0% 11 +57.1% 510 +13.3%
Total Diabetes &
Cardiovascular 5,400 1,375 +0.1% 3,530 -20.2% 495 -0.6% 1,505 +11.6% 6,905 -9.6%
Lovenox® 1,575 951 -7.1% 58 +9.3% 91 -2.2% 475 +7.8% 1,575 -2.1%
Plavix® 1,471 150 -7.4% 1 0.0% 294 -26.0% 1,026 +10.4% 1,471 -1.2%
Renagel®/Renvela® 802 71 -13.4% 645 -14.8% 36 +6.1% 50 +20.9% 802 -12.3%
Aprovel®/CoAprovel® 691 115 -9.4% 11 -20.0% 132 +3.1% 433 +8.7% 691 +3.7%
Depakine® 443 161 +1.2% — — 15 0.0% 267 +15.8% 443 +9.6%
Synvisc® / Synvisc-One® 387 30 -9.1% 292 -5.1% 14 0.0% 51 +6.3% 387 -3.9%
Allegra® 158 9 0.0% — — 149 -13.6% — — 158 -12.9%
Stilnox®/Ambien®/Myslee® 259 40 -9.1% 55 -33.3% 106 -8.3% 58 +1.8% 259 -13.5%
Tritace® 241 152 -1.3% — — 5 +25.0% 84 +4.6% 241 +1.2%
Targocid® 130 59 -18.9% — — 6 -14.3% 65 0.0% 130 -10.1%
Lasix® 137 72 -4.0% — — 11 -36.8% 54 +5.6% 137 -4.7%
Other 3,467 1,663 -1.7% 207 -19.7% 360 -5.5% 1,237 -3.8% 3,467 -4.1%
Total Established
Prescription Products 9,761 3,473 -4.4% 1,269 -13.8% 1,219 -11.7% 3,800 +4.8% 9,761 -3.4%
Generics 1,778 760 -4.9% 150 -12.0% 110 +23.9% 758 -2.9% 1,778 -3.3%
Total Emerging Markets
– Specialty Care 1,004 — — — — — — 1,004 +11.3% — —
Total Emerging Markets
– Diabetes &
Cardiovascular 1,505 — — — — — — 1,505 +11.6% — —
General Medicines &
Emerging Markets 14,048 4,233 -4.5% 1,419 -13.6% 1,329 -9.5% 7,067 +6.2%
Total Pharmaceuticals 25,122 7,473 -0.3% 8,152 -6.7% 2,430 -4.0% 7,067 +6.2% 25,122 -1.2%
(a) Western Europe and Eastern Europe excluding Eurasia (Russia, Ukraine, Georgia, Belarus, Armenia and Turkey). (b) Japan, South Korea, Canada, Australia, New Zealand and Puerto Rico. (c) World excluding United States, Canada, Western and Eastern Europe (apart from Eurasia), Japan, South Korea, Australia, New Zealand and Puerto Rico.
SANOFI / FORM 20-F 2018 113
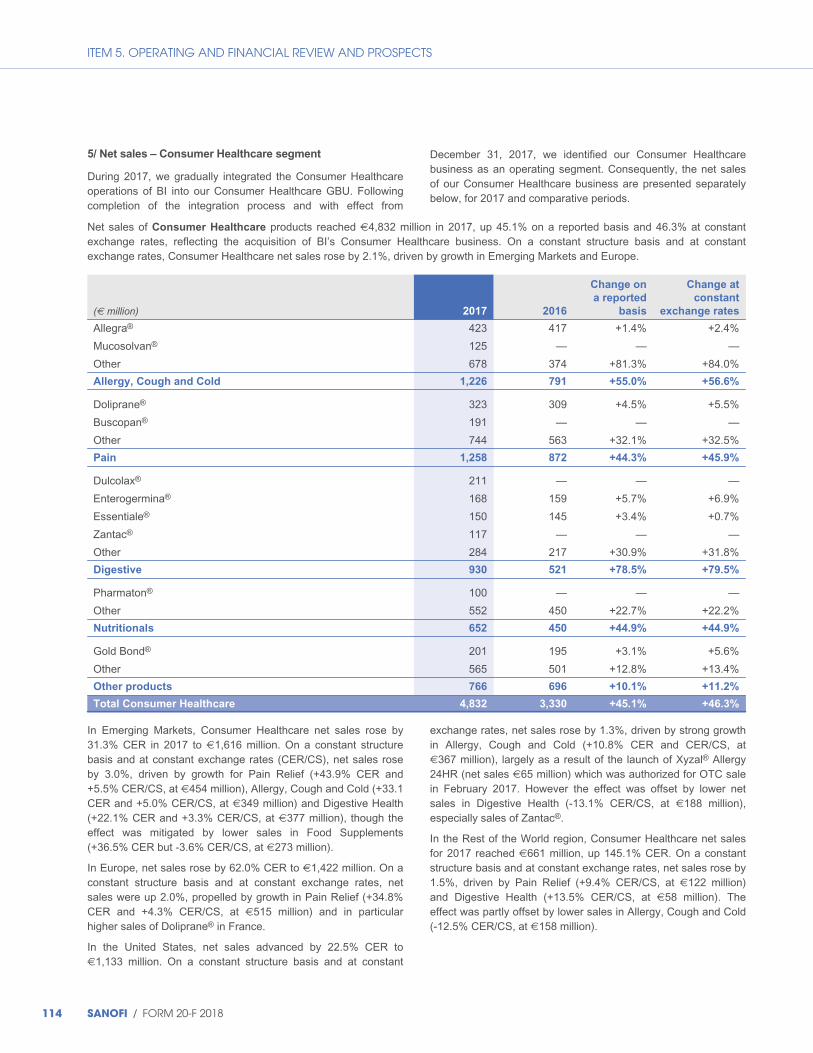
ITEM 5. OPERATING AND FINANCIAL REVIEW AND PROSPECTS
5/ Net sales – Consumer Healthcare segment
During 2017, we gradually integrated the Consumer Healthcare operations of BI into our Consumer Healthcare GBU. Following completion of the integration process and with effect from
December 31, 2017, we identified our Consumer Healthcare business as an operating segment. Consequently, the net sales of our Consumer Healthcare business are presented separately below, for 2017 and comparative periods.
Net sales of Consumer Healthcare products reached €4,832 million in 2017, up 45.1% on a reported basis and 46.3% at constant exchange rates, reflecting the acquisition of BI’s Consumer Healthcare business. On a constant structure basis and at constant exchange rates, Consumer Healthcare net sales rose by 2.1%, driven by growth in Emerging Markets and Europe.
(€ million) 2017 2016
Change on
a reported
basis
Change at
constant
exchange rates
Allegra® 423 417 +1.4% +2.4%
Mucosolvan® 125 — — —
Other 678 374 +81.3% +84.0%
Allergy, Cough and Cold 1,226 791 +55.0% +56.6%
Doliprane® 323 309 +4.5% +5.5%
Buscopan® 191 — — —
Other 744 563 +32.1% +32.5%
Pain 1,258 872 +44.3% +45.9%
Dulcolax® 211 — — —
Enterogermina® 168 159 +5.7% +6.9%
Essentiale® 150 145 +3.4% +0.7%
Zantac® 117 — — —
Other 284 217 +30.9% +31.8%
Digestive 930 521 +78.5% +79.5%
Pharmaton® 100 — — —
Other 552 450 +22.7% +22.2%
Nutritionals 652 450 +44.9% +44.9%
Gold Bond® 201 195 +3.1% +5.6%
Other 565 501 +12.8% +13.4%
Other products 766 696 +10.1% +11.2%
Total Consumer Healthcare 4,832 3,330 +45.1% +46.3%
In Emerging Markets, Consumer Healthcare net sales rose by 31.3% CER in 2017 to €1,616 million. On a constant structure basis and at constant exchange rates (CER/CS), net sales rose by 3.0%, driven by growth for Pain Relief (+43.9% CER and +5.5% CER/CS, at €454 million), Allergy, Cough and Cold (+33.1 CER and +5.0% CER/CS, at €349 million) and Digestive Health (+22.1% CER and +3.3% CER/CS, at €377 million), though the effect was mitigated by lower sales in Food Supplements (+36.5% CER but -3.6% CER/CS, at €273 million).
In Europe, net sales rose by 62.0% CER to €1,422 million. On a constant structure basis and at constant exchange rates, net sales were up 2.0%, propelled by growth in Pain Relief (+34.8% CER and +4.3% CER/CS, at €515 million) and in particular higher sales of Doliprane® in France.
In the United States, net sales advanced by 22.5% CER to €1,133 million. On a constant structure basis and at constant
exchange rates, net sales rose by 1.3%, driven by strong growth in Allergy, Cough and Cold (+10.8% CER and CER/CS, at €367 million), largely as a result of the launch of Xyzal® Allergy 24HR (net sales €65 million) which was authorized for OTC sale in February 2017. However the effect was offset by lower net sales in Digestive Health (-13.1% CER/CS, at €188 million), especially sales of Zantac®.
In the Rest of the World region, Consumer Healthcare net sales for 2017 reached €661 million, up 145.1% CER. On a constant structure basis and at constant exchange rates, net sales rose by 1.5%, driven by Pain Relief (+9.4% CER/CS, at €122 million) and Digestive Health (+13.5% CER/CS, at €58 million). The effect was partly offset by lower sales in Allergy, Cough and Cold (-12.5% CER/CS, at €158 million).
114 SANOFI / FORM 20-F 2018
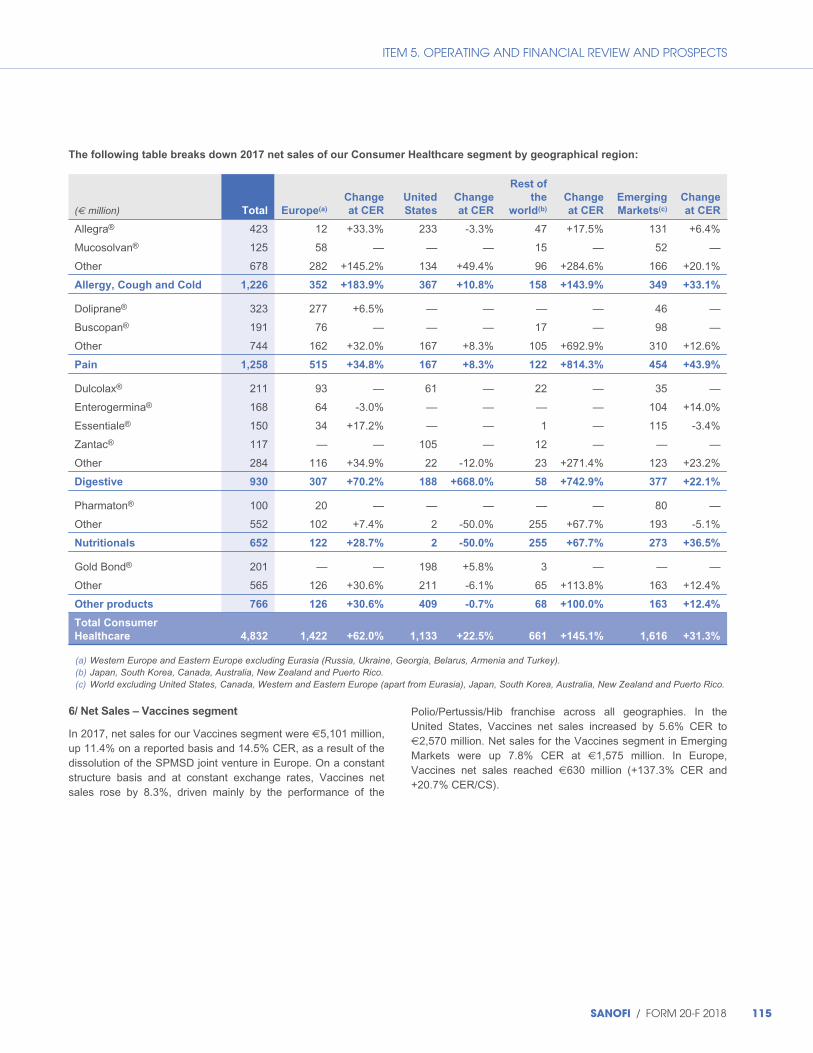
ITEM 5. OPERATING AND FINANCIAL REVIEW AND PROSPECTS
The following table breaks down 2017 net sales of our Consumer Healthcare segment by geographical region:
(€ million) Total Europe(a)
Change
at CER
United
States
Change
at CER
Rest of
the
world(b)
Change
at CER
Emerging
Markets(c)
Change
at CER
Allegra®
Mucosolvan®
423
125
12
58
+33.3%
—
233
—
-3.3%
—
47
15
+17.5%
—
131
52
+6.4%
—
Other 678 282 +145.2% 134 +49.4% 96 +284.6% 166 +20.1%
Allergy, Cough and Cold 1,226 352 +183.9% 367 +10.8% 158 +143.9% 349 +33.1%
Doliprane®
Buscopan®
323
191
277
76
+6.5%
—
—
—
—
—
—
17
—
—
46
98
—
—
Other 744 162 +32.0% 167 +8.3% 105 +692.9% 310 +12.6%
Pain 1,258 515 +34.8% 167 +8.3% 122 +814.3% 454 +43.9%
Dulcolax® 211 93 — 61 — 22 — 35 —
Enterogermina®
Essentiale®
168
150
64
34
-3.0%
+17.2%
—
—
—
—
—
1
—
—
104
115
+14.0%
-3.4%
Zantac® 117 — — 105 — 12 — — —
Other 284 116 +34.9% 22 -12.0% 23 +271.4% 123 +23.2%
Digestive 930 307 +70.2% 188 +668.0% 58 +742.9% 377 +22.1%
Pharmaton® 100 20 — — — — — 80 —
Other 552 102 +7.4% 2 -50.0% 255 +67.7% 193 -5.1%
Nutritionals 652 122 +28.7% 2 -50.0% 255 +67.7% 273 +36.5%
Gold Bond® 201 — — 198 +5.8% 3 — — —
Other 565 126 +30.6% 211 -6.1% 65 +113.8% 163 +12.4%
Other products 766 126 +30.6% 409 -0.7% 68 +100.0% 163 +12.4%
Total Consumer
Healthcare 4,832 1,422 +62.0% 1,133 +22.5% 661 +145.1% 1,616 +31.3%
(a) Western Europe and Eastern Europe excluding Eurasia (Russia, Ukraine, Georgia, Belarus, Armenia and Turkey). (b) Japan, South Korea, Canada, Australia, New Zealand and Puerto Rico. (c) World excluding United States, Canada, Western and Eastern Europe (apart from Eurasia), Japan, South Korea, Australia, New Zealand and Puerto Rico.
6/ Net Sales – Vaccines segment
In 2017, net sales for our Vaccines segment were €5,101 million, up 11.4% on a reported basis and 14.5% CER, as a result of the dissolution of the SPMSD joint venture in Europe. On a constant structure basis and at constant exchange rates, Vaccines net sales rose by 8.3%, driven mainly by the performance of the
Polio/Pertussis/Hib franchise across all geographies. In the United States, Vaccines net sales increased by 5.6% CER to €2,570 million. Net sales for the Vaccines segment in Emerging Markets were up 7.8% CER at €1,575 million. In Europe, Vaccines net sales reached €630 million (+137.3% CER and +20.7% CER/CS).
SANOFI / FORM 20-F 2018 115
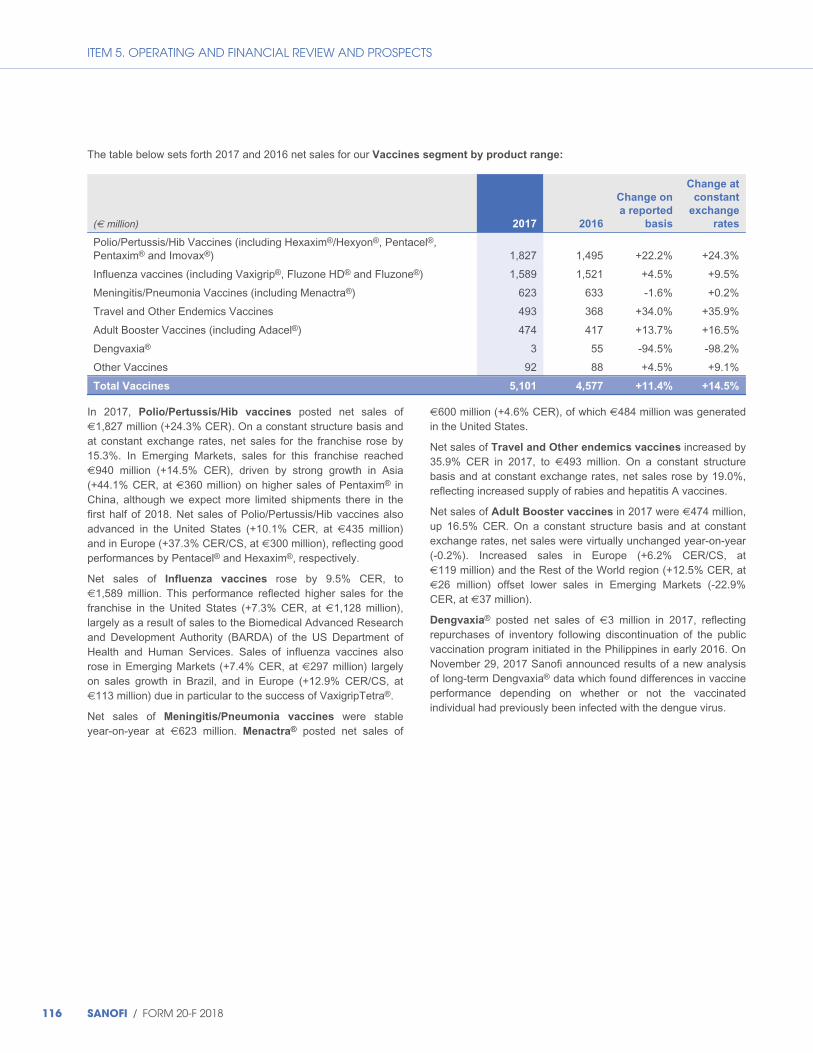
ITEM 5. OPERATING AND FINANCIAL REVIEW AND PROSPECTS
The table below sets forth 2017 and 2016 net sales for our Vaccines segment by product range:
Change at
Change on constant
a reported exchange
(€ million) 2017 2016 basis rates
Polio/Pertussis/Hib Vaccines (including Hexaxim®/Hexyon®, Pentacel®, Pentaxim® and Imovax®) 1,827 1,495 +22.2% +24.3%
Influenza vaccines (including Vaxigrip®, Fluzone HD® and Fluzone®) 1,589 1,521 +4.5% +9.5%
Meningitis/Pneumonia Vaccines (including Menactra®) 623 633 -1.6% +0.2%
Travel and Other Endemics Vaccines 493 368 +34.0% +35.9%
Adult Booster Vaccines (including Adacel®) 474 417 +13.7% +16.5%
Dengvaxia® 3 55 -94.5% -98.2%
Other Vaccines 92 88 +4.5% +9.1%
Total Vaccines 5,101 4,577 +11.4% +14.5%
In 2017, Polio/Pertussis/Hib vaccines posted net sales of €1,827 million (+24.3% CER). On a constant structure basis and at constant exchange rates, net sales for the franchise rose by 15.3%. In Emerging Markets, sales for this franchise reached €940 million (+14.5% CER), driven by strong growth in Asia (+44.1% CER, at €360 million) on higher sales of Pentaxim® in China, although we expect more limited shipments there in the first half of 2018. Net sales of Polio/Pertussis/Hib vaccines also advanced in the United States (+10.1% CER, at €435 million) and in Europe (+37.3% CER/CS, at €300 million), reflecting good performances by Pentacel® and Hexaxim®, respectively.
Net sales of Influenza vaccines rose by 9.5% CER, to €1,589 million. This performance reflected higher sales for the franchise in the United States (+7.3% CER, at €1,128 million), largely as a result of sales to the Biomedical Advanced Research and Development Authority (BARDA) of the US Department of Health and Human Services. Sales of influenza vaccines also rose in Emerging Markets (+7.4% CER, at €297 million) largely on sales growth in Brazil, and in Europe (+12.9% CER/CS, at €113 million) due in particular to the success of VaxigripTetra®.
Net sales of Meningitis/Pneumonia vaccines were stable year-on-year at €623 million. Menactra® posted net sales of
€600 million (+4.6% CER), of which €484 million was generated in the United States.
Net sales of Travel and Other endemics vaccines increased by 35.9% CER in 2017, to €493 million. On a constant structure basis and at constant exchange rates, net sales rose by 19.0%, reflecting increased supply of rabies and hepatitis A vaccines.
Net sales of Adult Booster vaccines in 2017 were €474 million, up 16.5% CER. On a constant structure basis and at constant exchange rates, net sales were virtually unchanged year-on-year (-0.2%). Increased sales in Europe (+6.2% CER/CS, at €119 million) and the Rest of the World region (+12.5% CER, at €26 million) offset lower sales in Emerging Markets (-22.9% CER, at €37 million).
Dengvaxia® posted net sales of €3 million in 2017, reflecting repurchases of inventory following discontinuation of the public vaccination program initiated in the Philippines in early 2016. On November 29, 2017 Sanofi announced results of a new analysis of long-term Dengvaxia® data which found differences in vaccine performance depending on whether or not the vaccinated individual had previously been infected with the dengue virus.
116 SANOFI / FORM 20-F 2018

ITEM 5. OPERATING AND FINANCIAL REVIEW AND PROSPECTS
The following table presents the 2017 net sales of our Vaccines segment by geographical region:
(€ million) Total Europe(a)
Change
at CER
United
States
Change
at CER
Rest of
the
world(b)
Change
at CER
Emerging
Markets(c)
Change
at CER
Polio/Pertussis/Hib Vaccines (including Hexaxim®/Hexyon®, Pentacel®, Pentaxim® and Imovax®) 1,827 300 +187.6% 435 +10.1% 152 +2.6% 940 +14.5%
Influenza Vaccines (including Vaxigrip®, Fluzone HD® and Fluzone®) 1,589 113 +37.3% 1,128 +7.3% 51 +28.2% 297 +7.4%
Meningitis/Pneumonia Vaccines (including Menactra®) 623 1 -80.0% 485 -4.1% 34 +106.3% 103 +9.6%
Travel and Other Endemics Vaccines 493 90 +253.8% 155 +26.2% 54 +6.0% 194 +18.1%
Adult Booster Vaccines (including Adacel®) 474 119 +172.7% 292 — 26 +17.4% 37 -22.9%
Dengvaxia® 3 — — — — — — 3 -98.2%
Other Vaccines 92 7 +40.0% 75 +8.3% 9 — 1 —
Total Vaccines 5,101 630 +137.3% 2,570 +5.6% 326 +13.4% 1,575 +7.8%
(a) Western Europe and Eastern Europe excluding Eurasia (Russia, Ukraine, Georgia, Belarus, Armenia and Turkey). (b) Japan, South Korea, Canada, Australia, New Zealand and Puerto Rico. (c) World excluding United States, Canada, Western and Eastern Europe (apart from Eurasia), Japan, South Korea, Australia, New Zealand and Puerto Rico.
7/ Net sales by geographical region
The following table presents our net sales by geographical region for the years ended December 31, 2017 and 2016:
(€ million) 2017 2016
Change on
a reported
basis
Change at
constant
exchange
rates
United States 11,855 12,391 -4.3% -2.0%
Emerging Markets(a) 10,258 9,593 +6.9% +9.7%
of which Asia (including South Asia(b)) 3,732 3,468 +7.6% +10.3%
of which Latin America 2,837 2,503 +13.3% +12.8%
of which Africa and Middle East 2,326 2,405 -3.3% +2.5%
of which Eurasia(c) 1,242 1,090 +13.9% +18.3%
Europe(d) 9,525 8,679 +9.7% +10.2%
Rest of the world(e) 3,417 3,158 +8.2% +10.6%
of which Japan 1,803 1,688 +6.8% +11.6%
of which South Korea 426 360 +18.3% +17.8%
Total net sales 35,055 33,821 +3.6% +5.6%
(a) World excluding United States, Canada, Western and Eastern Europe (apart from Eurasia), Japan, South Korea, Australia, New Zealand and Puerto Rico. (b) India, Bangladesh and Sri Lanka. In 2016, South Asia was included in the Africa, Middle East and South Asia region. The presentation of 2016 net sales
has been amended accordingly in the interests of comparability. (c) Russia, Ukraine, Georgia, Belarus, Armenia and Turkey. (d) Western Europe and Eastern Europe (excluding Eurasia). (e) Japan, South Korea, Canada, Australia, New Zealand and Puerto Rico.
SANOFI / FORM 20-F 2018 117
ITEM 5. OPERATING AND FINANCIAL REVIEW AND PROSPECTS
Sales in the United States totaled €11,855 million in 2017, down 4.3% on a reported basis and 3.5% on a constant structure basis and at constant exchange rates. The main factor was lower sales for two franchises: Diabetes (-22.8% CER at €3,128 million), and Established Prescription Products (-13.8% CER, at €1,269 million) due to competition from generics of Renvela®/Renagel®. The impact was partly offset by the performance of the Multiple Sclerosis franchise (+19.0% CER, at €1,330 million), the launch of Dupixent®, and growth in Vaccines sales (+5.6% CER at €2,570 million).
In Emerging Markets, net sales reached €10,258 million, up 6.9% on a reported basis and up 9.7% CER. On a constant structure basis and at constant exchange rates net sales rose by 6.0%, driven by sales growth for Established Prescription Products (+4.8% CER, at €3,800 million) and the Diabetes franchise (+11.4% CER, at €1,494 million), and a good performance from Vaccines (+7.8% CER, at €1,575 million). In Asia, net sales were €3,732 million, up 10.3% CER (+8.7% CER/CS), reflecting a solid performance in China (+15.1% CER/CS, at €2,218 million) on a recovery in Vaccines sales and growth for Established Prescription Products and the Diabetes franchise. In Latin America, net sales advanced by 12.8% CER (+5.9% CER/CS) to €2,837 million, boosted by good performances in Brazil (+5.7% CER/CS) and Argentina (+21.0% CER/CS, at €311 million). Net sales in Brazil reached €1,133 million, driven by Established Prescription Products and Consumer Healthcare. In the Africa and Middle East region, net sales totaled €2,326 million, up 2.5% CER but down 0.5% on a constant structure basis and at constant exchange rates. Solid performances in Egypt (+28.3% CER/CS) and Algeria (+6.8% CER/CS) were offset by lower sales in Morocco (-27.0% CER/CS) following the divestment of the Maphar site, in Saudi Arabia (-7.5% CER/CS), and in South Africa (-7.1% CER/CS). In the Eurasia region net sales reached €1,242 million, up 18.3% CER (+12.6% CER/CS) reflecting strong sales growth in Turkey (+18.1% CER/CS) and in Russia (+8.2% CER/CS). Net sales in Russia were €642 million, driven by Consumer Healthcare and by the Diabetes and Rare Diseases franchises.
In Europe, net sales were €9,525 million, up 10.2% CER and stable on a constant structure basis and at constant exchange rates. Lower sales of Established Prescription Products (-5.6% CER/CS, at €3,473 million) were offset by growth in sales of Vaccines (+20.7% CER/CS, at €630 million) and the Multiple Sclerosis franchise (+23.5% CER/CS, at €561 million). Net sales in France amounted to €2,330 million, down 2.3% CER/CS, as lower sales of Established Prescription Products and Generics were only partially offset by sales growth for Vaccines, Consumer Healthcare and the Multiple Sclerosis franchise.
In the Rest of the World region, net sales rose by 10.6% CER to €3,417 million. However, on a constant structure basis and at constant exchange rates net sales for the region fell by 1.5%.
This reflects a drop in sales for Established Prescription Products (-11.8% CER/CS, at €1,219 million) and the Diabetes franchise (-1.4% CER/CS, at €486 million), partly offset by stronger sales for Vaccines, the Specialty Care franchise, Generics and Consumer Healthcare. In Japan, net sales were up 11.6% CER at €1,803 million. On a constant structure basis, Japanese net sales fell by 7.3% due to the impact of generic competition for Plavix® and lower sales of Lantus®.
A.3.2. Other income statement items
The figures below have been restated in accordance with the new standard on revenue recognition, IFRS 15, which became applicable on January 1, 2018. The impacts of those restatements are described in detail in Note A.2.1.1. to the consolidated financial statements.
1/ Other revenues
Other revenues mainly comprise royalties under licensing agreements, and VaxServe sales of non-Sanofi products. Other revenues rose by 29.5% to €1,149 million in 2017, compared with €887 million in 2016. This was mainly due to higher sales at VaxServe (€859 million, versus €581 million in 2016).
2/ Gross profit
Gross profit reached €24,608 million in 2017, versus €23,995 million in 2016, a rise of 2.5%. The gross margin ratio (gross profit as a percentage of net sales) was 70.2% in 2017 compared with 71.0% in 2016. The decrease includes the impact of the fair value remeasurement of inventories acquired in the exchange transaction with BI (€166 million in 2017).
The gross margin ratio for the Pharmaceuticals segment(1)
decreased by 0.2 of a percentage point to 72.2%, mainly reflecting the negative effect of lower US sales for the Diabetes franchise, though the effect was partly offset by Emerging Markets (especially China), and the Multiple Sclerosis and Immunology franchises.
The gross margin ratio for the Vaccines segment(2) was 0.2 of a percentage point lower at 61.7%.
3/ Research and development expenses
Research and development (R&D) expenses amounted to €5,472 million in 2017 (versus €5,172 million in 2016) and represented 15.6% of net sales (versus 15.3% in 2016). The overall year-on-year increase of €300 million (+5.8%) included €217 million for the Pharmaceuticals segment(1) (+4.7%) and €83 million for the Vaccines segment(2) (+15.0%).
The year-on-year increase in R&D expenses was due partly to the integration of BI Consumer Healthcare products and of Sanofi products that were previously in the SPMSD portfolio, and partly
118 SANOFI / FORM 20-F 2018
(1) Includes the Consumer Healthcare business and an allocation of global support function costs. For more information see “– A.3.3. – Segment Results” below.
(2) Includes an allocation of global support function costs. For more information see “– A.3.3. – Segment Results” below.
ITEM 5. OPERATING AND FINANCIAL REVIEW AND PROSPECTS
to progress on development projects in immuno-oncology (isatixumab, PD-1) and for sotagliflozin.
4/ Selling and general expenses
Selling and general expenses totaled €10,072 million (28.7% of net sales), compared with €9,478 million in 2016 (28.0% of net sales). This represents a year-on-year rise of €594 million (+6.3%).
Selling and general expenses for the Pharmaceuticals(1) and Vaccines(2) segments rose by €455 million (+5.2%) and €138 million (+18.6%), respectively. This increase mainly reflected the launch costs of Dupixent®, Kevzara® and Xyzal®, plus investment in marketing and sales efforts in key emerging markets and in the European vaccines business.
5/ Other operating income and expenses
Overall, this represented net income of €4 million in 2017, compared with a net expense of €127 million in 2016.
(€ million) 2017 2016
Change
2017/2016
Other operating income 237 355 -118
Other operating expenses (233) (482) +249
Other operating income/
(expenses), net 4 (127) +131
The overall year-on-year positive change of €131 million reflected (i) a reduction in operating foreign exchange losses from €146 million (including €102 million on our Venezuelan operations) in 2016 to €80 million in 2017; and (ii) a decrease in income from our pharmaceutical alliance partners from €191 million in 2016 to €7 million in 2017, mainly relating to Regeneron following the launch of Dupixent® and Kevzara®. This was partly offset by (i) gains on disposals relating to ongoing operations (€90 million in 2017, compared with €40 million in 2016) and (ii) impairment losses of €87 million taken against property, plant and equipment associated with the dengue vaccine (see Notes D.25. and D.26. to our consolidated financial statements).
6/ Amortization of intangible assets
Amortization charged against intangible assets amounted to €1,866 million in 2017, versus €1,692 million in 2016.
The €174 million year-on-year increase was mainly due to a €245 million rise in amortization expense following the recognition of intangible assets in connection with the exchange transaction with BI finalized on January 1, 2017. The effect was partly offset by a reduction in amortization charged against intangible assets recognized on the acquisition of Aventis
(€365 million in 2017, versus €482 million in 2016) as some products reached the end of their life cycles.
7/ Impairment of intangible assets
In 2017, this line item showed impairment losses of €293 million against intangible assets, compared with €192 million in 2016.
In 2017, this line item included (i) a €190 million impairment loss taken against intangible assets associated with the dengue vaccine; (ii) a €54 million impairment loss relating to Clostridium difficile vaccine development projects following our decision to discontinue the related programs; and (iii) impairment losses of €23 million taken against rights relating to a number of marketed products in the Pharmaceuticals segment.
In 2016, this line item included (i) a net impairment loss of €58 million on various R&D projects in the Pharmaceuticals and Vaccines segments; and (ii) impairment losses of €134 million taken against rights relating to a number of marketed products in the Pharmaceuticals segment.
8/ Fair value remeasurement of contingent consideration
Fair value remeasurements of contingent consideration liabilities recognized on acquisitions in accordance with the revised IFRS 3 represented a net expense of €159 million in 2017, versus a net expense of €135 million in 2016.
The 2017 remeasurements relate to contingent consideration arising from the dissolution of the SPMSD joint venture (expense of €187 million), and to contingent consideration payable to Bayer as a result of an acquisition made by Genzyme prior to the latter’s acquisition by Sanofi (gain of €28 million in 2017, versus expense of €78 million in 2016). See Note D.18. to our consolidated financial statements.
9/ Restructuring costs and similar items
Restructuring costs and similar items amounted to €731 million in 2017, compared with €879 million in 2016.
In 2017, restructuring costs mainly comprised employee-related expenses arising from headcount adjustment plans in the United States and Europe, and write-downs of industrial assets in France and the United States.
10/ Other gains and losses, and litigation
In 2017, the line item Other gains and losses, and litigation
shows an expense of €215 million, including a provision for a vendor’s liability guarantee relating to a past divestment.
At the end of December 2016, Sanofi Pasteur and MSD ended their SPMSD joint venture. The derecognition of Sanofi’s investment in SPMSD generated a pre-tax gain on disposal of €211 million in 2016.
SANOFI / FORM 20-F 2018 119
(1) Includes the Consumer Healthcare business and an allocation of global support function costs. For more information see “– A.3.3. – Segment Results” below.
(2) Includes an allocation of global support function costs. For more information see “– A.3.3. – Segment Results” below.
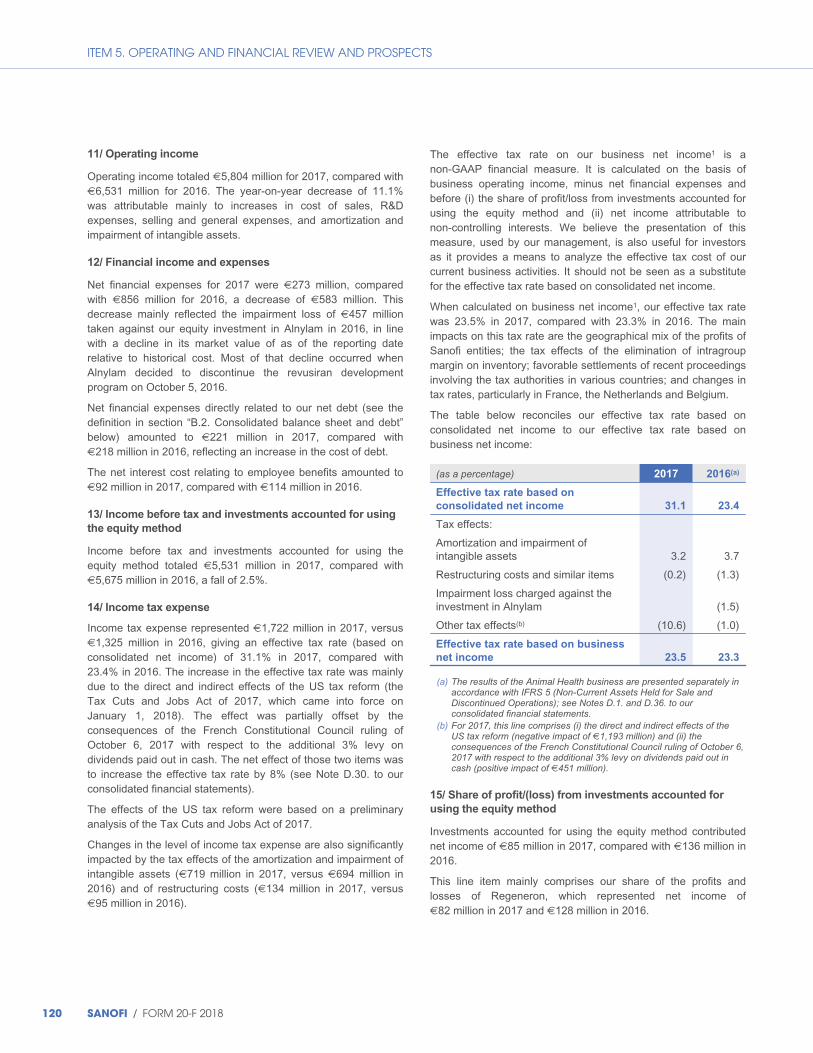
ITEM 5. OPERATING AND FINANCIAL REVIEW AND PROSPECTS
11/ Operating income
Operating income totaled €5,804 million for 2017, compared with €6,531 million for 2016. The year-on-year decrease of 11.1% was attributable mainly to increases in cost of sales, R&D expenses, selling and general expenses, and amortization and impairment of intangible assets.
12/ Financial income and expenses
Net financial expenses for 2017 were €273 million, compared with €856 million for 2016, a decrease of €583 million. This decrease mainly reflected the impairment loss of €457 million taken against our equity investment in Alnylam in 2016, in line with a decline in its market value of as of the reporting date relative to historical cost. Most of that decline occurred when Alnylam decided to discontinue the revusiran development program on October 5, 2016.
Net financial expenses directly related to our net debt (see the definition in section “B.2. Consolidated balance sheet and debt” below) amounted to €221 million in 2017, compared with €218 million in 2016, reflecting an increase in the cost of debt.
The net interest cost relating to employee benefits amounted to €92 million in 2017, compared with €114 million in 2016.
13/ Income before tax and investments accounted for using
the equity method
Income before tax and investments accounted for using the equity method totaled €5,531 million in 2017, compared with €5,675 million in 2016, a fall of 2.5%.
14/ Income tax expense
Income tax expense represented €1,722 million in 2017, versus €1,325 million in 2016, giving an effective tax rate (based on consolidated net income) of 31.1% in 2017, compared with 23.4% in 2016. The increase in the effective tax rate was mainly due to the direct and indirect effects of the US tax reform (the Tax Cuts and Jobs Act of 2017, which came into force on January 1, 2018). The effect was partially offset by the consequences of the French Constitutional Council ruling of October 6, 2017 with respect to the additional 3% levy on dividends paid out in cash. The net effect of those two items was to increase the effective tax rate by 8% (see Note D.30. to our consolidated financial statements).
The effects of the US tax reform were based on a preliminary analysis of the Tax Cuts and Jobs Act of 2017.
Changes in the level of income tax expense are also significantly impacted by the tax effects of the amortization and impairment of intangible assets (€719 million in 2017, versus €694 million in 2016) and of restructuring costs (€134 million in 2017, versus €95 million in 2016).
The effective tax rate on our business net income1 is a non-GAAP financial measure. It is calculated on the basis of business operating income, minus net financial expenses and before (i) the share of profit/loss from investments accounted for using the equity method and (ii) net income attributable to non-controlling interests. We believe the presentation of this measure, used by our management, is also useful for investors as it provides a means to analyze the effective tax cost of our current business activities. It should not be seen as a substitute for the effective tax rate based on consolidated net income.
When calculated on business net income1, our effective tax rate was 23.5% in 2017, compared with 23.3% in 2016. The main impacts on this tax rate are the geographical mix of the profits of Sanofi entities; the tax effects of the elimination of intragroup margin on inventory; favorable settlements of recent proceedings involving the tax authorities in various countries; and changes in tax rates, particularly in France, the Netherlands and Belgium.
The table below reconciles our effective tax rate based on consolidated net income to our effective tax rate based on business net income:
(as a percentage) 2017 2016(a)
Effective tax rate based on
consolidated net income 31.1 23.4
Tax effects:
Amortization and impairment of intangible assets 3.2 3.7
Restructuring costs and similar items (0.2) (1.3)
Impairment loss charged against the investment in Alnylam (1.5)
Other tax effects(b) (10.6) (1.0)
Effective tax rate based on business
net income 23.5 23.3
(a) The results of the Animal Health business are presented separately in accordance with IFRS 5 (Non-Current Assets Held for Sale and Discontinued Operations); see Notes D.1. and D.36. to our consolidated financial statements.
(b) For 2017, this line comprises (i) the direct and indirect effects of the US tax reform (negative impact of €1,193 million) and (ii) the consequences of the French Constitutional Council ruling of October 6, 2017 with respect to the additional 3% levy on dividends paid out in cash (positive impact of €451 million).
15/ Share of profit/(loss) from investments accounted for
using the equity method
Investments accounted for using the equity method contributed net income of €85 million in 2017, compared with €136 million in 2016.
This line item mainly comprises our share of the profits and losses of Regeneron, which represented net income of €82 million in 2017 and €128 million in 2016.
120 SANOFI / FORM 20-F 2018

ITEM 5. OPERATING AND FINANCIAL REVIEW AND PROSPECTS
16/ Net income excluding the exchanged/held-for-exchange
Animal Health business
Net income excluding the held-for-exchange Animal Health business amounted to €3,894 million in 2017, versus €4,486 million in 2016.
17/ Net income/(loss) of the exchanged/held-for-exchange
Animal Health business
In accordance with IFRS 5, the net income or loss of the Animal Health business is presented in a separate line item, Net
income/(loss) of the held-for-exchange Animal Health
business (see Notes D.2. and D.36. to our consolidated financial statements). At the start of January 2017, Sanofi and BI confirmed that they had finalized the strategic transaction agreed in June 2016, involving the exchange of Sanofi’s Animal Health business (Merial) for BI’s Consumer Healthcare business. Consequently, for 2017 this line item shows the net after-tax gain of €4,643 million on the divestment of the Animal Health business.
18/ Net income
Net income amounted to €8,537 million in 2017, compared with €4,800 million in 2016.
19/ Net income attributable to non-controlling interests
Net income attributable to non-controlling interests was €121 million in 2017, versus €91 million in 2016. This line item mainly comprises the share of pre-tax profits paid to BMS from territories managed by Sanofi (€84 million, versus €86 million in 2016). The year-on-year decrease was directly related to competition from generics of clopidogrel (active ingredient of Plavix®) and irbesartan (active ingredient of Aprovel®) in Europe.
20/ Net income attributable to equity holders of Sanofi
Net income attributable to equity holders of Sanofi amounted to €8,416 million, versus €4,709 million in 2016.
Basic earnings per share for 2017 was €6.70 (including the net gain on the divestment of the Animal Health business), 83.1% higher than the 2016 figure of €3.66, based on an average number of shares outstanding of 1,256.9 million in 2017 (1,286.6 million in 2016). Diluted earnings per share for 2017 was €6.64, 82.9% higher than the 2016 figure of €3.63, based on an average number of shares outstanding after dilution of 1,266.8 million in 2017 and 1,296.0 million in 2016.
A.3.3. Segment results
Business operating income (defined in Note D.35. to our consolidated financial statements) amounted to €9,323 million in 2017 (26.6% of net sales), lower than the 2016 figure of €9,284 million (27.5% of net sales).
Sanofi acquired the Consumer Healthcare operations of BI on January 1, 2017, and during 2017 we gradually integrated those operations into our Consumer Healthcare Global Business Unit (GBU). Following completion of the integration process and with effect from December 31, 2017, we identified our Consumer Healthcare business as an operating segment, the financial information for which is reported separately to, and reviewed separately by, our Chief Executive Officer. Up to December 31, 2017, the results of the Consumer Healthcare business were included in the Pharmaceuticals segment. Consequently, as of December 31, 2017 Sanofi has three operating segments: Pharmaceuticals, Consumer Healthcare and Vaccines.
However, due to lack of available data and the unduly complex and significant adjustments that would be required (in particular to our reporting tools), the 2016 comparative information has not been restated to reflect the changes arising from our new segment reporting model. Consequently, we present segment information for 2017 and comparative periods using our previous segment reporting model in the table below:
(€ million) December 31,
2017(a)
December 31,
2016(a) Change
Pharmaceuticals(b) 7,871 7,823 +0.6%
Vaccines(c) 1,521 1,573 -3.3%
Other (69) (112) -38.4%
Business operating income 9,323 9,284 +0.4%
(a) Includes the effects of first-time application of IFRS 15 on revenue recognition (see note A.2.1.1. to our consolidated financial statements). (b) Includes Consumer Healthcare and an allocation of global support function costs. (c) Includes an allocation of global support function costs.
SANOFI / FORM 20-F 2018 121
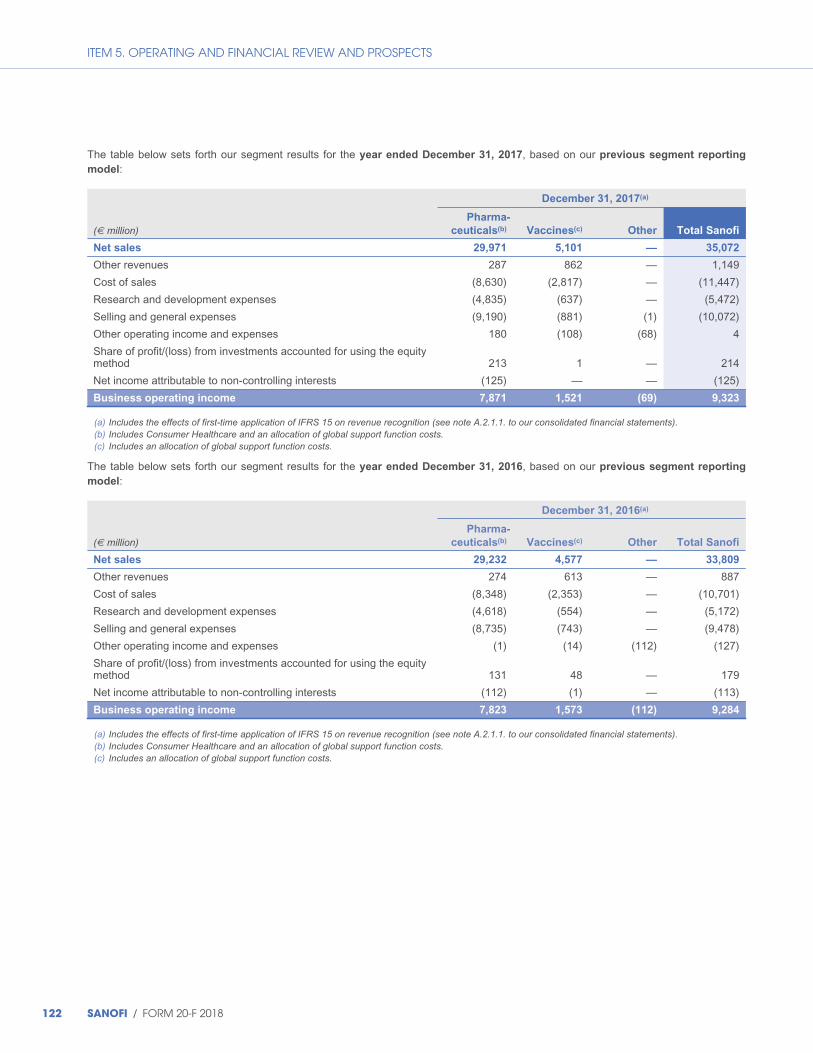
ITEM 5. OPERATING AND FINANCIAL REVIEW AND PROSPECTS
The table below sets forth our segment results for the year ended December 31, 2017, based on our previous segment reporting
model:
December 31, 2017(a)
Pharma-
(€ million) ceuticals(b) Vaccines(c) Other Total Sanofi
Net sales 29,971 5,101 — 35,072
Other revenues 287 862 — 1,149
Cost of sales (8,630) (2,817) — (11,447)
Research and development expenses (4,835) (637) — (5,472)
Selling and general expenses (9,190) (881) (1) (10,072)
Other operating income and expenses 180 (108) (68) 4
Share of profit/(loss) from investments accounted for using the equity method 213 1 — 214
Net income attributable to non-controlling interests (125) — — (125)
Business operating income 7,871 1,521 (69) 9,323
(a) Includes the effects of first-time application of IFRS 15 on revenue recognition (see note A.2.1.1. to our consolidated financial statements). (b) Includes Consumer Healthcare and an allocation of global support function costs. (c) Includes an allocation of global support function costs.
The table below sets forth our segment results for the year ended December 31, 2016, based on our previous segment reporting
model:
December 31, 2016(a)
Pharma-
(€ million) ceuticals(b) Vaccines(c) Other Total Sanofi
Net sales 29,232 4,577 — 33,809
Other revenues 274 613 — 887
Cost of sales (8,348) (2,353) — (10,701)
Research and development expenses (4,618) (554) — (5,172)
Selling and general expenses (8,735) (743) — (9,478)
Other operating income and expenses (1) (14) (112) (127)
Share of profit/(loss) from investments accounted for using the equity method 131 48 — 179
Net income attributable to non-controlling interests (112) (1) — (113)
Business operating income 7,823 1,573 (112) 9,284
(a) Includes the effects of first-time application of IFRS 15 on revenue recognition (see note A.2.1.1. to our consolidated financial statements). (b) Includes Consumer Healthcare and an allocation of global support function costs. (c) Includes an allocation of global support function costs.
122 SANOFI / FORM 20-F 2018
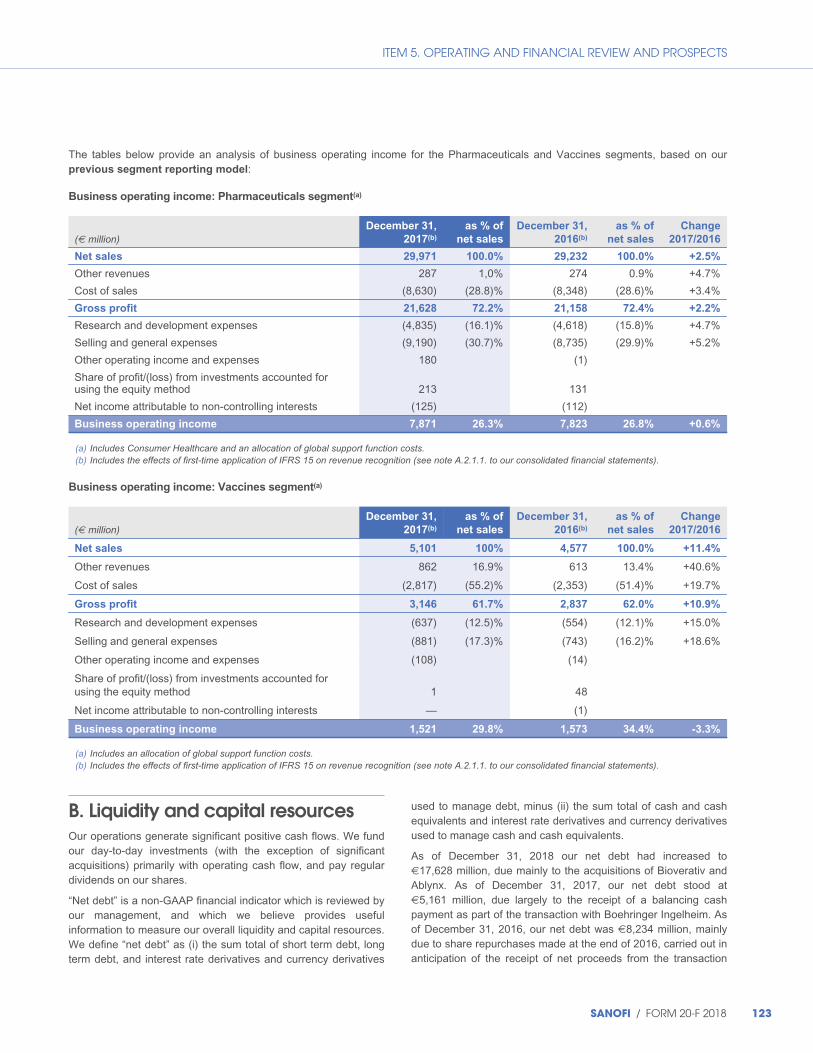
ITEM 5. OPERATING AND FINANCIAL REVIEW AND PROSPECTS
The tables below provide an analysis of business operating income for the Pharmaceuticals and Vaccines segments, based on our previous segment reporting model:
Business operating income: Pharmaceuticals segment(a)
(€ million) December 31,
2017(b)
as % of
net sales
December 31,
2016(b)
as % of
net sales
Change
2017/2016
Net sales 29,971 100.0% 29,232 100.0% +2.5%
Other revenues 287 1,0% 274 0.9% +4.7%
Cost of sales (8,630) (28.8)% (8,348) (28.6)% +3.4%
Gross profit 21,628 72.2% 21,158 72.4% +2.2%
Research and development expenses (4,835) (16.1)% (4,618) (15.8)% +4.7%
Selling and general expenses (9,190) (30.7)% (8,735) (29.9)% +5.2%
Other operating income and expenses 180 (1)
Share of profit/(loss) from investments accounted forusing the equity method 213 131
Net income attributable to non-controlling interests (125) (112)
Business operating income 7,871 26.3% 7,823 26.8% +0.6%
(a) Includes Consumer Healthcare and an allocation of global support function costs. (b) Includes the effects of first-time application of IFRS 15 on revenue recognition (see note A.2.1.1. to our consolidated financial statements).
Business operating income: Vaccines segment(a)
(€ million) December 31,
2017(b)
as % of
net sales
December 31,
2016(b)
as % of
net sales
Change
2017/2016
Net sales 5,101 100% 4,577 100.0% +11.4%
Other revenues 862 16.9% 613 13.4% +40.6%
Cost of sales (2,817) (55.2)% (2,353) (51.4)% +19.7%
Gross profit 3,146 61.7% 2,837 62.0% +10.9%
Research and development expenses (637) (12.5)% (554) (12.1)% +15.0%
Selling and general expenses (881) (17.3)% (743) (16.2)% +18.6%
Other operating income and expenses (108) (14)
Share of profit/(loss) from investments accounted forusing the equity method 1 48
Net income attributable to non-controlling interests — (1)
Business operating income 1,521 29.8% 1,573 34.4% -3.3%
(a) Includes an allocation of global support function costs. (b) Includes the effects of first-time application of IFRS 15 on revenue recognition (see note A.2.1.1. to our consolidated financial statements).
B. Liquidity and capital resources Our operations generate significant positive cash flows. We fund our day-to-day investments (with the exception of significant acquisitions) primarily with operating cash flow, and pay regular dividends on our shares.
“Net debt” is a non-GAAP financial indicator which is reviewed by our management, and which we believe provides useful information to measure our overall liquidity and capital resources. We define “net debt” as (i) the sum total of short term debt, long term debt, and interest rate derivatives and currency derivatives
used to manage debt, minus (ii) the sum total of cash and cash equivalents and interest rate derivatives and currency derivatives used to manage cash and cash equivalents.
As of December 31, 2018 our net debt had increased to €17,628 million, due mainly to the acquisitions of Bioverativ and Ablynx. As of December 31, 2017, our net debt stood at €5,161 million, due largely to the receipt of a balancing cash payment as part of the transaction with Boehringer Ingelheim. As of December 31, 2016, our net debt was €8,234 million, mainly due to share repurchases made at the end of 2016, carried out in anticipation of the receipt of net proceeds from the transaction
SANOFI / FORM 20-F 2018 123
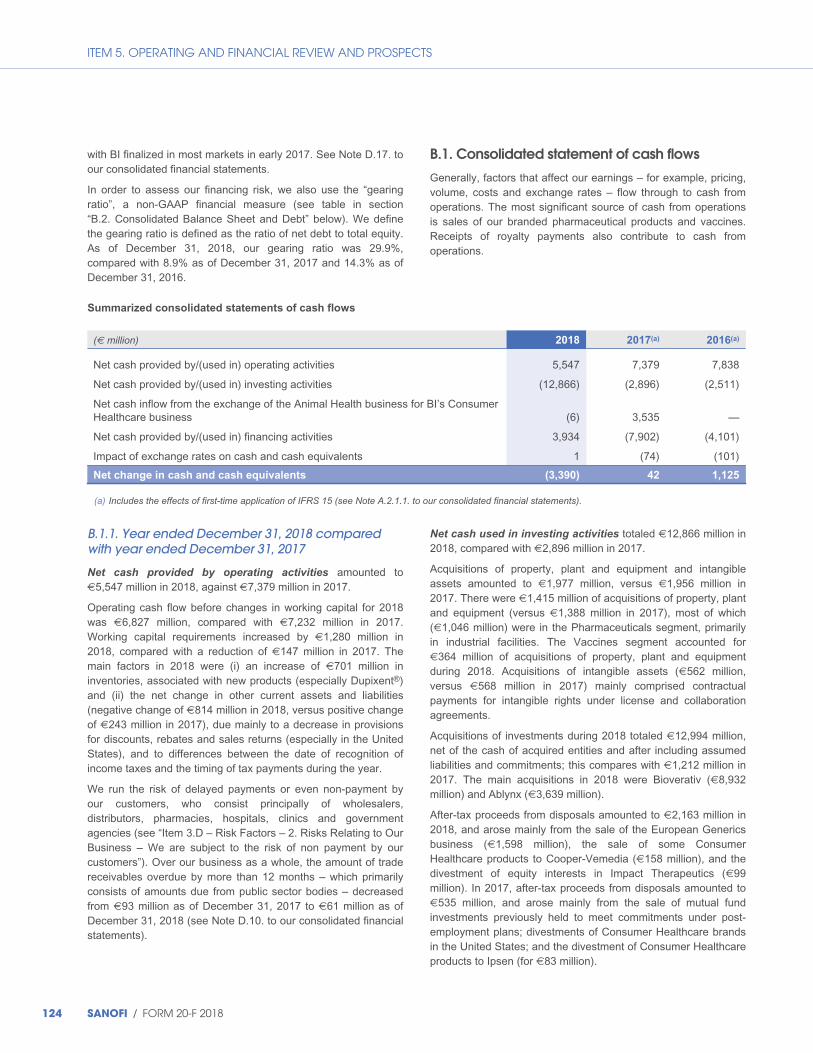
ITEM 5. OPERATING AND FINANCIAL REVIEW AND PROSPECTS
with BI finalized in most markets in early 2017. See Note D.17. to our consolidated financial statements.
In order to assess our financing risk, we also use the “gearing ratio”, a non-GAAP financial measure (see table in section “B.2. Consolidated Balance Sheet and Debt” below). We define the gearing ratio is defined as the ratio of net debt to total equity. As of December 31, 2018, our gearing ratio was 29.9%, compared with 8.9% as of December 31, 2017 and 14.3% as of December 31, 2016.
B.1. Consolidated statement of cash flows
Generally, factors that affect our earnings – for example, pricing, volume, costs and exchange rates – flow through to cash from operations. The most significant source of cash from operations is sales of our branded pharmaceutical products and vaccines. Receipts of royalty payments also contribute to cash from operations.
Summarized consolidated statements of cash flows
(€ million) 2018 2017(a) 2016(a)
Net cash provided by/(used in) operating activities 5,547 7,379 7,838
Net cash provided by/(used in) investing activities (12,866) (2,896) (2,511)
Net cash inflow from the exchange of the Animal Health business for BI’s Consumer Healthcare business (6) 3,535 —
Net cash provided by/(used in) financing activities 3,934 (7,902) (4,101)
Impact of exchange rates on cash and cash equivalents 1 (74) (101)
Net change in cash and cash equivalents (3,390) 42 1,125
(a) Includes the effects of first-time application of IFRS 15 (see Note A.2.1.1. to our consolidated financial statements).
B.1.1. Year ended December 31, 2018 compared with year ended December 31, 2017
Net cash provided by operating activities amounted to €5,547 million in 2018, against €7,379 million in 2017.
Operating cash flow before changes in working capital for 2018 was €6,827 million, compared with €7,232 million in 2017. Working capital requirements increased by €1,280 million in 2018, compared with a reduction of €147 million in 2017. The main factors in 2018 were (i) an increase of €701 million in inventories, associated with new products (especially Dupixent®) and (ii) the net change in other current assets and liabilities (negative change of €814 million in 2018, versus positive change of €243 million in 2017), due mainly to a decrease in provisions for discounts, rebates and sales returns (especially in the United States), and to differences between the date of recognition of income taxes and the timing of tax payments during the year.
We run the risk of delayed payments or even non-payment by our customers, who consist principally of wholesalers, distributors, pharmacies, hospitals, clinics and government agencies (see “Item 3.D – Risk Factors – 2. Risks Relating to Our Business – We are subject to the risk of non payment by our customers”). Over our business as a whole, the amount of trade receivables overdue by more than 12 months – which primarily consists of amounts due from public sector bodies – decreased from €93 million as of December 31, 2017 to €61 million as of December 31, 2018 (see Note D.10. to our consolidated financial statements).
Net cash used in investing activities totaled €12,866 million in 2018, compared with €2,896 million in 2017.
Acquisitions of property, plant and equipment and intangible assets amounted to €1,977 million, versus €1,956 million in 2017. There were €1,415 million of acquisitions of property, plant and equipment (versus €1,388 million in 2017), most of which (€1,046 million) were in the Pharmaceuticals segment, primarily in industrial facilities. The Vaccines segment accounted for €364 million of acquisitions of property, plant and equipment during 2018. Acquisitions of intangible assets (€562 million, versus €568 million in 2017) mainly comprised contractual payments for intangible rights under license and collaboration agreements.
Acquisitions of investments during 2018 totaled €12,994 million, net of the cash of acquired entities and after including assumed liabilities and commitments; this compares with €1,212 million in 2017. The main acquisitions in 2018 were Bioverativ (€8,932 million) and Ablynx (€3,639 million).
After-tax proceeds from disposals amounted to €2,163 million in 2018, and arose mainly from the sale of the European Generics business (€1,598 million), the sale of some Consumer Healthcare products to Cooper-Vemedia (€158 million), and the divestment of equity interests in Impact Therapeutics (€99 million). In 2017, after-tax proceeds from disposals amounted to €535 million, and arose mainly from the sale of mutual fund investments previously held to meet commitments under post-employment plans; divestments of Consumer Healthcare brands in the United States; and the divestment of Consumer Healthcare products to Ipsen (for €83 million).
124 SANOFI / FORM 20-F 2018
ITEM 5. OPERATING AND FINANCIAL REVIEW AND PROSPECTS
Net cash inflow from the exchange of the Animal Health
business for BI’s Consumer Healthcare business comprised the following items in 2017: (i) the receipt by Sanofi of a balancing cash payment of €4,207 million; (ii) reimbursements of intragroup accounts with Merial entities totaling €967 million; (iii) the €1,784 million payment of the tax due on the gain arising on the divestment; and (iv) the cash held by the BI subsidiaries acquired by Sanofi. After taking account of final enterprise value adjustments, the total consideration for the businesses effectively transferred in 2017 was €10,557 million for the sale of the Animal Health business to BI, and €6,239 million for the acquisition of BI’s Consumer Healthcare business (see Note D.1. to our consolidated financial statements for the year ended December 31, 2017).
Net cash provided by/used in financing activities represented a net cash inflow of €3,934 million in 2018, compared with a net outflow of €7,902 million in 2017. The 2018 figure includes net external debt finance obtained of €8,722 million (compared with a net repayment of €2,297 million of debt in 2017), including a debt issue of €8 billion under the Euro Medium Term Note program in March 2018 and a further $2 billion bond issue in June 2018. Other cash outflows in 2018 included the dividend payout to our shareholders of €3,773 million (versus €3,710 million in 2017), and the effect of changes in our share capital (repurchases of our own shares, net of capital increases) amounting to €924 million (€1,843 million in 2017).
The net change in cash and cash equivalents during 2018 was a decrease of €3,390 million, compared with an increase of €42 million in 2017.
B.1.2. Year ended December 31, 2017 compared with year ended December 31, 2016
Net cash provided by operating activities amounted to €7,379 million in 2017, versus €7,838 million in 2016.
Operating cash flow before changes in working capital for 2017 was €7,232 million, versus €7,008 million in 2016. Working capital requirements fell by €147 million in 2017, compared with a reduction of €830 million in 2016; the main factors in 2017 were an increase in accounts receivable of €529 million and an increase in accounts payable of €577 million.
Over our business as a whole, the amount of trade receivables overdue by more than 12 months – which primarily consists of amounts due from public sector bodies – decrease to €93 million as of December 31, 2017 from €198 million as of December 31, 2016 (see Note D.10. to our consolidated financial statements).
Net cash used in investing activities amounted to €2,896 million in 2017, compared with €2,511 million in 2016.
Acquisitions of property, plant and equipment and intangible assets totaled €1,956 million, versus €2,083 million in 2016. There were €1,388 million of acquisitions of property, plant and equipment (versus €1,219 million in 2016), most of which were in the Pharmaceuticals segment, primarily in industrial facilities. The Vaccines segment invested €346 million in property, plant and
equipment in 2017 (versus €315 million in 2016). Acquisitions of intangible assets (€568 million, versus €864 million in 2016) mainly comprised contractual payments for intangible rights under license and collaboration agreements.
Acquisitions of investments during 2017 amounted to €1,212 million, net of cash acquired and after including assumed liabilities and commitments, compared with €534 million in 2016. In 2017, these included the acquisition of Protein Sciences (€594 million), our contribution to the Onduo joint venture (€50 million), and purchases of additional shares in Regeneron (€184 million).
After-tax proceeds from disposals (€535 million) arose mainly from the sale of mutual fund investments previously held to meet commitments under post-employment plans; divestments of Consumer Healthcare brands in the United States; and the divestment of Consumer Healthcare products to Ipsen (for €83 million). After-tax proceeds from disposals in 2016 amounted to €209 million and arose mainly from the divestment of the equity interest in Nichi-Iko Pharmaceutical Co., Inc. and the divestment of product rights relating to Oenobiol®.
Net cash inflow from the exchange of the Animal Health
business for BI’s Consumer Healthcare business comprised the following items for 2017: (i) the receipt by Sanofi of a balancing cash payment of €4,207 million; (ii) reimbursements of intragroup accounts with Merial entities totaling €967 million; (iii) a tax payment of €1,784 million on the gain arising on the divestment; and (iv) the cash held by the BI subsidiaries acquired by Sanofi. After final enterprise value adjustments, the exchange values of the two businesses effectively transferred during 2017 were determined to be €10,557 million for Sanofi’s Animal Health business and €6,239 million for BI’s Consumer Healthcare business (see Note D.2. to the consolidated financial statements for the year ended December 31, 2018).
Net cash used in financing activities amounted to €7,902 million in 2017, compared with €4,101 million in 2016. The 2017 figure includes net external debt finance repaid (i.e., net change in short-term and long-term debt) of €2,297 million; this compares with net external debt financing raised of €2,293 million in 2016. It also includes the effect of changes in share capital (repurchases of own shares, net of capital increases), amounting to €1,843 million (versus €2,603 million in 2016), and the dividend payout to our shareholders of €3,710 million (versus €3,759 million in 2016).
The net change in cash and cash equivalents during 2017 was an increase of €42 million compared with an increase of €1,125 million in 2016.
B.2. Consolidated balance sheet and debt
Total assets were €111,408 million as of December 31, 2018, compared with €99,813 million as of December 31, 2017, an increase of €11,595 million.
Net debt was €17,628 million as of December 31, 2018, compared with €5,161 million as of December 31, 2017, due largely to the acquisitions of Bioverativ and Ablynx. “Net debt” is
SANOFI / FORM 20-F 2018 125
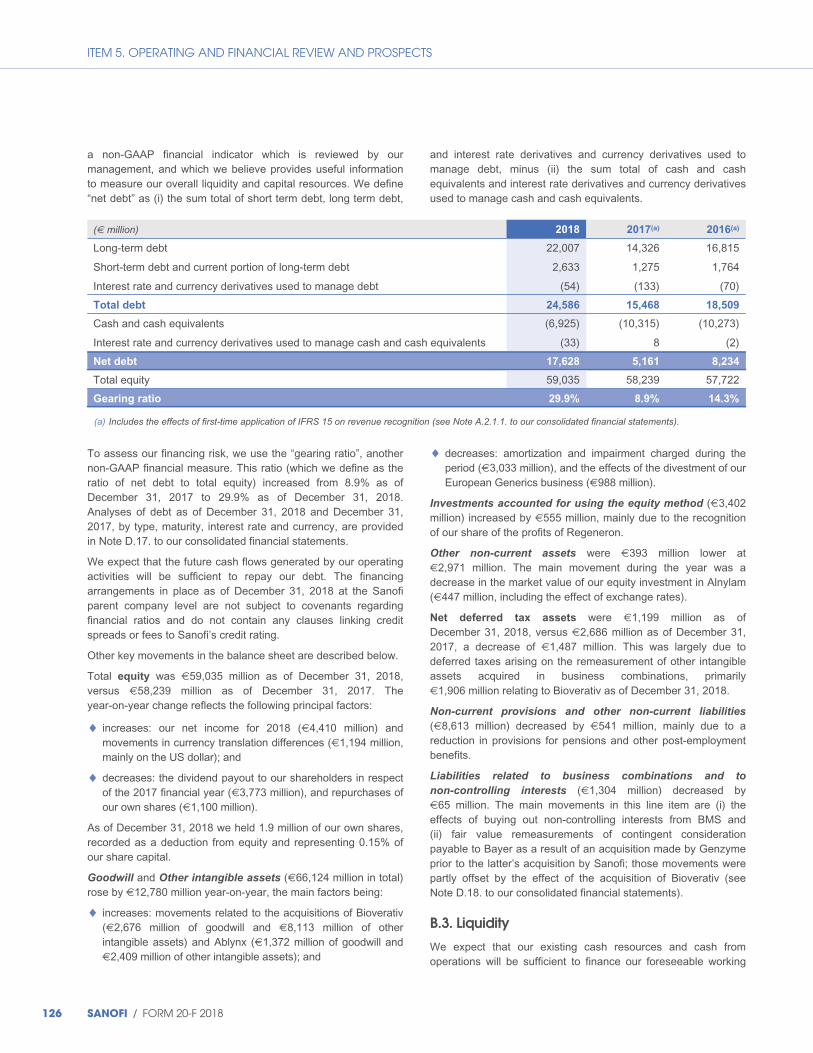
ITEM 5. OPERATING AND FINANCIAL REVIEW AND PROSPECTS
a non-GAAP financial indicator which is reviewed by our management, and which we believe provides useful information to measure our overall liquidity and capital resources. We define “net debt” as (i) the sum total of short term debt, long term debt,
and interest rate derivatives and currency derivatives used to manage debt, minus (ii) the sum total of cash and cash equivalents and interest rate derivatives and currency derivatives used to manage cash and cash equivalents.
(€ million) 2018 2017(a) 2016(a)
Long-term debt 22,007 14,326 16,815
Short-term debt and current portion of long-term debt 2,633 1,275 1,764
Interest rate and currency derivatives used to manage debt (54) (133) (70)
Total debt 24,586 15,468 18,509
Cash and cash equivalents (6,925) (10,315) (10,273)
Interest rate and currency derivatives used to manage cash and cash equivalents (33) 8 (2)
Net debt 17,628 5,161 8,234
Total equity 59,035 58,239 57,722
Gearing ratio 29.9% 8.9% 14.3%
(a) Includes the effects of first-time application of IFRS 15 on revenue recognition (see Note A.2.1.1. to our consolidated financial statements).
To assess our financing risk, we use the “gearing ratio”, another non-GAAP financial measure. This ratio (which we define as the ratio of net debt to total equity) increased from 8.9% as of December 31, 2017 to 29.9% as of December 31, 2018. Analyses of debt as of December 31, 2018 and December 31, 2017, by type, maturity, interest rate and currency, are provided in Note D.17. to our consolidated financial statements.
We expect that the future cash flows generated by our operating activities will be sufficient to repay our debt. The financing arrangements in place as of December 31, 2018 at the Sanofi parent company level are not subject to covenants regarding financial ratios and do not contain any clauses linking credit spreads or fees to Sanofi’s credit rating.
Other key movements in the balance sheet are described below.
Total equity was €59,035 million as of December 31, 2018, versus €58,239 million as of December 31, 2017. The year-on-year change reflects the following principal factors:
◆ increases: our net income for 2018 (€4,410 million) and movements in currency translation differences (€1,194 million, mainly on the US dollar); and
◆ decreases: the dividend payout to our shareholders in respect of the 2017 financial year (€3,773 million), and repurchases of our own shares (€1,100 million).
As of December 31, 2018 we held 1.9 million of our own shares, recorded as a deduction from equity and representing 0.15% of our share capital.
Goodwill and Other intangible assets (€66,124 million in total) rose by €12,780 million year-on-year, the main factors being:
◆ increases: movements related to the acquisitions of Bioverativ (€2,676 million of goodwill and €8,113 million of other intangible assets) and Ablynx (€1,372 million of goodwill and €2,409 million of other intangible assets); and
◆ decreases: amortization and impairment charged during the period (€3,033 million), and the effects of the divestment of our European Generics business (€988 million).
Investments accounted for using the equity method (€3,402 million) increased by €555 million, mainly due to the recognition of our share of the profits of Regeneron.
Other non-current assets were €393 million lower at €2,971 million. The main movement during the year was a decrease in the market value of our equity investment in Alnylam (€447 million, including the effect of exchange rates).
Net deferred tax assets were €1,199 million as of December 31, 2018, versus €2,686 million as of December 31, 2017, a decrease of €1,487 million. This was largely due to deferred taxes arising on the remeasurement of other intangible assets acquired in business combinations, primarily €1,906 million relating to Bioverativ as of December 31, 2018.
Non-current provisions and other non-current liabilities (€8,613 million) decreased by €541 million, mainly due to a reduction in provisions for pensions and other post-employment benefits.
Liabilities related to business combinations and to
non-controlling interests (€1,304 million) decreased by €65 million. The main movements in this line item are (i) the effects of buying out non-controlling interests from BMS and (ii) fair value remeasurements of contingent consideration payable to Bayer as a result of an acquisition made by Genzyme prior to the latter’s acquisition by Sanofi; those movements were partly offset by the effect of the acquisition of Bioverativ (see Note D.18. to our consolidated financial statements).
B.3. Liquidity
We expect that our existing cash resources and cash from operations will be sufficient to finance our foreseeable working
126 SANOFI / FORM 20-F 2018
ITEM 5. OPERATING AND FINANCIAL REVIEW AND PROSPECTS
capital requirements. At year-end 2018, we held cash and cash equivalents amounting to €6,925 million, substantially all of which were held in euros (see Note D.13. to our consolidated financial statements included at Item 18 of this annual report). As at December 31, 2018, €505 million of our cash and cash equivalents were held by our captive insurance and reinsurance companies in accordance with insurance regulations.
We run the risk of delayed payments or even non-payment by our customers, who consist principally of wholesalers, distributors, pharmacies, hospitals, clinics and government agencies (see “Item 3.D. Risk Factors – 2. Risks Relating to Our Business – We are subject to the risk of non-payment by our customers”). Deteriorating credit and economic conditions and other factors in some countries have resulted in, and may continue to result in an increase in the average length of time taken to collect our accounts receivable in these countries. Should these factors continue, it may require us to re-evaluate the collectability of these receivables in future periods. We carefully monitor sovereign debt issues and economic conditions and evaluate accounts receivable in these countries for potential collection risks. We have been conducting an active recovery policy, adapted to each country and including intense communication with customers, negotiations of payment plans, charging of interest for late payments, and legal action. Over our business as a whole, the amount of trade receivables overdue by more than 12 months (which primarily consists of amounts due
from public sector bodies) decreased from €93 million as of December 31, 2017 to €61 million as of December 31, 2018 (see Note D.10. to our consolidated financial statements).
In November 2011, Sanofi obtained the necessary corporate authorizations to purchase any or all of the outstanding Contingent Value Rights (“CVRs”) and subsequently purchased CVRs in 2011. In 2012 following a tender offer initiated in September 2012 on the basis of the same corporate authorization, Sanofi purchased an additional 40,025,805 CVRs (for a total consideration of approximately $70 million), followed by a further 10,928,075 CVRs (for approximately $9 million) in 2013, 1,879,774 CVRs (for approximately $1 million) in 2014, and none in 2015, 2016, 2017 and 2018. As of December 31, 2018, a total of 236,457,284 CVRs were outstanding out of the 291,313,510 issued at the time of the Genzyme acquisition.
At year-end 2018, we had no commitments for capital expenditures that we consider to be material to our consolidated financial position. Undrawn confirmed credit facilities amounted to a total of €8 billion at December 31, 2018. For a discussion of our treasury policies, see “Item 11. Quantitative and Qualitative Disclosures about Market Risk.”
We expect that cash from our operations will be sufficient to repay our debt. For a discussion of our liquidity risks, see “Item 11. Quantitative and Qualitative Disclosures about Market Risk.”
SANOFI / FORM 20-F 2018 127
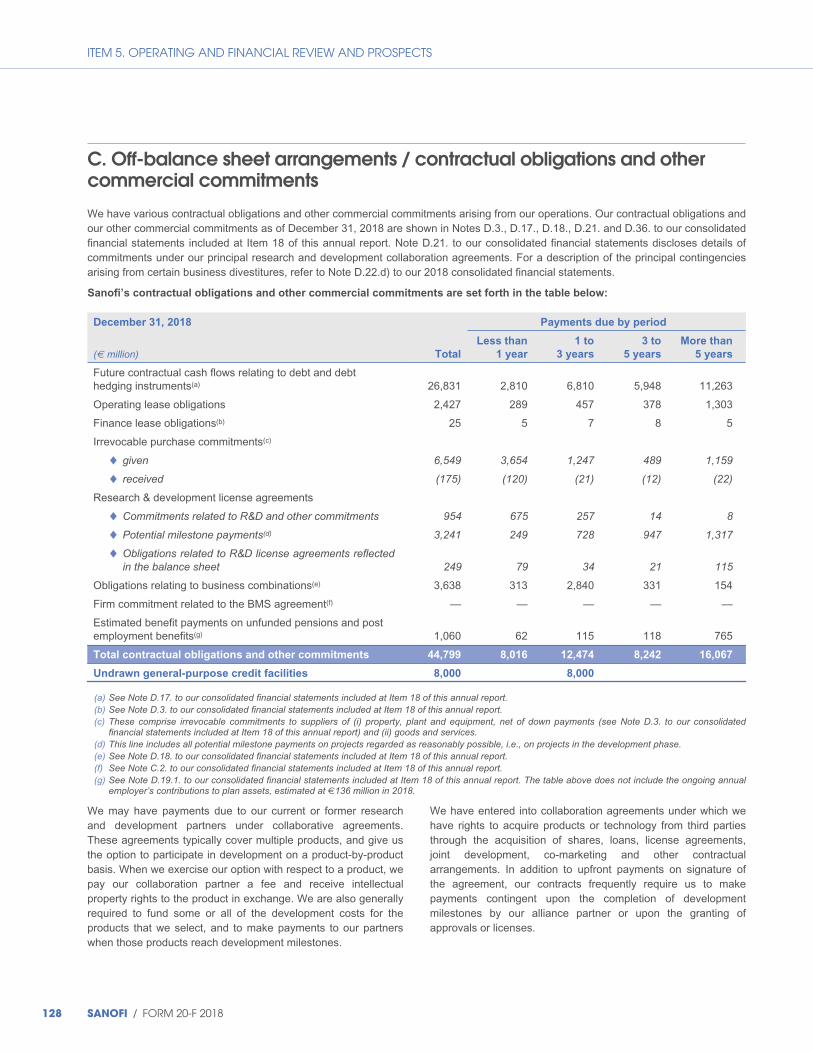
ITEM 5. OPERATING AND FINANCIAL REVIEW AND PROSPECTS
C. Off-balance sheet arrangements / contractual obligations and other commercial commitments
We have various contractual obligations and other commercial commitments arising from our operations. Our contractual obligations and our other commercial commitments as of December 31, 2018 are shown in Notes D.3., D.17., D.18., D.21. and D.36. to our consolidated financial statements included at Item 18 of this annual report. Note D.21. to our consolidated financial statements discloses details of commitments under our principal research and development collaboration agreements. For a description of the principal contingencies arising from certain business divestitures, refer to Note D.22.d) to our 2018 consolidated financial statements.
Sanofi’s contractual obligations and other commercial commitments are set forth in the table below:
December 31, 2018 Payments due by period
(€ million) Total
Less than
1 year
1 to
3 years
3 to
5 years
More than
5 years
Future contractual cash flows relating to debt and debt hedging instruments(a) 26,831 2,810 6,810 5,948 11,263
Operating lease obligations 2,427 289 457 378 1,303
Finance lease obligations(b) 25 5 7 8 5
Irrevocable purchase commitments(c)
◆ given 6,549 3,654 1,247 489 1,159
◆ received (175) (120) (21) (12) (22)
Research & development license agreements
◆ Commitments related to R&D and other commitments 954 675 257 14 8
◆ Potential milestone payments(d) 3,241 249 728 947 1,317
◆ Obligations related to R&D license agreements reflected in the balance sheet 249 79 34 21 115
Obligations relating to business combinations(e) 3,638 313 2,840 331 154
Firm commitment related to the BMS agreement(f) — — — — —
Estimated benefit payments on unfunded pensions and post employment benefits(g) 1,060 62 115 118 765
Total contractual obligations and other commitments 44,799 8,016 12,474 8,242 16,067
Undrawn general-purpose credit facilities 8,000 8,000
(a) See Note D.17. to our consolidated financial statements included at Item 18 of this annual report. (b) See Note D.3. to our consolidated financial statements included at Item 18 of this annual report. (c) These comprise irrevocable commitments to suppliers of (i) property, plant and equipment, net of down payments (see Note D.3. to our consolidated
financial statements included at Item 18 of this annual report) and (ii) goods and services. (d) This line includes all potential milestone payments on projects regarded as reasonably possible, i.e., on projects in the development phase. (e) See Note D.18. to our consolidated financial statements included at Item 18 of this annual report. (f) See Note C.2. to our consolidated financial statements included at Item 18 of this annual report. (g) See Note D.19.1. to our consolidated financial statements included at Item 18 of this annual report. The table above does not include the ongoing annual
employer’s contributions to plan assets, estimated at €136 million in 2018.
We may have payments due to our current or former research and development partners under collaborative agreements. These agreements typically cover multiple products, and give us the option to participate in development on a product-by-product basis. When we exercise our option with respect to a product, we pay our collaboration partner a fee and receive intellectual property rights to the product in exchange. We are also generally required to fund some or all of the development costs for the products that we select, and to make payments to our partners when those products reach development milestones.
We have entered into collaboration agreements under which we have rights to acquire products or technology from third parties through the acquisition of shares, loans, license agreements, joint development, co-marketing and other contractual arrangements. In addition to upfront payments on signature of the agreement, our contracts frequently require us to make payments contingent upon the completion of development milestones by our alliance partner or upon the granting of approvals or licenses.
128 SANOFI / FORM 20-F 2018

ITEM 5. OPERATING AND FINANCIAL REVIEW AND PROSPECTS
Because of the uncertain nature of development work, it is impossible to predict (i) whether Sanofi will exercise further options for products, or (ii) whether the expected milestones will be achieved, or (iii) the number of compounds that will reach the relevant milestones. It is therefore impossible to estimate the maximum aggregate amount that Sanofi will actually pay in the future under existing collaboration agreements.
Given the nature of its business, it is highly unlikely that Sanofi will exercise all options for all products or that all milestones will be achieved.
The main collaboration agreements relating to development projects are described in Note D.21.1. to our consolidated financial statements included at Item 18 of this annual report. Milestone payments relating to development projects under these agreements included in the table above exclude projects still in the research phase (€6.8 billion in 2018, €7.2 billion in 2017 and €6.2 billion in 2016) and payments contingent upon the attainment of sales targets once a product is on the market (€9.9 billion in 2018, €10.1 billion in 2017, €8.2 billion in 2016).
SANOFI / FORM 20-F 2018 129
ITEM 6. DIRECTORS, SENIOR MANAGEMENT AND EMPLOYEES
Item 6. Directors, Senior Management and Employees
A. Directors and senior management Since January 1, 2007, Sanofi has separated the offices of Chairman and Chief Executive Officer. Annual evaluations conducted since that date have indicated that this governance structure is appropriate to Sanofi’s current configuration. This arrangement was maintained with the appointment of Serge Weinberg to the office of Chairman firstly on May 17, 2010, then on May 6, 2011 and again on May 4, 2015. The Board of Directors regards this governance structure as appropriate to the current context in which Sanofi operates and its share ownership structure, and as protecting the rights of all of its stakeholders.
The Chairman organizes and directs the work of the Board, and is responsible for ensuring the proper functioning of the corporate decision-making bodies in compliance with good governance principles. The Chairman coordinates the work of the Board of Directors with that of its Committees. He ensures that the Company’s management bodies function properly, and in particular that the directors are able to fulfil their duties. The Chairman is accountable to the Shareholders’ General Meeting, which he chairs.
In addition to these roles conferred by law, the Chairman:
◆ in coordination with the Chief Executive Officer, liaises between the Board of Directors and the shareholders of the Company;
◆ is kept regularly informed by the Chief Executive Officer of significant events and situations affecting the affairs of the Company, and may request from the Chief Executive Officer any information useful to the Board of Directors;
◆ may, in close collaboration with the Chief Executive Officer, represent the Company in high-level dealings with governmental bodies and with key partners of the Company and/or of its subsidiaries, both nationally and internationally;
◆ seeks to prevent any conflict of interest and manages any situation that might give rise to a conflict of interest. He also gives rulings, in the name of the Board, on requests to take up external directorships of which he may become aware or that may be submitted to him or her by a director;
◆ may interview the statutory auditors in preparation for the work of the Board of Directors and the Audit Committee; and
◆ strives to promote in all circumstances the values and image of the Company.
The Chairman is also required to develop and maintain a proper relationship of trust between the Board and the Chief Executive
Officer, so as to ensure that the latter consistently and continuously implements the orientations determined by the Board.
In fulfilling his remit, the Chairman may meet with any individual, including senior executives of the Company, while avoiding any involvement in directing the Company or managing its operations, which are exclusively the responsibility of the Chief Executive Officer.
Finally, the Chairman reports to the Board on the fulfilment of his remit.
The Chairman carries out his duties during the entire period of his term of office, subject to the caveat that a director who is a natural person may not be appointed or reappointed once he or she has reached the age of 70.
The Chief Executive Officer manages the Company, and represents it in dealings with third parties within the limit of the corporate purpose. The Chief Executive Officer has the broadest powers to act in all circumstances in the name of the Company, subject to the powers that are attributed by law to the Board of Directors and to the Shareholders’ General Meeting and within the limits set by the Board of Directors.
The Chief Executive Officer must be less than 65 years old.
Limitations on the powers of the Chief Executive Officer set by the Board
With effect from March 6, 2018, the limitations on the powers of the Chief Executive Officer are specified in the Board Charter. Without prejudice to legal provisions regarding authorizations that must be granted by the Board (regulated agreements, guarantees, divestments of equity holdings or real estate, etc.), prior approval from the Board of Directors is required for transactions or decisions resulting in an investment or divestment, or an expenditure or guarantee commitment, made by the Company and its subsidiaries, in excess of:
◆ a cap of €500 million (per transaction) for transactions, decisions or commitments pertaining to a previously approved strategy; and
◆ a cap of €150 million (per transaction) for transactions, decisions or commitments not pertaining to a previously approved strategy.
When such transactions, decisions or commitments give rise to installment payments to the contracting third party (or parties) that are contingent upon future results or objectives, such as the registration of one or more products, attainment of the caps is calculated by aggregating the various payments due from
130 SANOFI / FORM 20-F 2018
ITEM 6. DIRECTORS, SENIOR MANAGEMENT AND EMPLOYEES
signature of the contract until (and including) filing of the first application for marketing authorization in the United States or in Europe.
Attainment of the above caps is also assessed after taking into account all commitments to make payments on exercise of a firm or conditional option with immediate or deferred effect, and all guarantees or collateral to be provided to third parties over the duration of such commitments.
The prior approval procedure does not apply to transactions and decisions that result in the signature of agreements that solely involve subsidiaries and the Company itself.
Board of Directors
Each year, the Board of Directors conducts a review to ensure that there is an appropriate balance in its composition and in the composition of its Committees. In particular, the Board seeks to ensure gender balance and a broad diversity of competencies, experience, nationalities and ages, reflecting our status as a diversified global business. The Board investigates and evaluates not only potential candidates, but also whether existing directors should seek reappointment. Above all, the Board seeks directors who show independence of mind and are competent, dedicated and committed, with compatible and complementary personalities.
As of December 31, 2018 the Board of Directors had 16 members, including two directors representing employees. 43% of the directors were women and 38% were non-French nationals.
The Board works with the Compensation Committee and the Appointments and Governance Committee (renamed the Appointments, Governance and CSR Committee effective March 8, 2019), to ensure that the Executive Committee operates an inclusion (non-discrimination) and diversity policy, especially as regards gender balance. As of December 31, 2018, 20% of the 15 Executive Committee members were women, and 67% were non-French nationals.
The Board of Directors is also kept informed, in particular on the occasion of its annual discussion on professional and pay equality policy, on how the inclusion and diversity policy is cascaded down to “Senior Leaders” (the positions in the Company with the highest level of responsibility). In 2018, there were 2,044 “Senior Leaders” within Sanofi, including Executive Committee members and other executives; of that total, 35.4% were women.
Subject to the powers expressly attributed to the Shareholders’ General Meeting and within the scope of the Company’s corporate purpose, the Board of Directors’ remit covers all issues relating to the proper management of the Company, and through its decisions the Board determines matters falling within its authority.
The rules and operating procedures of our Board of Directors are defined by law, by our Articles of Association, and by our Board
charter (an English language version of which is reproduced in full as Exhibit 1.2 to this Annual Report on Form 20-F).
Term of office The term of office of directors is four years. Directors are required to seek reappointment by rotation, such that members of the Board are required to seek reappointment on a regular basis in the most equal proportions possible. Exceptionally, the Shareholders’ Ordinary General Meeting may appoint a director to serve for a term of one, two or three years, in order to ensure adequate rotation of Board members. Each director standing down is eligible for reappointment. Should one or more directorships fall vacant as a result of death or resignation, the Board of Directors may make provisional appointments in the period between two Shareholders’ General Meetings, in accordance with applicable laws.
Directors may be removed from office at any time by a Shareholders’ General Meeting.
Independence of Board members Under the terms of the AFEP-MEDEF corporate governance code (the AFEP-MEDEF Code), a director is independent when he or she has no relationship of any kind whatsoever with the Company, its group or its senior management that may color his or her judgment. More specifically, a director can only be regarded as independent if he or she:
◆ is not (and has not been during the past five years):
– an employee or executive officer of the Company;
– an employee, executive officer or director of an entity consolidated by the Company; or
– an employee, executive officer or director of the Company’s parent, or of an entity consolidated by that parent (criterion 1);
◆ is not an executive officer of an entity in which (i) the Company directly or indirectly holds a directorship or (ii) an employee of the Company is designated as a director or (iii) an executive officer of the Company (currently, or who has held office within the past five years) holds a directorship (criterion 2);
◆ is not a customer, supplier, investment banker or corporate banker that is material to the Company or its group, or for whom the Company or its group represents a significant proportion of its business (criterion 3);
◆ has no close family ties with a corporate officer of the Company (criterion 4);
◆ has not acted as auditor for the Company over the course of the past five years (criterion 5);
◆ has not been a director of the Company for more than twelve years (criterion 6);
◆ does not receive variable compensation in cash or in the form of shares or any compensation linked to the performance of the Company or its group (criterion 7); or
SANOFI / FORM 20-F 2018 131
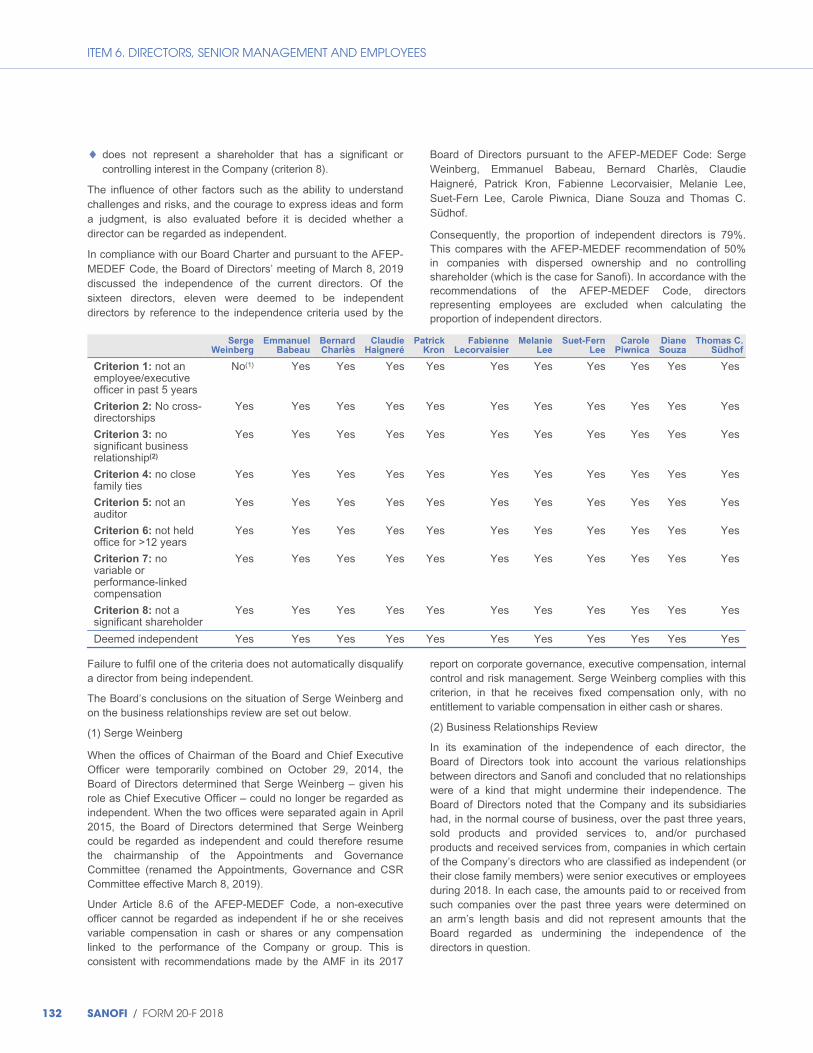
ITEM 6. DIRECTORS, SENIOR MANAGEMENT AND EMPLOYEES
◆ does not represent a shareholder that has a significant or controlling interest in the Company (criterion 8).
The influence of other factors such as the ability to understand challenges and risks, and the courage to express ideas and form a judgment, is also evaluated before it is decided whether a director can be regarded as independent.
In compliance with our Board Charter and pursuant to the AFEP-MEDEF Code, the Board of Directors’ meeting of March 8, 2019 discussed the independence of the current directors. Of the sixteen directors, eleven were deemed to be independent directors by reference to the independence criteria used by the
Board of Directors pursuant to the AFEP-MEDEF Code: Serge Weinberg, Emmanuel Babeau, Bernard Charlès, Claudie Haigneré, Patrick Kron, Fabienne Lecorvaisier, Melanie Lee, Suet-Fern Lee, Carole Piwnica, Diane Souza and Thomas C. Südhof.
Consequently, the proportion of independent directors is 79%. This compares with the AFEP-MEDEF recommendation of 50% in companies with dispersed ownership and no controlling shareholder (which is the case for Sanofi). In accordance with the recommendations of the AFEP-MEDEF Code, directors representing employees are excluded when calculating the proportion of independent directors.
Serge
Weinberg Emmanuel
Babeau Bernard Charlès
Claudie Haigneré
Patrick Kron
Fabienne Lecorvaisier
Melanie Lee
Suet-Fern Lee
Carole Piwnica
Diane Souza
Thomas C. Südhof
Criterion 1: not an No(1) Yes Yes Yes Yes Yes Yes Yes Yes Yes Yes employee/executive officer in past 5 years
Criterion 2: No cross- Yes Yes Yes Yes Yes Yes Yes Yes Yes Yes Yes directorships
Criterion 3: no Yes Yes Yes Yes Yes Yes Yes Yes Yes Yes Yes significant business relationship(2)
Criterion 4: no close Yes Yes Yes Yes Yes Yes Yes Yes Yes Yes Yes family ties
Criterion 5: not an Yes Yes Yes Yes Yes Yes Yes Yes Yes Yes Yes auditor
Criterion 6: not held Yes Yes Yes Yes Yes Yes Yes Yes Yes Yes Yes office for >12 years
Criterion 7: no Yes Yes Yes Yes Yes Yes Yes Yes Yes Yes Yes variable or performance-linked compensation
Criterion 8: not a Yes Yes Yes Yes Yes Yes Yes Yes Yes Yes Yes significant shareholder
Deemed independent Yes Yes Yes Yes Yes Yes Yes Yes Yes Yes Yes
Failure to fulfil one of the criteria does not automatically disqualify a director from being independent.
The Board’s conclusions on the situation of Serge Weinberg and on the business relationships review are set out below.
(1) Serge Weinberg
When the offices of Chairman of the Board and Chief Executive Officer were temporarily combined on October 29, 2014, the Board of Directors determined that Serge Weinberg – given his role as Chief Executive Officer – could no longer be regarded as independent. When the two offices were separated again in April 2015, the Board of Directors determined that Serge Weinberg could be regarded as independent and could therefore resume the chairmanship of the Appointments and Governance Committee (renamed the Appointments, Governance and CSR Committee effective March 8, 2019).
Under Article 8.6 of the AFEP-MEDEF Code, a non-executive officer cannot be regarded as independent if he or she receives variable compensation in cash or shares or any compensation linked to the performance of the Company or group. This is consistent with recommendations made by the AMF in its 2017
report on corporate governance, executive compensation, internal control and risk management. Serge Weinberg complies with this criterion, in that he receives fixed compensation only, with no entitlement to variable compensation in either cash or shares.
(2) Business Relationships Review
In its examination of the independence of each director, the Board of Directors took into account the various relationships between directors and Sanofi and concluded that no relationships were of a kind that might undermine their independence. The Board of Directors noted that the Company and its subsidiaries had, in the normal course of business, over the past three years, sold products and provided services to, and/or purchased products and received services from, companies in which certain of the Company’s directors who are classified as independent (or their close family members) were senior executives or employees during 2018. In each case, the amounts paid to or received from such companies over the past three years were determined on an arm’s length basis and did not represent amounts that the Board regarded as undermining the independence of the directors in question.
132 SANOFI / FORM 20-F 2018
ITEM 6. DIRECTORS, SENIOR MANAGEMENT AND EMPLOYEES
Board evaluation
Under the terms of the Board Charter, a discussion of the Board’s operating procedures must be included on the agenda of one Board meeting every year. The Charter also requires a formal evaluation to be performed at least every three years under the direction of the Appointments and Governance Committee (renamed the Appointments, Governance and CSR Committee effective March 8, 2019), with assistance from an independent consultant if deemed necessary.
In 2017, the evaluation was conducted on the basis of a questionnaire. Each director was allowed a few weeks to
complete the questionnaire using a secure digital platform. The responses were then analyzed by the Secretary to the Board, and supplemented by one-on-one interviews. The results were then presented to, and discussed by, the Appointments and Governance Committee (renamed the Appointments, Governance and CSR Committee effective March 8, 2019). A detailed report prepared at that meeting was presented at the Board meeting of March 6, 2018. The directors welcomed the progress made in the operation of the Board and its Committees since the previous evaluation. The issues most frequently raised in the evaluation were the diversity and complementarity of the Board following the appointment of the new directors, the role of the Committees, executive sessions, an update on the implementation of the Company’s digital strategy, and implementation of the external growth strategy.
The table below shows the areas for progress and vigilance identified in the evaluation, and action taken in response by the Board in 2018:
Areas for progress and vigilance identified Actions taken by the Board
Continuing to work on succession planning for the Chief Executive Officer, the Chairman, and key executive posts
Work continued on succession planning for the Chief Executive Officer and key executive posts, with both the Board and the Appointments and Governance Committee reaffirming this as a priority for the years ahead;
◆ An update on succession planning is now included in the agenda for each meeting of the Appointments, Governance and CSR Committee.
◆ The Committee has retained an external consultant to monitor and implement the succession plan.
See also the section on “Succession Planning” below.
Closer monitoring of the principal risks facing Sanofi The principal risks facing Sanofi were discussed at the Board meeting of February 6, 2018 and the Audit Committee meeting of July 26, 2018.
◆ The presentation made to the Board used detailed risk mapping to explain governance issues, active risks, mitigation strategies, and emerging risks. The following issues were addressed during the presentation:
– key achievements in 2017;
– Risk Committee composition and practices;
– segmentation and seriousness of risks assessed in 2017;
– risk identification and assessment;
– Sanofi’s risk profile, with a list of major risks and mitigation plans;
– allocation of roles between the Executive Committee and the Risk Committee; and
– a presentation of imaginable scenarios and their potential consequences.
Subsequent to that meeting, an update on risk management is now proposed systematically at each Board meeting.
SANOFI / FORM 20-F 2018 133
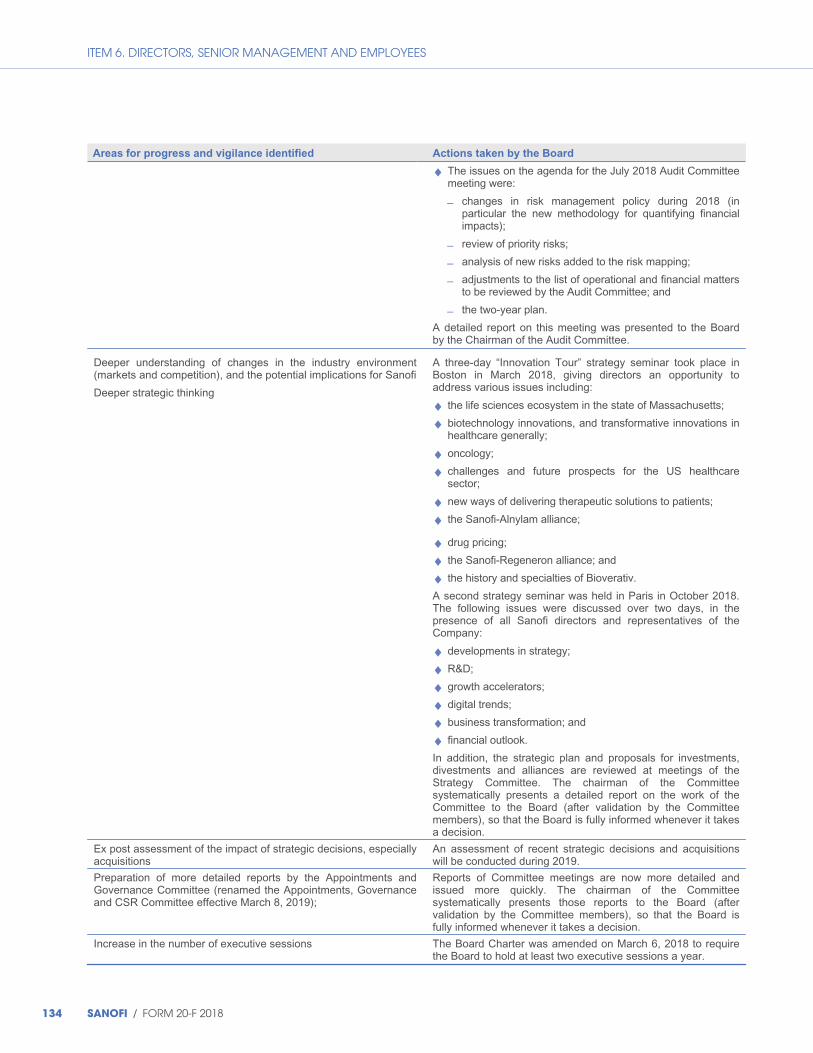
ITEM 6. DIRECTORS, SENIOR MANAGEMENT AND EMPLOYEES
Areas for progress and vigilance identified Actions taken by the Board
◆ The issues on the agenda for the July 2018 Audit Committee meeting were:
– changes in risk management policy during 2018 (in particular the new methodology for quantifying financial impacts);
– review of priority risks;
– analysis of new risks added to the risk mapping;
– adjustments to the list of operational and financial matters to be reviewed by the Audit Committee; and
– the two-year plan.
A detailed report on this meeting was presented to the Board by the Chairman of the Audit Committee.
Deeper understanding of changes in the industry environment (markets and competition), and the potential implications for Sanofi
Deeper strategic thinking
A three-day “Innovation Tour” strategy seminar took place in Boston in March 2018, giving directors an opportunity to address various issues including:
◆ the life sciences ecosystem in the state of Massachusetts;
◆ biotechnology innovations, and transformative innovations in healthcare generally;
◆ oncology;
◆ challenges and future prospects for the US healthcare sector;
◆ new ways of delivering therapeutic solutions to patients;
◆ the Sanofi-Alnylam alliance;
◆ drug pricing;
◆ the Sanofi-Regeneron alliance; and
◆ the history and specialties of Bioverativ.
A second strategy seminar was held in Paris in October 2018. The following issues were discussed over two days, in the presence of all Sanofi directors and representatives of the Company:
◆ developments in strategy;
◆ R&D;
◆ growth accelerators;
◆ digital trends;
◆ business transformation; and
◆ financial outlook.
In addition, the strategic plan and proposals for investments, divestments and alliances are reviewed at meetings of the Strategy Committee. The chairman of the Committee systematically presents a detailed report on the work of the Committee to the Board (after validation by the Committee members), so that the Board is fully informed whenever it takes a decision.
Ex post assessment of the impact of strategic decisions, especially acquisitions
An assessment of recent strategic decisions and acquisitions will be conducted during 2019.
Preparation of more detailed reports by the Appointments and Governance Committee (renamed the Appointments, Governance and CSR Committee effective March 8, 2019);
Reports of Committee meetings are now more detailed and issued more quickly. The chairman of the Committee systematically presents those reports to the Board (after validation by the Committee members), so that the Board is fully informed whenever it takes a decision.
Increase in the number of executive sessions The Board Charter was amended on March 6, 2018 to require the Board to hold at least two executive sessions a year.
134 SANOFI / FORM 20-F 2018
ITEM 6. DIRECTORS, SENIOR MANAGEMENT AND EMPLOYEES
In 2018, a formal evaluation of the Board was conducted under the direction of the Appointments and Governance Committee (renamed the Appointments, Governance and CSR Committee effective March 8, 2019), with assistance from the same specialist consultancy firm retained for the previous formal evaluation.
The evaluation took place over several weeks:
◆ Appointments and Governance Committee meeting of October 30, 2018: review of the process and methodology, and appointment of consultancy firm (after a tendering process).
◆ Board meeting of October 30, 2018: launch of the evaluation, acting on a proposal from the Appointments and Governance Committee.
◆ November 2018 through January 2019: the evaluation was conducted using the process described below:
– Distribution of a questionnaire to all directors, the main issues addressed by the questionnaire being: whether the composition of the Board is in line with Sanofi’s needs; quality of background material and presentations; working practices; relevance of the resources made available to the Board and its Committees; compliance of Sanofi’s corporate governance with best practice; quality and candor of discussions; composition and remit of the Committees; relations between the Board and the Executive Committee, shareholders and stakeholders; directors’ expectations; and personal contributions in terms of skill set and effective participation in discussions.
– Review of directors’ responses to the questionnaire.
– Appointments and Governance Committee meeting of December 18, 2018: progress report on the evaluation.
– Individual interviews conducted by a consultant.
◆ Appointments and Governance Committee meeting of February 26, 2019: presentation of results, and preparation of an executive summary including areas for progress and vigilance identified.
◆ Board meeting of March 8, 2019: review of executive summary, and decisions on actions to be taken.
The results of the 2018 evaluation showed a positive assessment of the way in which the Board and its Committees operate. The directors observed that there had been constant progress since the previous evaluation conducted using a similar process, in 2015.
The main issues on which the directors expressed satisfaction were:
◆ the diversity and complementarity of the Board, with a balance of skills that generates productive and lively debate;
◆ the well-prepared and informative off-site strategy seminar, which helped members to gain a better understanding of Sanofi’s markets and challenges, and get to know the management team;
◆ the Board’s ability to challenge management on strategy;
◆ the contribution of the Scientific Committee to the work of the Board;
◆ the good interaction between the Board and the Committees, and the quality of the Committee’s reports;
◆ the Board’s ability to prepare succession issues;
◆ the dynamic between Directors, enabling the Board to operate effectively as a team.
The Board also welcomed the way in which the composition of the Board had evolved to adapt to changes in the Company’s strategy and environment.
Finally, the directors judged the current governance structure (separation of the office of Chairman of the Board from that of Chief Executive Officer) to be appropriate to the Company’s needs and to be working effectively.
The areas for progress and vigilance identified in the latest evaluation and formally noted by the Board were:
◆ deeper long-term strategic thinking in the work of the Board and the Committees;
◆ better follow-up on the implementation of strategic decisions through the use of a dashboard;
◆ more interaction with the management team, especially with Executive Committee members;
◆ regular scheduling of executive sessions, and preparation of more detailed reports on such sessions;
◆ improved presentations, especially through more concise and relevant materials, to allow more time for debate and discussions during meetings;
◆ better prioritization of items on the agenda for Board meetings;
◆ continuing to diversify the Board without increasing its size; and
◆ further strengthening the links between Directors, and helping new Board members to integrate by allocating them a mentor.
The evaluation also included a review of each director’s contribution to the work of the Board and its Committees, which in each case was judged to have met the Company’s needs and to have been in line with its expectations. More generally, the Board found that directors had once again demonstrated strong commitment and were working well together. The diversity of their competencies, expertise and profiles contributed significantly to the quality of the work done by the Board and its Committees.
Succession planning
The remit of the Appointments and Governance Committee (renamed the Appointments, Governance and CSR Committee effective March 8, 2019) includes preparing for the future of the Company’s executive bodies, in particular through the establishment of a succession plan for executive officers. The Committee has a retained a specialist consultancy firm to evaluate and implement the plan.
The plan, which is systematically reviewed at meetings of the Appointments and Governance Committee (renamed the
SANOFI / FORM 20-F 2018 135
ITEM 6. DIRECTORS, SENIOR MANAGEMENT AND EMPLOYEES
Appointments, Governance and CSR Committee effective March 8, 2019), addresses various scenarios:
◆ unplanned vacancy due to prohibition, resignation or death;
◆ forced vacancy due to poor performance, mismanagement or misconduct; and
◆ planned vacancy due to retirement or expiration of term of office.
Through its work and discussions, the Committee seeks to devise a succession plan that is adaptable to situations arising in the short, medium or long term, but which also builds in diversity – in all its facets – as a key factor.
Although aware that separating the offices of Chairman and Chief Executive Officer provides continuity of power, the Committee nonetheless assesses the situation of the Chairman as well as that of the executive team.
To fulfill its remit, the Appointments, Governance and CSR Committee:
◆ provides the Board with progress reports, in particular at executive sessions;
◆ co-ordinates with the Compensation Committee. In that regard, having directors that sit on both Committees is a great advantage;
◆ works closely with the Chief Executive Officer to (i) ensure the plan is consistent with the Company’s own practices and market practices, (ii) ensure high-potential internal prospects receive appropriate support and training, and (iii) check there is adequate monitoring of key posts likely to fall vacant;
◆ meets with key executives as needed; and
◆ involves the Chief Executive Officer insofar as he has a key role in planning for his own successor, though without him directing the process.
In fulfilling their remit, Committee members are acutely conscious of confidentiality issues.
The succession plan was reviewed three times in 2018 (February 26, October 29 and December 18). Alongside the implementation of the succession plan, the situation of the Chairman was examined in detail in light of the expiration of Serge Weinberg’s term of office (the renewal of which the shareholders will be asked to approve at the Annual General Meeting of April 30, 2019). As with the Chief Executive Officer, the Chairman has a key role in planning for his own successor, though without him directing the process.
136 SANOFI / FORM 20-F 2018

ITEM 6. DIRECTORS, SENIOR MANAGEMENT AND EMPLOYEES
Composition of the Board of Directors as of December 31, 2018
As of December 31, 2018, our Board of Directors comprised:
Number of Number directorships Years of
of in listed First Term Board Director Age Gender Nationality shares companies(a) Independent appointed expires service AC AGC CC SC SciC
Serge Weinberg, 67 M French 1,636 1 Yes 2009 2019 AGM 9 C C √ Chairman of the Board
Olivier 62 M French 1,000 1 No 2015 2022 AGM 3 √ Brandicourt, Chief Executive Officer
Laurent Attal 60 M French 1,000 1 No 2012 2020 AGM 6 √ √
Emmanuel 51 M French 500 3 Yes 2018 2022 AGM 1 √ Babeau
Bernard 61 M French 1,000 2 Yes 2017 2021 AGM 2 Charlès
Claudie 61 F French 1,000 1 Yes 2008 2020 AGM 10 √ √ Haigneré
Patrick Kron 65 M French 1,000 4 Yes 2014 2022 AGM 4 √ C √
Fabienne 56 F French 1,000 2 Yes 2013 2021 AGM 5 C Lecorvaisier
Melanie Lee 60 F British 1,000 1 Yes 2017 2021 AGM 2 √
Suet-Fern Lee 60 F Singaporean 1,000 2 Yes 2011 2019 AGM 7
Christian 58 M French 1,590 2 No 2004 2022 AGM 14 √ √ Mulliez
Marion 36 F German 109 1 No 2017 2021 AGM 2 Palme(b)
Carole Piwnica 60 F Belgian 1,000 4 Yes 2010 2020 AGM 8
Christian 54 M French 251 1 No 2017 2021 AGM 2 Senectaire(b)
Diane Souza 66 F American 1,066 1 Yes 2016 2020 AGM 3 √ √
Thomas C. 63 M American/ 512 1 Yes 2016 2020 AGM 3 C Südhof German
Independent directors Female directors Non-French directors
79% 43% 38%
AC: Audit Committee AGC: Appointments and Governance Committee (renamed the Appointments, Governance and CSR Committee effective March 8, 2019) CC: Compensation Committee SC: Strategy Committee SciC: Scientific Committee C: Chairman/Chairwoman (a) Includes all non-executive and executive directorships held in listed companies. (b) Director representing employees.
SANOFI / FORM 20-F 2018 137

ITEM 6. DIRECTORS, SENIOR MANAGEMENT AND EMPLOYEES
Competencies of Board members
The Board of Directors, in liaison with the Appointments and Governance Committee (renamed the Appointments, Governance and CSR Committee effective March 8, 2019), must ensure that the composition of the Board is balanced, diverse and fit for purpose.
In assessing its composition, the Board takes account of the corporate strategy and of the new challenges facing the Company, and determines whether the qualities of serving directors are sufficient for the Board to deliver on its remit.
Over the past several years, the Board has adapted its composition in line with its roadmap by:
◆ bringing additional scientific expertise onto the Board;
◆ further raising the proportion of non-French directors;
◆ increasing the proportion of women on the Board;
◆ developing its competencies in digital; and
◆ maintaining the level of core competencies, especially in accounting and finance.
The Board has completed an overview of the competencies currently represented. The matrix below shows a comprehensive, balanced spread of the types of competencies required, both in general terms and by reference to our strategic ambitions (the matrix shows the number of directors possessing each of those competencies)(1):
Scientific training 5
Healthcare/pharmaceutical industryexperience
5
CEO role in international group 5
Board membership in internationalgroup
7
International experience 8
Mergers & acquisitions 7
Finance/Accounting 5
Regulatory 5
Digital 1
(1) The information shown excludes directors representing employees.
The Annual General Meeting of April 30, 2019 will be asked to renew the terms of office of Serge Weinberg and Suet-Fern Lee as directors. The Annual General Meeting will also be asked to ratify the Board’s decision of February 6, 2019 to co-opt Christophe Babule as a director following the resignation of Christian Mulliez as a director on the same date.
The following pages provide key information about each director individually:
◆ directorships and appointments held during 2018 (directorships in listed companies are indicated by an asterisk, and each director’s principal position is indicated in bold);
◆ other directorships held during the last five years; and
◆ education and professional experience.
138 SANOFI / FORM 20-F 2018

ITEM 6. DIRECTORS, SENIOR MANAGEMENT AND EMPLOYEES
Serge Weinberg
Date of birth: February 10, 1951 (aged 67)
Nationality: French
First elected: December 2009
Last reappointment: May 2015
Term expires: 2019
Business address: Sanofi – 54, rue La Boétie – 75008 Paris – France
Directorships and appointments of Serge Weinberg
Within the Sanofi Group Outside the Sanofi Group
Current directorships
and appointments
In French companies
◆ Independent director and Chairman of the Board of Directors of Sanofi*, – Chairman of the Strategy
Committee of Sanofi – Chairman of the Appointments and
Governance Committee of Sanofi (renamed the Appointments, Governance and CSR Committee effective March 8, 2019)
– Member of the Scientific Committee of Sanofi
◆ Chairman of Weinberg Capital Partners – Chairman of Maremma – Manager of Alret – Weinberg Capital Partners’ permanent representative on the
Board of ADIT ◆ Director of Madrigall
In foreign companies
None None
Past directorships
expiring within the
last five years
In French companies
None ◆ Director of Alliance Automotive Participations SAS and Schneider Electric*
◆ Member of the Supervisory Boards of Financière BFSA and Schneider Electric*
◆ Weinberg Capital Partners’ permanent representative on the Board of Sasa Industrie
◆ Vice Chairman and Director of Financière Sasa ◆ Chairman of the Supervisory Boards of Financière Climater
SAS and Financière Tess SAS ◆ Chairman of Financière Piasa and Piasa Holding
In foreign companies
None ◆ Chairman of Corum (Switzerland)
Education and professional experience
◆ Graduate in law, degree from the Institut d’Etudes Politiques ◆ Graduate of ENA (Ecole Nationale d’Administration)
Since 2005 Chairman of Weinberg Capital Partners
1976-1982 Sous-préfet and then Chief of Staff of the French Budget Minister (1981) 1982-1987 Deputy General Manager of FR3 (French television channel) and then Chief Executive Officer of Havas
Tourisme 1987-1990 Chief Executive Officer of Pallas Finance 1990-2005 Various positions at PPR* group including Chairman of the Management Board for 10 years 2006-2009 Chairman of the Board of Accor* 2005-2010 Vice Chairman of the Supervisory Board of Schneider Electric*
Number of shares held 1,636 shares
SANOFI / FORM 20-F 2018 139

ITEM 6. DIRECTORS, SENIOR MANAGEMENT AND EMPLOYEES
Olivier Brandicourt
Date of birth: February 13, 1956 (aged 62) Nationality: French First elected: April 2015 Last reappointment: May 2018 Term expires: 2022 Business address: Sanofi – 54, rue La Boétie – 75008 Paris – France
Directorships and appointments of Olivier Brandicourt Within the Sanofi Group Outside the Sanofi Group
Current directorships and appointments
In French companies
◆ Chief Executive Officer of Sanofi* None – Chairman of the Executive
Committee of Sanofi – Director of Sanofi
– Member of the Strategy Committee of Sanofi
◆ Chairman of Sanofi Biotechnology SAS
In foreign companies
None ◆ Member of the Board of Management of the Pharmaceutical Research and Manufacturers of America (PhRMA, United States)
◆ Member of the Council of the International Federation of Pharmaceutical Manufacturers and Associations (IFPMA, Switzerland)
◆ Member and Vice-President of the European Federation of Pharmaceutical Industries and Associations (EFPIA, Brussels)
◆ Member of the National Committee on US-China Relations (United States)
◆ Honorary Member of the Royal College of Physicians (United Kingdom)
Past directorships expiring within the last five years
In French companies
None None
In foreign companies
None ◆ Bayer Group (Germany):
– Chief Executive Officer and Chairman of the Executive
Committee of Bayer HealthCare AG – Member of the Executive Council of Bayer AG* ◆ Member and Vice-Chair of the Board of Trustees of the Children’s
Aid Society of New York (United States)
Education and professional experience ◆ Degree in Medical Mycology, Pasteur Institute, France ◆ Masters in Human Biology, Paris XII University, France ◆ Medical Degree with subspecialty in Infectious Diseases and Tropical Medicine, Paris V University, France Since 2015 Chief Executive Officer of Sanofi* 1979-1981 National Service with the Office de la recherche scientifique et technique outre-mer (ORSTOM) (Republic of
Congo) 1981-1987 Research Fellow and Hospital & University Assistant in the Department of Parasitology, Tropical Medicine and
Public Health at the Pitié-Salpêtrière Hospital (France) 1987-2000 Various operational and commercial positions at Warner-Lambert/Parke-Davis, including Vice-President and
General Manager (1998-2000) 2000-2013 Various operational and managerial positions at Pfizer Inc.*, including member of the Executive Leadership
Team (2010-2013) and President & General Manager Emerging Markets & Established Business Unit (2012-2013)
2013-2015 Chief Executive Officer and Chairman of the Executive Committee of Bayer HealthCare AG and Member of the Executive Council of Bayer AG*
Number of shares held 1,000 shares
140 SANOFI / FORM 20-F 2018

ITEM 6. DIRECTORS, SENIOR MANAGEMENT AND EMPLOYEES
Laurent Attal
Date of birth: February 11, 1958 (aged 60)
Nationality: French
First appointed: May 2012
Last reappointment: May 2016
Term expires: 2020
Business address: Sanofi – 54, rue La Boétie – 75008 Paris – France
Directorships and appointments of Laurent Attal
Within the Sanofi Group Outside the Sanofi Group
Current directorships
and appointments
In French companies
◆ Director of Sanofi* ◆ Director of Fondation d’Entreprise L’Oréal – Member of the Strategy Committee
of Sanofi – Member of the Scientific Committee
of Sanofi
In foreign companies
None None
Past directorships
expiring within the
last five years
In French companies
None None
In foreign companies
None None
Education and professional experience
◆ Doctor of medicine, dermatologist ◆ MBA from INSEAD (Institut Européen d’Administration des Affaires)
Since 2010 Vice-President General Manager Research and Innovation at L’Oréal*
Since 1986 Various positions within the L’Oréal* Group, including posts within the active cosmetics division and as President and Chief Executive Officer of L’Oréal USA (United States)
Since 2002 Member of the Executive Committee of L’Oréal*
Number of shares held
1,000 shares
SANOFI / FORM 20-F 2018 141

ITEM 6. DIRECTORS, SENIOR MANAGEMENT AND EMPLOYEES
Emmanuel Babeau
Date of birth: February 13, 1967 (aged 51) Nationality: French First elected: May 2018 Term expires: 2022 Business address: Sanofi – 54, rue La Boétie – 75008 Paris – France
Directorships and appointments of Emmanuel Babeau Within the Sanofi Group Outside the Sanofi Group
Current directorships and appointments
In French companies
◆ Independent director of Sanofi* – Member of the Audit Committee of
Sanofi
◆ Schneider Electric Group (of which Schneider Electric SE* is the parent company)
– Director of Schneider Electric Industries SAS – Member of the Supervisory Boards of Aster Capital Partners
SAS and Schneider Electric Energy Access (representing Schneider Electric Industries SAS)
◆ Director of Sodexo* – Chairman of the Audit Committee of Sodexo
◆ Managing Partner of SCI GETIJ
In foreign companies
None ◆ Schneider Electric Group (of which Schneider Electric SE* is the parent company)
– Vice Chairman and non-executive director of Aveva Group Plc.*
– Director of AO Schneider Electric, Schneider Electric (China) Co. Ltd., Samos Acquisition Company Ltd., Schneider Electric USA Inc., Schneider Electric Holdings Inc., Carros Sensors Topco Ltd. (formerly InnoVista Sensors Topco Ltd.)
Past directorships expiring within the last five years
In French companies
None ◆ Schneider Electric Group (of which Schneider Electric SE* is the parent company)
– Member of the Management Board of Schneider Electric
SA* – Director of Telvent GIT SA – Member of the Strategy Committee of Aster Capital Partners
– Member of the Supervisory Board of Innovista Sensors SAS
In foreign companies
None ◆ Schneider Electric Group (of which Schneider Electric SE* is the parent company)
– Director of Invensys Ltd. – Chairman and member of the Management Board of
Schneider Electric Services International Sprl.
Education and professional experience ◆ Graduate of ESCP (École Supérieure de Commerce de Paris, 1989) ◆ Post-graduate diploma in accounting and finance Since 2013 Deputy Chief Executive Officer in charge of Finance and Legal Affairs of Schneider Electric SE* 1990-1993 Arthur Andersen 1996-2009 Various functions within the Pernod Ricard* Group, including Chief Development Officer and Chief Financial
Officer 2009-2013 Various functions within Schneider Electric SE*, including Deputy Chief Executive Officer in charge of Finance
and Legal Affairs
Number of shares held 500 shares(1)
(1) Under the Board Charter, each director must be a shareholder in a personal capacity and hold at least 1,000 Sanofi shares in their own name. However, directors are allowed a period of two years in which to acquire these shares.
142 SANOFI / FORM 20-F 2018
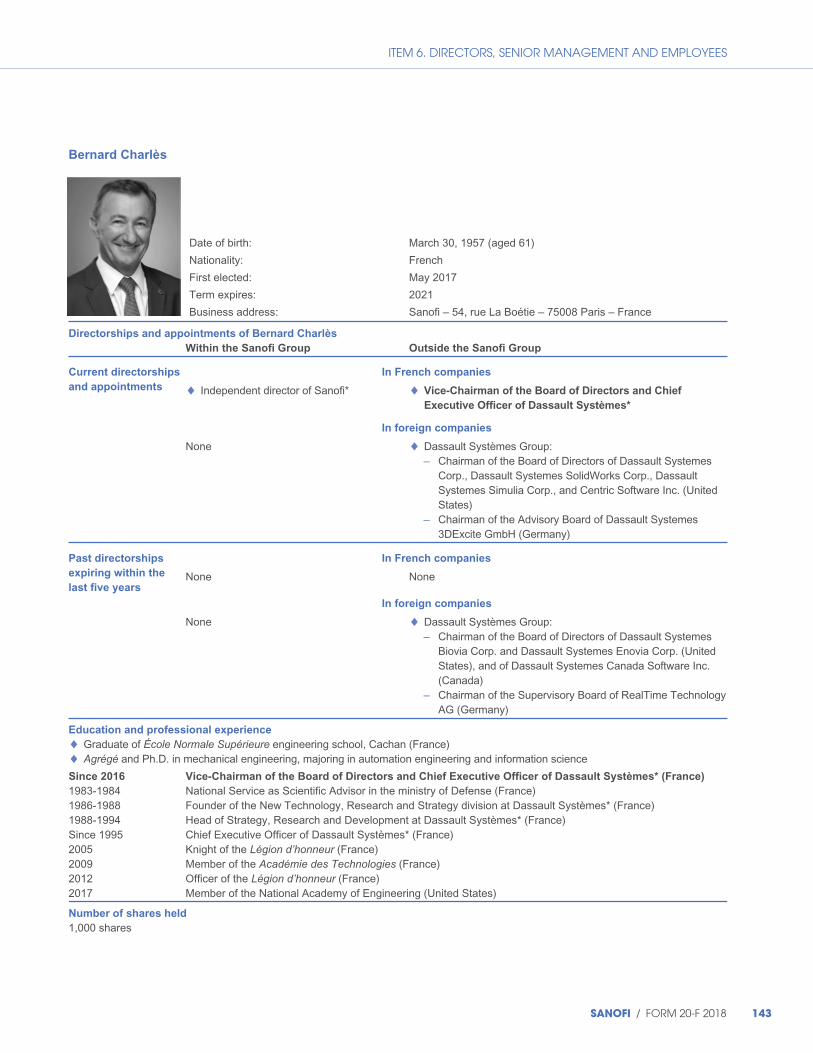
ITEM 6. DIRECTORS, SENIOR MANAGEMENT AND EMPLOYEES
Bernard Charlès
Date of birth: March 30, 1957 (aged 61)
Nationality: French
First elected: May 2017
Term expires: 2021
Business address: Sanofi – 54, rue La Boétie – 75008 Paris – France
Directorships and appointments of Bernard Charlès
Within the Sanofi Group Outside the Sanofi Group
Current directorships
and appointments
In French companies
◆ Independent director of Sanofi* ◆ Vice-Chairman of the Board of Directors and Chief
Executive Officer of Dassault Systèmes*
In foreign companies
None ◆ Dassault Systèmes Group: – Chairman of the Board of Directors of Dassault Systemes
Corp., Dassault Systemes SolidWorks Corp., Dassault Systemes Simulia Corp., and Centric Software Inc. (United States)
– Chairman of the Advisory Board of Dassault Systemes 3DExcite GmbH (Germany)
Past directorships
expiring within the
last five years
In French companies
None None
In foreign companies
None ◆ Dassault Systèmes Group: – Chairman of the Board of Directors of Dassault Systemes
Biovia Corp. and Dassault Systemes Enovia Corp. (United States), and of Dassault Systemes Canada Software Inc. (Canada)
– Chairman of the Supervisory Board of RealTime Technology AG (Germany)
Education and professional experience
◆ Graduate of École Normale Supérieure engineering school, Cachan (France) ◆ Agrégé and Ph.D. in mechanical engineering, majoring in automation engineering and information science
Since 2016 Vice-Chairman of the Board of Directors and Chief Executive Officer of Dassault Systèmes* (France)
1983-1984 National Service as Scientific Advisor in the ministry of Defense (France) 1986-1988 Founder of the New Technology, Research and Strategy division at Dassault Systèmes* (France) 1988-1994 Head of Strategy, Research and Development at Dassault Systèmes* (France) Since 1995 Chief Executive Officer of Dassault Systèmes* (France) 2005 Knight of the Légion d’honneur (France) 2009 Member of the Académie des Technologies (France) 2012 Officer of the Légion d’honneur (France) 2017 Member of the National Academy of Engineering (United States)
Number of shares held
1,000 shares
SANOFI / FORM 20-F 2018 143
ITEM 6. DIRECTORS, SENIOR MANAGEMENT AND EMPLOYEES
Claudie Haigneré
Date of birth: May 13, 1957 (aged 61)
Nationality: French
First appointed: May 2008
Last reappointment: May 2016
Term expires: 2020
Business address: Sanofi – 54, rue La Boétie – 75008 Paris – France
Directorships and appointments of Claudie Haigneré
Within the Sanofi Group Outside the Sanofi Group
Current directorships
and appointments
In French companies
◆ Independent director of Sanofi* – Member of the Appointments and
Governance Committee of Sanofi (renamed the Appointments, Governance and CSR Committee effective March 8, 2019)
– Member of the Compensation Committee of Sanofi
◆ Director of Fondation de l’Université de Lyon, Fondation C-Génial, Fondation d’Entreprise L’Oréal and Fondation Airbus
◆ Member of Académie des Technologies, Académie des Sports, Académie Nationale de l’Air et de l’Espace and Académie des Sciences de l’Outre-Mer
◆ Director of IRIS (French Institute for International and Strategic Affairs)
In foreign companies
None None
Past directorships
expiring within the
last five years
In French companies
None ◆ Director and member of the Innovation and Technology Committee of Orange*
◆ Chairwoman of Universcience (Cité des Sciences et de l’Industrie et Palais de la Découverte)
◆ Director of Fondation de France, École Normale Supérieure, Campus Condorcet, Pôle de Recherche et d’Enseignement Supérieur Hautes-Études-Sorbonne-Arts-et-Métiers and Fondation Lacoste
◆ Chairwoman of the Board of Directors of La Géode
In foreign companies
None None
Education and professional experience
◆ Rheumatologist, doctorate in sciences majoring in neurosciences ◆ Selected in 1985 by the CNES (French National Space Center) as an astronaut candidate
1984-1992 Rheumatologist, Cochin Hospital (Paris) 1996 Scientific space mission to the MIR space station (Cassiopée, Franco-Russian mission) 2001 Scientific and technical space mission to the International Space Station (Andromède mission) 2002-2004 Deputy Minister for Research and New Technologies in the French government 2004-2005 Deputy Minister for European Affairs in the French government 2005-2009 Adviser to the Director General of the European Space Agency 2007-2011 Vice-Chairwoman (Finance) of the IAA (International Academy of Astronautics) 2010-2011 Director of Aéro Club de France 2010-2015 Chairwoman of Universcience (French public-sector body) 2015 Special Adviser to the Director General of the European Space Agency
Number of shares held
1,000 shares
144 SANOFI / FORM 20-F 2018
ITEM 6. DIRECTORS, SENIOR MANAGEMENT AND EMPLOYEES
Patrick Kron
Date of birth: September 26, 1953 (aged 65)
Nationality: French
First appointed: May 2014
Last reappointment: May 2018
Term expires: 2022
Business address: Sanofi – 54, rue La Boétie – 75008 Paris – France
Directorships and appointments of Patrick Kron
Within the Sanofi Group Outside the Sanofi Group
Current directorships
and appointments
In French companies
◆ Independent director of Sanofi* ◆ Chairman of Truffle Capital SAS – Chairman of the Compensation
Committee of Sanofi – Member of the Appointments and
Governance Committee of Sanofi (renamed the Appointments, Governance and CSR Committee effective March 8, 2019)
– Member of the Strategy Committee of Sanofi
◆ Director of Lafarge-Holcim* ◆ Director of Halcor Metal Works* ◆ Director of Bouygues* ◆ Chairman of PKC&I SAS
– Permanent representative of PKC&I on the Supervisory Board of Segula Technologies
◆ Vice-President of the Les Arts Florissants choral group association
In foreign companies
None None
Past directorships
expiring within the
last five years
In French companies
None ◆ Alstom*: – Chairman and Chief Executive Officer
– Chairman of Alstom Resources Management
◆ Director of Association Française des Entreprises Privées
(AFEP)
In foreign companies
None ◆ Alstom*: – Director and Managing Director of Alstom Asia Pte. Ltd
(Singapore)
Education and professional experience
◆ Degree from École Polytechnique and École Nationale Supérieure des Mines de Paris
Since 2016 Chairman of Truffle Capital CAS
1979-1984 Various positions at the French Ministry of Industry, including as project officer at the Direction régionale de l’Industrie, de la Recherche et de l’Environnement (DRIRE) and in the Ministry’s general directorate
1984-1988 Operational responsibilities in one of the Pechiney Group’s biggest factories in Greece, then manager of the Greek subsidiary
1988-1993 Various senior operational and financial positions within the Pechiney Group 1993 Member of the Executive Committee of the Pechiney Group 1993-1997 Chairman and Chief Executive Officer of Carbone Lorraine 1995-1997 Manager of the Food and Health Care Packaging Sector at Pechiney, and Chief Operating Officer of American
National Can Company in Chicago (United States) 1998-2002 Chief Executive Officer of Imerys 2003-2016 Chief Executive Officer, then Chairman and Chief Executive Officer, of Alstom* Since 2016 Chairman of PKC&I SAS
Number of shares held
1,000 shares
SANOFI / FORM 20-F 2018 145
ITEM 6. DIRECTORS, SENIOR MANAGEMENT AND EMPLOYEES
Fabienne Lecorvaisier
Date of birth: August 27, 1962 (aged 56)
Nationality: French
First appointed: May 2013
Last reappointment: 2017
Term expires: 2021
Business address: Sanofi – 54, rue La Boétie – 75008 Paris – France
Directorships and appointments of Fabienne Lecorvaisier
Within the Sanofi Group Outside the Sanofi Group
Current directorships
and appointments
In French companies
◆ Independent director of Sanofi* – Chairwoman of the Audit
Committee of Sanofi
◆ Air Liquide Group*: – Director of Air Liquide International – Chairwoman and Chief Executive Officer of Air Liquide
Finance – Director of Air Liquide Eastern Europe – Director of The Hydrogen Company
In foreign companies
None ◆ Air Liquide Group*: – Executive Vice President of Air Liquide International
Corporation – Director of American Air Liquide Holdings, Inc. – Chairwoman of Air Liquide US LLC
Past directorships
expiring within the
last five years
In French companies
None ◆ Air Liquide Group*: – Director of Air Liquide France Industries, Aqualung
International, Air Liquide Welding SA and SOAEO
In foreign companies
None ◆ Air Liquide Group*: – Director of Air Liquide Japon (Japan)
Education and professional experience
◆ Civil engineer, graduate of Ecole Nationale des Ponts et Chaussées
Since July 2017 Executive Vice President, Chief Financial Officer and Executive Committee member of Air Liquide*
1985-1989 Member of the Corporate Finance Department, then Mergers and Acquisitions Department of Société Générale*
1989-1990 Senior Banking Executive in charge of the LBO Department (Paris)/Corporate Finance Department (Paris and London) at Barclays
1990-1993 Assistant General Manager of Banque du Louvre, Taittinger Group 1993-2007 Various positions within Essilor* including Group Chief Financial Officer (2001-2007) and Chief Strategy and
Acquisitions Officer (2007-2008) Since 2008 Chief Financial Officer and Executive Committee member of Air Liquide*
Number of shares held
1,000 shares
146 SANOFI / FORM 20-F 2018

ITEM 6. DIRECTORS, SENIOR MANAGEMENT AND EMPLOYEES
Melanie Lee
Date of birth: July 29, 1958 (aged 60)
Nationality: British
First elected: May 2017
Term expires: 2021
Business address: Sanofi – 54, rue La Boétie – 75008 Paris – France
Directorships and appointments of Melanie Lee
Within the Sanofi Group Outside the Sanofi Group
Current directorships
and appointments
In French companies
◆ Independent director of Sanofi* – Member of the Scientific Committee
of Sanofi
None
In foreign companies
None ◆ Director of Think10 (United Kingdom)
Past directorships
expiring within the
last five years
In French companies
None None
In foreign companies
None ◆ Director of Syntaxin Ltd* (United Kingdom) ◆ Director of BTG plc* (United Kingdom) ◆ Non-executive director of Lundbeck A/S (Denmark) ◆ Director of NightstaRx Ltd. (United Kingdom)
Education and professional experience
◆ Degree in Biology, University of York ◆ Ph.D. from the National Institute for Medical Research, London
Since 2018 Chief Executive Officer of LifeArc (United Kingdom)
1988-1998 Senior Biologist and subsequently Research Unit Head, Receptor Systems at Glaxo/GlaxoWellcome (United Kingdom)
2004-2007 Chairwoman of the Board of Directors of Cancer Research Technology Ltd. United Kingdom 1998-2009 Executive Director of Research at Celltech plc., and subsequently Executive Vice President, Research and
President New Medicines at UCB Celltech (United Kingdom) 2003-2011 Deputy Chairwoman of Cancer Research U.K. United Kingdom 2009-2013 Chief Executive Officer and Director of Syntaxin Ltd.* (United Kingdom) 2014 Founder of NightstaRx Ltd. (United Kingdom) 2011-2015 Non-executive director of Lundbeck A/S (Denmark) 2014-2018 Chief Scientific Officer of BTG plc* (United Kingdom) Since 2013 Director and Consultant, Think10 (United Kingdom)
Number of shares held
1,000 shares
SANOFI / FORM 20-F 2018 147
ITEM 6. DIRECTORS, SENIOR MANAGEMENT AND EMPLOYEES
Suet-Fern Lee
Date of birth: May 16, 1958 (aged 60)
Nationality: Singaporean
First appointed: May 2011
Last reappointment: May 2015
Term expires: 2019
Business address: Sanofi – 54, rue La Boétie – 75008 Paris – France
Directorships and appointments of Suet-Fern Lee
Within the Sanofi Group Outside the Sanofi Group
Current directorships
and appointments
In French companies
◆ Independent director of Sanofi* ◆ Rothschild & Co*: – Independent member of the Supervisory Board – Member of the Audit Committee
In foreign companies
None ◆ Director of Stamford Corporate Services Pte Ltd (Singapore) and the World Justice Project (United States), Caldecott Inc. (Cayman Islands) and Morgan Lewis & Bockius LLP (United States)
Past directorships
expiring within the
last five years
In French companies
None ◆ Axa*: – Independent director – Member of the Finance Committee
In foreign companies
None ◆ Director of Macquarie International Infrastructure Fund Ltd* (Bermuda) and of the National Heritage Board (Singapore)
◆ Chairwoman of the Board of Directors of the Asian Civilisations Museum (Singapore)
◆ Director of Rickmers Trust Management Pte Ltd* (Singapore)
Education and professional experience
◆ Law degree from Cambridge University (1980) ◆ Admitted to the Bar in London (1981) and Singapore (1982) ◆ Director of Morgan Lewis Stamford LLC ◆ Partner of Morgan Lewis & Bockius (United States) ◆ Chairwoman of the International Leadership Team, Morgan Lewis & Bockius
Since 2006 Member of the Board of Trustees of Nanyang Technological University (Singapore) Member of the Accounting Advisory Board of National University of Singapore Business School (Singapore)
Since 2007 Member of the Advisory Committee of Singapore Management University School of Law (Singapore) Since 2014 Member of the Senate and the Executive Committee of the Singapore Academy of Law where she also chairs
the Committee on Legal Education and Studies (Singapore) Chairwoman of the Expert Panel of the Centre of Cross-Border Commercial Law in Asia of the Singapore Management University School of Law (Singapore)
2010-2011 President of the Inter-Pacific Bar Association
Number of shares held
1,000 shares
148 SANOFI / FORM 20-F 2018

ITEM 6. DIRECTORS, SENIOR MANAGEMENT AND EMPLOYEES
Christian Mulliez
Date of birth: November 10, 1960 (aged 58)
Nationality: French
First appointed: June 2004
Last reappointment: May 2018
Term expires: 2022
Business address: Sanofi – 54, rue La Boétie – 75008 Paris – France
Directorships and appointments of Christian Mulliez
Within the Sanofi Group Outside the Sanofi Group
Current directorships
and appointments
In French companies
◆ Director of Sanofi* ◆ L’Oréal Group*: – Member of the Audit Committee of
Sanofi – Chairman of the Board of Directors of Regefi
◆ Director of GG 17 Invest – Member of the Compensation
Committee of Sanofi
In foreign companies
None ◆ L’Oréal Group*: – Director of L’Oréal USA Inc. (United States)
Past directorships
expiring within the
last five years
In French companies
None None
In foreign companies
None ◆ L’Oréal Group*: – Director of The Body Shop International (United Kingdom)
and Galderma Pharma (Switzerland)
Education and professional experience
◆ Degree from ESSEC (École Supérieure des Sciences Économiques et Commerciales)
Since 2003 Executive Vice President, Chief Financial Officer of L’Oréal*
1984-2002 Various positions at Synthélabo and then Sanofi-Synthélabo, including Vice President Finance
Number of shares held
1,590 shares
SANOFI / FORM 20-F 2018 149
ITEM 6. DIRECTORS, SENIOR MANAGEMENT AND EMPLOYEES
Carole Piwnica
Date of birth: February 12, 1958 (aged 60)
Nationality: Belgian
First appointed: December 2010
Last reappointment: May 2016
Term expires: 2020
Business address: Sanofi – 54, rue La Boétie – 75008 Paris – France
Directorships and appointments of Carole Piwnica
Within the Sanofi Group Outside the Sanofi Group
Current directorships
and appointments
In French companies
◆ Independent director of Sanofi* ◆ Eutelsat Communications*: – Member of the Audit Committee of
Sanofi (until April 2018) – Independent director – Chairwoman of the Nomination and Governance Committee
◆ Rothschild & Co*: – Independent member of the Supervisory Board
In foreign companies
None ◆ Director of Naxos UK Ltd (United Kingdom) – Director of Elevance (United States) and i2O (United
Kingdom) ◆ Director of Amyris Inc* (United States)
Past directorships
expiring within the
last five years
In French companies
None ◆ Rothschild & Co*: – Member of the Audit Committee and the Strategy
Committee
In foreign companies
None ◆ Director of Louis Delhaize* (Belgium), RecyCoal Ltd. (United Kingdom) and Big Red (United States)
Education and professional experience
◆ Degree in law, Université Libre de Bruxelles ◆ Master of Laws, New York University ◆ Admitted to the Bar in Paris and New York
Since 2006 Founder Director of Naxos UK Ltd (United Kingdom)
1985-1991 Attorney at Proskauer, Rose (New York) and Shearman & Sterling (Paris) with practice in mergers and acquisitions
1991-1994 General Counsel of Gardini & Associés 1994-2000 Chief Executive Officer of Amylum France, then Chairwoman of Amylum Group 1998-2004 Director of Spadel (Belgium) 1996-2006 Director of Tate & Lyle Plc (United Kingdom) 1996-2006 Chairwoman of the Liaison Committee and director of the Confédération Européenne des Industries Agro-
Alimentaires (CIAA) 2000-2006 Director and Vice-Chairwoman of Tate & Lyle Plc for Governmental Affairs (United Kingdom) 2000-2006 Chairwoman of the Export Commission and director of the Association Nationale des Industries Alimentaires
(ANIA) 2006-2009 Member of the Ethical Committee of Monsanto* (United States) 1996-2010 Director of Toepfer GmbH (Germany) 2007-2010 Director of Dairy Crest Plc* (United Kingdom) 2003-2011 Director, Chairwoman of the Corporate Responsibility Committee and member of the Compensation Committee
of Aviva Plc* (United Kingdom)
Number of shares held
1,000 shares
150 SANOFI / FORM 20-F 2018
ITEM 6. DIRECTORS, SENIOR MANAGEMENT AND EMPLOYEES
Diane Souza
Date of birth: July 3, 1952 (aged 66)
Nationality: American
First elected: May 2016
Term expires: 2020
Business address: Sanofi – 54, rue La Boétie – 75008 Paris – France
Directorships and appointments of Diane Souza
Within the Sanofi Group Outside the Sanofi Group
Current directorships
and appointments
In French companies
◆ Independent director of Sanofi* – Member of the Compensation
Committee of Sanofi – Member of the Audit Committee of
Sanofi (since May 2018)
None
In foreign companies
None ◆ Member of the Board of Directors of Farm Credit East (United States)
Past directorships
expiring within the
last five years
In French companies
None None
In foreign companies
None ◆ UnitedHealth Group: – Member of the Board of Directors of Unimerica Insurance
Company, Unimerica Life Insurance Company of New York, National Pacific Dental, Inc., Nevada Pacific Dental, DBP Services of New York, IPA, Dental Benefits Providers of California, Inc., Dental Benefit Providers of Illinois, Inc., Dental Benefit Providers, Inc., Spectera, Inc. and Spectera of New York, IPA, Inc. United States
Education and professional experience
◆ Degree in Accounting from University of Massachusetts ◆ Honorary doctorate in Business Administration from University of Massachusetts Dartmouth ◆ Certified Public Accountant ◆ Diploma in Dental Hygiene from Northeastern University, Forsyth School for Dental Hygienists
1979 Audit Staff Accountant at Price Waterhouse (United States) 1980-1988 Various positions at Deloitte Haskins & Sells, from Audit Staff Accountant to Senior Tax Manager-in-Charge
(United States) 1988-1994 Various positions at Price Waterhouse from Audit Staff Accountant to Head of the Northeast Insurance Tax
Region (United States) 1994-2006 Various positions at Aetna Inc. including Deputy Vice President Federal and State Taxes; Vice President and
Chief Financial Officer, Large Case Pensions; Vice President and Head of Global Internal Audit Services; Vice President, National Customer Operations; and finally Vice President, Strategic Systems & Processes (United States)
2007-2008 Principal consultant at Strategic Business Solutions, LLC (United States) 2008-2014 Chief Operating Officer of OptumHealth Specialty Benefits (2008), then Chief Executive Officer of
UnitedHealthcare Specialty Benefits (United States)
Number of shares held
2,132 American Depository Receipts, equivalent to 1,066 shares
SANOFI / FORM 20-F 2018 151
ITEM 6. DIRECTORS, SENIOR MANAGEMENT AND EMPLOYEES
Thomas C. Südhof
Date of birth: December 22, 1955 (aged 63) Nationality: German and American First elected: May 2016 Term expires: 2020 Business address: Sanofi – 54, rue La Boétie – 75008 Paris – France
Directorships and appointments of Thomas C. Südhof Within the Sanofi Group Outside the Sanofi Group
Current directorships and appointments
In French companies
◆ Independent director of Sanofi* None – Chairman of the Scientific
Committee of Sanofi
In foreign companies
None ◆ Independent director of Abide Therapeutics (United States)
Past directorships expiring within the last five years
In French companies
None None
In foreign companies
None None
Education and professional experience ◆ Degree in medicine from the Faculty of Medicine of the University of Göttingen (Germany) ◆ Bernard Katz Prize of the Biophysical Society, jointly with Reinhard Jahn (2008) ◆ Nobel Prize for Physiology or Medicine, jointly with James Rothman and Randy Shekman (2013) ◆ Albert Lasker Prize for Basic Medical Research, jointly with Richard Sheller (2013) Since 2008 Avram Goldstein Professor of Molecular & Cellular Physiology, Neurosurgery, Psychiatry, and
Neurology in the School of Medicine at Stanford University (United States) 1978-1981 Research assistant at the Max Planck Institute for Biophysical Chemistry (Germany) 1979 Student on exchange clerkship program at Harvard Medical School (United States) 1981-1982 Intern at the University Hospital of Göttingen (Germany) 1983-1986 Postdoctoral Fellow, Dept. of Molecular Genetics, UT Southwestern Medical School (USA) 1986-2008 Professor and subsequently Chair of the Neuroscience Department at the University of Texas Southwestern
Medical School (United States) 2014-2017 Co-founder and member of the Scientific Advisory Board of Bluenobel, Inc. (China) 2014-2018 Member of the Scientific Advisory Board of the Singapore National Research Foundation (Singapore) 2014-2018 Member of the Scientific Advisory Board of the Chinese Academy Institute of Biophysics (China) 2014-2018 Member of the Scientific Advisory Committee of the Institute of Cellular and Molecular Biology of A*Star (China) 2017-2018 Member of the Scientific Advisory Board of Abide (USA) Since 1986 Investigator at the Howard Hughes Medical Institute (United States) Since 2002 Co-founder and member of the Scientific Advisory Board of REATA Pharmaceuticals (United States) Since 2011 Co-founder and member of the Scientific Advisory Board of Circuit Therapeutics, Inc. (United States) Since 2013 Member of the Review Board of Genentech Neuroscience (United States) Since 2013 Member of the Scientific Advisory Board of the Shemyakin-Ovchinnikov Institute of Bio-Organic Chemistry
(Russia) Since 2014 Member of the Scientific Advisory Board of Elysium, Inc. (United States) Since 2016 Member of the Scientific Advisory Board of Simcere, Inc. China Since 2017 Member of the Scientific Advisory Board of the Chinese Academy of Sciences Institute of Guangzhou (China) Since 2017 Member of the Scientific Advisory Board of C-Bridge (China) Since 2017 Member of the Scientific Advisory Board of Cytodel, Inc. (United States) Since 2017 Co-founder and member of the Scientific Advisory Board of Neucyte, Inc. (United States) Since 2018 Member of the Scientific Advisory Board of Alector, Inc. (United States) Since 2018 Chairman of the Scientific Advisory Board of Capital Medical University, Beijing (China)
Number of shares held 1,024 American Depositary Receipts, equivalent to 512 shares
152 SANOFI / FORM 20-F 2018
ITEM 6. DIRECTORS, SENIOR MANAGEMENT AND EMPLOYEES
Marion Palme
Date of birth: December 22, 1982 (aged 36)
Nationality: German
First elected: May 2017
Term expires: 2021
Business address: Sanofi – 54, rue La Boétie – 75008 Paris – France
Directorships and appointments of Marion Palme
Within the Sanofi Group Outside the Sanofi Group
Current directorships
and appointments
In French companies
◆ Director representing employees of Sanofi*
None
In foreign companies
None ◆ Member of the German Industrial Union Mining, Chemistry, Energy (IG BCE) (Germany)
Past directorships
expiring within the
last five years
In French companies
◆ Member of the European Works Council
None
In foreign companies
None None
Education and professional experience
◆ Bachelor of Science in Chemical Engineering from Provadis School of International Management and Technology (2011)
Since 2005 Laboratory Technician at the Frankfurt site (Germany)
2002-2005 Apprenticeship as a laboratory technician at the Frankfurt site (Germany)
Number of shares held
109(1)
(1) In accordance with Article L.225-25 of the French Commercial Code, directors representing employees are exempt from the obligation to hold shares.
SANOFI / FORM 20-F 2018 153
ITEM 6. DIRECTORS, SENIOR MANAGEMENT AND EMPLOYEES
Christian Senectaire
Date of birth: October 9, 1964 (aged 54)
Nationality: French
First elected: May 2017
Term expires: 2021
Business address: Sanofi – 54, rue La Boétie – 75008 Paris – France
Directorships and appointments of Christian Senectaire
Within the Sanofi Group Outside the Sanofi Group
Current directorships
and appointments
In French companies
◆ Director representing employees of Sanofi*
None
◆ Member of the Supervisory Board of the Sanofi Group Savings Scheme (PEG)
◆ Member of the Supervisory Board of the Sanofi Group Collective Retirement Savings Plan (PERCO)
In foreign companies
None None
Past directorships
expiring within the
last five years
In French companies
◆ Alternate member of the Works Council at the Vertolaye site and of the Sanofi Chimie Works Council
◆ SAS Laboratoires Pichot: Member of the Compensation and Disclosure Committee
◆ Titular member and Secretary of the Sanofi Group Works Council
◆ Central Delegate for the CFDT union, Sanofi Chimie
◆ Deputy Group Delegate for the CFDT union, Sanofi France
In foreign companies
None None
Education and professional experience
Since 1987 Staff representative on the CFDT ticket (France) Since 2009 Senior production technician at the Vertolaye site (France)
1985-2009 Chemical industry machine operator at the Neuville site and then the Vertolaye site (France)
Number of shares held
251(1)
154 SANOFI / FORM 20-F 2018
ITEM 6. DIRECTORS, SENIOR MANAGEMENT AND EMPLOYEES
Changes in the composition of the Board of Directors
The only change in the composition of the Board of Directors during 2018 was the appointment of Emmanuel Babeau as a new independent director. On February 6, 2019, the Board duly noted the resignation of Christian Mulliez and decided, after consulting the Appointments and Governance Committee (renamed the Appointments, Governance and CSR Committee effective March 8, 2019), to co-opt Christophe Babule as new director.
The table below shows changes in the composition of the Board of Directors during 2017 and 2018, and the changes that will be submitted for approval at the Annual General Meeting of April 30, 2019:
Annual General Meeting of
May 10, 2017
Annual General Meeting of
May 2, 2018
Annual General Meeting of
April 30, 2019
Expiry of term of office None Robert Castaigne (independent director)
None
Renewal of term of office Fabienne Lecorvaisier (independent director)
Olivier Brandicourt Christian Mulliez Patrick Kron (independent director)
Serge Weinberg (independent director and Chairman of the Board of Directors) Suet-Fern Lee (independent director)
Proposed new appointments Bernard Charlès (independent director) Melanie Lee (independent director)
Emmanuel Babeau (independent director)
None
Co-opted None None Christophe Babule(a)
Other Christian Senectaire (director representing employees)(b) Marion Palme (director representing employees)(c)
None None
(a) Director co-opted by the Board of Directors on February 6, 2019 following the resignation of Christian Mulliez as a director on the same day. (b) Director representing employees, designated by the trade union body which is the most representative, within the meaning of applicable legislation, in the
Company and those of its direct or indirect subsidiaries that have their registered office in French territory. (c) Director representing employees, designated by the European Works Council.
If the terms of office of Serge Weinberg and Suet-Fern Lee are renewed and the co-opting of Christophe Babule is ratified, there would be no change in the number of Board members (16). The proportion of independent directors (79%) and female directors (43%), calculated using currently applicable rules, would not change either.
As of December 31, 2018, the members of our Board of Directors collectively held (directly, or via the employee share ownership fund associated with the Group savings scheme) 14,664 of our shares, representing 0.0012% of our share capital.
As of December 31, 2018, no corporate officer has been the subject of any conviction or court order, or been associated with any bankruptcy or winding-up order. As of this day, there is no potential conflict of interest between any corporate officer and Sanofi.
Under current French legislation, and given that employees own less than 3% of our share capital, the Board does not include a director representing employee shareholders.
SANOFI / FORM 20-F 2018 155
ITEM 6. DIRECTORS, SENIOR MANAGEMENT AND EMPLOYEES
Executive Committee
The Executive Committee is chaired by the Chief Executive Officer. The Committee meets at least twice a month.
The composition of the Executive Committee changed in 2018, with the appointment of five new members.
Outgoing members Incoming members
Dominique Carouge – Executive Vice President, Business Transformation (February 15, 2018)
Elias Zerhouni – President, Global Research and Development (June 30, 2018)
John Reed – Executive Vice President, Global Head of Research & Development (July 1, 2018)
Jérôme Contamine – Executive Vice President, Chief Financial Officer (September 30, 2018)
Jean-Baptiste Chasseloup de Chatillon – Executive Vice President, Chief Financial Officer (October 1, 2018)
Roberto Pucci – Executive Vice President, Human Resources (September 30, 2018)
Caroline Luscombe – Executive Vice President, Human Resources (October 1, 2018)
Stefan Oelrich – Executive Vice President, Diabetes & Cardiovascular (September 30, 2018)
Dieter Weinand – Executive Vice President, Primary Care (November 1, 2018)
(a) On September 13, 2018, we announced the creation of a new Primary Care Global Business Unit (GBU), combining the product portfolio of the former Diabetes & Cardiovascular GBU with the Established Products portfolio previously contained in the former General Medicines & Emerging Markets GBU. The new GBU, headed up by Dieter Weinand, will focus exclusively on mature markets. We have also created a second new GBU, China and Emerging Markets, headed up by Olivier Charmeil. These new GBUs were launched at the beginning of 2019. Sanofi’s other GBUs – Sanofi Genzyme, Sanofi Pasteur and Consumer Healthcare – remain unchanged.
As of December 31, 2018, the Executive Committee had 15 members.
In accordance with the Board Charter, the Board of Directors – in liaison with the Compensation Committee and the Appointments and Governance Committee (renamed the Appointments, Governance and CSR Committee effective March 8, 2019) ensures that the Chief Executive Officer implements a non-discrimination and diversity policy, especially as regards gender balance on the Executive Committee.
The list below shows all 15 permanent members of our Executive Committee as of the date of publication of this Annual Report on Form 20-F.
Olivier Brandicourt
Chief Executive Officer
Date of birth: February 13, 1956
Olivier Brandicourt was appointed Chief Executive Officer on April 2, 2015, and is also a member of our Strategy Committee.
For additional information regarding his education and professional experience see “– Competencies of Board members” above.
Dominique Carouge
Executive Vice President, Business Transformation
Date of birth: March 17, 1961
Dominique Carouge is a graduate of Ecole Supérieure de Commerce de Reims. He also holds an expertise comptable (CPA) qualification in France, as well as a Corporate Governance and Board management certificate from Sciences Po (Certificat d’Administrateur de Sociétés).
Dominique Carouge started his career in 1985 as an external auditor at Ernst & Young (EY) both in France (Paris) and in the US (Philadelphia). He joined Sanofi in 1991. Since then and for the past 28 years, he has held various finance positions of increasing responsibility and leadership across Australia, New Zealand, Germany and France. In 1991, he joined Roussel Uclaf where he held a positions of increasing seniority in finance. In 1996, he was appointed Chief Financial Officer for Hoechst Marion Roussel in Australia. From 1999 to 2002, he was in charge of Business Planning and Reporting at Aventis Pharma in Frankfurt, Germany. In 2003, he was appointed Operations Controller for the Aventis Group.
In 2005, Dominique Carouge became Chief Financial Officer for the Vaccines division.
From 2009 to 2011, he held the role of Vice President, Chief Strategy and Finance Officer for Sanofi Pasteur, and then Vice President, Administration & Management for Global R&D from 2011 to 2015.
On January 1, 2016, he was appointed Deputy CFO and Head of Finance Operations and Group Controlling.
He was appointed to his current position in January 2018, and took up his new role on February 15, 2018.
Dominique Carouge is a citizen of France.
Olivier Charmeil
Executive Vice President, China and Emerging Markets
Date of birth: February 19, 1963
Olivier Charmeil is a graduate of HEC (Ecole des Hautes Etudes Commerciales) and of the Institut d’Etudes Politiques in Paris. From 1989 to 1994, he worked in the Mergers & Acquisitions
156 SANOFI / FORM 20-F 2018
ITEM 6. DIRECTORS, SENIOR MANAGEMENT AND EMPLOYEES
department of Banque de l’Union Européenne. He joined Sanofi Pharma in 1994 as head of Business Development. Subsequently, he held various positions within Sanofi, including Chief Financial Officer (Asia) of Sanofi-Synthélabo in 1999 and Attaché to the Chairman, Jean-François Dehecq, in 2000, before being appointed as Vice President, Development within the Sanofi-Synthélabo International Operations Directorate, where he was responsible for China and support functions. In 2003, Olivier Charmeil was appointed Chairman and Chief Executive Officer of Sanofi-Synthélabo France, before taking the position of Senior Vice President, Business Management and Support within the Pharmaceutical Operations Directorate. In this role, he piloted the operational integration of Sanofi-Synthélabo and Aventis. He was appointed Senior Vice President Asia/Pacific, Pharmaceutical Operations in February 2006; Operations Japan reported to him from January 1, 2008, as did Asia/Pacific and Japan Vaccines from February 2009. On January 1, 2011, Olivier Charmeil was appointed Executive Vice President Vaccines, and joined our Executive Committee.
In May 2015, Olivier Charmeil and André Syrota were appointed as Co-Leaders of “Medicine of the Future”, an initiative developed by the French Minister for Economy, Industry and Digital Affairs, the French Minister for Social Affairs, Health and Women’s Rights and the French Minister for National and Higher Education and Research. They have been tasked with assembling a group of industrialists and academics, with the objective of imagining how French industry can accelerate the launch and export of innovative industrial products, with an emphasis on new biotechnologies.
From June 2016 to December 2018, Olivier Charmeil served as Executive Vice President of our General Medicines and Emerging Markets Global Business Unit.
He took up his current position of Executive Vice President, China and Emerging Markets in January 2019.
Olivier Charmeil is a citizen of France.
Jean-Baptiste Chasseloup de Chatillon
Executive Vice President, Chief Financial Officer
Date of birth: March 19, 1965
Jean-Baptiste Chasseloup de Chatillon holds a Masters from Paris Dauphine University and studied Finance in the United Kingdom at Lancaster University.
Until recently, he served as Chief Financial Officer and Executive Vice President of the PSA Group. In that capacity, he was also a member of the Managing Board and Executive Committee. He held various management positions within the PSA Group in finance (Treasurer in Spain, Chief Financial Officer in the United Kingdom) and in sales and marketing (Citroen Belgium Managing Director). He was also Chairman of the Board of Banque PSA Finance (BPF) from 2012 to June 2016. He joined the Peugeot S.A. Managing Board in 2012.
He was appointed to his current post on October 1, 2018.
Jean-Baptiste Chasseloup de Chatillon is a citizen of France.
Karen Linehan
Executive Vice President, Legal Affairs and General Counsel
Date of birth: January 21, 1959
Karen Linehan graduated from Georgetown University with Bachelor of Arts and Juris Doctorate degrees. Prior to practicing law, Ms. Linehan served on the congressional staff of the Speaker of the US House of Representatives from September 1977 to August 1986. Until December 1990, she was an Associate in a mid-size law firm in New York. In January 1991, she joined Sanofi as Assistant General Counsel of its US subsidiary. In July 1996, Ms. Linehan moved to Paris to work on international legal matters within Sanofi and she has held a number of positions within the Legal Department, most recently as Vice President – Deputy Head of Legal Operations.
She was appointed to her current position in March 2007.
Karen Linehan is a citizen of the United States of America and Ireland.
David Loew
Executive Vice President, Sanofi Pasteur
Date of birth: March 20, 1967
David Loew has a degree in Finance and Marketing and an MBA from the University of St. Gallen in Switzerland.
He started his career in the United States at Coopers & Lybrand and Hewlett Packard in 1990, before joining Roche in 1992. Over the next 21 years, David held a variety of positions with Roche including Global Oncology Head, General Manager Switzerland, Global Chief Marketing Officer & Head of Global Product Strategy, and Region Head Eastern Europe, Middle East and Africa for the Pharma Division of Roche.
David joined Sanofi in July 2013 as Senior Vice President Commercial Operations Europe and became Head of Global Commercial Operations at Sanofi Pasteur in January 2016. He was the International Federation of Pharmaceutical Manufacturers & Associations (IFPMA) representative on the Board of the Global Alliance for Vaccines and Immunization (GAVI). He also chaired the Steering Committee of IFPMA, comprising the CEOs of the member companies (GSK, Merck, Johnson & Johnson, Pfizer, Takeda, Novartis and Daiichi Sankyo), until July 2017.
He was appointed to his current position on June 1, 2016.
David Loew is a citizen of Switzerland.
SANOFI / FORM 20-F 2018 157

ITEM 6. DIRECTORS, SENIOR MANAGEMENT AND EMPLOYEES
Philippe Luscan
Executive Vice President, Global Industrial Affairs
Date of birth: April 3, 1962
Philippe Luscan is a graduate of the École Polytechnique (X) and the École Nationale Supérieure des Mines de Paris in Biotechnology. He began his career in 1987 as a Production Manager at Danone. In 1990, he joined Sanofi as Director of the Sanofi Chimie plant at Sisteron, France, and subsequently served as Industrial Director of Sanofi in the United States, as Vice President Supply Chain and as Vice President Chemistry from September 2006. He was appointed to his current position in September 2008. From January 2015 to September 2017, he was also Chairman of Sanofi in France.
Philippe Luscan is a citizen of France.
Caroline Luscombe
Executive Vice President, Human Resources
Date of birth: February 28, 1960
Caroline Luscombe holds a bachelor’s degree in German from University College, London. She started her career in finance at Arthur Young McClelland Moore, and was also UK controller and Compensation and Benefits manager for the strategy consultants Bain & Company.
Until recently, she was Head of Organization and Human Resources and a member of the Executive Committee at LafargeHolcim, based in Zurich (Switzerland). Before joining LafargeHolcim, she spent six years as Global Head of Human Resources and a member of the Executive Committee at Syngenta.
She previously held a number of senior HR positions at General Electric (GE), including head of HR at GE Capital Global Banking, GE Money and GE Healthcare Bio-Sciences. Ms Luscombe was also Executive Vice President HR for the Medical Diagnostics Division of Amersham plc, before that company was acquired by GE.
She was appointed to her current position on October 1, 2018.
Caroline Luscombe is a citizen of the United Kingdom.
Alan Main
Executive Vice President, Consumer Healthcare
Date of birth: July 3, 1963
Alan Main has a BA (Hons) in International Marketing from Thames Polytechnic in London, and has completed various executive and leadership development programs at London, Harvard and Columbia Business Schools, as well as INSEAD (Asia).
Alan has more than 30 years of marketing and general management experience in the Consumer Health and Medical Device fields, initially with Stafford Miller/Block Drug (GSK). He
then moved to Merrell Dow (Sanofi) and the London Rubber Company. In 1992, he joined Roche Consumer Health where he took on positions of increasing responsibility in the United Kingdom, South Africa and the Asia-Pacific region. Following the acquisition of Roche Consumer Health by Bayer in 2004, Alan continued to occupy key management roles, including Region Head for Asia Pacific and Europe. In 2010 Alan transferred to the medical device business of Bayer as Global President for Bayer Medical Care.
He was appointed to his current position in October 2016.
Alan Main is a citizen of the United Kingdom.
Muzammil Mansuri
Executive Vice President, Strategy and Business
Development
Date of birth: January 20, 1954
Muzammil Mansuri holds a Bachelor of Science degree in Chemistry and a Ph.D. in Organic Chemistry from University College London. He held post-doctoral positions at the University of California, Los Angeles (UCLA) and Columbia University. He started his career in 1981 with Shell Research Limited where he began as a research scientist. After Shell, he spent several years with Bristol-Myers Company in various R&D roles with increasing responsibility. From 2007 to 2010, he was Chairman and CEO at CGI Pharmaceuticals. Before joining Sanofi, Muzammil’s most recent position was Senior Vice President, Research & Development Strategy and Corporate Development at Gilead Sciences.
He was appointed to his current position in February 2016.
Muzammil Mansuri is a citizen of the United States of America and the United Kingdom.
Ameet Nathwani
Chief Digital Officer, Chief Medical Officer and Executive
Vice President Medical Function
Date of birth: October 5, 1963
Ameet Nathwani was born in Uganda and studied in the United Kingdom. He qualified in medicine in 1987 in London, and acquired his specialization in Cardiology at a number of University Hospitals in London. He also has a diploma in Pharmaceutical Medicine and an executive Masters in Business Administration.
Ameet Nathwani has more than twenty years’ experience in the pharmaceutical industry, beginning in 1994 when he joined Glaxo Group Research. Between 1994 and 2004 he held increasingly senior functional and franchise leadership roles in research and development in Glaxo, SmithKline Beecham and GlaxoSmithKline, in Europe and the US. He joined Novartis in 2004 as Senior Vice President and Global Development Head of the Cardiovascular and Metabolic Franchise, and over an 11-year period held a number of senior development and
158 SANOFI / FORM 20-F 2018
ITEM 6. DIRECTORS, SENIOR MANAGEMENT AND EMPLOYEES
commercial positions including Global Head of the Critical Care Franchise. In June 2014 Ameet Nathwani was appointed Global Head of Medical Affairs at Novartis Pharma AG and became a member of the Pharma Executive Committee, where he led the establishment of a Real World Evidence Center of Excellence and piloted the Digital Medicine strategy.
He was appointed as Chief Medical Officer and Executive Vice President Medical Function in May 2016. In addition to this role, he was appointed Chief Digital Officer on February 12, 2019.
Ameet Nathwani is a citizen of the United Kingdom.
John Reed
Executive Vice President, Global Head of Research and
Development
Date of birth: October 11, 1958
John Reed holds a B.A. in chemistry from the University of Virginia, Charlottesville and an M.D. and Ph.D. (Immunology) from the University of Pennsylvania School of Medicine.
He began his academic career as a member of the faculty at the University of Pennsylvania in 1988, following a post-doctoral fellowship in Molecular Biology at the Wistar Institute and a residency in Pathology & Laboratory Medicine at the Hospital of the University of Pennsylvania. John Reed subsequently held faculty appointments at several universities including the University of California, the University of Florida and ETH-Zurich.
In 1992, he joined the Sanford-Burnham Medical Research Institute in La Jolla, California, one of the largest independent non-profit biomedical research institutes in the United States. From 2002 to 2013, he served as CEO of the Institute. During his tenure, John Reed ran a highly productive laboratory that generated more than 900 research publications and over 130 patents, was awarded more than 100 research grants, and trained over 100 post-doctoral fellows. He is a Fellow of the American Association for the Advancement of Science (AAAS) and the recipient of numerous honors and awards for his accomplishments in biomedical research.
John Reed has served on multiple editorial boards of research journals, and was scientific founder or co-founder of four biotechnology companies. He has served on the Board of Directors for five publicly traded biopharmaceutical and biotechnology companies and on the governing boards for various non-profit biomedical research organizations.
From 2013 to 2018, John Reed was Global Head of Roche Pharmaceutical Research & Early Development, based at company headquarters in Basel, Switzerland. He was responsible for research through Phase IIb development for all therapeutic areas, overseeing R&D activities across 7 global sites.
He assumed his current position as Executive Vice President, Global Head of Research & Development for Sanofi in July 2018.
John Reed is a citizen of the United States of America.
Bill Sibold
Executive Vice President, Sanofi Genzyme
Date of birth: October 29, 1966
Bill Sibold holds an MBA from Harvard Business School and a B.A. in Molecular Biophysics and Biochemistry from Yale University. He has more than twenty-five years of experience in the biopharmaceutical industry. Bill Sibold began his career with Eli Lilly and then held a number of leadership positions within Biogen, including driving their US commercial operations in neurology, oncology and rheumatology. He also worked for Biogen in Australia and the Asia-Pacific region, and served as Chief Commercial Officer at Avanir Pharmaceuticals. Bill Sibold joined Sanofi in late 2011 as head of the MS franchise where he oversaw the successful launches of Aubagio® and Lemtrada®. From January 2016 to June 2017 he served as head of Sanofi Genzyme’s Global Multiple Sclerosis, Oncology and Immunology organization, where he led preparation for the global launches of dupilumab and sarilumab.
Bill Sibold has headed up Sanofi Genzyme, our specialty care global business unit, since July 1, 2017.
Bill Sibold is a citizen of Canada and of the United States of America.
Kathleen Tregoning
Executive Vice President, External Affairs
Date of birth: January 20, 1971
Kathleen Tregoning received her Bachelor’s degree in International Relations from Stanford University and her master’s degree in Public Policy from the Kennedy School of Government at Harvard University.
She has more than 20 years of professional experience in policy, advocacy, stakeholder outreach and external engagement. She began her career in 1993 with Andersen Consulting in San Francisco and later served as a Policy Advisor and then Assistant Deputy Mayor in the Office of the Mayor for the City of Los Angeles.
In 2001, Kathleen moved to Washington DC where she served as a professional staff member in the US Congress, working for the chairmen of the House of Representatives Ways & Means Committee, the House Energy & Commerce Committee, and the Senate Budget Committee. In these positions she was a key resource for members of Congress on a wide range of health care issues including Medicare, Medicaid, prescription drugs, disease management, health care information technology, and post-acute care.
Kathleen joined Biogen in 2006 as Vice President, Public Policy & Government Affairs. Over the next nine years, she built the company’s first global government affairs team to advance policies that enable the delivery of innovative biopharmaceutical
SANOFI / FORM 20-F 2018 159
ITEM 6. DIRECTORS, SENIOR MANAGEMENT AND EMPLOYEES
products to patients. In 2015, Kathleen was appointed Senior Vice President, Corporate Affairs at Biogen, overseeing the company’s policy and advocacy engagement, corporate and employee communications, media relations, product communications and philanthropy/community outreach on a global basis.
She was appointed to her current position in February 2017.
Kathleen Tregoning is a citizen of the United States of America.
Dieter Weinand
Executive Vice President, Primary Care
Date of birth: August 16, 1960
Dieter Weinand holds an M.Sc. in Pharmacology and Toxicology from Long Island University, New York and a B.A. in Biology from Concordia College in Bronkville, New York.
He has 30 years’ experience in the biopharmaceutical industry, holding various responsibilities in commercial, operational and strategic roles at a number of pharmaceutical companies including Warner Lambert, Pfizer and Bristol-Myers Squibb.
Before moving to Bayer, he was President, Global Commercialization & Portfolio Management at Otsuka Pharmaceutical Development & Commercialization Inc. in Princeton, New Jersey (United States). Dieter Weinand joined Bayer in 2014 as head of the Pharmaceuticals Division and was a member of the Bayer HealthCare Executive Committee. In 2016, he was appointed to the Board of Management of Bayer AG.
He was appointed to his current position as Executive Vice President, Primary Care at Sanofi in November 2018.
Dieter Weinand is a citizen of the United States of America.
B. Compensation
Compensation and arrangements for corporate officers
Compensation policy for executive and non-executive officers
This section describes the compensation policy for executive and non-executive officers as established pursuant to Article L. 225-37-2 of the French Commercial Code. It sets forth the principles and criteria used in determining, allocating and awarding the fixed, variable and exceptional components that collectively comprise the total compensation and benefits of whatever kind awarded to our executive and non-executive officers in respect of the office they hold.
The payment and award in a given year of any variable or exceptional components of compensation as described below that may arise in respect of the previous year are contingent on approval by the shareholders in an Ordinary General Meeting of the
compensation package of the executive or non-executive officer in question, on the terms stipulated in Article L. 225-100 of the French Commercial Code.
That condition – which affects the Chief Executive Officer only, given that the compensation of the Chairman of the Board of Directors (when the two offices are separated) consists solely of fixed compensation and benefits in kind – applies in this case to the following components of compensation:
◆ annual variable compensation (established on the basis partly of quantitative criteria, and partly of qualitative criteria);
◆ equity-based compensation (subject to fulfillment of performance conditions).
The compensation policy for executive and non-executive officers is established by the Board of Directors, acting on the recommendation of the Compensation Committee. The members of that Committee, the majority of whom are independent directors, were chosen for their technical competencies and their good understanding of current standards, emerging trends and Sanofi’s practices.
To fulfill their remit, the Committee regularly invites the Executive Vice President – Human Resources and the Head of Compensation and Employee Benefits to attend their meetings, although they absent themselves when the Committee deliberates. Committee members also work with the Chairman and the Secretary to the Board, who have contacts with our principal shareholders ahead of the Annual General Meeting.
In addition, the Chairman of the Committee:
◆ discusses the financial, accounting and tax impacts of the proposed compensation policy with the Chairman of the Audit Committee;
◆ plays an active role at meetings of the Appointments and Governance Committee (renamed the Appointments, Governance and CSR Committee effective March 8, 2019) and the Strategy Committee, to both of which he belongs, thereby gaining assurance that the proposed criteria are consistent and appropriate in light of Sanofi’s strategic ambitions.
The Committee obtains assurance at the start of each year as to the level of attainment of the performance criteria for the past financial year.
The Board of Directors applies the AFEP-MEDEF Code when determining the compensation and benefits awarded to our executive and non-executive officers.
Compensation policy for the Chairman of the Board of Directors
The compensation policy for the Chairman of the Board of Directors is identical to that approved by the Annual General Meeting of Sanofi shareholders on May 2, 2018.
The compensation of the Chairman of the Board of Directors (where the office of Chairman is separate from that of Chief
160 SANOFI / FORM 20-F 2018

ITEM 6. DIRECTORS, SENIOR MANAGEMENT AND EMPLOYEES
Executive Officer, as is currently the case) consists solely of fixed compensation and benefits in kind and excludes any variable or exceptional compensation, any awards of stock options or performance shares, and any directors’ attendance fees.
Where the office of Chairman is separate from that of Chief Executive Officer, as is currently the case, the Chairman of the Board is not entitled to the Sanofi top-up defined-benefit pension plan.
Nor is he entitled to a termination benefit or a non-compete indemnity.
Neither the Chairman of the Board nor the Chief Executive Officer receives attendance fees in their capacity as directors. Consequently, the Chairman of the Board does not receive attendance fees in his capacity as Chairman of the Board, Chairman of the Appointments, Governance and CSR Committee or Chairman of the Strategy Committee.
Shareholder votes on the compensation policy of the Chairman of the Board and on changes to that policy The table below summarizes shareholder votes on the compensation policy of the Chairman of the Board of Directors since that policy was introduced, and changes made to the policy:
2018 AGM 2017 AGM
Result of shareholder vote on compensation policy for the Chairman of the Board of Directors
98.83% in favor 98.19% in favor
Changes to the compensation policy for the Chairman of the Board of Directors
None, policy unchanged None, policy unchanged
Compensation policy for the Chief Executive Officer
The structure of the compensation policy for the Chief Executive Officer is identical to that approved by the Annual General Meeting of Sanofi shareholders on May 2, 2018. However, the following changes have been made in the implementation of the policy:
◆ introduction of a separate individual CSR performance criterion into annual variable compensation to reflect the Board’s longstanding commitment to take account of the social and environmental impact of Sanofi’s operations while promoting long-term value creation. It also responds to feedback gathered by the Chairman of the Board in meetings with our principal shareholders and stakeholders; and
◆ replacement of the performance criterion based on Return On Assets (ROA) with a criterion based on free cash flow (FCF) for future equity-based compensation plans (i.e. those awarded in or after 2019). This change has been introduced for the following reasons: it is a more clearly understandable performance criterion both within and outside Sanofi; it is easier to cascade down to lower grades; and it is a better fit with our current strategic objectives.
The compensation policy of the Chief Executive Officer is based on the same principles as the general Sanofi compensation policy.
General principles
The Sanofi compensation policy seeks to be consistent with market and industry practice in order to provide competitive levels of compensation, create a strong link between company and individual performance, and maintain a balance between short-term performance and medium-/long-term performance.
The compensation of the Chief Executive Officer is set by the Board of Directors acting on the recommendation of the
Compensation Committee, with reference to compensation paid to the chief executive officers of the following ten leading global pharmaceutical companies: AstraZeneca plc, Bayer AG, Bristol-Myers-Squibb Inc., Eli Lilly and Company Inc., Johnson & Johnson Inc., GlaxoSmithKline plc, Merck Inc., Novartis AG, Pfizer Inc., and Roche Holding Ltd.
This panel comprises companies that are comparable to Sanofi.
Consistency with market practice is fundamental in order to attract and retain the talents necessary to our success. We also review the practices of the principal CAC 40 companies in order to reach a fair balance and to take into account our corporate interest, market practices, the performance of the Chief Executive Officer, and our other stakeholders.
Equity-based compensation is a critical tool for our worldwide attractiveness as an employer, and aims to align employee and shareholder interests and reinforce employees’ ties to Sanofi.
Acting on the recommendation of the Compensation Committee, the Board of Directors determines the performance conditions attached to equity-based compensation for all beneficiaries at Sanofi and its subsidiaries worldwide, favoring the attainment of the Company’s objectives. Our equity-based compensation plan rules are made available to our shareholders on the governance page of our website (www.sanofi.com) in the same form as that distributed to our employees.
Our equity-based compensation policy, which was extensively revised by the Board of Directors in 2011, can generally be characterized by reduced dilution; diversified, multi-year performance conditions; increased transparency; and specific additional requirements for the Chief Executive Officer. As a result of positive and encouraging shareholder and proxy advisor feedback collected through corporate governance roadshows and the results of votes at recent Annual General Meetings, the Board decided to maintain this policy.
SANOFI / FORM 20-F 2018 161

ITEM 6. DIRECTORS, SENIOR MANAGEMENT AND EMPLOYEES
Since 2018, awards to senior executives have consisted solely of performance shares; only the Chief Executive Officer continues to be awarded stock options as well.
Awarding performance shares makes it possible to maintain a comparable level of employee incentivization while reducing the dilutive effect of equity-based compensation plans for existing shareholders. However, the Board of Directors continues to believe that due to their ratchet effect, options remain an appropriate component of the compensation of the Chief Executive Officer.
The Board of Directors makes any grant of performance shares or stock options contingent on several distinct performance criteria in order to ensure that our equity-based compensation plans incentivize overall performance and do not encourage excessive risk taking. Failure to achieve those criteria over the entire performance measurement period results in a reduction or loss of the initial grant.
Grants are also contingent on the beneficiary’s continued employment in the Sanofi group during the lock-up period (3 years for performance shares, 4 years for options, followed by further stringent lock-up obligations in the case of the Chief Executive Officer).
The exercise price of stock options is set by the Board, never incorporates a discount, and must be at least equal to the average of the quoted market prices on the 20 trading sessions preceding the date of grant by the Board.
The Board is not allowed to reset the terms of prior grants, for instance with easier performance conditions or a lower exercise price.
On taking up office
When the Chief Executive Officer is an outside appointment, the Board of Directors may decide, acting on a recommendation from the Compensation Committee, to compensate the appointee for some or all of the benefits he may have forfeited on leaving his previous employer. In such a case, the terms on which the Chief Executive Officer is hired aim to replicate the diversity of what was forfeited, with a comparable level of risk (variable portion, medium-term equity-based or cash compensation).
During the term of office
Compensation structure
Our policy aims at achieving a balance in the compensation structure between fixed compensation, benefits in kind, short-term variable cash compensation, and medium-term variable equity-based compensation. The proportions of annual fixed and variable compensation are not subject to annual review. Compensation adjustments based on performance and market practice are effected primarily through equity-based compensation, which is medium-term and aims at aligning the interests of the Chief Executive Officer with those of our shareholders and stakeholders.
Our overall compensation policy is designed to motivate and reward performance by ensuring that a significant portion of compensation is contingent on the attainment of financial, operational and extra-financial criteria aligned with the corporate interest and with the creation of shareholder value. Variable cash compensation and equity-based compensation are the two principal levers for action.
Annual variable compensation
Annual variable compensation is in a range between 0% and 250% of fixed compensation, with a target of 150%. It is determined by reference to quantitative and qualitative criteria. The percentage of variable compensation linked to the attainment of quantitative criteria may be scaled down regardless of actual performance, in order to give greater weight to the attainment of qualitative criteria. This flexibility can only operate to reduce the amount of variable compensation, and cannot compensate for underperformance on quantitative criteria.
In accordance with Article L. 225-100 of the French Commercial Code, payment of annual variable compensation in a given year in respect of the previous year is contingent on a favorable shareholder vote at the Annual General Meeting.
Equity-based compensation
The Chief Executive Officer’s equity-based compensation may not exceed 250% of his target short-term compensation (fixed plus variable). The valuation of stock options is calculated at the date of grant using the Black & Scholes method. The valuation of performance shares is also calculated at the date of grant, and represents the difference between the quoted market price of the share on the date of grant and the aggregate present value of the dividends to be received over the next three years. The parameters used to calculate the valuations are market parameters available in the financial press. The Chief Executive Officer’s equity-based compensation is contingent upon attainment of the performance conditions.
In 2018, on the basis of the information published as of the date of this annual report on Form 20-F, the median fixed compensation of the chief executive officers of the aforementioned ten leading global pharmaceutical companies was in the region of €1,435,000, the median of the annual variable compensation was in the region of €2,210,000 and the median of the long-term compensation granted (whether in shares or in cash) represented around 710% of the fixed compensation.
Each grant to our Chief Executive Officer takes into account previous grants and his overall compensation.
In any event, the maximum number of exercisable options or shares to be delivered may not be more than the number of options initially granted or performance shares initially awarded.
Any award of equity-based compensation in a given year is contingent on a favorable shareholder vote at the Annual General Meeting.
162 SANOFI / FORM 20-F 2018

ITEM 6. DIRECTORS, SENIOR MANAGEMENT AND EMPLOYEES
Attendance fees
Executive and non-executive officers do not receive attendance fees in their capacity as directors. Consequently, the Chief Executive Officer does not receive attendance fees in his capacity as a director or as a member of the Strategy Committee.
Exceptional compensation
No exceptional compensation can be awarded to the Chief Executive Officer.
On leaving office
The Chief Executive Officer is entitled to a top-up defined-benefit pension plan, a termination benefit, and a non-compete indemnity. Each of those benefits is taken into account by the Board of Directors when fixing the overall compensation of the Chief Executive Officer.
Pension arrangements
The Chief Executive Officer is covered by a top-up defined-benefit pension plan falling within the scope of Article L. 137-11 of the French Social Security Code. The plan is offered to all employees of Sanofi and its French subsidiaries who meet the eligibility criteria specified in the plan rules. The plan, which remains open, was set up on October 1, 2008 as the final stage in the process of harmonizing the status of personnel across the French subsidiaries.
This top-up defined-benefit pension plan is offered to executives (as defined by AGIRC, a confederation of executive pension funds) of Sanofi and its French subsidiaries who meet the eligibility criteria specified in the plan rules; the benefit is contingent upon the plan member ending his or her career within the Sanofi group. The plan is reserved for executives with at least ten years of service whose annual base compensation has for ten calendar years (not necessarily consecutive) exceeded four times the French social security ceiling, and is wholly funded by the Company and outsourced to an insurance company.
The top-up pension, which may not exceed 37.50% (1.5% per year of service, capped at 25 years) of the reference compensation, is in the form of a life annuity, and is transferable as a survivor’s pension. The annuity is based on the arithmetical average of the three highest years’ average annual gross compensation paid during any three of the five years (not necessarily consecutive) preceding final cessation of employment. This reference compensation is capped at 60 times the French social security ceiling applicable in the year in which the pension is taken. In addition, vesting of new rights for the Chief Executive Officer has been subject to a performance condition since January 1, 2017. The performance condition is applied on the following basis:
◆ if the level of attainment for variable compensation is equal to or greater than the target (i.e. 150% of fixed compensation), 100% of the contingent top-up pension rights will vest, corresponding to
an uplift of 1.5% in the annual reference compensation used to calculate the annuity payable under the plan;
◆ if the level of attainment for variable compensation is less than 100% of fixed compensation, no top-up pension rights will vest for the year in question; and
◆ between those two limits, vested rights are calculated on a prorata basis.
Consequently, the annual uplift in contingent rights is capped at 1.5% of the annual reference compensation used to calculate the annuity payable under the plan, which is below the upper limit of 3% of annual reference compensation stipulated in Article L. 225-42-1 of the French Commercial Code.
The annuity supplements any other schemes for which the plan member may be eligible in France or abroad, subject to a cap on the total pension from all sources set at 52% of the reference compensation. If the total amount of the annuities paid under all such schemes were to exceed the 52% cap, the amount of the Sanofi top-up defined-benefit pension annuity would be reduced accordingly in order to respect that cap.
This retirement plan is subject to various charges and contributions within France: CSG, CRDS, CSAM, CASA, contributions of 7% and 14% on the annuity, and of 24% on the external funding.
The pension entitlement is not cumulative with (i) any termination benefit paid in the event of forced departure or (ii) any non-compete indemnity.
Termination arrangements
The termination benefit only becomes payable if the departure of the Chief Executive Officer is forced, i.e. in the event of removal from office or resignation linked to a change in strategy or control of the Company. Compensation for non-renewal of the term of office is irrelevant in the case of the Chief Executive Officer, because this office is held for an indefinite term.
In addition, no termination benefit is payable in the following circumstances:
◆ in the event of removal from office for gross or serious misconduct (faute grave ou lourde);
◆ if the Chief Executive Officer elects to leave the Company to take up another position;
◆ if the Chief Executive Officer is assigned to another position within Sanofi;
◆ if the Chief Executive Officer takes his pension.
The amount of the termination benefit is capped at 24 months of the Chief Executive Officer’s most recent total compensation on the basis of (i) the fixed compensation effective on the date of leaving office and (ii) the last variable compensation received prior to that date, subject to fulfilment of the performance criteria for the three financial years preceding the date of leaving office.
SANOFI / FORM 20-F 2018 163
ITEM 6. DIRECTORS, SENIOR MANAGEMENT AND EMPLOYEES
The amount of the termination benefit is reduced by any amount received as consideration for the non-compete undertaking, such that the aggregate amount of those two benefits may never exceed two years of total fixed and variable compensation.
Non-compete undertaking
In the event of his departure from the Company, the Chief Executive Officer undertakes, during the 12-month period following his departure, not to join a competitor of the Company as an employee or executive/non-executive officer, or to provide services to or cooperate with such a competitor.
In return for this undertaking, he receives an indemnity corresponding to one year’s total compensation effective on the day he ceases to hold office and the last individual variable compensation received prior to that date. This indemnity is payable in 12 monthly installments.
However, the Board of Directors reserves the right to release the Chief Executive Officer from the undertaking for some or all of that 12-month period. In such cases, the non-compete indemnity would not be due for the period of time waived by the Company.
Consequences of the Chief Executive Officer’s departure for
equity-based compensation
If the Chief Executive Officer leaves the Company for reasons other than resignation or removal from office for gross or serious misconduct (in which case any award of equity-based compensation is forfeited), the overall allocation percentage will be prorated to reflect the amount of time the Chief Executive Officer remained with Sanofi during the vesting period.
If at any time prior to the expiration of (i) the period of validity of the options or (ii) the vesting period of the performance shares the Chief Executive Officer joins a competitor of Sanofi as an employee or executive/non-executive officer, or provides services to or cooperates with such a competitor, he irrevocably loses those options and performance shares regardless of any full or partial waiver by the Board of Directors of the non-compete undertaking relating to his office as Chief Executive Officer.
If the Chief Executive Officer retires at statutory retirement age prior to the expiration of (i) the period of validity of the options or (ii) the vesting period of the performance shares, he will retain entitlement to the options and performance shares initially awarded but will continue to be bound by the other terms of the plan, including performance conditions.
There is no acceleration clause in the event of a change of control.
164 SANOFI / FORM 20-F 2018
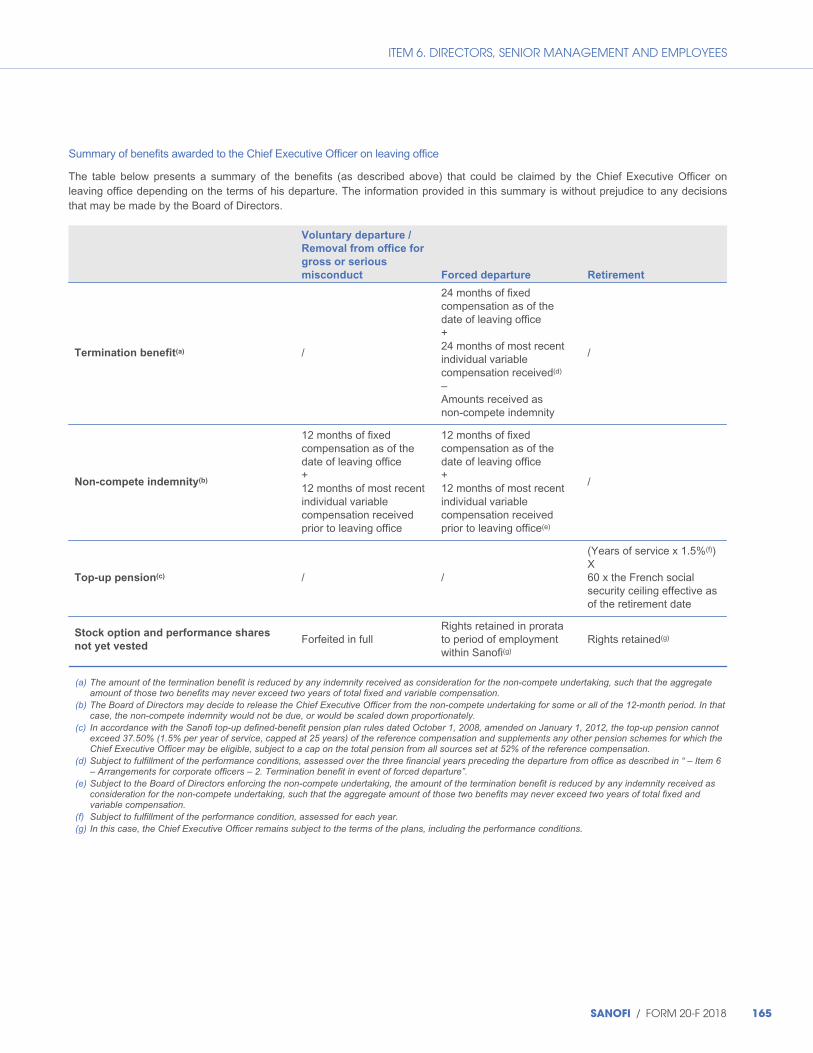
ITEM 6. DIRECTORS, SENIOR MANAGEMENT AND EMPLOYEES
Summary of benefits awarded to the Chief Executive Officer on leaving office
The table below presents a summary of the benefits (as described above) that could be claimed by the Chief Executive Officer on leaving office depending on the terms of his departure. The information provided in this summary is without prejudice to any decisions that may be made by the Board of Directors.
Voluntary departure /
Removal from office for
gross or serious
misconduct Forced departure Retirement
Termination benefit(a) /
24 months of fixed compensation as of the date of leaving office + 24 months of most recent individual variable compensation received(d) – Amounts received as non-compete indemnity
/
Non-compete indemnity(b)
12 months of fixed compensation as of the date of leaving office + 12 months of most recent individual variable compensation received prior to leaving office
12 months of fixed compensation as of the date of leaving office + 12 months of most recent individual variable compensation received prior to leaving office(e)
/
Top-up pension(c) / /
(Years of service x 1.5%(f)) X 60 x the French social security ceiling effective as of the retirement date
Stock option and performance shares
not yet vested Forfeited in full
Rights retained in prorata to period of employment within Sanofi(g)
Rights retained(g)
(a) The amount of the termination benefit is reduced by any indemnity received as consideration for the non-compete undertaking, such that the aggregate amount of those two benefits may never exceed two years of total fixed and variable compensation.
(b) The Board of Directors may decide to release the Chief Executive Officer from the non-compete undertaking for some or all of the 12-month period. In that case, the non-compete indemnity would not be due, or would be scaled down proportionately.
(c) In accordance with the Sanofi top-up defined-benefit pension plan rules dated October 1, 2008, amended on January 1, 2012, the top-up pension cannot exceed 37.50% (1.5% per year of service, capped at 25 years) of the reference compensation and supplements any other pension schemes for which the Chief Executive Officer may be eligible, subject to a cap on the total pension from all sources set at 52% of the reference compensation.
(d) Subject to fulfillment of the performance conditions, assessed over the three financial years preceding the departure from office as described in “ – Item 6 – Arrangements for corporate officers – 2. Termination benefit in event of forced departure”.
(e) Subject to the Board of Directors enforcing the non-compete undertaking, the amount of the termination benefit is reduced by any indemnity received as consideration for the non-compete undertaking, such that the aggregate amount of those two benefits may never exceed two years of total fixed and variable compensation.
(f) Subject to fulfillment of the performance condition, assessed for each year. (g) In this case, the Chief Executive Officer remains subject to the terms of the plans, including the performance conditions.
SANOFI / FORM 20-F 2018 165

ITEM 6. DIRECTORS, SENIOR MANAGEMENT AND EMPLOYEES
Shareholder votes on the compensation policy of the Chief Executive Officer and on changes to that policy
The table below summarizes shareholder votes on the compensation policy of the Chief Executive Officer since that policy was introduced, and changes made to the policy.
2018 AGM 2017 AGM
Result of shareholder vote on compensation policy for the Chief Executive Officer
89.52% in favor 93.55% in favor
Changes made to the compensation policy for the Chief Executive Officer
Structure of compensation policy unchanged, but adjustments made in its implementation to:
◆ annual variable compensation, with the introduction of a separate CSR-based individual performance criterion(a); and
◆ equity-based compensation, with the ROA-based performance criterion replaced with one based on FCF(a) in future performance share plans (i.e. those awarded in or after 2019).
Structure of compensation policy unchanged, but clarification provided on:
◆ the composition of the benchmark panel used as a basis of comparison for the compensation of the Chief Executive Officer, which was aligned on that used for TSR in our equity-based compensation plans; and
◆ the performance conditions applicable to the pension entitlement of the Chief Executive Officer.
(a) Subject to approval by the Annual General Meeting of Sanofi shareholders, this change will be applied as part of the compensation policy for the Chief Executive Officer from 2019 onwards.
Compensation of the Chairman of the Board, Serge Weinberg
Serge Weinberg has held the office of Chairman of the Board of Directors since May 17, 2010. He has never had, and does not currently have, a contract of employment with Sanofi.
The Chairman of the Board also chairs the Appointments and Governance Committee (renamed the Appointments, Governance and CSR Committee effective March 8, 2019) and the Strategy Committee. He is also a member of the Scientific Committee.
The remit of the Chairman of the Board is specified in the Board Charter, which is reproduced in its entirety in Exhibit 1.2. to this Annual Report on Form 20F.
During the course of 2018, the Chairman’s activities included:
◆ chairing all the meetings of the Board of Directors (11 in 2018) and of the Committees of which he is a member (three meetings of the Appointments and Governance Committee, six meetings of the Strategy Committee and one meeting of the Scientific Committee), and participating in Committee meetings to which he was invited (Audit Committee and Compensation Committee);
◆ close monitoring of the proper implementation of the decisions taken by the Board;
◆ meetings with directors, including (i) on the appointment of Emmanuel Babeau, to explain to him how the Board operates and answer his questions, (ii) in connection with the evaluation of the Board’s operating procedures and (iii) on matters relating to the projects presented to the Board;
◆ regular meetings with members of the senior management team;
◆ on-site visits to Sanofi locations in France and abroad, and meeting the employees;
◆ meetings with biotechs and medtechs in France and abroad;
◆ organizing a three-day strategy seminar in Boston (United States); and
◆ representing Sanofi at events or official meetings with representatives of the public authorities and other stakeholders, in line with his remit as defined by the Board Charter.
The Chairman also has a role in explaining positions taken by the Board within its sphere of competence, especially in terms of strategy, governance and executive compensation. In furtherance of this role, Serge Weinberg drew on his experience of corporate communication in:
◆ answering letters from investors and shareholders;
◆ holding meetings with certain shareholders and proxy advisors; and
◆ attending a meeting of the Individual Shareholders Committee at Sanofi headquarters in March 2018, discussing what Sanofi had achieved in 2017 and answering questions about the Company’s latest news, future prospects and dividend policy.
Those tasks were carried out after coordination with the Chief Executive Officer, and in close collaboration with our Investor Relations department.
166 SANOFI / FORM 20-F 2018
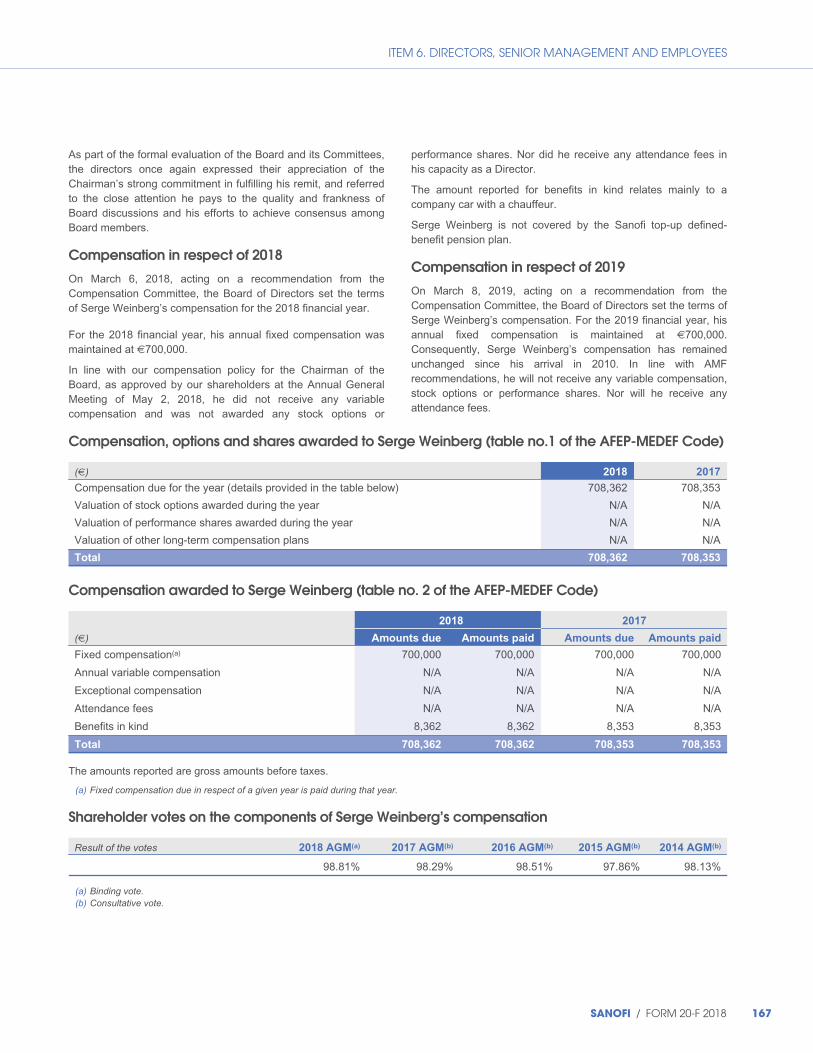
ITEM 6. DIRECTORS, SENIOR MANAGEMENT AND EMPLOYEES
As part of the formal evaluation of the Board and its Committees, the directors once again expressed their appreciation of the Chairman’s strong commitment in fulfilling his remit, and referred to the close attention he pays to the quality and frankness of Board discussions and his efforts to achieve consensus among Board members.
Compensation in respect of 2018
On March 6, 2018, acting on a recommendation from the Compensation Committee, the Board of Directors set the terms of Serge Weinberg’s compensation for the 2018 financial year.
For the 2018 financial year, his annual fixed compensation was maintained at €700,000.
In line with our compensation policy for the Chairman of the Board, as approved by our shareholders at the Annual General Meeting of May 2, 2018, he did not receive any variable compensation and was not awarded any stock options or
performance shares. Nor did he receive any attendance fees in his capacity as a Director.
The amount reported for benefits in kind relates mainly to a company car with a chauffeur.
Serge Weinberg is not covered by the Sanofi top-up defined-benefit pension plan.
Compensation in respect of 2019
On March 8, 2019, acting on a recommendation from the Compensation Committee, the Board of Directors set the terms of Serge Weinberg’s compensation. For the 2019 financial year, his annual fixed compensation is maintained at €700,000. Consequently, Serge Weinberg’s compensation has remained unchanged since his arrival in 2010. In line with AMF recommendations, he will not receive any variable compensation, stock options or performance shares. Nor will he receive any attendance fees.
Compensation, options and shares awarded to Serge Weinberg (table no.1 of the AFEP-MEDEF Code)
(€) 2018 2017
Compensation due for the year (details provided in the table below) 708,362 708,353
Valuation of stock options awarded during the year N/A N/A
Valuation of performance shares awarded during the year N/A N/A
Valuation of other long-term compensation plans N/A N/A
Total 708,362 708,353
Compensation awarded to Serge Weinberg (table no. 2 of the AFEP-MEDEF Code)
2018 2017
(€) Amounts due Amounts paid Amounts due Amounts paid
Fixed compensation(a) 700,000 700,000 700,000 700,000
Annual variable compensation N/A N/A N/A N/A
Exceptional compensation N/A N/A N/A N/A
Attendance fees N/A N/A N/A N/A
Benefits in kind 8,362 8,362 8,353 8,353
Total 708,362 708,362 708,353 708,353
The amounts reported are gross amounts before taxes.
(a) Fixed compensation due in respect of a given year is paid during that year.
Shareholder votes on the components of Serge Weinberg’s compensation
Result of the votes 2018 AGM(a) 2017 AGM(b) 2016 AGM(b) 2015 AGM(b) 2014 AGM(b)
98.81% 98.29% 98.51% 97.86% 98.13%
(a) Binding vote. (b) Consultative vote.
SANOFI / FORM 20-F 2018 167
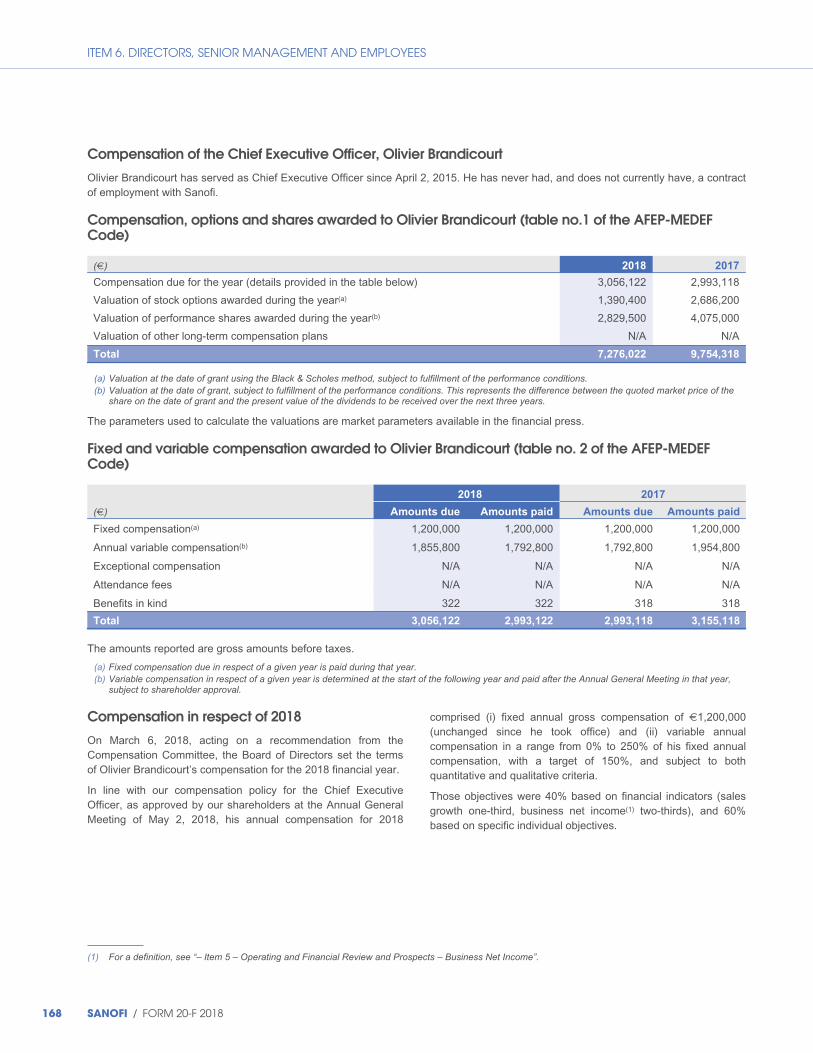
ITEM 6. DIRECTORS, SENIOR MANAGEMENT AND EMPLOYEES
Compensation of the Chief Executive Officer, Olivier Brandicourt
Olivier Brandicourt has served as Chief Executive Officer since April 2, 2015. He has never had, and does not currently have, a contract of employment with Sanofi.
Compensation, options and shares awarded to Olivier Brandicourt (table no.1 of the AFEP-MEDEF Code)
(€) 2018 2017
Compensation due for the year (details provided in the table below) 3,056,122 2,993,118
Valuation of stock options awarded during the year(a) 1,390,400 2,686,200
Valuation of performance shares awarded during the year(b) 2,829,500 4,075,000
Valuation of other long-term compensation plans N/A N/A
Total 7,276,022 9,754,318
(a) Valuation at the date of grant using the Black & Scholes method, subject to fulfillment of the performance conditions. (b) Valuation at the date of grant, subject to fulfillment of the performance conditions. This represents the difference between the quoted market price of the
share on the date of grant and the present value of the dividends to be received over the next three years.
The parameters used to calculate the valuations are market parameters available in the financial press.
Fixed and variable compensation awarded to Olivier Brandicourt (table no. 2 of the AFEP-MEDEF Code)
2018 2017
(€) Amounts due Amounts paid Amounts due Amounts paid
Fixed compensation(a) 1,200,000 1,200,000 1,200,000 1,200,000
Annual variable compensation(b) 1,855,800 1,792,800 1,792,800 1,954,800
Exceptional compensation N/A N/A N/A N/A
Attendance fees N/A N/A N/A N/A
Benefits in kind 322 322 318 318
Total 3,056,122 2,993,122 2,993,118 3,155,118
The amounts reported are gross amounts before taxes.
(a) Fixed compensation due in respect of a given year is paid during that year. (b) Variable compensation in respect of a given year is determined at the start of the following year and paid after the Annual General Meeting in that year,
subject to shareholder approval.
Compensation in respect of 2018
On March 6, 2018, acting on a recommendation from the Compensation Committee, the Board of Directors set the terms of Olivier Brandicourt’s compensation for the 2018 financial year.
In line with our compensation policy for the Chief Executive Officer, as approved by our shareholders at the Annual General Meeting of May 2, 2018, his annual compensation for 2018
comprised (i) fixed annual gross compensation of €1,200,000 (unchanged since he took office) and (ii) variable annual compensation in a range from 0% to 250% of his fixed annual compensation, with a target of 150%, and subject to both quantitative and qualitative criteria.
Those objectives were 40% based on financial indicators (sales growth one-third, business net income(1) two-thirds), and 60% based on specific individual objectives.
(1) For a definition, see “– Item 5 – Operating and Financial Review and Prospects – Business Net Income”.
168 SANOFI / FORM 20-F 2018
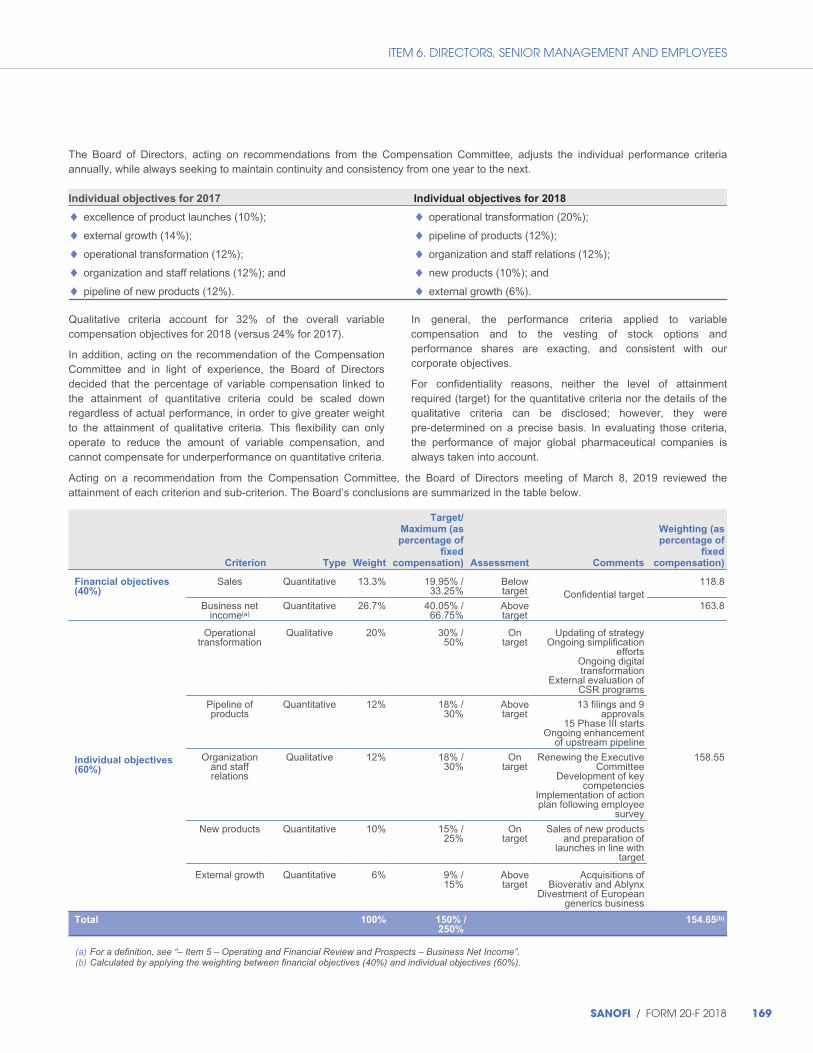
ITEM 6. DIRECTORS, SENIOR MANAGEMENT AND EMPLOYEES
The Board of Directors, acting on recommendations from the Compensation Committee, adjusts the individual performance criteria annually, while always seeking to maintain continuity and consistency from one year to the next.
Individual objectives for 2017 Individual objectives for 2018
◆ excellence of product launches (10%); ◆ operational transformation (20%);
◆ external growth (14%); ◆ pipeline of products (12%);
◆ operational transformation (12%); ◆ organization and staff relations (12%);
◆ organization and staff relations (12%); and ◆ new products (10%); and
◆ pipeline of new products (12%). ◆ external growth (6%).
Qualitative criteria account for 32% of the overall variable compensation objectives for 2018 (versus 24% for 2017).
In addition, acting on the recommendation of the Compensation Committee and in light of experience, the Board of Directors decided that the percentage of variable compensation linked to the attainment of quantitative criteria could be scaled down regardless of actual performance, in order to give greater weight to the attainment of qualitative criteria. This flexibility can only operate to reduce the amount of variable compensation, and cannot compensate for underperformance on quantitative criteria.
In general, the performance criteria applied to variable compensation and to the vesting of stock options and performance shares are exacting, and consistent with our corporate objectives.
For confidentiality reasons, neither the level of attainment required (target) for the quantitative criteria nor the details of the qualitative criteria can be disclosed; however, they were pre-determined on a precise basis. In evaluating those criteria, the performance of major global pharmaceutical companies is always taken into account.
Acting on a recommendation from the Compensation Committee, the Board of Directors meeting of March 8, 2019 reviewed the attainment of each criterion and sub-criterion. The Board’s conclusions are summarized in the table below.
Criterion Type Weight
Target/ Maximum (as percentage of
fixed compensation) Assessment Comments
Weighting (as percentage of
fixed compensation)
Financial objectives (40%)
Sales Quantitative 13.3% 19.95% / 33.25%
Below target Confidential target
118.8
Business net income(a)
Quantitative 26.7% 40.05% / 66.75%
Above target
163.8
Individual objectives (60%)
Operational transformation
Qualitative 20% 30% / 50%
On target
Updating of strategy Ongoing simplification
efforts Ongoing digital transformation
External evaluation of CSR programs
Pipeline of products
Quantitative 12% 18% / 30%
Above target
13 filings and 9 approvals
15 Phase III starts Ongoing enhancement
of upstream pipeline
Organization and staff relations
Qualitative 12% 18% / 30%
On target
Renewing the Executive Committee
Development of key competencies
Implementation of action plan following employee
survey
158.55
New products Quantitative 10% 15% / 25%
On target
Sales of new products and preparation of
launches in line with target
External growth Quantitative 6% 9% / 15%
Above target
Acquisitions of Bioverativ and Ablynx
Divestment of European generics business
Total 100% 150% /250%
154.65(b)
(a) For a definition, see “– Item 5 – Operating and Financial Review and Prospects – Business Net Income”. (b) Calculated by applying the weighting between financial objectives (40%) and individual objectives (60%).
SANOFI / FORM 20-F 2018 169
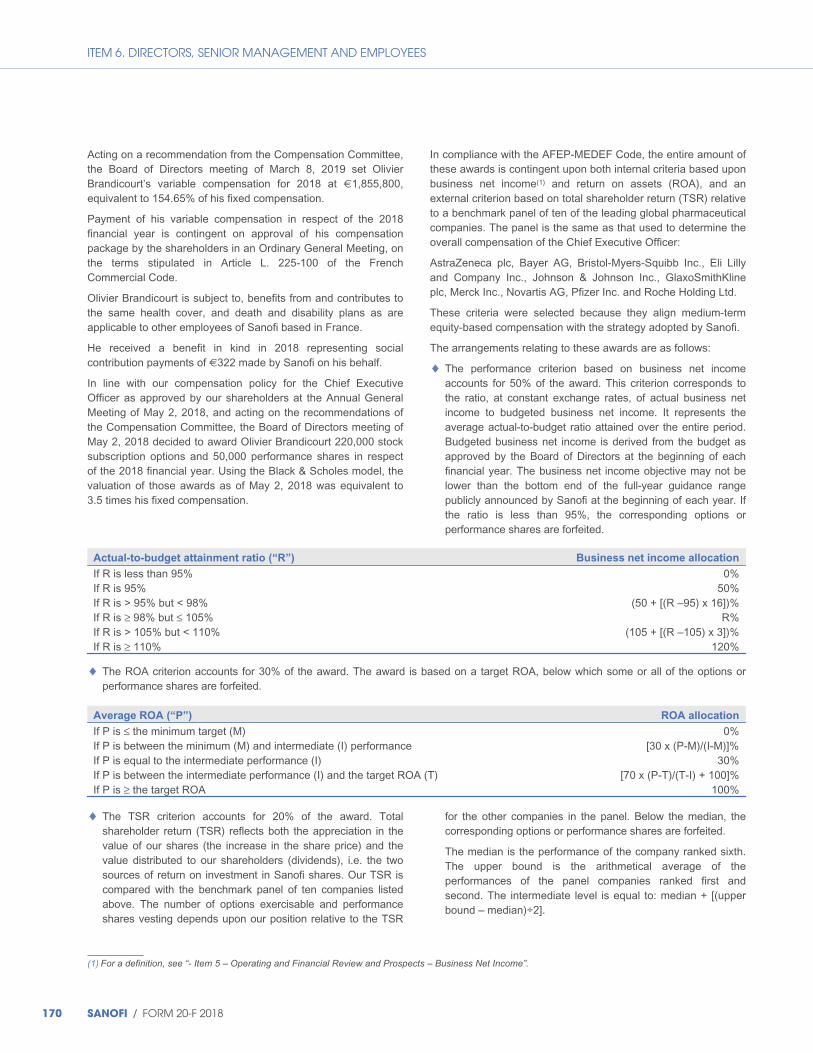
ITEM 6. DIRECTORS, SENIOR MANAGEMENT AND EMPLOYEES
Acting on a recommendation from the Compensation Committee, the Board of Directors meeting of March 8, 2019 set Olivier Brandicourt’s variable compensation for 2018 at €1,855,800, equivalent to 154.65% of his fixed compensation.
Payment of his variable compensation in respect of the 2018 financial year is contingent on approval of his compensation package by the shareholders in an Ordinary General Meeting, on the terms stipulated in Article L. 225-100 of the French Commercial Code.
Olivier Brandicourt is subject to, benefits from and contributes to the same health cover, and death and disability plans as are applicable to other employees of Sanofi based in France.
He received a benefit in kind in 2018 representing social contribution payments of €322 made by Sanofi on his behalf.
In line with our compensation policy for the Chief Executive Officer as approved by our shareholders at the Annual General Meeting of May 2, 2018, and acting on the recommendations of the Compensation Committee, the Board of Directors meeting of May 2, 2018 decided to award Olivier Brandicourt 220,000 stock subscription options and 50,000 performance shares in respect of the 2018 financial year. Using the Black & Scholes model, the valuation of those awards as of May 2, 2018 was equivalent to 3.5 times his fixed compensation.
In compliance with the AFEP-MEDEF Code, the entire amount of these awards is contingent upon both internal criteria based upon business net income(1) and return on assets (ROA), and an external criterion based on total shareholder return (TSR) relative to a benchmark panel of ten of the leading global pharmaceutical companies. The panel is the same as that used to determine the overall compensation of the Chief Executive Officer:
AstraZeneca plc, Bayer AG, Bristol-Myers-Squibb Inc., Eli Lilly and Company Inc., Johnson & Johnson Inc., GlaxoSmithKline plc, Merck Inc., Novartis AG, Pfizer Inc. and Roche Holding Ltd.
These criteria were selected because they align medium-term equity-based compensation with the strategy adopted by Sanofi.
The arrangements relating to these awards are as follows:
◆ The performance criterion based on business net income accounts for 50% of the award. This criterion corresponds to the ratio, at constant exchange rates, of actual business net income to budgeted business net income. It represents the average actual-to-budget ratio attained over the entire period. Budgeted business net income is derived from the budget as approved by the Board of Directors at the beginning of each financial year. The business net income objective may not be lower than the bottom end of the full-year guidance range publicly announced by Sanofi at the beginning of each year. If the ratio is less than 95%, the corresponding options or performance shares are forfeited.
Actual-to-budget attainment ratio (“R”) Business net income allocation
If R is less than 95% 0% If R is 95% 50% If R is > 95% but < 98% (50 + [(R –95) x 16])% If R is ≥ 98% but ≤ 105% R% If R is > 105% but < 110% (105 + [(R –105) x 3])% If R is ≥ 110% 120%
◆ The ROA criterion accounts for 30% of the award. The award is based on a target ROA, below which some or all of the options or performance shares are forfeited.
Average ROA (“P”) ROA allocation
If P is ≤ the minimum target (M) 0% If P is between the minimum (M) and intermediate (I) performance [30 x (P-M)/(I-M)]% If P is equal to the intermediate performance (I) 30% If P is between the intermediate performance (I) and the target ROA (T) [70 x (P-T)/(T-I) + 100]% If P is ≥ the target ROA 100%
◆ The TSR criterion accounts for 20% of the award. Total shareholder return (TSR) reflects both the appreciation in the value of our shares (the increase in the share price) and the value distributed to our shareholders (dividends), i.e. the two sources of return on investment in Sanofi shares. Our TSR is compared with the benchmark panel of ten companies listed above. The number of options exercisable and performance shares vesting depends upon our position relative to the TSR
for the other companies in the panel. Below the median, the corresponding options or performance shares are forfeited.
The median is the performance of the company ranked sixth. The upper bound is the arithmetical average of the performances of the panel companies ranked first and second. The intermediate level is equal to: median + [(upper bound – median)÷2].
(1) For a definition, see “- Item 5 – Operating and Financial Review and Prospects – Business Net Income”.
170 SANOFI / FORM 20-F 2018
ITEM 6. DIRECTORS, SENIOR MANAGEMENT AND EMPLOYEES
– if Sanofi’s TSR is below the median, the TSR allocation will be 0%;
– if Sanofi’s TSR is equal to the median, the TSR allocation will be 50%;
– if Sanofi’s TSR is equal to the intermediate level, the TSR allocation will be 100%;
– if Sanofi’s TSR is ≥ the upper bound, the TSR allocation will be 150%; and
– if Sanofi’s TSR is above the median but below the upper bound, the TSR allocation will be calculated using linear interpolation.
◆ In addition to the three criteria described above, in the case of stock options there is an implicit condition in the form of the exercise price, and a condition of continuing employment within Sanofi.
◆ In order to align equity-based compensation with medium-term performance, performance is measured over three financial years.
◆ Vesting is subject to a non-compete clause.
◆ In the event that Olivier Brandicourt leaves the Company for reasons other than resignation or removal from office for gross or serious misconduct, the overall allocation percentage will be prorated to reflect the amount of time he remained with Sanofi during the vesting period.
◆ Until he ceases to hold office, the Chief Executive Officer is required to retain a quantity of Sanofi shares equivalent to (i) 50% of any gain (net of taxes and social contributions) arising on the exercise of stock options and (ii) 50% of any gain (net of taxes and social contributions) arising on the vesting of performance shares, calculated as of the date on which those shares vest. Those shares must be retained in registered form until he ceases to hold office.
◆ In compliance with the AFEP-MEDEF Code, the Chief Executive Officer is bound by insider trading rules (contained in the Board Charter) which stipulate (i) periods during which he must refrain from trading in Sanofi shares and (ii) the requirements relating to disclosure of his transactions to the AMF and the Company.
◆ In compliance with the AFEP-MEDEF Code and our Board Charter, Olivier Brandicourt has undertaken to refrain from entering into speculative or hedging transactions, and so far as the Company is aware no such instruments have been contracted.
The Board regards these performance conditions as good indicators of the development of shareholder value in terms of: the quality of investment decisions in a period where external growth was a determining factor (ROA condition); the commitment to delivering challenging bottom-line results in a tough business environment (business net income condition); and matching or bettering our peer group in terms of shareholder returns (TSR condition).
For confidentiality reasons, the amount of the quantitative measures for the internal criteria cannot be disclosed. However, they were determined on a precise basis, and the level of attainment for the internal criteria will be disclosed at the end of the performance measurement period.
In line with our commitment to transparency, we publish in our annual report the attainment level determined by the Board of Directors for performance conditions (and the corresponding allocation rate) applicable to equity-based compensation plans awarded to the Chief Executive Officer and other members of the Executive Committee. The Board believes that disclosing the level of attainment allows our shareholders to better understand the demanding nature of the performance conditions.
SANOFI / FORM 20-F 2018 171
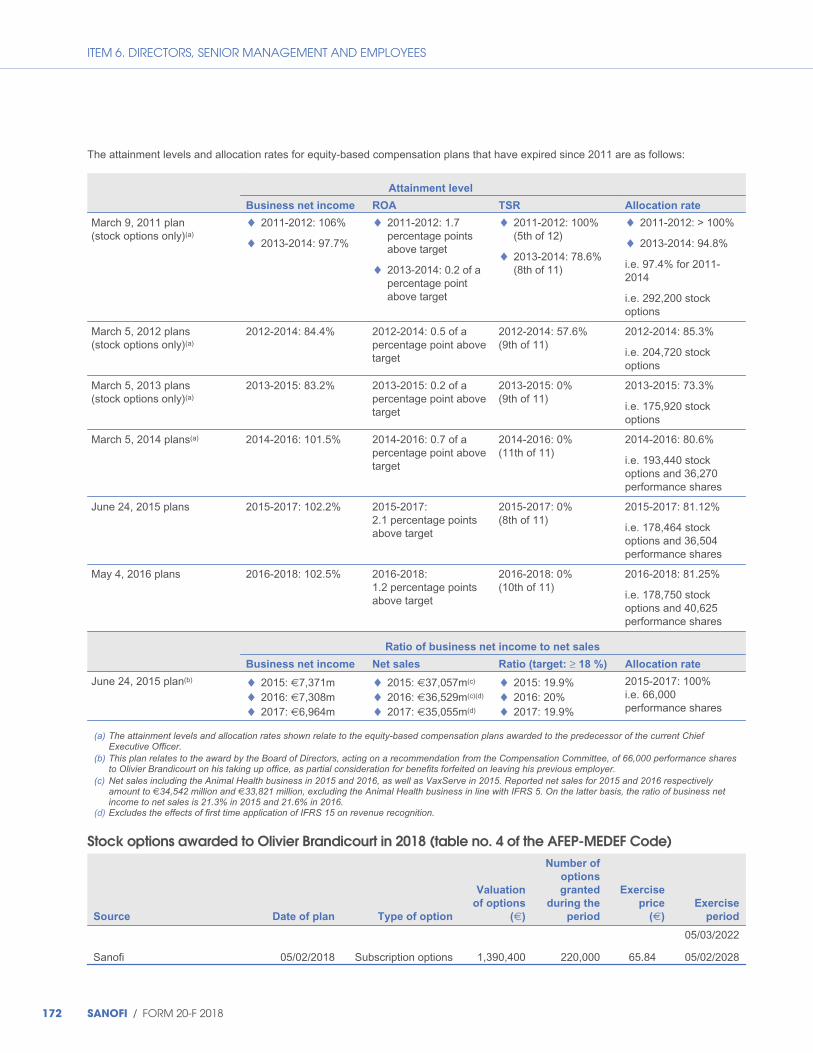
ITEM 6. DIRECTORS, SENIOR MANAGEMENT AND EMPLOYEES
The attainment levels and allocation rates for equity-based compensation plans that have expired since 2011 are as follows:
Attainment level
Business net income ROA TSR Allocation rate
March 9, 2011 plan (stock options only)(a)
◆ 2011-2012: 106%
◆ 2013-2014: 97.7%
◆ 2011-2012: 1.7 percentage points above target
◆ 2013-2014: 0.2 of a percentage point above target
◆ 2011-2012: 100% (5th of 12)
◆ 2013-2014: 78.6% (8th of 11)
◆ 2011-2012: > 100%
◆ 2013-2014: 94.8%
i.e. 97.4% for 2011-2014
i.e. 292,200 stock options
March 5, 2012 plans (stock options only)(a)
2012-2014: 84.4% 2012-2014: 0.5 of a percentage point above target
2012-2014: 57.6%(9th of 11)
2012-2014: 85.3%
i.e. 204,720 stock options
March 5, 2013 plans (stock options only)(a)
2013-2015: 83.2% 2013-2015: 0.2 of a percentage point above target
2013-2015: 0%(9th of 11)
2013-2015: 73.3%
i.e. 175,920 stock options
March 5, 2014 plans(a) 2014-2016: 101.5% 2014-2016: 0.7 of a percentage point above target
2014-2016: 0%(11th of 11)
2014-2016: 80.6%
i.e. 193,440 stock options and 36,270 performance shares
June 24, 2015 plans 2015-2017: 102.2% 2015-2017: 2.1 percentage points above target
2015-2017: 0%(8th of 11)
2015-2017: 81.12%
i.e. 178,464 stock options and 36,504 performance shares
May 4, 2016 plans 2016-2018: 102.5% 2016-2018: 1.2 percentage points above target
2016-2018: 0% (10th of 11)
2016-2018: 81.25%
i.e. 178,750 stock options and 40,625 performance shares
Ratio of business net income to net sales
Business net income Net sales Ratio (target: ≥ 18 %) Allocation rate
June 24, 2015 plan(b) ◆ 2015: €7,371m ◆ 2016: €7,308m ◆ 2017: €6,964m
◆ 2015: €37,057m(c) ◆ 2016: €36,529m(c)(d) ◆ 2017: €35,055m(d)
◆ 2015: 19.9% ◆ 2016: 20% ◆ 2017: 19.9%
2015-2017: 100% i.e. 66,000 performance shares
(a) The attainment levels and allocation rates shown relate to the equity-based compensation plans awarded to the predecessor of the current Chief Executive Officer.
(b) This plan relates to the award by the Board of Directors, acting on a recommendation from the Compensation Committee, of 66,000 performance shares to Olivier Brandicourt on his taking up office, as partial consideration for benefits forfeited on leaving his previous employer.
(c) Net sales including the Animal Health business in 2015 and 2016, as well as VaxServe in 2015. Reported net sales for 2015 and 2016 respectively amount to €34,542 million and €33,821 million, excluding the Animal Health business in line with IFRS 5. On the latter basis, the ratio of business net income to net sales is 21.3% in 2015 and 21.6% in 2016.
(d) Excludes the effects of first time application of IFRS 15 on revenue recognition.
Stock options awarded to Olivier Brandicourt in 2018 (table no. 4 of the AFEP-MEDEF Code)
Source Date of plan Type of option
Valuation
of options
(€)
Number of
options
granted
during the
period
Exercise
price
(€)
Exercise
period
05/03/2022
Sanofi 05/02/2018 Subscription options 1,390,400 220,000 65.84 05/02/2028
172 SANOFI / FORM 20-F 2018
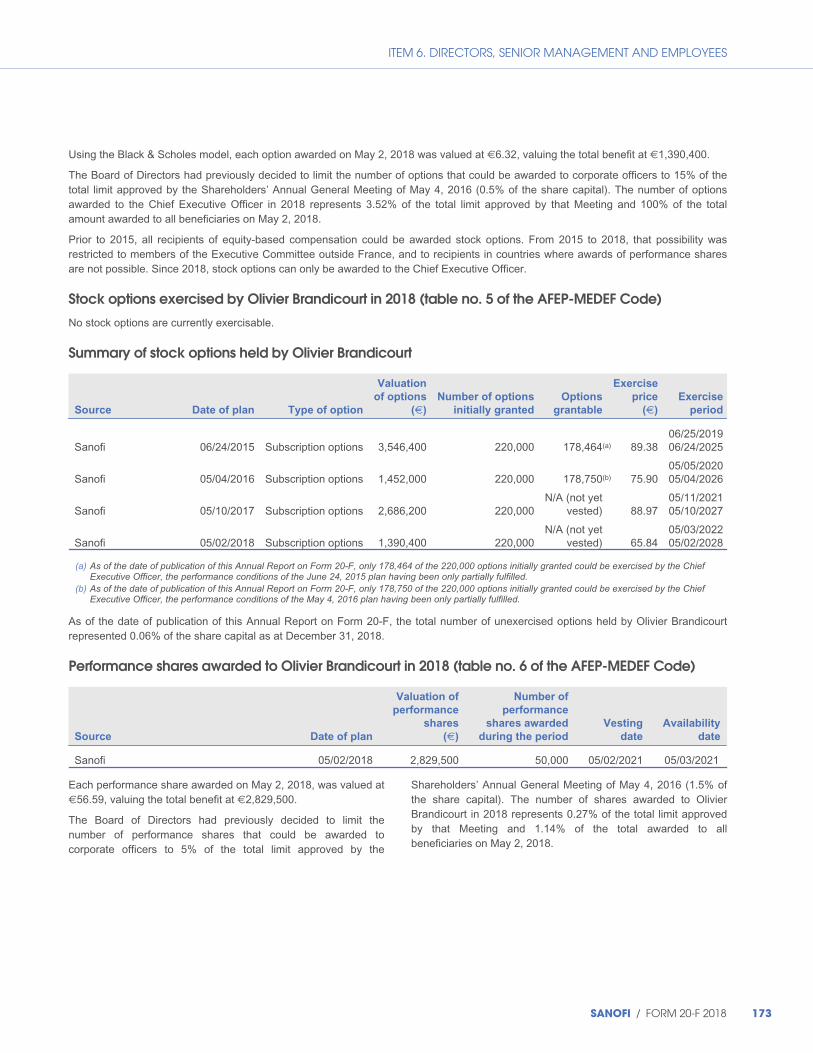
ITEM 6. DIRECTORS, SENIOR MANAGEMENT AND EMPLOYEES
Using the Black & Scholes model, each option awarded on May 2, 2018 was valued at €6.32, valuing the total benefit at €1,390,400.
The Board of Directors had previously decided to limit the number of options that could be awarded to corporate officers to 15% of the total limit approved by the Shareholders’ Annual General Meeting of May 4, 2016 (0.5% of the share capital). The number of options awarded to the Chief Executive Officer in 2018 represents 3.52% of the total limit approved by that Meeting and 100% of the total amount awarded to all beneficiaries on May 2, 2018.
Prior to 2015, all recipients of equity-based compensation could be awarded stock options. From 2015 to 2018, that possibility was restricted to members of the Executive Committee outside France, and to recipients in countries where awards of performance shares are not possible. Since 2018, stock options can only be awarded to the Chief Executive Officer.
Stock options exercised by Olivier Brandicourt in 2018 (table no. 5 of the AFEP-MEDEF Code)
No stock options are currently exercisable.
Summary of stock options held by Olivier Brandicourt
Source Date of plan Type of option
Valuation
of options
(€)
Number of options
initially granted
Options
grantable
Exercise
price
(€)
Exercise
period
Sanofi 06/24/2015 Subscription options 3,546,400 220,000 178,464(a) 89.38 06/25/2019 06/24/2025
Sanofi 05/04/2016 Subscription options 1,452,000 220,000 178,750(b) 75.90 05/05/2020 05/04/2026
Sanofi 05/10/2017 Subscription options 2,686,200 220,000 N/A (not yet
vested) 88.97 05/11/2021 05/10/2027
Sanofi 05/02/2018 Subscription options 1,390,400 220,000 N/A (not yet
vested) 65.84 05/03/2022 05/02/2028
(a) As of the date of publication of this Annual Report on Form 20-F, only 178,464 of the 220,000 options initially granted could be exercised by the Chief Executive Officer, the performance conditions of the June 24, 2015 plan having been only partially fulfilled.
(b) As of the date of publication of this Annual Report on Form 20-F, only 178,750 of the 220,000 options initially granted could be exercised by the Chief Executive Officer, the performance conditions of the May 4, 2016 plan having been only partially fulfilled.
As of the date of publication of this Annual Report on Form 20-F, the total number of unexercised options held by Olivier Brandicourt represented 0.06% of the share capital as at December 31, 2018.
Performance shares awarded to Olivier Brandicourt in 2018 (table no. 6 of the AFEP-MEDEF Code)
Source Date of plan
Valuation of
performance
shares
(€)
Number of
performance
shares awarded
during the period
Vesting
date
Availability
date
Sanofi 05/02/2018 2,829,500 50,000 05/02/2021 05/03/2021
Each performance share awarded on May 2, 2018, was valued at €56.59, valuing the total benefit at €2,829,500.
The Board of Directors had previously decided to limit the number of performance shares that could be awarded to corporate officers to 5% of the total limit approved by the
Shareholders’ Annual General Meeting of May 4, 2016 (1.5% of the share capital). The number of shares awarded to Olivier Brandicourt in 2018 represents 0.27% of the total limit approved by that Meeting and 1.14% of the total awarded to all beneficiaries on May 2, 2018.
SANOFI / FORM 20-F 2018 173

ITEM 6. DIRECTORS, SENIOR MANAGEMENT AND EMPLOYEES
Performance shares awarded to Olivier Brandicourt which became available in 2018 (table no. 7 of the AFEP-MEDEF Code)
No performance shares became available.
Summary of performance shares awarded to Olivier Brandicourt
Source Date of plan
Valuation of
performance
shares
(€)
Number of
performance
shares initially
awarded
Performance
shares
awardable
Vesting
date
Availability
date
Sanofi 06/24/2015 5,248,320 66,000 66,000 06/24/2019 06/25/2019 Sanofi 06/24/2015 3,578,400 45,000 36,504(a) 06/24/2019 06/25/2019 Sanofi 05/04/2016 3,053,000 50,000 40,625(b) 05/04/2019 05/05/2019
Sanofi 05/10/2017 4,075,000 50,000 N/A (not yet
vested) 05/10/2020 05/11/2020
Sanofi 05/02/2018 2,829,500 50,000 N/A (not yet
vested) 05/02/2021 05/03/2021
(a) As of the date of publication of this Annual Report on Form 20-F, only 36,504 of the 50,000 performance shares initially awarded to the Chief Executive Officer would vest, the performance conditions of the June 24, 2015 plan having been only partially fulfilled.
(b) As of the date of publication of this Annual Report on Form 20-F, only 40,625 of the 50,000 performance shares initially awarded to the Chief Executive Officer would vest, the performance conditions of the May 4, 2016 plan having been only partially fulfilled.
As of the date of publication of this Annual Report on Form 20-F, the total number of performance shares awarded to Olivier Brandicourt represented 0.02% of the share capital as of December 31, 2018.
Compensation in respect of 2019 Acting on a recommendation from the Compensation Committee, the Board of Directors meeting of March 8, 2019 decided to maintain Olivier Brandicourt’s fixed annual compensation for 2019 at the same level (€1,200,000), and also to retain the same variable annual compensation structure whereby 40% is based on financial indicators (sales growth one-third, business net income two-thirds) and 60% on specific individual objectives.
Also acting on a recommendation from the Compensation Committee, the Board of Directors decided to introduce a separate CSR criterion. That decision reflects the Board’s long-standing commitment to take account of the social and environmental impact of Sanofi’s operations while promoting long-term value creation. It also responds to feedback gathered by the Chairman of the Board in meetings with our principal shareholders and stakeholders.
The Chief Executive Officer’s individual objectives are as follows:
◆ Business transformation (15%)
◆ Pipeline (12.5%)
◆ New products launches (10%)
◆ Organisation & People (10%)
◆ Business development – External growth (7.5%)
◆ CSR (5%)
For 2019, the variable compensation of Olivier Brandicourt will remain in a range between 0% and 250% of his fixed compensation, with a target of 150%.
Acting on a recommendation from the Compensation Committee, the Board of Directors meeting of March 8, 2019 proposed to award Olivier Brandicourt 220,000 stock subscription options and 50,000 performance shares in respect of the 2019 financial year. To ensure that the Chief Executive Officer’s compensation remains aligned with our performance and our evolving strategy, the Board of Directors (acting on a recommendation from the Compensation Committee) has decided to replace the performance criterion based on Return On Assets (ROA) with a criterion based on free cash flow (FCF). The other performance conditions (business net income and TSR) are unchanged.
The award of those stock options and performance shares to Olivier Brandicourt in respect of the 2019 financial year is contingent on approval of his compensation package by the shareholders at the Ordinary General Meeting, on the terms stipulated in Article L. 225-100 of the French Commercial Code.
Shareholder votes on the components of Olivier Brandicourt’s compensation
Result of the votes 2018 AGM(a) 2017 AGM(b) 2016 AGM(b)
88.75% 87.69% 63.26%
(a) Binding vote. (b) Consultative vote.
174 SANOFI / FORM 20-F 2018
ITEM 6. DIRECTORS, SENIOR MANAGEMENT AND EMPLOYEES
Arrangements for executive officers
1. Pension arrangements
Olivier Brandicourt is covered by the Sanofi top-up defined-benefit pension plan, which falls within the scope of Article L. 137-11 of the French Social Security Code. For a fuller description of the plan, refer to “– Compensation policy for corporate officers” above.
Based on the assumptions used in the actuarial valuation of the plan, 527 executives were eligible for this plan (71 retirees, 90 early retirees and 366 active employees) as of December 31, 2018.
Because Olivier Brandicourt has pursued his career in different countries and in different groups, he has not continuously paid into the French compulsory industry schemes. Consequently, he was awarded a deemed ten years of service on taking up office at Sanofi.
The Shareholders’ Annual General Meeting of May 4, 2015 approved the section on the pension benefit contained in the auditors’ special report on related-party agreements.
The Board of Directors, acting on a recommendation from the Compensation Committee, decided at its meeting of February 7, 2017 to apply a performance condition to the vesting of new contingent rights arising under Olivier Brandicourt’s top-up pension plan with effect from January 1, 2017. The terms of that performance condition are described in “– Compensation policy for corporate officers” above.
The alteration in pension arrangements was approved by Sanofi shareholders at the Annual General Meeting of May 10, 2017.
At a meeting on March 8, 2019, our Board of Directors ascertained whether the performance condition had been met, noting that the level of attainment for the Chief Executive Officer’s variable compensation for the 2018 financial year was 103.1%, i.e. 154.65% of his fixed compensation. Consequently, 103.1% of his contingent top-up pension rights vest, corresponding to an uplift of 1.55%in the annual reference compensation used to calculate the annuity payable under the plan.
Taking into account the award of a deemed ten years of service, he has therefore accumulated 13.75 years of service as of December 31, 2018. His reference compensation being limited to 60 times the French social security ceiling (i.e. €2,383,920 in 2018, based on a ceiling of €39,732), the theoretical maximum of his top-up pension is currently 20.6655% of that amount, i.e. €492,649.
On leaving Sanofi, Olivier Brandicourt may not benefit from our top-up pension plan unless he is entitled to benefit fully from compulsory industry schemes; this requires him to have reached statutory retirement age (which he did in February 2018) and to have accumulated the required number of three-month periods of qualifying employment. We do not have sufficient information to determine whether retirement in 2019 is a realistic scenario in terms of his period of qualifying employment, since most of his career has been spent outside France.
If Olivier Brandicourt were to retire in 2019, he would as mentioned above have accumulated 13.75 years of service, entitling him to an annuity equal to 20.625% of his reference compensation. That annuity would supplement any other schemes for which he may be eligible in France or abroad, subject to a cap on the total pension from all sources set at 52% of the reference compensation. If the total amount of the annuities paid under all such schemes were to exceed the 52% cap, the amount of the Sanofi top-up defined-benefit pension annuity would be reduced accordingly in order to respect this cap.
2. Termination arrangements
The termination benefit only becomes payable if the departure of the Chief Executive Officer is forced, i.e. in the event of removal from office linked to a change in strategy or control of the Company; for a fuller description of the benefit, refer to “– Compensation policy for corporate officers” above.
In accordance with article L. 225-42-1 of the French Commercial Code and with the AFEP-MEDEF Code, payment of the termination benefit is contingent upon fulfillment of two performance criteria, assessed over the three financial years preceding his ceasing to hold office. The two criteria are as follows:
◆ the average of the ratios of business net income1 to net sales for each financial year must be at least 15%;
◆ the average of the ratios of operating cash flow before changes in working capital to net sales for each financial year must be at least 18%.
The Shareholders’ Annual General Meeting of May 4, 2015 approved the section on the termination benefit contained in the auditors’ special report on related-party agreements.
3. Non-compete undertaking
This undertaking stipulates that in the event of his departure from the Company, Olivier Brandicourt will not join a competitor of the Company as an employee or corporate officer, or provide services to or cooperate with such a competitor, during the 12-month period following his departure; for a fuller description of this undertaking, refer to “– Compensation policy for corporate officers” above.
In return for this undertaking, he may receive an indemnity corresponding to one year’s total compensation (fixed + variable), payable in 12 monthly installments; however the Board of Directors reserves the right to release him from that undertaking for some or all of the period covered by the undertaking. In that case, the non-compete indemnity would not be due for the period of time waived by the Company.
The Shareholders’ General Meeting of May 4, 2015 approved the section on the non-compete undertaking contained in the auditors’ special report on related party agreements.
(1) For a definition, see “– Item 5 – Operating and Financial Review and Prospects – Business Net Income”.
SANOFI / FORM 20-F 2018 175
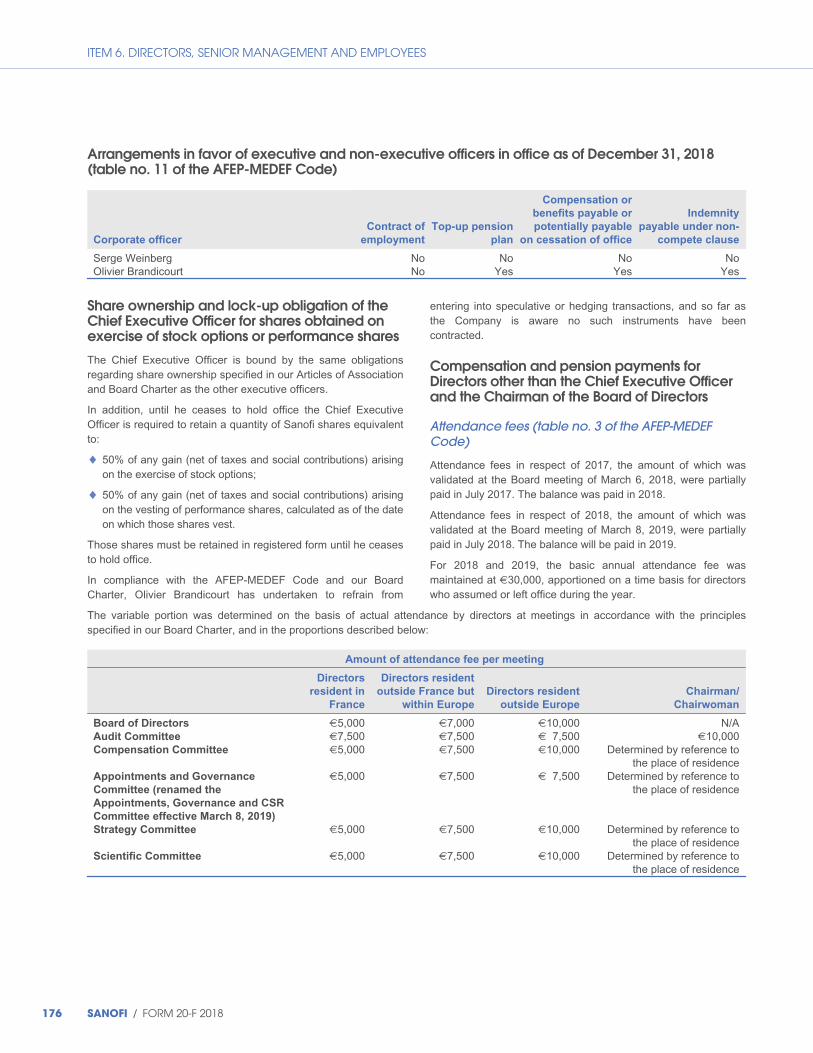
ITEM 6. DIRECTORS, SENIOR MANAGEMENT AND EMPLOYEES
Arrangements in favor of executive and non-executive officers in office as of December 31, 2018 (table no. 11 of the AFEP-MEDEF Code)
Corporate officer
Contract of
employment
Top-up pension
plan
Compensation or
benefits payable or
potentially payable
on cessation of office
Indemnity
payable under non-
compete clause
Serge Weinberg No No No No Olivier Brandicourt No Yes Yes Yes
Share ownership and lock-up obligation of the Chief Executive Officer for shares obtained on exercise of stock options or performance shares
The Chief Executive Officer is bound by the same obligations regarding share ownership specified in our Articles of Association and Board Charter as the other executive officers.
In addition, until he ceases to hold office the Chief Executive Officer is required to retain a quantity of Sanofi shares equivalent to:
◆ 50% of any gain (net of taxes and social contributions) arising on the exercise of stock options;
◆ 50% of any gain (net of taxes and social contributions) arising on the vesting of performance shares, calculated as of the date on which those shares vest.
Those shares must be retained in registered form until he ceases to hold office.
In compliance with the AFEP-MEDEF Code and our Board Charter, Olivier Brandicourt has undertaken to refrain from
entering into speculative or hedging transactions, and so far as the Company is aware no such instruments have been contracted.
Compensation and pension payments for Directors other than the Chief Executive Officer and the Chairman of the Board of Directors
Attendance fees (table no. 3 of the AFEP-MEDEF Code)
Attendance fees in respect of 2017, the amount of which was validated at the Board meeting of March 6, 2018, were partially paid in July 2017. The balance was paid in 2018.
Attendance fees in respect of 2018, the amount of which was validated at the Board meeting of March 8, 2019, were partially paid in July 2018. The balance will be paid in 2019.
For 2018 and 2019, the basic annual attendance fee was maintained at €30,000, apportioned on a time basis for directors who assumed or left office during the year.
The variable portion was determined on the basis of actual attendance by directors at meetings in accordance with the principles specified in our Board Charter, and in the proportions described below:
Amount of attendance fee per meeting
Directors
resident in
France
Directors resident
outside France but
within Europe
Directors resident
outside Europe
Chairman/
Chairwoman
Board of Directors €5,000 €7,000 €10,000 N/A Audit Committee €7,500 €7,500 € 7,500 €10,000 Compensation Committee €5,000 €7,500 €10,000 Determined by reference to
the place of residence Appointments and Governance
Committee (renamed the
Appointments, Governance and CSR
Committee effective March 8, 2019)
€5,000 €7,500 € 7,500 Determined by reference to the place of residence
Strategy Committee €5,000 €7,500 €10,000 Determined by reference to the place of residence
Scientific Committee €5,000 €7,500 €10,000 Determined by reference to the place of residence
176 SANOFI / FORM 20-F 2018
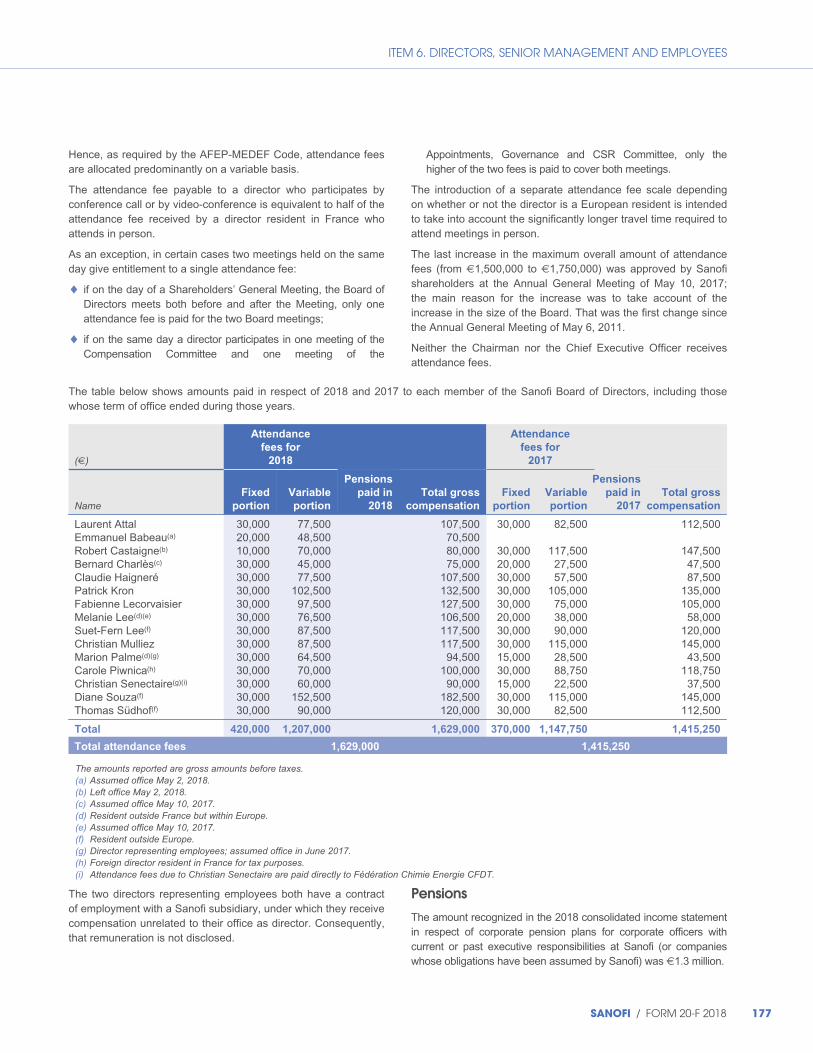
ITEM 6. DIRECTORS, SENIOR MANAGEMENT AND EMPLOYEES
Hence, as required by the AFEP-MEDEF Code, attendance fees are allocated predominantly on a variable basis.
The attendance fee payable to a director who participates by conference call or by video-conference is equivalent to half of the attendance fee received by a director resident in France who attends in person.
As an exception, in certain cases two meetings held on the same day give entitlement to a single attendance fee:
◆ if on the day of a Shareholders’ General Meeting, the Board of Directors meets both before and after the Meeting, only one attendance fee is paid for the two Board meetings;
◆ if on the same day a director participates in one meeting of the Compensation Committee and one meeting of the
Appointments, Governance and CSR Committee, only the higher of the two fees is paid to cover both meetings.
The introduction of a separate attendance fee scale depending on whether or not the director is a European resident is intended to take into account the significantly longer travel time required to attend meetings in person.
The last increase in the maximum overall amount of attendance fees (from €1,500,000 to €1,750,000) was approved by Sanofi shareholders at the Annual General Meeting of May 10, 2017; the main reason for the increase was to take account of the increase in the size of the Board. That was the first change since the Annual General Meeting of May 6, 2011.
Neither the Chairman nor the Chief Executive Officer receives attendance fees.
The table below shows amounts paid in respect of 2018 and 2017 to each member of the Sanofi Board of Directors, including those whose term of office ended during those years.
(€)
Attendance
fees for
2018
Attendance
fees for
2017
Name Fixed
portion
Variable
portion
Pensions
paid in
2018
Total gross
compensation
Fixed
portion
Variable
portion
Pensions
paid in
2017
Total gross
compensation
Laurent Attal 30,000 77,500 107,500 30,000 82,500 112,500 Emmanuel Babeau(a) 20,000 48,500 70,500 Robert Castaigne(b) 10,000 70,000 80,000 30,000 117,500 147,500Bernard Charlès(c) 30,000 45,000 75,000 20,000 27,500 47,500Claudie Haigneré 30,000 77,500 107,500 30,000 57,500 87,500 Patrick Kron 30,000 102,500 132,500 30,000 105,000 135,000 Fabienne Lecorvaisier 30,000 97,500 127,500 30,000 75,000 105,000 Melanie Lee(d)(e) 30,000 76,500 106,500 20,000 38,000 58,000Suet-Fern Lee(f) 30,000 87,500 117,500 30,000 90,000 120,000Christian Mulliez 30,000 87,500 117,500 30,000 115,000 145,000 Marion Palme(d)(g) 30,000 64,500 94,500 15,000 28,500 43,500Carole Piwnica(h) 30,000 70,000 100,000 30,000 88,750 118,750Christian Senectaire(g)(i) 30,000 60,000 90,000 15,000 22,500 37,500Diane Souza(f) 30,000 152,500 182,500 30,000 115,000 145,000Thomas Südhof(f) 30,000 90,000 120,000 30,000 82,500 112,500
Total 420,000 1,207,000 1,629,000 370,000 1,147,750 1,415,250
Total attendance fees 1,629,000 1,415,250
The amounts reported are gross amounts before taxes. (a) Assumed office May 2, 2018. (b) Left office May 2, 2018. (c) Assumed office May 10, 2017. (d) Resident outside France but within Europe. (e) Assumed office May 10, 2017. (f) Resident outside Europe. (g) Director representing employees; assumed office in June 2017. (h) Foreign director resident in France for tax purposes. (i) Attendance fees due to Christian Senectaire are paid directly to Fédération Chimie Energie CFDT.
The two directors representing employees both have a contract of employment with a Sanofi subsidiary, under which they receive compensation unrelated to their office as director. Consequently, that remuneration is not disclosed.
Pensions
The amount recognized in the 2018 consolidated income statement in respect of corporate pension plans for corporate officers with current or past executive responsibilities at Sanofi (or companies whose obligations have been assumed by Sanofi) was €1.3 million.
SANOFI / FORM 20-F 2018 177
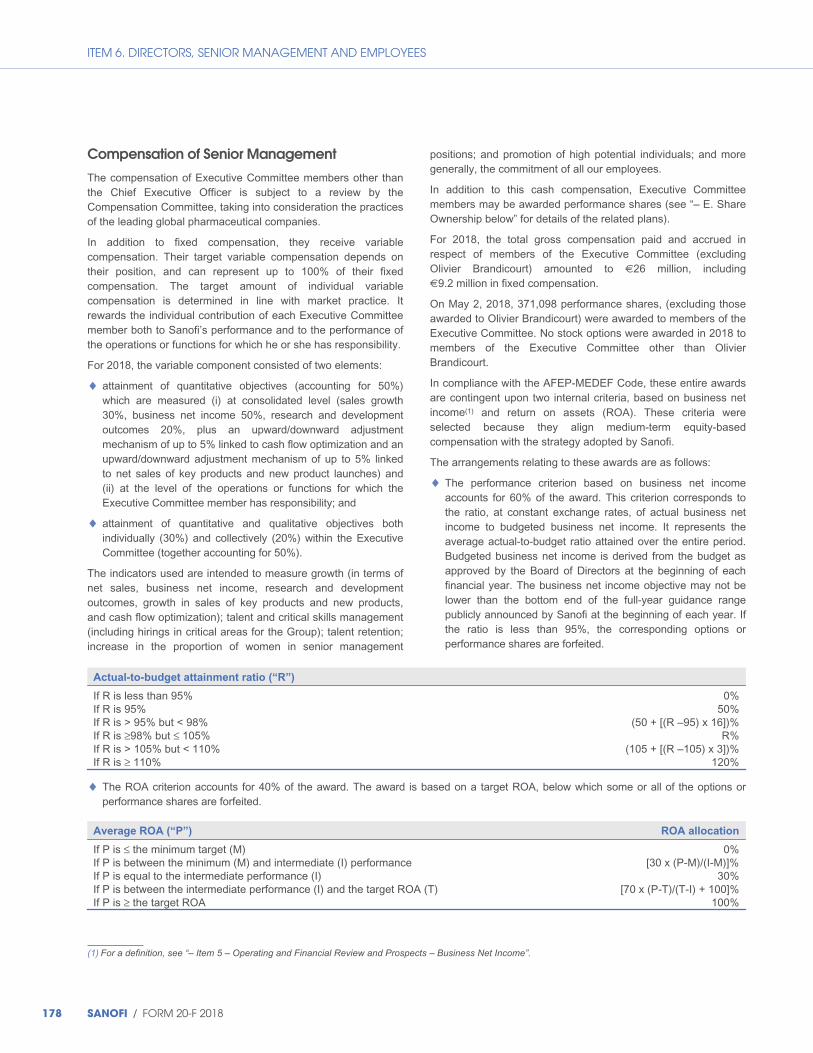
ITEM 6. DIRECTORS, SENIOR MANAGEMENT AND EMPLOYEES
Compensation of Senior Management
The compensation of Executive Committee members other than the Chief Executive Officer is subject to a review by the Compensation Committee, taking into consideration the practices of the leading global pharmaceutical companies.
In addition to fixed compensation, they receive variable compensation. Their target variable compensation depends on their position, and can represent up to 100% of their fixed compensation. The target amount of individual variable compensation is determined in line with market practice. It rewards the individual contribution of each Executive Committee member both to Sanofi’s performance and to the performance of the operations or functions for which he or she has responsibility.
For 2018, the variable component consisted of two elements:
◆ attainment of quantitative objectives (accounting for 50%) which are measured (i) at consolidated level (sales growth 30%, business net income 50%, research and development outcomes 20%, plus an upward/downward adjustment mechanism of up to 5% linked to cash flow optimization and an upward/downward adjustment mechanism of up to 5% linked to net sales of key products and new product launches) and (ii) at the level of the operations or functions for which the Executive Committee member has responsibility; and
◆ attainment of quantitative and qualitative objectives both individually (30%) and collectively (20%) within the Executive Committee (together accounting for 50%).
The indicators used are intended to measure growth (in terms of net sales, business net income, research and development outcomes, growth in sales of key products and new products, and cash flow optimization); talent and critical skills management (including hirings in critical areas for the Group); talent retention; increase in the proportion of women in senior management
positions; and promotion of high potential individuals; and more generally, the commitment of all our employees.
In addition to this cash compensation, Executive Committee members may be awarded performance shares (see “– E. Share Ownership below” for details of the related plans).
For 2018, the total gross compensation paid and accrued in respect of members of the Executive Committee (excluding Olivier Brandicourt) amounted to €26 million, including €9.2 million in fixed compensation.
On May 2, 2018, 371,098 performance shares, (excluding those awarded to Olivier Brandicourt) were awarded to members of the Executive Committee. No stock options were awarded in 2018 to members of the Executive Committee other than Olivier Brandicourt.
In compliance with the AFEP-MEDEF Code, these entire awards are contingent upon two internal criteria, based on business net income(1) and return on assets (ROA). These criteria were selected because they align medium-term equity-based compensation with the strategy adopted by Sanofi.
The arrangements relating to these awards are as follows:
◆ The performance criterion based on business net income accounts for 60% of the award. This criterion corresponds to the ratio, at constant exchange rates, of actual business net income to budgeted business net income. It represents the average actual-to-budget ratio attained over the entire period. Budgeted business net income is derived from the budget as approved by the Board of Directors at the beginning of each financial year. The business net income objective may not be lower than the bottom end of the full-year guidance range publicly announced by Sanofi at the beginning of each year. If the ratio is less than 95%, the corresponding options or performance shares are forfeited.
Actual-to-budget attainment ratio (“R”)
If R is less than 95% 0% If R is 95% 50% If R is > 95% but < 98% (50 + [(R –95) x 16])% If R is ≥98% but ≤ 105% R% If R is > 105% but < 110% (105 + [(R –105) x 3])% If R is ≥ 110% 120%
◆ The ROA criterion accounts for 40% of the award. The award is based on a target ROA, below which some or all of the options or performance shares are forfeited.
Average ROA (“P”) ROA allocation
If P is ≤ the minimum target (M) 0% If P is between the minimum (M) and intermediate (I) performance [30 x (P-M)/(I-M)]% If P is equal to the intermediate performance (I) 30% If P is between the intermediate performance (I) and the target ROA (T) [70 x (P-T)/(T-I) + 100]% If P is ≥ the target ROA 100%
(1) For a definition, see “– Item 5 – Operating and Financial Review and Prospects – Business Net Income”.
178 SANOFI / FORM 20-F 2018
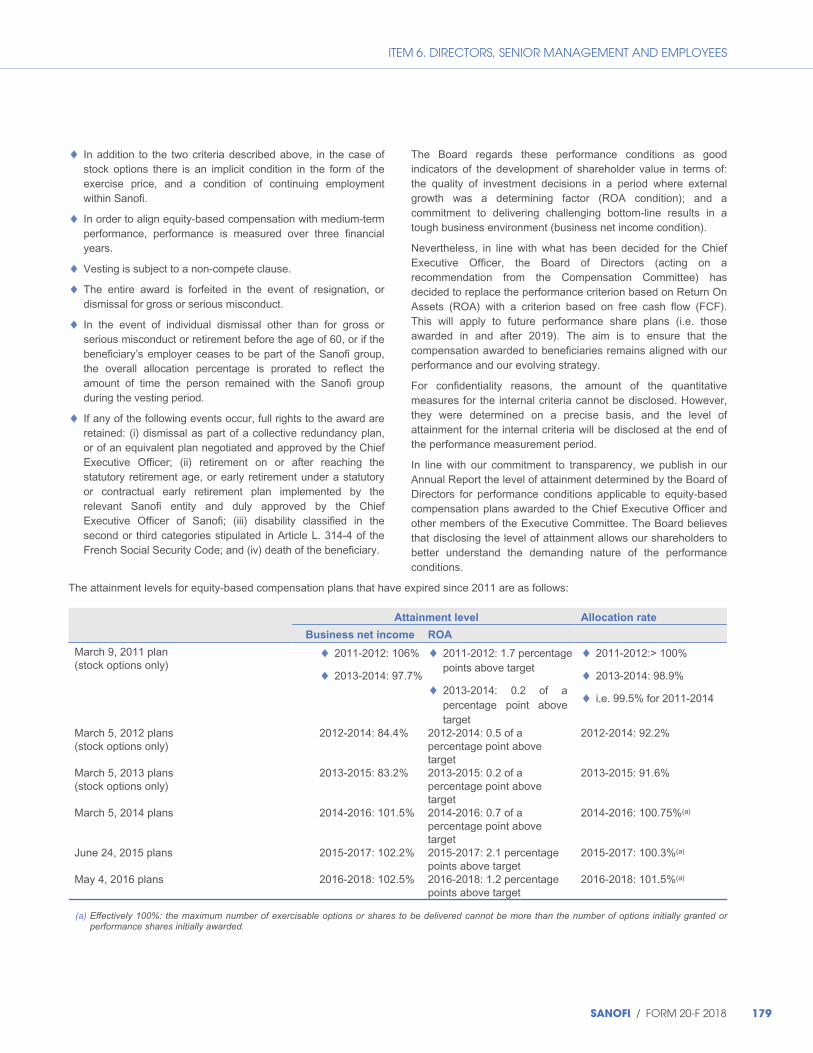
ITEM 6. DIRECTORS, SENIOR MANAGEMENT AND EMPLOYEES
◆ In addition to the two criteria described above, in the case of stock options there is an implicit condition in the form of the exercise price, and a condition of continuing employment within Sanofi.
◆ In order to align equity-based compensation with medium-term performance, performance is measured over three financial years.
◆ Vesting is subject to a non-compete clause.
◆ The entire award is forfeited in the event of resignation, or dismissal for gross or serious misconduct.
◆ In the event of individual dismissal other than for gross or serious misconduct or retirement before the age of 60, or if the beneficiary’s employer ceases to be part of the Sanofi group, the overall allocation percentage is prorated to reflect the amount of time the person remained with the Sanofi group during the vesting period.
◆ If any of the following events occur, full rights to the award are retained: (i) dismissal as part of a collective redundancy plan, or of an equivalent plan negotiated and approved by the Chief Executive Officer; (ii) retirement on or after reaching the statutory retirement age, or early retirement under a statutory or contractual early retirement plan implemented by the relevant Sanofi entity and duly approved by the Chief Executive Officer of Sanofi; (iii) disability classified in the second or third categories stipulated in Article L. 314-4 of the French Social Security Code; and (iv) death of the beneficiary.
The Board regards these performance conditions as good indicators of the development of shareholder value in terms of: the quality of investment decisions in a period where external growth was a determining factor (ROA condition); and a commitment to delivering challenging bottom-line results in a tough business environment (business net income condition).
Nevertheless, in line with what has been decided for the Chief Executive Officer, the Board of Directors (acting on a recommendation from the Compensation Committee) has decided to replace the performance criterion based on Return On Assets (ROA) with a criterion based on free cash flow (FCF). This will apply to future performance share plans (i.e. those awarded in and after 2019). The aim is to ensure that the compensation awarded to beneficiaries remains aligned with our performance and our evolving strategy.
For confidentiality reasons, the amount of the quantitative measures for the internal criteria cannot be disclosed. However, they were determined on a precise basis, and the level of attainment for the internal criteria will be disclosed at the end of the performance measurement period.
In line with our commitment to transparency, we publish in our Annual Report the level of attainment determined by the Board of Directors for performance conditions applicable to equity-based compensation plans awarded to the Chief Executive Officer and other members of the Executive Committee. The Board believes that disclosing the level of attainment allows our shareholders to better understand the demanding nature of the performance conditions.
The attainment levels for equity-based compensation plans that have expired since 2011 are as follows:
Attainment level Allocation rate
Business net income ROA
March 9, 2011 plan (stock options only)
◆ 2011-2012: 106%
◆ 2013-2014: 97.7%
◆ 2011-2012: 1.7 percentage points above target
◆ 2013-2014: 0.2 of a percentage point above target
◆ 2011-2012:> 100%
◆ 2013-2014: 98.9%
◆ i.e. 99.5% for 2011-2014
March 5, 2012 plans (stock options only)
2012-2014: 84.4% 2012-2014: 0.5 of a percentage point above target
2012-2014: 92.2%
March 5, 2013 plans (stock options only)
2013-2015: 83.2% 2013-2015: 0.2 of a percentage point above target
2013-2015: 91.6%
March 5, 2014 plans 2014-2016: 101.5% 2014-2016: 0.7 of a percentage point above target
2014-2016: 100.75%(a)
June 24, 2015 plans 2015-2017: 102.2% 2015-2017: 2.1 percentage points above target
2015-2017: 100.3%(a)
May 4, 2016 plans 2016-2018: 102.5% 2016-2018: 1.2 percentage points above target
2016-2018: 101.5%(a)
(a) Effectively 100%: the maximum number of exercisable options or shares to be delivered cannot be more than the number of options initially granted or performance shares initially awarded.
SANOFI / FORM 20-F 2018 179

ITEM 6. DIRECTORS, SENIOR MANAGEMENT AND EMPLOYEES
During 2018, 70,951 stock options were exercised by individuals who were Executive Committee members at the time of exercise.
All of the plans involved post-dated the creation of the Executive Committee: Sanofi-Aventis plan of March 3, 2009, exercise price €45.09; Sanofi-Aventis plan of March 9, 2011, exercise price €50.48; Sanofi plan of March 5, 2012, exercise price €56.44; and Sanofi plan of March 5, 2014, exercise price €73.48.
Under French law, Directors may not receive options or performance shares solely as compensation for service on our Board, and consequently our Company may grant options only to those Directors who are also our executive officers.
Because some of our non-executive Directors were formerly senior executives or executive officers of our Company or its predecessor companies, some of our non-executive Directors hold Sanofi stock options.
We do not have separate profit-sharing plans for key executives. As employees, they are able to participate in our voluntary and
statutory profit-sharing schemes on the same terms as our other employees. These plans are described below under “ –Employees – Profit-sharing schemes.”
The total amount accrued as of December 31, 2018 in respect of corporate pension plans for corporate officers with current or past executive responsibilities at Sanofi (or at companies whose obligations have been assumed by Sanofi) and for members of the Sanofi Executive Committee was €59 million, of which €7 million was recognized in the income statement for the year then ended.
C. Board Practices Neither we nor our subsidiaries have entered into service contracts with members of our Board of Directors or corporate officers providing for benefits upon termination of employment. With respect to Olivier Brandicourt see also “–B. Compensation – Compensation and arrangements for corporate officers” above.
Application of the AFEP-MEDEF Code
The AFEP-MEDEF Code requires us to report specifically on the application of its recommendations and if any of them have not been applied, explain why. Currently our departures from this Code are as follows:
Paragraph of the AFEP-MEDEF
Code
Recommendation of the AFEP-MEDEF
code Application by Sanofi
9.2 Evaluation of the Board of Directors
The evaluation has three objectives:
– […] ;
The evaluation of the Board conducted at the end of 2018 included an assessment of the actual contribution of each director to the Board’s work.
– measure the actual contribution of each director to the Board’s work.
More generally, the issue of competence and individual contribution to the work of the Board and its Committees is addressed on a continuous basis, with a specific review when a director is up for reappointment as a Board or Committee member.
Annual evaluations are conducted using a detailed questionnaire. The questionnaire deals specifically with the operating procedures of the Board and gives directors an opportunity to express freely their assessment of the individual contributions of other directors. These evaluations may be followed by individual meetings with the Secretary to the Board, at which the responses to the questionnaire are analyzed and discussed.
17.1. Membership of the Compensation Committee
It is recommended that one of its members be an employee director.
The Board intends to appoint a director representing employees to the Compensation Committee after an induction period that will give that director time to adapt to how the Company operates, understand its specific characteristics, familiarize himself or herself with the challenges and broad outlines of the Board’s remit, and undertake any necessary training.
180 SANOFI / FORM 20-F 2018
ITEM 6. DIRECTORS, SENIOR MANAGEMENT AND EMPLOYEES
Paragraph of the AFEP-MEDEF
Code
Recommendation of the AFEP-MEDEF
code Application by Sanofi
23.2 Non-competition agreement In any event, no benefit can be paid over the age of 65.
Under the compensation policy for our Chief Executive Officer, he undertakes in the event he leaves the Company not to join a competitor of the Company as an employee or corporate officer, or to provide services to or cooperate with such a competitor.
In return for this undertaking, he receives an indemnity corresponding to one year’s total compensation based on his fixed compensation effective on the day he ceases to hold office and the last individual variable compensation received prior to that date. The indemnity is payable in 12 monthly installments.
The Board of Directors, acting on a recommendation of the Compensation Committee, decided not to alter the compensation policy and non-compete undertaking of the Chief Executive Officer such that his indemnity would not be payable after he reaches the age of 65. Apart from the fact that the AFEP-MEDEF recommendation is contrary to the principle of the strict enforceability of legally constituted contractual arrangements, it is also out of line with the actual situation. In practice, many executive officers continue to work after they leave office, often in a consultancy role. Consequently, implementing the AFEP-MEDEF recommendation would put Sanofi at risk of having no legal protection if the Chief Executive Officer were to take up an activity in competition with the Company immediately after leaving office.
However, the Board of Directors may decide at the time the Chief Executive Officer leaves office (regardless of his age) to release him from the non-compete undertaking for some or all of the 12-month period. In such a case, the non-compete indemnity would not be due for the period of time waived by the Company.
Activities of the Board of Directors in 2018
During 2018, the Board of Directors met 11 times, with an overall attendance rate among Board members of over 95%. This attendance rate includes participation by conference call, though only a small number of Directors participated in this way. Individual attendance rates varied between 82% and 100%.
The following persons attended meetings of the Board of Directors:
◆ the directors;
◆ the Secretary to the Board;
◆ frequently: members of the Executive Committee; and
◆ occasionally: the statutory auditors, managers of our global support functions, and other company employees.
The agenda for each meeting of the Board is prepared by the Secretary after consultation with the Chairman, taking account of the agendas for the meetings of the specialist Committees and the suggestions of the directors.
Approximately one week prior to each meeting of the Board of Directors, the directors each receive a file containing the agenda, the minutes of the previous meeting, and documentation relating to the agenda.
The minutes of each meeting are expressly approved at the next meeting of the Board of Directors.
In compliance with our Board Charter, certain issues are examined in advance by the various Committees according to their areas of competence to enable them to make a recommendation; those issues are then submitted for a decision by the Board of Directors.
SANOFI / FORM 20-F 2018 181
ITEM 6. DIRECTORS, SENIOR MANAGEMENT AND EMPLOYEES
Since 2016, acting on a recommendation from the Appointments and Governance Committee (renamed the Appointments, Governance and CSR Committee effective March 8, 2019), the Board has held at least two executive sessions (i.e. meetings held without the Chief Executive Officer present) per year. If the Chairman of the Board so decides, such sessions may also be held without the directors representing employees (or any other Sanofi employee) being present. The primary purpose of such sessions is to evaluate the way the Board and its Committees operate, to discuss the performance of the Chief Executive Officer, and to debate succession planning. Two executive sessions took place in 2018, ahead of the Board meetings held on March 6 and December 18.
In 2018, the main activities of the Board of Directors related to the following issues:
◆ financial statements and financial matters:
– review of the individual company and consolidated financial statements for the 2017 financial year and for the first half of 2018, review of the consolidated financial statements for the first three quarters of 2017, review of the draft press releases and presentations to analysts with respect to the publication of such financial statements, examination of documents relating to management forecasts;
– delegation of authority to the Chief Executive Officer to issue bonds and guarantees, and renewal of the share repurchase program;
– recording the amount of share capital, reducing the share capital through cancellation of treasury shares, and amending the Articles of Association accordingly; and
– presentation of the revised 2018 budget (following the acquisitions of Ablynx and Bioverativ), the 2019 budget, and 2019-2020 financial forecasts.
◆ compensation matters:
– determination of the 2017 variable compensation of the Chief Executive Officer, the 2018 fixed and variable compensation of the Chief Executive Officer and the 2018 fixed compensation of the Chairman of the Board, plus an update on fixed and variable compensation of members of the Executive Committee for 2017 and 2018. During the presentation of the report of the Compensation Committee on the compensation of corporate officers, the Board of Directors deliberates in executive session in their absence: the Board of Directors first discusses the compensation of the Chairman of the Board in his absence, and then the compensation of the Chief Executive Officer with the Chairman present but the Chief Executive Officer still absent;
– allocation of Directors’ attendance fees for 2017, principles of allocation for 2018 and allocation of attendance fees for the first half of 2018;
– adoption of equity-based compensation plans, consisting of stock subscription option plans and performance share
plans in respect of 2018, and determination of the fulfillment of performance conditions of previous equity-based compensation plans; and
– adjustment to the performance criteria for the stock option plans and performance share plans of May 4, 2016 and May 10, 2017 to reflect the impact of the acquisitions of Ablynx and Bioverativ.
◆ appointments and governance matters:
– composition of the Board and its Committees, proposed reappointment of directors and appointment of a new director at the 2018 Annual General Meeting, and director independence;
– creation of a Scientific Committee;
– review of succession planning;
– reviews of the Board of Directors’ Management Report, the report on corporate governance, and the reports of the statutory auditors;
– the notice of meeting for the Annual General Meeting of Shareholders and of Holders of Participating Shares (Series issued in 1983, 1984 and 1987), adoption of (i) the draft resolutions (ii) the report of the Board of Directors on the resolutions and (iii) the special reports on the awards of stock subscription options and performance shares, and examination of questions submitted in writing;
– evaluation of the work of the Board and its Committees;
– presentation of a detailed report on the governance roadshows arranged for the main investors in Sanofi;
– revisions to the Board Charter; and
– review of previously-approved related party agreements.
◆ scrutiny of, and updates on, the Ablynx and Bioverativ acquisitions;
◆ divestment of our European Generics business (Zentiva) to Advent International;
◆ presentation on Sanofi’s CSR policies and initiatives;
◆ update on the risks facing Sanofi;
◆ update on the Diabetes and Cardiovascular business;
◆ the transfer of our non-vaccine infectious diseases R&D platform to Evotec;
◆ update on Dengvaxia®;
◆ update on Praluent®;
◆ update on Depakine®;
◆ update on chemical industrial facilities in France;
◆ update on the strategy for China and emerging markets;
◆ scrutiny of significant proposed alliances and acquisitions, and strategic opportunities;
◆ update on the industrial transformation of Sanofi;
182 SANOFI / FORM 20-F 2018
ITEM 6. DIRECTORS, SENIOR MANAGEMENT AND EMPLOYEES
◆ company policy on equal pay and opportunities;
◆ cancellation of the 1989 series of participating shares; and
◆ approval in principle of a share issue reserved for employees.
In addition, two strategy seminars were held during 2018. The first (the “Innovation Tour”) took place in Boston in March 2018, giving directors an opportunity to address various issues including:
– the life sciences ecosystem in the state of Massachusetts;
– biotechnology innovations, and transformative innovations in healthcare generally;
– oncology;
– challenges and future prospects for the US healthcare sector;
– new ways of delivering therapeutic solutions to patients;
– the Sanofi-Alnylam alliance;
– drug pricing;
– the Sanofi-Regeneron alliance; and
– the history and specialties of Bioverativ.
The second strategy seminar was held in Paris in October 2018. The following issues were discussed over two days, in the presence of all Sanofi directors and representatives of the Company:
– developments in strategy;
– R&D;
– growth accelerators;
– digital trends;
– business transformation; and
– financial outlook.
Activities of the Board Committees in 2018
Since 1999, our Board of Directors has been assisted in its deliberations and decisions by specialist Committees (see our Board Charter, provided as Exhibit 1.2 to this Annual Report on Form 20-F). Chairmen and members of these Committees are chosen by the Board from among its members, based on their experience.
The Committees are responsible for the preparation of certain items on the agenda of the Board of Directors. Decisions of the Committees are adopted by a simple majority with the chairman of the Committee having a casting vote. Minutes are drafted, and approved by the Committee members.
The chairman of each Committee reports to the Board on the work of that Committee, so that the Board is fully informed whenever it takes a decision.
During 2018:
◆ the Board of Directors decided to set up a fifth specialist Committee, the Scientific Committee:
Scientific Committee
Chairman Thomas Südhof (independent director)
Members Laurent Attal Melanie Lee (independent director) Serge Weinberg (independent director)
Proportion of independent directors: 75% (3/4)
◆ there were the following changes to the composition of the Audit Committee:
Audit Committee
Composition as of January 1, 2018 Composition as of December 31, 2018
Chairman Robert Castaigne (independent director) Fabienne Lecorvaisier (independent director)
Members Fabienne Lecorvaisier (independent director) Christian Mulliez Carole Piwnica (independent director)
Emmanuel Babeau (independent director) Christian Mulliez Diane Souza (independent director)
Proportion of independent directors: 75% (3/4) Proportion of independent directors: 75% (3/4)
SANOFI / FORM 20-F 2018 183

ITEM 6. DIRECTORS, SENIOR MANAGEMENT AND EMPLOYEES
◆ there were no changes in the composition of the other Committees, but there have been changes to the remit of the Appointments and Governance Committee (renamed the Appointments, Governance and CSR Committee effective March 8, 2019):
Compensation Committee Appointments, Governance and CSR Committee
Chairman Patrick Kron (independent director) Serge Weinberg (independent director)
Members Claudie Haigneré (independent director) Christian Mulliez Diane Souza (independent director)
Claudie Haigneré (independent director) Patrick Kron (independent director)
Proportion of independent directors: 75% (3/4) Proportion of independent directors: 100% (3/3)
Strategy Committee
Chairman Serge Weinberg (independent director)
Members Olivier Brandicourt Laurent Attal Patrick Kron (independent director)
Proportion of independent directors: 50% (2/4)
Audit Committee
Three members of the Audit Committee qualify as independent pursuant to the criteria adopted by the Board of Directors: Fabienne Lecorvaisier, Emmanuel Babeau and Diane Souza.
All four members of the Committee have financial or accounting expertise as a consequence of their education and professional experience as reflected in their biographies. Furthermore, they are deemed to be financial experts as defined by the Sarbanes-Oxley Act and by Article L. 823-19 of the French Commercial Code. See “Item 16A. Audit Committee Financial Expert”.
The Audit Committee met six times in 2018, including prior to the meetings of the Board of Directors during which the financial statements were approved. In addition to the statutory auditors, the principal financial officers, the Senior Vice President Group Internal Audit and other members of the senior management team attended meetings of the Audit Committee, in particular when risk exposure and off-balance-sheet commitments were discussed.
The Committee members had a very good attendance record, with an overall attendance rate of 92%. Individual attendance rates varied between 67% and 100%.
The statutory auditors attend all meetings of the Audit Committee; they presented their opinions on the annual and half-year financial statements at the Committee meetings of February 2 and July 26, 2018, respectively.
In 2018, the main activities of the Audit Committee related to:
◆ preliminary review of the individual company and consolidated financial statements for the 2018 financial year, review of the individual company and consolidated financial statements for the first half of 2018, review of the consolidated financial statements for the first three quarters of 2018, review of the draft press releases and analyst presentations relating to the publication of such financial statements;
◆ Sanofi’s financial position, indebtedness and liquidity;
◆ review of the work of the Internal Control function and evaluation of that work for 2017 as certified by the statutory auditors pursuant to Section 404 of the Sarbanes-Oxley Act, and examination of the 2017 Annual Report on Form 20-F;
◆ reporting on guarantees;
◆ the principal risks (risk management and risk profiles) facing Sanofi including a report of the Risk Committee, impairment testing of goodwill, a review of whistleblowing and material compliance investigations, a review of tax risks and deferred tax assets and changes in tax legislation, a review of material litigation, and an update on pension funds and actuarial assumptions;
◆ conclusions of Sanofi senior management on internal control procedures, the Board of Directors’ Management Report, and the description of risk factors contained in the French-language Document de Référence and the Annual Report on form 20-F for 2017;
◆ assessment of fulfilment of the performance conditions of the 2015 equity-based compensation plans;
◆ update on cyber-security;
◆ coordination of work between internal audit and internal control;
◆ progress report on the ERP Global Shift project;
◆ report on internal audit;
◆ review of the draft financial resolutions for the May 2, 2018 Shareholders’ Annual General Meeting;
◆ presentation of the plan to bring Sanofi into line with the European General Data Protection Regulation;
◆ update on the anti-corruption measures in the French “Sapin II” law;
◆ presentation of the 2019 budget; and
184 SANOFI / FORM 20-F 2018
ITEM 6. DIRECTORS, SENIOR MANAGEMENT AND EMPLOYEES
◆ the audit program, allocation of work and fees between the statutory auditors, and the budget for services other than statutory audit (audit-related services, tax, and other services).
The Committee did not use external consultants in 2018.
Compensation Committee
Of the four members of the Compensation Committee, three are deemed to be independent: Patrick Kron, Claudie Haigneré and Diane Souza.
The Compensation Committee met four times in 2018.
The Committee members have an exemplary attendance record, with all members having an attendance rate of 100%.
When the Committee discusses the compensation policy for members of senior management who are not corporate officers, i.e. the members of the Executive Committee, the Committee invites the Chief Executive Officer to attend.
In 2018, the main activities of the Compensation Committee related to:
◆ fixed and variable compensation of executive officers (Chief Executive Officer and Chairman of the Board);
◆ the 2017 and 2018 fixed and variable compensation of the members of the Executive Committee;
◆ setting the amount of directors’ attendance fees for 2017, reviewing the expenses of corporate officers for 2017, and principles for allocating directors’ attendance fees for 2018;
◆ review of the disclosures about compensation contained in the corporate governance section of the 2017 French-language Document de Référence and the Annual Report on form 20-F;
◆ implementation of the equity-based compensation policy, including both stock options and performance shares, which was discussed at more than one meeting;
◆ review of draft resolutions on compensation to be submitted to the shareholders in 2018;
◆ launch of an employee share ownership plan in June 2018, follow-up report on implementation of the 2017 plan, and consideration of the next plan;
◆ analysis of the impact of the Ablynx and Bioverativ acquisitions on the performance criteria of existing equity-based compensation plans;
◆ the governance roadshow campaign targeted at the main investors in Sanofi, and an analysis of the policies adopted by proxy advisors;
◆ monitoring of developments related to compensation (say on pay, executive pay ratio, performance indicators); and
◆ the top-up defined-benefit pension plan of the Chief Executive Officer; and
◆ the expenses of corporate officers.
The Committee did not use external consultants in 2018.
Appointments and Governance Committee (Renamed Appointments, Governance and CSR Committee effective March 8, 2019)
All three members of the Committee are deemed to be independent.
The Committee met three times in 2018.
The Committee members have an exemplary attendance record, with all members having an attendance rate of 100%.
In 2018, the main activities of the Appointments and Governance Committee related to:
◆ succession planning;
◆ summary of the 2017 Board evaluation, and implementation of the 2018 evaluation of the work of the Board and its Committees (conducted with assistance from an external consultant, under the direction of the Committee);
◆ review of the Board of Directors Management Report, and the governance section of the 2017 French-language Document de Référence and Annual Report on Form 20-F;
◆ changes in the composition of the Board and its Committees, director independence, proposed reappointments of directors, and recruitment of a new director;
◆ revisions to the AFEP-MEDEF Code;
◆ the creation of the Scientific Committee;
◆ revisions to the Board Charter; and
◆ the governance roadshow campaign targeted at the main investors in Sanofi, and an analysis of the policies adopted by proxy advisors.
The Committee used external consultants in 2018, for the evaluation of the Board and its Committees and for succession planning.
At its meeting of March 8, 2019, the Board of Directors decided to rename this committee the Governance and CSR Committee, and to add the following roles to the Committee’s remit:
◆ review and monitor the Company’s corporate social responsibility (CSR) commitments and orientations, assess the extent to which they meet stakeholder expectations, and more generally ensure that CSR issues are taken into account when developing and implementing corporate strategy;
◆ review drafts of the Company’s governance and CSR reports, and more generally ensure that all related disclosures required by applicable legislation have been made;
◆ ensure that regular communication is established with shareholders on corporate governance issues and determine how this is done, without undermining the principle of equality of treatment between shareholders or the collegiate nature of the Board; and
◆ identify and discuss emerging trends in governance and CSR, and ensure that the Company is preparing as well as possible for the challenges specific to its operations and objectives.
SANOFI / FORM 20-F 2018 185
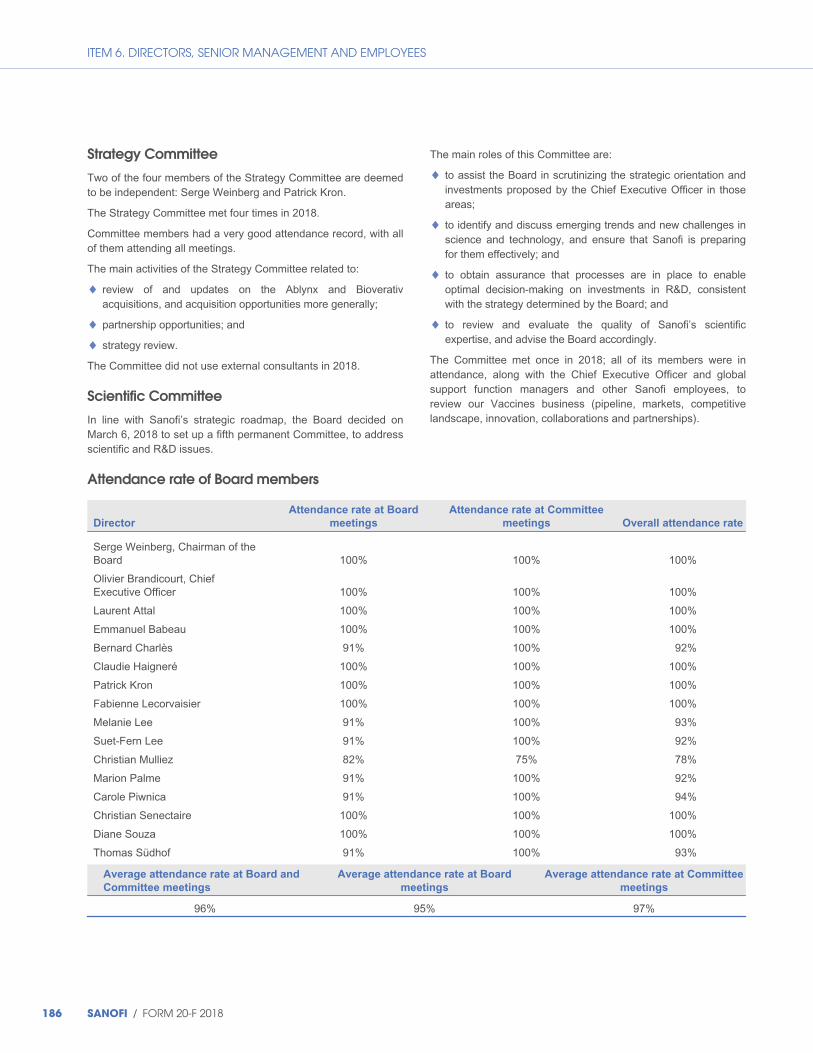
ITEM 6. DIRECTORS, SENIOR MANAGEMENT AND EMPLOYEES
Strategy Committee
Two of the four members of the Strategy Committee are deemed to be independent: Serge Weinberg and Patrick Kron.
The Strategy Committee met four times in 2018.
Committee members had a very good attendance record, with all of them attending all meetings.
The main activities of the Strategy Committee related to:
◆ review of and updates on the Ablynx and Bioverativ acquisitions, and acquisition opportunities more generally;
◆ partnership opportunities; and
◆ strategy review.
The Committee did not use external consultants in 2018.
Scientific Committee
In line with Sanofi’s strategic roadmap, the Board decided on March 6, 2018 to set up a fifth permanent Committee, to address scientific and R&D issues.
The main roles of this Committee are:
◆ to assist the Board in scrutinizing the strategic orientation and investments proposed by the Chief Executive Officer in those areas;
◆ to identify and discuss emerging trends and new challenges in science and technology, and ensure that Sanofi is preparing for them effectively; and
◆ to obtain assurance that processes are in place to enable optimal decision-making on investments in R&D, consistent with the strategy determined by the Board; and
◆ to review and evaluate the quality of Sanofi’s scientific expertise, and advise the Board accordingly.
The Committee met once in 2018; all of its members were in attendance, along with the Chief Executive Officer and global support function managers and other Sanofi employees, to review our Vaccines business (pipeline, markets, competitive landscape, innovation, collaborations and partnerships).
Attendance rate of Board members
Director
Attendance rate at Board
meetings
Attendance rate at Committee
meetings Overall attendance rate
Serge Weinberg, Chairman of the Board 100% 100% 100%
Olivier Brandicourt, Chief Executive Officer 100% 100% 100%
Laurent Attal 100% 100% 100%
Emmanuel Babeau 100% 100% 100%
Bernard Charlès 91% 100% 92%
Claudie Haigneré 100% 100% 100%
Patrick Kron 100% 100% 100%
Fabienne Lecorvaisier 100% 100% 100%
Melanie Lee 91% 100% 93%
Suet-Fern Lee 91% 100% 92%
Christian Mulliez 82% 75% 78%
Marion Palme 91% 100% 92%
Carole Piwnica 91% 100% 94%
Christian Senectaire 100% 100% 100%
Diane Souza 100% 100% 100%
Thomas Südhof 91% 100% 93%
Average attendance rate at Board and
Committee meetings
Average attendance rate at Board
meetings
Average attendance rate at Committee
meetings
96% 95% 97%
186 SANOFI / FORM 20-F 2018
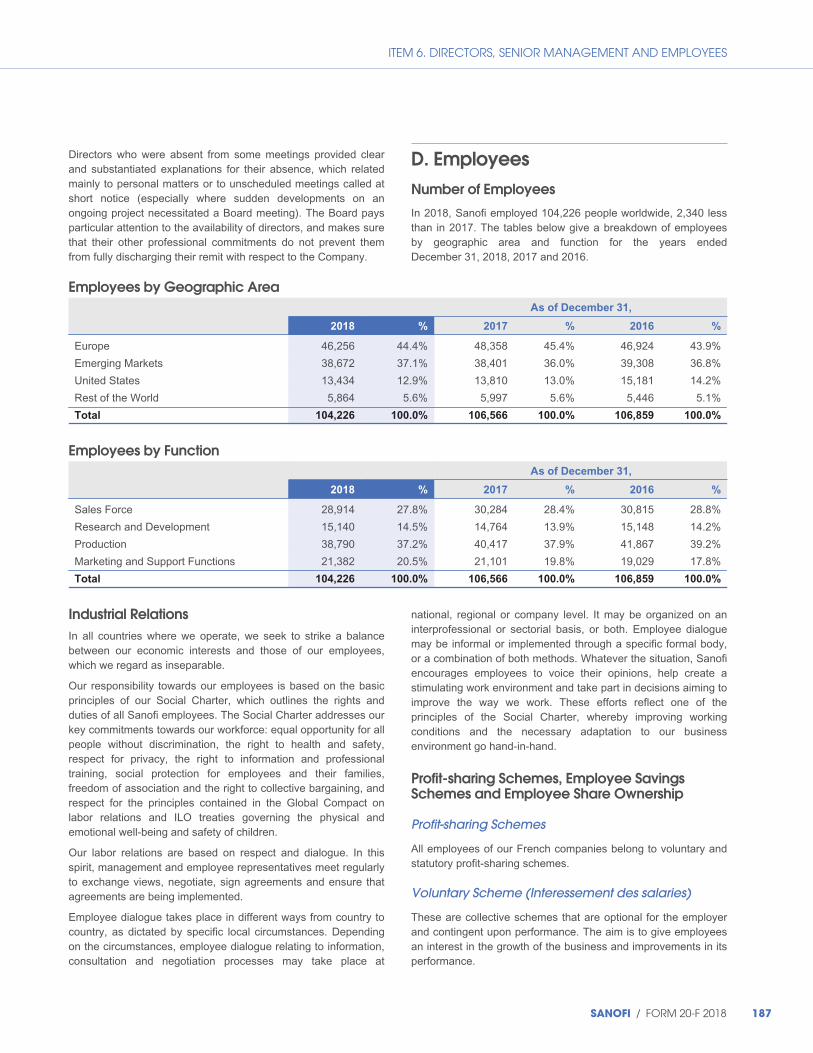
ITEM 6. DIRECTORS, SENIOR MANAGEMENT AND EMPLOYEES
Directors who were absent from some meetings provided clear and substantiated explanations for their absence, which related mainly to personal matters or to unscheduled meetings called at short notice (especially where sudden developments on an ongoing project necessitated a Board meeting). The Board pays particular attention to the availability of directors, and makes sure that their other professional commitments do not prevent them from fully discharging their remit with respect to the Company.
D. Employees Number of Employees
In 2018, Sanofi employed 104,226 people worldwide, 2,340 less than in 2017. The tables below give a breakdown of employees by geographic area and function for the years ended December 31, 2018, 2017 and 2016.
Employees by Geographic Area As of December 31,
2018 % 2017 % 2016 %
Europe 46,256 44.4% 48,358 45.4% 46,924 43.9%
Emerging Markets 38,672 37.1% 38,401 36.0% 39,308 36.8%
United States 13,434 12.9% 13,810 13.0% 15,181 14.2%
Rest of the World 5,864 5.6% 5,997 5.6% 5,446 5.1%
Total 104,226 100.0% 106,566 100.0% 106,859 100.0%
Employees by Function As of December 31,
2018 % 2017 % 2016 %
Sales Force 28,914 27.8% 30,284 28.4% 30,815 28.8%
Research and Development 15,140 14.5% 14,764 13.9% 15,148 14.2%
Production 38,790 37.2% 40,417 37.9% 41,867 39.2%
Marketing and Support Functions 21,382 20.5% 21,101 19.8% 19,029 17.8%
Total 104,226 100.0% 106,566 100.0% 106,859 100.0%
Industrial Relations In all countries where we operate, we seek to strike a balance between our economic interests and those of our employees, which we regard as inseparable.
Our responsibility towards our employees is based on the basic principles of our Social Charter, which outlines the rights and duties of all Sanofi employees. The Social Charter addresses our key commitments towards our workforce: equal opportunity for all people without discrimination, the right to health and safety, respect for privacy, the right to information and professional training, social protection for employees and their families, freedom of association and the right to collective bargaining, and respect for the principles contained in the Global Compact on labor relations and ILO treaties governing the physical and emotional well-being and safety of children.
Our labor relations are based on respect and dialogue. In this spirit, management and employee representatives meet regularly to exchange views, negotiate, sign agreements and ensure that agreements are being implemented.
Employee dialogue takes place in different ways from country to country, as dictated by specific local circumstances. Depending on the circumstances, employee dialogue relating to information, consultation and negotiation processes may take place at
national, regional or company level. It may be organized on an interprofessional or sectorial basis, or both. Employee dialogue may be informal or implemented through a specific formal body, or a combination of both methods. Whatever the situation, Sanofi encourages employees to voice their opinions, help create a stimulating work environment and take part in decisions aiming to improve the way we work. These efforts reflect one of the principles of the Social Charter, whereby improving working conditions and the necessary adaptation to our business environment go hand-in-hand.
Profit-sharing Schemes, Employee Savings Schemes and Employee Share Ownership
Profit-sharing Schemes
All employees of our French companies belong to voluntary and statutory profit-sharing schemes.
Voluntary Scheme (Interessement des salaries)
These are collective schemes that are optional for the employer and contingent upon performance. The aim is to give employees an interest in the growth of the business and improvements in its performance.
SANOFI / FORM 20-F 2018 187

ITEM 6. DIRECTORS, SENIOR MANAGEMENT AND EMPLOYEES
The amount distributed by our French companies during 2018 in respect of voluntary profit-sharing for the year ended December 31, 2017 represented 2.1% of total payroll.
In June 2017, we entered into a new fixed-term statutory profit-sharing agreement for the 2017, 2018 and 2019 financial years. That agreement applies to all employees of our French companies. Under the agreement, Sanofi pays collective variable compensation determined on the basis of the more favorable of (i) growth in consolidated net sales (at constant exchange rates and on a constant structure basis) or (ii) the level of business net income. For each of those criteria, a matrix determines what percentage of total payroll is to be allocated to the scheme. This overall allocation is then reduced by the amount required by law to be transferred to a special profit-sharing reserve. The balance is then distributed between the employees unless the transfer to the reserve exceeds the maximum amount determined under the specified criteria, in which case no profit share is paid to the employees.
Statutory Scheme (Participation des salaries aux résultats de l’entreprise)
This scheme is a French legal obligation for companies with more than 50 employees that made a profit in the previous financial year.
The amount distributed by our French companies during 2018 in respect of the statutory scheme for the year ended December 31, 2017 represented 6.98% of total payroll.
Distribution Formula
In order to favor lower-paid employees, the voluntary and statutory profit-sharing agreements entered into since 2005 split the benefit between those entitled as follows:
◆ 60% prorated on the basis of time spent in the Company’s employment in the year; and
◆ 40% prorated on the basis of gross annual salary during the year, subject to a lower limit equal to the social security ceiling and an upper limit of three times the social security ceiling.
Employee Savings Schemes and Collective Retirement Savings Plan
The employee savings arrangements operated by Sanofi are based on a collective savings scheme (Plan d’Epargne Groupe) and a collective retirement savings scheme (Plan d’Epargne pour la Retraite Collectif). Those schemes reinvest the sums derived from the statutory and voluntary profit-sharing schemes, plus voluntary contributions from employees.
In June 2018, more than 91% of the employees who benefited from the profit-sharing schemes opted to invest in the collective savings scheme, and nearly 80% opted to invest in the collective retirement savings scheme.
Sanofi supplements the amount invested by employees in these schemes by making a top-up contribution.
In 2018, €121.3 million and €58.5 million were invested in the collective savings scheme and the collective retirement savings scheme respectively through the voluntary and statutory schemes for 2017, and through top-up contributions.
In December 2017, we entered into a new agreement for an indefinite period, setting out revised terms for the top-up contribution to the collective savings scheme and covering all the employees of our French companies.
Employee Share Ownership
As of December 31, 2018, shares held under the collective savings scheme by employees of Sanofi, employees of related companies and former employees amounted to 1.70% of our share capital. For more information about our most recent employee share ownership plan, refer to “Item 10. Additional Information – Changes in Share Capital – Increases in Share Capital”.
E. Share Ownership
Senior Management
Members of the Executive Committee hold shares of our Company amounting in the aggregate to less than 1% of our share capital.
During 2018, 70,951 stock options were exercised by individuals who were members of the Executive Committee when they exercised.
All the plans post-dated the creation of the Executive Committee (sanofi-aventis plan of March 3, 2009, exercise price €45.09; sanofi-aventis plan of March 9, 2011, exercise price €50.48; sanofi-aventis plan of March 5, 2012, exercise price €56.44; and sanofi-aventis plan of March 5, 2014, exercise price €73.48).
Existing Option Plans as of December 31, 2018
As of December 31, 2018, a total of 6,849,573 options were outstanding: 80,671 stock purchase options and 6,768,902 stock subscription options. As of that same date, 5,468,214 options were immediately exercisable: 80,671 stock purchase options and 5,387,543 stock subscription options.
Equity-based compensation, consisting of share subscription option plans and performance share plans, aims to align our employees’ objectives with those of our shareholders and to reinforce the link between our employees and Sanofi. Under French law, awarding such plans falls within the powers of the Board of Directors. Stock options are awarded to employees and executive officers by our Board of Directors on the basis of recommendations from the Compensation Committee.
Granting options is a way of recognizing the grantee’s performance and contribution to the development of Sanofi, and also of securing his or her future commitment.
188 SANOFI / FORM 20-F 2018

ITEM 6. DIRECTORS, SENIOR MANAGEMENT AND EMPLOYEES
For each plan, the Compensation Committee and the Board of Directors assess whether it should take the form of options to subscribe for shares or options to purchase shares, based on criteria that are primarily financial.
A list of grantees is proposed by the Chief Executive Officer to the Compensation Committee, which reviews the list and then submits it to the Board of Directors, which takes the decision to grant the options. The Board of Directors also sets the terms for the exercise of the options (including the exercise price) and the lock-up period. The exercise price never incorporates a discount, and is at least equal to the average of the quoted market prices on the 20 trading days preceding the date of grant. Stock option plans invariably specify a lock-up period of four years and a total duration of ten years.
In 2011, the Board of Directors made substantial changes to our equity-based compensation policy. To limit the dilutive effect on our shareholders, the Board of Directors decided to primarily award performance shares, except for a limited number of high-
level executives who may continue to receive options. Under this policy, regardless of the identity of the grantee, any award of options or performance shares was fully contingent upon performance targets being achieved over three financial years.
Since 2018, only the Chief Executive Officer continues to be granted stock options. Consequently, apart from the 220,000 options awarded to Olivier Brandicourt, the Board did not award any stock options at its meeting of May 2, 2018.
The number of options awarded to the Chief Executive Officer in 2018 represents 3.52% of the total limit approved by the Shareholders’ Annual General Meeting of May 4, 2016 (0.5% of our share capital) and 100% of the total award to all beneficiaries made on May 2, 2018.
A new voluntary profit-sharing agreement was signed in June 2017 which gives all of our employees an interest in Sanofi’s performance (for more details refer to “– Profit-Sharing Schemes, Employee Savings Schemes and Employee Share Ownership”, above).
Share Purchase Option Plans
Source
Date ofshareholder
authorization Date of
grant
Number of
optionsinitiallygranted
- tocorporateofficers(a)
- to the 10employees
awarded themost options(b)
Start dateof exercise
period Expiry
date
Exerciseprice
(€)
Numberof shares
subscribedas of
12/31/2018
Number ofoptions
canceledas of
12/31/2018(c)
Number ofoptions
outstanding
Synthélabo 06/23/98 03/30/99 716,040 0 176,800 03/31/04 03/30/19 38.08 629,649 5,720 80,671
(a) Comprises the Chairman & Chief Executive Officer, the Chief Executive Officer, and any Deputy Chief Executive Officers in office at the date of grant. (b) In post at the date of grant.
Share Subscription Option Plans
Source
Date ofshareholder
authorization Date of
grant
Number of
optionsinitiallygranted
- tocorporateofficers(a)
- to the 10employees
awarded themost options(b)
Start dateof exercise
period Expiry
date
Exerciseprice
(€)
Numberof shares
subscribedas of
12/31/2018
Number ofoptions
canceledas of
12/31/2018(c)
Number ofoptions
outstanding
Sanofi-aventis 05/31/07 03/02/09 7,736,480 250,000 655,000 03/04/13 03/01/19 45.09 6,078,643 639,870 1,021,002 Sanofi-aventis 04/17/09 03/01/10 7,316,355 0 665,000 03/03/14 02/28/20 54.12 4,353,570 685,695 2,282,300 Sanofi-aventis 04/17/09 03/01/10 805,000 275,000 805,000 03/03/14 02/28/20 54.12 625,000 50,000 130,000Sanofi-aventis 04/17/09 03/09/11 574,500 0 395,000 03/10/15 03/09/21 50.48 383,529 35,454 155,517Sanofi-aventis 04/17/09 03/09/11 300,000 300,000 0 03/10/15 03/09/21 50.48 292,200 7,800 0Sanofi 05/06/11 03/05/12 574,050 0 274,500 03/06/16 03/05/22 56.44 187,539 95,021 291,490Sanofi 05/06/11 03/05/12 240,000 240,000 0 03/06/16 03/05/22 56.44 0 35,280 204,720Sanofi 05/06/11 03/05/13 548,725 0 261,000 03/06/17 03/05/23 72.19 110,839 108,607 329,279Sanofi 05/06/11 03/05/13 240,000 240,000 0 03/06/17 03/05/23 72.19 0 64,080 175,920Sanofi 05/03/13 03/05/14 769,250 0 364,500 03/06/18 03/05/24 73.48 63,500 101,875 603,875Sanofi 05/03/13 03/05/14 240,000 240,000 0 03/06/18 03/05/24 73.48 0 46,560 193,440Sanofi 05/03/13 06/24/15 12,500 0 12,500 06/25/19 06/24/25 89.38 0 5,000 7,500Sanofi 05/03/13 06/24/15 202,500 0 202,500 06/25/19 06/24/25 89.38 0 0 202,500Sanofi 05/03/13 06/24/15 220,000 220,000 0 06/25/19 06/24/25 89.38 0 41,536 178,464Sanofi 05/04/16 05/04/16 17,750 0 17,750 05/05/20 05/04/26 75.90 0 4,750 13,000Sanofi 05/04/16 05/04/16 165,000 0 165,000 05/05/20 05/04/26 75.90 0 0 165,000Sanofi 05/04/16 05/04/16 220,000 220,000 0 05/05/20 05/04/26 75.90 0 0 220,000Sanofi 05/10/17 05/10/17 158,040 0 157,140 05/11/21 05/10/27 88.97 0 3,145 154,895Sanofi 05/10/17 05/10/17 220,000 220,000 0 05/11/21 05/10/27 88.97 0 0 220,000Sanofi 05/02/18 05/02/18 220,000 220,000 0 05/03/22 05/03/28 65.84 0 0 220,000
(a) Comprises the Chairman & Chief Executive Officer, the Chief Executive Officer, and any Deputy Chief Executive Officers in office at the date of grant. (b) In post at the date of grant. (c) Includes 255,176 options canceled due to partial non-fulfilment of performance conditions.
SANOFI / FORM 20-F 2018 189
ITEM 6. DIRECTORS, SENIOR MANAGEMENT AND EMPLOYEES
The main characteristics of our stock options are also described in Note D.15.8. to our consolidated financial statements, included in Item 18 of this annual report.
Existing Restricted Share Plans as of December 31, 2018
Since 2009, the Board of Directors has awarded shares to certain employees in order to give them a direct stake in our future and performances via trends in the share price, as a partial substitute for the granting of stock options.
Shares are awarded to employees on the basis of a list submitted to the Compensation Committee. This Committee then submits the list to the Board of Directors, which decides whether to award the shares. The Board of Directors sets the continuing employment conditions to which vesting is subject, and any lock-up conditions for the shares.
In 2011, the Board of Directors made substantial changes to our equity-based compensation policy. To limit the dilutive effect on our shareholders, the Board of Directors decided to primarily award performance shares, except for a limited number of high-level executives who could continue to receive options.
Since 2018, awards to senior executives have consisted solely of performance shares; only the Chief Executive Officer continues to be awarded stock options as well. Under this policy, any award of performance shares is fully contingent upon performance targets being achieved over three financial years, regardless of the identity of the grantee.
Our share plans have a three-year vesting period, with no lock-up period.
At its meeting of May 2, 2018, the Board of Directors awarded two plans, in addition to the plan awarded to the Chief Executive Officer:
◆ a “France” plan, under which 2,329 beneficiaries were awarded a total of 1,513,074 shares; and
◆ an “International” plan, under which 4,903 beneficiaries were awarded a total of 2,827,142 shares.
The entire award is contingent upon the same criteria, based on business net income(1) and return on assets (ROA), as the award made to members of the Executive Committee. The attainment levels are also the same as for the awards made to members of the Executive Committee. Vesting is subject to a non-compete clause.
The number of performance shares awarded to the Chief Executive Officer in 2018 represents 0.27% of the total limit approved by the Shareholders’ Annual General Meeting of May 4, 2016 (1.5% of the share capital) and 1.14% of the total amount awarded to all beneficiaries on May 2, 2018.
In addition, at its meeting of July 30, 2018, the Board of Directors awarded a plan dedicated to Ablynx employees under which 152 beneficiaries were awarded a total of 141,669 shares.
The entire award is contingent upon a performance target of return on assets (ROA), calculated over a three-year period comprising the 2018, 2019 and 2020 financial years. The attainment level is the same as for the awards decided on May 2, 2018. Vesting is subject to a non-compete clause
The 2018 awards represent a dilution of approximately 0.35% of our undiluted share capital as of December 31, 2018.
Not all of our employees were awarded performance shares, but a new voluntary profit-sharing agreement was signed in June 2017 which gives all of our employees an interest in Sanofi’s performance (for more details refer to “– Profit-Sharing Schemes, Employee Savings Schemes and Employee Share Ownership”, above).
(1) For a definition, see “– Item 5 – Operating and Financial Review and Prospects – Business Net Income”.
190 SANOFI / FORM 20-F 2018
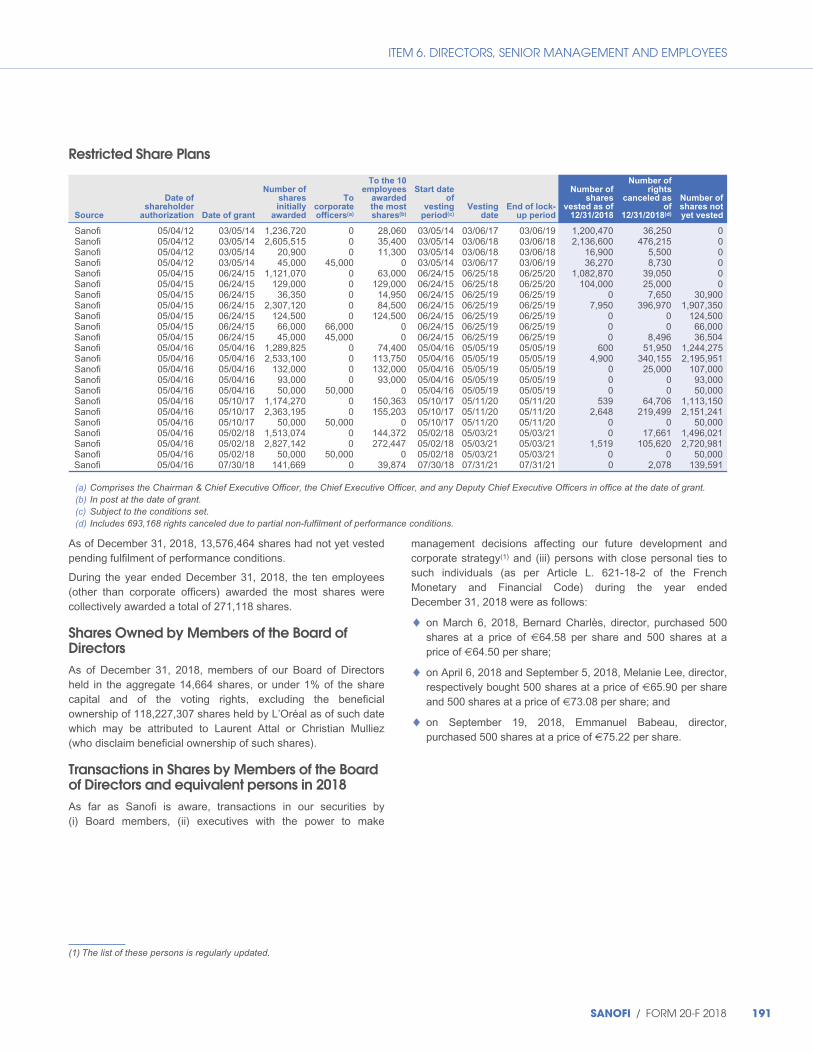
ITEM 6. DIRECTORS, SENIOR MANAGEMENT AND EMPLOYEES
Restricted Share Plans
To the 10 Number of Number of employees Start date Number of rights
Date of shares To awarded of shares canceled as Number of shareholder initially corporate the most vesting Vesting End of lock- vested as of of shares not
Source authorization Date of grant awarded officers(a) shares(b) period(c) date up period 12/31/2018 12/31/2018(d) yet vested
Sanofi 05/04/12 03/05/14 1,236,720 0 28,060 03/05/14 03/06/17 03/06/19 1,200,470 36,250 0Sanofi 05/04/12 03/05/14 2,605,515 0 35,400 03/05/14 03/06/18 03/06/18 2,136,600 476,215 0Sanofi 05/04/12 03/05/14 20,900 0 11,300 03/05/14 03/06/18 03/06/18 16,900 5,500 0Sanofi 05/04/12 03/05/14 45,000 45,000 0 03/05/14 03/06/17 03/06/19 36,270 8,730 0Sanofi 05/04/15 06/24/15 1,121,070 0 63,000 06/24/15 06/25/18 06/25/20 1,082,870 39,050 0Sanofi 05/04/15 06/24/15 129,000 0 129,000 06/24/15 06/25/18 06/25/20 104,000 25,000 0Sanofi 05/04/15 06/24/15 36,350 0 14,950 06/24/15 06/25/19 06/25/19 0 7,650 30,900Sanofi 05/04/15 06/24/15 2,307,120 0 84,500 06/24/15 06/25/19 06/25/19 7,950 396,970 1,907,350Sanofi 05/04/15 06/24/15 124,500 0 124,500 06/24/15 06/25/19 06/25/19 0 0 124,500Sanofi 05/04/15 06/24/15 66,000 66,000 0 06/24/15 06/25/19 06/25/19 0 0 66,000Sanofi 05/04/15 06/24/15 45,000 45,000 0 06/24/15 06/25/19 06/25/19 0 8,496 36,504Sanofi 05/04/16 05/04/16 1,289,825 0 74,400 05/04/16 05/05/19 05/05/19 600 51,950 1,244,275Sanofi 05/04/16 05/04/16 2,533,100 0 113,750 05/04/16 05/05/19 05/05/19 4,900 340,155 2,195,951Sanofi 05/04/16 05/04/16 132,000 0 132,000 05/04/16 05/05/19 05/05/19 0 25,000 107,000Sanofi 05/04/16 05/04/16 93,000 0 93,000 05/04/16 05/05/19 05/05/19 0 0 93,000Sanofi 05/04/16 05/04/16 50,000 50,000 0 05/04/16 05/05/19 05/05/19 0 0 50,000Sanofi 05/04/16 05/10/17 1,174,270 0 150,363 05/10/17 05/11/20 05/11/20 539 64,706 1,113,150Sanofi 05/04/16 05/10/17 2,363,195 0 155,203 05/10/17 05/11/20 05/11/20 2,648 219,499 2,151,241Sanofi 05/04/16 05/10/17 50,000 50,000 0 05/10/17 05/11/20 05/11/20 0 0 50,000Sanofi 05/04/16 05/02/18 1,513,074 0 144,372 05/02/18 05/03/21 05/03/21 0 17,661 1,496,021Sanofi 05/04/16 05/02/18 2,827,142 0 272,447 05/02/18 05/03/21 05/03/21 1,519 105,620 2,720,981Sanofi 05/04/16 05/02/18 50,000 50,000 0 05/02/18 05/03/21 05/03/21 0 0 50,000Sanofi 05/04/16 07/30/18 141,669 0 39,874 07/30/18 07/31/21 07/31/21 0 2,078 139,591
(a) Comprises the Chairman & Chief Executive Officer, the Chief Executive Officer, and any Deputy Chief Executive Officers in office at the date of grant. (b) In post at the date of grant. (c) Subject to the conditions set. (d) Includes 693,168 rights canceled due to partial non-fulfilment of performance conditions.
As of December 31, 2018, 13,576,464 shares had not yet vested pending fulfilment of performance conditions.
During the year ended December 31, 2018, the ten employees (other than corporate officers) awarded the most shares were collectively awarded a total of 271,118 shares.
Shares Owned by Members of the Board of Directors As of December 31, 2018, members of our Board of Directors held in the aggregate 14,664 shares, or under 1% of the share capital and of the voting rights, excluding the beneficial ownership of 118,227,307 shares held by L’Oréal as of such date which may be attributed to Laurent Attal or Christian Mulliez (who disclaim beneficial ownership of such shares).
Transactions in Shares by Members of the Board of Directors and equivalent persons in 2018 As far as Sanofi is aware, transactions in our securities by (i) Board members, (ii) executives with the power to make
management decisions affecting our future development and corporate strategy(1) and (iii) persons with close personal ties to such individuals (as per Article L. 621-18-2 of the French Monetary and Financial Code) during the year ended December 31, 2018 were as follows:
◆ on March 6, 2018, Bernard Charlès, director, purchased 500 shares at a price of €64.58 per share and 500 shares at a price of €64.50 per share;
◆ on April 6, 2018 and September 5, 2018, Melanie Lee, director, respectively bought 500 shares at a price of €65.90 per share and 500 shares at a price of €73.08 per share; and
◆ on September 19, 2018, Emmanuel Babeau, director, purchased 500 shares at a price of €75.22 per share.
(1) The list of these persons is regularly updated.
SANOFI / FORM 20-F 2018 191
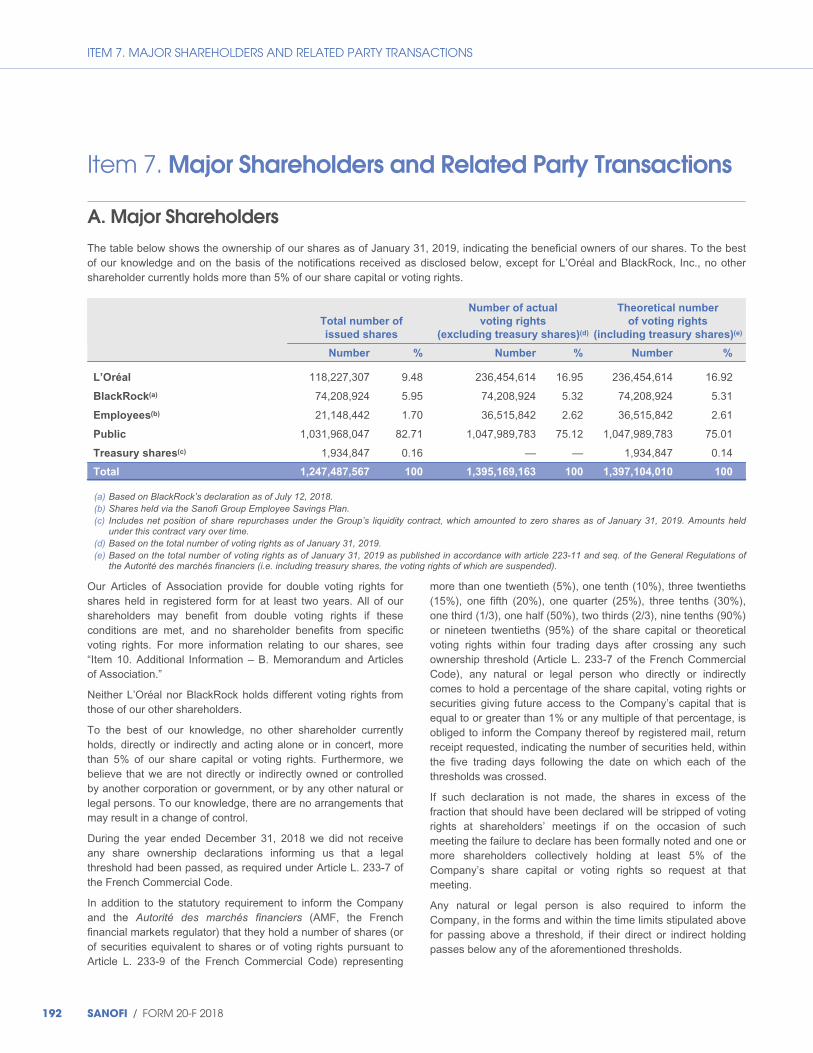
ITEM 7. MAJOR SHAREHOLDERS AND RELATED PARTY TRANSACTIONS
Item 7. Major Shareholders and Related Party Transactions
A. Major Shareholders The table below shows the ownership of our shares as of January 31, 2019, indicating the beneficial owners of our shares. To the best of our knowledge and on the basis of the notifications received as disclosed below, except for L’Oréal and BlackRock, Inc., no other shareholder currently holds more than 5% of our share capital or voting rights.
Total number of
issued shares
Number of actual
voting rights
(excluding treasury shares)(d)
Theoretical number
of voting rights
(including treasury shares)(e)
Number % Number % Number %
L’Oréal 118,227,307 9.48 236,454,614 16.95 236,454,614 16.92
BlackRock(a) 74,208,924 5.95 74,208,924 5.32 74,208,924 5.31
Employees(b) 21,148,442 1.70 36,515,842 2.62 36,515,842 2.61
Public 1,031,968,047 82.71 1,047,989,783 75.12 1,047,989,783 75.01
Treasury shares(c) 1,934,847 0.16 — — 1,934,847 0.14
Total 1,247,487,567 100 1,395,169,163 100 1,397,104,010 100
(a) Based on BlackRock’s declaration as of July 12, 2018. (b) Shares held via the Sanofi Group Employee Savings Plan. (c) Includes net position of share repurchases under the Group’s liquidity contract, which amounted to zero shares as of January 31, 2019. Amounts held
under this contract vary over time. (d) Based on the total number of voting rights as of January 31, 2019. (e) Based on the total number of voting rights as of January 31, 2019 as published in accordance with article 223-11 and seq. of the General Regulations of
the Autorité des marchés financiers (i.e. including treasury shares, the voting rights of which are suspended).
Our Articles of Association provide for double voting rights for shares held in registered form for at least two years. All of our shareholders may benefit from double voting rights if these conditions are met, and no shareholder benefits from specific voting rights. For more information relating to our shares, see “Item 10. Additional Information – B. Memorandum and Articles of Association.”
Neither L’Oréal nor BlackRock holds different voting rights from those of our other shareholders.
To the best of our knowledge, no other shareholder currently holds, directly or indirectly and acting alone or in concert, more than 5% of our share capital or voting rights. Furthermore, we believe that we are not directly or indirectly owned or controlled by another corporation or government, or by any other natural or legal persons. To our knowledge, there are no arrangements that may result in a change of control.
During the year ended December 31, 2018 we did not receive any share ownership declarations informing us that a legal threshold had been passed, as required under Article L. 233-7 of the French Commercial Code.
In addition to the statutory requirement to inform the Company and the Autorité des marchés financiers (AMF, the French financial markets regulator) that they hold a number of shares (or of securities equivalent to shares or of voting rights pursuant to Article L. 233-9 of the French Commercial Code) representing
more than one twentieth (5%), one tenth (10%), three twentieths (15%), one fifth (20%), one quarter (25%), three tenths (30%), one third (1/3), one half (50%), two thirds (2/3), nine tenths (90%) or nineteen twentieths (95%) of the share capital or theoretical voting rights within four trading days after crossing any such ownership threshold (Article L. 233-7 of the French Commercial Code), any natural or legal person who directly or indirectly comes to hold a percentage of the share capital, voting rights or securities giving future access to the Company’s capital that is equal to or greater than 1% or any multiple of that percentage, is obliged to inform the Company thereof by registered mail, return receipt requested, indicating the number of securities held, within the five trading days following the date on which each of the thresholds was crossed.
If such declaration is not made, the shares in excess of the fraction that should have been declared will be stripped of voting rights at shareholders’ meetings if on the occasion of such meeting the failure to declare has been formally noted and one or more shareholders collectively holding at least 5% of the Company’s share capital or voting rights so request at that meeting.
Any natural or legal person is also required to inform the Company, in the forms and within the time limits stipulated above for passing above a threshold, if their direct or indirect holding passes below any of the aforementioned thresholds.
192 SANOFI / FORM 20-F 2018
ITEM 7. MAJOR SHAREHOLDERS AND RELATED PARTY TRANSACTIONS
Since January 1, 2019 we have not received any share ownership declaration.
As of December 31, 2018, individual shareholders (including employees of Sanofi and its subsidiaries, as well as retired employees holding shares via the Sanofi Group Employee Savings Plan) held approximately 7.00% of our share capital. Institutional shareholders (excluding L’Oréal) held approximately 76.64% of our share capital. Such shareholders are primarily American (26.65%), French (15.11%) and British (15.22%). German institutions held 4.01% of our share capital, Swiss institutions held 2.16%, institutions from other European countries held 7.09% and Canadian institutions held 1.84% of our share capital. Other international institutional investors (excluding those from Europe and North America) held approximately 4.56% of our share capital. In France, our home country, we have 178 identified institutional shareholders of record. In the United States, our host country, we have 601 identified institutional shareholders of record and 506 identified ADS holders of record.
(Source: a survey conducted by Euroclear France as of December 31, 2018, and internal information).
Shareholders’ Agreement
We are unaware of any shareholders’ agreement currently in force.
B. Related Party Transactions
See Note D.33. to our consolidated financial statements included at Item 18 of this annual report.
C. Interests of Experts and Counsel
N/A
SANOFI / FORM 20-F 2018 193

ITEM 8. FINANCIAL INFORMATION
Item 8. Financial Information
A. Consolidated Financial Statements and Other Financial Information Our consolidated financial statements as of and for the years ended December 31, 2018, 2017 and 2016 are included in this annual report at “Item 18. Financial Statements.”
Dividends on Ordinary Shares
We paid annual dividends for the years ended December 31, 2014, 2015, 2016 and 2017 and our shareholders will be asked
to approve the payment of an annual dividend of €3.07 per share for the 2018 fiscal year at our next annual shareholders’ meeting. If approved, this dividend will be paid on May 13, 2019.
We expect that we will continue to pay regular dividends based on our financial condition and results of operations. The proposed 2018 dividend equates to a distribution of 56.1% of our business net income. For information on the non-GAAP financial measure “business earnings per share” see “Item 5. Operating and Financial Review and Prospects – Business Net Income.”
The following table sets forth information with respect to the dividends paid by our Company in respect of the 2014, 2015, 2016 and 2017 fiscal years and the dividend that will be proposed for approval by our shareholders in respect of the 2018 fiscal year at our May 13, 2019 shareholders’ meeting.
2018(a) 2017 2016 2015 2014
Dividend per Share (in €) 3.07 3.03 2.96 2.93 2.85
Dividend per Share (in $)(b) 3.52 3.63 3.12 3.19 3.46
(a) Proposal, subject to shareholder approval. (b) Based on the relevant year-end exchange rate.
The declaration, amount and payment of any future dividends will be determined by majority vote of the holders of our shares at an ordinary general meeting, following the recommendation of our Board of Directors. Any declaration will depend on our results of operations, financial condition, cash requirements, future prospects and other factors deemed relevant by our shareholders. Accordingly, we cannot assure you that we will pay dividends in the future on a continuous and regular basis. Under French law, we are required to pay dividends approved by an ordinary general meeting of shareholders within nine months following the meeting at which they are approved.
Disclosure pursuant to Section 13(r) of the United States Exchange Act of 1934
Sanofi conducts limited business relating to human health products with Iran, which contributed well under 1% of Sanofi’s consolidated net sales in 2018. These activities, which are not financially material to Sanofi, are being disclosed pursuant to Section 13(r) of the United States Exchange Act of 1934, as amended. Sales consisted of bulk and branded pharmaceuticals, and vaccines. US affiliates of Sanofi, or foreign affiliates controlled by US affiliates of Sanofi, are either not involved in these activities or operate under humanitarian licenses issued by the US Treasury Department’s Office of Foreign Assets Control. Limited business amounting to approximately €6.64 million in gross revenues has been conducted by non-US subsidiaries of
Sanofi not requiring an OFAC license with entities such as public hospitals or distributors tied to the Ministry of Health. It is estimated that this activity contributed no more than €3.8 million to net profits. A representative office in Tehran incurs incidental expenses from state-owned utilities.
In January 2016, Sanofi and the Iran Food and Drug Administration, affiliated with the Ministry of Health and Medical Education of the Islamic Republic of Iran, signed a Memorandum of Cooperation (MoC) regarding (i) potential future projects to reinforce current partnerships with reputable Iranian manufacturers (in particular to enhance industrial quality standards), (ii) collaborating with the Ministry of Health on programs for the prevention and control of certain chronic and non-communicable diseases (in particular diabetes) and (iii) potential future collaboration on epidemiological studies.
Following the MOC, Sanofi and the Iranian company Barkat Pharmed Co. entered into a non-binding letter of intent on June 16, 2017 to evaluate the possibility of a transaction involving the creation of a joint venture, or other possible forms of transaction, the business purpose of which would be the manufacturing and distribution of pharmaceutical products in Iran. The MoC and the letter of intent did not generate any revenue or net profit in 2018.
Sanofi has determined that its activities are compliant with applicable law. In light of the nature of the activities concerned, Sanofi and its affiliates intend to continue their activities in Iran.
194 SANOFI / FORM 20-F 2018
ITEM 8. FINANCIAL INFORMATION
Information on Legal or Arbitration Proceedings
This Item 8 incorporates by reference the disclosures found in Note D.22. to the consolidated financial statements at Item 18 of this annual report; material updates thereto as of the date of this annual report are found below under the heading “– B. Significant Changes – Updates to Note D.22”.
Sanofi and its subsidiaries are involved in litigation, arbitration and other legal proceedings. These proceedings typically are related to product liability claims, intellectual property rights (particularly claims against generic companies seeking to limit the patent protection of Sanofi products), competition law and trade practices, commercial claims, employment and wrongful discharge claims, tax assessment claims, waste disposal and pollution claims, and claims under warranties or indemnification arrangements relating to business divestitures. As a result, we may become subject to substantial liabilities that may not be covered by insurance and could affect our business and reputation. While we do not currently believe that any of these legal proceedings will have a material adverse effect on our financial position, litigation is inherently unpredictable. As a consequence, we may in the future incur judgments or enter into settlements of claims that could have a material adverse effect on results of operations, cash flows and/or our reputation.
Patents
Co-Aprovel® Patent Infringement Actions (Europe)
Following a Court of Justice of the European Union (CJEU) decision of December 12, 2013 that declared the Co-Aprovel® Supplemental Protection Certificate invalid, generic companies (whose products were withdrawn from the market due to national preliminary injunctions or cross-undertakings) filed damages claims against Sanofi in several countries.
In 2018, all pending damages claims in Europe were settled.
Lantus® Merck Patent Litigation (United States)
In September 2016, several Sanofi entities filed a patent infringement suit against Merck Sharp & Dohme Corp. (“Merck”) in the United States District Court for the District of Delaware. In its suit, Sanofi alleged infringement of several patents. The suit was triggered by a notification received from Merck in early August 2016, in which Merck stated that it had filed an NDA (505(b)(2) New Drug Application) with FDA for an insulin glargine drug pen product. Merck also stated that its NDA included a paragraph IV certification challenging all of the Sanofi patents then listed in the FDA Orange Book for Sanofi’s Lantus® and Lantus® SoloStar® products.
In August 2017, several Sanofi entities filed a patent infringement suit against Merck in the United States District Court for the District of New Jersey. In its suit, Sanofi alleged infringement of two patents. The suit was triggered by a notification received from Merck in late June 2017, in which Merck stated that it had filed an
NDA with the FDA for an insulin glargine drug vial product. Merck also stated that its NDA included a paragraph IV certification challenging all of the Sanofi patents then listed in the FDA Orange Book for Sanofi’s Lantus® and Lantus® SoloStar® products.
Sanofi and Merck jointly filed stipulations asking the New Jersey and Delaware District Courts to dismiss the New Jersey and Delaware patent cases concerning Merck’s proposed insulin glargine pen and vial products. In October and November 2018, the Delaware and New Jersey District Courts ordered the dismissals and thus the Delaware pen patent case and the New Jersey vial patent case are now closed. These dismissals are in response to Merck’s public announcement that it will not commercialize insulin glargine products in the US.
Lantus® Mylan Patent Litigation (United States)
In June 2017, Mylan Pharmaceuticals, Inc. filed petitions for Inter Partes Review (IPR) for US Patent 7,476,652 and 7,713,930 regarding Lantus® with the United States Patent Office Patent Trial and Appeal Board (PTAB). In these petitions, Mylan attacks the validity of all claims of these patents. On December 13, 2017, the PTAB decided to move forward with Mylan’s IPRs for these two patents. In December 2018, the PTAB issued a decision invalidating the claims of the two formulation patents. Sanofi has appealed the adverse PTAB administrative decisions to the Federal Circuit. No schedule has yet been set for the appeals.
On October 24 and 26, 2017, several Sanofi entities filed a patent infringement suit against Mylan N.V., Mylan GmbH, Mylan Inc., and Mylan Pharmaceuticals Inc. (collectively, “Mylan”) in the United States District Courts for the District of New Jersey and Northern District of West Virginia. In its suits, Sanofi alleges infringement of several patents. The suits were triggered by a notification received from Mylan in mid-September 2017, in which Mylan stated that it had filed an NDA with the FDA for an insulin glargine drug pen and vial products. Mylan also stated that its NDA included a paragraph IV certification challenging all of the Sanofi patents then listed in the FDA Orange Book for Sanofi’s Lantus® and Lantus® SoloStar® products. These suits resulted in a stay during which the FDA cannot approve Mylan’s NDA. The 30 month stay is expected to expire on the earlier of (i) March 18, 2020 or (ii) a court decision in favor of Mylan. On February 21, 2018, the West Virginia case was dismissed and the parties are now proceeding only with the New Jersey lawsuit. The parties are currently proceeding with discovery and claim construction. There will be summary judgment briefing beginning around the second quarter of 2019.
On September 10, 2018, Mylan filed 10 petitions asking the U.S. Patent Office Patent Trial and Appeal Board (PTAB) to commence Inter Partes Review (IPR) proceedings of U.S. Patent Nos. 8,603,044, 8,679,069, 8,992,486, 9,526,844, and 9,604,008, challenging the validity of certain claims of these Sanofi patents. Sanofi’s Patent Owner Preliminary Responses are due to be filed on various dates starting in January 2019. The PTAB will determine whether to move forward with IPR proceedings starting by various dates in April 2019.
SANOFI / FORM 20-F 2018 195
ITEM 8. FINANCIAL INFORMATION
Cerdelga® Patent Litigation (United States)
Cerdelga® is covered by four Orange Book listed patents US 6,916,802, US 7,196,205, US 7,253,185, and US 7,615,573. In the fourth quarter of 2018, six different generic manufacturers each separately notified Sanofi-Genzyme that they had filed ANDA applications for Cerdelga® with Paragraph IV certifications challenging the US ‘802, ‘205, ‘185 and ‘573 patents. Sanofi-Genzyme filed suit against each ANDA filer within 45 days of receipt of each notification in the US District Court for the District of Delaware. The associated 30-month stay of FDA approval on each ANDA is expected to expire on the earlier of (i) February 19, 2022 or (ii) a court decision in favor of the generic manufacturer(s).
Government Investigations and Related Litigation
From time to time, subsidiaries of Sanofi are subject to governmental investigations and information requests from regulatory authorities inquiring as to the practices of Sanofi with respect to the sales, marketing, and promotion of its products.
In December 2013, Genzyme entered into a settlement agreement to resolve civil claims arising out of the investigation into promotional practices of Seprafilm® and paid in that respect approximately $23 million. As part of this settlement, and as part of the settlement entered into by Sanofi US in December 2012 relating to civil claims arising out of an investigation into sampling of its former product Hyalgan® for which Sanofi US paid $109 million, the companies entered into a Corporate Integrity Agreement (“CIA”) with the Office of the Inspector General of the United States Department of Health and Human Services in September 2015. Also in September 2015, Genzyme entered into a Deferred Prosecution Agreement (“DPA”) with the US Department of Justice and paid in that respect approximately $33 million to resolve the Seprafilm® matter completely. The DPA expired in September 2017 and the CIA is currently in effect.
In February 2016, Sanofi US received a civil investigative demand from the US Attorney’s Office for the Northern District of Texas requesting documents and information relating to contracts with specialty pharmacies concerning the renal products Renvela® and Renagel® from January 1, 2006 through February 2, 2016. Sanofi US is cooperating with this investigation.
In March 2016, Sanofi US received a civil investigative demand from the US Attorney’s Office for the Southern District of New York requesting documents and information relating to contracts with, services performed by and payments to pharmacy benefit managers (PBMs) regarding Lantus® and Apidra® from January 1, 2006 forward.
In April 2018, a lawsuit was unsealed in the US District Court for the Southern District of New York, alleging violations of the False Claims Act and 29 state-law analogs by Sanofi US and other manufacturer and PBM defendants. The complaint had first been filed on October 6, 2015. It was unsealed after the federal and state governments declined to intervene. In October 2018, the defendants (including Sanofi) moved to dismiss the complaint. In
December 2018, the United States separately moved to dismiss the complaint, over the relator’s objections.
In June 2016, the United States declined to intervene in a False Claims Act action filed in Federal Court in New Jersey regarding the sale and marketing of and variability of response to Plavix®. Sanofi US is defending this action as well as two State Attorney General actions (Hawaii and New Mexico) concerning the sale and marketing of Plavix®.
In December 2016 and January 2017, two putative class actions were filed against Sanofi US and Sanofi GmbH in Federal Court in Massachusetts on behalf of direct-purchasers of Lantus® alleging certain antitrust violations. On January 10, 2018, the District Court of Massachusetts dismissed Plaintiffs’ complaint against Sanofi. The dismissal of Plaintiffs’ entire case was without prejudice. Plaintiffs have appealed.
In January 2017, the Minnesota State Attorney General’s office issued a civil investigative demand calling for the production of documents and information relating to pricing and trade practices for Lantus® and Toujeo®, from January 1, 2008 through present. In October 2018, the State of Minnesota, through its Attorney General, filed a complaint in the District of New Jersey against Sanofi US, Novo Nordisk, and Eli Lilly & Co. The complaint, which was filed as a companion case to existing private litigation captioned “In re Insulin Pricing Litigation”, alleges that the insulin manufacturers paid pharmacy benefit managers rebates in order to increase sales. Sanofi US intends to move to dismiss the complaint.
In March 2017, the Washington State Attorney General’s office issued a civil investigative demand calling for the production of documents and information relating to pricing and trade practices for Sanofi’s injectable insulin products, from January 1, 2005 through present. Sanofi US is cooperating with this investigation.
In April 2018, Sanofi US received a set of interrogatories from the California State Attorney General’s office regarding the 2014-2015 litigations and settlement between Sanofi and Eli Lilly related to Lantus® patents and the launch of Basaglar®. Sanofi US is responding to these interrogatories.
In August 2017, Sanofi US received a civil investigative demand from the US Attorney’s Office for the Southern District of New York requesting documents and information relating to Sanofi US’s certified diabetes educator program during the period from 2007 to the present. In September 2018, the US Attorney’s Office elected to decline intervention in the underlying False Claims Act suit and in February 2019, the Court dismissed the suit without prejudice.
In January 2018, Sanofi US received a subpoena from the US Attorney’s Office for the District of Massachusetts requesting documents and information relating to Sanofi US’s relationship with non-profit organizations that provide assistance to patients taking Sanofi drugs and Sanofi US’s patient assistance programs as well as documents and information relating to the sale and marketing of Aubagio® and Lemtrada®. Sanofi US is cooperating with this investigation.
196 SANOFI / FORM 20-F 2018
ITEM 8. FINANCIAL INFORMATION
In early 2017, four actions were filed against Sanofi US in Federal Court in New Jersey on behalf of a putative class of diabetes patients alleging violations of the Racketeer Influenced and Corrupt Organizations Act (“RICO Act”) and various state unfair/deceptive trade practices statutes in connection with the pricing of Lantus®, Apidra®, and Toujeo®. On December 26, 2017, Plaintiffs filed a consolidated amended complaint, consolidating these four separate actions.
In March 2018, Sanofi filed a motion to dismiss plaintiffs’ second amended complaint in the putative class actions filed against Sanofi US and Sanofi GmbH in Federal Court in Massachusetts on behalf of direct-purchasers of Lantus® alleging certain antitrust violations.
In May 2018, Sanofi US filed a joint motion to dismiss the consolidated amended complaint filed on behalf of a putative class of diabetes patients alleging violations of the Racketeer Influenced and Corrupt Organizations Act (“RICO Act”) and various state unfair/deceptive trade practices statutes in connection with the pricing of Lantus®. In February 2019, the Court dismissed the RICO counts, but allowed many of the state law claims to proceed.
Separately, a case (MSP Recovery Claims, Series LLC) was filed in February 2018 in the New Jersey Federal Court against Sanofi, Novo Nordisk, and Eli Lilly. The plaintiffs are Medicare Secondary Payers (“MSPs”) that say they have been assigned the rights of 75 Medicare Advantage Organizations whose members include diabetes patients. Like the plaintiffs in the New Jersey actions, the MSPs assert RICO claims and state consumer-protection claims (as well as claims for fraud and unjust enrichment) premised on the pricing of the manufacturers’ insulin drugs. The MSPs name Sanofi, Novo Nordisk, and Eli Lilly as defendants. Defendants’ motion to dismiss is fully briefed and awaiting a ruling from the court.
In October 2018, Minnesota filed a complaint in Federal Court in New Jersey that is very similar to the class action pending there. The complaint includes RICO claims against each of the same manufacturers, as well as three claims under Minnesota consumer protection statutes and a claim for unjust enrichment.
In France, in the claim concerning allegations that Sanofi’s communication and promotional practices inhibited the entry on the market of generics of clopidogrel (the active ingredient of Plavix®), the French Antitrust Authority issued its decision on May 14, 2013, imposing on Sanofi a fine of €40.6 million. In December 2014, the Paris Court of Appeals rejected Sanofi’s
appeal and confirmed in totality the decision. Sanofi filed a “pourvoi” with the French Supreme Court (Cour de cassation) in January 2015. As a consequence of the May 2013 ruling, claims were filed by Sandoz and by Teva in 2014 before the Commercial Court of Paris for compensation of their alleged damages: loss of margin and other ancillary damages (legal fees to external counsel, image and reputation). In June and November 2016 respectively, settlement agreements were entered into with Sandoz and Teva. Consequently, they subsequently withdrew their civil claims, jointly and severally. On October 18, 2016, the Supreme Court confirmed the Court of Appeals’ decision. Therefore, the Court of Appeals’ decision became definitive. In September 2017, Sanofi and Sanofi-Aventis France received a summons before the Paris Commercial Court from the French Caisse Nationale d’Assurance Maladie (French Social Security) claiming €115.8 million for their alleged damages.
Sanofi has been engaged in discussions with the US Department of Justice (“DOJ”) and the US Securities and Exchange Commission (“SEC”) regarding allegations that certain subsidiaries outside the United States made improper payments in connection with the sale of pharmaceutical products and whether those payments, if made, fall within the US Foreign Corrupt Practices Act (“FCPA”). Sanofi has voluntarily provided information to the DOJ and the SEC and proactively cooperated in both agencies’ review of the allegations. In February 2018, the DOJ notified Sanofi that it had decided to close its inquiry into the allegations. In September 2018, Sanofi reached a civil settlement with the US SEC fully resolving the SEC’s investigation into possible violation of the US FCPA. Sanofi did not admit any wrongdoing in connection with the settlement but agreed to pay $25 million in penalties and also agreed to a two-year period of self-reporting on the effectiveness of its enhanced internal controls.
Products
Dengvaxia® (Philippines)
In early 2018, several claims were filed in the Philippines by parents of deceased children whose deaths were allegedly due to vaccination with Dengvaxia®. Early March 2019, the Philippine Department of Justice announced it had found probable cause to indict six Sanofi employees / former employees and Government officials for “reckless imprudence” resulting in homicides. Details of charges are not yet known.
SANOFI / FORM 20-F 2018 197

ITEM 8. FINANCIAL INFORMATION
B. Significant Changes Updates to Note D.22 Praluent® (alirocumab)-related Amgen Patent Litigation in
the US
On February 25, 2019, a jury from the US District Court for the District of Delaware upheld the validity of three of the five asserted claims of two Amgen US patents covering antibodies targeting PCSK9. The jury agreed with Sanofi and Regeneron for two of the five asserted claims, finding they were invalid based on lack of written description. Sanofi and Regeneron will file post-trial motions with the District Court over the next few months, seeking to overturn part of the jury verdict and also requesting a new trial. In addition, if necessary, the companies plan to appeal to the Court of Appeals for the Federal Circuit. On February 8, 2019, the District Court dismissed Amgen’s claim for willful infringement. Briefing over the next few months will also involve Amgen’s request for a permanent injunction. The Court has indicated that it may hold a public hearing on Amgen’s request for a permanent injunction in June 2019. A damages trial may be deferred until after any appeal is resolved by the US Court of Appeals for the Federal Circuit.
Dupixent® (dupilumab)-related Amgen Patent Opposition
and Revocation in Europe
On February 15, 2019, at oral proceedings, the European Patent Office (EPO) revoked the patent EP2990420 in its entirety, finding the claims invalid for lack of sufficiency. Immunex can appeal the decision within two months of the date of the written decision revoking the patent.
Dupixent® (dupilumab)-related Amgen Inter Partes Reviews
and Patent Litigation in the US
On February 14, 2019, the United States Patent and Trademark Office (USPTO) issued final written decisions on the petitions and declined to hold the challenged claims of the US patent No. 8,679,487 invalid for anticipation, but found all claims on the ‘487 patent invalid for obviousness.
With respect to the Immunex complaint, on February 28, 2019, the US District Court granted parties’ joint stipulation seeking to stay (put on-hold) the district court litigation. Accordingly, the litigation is stayed pending final resolution of any rehearings or appeals of the related IPR proceedings.
Other Changes
On February 12, 2019, Sanofi announced the appointment of Ameet Nathwani, M.D. as Chief Digital Officer in addition to his role of Executive Vice President, Chief Medical Officer. As Chief Digital Officer, Dr. Nathwani will be responsible for enhancing Sanofi’s strategy of integrating digital technologies and medical science to ultimately improve patient outcomes. His mandate will include scaling up Sanofi’s ongoing portfolio of digital initiatives by developing broad external partnerships, building out internal infrastructures, and exploring new business opportunities for Sanofi in the digital space.
198 SANOFI / FORM 20-F 2018
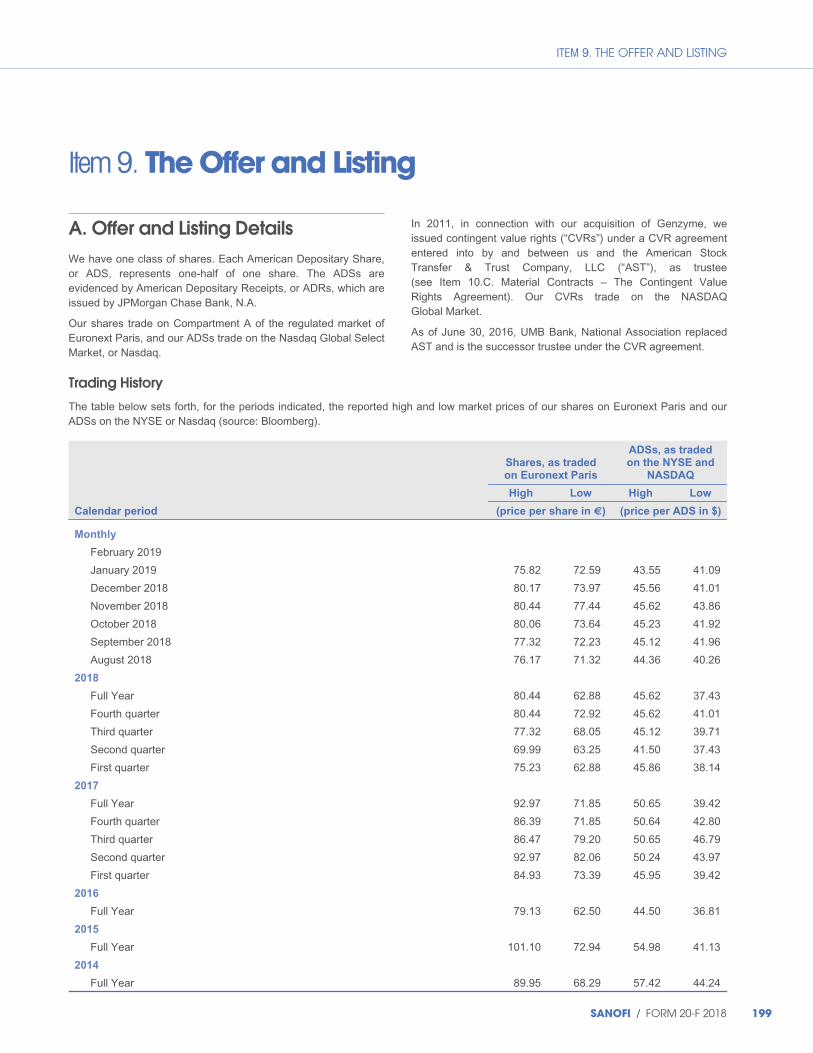
ITEM 9. THE OFFER AND LISTING
Item 9. The Offer and Listing
A. Offer and Listing Details We have one class of shares. Each American Depositary Share, or ADS, represents one-half of one share. The ADSs are evidenced by American Depositary Receipts, or ADRs, which are issued by JPMorgan Chase Bank, N.A.
Our shares trade on Compartment A of the regulated market of Euronext Paris, and our ADSs trade on the Nasdaq Global Select Market, or Nasdaq.
In 2011, in connection with our acquisition of Genzyme, we issued contingent value rights (“CVRs”) under a CVR agreement entered into by and between us and the American Stock Transfer & Trust Company, LLC (“AST”), as trustee (see Item 10.C. Material Contracts – The Contingent Value Rights Agreement). Our CVRs trade on the NASDAQ Global Market.
As of June 30, 2016, UMB Bank, National Association replaced AST and is the successor trustee under the CVR agreement.
Trading History
The table below sets forth, for the periods indicated, the reported high and low market prices of our shares on Euronext Paris and our ADSs on the NYSE or Nasdaq (source: Bloomberg).
Shares, as traded
on Euronext Paris
ADSs, as traded
on the NYSE and
NASDAQ
High Low High Low
Calendar period (price per share in €) (price per ADS in $)
Monthly
February 2019
January 2019 75.82 72.59 43.55 41.09
December 2018 80.17 73.97 45.56 41.01
November 2018 80.44 77.44 45.62 43.86
October 2018 80.06 73.64 45.23 41.92
September 2018 77.32 72.23 45.12 41.96
August 2018 76.17 71.32 44.36 40.26
2018
Full Year 80.44 62.88 45.62 37.43
Fourth quarter 80.44 72.92 45.62 41.01
Third quarter 77.32 68.05 45.12 39.71
Second quarter 69.99 63.25 41.50 37.43
First quarter 75.23 62.88 45.86 38.14
2017
Full Year 92.97 71.85 50.65 39.42
Fourth quarter 86.39 71.85 50.64 42.80
Third quarter 86.47 79.20 50.65 46.79
Second quarter 92.97 82.06 50.24 43.97
First quarter 84.93 73.39 45.95 39.42
2016
Full Year 79.13 62.50 44.50 36.81
2015
Full Year 101.10 72.94 54.98 41.13
2014
Full Year 89.95 68.29 57.42 44.24
SANOFI / FORM 20-F 2018 199

ITEM 9. THE OFFER AND LISTING
Fluctuations in the exchange rate between the euro and the U.S. dollar will affect any comparisons of euro share prices and U.S. ADS prices.
B. Plan of Distribution N/A
C. Markets
Shares and ADSs
Our shares are listed on Euronext Paris under the symbol “SAN” and our ADSs are listed on the Nasdaq under the symbol “SNY”.
As of the date of this annual report, our shares are included in a large number of indices, including the “CAC 40 Index”, the principal French index published by Euronext Paris. This index contains 40 stocks selected among the top 100 companies based on free-float capitalization and the most active stocks listed on the Euronext Paris market. The CAC 40 Index indicates trends in the French stock market as a whole and is one of the most widely followed stock price indices in France. Our shares are also included in the S&P Global 100 Index, the Dow Jones Euro STOXX 50, the Dow Jones STOXX 50, the FTS Eurofirst 100, the FTS Eurofirst 80 and the MSCI Pan-Euro Index, among other indices.
CVRs
Our CVRs trade on the NASDAQ Global Market under the symbol “GCVRZ”.
Trading by Sanofi in our own Shares
Under French law, a company may not issue shares to itself, but it may purchase its own shares in the limited cases described at “Item 10. Additional Information – B. Memorandum and Articles of Association – Trading in Our Own Shares.”
D. Selling Shareholders N/A
E. Dilution N/A
F. Expenses of the Issue N/A
200 SANOFI / FORM 20-F 2018
ITEM 10. ADDITIONAL INFORMATION
Item 10. Additional Information
Share Capital N/A
A.Memorandum and Articles of Association
General
Our Company is a société anonyme, a form of limited liability company, organized under the laws of France. The LEI number of the Company is 549300E9PC51EN656011.
In this section, we summarize material information concerning our share capital, together with material provisions of applicable French law and our Articles of Association (statuts), an English translation of which has been filed as an exhibit to this annual report. For a description of certain provisions of our Articles of Association relating to our Board of Directors and statutory auditors, see “Item 6. Directors, Senior Management and Employees.” You may obtain copies of our Articles of Association in French from the greffe (Clerk) of the Registre du Commerce et des Sociétés de Paris (Registry of Commerce and Companies of Paris, France, registration number: 395 030 844). Please refer to that full document for additional details.
Our Articles of Association specify that our corporate affairs are governed by:
◆ applicable laws and regulations (in particular, Title II of the French Commercial Code); and
◆ the Articles of Association themselves.
Article 3 of our Articles of Association specifies that the Company’s corporate purpose, in France and abroad, is:
◆ acquiring interests and holdings, in any form whatsoever, in any company or enterprise, in existence or to be created, connected directly or indirectly with the health and fine chemistry sectors, human and animal therapeutics, nutrition and bio-industry;
in the following areas:
◆ purchase and sale of all raw materials and products necessary for these activities;
◆ research, study and development of new products, techniques and processes;
◆ manufacture and sale of all chemical, biological, dietary and hygienic products;
◆ obtaining or acquiring all intellectual property rights related to results obtained and, in particular, filing all patents, trademarks and models, processes or inventions;
◆ operating directly or indirectly, purchasing, and transferring – for free or for consideration – pledging or securing all intellectual property rights, particularly all patents, trademarks and models, processes or inventions;
◆ obtaining, operating, holding and granting all licenses;
◆ within the framework of a group-wide policy and subject to compliance with the relevant legislation, participating in treasury management transactions, whether as lead company or otherwise, in the form of centralized currency risk management or intra-group netting, or any other form permitted under the relevant laws and regulations;
and, more generally:
◆ all commercial, industrial, real or personal property, financial or other transactions, connected directly or indirectly, totally or partially, with the activities described above and with all similar or related activities and even with any other purposes likely to encourage or develop the Company’s activities.
Directors
Transactions in which directors are materially interested
Under French law, any agreement entered into (directly or through an intermediary) between our Company and any one of the members of the Board of Directors that is not entered into (i) in the ordinary course of our business and (ii) under normal conditions is subject to the prior authorization of the disinterested members of the Board of Directors. The same provision applies to agreements between our Company and another company if one of the members of the Board of Directors is the owner, general partner, manager, director, general manager or member of the executive or supervisory board of the other company, as well as to agreements in which one of the members of the Board of Directors has an indirect interest.
The Board of Directors must also authorize any undertaking taken by our Company for the benefit of our Chairman, Chief Executive Officer (directeur général) or his delegates (directeurs généraux délégués) pursuant to which such persons will or may be granted compensation, benefits or any other advantages as a result of the termination of or a change in their offices or following such termination or change.
In addition, except with respect to any non-compete indemnity or certain pension benefits, any such termination package: (i) must be authorized by our shareholders through the adoption of a separate general shareholders meeting resolution for each such beneficiary, which authorization must be renewed at each renewal of such beneficiary’s mandate, and (ii) cannot be paid to such beneficiary unless (a) the Board of Directors decides that
SANOFI / FORM 20-F 2018 201
ITEM 10. ADDITIONAL INFORMATION
such beneficiary has satisfied certain conditions, linked to such beneficiary’s performance measured by our Company’s performance, that must have been defined by the Board of Directors when granting such package, and (b) such decision is publicly disclosed.
Directors’ compensation
The aggregate amount of attendance fees (jetons de présence) of the Board of Directors is determined at the Shareholders’ Ordinary General Meeting. The Board of Directors then divides this aggregate amount among its members by a simple majority vote. In addition, the Board of Directors may grant exceptional compensation (rémunérations exceptionnelles) to individual directors on a case-by-case basis for special assignments following the procedures described above at “– Transactions in Which Directors Are Materially Interested.” The Board of Directors may also authorize the reimbursement of travel and accommodation expenses, as well as other expenses incurred by Directors in the corporate interest. See also “Item 6. Directors, Senior Management and Employees.”
Board of Directors’ borrowing powers
All loans or borrowings on behalf of the Company may be decided by the Board of Directors within the limits, if any, imposed by the Shareholders’ General Meeting. There are currently no limits imposed on the amounts of loans or borrowings that the Board of Directors may approve.
Directors’ age limits
For a description of the provisions of our Articles of Association relating to age limits applicable to our Directors, see “Item 6. Directors, Senior Management and Employees.”
Directors’ Share Ownership requirements
Pursuant to the Board Charter, our Directors are required to hold at least 1,000 shares during the term of their appointment.
Share Capital
As of December 31, 2018, our share capital amounted to €2,494,790,944, divided into 1,247,395,472 outstanding shares with a par value of €2 per share. All of our outstanding shares are of the same class and are fully paid. Of these shares, we or entities controlled by us held 1,941,087 shares (or 0.16% of our outstanding share capital), as treasury shares as of such date. As of December 31, 2018, the carrying amount of such shares was €145 million.
At an extraordinary general meeting held on May 10, 2017, our shareholders authorized our Board of Directors to increase our share capital, through the issuance of shares or other securities giving access to the share capital with or without preemptive rights, by an aggregate maximum nominal amount of €1.289 billion. See “– Changes in Share Capital – Increases in Share Capital,” below.
The maximum total number of authorized but unissued shares as of December 31, 2018 was 140 million, reflecting the unused part of the May 4, 2016 and May 10, 2017 shareholder authorizations to issue shares without preemptive rights, outstanding options to subscribe for shares, and awards of shares.
Stock Options
Types of Stock Options
We have two types of stock options outstanding: options to subscribe for shares (options de souscription d’actions) and options to purchase shares (options d’achat d’actions). Upon exercise of an option to subscribe for shares, we issue new shares, whereas upon exercise of an option to purchase shares, the option holder receives existing shares. We purchase our shares on the market prior to the vesting of the options to purchase in order to provide the option holder with shares upon exercise.
Because the exercise of options to purchase shares will be satisfied with existing shares repurchased on the market or held in treasury, the exercise of options to purchase shares has no impact on the amount of our share capital.
Stock Option Plans
Our combined general meeting held on May 4, 2016 authorized our Board of Directors for a period of 38 months to grant, on one or more occasions, options to subscribe for shares and options to purchase shares in favor of persons to be chosen by the Board of Directors from among the salaried employees and corporate officers of our Company or of companies or groupings of economic interest of the Group in accordance with Article L. 225-180 of the French Commercial Code.
The aggregate number of options to subscribe for shares and options to purchase shares that may be granted under this authorization may not give entitlement to a total number of shares exceeding 0.5% of the share capital as of the date of the decision by the Board of Directors to grant such options.
The Board of Directors sets the exercise price of options to subscribe for shares and options to purchase shares. However, the exercise price never incorporates a discount and must be at least equal to the average of the quoted market prices on the 20 trading sessions preceding the date of grant by the Board of Directors.
Stock option plans generally provide for a lock-up period of four years and have a duration of ten years.
Under such authorization the shareholders expressly waive, in favor of the grantees of options to subscribe for shares, their preemptive rights in respect of shares that are to be issued as and when options are exercised.
The Board of Directors is granted full power to implement this authorization and to set the terms and conditions on which options are granted and the arrangements with respect to the dividend entitlement of the shares.
202 SANOFI / FORM 20-F 2018
ITEM 10. ADDITIONAL INFORMATION
See “Item 6. Directors, Senior Management and Employees – E. Share Ownership” for a description of our option plans currently in force.
Awards of Shares
Our combined general meeting held on May 4, 2016 authorized our Board of Directors for a period of 38 months to allot, on one or more occasions, existing or new restricted shares in favor of persons to be chosen by the Board of Directors from among the salaried employees and corporate officers of our Company or of companies or economic interest groupings of the Group in accordance with Articles L. 225-197-1 et seq. of the French Commercial Code.
The existing or new shares allotted under this authorization may not represent more than 1.5% of our share capital as of the date of the decision by the Board of Directors to allot such shares.
The authorization provides that allotment of shares to the allottees will become irrevocable at the end of a minimum vesting period of three years.
In the case of newly issued shares, the authorization entails the express waiver by the shareholders, in favor of the allottees of restricted shares, of their preemptive rights in respect of shares that are to be issued as and when restricted shares vest.
The Board of Directors sets the terms on which restricted shares are granted and the arrangements with respect to the dividend entitlement of the shares.
See “Item 6. Directors, Senior Management and Employees – E. Share Ownership” for a description of our restricted shares plans currently in force.
Changes in Share Capital in 2017
See Note D.15.1. to our consolidated financial statements included at Item 18 of this annual report.
Voting Rights
In general, each shareholder is entitled to one vote per share at any shareholders’ general meeting. Our Articles of Association do not provide for cumulative voting rights. However, our Articles of Association provide that any fully paid-up shares that have been held in registered form under the name of the same shareholder for at least two years acquire double voting rights. The double voting rights cease automatically for any share converted into bearer form or transferred from one owner to another, subject to certain exceptions permitted by law.
As of December 31, 2018, there were 149,643,921 shares that were entitled to double voting rights, representing 12% of our total share capital, and approximately 21.45% of the voting rights which can be cast at our shareholders’ general meeting as of that date.
Double voting rights are not taken into account in determining whether a quorum exists.
Under the French Commercial Code, treasury shares or shares held by entities controlled by that company are not entitled to voting rights and do not count for quorum purposes.
Our Articles of Association allow us to obtain from Euroclear France the name, nationality, address and number of shares held by holders of our securities that have, or may in the future have, voting rights. If we have reason to believe that a person on any list provided by Euroclear France holds securities on behalf of another person, our Articles of Association allow us to request information regarding beneficial ownership directly from such person. See “– B. Memorandum and Articles of Association – Form, Holding and Transfer of Shares,” below.
Our Articles of Association provide that Board members are elected on a rolling basis for a maximum tenure of four years.
Shareholders’ Agreement
We are not aware of any shareholder’s agreement currently in force concerning our shares.
Shareholders’ Meetings
General
In accordance with the provisions of the French Commercial Code, there are three types of shareholders’ meetings: ordinary, extraordinary and special.
Ordinary general meetings of shareholders are required for matters such as:
◆ electing, replacing and removing Directors;
◆ appointing independent auditors;
◆ approving the annual financial statements;
◆ declaring dividends or authorizing dividends to be paid in shares, provided the Articles of Association contain a provision to that effect; and
◆ approving share repurchase programs.
Extraordinary general meetings of shareholders are required for approval of matters such as amendments to our Articles of Association, including any amendment required in connection with extraordinary corporate actions. Extraordinary corporate actions include:
◆ changing our Company’s name or corporate purpose;
◆ increasing or decreasing our share capital;
◆ creating a new class of equity securities;
◆ authorizing the issuance of:
– shares giving access to our share capital or giving the right to receive debt instruments, or
– other securities giving access to our share capital;
◆ establishing any other rights to equity securities;
SANOFI / FORM 20-F 2018 203
ITEM 10. ADDITIONAL INFORMATION
◆ selling or transferring substantially all of our assets; and
◆ the voluntary liquidation of our Company.
Special meetings of shareholders of a certain category of shares or shares with certain specific rights (such as shares with double voting rights) are required for any modification of the rights derived from that category of shares. The resolutions of the shareholders’ general meeting affecting these rights are effective only after approval by the relevant special meeting.
Annual Ordinary Meetings
The French Commercial Code requires the Board of Directors to convene an annual ordinary general shareholders’ meeting to approve the annual financial statements. This meeting must be held within six months of the end of each fiscal year. This period may be extended by an order of the President of the Commercial Court. The Board of Directors may also convene an ordinary or extraordinary general shareholders’ meeting upon proper notice at any time during the year. If the Board of Directors fails to convene a shareholders’ meeting, our independent auditors may call the meeting. In case of bankruptcy, the liquidator or court-appointed agent may also call a shareholders’ meeting in some instances. In addition, any of the following may request the court to appoint an agent for the purpose of calling a shareholders’ meeting:
◆ one or several shareholders holding at least 5% of our share capital;
◆ duly qualified associations of shareholders who have held their shares in registered form for at least two years and who together hold at least 1% of our voting rights;
◆ the works council in cases of urgency; or
◆ any interested party in cases of urgency.
Notice of Shareholders’ Meetings
All prior notice periods provided for below are minimum periods required by French law and cannot be shortened, except in case of a public tender offer for our shares.
We must announce general meetings at least thirty-five days in advance by means of a preliminary notice (avis de réunion), which is published in the Bulletin des Annonces Légales Obligatoires, or BALO. The preliminary notice must first be sent to the French Financial markets authority (Autorité des marchés financiers, the “AMF”), with an indication of the date on which it will be published in the BALO. It must be published on our website at least twenty-one days prior to the general meeting. The preliminary notice must contain, among other things, the agenda, a draft of the resolutions to be submitted to the shareholders for consideration at the general meeting and a detailed description of the voting procedures (proxy voting, electronic voting or voting by mail), the procedures permitting shareholders to submit additional resolutions or items to the agenda and to ask written questions to the Board of Directors.
The AMF also recommends that, prior to or simultaneously with the publication of the preliminary notice, we publish a summary of the notice indicating the date, time and place of the meeting in a newspaper of national circulation in France and on our website.
At least fifteen days prior to the date set for a first convening, and at least ten days prior to any second convening, we must send a final notice (avis de convocation) containing the final agenda, the date, time and place of the meeting and other information related to the meeting. Such final notice must be sent by mail to all registered shareholders who have held shares in registered form for more than one month prior to the date of the final notice and by registered mail, if shareholders have asked for it and paid the corresponding charges. The final notice must also be published in a newspaper authorized to publish legal announcements in the local administrative department (département) in which our Company is registered as well as in the BALO, with prior notice having been given to the AMF for informational purposes. Even if there are no proposals for new resolutions or items to be submitted to the shareholders at the meeting, we must publish a final notice in a newspaper authorized to publish legal announcements in the local administrative department (départment) in which our Company is registered as well as in the BALO.
Other issues
In general, shareholders can only take action at shareholders’ meetings on matters listed on the agenda. As an exception to this rule, shareholders may take action with respect to the appointment and dismissal of directors even if this action has not been included on the agenda.
Additional resolutions to be submitted for approval by the shareholders at the shareholders’ meeting may be proposed to the Board of Directors, for recommendation to the shareholders at any time from the publication of the preliminary notice in the BALO until twenty-five days prior to the general meeting and in any case no later than twenty days following the publication of the preliminary notice in the BALO by:
◆ one or several shareholders together holding a specified percentage of shares;
◆ a duly qualified association of shareholders who have held their shares in registered form for at least two years and who together hold at least 1% of our voting rights; or
◆ the works council.
Within the same period, the shareholders may also propose additional items (points) to be submitted and discussed during the shareholders’ meeting, without a shareholders’ vote. The shareholders must substantiate the reasons for their proposals of additional items.
The resolutions and the list of items added to the agenda of the shareholders’ meeting must be promptly published on our website.
204 SANOFI / FORM 20-F 2018
ITEM 10. ADDITIONAL INFORMATION
The Board of Directors must submit the resolutions to a vote of the shareholders after having made a recommendation thereon. The Board of Directors may also comment on the items that are submitted to the shareholders’ meeting.
Following the date on which documents must be made available to the shareholders (including documents to be submitted to the shareholders’ meeting and resolutions proposed by the Board of Directors, which must be published on our website at least twenty-one days prior to the general meeting), shareholders may submit written questions to the Board of Directors relating to the agenda for the meeting until the fourth business day prior to the general meeting. The Board of Directors must respond to these questions during the meeting or may refer to a Q&A section located on our website in which the question submitted by a shareholder has already been answered.
Attendance at Shareholders’ Meetings; Proxies and votes by mail
In general, all shareholders may participate in general meetings either in person or by proxy. Shareholders may vote in person, by proxy or by mail.
The right of shareholders to participate in general meetings is subject to the recording (inscription en compte) of their shares on the second business day, zero hour (Paris time), preceding the general meeting:
◆ for holders of registered shares: in the registered shareholder account held by the Company or on its behalf by an agent appointed by it; and
◆ for holders of bearer shares: in the bearer shareholder account held by the accredited financial intermediary with whom such holders have deposited their shares; such financial intermediaries shall deliver to holders of bearer shares a shareholding certificate (attestation de participation) enabling them to participate in the general meeting.
Attendance in person
Any shareholder may attend ordinary general meetings and extraordinary general meetings and exercise its voting rights subject to the conditions specified in the French Commercial Code and our Articles of Association.
Proxies and votes by mail
Proxies are sent to any shareholder upon a request received between the publication of the final notice of meeting and six days before the general meeting and must be made available on our website at least twenty-one days before the general meeting. In order to be counted, such proxies must be received at our registered office, or at any other address indicated on the notice of the meeting or by any electronic mail indicated on the notice of the meeting, prior to the date of the meeting (in practice, we request that shareholders return proxies at least three business days prior to the meeting; electronic proxies must be returned
before 3 p.m. Paris time, on the day prior to the general meeting). A shareholder may grant proxies to any natural person or legal entity. The agent may be required to disclose certain information to the shareholder or to the public.
Alternatively, the shareholder may send us a blank proxy without nominating any representative. In this case, the chairman of the meeting will vote the blank proxies in favor of all resolutions proposed or approved by the Board of Directors and against all others.
With respect to votes by mail, we must send shareholders a voting form upon request or must make available a voting form on our website at least twenty-one days before the general meeting. The completed form must be returned to us at least three days prior to the date of the shareholders’ meeting. For holders of registered shares, in addition to traditional voting by mail, instructions may also be given via the internet.
Quorum
The French Commercial Code requires that shareholders holding in the aggregate at least 20% of the shares entitled to vote must be present in person, or vote by mail or by proxy, in order to fulfill the quorum requirement for:
◆ an ordinary general meeting; and
◆ an extraordinary general meeting where the only resolutions pertain to either (a) a proposed increase in our share capital through incorporation of reserves, profits or share premium, or (b) the potential issuance of free share warrants in the event of a public tender offer for our shares (article L. 233-32 of the French Commercial Code).
For any other extraordinary general meeting the quorum requirement is at least 25% of the shares entitled to vote, held by shareholders present in person, voting by mail or by proxy.
For a special meeting of holders of a certain category of shares, the quorum requirement is one third of the shares entitled to vote in that category, held by shareholders present in person, voting by mail or by proxy.
If a quorum is not present at a meeting, the meeting is adjourned. However, only questions that were on the agenda of the adjourned meeting may be discussed and voted upon once the meeting resumes.
When an adjourned meeting is resumed, there is no quorum requirement for meetings cited in the first paragraph of this “Quorum” section. In the case of any other reconvened extraordinary general meeting or special meeting, the quorum requirement is 20% of the shares entitled to vote (or voting shares belonging to the relevant category for special meetings of holders of shares of such specific category), held by shareholders present in person or voting by mail or by proxy. If a quorum is not met, the reconvened meeting may be adjourned for a maximum of two months with the same quorum requirement. No deliberation or action by the shareholders may take place without a quorum.
SANOFI / FORM 20-F 2018 205
ITEM 10. ADDITIONAL INFORMATION
Votes required for shareholder action
The affirmative vote of a simple majority of the votes cast may pass a resolution at either an ordinary general meeting or an extraordinary general meeting where the only resolution(s) pertain to either (a) a proposed increase in our share capital through incorporation of reserves, profits or share premium, or (b) the potential issuance of free share warrants in the event of a public tender offer for our shares (article L. 233-32 of the French Commercial Code). At any other extraordinary general shareholders’ meeting and at any special meeting of holders of a specific category of shares, the affirmative vote of two-thirds of the votes cast is required.
Abstention from voting by those present or those represented by proxy or voting by mail is counted as a vote against the resolution submitted to a shareholder vote.
Changes to shareholders’ rights
Under French law, the affirmative vote of two-thirds of the votes cast at an extraordinary shareholders’ meeting is required to change our Articles of Association, which set out the rights attached to our shares, except for capital increases through incorporation of reserves, profits or share premium, or through the issuance of free share warrants in the event of a public tender offer for our shares (article L. 233-32 of the French Commercial Code).
The rights of a class of shareholders can be amended only after a special meeting of the class of shareholders affected has taken place. The voting requirements applicable to this type of special meeting are the same as those applicable to an extraordinary general shareholders’ meeting. The quorum requirements for a special meeting are one-third of the voting shares, or 20% upon resumption of an adjourned meeting.
A unanimous shareholders’ vote is required to increase the liabilities of shareholders.
Financial Statements and other communications with shareholders
In connection with any shareholders’ meeting, we must provide a set of documents which includes our annual report.
We must also provide on our website at least twenty-one days before a shareholders’ meeting certain information and a set of documents that includes the preliminary notice, the proxies and voting forms, the resolutions proposed by the Board of Directors, and the documents to be submitted to the shareholders’ meeting pursuant to articles L. 225-115 and R. 225-83 of the French Commercial Code, etc. The resolutions and the list of items added to the agenda of the shareholders’ meeting must be promptly published on our website.
Dividends
We may only distribute dividends out of our “distributable profits,” plus any amounts held in our reserves that the shareholders decide to make available for distribution, other than those reserves that are specifically required by law or our Articles of Association. “Distributable profits” consist of our unconsolidated net profit in each fiscal year, as increased or reduced by any profit or loss carried forward from prior years, less any contributions to the reserve accounts pursuant to law or our Articles of Association.
Legal reserve
The French Commercial Code requires us to allocate 5% of our unconsolidated net profit for each year to our legal reserve fund before dividends may be paid with respect to that year. Funds must be allocated until the amount in the legal reserve is equal to 10% of the aggregate par value of the issued and outstanding share capital. This restriction on the payment of dividends also applies to each of our French subsidiaries on an unconsolidated basis. At December 31, 2018, our legal reserve amounted to €282,280,863.40, representing 11.31% of the aggregate par value of our issued and outstanding share capital as of that date. The legal reserve of any company subject to this requirement may serve to allocate losses that may not be allocated to other reserves, or may be distributed to shareholders upon liquidation of the company.
Approval of dividends
According to the French Commercial Code, our Board of Directors may propose a dividend for approval by shareholders at the annual general shareholders’ meeting. If we have earned distributable profits since the end of the preceding fiscal year, as reflected in an interim income statement certified by our independent auditors, our Board of Directors may distribute interim dividends to the extent of the distributable profits for the period covered by the interim income statement. Our Board of Directors exercises this authority subject to French law and regulations and may do so without obtaining shareholder approval.
Distribution of dividends
Dividends are distributed to shareholders pro rata according to their respective holdings of shares. In the case of interim dividends, distributions are made to shareholders on the date set by our Board of Directors during the meeting in which the distribution of interim dividends is approved. The actual dividend payment date is decided by the shareholders at an ordinary general shareholders’ meeting or by our Board of Directors in the absence of such a decision by the shareholders. Shareholders that own shares on the actual payment date are entitled to the dividend.
206 SANOFI / FORM 20-F 2018

ITEM 10. ADDITIONAL INFORMATION
Dividends may be paid in cash or, if the shareholders’ meeting so decides, in kind, provided that all shareholders receive a whole number of assets of the same nature paid in lieu of cash. Our Articles of Association provide that, subject to a decision of the shareholders’ meeting taken by ordinary resolution, each shareholder may be given the choice to receive his dividend in cash or in shares.
Timing of payment
According to the French Commercial Code, we must pay any existing dividends within nine months of the end of our fiscal year, unless otherwise authorized by court order. Dividends on shares that are not claimed within five years of the date of declared payment revert to the French State.
Changes in share capital
Increases in Share Capital
As provided for by the French Commercial Code, our share capital may be increased only with shareholders’ approval at an extraordinary general shareholders’ meeting following the recommendation of our Board of Directors. The shareholders may delegate to our Board of Directors either the authority (délégation de compétence) or the power (délégation de pouvoir) to carry out any increase in share capital. Our Board of Directors may further delegate this power to our Chief Executive Officer or, subject to our Chief Executive Officer’s approval, to his delegates (directeurs généraux délégués).
Increases in our share capital may be effected by:
◆ issuing additional shares;
◆ increasing the par value of existing shares;
◆ creating a new class of equity securities; or
◆ exercising the rights attached to securities giving access to the share capital.
Increases in share capital by issuing additional securities may be effected through one or a combination of the following:
◆ in consideration for cash;
◆ in consideration for assets contributed in kind;
◆ through an exchange offer;
◆ by conversion of previously issued debt instruments;
◆ by capitalization of profits, reserves or share premium; or
◆ subject to various conditions, in satisfaction of debt incurred by our Company.
Decisions to increase the share capital through the capitalization of reserves, profits and/or share premium or through the issuance of free share warrants in the event of a public tender offer for our shares (article L. 233-32 of the French Commercial Code) require shareholders’ approval at an extraordinary general shareholders’ meeting, acting under the quorum and majority
requirements applicable to ordinary shareholders’ meetings. Increases effected by an increase in the par value of shares require unanimous approval of the shareholders, unless effected by capitalization of reserves, profits or share premium. All other capital increases require shareholders’ approval at an extraordinary general shareholders’ meeting acting under the regular quorum and majority requirements for such meetings. See “– Quorum” and “– Votes Required for Shareholder Action” above.
On May 10, 2017, our shareholders approved various resolutions delegating to the Board of Directors the authority to increase our share capital through the issuance of shares or securities giving access to the share capital, subject to an overall cap set at €1.289 billion. This cap applies to all the resolutions whereby the extraordinary shareholders’ meeting delegated to the Board of Directors the authority to increase the share capital, it being also specified that:
◆ the maximum aggregate par value of capital increases that may be carried out with preemptive rights maintained was set at €1.289 billion;
◆ the maximum aggregate par value of capital increases that may be carried out by public offering without preemptive rights was set at €240 million;
◆ the maximum aggregate par value of capital increases that may be carried out by private placement without preemptive rights was set at €240 million;
◆ capital increases resulting in the issuance of securities to members of employee savings plans are limited to 1% of the share capital as computed on the date of the Board of Directors’ decision to issue such securities, and such issuances may be made at a discount of 20% (or 30%) if certain French law restrictions on resales were to apply, i.e. a lock up period of five years (or 10 years).
At its meeting of March 6, 2018, our Board of Directors decided to delegate to the Chief Executive Officer the powers necessary to carry out a capital increase reserved for members of the Group savings program. Every employee subscribing for at least five shares received one additional new share as an employer’s top-up contribution. Beyond the first twenty shares there was no entitlement to any further shares by way of employer’s top-up contribution (every employee subscribing for twenty shares received four additional shares as an employer’s top-up contribution). The subscription period was open during June 2018.
27,680 employees from nearly 80 countries subscribed for a total of 2,298,783 shares. Of these, 1,120,411 shares were subscribed via FCPE Actions Sanofi, the dedicated employee share ownership fund for employees of our French subsidiaries; 488,528 shares via FCPE Sanofi Shares, the dedicated employee share ownership fund for employees of our foreign subsidiaries; and 689,844 shares directly by employees who were eligible for the employee share ownership plan but were in
SANOFI / FORM 20-F 2018 207
ITEM 10. ADDITIONAL INFORMATION
countries where local regulations did not allow the use of a dedicated employee share ownership fund.
A total of 102,401 shares were issued by way of employer’s top-up contribution. Of these, 43,140 were issued to FCPE Actions Sanofi; 28,454 to FCPE Sanofi Shares; and 30,807 directly to employees who were eligible for the employee share ownership plan but were in countries where local regulations did not allow the use of a dedicated employee share ownership fund.
Voting rights attached to shares held by FCPE Actions Sanofi are exercised individually by the employees who hold units in the fund; fractional rights are exercised by the fund’s supervisory board.
Voting rights attached to shares held by FCPE Sanofi Shares are also exercised individually by the employees who hold units in the fund; any rights not exercised by them are exercised by the fund’s supervisory board.
In each case, the supervisory board includes an equal number of representatives of employees and of Sanofi management.
On May 4, 2016, our shareholders approved resolutions delegating to the Board of Directors the authority to increase the share capital by granting options to our employees and/or corporate officers, subject to the overall cap mentioned above and under the following terms and conditions:
◆ the authorization is valid for a period of 38 months, and any options granted may not give entitlement to a total number of shares exceeding 0.5% of the share capital as computed on the date of the decision of the Board of Directors to grant such options; see “– Stock Options” above;
On May 4, 2016, our shareholders also approved resolutions delegating to the Board of Directors the authority to increase the share capital by granting existing or new restricted shares to our employees and/or corporate officers, subject to the overall cap mentioned above and under the following terms and conditions:
◆ the authorization is valid for a period of 38 months, and is subject to a limit of 1.5% of the share capital as computed on the date of the decision of the Board of Directors to allot such shares; see “– Awards of Shares” above.
See also “Item 6. Directors, Senior Management and Employees – E. Share Ownership”.
Decreases in share capital
In accordance with the provisions of the French Commercial Code, any decrease in our share capital requires approval by the shareholders entitled to vote at an extraordinary general meeting. The share capital may be reduced either by decreasing the par value of the outstanding shares or by reducing the number of outstanding shares. The number of outstanding shares may be reduced either by an exchange of shares or by the repurchase and cancellation of shares. Holders of each class of shares must be treated equally unless each affected shareholder agrees otherwise.
In addition, specific rules exist to permit the cancellation of treasury shares, by which the shareholders’ meeting may authorize the cancellation of up to a maximum of 10% of a company’s share capital within any 24-month period. On May 10, 2017, our shareholders delegated to our Board of Directors for 26 months the right to reduce our share capital by canceling our own shares.
Preemptive rights
According to the French Commercial Code, if we issue additional securities to be paid in cash, current shareholders will have preemptive rights to these securities on a pro rata basis. These preemptive rights require us to give priority treatment to current shareholders. The rights entitle the individual or entity that holds them to subscribe to the issuance of any securities that may increase the share capital of our Company by means of a cash payment or a set-off of cash debts. Preemptive rights are transferable during the subscription period relating to a particular offering. These rights may also be listed on Euronext Paris Stock Exchange.
Preemptive rights with respect to any particular offering may be waived by the affirmative vote of shareholders holding two-thirds of the shares entitled to vote at an extraordinary general meeting. Our Board of Directors and our independent auditors are required by French law to present reports that specifically address any proposal to waive preemptive rights. In the event of a waiver, the issuance of securities must be completed within the period prescribed by law. Shareholders may also notify us that they wish to waive their own preemptive rights with respect to any particular offering if they so choose.
The shareholders may decide at extraordinary general meetings to give the existing shareholders a non-transferable priority right to subscribe to the new securities, for a limited period of time.
In the event of a capital increase without preemptive rights to existing shareholders, French law requires that the capital increase be made at a price equal to or exceeding the weighted average market prices of the shares for the last three trading days on Euronext Paris Stock Exchange prior to the determination of the subscription price of the capital increase less 5%.
Form, holding and transfer of shares
Form of shares
Our Articles of Association provide that the shares may be held in either bearer form or registered form at the option of the holder.
Holding of shares
In accordance with French law relating to the dematerialization of securities, shareholders’ ownership rights are represented by book entries instead of share certificates. We maintain a share account with Euroclear France (a French clearing system, which holds securities for its participants) for all shares in registered
208 SANOFI / FORM 20-F 2018
ITEM 10. ADDITIONAL INFORMATION
form, which is administered by BNP Paribas Securities Services. In addition, we maintain separate accounts in the name of each shareholder either directly or, at a shareholder’s request, through the shareholder’s accredited intermediary. Each shareholder account shows the name of the holder and the number of shares held. BNP Paribas Securities Services issues confirmations (attestations d’inscription en compte) to each registered shareholder as to shares registered in the shareholder’s account, but these confirmations are not documents of title.
Shares of a listed company may also be issued in bearer form. Shares held in bearer form are held and registered on the shareholder’s behalf in an account maintained by an accredited financial intermediary and are credited to an account at Euroclear France maintained by such intermediary. Each accredited financial intermediary maintains a record of shares held through it and provides the account holder with a securities account statement. Transfers of shares held in bearer form may only be made through accredited financial intermediaries and Euroclear France.
Shares held by persons who are not domiciled in France may be registered in the name of intermediaries who act on behalf of one or more investors. When shares are so held, we are entitled to request from such intermediaries the names of the investors. Also, we may request any legal entity (personne morale) which holds more than 2.5% of our shares or voting rights to disclose the name of any person who owns, directly or indirectly, more than one-third of its share capital or of its voting rights. A person not providing the complete requested information in time, or who provides incomplete or false information, will be deprived of its voting rights at shareholders’ meetings and will have its payment of dividends withheld until it has provided the requested information in strict compliance with French law. If such person acted willfully, the person may be deprived by a French court of either its voting rights or its dividends or both for a period of up to five years.
Transfer of shares
Our Articles of Association do not contain any restrictions relating to the transfer of shares.
Registered shares must be converted into bearer form before being transferred on the Euronext Paris Stock Exchange on the shareholders’ behalf and, accordingly, must be registered in an account maintained by an accredited financial intermediary on the shareholders’ behalf. A shareholder may initiate a transfer by giving instructions to the relevant accredited financial intermediary.
A fee or commission is payable to the broker involved in the transaction, regardless of whether the transaction occurs within or outside France. Registration duty is currently payable in France if a written deed of sale and purchase (acte) is executed in France or outside France with respect to the shares of the Company.
Redemption of shares
Under French law, our Board of Directors is entitled to redeem a set number of shares as authorized by the extraordinary shareholders’ meeting. In the case of such an authorization, the shares redeemed must be cancelled within one month after the end of the offer to purchase such shares from shareholders. However, shares redeemed on the open market do not need to be cancelled if the company redeeming the shares grants options on or awards those shares to its employees within one year following the acquisition. See also “– Trading in Our Own Shares” below.
Sinking fund provisions
Our Articles of Association do not provide for any sinking fund provisions.
Liability to further capital calls
Shareholders are liable for corporate liabilities only up to the par value of the shares they hold; they are not liable to further capital calls.
Liquidation rights
If we are liquidated, any assets remaining after payment of our debts, liquidation expenses and all of our remaining obligations will first be distributed to repay in full the par value of our shares. Any surplus will be distributed pro rata among shareholders in proportion to the par value of their shareholdings.
Requirements for holdings exceeding certain percentages
The French Commercial Code provides that any individual or entity, acting alone or in concert with others, that becomes the owner, directly or indirectly, of more than 5%, 10%, 15%, 20%, 25%, 30%, 331/3%, 50%, 662/3%, 90% or 95% of the outstanding shares or voting rights of a listed company in France, such as our Company, or that increases or decreases its shareholding or voting rights above or below any of those percentages, must notify the company, before the end of the fourth trading day following the date it crosses the threshold, of the number of shares it holds and their voting rights. The individual or entity must also notify the AMF before the end of the fourth trading day following the date it crosses any such threshold. The AMF makes the notice public.
Pursuant to the French Commercial Code and the AMF General Regulation, the participation thresholds shall be calculated on the basis of the shares and voting rights owned, and shall take into account the shares and voting rights which are deemed to be shares and voting rights owned, even if the individual or entity does not itself hold shares or voting rights. In accordance with this deemed ownership principle, the individual or entity must take into account specific situations where shares and voting
SANOFI / FORM 20-F 2018 209
ITEM 10. ADDITIONAL INFORMATION
rights are deemed to be shares and voting rights owned when calculating the number of shares owned to be disclosed in the notifications to the Company and to the AMF. It includes among others situations where an individual or entity is entitled to acquire issued shares at its own initiative, immediately or at the end of a maturity period, under an agreement or a financial instrument, without set-off against the number of shares that this individual or entity is entitled to sell under another agreement or financial instrument. The individual or entity required to make such notification shall also take into account issued shares covered by an agreement or cash-settled financial instrument and having an economic effect for said individual or entity that is equivalent to owning such shares. In the cases of deemed ownership described above, the notification shall mention the type of deemed ownership and include a description of the main characteristics of the financial instrument or agreement with specific details required by the AMF General Regulation.
The AMF General Regulation provides that shares and voting rights subject to multiple cases of deemed ownership shall only be counted once.
When an individual or entity modifies the allocation between the shares it owns and its financial instruments or agreements deemed to be owned shares, it must disclose that change in a new notification. However, the change must only be disclosed if the acquisition of owned shares due to the settlement of the financial instruments or agreements causes the investor to cross a threshold.
Subject to certain limited exceptions, French law and AMF regulations impose additional reporting requirements on persons who acquire more than 10%, 15%, 20%, or 25% of the outstanding shares or voting rights of a company listed in France. These persons must file a report with the company and the AMF before the end of the fifth trading day following the date they cross any such threshold.
In the report, the acquirer will have to specify its intentions for the following six months including:
◆ whether it acts alone or in concert with others;
◆ the means of financing of the acquisition (the notifier shall indicate in particular whether the acquisition is being financed with equity or debt, the main features of that debt, and, where applicable, the main guarantees given or received by the notifier. The notifier shall also indicate what portion of its holding, if any, it obtained through securities loans);
◆ whether or not it intends to continue its purchases;
◆ whether or not it intends to acquire control of the company in question;
◆ the strategy it contemplates vis-à-vis the issuer;
◆ the way it intends to implement its strategy, including: (i) any plans for a merger, reorganization, liquidation, or partial transfer of a substantial part of the assets of the issuer or of any other entity it controls within the meaning of article L. 233-3 of the French Commercial Code, (ii) any plans to modify
the business of the issuer, (iii) any plans to modify articles of association of the issuer, (iv) any plans to delist a category of the issuer’s financial instruments, and (v) any plans to issue the issuer’s financial instruments;
◆ any agreement for the temporary transfer of shares or voting rights of the issuer;
◆ the way it intends to settle its agreements or instruments on the shares or voting rights of the issuer mentioned in Article L. 233- 9,4° and 4° bis of the French Commercial Code; and
◆ whether it seeks representation on the Board of Directors.
The AMF makes the report public. Upon any change of intention within the six-month period following the filing of the report, it will have to file a new report for the following six-month period.
In order to enable shareholders to give the required notice, we must each month publish on our website and send the AMF a written notice setting forth the total number of our shares and voting rights (including treasury shares) whenever they vary from the figures previously published.
If any shareholder fails to comply with an applicable legal notification requirement, the shares in excess of the relevant threshold will be deprived of voting rights for all shareholders’ meetings until the end of a two-year period following the date on which the owner complies with the notification requirements. In addition, any shareholder who fails to comply with these requirements may have all or part of its voting rights suspended for up to five years by the Commercial Court at the request of our Chairman, any shareholder or the AMF, and may be subject to criminal fines.
Under AMF regulations, and subject to limited exemptions granted by the AMF, any person or entity, acting alone or in concert, that crosses the threshold of 30% of the share capital or voting rights of a French listed company must initiate a public tender offer for the balance of the shares and securities giving access to the share capital or voting rights of such company. Cash-settled derivative instruments or agreements mentioned in Article L. 233-9, 4° bis of the French Commercial Code are not included in the calculation of the number of shares related to the mandatory public tender offer.
In addition, our Articles of Association provide that any person or entity, acting alone or in concert with others, who becomes the owner of 1%, or any multiple of 1% of our share capital or our voting rights, even beyond the minimum declaration limits permitted by the legal and regulatory provisions, must notify us by certified mail, return receipt requested, within five trading days, of the total number of shares and securities giving access to our share capital and voting rights that such person then owns. The same provisions of our Articles of Association apply whenever such owner increases or decreases its ownership of our share capital or our voting rights to such extent that it goes above or below one of the thresholds described in the preceding sentence. Any person or entity that fails to comply with such notification requirement will, upon the request of one or more shareholders holding at least 5% of our share capital or of our
210 SANOFI / FORM 20-F 2018
ITEM 10. ADDITIONAL INFORMATION
voting rights made at the general shareholders’ meeting, be deprived of voting rights with respect to the shares in excess of the relevant threshold for all shareholders’ meetings until the end of a two-year period following the date on which such person or entity complies with the notification requirements.
Change in control/anti-takeover
There are no provisions in our Articles of Association that would have the effect of delaying, deferring or preventing a change in control of our Company or that would operate only with respect to a merger, acquisition or corporate restructuring involving our Company or any of our subsidiaries. Further, there are no provisions in our Articles of Association that allow the issuance of preferred stock upon the occurrence of a takeover attempt or the addition of other “anti-takeover” measures without a shareholder vote.
Our Articles of Association do not include any provisions discriminating against any existing or prospective holder of our securities as a result of such shareholder owning a substantial number of shares.
Trading in our own shares
Under French law, Sanofi may not issue shares to itself. However, we may, either directly or through a financial intermediary acting on our behalf, acquire up to 10% of our issued share capital within a maximum period of 18 months, provided our shares are listed on a regulated market. Prior to acquiring our shares, we must publish a description of the share repurchase program (descriptif du programme de rachat d’actions).
We may not cancel more than 10% of our issued share capital over any 24-month period. Our repurchase of shares must not result in our Company holding, directly or through a person acting on our behalf, more than 10% of our issued share capital. We must hold any shares that we repurchase in registered form. These shares must be fully paid up. Shares repurchased by us continue to be deemed “issued” under French law but are not entitled to dividends or voting rights so long as we hold them directly or indirectly, and we may not exercise the preemptive rights attached to them.
The shareholders, at an extraordinary general shareholders meeting, may decide not to take these shares into account in determining the preemptive rights attached to the other shares. However, if the shareholders decide to take them into account, we must either sell the rights attached to the shares we hold on the market before the end of the subscription period or distribute them to the other shareholders on a pro rata basis.
On May 2, 2018, our shareholders approved a resolution authorizing us to repurchase up to 10% of our shares over an 18-month period. Under this authorization, the purchase price for
each Sanofi ordinary share may not be greater than €120.00 and the maximum amount that Sanofi may pay for the repurchases is €15,048,238,800. This authorization was granted for a period of 18 months from May 2, 2018 and cancelled and replaced the authorization granted to the Board of Directors by the combined general meeting held on May 10, 2017. A description of this share repurchase program as adopted by the combined general meeting held on May 2, 2018 (descriptif du programme de rachat d’actions) was published on March 8, 2018.
Purposes of share repurchase programs
Under the European regulation 596/2014, dated April 16, 2014 on market abuse and its delegated regulation 2016/1052 on repurchase programs and stabilization measures, dated March 8, 2016 (which we refer to in this section as the “Regulation”), an issuer will benefit from a safe harbor for share transactions that comply with certain conditions relating in particular to the pricing, volume and timing of transactions (see below) and that are made in connection with a share repurchase program the purpose of which is:
◆ to reduce the share capital through the cancellation of treasury shares;
◆ to meet obligations arising from debt financial instruments that are exchangeable into equity instruments; and/or
◆ to meet obligations arising from share option programs or other allocations of shares to employees or to members of the administrative, management or supervisory bodies of the issuer or of an associate company.
Safe harbor transactions will by definition not be considered market abuses under the Regulation. Transactions that are carried out for other purposes than those mentioned above do not qualify for the safe harbor.
However, as permitted by the Regulation, which provides for a presumption of legitimacy for existing market practices that do not constitute market manipulation and that conform with certain criteria, the AMF has established as a French accepted market practice, which therefore benefits from a presumption of legitimacy, the use of liquidity agreements for share purchases that are entered into with a financial services intermediary and that comply with the criteria set out by the AMF.
The AMF confirmed that all transactions directed at maintaining the liquidity of an issuer’s shares must be conducted pursuant to a liquidity agreement with a financial services intermediary acting independently.
As of July 3, 2016, the purchase of shares that are subsequently used as acquisition currency in a business combination transaction, which the AMF previously permitted as an accepted market practice, is no longer considered as such, although such practice, while not benefiting from the presumption of legitimacy, is not prohibited under the Regulation.
SANOFI / FORM 20-F 2018 211
ITEM 10. ADDITIONAL INFORMATION
Pricing, volume and other restrictions
In order to qualify for the safe harbor described above, the issuer must generally comply with the following pricing and volume restrictions:
◆ a share purchase must not be made at a price higher than the higher of the price of the last independent trade and the highest current independent bid on the trading venues where the purchase is carried out; and
◆ subject to certain exceptions for illiquid securities, the issuer must not purchase on any trading day more than 25% of the average daily volume of the shares on the regulated market on which the purchase is carried out. The average daily volume figure must be based on the average daily volume traded in the month preceding the month of public disclosure of the share repurchase program and fixed on that basis for the authorized period of that program. If the program does not make reference to this volume, the average daily volume figure must be based on the average daily volume traded in the 20 trading days preceding the date of purchase.
In addition, unless the issuer has in place a time-scheduled repurchase program or the repurchase program is lead-managed by an investment firm or a credit institution which makes its trading decisions concerning the timing of the purchase of the issuer’s shares independently of the issuer, the issuer must not, for the duration of the repurchase program, engage in the following activities:
◆ selling its own shares;
◆ effecting any transaction during a closed period imposed by the applicable law of the Member State in which the transaction occurs (i.e. under French law, during the period between the date on which the company has knowledge of insider information and the date on which such information is made public and during the 30 calendar day period before the announcement of an interim financial report or a year-end report which the issuer is obliged to make public); or
◆ effecting any transaction in securities with respect to which the issuer has decided to delay the public disclosure of inside information, in accordance with applicable rules.
Use of share repurchase programs
Pursuant to the AMF rules, issuers must immediately allocate the repurchased shares to one of the purposes provided for in the Regulation and must not subsequently use the shares for a different purpose. As an exception to the foregoing, shares repurchased with a view to covering stock option plans may, if no longer needed for this purpose, be re-allocated for cancellation or sold in compliance with AMF requirements relating in particular to blackout periods. Shares repurchased in connection with one of the market practices authorized by the AMF (see above) may
also be re-allocated to one of the purposes contemplated by the Regulation or sold in compliance with AMF requirements. Shares repurchased with a view to their cancellation must be cancelled within 24 months following their acquisition.
During the year ended December 31, 2018, we used the authority delegated by our shareholders to repurchase our shares on the stock market.
Pursuant to our share repurchase programs authorized by our shareholders on May 10, 2017 and on May 2, 2018, we repurchased 15,374,665 of our shares for a weighted average price of €71.55, i.e. a total cost of €1,100 million. Brokerage fees and financial transaction taxes (net of income taxes) amounted to €3.3 million. Our Company did not resort to derivatives to repurchase our own shares.
On April 26, 2018, the Board of Directors cancelled 7,239,803 treasury shares repurchased between October 2017 and the end of March 2018 pursuant to the share repurchase program of the Company.
On December 18, 2018, the Board of Directors cancelled 5,106,804 treasury shares repurchased between April and November 2018 pursuant to the share repurchase program of the Company.
During 2018, pursuant to the liquidity contract, Rothschild & Cie:
◆ purchased 601,296 of our shares at an average weighted price of €74.58 for a total amount of €44,842,701; and
◆ sold 651,046 of our shares at an average weighted price of €74.43 for a total amount of €48,723,473.
In 2018, of the 104,701 shares allocated to stock purchase option plans outstanding at December 31, 2017, 24,030 shares were transferred to grantees of options. In 2018, in addition to the 19,275 shares allocated to restricted share plans outstanding at December 31, 2017, Sanofi:
◆ purchased 3,028,058 of its shares at an average weighted price of €72.88 for a total amount of €220,690,339; and
◆ transferred 1,186,917 of its shares to beneficiaries of performance shares at an average weighted price of €67.19 for a total amount of €78,865,214.
As a result, as of December 31, 2018, all of our 1,941,087 treasury shares, representing 0.16% of our share capital, were allocated to outstanding stock purchase option plans and restricted share plans. At the same date, none of the shares was allocated to the liquidity account or for the purpose of cancellation.
As of December 31, 2018, we directly owned 1,941,087 Sanofi shares with a par value of €2 representing around 0.16% of our share capital and with an estimated value of €145 million, based on the share price at the time of purchase.
212 SANOFI / FORM 20-F 2018
ITEM 10. ADDITIONAL INFORMATION
Reporting obligations
Pursuant to the Regulation, the AMF Regulation and the French Commercial Code, issuers trading in their own shares are subject to the following reporting obligations:
◆ issuers must report all transactions in their own shares to the competent authority of each trading venue on which the shares are admitted to trading or are traded within seven trading days of the transaction in a prescribed format, unless such transactions are carried out pursuant to a liquidity agreement that complies with the ethical code approved by the AMF;
◆ issuers must declare to the AMF on a monthly basis all transactions completed under the share repurchase program unless they provide the same information on a weekly basis; and
◆ post on its website the transactions disclosed and keep that information available to the public for at least a 5-year period from the date of public disclosure.
Ownership of shares by non-French persons
The French Commercial Code and our Articles of Association currently do not limit the right of non-residents of France or non-French persons to own or, where applicable, to vote our securities. However, non-residents of France must file an administrative notice with the French authorities in connection with certain direct and indirect investments in us, including the acquisition of a controlling interest in our Company. Under existing administrative rulings, ownership of 331/3% or more of our share capital or voting rights is regarded as a controlling interest, but a lower percentage might be held to be a controlling interest in certain circumstances depending upon factors such as:
◆ the acquiring party’s intentions;
◆ the acquiring party’s ability to elect directors; or
◆ financial reliance by the company on the acquiring party.
Moreover, certain foreign investments in companies incorporated under French laws are subject to prior authorization from the French Minister of the Economy, where all or part of the target’s business and activity relate to a strategic sector, such as energy, transportation, public health, telecommunications, etc.
Enforceability of civil liabilities
We are a limited liability company (société anonyme) organized under the laws of France, and most of our officers and directors reside outside the United States. In addition, a substantial portion of our assets is located in France.
As a result, investors may find it difficult or be unable to effect service of process within the United States upon or obtain jurisdiction over our Company or our officers and directors in US courts in actions predicated on the civil liability provisions of US securities law. It may also be difficult to enforce against them, either inside or outside the United States, judgments obtained
against them in US courts, or to enforce in US courts, judgments obtained against them in courts in jurisdictions outside the United States, in any action based on civil liabilities under US federal securities laws. There is doubt as to the enforceability against such persons in France, whether in original actions or in actions to enforce judgments of US courts, of liabilities based solely on US federal securities laws. In addition, actions in the United States under US federal securities laws could be affected under certain circumstances by French law No. 68-678 of July 26, 1968 as amended by French Law No. 80-538 of July 16, 1980, which may preclude or restrict the obtaining of evidence in France or from French persons in connection with those actions. Additionally, awards of punitive damages in actions brought in the United States or elsewhere may be unenforceable in France.
C. Material Contracts The Contingent Value Rights Agreement In connection with its acquisition of Genzyme Corporation, now a wholly-owned subsidiary of Sanofi, Sanofi issued one CVR per Genzyme share. On March 30, 2011, Sanofi and American Stock Transfer & Trust Company, LLC (“AST”), as trustee, entered into a Contingent Value Rights Agreement (the “CVR Agreement”) governing the terms of the CVRs. On May 13, 2016, AST tendered its resignation as trustee under the CVR Agreement to Sanofi. As of June 30, 2016, UMB Bank, National Association replaced AST and is the successor trustee under the CVR Agreement.
Pursuant to the terms of the CVR Agreement, a holder of a CVR is entitled to cash payments upon the achievement of contractually defined milestones. The first three milestones (related, respectively, to (i) manufacturing of Cerezyme® and Fabrazyme® (ii) US regulatory approval on or before March 31, 2014 of Lemtrada® for the treatment of MS (the “Approval Milestone”) and (iii) Product Sales Milestone #1, pursuant to which a holder of a CVR would have been entitled to receive $2 per CVR if Lemtrada® sales (as defined in the CVR Agreement) post launch equaled or exceeded a total of $400 million within certain specified periods and territories) were not met. The remaining milestone payments under the CVR Agreement are summarized below:
Product Sales Milestone #2 Payment. $3 per CVR upon the first instance in which Lemtrada® sales (as defined in the CVR Agreement) for a four calendar quarter period are equal to or in excess of $1.8 billion. Given that the Approval Milestone was not achieved, an additional $1 per CVR will be paid should Product Sales Milestone #2 be achieved, totaling $4 per CVR.
Product Sales Milestone #3 Payment. $4 per CVR upon the first instance in which Lemtrada® sales (as defined in the CVR Agreement) for a four calendar quarter period are equal to or in excess of $2.3 billion (however, no quarter in which Lemtrada® sales (as defined in the CVR Agreement) were used to determine the achievement of Product Sales Milestone #1 or #2 shall be included in the calculation of sales for determining whether Product Sales Milestone #3 has been achieved).
SANOFI / FORM 20-F 2018 213
ITEM 10. ADDITIONAL INFORMATION
Product Sales Milestone #4 Payment. $3 per CVR upon the first instance in which Lemtrada® sales (as defined in the CVR Agreement) for a four calendar quarter period are equal to or in excess of $2.8 billion (however, no quarter in which Lemtrada® sales (as defined in the CVR Agreement) were used to determine the achievement of Product Sales Milestone #1, #2 or #3 shall be included in the calculation of sales for determining whether Product Sales Milestone #4 has been achieved).
On February 7, 2018, Sanofi disclosed that, based upon actual sales trends to date, it does not expect that product sales milestones #2 to #4 will be met.
The CVR Agreement will terminate on the earlier of (a) December 31, 2020 and (b) the date that Product Sales Milestone #4 is paid (the “Termination Date”), provided that if any milestone has been achieved prior to the Termination Date, but the associated CVR payment has not been paid on or prior to the Termination Date, the CVR Agreement shall not terminate until such payment has been paid in full in accordance with the terms of the CVR Agreement.
Sanofi has agreed to use diligent efforts (as defined in the CVR Agreement), until the CVR Agreement is terminated, to achieve each of the remaining milestones. However, we are not required to take all possible actions to achieve these goals. Sanofi has also agreed to use its commercially reasonable efforts to maintain a listing for trading of the CVRs on the NASDAQ market.
For more information on Lemtrada® see “Item 4.B Business Overview – Pharmaceutical Products – Multiple Sclerosis”.
The CVR Agreement does not prohibit Sanofi or any of its subsidiaries or affiliates (as defined in the CVR Agreement) from acquiring the CVRs, whether in open market transactions, private transactions or otherwise. Sanofi has certain disclosure obligations in connection with such acquisitions under the CVR Agreement. Sanofi may also, subject to certain terms and conditions as set forth in the CVR Agreement, optionally purchase and cancel all (but not less than all) of the outstanding CVRs at a cash price as set forth in the CVR Agreement if (i) the volume-weighted average price paid per CVR for all CVRs traded over the forty-five trading days prior to such date is less than fifty cents and (ii) Lemtrada® sales (as defined in the CVR Agreement) in the four calendar quarters ended immediately prior to such date are less than $1 billion in the aggregate.
A copy of the form of CVR Agreement is on file with the SEC as Annex B to Amendment No. 2 to the Registration Statement on Form F-4 filed with the Securities and Exchange Commission on March 24, 2011. Reference is made to such exhibit for a more complete description of the terms and conditions of the CVR Agreement, and the foregoing summary of such terms and conditions is qualified in its entirety by such exhibit.
D. Exchange Controls French exchange control regulations currently do not limit the amount of payments that we may remit to non-residents of France. Laws and regulations concerning foreign exchange controls do require, however, that all payments or transfers of funds made by a French resident to a non-resident be handled by an accredited intermediary.
E. Taxation
General
The following generally summarizes the material French and US federal income tax consequences to US holders (as defined below) of purchasing, owning and disposing of our ADSs and ordinary shares (collectively the “Securities”). This discussion is intended only as a descriptive summary and does not purport to be a complete analysis or listing of all potential tax effects of the purchase, ownership or disposition of our Securities. All of the following is subject to change. Such changes could apply retroactively and could affect the consequences described below.
This summary does not constitute a legal opinion or tax advice. Holders are urged to consult their own tax advisers regarding the tax consequences of the purchase, ownership and disposition of Securities in light of their particular circumstances, including the effect of any US federal, state, local or other national tax laws.
A set of tax rules is applicable to French assets that are held by or in foreign trusts. These rules provide inter alia for the inclusion of trust assets in the settlor’s net assets for purpose of applying the French real estate wealth tax, for the application of French gift and death duties to French assets held in trust, for a specific tax on capital on the French assets of foreign trusts not already subject to the French real estate wealth tax and for a number of French tax reporting and disclosure obligations. The following discussion does not address the French tax consequences applicable to Securities held in trusts. If Securities are held in trust, the grantor, trustee and beneficiary are urged to consult their own tax adviser regarding the specific tax consequences of acquiring, owning and disposing of Securities.
The description of the French and US federal income tax consequences set forth below is based on the laws (including, for US federal income tax purposes, the Internal Revenue Code of 1986, as amended (the “Code”), final, temporary and proposed US Treasury Regulations promulgated thereunder and administrative and judicial interpretations thereof) in force as of the date of this annual report, the Convention Between the Government of the United States of America and the Government of the French Republic for the Avoidance of Double Taxation and the Prevention of Fiscal Evasion with Respect to Taxes on Income and Capital of August 31, 1994 (the “Treaty”), which entered into force on December 30, 1995 (as amended by any subsequent protocols, including the protocol of January 13,
214 SANOFI / FORM 20-F 2018
ITEM 10. ADDITIONAL INFORMATION
2009), and the tax regulations issued by the French tax authorities within the Bulletin Officiel des Finances Publiques-Impôts (the “Regulations”) in force as of the date of this report. US holders are advised to consult their own tax advisers regarding their eligibility for Treaty benefits, especially with regard to the “Limitations on Benefits” provision, in light of their own particular circumstances.
For the purposes of this discussion, a US holder is a beneficial owner of Securities that is (i) an individual who is a US citizen or resident for US federal income tax purposes, (ii) a US domestic corporation or certain other entities created or organized in or under the laws of the United States or any state thereof, including the District of Columbia, or (iii) otherwise subject to US federal income taxation on a net income basis in respect of Securities. A non-US holder is a person other than a US holder.
If a partnership holds Securities, the tax treatment of a partner generally will depend upon the status of the partner and the activities of the partnership. If a US holder is a partner in a partnership that holds Securities, the holder is urged to consult its own tax adviser regarding the specific tax consequences of acquiring, owning and disposing of Securities.
This discussion is intended only as a general summary and does not purport to be a complete analysis or listing of all potential tax effects of the acquisition, ownership or disposition of the Securities to any particular investor, and does not discuss tax considerations that arise from rules of general application or that are generally assumed to be known by investors. The discussion applies only to investors that hold our Securities as capital assets that have the US dollar as their functional currency, that are entitled to Treaty benefits under the “Limitation on Benefits” provision contained in the Treaty, and whose ownership of the Securities is not effectively connected to a permanent establishment or a fixed base in France. Certain holders (including, but not limited to, US expatriates, partnerships or other entities classified as partnerships for US federal income tax purposes, banks, insurance companies, regulated investment companies, tax-exempt organizations, financial institutions, persons subject to the alternative minimum tax, persons who acquired the Securities pursuant to the exercise of employee stock options or otherwise as compensation, persons that own (directly, indirectly or by attribution) 5% or more of our voting stock or 5% or more of our outstanding share capital, dealers in securities or currencies, persons that elect to mark their securities to market for US federal income tax purposes, persons that acquire ADSs in “pre-release” transactions (i.e. prior to deposit of the relevant ordinary shares) and persons holding Securities as a position in a synthetic security, straddle or conversion transaction) may be subject to special rules not discussed below. Holders of Securities are advised to consult their own tax advisers with regard to the application of French tax law and US federal income tax law to their particular situations, as well as any tax consequences arising under the laws of any state, local or other foreign jurisdiction.
French taxes
Estate and gift taxes and transfer taxes
In general, a transfer of Securities by gift or by reason of death of a US holder that would otherwise be subject to French gift or inheritance tax, respectively, will not be subject to such French tax by reason of the Convention between the Government of the United States of America and the Government of the French Republic for the Avoidance of Double Taxation and the Prevention of Fiscal Evasion with Respect to Taxes on Estates, Inheritances and Gifts, dated November 24, 1978, unless the donor or the transferor is domiciled in France at the time of making the gift or at the time of his or her death, or the Securities were used in, or held for use in, the conduct of a business through a permanent establishment or a fixed base in France.
Pursuant to Article 235 ter ZD of the French General Tax Code, purchases of Securities are subject to a 0.3% French tax on financial transactions (the “FTFF”) provided that Sanofi’s market capitalization exceeds 1 billion euros as of December 1 of the year preceding the taxation year. A list of companies whose market capitalization exceeds 1 billion euros as of December 1 of the year preceding the taxation year used to be published annually by the French Ministry of Economy. It is now published by the French tax authorities, and could be amended at any time. Pursuant to Regulations BOI-ANNX-000467-20181217 issued on December 17, 2018, purchases of Sanofi’s Securities in 2019 should be subject to the FTFF as the market capitalization of Sanofi exceeded 1 billion euros as of December 1, 2018. In accordance with Article 726-II-d of the French General Tax Code, purchases which are subject to the FTFF should however not be subject to transfer taxes (droits d’enregistrement) in France.
Wealth tax
The French wealth tax (impôt de solidarité sur la fortune) has been replaced with a French real estate wealth tax (impôt sur la fortune immobilière) with effect from January 1, 2018. French real estate wealth tax applies only to individuals and does not generally apply to the Securities if the holder is a US resident, as defined pursuant to the provisions of the Treaty, provided that the individual does not own directly or indirectly a shareholding exceeding 10% of the financial rights and voting rights.
US taxes
Ownership of the securities
Deposits and withdrawals by a US holder of ordinary shares in exchange for ADSs, will not be taxable events for US federal income tax purposes. For US tax purposes, holders of ADSs will be treated as owners of the ordinary shares represented by such ADSs. Accordingly, the discussion that follows regarding the US federal income tax consequences of acquiring, owning and disposing of ordinary shares is equally applicable to ADSs.
SANOFI / FORM 20-F 2018 215
ITEM 10. ADDITIONAL INFORMATION
Information reporting and backup withholding tax
Distributions made to holders and proceeds paid from the sale, exchange, redemption or disposal of Securities may be subject to information reporting to the Internal Revenue Service. Such payments may be subject to backup withholding taxes unless the holder (i) is a corporation or other exempt recipient or (ii) provides a taxpayer identification number and certifies that no loss of exemption from backup withholding has occurred. Holders that are not US persons generally are not subject to information reporting or backup withholding. However, such a holder may be required to provide a certification of its non-US status in connection with payments received within the United States or through a US-related financial intermediary to establish that it is an exempt recipient. Backup withholding is not an additional tax. Amounts withheld as backup withholding may be credited against a holder’s US federal income tax liability. A holder may obtain a refund of any excess amounts withheld under the backup withholding rules by filing the appropriate claim for refund with the Internal Revenue Service and furnishing any required information.
Foreign asset reporting
In addition, a US holder that is an individual (and, to the extent provided in future regulations, an entity), may be subject to recently-enacted reporting obligations with respect to ordinary shares and ADSs if the aggregate value of these and certain other “specified foreign financial assets” exceeds $50,000. If required, this disclosure is made by filing Form 8938 with the US Internal Revenue Service. Significant penalties can apply if holders are required to make this disclosure and fail to do so. In addition, a US holder should consider the possible obligation to file online a FinCEN Form 114 – Foreign Bank and Financial Accounts Report as a result of holding ordinary shares or ADSs. Holders are encouraged to consult their US tax advisors with respect to these and other reporting requirements that may apply to their acquisition of ordinary shares and ADSs.
State and local taxes
In addition to US federal income tax, US holders of Securities may be subject to US state and local taxes with respect to such Securities. Holders of Securities are advised to consult their own tax advisers with regard to the application of US state and local income tax law to their particular situation.
ADSs-Ordinary Shares
French taxes
Taxation of dividends
Under French law, dividends paid by a French corporation, such as Sanofi, to non-residents of France are generally subject to French withholding tax at a rate of 30% (12.8% for distributions made to individuals, and 15% for distributions made to not-for-profit organizations with a head office in a Member State
of the European Economic Area which would be subject to the tax regime set forth under article 206 paragraph 2 of the French General Tax Code if its head office were located in France and which meet the criteria set forth in the Regulations BOI-RPPM-RCM-30-30-10-70-20171004, no 130). Dividends paid by a French corporation, such as Sanofi, towards non-cooperative States or territories, as defined in Article 238-0 A of the French General Tax Code, will generally be subject to French withholding tax at a rate of 75%, irrespective of the tax residence of the beneficiary of the dividends if the dividends are received in such States or territories; however, eligible US holders entitled to Treaty benefits under the “Limitation on Benefits” provision contained in the Treaty who are US residents, as defined pursuant to the provisions of the Treaty and who receive dividends in non-cooperative States or territories, will not be subject to this 75% withholding tax rate.
Under the Treaty, the rate of French withholding tax on dividends paid to an eligible US holder who is a US resident as defined pursuant to the provisions of the Treaty and whose ownership of the ordinary shares or ADSs is not effectively connected with a permanent establishment or fixed base that such US holder has in France, is reduced to 15%, or to 5% if such US holder is a corporation and owns directly or indirectly at least 10% of the share capital of the issuing company; such US holder may claim a refund from the French tax authorities of the amount withheld in excess of the Treaty rates of 15% or 5%, if any. For US holders that are not individuals but are US residents, as defined pursuant to the provisions of the Treaty, the requirements for eligibility for Treaty benefits, including the reduced 5% or 15% withholding tax rates contained in the “Limitation on Benefits” provision of the Treaty, are complicated, and certain technical changes were made to these requirements by the protocol of January 13, 2009. US holders are advised to consult their own tax advisers regarding their eligibility for Treaty benefits in light of their own particular circumstances.
Dividends paid to an eligible US holder may immediately be subject to the reduced rates of 5% or 15% provided that such holder establishes before the date of payment that it is a US resident under the Treaty by completing and providing the depositary with a treaty form (Form 5000). Dividends paid to a US holder that has not filed the Form 5000 before the dividend payment date will be subject to French withholding tax at the rate of 30% and then reduced at a later date to 5% or 15%, provided that such holder duly completes and provides the French tax authorities with the treaty forms Form 5000 and Form 5001 before December 31 of the second calendar year following the year during which the dividend is paid. Pension funds and certain other tax-exempt entities are subject to the same general filing requirements as other US holders except that they may have to supply additional documentation evidencing their entitlement to these benefits.
The depositary agrees to use reasonable efforts to follow the procedures established, or that may be established, by the French tax authorities (i) to enable eligible US holders to qualify
216 SANOFI / FORM 20-F 2018

ITEM 10. ADDITIONAL INFORMATION
for the reduced withholding tax rate provided by the Treaty, if available at the time the dividends are paid, or (ii) to recover any excess French withholding taxes initially withheld or deducted with respect to dividends and other distributions to which such US holders may be eligible from the French tax authorities and (iii) to recover any other available tax credits. In particular, associated forms (including Form 5000 and Form 5001, together with their instructions), will be made available by the depositary to all US holders registered with the depositary, and are also generally available from the US Internal Revenue Service.
The withholding tax refund, if any, ordinarily is paid within 12 months of filing the applicable French Treasury Form, but not before January 15 of the year following the calendar year in which the related dividend is paid.
Tax on sale or other disposition
In general, under the Treaty, a US holder who is a US resident for purposes of the Treaty will not be subject to French tax on any capital gain from the redemption (other than redemption proceeds characterized as dividends under French domestic law), sale or exchange of ordinary shares or ADSs unless the ordinary shares or the ADSs form part of the business property of a permanent establishment or fixed base that the US holder has in France. Special rules apply to holders who are residents of more than one country.
US taxes
Taxation of dividends
For US federal income tax purposes, the gross amount of any distribution paid to US holders (that is, the net distribution received plus any tax withheld therefrom) will be treated as ordinary dividend income to the extent paid or deemed paid out of the current or accumulated earnings and profits of Sanofi (as determined under US federal income tax principles). Dividends paid by Sanofi will not be eligible for the dividends-received deduction generally allowed to corporate US holders.
Subject to certain exceptions for short-term and hedged positions, the US dollar amount of dividends received by an individual US holder with respect to the ADSs or our ordinary shares is currently subject to taxation at a maximum rate of 20% if the dividends are “qualified dividends”. Dividends paid on the ordinary shares or ADSs will be treated as qualified dividends if (i) the issuer is eligible for the benefits of a comprehensive income tax treaty with the United States that the Internal Revenue Service has approved for the purposes of the qualified dividend rules and (ii) the issuer was not, in the year prior to the year in which the dividend was paid, and is not, in the year in which the dividend is paid, a passive foreign investment company (“PFIC”). The Treaty has been approved for the purposes of the qualified dividend rules. Based on our audited financial statements and relevant market and shareholder data, we believe Sanofi was not a PFIC for US federal income tax purposes with respect to its 2018 taxable year. In addition, based
on its current expectations regarding the value and nature of its assets, the sources and nature of its income, and relevant market and shareholder data, we do not anticipate that Sanofi will become a PFIC for its 2019 taxable year. Holders of ordinary shares and ADSs should consult their own tax advisers regarding the availability of the reduced dividend tax rate in light of their own particular circumstances.
If you are a US holder, dividend income received by you with respect to ADSs or ordinary shares generally will be treated as foreign source income for foreign tax credit purposes. The limitation on foreign taxes eligible for credit is calculated separately with respect to specific classes of income. Distributions out of earnings and profits with respect to the ADSs or ordinary shares generally will be treated as “passive category” income (or, in the case of certain US holders, “general category” income). Subject to certain limitations, French income tax withheld in connection with any distribution with respect to the ADSs or ordinary shares may be claimed as a credit against the US federal income tax liability of a US holder if such US holder elects for that year to credit all foreign income taxes. Alternatively, such French withholding tax may be taken as a deduction against taxable income. Foreign tax credits will not be allowed for withholding taxes imposed in respect of certain short-term or hedged positions in Securities and may not be allowed in respect of certain arrangements in which a US holder’s expected economic profit is insubstantial. The US federal income tax rules governing the availability and computation of foreign tax credits are complex. US holders should consult their own tax advisers concerning the implications of these rules in light of their particular circumstances.
To the extent that an amount received by a US holder exceeds the allocable share of our current and accumulated earnings and profits, such excess will be applied first to reduce such US holder’s tax basis in its ordinary shares or ADSs and then, to the extent it exceeds the US holder’s tax basis, it will constitute capital gain from a deemed sale or exchange of such ordinary shares or ADSs (see “– Tax on Sale or Other Disposition”, below).
The amount of any distribution paid in euros will be equal to the US dollar value of the euro amount distributed, calculated by reference to the exchange rate in effect on the date the dividend is received by a US holder of ordinary shares (or by the depositary, in the case of ADSs) regardless of whether the payment is in fact converted into US dollars on such date. US holders should consult their own tax advisers regarding the treatment of foreign currency gain or loss, if any, on any euros received by a US holder that are converted into US dollars on a date subsequent to receipt.
Distributions to holders of additional ordinary shares (or ADSs) with respect to their ordinary shares (or ADSs) that are made as part of a pro rata distribution to all ordinary shareholders generally will not be subject to US federal income tax. However, if a US holder has the option to receive a distribution in shares (or ADSs) or to receive cash in lieu of such shares (or ADSs), the
SANOFI / FORM 20-F 2018 217
ITEM 10. ADDITIONAL INFORMATION
distribution of shares (or ADSs) will be taxable as if the holder had received an amount equal to the fair market value of the distributed shares (or ADSs), and such holder’s tax basis in the distributed shares (or ADSs) will be equal to such amount.
Tax on sale or other disposition
In general, for US federal income tax purposes, a US holder that sells, exchanges or otherwise disposes of its ordinary shares or ADSs will recognize capital gain or loss in an amount equal to the US dollar value of the difference between the amount realized for the ordinary shares or ADSs and the US holder’s adjusted tax basis (determined in US dollars and under US federal income tax rules) in the ordinary shares or ADSs. Such gain or loss generally will be US-source gain or loss, and will be treated as long-term capital gain or loss if the US holder’s holding period in the ordinary shares or ADSs exceeds one year at the time of disposition. If the US holder is an individual, any capital gain generally will be subject to US federal income tax at preferential rates (currently a maximum of 20%) if specified minimum holding periods are met. The deductibility of capital losses is subject to significant limitations.
Medicare tax
Certain US holders who are individuals, estates or trusts are required to pay a Medicare tax of 3.8% (in addition to taxes they would otherwise be subject to) on their “net investment income” which would include, among other things, dividends and capital gains from the ordinary shares and ADSs.
F. Dividends and paying agents N/A
G. Statement by experts N/A
H. Documents on display We are subject to the information requirements of the US Securities Exchange Act of 1934, as amended, or Exchange Act, and, in accordance therewith, we are required to file reports, including this annual report on Form 20-F, and other information with the US Securities and Exchange Commission, or Commission, by electronic means.
You may review a copy of our filings with the Commission, as well as other information furnished to the Commission, including exhibits and schedules filed with it, at the Commission’s public reference room at 100 F Street, N.E., Room 1580, Washington, D.C. 20549. Please call the SEC at 1-800-SEC-0330 for further information. In addition, the Commission maintains an Internet site at http://www.sec.gov that contains reports and other information regarding issuers that file electronically with the Commission (these documents are not incorporated by reference in this annual report).
I. Subsidiary information N/A
218 SANOFI / FORM 20-F 2018
ITEM 11. QUANTITATIVE AND QUALITATIVE DISCLOSURES ABOUT MARKET RISK
Item 11. Quantitative and Qualitative Disclosures about Market Risk(1)
General policy Liquidity risk, foreign exchange risk and interest rate risk, as well as related counterparty risks, are managed centrally by our dedicated treasury team within the Group Finance Department. Where it is not possible to manage those risks centrally – in particular due to regulatory restrictions (such as foreign exchange controls) or local tax restrictions – credit facilities and/or currency lines, guaranteed whenever necessary by the parent company, are contracted by our subsidiaries locally with banks, under the supervision of the central treasury team.
Our financing and investment strategies, and our interest rate and currency hedging strategies, are reviewed monthly by the Group Finance Department.
Our policy prohibits the use of derivatives for speculative purposes.
Liquidity risk We operate a centralized treasury platform whereby all surplus cash and financing needs of our subsidiaries are invested with or funded by the parent company (where permitted by local legislation). The central treasury department manages our current and projected financing, and ensures that Sanofi is able to meet its financial commitments by maintaining sufficient cash and confirmed credit facilities for the size of our operations and the maturity of our debt (see Notes D.17.c and D.17.g to the consolidated financial statements).
We diversify our short-term investments with leading counterparties using money-market products with instant access or with a maturity of less than three months. As of December 31, 2018, cash and cash equivalents amounted to € 6 925 million, and our short-term investments predominantly comprised:
◆ collective investments in euro and US dollar denominated money-market mutual funds. All such funds can be traded on a daily basis and the amount invested in each fund may not exceed 10% of the aggregate amount invested in such funds;
◆ amounts invested directly with banks and non-financial institutions in the form of instant access deposits, term deposits, and Negotiable European Commercial Paper with a maturity of no more than three months.
As of December 31, 2018, the Group also had €8 billion of undrawn general corporate purpose confirmed credit facilities, half expiring December 2020 and half December 2021. Those credit facilities are not subject to financial covenant ratios.
Our policy is to diversify our sources of funding through public or private issuances of debt securities, in the United States (shelf registration statement) and Europe (Euro Medium Term Note program). In addition, our A-1+/P-1 short-term rating gives us access to commercial paper programs in the United States and in France. The average maturity of our total debt was 5.8 years as of December 31, 2018, compared with 4.9 years as of December 31, 2017. During 2018, we did not draw down on our French commercial paper program. Average drawdowns under the US commercial paper program during 2018 were €4.2 billion (maximum €7.7 billion); the average maturity of those drawdowns was three months. As of December 31, 2018, neither of those programs was being utilized.
In the event of a liquidity crisis, we could be exposed to difficulties in calling up our available cash, a scarcity of sources of funding including the above-mentioned programs, and/or a deterioration in their terms. This situation could damage our capacity to refinance our debt or to issue new debt on reasonable terms.
Interest rate risk Sanofi issues debt in two currencies, the euro and the US dollar, and also invests its cash and cash equivalents in those currencies (see Note D.17). The floating-rate portion of this net debt exposes Sanofi to rises in interest rates, primarily in the Eonia and Euribor benchmark rates (for the euro) and in the US Libor and Federal Fund Effective rates (for the US dollar). To optimize the cost of debt or reduce the volatility of debt, Sanofi uses derivative instruments (interest rate swaps, cross currency swaps) that alter the fixed/floating rate split of its net debt.
SANOFI / FORM 20-F 2018 219

ITEM 11. QUANTITATIVE AND QUALITATIVE DISCLOSURES ABOUT MARKET RISK
The projected full-year sensitivity to interest rate fluctuations of our debt, net of cash and cash equivalents for 2019 is as follows:
Change in EUR and USD short-term interest rates
Impact on pre-tax
net income
(€ million)
Impact on pre-tax
income/(expense)
recognized directly
in equity
(€ million)
+100 bp 11 —
+25 bp 3 —
-25 bp (3) —
-100 bp (11) —
Foreign exchange risk
A. Operating foreign exchange risk
A substantial portion of our net sales is generated in countries where the euro, which is our reporting currency, is not the functional currency. In 2018, for example, 33.5% of our net sales were generated in the United States, 22.2% in Emerging Markets other than China (including countries that are, or may in future become, subject to exchange controls), 7.1% in China and 5.0% in Japan. Although we also incur expenses in those countries, the impact of those expenses is not enough wholly to offset the impact of exchange rates on our net sales. Consequently, our operating income may be materially affected
by fluctuations in exchange rates between the euro and other currencies.
We operate a foreign exchange risk hedging policy to reduce the exposure of our operating income to exchange rate movements. This policy involves regular assessments of our worldwide foreign currency exposure, based on foreign-currency transactions carried out by the parent company and its subsidiaries. Those transactions mainly comprise sales, purchases, research costs, co-marketing and co-promotion expenses, and royalties. To reduce the exposure of those transactions to exchange rate movements, we contract hedges using liquid derivative instruments, mainly forward currency purchases and sales, and also currency swaps.
The table below shows operating currency hedging instruments in place as of December 31, 2018, with the notional amount translated into euros at the relevant closing exchange rate (see Note D.20. to the consolidated financial statements for the accounting classification of those instruments as of December 31, 2018).
Operating foreign exchange derivatives as of December 31, 2018:
(€ million) Notional amount Fair value
Forward currency sales 4,002 —
of which US dollar 1,723 (7)
of which Singapore dollar 652 1
of which Chinese yuan renminbi 451 (1)
of which Saudi Arabian Riyal 100 1
of which Russian ruble 88 5
Forward currency purchases 2,036 7
of which US dollar 514 8
of which Singapore dollar 500 1
of which Japanese yen 197 3
of which Chinese yuan renminbi 163 (1)
of which Canadian dollar 106 (2)
Total 6,038 7
220 SANOFI / FORM 20-F 2018
ITEM 11. QUANTITATIVE AND QUALITATIVE DISCLOSURES ABOUT MARKET RISK
The above positions mainly hedge future material foreign-currency cash flows arising after the end of the reporting period in relation to transactions carried out during the year ended December 31, 2018 and recognized in the balance sheet at that date. Gains and losses on hedging instruments (forward contracts) have been and will continue to be calculated and recognized in parallel with the recognition of gains and losses on the hedged items. Due to this hedging relationship, the commercial foreign exchange gain or loss on these items (hedging instruments and hedged transactions) will be immaterial in 2019.
B. Financial foreign exchange risk
The cash pooling arrangements for our foreign subsidiaries outside the euro zone, and some of our financing activities, expose certain of our entities to financial foreign exchange risk (i.e. the risk of changes in the value of borrowings and loans denominated in a currency other than the functional currency of the borrower or lender). That foreign exchange exposure is hedged by the parent company using derivative instruments (currency swaps and forward contracts) that alter the currency split of Sanofi’s net debt once these instruments are taken into account.
The table below shows financial currency hedging instruments in place as of December 31, 2018, with the notional amounts translated into euros at the relevant closing exchange rate (see also Note D.20 to the consolidated financial statements for the accounting classification of these instruments as of December 31, 2018).
Financial foreign exchange derivatives as of December 31, 2018:
(€ million) Notional
amount Fair value Expiry
Forward currency sales 7,762 17
of which US dollar 5,500(1) 38 2019
of which Japanese yen 973 (24) 2019
of which Australian dollar 196 5 2019
Forward currency purchases 7,291 20
of which US dollar 4,165 (17) 2019
of which Singapore dollar 2,022 33 2019
of which Chinese yuan renminbi 427 — 2019
Total 15,053 37
(1) Includes forward currency sales for a nominal amount of $3,615 million maturing in 2019, designated as a hedge of our net investment in Bioverativ. As of 31 December 2018, the fair value of these contracts represents an asset of €24 million booked in Other comprehensive income; the impact on financial income/expense is immaterial.
These forward currency contracts generate a net financial foreign exchange gain or loss arising from the interest rate differential between the hedged currency and the euro, given that the foreign exchange gain or loss on the foreign-currency borrowing and loans is offset by the change in the intrinsic value of the hedging instruments. The interest rate differential is recognized within cost of net debt (see note D.29. to our consolidated financial statements).
We may also hedge some future foreign-currency investment or divestment cash flows.
C. Other foreign exchange risks
A significant proportion of our net assets is denominated in US dollars (see Note D.35. to the consolidated financial statements). As a result, any fluctuation in the exchange rate of the US dollar against the euro automatically impacts the amount of our equity as expressed in euros.
In addition, we use the euro as our reporting currency. Consequently, if one or more European Union Member States were to abandon the euro as a currency, the resulting economic upheavals – in particular, fluctuations in exchange rates – could have a significant impact on the terms under which we can obtain financing and on our financial results, the extent and consequences of which are not currently foreseeable.
Counterparty risk
Our financing and investing transactions, and our currency and interest rate hedges, are contracted with leading counterparties. We set limits for investment and derivative transactions with individual financial institutions, depending on the rating of each institution. Compliance with these limits, which are based on notional amounts weighted by the residual maturity and the nature of the commitment, is monitored on a daily basis.
SANOFI / FORM 20-F 2018 221

ITEM 11. QUANTITATIVE AND QUALITATIVE DISCLOSURES ABOUT MARKET RISK
The table below shows our total exposure as of December 31, 2018 by rating and in terms of our percentage exposure to the dominant counterparty.
(€ million)
Cash and cash
equivalents
(excluding mutual
funds)(a)
Notional
amounts of
currency
hedges(b)
Notional
amounts of
interest rate
hedges(b)
General
corporate
purpose
credit facilities
AA — — — —
AA- 992 5,851 1,136 1,500
A+ 1,622 9,876 2,267(c) 3,500
A 508 3,891 918 2,000
A- 245 1,050 200 500
BBB+ 145 420 — 500
BBB 52 — — —
Unallocated 177 2 — —
Total 3,741 21,090 4,521 8,000
% / rating of dominant counterparty 21% /AA- 18% /AA- 19% /A+ 6% /BBB+
(a) Cash equivalents include mutual fund investments of €3,189 million. (b) The notional amounts are translated into euros at the relevant closing exchange rate as of December 31, 2018. (c) Includes interest rate swaps hedging fixed-rate bonds of €99 million held in a Professional Specialized Investment Fund dedicated to Sanofi, recognized in
Long-term loans, advances and other non-current receivables (see note D.7. to our consolidated financial statements).
As of December 31, 2018, we held investments in euro and US dollar denominated money-market mutual funds. Those instruments have low volatility, low sensitivity to interest rate risk, and a very low probability of loss of principal. The depositary banks of the mutual funds, and of Sanofi itself, have a long-term rating of at least A.
Realization of counterparty risk could impact our liquidity in certain circumstances.
Stock market risk
It is our policy not to trade on the stock market for speculative purposes.
222 SANOFI / FORM 20-F 2018
ITEM 12. DESCRIPTION OF SECURITIES OTHER THAN EQUITY SECURITIES
Item 12. Description of Securities other than Equity Securities
12.A Debt securities Not applicable.
12.B Warrants and rights Not applicable.
12.C Other securities Not applicable.
12.D American depositary shares
General
JPMorgan Chase Bank, N.A. (“JPMorgan”), as depositary, issues Sanofi ADSs in certificated form (evidenced by an ADR) or book-entry form. Each ADR is a certificate evidencing a specific number of Sanofi ADSs. Each Sanofi ADS represents one-half of one Sanofi ordinary share (or the right to receive one-half of one Sanofi ordinary share) deposited with the Paris, France office of BNP Paribas, as custodian. Each Sanofi ADS also represents an interest in any other securities, cash or other property that may be held by the depositary under the deposit agreement. The depositary’s office is located at 4 New York Plaza, 12th Floor, New York, New York 10004.
A holder may hold Sanofi ADSs either directly or indirectly through his or her broker or other financial institution. The following description assumes holders hold their Sanofi ADSs directly, in certificated form evidenced by ADRs. Holders who hold the Sanofi ADSs indirectly must rely on the procedures of their broker or other financial institution to assert the rights of ADR holders described in this section. Holders should consult with their broker or financial institution to find out what those procedures are.
Holders of Sanofi ADSs do not have the same rights as holders of Sanofi shares. French law governs shareholder rights. The rights of holders of Sanofi ADSs are set forth in the deposit agreement between Sanofi and JPMorgan and in the ADR. New York law governs the deposit agreement and the ADRs.
The following is a summary of certain terms of the deposit agreement, as amended. Our form of second amended and restated deposit agreement was filed as an exhibit to our Post-
Effective Amendment No. 1 to Form F-6 filed on February 13, 2015. To the extent any portion of the amendment and restatement would prejudice any substantial existing right of holders of ADSs under the first amended and restated deposit agreement, such portion shall not become effective as to such holders until 30 days after holders have received notice thereof. For more complete information, holders should read the entire second amended and restated deposit agreement and the ADR itself. Holders may also inspect a copy of the current deposit agreement at the depositary’s office.
Share dividends and other distributions
Receipt of dividends and other distributions
The depositary has agreed to pay to holders of Sanofi ADSs the cash dividends or other distributions that it or the custodian receives on the deposited Sanofi ordinary shares and other deposited securities after deducting its fees and expenses. Holders of Sanofi ADSs will receive these distributions in proportion to the number of Sanofi ADSs that they hold.
Cash. The depositary will convert any cash dividend or other cash distribution paid on the shares into U.S. dollars if, in its judgment, it can do so on a reasonable basis and can transfer the U.S. dollars to the United States. If the depositary determines that such a conversion and transfer is not possible, or if any approval from the French government is needed and cannot be obtained within a reasonable period, then the depositary may (1) distribute the foreign currency received by it to the holders of Sanofi ADSs or (2) hold the foreign currency distribution (uninvested and without liability for any interest) for the account of holders of Sanofi ADSs.
In addition, if any conversion of foreign currency, in whole or in part, cannot be effected to some holders of Sanofi ADSs, the deposit agreement allows the depositary to distribute the dividends only to those ADR holders to whom it is possible to do so. It will hold the foreign currency it cannot convert into U.S. dollars for the account of the ADR holders who have not been paid. It will not invest the funds it holds and it will not be liable for any interest.
Before making a distribution, any withholding taxes that must be paid under French law will be deducted. The depositary will distribute only whole U.S. dollars and cents and will round fractional cents down to the nearest whole cent. Exchange rate
fluctuations during a period when the depositary cannot
convert euros into U.S. dollars may result in holders losing
some or all of the value of a distribution.
SANOFI / FORM 20-F 2018 223
ITEM 12. DESCRIPTION OF SECURITIES OTHER THAN EQUITY SECURITIES
Shares. The depositary may, and at our request will, distribute new ADRs representing any shares we distribute as a dividend or free distribution, if we furnish it promptly with satisfactory evidence that it is legal to do so. At its option, the depositary may distribute fractional Sanofi ADSs. If the depositary does not distribute additional Sanofi ADSs, the outstanding ADRs will also represent the new shares. The depositary may withhold any tax or other governmental charges, or require the payment of any required fees and expenses, prior to making any distribution of additional Sanofi ADSs.
Rights to Receive Additional Shares. If we offer holders of Sanofi ordinary shares any rights to subscribe for additional shares or any other rights, the depositary, after consultation with us, will, in its discretion, either (1) make these rights available to holders or (2) dispose of such rights on behalf of holders and make the net proceeds available to holders. The depositary may make rights available to certain holders but not others if it determines it is lawful and feasible to do so. However, if, under the terms of the offering or for any other reason, the depositary may not make such rights available or dispose of such rights and make the net proceeds available, it will allow the rights to lapse. In that case, holders of Sanofi ADSs will receive no value for them.
In circumstances where rights would not otherwise be distributed by the depositary to holders of Sanofi ADSs, a holder of Sanofi ADSs may nonetheless request, and will receive from the depositary, any instruments or other documents necessary to exercise the rights allocable to that holder if the depositary first receives written notice from Sanofi that (1) Sanofi has elected, in its sole discretion, to permit the rights to be exercised and (2) such holder has executed the documents Sanofi has determined, in its sole discretion, are reasonably required under applicable law.
If the depositary makes rights available to holders of Sanofi ADSs, upon instruction from such holders, it will exercise the rights and purchase the shares on such holder’s behalf. The depositary will then deposit the shares and deliver ADRs to such holders. It will only exercise rights if holders of Sanofi ADSs pay it the exercise price and any other charges the rights require such holders to pay.
U.S. securities laws may restrict the sale, deposit, cancellation or transfer of ADRs issued upon exercise of rights. For example, holders of Sanofi ADSs may not be able to trade Sanofi ADSs freely in the United States. In this case, the depositary may deliver Sanofi ADSs under a separate restricted deposit agreement that will contain the same provisions as the deposit agreement, except for changes needed to implement the required restrictions.
Other Distributions. The depositary will distribute to holders of Sanofi ADSs anything else we may distribute on deposited securities (after deduction or upon payment of fees and expenses or any taxes or other governmental charges) by any means it thinks is legal, equitable and practical. If, for any reason, it cannot make the distribution in that way, the depositary may
sell what we distributed and distribute the net proceeds of the sale in the same way it distributes cash dividends, or it may choose any other method to distribute the property it deems equitable and practicable.
The depositary is not responsible if it decides that it is unlawful or impractical to make a distribution available to any holders of Sanofi ADSs. We have no obligation to register Sanofi ADSs, shares, rights or other securities under the U.S. Securities Act of 1933, as amended. We also have no obligation to take any other action to permit the distribution of ADRs, shares, rights or anything else to holders of Sanofi ADSs. This means that holders may not receive the distribution we make on our shares or any value for them if it is illegal or impractical for the depositary to make them available to such holders.
Elective Distributions. Whenever we intend to distribute a dividend payable at the election of shareholders either in cash or in additional shares, we will give prior notice thereof to the depositary and will indicate whether we wish the elective distribution to be made available to holders of Sanofi ADSs. In that case, we will assist the depositary in determining whether that distribution is lawful and reasonably practicable. The depositary will make the election available to holders of Sanofi ADSs only if it is reasonably practicable and if we have provided all the documentation contemplated in the deposit agreement. In that case, the depositary will establish procedures to enable holders of Sanofi ADSs to elect to receive either cash or additional ADSs, in each case as described in the deposit agreement. If the election is not made available to holders of Sanofi ADSs, such holders will receive either cash or additional Sanofi ADSs, depending on what a shareholder in France would receive for failing to make an election, as more fully described in the deposit agreement.
Deposit, withdrawal and cancellation
Delivery of ADRs
The depositary will deliver ADRs if the holder or his or her broker deposit shares or evidence of rights to receive shares with the custodian. Upon payment of its fees and expenses and any taxes or charges, such as stamp taxes or stock transfer taxes or fees, the depositary will register the appropriate number of Sanofi ADSs in the names the holder requests and will deliver the ADRs to the persons the holder requests at its office.
Obtaining Sanofi ordinary shares
A holder may turn in his or her ADRs at the depositary’s office. Upon payment of its fees and expenses and any taxes or charges, such as stamp taxes or stock transfer taxes or fees, the depositary will deliver (1) the underlying shares to an account designated by the holder and (2) any other deposited securities underlying the ADR at the office of a custodian or, at the holder’s request, risk and expense, the depositary will deliver the deposited securities at its office.
224 SANOFI / FORM 20-F 2018

ITEM 12. DESCRIPTION OF SECURITIES OTHER THAN EQUITY SECURITIES
Voting rights
A holder may instruct the depositary to vote the Sanofi ordinary shares underlying his or her Sanofi ADSs at any meeting of Sanofi shareholders, but only if we request that the depositary ask for holder instructions. Otherwise, holders will not be able to exercise their right to vote unless they withdraw the underlying ordinary shares from the ADR program and vote as an ordinary shareholder. However, holders may not know about the meeting sufficiently in advance to timely withdraw the underlying ordinary shares.
If we ask for holder instructions in connection with a meeting of Sanofi shareholders, the depositary will provide materials to holders of Sanofi ADSs in the manner described under the heading “Notices and Reports; Rights of Holders to Inspect Books” below. For any instructions to be valid, the depositary must receive them on or before the date specified in the materials distributed by the depositary. The depositary will endeavor, in so far as practical, subject to French law and the provisions of our statuts, to vote or to have its agents vote the shares or other deposited securities as holders may validly instruct. The depositary will only vote or attempt to vote shares as holders validly instruct.
We cannot guarantee holders that they will receive the voting materials with sufficient time to enable them to return any voting instructions to the depositary in a timely manner to vote their shares. As long as they act in good faith, neither the depositary nor its agents will be responsible for failing to carry out voting instructions or for the manner of carrying out voting instructions. This means that holders may not be able to exercise their
right to vote and there may be nothing holders can do if their
shares are not voted as they requested.
Similar to our shares, Sanofi ADSs evidenced by ADRs that are registered in the name of the same owner for at least two (2) years are eligible for double voting rights so long as certain procedures are followed, as set out in the deposit agreement. For additional information regarding double voting rights, see “Item 10. Additional Information – B. Memorandum and Articles of Association – Voting Rights”.
The deposit agreement allows the depositary and Sanofi to change the voting procedures or require additional voting procedures in addition to the ones described above if necessary or appropriate. For example, holders might be required to
arrange to have their Sanofi ADSs deposited in a blocked
account for a specified period of time prior to a
shareholders’ meeting in order to be allowed to give voting
instructions.
Notices and reports; rights of holders to inspect books
On or before the first date on which we give notice, by publication or otherwise, of any meeting of holders of shares or other deposited securities, or of any adjourned meeting of such holders, or of the taking of any action in respect of any cash or other distributions or the offering of any rights, we will transmit to the depositary a copy of the notice.
Upon notice of any meeting of holders of shares or other deposited securities, if requested in writing by Sanofi, the depositary will, as soon as practicable, mail to the holders of Sanofi ADSs a notice, the form of which is in the discretion of the depositary, containing (1) a summary in English of the information contained in the notice of meeting provided by Sanofi to the depositary, (2) a statement that the holders as of the close of business on a specified record date will be entitled, subject to any applicable provision of French law and of our statuts, to instruct the depositary as to the exercise of the voting rights, if any, pertaining to the amount of shares or other deposited securities represented by their respective ADSs and (3) a statement as to the manner in which such instructions may be given. Notwithstanding the above, the depositary may, to the extent not prohibited by law or regulations, or by the requirements of the NYSE, in lieu of distribution of the materials provided to the depositary as described above, distribute to the holders a notice that provides holders with, or otherwise publicizes to holders, instructions on how to retrieve such materials or receive such materials upon request (i.e. by reference to a website containing the materials for retrieval or a contact for requesting copies of the materials).
The depositary will make available for inspection by ADS holders at the depositary’s office any reports and communications, including any proxy soliciting material, received from us that are both (1) received by the depositary as the holder of the deposited securities and (2) made generally available to the holders of such deposited securities by us. The depositary will also, upon written request, send to ADS holders copies of such reports when furnished by us pursuant to the deposit agreement. Any such reports and communications, including any such proxy soliciting material, furnished to the depositary by us will be furnished in English to the extent such materials are required to be translated into English pursuant to any regulations of the SEC.
The depositary will keep books for the registration of ADRs and transfers of ADRs that at all reasonable times will be open for inspection by the holders provided that such inspection is not for the purpose of communicating with holders in the interest of a business or object other than our business or a matter related to the deposit agreement or the ADRs.
SANOFI / FORM 20-F 2018 225
ITEM 12. DESCRIPTION OF SECURITIES OTHER THAN EQUITY SECURITIES
Fees and expenses
Fees payable by ADS holders
Pursuant to the deposit agreement, holders of our ADSs may have to pay to JPMorgan, either directly or indirectly, fees or charges up to the amounts set forth in the table below.
Associated Fee Depositary Action
$5.00 or less per 100 ADSs (or portion thereof) Execution and delivery of ADRs for distributions and dividends in shares and rights to subscribe for additional shares or rights of any other nature and surrender of ADRs for the purposes of withdrawal, including the termination of the deposit agreement.
$0.05 or less per ADS (or portion thereof) Any cash distribution made pursuant to the deposit agreement, including, among other things:
◆ cash distributions or dividends,
◆ distributions other than cash, shares or rights,
◆ distributions in shares, and
◆ rights of any other nature, including rights to subscribe for additional shares.
Registration fees in effect for the registration of transfers of shares generally on the share register of the company or foreign registrar and applicable to transfers of shares to or from the name of JPMorgan or its nominee to the custodian or its nominee on the making of deposits and withdrawals
As applicable
A fee equal to the fee for the execution and delivery of ADSs which would have been charged as a result of the deposit of such securities
Distributions of securities other than cash, shares or rights
A fee for the reimbursement of such fees, charges and expenses as are incurred by JPMorgan, its agents (and their agents), including BNP Paribas, as custodian (by deductions from cash dividends or other cash distributions or by directly billing investors or by charging the book-entry system accounts of participants acting for them)
Compliance with foreign exchange control regulations or any law or regulation relating to foreign investment, servicing of shares or other deposited securities, sale of securities, delivery of deposited securities or otherwise
Expenses incurred by JPMorgan ◆ Cable, telex and facsimile transmission (where expressly provided for in the deposit agreement)
◆ Foreign currency conversion into U.S. dollars
In addition to the fees outlined above, each holder will be responsible for any taxes or other governmental charges payable on his or her Sanofi ADSs or on the deposited securities underlying his or her Sanofi ADSs. The depositary may refuse to transfer a holder’s Sanofi ADSs or allow a holder to withdraw the deposited securities underlying his or her Sanofi ADSs until such taxes or other charges are paid. It may apply payments owed to a holder or sell deposited securities underlying a holder’s Sanofi ADSs to pay any taxes owed, and the holder will remain liable for any deficiency. If it sells deposited securities, it will, if appropriate, reduce the number of Sanofi ADSs to reflect the sale and pay to the holder any proceeds, or send to the holder any property, remaining after it has paid the taxes. For additional information regarding taxation, see “Item 10. Additional Information – E. Taxation”.
Fees paid to Sanofi by the depositary
JPMorgan, as depositary, has agreed to reimburse Sanofi for certain expenses (subject to certain limits) Sanofi incurs relating to legal fees, investor relations servicing, investor-related presentations, ADR-related advertising and public relations in those jurisdictions in which the ADRs may be listed or otherwise quoted, investor relations channel, perception studies, accountants’ fees in relation to our annual report on Form 20-F or any other expenses directly or indirectly relating to managing the program or servicing the ADR holders. The depositary has also agreed to provide additional amounts to us based on certain performance indicators relating to the ADR facility and fees collected by it. From January 1, 2018 to December 31, 2018, we received a total amount of $11,929,239 from JPMorgan. In addition to these payments,
226 SANOFI / FORM 20-F 2018

ITEM 12. DESCRIPTION OF SECURITIES OTHER THAN EQUITY SECURITIES
JPMorgan has agreed to waive servicing fees we may incur in connection with routine corporate actions such as annual general meetings and dividend distributions, as well as for other assistance JPMorgan may provide to us, such as preparation of tax and regulatory compliance documents for holders and investor relations advisory services.
Changes affecting deposited securities
If we:
◆ change the nominal or par value of our Sanofi ordinary shares;
◆ recapitalize, reorganize, merge or consolidate, liquidate, sell assets, or take any similar action;
◆ reclassify, split up or consolidate any of the deposited securities; or
◆ distribute securities on the deposited securities that are not distributed to holders;
then either:
◆ the cash, shares or other securities received by the depositary will become deposited securities and each Sanofi ADS will automatically represent its equal share of the new deposited securities; or
◆ the depositary may, and will if we ask it to, distribute some or all of the cash, shares or other securities it receives. It may also deliver new ADRs or ask holders to surrender their outstanding ADRs in exchange for new ADRs identifying the new deposited securities.
Disclosure of interests
The obligation of a holder or other person with an interest in our shares to disclose information under French law and under our statuts also applies to holders and any other persons, other than the depositary, who have an interest in the Sanofi ADSs. The consequences for failing to comply with these provisions are the same for holders and any other persons with an interest as a holder of our ordinary shares. For additional information regarding these obligations, see “Item 10. Additional Information – B. Memorandum and Articles of Association – Requirements for Holdings Exceeding Certain Percentages”.
Amendment and termination
We may agree with the depositary to amend the deposit agreement and the ADRs without the consent of the ADS holders for any reason. If the amendment adds or increases fees or charges, except for taxes and other governmental charges or registration fees, cable, telex or facsimile transmission costs, delivery costs or other such expenses, or prejudices a substantial right of holders of Sanofi ADSs, it will only become effective 30 days after the depositary notifies such holders of the amendment. However, we may not be able to provide holders of Sanofi ADSs with prior notice of the effectiveness of any modifications or supplements that are required to accommodate compliance with applicable provisions of law, whether or not those modifications or supplements could be considered to be
materially prejudicial to the substantial rights of holders of Sanofi ADSs. At the time an amendment becomes effective, such
holders will be considered, by continuing to hold their ADR,
to have agreed to the amendment and to be bound by the
ADR and the deposit agreement as amended.
The depositary will terminate the agreement if we ask it to do so. The depositary may also terminate the agreement if the depositary has told us that it would like to resign and we have not appointed a new depositary bank within 90 days. In both cases, the depositary must notify holders of Sanofi ADSs at least 30 days before termination.
After termination, the depositary and its agents will be required to do only the following under the deposit agreement: (1) collect distributions on the deposited securities, (2) sell rights and other property as provided in the deposit agreement and (3) deliver shares and other deposited securities upon cancellation of ADRs. Six months or more after termination, the depositary may sell any remaining deposited securities by public or private sale. After that, the depositary will hold the money it receives on the sale, as well as any other cash it is holding under the deposit agreement, for the pro rata benefit of the holders of Sanofi ADSs that have not surrendered their Sanofi ADSs. It will have no liability for interest. Upon termination of the deposit agreement, the depositary’s only obligations will be to account for the proceeds of the sale and other cash and with respect to indemnification. After termination, our only obligation will be with respect to indemnification and to pay certain amounts to the depositary.
Limitations on obligations and liability to holders of Sanofi ADSs
The deposit agreement expressly limits our obligations and the obligations of the depositary, and it limits our liability and the liability of the depositary. In particular, please note the following:
◆ we and the depositary are obligated only to take the actions specifically set forth in the deposit agreement without gross negligence or bad faith;
◆ we and the depositary are not liable if either is prevented or delayed by law or circumstances beyond its control from performing its obligations under the deposit agreement;
◆ we and the depositary are not liable if either exercises, or fails to exercise, any discretion permitted under the deposit agreement;
◆ we and the depositary have no obligation to become involved in a lawsuit or other proceeding related to the Sanofi ADSs or the deposit agreement on holders’ behalf or on behalf of any other party, unless indemnity satisfactory to it against all expense and liability is furnished as often as may be required;
◆ we and the depositary are not liable for the acts or omissions made by, or the insolvency of, any securities depository, clearing agency or settlement system or the custodian, subject to certain exceptions and to the extent the custodian is not a branch or affiliate of JPMorgan;
SANOFI / FORM 20-F 2018 227
ITEM 12. DESCRIPTION OF SECURITIES OTHER THAN EQUITY SECURITIES
◆ the depositary is not liable for the price received in connection with any sale of securities, the timing thereof or any delays, acts, omissions to act, errors, defaults or negligence on the part of the party so retained in connection with any such sale or proposed sale;
◆ we and the depositary may rely without any liability upon any written notice, request, direction, instruction or other document believed by either of us to be genuine and to have been signed or presented by the proper parties; and
◆ we and the depositary are not liable for any action or nonaction taken in reliance upon the advice of or information from legal counsel, accountants, any person presenting ordinary shares for deposit, any ADS holder, or any other person believed in good faith to be competent to give such advice or information.
In addition, the depositary will not be liable for any acts or omissions made by a successor depositary. Moreover, neither we nor the depositary nor any of our respective agents will be liable to any holder of Sanofi ADSs for any indirect, special, punitive or consequential damages.
Pursuant to the terms of the deposit agreement, we and the depositary have agreed to indemnify each other under certain circumstances.
Requirements for depositary actions
Before the depositary will deliver or register the transfer of Sanofi ADSs, make a distribution on Sanofi ADSs or process a withdrawal of shares, the depositary may require:
◆ payment of stock transfer or other taxes or other governmental charges and transfer or registration fees charged by third parties for the transfer of any shares or other deposited securities;
◆ production of satisfactory proof of the identity and genuineness of any signature or other information it deems necessary; and
◆ compliance with regulations it may establish, from time to time, consistent with the deposit agreement, including presentation of transfer documents.
The depositary may refuse to deliver Sanofi ADSs, register transfers of Sanofi ADSs or permit withdrawals of shares when the transfer books of the depositary or our transfer books are closed, or at any time if the depositary or we think it advisable to do so.
Right to receive the shares underlying the Sanofi ADSs
Holders have the right to cancel their Sanofi ADSs and withdraw the underlying Sanofi ordinary shares at any time except:
◆ when temporary delays arise when we or the depositary have closed our transfer books or the deposit of shares in connection with voting at a shareholders’ meeting, or the payment of dividends;
◆ when the holder or other holders of Sanofi ADSs seeking to withdraw shares owe money to pay fees, taxes and similar charges; or
◆ when it is necessary to prohibit withdrawals in order to comply with any laws or governmental regulations that apply to Sanofi ADSs or to the withdrawal of shares or other deposited securities.
This right of withdrawal may not be limited by any other provision of the deposit agreement.
Pre-release of Sanofi ADSs
Unless we instruct the depositary not to, the deposit agreement permits the depositary to deliver Sanofi ADSs before deposit of the underlying shares. This is called a pre-release of the Sanofi ADSs. The depositary may also deliver shares upon cancellation of pre-released Sanofi ADSs (even if the Sanofi ADSs are cancelled before the pre-release transaction has been closed out). A pre-release is closed out as soon as the underlying shares are delivered to the depositary. The depositary may receive Sanofi ADSs instead of shares to close out a pre-release. Unless otherwise agreed in writing, the depositary may pre-release Sanofi ADSs only under the following conditions: (1) before or at the time of the pre-release, the person to whom the pre-release is being made must represent to the depositary in writing that it or its customer (i) owns the shares or Sanofi ADSs to be deposited, (ii) assigns all beneficial rights, title and interest in such shares or ADRs to the depositary in its capacity as depositary and (iii) will not take any action with respect to such shares or ADRs that is inconsistent with the transfer of beneficial ownership, other than in satisfaction of such pre-release; (2) the pre-release must be fully collateralized with cash, U.S. government securities or other collateral that the depositary considers appropriate; (3) the depositary must be able to close out the pre-release on not more than five business days’ notice; and (4) the depositary may require such further indemnities and credit regulations as it deems appropriate. In addition, the depositary will limit the number of Sanofi ADSs that may be outstanding at any time as a result of pre-release, although the depositary may disregard the limit from time to time, if it thinks it is appropriate to do so. The depositary may retain for its own account any compensation received by it in connection with the foregoing. Any holder of pre-release ADRs should consult its tax and other advisors about the implications of pre-release for its particular situation
228 SANOFI / FORM 20-F 2018
ITEM 13. DEFAULTS, DIVIDEND ARREARAGES AND DELINQUENCIES
Part II
Item 13. Defaults, Dividend Arrearages and Delinquencies N/A
Item 14. Material Modifications to the Rights of Security Holders N/A
Item 15. Controls and Procedures (a) Our Chief Executive Officer and principal financial officer, after
evaluating the effectiveness of our disclosure controls and procedures (as defined in Exchange Act Rule 13a-15(e)) as of the end of the period covered by this Form 20-F, have concluded that, as of such date, our disclosure controls and procedures were effective to ensure that material information relating to Sanofi was timely made known to them by others within Sanofi.
(b) Report of Management on Internal Control Over Financial Reporting.
Management of the Company is responsible for establishing and maintaining adequate internal control over financial reporting, as such term is defined in Exchange Act Rule 13a-15(f). Management assessed the effectiveness of internal control over financial reporting as of December 31, 2018 based on the framework in “Internal Control – Integrated Framework” (2013 framework) issued by the Committee of Sponsoring Organizations of the Treadway Commission (COSO).
Based on that assessment, management has concluded that the Company’s internal control over financial reporting was effective as of December 31, 2018 to provide reasonable assurance regarding the reliability of its financial reporting and the preparation of its financial statements for external purposes, in accordance with generally accepted accounting principles.
Due to its inherent limitations, internal control over financial reporting may not prevent or detect misstatements, and can only provide reasonable assurance regarding the reliability of financial reporting and the preparation of financial statements. Also, projections of any evaluation of effectiveness to future periods are subject to the risk that controls may become inadequate because of changes in conditions, or that the degree of compliance with the policies or procedures may deteriorate.
The effectiveness of the Company’s internal control over financial reporting has been audited by PricewaterhouseCoopers Audit and Ernst & Young et Autres, independent registered public accounting firms, as stated in their report on the Company’s internal control over financial reporting as of December 31, 2018, which is included herein. See paragraph (c) of the present Item 15, below.
(c) See report of PricewaterhouseCoopers Audit and Ernst & Young et Autres, independent registered public accounting firms, included under “Item 18. Financial Statements” on page F-3.
(d) There were no changes to our internal control over financial reporting that occurred during the period covered by this Form 20-F that have materially affected, or are reasonably likely to materially affect, our internal control over financial reporting.
SANOFI / FORM 20-F 2018 229
ITEM 16A. AUDIT COMMITTEE FINANCIAL EXPERT
Item 16A. Audit Committee Financial Expert Our Board of Directors has determined that Fabienne Lecorvaisier, Emmanuel Babeau, Christian Mulliez and Diane Souza, the four directors serving on the Audit Committee, are independent financial experts within the meaning of paragraph 407 of the Sarbanes-Oxley Act of 2002.
The Board of Directors deemed Fabienne Lecorvaisier to be a financial expert based on her education and her experience in corporate finance in various international banks and as Chief Financial Officer of Essilor and Air Liquide. She is now Executive Vice President, in charge of Finance, Operations Control and General Secretariat of Air Liquide Group.
The Board of Directors deemed Emmanuel Babeau to be a financial expert based on his education and his experience in audit and in corporate finance in major corporations, as Chief Financial Officer of Pernod Ricard and Schneider Electric SE, and as chairman of the audit committee of Sodexo. He is now Deputy Chief Executive Officer in charge of Finance and Legal Affairs of Schneider Electric SE.
The Board of Directors deemed Christian Mulliez to be a financial expert taking into account his experience as Executive Vice President, Chief Financial Officer of L’Oréal. Mr. Mulliez is a graduate of the Ecole Supérieure des Sciences Economiques et Commerciales (ESSEC).
The Board of Directors deemed Diane Souza to be a financial expert based on her education (she is a certified public accountant) and her experience in audit and tax in major international corporations, as Chief Financial Officer of Aetna’s Guaranteed Products business, and as Chief Executive Officer of the UnitedHealthcare Specialty Benefits.
The Board of Directors has determined that all four directors meet the independence criteria of US Securities and Exchange Commission Rule 10A-3, although only Fabienne Lecorvaisier, Emmanuel Babeau and Diane Souza meet the French AFEP-MEDEF Code criteria of independence applied by the Board of Directors for general corporate governance purposes (see Item 16G, below).
Item 16B. Code of Ethics We have adopted a financial code of ethics, as defined in Item 16B. of Form 20-F under the Exchange Act. Our financial code of ethics applies to our Chief Executive Officer, Chief Financial Officer, Chief Accounting Officer and other officers performing similar functions, as designated from time to time. Our financial code of ethics is available on our website at www.sanofi.com (information on our website is not incorporated
by reference in this annual report). A copy of our financial code of ethics may also be obtained free of charge by addressing a written request to the attention of Individual Shareholder Relations at our headquarters in Paris. We will disclose any amendment to the provisions of such financial code of ethics on our website.
Item 16C. Principal Accountants’ Fees and Services See Note E. to our consolidated financial statements included at Item 18 of this annual report.
Item 16D. Exemptions from the Listing Standards for Audit Committees N/A
230 SANOFI / FORM 20-F 2018

ITEM 16E. PURCHASES OF EQUITY SECURITIES BY THE ISSUER AND AFFILIATED PURCHASERS
Item 16E. Purchases of Equity Securities by the Issuer and Affiliated Purchasers In 2018, Sanofi made the following purchases of its ordinary shares.
Period
(A) Total
Number
of Shares
Purchased
(B) Average
Price Paid
per Share
(C) Total Number
of Shares
Purchased as
Part of Publicly
Announced
Plans or
Programs(a)
(D) Approximate
Value of Shares
that May Yet Be
Purchased Under
the Plans or
Programs (b)
January 2018 5,495,622 72.78 5,495,622 14,394
February 2018 2,994,251 66.81 2,994,251 14,194
June 2018 1,879,789 67.72 1,879,789 14,921
July 2018 1,165,782 71.94 1,165,782 14,837
August 2018 1,126,817 73.71 1,126,817 14,754
September 2018 848,877 73.81 848,877 14,691
October 2018 1,185,348 75.40 1,185,348 14,602
November 2018 678,179 78.97 678,179 14,548
(a) The Company was authorized to repurchase up to €15,048,238,800 of shares for a period of eighteen months (i.e., through November 2, 2019) by the Annual Shareholders’ Meeting held on May 2, 2018.
(b) Millions of euros.
This schedule does not include purchases and sales conducted by Rothschild & Cie Banque under a liquidity contract that is still
in effect. For more information see Item 10.B Memorandum and Articles of Association – Use of Share Repurchase Programs.
Item 16F. Change in Registrant’s Certifying Accountant N/A
Item 16G. Corporate Governance Sanofi is incorporated under the laws of France, with securities listed on regulated public markets in the United States (NASDAQ Global Select Market) and France (Euronext Paris). Consequently, as described further in our annual report, our corporate governance framework reflects the mandatory provisions of French corporate law, the securities laws and regulations of France and the United States and the rules of the aforementioned public markets.
As a “foreign private issuer,” as defined in rules promulgated under the U.S. Securities Exchange Act of 1934, as amended, (the “Exchange Act”), Sanofi is permitted, pursuant to NASDAQ Stock Market Rule 5615(a)(3), to follow its home country practice in lieu of certain NASDAQ corporate governance requirements applicable to U.S. corporations listed on the NASDAQ Stock
Market. Sanofi has informed NASDAQ that it intends to follow corporate governance standards under French law to the extent permitted by the NASDAQ Stock Market rules and U.S. securities laws, as further discussed below.
We generally follow the “AFEP-MEDEF” corporate governance recommendations for French listed issuers (hereafter referred to as the “AFEP-MEDEF Code”). As a result, our corporate governance framework is similar in many respects to, and provides investor protections that are comparable to – or in some cases, more stringent than – the corresponding rules of the NASDAQ Global Select Market. Nevertheless, there are important differences to keep in mind.
SANOFI / FORM 20-F 2018 231
ITEM 16G. CORPORATE GOVERNANCE
In line with NASDAQ Stock Market rules applicable to domestic issuers, a majority of Sanofi’s Board of Directors is comprised of independent directors. Sanofi evaluates the independence of members of our Board of Directors using the standards of the French AFEP-MEDEF Code as the principal reference. We believe that AFEP-MEDEF’s overarching criteria for independence – no relationship of any kind whatsoever with the Company, its group or the management of either that is such as to color a Board member’s judgment – are on the whole consistent with the goals of the NASDAQ Global Select Market’s rules although the specific tests proposed under the two standards may vary on some points. We have complied with the Audit Committee independence and other requirements of the Rule 10A-3 under the Exchange Act, adopted pursuant to the Sarbanes-Oxley Act of 2002. Based on the independence standards of the AFEP-MEDEF Code, our Audit Committee and Compensation Committee include one non-independent member, Christian Mulliez, as is permitted under the AFEP-MEDEF Code. However, each member of these two Committees meets the independence requirements of NASDAQ’s listing rules and Rule 10A-3 promulgated under the Sarbanes-Oxley Act of 2002, as amended.
Sanofi follows the recommendation of the AFEP-MEDEF Code that at least one meeting not attended by the company’s executive officers be organized each year. Accordingly, Sanofi’s Board Charter provides that the Board of Directors shall organize at least two meetings a year without its executive officers, thereby providing the Chairman with the option to include or not non-independent directors and directors representing employees, as the case may require, depending on the agenda of the meeting. Sanofi’s practice in that respect departs from NASDAQ’s Listing Rule 5605(b)(2), which provides that independent directors must have regularly scheduled meetings at which only independent directors are present.
Under French law, the committees of our Board of Directors are advisory only, and where the NASDAQ Listing Rule 5600 Series would vest certain decision-making powers with specific committees by delegation (e.g. the appointment of Sanofi’s auditors by the Audit Committee), under French law, our Board of Directors remains the only competent body to take such decisions, albeit taking into account the recommendation of the relevant committees. Additionally, under French corporate law, it is the Shareholders of Sanofi voting at the Shareholders’ General Meeting that have the authority to appoint our auditors upon consideration of the proposal of our Board of Directors, although our Board Charter provides that the Board of Directors will make its proposal on the basis of the recommendation of our Audit Committee. We believe that this requirement of French law, together with the additional legal requirement that two sets of
statutory auditors be appointed, share the NASDAQ Global Select Market’s underlying goal of ensuring that the audit of our accounts be conducted by auditors independent from company management.
In addition to the oversight role of our Compensation Committee for questions of management compensation including by way of equity, under French law any option or restricted share plans or other share capital increases, whether for the benefit of senior management or employees, may only be adopted by the Board of Directors pursuant to and within the limits of a shareholder resolution approving the related capital increase and delegating to the Board the authority to implement such operations.
As described above, a number of issues, which could be resolved directly by a board or its committees in the United States, require the additional protection of direct shareholder consultation in France.
Because we are a ‘foreign private issuer’ as described above, our Chief Executive Officer and our Chief Financial Officer issue the certifications required by §302 and §906 of the Sarbanes Oxley Act of 2002 on an annual basis (with the filing of our annual report on Form 20-F) rather than on a quarterly basis as would be the case of a U.S. corporation filing quarterly reports on Form 10-Q.
French corporate law provides that the Board of Directors must vote to approve a broadly defined range of transactions that could potentially create conflicts of interest between Sanofi on the one hand and its Directors and Chief Executive Officer on the other hand, which are then presented to shareholders for approval at the next annual meeting. This legal safeguard provides shareholders with an opportunity to approve significant aspects of the Chief Executive Officer’s compensation package, and it operates in place of certain provisions of the NASDAQ Stock Market Listing Rules.
Sanofi is governed by the French Commercial Code, which provides that an ordinary general meeting of the shareholders may validly deliberate when first convened if the shareholders present or represented hold at least one fifth of the voting shares. If it is reconvened, no quorum is required. The French Commercial Code further provides that the shareholders at an extraordinary general meeting may validly deliberate when first convened only if the shareholders present or represented hold at least one quarter of the voting shares and, if reconvened, one fifth of the voting shares. Therefore, Sanofi will not follow NASDAQ’s Rule 5620(c), which provides that the minimum quorum requirement for a meeting of shareholders is 331⁄3% of the outstanding common voting shares of the company.
Item 16H. Mine Safety Disclosure N/A
232 SANOFI / FORM 20-F 2018
ITEM 17. FINANCIAL STATEMENTS
Part III
Item 17. Financial Statements See Item 18.
Item 18. Financial Statements See pages F-1 through F-110 incorporated herein by reference.
Item 19. Exhibits 1.1 Articles of association (statuts) of Sanofi (English translation).
1.2 Board Charter (Règlement Intérieur) of Sanofi (English translation).
2. The total amount of long-term debt securities authorized under any instrument does not exceed 10% of the total assets of the Company and its subsidiaries on a consolidated basis. We hereby agree to furnish to the SEC, upon its request, a copy of any instrument defining the rights of holders of long-term debt of the Company or of its subsidiaries for which consolidated or unconsolidated financial statements are required to be filed.
4.1 Form of Contingent Value Rights Agreement by and among Sanofi and Trustee (on file with the SEC as Annex B to Amendment No.2 to the Registration Statement on Form F-4 filed on March 24, 2011).
8.1 List of significant subsidiaries, see “Item 4. Information on the Company – C. Organizational Structure” of this 20-F.
12.1 Certification by Olivier Brandicourt, Chief Executive Officer, required by Section 302 of the Sarbanes-Oxley Act of 2002.
12.2 Certification by Jean-Baptiste Chasseloup de Chatillon, Principal Financial Officer, required by Section 302 of the Sarbanes-Oxley Act of 2002.
13.1 Certification by Olivier Brandicourt, Chief Executive Officer, required by Section 906 of the Sarbanes-Oxley Act of 2002.
13.2 Certification by Jean-Baptiste Chasseloup de Chatillon, Principal Financial Officer, required by Section 906 of the Sarbanes-Oxley Act of 2002.
23.1 Consent of Ernst & Young et Autres dated March 8, 2019.
23.2 Consent of PricewaterhouseCoopers Audit dated March 8, 2019.
SANOFI / FORM 20-F 2018 233
Signatures The registrant hereby certifies that it meets all of the requirements for filing on Form 20-F and that it has duly caused and authorized the undersigned to sign this annual report on its behalf.
Sanofi
By: /s/ OLIVIER BRANDICOURT
Name: Olivier Brandicourt
Title: Chief Executive Officer
Date: March 8, 2019
234 SANOFI / FORM 20-F 2018
Report of Independent Registered Public Accounting Firms To the Board of Directors and Shareholders of Sanofi,
Opinion on the consolidated financial statements
We have audited the accompanying consolidated balance sheets of Sanofi and its subsidiaries (together the “Company”) as of December 31, 2018, 2017, and 2016, and the related consolidated income statements and consolidated statements of comprehensive income, changes in equity and cash flows for the years then ended and the related notes (collectively referred to as the “consolidated financial statements”). In our opinion, the consolidated financial statements present fairly, in all material respects, the financial position of the Company as of December 31, 2018, 2017, and 2016, and the results of its operations and its cash flows for the years then ended, in conformity with International Financial Reporting Standards as issued by the International Accounting Standards Board and in conformity with International Financial Reporting Standards as endorsed by the European Union.
We also have audited, in accordance with the standards of the Public Company Accounting Oversight Board (United States) (“PCAOB”), the Company’s internal control over financial reporting as of December 31, 2018, based on criteria established in the Internal Control – Integrated Framework issued by the Committee of Sponsoring Organizations of the Treadway Commission (2013 framework) and our report dated March 8, 2019 expressed an unqualified opinion thereon.
Basis for opinion
These consolidated financial statements are the responsibility of the Company’s management. Our responsibility is to express an opinion on the Company’s consolidated financial statements based on our audits. We are public accounting firms registered with the PCAOB and are required to be independent with respect to the Company in accordance with the U.S. federal securities laws and the applicable rules and regulations of the Securities and Exchange Commission and the PCAOB.
We conducted our audits in accordance with the standards of the PCAOB. Those standards require that we plan and perform the audit to obtain reasonable assurance about whether the consolidated financial statements are free of material misstatement, whether due to error or fraud. Our audits of the consolidated financial statements included performing procedures to assess the risks of material misstatement of the consolidated financial statements, whether due to error or fraud, and performing procedures that respond to those risks. Such procedures included examining, on a test basis, evidence regarding the amounts and disclosures in the consolidated financial statements. Our audits also included evaluating the accounting principles used and significant estimates made by management, as well as evaluating the overall presentation of the consolidated financial statements. We believe that our audits provide a reasonable basis for our opinion.
/s/ PricewaterhouseCoopers Audit Ernst & Young et Autres
/s/ Philippe Vogt /s/ Stéphane Basset
Ernst & Young et Autres and PricewaterhouseCoopers Audit have respectively served as the Company’s auditors since 1986 and 1999.
Neuilly-sur-Seine and Paris-La Défense, France March 8, 2019
SANOFI / FORM 20-F 2018 235
Report of Independent Registered Public Accounting Firms To the Board of Directors and Shareholders of Sanofi,
Opinion on internal control over financial reporting
We have audited Sanofi and its subsidiaries’ (together “the Company”) internal control over financial reporting as of December 31, 2018, based on criteria established in Internal Control – Integrated Framework issued by the Committee of Sponsoring Organizations of the Treadway Commission (2013 Framework) (the “COSO criteria”). In our opinion, the Company maintained, in all material respects, effective internal control over financial reporting as of December 31, 2018, based on the COSO criteria.
We also have audited, in accordance with the standards of the Public Company Accounting Oversight Board (United States) (PCAOB), the consolidated balance sheets of the Company as of December 31, 2018, 2017 and 2016, and the related consolidated income statements and consolidated statements of comprehensive income, changes in equity and cash flows for the years then ended, including the related notes (collectively referred to as the “consolidated financial statements”), and our report dated March 8, 2019 expressed an unqualified opinion thereon.
Basis for opinion
The Company’s management is responsible for maintaining effective internal control over financial reporting and for its assessment of the effectiveness of internal control over financial reporting included in the accompanying Report of Management on Internal Control Over Financial Reporting. Our responsibility is to express an opinion on the Company’s internal control over financial reporting based on our audit. We are public accounting firms registered with the PCAOB and are required to be independent with respect to the Company in accordance with the U.S. federal securities laws and the applicable rules and regulations of the Securities and Exchange Commission and the PCAOB.
We conducted our audit in accordance with the standards of the PCAOB. Those standards require that we plan and perform the
audit to obtain reasonable assurance about whether effective internal control over financial reporting was maintained in all material respects.
Our audit included obtaining an understanding of internal control over financial reporting, assessing the risk that a material weakness exists, testing and evaluating the design and operating effectiveness of internal control based on the assessed risk, and performing such other procedures as we considered necessary in the circumstances. We believe that our audit provides a reasonable basis for our opinion.
Definition and limitations of internal control over financial reporting
A company’s internal control over financial reporting is a process designed to provide reasonable assurance regarding the reliability of financial reporting and the preparation of financial statements for external purposes in accordance with generally accepted accounting principles. A company’s internal control over financial reporting includes those policies and procedures that (1) pertain to the maintenance of records that, in reasonable detail, accurately and fairly reflect the transactions and dispositions of the assets of the company; (2) provide reasonable assurance that transactions are recorded as necessary to permit preparation of financial statements in accordance with generally accepted accounting principles, and that receipts and expenditures of the company are being made only in accordance with authorizations of management and directors of the company; and (3) provide reasonable assurance regarding prevention or timely detection of unauthorized acquisition, use, or disposition of the company’s assets that could have a material effect on the financial statements.
Because of its inherent limitations, internal control over financial reporting may not prevent or detect misstatements. Also, projections of any evaluation of effectiveness to future periods are subject to the risk that controls may become inadequate because of changes in conditions, or that the degree of compliance with the policies or procedures may deteriorate.
/s/ PricewaterhouseCoopers Audit Ernst & Young et Autres
/s/ Philippe Vogt /s/ Stéphane Basset
Ernst & Young et Autres and PricewaterhouseCoopers Audit have respectively served as the Company’s auditors since 1986 and 1999.
Neuilly-sur-Seine and Paris-La Défense, France March 8, 2019
236 SANOFI / FORM 20-F 2018

2018 Consolidated financial statementsThe financial statements are presented in accordance with International Financial Reporting Standards (IFRS).
CONSOLIDATED BALANCE SHEETS – ASSETS F-2
CONSOLIDATED BALANCE SHEETS – EQUITY AND LIABILITIES F-3
CONSOLIDATED INCOME STATEMENTS F-4
CONSOLIDATED STATEMENTS OF COMPREHENSIVE INCOME F-5
CONSOLIDATED STATEMENTS OF CHANGES IN EQUITY F-6
CONSOLIDATED STATEMENTS OF CASH FLOWS F-9
NOTES TO THE CONSOLIDATED FINANCIAL STATEMENTS F-11
INTRODUCTION F-11
A/ Basis of preparation F-11
B/ Summary of significant accounting policies F-17
C/ Principal alliances F-34
D/ Presentation of the financial statements F-36
E/ Principal accountants’ fees and services F-114
F/ List of principal companies included in the consolidation during 2018 F-115
G/ Events subsequent to December 31, 2018 F-118
F-1SANOFI / FORM 20-F 2018

CONSOLIDATED BALANCE SHEETS – ASSETS
Consolidated balance sheets – assets
(€ million) Note
December 31,
2018
December 31,
2017(a)
December 31,
2016(a)
Property, plant and equipment D.3. 9,651 9,579 10,019
Goodwill D.4. 44,235 40,264 40,287
Other intangible assets D.4. 21,889 13,080 10,879
Investments accounted for using the equity method D.6. 3,402 2,847 2,892
Other non-current assets D.7. 2,971 3,364 2,820
Deferred tax assets D.14. 4,613 4,291 4,670
Non-current assets 86,761 73,425 71,567
Inventories D.9. 7,477 6,818 6,896
Accounts receivable D.10. 7,260 7,216 7,311
Other current assets D.11. 2,917 2,005 2,211
Cash and cash equivalents D.13. - D.17. 6,925 10,315 10,273
Current assets 24,579 26,354 26,691
Assets held for sale or exchange D.8. - D.36. 68 34 6,421
Total assets 111,408 99,813 104,679
(a) Includes the effects of first-time application of IFRS 15 on revenue recognition (see Note A.2.1.1.).
F-2 SANOFI / FORM 20-F 2018

CONSOLIDATED BALANCE SHEETS – EQUITY AND LIABILITIES
Consolidated balance sheets – equityand liabilities
(€ million) Note
December 31,
2018
December 31,
2017(a)
December 31,
2016(a)
Equity attributable to equity holders of Sanofi D.15. 58,876 58,070 57,552
Equity attributable to non-controlling interests D.16. 159 169 170
Total equity 59,035 58,239 57,722
Long-term debt D.17. 22,007 14,326 16,815
Non-current liabilities related to business combinations and tonon-controlling interests D.18. 963 1,026 1,378
Non-current provisions and other non-current liabilities D.19. 8,613 9,154 8,834
Deferred tax liabilities D.14. 3,414 1,605 2,292
Non-current liabilities 34,997 26,111 29,319
Accounts payable 5,041 4,633 4,297
Current liabilities related to business combinations and tonon-controlling interests D.18. 341 343 198
Current provisions and other current liabilities D.19.5. 9,361 9,212 10,184
Short-term debt and current portion of long-term debt D.17. 2,633 1,275 1,764
Current liabilities 17,376 15,463 16,443
Liabilities related to assets held for sale or exchange D.8. - D.36. — — 1,195
Total equity and liabilities 111,408 99,813 104,679
(a) Includes the effects of first-time application of IFRS 15 on revenue recognition (see Note A.2.1.1.).
F-3SANOFI / FORM 20-F 2018
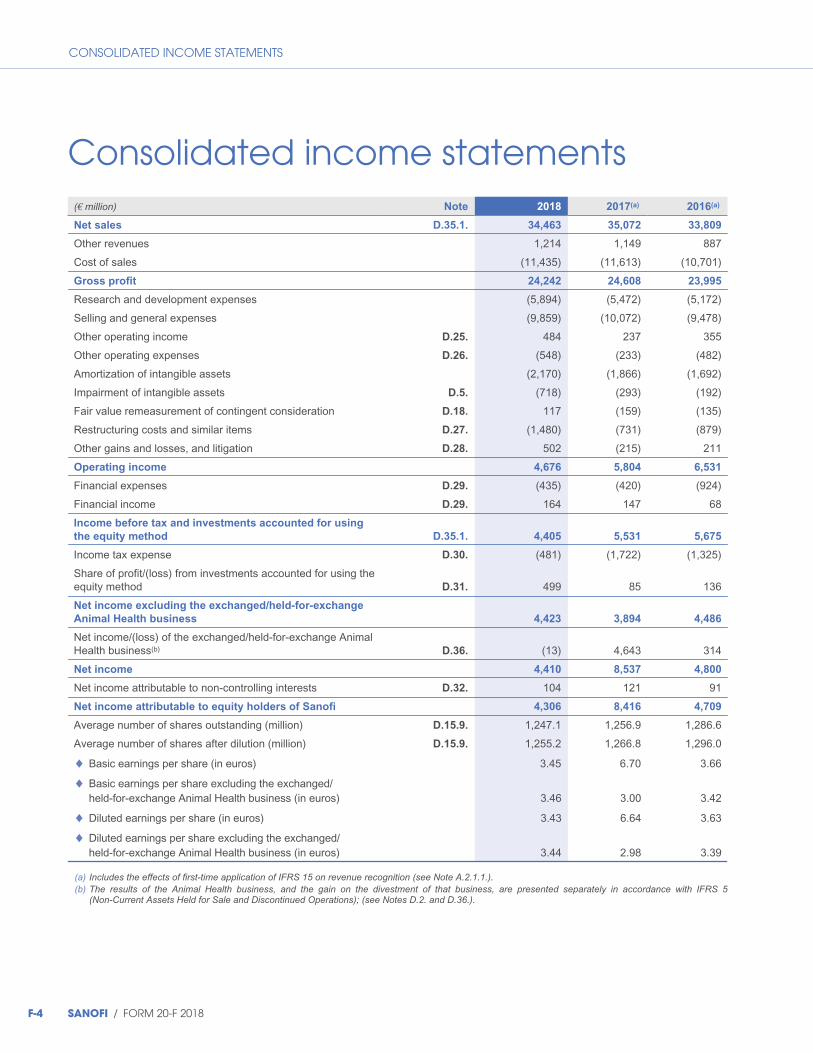
CONSOLIDATED INCOME STATEMENTS
Consolidated income statements(€ million) Note 2018 2017(a) 2016(a)
Net sales D.35.1. 34,463 35,072 33,809
Other revenues 1,214 1,149 887
Cost of sales (11,435) (11,613) (10,701)
Gross profit 24,242 24,608 23,995
Research and development expenses (5,894) (5,472) (5,172)
Selling and general expenses (9,859) (10,072) (9,478)
Other operating income D.25. 484 237 355
Other operating expenses D.26. (548) (233) (482)
Amortization of intangible assets (2,170) (1,866) (1,692)
Impairment of intangible assets D.5. (718) (293) (192)
Fair value remeasurement of contingent consideration D.18. 117 (159) (135)
Restructuring costs and similar items D.27. (1,480) (731) (879)
Other gains and losses, and litigation D.28. 502 (215) 211
Operating income 4,676 5,804 6,531
Financial expenses D.29. (435) (420) (924)
Financial income D.29. 164 147 68
Income before tax and investments accounted for using
the equity method D.35.1. 4,405 5,531 5,675
Income tax expense D.30. (481) (1,722) (1,325)
Share of profit/(loss) from investments accounted for using theequity method D.31. 499 85 136
Net income excluding the exchanged/held-for-exchange
Animal Health business 4,423 3,894 4,486
Net income/(loss) of the exchanged/held-for-exchange AnimalHealth business(b) D.36. (13) 4,643 314
Net income 4,410 8,537 4,800
Net income attributable to non-controlling interests D.32. 104 121 91
Net income attributable to equity holders of Sanofi 4,306 8,416 4,709
Average number of shares outstanding (million) D.15.9. 1,247.1 1,256.9 1,286.6
Average number of shares after dilution (million) D.15.9. 1,255.2 1,266.8 1,296.0
Basic earnings per share (in euros) 3.45 6.70 3.66
Basic earnings per share excluding the exchanged/held-for-exchange Animal Health business (in euros) 3.46 3.00 3.42
Diluted earnings per share (in euros) 3.43 6.64 3.63
Diluted earnings per share excluding the exchanged/held-for-exchange Animal Health business (in euros) 3.44 2.98 3.39
◆
◆
◆
◆
(a) Includes the effects of first-time application of IFRS 15 on revenue recognition (see Note A.2.1.1.).(b) The results of the Animal Health business, and the gain on the divestment of that business, are presented separately in accordance with IFRS 5
(Non-Current Assets Held for Sale and Discontinued Operations); (see Notes D.2. and D.36.).
F-4 SANOFI / FORM 20-F 2018
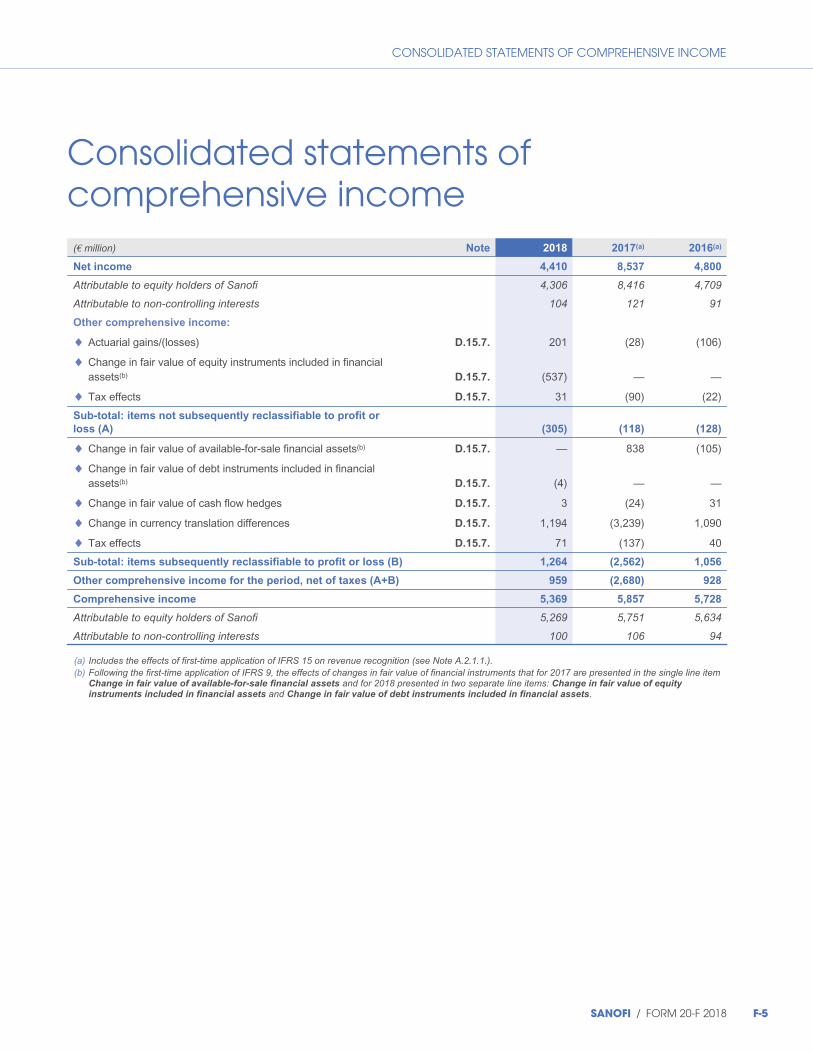
CONSOLIDATED STATEMENTS OF COMPREHENSIVE INCOME
Consolidated statements ofcomprehensive income
(€ million) Note 2018 2017(a) 2016(a)
Net income 4,410 8,537 4,800
Attributable to equity holders of Sanofi 4,306 8,416 4,709
Attributable to non-controlling interests 104 121 91
Other comprehensive income:
Actuarial gains/(losses) D.15.7. 201 (28) (106)
Change in fair value of equity instruments included in financialassets(b) D.15.7. (537) — —
Tax effects D.15.7. 31 (90) (22)
Sub-total: items not subsequently reclassifiable to profit or
loss (A) (305) (118) (128)
Change in fair value of available-for-sale financial assets(b) D.15.7. — 838 (105)
Change in fair value of debt instruments included in financialassets(b) D.15.7. (4) — —
Change in fair value of cash flow hedges D.15.7. 3 (24) 31
Change in currency translation differences D.15.7. 1,194 (3,239) 1,090
Tax effects D.15.7. 71 (137) 40
Sub-total: items subsequently reclassifiable to profit or loss (B) 1,264 (2,562) 1,056
Other comprehensive income for the period, net of taxes (A+B) 959 (2,680) 928
Comprehensive income 5,369 5,857 5,728
Attributable to equity holders of Sanofi 5,269 5,751 5,634
Attributable to non-controlling interests 100 106 94
◆
◆
◆
◆
◆
◆
◆
◆
(a) Includes the effects of first-time application of IFRS 15 on revenue recognition (see Note A.2.1.1.).(b) Following the first-time application of IFRS 9, the effects of changes in fair value of financial instruments that for 2017 are presented in the single line item
Change in fair value of available-for-sale financial assets and for 2018 presented in two separate line items: Change in fair value of equityinstruments included in financial assets and Change in fair value of debt instruments included in financial assets.
F-5SANOFI / FORM 20-F 2018

CONSOLIDATED STATEMENTS OF CHANGES IN EQUITY
Consolidated statements of changes inequity
(€ million)Share
capital
Additional
paid-in
capital and
retained
earnings
Treasury
shares
Stock
options and
other share-
based
payments
Other
comprehensive
income
Attributable
to equity
holders of
Sanofi
Attributable
to non-
controlling
interests Total equity
Balance at January 1,2016 per the publishedfinancial statements 2,611 52,010 (298) 2,814 912 58,049 161 58,210
First-time application ofIFRS 15(a) — (2) — — — (2) — (2)
Balance at January 1,2016 – including theeffects of IFRS 15 2,611 52,008 (298) 2,814 912 58,047 161 58,208
Other comprehensiveincome for the period — (127) — — 1,052 925 3 928
Net income for theperiod(a) — 4,709 — — — 4,709 91 4,800
Comprehensiveincome for theperiod(a) — 4,582 — — 1,052 5,634 94 5,728
Dividend paid out of2015 earnings (€2.93per share) — (3,759) — — — (3,759) — (3,759)
Payment of dividends tonon-controlling interests — — — — — — (110) (110)
Share repurchaseprogram(b) — — (2,905) — — (2,905) — (2,905)
Reduction in sharecapital(b) (45) (1,655) 1,700 — — — — —
Share-based paymentplans:
Exercise of stockoptions(b) 7 212 — — — 219 — 219
Issuance of restrictedshares(b) 7 (7) — — — — — —
Employee shareownership plan(b) 4 96 — — — 100 — 100
Value of servicesobtained fromemployees — — — 227 — 227 — 227
Tax effects of theexercise of stockoptions — — — (9) — (9) — (9)
Change innon-controlling interestswithout loss of control — (2) — — — (2) 27 25
Change innon-controlling interestsarising from divestment — — — — — — (2) (2)
Balance atDecember 31, 2016(a) 2,584 51,475 (1,503) 3,032 1,964 57,552 170 57,722
◆
◆
◆
◆
◆
F-6 SANOFI / FORM 20-F 2018
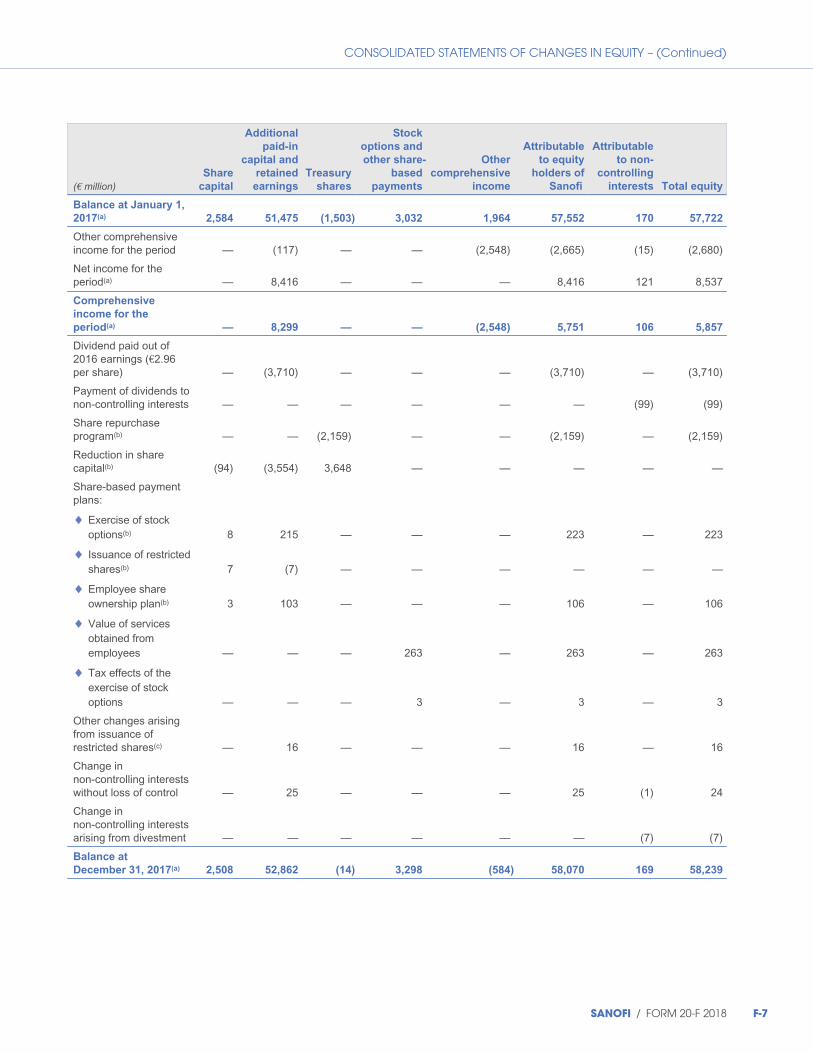
CONSOLIDATED STATEMENTS OF CHANGES IN EQUITY – (Continued)
(€ million)Share
capital
Additional
paid-in
capital and
retained
earnings
Treasury
shares
Stock
options and
other share-
based
payments
Other
comprehensive
income
Attributable
to equity
holders of
Sanofi
Attributable
to non-
controlling
interests Total equity
Balance at January 1,
2017(a) 2,584 51,475 (1,503) 3,032 1,964 57,552 170 57,722
Other comprehensiveincome for the period — (117) — — (2,548) (2,665) (15) (2,680)
Net income for theperiod(a) — 8,416 — — — 8,416 121 8,537
Comprehensive
income for the
period(a) — 8,299 — — (2,548) 5,751 106 5,857
Dividend paid out of2016 earnings (€2.96per share) — (3,710) — — — (3,710) — (3,710)
Payment of dividends tonon-controlling interests — — — — — — (99) (99)
Share repurchaseprogram(b) — — (2,159) — — (2,159) — (2,159)
Reduction in sharecapital(b) (94) (3,554) 3,648 — — — — —
Share-based paymentplans:
Exercise of stockoptions(b) 8 215 — — — 223 — 223
Issuance of restrictedshares(b) 7 (7) — — — — — —
Employee shareownership plan(b) 3 103 — — — 106 — 106
Value of servicesobtained fromemployees — — — 263 — 263 — 263
Tax effects of theexercise of stockoptions — — — 3 — 3 — 3
Other changes arisingfrom issuance ofrestricted shares(c) — 16 — — — 16 — 16
Change innon-controlling interestswithout loss of control — 25 — — — 25 (1) 24
Change innon-controlling interestsarising from divestment — — — — — — (7) (7)
Balance at
December 31, 2017(a) 2,508 52,862 (14) 3,298 (584) 58,070 169 58,239
◆
◆
◆
◆
◆
SANOFI / FORM 20-F 2018 F-7
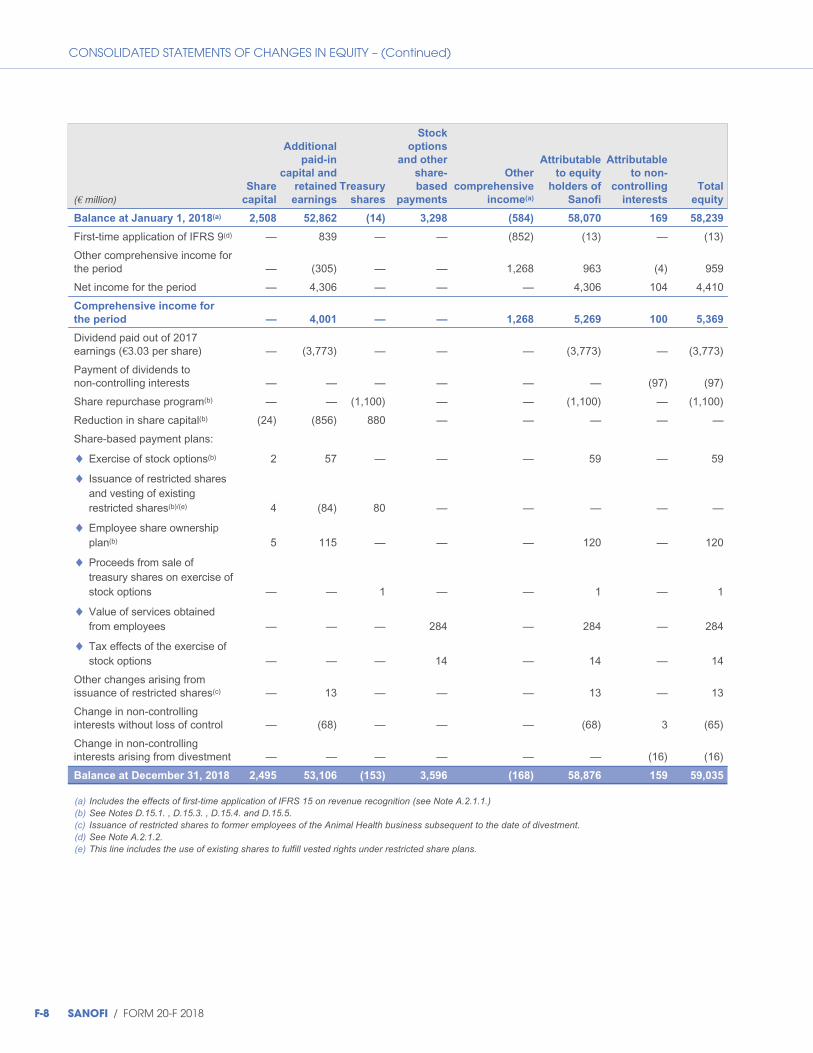
CONSOLIDATED STATEMENTS OF CHANGES IN EQUITY – (Continued)
(€ million)Share
capital
Additional
paid-in
capital and
retained
earnings
Treasury
shares
Stock
options
and other
share-
based
payments
Other
comprehensive
income(a)
Attributable
to equity
holders of
Sanofi
Attributable
to non-
controlling
interests
Total
equity
Balance at January 1, 2018(a) 2,508 52,862 (14) 3,298 (584) 58,070 169 58,239
First-time application of IFRS 9(d) — 839 — — (852) (13) — (13)
Other comprehensive income forthe period — (305) — — 1,268 963 (4) 959
Net income for the period — 4,306 — — — 4,306 104 4,410
Comprehensive income for
the period — 4,001 — — 1,268 5,269 100 5,369
Dividend paid out of 2017earnings (€3.03 per share) — (3,773) — — — (3,773) — (3,773)
Payment of dividends tonon-controlling interests — — — — — — (97) (97)
Share repurchase program(b) — — (1,100) — — (1,100) — (1,100)
Reduction in share capital(b) (24) (856) 880 — — — — —
Share-based payment plans:
Exercise of stock options(b) 2 57 — — — 59 — 59
Issuance of restricted sharesand vesting of existingrestricted shares(b)/(e) 4 (84) 80 — — — — —
Employee share ownershipplan(b) 5 115 — — — 120 — 120
Proceeds from sale oftreasury shares on exercise ofstock options — — 1 — — 1 — 1
Value of services obtainedfrom employees — — — 284 — 284 — 284
Tax effects of the exercise ofstock options — — — 14 — 14 — 14
Other changes arising fromissuance of restricted shares(c) — 13 — — — 13 — 13
Change in non-controllinginterests without loss of control — (68) — — — (68) 3 (65)
Change in non-controllinginterests arising from divestment — — — — — — (16) (16)
Balance at December 31, 2018 2,495 53,106 (153) 3,596 (168) 58,876 159 59,035
◆
◆
◆
◆
◆
◆
(a) Includes the effects of first-time application of IFRS 15 on revenue recognition (see Note A.2.1.1.)(b) See Notes D.15.1. , D.15.3. , D.15.4. and D.15.5.(c) Issuance of restricted shares to former employees of the Animal Health business subsequent to the date of divestment.(d) See Note A.2.1.2.(e) This line includes the use of existing shares to fulfill vested rights under restricted share plans.
F-8 SANOFI / FORM 20-F 2018
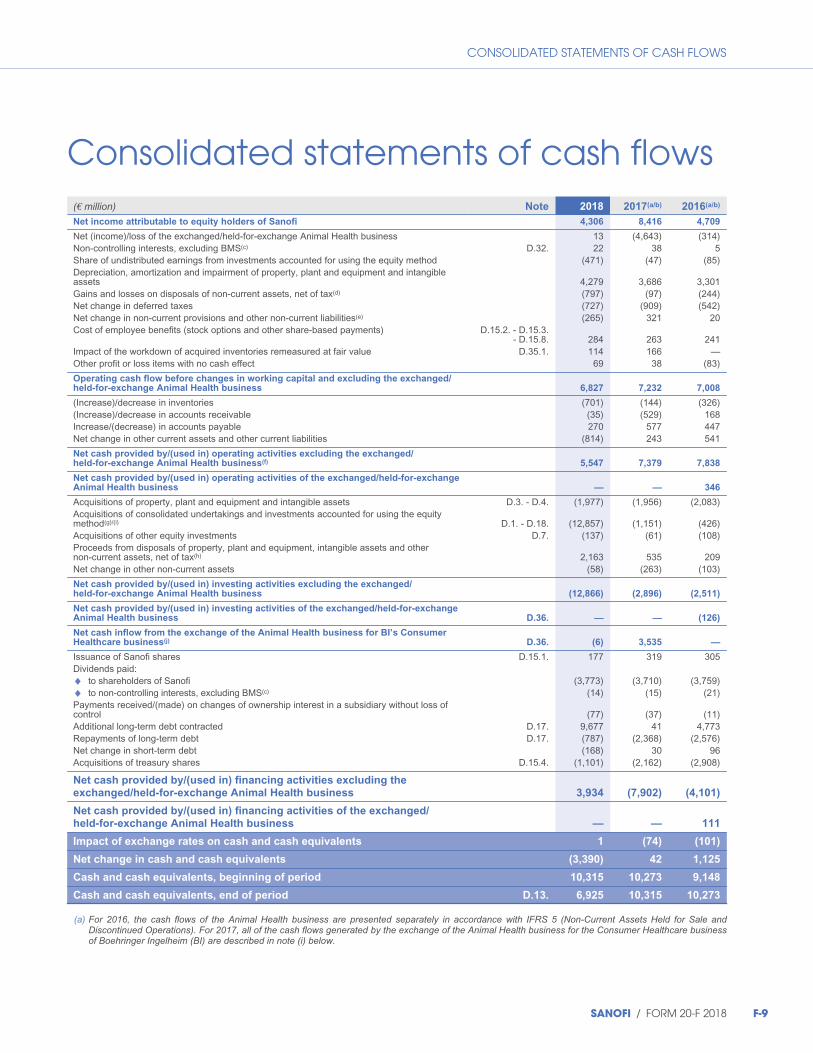
CONSOLIDATED STATEMENTS OF CASH FLOWS
Consolidated statements of cash flows(€ million) Note 2018 2017(a/b) 2016(a/b)
Net income attributable to equity holders of Sanofi 4,306 8,416 4,709
Net (income)/loss of the exchanged/held-for-exchange Animal Health businessNon-controlling interests, excluding BMS(c)
Share of undistributed earnings from investments accounted for using the equity methodDepreciation, amortization and impairment of property, plant and equipment and intangibleassetsGains and losses on disposals of non-current assets, net of tax(d)
Net change in deferred taxesNet change in non-current provisions and other non-current liabilities(e)
Cost of employee benefits (stock options and other share-based payments)
Impact of the workdown of acquired inventories remeasured at fair valueOther profit or loss items with no cash effect
D.32.
D.15.2. - D.15.3.- D.15.8.
D.35.1.
1322
(471)
4,279(797)(727)(265)
284114
69
(4,643)38
(47)
3,686(97)
(909)321
263166
38
(314)5
(85)
3,301(244)(542)
20
241—
(83)
Operating cash flow before changes in working capital and excluding the exchanged/held-for-exchange Animal Health business 6,827 7,232 7,008
(Increase)/decrease in inventories(Increase)/decrease in accounts receivableIncrease/(decrease) in accounts payableNet change in other current assets and other current liabilities
(701)(35)270
(814)
(144)(529)
577243
(326)168447541
Net cash provided by/(used in) operating activities excluding the exchanged/held-for-exchange Animal Health business(f) 5,547 7,379 7,838
Net cash provided by/(used in) operating activities of the exchanged/held-for-exchangeAnimal Health business — — 346
Acquisitions of property, plant and equipment and intangible assetsAcquisitions of consolidated undertakings and investments accounted for using the equitymethod(g)/(i)
Acquisitions of other equity investmentsProceeds from disposals of property, plant and equipment, intangible assets and othernon-current assets, net of tax(h)
Net change in other non-current assets
D.3. - D.4.
D.1. - D.18.D.7.
(1,977)
(12,857)(137)
2,163(58)
(1,956)
(1,151)(61)
535(263)
(2,083)
(426)(108)
209(103)
Net cash provided by/(used in) investing activities excluding the exchanged/held-for-exchange Animal Health business (12,866) (2,896) (2,511)
Net cash provided by/(used in) investing activities of the exchanged/held-for-exchangeAnimal Health business D.36. — — (126)
Net cash inflow from the exchange of the Animal Health business for BI’s ConsumerHealthcare business(j) D.36. (6) 3,535 —
Issuance of Sanofi sharesDividends paid:
to shareholders of Sanofito non-controlling interests, excluding BMS(c)
Payments received/(made) on changes of ownership interest in a subsidiary without loss ofcontrolAdditional long-term debt contractedRepayments of long-term debtNet change in short-term debtAcquisitions of treasury shares
D.15.1.
D.17.D.17.
D.15.4.
177
(3,773)(14)
(77)9,677(787)(168)
(1,101)
319
(3,710)(15)
(37)41
(2,368)30
(2,162)
305
(3,759)(21)
(11)4,773
(2,576)96
(2,908)
Net cash provided by/(used in) financing activities excluding the
exchanged/held-for-exchange Animal Health business 3,934 (7,902) (4,101)
Net cash provided by/(used in) financing activities of the exchanged/
held-for-exchange Animal Health business — — 111
Impact of exchange rates on cash and cash equivalents 1 (74) (101)
Net change in cash and cash equivalents (3,390) 42 1,125
Cash and cash equivalents, beginning of period 10,315 10,273 9,148
Cash and cash equivalents, end of period D.13. 6,925 10,315 10,273
◆
◆
(a) For 2016, the cash flows of the Animal Health business are presented separately in accordance with IFRS 5 (Non-Current Assets Held for Sale andDiscontinued Operations). For 2017, all of the cash flows generated by the exchange of the Animal Health business for the Consumer Healthcare businessof Boehringer Ingelheim (BI) are described in note (i) below.
SANOFI / FORM 20-F 2018 F-9
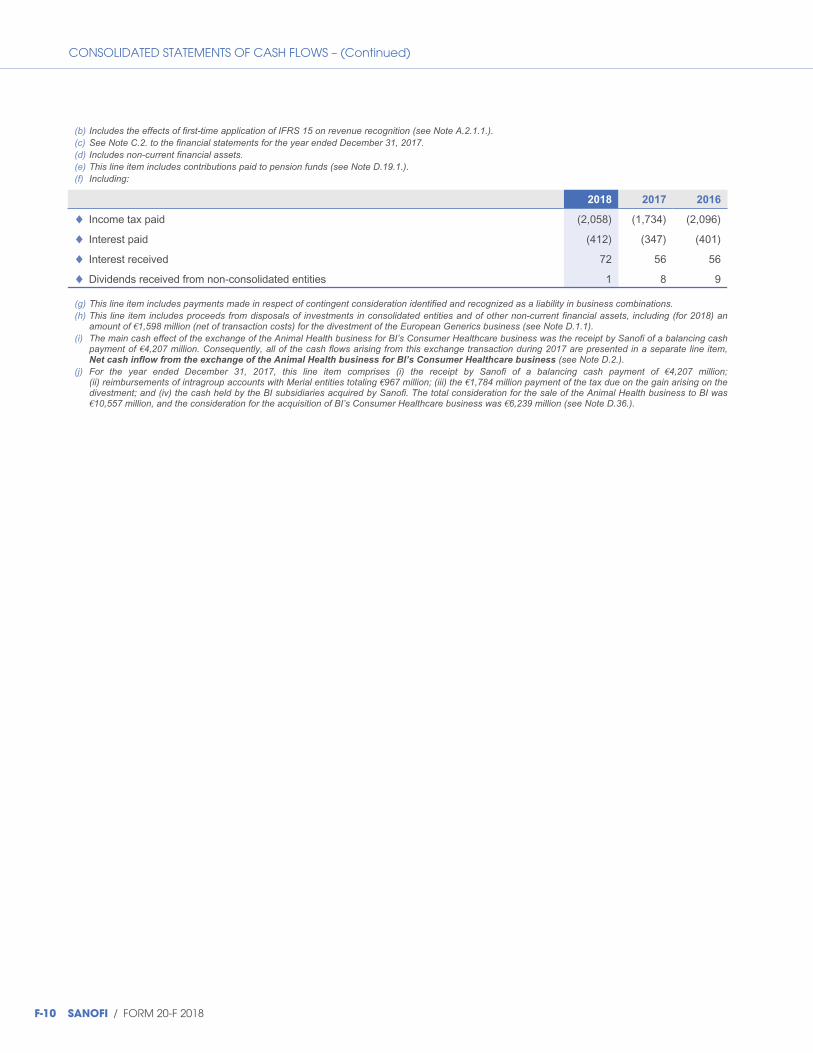
CONSOLIDATED STATEMENTS OF CASH FLOWS – (Continued)
(b) Includes the effects of first-time application of IFRS 15 on revenue recognition (see Note A.2.1.1.).(c) See Note C.2. to the financial statements for the year ended December 31, 2017.(d) Includes non-current financial assets.(e) This line item includes contributions paid to pension funds (see Note D.19.1.).(f) Including:
2018 2017 2016
Income tax paid (2,058) (1,734) (2,096)
Interest paid (412) (347) (401)
Interest received 72 56 56
Dividends received from non-consolidated entities 1 8 9
◆
◆
◆
◆
(g) This line item includes payments made in respect of contingent consideration identified and recognized as a liability in business combinations.(h) This line item includes proceeds from disposals of investments in consolidated entities and of other non-current financial assets, including (for 2018) an
amount of €1,598 million (net of transaction costs) for the divestment of the European Generics business (see Note D.1.1).(i) The main cash effect of the exchange of the Animal Health business for BI’s Consumer Healthcare business was the receipt by Sanofi of a balancing cash
payment of €4,207 million. Consequently, all of the cash flows arising from this exchange transaction during 2017 are presented in a separate line item,Net cash inflow from the exchange of the Animal Health business for BI’s Consumer Healthcare business (see Note D.2.).
(j) For the year ended December 31, 2017, this line item comprises (i) the receipt by Sanofi of a balancing cash payment of €4,207 million;(ii) reimbursements of intragroup accounts with Merial entities totaling €967 million; (iii) the €1,784 million payment of the tax due on the gain arising on thedivestment; and (iv) the cash held by the BI subsidiaries acquired by Sanofi. The total consideration for the sale of the Animal Health business to BI was€10,557 million, and the consideration for the acquisition of BI’s Consumer Healthcare business was €6,239 million (see Note D.36.).
F-10 SANOFI / FORM 20-F 2018
NOTES TO THE CONSOLIDATED FINANCIAL STATEMENTS
Notes to the Consolidated FinancialStatementsIntroductionSanofi, together with its subsidiaries (collectively “Sanofi” or “theCompany”), is a global healthcare leader engaged in theresearch, development and marketing of therapeutic solutionsfocused on patient needs.
Sanofi is listed in Paris (Euronext: SAN) and New York (Nasdaq:SNY).
The consolidated financial statements for the year endedDecember 31, 2018, and the notes thereto, were signed off bythe Sanofi Board of Directors on February 6, 2019.
A/ Basis of preparationA.1. International financial reporting standards(IFRS)The consolidated financial statements cover the twelve-monthperiods ended December 31, 2018, 2017 and 2016.
In accordance with Regulation No. 1606/2002 of the EuropeanParliament and Council of July 19, 2002 on the application ofinternational accounting standards, Sanofi has presented itsconsolidated financial statements in accordance with IFRS sinceJanuary 1, 2005. The term “IFRS” refers collectively tointernational accounting and financial reporting standards (IASsand IFRSs) and to interpretations of the interpretationscommittees (SIC and IFRIC) with mandatory application as ofDecember 31, 2018.
The consolidated financial statements of Sanofi as ofDecember 31, 2018 have been prepared in compliance with IFRSas issued by the International Accounting Standards Board(IASB) and with IFRS as endorsed by the European Union as ofDecember 31, 2018.
IFRS as endorsed by the European Union as of December 31,2018 are available under the heading “IFRS FinancialStatements” via the following web link:
https://www.efrag.org/Endorsement.
The consolidated financial statements have been prepared inaccordance with the IFRS general principles of fair presentation,going concern, accrual basis of accounting, consistency ofpresentation, materiality, and aggregation.
A.2. New standards, amendments andinterpretations
A.2.1. New standards applicable from January 1,2018
IFRS 15 and IFRS 9 became applicable on January 1, 2018,requiring Sanofi to update its accounting policies on revenue andfinancial instruments.
However, those updates do not materially affect the way in whichSanofi accounts for net sales or financial instruments.
As regards net sales, the concept of “transfer of control”, which isused primarily to determine the date of revenue recognition, doesnot call for any change in accounting for the majority oftransactions with Sanofi’s customers. The concept of “variableconsideration” does not materially alter the principles andmethods used to measure net sales, which continue to berecognized net of customer incentives and discounts, and ofcertain sales-based payments paid or payable to the healthcareauthorities.
As regards financial instruments, IFRS 9 changes the terminology usedto classify some sub-categories of non-derivative financial assetswithout affecting the measurement principles applied to those assets,which continue to be measured at either fair value or amortized cost.The valuation models used by Sanofi are unchanged.
Finally, changes to the principles used in determining impairmentof financial assets measured at amortized cost mean that anexpected loss approach is now applied to such assets. Inpractice, this has an immaterial effect on the amount ofimpairment, and mainly affects accounts receivable.
The impacts of the first-time application of IFRS 15 are describedin detail in Note A.2.1.1. The accounting policies applicable to therecognition of net sales and other revenues are described in NoteB.13. The disclosures required by IFRS 15 regarding net salesare presented in Note D.35.1., “Segment results”.
The impacts of the first-time application of IFRS 9 are describedin detail in Note A.2.1.2. The accounting policies applied tonon-derivative financial assets, hedging, liabilities and othernon-derivative financial liabilities effective January 1, 2018 aredescribed in Note B.8.
A.2.1.1 Impacts of the first-time application of IFRS 15
Sanofi applied IFRS 15 retrospectively (in accordance with IAS 8)effective January 1, 2018, without applying any of the practicalexpedients permitted under IFRS 15. The impacts of the first-timeapplication of IFRS 15 on the consolidated balance sheeteffective January 1, 2016 are presented below. The main impactsrelate to:
◆ Contracts with distributors: The concept of “transfer of control”as introduced by IFRS 15 has changed the date on whichSanofi recognizes net sales for a limited number of contractswith distributors. Some distributors that were previously treatedas customers are now treated as agents:
– sales that were previously recognized when the risks andrewards of ownership were transferred to the distributor arenow recognized when control is transferred to the endcustomer;
SANOFI / FORM 20-F 2018 F-11
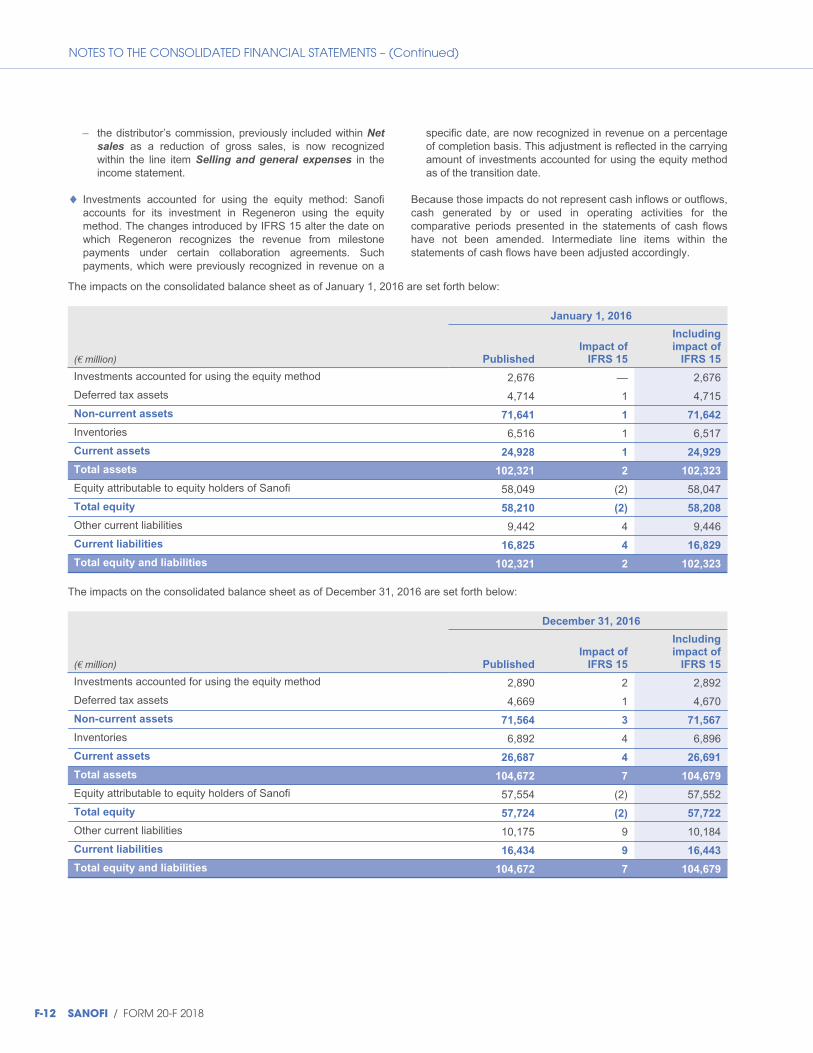
NOTES TO THE CONSOLIDATED FINANCIAL STATEMENTS – (Continued)
– the distributor’s commission, previously included within Net
sales as a reduction of gross sales, is now recognizedwithin the line item Selling and general expenses in theincome statement.
◆ Investments accounted for using the equity method: Sanofiaccounts for its investment in Regeneron using the equitymethod. The changes introduced by IFRS 15 alter the date onwhich Regeneron recognizes the revenue from milestonepayments under certain collaboration agreements. Suchpayments, which were previously recognized in revenue on a
specific date, are now recognized in revenue on a percentageof completion basis. This adjustment is reflected in the carryingamount of investments accounted for using the equity methodas of the transition date.
Because those impacts do not represent cash inflows or outflows,cash generated by or used in operating activities for thecomparative periods presented in the statements of cash flowshave not been amended. Intermediate line items within thestatements of cash flows have been adjusted accordingly.
The impacts on the consolidated balance sheet as of January 1, 2016 are set forth below:
(€ million)
January 1, 2016
Published
Impact of
IFRS 15
Including
impact of
IFRS 15
Investments accounted for using the equity method 2,676 — 2,676
Deferred tax assets 4,714 1 4,715
Non-current assets 71,641 1 71,642
Inventories 6,516 1 6,517
Current assets 24,928 1 24,929
Total assets 102,321 2 102,323
Equity attributable to equity holders of Sanofi 58,049 (2) 58,047
Total equity 58,210 (2) 58,208
Other current liabilities 9,442 4 9,446
Current liabilities 16,825 4 16,829
Total equity and liabilities 102,321 2 102,323
The impacts on the consolidated balance sheet as of December 31, 2016 are set forth below:
(€ million) Published
December 31, 2016
Impact of
IFRS 15
Including
impact of
IFRS 15
Investments accounted for using the equity method 2,890 2 2,892
Deferred tax assets 4,669 1 4,670
Non-current assets 71,564 3 71,567
Inventories 6,892 4 6,896
Current assets 26,687 4 26,691
Total assets 104,672 7 104,679
Equity attributable to equity holders of Sanofi 57,554 (2) 57,552
Total equity 57,724 (2) 57,722
Other current liabilities 10,175 9 10,184
Current liabilities 16,434 9 16,443
Total equity and liabilities 104,672 7 104,679
F-12 SANOFI / FORM 20-F 2018
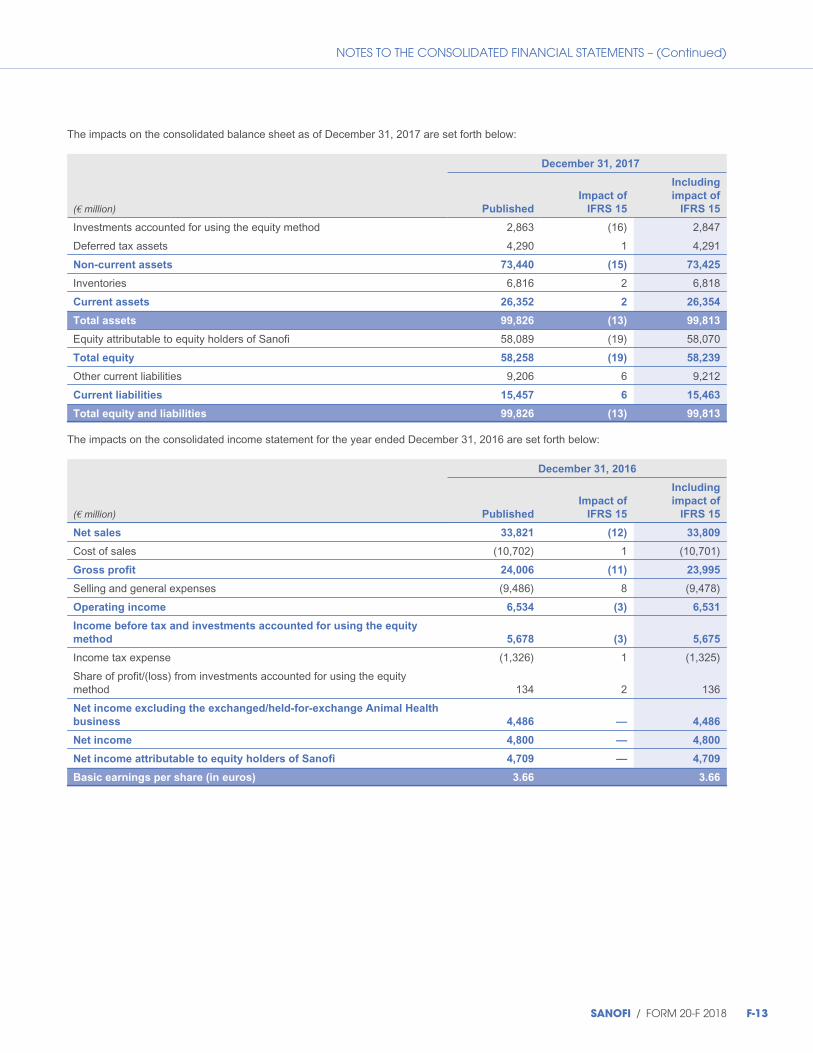
NOTES TO THE CONSOLIDATED FINANCIAL STATEMENTS – (Continued)
The impacts on the consolidated balance sheet as of December 31, 2017 are set forth below:
December 31, 2017
(€ million) Published
Impact of
IFRS 15
Including
impact of
IFRS 15
Investments accounted for using the equity method 2,863 (16) 2,847
Deferred tax assets 4,290 1 4,291
Non-current assets 73,440 (15) 73,425
Inventories 6,816 2 6,818
Current assets 26,352 2 26,354
Total assets 99,826 (13) 99,813
Equity attributable to equity holders of Sanofi
Total equity
58,089
58,258
(19)
(19)
58,070
58,239
Other current liabilities 9,206 6 9,212
Current liabilities 15,457 6 15,463
Total equity and liabilities 99,826 (13) 99,813
The impacts on the consolidated income statement for the year ended December 31, 2016 are set forth below:
December 31, 2016
(€ million) Published
Impact of
IFRS 15
Including
impact of
IFRS 15
Net sales 33,821 (12) 33,809
Cost of sales (10,702) 1 (10,701)
Gross profit 24,006 (11) 23,995
Selling and general expenses (9,486) 8 (9,478)
Operating income 6,534 (3) 6,531
Income before tax and investments accounted for using the equity
method 5,678 (3) 5,675
Income tax expense (1,326) 1 (1,325)
Share of profit/(loss) from investments accounted for using the equitymethod 134 2 136
Net income excluding the exchanged/held-for-exchange Animal Health
business 4,486 — 4,486
Net income 4,800 — 4,800
Net income attributable to equity holders of Sanofi 4,709 — 4,709
Basic earnings per share (in euros) 3.66 3.66
SANOFI / FORM 20-F 2018 F-13

NOTES TO THE CONSOLIDATED FINANCIAL STATEMENTS – (Continued)
The impacts on the consolidated income statement for the year ended December 31, 2017 are set forth below:
December 31, 2017
(€ million) Published
Impact of
IFRS 15
Including
impact of
IFRS 15
Net sales 35,055 17 35,072
Cost of sales (11,611) (2) (11,613)
Gross profit 24,593 15 24,608
Selling and general expenses (10,058) (14) (10,072)
Operating income 5,803 1 5,804
Income before tax and investments accounted for using the equity
method 5,530 1 5,531
Income tax expense (1,722) — (1,722)
Share of profit/(loss) from investments accounted for using the equitymethod 104 (19) 85
Net income excluding the exchanged/held-for-exchange Animal Health
business 3,912 (18) 3,894
Net income 8,555 (18) 8,537
Net income attributable to equity holders of Sanofi 8,434 (18) 8,416
Basic earnings per share (in euros) 6.71 6.70
A.2.1.2. Impacts of the first-time application of IFRS 9
Sanofi applied IFRS 9 effective January 1, 2018.
IFRS 9 changes the terminology used to classify somesub-categories of non-derivative financial assets without affectingthe measurement principles applied to those assets, whichcontinue to be measured at either fair value or amortized cost.The valuation models used by Sanofi are unchanged. In
accordance with the transition provisions of IFRS 9, thosereclassifications are made prospectively, and consequently donot require any restatement of published information for priorperiods.
IFRS 9 does not alter the accounting treatment of financialliabilities or derivative instruments.
F-14 SANOFI / FORM 20-F 2018
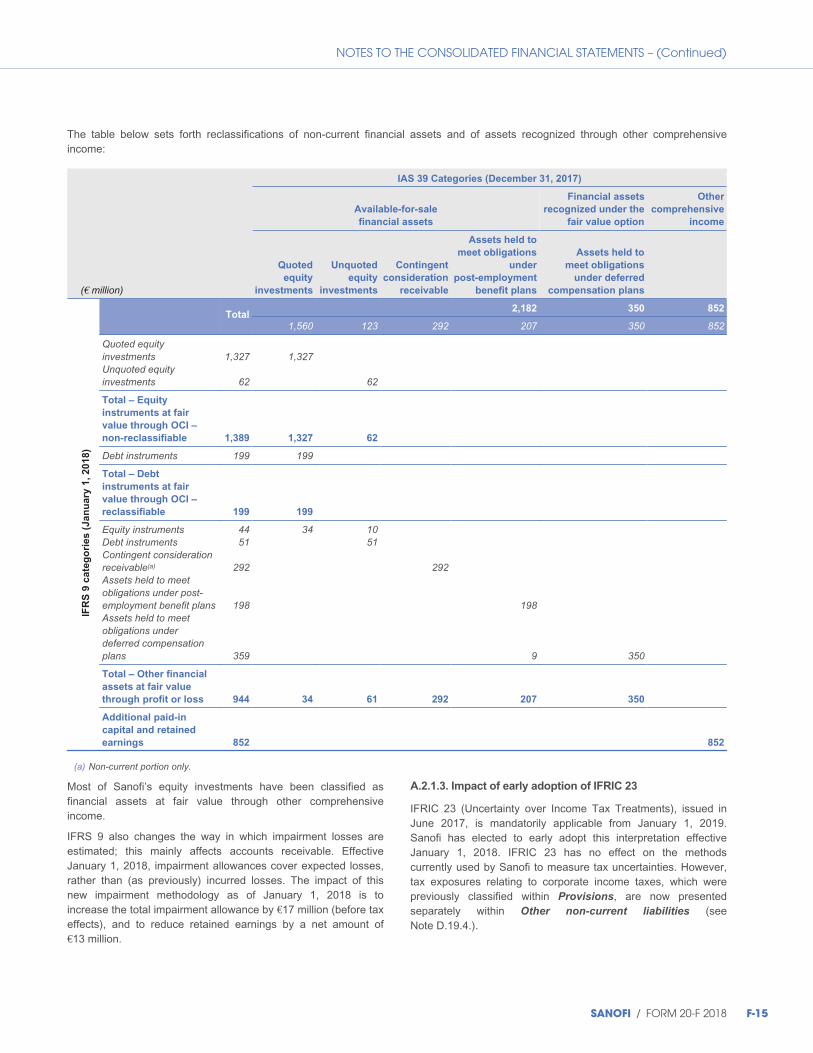
NOTES TO THE CONSOLIDATED FINANCIAL STATEMENTS – (Continued)
The table below sets forth reclassifications of non-current financial assets and of assets recognized through other comprehensiveincome:
IFR
S 9
cate
gorie
s (J
anua
ry 1
, 201
8)
IAS 39 Categories (December 31, 2017)
Available-for-sale
financial assets
Financial assets
recognized under the
fair value option
Other
comprehensive
income
(€ million)
Quoted
equity
investments
Unquoted
equity
investments
Contingent
consideration
receivable
Assets held to
meet obligations
under
post-employment
benefit plans
Assets held to
meet obligations
under deferred
compensation plans
Total2,182 350 852
1,560 123 292 207 350 852
Quoted equityinvestmentsUnquoted equityinvestments
1,327
62
1,327
62
Total – Equity
instruments at fair
value through OCI –
non-reclassifiable 1,389 1,327 62
Debt instruments 199 199
Total – Debt
instruments at fair
value through OCI –
reclassifiable 199 199
Equity instruments 44 34 10Debt instruments 51 51Contingent considerationreceivable(a) 292 292Assets held to meetobligations under post-employment benefit plans 198 198Assets held to meetobligations underdeferred compensationplans 359 9 350
Total – Other financial
assets at fair value
through profit or loss 944 34 61 292 207 350
Additional paid-in
capital and retained
earnings 852 852
(a) Non-current portion only.
Most of Sanofi’s equity investments have been classified asfinancial assets at fair value through other comprehensiveincome.
IFRS 9 also changes the way in which impairment losses areestimated; this mainly affects accounts receivable. EffectiveJanuary 1, 2018, impairment allowances cover expected losses,rather than (as previously) incurred losses. The impact of thisnew impairment methodology as of January 1, 2018 is toincrease the total impairment allowance by €17 million (before taxeffects), and to reduce retained earnings by a net amount of€13 million.
A.2.1.3. Impact of early adoption of IFRIC 23
IFRIC 23 (Uncertainty over Income Tax Treatments), issued inJune 2017, is mandatorily applicable from January 1, 2019.Sanofi has elected to early adopt this interpretation effectiveJanuary 1, 2018. IFRIC 23 has no effect on the methodscurrently used by Sanofi to measure tax uncertainties. However,tax exposures relating to corporate income taxes, which werepreviously classified within Provisions, are now presentedseparately within Other non-current liabilities (seeNote D.19.4.).
SANOFI / FORM 20-F 2018 F-15
NOTES TO THE CONSOLIDATED FINANCIAL STATEMENTS – (Continued)
A.2.2. New pronouncements issued by the IASB andapplicable from 2019 or later
This note describes standards, amendments and interpretationsissued by the IASB that will have mandatory application in 2019or subsequent years, and Sanofi’s position regarding futureapplication. Sanofi has not early adopted any of those standards,amendments or interpretations in its 2018 consolidated financialstatements.
A.2.2.1 IFRS 16 (Leases)
In January 2016 the IASB issued IFRS 16 (Leases), which alignsthe balance sheet accounting treatment of operating leases onthat of finance leases (recognition of a liability for future leasepayments, and of an asset for the associated rights of use). Thefirst-time application of IFRS 16 will also lead to a change inpresentation:
◆ in the income statement: the lease expense currentlyrecognized as a component of Operating income will, underIFRS 16, be recognized partly as depreciation expense withinOperating income, and partly within Financial expenses;
◆ in the statement of cash flows: the lease payments currentlypresented within Net cash provided by/(used in) operating
activities will, under IFRS 16, be presented within Net cash
provided by/(used in) financing activities to the extent thatthose payments are allocated to repayment of the leaseliability.
IFRS 16 is applicable to annual reporting periods beginning on orafter January 1, 2019.
Most of the leases contracted by Sanofi are operating leases (asdefined by IAS 17) in which Sanofi is the lessee. Those leases,except for short-term leases and leases of low-value assets, willbe recognized in the balance sheet as (i) a right-of-use asset and(ii) a liability for future lease payments. The main assets leasedby Sanofi are buildings, cars, and computer equipment.
Sanofi has reviewed its main service and supply contracts toidentify potential embedded leases. The embedded leasesidentified in that review will not have a material impact on theconsolidated financial statements.
Sanofi has elected to adopt the following methods for the first-time application of IFRS 16:
◆ IFRS 16 will be applied as of January 1, 2019 with norestatement of prior periods, using the modified retrospectiveapproach;
◆ where a service contract contains a lease, Sanofi will recognizethe lease component as a stand-alone lease separately fromthe non-lease components;
◆ lease liabilities will be discounted using the incrementalborrowing rate at the transition date, taking account of theresidual lease term and the risk associated with the specificeconomic environment of the leased asset.
At this stage, Sanofi estimates that the liability for future leasepayments determined in accordance with IFRS 16 would liebetween €1.2 billion and €1.6 billion as of January 1, 2019. Theamount of the right-of-use asset will equal the amount of thatliability, plus advance payments made and minus accruedexpenses.
A reconciliation between the lease liability determined underIFRS 16 and the obligation determined under IAS 17 foroperating leases (as disclosed in Note D.21. to the consolidatedfinancial statements) will be presented in the opening balancesheet of the 2019 financial year and disclosed during the annualperiod in IFRS 16 becomes applicable. Sanofi expects the maindifferences will arise from:
◆ leases that were committed at the end of 2018 but had not yetcommenced;
◆ extension or termination options, which are incorporated intothe lease term under the new lease term definition;
◆ short-term leases and low-value assets, which are included inoperating lease commitments under IAS 17 but will not berecognized in the balance sheet under IFRS 16;
◆ the effect of discounting the lease liability.
A.2.2.2. Amendments, annual improvements and
interpretations
During 2018, the IASB published a number of amendments whichSanofi does not expect to have a material effect, including:
◆ “Plan Amendment, Curtailment or Settlement” (amendment toIAS 19), issued on February 7, 2018, will be applicableprospectively to plan amendments from January 1, 2019onwards subject to endorsement by the European Union.
◆ “Definition of a Business” (amendment to IFRS 3), issued onOctober 22, 2018, will apply prospectively to businesscombinations from January 1, 2020 onwards subject toendorsement by the European Union.
Sanofi will not early adopt those amendments.
A.3. Use of estimates and judgments
The preparation of financial statements requires management tomake reasonable estimates and assumptions based oninformation available at the date of the finalization of the financialstatements. Those estimates and assumptions may affect thereported amounts of assets, liabilities, revenues and expenses inthe financial statements, and disclosures of contingent assetsand contingent liabilities as of the date of the review of thefinancial statements. Examples of estimates and assumptionsinclude:
◆ amounts deducted from sales for projected sales returns,chargeback incentives, rebates and price reductions (seeNotes B.13.1. and D.23.);
F-16 SANOFI / FORM 20-F 2018
NOTES TO THE CONSOLIDATED FINANCIAL STATEMENTS – (Continued)
◆ impairment of property, plant and equipment, intangible assets,and investments accounted for using the equity method (seeNotes B.6. and D.5.);
◆ the valuation of goodwill and the valuation and useful life ofacquired intangible assets (see Notes B.3.2. , B.4.3. , D.4. andD.5.);
◆ the measurement of equity investments in unquoted entities(see Notes B.8.5. and D12.);
◆ the measurement of contingent consideration receivable inconnection with asset divestments (see Notes B.8.5. andD.12.);
◆ the measurement of financial assets at amortized cost (seeNote B.8.5.);
◆ the amount of post-employment benefit obligations (see NotesB.23. and D.19.1.);
◆ the amount of provisions for restructuring, litigation, tax risksand environmental risks, other than those related to incometaxes (see Notes B.12., B.19., B.20., D.19. and D.22.);
◆ the amount of deferred tax assets resulting from tax lossesavailable for carry-forward and deductible temporarydifferences (see Notes B.22. and D.14.);
◆ the direct and indirect impacts recorded in 2017 of the US taxreform (Tax Cuts and Jobs Act of 2017), including theestimated tax charge on deemed repatriation that is attributableto the accumulated earnings of non-US operations (see NoteD.19.4.);
◆ the measurement of contingent consideration (see Notes B.3.and D.18.);
◆ which exchange rate to use at the end of the reporting periodfor the translation of accounts denominated in foreigncurrencies, and of financial statements of foreign subsidiaries,in cases where more than one exchange rate exists for a givencurrency (see Note A.4.).
Actual results could differ from these estimates.
A.4. Hyperinflation
Under IAS 29, (Financial Reporting in HyperinflationaryEconomies), non-monetary balance sheet items must be restatedusing a general price index; monetary items are not restated.Items in the income statement and the statement ofcomprehensive income must be restated by applying the changein the general price index from the dates when the income andexpense items were initially recorded in the financial statements.
In 2018, Sanofi continued to account for subsidiaries based inVenezuela using the full consolidation method, on the basis thatthe criteria for control as specified in IFRS 10 (ConsolidatedFinancial Statements) are still met.
In 2016, in light of changes to the foreign exchange system,economic and political developments and the scarcity of USdollar cash in Venezuela, Sanofi changed the exchange rate
used to translate its Venezuelan operations and adopted the“DICOM” rate. This change led to the recognition of a foreignexchange loss of €102 million in 2016.
In 2018, the Venezuelan government made further changes tothe foreign exchange system. At the end of August the “DICOM”rate, which had been the compulsory rate since the end ofJanuary 2018, was abolished and replaced by the “PETRO” ratewith a floating US dollar/bolivar parity. At the same time, thestrong bolivar (“VEF”) was also replaced by a new currencyknown as the sovereign bolivar (“VES”), reflecting a1-for-100,000 devaluation. Consequently, the contribution of theVenezuelan subsidiaries to the consolidated financial statementsis immaterial.
In Argentina, the cumulative rate of inflation over the last threeyears is in excess of 100%, based on a combination of indicesused to measure inflation in that country. Consequently, Sanofihas treated Argentina as a hyperinflationary economy fromJuly 1, 2018 onwards, and applies IAS 29.
Consequently, a monetary foreign exchange loss of €9 millionwas recognized in the Sanofi financial statements as ofDecember 31, 2018 in respect of the impact of hyperinflation inArgentina.
A.5. Withdrawal of the United Kingdom from theEuropean Union
The announced withdrawal of the United Kingdom from theEuropean Union does not pose any major issues for Sanofi, andthe Group does not expect a material impact on the consolidatedfinancial statements.
B/ Summary of significantaccounting policiesB.1. Basis of consolidation
In accordance with IFRS 10 (Consolidated Financial Statements),the consolidated financial statements of Sanofi include thefinancial statements of entities that Sanofi controls directly orindirectly, regardless of the level of the equity interest in thoseentities. An entity is controlled when Sanofi has power over theentity, exposure or rights to variable returns from its involvementwith the entity, and the ability to affect those returns through itspower over the entity. In determining whether control exists,potential voting rights must be taken into account if those rightsare substantive, in other words they can be exercised on a timelybasis when decisions about the relevant activities of the entity areto be taken.
Entities consolidated by Sanofi are referred to as “subsidiaries”.Entities that Sanofi controls by means other than voting rights arereferred to as “consolidated structured entities”.
In accordance with IFRS 11 (Joint Arrangements), Sanoficlassifies its joint arrangements (i.e. arrangements in which
SANOFI / FORM 20-F 2018 F-17

NOTES TO THE CONSOLIDATED FINANCIAL STATEMENTS – (Continued)
Sanofi exercises joint control with one or more other parties)either as a joint operation or a joint venture. In the case of a jointoperation, Sanofi recognizes the assets and liabilities of theoperation in proportion to its rights and obligations relating tothose assets and liabilities. Joint ventures are accounted forusing the equity method.
Sanofi exercises joint control over a joint arrangement whendecisions relating to the relevant activities of the arrangementrequire the unanimous consent of Sanofi and the other partieswith whom control is shared.
Sanofi exercises significant influence over an entity when it hasthe power to participate in the financial and operating policydecisions of that entity, but does not have the power to exercisecontrol or joint control over those policies.
In accordance with IAS 28 (Investments in Associates and JointVentures), the equity method is used to account for joint ventures(i.e. entities over which Sanofi exercises joint control) and forassociates (i.e. entities over which Sanofi exercises significantinfluence).
Under the equity method, the investment is initially recognized atcost, and subsequently adjusted to reflect changes in the netassets of the associate or joint venture. IAS 28 does not specifythe treatment to be adopted on first-time application of the equitymethod to an investee following a step acquisition. Consequently,by reference to paragraph 10 of IAS 28, Sanofi has opted toapply the cost method, whereby the carrying amount of theinvestment represents the sum of the historical cost amounts foreach step in the acquisition. As of the date on which the equitymethod is first applied, goodwill (which is included in the carryingamount of the investment) is determined for each acquisitionstep. The same applies to subsequent increases in thepercentage interest in the equity-accounted investment.
When the criteria of IFRS 5 are met, Sanofi recognizes the equityinterest within the balance sheet line item Assets held for sale
or exchange. The equity method is not applied to equity intereststhat are classified as held-for-sale assets.
Transactions between consolidated companies are eliminated, asare intragroup profits.
A list of the principal companies included in the consolidation in2018 is presented in Note F.
B.2. Foreign currency translation
B.2.1. Accounting for foreign currency transactions inthe financial statements of consolidated entities
Non-current assets (other than receivables) and inventoriesacquired in foreign currencies are translated into the functionalcurrency using the exchange rate prevailing at the acquisitiondate.
Monetary assets and liabilities denominated in foreign currenciesare translated using the exchange rate prevailing at the end ofthe reporting period. The gains and losses resulting from foreign
currency translation are recorded in the income statement.However, foreign exchange gains and losses arising from thetranslation of advances between consolidated subsidiaries forwhich settlement is neither planned nor likely to occur in theforeseeable future are recognized in equity, in the line itemChange in currency translation differences.
B.2.2. Foreign currency translation of the financialstatements of foreign entities
Sanofi presents its consolidated financial statements in euros (€).In accordance with IAS 21 (The Effects of Changes in ForeignExchange Rates), each subsidiary accounts for its transactions inthe currency that is most representative of its economicenvironment (the functional currency).
All assets and liabilities are translated into euros using theexchange rate of the subsidiary’s functional currency prevailing atthe end of the reporting period. Income statements are translatedusing a weighted average exchange rate for the period, except inthe case of foreign subsidiaries in a hyperinflationary economy.The resulting currency translation difference is recognized as aseparate component of equity in the consolidated statement ofcomprehensive income, and is recognized in the incomestatement only when the subsidiary is sold or is wholly or partiallyliquidated.
B.3. Business combinations and transactions withnon-controlling interests
B.3.1. Accounting for business combinations,transactions with non-controlling interests and loss ofcontrol
Business combinations are accounted for in accordance withIFRS 3 (Business Combinations) and IFRS 10 (ConsolidatedFinancial Statements).
Business combinations are accounted for using the acquisitionmethod. Under this method, the acquiree’s identifiable assets andliabilities that satisfy the recognition criteria of IFRS 3 (BusinessCombinations) are measured initially at their fair values as at thedate of acquisition, except for (i) non-current assets classified asheld for sale (which are measured at fair value less costs to sell)and (ii) assets and liabilities that fall within the scope of IAS 12(Income Taxes) and IAS 19 (Employee Benefits). Restructuringliabilities are recognized as a liability of the acquiree only if theacquiree has an obligation as of the acquisition date to carry outthe restructuring.
The principal accounting rules applicable to businesscombinations and transactions with non-controlling interestsinclude:
◆ Acquisition-related costs are recognized as an expense on theacquisition date, as a component of Operating income.
◆ Contingent consideration is recognized in equity if thecontingent payment is settled by delivery of a fixed number of
F-18 SANOFI / FORM 20-F 2018
NOTES TO THE CONSOLIDATED FINANCIAL STATEMENTS – (Continued)
the acquirer’s equity instruments; otherwise, it is recognized inLiabilities related to business combinations. Contingentconsideration is recognized at fair value at the acquisition dateirrespective of the probability of payment. If the contingentconsideration was originally recognized as a financial liability,subsequent adjustments to the liability are recognized in profitor loss in the line item Fair value remeasurement of
contingent consideration, unless the adjustment is madewithin the twelve months following the acquisition date andrelates to facts and circumstances existing as of that date.Subsequent contingent consideration adjustments in respect ofbusiness combinations completed before January 1, 2010continue to be accounted for in accordance with thepre-revision IFRS 3 (i.e. through goodwill).
◆ In the case of a step acquisition, the previously-held equityinterest is remeasured at its acquisition-date fair value. Thedifference between this fair value and the carrying amount isrecorded in profit or loss, along with any gains or lossesrelating to the previously-held interest that were recognized inother comprehensive income and are reclassifiable to profit orloss.
◆ Goodwill may be calculated on the basis of either (i) the entirefair value of the acquiree, or (ii) a share of the fair value of theacquiree proportionate to the interest acquired. This optionmay be elected for each acquisition individually.
◆ The effects of (i) a buyout of non-controlling interests in asubsidiary already controlled by Sanofi, and (ii) a disposal of apercentage interest without loss of control, are recognized inequity.
◆ In a partial disposal resulting in loss of control, the retainedequity interest is remeasured at fair value at the date of loss ofcontrol. The gain or loss recognized on the disposal includesthe effect of that remeasurement, and items initially recognizedin equity that must be reclassified to profit or loss.
◆ Adjustments to the values of assets and liabilities initiallydetermined provisionally (pending the results of independentvaluations or further analysis) are recognized as aretrospective adjustment to goodwill if they are made withintwelve months of the acquisition date. Once this twelve-monthperiod has elapsed, the effects of any adjustments arerecognized directly in profit or loss, unless they qualify as anerror correction.
Purchase price allocations are performed under the responsibilityof management, with assistance from an independent valuer inthe case of major acquisitions. The revised IFRS 3 does notspecify an accounting treatment for contingent considerationarising from a business combination made by an entity prior tothe acquisition of control in that entity and carried as a liability inthe acquired entity’s balance sheet. The accounting treatmentapplied by Sanofi to such a liability is to measure it at fair valueas of the acquisition date and to report it in the line itemLiabilities related to business combinations and to
non-controlling interests, with subsequent remeasurements
recognized in profit or loss. This treatment is consistent with theaccounting applied to contingent consideration in the books ofthe acquirer.
B.3.2. Goodwill
The excess of the cost of an acquisition over Sanofi’s interest inthe fair value of the identifiable assets and liabilities of theacquiree is recognized as goodwill at the date of the businesscombination.
Goodwill arising on the acquisition of subsidiaries is shown in aseparate balance sheet line item, whereas goodwill arising on theacquisition of investments accounted for using the equity methodis recorded in Investments accounted for using the equity
method.
Goodwill arising on foreign operations is expressed in thefunctional currency of the country concerned and translated intoeuros using the exchange rate prevailing at the end of thereporting period.
In accordance with IAS 36 (Impairment of Assets), goodwill iscarried at cost less accumulated impairment (see Note B.6.).
Goodwill is tested for impairment annually and whenever eventsor circumstances indicate that impairment might exist. Suchevents or circumstances include significant changes more likelythan not to have an other-than-temporary impact on thesubstance of the original investment.
B.4. Other intangible assets
Other intangible assets are initially measured at acquisition costor production cost, including any directly attributable costs ofpreparing the asset for its intended use, or (in the case of assetsacquired in a business combination) at fair value as of the date ofthe business combination. Intangible assets are amortized on astraight line basis over their useful lives.
The useful lives of other intangible assets are reviewed at theend of each reporting period. The effect of any adjustment touseful lives is recognized prospectively as a change inaccounting estimate.
Amortization of other intangible assets is recognized in theincome statement within Amortization of intangible assets
except for amortization charged against (i) acquired or internally-developed software and (ii) other rights of an industrial oroperational nature, which is recognized in the relevantclassification of expense by function.
Sanofi does not own any intangible assets with an indefiniteuseful life, other than goodwill.
Intangible assets (other than goodwill) are carried at cost lessaccumulated amortization and accumulated impairment, if any, inaccordance with IAS 36 (see Note B.6.).
SANOFI / FORM 20-F 2018 F-19
NOTES TO THE CONSOLIDATED FINANCIAL STATEMENTS – (Continued)
B.4.1. Research and development not acquired in abusiness combination
Internally generated research and development
Under IAS 38, research expenses are recognized in profit or losswhen incurred.
Internally generated development expenses are recognized as anintangible asset if, and only if, all the following six criteria can bedemonstrated: (a) the technical feasibility of completing thedevelopment project; (b) Sanofi’s intention to complete theproject; (c) Sanofi’s ability to use the project; (d) the probabilitythat the project will generate future economic benefits; (e) theavailability of adequate technical, financial and other resources tocomplete the project; and (f) the ability to measure thedevelopment expenditure reliably.
Due to the risks and uncertainties relating to regulatory approvaland to the research and development process, the six criteria forcapitalization are usually considered not to have been met untilthe product has obtained marketing approval from the regulatoryauthorities. Consequently, internally generated developmentexpenses arising before marketing approval has been obtained,mainly the cost of clinical trials, are generally expensed asincurred within Research and development expenses.
Some industrial development expenses (such as those incurredin developing a second-generation synthesis process) areincurred after marketing approval has been obtained, in order toimprove the industrial process for an active ingredient. To theextent that the six IAS 38 criteria are considered as having beenmet, such expenses are recognized as an asset in the balancesheet within Other intangible assets as incurred. Similarly,some clinical trials, for example those undertaken to obtain ageographical extension for a molecule that has already obtainedmarketing approval in a major market, may in certaincircumstances meet the six capitalization criteria under IAS 38, inwhich case the related expenses are recognized as an asset inthe balance sheet within Other intangible assets.
Separately acquired research and development
Payments for separately acquired research and development arecapitalized within Other intangible assets provided that theymeet the definition of an intangible asset: a resource that is(i) controlled by Sanofi, (ii) expected to provide future economicbenefits for Sanofi, and (iii) identifiable (i.e. it is either separableor arises from contractual or legal rights). Under paragraph 25 ofIAS 38, the first condition for capitalization (the probability thatthe expected future economic benefits from the asset will flow tothe entity) is considered to be satisfied for separately acquiredresearch and development. Consequently, upfront and milestonepayments to third parties related to pharmaceutical products forwhich marketing approval has not yet been obtained arerecognized as intangible assets, and amortized on a straight linebasis over their useful lives beginning when marketing approvalis obtained.
Payments under research and development arrangementsrelating to access to technology or to databases and paymentsmade to purchase generics dossiers are also capitalized, andamortized over the useful life of the intangible asset.
Subcontracting arrangements, payments for research anddevelopment services, and continuous payments under researchand development collaborations which are unrelated to theoutcome of that collaboration, are expensed over the service term.
B.4.2. Other intangible assets not acquired in abusiness combination
Licenses other than those related to pharmaceutical products andresearch projects, in particular software licenses, are capitalizedat acquisition cost, including any directly attributable cost ofpreparing the software for its intended use. Software licenses areamortized on a straight line basis over their useful lives for Sanofi(three to five years).
Internally generated costs incurred to develop or upgrade softwareare capitalized if the IAS 38 recognition criteria are satisfied, andamortized on a straight line basis over the useful life of thesoftware from the date on which the software is ready for use.
B.4.3. Other intangible assets acquired in a businesscombination
Other intangible assets acquired in a business combination whichrelate to in-process research and development and currentlymarketed products and are reliably measurable are identifiedseparately from goodwill, measured at fair value and capitalizedwithin Other intangible assets in accordance with IFRS 3(Business Combinations) and IAS 38 (Intangible Assets). Therelated deferred tax liability is also recognized if a deductible ortaxable temporary difference exists.
In-process research and development acquired in a businesscombination is amortized on a straight line basis over its usefullife from the date of receipt of marketing approval.
Rights to products currently marketed by Sanofi are amortized ona straight line basis over their useful lives, determined on thebasis of cash flow forecasts which take into account the patentprotection period of the marketed product.
B.5. Property, plant and equipment
Property, plant and equipment is initially measured andrecognized at acquisition cost, including any directly attributablecost of preparing the asset for its intended use, or (in the case ofassets acquired in a business combination) at fair value as of thedate of the business combination. The component-basedapproach to accounting for property, plant and equipment isapplied. Under this approach, each component of an item ofproperty, plant and equipment with a cost which is significant inrelation to the total cost of the item and which has a differentuseful life from the other components must be depreciatedseparately.
F-20 SANOFI / FORM 20-F 2018
NOTES TO THE CONSOLIDATED FINANCIAL STATEMENTS – (Continued)
After initial measurement, property, plant and equipment iscarried at cost less accumulated depreciation and impairment,except for land which is carried at cost less impairment.
Subsequent costs are not recognized as assets unless (i) it isprobable that future economic benefits associated with thosecosts will flow to Sanofi and (ii) the costs can be measuredreliably.
Borrowing costs attributable to the financing of items of property,plant and equipment, and incurred during the construction period,are capitalized as part of the acquisition cost of the item.
Government grants relating to property, plant and equipment arededucted from the acquisition cost of the asset to whichthey relate.
In accordance with IAS 17 (Leases), items of property, plant andequipment leased by Sanofi as lessee under finance leases arerecognized as an asset in the balance sheet, with the relatedlease obligation recognized as a liability. A lease qualifies as afinance lease if it transfers substantially all of the risks andrewards of ownership of the asset to Sanofi. Assets held underfinance leases are carried at the lower of the fair value of theleased asset or the present value of the minimum leasepayments, and are depreciated over the shorter of the useful lifeof the asset or the term of the lease.
The depreciable amount of items of property, plant andequipment, net of any residual value, is depreciated on a straightline basis over the useful life of the asset. The useful life of anasset is usually equivalent to its economic life.
The customary useful lives of property, plant and equipment areas follows:
Buildings 15 to 40 years
Fixtures 10 to 20 years
Machinery and equipment 5 to 15 years
Other 3 to 15 years
Useful lives and residual values of property, plant and equipmentare reviewed annually. The effect of any adjustment to usefullives or residual values is recognized prospectively as a changein accounting estimate.
Depreciation of property, plant and equipment is recognized asan expense in the income statement, in the relevant classificationof expense by function.
B.6. Impairment of property, plant andequipment, intangible assets, and investmentsaccounted for using the equity method
B.6.1. Impairment of property, plant and equipmentand intangible assets
In accordance with IAS 36 (Impairment of Assets), assets thatgenerate separate cash flows and assets included in cash-generating units (CGUs) are assessed for impairment when
events or changes in circumstances indicate that the asset orCGU may be impaired. A CGU is the smallest identifiable groupof assets that generates cash inflows that are largelyindependent of the cash inflows from other assets or groups ofassets.
Under IAS 36, each CGU to which goodwill is allocated must(i) represent the lowest level within the entity at which thegoodwill is monitored for internal management purposes, and(ii) not be larger than an operating segment determined inaccordance with IFRS 8 (Operating Segments), beforeapplication of the IFRS 8 aggregation criteria (see Note B.26.).
Quantitative and qualitative indications of impairment (primarilyrelating to the status of the research and development portfolio,pharmacovigilance, patent litigation, and the launch of competingproducts) are reviewed at the end of each reporting period. Ifthere is any internal or external indication of impairment, Sanofiestimates the recoverable amount of the asset or CGU.
Other intangible assets not yet available for use (such ascapitalized in-process research and development), and CGUsthat include goodwill, are tested for impairment annually whetheror not there is any indication of impairment, and more frequentlyif any event or circumstance indicates that they might beimpaired. Such assets are not amortized.
When there is an internal or external indication of impairment,Sanofi estimates the recoverable amount of the asset andrecognizes an impairment loss if the carrying amount of the assetexceeds its recoverable amount. The recoverable amount of theasset is the higher of its fair value less costs to sell or its value inuse. To determine value in use, Sanofi uses estimates of futurecash flows generated by the asset or CGU, prepared using thesame methods as those used in the initial measurement of theasset or CGU on the basis of medium-term strategic plans.
In the case of goodwill, estimates of future cash flows are basedon a medium-term strategic plan, an extrapolation of the cashflows beyond that plan, and a terminal value. In the case of otherintangible assets, the period used is based on the economic lifeof the asset.
Estimated cash flows are discounted at long-term market interestrates that reflect the best estimate by Sanofi of the time value ofmoney, the risks specific to the asset or CGU, and economicconditions in the geographical regions in which the businessactivity associated with the asset or CGU is located.
Certain assets and liabilities that are not directly attributable to aspecific CGU are allocated between CGUs on a basis that isreasonable, and consistent with the allocation of thecorresponding goodwill.
Impairment losses arising on property, plant and equipment, onsoftware and on certain rights are recognized in the relevantclassification of expense by function.
Impairment losses arising on Other intangible assets arerecognized within Impairment of intangible assets in theIncome statement.
SANOFI / FORM 20-F 2018 F-21
NOTES TO THE CONSOLIDATED FINANCIAL STATEMENTS – (Continued)
B.6.2. Impairment of investments accounted forusing the equity method
In accordance with IAS 28 (Investments in Associates and JointVentures), Sanofi determines whether investments accounted forusing the equity method may be impaired based on indicatorssuch as default in contractual payments, significant financialdifficulties, probability of bankruptcy, or a prolonged or significantdecline in quoted market price. If an investment is impaired, theamount of the impairment loss is determined by applying IAS 36(see Note B.6.1.) and recognized in Share of profit/(loss) from
investments accounted for using the equity method.
B.6.3. Reversals of impairment losses chargedagainst property, plant and equipment, intangibleassets, and investments accounted for using theequity method
At the end of each reporting period, Sanofi assesses whetherevents or changes in circumstances indicate that an impairmentloss recognized in a prior period in respect of an asset (otherthan goodwill) or an investment accounted for using the equitymethod can be reversed. If this is the case, and the recoverableamount as determined based on the revised estimates exceedsthe carrying amount of the asset, Sanofi reverses the impairmentloss only to the extent of the carrying amount that would havebeen determined had no impairment loss been recognized for theasset.
Reversals of impairment losses in respect of other intangibleassets are recognized within the income statement line itemImpairment of intangible assets, while reversals of impairmentlosses in respect of investments accounted for using the equitymethod are recognized within the income statement line itemShare of profit/(loss) from investments accounted for using
the equity method. Impairment losses taken against goodwillare never reversed, unless the goodwill is part of the carryingamount of an investment accounted for using the equity method.
B.7. Assets held for sale or exchange andliabilities related to assets held for sale orexchange
In accordance with IFRS 5 (Non-Current Assets Held for Saleand Discontinued Operations), non-current assets and groups ofassets are classified as held for sale in the balance sheet if theircarrying amount will be recovered principally through a saletransaction rather than through continuing use. Within themeaning of IFRS 5, the term “sale” also includes exchanges forother assets.
Non-current assets or asset groups held for sale must beavailable for immediate sale in their present condition, subjectonly to terms that are usual and customary for sales of suchassets, and a sale must be highly probable. Criteria used todetermine whether a sale is highly probable include:
◆ the appropriate level of management must be committed to aplan to sell;
◆ an active program to locate a buyer and complete the planmust have been initiated;
◆ the asset must be actively marketed for sale at a price that isreasonable in relation to its current fair value;
◆ completion of the sale should be foreseeable within the twelvemonths following the date of reclassification to Assets held for
sale or exchange;
◆ actions required to complete the plan should indicate that it isunlikely that significant changes to the plan will be made or thatthe plan will be withdrawn.
Before initial reclassification of the non-current asset (or assetgroup) to Assets held for sale or exchange, the carryingamounts of the asset (or of all the assets and liabilities in theasset group) must be measured in accordance with theapplicable standards.
Subsequent to reclassification to Assets held for sale or
exchange, the non-current asset (or asset group) is measured atthe lower of carrying amount or fair value less costs to sell, withany write-down recognized by means of an impairment loss.Once a non-current asset has been reclassified as held for saleor exchange, it is no longer depreciated or amortized.
In a disposal of an equity interest leading to loss of control, all theassets and liabilities of the entity involved are classified asheld-for-sale assets or liabilities within the balance sheet lineitems Assets held for sale or exchange or Liabilities related
to assets held for sale or exchange, provided that the disposalsatisfies the IFRS 5 classification criteria.
The profit or loss generated by a held-for-sale asset group isreported in a separate line item in the income statement for thecurrent period and for the comparative periods presented,provided that the asset group:
◆ represents a separate major line of business or geographicalarea of operations; or,
◆ is part of a single coordinated plan to dispose of a separatemajor line of business or geographical area of operations; or,
◆ is a subsidiary acquired exclusively with a view to resale.
In accordance with IFRS 10, transactions between companiesthat are held for sale or treated as discontinued operations andother consolidated companies are eliminated.
Events or circumstances beyond Sanofi’s control may extend theperiod to complete the sale or exchange beyond one year withoutprecluding classification of the asset (or disposal group) inAssets held for sale or exchange provided that there issufficient evidence that Sanofi remains committed to the plannedsale or exchange. Finally, in the event of changes to a plan ofsale that require an asset no longer to be classified as held forsale, IFRS 5 specifies the following treatment:
◆ The assets and liabilities previously classified as held for saleare reclassified to the appropriate balance sheet line items,with no restatement of comparative periods;
F-22 SANOFI / FORM 20-F 2018
NOTES TO THE CONSOLIDATED FINANCIAL STATEMENTS – (Continued)
◆ Each asset is measured at the lower of (a) its carrying amountbefore the asset was reclassified as held for sale, adjusted forany depreciation, amortization or revaluation that would havebeen recognized if the asset had not been reclassified as heldfor sale, or (b) its recoverable amount at the date ofreclassification;
◆ The backlog of depreciation, amortization and impairment notrecognized while non-current assets were classified as held forsale must be reported in the same income statement line itemthat was used to report impairment losses arising on initialreclassification of assets as held for sale and gains or lossesarising on the sale of such assets. In the consolidated incomestatement, those impacts are reported within the line itemOther gains and losses, and litigation;
◆ The net income of a business previously classified asdiscontinued or as held for sale or exchange and reported on aseparate line in the income statement must be reclassified andincluded in net income from continuing operations, for allperiods presented;
◆ In addition, segment information relating to the incomestatement and the statement of cash flows (acquisitions ofnon-current assets) must be disclosed in the notes to thefinancial statements in accordance with IFRS 8 (OperatingSegments), and must also be restated for all prior periodspresented.
B.8. Financial instruments
B.8.1. Non-derivative financial assets
In accordance with IFRS 9 (Financial Instruments) and IAS 32(Financial Instruments: Presentation), Sanofi has adopted theclassification of non-derivative financial assets described below.The classification used depends on (i) the characteristics of thecontractual cash flows (i.e. whether they represent interest orprincipal) and (ii) the business model for managing the assetapplied at the time of initial recognition.
Financial assets at fair value through other comprehensiveincome
These mainly comprise:
◆ quoted and unquoted equity investments that Sanofi does nothold for trading purposes and that management hasdesignated at “fair value through other comprehensive income”on initial recognition. Gains and losses arising from changes infair value are recognized in equity within the statement ofcomprehensive income in the period in which they occur. Whensuch instruments are derecognized, the previously-recognizedchanges in fair value remain within Other comprehensive
income, as does the gain or loss on divestment. Dividendsreceived are recognized in profit or loss for the period, withinthe line item Financial income;
◆ debt instruments whose contractual cash flows representpayments of interest or repayments of principal, and which are
managed with a view to collecting cash flows and selling theasset. Gains and losses arising from changes in fair value arerecognized in equity within the statement of comprehensiveincome in the period in which they occur. When such assetsare derecognized, the cumulative gains and losses previouslyrecognized in equity are reclassified to profit or loss for theperiod within the line items Financial income or Financial
expenses.
Financial assets at fair value through profit or loss
These mainly comprise:
◆ contingent consideration already carried in the books of anacquired entity or granted in connection with a businesscombination;
◆ instruments whose contractual cash flows represent paymentsof interest and repayments of principal, which are managedwith a view to selling the asset;
◆ instruments that management has designated as ‘fair valuethrough profit or loss” on initial recognition;
◆ quoted and unquoted equity investments: equity instrumentsthat are not held for trading and which management did notdesignate at “fair value through other comprehensive income”on initial recognition, and instruments that do not meet theIFRS definition of “equity instruments”;
Gains and losses arising from changes in fair value arerecognized in profit or loss within the line items Financial
income or Financial expenses. Dividends received arerecognized in profit or loss for the period, within the line itemFinancial income.
Fair value of equity investments in unquoted entities
On initial recognition of an equity investment in an entity notquoted in an active market, the fair value of the investment is theacquisition cost. Cost ceases to be a representative measure ofthe fair value of an unquoted equity investment when Sanofiidentifies significant changes in the investee, or in the environmentin which it operates. In such cases, an internal valuation is carriedout, based mainly on peer comparisons.
Financial assets measured at amortized cost
Financial assets at amortized cost comprise instruments whosecontractual cash flows represent payments of interest andrepayments of principal and which are managed with a view tocollecting cash flows. The main assets in this category are loansand receivables. They are presented within the line items Other
non-current assets, Other current assets, Accounts
receivable and Cash and cash equivalents. Loans with amaturity of more than 12 months are presented in “Long-termloans and advances” within Other non-current assets. Thesefinancial assets are measured at amortized cost using theeffective interest method.
SANOFI / FORM 20-F 2018 F-23
NOTES TO THE CONSOLIDATED FINANCIAL STATEMENTS – (Continued)
Impairment of financial assets measured at amortized cost
The main assets involved are accounts receivable.
Accounts receivable are initially recognized at the amountinvoiced to the customer. Impairment losses on trade accountsreceivable are estimated using the expected loss method, in orderto take account of the risk of payment default throughout thelifetime of the receivables. The expected credit loss is estimatedcollectively for all accounts receivable at each reporting date usingan average expected loss rate, determined primarily on the basisof historical credit loss rates. However, that average expected lossrate may be adjusted if there are indications of a likely significantincrease in credit risk. If a receivable is subject to a known creditrisk, a specific impairment loss is recognized for that receivable.The amount of expected losses is recognized in the balance sheetas a reduction in the gross amount of accounts receivable.Impairment losses on accounts receivable are recognized withinSelling and general expenses in the income statement.
B.8.2. Derivative instruments
Derivative instruments that do not qualify for hedge accountingare initially and subsequently measured at fair value, withchanges in fair value recognized in the income statement inOther operating income or in Financial income or Financial
expenses, depending on the nature of the underlying economicitem which is hedged.
Derivative instruments that qualify for hedge accounting aremeasured using the policies described in Note B.8.3. below.
IFRS 13 (Fair Value Measurement) requires counterparty creditrisk to be taken into account when measuring the fair value offinancial instruments. That risk is estimated on the basis ofobservable, publicly-available statistical data.
Policy on offsetting
In order for a financial asset and a financial liability to bepresented as a net amount in the balance sheet under IAS 32,there must be:
(a) a legally enforceable right to offset; and
(b) the intention either to settle on a net basis, or to realize theasset and settle the liability simultaneously.
In addition, IFRS 7 (Financial Instruments: Disclosures) requiresthe notes to the financial statements to include a scheduleshowing a list of any offsets recognized under IAS 32 and oftransactions for which only criterion (a) is met, i.e. potentialoffsets such as those specified in close out netting agreements(positions offset only in the event of default, as specified in theInternational Swaps and Derivatives Association (ISDA)standard).
B.8.3. Hedging
As part of its overall market risk management policy, Sanofienters into various hedging transactions involving derivative or
non-derivative instruments; these may include forward contracts,currency swaps or options, interest rate swaps or options, cross-currency swaps, and debt placings or issues.
Such financial instruments are designated as hedginginstruments and recognized using the hedge accountingprinciples of IFRS 9 when (a) there is formal designation anddocumentation of the hedging relationship, of how theeffectiveness of the hedging relationship will be assessed, and ofthe underlying market risk management objective and strategy;(b) the hedged item and the hedging instrument are eligible forhedge accounting; and (c) there is an economic relationshipbetween the hedged item and the hedging instrument, defined onthe basis of a hedge ratio that is consistent with the underlyingmarket risk management strategy, and the residual credit riskdoes not dominate the value changes that result from thateconomic relationship.
Fair value hedge
A fair value hedge is a hedge of the exposure to changes in fairvalue of an asset, liability or firm commitment that is attributableto one or more risk components and could affect profit or loss.
Changes in fair value of the hedging instrument and changes infair value of the hedged item attributable to the hedged riskcomponents are generally recognized in the income statement,within Other operating income for hedges related to operatingactivities, or within Financial income or Financial expenses forhedges related to investing or financing activities.
Cash flow hedge
A cash flow hedge is a hedge of the exposure to variability incash flows from an asset, liability or highly probable forecasttransaction that is attributable to one or more risk componentsand could affect profit or loss.
Changes in fair value of the hedging instrument attributable to theeffective portion of the hedge are recognized directly in equity inthe consolidated statement of comprehensive income. Changesin fair value attributable to the ineffective portion of the hedge arerecognized in the income statement within Other operating
income for hedges of operating activities, and within Financial
income or Financial expenses for hedges of investing orfinancing activities.
Cumulative changes in fair value of the hedging instrumentpreviously recognized in equity are reclassified to the incomestatement when the hedged transaction affects profit or loss.Those reclassified gains and losses are recognized within Other
operating income for hedges related to operating activities, andwithin Financial income or Financial expenses for hedgesrelated to investing or financing activities.
When a forecast transaction results in the recognition of anon-financial asset or liability, cumulative changes in the fairvalue of the hedging instrument previously recognized in equityare incorporated in the initial carrying amount of that asset orliability.
F-24 SANOFI / FORM 20-F 2018

NOTES TO THE CONSOLIDATED FINANCIAL STATEMENTS – (Continued)
When the hedging instrument expires or is sold, terminated orexercised, the cumulative gain or loss previously recognized inequity remains separately recognized in equity and is notreclassified to the income statement (or recognized as anadjustment to the initial cost of the related non-financial asset orliability) until the forecast transaction occurs. However, if Sanofino longer expects the forecast transaction to occur, thecumulative gain or loss previously recognized in equity isrecognized immediately in profit or loss.
Hedge of a net investment in a foreign operation
In a hedge of a net investment in a foreign operation, changes inthe fair value of the hedging instrument attributable to theeffective portion of the hedge are recognized directly in equity inthe consolidated statement of comprehensive income. Changesin fair value attributable to the ineffective portion of the hedge arerecognized in the income statement within Financial income orFinancial expenses. When the investment in the foreignoperation is sold, the changes in the fair value of the hedginginstrument previously recognized in equity are reclassified to theincome statement within Financial income or Financial
expenses.
Cost of hedging
As part of its market risk management policy, Sanofi maydesignate currency options or interest rate options as hedginginstruments, the effectiveness of which is measured on the basisof changes in intrinsic value. In such cases, the time value of theoption is treated as a hedging cost and accounted for as follows:
◆ If the option includes a component that is not aligned on thecritical features of the hedged item, the corresponding changein the time value is taken to profit or loss.
◆ Otherwise, the change in the time value is taken to equitywithin the statement of comprehensive income, and then:
– If the hedged item is linked to a transaction that results inthe recognition of a financial asset or liability, the change inthe time value is reclassified to profit or loss symmetricallywith the hedged item;
– If the hedged item is linked to a transaction that results inthe recognition of a non-financial asset or liability, thechange in the time value is incorporated in the initialcarrying amount of that asset or liability;
– if the hedged item is linked to a period of time, the change intime value is reclassified to profit or loss on a straight linebasis over the life of the hedging relationship.
In the case of forward contracts and currency swaps, and ofcross-currency swaps that qualify for hedge accounting on thebasis of changes in spot rates, Sanofi may elect for eachtransaction to use the option whereby the premium/discount orforeign currency basis spread are treated in the same way as thetime value of an option.
Discontinuation of hedge accounting
Hedge accounting is discontinued when the eligibility criteria areno longer met (in particular, when the hedging instrument expiresor is sold, terminated or exercised), or if there is a change in themarket risk management objective of the hedging relationship.
B.8.4. Non-derivative financial liabilities
Borrowings and debt
Bank borrowings and debt instruments are initially measured atfair value of the consideration received, net of directly attributabletransaction costs.
Subsequently, they are measured at amortized cost using theeffective interest method. All costs related to the issuance ofborrowings or debt instruments, and all differences between theissue proceeds net of transaction costs and the value onredemption, are recognized within Financial expenses in theincome statement over the term of the debt using the effectiveinterest method.
Liabilities related to business combinations and to non-controllinginterests
These line items record the fair value of (i) contingentconsideration payable in connection with business combinationsand (ii) commitments to buy out equity holders of subsidiaries,including put options granted to non-controlling interests.
Adjustments to the fair value of commitments to buy out equityholders of subsidiaries, including put options granted tonon-controlling interests, are recognized in equity.
Other non-derivative financial liabilities
Other non-derivative financial liabilities include trade accountspayable, which are measured at fair value (which in most casesequates to face value) on initial recognition, and subsequently atamortized cost.
B.8.5. Fair value of financial instruments
Under IFRS 13 (Fair Value Measurement) and IFRS 7 (FinancialInstruments: Disclosures), fair value measurements must beclassified using a hierarchy based on the inputs used to measurethe fair value of the instrument. This hierarchy has three levels:
(a) level 1: quoted prices in active markets for identical assets orliabilities (without modification or repackaging);
(b) level 2: quoted prices in active markets for similar assets andliabilities, or valuation techniques in which all important inputs arederived from observable market data;
(c) level 3: valuation techniques in which not all important inputsare derived from observable market data.
SANOFI / FORM 20-F 2018 F-25

NOTES TO THE CONSOLIDATED FINANCIAL STATEMENTS – (Continued)
The table below shows the disclosures required under IFRS 7 relating to the measurement principles applied to financial instruments.
Method used to determine fair value
Market data
Note Type of financial instrument
Measurement
principle
Level in
fair value
hierarchy
Valuation
technique
Valuation
model
Exchange
rate
Interest
rate
B.6. Financial assets measured at fairvalue (quoted equity instruments) Fair value 1 Market value Quoted
market price N/A
B.6. Financial assets measured at fairvalue (quoted debt instruments) Fair value 1 Market value Quoted
market price N/A
B.6.Financial assets measured at fairvalue (unquoted equityinstruments)
Fair value 3
Amortizedcost/ Peercomparison(primarily)
If cost ceases to be a representativemeasure of fair value, an internal valuationbased primarily on peer comparison is used.
B.6.Financial assets measured at fairvalue (contingent considerationreceivable)
Fair value 3Revenue-basedapproach
The fair value of contingent considerationreceivable is determined by adjusting thecontingent consideration at the end of thereporting period using the method describedin Note D.7.3.
B.6.
Financial assets measured at fairvalue held to meet obligationsunder post-employment benefitplans
Fair value 1 Market value Quotedmarket price N/A
B.6.Financial assets designated at fairvalue held to meet obligationsunder deferred compensation plans
Fair value 1 Market value Quotedmarket price N/A
B.6. Long-term loans and advances andother non-current receivables Amortized cost N/A N/A
The amortized cost of long-term loans andadvances and other non-current receivablesat the end of the reporting period is notmaterially different from their fair value.
B.9. Investments in mutual funds Fair value 1 Market value Net assetvalue N/A
B.9.Negotiable debt instruments,commercial paper, instant accessdeposits and term deposits
Amortized cost N/A N/A
Because these instruments have a maturityof less than 3 months, amortized cost isregarded as an acceptable approximation offair value as disclosed in the notes to theconsolidated financial statements.
F-26 SANOFI / FORM 20-F 2018
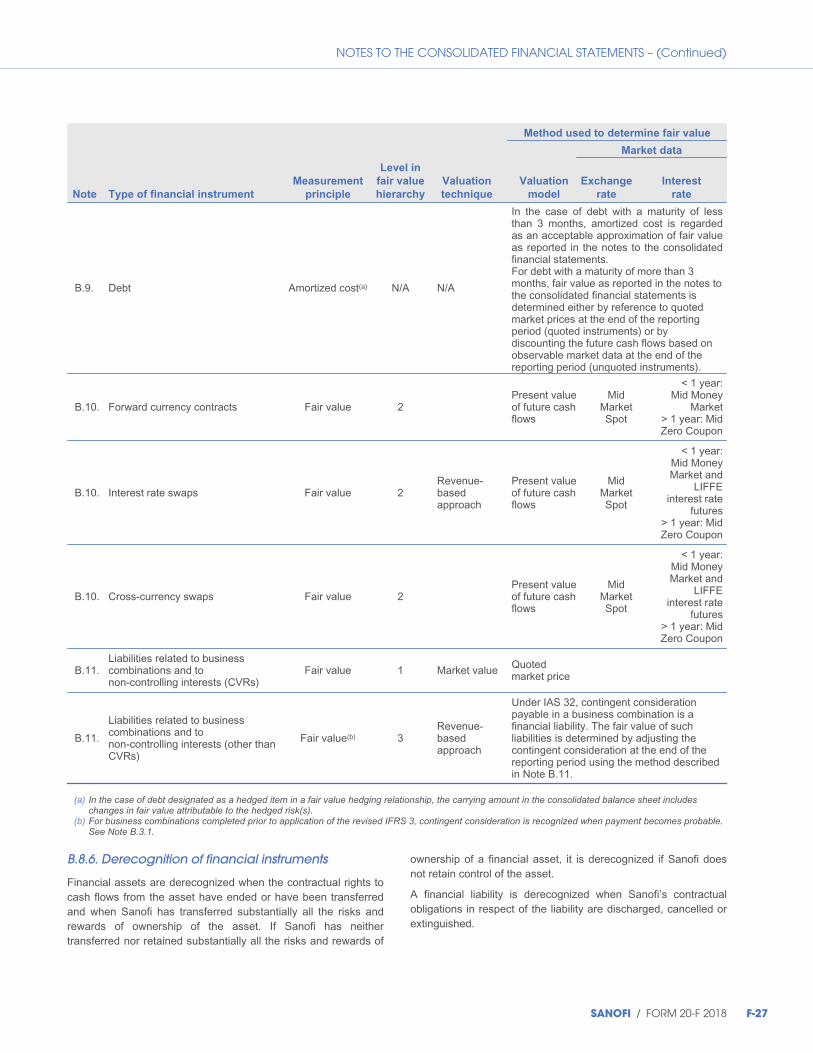
NOTES TO THE CONSOLIDATED FINANCIAL STATEMENTS – (Continued)
Method used to determine fair value
Market data
Note Type of financial instrument
Measurement
principle
Level in
fair value
hierarchy
Valuation
technique
Valuation
model
Exchange
rate
Interest
rate
B.9. Debt Amortized cost(a) N/A N/A
In the case of debt with a maturity of lessthan 3 months, amortized cost is regardedas an acceptable approximation of fair valueas reported in the notes to the consolidatedfinancial statements.For debt with a maturity of more than 3months, fair value as reported in the notes tothe consolidated financial statements isdetermined either by reference to quotedmarket prices at the end of the reportingperiod (quoted instruments) or bydiscounting the future cash flows based onobservable market data at the end of thereporting period (unquoted instruments).
B.10. Forward currency contracts Fair value 2Present valueof future cashflows
MidMarketSpot
< 1 year:Mid Money
Market> 1 year: MidZero Coupon
B.10. Interest rate swaps Fair value 2Revenue-basedapproach
Present valueof future cashflows
MidMarketSpot
< 1 year:Mid MoneyMarket and
LIFFEinterest rate
futures> 1 year: MidZero Coupon
B.10. Cross-currency swaps Fair value 2Present valueof future cashflows
MidMarketSpot
< 1 year:Mid MoneyMarket and
LIFFEinterest rate
futures> 1 year: MidZero Coupon
B.11.Liabilities related to businesscombinations and tonon-controlling interests (CVRs)
Fair value 1 Market value Quotedmarket price
B.11.
Liabilities related to businesscombinations and tonon-controlling interests (other thanCVRs)
Fair value(b) 3Revenue-basedapproach
Under IAS 32, contingent considerationpayable in a business combination is afinancial liability. The fair value of suchliabilities is determined by adjusting thecontingent consideration at the end of thereporting period using the method describedin Note B.11.
(a) In the case of debt designated as a hedged item in a fair value hedging relationship, the carrying amount in the consolidated balance sheet includeschanges in fair value attributable to the hedged risk(s).
(b) For business combinations completed prior to application of the revised IFRS 3, contingent consideration is recognized when payment becomes probable.See Note B.3.1.
B.8.6. Derecognition of financial instruments
Financial assets are derecognized when the contractual rights tocash flows from the asset have ended or have been transferredand when Sanofi has transferred substantially all the risks andrewards of ownership of the asset. If Sanofi has neithertransferred nor retained substantially all the risks and rewards of
ownership of a financial asset, it is derecognized if Sanofi doesnot retain control of the asset.
A financial liability is derecognized when Sanofi’s contractualobligations in respect of the liability are discharged, cancelled orextinguished.
SANOFI / FORM 20-F 2018 F-27
NOTES TO THE CONSOLIDATED FINANCIAL STATEMENTS – (Continued)
B.8.7. Risks Relating to financial instruments
Market risks in respect of non-current financial assets, cashequivalents, derivative instruments and debt are described in thediscussions of risk factors presented in Item 3.D. and Item 11 ofSanofi’s Annual Report on Form 20-F for 2018.
Credit risk is the risk that customers may fail to pay their debts.
B.9. Inventories
Inventories are measured at the lower of cost or net realizablevalue. Cost is calculated using the weighted average cost methodor the first-in, first-out method, depending on the nature of theinventory.
The cost of finished goods inventories includes costs ofpurchase, costs of conversion and other costs incurred inbringing the inventories to their present location and condition.
Net realizable value is the estimated selling price in the ordinarycourse of business less the estimated costs of completion andthe estimated costs necessary to make the sale.
During the launch phase of a new product, any inventories of thatproduct are written down to zero pending regulatory approval.The write-down is reversed once it becomes highly probable thatmarketing approval will be obtained.
B.10. Cash and cash equivalents
Cash and cash equivalents as shown in the consolidated balancesheet and statement of cash flows comprise cash, plus liquidshort-term investments that are readily convertible into cash andare subject to an insignificant risk of changes in value in theevent of movements in interest rates.
B.11. Treasury shares
In accordance with IAS 32, Sanofi treasury shares are deductedfrom equity, irrespective of the purpose for which they are held.No gain or loss is recognized in the income statement on thepurchase, sale, impairment or cancellation of treasury shares.
B.12. Provisions for risks
In accordance with IAS 37 (Provisions, Contingent Liabilities andContingent Assets), Sanofi records a provision when it has apresent obligation, whether legal or constructive, as a result of apast event; it is probable that an outflow of resources embodyingeconomic benefits will be required to settle the obligation; and areliable estimate can be made of the amount of the outflow ofresources.
If the obligation is expected to be settled more than twelvemonths after the end of the reporting period, or has no definitesettlement date, the provision is recorded within Non-current
provisions and other non-current liabilities.
Provisions relating to the insurance programs in which Sanofi’scaptive insurance company participates are based on risk
exposure estimates calculated by management, with assistancefrom independent actuaries, using IBNR (Incurred But NotReported) techniques. Those techniques use past claimsexperience, within Sanofi and in the market, to estimate futuretrends in the cost of claims.
Contingent liabilities are not recognized, but are disclosed in thenotes to the financial statements unless the possibility of anoutflow of economic resources is remote.
Sanofi estimates provisions on the basis of events andcircumstances related to present obligations at the end of thereporting period and of past experience, and to the best ofmanagement’s knowledge at the date of preparation of thefinancial statements.
Reimbursements offsetting the probable outflow of resources arerecognized as assets only if it is virtually certain that they will bereceived. Contingent assets are not recognized.
Restructuring provisions are recognized if Sanofi has a detailed,formal restructuring plan at the end of the reporting period andhas announced its intention to implement this plan to thoseaffected by it.
No provisions are recorded for future operating losses.
Sanofi records non-current provisions for certain obligations,such as legal or constructive environmental obligations andlitigation, where an outflow of resources is probable and theamount of the outflow can be reliably estimated. Where the effectof the time value of money is material, those provisions aremeasured at the present value of the expenditures expected tobe required to settle the obligation, calculated using a discountrate that reflects an estimate of the time value of money and therisks specific to the obligation.
Increases in provisions to reflect the effects of the passage oftime are recognized within Financial expenses.
B.13. Revenue recognition
B.13.1. Net sales
Revenue arising from the sale of goods is presented in theincome statement within Net sales. Net sales comprise revenuefrom sales of pharmaceutical products, consumer healthcareproducts, active ingredients and vaccines, net of sales returns, ofcustomer incentives and discounts, and of certain sales-basedpayments paid or payable to the healthcare authorities. Analysesof net sales are provided in Note D.35.1., “Segment Information”.
In accordance with IFRS 15 (Revenue from Contracts withCustomers), such revenue is recognized when Sanofi transferscontrol over the product to the customer; control of an assetrefers to the ability to direct the use of, and obtain substantially allof the remaining benefits from, that asset. For the vast majority ofcontracts, revenue is recognized when the product is physicallytransferred, in accordance with the delivery and acceptanceterms agreed with the customer.
F-28 SANOFI / FORM 20-F 2018
NOTES TO THE CONSOLIDATED FINANCIAL STATEMENTS – (Continued)
For contracts entered into by Sanofi Pasteur, transfer of control isusually determined by reference to the terms of release(immediate or deferred) and acceptance of batches of vaccine.
In the case of contracts with distributors, Sanofi does notrecognize revenue when the product is physically transferred tothe distributor if the products are sold on consignment, or if thedistributor acts as agent. In such cases, revenue is recognizedwhen control is transferred to the end customer, and thedistributor’s commission is presented within the line item Selling
and general expenses in the income statement.
The amount of revenue recognized reflects the various types ofprice reductions or rights of return offered by Sanofi to itscustomers on certain products. Such price reductions and rightsof return qualify as variable consideration under IFRS 15.
In particular, products sold in the United States are covered byvarious governmental programs (such as Medicare andMedicaid) under which products are sold at a discount. Rebatesare granted to healthcare authorities, and under contractualarrangements with certain customers. Some wholesalers areentitled to chargeback incentives based on the selling price to theend customer, under specific contractual arrangements. Cashdiscounts may also be granted for prompt payment. Returns,discounts, incentives and rebates, as described above, arerecognized in the period in which the underlying sales arerecognized as a reduction of gross sales.
These amounts are calculated as follows:
◆ The amount of chargeback incentives is estimated on the basisof the relevant subsidiary’s standard sales terms andconditions, and in certain cases on the basis of specificcontractual arrangements with the customer;
◆ The amount of rebates based on attainment of sales targets isestimated and accrued as each of the underlying salestransactions is recognized;
◆ The amount of price reductions under Government and Stateprograms, largely in the United States, is estimated on thebasis of the specific terms of the relevant regulations oragreements, and accrued as each of the underlying salestransactions is recognized;
◆ The amount of sales returns is calculated on the basis ofmanagement’s best estimate of the amount of product that willultimately be returned by customers. In countries whereproduct returns are possible, Sanofi operates a returns policythat allows the customer to return products within a certainperiod either side of the expiry date (usually 12 months afterthe expiry date). The amount recognized for returns isestimated on the basis of past experience of sales returns.Sanofi also takes into account factors such as levels ofinventory in its various distribution channels, product expirydates, information about potential discontinuation of products,the entry of competing generics into the market, and the launchof over-the-counter medicines. Most product return clausesrelate solely to date-expired products, which cannot be resold
and are destroyed. Sanofi does not recognize a right of returnasset in the balance sheet for contracts that allow for the returnof time-expired products, since those products have no value.
The estimated amounts described above are recognized in theincome statement within Net sales as a reduction of gross sales,and within Other current liabilities in the balance sheet. Theyare subject to regular review and adjustment as appropriatebased on the most recent data available to management. Sanofibelieves that it has the ability to measure each of the aboveamounts reliably, using the following factors in developing itsestimates:
◆ the nature and patient profile of the underlying product;
◆ the applicable regulations or the specific terms and conditionsof contracts with governmental authorities, wholesalers andother customers;
◆ historical data relating to similar contracts, in the case ofqualitative and quantitative rebates and chargeback incentives;
◆ past experience and sales growth trends for the same orsimilar products;
◆ actual inventory levels in distribution channels, monitored bySanofi using internal sales data and externally provided data;
◆ the shelf life of Sanofi products;
◆ market trends including competition, pricing and demand.
An analysis of provisions for discounts, rebates and sales returnsis provided in Note D.23.
B.13.2. Other revenues
Other revenues mainly comprise royalties received fromlicensing intellectual property rights to third parties, and VaxServesales of products sourced from third-party manufacturers.
Royalties received under licensing arrangements are recognizedover the period during which the underlying sales are recognized.
VaxServe is a Vaccines segment entity whose operations includethe distribution within the United States of vaccines and otherproducts manufactured by third parties. VaxServe sales ofproducts sourced from third-party manufacturers are presentedwithin Other revenues.
B.14. Cost of sales
Cost of sales consists primarily of the industrial cost of goodssold, payments made under licensing agreements, anddistribution costs. The industrial cost of goods sold includes thecost of materials, depreciation of property, plant and equipment,amortization of software, personnel costs, and other expensesattributable to production.
B.15. Research and development
Note B.4.1. “Research and development not acquired in abusiness combination” and Note B.4.3. “Other intangible assets
SANOFI / FORM 20-F 2018 F-29
NOTES TO THE CONSOLIDATED FINANCIAL STATEMENTS – (Continued)
acquired in a business combination” describe the principlesapplied to the recognition of research and development costs.
Contributions or reimbursements received from alliance partnersare recorded as a reduction of Research and development
expenses.
B.16. Other operating income and expenses
B.16.1. Other Operating Income
Other operating income includes the share of profits that Sanofiis entitled to receive from alliance partners in respect of productmarketing agreements. It also includes revenues generatedunder certain complex agreements, which may includepartnership and co-promotion arrangements.
Upfront payments received are deferred until the serviceobligation is met. Milestone payments are assessed on a case bycase basis, and recognized in the income statement on deliveryof the products and/or upon the service obligation being met.Revenue generated in connection with these services isrecognized on the basis of delivery of the goods or provision ofthe services to the other contracting party.
This line item also includes realized and unrealized foreignexchange gains and losses on operating activities (seeNote B.8.3.), and operating gains on disposals not regarded asmajor disposals (see Note B.20.).
B.16.2. Other operating expenses
Other operating expenses mainly comprise the share of profitsthat alliance partners are entitled to receive from Sanofi underproduct marketing agreements.
B.17. Amortization and impairment of intangibleassets
B.17.1. Amortization of intangible assets
The expenses recorded in this line item comprise amortization ofproduct rights and other intangible assets (see Note D.4.), giventhat the benefit of those rights to Sanofi’s commercial, industrialand development functions cannot be separately identified.
Amortization of software, and of other rights of an industrial oroperational nature, is recognized as an expense in the incomestatement, in the relevant line items of expense by function.
B.17.2. Impairment of intangible assets
This line item records impairment losses (other than thoseassociated with restructuring) recognized against intangibleassets (including goodwill, but excluding software and otherrights of an industrial or operational nature), and any reversals ofsuch impairment losses.
B.18. Fair value remeasurement of contingentConsideration
Changes in the fair value of contingent consideration that was(i) already carried in the books of an acquired entity, or(ii) granted in connection with a business combination and initiallyrecognized as a liability in accordance with the revised IFRS 3,are reported in profit or loss. Such adjustments are reportedseparately in the income statement, in the line item Fair value
remeasurement of contingent consideration.
This line item also includes changes in the fair value ofcontingent consideration receivable in connection with adivestment and classified as a financial asset at fair valuethrough profit or loss.
Finally, it includes the effect of the unwinding of discount, and ofexchange rate movements where the asset or liability isexpressed in a currency other than the functional currency of thereporting entity.
B.19. Restructuring costs and similar items
Restructuring costs are expenses incurred in connection with thetransformation or reorganization of Sanofi’s operations or supportfunctions. Such costs include collective redundancy plans,compensation to third parties for early termination of contracts,and commitments made in connection with transformation orreorganization decisions. They also include accelerateddepreciation charges arising from site closures and losses onasset disposals resulting from such decisions.
In addition, this line item includes expenses incurred inconnection with programs implemented as part of thetransformation strategy announced in November 2015 intendedto deliver a global information systems solution, to standardizeand consolidate processes, and to transition towards a worldwideservices platform.
B.20. Other gains and losses, and litigation
The line item Other gains and losses, and litigation includesthe impact of material transactions of an unusual nature oramount which Sanofi believes it necessary to report separately inthe income statement in order to improve the relevance of thefinancial statements, such as:
◆ gains and losses on major disposals of property, plant andequipment, of intangible assets, of assets (or groups of assetsand liabilities) held for sale, or of a business within the meaningof the revised IFRS 3, other than those considered to berestructuring costs;
◆ impairment losses and reversals of impairment losses onassets (or groups of assets and liabilities) held for sale, otherthan those considered to be restructuring costs;
◆ gains on bargain purchases;
◆ costs and provisions relating to major litigation; and
F-30 SANOFI / FORM 20-F 2018

NOTES TO THE CONSOLIDATED FINANCIAL STATEMENTS – (Continued)
◆ pre-tax separation costs associated with the process ofdisinvesting from operations in the event of a major divestment.
B.21. Financial expenses and income
B.21.1. Financial expenses
Financial expenses mainly comprise interest charges on debtfinancing; negative changes in the fair value of financialinstruments (where changes in fair value are recognized in profitor loss); realized and unrealized foreign exchange losses onfinancing and investing activities; impairment losses on financialinstruments; and any reversals of impairment losses on financialinstruments.
Financial expenses also include expenses arising from theunwinding of discount on long-term provisions, and the netinterest cost related to employee benefits. This line item does notinclude commercial cash discounts, which are deducted from netsales.
B.21.2. Financial income
Financial income includes interest and dividend income; positivechanges in the fair value of financial instruments (where changesin fair value are recognized in profit or loss); realized andunrealized foreign exchange gains on financing and investingactivities; and gains on disposals of financial assets at fair valuethrough profit or loss.
B.22. Income tax expense
Income tax expense includes all current and deferred taxes ofconsolidated companies.
Sanofi accounts for deferred taxes in accordance with IAS 12(Income Taxes), using the methods described below:
◆ Deferred tax assets and liabilities are recognized on taxableand deductible temporary differences, and on tax loss carry-forwards. Temporary differences are differences between thecarrying amount of an asset or liability in the balance sheet andits tax base.
◆ French business taxes include a value added basedcomponent: “CVAE” (Cotisation sur la Valeur Ajoutée desEntreprises). Given that CVAE is (i) calculated as the amountby which certain revenues exceed certain expenses and(ii) borne primarily by companies that own intellectual propertyrights on income derived from those rights (royalties, andmargin on sales to third parties and to Sanofi entities), it isregarded as meeting the definition of income taxes specified inIAS 12, paragraph 2 (“taxes which are based on taxableprofits”).
◆ Deferred tax assets and liabilities are calculated using the taxrate expected to apply in the period when the correspondingtemporary differences are expected to reverse, based on taxrates enacted or substantively enacted at the end of thereporting period.
◆ Deferred tax assets are recognized in respect of deductibletemporary differences, tax losses available for carry-forwardand unused tax credits to the extent that future recovery isregarded as probable. The recoverability of deferred tax assetsis assessed on a case-by-case basis, taking into account theprofit forecasts contained in Sanofi’s medium-term businessplan.
◆ A deferred tax liability is recognized for temporary differencesrelating to interests in subsidiaries, associates and jointventures, except in cases where Sanofi is able to control thetiming of the reversal of the temporary differences. This appliesin particular when Sanofi is able to control dividend policy and itis probable that the temporary differences will not reverse inthe foreseeable future.
◆ No deferred tax is recognized on eliminations of intragrouptransfers of interests in subsidiaries, associates or jointventures.
◆ Each tax entity calculates its own net deferred tax position. Allnet deferred tax asset and liability positions are thenaggregated and shown in separate line items on the relevantside of the consolidated balance sheet. Deferred tax assetsand liabilities are offset only if (i) Sanofi has a legallyenforceable right to offset current tax assets and current taxliabilities, and (ii) the deferred tax assets and deferred taxliabilities relate to income taxes levied by the same taxationauthority.
◆ Deferred taxes are not discounted, except implicitly in the caseof deferred taxes on assets and liabilities which are alreadyimpacted by discounting.
◆ Withholding taxes on intragroup royalties and dividends, andon royalties and dividends collected from third parties, areaccounted for as current income taxes.
In accounting for business combinations, Sanofi complies withthe revised IFRS 3 as regards the recognition of deferred taxassets after the initial accounting period. Consequently, anydeferred tax assets recognized by the acquiree after the end ofthis period in respect of temporary differences or tax loss carry-forwards existing at the acquisition date are recognized in profitor loss.
The positions adopted by Sanofi in tax matters are based on itsinterpretation of tax laws and regulations. Some of thosepositions may be subject to uncertainty. In such cases, Sanofiassesses the amount of the tax liability on the basis of thefollowing assumptions: that its position will be examined by oneor more tax authorities on the basis of all relevant information;that a technical assessment is carried out with reference tolegislation, case law, regulations, and established practice; andthat each position is assessed individually (or collectively whereappropriate), with no offset or aggregation between positions.Those assumptions are assessed on the basis of facts andcircumstances existing at the end of the reporting period. Whenan uncertain tax liability is regarded as probable, it is measuredon the basis of Sanofi’s best estimate and recognized as a
SANOFI / FORM 20-F 2018 F-31
NOTES TO THE CONSOLIDATED FINANCIAL STATEMENTS – (Continued)
liability; uncertain tax assets are not recognized. The amount ofthe liability includes any penalties and late payment interest. Theline item Income tax expense includes the effects of taxreassessments and tax disputes, and any penalties and latepayment interest arising from such disputes that have thecharacteristics of income taxes within the meaning of paragraph2 of IAS 12 (“taxes which are based on taxable profits”).
No deferred taxation is recognized on temporary differences thatare liable to be subject to US global intangible low taxed income(GILTI) provisions. The related tax expense is recognized in theyear in which it is declared in the tax return to the extent that itarises from the existence of non-US profits that exceed thetheoretical return on investment specified in the GILTI provisionsand are taxed at a rate lower than the applicable US tax rate.
B.23. Employee benefit obligations
Sanofi offers retirement benefits to employees and retirees. Suchbenefits are accounted for in accordance with IAS 19 (EmployeeBenefits).
Benefits are provided in the form of either defined contributionplans or defined benefit plans. In the case of defined contributionplans, the cost is recognized immediately in the period in which itis incurred, and equates to the amount of the contributions paidby Sanofi. For defined benefit plans, Sanofi generally recognizesits obligations to pay pensions and similar benefits to employeesas a liability, based on an actuarial estimate of the rights vestedor currently vesting in employees and retirees, using theprojected unit credit method. Estimates are performed at leastonce a year, and rely on financial assumptions (such as discountrates) and demographic assumptions (such as life expectancy,retirement age, employee turnover, and the rate of salaryincreases).
Obligations relating to other post-employment benefits(healthcare and life insurance) offered by Sanofi companies toemployees are also recognized as a liability based on anactuarial estimate of the rights vested or currently vesting inemployees and retirees at the end of the reporting period.
Such liabilities are recognized net of the fair value of plan assets.
In the case of multi-employer defined benefit plans where planassets cannot be allocated to each participating employer withsufficient reliability, the plan is accounted for as a definedcontribution plan, in accordance with paragraph 34 of IAS 19.
The benefit cost for the period consists primarily of currentservice cost, past service cost, net interest cost, gains or lossesarising from plan settlements not specified in the terms of theplan, and actuarial gains or losses arising from plan curtailments.Net interest cost for the period is determined by applying thediscount rate specified in IAS 19 to the net liability (i.e. theamount of the obligation, net of plan assets) recognized inrespect of defined benefit plans. Past service cost is recognizedimmediately in profit or loss in the period in which it is incurred,regardless of whether or not the rights have vested at the time of
adoption (in the case of a new plan) or of amendment (in thecase of an existing plan).
Actuarial gains and losses on defined benefit plans (pensionsand other post-employment benefits), also referred to asRemeasurements of the net defined benefit liability (asset),
arise as a result of changes in financial and demographicassumptions, experience adjustments, and the differencebetween the actual return and interest cost on plan assets. Theimpacts of those remeasurements are recognized in Other
comprehensive income, net of deferred taxes; they are notsubsequently reclassifiable to profit or loss.
B.24. Share-based payment
Share-based payment expense is recognized as a component ofoperating income, in the relevant classification of expense byfunction. In measuring the expense, the level of attainment of anyperformance conditions is taken into account.
B.24.1. Stock option plans
Sanofi has granted a number of equity-settled share-basedpayment plans (stock option plans) to some of its employees.The terms of those plans may make the award contingent on theattainment of performance criteria for some of the grantees.
In accordance with IFRS 2 (Share-Based Payment), servicesreceived from employees as consideration for stock options arerecognized as an expense in the income statement, with theopposite entry recognized in equity. The expense corresponds tothe fair value of the stock option plans, and is charged to incomeon a straight-line basis over the four-year vesting period of theplan.
The fair value of stock option plans is measured at the date ofgrant using the Black-Scholes valuation model, taking intoaccount the expected life of the options. The resulting expensealso takes into account the expected cancellation rate of theoptions. The expense is adjusted over the vesting period toreflect actual cancellation rates resulting from option-holdersceasing to be employed by Sanofi.
B.24.2. Employee share ownership plans
Sanofi may offer its employees the opportunity to subscribe toreserved share issues at a discount to the reference marketprice. Shares awarded to employees under such plans fall withinthe scope of IFRS 2. Consequently, an expense is recognized atthe subscription date, based on the value of the discount offeredto employees.
B.24.3. Restricted share plans
Sanofi may award restricted share plans to certain of itsemployees. The terms of those plans may make the awardcontingent on the attainment of performance criteria for some ofthe grantees.
F-32 SANOFI / FORM 20-F 2018

NOTES TO THE CONSOLIDATED FINANCIAL STATEMENTS – (Continued)
In accordance with IFRS 2, an expense equivalent to the fairvalue of such plans is recognized on a straight line basis over thevesting period of the plan, with the opposite entry recognized inequity. Depending on the country, the vesting period of suchplans is either three or four years. Plans with a two-year or three-year vesting period are subject to a two-year lock-up period.
The fair value of stock option plans is based on the fair value ofthe equity instruments granted, representing the fair value of theservices received during the vesting period. The fair value of anequity instrument granted under a plan is the market price of theshare at the grant date, adjusted for expected dividends duringthe vesting period.
B.25. Earnings per share
Basic earnings per share is calculated using the weightedaverage number of shares outstanding during the reportingperiod, adjusted on a time-weighted basis from the acquisitiondate to reflect the number of own shares held by Sanofi. Dilutedearnings per share is calculated on the basis of the weightedaverage number of ordinary shares, computed using the treasurystock method.
This method assumes that (i) all outstanding dilutive options andwarrants are exercised, and (ii) Sanofi acquires its own shares atthe quoted market price for an amount equivalent to the cashreceived as consideration for the exercise of the options orwarrants, plus the expense arising on unamortized stock options.
B.26. Segment information
In accordance with IFRS 8 (Operating Segments), the segmentinformation reported by Sanofi is prepared on the basis of internalmanagement data provided to the Chief Executive Officer, who isthe chief operating decision maker. The performance of thosesegments is monitored individually using internal reports andcommon indicators. Disclosures about operating segmentsrequired under IFRS 8 are presented in Note D.35. (“Segmentinformation”) to the consolidated financial statements.
Since December 31, 2017 Sanofi has had three operatingsegments: Pharmaceuticals, Consumer Healthcare and HumanVaccines (Vaccines).
The Pharmaceuticals segment comprises the commercialoperations of the following global franchises: Specialty Care(Rare Diseases, Multiple Sclerosis, Oncology, Immunology),Diabetes & Cardiovascular, Established Prescription Productsand Generics, together with research, development andproduction activities dedicated to the Pharmaceuticals segment.This segment also includes associates whose activities arerelated to pharmaceuticals, in particular the investment inRegeneron.
The Consumer Healthcare segment comprises, for all geographicalterritories, the commercial operations for our Consumer Healthcareproducts, together with research, development and productionactivities dedicated to those products.
The Vaccines segment comprises, for all geographical territories(including certain European territories previously included in theSanofi Pasteur MSD joint venture), the commercial operations ofSanofi Pasteur, together with research, development andproduction activities dedicated to vaccines.
Inter-segment transactions are not material.
The costs of Sanofi’s global functions (Medical Affairs, ExternalAffairs, Finance, Human Resources, Legal Affairs, InformationSolutions & Technologies, Sanofi Business Services, etc.) aremanaged centrally at group-wide level, and are presented withinthe “Other” category. That category also includes otherreconciling items such as retained commitments in respect ofdivested activities.
Information about operating segments for the years endedDecember 31, 2018, 2017 and 2016 is presented in Note D.35.,“Segment information”.
B.27. Management of capital
In order to maintain or adjust the capital structure, Sanofi canadjust the amount of dividends paid to shareholders, repurchaseits own shares, issue new shares, or issue securities givingaccess to its capital.
The following objectives are defined under the terms of Sanofi’sshare repurchase programs:
◆ the implementation of any stock option plan giving entitlementto purchase shares in the Sanofi parent company;
◆ the allotment or sale of shares to employees under statutoryprofit sharing schemes and employee savings plans;
◆ the consideration-free allotment of shares (i.e. restricted shareplans);
◆ the cancellation of some or all of the repurchased shares;
◆ market-making in the secondary market by an investmentservices provider under a liquidity contract in compliance withthe ethical code recognized by the Autorité des marchésfinanciers (AMF);
◆ the delivery of shares on the exercise of rights attached tosecurities giving access to the capital by redemption,conversion, exchange, presentation of a warrant or any othermeans;
◆ the delivery of shares (in exchange, as payment, or otherwise)in connection with mergers and acquisitions;
◆ the execution by an investment services provider of purchases,sales or transfers by any means, in particular via off-markettrading; or
◆ any other purpose that is or may in the future be authorizedunder the applicable laws and regulations.
Sanofi is not subject to any constraints on equity capital imposedby third parties.
SANOFI / FORM 20-F 2018 F-33
NOTES TO THE CONSOLIDATED FINANCIAL STATEMENTS – (Continued)
Total equity includes Equity attributable to equity holders of
Sanofi and Equity attributable to non-controlling interests, asshown in the consolidated balance sheet.
Sanofi defines “Net debt” as (i) the sum of short-term debt, long-term debt and interest rate derivatives and currency derivativesused to hedge debt, minus (ii) the sum of cash and cashequivalents and interest rate derivatives and currency derivativesused to hedge cash and cash equivalents.
C/ Principal alliancesC.1. Alliance arrangements with regeneronpharmaceuticals, Inc. (Regeneron)
Collaboration agreement on the discovery, development and
commercialization of Human Therapeutic Antibodies
In November 2007, Sanofi and Regeneron signed agreements(amended in November 2009) for the discovery, developmentand commercialization of fully human therapeutic antibodies.Under the 2009 amended agreements Sanofi committed tofunding the discovery and pre-clinical development of fully humantherapeutic antibodies by a maximum of $160 million per yearthrough 2017, with an option to develop and commercializeantibodies discovered by Regeneron pursuant to thecollaboration. Sanofi decided not to extend the discoveryagreement, which expired on December 31, 2017.
Following the signature in July 2015 of the immuno-oncologycollaboration agreements described below, $75 million of thediscovery and pre-clinical development funding was reallocatedto the new agreements (spread over three years).
If an option is exercised under the 2009 amended agreements,Sanofi co-develops the antibody with Regeneron and isresponsible for funding. Sanofi and Regeneron shareco-promotion rights and profits on sales of the co-developedantibodies. On receipt of the first positive Phase III trial results forany such antibody, the subsequent Phase III costs for thatantibody are split 80% Sanofi, 20% Regeneron. Amountsreceived from Regeneron under those arrangements arerecognized by Sanofi as a reduction in the line item “Research
and development expenses”. Once a product begins to becommercialized, and provided that the share of quarterly resultsunder the agreement represents a profit, Sanofi is entitled to anadditional portion of Regeneron’s profit-share (capped at 10% ofRegeneron’s share of quarterly profits) until Regeneron has paid50% of the cumulative development costs incurred by the partiesin the collaboration.
As of December 31, 2018 the cumulative development costsincurred by the two parties were €6.1 billion (comprising€3.3 billion funded 100% by Sanofi, and €2.8 billion funded 80%by Sanofi and 20% by Regeneron, amounts translated into eurosat the closing US dollar exchange rate). On the earlier of (i) 24months before the scheduled launch date or (ii) the first positivePhase III trial results, Sanofi and Regeneron share the
commercial expenses of the antibodies co-developed under thelicense agreement. Sanofi recognizes all the sales of thoseantibodies. Profits and losses arising from commercial operationsin the United States are split 50/50. Outside the United States,Sanofi is entitled to between 55% and 65% of profits dependingon sales of the antibodies, and bears 55% of any losses. Theshare of profits and losses attributable to Regeneron under theagreement is recognized within the line items Other operating
income or Other operating expenses, which are components ofoperating income. In addition, Regeneron is entitled to receivepayments of up to $250 million contingent on the attainment ofspecified levels of sales outside the United States.
Praluent®, Dupixent®, Kevzara® and REGN3500 (SAR440340)continue to be developed, and commercialized as applicable,with Regeneron under the Antibody License and CollaborationAgreement (LCA) following the expiry of the discoveryagreement.
In January 2018, Sanofi and Regeneron signed a set ofamendments including an amendment to the collaborationagreement on the development and commercialization of humantherapeutic antibodies that allowed for the funding of additionalprograms on Dupixent® and REGN3500 (SAR440340) which willfocus on extending the current range of indications, finding newindications, and improving co-morbidity between multiplepathologies.
Immuno-Oncology (IO) Discovery and Development
Agreement and IO License and Collaboration Agreement (IO
LCA)
On July 1, 2015, Sanofi and Regeneron entered into a new globalcollaboration to discover, develop and commercialize newantibody cancer treatments in the emerging field of immuno-oncology. As part of the agreements, Sanofi made an upfrontpayment of $640 million to Regeneron. The two companies alsoagreed to reallocate $75 million (spread over three years) toimmuno-oncology antibody research and development fromSanofi’s $160 million annual contribution to their existing antibodydiscovery collaboration.
Under the terms of the IO Discovery and DevelopmentAgreement, the two companies agreed to invest approximately$1 billion from discovery through proof of concept (POC)development (usually a Phase IIa study) of monotherapy andnovel combinations of immuno-oncology antibody candidates tobe funded 25% by Regeneron ($250 million) and 75% by Sanofi($750 million). Beyond the committed funding, additional fundingwill be allocated as programs enter post-POC development underthe IO LCA.
Upon establishment of POC, Sanofi can exercise its opt-in rightsto further development and commercialization under the IO LCAfor candidates derived from the IO discovery program. OnceSanofi has exercised its opt-in rights for a candidate, futuredevelopment of that candidate will be conducted under the IOLCA either by Sanofi or Regeneron.
F-34 SANOFI / FORM 20-F 2018
NOTES TO THE CONSOLIDATED FINANCIAL STATEMENTS – (Continued)
Under the terms of the IO Discovery and DevelopmentAgreement, Sanofi is entitled to an additional share of profits ofup to 50% of the clinical development costs initially funded bySanofi. That additional profit-share is capped at 10% of the shareof Regeneron’s quarterly profits arising under the IO LCA.
The Amended and Restated Immuno-oncology Discovery andDevelopment Agreement (“Amended IO Discovery Agreement”),effective from December 31, 2018, was signed on January 2,2019. Through this amendment, Sanofi and Regeneronrestructured their global Immuno-oncology Discovery andDevelopment Agreement, effective December 31, 2018. The2015 agreement was due to end in mid-2020, and the revisionprovides for ongoing collaborative development of two clinical-stage bispecific antibody programs targeting respectively(i) BCMA and CD3 and (ii) MUC16 and CD3. This gives Sanofiincreased flexibility to advance its early-stage immuno-oncologypipeline independently, while Regeneron retains all rights to itsother immuno-oncology discovery and development programs.
Under the terms of the Amended IO Discovery Agreement Sanofipaid Regeneron $462 million representing the balance ofpayments due under the original Immuno-oncology Agreement,which covers the Sanofi share of (i) the immuno-oncologydiscovery program costs for the last quarter of 2018 and up to$120 million in development costs for the two selected clinical-stage bispecific antibodies, plus (ii) the termination fee for theother programs under the original immuno-oncology agreement.Sanofi secured the right to opt-in to the BCMAxCD3 andMUC16xCD3 bispecific programs when proof of concept isachieved or when the allocated funding is expended.
Post opt-in of the BCMAxCD3 bispecific, Sanofi will leaddevelopment and commercialization. Post opt-in of theMUC16xCD3 bispecific, Regeneron will lead development, andalso lead commercialization in the United States. Sanofi will leadcommercialization outside the United States.
The companies’ ongoing collaboration for the development andcommercialization of Libtayo® (cemiplimab) is unaffected by theAmended IO Discovery Agreement. As of December 31, 2018,the additional share of profits corresponding to 50% of the clinicaldevelopment costs initially funded by Sanofi amounts to€53 million (amount translated into euros at the closing US dollarexchange rate). This additional profit-share is capped at 10% ofthe share of Regeneron’s quarterly profits arising under the IOLCA.
Under the 2015 IO LCA, the two companies have agreed tojointly develop a programmed cell death protein 1 (PD-1) inhibitorantibody (REGN2810) and have committed to provide additionalfunding of no more than $650 million on a 50/50 basis($325 million per company) for the development of REGN2810, aPD-1 inhibitor antibody. While they share profits on a 50/50 basis,Sanofi will make a one-time milestone payment of $375 million toRegeneron in the event that sales of a PD-1 product and anyother collaboration antibody sold for use in combination with aPD-1 product were to exceed, in the aggregate, $2 billion in anyconsecutive 12-month period.
In January 2018, Sanofi and Regeneron announced a set ofamendments including an amendment to their IO LCA on thedevelopment of cemiplimab (REGN2810) in the field of immuno-oncology, pursuant to which the $650 million development budgetfor the PD-1 inhibitor antibody was increased to $1.64 billionthrough 2022, funded equally by the two companies (i.e. from$325 million to $820 million for each partner).
On September 21, 2018, the US Food and Drug Administration(FDA) approved Libtayo® (cemiplimab) for the treatment ofpatients with metastatic cutaneous squamous cell carcinoma(CSCC) or locally advanced CSCC who are not candidates forcurative surgery or curative radiation. Libtayo® is a fully-humanmonoclonal antibody targeting the immune checkpoint receptorPD-1 (programmed cell death protein-1) and is the first and onlytreatment specifically approved and available for advancedCSCC in the U.S. A regulatory application for Libtayo® has alsobeen submitted in the EU.
An ongoing joint clinical program is investigating Libtayo® inmultiple other cancers, and includes potentially pivotal trials inlung, cervical and skin cancers. The safety and efficacy ofLibtayo® have not been fully evaluated by any regulatoryauthority for indications beyond advanced CSCC.
Investor agreement
In January 2014, Sanofi and Regeneron amended the investoragreement that has existed between the two companies since2007 (the “Amended Investor Agreement”). Under the terms ofthe amendment, Sanofi accepted various restrictions. Sanofi isbound by certain “standstill” provisions, which contractuallyprohibit Sanofi from seeking to directly or indirectly exert controlof Regeneron or acquiring more than 30% of Regeneron’s capitalstock (consisting of the outstanding shares of common stock andthe shares of Class A stock). This prohibition will remain in placeuntil the earlier of (i) the later of the fifth anniversaries of theexpiration or earlier termination of the Zaltrap® collaborationagreement with Regeneron (related to the development andcommercialization of Zaltrap®) or the collaboration agreementwith Regeneron on monoclonal antibodies (see “Collaborationagreement on the discovery, development and commercializationof human therapeutics antibodies” above), each as amended and(ii) other specified events.
Sanofi has also agreed to vote as recommended by Regeneron’sBoard of Directors, except that it may elect to vote proportionallywith the votes cast by all of Regeneron’s other shareholders withrespect to certain change-of-control transactions, and to vote inits sole discretion with respect to liquidation or dissolution, stockissuances equal to or exceeding 20% of the outstanding sharesor voting rights of Regeneron’s Class A Stock and CommonStock (taken together), and new equity compensation plans oramendments if not materially consistent with Regeneron’shistorical equity compensation practices.
As soon as it had passed the threshold of 20% ownership of thecapital stock, Sanofi exercised its right under the AmendedInvestor Agreement to designate an independent director, who
SANOFI / FORM 20-F 2018 F-35
NOTES TO THE CONSOLIDATED FINANCIAL STATEMENTS – (Continued)
was appointed to the Board of Directors of Regeneron. Theinterest held by Sanofi in Regeneron has been consolidated bythe equity method since April 2014.
On the conditions set out in the Amended Investor Agreemententered into in January 2014, Sanofi’s right to designate aRegeneron board member was contingent on Sanofi maintainingits percentage share of Regeneron’s outstanding capital stock(measured on a quarterly basis) at a level no lower than thehighest percentage level previously achieved, with the maximumrequirement capped at 25%. In addition, Sanofi’s interest inRegeneron was subject to a lock-up clause. Those limitationshave been amended by the letter agreement of January 2018(see below).
In November 2015, the Independent Designee (as defined in theAmended Investor Agreement) designated by Sanofi as anindependent director resigned from the Regeneron Board ofDirectors. At Sanofi’s request, pursuant to the Amended InvestorAgreement, Regeneron appointed N. Anthony “Tony” Coles, M.D.to its Board of Directors in January 2017 as a successor Sanofidesignee.
The Amended Investor Agreement also gives Sanofi the right toreceive certain reasonable information as may be agreed uponby the parties and which will facilitate Sanofi’s ability to accountfor its investment in Regeneron using the equity method ofaccounting under IFRS.
In January 2018, Sanofi and Regeneron announced a set ofamendments (i) to their collaboration agreement on thedevelopment and commercialization of human therapeuticantibodies; (ii) to their IO License and Collaboration Agreementon the development of cemiplimab (REGN2810) in the field ofimmuno-oncology; and (iii) a limited waiver and amendment ofthe Amended Investor Agreement pursuant to a letter agreement(the “2018 Letter Agreement”).
Pursuant to the 2018 Letter Agreement, Regeneron has agreedto grant a limited waiver of the lock-up clause” and the obligationto maintain the “Highest Percentage Threshold” in the Amendedand Restated Investor Agreement between the companies, sothat Sanofi may elect to sell a small percentage of the Regeneroncommon stock it owns to fund a portion of the cemiplimab anddupilumab development expansion. This waiver will allow Sanofito sell up to an aggregate of 1.4 million shares of Regeneroncommon stock to Regeneron in private transactions through theend of 2020. If Regeneron decides not to purchase the shares,Sanofi will be allowed to sell those shares on the open market,subject to certain volume and timing limitations. Upon expirationof the limited waiver under the 2018 Letter Agreement, theAmended Investor Agreement will be amended to define “HighestPercentage Threshold” as the lower of (i) 25% of Regeneronoutstanding shares of Class A Stock and Common Stock (takentogether) and (ii) the higher of (a) Sanofi’s percentage ownershipof Class A Stock and Common Stock (taken together) on suchtermination date and (b) the highest percentage ownership ofRegeneron outstanding shares of Class A Stock and CommonStock (taken together) Sanofi attains following such termination
date. As of December 31, 2018 Sanofi has sold 226,153 sharesof Regeneron stock to Regeneron pursuant to the 2018 LetterAgreement.
C.2. Alliance arrangements with Bristol-MyersSquibb (BMS)
Two of Sanofi’s leading products were jointly developed withBMS: the anti-hypertensive agent irbesartan (Aprovel®/Avapro®/Karvea®) and the anti-atherothrombosis treatment clopidogrelbisulfate (Plavix®/Iscover®).
On September 27, 2012, Sanofi and BMS signed an agreementrelating to their alliance following the loss of exclusivity of Plavix®
and Avapro®/Avalide® in many major markets.
Under the terms of this agreement, effective January 1, 2013,BMS returned to Sanofi its rights to Plavix® and Avapro®/Avalide® in all markets worldwide with the exception of Plavix® inthe United States and Puerto Rico, giving Sanofi sole control andfreedom to operate commercially in respect of those products. Inexchange, BMS received royalty payments on Sanofi’s sales ofbranded and unbranded Plavix® and Avapro®/Avalide® worldwide(except for Plavix® in the United States and Puerto Rico) until2018, and also received a payment of $200 million from Sanofi inDecember 2018, part of which is for buying out thenon-controlling interests (see Note D.18.). Rights to Plavix® in theUnited States and Puerto Rico remain unchanged and continueto be governed by the terms of the original agreement untilDecember 2019.
In all of the territories managed by Sanofi (including the UnitedStates and Puerto Rico for Avapro®/Avalide®) as defined in thenew agreement, Sanofi recognizes in its consolidated financialstatements the revenue and expenses generated by its ownoperations. The share of profits reverting to BMS subsidiaries ispresented within Net income attributable to non-controlling
interests in the income statement.
In the territory managed by BMS (United States and Puerto Ricofor Plavix®), Sanofi recognizes its share of profits and losseswithin the line item Share of profit/(loss) from investments
accounted for using the equity method.
D/ Presentation of the financialstatementsD.1. Changes in the scope of consolidation dueto acquisitions and divestments
D.1.1. Principal changes in the scope ofconsolidation in 2018
Acquisition of Bioverativ
Following a public tender offer, on March 8, 2018 Sanofi acquiredthe entire share capital of Bioverativ, a biotechnology companyspecializing in the development of treatments for hemophilia and
F-36 SANOFI / FORM 20-F 2018
NOTES TO THE CONSOLIDATED FINANCIAL STATEMENTS – (Continued)
other rare blood disorders, for a total consideration of$11.6 billion (€9.4 billion).
The provisional purchase price allocation resulted in the recognitionof goodwill amounting to €2,676 million, as indicated below:
(€ million)Fair value at
acquisition date
Other intangible assets 8,113
Inventories 145
Cash and cash equivalents 422
Other current and non-current assets andliabilities 16
True North Therapeutics contingentconsideration liability (226)
Net deferred tax position (1,792)
Net assets of Bioverativ 6,678
Goodwill 2,676
Purchase price 9,354
The other intangible assets recognized mainly comprise themarketed hemophilia products Eloctate® (a recombinant fusionprotein consisting of human coagulation VIII factor bound to theFc fragment of IgG1, for the treatment of hemophilia A) andAlprolix® (a recombinant fusion protein consisting of coagulationIX factor bound to the Fc fragment of IgG1, for the treatment ofhemophilia B), plus development projects relating to treatmentsfor rare hematological disorders (in particular, a Phase IIIresearch program in cold agglutinin disease).
Goodwill represents (i) the pipeline of future products in early-stage research and development not identified individually at theacquisition date; (ii) the capacity to draw on a specialized structureto refresh the existing product portfolio; (iii) the competencies ofBioverativ staff; (iv) the benefits derived from the creation of newgrowth platforms; and (v) the expected future synergies and otherbenefits from the combination of Bioverativ and Sanofi.
The goodwill arising on this acquisition is not tax deductible.
The contributions from Bioverativ to net sales and businessoperating income of the Pharmaceuticals segment (for adefinition refer to Note D.35., “Segment Information”) since theacquisition date amount to €892 million and €389 million,respectively. Over the same period, Bioverativ made a negativecontribution of €325 million to consolidated net income, includingexpenses charged during the period relating to the fair valueremeasurement of assets recognized at the acquisition date.During the year ended December 31, 2018, Bioverativ generatednet sales of €1,068 million.
Acquisition-related costs recognized in profit or loss for the periodamounted to €26 million, and were recorded primarily withinOther operating expenses.
The net cash outflow on this acquisition amounted to €8,932 million,and is recorded within Acquisitions of consolidated
undertakings and investments accounted for using the equity
method in the consolidated statement of cash flows.
Acquisition of Ablynx
On May 14, 2018, following a public tender offer, Sanofi acquired95.60% of the share capital of Ablynx, a biopharmaceuticalcompany specializing in the discovery and development ofNanobodies®. On June 19, 2018, following the expiration of thesqueeze-out procedure, Sanofi announced that it held the entireshare capital of Ablynx, representing a total investment of€3,897 million.
The provisional purchase price allocation resulted in the recognitionof goodwill amounting to €1,372 million, as indicated below:
(€ million)Fair value at
acquisition date
Other intangible assets 2,409
Cash and cash equivalents 258
Other current and non-current assets andliabilities 130
Net deferred tax position (272)
Net assets of Ablynx 2,525
Goodwill 1,372
Purchase price 3,897
The other intangible assets acquired mainly comprise:
◆ the rights to Cablivi®, a medicine for the treatment of a life-threatening form of thrombotic micro-angiopathy that obtainedEuropean marketing approval in September 2018 and iseligible for FDA priority review, and the rights to develop atreatment for respiratory syncytial virus in very young and veryold patients at high risk of complications;
◆ the rights to exploit technology developed by Ablynx that usescamelid antibody fragments (“Nanobodies®”) to research andidentify multi-specific molecules targeting multiple diseases invarious therapeutic fields; and
◆ future payments receivable under research and developmentcollaboration agreements contracted by Ablynx for candidatesin various therapeutic fields.
Goodwill represents (i) the pipeline of future products in early-stage research and development not identified individually at theacquisition date; (ii) the capacity to draw on a technologicalplatform and specialized structure to refresh the existing productportfolio; (iii) the competencies of Ablynx staff; (iv) the benefitsderived from the creation of new growth platforms; and (v) theexpected future synergies and other benefits from thecombination of Ablynx and Sanofi.
The goodwill arising on this acquisition is not tax deductible.
The impacts of this acquisition on Sanofi’s business operatingincome and consolidated net income for the year endedDecember 31, 2018 are not material.
SANOFI / FORM 20-F 2018 F-37

NOTES TO THE CONSOLIDATED FINANCIAL STATEMENTS – (Continued)
Acquisition-related costs recognized in profit or loss during theperiod were €30 million, and are mainly included within the lineitem Other operating expenses.
The net cash outflow on this acquisition amounted to€3,639 million, and is recorded within Acquisitions of
consolidated undertakings and investments accounted for
using the equity method in the consolidated statement of cashflows.
Divestment of the European Generics business
On September 30, 2018, Sanofi finalized the divestment of itsEuropean Generics business. Sanofi recognized a gain of€510 million before taxes.
An analysis of the assets and liabilities divested is set forth below:
(€ million)September 30,
2018
Assets
Property, plant and equipment 120
Goodwill 913
Other intangible assets 75
Other non-current assets 1
Deferred tax assets 83
Inventories 129
Accounts receivable 107
Other current assets 40
Cash and cash equivalents 122
Total assets of the divested European Generics business 1,590
Liabilities
Non-current provisions and other non-current liabilities 27
Deferred tax liabilities 14
Accounts payable 91
Other current liabilities 216
Short-term debt and current portion of long-term debt 46
Total liabilities of the divested European Generics business 394
The cash inflow on this divestment amounted to €1,598 million,and is recorded within Proceeds from disposals of property,
plant and equipment, intangible assets and other
non-current assets, net of tax in the consolidated statement ofcash flows.
Regeneron Pharmaceuticals, Inc. (Regeneron)
Changes in the equity interest held by Sanofi in the biopharmaceuticals company Regeneron during the reporting periods presented areset forth below:
(€ million) 2018 2017(a) 2016(a)
Carrying amount(b) 3,055 2,496 2,550
Equity interest 21.7% 22.2% 22.1%
Acquisitions of shares — 184 115
Disposals of shares(c) 24 — —
(a) Includes the effects of first-time application of IFRS 15 on revenue recognition (see Note A.2.1.1.).(b) See Note D.6.(c) Disposals of shares in connection with the funding of R&D activities relating to Libtayo®, Dupixent® and REGN3500 (SAR440340) (see Note C.1.).
F-38 SANOFI / FORM 20-F 2018
NOTES TO THE CONSOLIDATED FINANCIAL STATEMENTS – (Continued)
D.1.2. Principal changes in the scope ofconsolidation in 2017
Acquisition of Protein Sciences
On August 25, 2017, Sanofi acquired 100% of Protein Sciences,a biotechnology company headquartered in Meriden, Connecticut(United States). The principal product of Protein Sciences isFlublok®, the only recombinant protein-based influenza vaccineapproved by the FDA in the United States.
The purchase price allocation resulted in the recognition ofgoodwill amounting to €117 million, as indicated below:
(€ million)Fair value at
acquisition date
Other intangible assets 776
Inventories 4
Other assets and liabilities (7)
Net deferred tax position (259)
Net assets of Protein Sciences 514
Goodwill 117
Purchase price 631
The other intangible assets acquired mainly comprise themarketed vaccine Flublok®, valued at €767 million. The purchaseprice included two contingent consideration milestones of€42 million each.
The impacts of this acquisition on Sanofi’s business operatingincome and consolidated net income for the year endedDecember 31, 2017 were not material.
D.1.3. Principal changes in the scope ofconsolidation in 2016
In December 2016, Sanofi finalized the dissolution of the SanofiPasteur MSD (SPMSD) joint venture.
The transaction was completed in two stages on December 30and December 31, 2016.
Divestment by Sanofi of its interest in SPMSD
On December 30, 2016, Sanofi transferred its interest in SPMSDto MSD.
The consideration for the transfer was (i) a fixed sum of€127 million received on January 4, 2017 and (ii) contingentconsideration measured at €458 million as of December 31, 2016and recognized in the available-for-sale financial assets category(see Note D.7.).
The pre-tax gain on the divestment, amounting to €211 million, ispresented within the line item Other gains and losses, and
litigation (see Note D.28) for the year ended December 31,2016. A negative price adjustment of €31 million was recognizedwithin the same line item in 2017.
Acquisition of the European Vaccines business previouslyincluded in the SPMSD joint venture
This transaction was finalized on December 31, 2016. The finalpurchase price allocation resulted in the recognition of goodwillamounting to €21 million, as presented in the table below:
(€ million)Fair value at
acquisition date
Other intangible assets 465
Inventories 17
Other current assets 2
Other non-current liabilities (5)
Net deferred tax position (10)
Net assets of the European Vaccines
business 469
Goodwill 21
Purchase price 490
The purchase price essentially comprised (i) a fixed sum of€154 million paid on January 4, 2017 and (ii) contingentconsideration of €354 million. In accordance with IFRS 3(Business Combinations), that contingent consideration wasrecognized in Liabilities related to business combinations
and to non-controlling interests as of December 31, 2016 (seeNote D.18.). A negative price adjustment of €16 million wasrecognized in the year ended December 31, 2017.
D.1.4. Other acquisitions and divestments
The impacts of the other acquisitions made during 2018, 2017and 2016 are not material for Sanofi.
D.2. Exchange of the Animal Health Business
On January 1, 2017, Sanofi finalized the exchange of its AnimalHealth business for Boehringer Ingelheim’s ConsumerHealthcare (CHC) business.
Consequently, and as required by IFRS 5 (see Note B.7.), all theassets and liabilities of the Animal Health business wereclassified in the line items Assets held for sale or exchange
and Liabilities related to assets held for sale or exchange,respectively, in the consolidated balance sheet as ofDecember 31, 2016. The net income/loss from that business wasalso presented separately in the consolidated income statementwithin the line item Net income/(loss) of the exchanged/
held-for-exchange Animal Health business.
For detailed information about the contribution of the AnimalHealth business to the consolidated financial statements refer toNote D.36., “Exchanged/Held-for-Exchange Animal Healthbusiness”.
After final enterprise value adjustments, the exchange values ofthe two businesses transferred in 2017 were determined at€10,557 million for Sanofi’s Animal Health business and€6,239 million for Boehringer Ingelheim’s CHC business.
SANOFI / FORM 20-F 2018 F-39
NOTES TO THE CONSOLIDATED FINANCIAL STATEMENTS – (Continued)
Divestment of the Animal Health Business
In 2017, Sanofi recognized a pre-tax gain of €6,343 million withinthe line item Net income of the exchanged/held-for-exchange
Animal Health business, and an after-tax gain of €4,643 million.
Acquisition of Boehringer Ingelheim’s CHC Business
Goodwill on the acquisition amounted to €2,222 million, andrepresents (i) the capacity to draw on a specialized structure torefresh the existing product portfolio; (ii) the competencies of thestaff transferred to Sanofi; (iii) the benefits derived from the
creation of new growth platforms; and (iv) the expected futuresynergies and other benefits from combining the CHC operationsof Boehringer Ingelheim and Sanofi.
The tax-deductible portion of goodwill amounted to€1,876 million.
Acquisition-related costs amounted to €10 million.
With effect from January 1, 2017, the performances of thisportfolio (which generated sales of €1,407 million in 2017) arereflected in the consolidated net sales of the ConsumerHealthcare segment.
F-40 SANOFI / FORM 20-F 2018

NOTES TO THE CONSOLIDATED FINANCIAL STATEMENTS – (Continued)
D.3. Property, plant and equipment
Property, plant and equipment (including assets held under finance leases) comprise:
(€ million) Land Buildings
Machinery
and
equipment
Fixtures,
fittings and
other
Property, plant
and equipment
in process Total
Gross value at January 1, 2016 336 6,732 9,742 2,347 1,952 21,109
Acquisitions and other increases — 9 48 51 1,232 1,340
Disposals and other decreases
Currency translation differences
(10)
1
(111)
81
(350)
36
(104)
(1)
(37)
15
(612)
132
Transfers(a) — 247 558 128 (1,025) (92)
Gross value at December 31, 2016 327 6,958 10,034 2,421 2,137 21,877
Changes in scope of consolidation 22 23 11 6 7 69
Acquisitions and other increases
Disposals and other decreases
—
(10)
10
(124)
63
(261)
54
(125)
1,267
(111)
1,394
(631)
Currency translation differences
Transfers(a)
(21)
—
(326)
227
(278)
576
(75)
169
(84)
(919)
(784)
53
Gross value at December 31, 2017 318 6,768 10,145 2,450 2,297 21,978
Changes in scope of consolidation
Acquisitions and other increases
—
—
6
22
11
48
4
71
1
1,318
22
1,459
Disposals and other decreases
Currency translation differences
(23)
—
(227)
57
(272)
26
(127)
17
(20)
11
(669)
111
Transfers(a) (12) 257 510 164 (1,123) (204)
Gross value at December 31, 2018 283 6,883 10,468 2,579 2,484 22,697
Accumulated depreciation & impairment atJanuary 1, 2016 (11) (3,132) (6,216) (1,641) (166) (11,166)
Depreciation expense — (356) (595) (190) — (1,141)
Impairment losses, net of reversals
Disposals and other decreases
(3)
3
(31)
107
(17)
348
(30)
100
(78)
33
(159)
591
Currency translation differences
Transfers(a)
—
4
(37)
22
(16)
16
(2)
6
(2)
26
(57)
74
Accumulated depreciation & impairment atDecember 31, 2016 (7) (3,427) (6,480) (1,757) (187) (11,858)
Depreciation expense — (329) (595) (197) — (1,121)
Impairment losses, net of reversals
Disposals and other decreases
(11)
—
(45)
94
(177)
239
(6)
117
(15)
107
(254)
557
Currency translation differences
Transfers(a)
1
(3)
140
(45)
147
(19)
53
(14)
2
15
343
(66)
Accumulated depreciation & impairment atDecember 31, 2017 (20) (3,612) (6,885) (1,804) (78) (12,399)
Depreciation expense — (351) (595) (191) — (1,137)
Impairment losses, net of reversals
Disposals and other decreases
(8)
8
(24)
170
(40)
235
(11)
110
(12)
3
(95)
526
Currency translation differences
Transfers(a)
—
1
(29)
50
(15)
70
(14)
(4)
—
—
(58)
117
Accumulated depreciation & impairment atDecember 31, 2018 (19) (3,796) (7,230) (1,914) (87) (13,046)
Carrying amount at December 31, 2016
Carrying amount at December 31, 2017
320
298
3,531
3,156
3,554
3,260
664
646
1,950
2,219
10,019
9,579
Carrying amount at December 31, 2018 264 3,087 3,238 665 2,397 9,651
(a) This line also includes the effect of the reclassification of assets to Assets held for sale or exchange.
SANOFI / FORM 20-F 2018 F-41

NOTES TO THE CONSOLIDATED FINANCIAL STATEMENTS – (Continued)
The table below sets forth acquisitions and capitalized interest by operating segment for the years ended December 31, 2018, 2017 and 2016:
(€ million) 2018 2017 2016
Acquisitions 1,459 1,394 1,340
Pharmaceuticals 1,014 1,005 1,069
Industrial facilities 769 741 769
Research sites 14 138 164
Other 231 126 136
Vaccines 440 379 271
Consumer Healthcare(a) 5 10 —
Capitalized interest 21 20 17
(a) Consumer Healthcare was not identified as an operating segment in 2016, and acquisitions for CHC during that year are included within thePharmaceuticals segment (See Note D.35.).
Off balance sheet commitments relating to property, plant and equipment as of December 31, 2018, 2017 and 2016 are set forth below:
(€ million) 2018 2017 2016
Firm orders of property, plant and equipment 535 508 545
Property, plant and equipment pledged as security for liabilities 123 128 241
Impairment tests of property, plant and equipment conducted using the method described in Note B.6. resulted in the recognition of thefollowing impairment losses in each of the last three financial periods:
(€ million) 2018 2017 2016
Net impairment losses 94 254 159
of which tangible assets related to Dengue vaccine — 87 —
The table below shows amounts for items of property, plant and equipment held under finance leases:
(€ million) 2018 2017 2016
Land — 4 3
Buildings 73 102 102
Other property, plant and equipment 14 9 8
Total gross value 87 115 113
Accumulated depreciation and impairment (64) (87) (79)
Carrying amount 23 28 34
Future minimum lease payments due under finance leases are shown in the table below:
(€ million) 2018 2017 2016
Future minimum lease payments due under finance leases 25 39 66
of which interest 3 7 13
As of December 31, 2018, the payment schedule is as follows:
Payments due by period
(€ million) Total
Less than
1 year
1 to 3
years
3 to 5
years
More than
5 years
Finance lease obligations
principal 22 4 6 7 5
interest 3 1 1 1 —
Total 25 5 7 8 5
◆
◆
F-42 SANOFI / FORM 20-F 2018

NOTES TO THE CONSOLIDATED FINANCIAL STATEMENTS – (Continued)
D.4. Goodwill and other intangible assets
Movements in goodwill comprise:
(€ million) Goodwill
Balance at January 1, 2016 39,557
Acquisitions during the period 5
Currency translation differences 725
Balance at December 31, 2016 40,287
Acquisitions during the period 2,347
Other movements during the period 12
Currency translation differences (2,382)
Balance at December 31, 2017 40,264
Acquisitions during the period 4,039
Other movements during the period(a) (1,006)
Currency translation differences 938
Balance at December 31, 2018 44,235
(a) Relates mainly to the divestment of the European Generics business.
Acquisition of Bioverativ (2018)
The provisional purchase price allocation for Bioverativ resultedin the recognition of intangible assets (other than goodwill)
totaling €8,113 million as of the acquisition date (March 8, 2018),and of goodwill provisionally measured at €2,676 million as of theacquisition date (see Note D.1.1.).
Acquisition of Ablynx (2018)
The provisional purchase price allocation for Ablynx resulted inthe recognition of intangible assets (other than goodwill) totaling€2,409 million as of the acquisition date (May 14, 2018), and ofgoodwill provisionally measured at €1,372 million as of theacquisition date (see Note D.1.1.).
Acquisition of Boehringer Ingelheim’s Consumer Healthcare
business (2017)
The final purchase price allocation for Boehringer Ingelheim’sConsumer Healthcare business resulted in the recognition ofintangible assets (other than goodwill) totaling €3,771 million atthe acquisition date (January 1, 2017), and goodwill of€2,222 million (see Note D.2.).
Acquisition of Protein Sciences (2017)
The final purchase price allocation for Protein Sciences resultedin the recognition of intangible assets (other than goodwill)totaling €776 million, and goodwill of €117 million (see NoteD.1.2.).
SANOFI / FORM 20-F 2018 F-43

NOTES TO THE CONSOLIDATED FINANCIAL STATEMENTS – (Continued)
Movements in other intangible assets comprise:
(€ million) Acquired R&D
Products,
trademarks and
other rights Software
Total other
intangible assets
Gross value at January 1, 2016 3,854 52,002 1,231 57,087
Changes in scope of consolidation — 465 — 465Acquisitions and other increases 142 127 148 417Disposals and other decreases (305)(c) (687) (73) (1,065)Currency translation differences 55 1,124 17 1,196Transfers(a) (97) 76 3 (18)
Gross value at December 31, 2016 3,649 53,107 1,326 58,082
Changes in scope of consolidation — 4,546 1 4,547Acquisitions and other increases 317 212 170 699Disposals and other decreases (39) (450) (62) (551)Currency translation differences (200) (3,814) (51) (4,065)Transfers(a) (48) 37 (16) (27)
Gross value at December 31, 2017 3,679 53,638 1,368 58,685
Changes in scope of consolidation 3,632 6,889 2 10,523
Acquisitions and other increases 367 16 251 634
Disposals and other decreases (44) (920) (75) (1,039)
Currency translation differences 218 1,757 10 1,985
Transfers(a) (430) 420 3 (7)
Gross value at December 31, 2018 7,422 61,800 1,559 70,781
Accumulated amortization &impairment at January 1, 2016 (2,301) (41,888) (872) (45,061)
Amortization expense — (1,712) (104) (1,816)Impairment losses, net of reversals(b) (60) (137) — (197)Disposals and other decreases 108 673 73 854Currency translation differences (41) (931) (12) (984)Transfers(a) 4 (2) (1) 1
Accumulated amortization &impairment at December 31, 2016 (2,290) (43,997) (916) (47,203)
Amortization expense — (1,886) (112) (1,998)Impairment losses, net of reversals(b) (95) (215) (3) (313)Disposals and other decreases 39 443 64 546Currency translation differences 142 3,138 35 3,315Transfers(a) — 41 7 48
Accumulated amortization &impairment at December 31, 2017 (2,204) (42,476) (925) (45,605)
Amortization expense — (2,188) (115) (2,303)
Impairment losses, net of reversals(b) (456) (264) (10) (730)
Disposals and other decreases 36 840 68 944
Currency translation differences (54) (1,146) (6) (1,206)
Transfers(a) — 6 2 8
Accumulated amortization &impairment at December 31, 2018 (2,678) (45,228) (986) (48,892)
Carrying amount at December 31, 2016 1,359 9,110 410 10,879Carrying amount at December 31, 2017 1,475 11,162 443 13,080
Carrying amount at December 31, 2018 4,744 16,572 573 21,889
(a) The “Transfers” line mainly relates to acquired R&D that came into commercial use during the period and is being amortized from the date of marketingapproval.
(b) See Note D.5.(c) Includes the return of product rights to Hanmi Pharmaceutical Co. Ltd in 2016 (see Note D.21.1).
F-44 SANOFI / FORM 20-F 2018
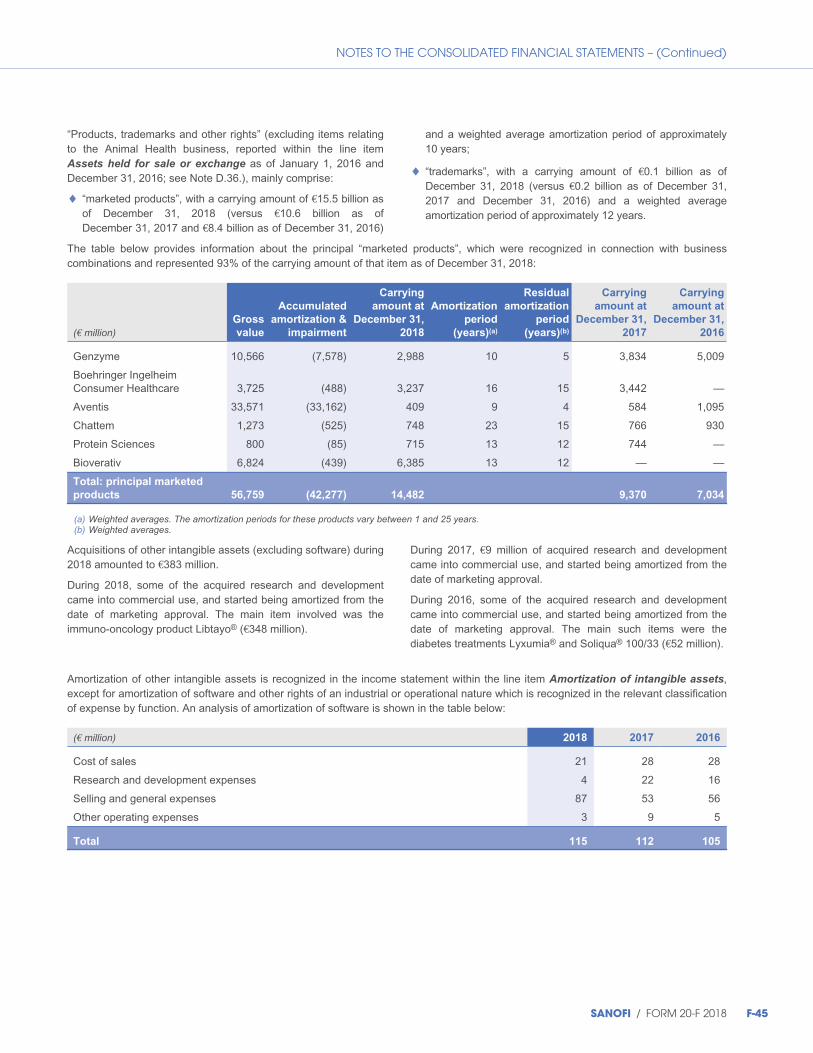
NOTES TO THE CONSOLIDATED FINANCIAL STATEMENTS – (Continued)
“Products, trademarks and other rights” (excluding items relatingto the Animal Health business, reported within the line itemAssets held for sale or exchange as of January 1, 2016 andDecember 31, 2016; see Note D.36.), mainly comprise:
◆ “marketed products”, with a carrying amount of €15.5 billion asof December 31, 2018 (versus €10.6 billion as ofDecember 31, 2017 and €8.4 billion as of December 31, 2016)
and a weighted average amortization period of approximately10 years;
◆ “trademarks”, with a carrying amount of €0.1 billion as ofDecember 31, 2018 (versus €0.2 billion as of December 31,2017 and December 31, 2016) and a weighted averageamortization period of approximately 12 years.
The table below provides information about the principal “marketed products”, which were recognized in connection with businesscombinations and represented 93% of the carrying amount of that item as of December 31, 2018:
(€ million)Gross
value
Accumulated
amortization &
impairment
Carrying
amount at
December 31,
2018
Amortization
period
(years)(a)
Residual
amortization
period
(years)(b)
Carrying
amount at
December 31,
2017
Carrying
amount at
December 31,
2016
Genzyme 10,566 (7,578) 2,988 10 5 3,834 5,009
Boehringer IngelheimConsumer Healthcare 3,725 (488) 3,237 16 15 3,442 —
Aventis 33,571 (33,162) 409 9 4 584 1,095
Chattem 1,273 (525) 748 23 15 766 930
Protein Sciences 800 (85) 715 13 12 744 —
Bioverativ 6,824 (439) 6,385 13 12 — —
Total: principal marketed
products 56,759 (42,277) 14,482 9,370 7,034
(a) Weighted averages. The amortization periods for these products vary between 1 and 25 years.(b) Weighted averages.
Acquisitions of other intangible assets (excluding software) during2018 amounted to €383 million.
During 2018, some of the acquired research and developmentcame into commercial use, and started being amortized from thedate of marketing approval. The main item involved was theimmuno-oncology product Libtayo® (€348 million).
During 2017, €9 million of acquired research and developmentcame into commercial use, and started being amortized from thedate of marketing approval.
During 2016, some of the acquired research and developmentcame into commercial use, and started being amortized from thedate of marketing approval. The main such items were thediabetes treatments Lyxumia® and Soliqua® 100/33 (€52 million).
Amortization of other intangible assets is recognized in the income statement within the line item Amortization of intangible assets,except for amortization of software and other rights of an industrial or operational nature which is recognized in the relevant classificationof expense by function. An analysis of amortization of software is shown in the table below:
(€ million) 2018 2017 2016
Cost of sales 21 28 28
Research and development expenses 4 22 16
Selling and general expenses 87 53 56
Other operating expenses 3 9 5
Total 115 112 105
SANOFI / FORM 20-F 2018 F-45

NOTES TO THE CONSOLIDATED FINANCIAL STATEMENTS – (Continued)
D.5. Impairment of intangible assets and property, plant and equipment
Goodwill
The recoverable amount of cash generating units (CGUs) is determined by reference to the value in use of each CGU, based ondiscounted estimates of the future cash flows from the CGU, in accordance with the policies described in Note B.6.1.
Goodwill is monitored internally at the level of each of the three current CGUs (Pharmaceuticals, Consumer Healthcare and Vaccines).Each of those CGUs reflects on a global scale all the key organizational components involved in commercial, R&D and industrialdecision-making for that CGU. Sanofi believes those decisions have a significant influence on the generation of cash flows for eachCGU.
The goodwill arising on the acquisitions of Bioverativ and Ablynx (see Note D.1.1.) was allocated in full to the Pharmaceuticals CGU.
The allocation of goodwill as of December 31, 2018 is shown below:
(€ million) Pharmaceuticals
Consumer
Healthcare Vaccines Total
Goodwill 36,352 6,545 1,338 44,235
The value in use of each CGU was determined by applying anafter-tax discount rate to estimated future after-tax cash flows.
A separate discount rate is used for each CGU to reflect thespecific economic conditions of the CGU.
The rates used for impairment testing in 2018 were 7.75% for thePharmaceuticals CGU, 7.00% for the Consumer HealthcareCGU, and 7.25% for the Vaccines CGU; an identical value in usefor Sanofi as a whole would be obtained by applying a uniform7.5% rate to all three CGUs.
The pre-tax discount rates applied to estimated pre-tax cashflows are calculated by iteration from the previously-determinedvalue in use. Those pre-tax discount rates were 10.4% for thePharmaceuticals CGU, 8.8% for the Consumer Healthcare CGUand 9.6% for the Vaccines CGU, and equate to a uniform rate of10.0% for Sanofi as a whole.
The assumptions used in testing goodwill for impairment arereviewed annually. Apart from the discount rate, the principalassumptions used in 2018 were as follows:
◆ The perpetual growth rates applied to future cash flows werezero for the Pharmaceuticals CGU, 2% for the ConsumerHealthcare CGU, and 0.5% for the Vaccines CGU.
◆ Sanofi also applies assumptions on the probability of successof current research and development projects, and moregenerally on its ability to renew the product portfolio in thelonger term.
Value in use (determined as described above) is compared withthe carrying amount, and this comparison is then subjected tosensitivity analyses by reference to the principal parameters,including:
◆ changes in the discount rate;
◆ changes in the perpetual growth rate;
◆ fluctuations in operating margin.
No impairment of goodwill would need to be recognized in theevent of a reasonably possible change in the assumptions usedin 2018.
A value in use calculation for each of the CGUs would not resultin an impairment loss using:
◆ a discount rate up to 3.1 percentage points above the ratesactually used; or
◆ a perpetual growth rate up to 7.7 percentage points below therates actually used; or
◆ an operating margin up to 8.6 percentage points below therates actually used.
No impairment losses were recognized against goodwill in theyears ended December 31, 2018, 2017 or 2016.
Other intangible assets
When there is evidence that an asset may have becomeimpaired, the asset’s value in use is calculated by applying anafter-tax discount rate to the estimated future after-tax cash flowsfrom that asset. For the purposes of impairment testing, the taxcash flows relating to the asset are determined using a notionaltax rate incorporating the notional tax benefit that would resultfrom amortizing the asset if its value in use were regarded as itsdepreciable amount for tax purposes. Applying after-tax discountrates to after-tax cash flows gives the same values in use aswould be obtained by applying pre-tax discount rates to pre-taxcash flows.
The after-tax discount rates used in 2018 for impairment testingof other intangible assets in the Pharmaceuticals, ConsumerHealthcare and Vaccines CGUs were obtained by adjustingSanofi’s weighted average cost of capital to reflect specificcountry and business risks, giving after-tax discount rates in arange from 7.25% to 8.25%.
In most instances, there are no market data that would enablefair value less costs to sell to be determined other than by meansof a similar estimate based on future cash flows. Consequently,recoverable amount is in substance equal to value in use.
F-46 SANOFI / FORM 20-F 2018
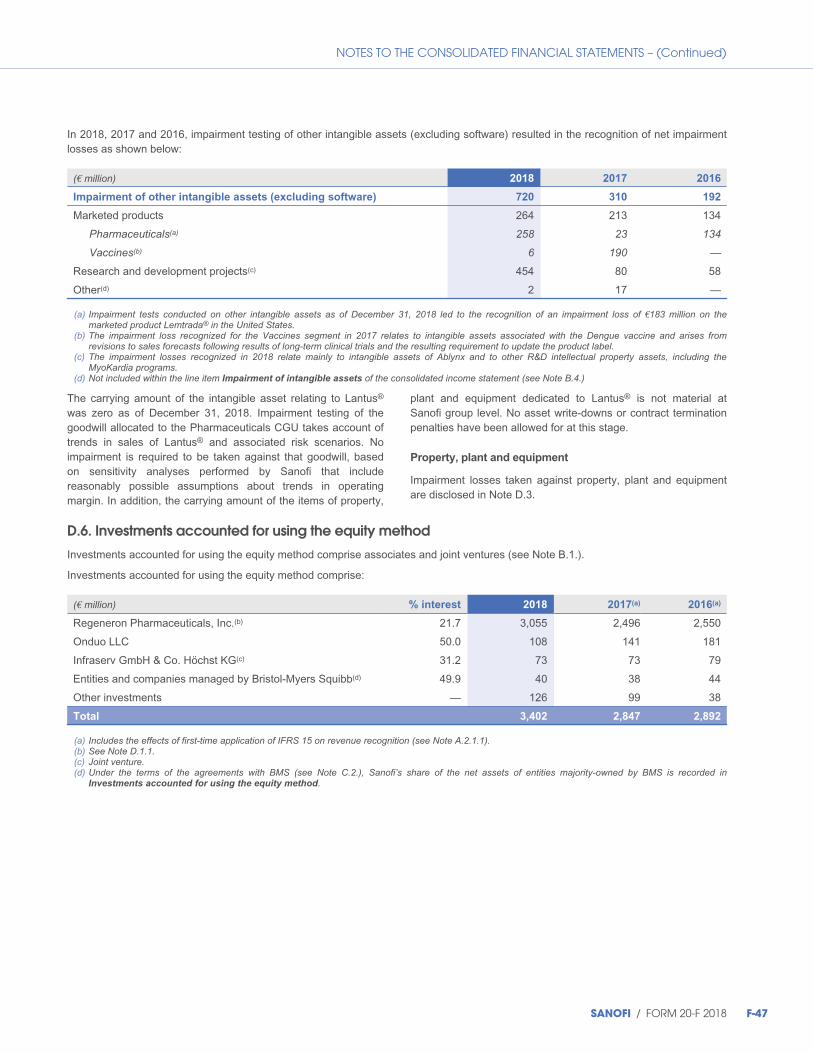
NOTES TO THE CONSOLIDATED FINANCIAL STATEMENTS – (Continued)
In 2018, 2017 and 2016, impairment testing of other intangible assets (excluding software) resulted in the recognition of net impairmentlosses as shown below:
(€ million) 2018 2017 2016
Impairment of other intangible assets (excluding software) 720 310 192
Marketed products 264 213 134
Pharmaceuticals(a) 258 23 134
Vaccines(b) 6 190 —
Research and development projects(c) 454 80 58
Other(d) 2 17 —
(a) Impairment tests conducted on other intangible assets as of December 31, 2018 led to the recognition of an impairment loss of €183 million on themarketed product Lemtrada® in the United States.
(b) The impairment loss recognized for the Vaccines segment in 2017 relates to intangible assets associated with the Dengue vaccine and arises fromrevisions to sales forecasts following results of long-term clinical trials and the resulting requirement to update the product label.
(c) The impairment losses recognized in 2018 relate mainly to intangible assets of Ablynx and to other R&D intellectual property assets, including theMyoKardia programs.
(d) Not included within the line item Impairment of intangible assets of the consolidated income statement (see Note B.4.)
The carrying amount of the intangible asset relating to Lantus®
was zero as of December 31, 2018. Impairment testing of thegoodwill allocated to the Pharmaceuticals CGU takes account oftrends in sales of Lantus® and associated risk scenarios. Noimpairment is required to be taken against that goodwill, basedon sensitivity analyses performed by Sanofi that includereasonably possible assumptions about trends in operatingmargin. In addition, the carrying amount of the items of property,
plant and equipment dedicated to Lantus® is not material atSanofi group level. No asset write-downs or contract terminationpenalties have been allowed for at this stage.
Property, plant and equipment
Impairment losses taken against property, plant and equipmentare disclosed in Note D.3.
D.6. Investments accounted for using the equity method
Investments accounted for using the equity method comprise associates and joint ventures (see Note B.1.).
Investments accounted for using the equity method comprise:
(€ million) % interest 2018 2017(a) 2016(a)
Regeneron Pharmaceuticals, Inc.(b) 21.7 3,055 2,496 2,550
Onduo LLC 50.0 108 141 181
Infraserv GmbH & Co. Höchst KG(c) 31.2 73 73 79
Entities and companies managed by Bristol-Myers Squibb(d) 49.9 40 38 44
Other investments — 126 99 38
Total 3,402 2,847 2,892
(a) Includes the effects of first-time application of IFRS 15 on revenue recognition (see Note A.2.1.1).(b) See Note D.1.1.(c) Joint venture.(d) Under the terms of the agreements with BMS (see Note C.2.), Sanofi’s share of the net assets of entities majority-owned by BMS is recorded in
Investments accounted for using the equity method.
SANOFI / FORM 20-F 2018 F-47
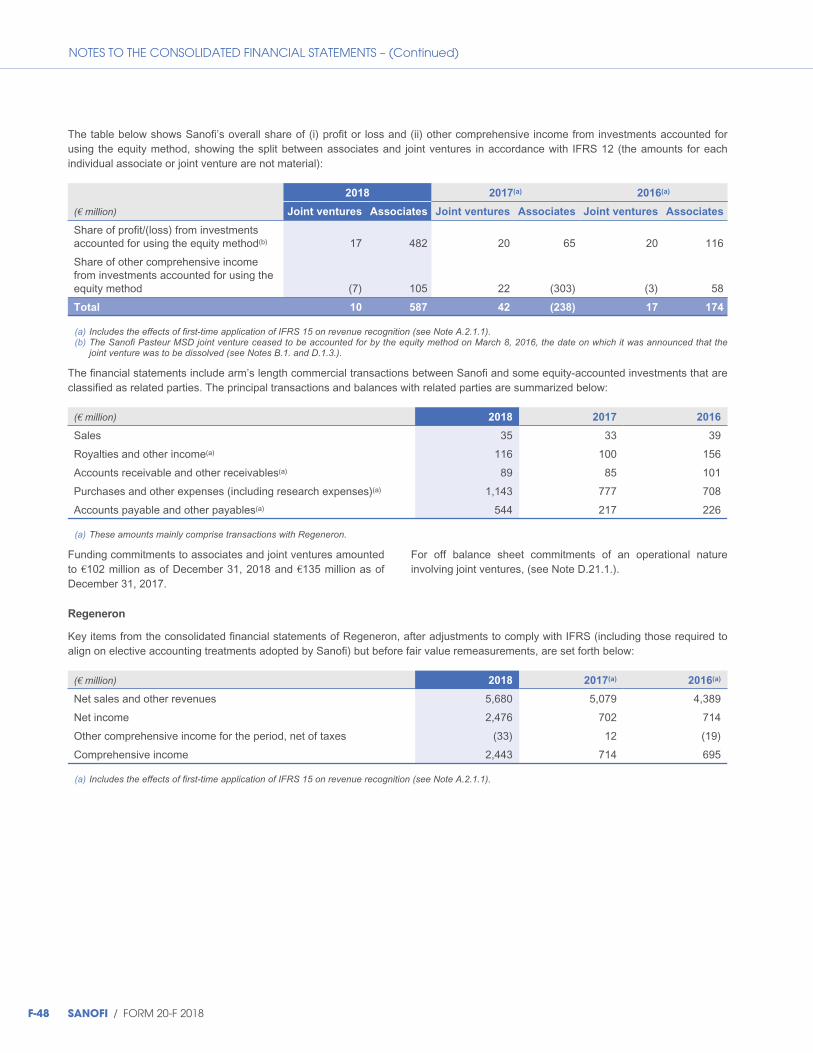
NOTES TO THE CONSOLIDATED FINANCIAL STATEMENTS – (Continued)
The table below shows Sanofi’s overall share of (i) profit or loss and (ii) other comprehensive income from investments accounted forusing the equity method, showing the split between associates and joint ventures in accordance with IFRS 12 (the amounts for eachindividual associate or joint venture are not material):
2018 2017(a) 2016(a)
(€ million) Joint ventures Associates Joint ventures Associates Joint ventures Associates
Share of profit/(loss) from investmentsaccounted for using the equity method(b) 17 482 20 65 20 116
Share of other comprehensive incomefrom investments accounted for using theequity method (7) 105 22 (303) (3) 58
Total 10 587 42 (238) 17 174
(a) Includes the effects of first-time application of IFRS 15 on revenue recognition (see Note A.2.1.1).(b) The Sanofi Pasteur MSD joint venture ceased to be accounted for by the equity method on March 8, 2016, the date on which it was announced that the
joint venture was to be dissolved (see Notes B.1. and D.1.3.).
The financial statements include arm’s length commercial transactions between Sanofi and some equity-accounted investments that areclassified as related parties. The principal transactions and balances with related parties are summarized below:
(€ million) 2018 2017 2016
Sales 35 33 39
Royalties and other income(a) 116 100 156
Accounts receivable and other receivables(a) 89 85 101
Purchases and other expenses (including research expenses)(a) 1,143 777 708
Accounts payable and other payables(a) 544 217 226
(a) These amounts mainly comprise transactions with Regeneron.
Funding commitments to associates and joint ventures amountedto €102 million as of December 31, 2018 and €135 million as ofDecember 31, 2017.
For off balance sheet commitments of an operational natureinvolving joint ventures, (see Note D.21.1.).
Regeneron
Key items from the consolidated financial statements of Regeneron, after adjustments to comply with IFRS (including those required toalign on elective accounting treatments adopted by Sanofi) but before fair value remeasurements, are set forth below:
(€ million) 2018 2017(a) 2016(a)
Net sales and other revenues 5,680 5,079 4,389
Net income 2,476 702 714
Other comprehensive income for the period, net of taxes (33) 12 (19)
Comprehensive income 2,443 714 695
(a) Includes the effects of first-time application of IFRS 15 on revenue recognition (see Note A.2.1.1).
F-48 SANOFI / FORM 20-F 2018
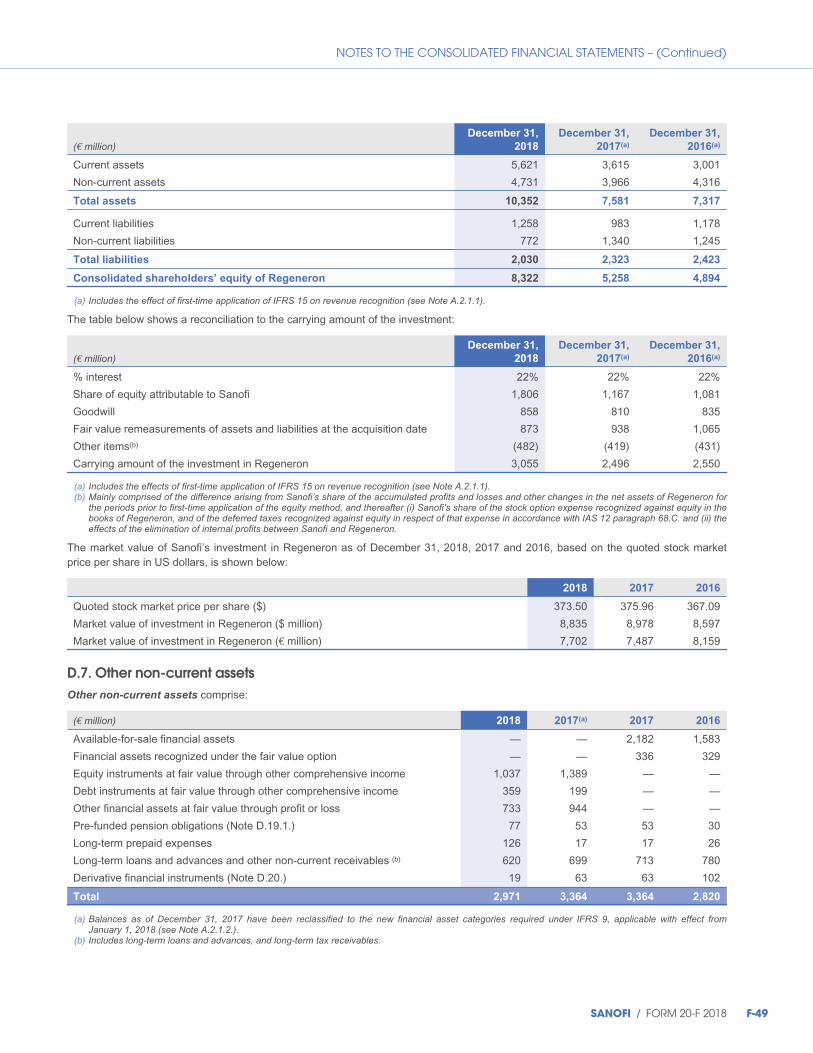
NOTES TO THE CONSOLIDATED FINANCIAL STATEMENTS – (Continued)
(€ million)December 31,
2018
December 31,
2017(a)
December 31,
2016(a)
Current assets 5,621 3,615 3,001
Non-current assets 4,731 3,966 4,316
Total assets 10,352 7,581 7,317
Current liabilities 1,258 983 1,178
Non-current liabilities 772 1,340 1,245
Total liabilities 2,030 2,323 2,423
Consolidated shareholders’ equity of Regeneron 8,322 5,258 4,894
(a) Includes the effect of first-time application of IFRS 15 on revenue recognition (see Note A.2.1.1).
The table below shows a reconciliation to the carrying amount of the investment:
(€ million)December 31,
2018
December 31,
2017(a)
December 31,
2016(a)
% interest 22% 22% 22%
Share of equity attributable to Sanofi 1,806 1,167 1,081
Goodwill 858 810 835
Fair value remeasurements of assets and liabilities at the acquisition date 873 938 1,065
Other items(b) (482) (419) (431)
Carrying amount of the investment in Regeneron 3,055 2,496 2,550
(a) Includes the effects of first-time application of IFRS 15 on revenue recognition (see Note A.2.1.1).(b) Mainly comprised of the difference arising from Sanofi’s share of the accumulated profits and losses and other changes in the net assets of Regeneron for
the periods prior to first-time application of the equity method, and thereafter (i) Sanofi’s share of the stock option expense recognized against equity in thebooks of Regeneron, and of the deferred taxes recognized against equity in respect of that expense in accordance with IAS 12 paragraph 68.C. and (ii) theeffects of the elimination of internal profits between Sanofi and Regeneron.
The market value of Sanofi’s investment in Regeneron as of December 31, 2018, 2017 and 2016, based on the quoted stock marketprice per share in US dollars, is shown below:
2018 2017 2016
Quoted stock market price per share ($) 373.50 375.96 367.09
Market value of investment in Regeneron ($ million) 8,835 8,978 8,597
Market value of investment in Regeneron (€ million) 7,702 7,487 8,159
D.7. Other non-current assetsOther non-current assets comprise:
(€ million) 2018 2017(a) 2017 2016
Available-for-sale financial assets — — 2,182 1,583
Financial assets recognized under the fair value option — — 336 329
Equity instruments at fair value through other comprehensive income 1,037 1,389 — —
Debt instruments at fair value through other comprehensive income 359 199 — —
Other financial assets at fair value through profit or loss 733 944 — —
Pre-funded pension obligations (Note D.19.1.) 77 53 53 30
Long-term prepaid expenses 126 17 17 26
Long-term loans and advances and other non-current receivables (b) 620 699 713 780
Derivative financial instruments (Note D.20.) 19 63 63 102
Total 2,971 3,364 3,364 2,820
(a) Balances as of December 31, 2017 have been reclassified to the new financial asset categories required under IFRS 9, applicable with effect fromJanuary 1, 2018 (see Note A.2.1.2.).
(b) Includes long-term loans and advances, and long-term tax receivables.
SANOFI / FORM 20-F 2018 F-49
NOTES TO THE CONSOLIDATED FINANCIAL STATEMENTS – (Continued)
D.7.1 Equity instruments at fair value through othercomprehensive income
Quoted equity investments
The line item “Equity instruments at fair value through othercomprehensive income” includes in particular the followingquoted equity investments:
◆ An equity interest in Alnylam Pharmaceuticals, Inc. (Alnylam),acquired at the start of 2014. Based on quoted market prices,the carrying amount of the equity interest was €671 million asof December 31, 2018, versus €1,118 million as ofDecember 31, 2017 and €364 million as of December 31,2016. On October 5, 2016, Alnylam announced that it wasterminating its revusiran development program, as a result ofwhich its share price fell by 48% on October 6, 2016.Consequently, Sanofi recognized as of December 31, 2016 animpairment loss of €457 million, reflecting the differencebetween the historical acquisition cost of its shares in Alnylamand the market value of those shares at that date.
◆ An equity injection into MyoKardia, Inc., initiated under acollaboration agreement signed with that company inSeptember 2014, valued at €178 million as of December 31,2018 and representing an equity interest of approximately 9%as of that date (versus €141 million as of December 31, 2017and €45 million as of December 31, 2016).
A 10% decline in stock prices of the quoted equity investmentsincluded within “Equity instruments at fair value through othercomprehensive income” would have had a negative pre-taximpact of €86 million on Other comprehensive income.
Unquoted equity investments
The line item “Equity instruments at fair value through othercomprehensive income” also includes equity investments notquoted in an active market. The carrying amount of thoseinvestments was €178 million as of December 31, 2018 and€62 million as of December 31, 2017.
D.7.2 Debt instruments at fair value through othercomprehensive income
The line item “Debt instruments at fair value through othercomprehensive income” includes quoted euro-denominatedsenior bonds amounting to €359 million as of December 31,2018, including €136 million of securities obtained in exchangefor financial assets held to meet obligations to employees underpost-employment benefit plans.
Sanofi held €199 million of listed senior bonds as ofDecember 31, 2017 and €112 million as of December 31, 2016.
As regards debt instruments held to meet obligations toemployees under post-employment benefit plans, a reduction of10 basis points in market interest rates as of December 31, 2018would have had a negative pre-tax impact of €3 million on Other
comprehensive income.
As regards other quoted debt instruments, a reduction of10 basis points in market interest rates as of December 31, 2018would have had a negative pre-tax impact of €1 million on Other
comprehensive income.
Other comprehensive income recognized in respect of “Equityinstruments at fair value through other comprehensive income”and “Debt instruments at fair value through other comprehensiveincome” represented unrealized after-tax losses of €106 millionas of December 31, 2018 and unrealized after-tax gains of€335 million as of December 31, 2017.
An analysis of the change in gains and losses recognized inOther comprehensive income, and of items reclassified to profitor loss, is presented in Note D.15.7.
D.7.3. Other financial assets at fair value throughprofit or loss
The line item “Other financial assets at fair value through profit orloss” includes:
◆ Contingent consideration receivable by Sanofi following thedissolution of the Sanofi Pasteur MSD joint venture, based ona percentage of MSD’s future sales during the 2017-2024period of specified products previously distributed by SPMSD(see Notes B.1., D.1.3. and D.12.).
The fair value of the MSD contingent consideration wasdetermined by applying the royalty percentage stipulated inthe contract to discounted sales projections. A reduction ofone percentage point in the discount rate would increase thefair value of the MSD contingent consideration byapproximately 3%.
Changes in the fair value of this contingent consideration arerecognized in the income statement within the line item Fair
value remeasurement of contingent consideration (seeNote B.18.).
As of December 31, 2018, the contingent consideration assetamounted to €373 million (including a non-current portion of€309 million), versus €342 million (non-current portion: €292million) as of December 31, 2017 and €458 million as ofDecember 31, 2016. The movement during 2018 was dueprimarily to an adjustment of €72 million to the fair value of theasset to reflect revisions of sales forecasts.
◆ Financial assets held to meet obligations to employees underpost-employment benefit plans, amounting to €198 million as ofDecember 31, 2017 (versus €360 million as of December 31,2016). Those obligations, and the financial assets held to meetthem, were partially outsourced during 2017. They wereexchanged for debt instruments during 2018 (see Note D.7.1.).
◆ A portfolio of financial investments (amounting to €363 million)held to fund a deferred compensation plan provided to certainemployees (versus €359 million as of December 31, 2017 and€353 million as of December 31, 2016).
F-50 SANOFI / FORM 20-F 2018

NOTES TO THE CONSOLIDATED FINANCIAL STATEMENTS – (Continued)
The equity investments in Voyager Therapeutics, Inc. and ImpactTherapeutics, Inc. that were recognized as available-for-salefinancial assets as of December 31, 2016 and December 31,2017 were reclassified in accordance with IFRS 9 as otherfinancial assets at fair value through profit or loss as of
January 1, 2018. Those investments were divested in the firsthalf of 2018 for an amount of €34 million, and derecognized. Afinancial gain of €6 million was recognized (see Note D.29,“Financial expenses and income”).
D.8. Assets held for sale or exchange and liabilities related to assets held for sale or exchange
Assets held for sale or exchange, and liabilities related to assets held for sale or exchange, comprise:
(€ million) December 31, 2018 December 31, 2017 December 31, 2016
Animal Health business D.36. — — 6,376
Other 68 34 45
Assets held for sale or exchange 68 34 6,421
Animal Health business D.36. — — 1,165
Other — — 30
Liabilities related to assets held for sale or exchange — — 1,195
D.9. Inventories
Inventories comprise the following:
2018 2017(a) 2016(a)
(€ million)Gross
value Allowances
Carrying
amount
Gross
value Allowances
Carrying
amount
Gross
value Allowances
Carrying
amount
Raw materials 1,099 (83) 1,016 1,041 (79) 962 1,053 (104) 949
Work in process 4,637 (549) 4,088 4,348 (656) 3,692 4,512 (710) 3,802
Finished goods 2,533 (160) 2,373 2,342 (178) 2,164 2,345 (200) 2,145
Total 8,269 (792) 7,477 7,731 (913) 6,818 7,910 (1,014) 6,896
(a) Includes the effects of first-time application of IFRS 15 on revenue recognition (see Note A.2.1.1.).
Allowances include write-downs of products on hand pendingmarketing approval.
Inventories pledged as security for liabilities amounted to€18 million as of December 31, 2018 (compared with €18 millionas of December 31, 2017 and €24 million as of December 31,2016).
D.10. Accounts receivable
Accounts receivable break down as follows:
(€ million) December 31, 2018 December 31, 2017 December 31, 2016
Gross value 7,430 7,405 7,506
Allowances (170)(a) (189) (195)
Carrying amount 7,260 7,216 7,311
(a) With effect from January 1, 2018, impairment allowances cover expected losses as required by IFRS 9, rather than (as previously) incurred losses. Theimpact of this new impairment methodology as of January 1, 2018 is to increase the total impairment allowance by €17 million.
The impact of allowances against accounts receivable in 2018was a net expense of €15 million (versus €27 million in 2017 and€32 million in 2016).
The gross value of overdue receivables was €547 million as ofDecember 31, 2018, versus €644 million as of December 31,2017 and €597 million as of December 31, 2016.
SANOFI / FORM 20-F 2018 F-51
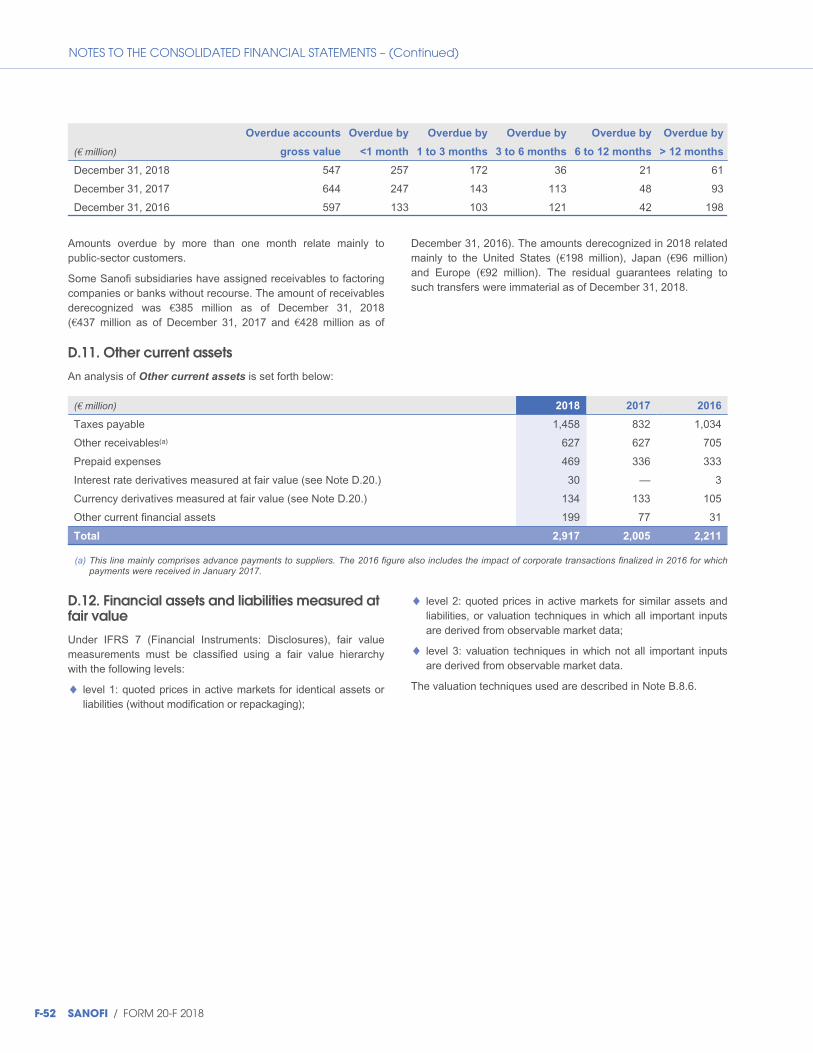
NOTES TO THE CONSOLIDATED FINANCIAL STATEMENTS – (Continued)
(€ million)
Overdue accounts
gross value
Overdue by
<1 month
Overdue by
1 to 3 months
Overdue by
3 to 6 months
Overdue by
6 to 12 months
Overdue by
> 12 months
December 31, 2018 547 257 172 36 21 61
December 31, 2017 644 247 143 113 48 93
December 31, 2016 597 133 103 121 42 198
Amounts overdue by more than one month relate mainly topublic-sector customers.
Some Sanofi subsidiaries have assigned receivables to factoringcompanies or banks without recourse. The amount of receivablesderecognized was €385 million as of December 31, 2018(€437 million as of December 31, 2017 and €428 million as of
December 31, 2016). The amounts derecognized in 2018 relatedmainly to the United States (€198 million), Japan (€96 million)and Europe (€92 million). The residual guarantees relating tosuch transfers were immaterial as of December 31, 2018.
D.11. Other current assets
An analysis of Other current assets is set forth below:
(€ million) 2018 2017 2016
Taxes payable 1,458 832 1,034
Other receivables(a) 627 627 705
Prepaid expenses 469 336 333
Interest rate derivatives measured at fair value (see Note D.20.) 30 — 3
Currency derivatives measured at fair value (see Note D.20.) 134 133 105
Other current financial assets 199 77 31
Total 2,917 2,005 2,211
(a) This line mainly comprises advance payments to suppliers. The 2016 figure also includes the impact of corporate transactions finalized in 2016 for whichpayments were received in January 2017.
D.12. Financial assets and liabilities measured atfair value
Under IFRS 7 (Financial Instruments: Disclosures), fair valuemeasurements must be classified using a fair value hierarchywith the following levels:
◆ level 1: quoted prices in active markets for identical assets orliabilities (without modification or repackaging);
◆ level 2: quoted prices in active markets for similar assets andliabilities, or valuation techniques in which all important inputsare derived from observable market data;
◆ level 3: valuation techniques in which not all important inputsare derived from observable market data.
The valuation techniques used are described in Note B.8.6.
F-52 SANOFI / FORM 20-F 2018
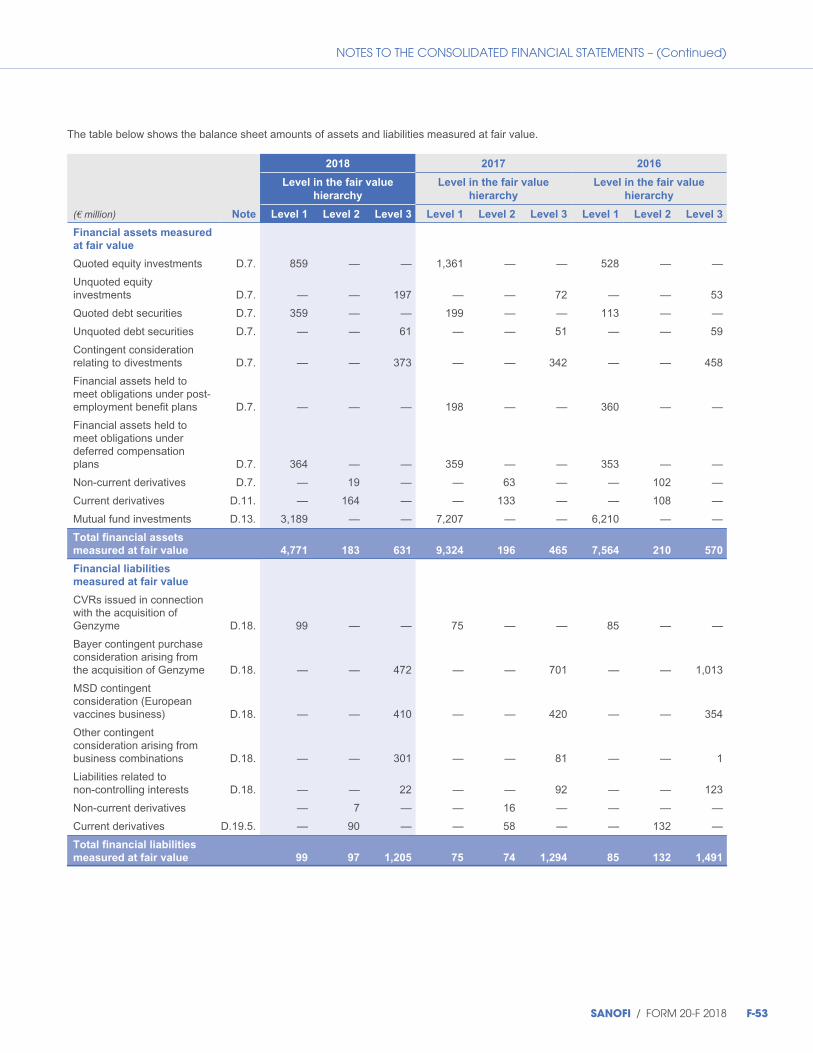
NOTES TO THE CONSOLIDATED FINANCIAL STATEMENTS – (Continued)
The table below shows the balance sheet amounts of assets and liabilities measured at fair value.
2018 2017 2016
Level in the fair value
hierarchy
Level in the fair value
hierarchy
Level in the fair value
hierarchy
(€ million) Note Level 1 Level 2 Level 3 Level 1 Level 2 Level 3 Level 1 Level 2 Level 3
Financial assets measured
at fair value
Quoted equity investments D.7. 859 — — 1,361 — — 528 — —
Unquoted equityinvestments D.7. — — 197 — — 72 — — 53
Quoted debt securities D.7. 359 — — 199 — — 113 — —
Unquoted debt securities D.7. — — 61 — — 51 — — 59
Contingent considerationrelating to divestments D.7. — — 373 — — 342 — — 458
Financial assets held tomeet obligations under post-employment benefit plans D.7. — — — 198 — — 360 — —
Financial assets held tomeet obligations underdeferred compensationplans D.7. 364 — — 359 — — 353 — —
Non-current derivatives D.7. — 19 — — 63 — — 102 —
Current derivatives D.11. — 164 — — 133 — — 108 —
Mutual fund investments D.13. 3,189 — — 7,207 — — 6,210 — —
Total financial assets
measured at fair value 4,771 183 631 9,324 196 465 7,564 210 570
Financial liabilities
measured at fair value
CVRs issued in connectionwith the acquisition ofGenzyme D.18. 99 — — 75 — — 85 — —
Bayer contingent purchaseconsideration arising fromthe acquisition of Genzyme D.18. — — 472 — — 701 — — 1,013
MSD contingentconsideration (Europeanvaccines business) D.18. — — 410 — — 420 — — 354
Other contingentconsideration arising frombusiness combinations D.18. — — 301 — — 81 — — 1
Liabilities related tonon-controlling interests D.18. — — 22 — — 92 — — 123
Non-current derivatives — 7 — — 16 — — — —
Current derivatives D.19.5. — 90 — — 58 — — 132 —
Total financial liabilities
measured at fair value 99 97 1,205 75 74 1,294 85 132 1,491
SANOFI / FORM 20-F 2018 F-53
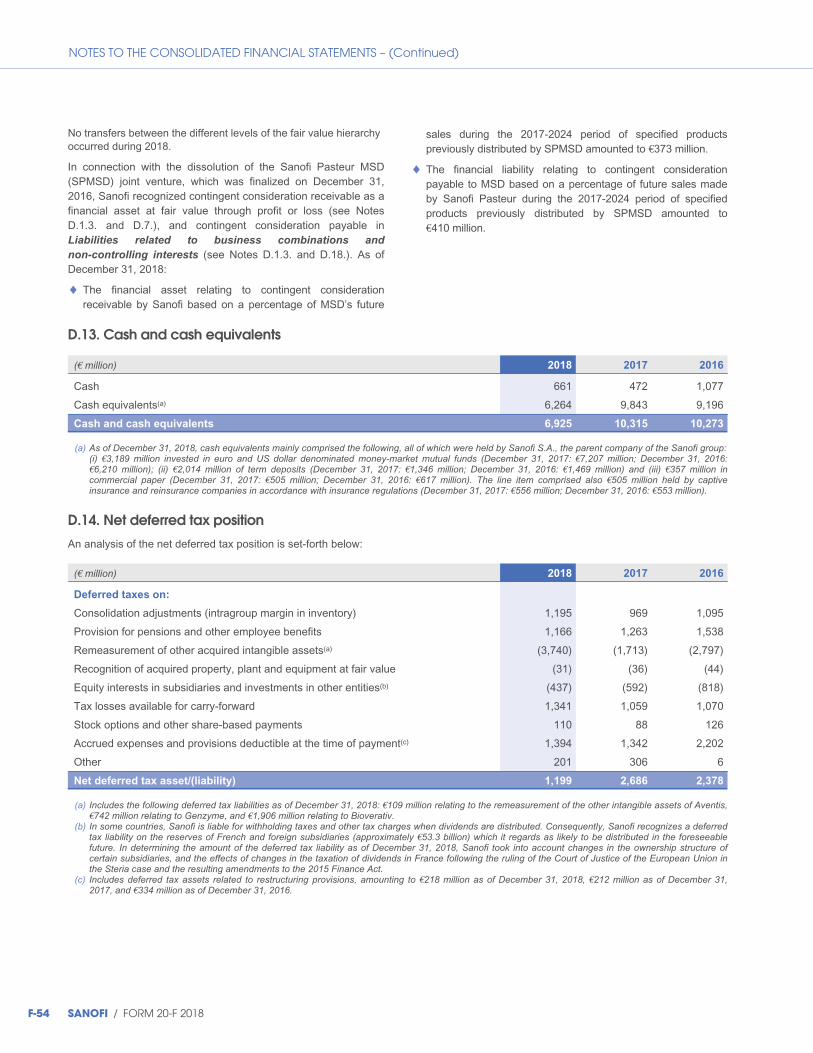
NOTES TO THE CONSOLIDATED FINANCIAL STATEMENTS – (Continued)
No transfers between the different levels of the fair value hierarchyoccurred during 2018.
In connection with the dissolution of the Sanofi Pasteur MSD(SPMSD) joint venture, which was finalized on December 31,2016, Sanofi recognized contingent consideration receivable as afinancial asset at fair value through profit or loss (see NotesD.1.3. and D.7.), and contingent consideration payable inLiabilities related to business combinations and
non-controlling interests (see Notes D.1.3. and D.18.). As ofDecember 31, 2018:
◆ The financial asset relating to contingent considerationreceivable by Sanofi based on a percentage of MSD’s future
sales during the 2017-2024 period of specified productspreviously distributed by SPMSD amounted to €373 million.
◆ The financial liability relating to contingent considerationpayable to MSD based on a percentage of future sales madeby Sanofi Pasteur during the 2017-2024 period of specifiedproducts previously distributed by SPMSD amounted to€410 million.
D.13. Cash and cash equivalents
(€ million) 2018 2017 2016
Cash 661 472 1,077
Cash equivalents(a) 6,264 9,843 9,196
Cash and cash equivalents 6,925 10,315 10,273
(a) As of December 31, 2018, cash equivalents mainly comprised the following, all of which were held by Sanofi S.A., the parent company of the Sanofi group:(i) €3,189 million invested in euro and US dollar denominated money-market mutual funds (December 31, 2017: €7,207 million; December 31, 2016:€6,210 million); (ii) €2,014 million of term deposits (December 31, 2017: €1,346 million; December 31, 2016: €1,469 million) and (iii) €357 million incommercial paper (December 31, 2017: €505 million; December 31, 2016: €617 million). The line item comprised also €505 million held by captiveinsurance and reinsurance companies in accordance with insurance regulations (December 31, 2017: €556 million; December 31, 2016: €553 million).
D.14. Net deferred tax position
An analysis of the net deferred tax position is set-forth below:
(€ million) 2018 2017 2016
Deferred taxes on:
Consolidation adjustments (intragroup margin in inventory) 1,195 969 1,095
Provision for pensions and other employee benefits 1,166 1,263 1,538
Remeasurement of other acquired intangible assets(a) (3,740) (1,713) (2,797)
Recognition of acquired property, plant and equipment at fair value (31) (36) (44)
Equity interests in subsidiaries and investments in other entities(b) (437) (592) (818)
Tax losses available for carry-forward 1,341 1,059 1,070
Stock options and other share-based payments 110 88 126
Accrued expenses and provisions deductible at the time of payment(c) 1,394 1,342 2,202
Other 201 306 6
Net deferred tax asset/(liability) 1,199 2,686 2,378
(a) Includes the following deferred tax liabilities as of December 31, 2018: €109 million relating to the remeasurement of the other intangible assets of Aventis,€742 million relating to Genzyme, and €1,906 million relating to Bioverativ.
(b) In some countries, Sanofi is liable for withholding taxes and other tax charges when dividends are distributed. Consequently, Sanofi recognizes a deferredtax liability on the reserves of French and foreign subsidiaries (approximately €53.3 billion) which it regards as likely to be distributed in the foreseeablefuture. In determining the amount of the deferred tax liability as of December 31, 2018, Sanofi took into account changes in the ownership structure ofcertain subsidiaries, and the effects of changes in the taxation of dividends in France following the ruling of the Court of Justice of the European Union inthe Steria case and the resulting amendments to the 2015 Finance Act.
(c) Includes deferred tax assets related to restructuring provisions, amounting to €218 million as of December 31, 2018, €212 million as of December 31,2017, and €334 million as of December 31, 2016.
F-54 SANOFI / FORM 20-F 2018

NOTES TO THE CONSOLIDATED FINANCIAL STATEMENTS – (Continued)
The reserves of Sanofi subsidiaries that would be taxable ifdistributed but for which no distribution is planned, and for whichno deferred tax liability has therefore been recognized, totaled€10.2 billion as of December 31, 2018, compared with€16.8 billion as of December 31, 2017 and €25.2 billion as ofDecember 31, 2016.
Most of Sanofi’s tax loss carry-forwards are available indefinitely.For a description of policies on the recognition of deferred taxassets, refer to Note B.22. The recognition of deferred tax assetsis determined on the basis of profit forecasts for each taxconsolidation, and of the tax consequences of the strategicopportunities available to Sanofi. Those forecasts are consistentwith Sanofi’s medium-term strategic plan, and are based on timehorizons that take account of the period of availability of tax losscarry-forwards and the specific circumstances of each tax group.Deferred tax assets relating to tax loss carry-forwards as ofDecember 31, 2018 amounted to €1,651 million, of which€310 million were not recognized. This compares with€1,346 million as of December 31, 2017 (of which €287 millionwere not recognized) and €1,502 million as of December 31,2016 (of which €431 million were not recognized).
The table below shows when tax losses available for carry-forward are due to expire:
(€ million)Tax losses available
for carry-forward(a)
2019 7
2020 6
2021 75
2022 64
2023 37
2024 and later 5,911
Total as of December 31, 2018 6,100
Total as of December 31, 2017 5,164
Total as of December 31, 2016 5,176
(a) Excluding tax loss carry-forwards on asset disposals. Such carry-forwards amounted to €1 million as of December 31, 2018, €7 millionas of December 31, 2017 and €13 million as of December 31, 2016.
Use of tax loss carry-forwards is limited to the entity in which theyarose. In jurisdictions where tax consolidations are in place, taxlosses can be netted against taxable income generated byentities in the same tax consolidation.
Deferred tax assets not recognized because their future recoverywas not regarded as probable given the expected results of theentities in question amounted to €298 million in 2018,€302 million in 2017 and €561 million in 2016.
D.15. Consolidated shareholders’ equity
D.15.1. Share capital
As of December 31, 2018, the share capital was €2,494,790,944, consisting of 1,247,395,472 shares with a par value of €2. Treasuryshares held by Sanofi are as follows:
Number of shares
(million)
% of share capital
for the period
December 31, 2018 1.9 0.15%
December 31, 2017 0.2 0.01%
December 31, 2016 20.0 1.55%
January 1, 2016 4.0 0.30%
Treasury shares are deducted from shareholders’ equity. Gains and losses on disposals of treasury shares are recorded directly inequity and are not recognized in net income for the period.
SANOFI / FORM 20-F 2018 F-55
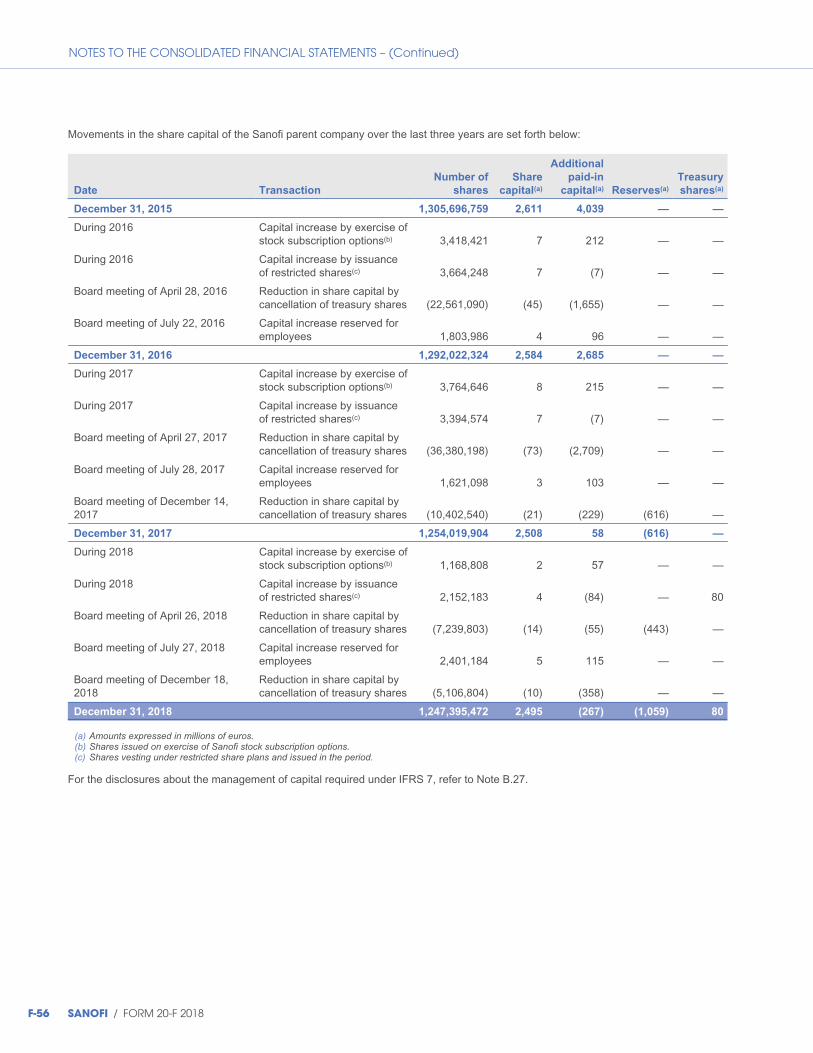
NOTES TO THE CONSOLIDATED FINANCIAL STATEMENTS – (Continued)
Movements in the share capital of the Sanofi parent company over the last three years are set forth below:
Date Transaction
Number of
shares
Share
capital(a)
Additional
paid-in
capital(a) Reserves(a)
Treasury
shares(a)
December 31, 2015 1,305,696,759 2,611 4,039 — —
During 2016 Capital increase by exercise ofstock subscription options(b) 3,418,421 7 212 — —
During 2016 Capital increase by issuanceof restricted shares(c) 3,664,248 7 (7) — —
Board meeting of April 28, 2016 Reduction in share capital bycancellation of treasury shares (22,561,090) (45) (1,655) — —
Board meeting of July 22, 2016 Capital increase reserved foremployees 1,803,986 4 96 — —
December 31, 2016 1,292,022,324 2,584 2,685 — —
During 2017 Capital increase by exercise ofstock subscription options(b) 3,764,646 8 215 — —
During 2017 Capital increase by issuanceof restricted shares(c) 3,394,574 7 (7) — —
Board meeting of April 27, 2017 Reduction in share capital bycancellation of treasury shares (36,380,198) (73) (2,709) — —
Board meeting of July 28, 2017 Capital increase reserved foremployees 1,621,098 3 103 — —
Board meeting of December 14,2017
Reduction in share capital bycancellation of treasury shares (10,402,540) (21) (229) (616) —
December 31, 2017 1,254,019,904 2,508 58 (616) —
During 2018 Capital increase by exercise ofstock subscription options(b) 1,168,808 2 57 — —
During 2018 Capital increase by issuanceof restricted shares(c) 2,152,183 4 (84) — 80
Board meeting of April 26, 2018 Reduction in share capital bycancellation of treasury shares (7,239,803) (14) (55) (443) —
Board meeting of July 27, 2018 Capital increase reserved foremployees 2,401,184 5 115 — —
Board meeting of December 18,2018
Reduction in share capital bycancellation of treasury shares (5,106,804) (10) (358) — —
December 31, 2018 1,247,395,472 2,495 (267) (1,059) 80
(a) Amounts expressed in millions of euros.(b) Shares issued on exercise of Sanofi stock subscription options.(c) Shares vesting under restricted share plans and issued in the period.
For the disclosures about the management of capital required under IFRS 7, refer to Note B.27.
F-56 SANOFI / FORM 20-F 2018

NOTES TO THE CONSOLIDATED FINANCIAL STATEMENTS – (Continued)
D.15.2. Restricted share plans
Restricted share plans are accounted for in accordance with the policies described in Note B.24.3. The principal characteristics of thoseplans are as follows:
2018 2017 2016
Type of plan
Performance
share plan
Performance
share plan
Performance
share plan
Performance
share plan
Date of Board meeting approving the plan July 30, 2018 May 2, 2018 May 10, 2017 May 4, 2016
Service period 3 years 3 years 3 years 3 years
Total number of shares awarded 141,669 4,390,216 3,587,465 4,097,925
Fair value per share awarded (€)(a) 64.35 56.59 81.50 61.06
Fair value of plan at the date of grant (€ million) 9 248 292 250
(a) Quoted market price per share at the date of grant, adjusted for dividends expected during the vesting period.
The total expense recognized for all restricted share plans, and the number of restricted shares not yet fully vested, are shown in thetable below:
2018 2017 2016
Total expense for restricted share plans (€ million)(a) 248 238 219
Number of shares not yet fully vested 13,576,464 12,867,519 13,543,254
Under 2018 plans 4,406,593 — —
Under 2017 plans 3,314,391 3,468,576 —
Under 2016 plans 3,690,226 3,798,073 4,051,325
Under 2015 plans 2,165,254 3,438,420 3,667,620
Under 2014 plans — 2,162,450 3,595,420
Under 2013 plans — — 2,228,889
(a) The 2016 figure excludes the Animal Health business.
On March 5, 2014, the Board of Directors approved aperformance share unit (PSU) plan, vesting at the end of a three-year service period and subject to performance conditions. Thatplan expired on March 5, 2017, resulting in a cash payment of
€27 million based on attainment of the performance criteria. Thecorresponding expense was recognized on a straight line basisover the vesting period, in accordance with the policies describedin Note B.24.3.
D.15.3. Capital increases
The characteristics of the employee share ownership plans awarded in the form of a capital increase reserved for employees in 2018,2017 and 2016 are summarized in the table below:
2018 2017 2016
Date of Board meeting approving the plan March 6, 2018 March 2, 2017 March 3, 2016
Subscription price (€)(a) 52.66 70.01 57.25
Subscription period June 11-29, 2018 June 19-30, 2017 June 13-24, 2016
Number of shares subscribed 2,298,783 1,528,982 1,756,972
Number of shares issued immediately as employer’s contribution 102,401 92,116 47,014
(a) Subscription price representing 80% of the average of the opening quoted market prices of Sanofi shares during the 20 trading days preceding June 9,2018, June 14, 2017 and June 8, 2016, respectively.
SANOFI / FORM 20-F 2018 F-57
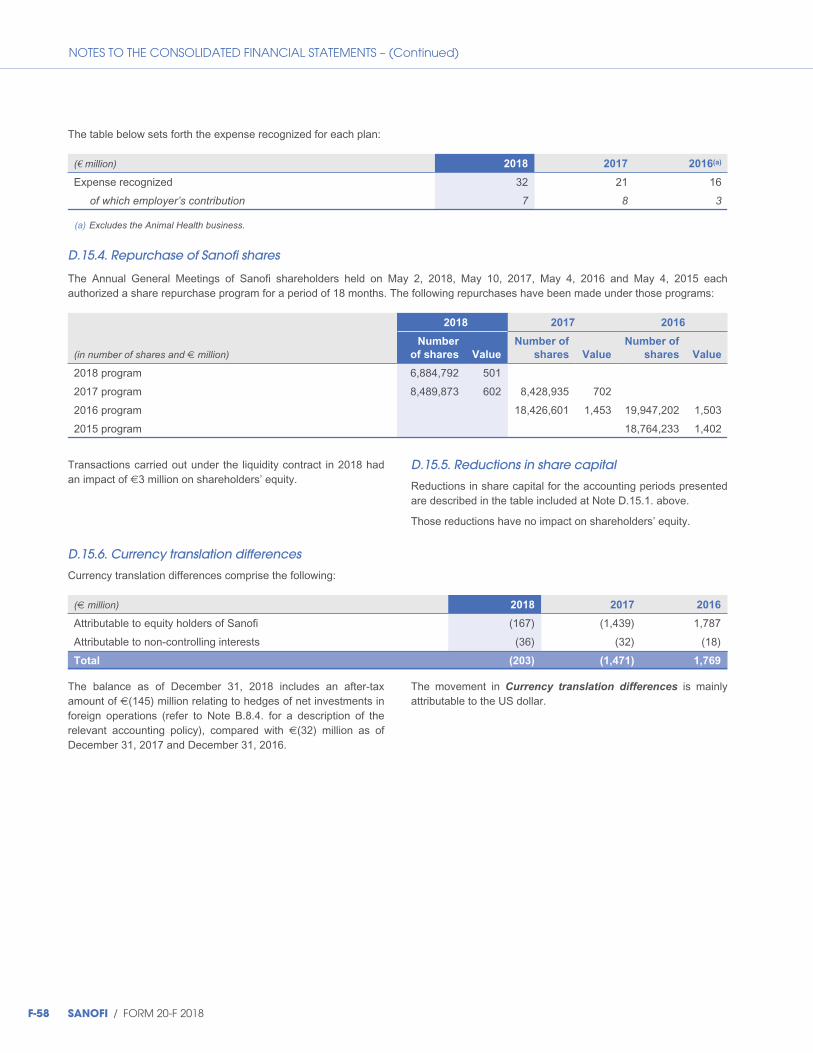
NOTES TO THE CONSOLIDATED FINANCIAL STATEMENTS – (Continued)
The table below sets forth the expense recognized for each plan:
(€ million) 2018 2017 2016(a)
Expense recognized 32 21 16
of which employer’s contribution 7 8 3
(a) Excludes the Animal Health business.
D.15.4. Repurchase of Sanofi shares
The Annual General Meetings of Sanofi shareholders held on May 2, 2018, May 10, 2017, May 4, 2016 and May 4, 2015 eachauthorized a share repurchase program for a period of 18 months. The following repurchases have been made under those programs:
2018 2017 2016
(in number of shares and € million)Number
of shares Value
Number of
shares Value
Number of
shares Value
2018 program 6,884,792 501
2017 program 8,489,873 602 8,428,935 702
2016 program 18,426,601 1,453 19,947,202 1,503
2015 program 18,764,233 1,402
Transactions carried out under the liquidity contract in 2018 hadan impact of €3 million on shareholders’ equity.
D.15.5. Reductions in share capital
Reductions in share capital for the accounting periods presentedare described in the table included at Note D.15.1. above.
Those reductions have no impact on shareholders’ equity.
D.15.6. Currency translation differences
Currency translation differences comprise the following:
(€ million) 2018 2017 2016
Attributable to equity holders of Sanofi (167) (1,439) 1,787
Attributable to non-controlling interests (36) (32) (18)
Total (203) (1,471) 1,769
The balance as of December 31, 2018 includes an after-taxamount of €(145) million relating to hedges of net investments inforeign operations (refer to Note B.8.4. for a description of therelevant accounting policy), compared with €(32) million as ofDecember 31, 2017 and December 31, 2016.
The movement in Currency translation differences is mainlyattributable to the US dollar.
F-58 SANOFI / FORM 20-F 2018

NOTES TO THE CONSOLIDATED FINANCIAL STATEMENTS – (Continued)
D.15.7. Other comprehensive income
Movements within other comprehensive income are shown below:
(€ million) 2018 2017(a) 2016(a)
Actuarial gains/(losses):
Actuarial gains/(losses) excluding investments accounted for using the equity method(see Note D.19.1.) 201 (30) (104)
Actuarial gains/(losses) of investments accounted for using the equity method, net oftaxes — 2 (2)
Tax effects (69) (90) (22)
Equity instruments included in financial assets(b):
Change in fair value (excluding investments accounted for using the equity method) (529) — —
Change in fair value (investments accounted for using the equity method, net of taxes) (8) — —
Tax effects 100 — —
Items not subsequently reclassifiable to profit or loss (305) (118) (128)
Available-for-sale financial assets(c)
Change in fair value (excluding investments accounted for using the equity method) — 837 (104)
Change in fair value (investments accounted for using the equity method, net of taxes) — 1 (1)
Tax effects — (145) 50
Debt instruments included in financial assets(b):
Change in fair value (excluding investments accounted for using the equity method)(d) (4) — —
Change in fair value (investments accounted for using the equity method, net of taxes) — — —
Tax effects — — —
Cash flow hedges:
Change in fair value (excluding investments accounted for using the equity method)(e) 3 (24) 30
Change in fair value (investments accounted for using the equity method, net of taxes) — — 1
Tax effects (1) 8 (10)
Change in currency translation differences:
Currency translation differences on foreign subsidiaries (excluding investmentsaccounted for using the equity method)(e)/(f) 1,273 (2,956) 1,033
Currency translation differences (investments accounted for using the equity method) 106 (283) 57
Hedges of net investments in foreign operations (185) — —
Tax effects 72 — —
Items subsequently reclassifiable to profit or loss 1,264 (2,562) 1,056
◆
◆
◆
◆
◆
◆
◆
◆
◆
◆
◆
◆
◆
◆
◆
◆
◆
◆
◆
(a) Includes the effects of first-time application of IFRS 15 on revenue recognition (see Note A.2.1.1.).(b) The “Equity instruments included in financial assets” and “Debt instruments included in financial assets” categories are used effective January 1, 2018 in
application of IFRS 9 (see Note A.2.1.2.)(c) Includes reclassifications to profit or loss: €(89) million in 2017 and €447 million in 2016. With effect from January 1, 2018, the financial asset category
Available-for-sale financial assets is no longer applicable, in accordance with IFRS 9 (see Note A.2.1.2.).(d) Immaterial amounts reclassified to profit or loss in 2018.(e) Includes reclassifications to profit or loss: €(7) million in 2018, €(23) million in 2017 and €2 million in 2016.(f) Items subsequently reclassifiable to profit or loss and attributable to the Animal Health business divested on January 1, 2017: €(170) million in 2017 on
divestment (comprising €(147) million of currency translation differences and €(23) million of cash flow hedges); €(51) million in 2016.
SANOFI / FORM 20-F 2018 F-59
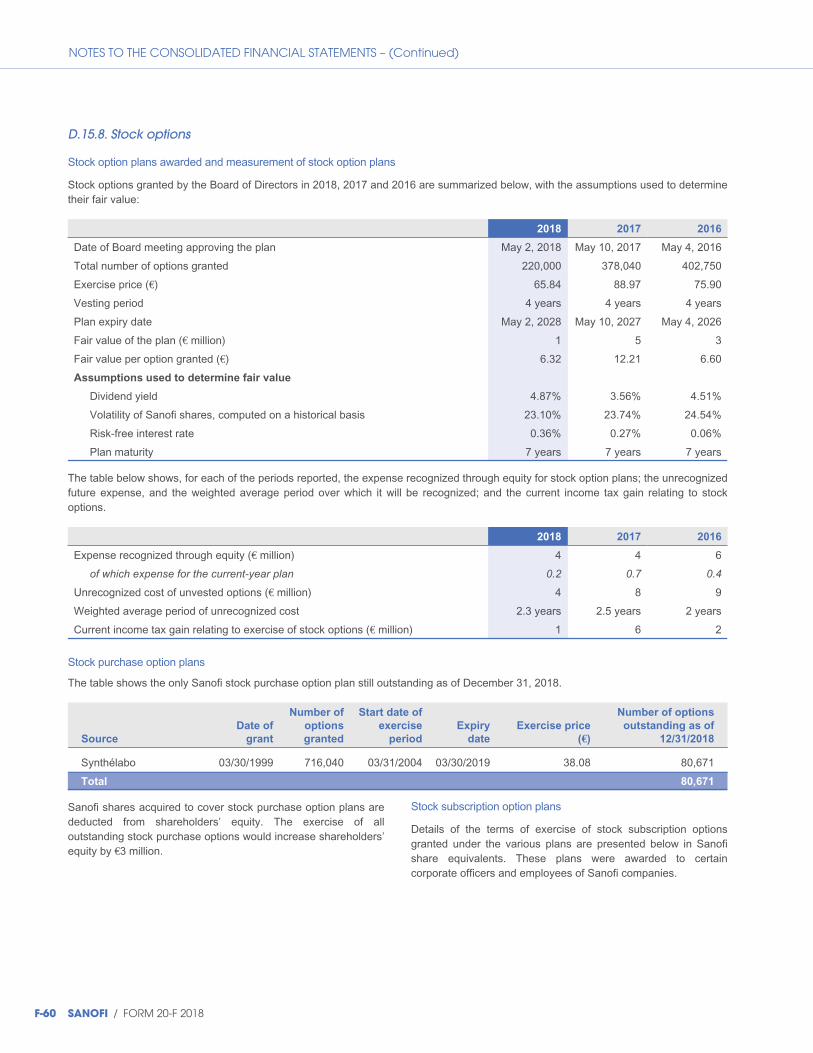
NOTES TO THE CONSOLIDATED FINANCIAL STATEMENTS – (Continued)
D.15.8. Stock options
Stock option plans awarded and measurement of stock option plans
Stock options granted by the Board of Directors in 2018, 2017 and 2016 are summarized below, with the assumptions used to determinetheir fair value:
2018 2017 2016
Date of Board meeting approving the plan May 2, 2018 May 10, 2017 May 4, 2016
Total number of options granted 220,000 378,040 402,750
Exercise price (€) 65.84 88.97 75.90
Vesting period 4 years 4 years 4 years
Plan expiry date May 2, 2028 May 10, 2027 May 4, 2026
Fair value of the plan (€ million) 1 5 3
Fair value per option granted (€) 6.32 12.21 6.60
Assumptions used to determine fair value
Dividend yield 4.87% 3.56% 4.51%
Volatility of Sanofi shares, computed on a historical basis 23.10% 23.74% 24.54%
Risk-free interest rate 0.36% 0.27% 0.06%
Plan maturity 7 years 7 years 7 years
The table below shows, for each of the periods reported, the expense recognized through equity for stock option plans; the unrecognizedfuture expense, and the weighted average period over which it will be recognized; and the current income tax gain relating to stockoptions.
2018 2017 2016
Expense recognized through equity (€ million) 4 4 6
of which expense for the current-year plan 0.2 0.7 0.4
Unrecognized cost of unvested options (€ million) 4 8 9
Weighted average period of unrecognized cost 2.3 years 2.5 years 2 years
Current income tax gain relating to exercise of stock options (€ million) 1 6 2
Stock purchase option plans
The table shows the only Sanofi stock purchase option plan still outstanding as of December 31, 2018.
Source
Date of
grant
Number of
options
granted
Start date of
exercise
period
Expiry
date
Exercise price
(€)
Number of options
outstanding as of
12/31/2018
Synthélabo 03/30/1999 716,040 03/31/2004 03/30/2019 38.08 80,671
Total 80,671
Sanofi shares acquired to cover stock purchase option plans arededucted from shareholders’ equity. The exercise of alloutstanding stock purchase options would increase shareholders’equity by €3 million.
Stock subscription option plans
Details of the terms of exercise of stock subscription optionsgranted under the various plans are presented below in Sanofishare equivalents. These plans were awarded to certaincorporate officers and employees of Sanofi companies.
F-60 SANOFI / FORM 20-F 2018
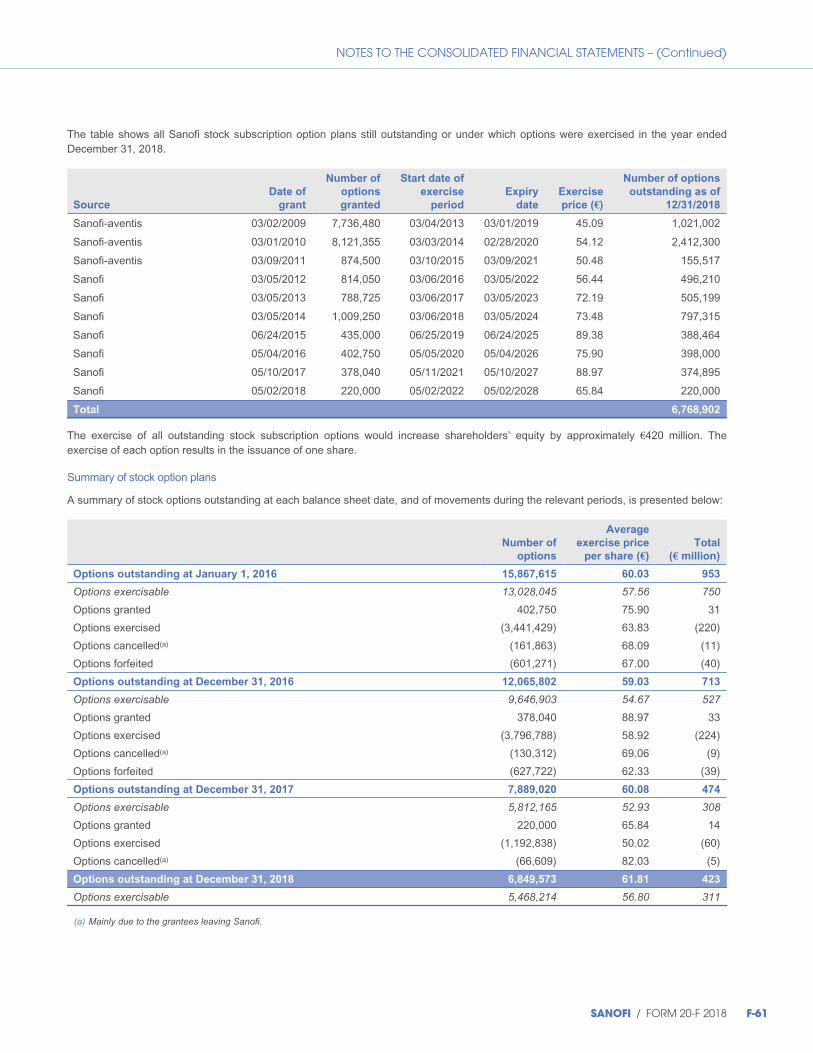
NOTES TO THE CONSOLIDATED FINANCIAL STATEMENTS – (Continued)
The table shows all Sanofi stock subscription option plans still outstanding or under which options were exercised in the year endedDecember 31, 2018.
Source
Date of
grant
Number of
options
granted
Start date of
exercise
period
Expiry
date
Exercise
price (€)
Number of options
outstanding as of
12/31/2018
Sanofi-aventis 03/02/2009 7,736,480 03/04/2013 03/01/2019 45.09 1,021,002
Sanofi-aventis 03/01/2010 8,121,355 03/03/2014 02/28/2020 54.12 2,412,300
Sanofi-aventis 03/09/2011 874,500 03/10/2015 03/09/2021 50.48 155,517
Sanofi 03/05/2012 814,050 03/06/2016 03/05/2022 56.44 496,210
Sanofi 03/05/2013 788,725 03/06/2017 03/05/2023 72.19 505,199
Sanofi 03/05/2014 1,009,250 03/06/2018 03/05/2024 73.48 797,315
Sanofi 06/24/2015 435,000 06/25/2019 06/24/2025 89.38 388,464
Sanofi 05/04/2016 402,750 05/05/2020 05/04/2026 75.90 398,000
Sanofi 05/10/2017 378,040 05/11/2021 05/10/2027 88.97 374,895
Sanofi 05/02/2018 220,000 05/02/2022 05/02/2028 65.84 220,000
Total 6,768,902
The exercise of all outstanding stock subscription options would increase shareholders’ equity by approximately €420 million. Theexercise of each option results in the issuance of one share.
Summary of stock option plans
A summary of stock options outstanding at each balance sheet date, and of movements during the relevant periods, is presented below:
Number of
options
Average
exercise price
per share (€)
Total
(€ million)
Options outstanding at January 1, 2016 15,867,615 60.03 953
Options exercisable 13,028,045 57.56 750
Options granted 402,750 75.90 31
Options exercised (3,441,429) 63.83 (220)
Options cancelled(a) (161,863) 68.09 (11)
Options forfeited (601,271) 67.00 (40)
Options outstanding at December 31, 2016 12,065,802 59.03 713
Options exercisable 9,646,903 54.67 527
Options granted 378,040 88.97 33
Options exercised (3,796,788) 58.92 (224)
Options cancelled(a) (130,312) 69.06 (9)
Options forfeited (627,722) 62.33 (39)
Options outstanding at December 31, 2017 7,889,020 60.08 474
Options exercisable 5,812,165 52.93 308
Options granted 220,000 65.84 14
Options exercised (1,192,838) 50.02 (60)
Options cancelled(a) (66,609) 82.03 (5)
Options outstanding at December 31, 2018 6,849,573 61.81 423
Options exercisable 5,468,214 56.80 311
(a) Mainly due to the grantees leaving Sanofi.
SANOFI / FORM 20-F 2018 F-61
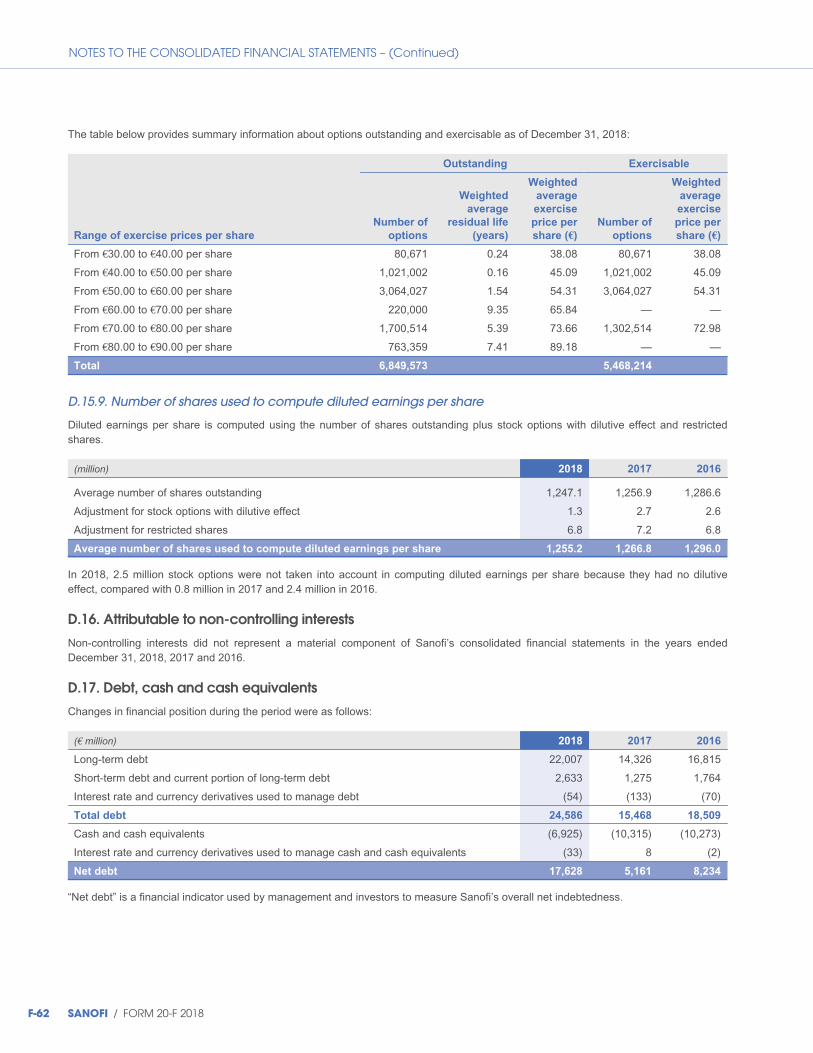
NOTES TO THE CONSOLIDATED FINANCIAL STATEMENTS – (Continued)
The table below provides summary information about options outstanding and exercisable as of December 31, 2018:
Outstanding Exercisable
Range of exercise prices per share
Number of
options
Weighted
average
residual life
(years)
Weighted
average
exercise
price per
share (€)
Number of
options
Weighted
average
exercise
price per
share (€)
From €30.00 to €40.00 per share 80,671 0.24 38.08 80,671 38.08
From €40.00 to €50.00 per share 1,021,002 0.16 45.09 1,021,002 45.09
From €50.00 to €60.00 per share 3,064,027 1.54 54.31 3,064,027 54.31
From €60.00 to €70.00 per share 220,000 9.35 65.84 — —
From €70.00 to €80.00 per share 1,700,514 5.39 73.66 1,302,514 72.98
From €80.00 to €90.00 per share 763,359 7.41 89.18 — —
Total 6,849,573 5,468,214
D.15.9. Number of shares used to compute diluted earnings per share
Diluted earnings per share is computed using the number of shares outstanding plus stock options with dilutive effect and restrictedshares.
(million) 2018 2017 2016
Average number of shares outstanding 1,247.1 1,256.9 1,286.6
Adjustment for stock options with dilutive effect 1.3 2.7 2.6
Adjustment for restricted shares 6.8 7.2 6.8
Average number of shares used to compute diluted earnings per share 1,255.2 1,266.8 1,296.0
In 2018, 2.5 million stock options were not taken into account in computing diluted earnings per share because they had no dilutiveeffect, compared with 0.8 million in 2017 and 2.4 million in 2016.
D.16. Attributable to non-controlling interests
Non-controlling interests did not represent a material component of Sanofi’s consolidated financial statements in the years endedDecember 31, 2018, 2017 and 2016.
D.17. Debt, cash and cash equivalents
Changes in financial position during the period were as follows:
(€ million) 2018 2017 2016
Long-term debt 22,007 14,326 16,815
Short-term debt and current portion of long-term debt 2,633 1,275 1,764
Interest rate and currency derivatives used to manage debt (54) (133) (70)
Total debt 24,586 15,468 18,509
Cash and cash equivalents (6,925) (10,315) (10,273)
Interest rate and currency derivatives used to manage cash and cash equivalents (33) 8 (2)
Net debt 17,628 5,161 8,234
“Net debt” is a financial indicator used by management and investors to measure Sanofi’s overall net indebtedness.
F-62 SANOFI / FORM 20-F 2018
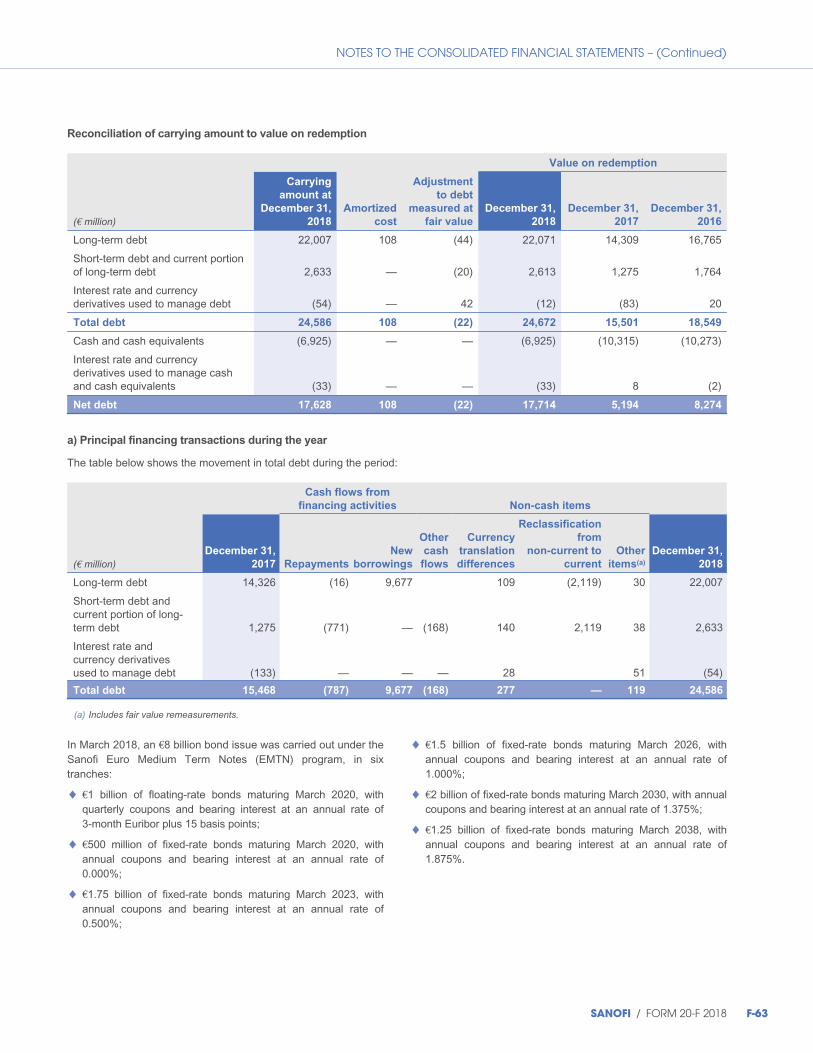
NOTES TO THE CONSOLIDATED FINANCIAL STATEMENTS – (Continued)
Reconciliation of carrying amount to value on redemption
Value on redemption
(€ million)
Carrying
amount at
December 31,
2018
Amortized
cost
Adjustment
to debt
measured at
fair value
December 31,
2018
December 31,
2017
December 31,
2016
Long-term debt 22,007 108 (44) 22,071 14,309 16,765
Short-term debt and current portionof long-term debt 2,633 — (20) 2,613 1,275 1,764
Interest rate and currencyderivatives used to manage debt (54) — 42 (12) (83) 20
Total debt 24,586 108 (22) 24,672 15,501 18,549
Cash and cash equivalents (6,925) — — (6,925) (10,315) (10,273)
Interest rate and currencyderivatives used to manage cashand cash equivalents (33) — — (33) 8 (2)
Net debt 17,628 108 (22) 17,714 5,194 8,274
a) Principal financing transactions during the year
The table below shows the movement in total debt during the period:
Cash flows from
financing activities Non-cash items
(€ million)December 31,
2017 Repayments
New
borrowings
Other
cash
flows
Currency
translation
differences
Reclassification
from
non-current to
current
Other
items(a)
December 31,
2018
Long-term debt 14,326 (16) 9,677 109 (2,119) 30 22,007
Short-term debt andcurrent portion of long-term debt 1,275 (771) — (168) 140 2,119 38 2,633
Interest rate andcurrency derivativesused to manage debt (133) — — — 28 51 (54)
Total debt 15,468 (787) 9,677 (168) 277 — 119 24,586
(a) Includes fair value remeasurements.
In March 2018, an €8 billion bond issue was carried out under theSanofi Euro Medium Term Notes (EMTN) program, in sixtranches:
◆ €1 billion of floating-rate bonds maturing March 2020, withquarterly coupons and bearing interest at an annual rate of3-month Euribor plus 15 basis points;
◆ €500 million of fixed-rate bonds maturing March 2020, withannual coupons and bearing interest at an annual rate of0.000%;
◆ €1.75 billion of fixed-rate bonds maturing March 2023, withannual coupons and bearing interest at an annual rate of0.500%;
◆ €1.5 billion of fixed-rate bonds maturing March 2026, withannual coupons and bearing interest at an annual rate of1.000%;
◆ €2 billion of fixed-rate bonds maturing March 2030, with annualcoupons and bearing interest at an annual rate of 1.375%;
◆ €1.25 billion of fixed-rate bonds maturing March 2038, withannual coupons and bearing interest at an annual rate of1.875%.
SANOFI / FORM 20-F 2018 F-63
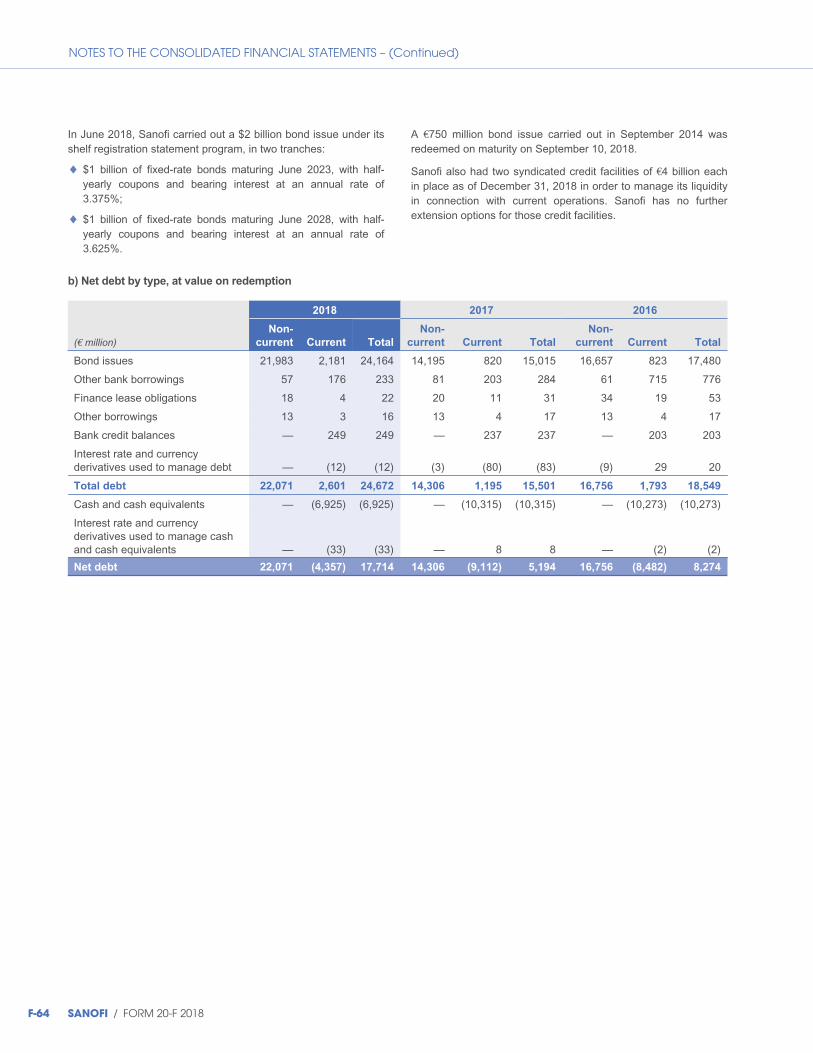
NOTES TO THE CONSOLIDATED FINANCIAL STATEMENTS – (Continued)
In June 2018, Sanofi carried out a $2 billion bond issue under itsshelf registration statement program, in two tranches:
◆ $1 billion of fixed-rate bonds maturing June 2023, with half-yearly coupons and bearing interest at an annual rate of3.375%;
◆ $1 billion of fixed-rate bonds maturing June 2028, with half-yearly coupons and bearing interest at an annual rate of3.625%.
A €750 million bond issue carried out in September 2014 wasredeemed on maturity on September 10, 2018.
Sanofi also had two syndicated credit facilities of €4 billion eachin place as of December 31, 2018 in order to manage its liquidityin connection with current operations. Sanofi has no furtherextension options for those credit facilities.
b) Net debt by type, at value on redemption
2018 2017 2016
(€ million)Non-
current Current Total
Non-
current Current Total
Non-
current Current Total
Bond issues 21,983 2,181 24,164 14,195 820 15,015 16,657 823 17,480
Other bank borrowings 57 176 233 81 203 284 61 715 776
Finance lease obligations 18 4 22 20 11 31 34 19 53
Other borrowings 13 3 16 13 4 17 13 4 17
Bank credit balances — 249 249 — 237 237 — 203 203
Interest rate and currencyderivatives used to manage debt — (12) (12) (3) (80) (83) (9) 29 20
Total debt 22,071 2,601 24,672 14,306 1,195 15,501 16,756 1,793 18,549
Cash and cash equivalents — (6,925) (6,925) — (10,315) (10,315) — (10,273) (10,273)
Interest rate and currencyderivatives used to manage cashand cash equivalents — (33) (33) — 8 8 — (2) (2)
Net debt 22,071 (4,357) 17,714 14,306 (9,112) 5,194 16,756 (8,482) 8,274
F-64 SANOFI / FORM 20-F 2018

NOTES TO THE CONSOLIDATED FINANCIAL STATEMENTS – (Continued)
Bond issues carried out by Sanofi under the Euro Medium Term Note (EMTN) program are as follows:
Issuer ISIN code Issue date Maturity Annual interest rate
Amount
(€ million)
Sanofi XS0456451771 October 2009 October 2019 4.125% 800
Sanofi FR0011560333 September 2013 September 2020 1.875% 1,000
Sanofi FR0011625433 November 2013 November 2023 2.50% 1,000
Sanofi FR0012146777 September 2014 March 2022 1.125% 1,000
Sanofi FR0012146801 September 2014 September 2026 1.75% 1,510
Sanofi FR0012969012 September 2015 March 2019 E3M + 0.30% 750
Sanofi FR0012969020 September 2015 September 2021 0.875% 500
Sanofi FR0012969038 September 2015 September 2025 1.50% 750
Sanofi FR0013143989 April 2016 April 2019 0% 500
Sanofi FR0013143997 April 2016 April 2024 0.625% 600
Sanofi FR0013144003 April 2016 April 2028 1.125% 700
Sanofi FR0013201613 September 2016 January 2020 0% 1,000
Sanofi FR0013201621 September 2016 September 2022 0% 850
Sanofi FR0013201639 September 2016 January 2027 0.5% 1,150
Sanofi FR0013324316 March 2018 March 2020 E3M + 0.15% 1,000
Sanofi FR0013324324 March 2018 March 2020 0% 500
Sanofi FR0013324332 March 2018 March 2023 0.5% 1,750
Sanofi FR0013324340 March 2018 March 2026 1% 1,500
Sanofi FR0013324357 March 2018 March 2030 1.375% 2,000
Sanofi FR0013324373 March 2018 March 2038 1.875% 1,250
Bond issues carried out by Sanofi under the public bond issue program (shelf registration statement) registered with the US Securitiesand Exchange Commission (SEC) comprise:
Issuer ISIN code Issue date Maturity
Annual interest
rate
Amount
($ million)
Sanofi US80105NAG07 March 2011 March 2021 4% 2,000
Genzyme Corp.(a) US372917AS37 June 2010 June 2020 5% 500
Sanofi US801060AC87 June 2018 June 2023 3.375% 1,000
Sanofi US801060AD60 June 2018 June 2028 3.625% 1,000
(a) Bonds issued by Genzyme Corp. prior to its acquisition by Sanofi in 2011.
The line “Other borrowings” mainly comprises:
◆ participating shares issued between 1983 and 1987, of which82,698 remain outstanding, with a nominal amount of€13 million.
The Series A participating shares issued in 1989 wererepurchased in 2018 for €1.3 million and then cancelled by theBoard of Directors.
In order to manage its liquidity needs for current operations,Sanofi has:
◆ a syndicated credit facility of €4 billion, drawable in euros andin US dollars, due to expire on December 17, 2020 followingthe exercise of a second extension option in November 2015;
◆ a syndicated credit facility of €4 billion, drawable in euros andin US dollars, due to expire on December 3, 2021 following theexercise of a second extension option in November 2016.
Sanofi also has a €6 billion Negotiable European CommercialPaper program in France and a $10 billion Commercial Paperprogram in the United States. During 2018 only the US programwas used, with an average drawdown of $5.0 billion and amaximum drawdown of $9.5 billion. As of December 31, 2018,neither of those programs was being utilized.
The financing in place as of December 31, 2018 at the level ofthe holding company (which manages most of Sanofi’s financingneeds centrally) is not subject to any financial covenants, andcontains no clauses linking credit spreads or fees to the creditrating.
SANOFI / FORM 20-F 2018 F-65
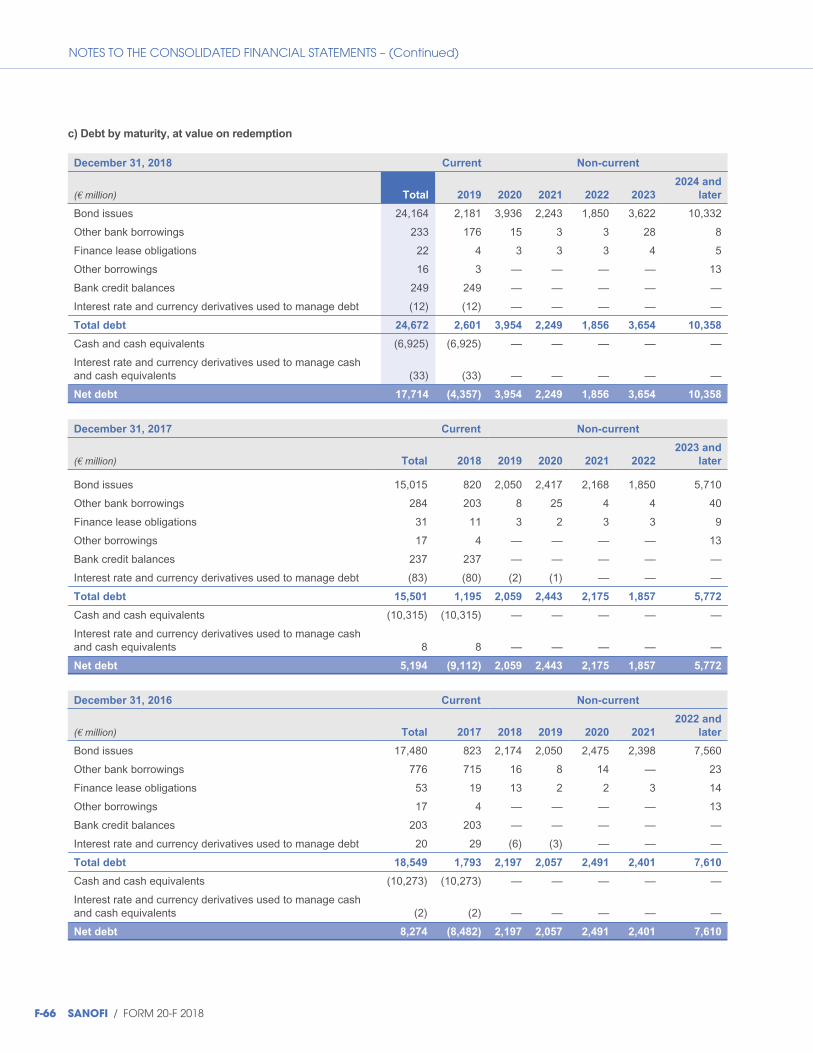
NOTES TO THE CONSOLIDATED FINANCIAL STATEMENTS – (Continued)
c) Debt by maturity, at value on redemption
December 31, 2018 Current Non-current
(€ million) Total 2019 2020 2021 2022 2023
2024 and
later
Bond issues 24,164 2,181 3,936 2,243 1,850 3,622 10,332
Other bank borrowings 233 176 15 3 3 28 8
Finance lease obligations 22 4 3 3 3 4 5
Other borrowings 16 3 — — — — 13
Bank credit balances 249 249 — — — — —
Interest rate and currency derivatives used to manage debt (12) (12) — — — — —
Total debt 24,672 2,601 3,954 2,249 1,856 3,654 10,358
Cash and cash equivalents (6,925) (6,925) — — — — —
Interest rate and currency derivatives used to manage cashand cash equivalents (33) (33) — — — — —
Net debt 17,714 (4,357) 3,954 2,249 1,856 3,654 10,358
December 31, 2017 Current Non-current
(€ million) Total 2018 2019 2020 2021 2022
2023 and
later
Bond issues 15,015 820 2,050 2,417 2,168 1,850 5,710
Other bank borrowings 284 203 8 25 4 4 40
Finance lease obligations 31 11 3 2 3 3 9
Other borrowings 17 4 — — — — 13
Bank credit balances 237 237 — — — — —
Interest rate and currency derivatives used to manage debt (83) (80) (2) (1) — — —
Total debt 15,501 1,195 2,059 2,443 2,175 1,857 5,772
Cash and cash equivalents (10,315) (10,315) — — — — —
Interest rate and currency derivatives used to manage cashand cash equivalents 8 8 — — — — —
Net debt 5,194 (9,112) 2,059 2,443 2,175 1,857 5,772
December 31, 2016 Current Non-current
(€ million) Total 2017 2018 2019 2020 2021
2022 and
later
Bond issues 17,480 823 2,174 2,050 2,475 2,398 7,560
Other bank borrowings 776 715 16 8 14 — 23
Finance lease obligations 53 19 13 2 2 3 14
Other borrowings 17 4 — — — — 13
Bank credit balances 203 203 — — — — —
Interest rate and currency derivatives used to manage debt 20 29 (6) (3) — — —
Total debt 18,549 1,793 2,197 2,057 2,491 2,401 7,610
Cash and cash equivalents (10,273) (10,273) — — — — —
Interest rate and currency derivatives used to manage cashand cash equivalents (2) (2) — — — — —
Net debt 8,274 (8,482) 2,197 2,057 2,491 2,401 7,610
F-66 SANOFI / FORM 20-F 2018

NOTES TO THE CONSOLIDATED FINANCIAL STATEMENTS – (Continued)
As of December 31, 2018, the main undrawn confirmed general-purpose credit facilities at holding company level amounted to€8 billion, of which half expires in 2020 and half in 2021.
As of December 31, 2018, no single counterparty representedmore than 7% of Sanofi’s undrawn confirmed credit facilities.
d) Debt by interest rate, at value on redemption
The table below splits net debt between fixed and floating rate, and by maturity or contractual repricing date, as of December 31, 2018.The figures shown are values on redemption, before the effects of derivative instruments:
(€ million) Total 2019 2020 2021 2022 2023
2024 and
later
Fixed-rate debt 22,414 1,431 2,936 2,243 1,850 3,622 10,332
of which euro 18,471
of which US dollar 3,943
% fixed-rate 91%
Floating-rate debt (maturity based on contractual repricingdate) 2,270 1,182 1,018 6 6 32 26
of which euro 1,800
of which US dollar 27
% floating-rate 9%
Debt 24,684 2,613 3,954 2,249 1,856 3,654 10,358
Cash and cash equivalents (6,925) (6,925)
of which euro (3,244)
of which US dollar (3,109)
% floating-rate 100%
Net debt 17,759 (4,312) 3,954 2,249 1,856 3,654 10,358
Sanofi issues debt in two currencies, the euro and the US dollar,and also invests its cash and cash equivalents in thosecurrencies. Sanofi also operates cash pooling arrangements to
manage the surplus cash and short-term liquidity needs of foreignsubsidiaries located outside the euro zone.
SANOFI / FORM 20-F 2018 F-67
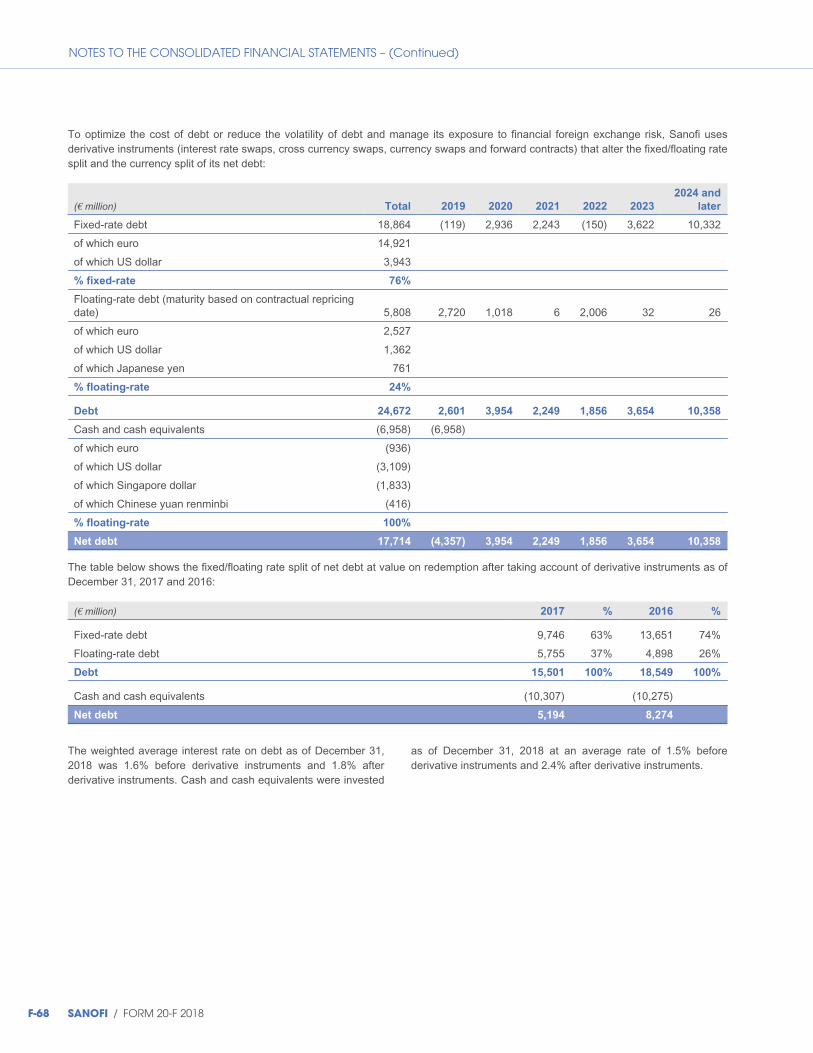
NOTES TO THE CONSOLIDATED FINANCIAL STATEMENTS – (Continued)
To optimize the cost of debt or reduce the volatility of debt and manage its exposure to financial foreign exchange risk, Sanofi usesderivative instruments (interest rate swaps, cross currency swaps, currency swaps and forward contracts) that alter the fixed/floating ratesplit and the currency split of its net debt:
(€ million) Total 2019 2020 2021 2022 2023
2024 and
later
Fixed-rate debt 18,864 (119) 2,936 2,243 (150) 3,622 10,332
of which euro 14,921
of which US dollar 3,943
% fixed-rate 76%
Floating-rate debt (maturity based on contractual repricingdate) 5,808 2,720 1,018 6 2,006 32 26
of which euro 2,527
of which US dollar 1,362
of which Japanese yen 761
% floating-rate 24%
Debt 24,672 2,601 3,954 2,249 1,856 3,654 10,358
Cash and cash equivalents (6,958) (6,958)
of which euro (936)
of which US dollar (3,109)
of which Singapore dollar (1,833)
of which Chinese yuan renminbi (416)
% floating-rate 100%
Net debt 17,714 (4,357) 3,954 2,249 1,856 3,654 10,358
The table below shows the fixed/floating rate split of net debt at value on redemption after taking account of derivative instruments as ofDecember 31, 2017 and 2016:
(€ million) 2017 % 2016 %
Fixed-rate debt 9,746 63% 13,651 74%
Floating-rate debt 5,755 37% 4,898 26%
Debt 15,501 100% 18,549 100%
Cash and cash equivalents (10,307) (10,275)
Net debt 5,194 8,274
The weighted average interest rate on debt as of December 31,2018 was 1.6% before derivative instruments and 1.8% afterderivative instruments. Cash and cash equivalents were invested
as of December 31, 2018 at an average rate of 1.5% beforederivative instruments and 2.4% after derivative instruments.
F-68 SANOFI / FORM 20-F 2018

NOTES TO THE CONSOLIDATED FINANCIAL STATEMENTS – (Continued)
The projected full-year sensitivity of net debt to interest rate fluctuations for 2019 is as follows:
Change in short-term interest rates
Impact on pre-tax net
income (€ million)
Impact on pre-tax
income/(expense) recognized
directly in equity
(€ million)
+100 bp 11 —
+25 bp 3 —
-25 bp (3) —
-100 bp (11) —
e) Debt by currency, at value on redemption
The table below shows net debt by currency at December 31, 2018, before and after derivative instruments contracted to convert theforeign-currency net debt of exposed entities into their functional currency:
(€ million) Before derivative instruments After derivative instruments
Euro 17,028 16,511
US dollar 861 2,197
Singapore dollar (2) (1,833)
Japanese yen (1) 761
Chinese yuan renminbi (17) (416)
Other currencies (110) 494
Net debt 17,759 17,714
The table below shows net debt by currency at December 31, 2017 and 2016, after derivative instruments contracted to convert theforeign currency net debt of exposed entities into their functional currency:
(€ million) 2017 2016
Euro 3,410 4,556
US dollar 4,683 4,907
Other currencies (2,899) (1,189)
Net debt 5,194 8,274
f) Market value of net debt
The market value of Sanofi’s debt, net of cash and cash equivalents and derivatives and excluding accrued interest, is as follows:
(€ million) 2018 2017 2016
Market value 18,003 5,650 8,690
Value on redemption 17,714 5,194 8,274
The fair value of debt is determined by reference to quotedmarket prices at the balance sheet date in the case of quotedinstruments (level 1 in the IFRS 7 hierarchy, see Note D.12.), and
by reference to the fair value of interest rate and currencyderivatives used to manage net debt (level 2 in the IFRS 7hierarchy, see Note D.12.).
SANOFI / FORM 20-F 2018 F-69
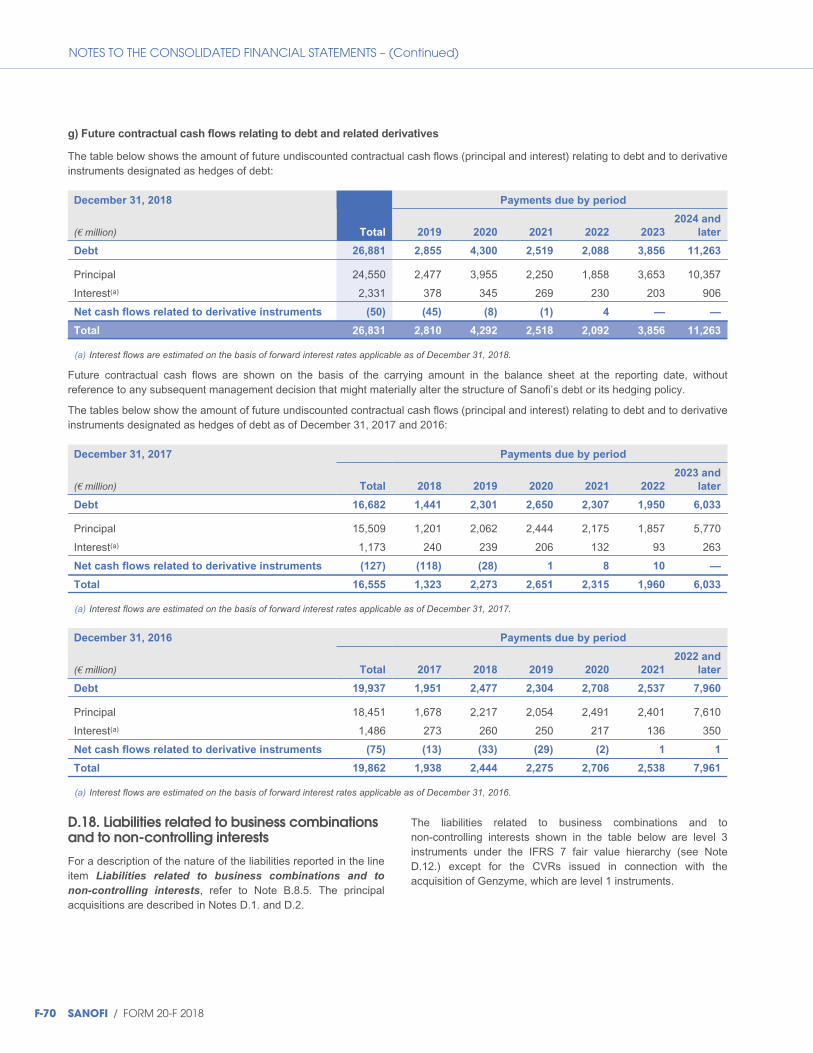
NOTES TO THE CONSOLIDATED FINANCIAL STATEMENTS – (Continued)
g) Future contractual cash flows relating to debt and related derivatives
The table below shows the amount of future undiscounted contractual cash flows (principal and interest) relating to debt and to derivativeinstruments designated as hedges of debt:
December 31, 2018 Payments due by period
(€ million) Total 2019 2020 2021 2022 2023
2024 and
later
Debt 26,881 2,855 4,300 2,519 2,088 3,856 11,263
Principal 24,550 2,477 3,955 2,250 1,858 3,653 10,357
Interest(a) 2,331 378 345 269 230 203 906
Net cash flows related to derivative instruments (50) (45) (8) (1) 4 — —
Total 26,831 2,810 4,292 2,518 2,092 3,856 11,263
(a) Interest flows are estimated on the basis of forward interest rates applicable as of December 31, 2018.
Future contractual cash flows are shown on the basis of the carrying amount in the balance sheet at the reporting date, withoutreference to any subsequent management decision that might materially alter the structure of Sanofi’s debt or its hedging policy.
The tables below show the amount of future undiscounted contractual cash flows (principal and interest) relating to debt and to derivativeinstruments designated as hedges of debt as of December 31, 2017 and 2016:
December 31, 2017 Payments due by period
(€ million) Total 2018 2019 2020 2021 2022
2023 and
later
Debt 16,682 1,441 2,301 2,650 2,307 1,950 6,033
Principal 15,509 1,201 2,062 2,444 2,175 1,857 5,770
Interest(a) 1,173 240 239 206 132 93 263
Net cash flows related to derivative instruments (127) (118) (28) 1 8 10 —
Total 16,555 1,323 2,273 2,651 2,315 1,960 6,033
(a) Interest flows are estimated on the basis of forward interest rates applicable as of December 31, 2017.
December 31, 2016 Payments due by period
(€ million) Total 2017 2018 2019 2020 2021
2022 and
later
Debt 19,937 1,951 2,477 2,304 2,708 2,537 7,960
Principal 18,451 1,678 2,217 2,054 2,491 2,401 7,610
Interest(a) 1,486 273 260 250 217 136 350
Net cash flows related to derivative instruments (75) (13) (33) (29) (2) 1 1
Total 19,862 1,938 2,444 2,275 2,706 2,538 7,961
(a) Interest flows are estimated on the basis of forward interest rates applicable as of December 31, 2016.
D.18. Liabilities related to business combinationsand to non-controlling interests
For a description of the nature of the liabilities reported in the lineitem Liabilities related to business combinations and to
non-controlling interests, refer to Note B.8.5. The principalacquisitions are described in Notes D.1. and D.2.
The liabilities related to business combinations and tonon-controlling interests shown in the table below are level 3instruments under the IFRS 7 fair value hierarchy (see NoteD.12.) except for the CVRs issued in connection with theacquisition of Genzyme, which are level 1 instruments.
F-70 SANOFI / FORM 20-F 2018

NOTES TO THE CONSOLIDATED FINANCIAL STATEMENTS – (Continued)
Movements in liabilities related to business combinations and to non-controlling interests are shown below:
(€ million)
Liabilities
related to
non-controlling
interests(a)
CVRs issued
in connection
with the
acquisition
of Genzyme(b)
Bayer
contingent
consideration
arising from the
acquisition of
Genzyme
MSD
contingent
consideration
(European
Vaccines
business) Other Total(c)
Balance at January 1, 2016 181 24 1,040 — 6 1,251
New transactions — — — 354 — 354
Payments made — — (137) — (3) (140)
Fair value remeasurementsthrough profit or loss: (gain)/loss(including unwinding of discount)(d) — 58 78 — (1) 135
Other movements (58) — — — — (58)
Currency translation differences — 3 32 — (1) 34
Balance at December 31, 2016 123 85 1,013 354 1 1,576
New transactions(e) — — — — 85 85
Payments made — — (165) — (61) (226)
Fair value remeasurementsthrough profit or loss: (gain)/loss(including unwinding of discount)(d) — 1 (28) 71 (1) 43
Other movements (28) — — — 57 29
Currency translation differences (3) (11) (119) (5) — (138)
Balance at December 31, 2017 92 75 701 420 81 1,369
New transactions(f) — — — — 228 228
Payments made (70) — (147) (57) (55) (329)
Fair value remeasurementsthrough profit or loss: (gain)/loss(including unwinding of discount)(d) — 19 (109) 50 3 (37)
Other movements — — — — 24 24
Currency translation differences — 5 27 (3) 20 49
Balance at December 31, 2018 22 99 472 410 301 1,304
(a) Includes put options granted to non-controlling interests as of December 31, 2016 and 2017, and commitment to future buyout of non-controlling interestsheld by BMS. The payment relating to that buyout had been made as of December 31, 2018 (see Note C.2.).
(b) Based on the quoted market price per CVR of $0.48 as of December 31, 2018, and $0.38 as of December 31, 2017 and 2016.(c) Portion due after more than one year: €963 million as of December 31, 2018 (€1,026 million as of December 31, 2017 and €1,378 million as of
December 31, 2016); portion due within less than one year: €341 million as of December 31, 2018 (€343 million as of December 31, 2017 and €198 millionas of December 31, 2016).
(d) Amounts reported within the income statement line item Fair value remeasurement of contingent consideration, and mainly comprising unrealizedgains and losses.
(e) Includes two potential payments of €42 million each relating to the acquisition of Protein Sciences, contingent on the attainment of specified performancecriteria subsequent to the acquisition date.
(f) Includes €226 million for contingent consideration liabilities in favor of True North Therapeutics and €2 million of liabilities owed to Bioverativ employees atthe acquisition date.
SANOFI / FORM 20-F 2018 F-71
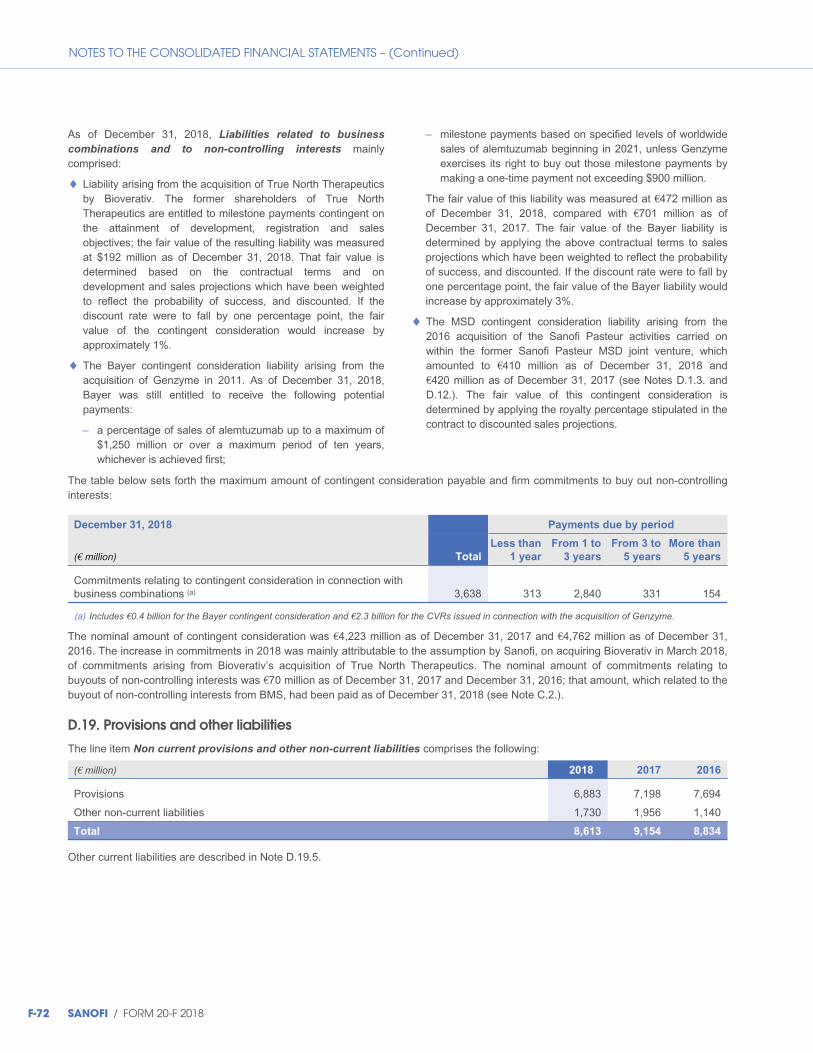
NOTES TO THE CONSOLIDATED FINANCIAL STATEMENTS – (Continued)
As of December 31, 2018, Liabilities related to business
combinations and to non-controlling interests mainlycomprised:
◆ Liability arising from the acquisition of True North Therapeuticsby Bioverativ. The former shareholders of True NorthTherapeutics are entitled to milestone payments contingent onthe attainment of development, registration and salesobjectives; the fair value of the resulting liability was measuredat $192 million as of December 31, 2018. That fair value isdetermined based on the contractual terms and ondevelopment and sales projections which have been weightedto reflect the probability of success, and discounted. If thediscount rate were to fall by one percentage point, the fairvalue of the contingent consideration would increase byapproximately 1%.
◆ The Bayer contingent consideration liability arising from theacquisition of Genzyme in 2011. As of December 31, 2018,Bayer was still entitled to receive the following potentialpayments:
– a percentage of sales of alemtuzumab up to a maximum of$1,250 million or over a maximum period of ten years,whichever is achieved first;
– milestone payments based on specified levels of worldwidesales of alemtuzumab beginning in 2021, unless Genzymeexercises its right to buy out those milestone payments bymaking a one-time payment not exceeding $900 million.
The fair value of this liability was measured at €472 million asof December 31, 2018, compared with €701 million as ofDecember 31, 2017. The fair value of the Bayer liability isdetermined by applying the above contractual terms to salesprojections which have been weighted to reflect the probabilityof success, and discounted. If the discount rate were to fall byone percentage point, the fair value of the Bayer liability wouldincrease by approximately 3%.
◆ The MSD contingent consideration liability arising from the2016 acquisition of the Sanofi Pasteur activities carried onwithin the former Sanofi Pasteur MSD joint venture, whichamounted to €410 million as of December 31, 2018 and€420 million as of December 31, 2017 (see Notes D.1.3. andD.12.). The fair value of this contingent consideration isdetermined by applying the royalty percentage stipulated in thecontract to discounted sales projections.
The table below sets forth the maximum amount of contingent consideration payable and firm commitments to buy out non-controllinginterests:
December 31, 2018 Payments due by period
(€ million) Total
Less than
1 year
From 1 to
3 years
From 3 to
5 years
More than
5 years
Commitments relating to contingent consideration in connection withbusiness combinations (a) 3,638 313 2,840 331 154
(a) Includes €0.4 billion for the Bayer contingent consideration and €2.3 billion for the CVRs issued in connection with the acquisition of Genzyme.
The nominal amount of contingent consideration was €4,223 million as of December 31, 2017 and €4,762 million as of December 31,2016. The increase in commitments in 2018 was mainly attributable to the assumption by Sanofi, on acquiring Bioverativ in March 2018,of commitments arising from Bioverativ’s acquisition of True North Therapeutics. The nominal amount of commitments relating tobuyouts of non-controlling interests was €70 million as of December 31, 2017 and December 31, 2016; that amount, which related to thebuyout of non-controlling interests from BMS, had been paid as of December 31, 2018 (see Note C.2.).
D.19. Provisions and other liabilities
The line item Non current provisions and other non-current liabilities comprises the following:
(€ million) 2018 2017 2016
Provisions 6,883 7,198 7,694
Other non-current liabilities 1,730 1,956 1,140
Total 8,613 9,154 8,834
Other current liabilities are described in Note D.19.5.
F-72 SANOFI / FORM 20-F 2018
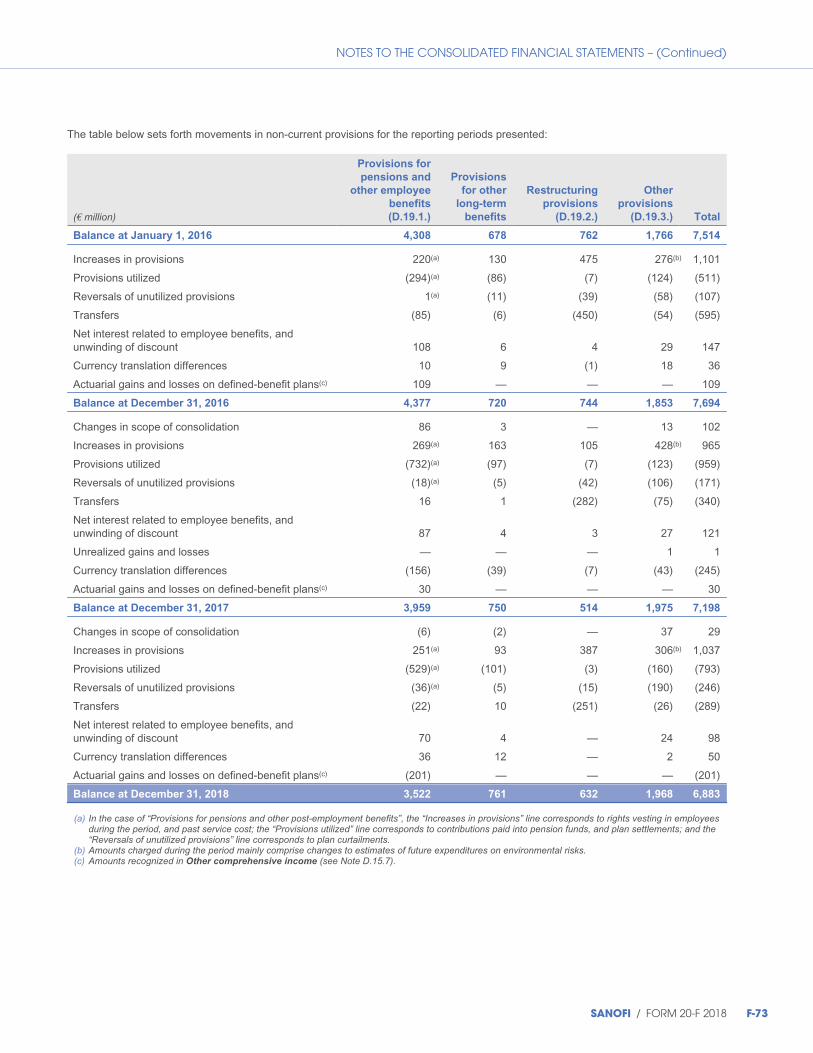
NOTES TO THE CONSOLIDATED FINANCIAL STATEMENTS – (Continued)
The table below sets forth movements in non-current provisions for the reporting periods presented:
(€ million)
Provisions for
pensions and
other employee
benefits
(D.19.1.)
Provisions
for other
long-term
benefits
Restructuring
provisions
(D.19.2.)
Other
provisions
(D.19.3.) Total
Balance at January 1, 2016 4,308 678 762 1,766 7,514
Increases in provisions 220(a) 130 475 276(b) 1,101
Provisions utilized (294)(a) (86) (7) (124) (511)
Reversals of unutilized provisions 1(a) (11) (39) (58) (107)
Transfers (85) (6) (450) (54) (595)
Net interest related to employee benefits, andunwinding of discount 108 6 4 29 147
Currency translation differences 10 9 (1) 18 36
Actuarial gains and losses on defined-benefit plans(c) 109 — — — 109
Balance at December 31, 2016 4,377 720 744 1,853 7,694
Changes in scope of consolidation 86 3 — 13 102
Increases in provisions 269(a) 163 105 428(b) 965
Provisions utilized (732)(a) (97) (7) (123) (959)
Reversals of unutilized provisions (18)(a) (5) (42) (106) (171)
Transfers 16 1 (282) (75) (340)
Net interest related to employee benefits, andunwinding of discount 87 4 3 27 121
Unrealized gains and losses — — — 1 1
Currency translation differences (156) (39) (7) (43) (245)
Actuarial gains and losses on defined-benefit plans(c) 30 — — — 30
Balance at December 31, 2017 3,959 750 514 1,975 7,198
Changes in scope of consolidation (6) (2) — 37 29
Increases in provisions 251(a) 93 387 306(b) 1,037
Provisions utilized (529)(a) (101) (3) (160) (793)
Reversals of unutilized provisions (36)(a) (5) (15) (190) (246)
Transfers (22) 10 (251) (26) (289)
Net interest related to employee benefits, andunwinding of discount 70 4 — 24 98
Currency translation differences 36 12 — 2 50
Actuarial gains and losses on defined-benefit plans(c) (201) — — — (201)
Balance at December 31, 2018 3,522 761 632 1,968 6,883
(a) In the case of “Provisions for pensions and other post-employment benefits”, the “Increases in provisions” line corresponds to rights vesting in employeesduring the period, and past service cost; the “Provisions utilized” line corresponds to contributions paid into pension funds, and plan settlements; and the“Reversals of unutilized provisions” line corresponds to plan curtailments.
(b) Amounts charged during the period mainly comprise changes to estimates of future expenditures on environmental risks.(c) Amounts recognized in Other comprehensive income (see Note D.15.7).
SANOFI / FORM 20-F 2018 F-73

NOTES TO THE CONSOLIDATED FINANCIAL STATEMENTS – (Continued)
D.19.1. Provisions for pensions and other post-employment benefits
Sanofi offers its employees pension plans and other post-employment benefit plans. The specific features of the plans(benefit formulas, fund investment policy and fund assets held)vary depending on the applicable laws and regulations in eachcountry where the employees work. These employee benefits areaccounted for in accordance with the revised IAS 19 (seeNote B.23.).
Sanofi’s pension obligations in four major countries representednearly 90% of the total value of the defined-benefit obligation andnearly 89% of the total value of plan assets as of December 31,2018. The features of the principal defined-benefit plans in eachof those four countries are described below.
France
Lump-sum retirement benefit plans
All employees working for Sanofi in France are entitled onretirement to a lump-sum payment, the amount of which dependsboth on their length of service and on the rights guaranteed bycollective and internal agreements. The employee’s final salary isused in calculating the amount of these lump-sum retirementbenefits. These plans represent approximately 34% of theGroup’s total obligation in France.
Defined-benefit pension plans
These plans provide benefits from the date of retirement.Employees must fulfil a number of criteria to be eligible for thesebenefits. All but one of the plans are closed to new entrants.These plans represent approximately 66% of the Group’s totalobligation in France.
Germany
Top-up defined-benefit pension plan
The benefits offered under this pension plan are wholly funded bythe employer (there are no employee contributions) via aContractual Trust Agreement (CTA), under which benefits areestimated on the basis of a career average salary. Employeesare entitled to receive an annuity under this plan if their salaryexceeds the social security ceiling. The amount of the pension iscalculated by reference to a range of vesting rates correspondingto salary bands. The plan also includes disability and deathbenefits. This plan represents approximately 67% of Sanofi’s totalobligation in Germany.
Sanofi-Aventis plus (SAV plus)
A new top-up pension plan (SAV plus) has replaced the previoustop-up defined-benefit plan. New entrants joining the plan afterApril 1, 2015 contribute to a defined-contribution plan that ispartially funded via the company’s CTA.
All employees whose salary exceeds the social security ceilingare automatically covered by the plan. The employer’scontribution is 15% of the amount by which the employee’s salaryexceeds the social security ceiling.
Multi-employer plan (Pensionskasse)
This is a defined-benefit plan that is treated as a defined-contribution plan, in accordance with the accounting policiesdescribed in Note B.23. Currently, contributions cover the level ofannuities. Only the portion relating to the future revaluation of theannuities is included in the defined-benefit pension obligation.The obligation relating to this revaluation amounted to€673 million as of December 31, 2018, versus €699 million as ofDecember 31, 2017 and €663 million as of December 31, 2016.This plan represents approximately 21% of Sanofi’s total defined-benefit obligation in Germany.
United States
Defined-benefit pension plans
In the United States, there are two types of defined-benefit plan:
◆ “Qualified” plans within the meaning of the EmployeeRetirement Income Security Act of 1974 (ERISA), whichprovide guaranteed benefits to eligible employees duringretirement, and in the event of death or disability. Employeescan elect to receive a reduced annuity, in exchange for anannuity to be paid in the event of their death to a persondesignated by them. An annuity is also granted under the planif the employee dies before retirement age. Eligible employeesdo not pay any contributions. These plans are closed to newentrants, and the vesting of rights for future service periods ispartially frozen. These plans represent approximately 64% ofSanofi’s total obligation in the United States.
◆ “Non-qualified” plans within the meaning of ERISA providetop-up retirement benefits to some eligible employeesdepending on the employee’s level of responsibility and subjectto a salary cap. These plans represent approximately 9% ofSanofi’s total obligation in the United States.
Healthcare cover and life insurance
Sanofi companies provide some eligible employees withhealthcare cover and life insurance during the retirement period(the company’s contributions are capped at a specified level).These plans represent approximately 27% (or €714 million) ofSanofi’s total obligation and 3% (or €44 million) of total planassets in the United States.
United Kingdom
Defined-benefit pension plans
Sanofi operates a number of pension plans in the UnitedKingdom that reflect past acquisitions. The most significant
F-74 SANOFI / FORM 20-F 2018
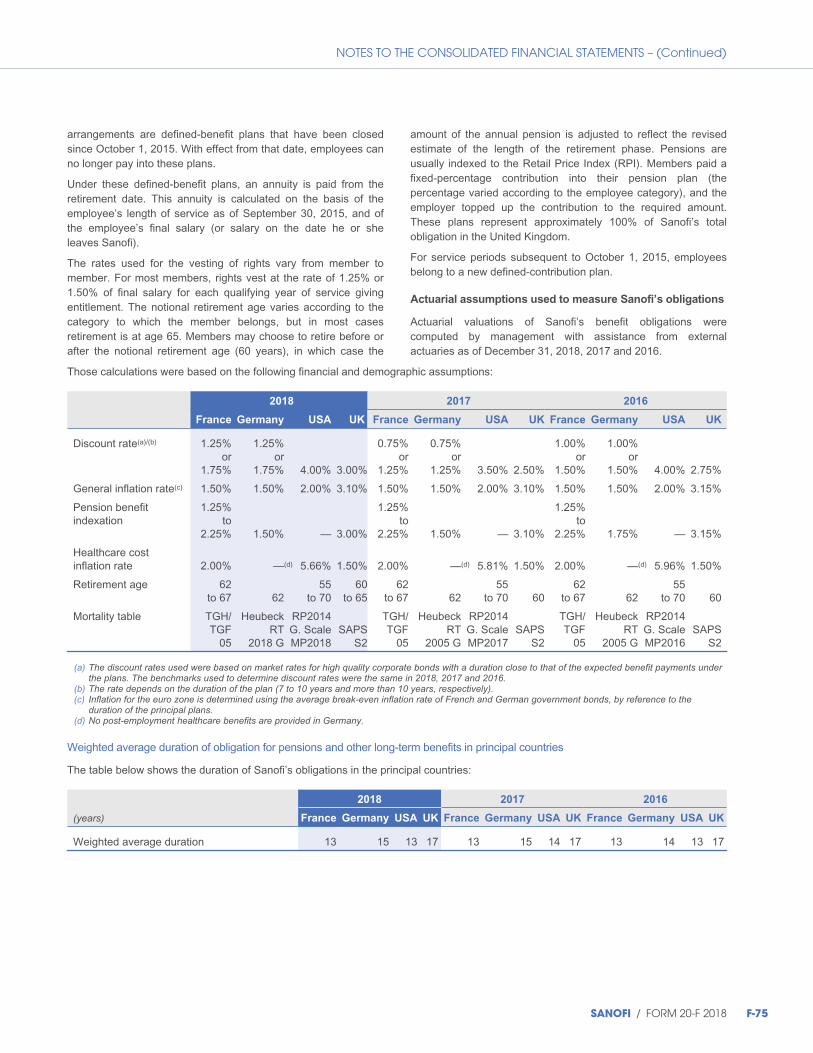
NOTES TO THE CONSOLIDATED FINANCIAL STATEMENTS – (Continued)
arrangements are defined-benefit plans that have been closedsince October 1, 2015. With effect from that date, employees canno longer pay into these plans.
Under these defined-benefit plans, an annuity is paid from theretirement date. This annuity is calculated on the basis of theemployee’s length of service as of September 30, 2015, and ofthe employee’s final salary (or salary on the date he or sheleaves Sanofi).
The rates used for the vesting of rights vary from member tomember. For most members, rights vest at the rate of 1.25% or1.50% of final salary for each qualifying year of service givingentitlement. The notional retirement age varies according to thecategory to which the member belongs, but in most casesretirement is at age 65. Members may choose to retire before orafter the notional retirement age (60 years), in which case the
amount of the annual pension is adjusted to reflect the revisedestimate of the length of the retirement phase. Pensions areusually indexed to the Retail Price Index (RPI). Members paid afixed-percentage contribution into their pension plan (thepercentage varied according to the employee category), and theemployer topped up the contribution to the required amount.These plans represent approximately 100% of Sanofi’s totalobligation in the United Kingdom.
For service periods subsequent to October 1, 2015, employeesbelong to a new defined-contribution plan.
Actuarial assumptions used to measure Sanofi’s obligations
Actuarial valuations of Sanofi’s benefit obligations werecomputed by management with assistance from externalactuaries as of December 31, 2018, 2017 and 2016.
Those calculations were based on the following financial and demographic assumptions:
2018 2017 2016
France Germany USA UK France Germany USA UK France Germany USA UK
Discount rate(a)/(b) 1.25%or
1.75%
1.25%or
1.75% 4.00% 3.00%
0.75%or
1.25%
0.75%or
1.25% 3.50% 2.50%
1.00%or
1.50%
1.00%or
1.50% 4.00% 2.75%
General inflation rate(c) 1.50% 1.50% 2.00% 3.10% 1.50% 1.50% 2.00% 3.10% 1.50% 1.50% 2.00% 3.15%
Pension benefitindexation
1.25%to
2.25% 1.50% — 3.00%
1.25%to
2.25% 1.50% — 3.10%
1.25%to
2.25% 1.75% — 3.15%
Healthcare costinflation rate 2.00% —(d) 5.66% 1.50% 2.00% —(d) 5.81% 1.50% 2.00% —(d) 5.96% 1.50%
Retirement age 62to 67 62
55to 70
60to 65
62to 67 62
55to 70 60
62to 67 62
55to 70 60
Mortality table TGH/TGF
05
HeubeckRT
2018 G
RP2014G. ScaleMP2018
SAPSS2
TGH/TGF
05
HeubeckRT
2005 G
RP2014G. ScaleMP2017
SAPSS2
TGH/TGF
05
HeubeckRT
2005 G
RP2014G. ScaleMP2016
SAPSS2
(a) The discount rates used were based on market rates for high quality corporate bonds with a duration close to that of the expected benefit payments underthe plans. The benchmarks used to determine discount rates were the same in 2018, 2017 and 2016.
(b) The rate depends on the duration of the plan (7 to 10 years and more than 10 years, respectively).(c) Inflation for the euro zone is determined using the average break-even inflation rate of French and German government bonds, by reference to the
duration of the principal plans.(d) No post-employment healthcare benefits are provided in Germany.
Weighted average duration of obligation for pensions and other long-term benefits in principal countries
The table below shows the duration of Sanofi’s obligations in the principal countries:
2018 2017 2016
(years) France Germany USA UK France Germany USA UK France Germany USA UK
Weighted average duration 13 15 13 17 13 15 14 17 13 14 13 17
SANOFI / FORM 20-F 2018 F-75
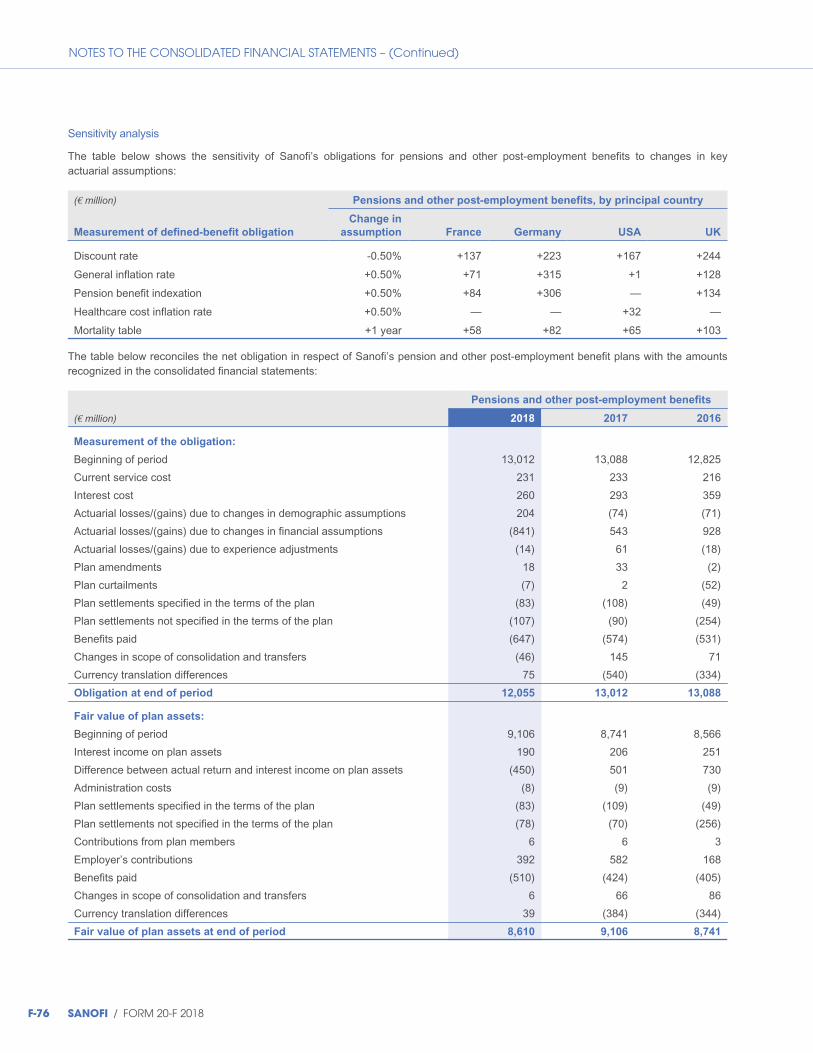
NOTES TO THE CONSOLIDATED FINANCIAL STATEMENTS – (Continued)
Sensitivity analysis
The table below shows the sensitivity of Sanofi’s obligations for pensions and other post-employment benefits to changes in keyactuarial assumptions:
(€ million) Pensions and other post-employment benefits, by principal country
Measurement of defined-benefit obligation
Change in
assumption France Germany USA UK
Discount rate -0.50% +137 +223 +167 +244
General inflation rate +0.50% +71 +315 +1 +128
Pension benefit indexation +0.50% +84 +306 — +134
Healthcare cost inflation rate +0.50% — — +32 —
Mortality table +1 year +58 +82 +65 +103
The table below reconciles the net obligation in respect of Sanofi’s pension and other post-employment benefit plans with the amountsrecognized in the consolidated financial statements:
Pensions and other post-employment benefits
(€ million) 2018 2017 2016
Measurement of the obligation:
Beginning of period 13,012 13,088 12,825
Current service cost 231 233 216
Interest cost 260 293 359
Actuarial losses/(gains) due to changes in demographic assumptions 204 (74) (71)
Actuarial losses/(gains) due to changes in financial assumptions (841) 543 928
Actuarial losses/(gains) due to experience adjustments (14) 61 (18)
Plan amendments 18 33 (2)
Plan curtailments (7) 2 (52)
Plan settlements specified in the terms of the plan (83) (108) (49)
Plan settlements not specified in the terms of the plan (107) (90) (254)
Benefits paid (647) (574) (531)
Changes in scope of consolidation and transfers (46) 145 71
Currency translation differences
Obligation at end of period
Fair value of plan assets:
75
12,055
(540)
13,012
(334)
13,088
Beginning of period 9,106 8,741 8,566
Interest income on plan assets 190 206 251
Difference between actual return and interest income on plan assets (450) 501 730
Administration costs (8) (9) (9)
Plan settlements specified in the terms of the plan (83) (109) (49)
Plan settlements not specified in the terms of the plan (78) (70) (256)
Contributions from plan members 6 6 3
Employer’s contributions 392 582 168
Benefits paid (510) (424) (405)
Changes in scope of consolidation and transfers 6 66 86
Currency translation differences
Fair value of plan assets at end of period
39
8,610
(384)
9,106
(344)
8,741
F-76 SANOFI / FORM 20-F 2018

NOTES TO THE CONSOLIDATED FINANCIAL STATEMENTS – (Continued)
Pensions and other post-employment benefits
(€ million) 2018 2017 2016
Net amount shown in the balance sheet:
Net obligation 3,445 3,906 4,347
Effect of asset ceiling
Net amount shown in the balance sheet at end of period
Amounts recognized in the balance sheet:
—
3,445
—
3,906
—
4,347
Pre-funded obligations (see Note D.7.) (77) (53) (30)
Obligations provided for
Net amount recognized at end of period
Benefit cost for the period:
3,522
3,445
3,959
3,906
4,377
4,347
Current service cost 231 233 216
Past service cost 18 33 (2)
Net interest (income)/cost 70 87 108
(Gains)/losses on plan settlements not specified in the terms of the plan (29) (20) 2
Actuarial (gains)/losses on plan curtailments (7) 2 (52)
Contributions from plan members (6) (6) (3)
Administration costs and taxes paid during the period
Expense recognized directly in profit or loss
Remeasurement of net defined-benefit (asset)/liability (actuarial gains andlosses)
Expense/(gain) for the period
8
285
(201)
84
9
338
30
368
9
278
109
387
The tables below show Sanofi’s net liability in respect of pension plans and other post-employment benefits by geographical region:
(€ million) Pensions and other post-employment benefits by geographical region
December 31, 2018 France Germany USA UK Other Total
Measurement of obligation 2,091 3,262 2,597 2,858 1,247 12,055
Fair value of plan assets 931 2,217 1,622 2,862 978 8,610
Net amount shown in the balance sheet at
end of period 1,160 1,045 975 (4) 269 3,445
(€ million) Pensions and other post-employment benefits by geographical region
December 31, 2017 France Germany USA UK Other Total
Measurement of obligation 2,363 3,611 2,699 3,032 1,307 13,012
Fair value of plan assets 991 2,390 1,775 2,926 1,024 9,106
Net amount shown in the balance sheet at
end of period 1,372 1,221 924 106 283 3,906
(€ million) Pensions and other post-employment benefits by geographical region
December 31, 2016 France Germany USA UK Other Total
Measurement of obligation 2,361 3,535 2,874 3,065 1,253 13,088
Fair value of plan assets 857 2,304 1,760 2,866 954 8,741
Net amount shown in the balance sheet at
end of period 1,504 1,231 1,114 199 299 4,347
SANOFI / FORM 20-F 2018 F-77
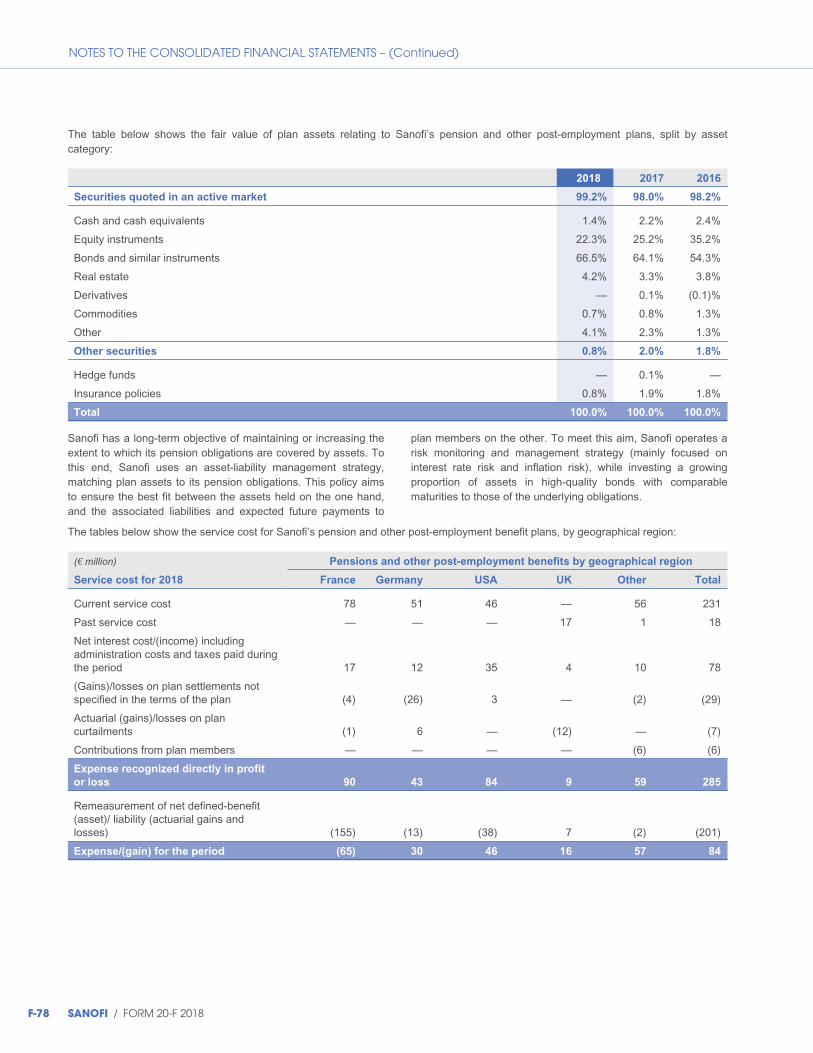
NOTES TO THE CONSOLIDATED FINANCIAL STATEMENTS – (Continued)
The table below shows the fair value of plan assets relating to Sanofi’s pension and other post-employment plans, split by assetcategory:
2018 2017 2016
Securities quoted in an active market 99.2% 98.0% 98.2%
Cash and cash equivalents 1.4% 2.2% 2.4%
Equity instruments 22.3% 25.2% 35.2%
Bonds and similar instruments 66.5% 64.1% 54.3%
Real estate 4.2% 3.3% 3.8%
Derivatives — 0.1% (0.1)%
Commodities 0.7% 0.8% 1.3%
Other 4.1% 2.3% 1.3%
Other securities 0.8% 2.0% 1.8%
Hedge funds — 0.1% —
Insurance policies 0.8% 1.9% 1.8%
Total 100.0% 100.0% 100.0%
Sanofi has a long-term objective of maintaining or increasing theextent to which its pension obligations are covered by assets. Tothis end, Sanofi uses an asset-liability management strategy,matching plan assets to its pension obligations. This policy aimsto ensure the best fit between the assets held on the one hand,and the associated liabilities and expected future payments to
plan members on the other. To meet this aim, Sanofi operates arisk monitoring and management strategy (mainly focused oninterest rate risk and inflation risk), while investing a growingproportion of assets in high-quality bonds with comparablematurities to those of the underlying obligations.
The tables below show the service cost for Sanofi’s pension and other post-employment benefit plans, by geographical region:
(€ million) Pensions and other post-employment benefits by geographical region
Service cost for 2018 France Germany USA UK Other Total
Current service cost 78 51 46 — 56 231
Past service cost — — — 17 1 18
Net interest cost/(income) includingadministration costs and taxes paid duringthe period 17 12 35 4 10 78
(Gains)/losses on plan settlements notspecified in the terms of the plan (4) (26) 3 — (2) (29)
Actuarial (gains)/losses on plancurtailments (1) 6 — (12) — (7)
Contributions from plan members — — — — (6) (6)
Expense recognized directly in profit
or loss 90 43 84 9 59 285
Remeasurement of net defined-benefit(asset)/ liability (actuarial gains andlosses) (155) (13) (38) 7 (2) (201)
Expense/(gain) for the period (65) 30 46 16 57 84
F-78 SANOFI / FORM 20-F 2018

NOTES TO THE CONSOLIDATED FINANCIAL STATEMENTS – (Continued)
(€ million) Pensions and other post-employment benefits by geographical region
Service cost for 2017 France Germany USA UK Other Total
Current service cost 74 50 53 — 56 233
Past service cost — — 36 — (3) 33
Net interest cost/(income) includingadministration costs and taxes paidduring the period 22 16 40 8 10 96
(Gains)/losses on plan settlements notspecified in the terms of the plan (17) — — — (3) (20)
Actuarial (gains)/losses on plancurtailments (6) 7 8 — (7) 2
Contributions from plan members — — — — (6) (6)
Expense recognized directly in profit
or loss 73 73 137 8 47 338
Remeasurement of net defined-benefit(asset)/ liability (actuarial gains andlosses) 35 (33) 77 (48) (1) 30
Expense/(gain) for the period 108 40 214 (40) 46 368
(€ million) Pensions and other post-employment benefits by geographical region
Service cost for 2016 France Germany USA UK Other Total
Current service cost 70 42 62 — 42 216
Past service cost — — — — (2) (2)
Net interest cost/(income) includingadministration costs and taxes paidduring the period 30 23 48 6 10 117
(Gains)/losses on plan settlements notspecified in the terms of the plan — — (2) — 4 2
Actuarial (gains)/losses on plancurtailments (51) 2 — — (3) (52)
Contributions from plan members — — — — (3) (3)
Expense recognized directly in profit
or loss 49 67 108 6 48 278
Remeasurement of net defined-benefit(asset)/liability (actuarial gains andlosses) 70 1 (161) 165 34 109
Expense/(gain) for the period 119 68 (53) 171 82 387
There were no significant events affecting Sanofi’s pension and other post-employment benefit plans during 2018.
SANOFI / FORM 20-F 2018 F-79
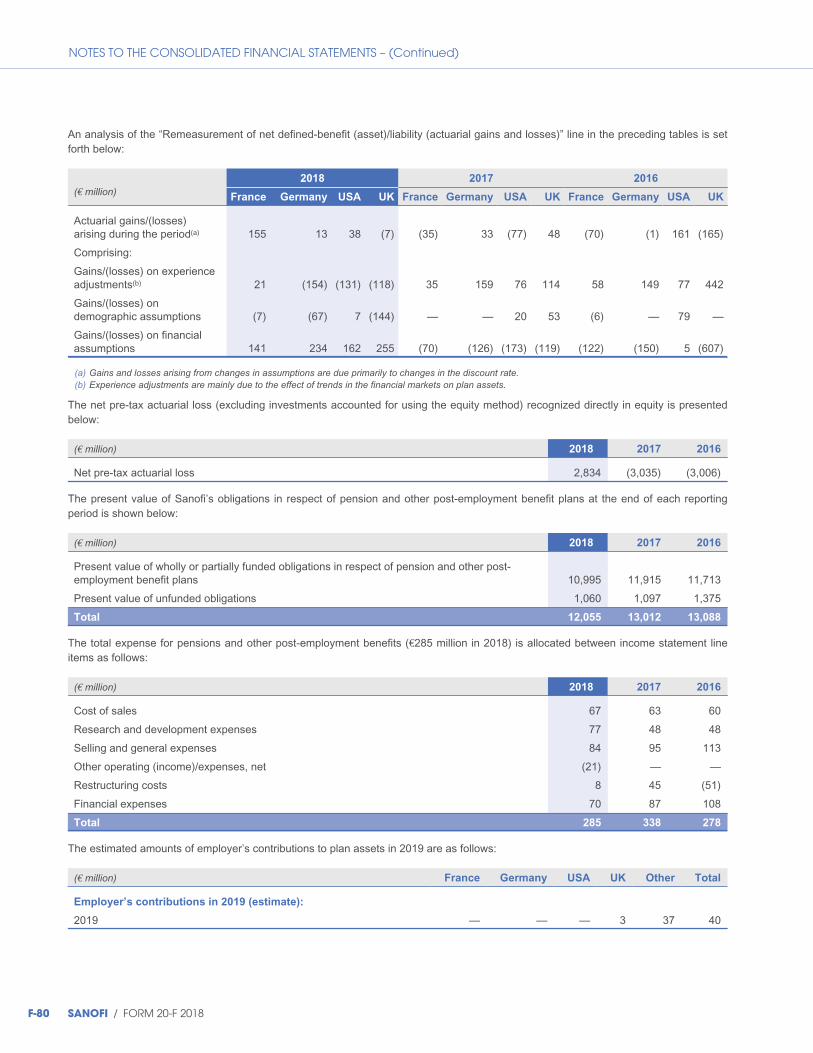
NOTES TO THE CONSOLIDATED FINANCIAL STATEMENTS – (Continued)
An analysis of the “Remeasurement of net defined-benefit (asset)/liability (actuarial gains and losses)” line in the preceding tables is setforth below:
2018 2017 2016
(€ million)France Germany USA UK France Germany USA UK France Germany USA UK
Actuarial gains/(losses)arising during the period(a) 155 13 38 (7) (35) 33 (77) 48 (70) (1) 161 (165)
Comprising:
Gains/(losses) on experienceadjustments(b) 21 (154) (131) (118) 35 159 76 114 58 149 77 442
Gains/(losses) ondemographic assumptions (7) (67) 7 (144) — — 20 53 (6) — 79 —
Gains/(losses) on financialassumptions 141 234 162 255 (70) (126) (173) (119) (122) (150) 5 (607)
(a) Gains and losses arising from changes in assumptions are due primarily to changes in the discount rate.(b) Experience adjustments are mainly due to the effect of trends in the financial markets on plan assets.
The net pre-tax actuarial loss (excluding investments accounted for using the equity method) recognized directly in equity is presentedbelow:
(€ million) 2018 2017 2016
Net pre-tax actuarial loss 2,834 (3,035) (3,006)
The present value of Sanofi’s obligations in respect of pension and other post-employment benefit plans at the end of each reportingperiod is shown below:
(€ million) 2018 2017 2016
Present value of wholly or partially funded obligations in respect of pension and other post-employment benefit plans 10,995 11,915 11,713
Present value of unfunded obligations 1,060 1,097 1,375
Total 12,055 13,012 13,088
The total expense for pensions and other post-employment benefits (€285 million in 2018) is allocated between income statement lineitems as follows:
(€ million) 2018 2017 2016
Cost of sales 67 63 60
Research and development expenses 77 48 48
Selling and general expenses 84 95 113
Other operating (income)/expenses, net (21) — —
Restructuring costs 8 45 (51)
Financial expenses 70 87 108
Total 285 338 278
The estimated amounts of employer’s contributions to plan assets in 2019 are as follows:
(€ million) France Germany USA UK Other Total
Employer’s contributions in 2019 (estimate):
2019 — — — 3 37 40
F-80 SANOFI / FORM 20-F 2018

NOTES TO THE CONSOLIDATED FINANCIAL STATEMENTS – (Continued)
The table below shows the expected timing of benefit payments under pension and other post-employment benefit plans for the next tenyears:
(€ million) France Germany USA UK Other Total
Estimated future benefit payments:
2019 92 189 149 117 57 604
2020 95 195 145 120 55 610
2021 116 200 148 124 56 644
2022 66 205 149 128 59 607
2023 84 210 144 132 65 635
2024 to 2028 550 1,063 732 726 363 3,434
The table below shows estimates as of December 31, 2018 for the timing of future payments in respect of unfunded pension and otherpost-employment benefit plans:
Payments due by period
(€ million) Total Less than 1 year 1 to 3 years 3 to 5 years More than 5 years
Estimated payments 1,060 62 115 118 765
D.19.2. Restructuring provisions
The table below shows movements in restructuring provisions classified in non-current and current liabilities:
(€ million) 2018 2017 2016
Balance, beginning of period 1,086 1,420 1,343
Of which:
Classified in non-current liabilities 514 744 762
Classified in current liabilities 572 676 581
Change in provisions recognized in profit or loss for the period 1,035 297 667
Provisions utilized (605) (616) (641)
Transfers 54 7 38
Unwinding of discount — 3 4
Currency translation differences 2 (25) 9
Balance, end of period 1,572 1,086 1,420
Of which:
Classified in non-current liabilities 632 514 744
Classified in current liabilities 940 572 676
◆
◆
◆
◆
Provisions for employee termination benefits as of December 31,2018 amounted to €895 million (versus €862 million as ofDecember 31, 2017 and €1,159 million as of December 31,2016).
The provisions apply mainly to France, and relate to various earlyretirement plans:
◆ plans with termination of employment contracts such ascessation of employment plans and end-of-career transitionplans;
◆ plans without termination of employment contracts, such as the“Forward” end-of-career paid leave plan implemented in 2016and a proposed new plan announced in December 2018 (anextension of the “Forward” plan), which are wholly voluntaryand include an end-of-career paid leave component.
The provision includes the present values of:
◆ gross annuities for self-funded plans;
SANOFI / FORM 20-F 2018 F-81
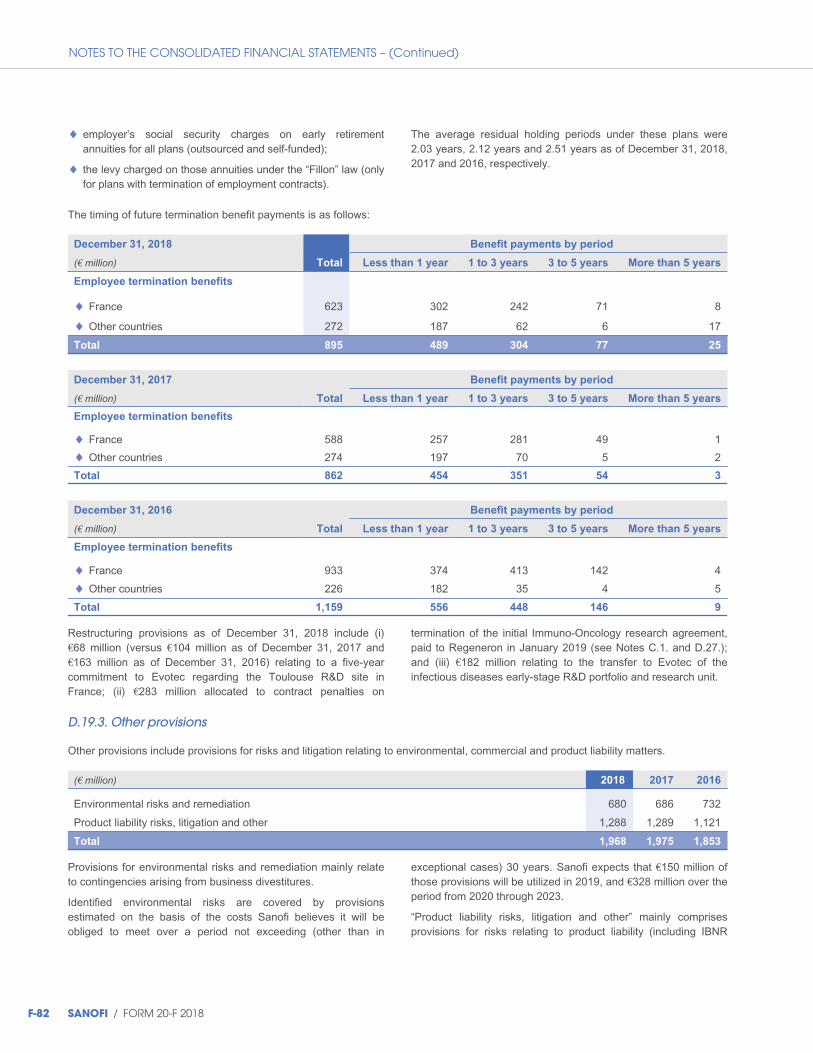
NOTES TO THE CONSOLIDATED FINANCIAL STATEMENTS – (Continued)
◆ employer’s social security charges on early retirementannuities for all plans (outsourced and self-funded);
◆ the levy charged on those annuities under the “Fillon” law (onlyfor plans with termination of employment contracts).
The average residual holding periods under these plans were2.03 years, 2.12 years and 2.51 years as of December 31, 2018,2017 and 2016, respectively.
The timing of future termination benefit payments is as follows:
December 31, 2018 Benefit payments by period
(€ million) Total Less than 1 year 1 to 3 years 3 to 5 years More than 5 years
Employee termination benefits
France 623 302 242 71 8
Other countries 272 187 62 6 17
Total 895 489 304 77 25
◆
◆
December 31, 2017 Benefit payments by period
(€ million) Total Less than 1 year 1 to 3 years 3 to 5 years More than 5 years
Employee termination benefits
France 588 257 281 49 1
Other countries 274 197 70 5 2
Total 862 454 351 54 3
◆
◆
December 31, 2016 Benefit payments by period
(€ million) Total Less than 1 year 1 to 3 years 3 to 5 years More than 5 years
Employee termination benefits
France 933 374 413 142 4
Other countries 226 182 35 4 5
Total 1,159 556 448 146 9
◆
◆
Restructuring provisions as of December 31, 2018 include (i)€68 million (versus €104 million as of December 31, 2017 and€163 million as of December 31, 2016) relating to a five-yearcommitment to Evotec regarding the Toulouse R&D site inFrance; (ii) €283 million allocated to contract penalties on
termination of the initial Immuno-Oncology research agreement,paid to Regeneron in January 2019 (see Notes C.1. and D.27.);and (iii) €182 million relating to the transfer to Evotec of theinfectious diseases early-stage R&D portfolio and research unit.
D.19.3. Other provisions
Other provisions include provisions for risks and litigation relating to environmental, commercial and product liability matters.
(€ million) 2018 2017 2016
Environmental risks and remediation 680 686 732
Product liability risks, litigation and other 1,288 1,289 1,121
Total 1,968 1,975 1,853
Provisions for environmental risks and remediation mainly relateto contingencies arising from business divestitures.
Identified environmental risks are covered by provisionsestimated on the basis of the costs Sanofi believes it will beobliged to meet over a period not exceeding (other than in
exceptional cases) 30 years. Sanofi expects that €150 million ofthose provisions will be utilized in 2019, and €328 million over theperiod from 2020 through 2023.
“Product liability risks, litigation and other” mainly comprisesprovisions for risks relating to product liability (including IBNR
F-82 SANOFI / FORM 20-F 2018
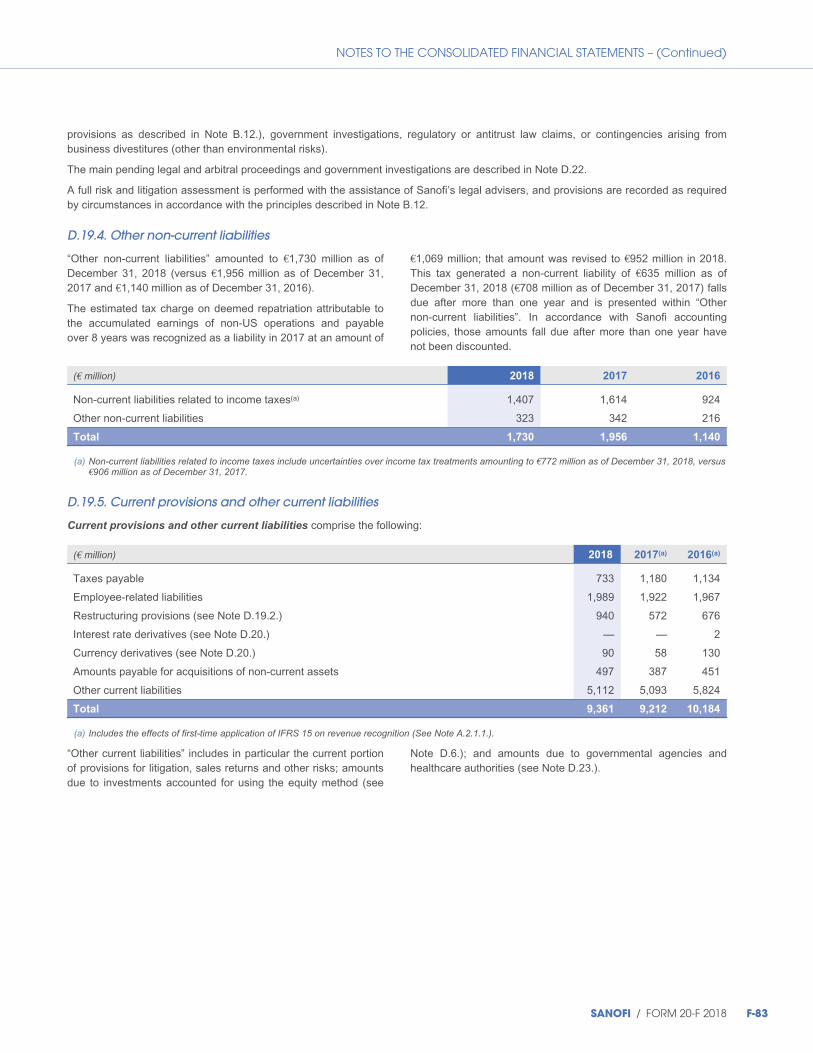
NOTES TO THE CONSOLIDATED FINANCIAL STATEMENTS – (Continued)
provisions as described in Note B.12.), government investigations, regulatory or antitrust law claims, or contingencies arising frombusiness divestitures (other than environmental risks).
The main pending legal and arbitral proceedings and government investigations are described in Note D.22.
A full risk and litigation assessment is performed with the assistance of Sanofi’s legal advisers, and provisions are recorded as requiredby circumstances in accordance with the principles described in Note B.12.
D.19.4. Other non-current liabilities
“Other non-current liabilities” amounted to €1,730 million as ofDecember 31, 2018 (versus €1,956 million as of December 31,2017 and €1,140 million as of December 31, 2016).
The estimated tax charge on deemed repatriation attributable tothe accumulated earnings of non-US operations and payableover 8 years was recognized as a liability in 2017 at an amount of
€1,069 million; that amount was revised to €952 million in 2018.This tax generated a non-current liability of €635 million as ofDecember 31, 2018 (€708 million as of December 31, 2017) fallsdue after more than one year and is presented within “Othernon-current liabilities”. In accordance with Sanofi accountingpolicies, those amounts fall due after more than one year havenot been discounted.
(€ million) 2018 2017 2016
Non-current liabilities related to income taxes(a)
Other non-current liabilities
1,407
323
1,614
342
924
216
Total 1,730 1,956 1,140
(a) Non-current liabilities related to income taxes include uncertainties over income tax treatments amounting to €772 million as of December 31, 2018, versus€906 million as of December 31, 2017.
D.19.5. Current provisions and other current liabilities
Current provisions and other current liabilities comprise the following:
(€ million) 2018 2017(a) 2016(a)
Taxes payable 733 1,180 1,134
Employee-related liabilities 1,989 1,922 1,967
Restructuring provisions (see Note D.19.2.) 940 572 676
Interest rate derivatives (see Note D.20.) — — 2
Currency derivatives (see Note D.20.) 90 58 130
Amounts payable for acquisitions of non-current assets 497 387 451
Other current liabilities 5,112 5,093 5,824
Total 9,361 9,212 10,184
(a) Includes the effects of first-time application of IFRS 15 on revenue recognition (See Note A.2.1.1.).
“Other current liabilities” includes in particular the current portionof provisions for litigation, sales returns and other risks; amountsdue to investments accounted for using the equity method (see
Note D.6.); and amounts due to governmental agencies andhealthcare authorities (see Note D.23.).
SANOFI / FORM 20-F 2018 F-83
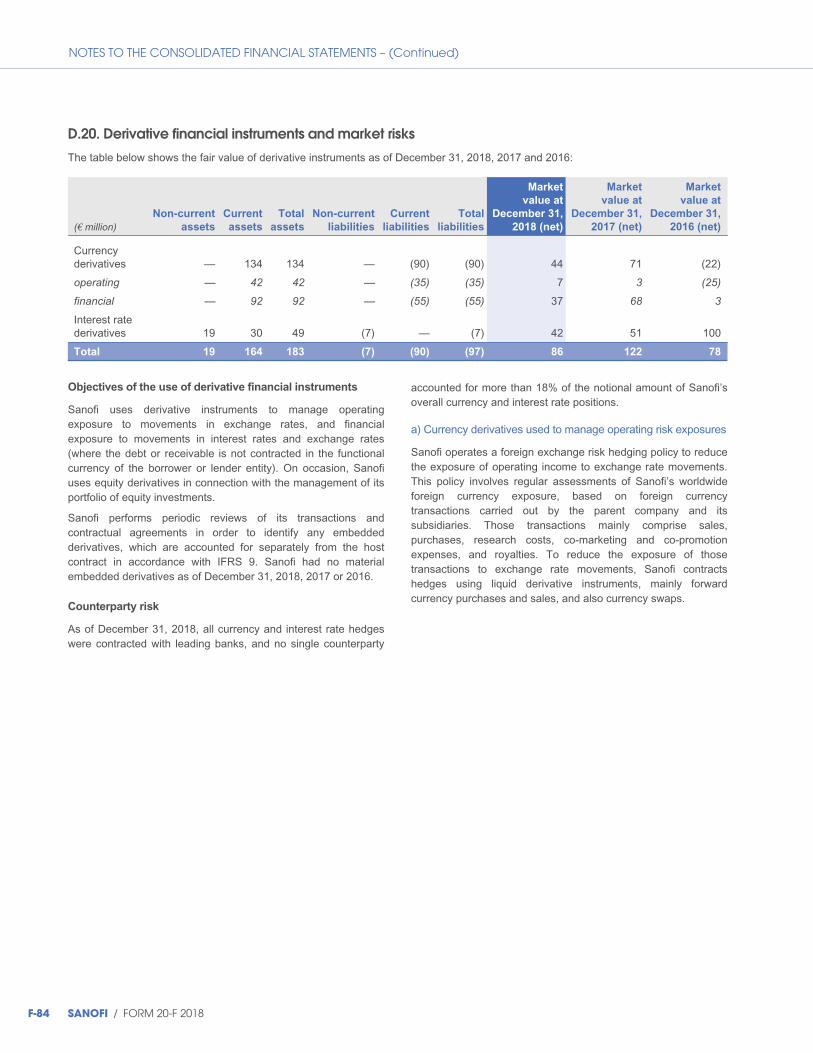
NOTES TO THE CONSOLIDATED FINANCIAL STATEMENTS – (Continued)
D.20. Derivative financial instruments and market risks
The table below shows the fair value of derivative instruments as of December 31, 2018, 2017 and 2016:
(€ million)Non-current
assets
Current
assets
Total
assets
Non-current
liabilities
Current
liabilities
Total
liabilities
Market
value at
December 31,
2018 (net)
Market
value at
December 31,
2017 (net)
Market
value at
December 31,
2016 (net)
Currencyderivatives — 134 134 — (90) (90) 44 71 (22)
operating — 42 42 — (35) (35) 7 3 (25)
financial — 92 92 — (55) (55) 37 68 3
Interest ratederivatives 19 30 49 (7) — (7) 42 51 100
Total 19 164 183 (7) (90) (97) 86 122 78
Objectives of the use of derivative financial instruments
Sanofi uses derivative instruments to manage operatingexposure to movements in exchange rates, and financialexposure to movements in interest rates and exchange rates(where the debt or receivable is not contracted in the functionalcurrency of the borrower or lender entity). On occasion, Sanofiuses equity derivatives in connection with the management of itsportfolio of equity investments.
Sanofi performs periodic reviews of its transactions andcontractual agreements in order to identify any embeddedderivatives, which are accounted for separately from the hostcontract in accordance with IFRS 9. Sanofi had no materialembedded derivatives as of December 31, 2018, 2017 or 2016.
Counterparty risk
As of December 31, 2018, all currency and interest rate hedgeswere contracted with leading banks, and no single counterparty
accounted for more than 18% of the notional amount of Sanofi’soverall currency and interest rate positions.
a) Currency derivatives used to manage operating risk exposures
Sanofi operates a foreign exchange risk hedging policy to reducethe exposure of operating income to exchange rate movements.This policy involves regular assessments of Sanofi’s worldwideforeign currency exposure, based on foreign currencytransactions carried out by the parent company and itssubsidiaries. Those transactions mainly comprise sales,purchases, research costs, co-marketing and co-promotionexpenses, and royalties. To reduce the exposure of thosetransactions to exchange rate movements, Sanofi contractshedges using liquid derivative instruments, mainly forwardcurrency purchases and sales, and also currency swaps.
F-84 SANOFI / FORM 20-F 2018
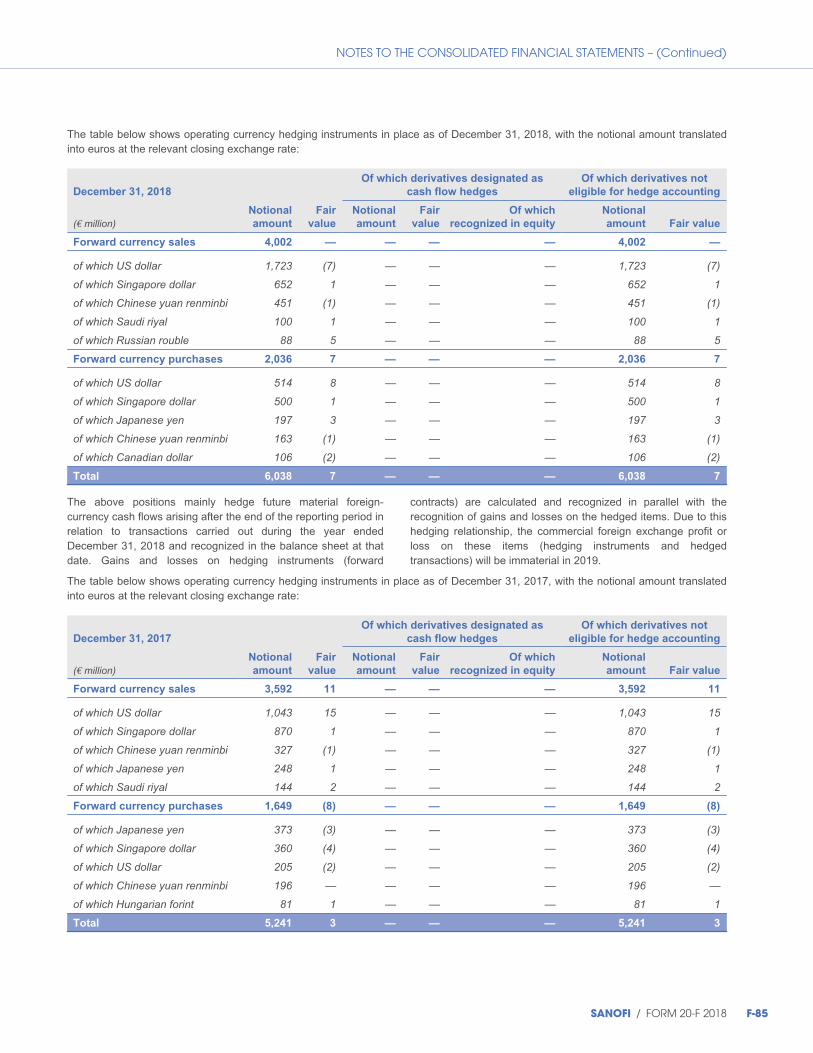
NOTES TO THE CONSOLIDATED FINANCIAL STATEMENTS – (Continued)
The table below shows operating currency hedging instruments in place as of December 31, 2018, with the notional amount translatedinto euros at the relevant closing exchange rate:
December 31, 2018
Of which derivatives designated as
cash flow hedges
Of which derivatives not
eligible for hedge accounting
(€ million)Notional
amount
Fair
value
Notional
amount
Fair
value
Of which
recognized in equity
Notional
amount Fair value
Forward currency sales 4,002 — — — — 4,002 —
of which US dollar 1,723 (7) — — — 1,723 (7)
of which Singapore dollar 652 1 — — — 652 1
of which Chinese yuan renminbi 451 (1) — — — 451 (1)
of which Saudi riyal 100 1 — — — 100 1
of which Russian rouble 88 5 — — — 88 5
Forward currency purchases 2,036 7 — — — 2,036 7
of which US dollar 514 8 — — — 514 8
of which Singapore dollar 500 1 — — — 500 1
of which Japanese yen 197 3 — — — 197 3
of which Chinese yuan renminbi 163 (1) — — — 163 (1)
of which Canadian dollar 106 (2) — — — 106 (2)
Total 6,038 7 — — — 6,038 7
The above positions mainly hedge future material foreign-currency cash flows arising after the end of the reporting period inrelation to transactions carried out during the year endedDecember 31, 2018 and recognized in the balance sheet at thatdate. Gains and losses on hedging instruments (forward
contracts) are calculated and recognized in parallel with therecognition of gains and losses on the hedged items. Due to thishedging relationship, the commercial foreign exchange profit orloss on these items (hedging instruments and hedgedtransactions) will be immaterial in 2019.
The table below shows operating currency hedging instruments in place as of December 31, 2017, with the notional amount translatedinto euros at the relevant closing exchange rate:
December 31, 2017
Of which derivatives designated as
cash flow hedges
Of which derivatives not
eligible for hedge accounting
(€ million)Notional
amount
Fair
value
Notional
amount
Fair
value
Of which
recognized in equity
Notional
amount Fair value
Forward currency sales 3,592 11 — — — 3,592 11
of which US dollar 1,043 15 — — — 1,043 15
of which Singapore dollar 870 1 — — — 870 1
of which Chinese yuan renminbi 327 (1) — — — 327 (1)
of which Japanese yen 248 1 — — — 248 1
of which Saudi riyal 144 2 — — — 144 2
Forward currency purchases 1,649 (8) — — — 1,649 (8)
of which Japanese yen 373 (3) — — — 373 (3)
of which Singapore dollar 360 (4) — — — 360 (4)
of which US dollar 205 (2) — — — 205 (2)
of which Chinese yuan renminbi 196 — — — — 196 —
of which Hungarian forint 81 1 — — — 81 1
Total 5,241 3 — — — 5,241 3
SANOFI / FORM 20-F 2018 F-85
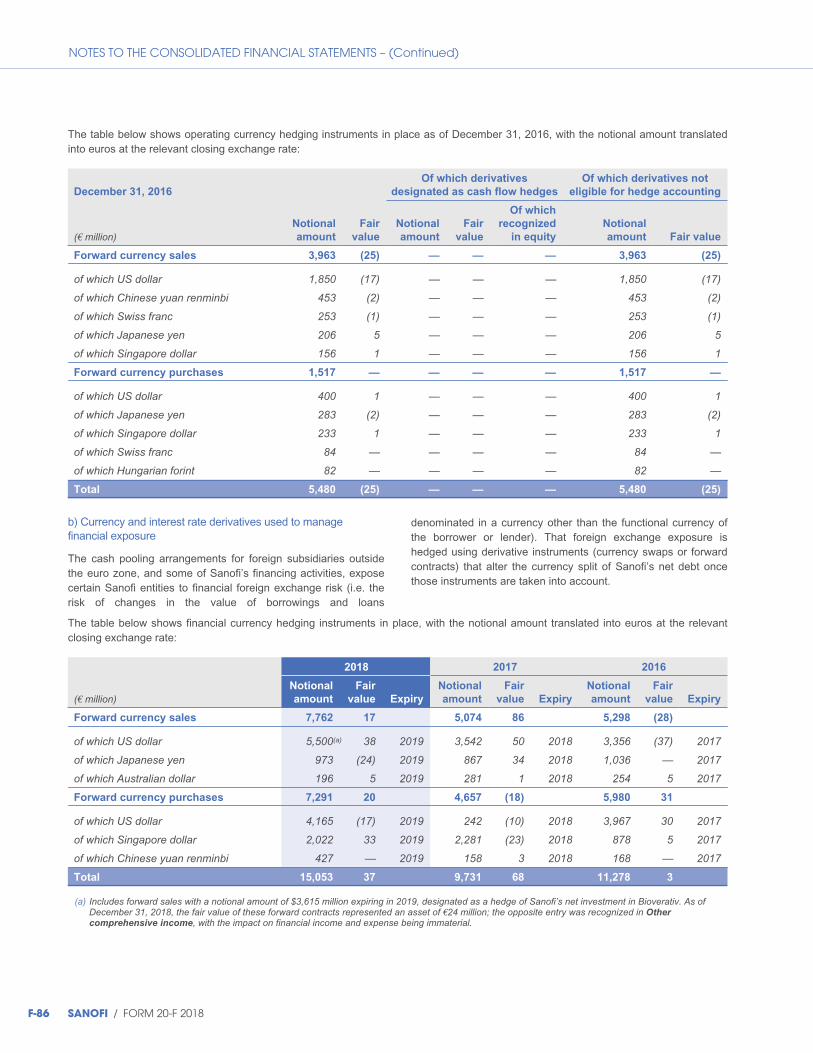
NOTES TO THE CONSOLIDATED FINANCIAL STATEMENTS – (Continued)
The table below shows operating currency hedging instruments in place as of December 31, 2016, with the notional amount translatedinto euros at the relevant closing exchange rate:
December 31, 2016
Of which derivatives
designated as cash flow hedges
Of which derivatives not
eligible for hedge accounting
(€ million)Notional
amount
Fair
value
Notional
amount
Fair
value
Of which
recognized
in equity
Notional
amount Fair value
Forward currency sales 3,963 (25) — — — 3,963 (25)
of which US dollar 1,850 (17) — — — 1,850 (17)
of which Chinese yuan renminbi 453 (2) — — — 453 (2)
of which Swiss franc 253 (1) — — — 253 (1)
of which Japanese yen 206 5 — — — 206 5
of which Singapore dollar 156 1 — — — 156 1
Forward currency purchases 1,517 — — — — 1,517 —
of which US dollar 400 1 — — — 400 1
of which Japanese yen 283 (2) — — — 283 (2)
of which Singapore dollar 233 1 — — — 233 1
of which Swiss franc 84 — — — — 84 —
of which Hungarian forint 82 — — — — 82 —
Total 5,480 (25) — — — 5,480 (25)
b) Currency and interest rate derivatives used to managefinancial exposure
The cash pooling arrangements for foreign subsidiaries outsidethe euro zone, and some of Sanofi’s financing activities, exposecertain Sanofi entities to financial foreign exchange risk (i.e. therisk of changes in the value of borrowings and loans
denominated in a currency other than the functional currency ofthe borrower or lender). That foreign exchange exposure ishedged using derivative instruments (currency swaps or forwardcontracts) that alter the currency split of Sanofi’s net debt oncethose instruments are taken into account.
The table below shows financial currency hedging instruments in place, with the notional amount translated into euros at the relevantclosing exchange rate:
2018 2017 2016
(€ million)Notional
amount
Fair
value Expiry
Notional
amount
Fair
value Expiry
Notional
amount
Fair
value Expiry
Forward currency sales 7,762 17 5,074 86 5,298 (28)
of which US dollar 5,500(a) 38 2019 3,542 50 2018 3,356 (37) 2017
of which Japanese yen 973 (24) 2019 867 34 2018 1,036 — 2017
of which Australian dollar 196 5 2019 281 1 2018 254 5 2017
Forward currency purchases 7,291 20 4,657 (18) 5,980 31
of which US dollar 4,165 (17) 2019 242 (10) 2018 3,967 30 2017
of which Singapore dollar 2,022 33 2019 2,281 (23) 2018 878 5 2017
of which Chinese yuan renminbi 427 — 2019 158 3 2018 168 — 2017
Total 15,053 37 9,731 68 11,278 3
(a) Includes forward sales with a notional amount of $3,615 million expiring in 2019, designated as a hedge of Sanofi’s net investment in Bioverativ. As ofDecember 31, 2018, the fair value of these forward contracts represented an asset of €24 million; the opposite entry was recognized in Othercomprehensive income, with the impact on financial income and expense being immaterial.
F-86 SANOFI / FORM 20-F 2018
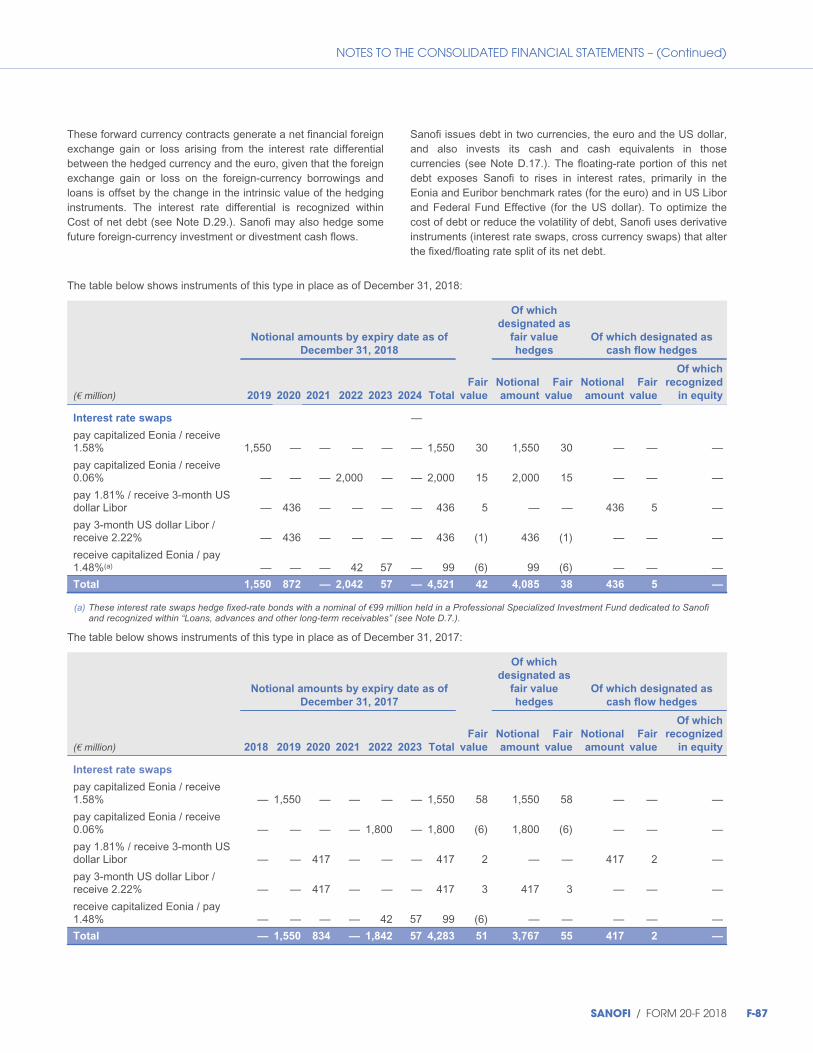
NOTES TO THE CONSOLIDATED FINANCIAL STATEMENTS – (Continued)
These forward currency contracts generate a net financial foreignexchange gain or loss arising from the interest rate differentialbetween the hedged currency and the euro, given that the foreignexchange gain or loss on the foreign-currency borrowings andloans is offset by the change in the intrinsic value of the hedginginstruments. The interest rate differential is recognized withinCost of net debt (see Note D.29.). Sanofi may also hedge somefuture foreign-currency investment or divestment cash flows.
Sanofi issues debt in two currencies, the euro and the US dollar,and also invests its cash and cash equivalents in thosecurrencies (see Note D.17.). The floating-rate portion of this netdebt exposes Sanofi to rises in interest rates, primarily in theEonia and Euribor benchmark rates (for the euro) and in US Liborand Federal Fund Effective (for the US dollar). To optimize thecost of debt or reduce the volatility of debt, Sanofi uses derivativeinstruments (interest rate swaps, cross currency swaps) that alterthe fixed/floating rate split of its net debt.
The table below shows instruments of this type in place as of December 31, 2018:
Notional amounts by expiry date as of
December 31, 2018
Of which
designated as
fair value
hedges
Of which designated as
cash flow hedges
(€ million) 2019 2020 2021 2022 2023 2024 Total
Fair
value
Notional
amount
Fair
value
Notional
amount
Fair
value
Of which
recognized
in equity
Interest rate swaps —
pay capitalized Eonia / receive1.58% 1,550 — — — — — 1,550 30 1,550 30 — — —
pay capitalized Eonia / receive0.06% — — — 2,000 — — 2,000 15 2,000 15 — — —
pay 1.81% / receive 3-month USdollar Libor — 436 — — — — 436 5 — — 436 5 —
pay 3-month US dollar Libor /receive 2.22% — 436 — — — — 436 (1) 436 (1) — — —
receive capitalized Eonia / pay1.48%(a) — — — 42 57 — 99 (6) 99 (6) — — —
Total 1,550 872 — 2,042 57 — 4,521 42 4,085 38 436 5 —
(a) These interest rate swaps hedge fixed-rate bonds with a nominal of €99 million held in a Professional Specialized Investment Fund dedicated to Sanofiand recognized within “Loans, advances and other long-term receivables” (see Note D.7.).
The table below shows instruments of this type in place as of December 31, 2017:
Notional amounts by expiry date as of
December 31, 2017
Of which
designated as
fair value
hedges
Of which designated as
cash flow hedges
(€ million) 2018 2019 2020 2021 2022 2023 Total
Fair
value
Notional
amount
Fair
value
Notional
amount
Fair
value
Of which
recognized
in equity
Interest rate swaps
pay capitalized Eonia / receive1.58% — 1,550 — — — — 1,550 58 1,550 58 — — —
pay capitalized Eonia / receive0.06% — — — — 1,800 — 1,800 (6) 1,800 (6) — — —
pay 1.81% / receive 3-month USdollar Libor — — 417 — — — 417 2 — — 417 2 —
pay 3-month US dollar Libor /receive 2.22% — — 417 — — — 417 3 417 3 — — —
receive capitalized Eonia / pay1.48% — — — — 42 57 99 (6) — — — — —
Total — 1,550 834 — 1,842 57 4,283 51 3,767 55 417 2 —
SANOFI / FORM 20-F 2018 F-87

NOTES TO THE CONSOLIDATED FINANCIAL STATEMENTS – (Continued)
The table below shows instruments of this type in place as of December 31, 2016:
Notional amounts by expiry date as of
December 31, 2016
Of which
designated as
fair value
hedges
Of which designated as
cash flow hedges
(€ million) 2017 2018 2019 2020 2021 2022 Total
Fair
value
Notional
amount
Fair
value
Notional
amount
Fair
value
Of which
recognized
in equity
Interest rate swaps
pay capitalized Eonia / receive1.58% — — 1,550 — — — 1,550 88 1,550 88 — — —
pay 3-month Euribor / receive1.15% 428 — — — — — 428 3 428 3 — — —
pay 3-month US dollar Libor /receive 2.22% — — — 475 — — 475 10 475 10 — — —
pay 1.22% / receive 3-month &6-month US dollar Libor 475 — — — — — 475 (2) — — 475 (2) —
pay capitalized Eonia / receive-0.01% — — — — — 300 300 1 300 1 — — —
Total 903 — 1,550 475 — 300 3,228 100 2,753 102 475 (2) —
c) Actual or potential effects of netting arrangements
The table below is prepared in accordance with the accounting policies described in Note B.8.3.:
(€ million)
2018 2017 2016
Derivative
financial
assets
Derivative
financial
liabilities
Derivative
financial
assets
Derivative
financial
liabilities
Derivative
financial
assets
Derivative
financial
liabilities
Gross carrying amounts before offset (a) 183 (97) 196 (74) 210 (132)
Gross amounts offset (in accordance withIAS 32) (b) — — — — — —
Net amounts as reported in the balance
sheet (a) – (b) = (c) 183 (97) 196 (74) 210 (132)
Effects of other netting arrangements (notfulfilling the IAS 32 criteria for offsetting) (d) — —
Financial instruments (81) 81 (67) 67 (97) 97
Fair value of financial collateral N/A N/A N/A N/A N/A N/A
Net exposure (c) + (d) 102 (16) 129 (7) 113 (35)
F-88 SANOFI / FORM 20-F 2018
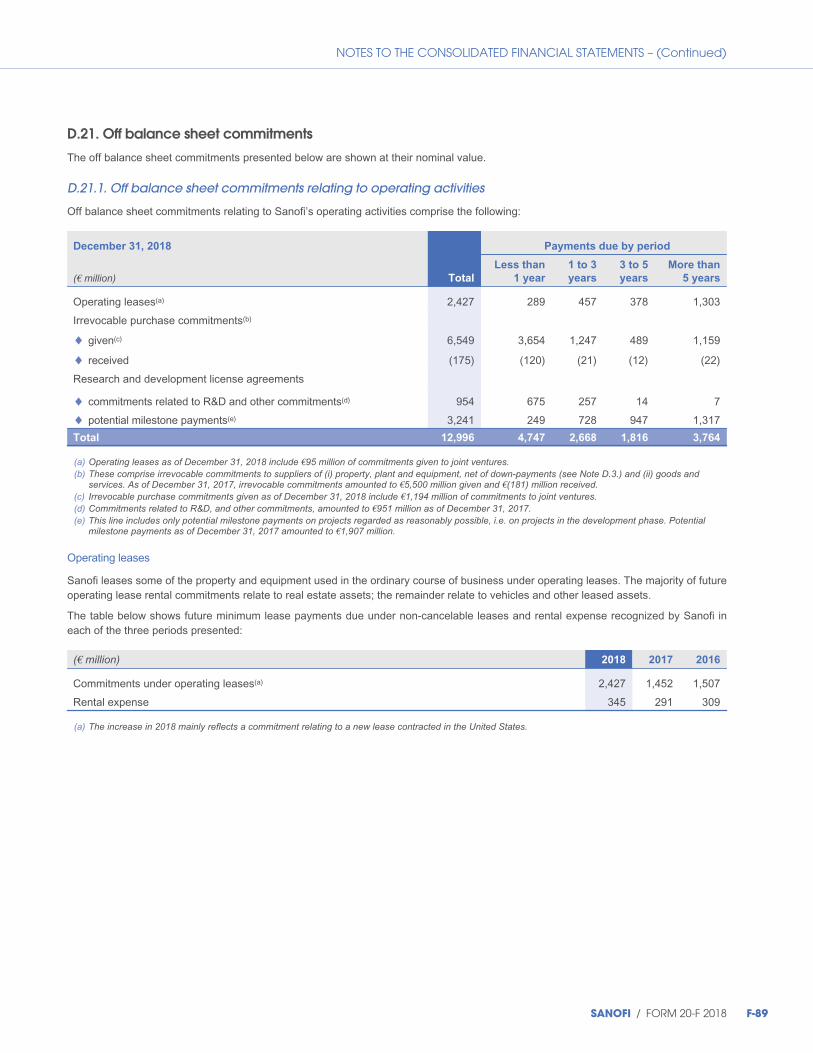
NOTES TO THE CONSOLIDATED FINANCIAL STATEMENTS – (Continued)
D.21. Off balance sheet commitments
The off balance sheet commitments presented below are shown at their nominal value.
D.21.1. Off balance sheet commitments relating to operating activities
Off balance sheet commitments relating to Sanofi’s operating activities comprise the following:
December 31, 2018 Payments due by period
(€ million) Total
Less than
1 year
1 to 3
years
3 to 5
years
More than
5 years
Operating leases(a) 2,427 289 457 378 1,303
Irrevocable purchase commitments(b)
given(c) 6,549 3,654 1,247 489 1,159
received (175) (120) (21) (12) (22)
Research and development license agreements
commitments related to R&D and other commitments(d) 954 675 257 14 7
potential milestone payments(e) 3,241 249 728 947 1,317
Total 12,996 4,747 2,668 1,816 3,764
◆
◆
◆
◆
(a) Operating leases as of December 31, 2018 include €95 million of commitments given to joint ventures.(b) These comprise irrevocable commitments to suppliers of (i) property, plant and equipment, net of down-payments (see Note D.3.) and (ii) goods and
services. As of December 31, 2017, irrevocable commitments amounted to €5,500 million given and €(181) million received.(c) Irrevocable purchase commitments given as of December 31, 2018 include €1,194 million of commitments to joint ventures.(d) Commitments related to R&D, and other commitments, amounted to €951 million as of December 31, 2017.(e) This line includes only potential milestone payments on projects regarded as reasonably possible, i.e. on projects in the development phase. Potential
milestone payments as of December 31, 2017 amounted to €1,907 million.
Operating leases
Sanofi leases some of the property and equipment used in the ordinary course of business under operating leases. The majority of futureoperating lease rental commitments relate to real estate assets; the remainder relate to vehicles and other leased assets.
The table below shows future minimum lease payments due under non-cancelable leases and rental expense recognized by Sanofi ineach of the three periods presented:
(€ million) 2018 2017 2016
Commitments under operating leases(a) 2,427 1,452 1,507
Rental expense 345 291 309
(a) The increase in 2018 mainly reflects a commitment relating to a new lease contracted in the United States.
SANOFI / FORM 20-F 2018 F-89
NOTES TO THE CONSOLIDATED FINANCIAL STATEMENTS – (Continued)
Research and development license agreements
In pursuance of its strategy, Sanofi may acquire technologies andrights to products. Such acquisitions may be made in variouscontractual forms: acquisitions of shares, loans, licenseagreements, joint development, and co-marketing. Thesearrangements generally involve upfront payments on signature ofthe agreement, development milestone payments, and royalties.Some of these complex agreements include undertakings to fundresearch programs in future years and payments contingent uponachieving specified development milestones, the granting ofapprovals or licenses, or the attainment of sales targets once aproduct is commercialized.
The “Research and development license agreements” linecomprises future service commitments to fund research anddevelopment or technology, and potential milestone paymentsregarded as reasonably possible (i.e. all potential milestonepayments relating to projects in the development phase, forwhich the future financial consequences are known or probableand for which there is a sufficiently reliable estimate). It excludescommitments relating to projects in the research phase(€6.8 billion in 2018, €7.2 billion in 2017, €6.2 billion in 2016), andpayments contingent upon the attainment of sales targets once aproduct is commercialized (€9.9 billion in 2018, €10.1 billion in2017, €8.2 billion in 2016).
Major agreements entered into during 2018 were as follows:
On January 7, 2018, Sanofi and Alnylam Pharmaceuticals, Inc.(“Alnylam”) announced a strategic restructuring of their alliance todevelop RNAi therapeutics for the treatment of rare geneticdiseases. Under the new agreement, Sanofi assumes fullresponsibility for the worldwide development andcommercialization of fitusiran, while Alnylam assumes suchresponsibility for patisiran and ALN-TTRsc02. Mutual royaltypayments will be made on worldwide sales of ALN-TTRsc02 andfitusiran, and on sales of patisiran outside of the United States,Canada and Western Europe.
On January 7, 2018, Celgene announced the acquisition ofImpact Biomedicines for $7 billion, comprising an upfrontpayment of $1.1 billion and variable consideration contingent onfuture performances totaling $5.9 billion. In 2016, Sanofi sold allits rights to fedratinib (which it held following the 2010 acquisitionof TargeGen Inc., an unquoted biotech company specializing inthe treatment of blood disorders), and in exchange received a10% equity interest in Impact Biomedicines. Under the terms ofthe offer, Sanofi received a payment of $118 million and isentitled to receive future variable payments not exceeding$776 million in aggregate, along with royalties on marketedproducts derived from Impact Biomedicines developmentprograms.
On January 8, 2018, Sanofi and Regeneron announced that theyhad (i) amended their collaboration agreement on thedevelopment and commercialization of human therapeuticantibodies; (ii) amended their Immuno-Oncology License andCollaboration Agreement on the development of cemiplimab
(REGN2810); and (iii) agreed a limited waiver and amendment ofthe Amended and Restated Investor Agreement pursuant to aletter agreement (the “2018 Letter Agreement”); (see Note C.1.).
On February 8, 2018, Sanofi signed a partnership agreementwith AnaBios Corporation to develop and commercialize newtreatments for irregular heartbeat, primarily atrial fibrillation.
On February 12, 2018, Sanofi Pasteur signed a partnershipagreement with SK Chemicals under which Sanofi acquiredexclusive development and commercialization rights in the UnitedStates and Europe for vaccines derived from the cell-basedtechnology developed by SK Chemicals.
On June 8, 2018, Sanofi signed a strategic partnershipagreement in oncology with Revolution Medicines, an innovativebiotech company that develops targeted-action small molecules.Under the agreement, the two companies will jointly develop theprincipal candidate derived from Revolution Medicines biologicalresearch: RMC 4630, an inhibitor of SHP2 (PTPN11), a cellularenzyme in the protein tyrosine phosphatase family that plays animportant role in multiple forms of cancer; the first clinical trials inhumans are expected this year.
On June 11, 2018, Sanofi Pasteur entered into a partnershipagreement with Translate Bio to develop messenger RNA(mRNA) vaccines derived from Translate Bio technology for fiveinfectious disease pathogens, with an option to extend toadditional pathogens. If that option is exercised, the total value ofthe transaction would rise to $805 million.
In addition, by acquiring all of the outstanding shares ofBioverativ on March 8, 2018 (see Note D.1.), Sanofi assumed thecommitments made by that company to various partners undercollaboration agreements, in particular:
◆ with Sangamo Therapeutics, Inc. to research, develop, andcommercialize therapeutics for hemoglobinopathies, inparticular beta thalassemia and sickle cell disease, based onSangamo’s gene therapy platform; and
◆ with Bicycle Therapeutics Ltd. to discover, develop andcommercialize innovative therapies for hemophilia and sicklecell disease.
Sanofi also assumed the commitments regarding contingentconsideration entered into by Bioverativ when the latter acquiredTrue North Therapeutics (see Note D.18.).
Finally, by acquiring all of the outstanding shares of Ablynx onJune 19, 2018 (see Note D.1.), Sanofi obtained variouscommitments in favor of that company, mainly in respect ofmilestone payments relating to development projects androyalties under collaboration agreements between Ablynxand various partners, in particular:
◆ with Boehringer Ingelheim in September 2007;
◆ with Merck KGaa in September 2008;
◆ with Merck & Co, Inc. in October 2012 and January 2014.
F-90 SANOFI / FORM 20-F 2018
NOTES TO THE CONSOLIDATED FINANCIAL STATEMENTS – (Continued)
On November 1, 2018, Sanofi signed a collaboration agreementwith Denali Therapeutics Inc. on the development of multiplemolecules with the potential to treat a range of neurological andsystemic inflammatory diseases. The two lead molecules areDNL747 in multiple sclerosis and amyotrophic lateral sclerosis,and DNL758 in systemic inflammatory diseases such asrheumatoid arthritis and psoriasis.
Other major agreements entered into by Sanofi in prior years aredescribed below:
◆ Immunext (2017): agreement to develop a novel antibody totreat auto-immune diseases such as multiple sclerosis andlupus. Under the agreement, Sanofi acquired an exclusiveworldwide license to INX-021, a monoclonal CD40L antibodycurrently in preclinical development. A second parallelagreement was signed to support clinical trials.
◆ MedImmune (a division of AstraZeneca) (2017): agreement todevelop and commercialize a monoclonal antibody(MEDI8897) for the prevention of Respiratory Syncytial Virus(RSV) associated illness in newborns and infants.
◆ ImmunoGen (2017): amendment to the license andcollaboration agreement signed in 2003. ImmunoGen grantedSanofi a fully paid and exclusive license to develop,manufacture and commercialize the full series of compoundsdeveloped by Sanofi using ImmunoGen technology.
◆ Thermalin, Inc. (2017): worldwide collaboration to discover anddevelop novel engineered insulin analogues. The collaborationbuilds on Thermalin’s pioneering science, which alters theinsulin molecule to achieve greater therapeutic performance.
◆ Principia Biopharma, Inc. (2017): license agreement to developPrincipia’s Bruton’s tyrosine kinase (BTK) inhibitor (PRN2246),in the treatment of multiple sclerosis and, potentially, othercentral nervous system diseases.
◆ Hanmi Pharmaceutical Co., Ltd. (2016): amendment to thelicense agreement originally signed on November 5, 2015.Under the terms of the amendment, Sanofi returned to Hanmithe rights for a weekly-administered insulin, and Hanmire-assumed at its own expense responsibility for developingthe weekly-administered efpeglenatide/insulin combination fora specified period of time, with other contractual terms relatingto the combination remaining unchanged. The financial termsof the efpeglenatide collaboration as regards development andregistration milestone payments, Hanmi’s entitlement toroyalties and Hanmi’s contribution to the development costs ofefpeglenatide were also amended. In return, Hanmi committedto pay €196 million to Sanofi, of which €98 million was paid in2018 and €98 million in 2017.
◆ JHL Biotech, Inc. (2016): collaboration to develop andcommercialize biological therapeutic treatments in China, withthe potential for international expansion. JHL retainsresponsibility for development, registration and production,while Sanofi is responsible for commercialization.
◆ DiCE Molecules (2016): five-year global collaboration todiscover potential new therapeutics for up to 12 targets thatencompass all disease areas of strategic interest to Sanofi.
◆ Innate Pharma (2016): collaboration and licensing agreementto apply Innate Pharma’s new proprietary technology to thedevelopment of innovative bispecific antibody formatsengaging natural killer (NK) cells to kill tumor cells through theactivating receptor NKp46.
◆ Lexicon Pharmaceuticals, Inc. (2015): collaboration and licenseagreement to develop and commercialize sotagliflozin, aninvestigational dual inhibitor of sodium-glucose cotransporters1 and 2 (SGLT-1 and SGLT-2).
◆ BioNTech A.G. (2015): exclusive collaboration and licenseagreement to discover and develop up to five cancerimmunotherapies.
◆ Evotec AG and Apeiron Biologics AG (2015): collaboration andlicense agreement to discover and develop first-in-class smallmolecule-based immuno-oncology therapies to treat solid andhematological cancers.
◆ Evotec International GmbH (2015): strategic researchcollaboration to develop beta cell-modulating diabetestreatments, which may reduce or eliminate the need for insulininjections.
◆ Regeneron Pharmaceuticals, Inc. (2015): collaboration agreementon the discovery, development and commercialization ofantibodies in the field of immuno-oncology; amendments to thatagreement were signed (see Note C.1.).
◆ Regeneron Pharmaceuticals, Inc. (2015): amendment to theSeptember 2003 collaboration agreement on the developmentand commercialization of Zaltrap® (aflibercept) (see Note C.1.).
◆ Lead Pharma (2015): research collaboration and licenseagreement for the discovery, development andcommercialization of small-molecule therapies directed against“ROR gamma t” nuclear hormone receptors to treat auto-immune diseases.
◆ Voyager Therapeutics (2015): collaboration agreement for thediscovery, development and commercialization of new genetherapies to treat serious disorders of the central nervoussystem.
◆ Immune Design (2014): license agreement for the use ofImmune Design’s GLAAS® research platform to developtherapeutic agents capable of treating an identified foodallergy.
◆ Eli Lilly and Company (2014): agreement to pursue regulatoryapproval for non-prescription Cialis® (tadalafil).
◆ Alnylam Pharmaceuticals Inc. (2014): extension of the strategicagreement to develop and commercialize treatments for raregenetic diseases. An amendment to that agreement wassigned on January 7, 2018.
SANOFI / FORM 20-F 2018 F-91
NOTES TO THE CONSOLIDATED FINANCIAL STATEMENTS – (Continued)
◆ UCB (2014): scientific and strategic collaboration for thediscovery and development of innovative anti-inflammatorysmall molecules, which have the potential to treat a wide rangeof immune-mediated diseases in areas such asgastroenterology and arthritis.
◆ Ascendis (2010): licensing and patent transfer agreement onTranscon Linker and Hydrogel Carrier technology. Theagreement enables Sanofi to develop, manufacture andcommercialize products combining this technology with activemolecules for the treatment of diabetes and related disorders.
◆ Regulus Therapeutics Inc. (2010): discovery, development andcommercialization of novel micro-RNA therapeutics in fibrosis.
◆ Exelixis, Inc. (2009): global license agreement for XL765.
Sanofi and its alliance partners have decided to terminate thefollowing agreements (the related commitments are no longerincluded in Sanofi’s off balance sheet disclosures as ofDecember 31, 2018):
◆ Sanofi and Avila Therapeutics Inc. (acquired by CelgeneCorporation in 2012) have decided to end their license andcollaboration agreement on research into targeted covalentdrugs for the treatment of cancers. The related commitmentsare no longer included in Sanofi’s off balance sheet disclosuresas of December 31, 2018.
Other agreements
Sanofi has entered into two agreements, with Royalty Pharma(December 2014) and NovaQuest (December 2015), which havesimilar characteristics in that the partners jointly bear a portion ofthe remaining development costs of the project on a quarterlybasis in return for royalties on future sales. These transactionsare co-investments, whereby the partner acquires an interest inthe jointly-developed product by providing funding towards thedevelopment program. Consequently, the amounts received bySanofi will be recorded as a reduction in development costs, tothe extent that the development costs incurred by Sanofi are
recognized in profit or loss in accordance with the policiesdescribed in Note B.4.1. The commitments under these twoagreements were altered by the following events that occurred in2017:
◆ The products being developed under the December 2014agreement with Royalty Pharma were launched in the UnitedStates and Europe, marking the end of the joint developmentprograms.
◆ Sanofi announced the discontinuation of development on theClostridium Difficile program on December 1, 2017, therebycancelling any future commitments under the December 2015joint development agreement with NovaQuest.
On February 27, 2017, Sanofi and Lonza announced a strategicpartnership in the form of a joint venture to build and operate alarge-scale mammalian cell culture facility for monoclonalantibody production in Visp, Switzerland. An initial investment ofapproximately €0.3 billion to finance construction of the facility willbe made 50/50 by the two partners. In addition, Sanofi could payLonza in the region of €0.8 billion over the next fifteen yearspartly as its share of operating expenses and the cost ofproducing future batches, and partly to reserve capacity in thenew facility.
In February 2014, pursuant to the “Pandemic InfluenzaPreparedness Framework for the sharing of influenza viruses andaccess to vaccines and other benefits” (still effective as ofDecember 31, 2018), Sanofi Pasteur and the World HealthOrganization (WHO) signed a bilateral “Standard MaterialTransfer Agreement” (SMTA 2). This agreement stipulates thatSanofi Pasteur will, during declared pandemic periods, (i) donate7.5% of its real-time production of pandemic vaccines againstany strain with potential to cause a pandemic, and (ii) reserve afurther 7.5% of such production on affordable terms. Theagreement cancels and replaces all preceding commitments todonate pandemic vaccines to the WHO.
No other agreement or amendment falling within this categorywas entered into during the year ended December 31, 2018.
D.21.2. Off balance sheet commitments relating to financing activities
Credit facilities
Undrawn credit facilities are as follows:
December 31, 2018 Expiry
(€ million) Total Less than 1 year 1 to 3 years 3 to 5 yearsMore than 5 years
General-purpose credit facilities 8,000 — 8,000 —
As of December 31, 2018, total credit facilities amounted to €8,000 million (versus €8,010 million as of December 31, 2017 and€8,000 million as of December 31, 2016, excluding the Animal Health business).
F-92 SANOFI / FORM 20-F 2018

NOTES TO THE CONSOLIDATED FINANCIAL STATEMENTS – (Continued)
Guarantees
The table below shows the amount of guarantees given and received:
(€ million) 2018 2017 2016
Guarantees given: 3,010 2,986 3,946
Guarantees provided to banks in connection with credit facilities 1,307 1,318 2,189
Other guarantees given 1,703 1,668 1,757
Guarantees received (190) (181) (211)
◆
◆
D.21.3. Off balance sheet commitments relating to Sanofi entities and business combinations
Funding commitments to associates and joint ventures are disclosed in Note D.6.
The maximum amount of contingent consideration relating to business combinations is disclosed in Note D.18.
D.22. Legal and arbitral proceedings
Sanofi and its affiliates are involved in litigation, arbitration andother legal proceedings. These proceedings typically are relatedto product liability claims, intellectual property rights (particularlyclaims against generic companies seeking to limit the patentprotection of Sanofi products), competition law and tradepractices, commercial claims, employment and wrongfuldischarge claims, tax assessment claims, waste disposal andpollution claims, and claims under warranties or indemnificationarrangements relating to business divestitures. Provisions relatedto legal and arbitral proceedings are recorded in accordance withthe principles described in Note B.12.
Most of the issues raised by these claims are highly complex andsubject to substantial uncertainties; therefore, the probability ofloss and an estimation of damages are difficult to ascertain.Contingent liabilities are cases for which either we are unable tomake a reasonable estimate of the expected financial effect thatwill result from ultimate resolution of the proceeding, or a cashoutflow is not probable. In either case, a brief description of thenature of the contingent liability is disclosed and, wherepracticable, an estimate of its financial effect, an indication of theuncertainties relating to the amount and timing of any outflow,and the possibility of any reimbursement are provided inapplication of paragraph 86 of IAS 37.
In the cases that have been settled or adjudicated, or wherequantifiable fines and penalties have been assessed, we haveindicated our losses or the amount of provision accrued that isthe estimate of the probable loss.
In a limited number of ongoing cases, while we are able to makea reasonable estimate of the expected loss or range of thepossible loss and have accrued a provision for such loss, webelieve that publication of this information on a case-by-casebasis or by class would seriously prejudice the Company’sposition in the ongoing legal proceedings or in any relatedsettlement discussions. Accordingly, in those cases, we havedisclosed information with respect to the nature of thecontingency but have not disclosed our estimate of the range ofpotential loss, in accordance with paragraph 92 of IAS 37.
These assessments can involve a series of complex judgmentsabout future events and can rely heavily on estimates andassumptions. Our assessments are based on estimates andassumptions that have been deemed reasonable bymanagement. We believe that the aggregate provisions recordedfor the above matters are adequate based upon currentlyavailable information. However, given the inherent uncertaintiesrelated to these cases and involved in estimating contingentliabilities, we could in the future incur judgments that could havea material adverse effect on our net income in any particularperiod.
Long term provisions are disclosed in Note D.19. They include:
◆ Provisions for product liability risks, litigation and other amountto €1,288 million in 2018. These provisions are mainly relatedto product liabilities, government investigations, competitionlaw, regulatory claims, warranties in connection with certaincontingent liabilities arising from business divestitures otherthan environmental matters and other claims.
◆ Provisions for environmental risks and remediation amount to€680 million in 2018, the majority of which are related tocontingencies that have arisen from business divestitures.
a) Products
Sanofi Pasteur Hepatitis B Vaccine Product Litigation
Since 1996, more than 180 lawsuits have been filed in variousFrench civil courts against Sanofi Pasteur and/or Sanofi PasteurMSD S.N.C., the former French subsidiary of Sanofi, and thelatter a joint venture company with Merck & Co., Inc. nowterminated, for which past ongoing litigation is now managed bythe originating party. In such lawsuits, the plaintiffs allege thatthey suffer from a variety of neurological disorders andautoimmune diseases, including multiple sclerosis and Guillain-Barré syndrome as a result of receiving the hepatitis B vaccine.
In January 2008, both the legal entity Sanofi Pasteur MSDS.N.C., and a corporate officer of this company, as well as aformer corporate officer of Sanofi Pasteur, were placed underinvestigation in an ongoing criminal inquiry in France relating to
SANOFI / FORM 20-F 2018 F-93
NOTES TO THE CONSOLIDATED FINANCIAL STATEMENTS – (Continued)
alleged side effects caused by the hepatitis B vaccine. In March2012, Sanofi Pasteur and its former pharmacist in charge (i.e. thedeputy Chief Executive Officer) were placed under an “advisedwitness” status. In March 2016, the investigating judges decidedto dismiss the proceedings. Several civil parties appealed againstthis decision. On June 4, 2018, the Prosecutor Generalrequested confirmation of the dismissal. The case has beenadjourned for deliberation on June 14, 2019.
In October 2017, the French Supreme Court (Cour de cassation)dismissed two appeals filed by the plaintiffs against two decisionsof the Appeal Court of Paris (Cour d’appel).
In January 2018, the Appeal Court of Bordeaux found a causallink between hepatitis B vaccine and multiple sclerosis. SanofiPasteur Europe appealed this decision before the FrenchSupreme Court (Cour de cassation).
Plavix® Product Litigation in the US
As of December 31, 2018, 20 Plavix® product liability actionsinvolving 91 total plaintiffs (67 of whom are ingesting plaintiffs)were currently pending, all venued in the Plavix® MultidistrictLitigation (“MDL”) in the U.S. District Court for the District of NewJersey. The Plavix® product litigation has predominantlyconcluded favorably for the Company.
Taxotere® Product Litigation in the US
As of December 31, 2018, there were approximately 11,000plaintiffs in courts across the country, with approximately 1,000 ofthose plaintiffs being spouses who have filed loss of consortiumclaims.
Suits have been filed against affiliates of Sanofi under US statelaw for personal injuries allegedly sustained in connection withthe use of Taxotere®. The actions are held in severaljurisdictions, including the federal and/or state courts ofLouisiana, New Jersey, California, Delaware and Illinois. TheEastern District of Louisiana Federal Court in New Orleans hasentered a scheduling order setting the first bellwether trial forMay 13, 2019. It is not possible, at this stage, to assess reliablythe outcome of these lawsuits or the potential financial impact onthe Company.
Taxotere® – Mississippi Attorney General Litigation in the US
In October 2018, the Attorney General for the State of Mississippifiled a civil action in Hinds County, Mississippi, Chancery Courtagainst various Sanofi Defendants related to Taxotere®. TheState asserts one cause of action based on the MississippiConsumer Protection Act (“MCPA”) and seeks a permanentinjunction prohibiting Defendants’ conduct and civil penalties ofup to $10,000 for each violation. In December 2018, Sanofiremoved the matter to the U.S. District Court for the SouthernDistrict of Mississippi. It is not possible, at this stage, to assessreliably the outcome of this lawsuit or the potential financialimpact on the Company.
Depakine® Product Litigation in France
As of December 31, 2018, 66 individual claims, involvingapproximately 113 claimants, and a class action based on 14claims have been filed against a French affiliate of Sanofi seekingindemnification under French law for personal injuries allegedlysustained by children in connection with the use of sodiumvalproate by their mothers during pregnancy to treat theirepilepsy (Depakine®) or bipolar disorder condition (Depakote®).These actions are held in several jurisdictions in France.
Five lawsuits are being ruled on the merits. In May 2018, theFrench affiliate filed a motion to the French Supreme Court toreverse the decision rendered by the Court of Appeal of Orléans(France) against Sanofi in November 2017 ordering payment ofapproximately €2 million to the plaintiff and €1 million to theCPAM (Caisse Primaire d’Assurance Maladie). In July 2018, theFrench affiliate of Sanofi filed an action with the administrativetribunal seeking compensation from the French Ministry of Healthfor those damages paid under the above mentioned decision.
In another civil action before the Paris Civil Court brought againstSanofi, ONIAM (Office National d’Indemnisation des AccidentsMédicaux) and the healthcare professionals, in October 2018, theCourt of Appeal of Paris confirmed the dismissal of claimant’smotion on interim measures. First procedural hearings on themerits on the other three lawsuits have been scheduled for March2019.
In the class action lawsuit filed by the APESAC (Association desParents d’Enfants souffrant du Syndrome de l’Anti-Convulsivant)before the Paris Court, the judge denied claimant’s motion oninterim measures in November 2017. APESAC lodged an appealwhich was rejected by the Court of Appeal of Paris in October2018.
The French government has, through the 2017 Finance lawadopted on December 29, 2016, set up a public fund which ismeant to compensate loss or injury actually suffered in relation tothe prescription of sodium valproate and its derivatives. The fundentered into force on June 1, 2017. The French affiliate hasraised issue of conflict of interest of certain appointed experts,which led to those experts being either removed or replaced asper administrative decision. The indemnification committee of thepublic fund has started to issue final opinions addressed to theFrench affiliate as being held liable for the damages either in fullor in part along with the French State. The French affiliaterejected the committee’s opinions and has accordingly notoffered indemnification to the claimants who will receivecompensation from the public fund as provided by the regulationgoverning it.
An investigation is ongoing in relation to a criminal complaintagainst person unknown filed in May 2015.
It is not possible, at this stage, to assess reliably the outcome ofthese cases or the potential financial impact on the Company.
F-94 SANOFI / FORM 20-F 2018
NOTES TO THE CONSOLIDATED FINANCIAL STATEMENTS – (Continued)
b) Patents
Ramipril Canada Patent Litigation
Sanofi has been involved in a number of legal proceedingsinvolving companies which market generic Altace® (ramipril) inCanada. In 2004, Sanofi unsuccessfully brought Notice ofCompliance proceedings (NOC proceedings) at the end of whicheight manufacturers obtained marketing authorizations from theCanadian Minister of Health for generic versions of ramipril inCanada. Following the marketing of these products, Sanofi filedpatent infringement actions against all those companies and onJune 29, 2009, the Federal Court of Canada ruled that the patentasserted by Sanofi was invalid. Sanofi’s leave to appeal theinvalidity judgment was denied in 2012.
Each of Teva, Apotex and Riva initiated Section 8 damagesclaims against Sanofi in the Federal Court of Canada, seekingcompensation for their inability to market a generic ramipril duringthe pendency of the NOC proceedings. Based on the ruling andguidelines issued from the Court, Sanofi and Teva reached anagreement in June 2012 on a confidential amount to satisfyTeva’s claim. In November 2012, the Court awarded ApotexCAD221 million.
Sanofi appealed both Section 8 rulings. In March 2014, theFederal Court of Appeal dismissed Sanofi’s appeal with respectto Teva and issued a decision in the appeal with respect toApotex increasing Apotex’s Section 8 award by an additionalCAD23 million. On April 20, 2015, the Supreme Court of Canadadismissed Sanofi’s appeal, thereby affirming the decision of theCourt of Appeal with respect to Apotex. The Riva Section 8 case,which had been stayed pending resolution of the Supreme CourtAppeal, was settled following court-sponsored mediation inSeptember 2015.
In June 2011, while the Section 8 damages action wasproceeding in Federal Court, Apotex commenced an action in theOntario Superior Court of Justice asserting damages under theOntario Statute of Monopolies, the UK Statute of Monopolies, andthe Trade-marks Act (the “Ontario Action”). The Ontario Actionwas stayed pending exhaustion of appeals in the Section 8damages action and, despite having received full compensationin the Section 8 action, was reinitiated by Apotex after theconclusion of the appeals.
In June 2017, the Canadian Supreme Court determined that thelegal principles applied in the ramipril invalidity decision wereunsound and in the fall of 2018 Sanofi sought to amend itsstatement of defense in the Ontario action to reflect thisdevelopment. On November 8, 2018, the pleadings amendmentwas allowed on appeal, after initially being denied by the motionsjudge.
On January 11, 2019, the motions judge denied Sanofi’s motionto seek summary judgment on the issue of applicability of theStatute of Monopolies in view of the allowed pleadingsamendment. The trial for this matter, originally expected for fall2019, will now likely be delayed significantly.
Praluent® (alirocumab)-related Amgen Patent Litigation in the US
Amgen filed four separate complaints against Sanofi andRegeneron in the United States District Court for the District ofDelaware (“District Court”) asserting patent infringement onOctober 17, October 28, November 11, and November 18, 2014relating to Sanofi and Regeneron’s Praluent® product. Togetherthese complaints allege that Praluent® infringes seven patents forantibodies targeting PCSK9 and seek injunctive relief andunspecified damages. These cases were consolidated into onecase in December 2014. Sanofi and Regeneron initially asserted,among other defenses, invalidity and non-infringement defenses.In January 2016, Sanofi and Regeneron informed the DistrictCourt that they stipulated to infringement. In March 2016, theDistrict Court granted Judgment as a Matter of Law (JMOL) ofobviousness in favor of Amgen and JMOL on an aspect of willfulinfringement in favor of Sanofi and Regeneron. In addition, inMarch 2016, a jury verdict upheld the validity of Amgen’sasserted claims of two patents. Further, in March 2016, Sanofi,Regeneron and Amgen resolved part of the proceedings relatedto certain past damages that is contingent on the outcome of ourappeal. In January 2017, the District Court denied Sanofi’s andRegeneron’s motion for a new trial and their motion for JMOL oflack of written description and enablement and granted aninjunction preventing the marketing, selling or manufacturing ofPraluent® in the US during the term of the two Amgen patentsstarting from February 21, 2017.
In early February 2017, the US Court of Appeals for the FederalCircuit (“Federal Circuit”) stayed (suspended) the permanentinjunction for Praluent® during Sanofi’s and Regeneron’s appealof the validity judgment and injunction ruling in the FederalCircuit. In October 2017, the Federal Circuit granted a new trialon certain validity issues (lack of written description andenablement), vacated (lifted) the District Court’s judgment andfound that the District Court improperly granted a permanentinjunction. Amgen filed a petition for rehearing by the full FederalCircuit in December 2017 which was denied.
The District Court has set a jury trial on invalidity to begin inFebruary 2019, with a jury trial on damages and possibly willfulinfringement immediately to follow, should Sanofi and Regeneronlose on validity. The District Court requested post-trial briefs onthe permanent injunction issue should Sanofi and Regeneronlose on validity, and may also request a permanent injunctionhearing in such a circumstance. The District Court also allowedeach side to file one summary judgment motion, both of whichwere denied in January 2019.
In July 2018, Amgen filed a petition for certiorari with the USSupreme Court asking the Supreme Court to review and overturnthe October 5, 2017 Federal Circuit decision, in particular thevalidity issues. The petition was denied in January 2019.
Praluent® (alirocumab)-related Amgen Patent Litigation in Europe
Amgen has filed three separate patent infringement lawsuitsagainst Sanofi and Regeneron in Europe based on Amgen’s
SANOFI / FORM 20-F 2018 F-95
NOTES TO THE CONSOLIDATED FINANCIAL STATEMENTS – (Continued)
European patent EP2215124. On July 25, 2016, Amgen filed alawsuit in the UK High Court of Justice, Chancery DivisionPatents Court against five Sanofi entities and Regeneron allegingthat alirocumab infringes its ‘124 (UK) patent, seeking injunctiverelief and unspecified damages; Sanofi has counterclaimedinvalidity. In February 2017, the UK action was stayed(suspended) on terms agreed by the parties.
Also on July 25, 2016, Amgen filed a lawsuit in Germany in theRegional Court, Düsseldorf against three Sanofi entities andRegeneron alleging that alirocumab infringes its ‘124 (DE) patent,seeking injunctive relief and unspecified damages. New oralproceedings are scheduled for April 2019.
On September 26, 2016, Amgen filed a lawsuit in France in theTribunal de Grande Instance of Paris against two Sanofi entitiesand Regeneron alleging that alirocumab infringes its ‘124 (FR)patent, seeking injunctive relief, €10 million in provisionaldamages and unspecified damages. Sanofi has counterclaimedinvalidity. The next procedural hearing is scheduled for July 2019.
Praluent® (alirocumab)-related EPO Patent Oppositions
The European Patent Office (EPO) granted Amgen’s EuropeanPatent EP2215124 on February 24, 2016. Also on February 24,2016, Sanofi filed an opposition with the EPO requesting therevocation of Amgen’s ’124 patent in its entirety for all contractingstates on the grounds that the subject-matter of the opposedpatent is not patentable. On November 24, 2016, Sanofi filed asecond opposition (in the name of three Sanofi affiliates namedas defendants in the German infringement action – see above),and Regeneron filed a separate opposition, requesting revocationof Amgen’s ’124 patent. In November 2018, the EPO OppositionDivision maintained Amgen’s patent claims in amended form.Subsequently, Sanofi and Regeneron each filed a notice ofappeal.
Praluent® (alirocumab)-related Amgen Opposition and PatentLitigation in Japan
In May 2017, Amgen filed a lawsuit in the Tokyo District Court(TDC), against Sanofi K.K. for patent infringement of two of itsJapanese Patents, JP5705288 and JP5906333. Amgen soughtinjunctive relief to prevent the infringing manufacture, use andsale of alirocumab, as well as destruction of Praluent® andalirocumab, and the cost of litigation. Sanofi had counterclaimedinvalidity and non-infringement.
The validity of these two Japanese patents was separatelychallenged by Sanofi in the Japanese Patent Office (JPO) byfiling invalidation actions in 2016. In August 2017, the JPOupheld the patents’ claims in amended form. In December 2017,Sanofi filed an appeal to the Intellectual Property High Court(IPHC) demanding revocation of the JPO decision. In December2018, the IPHC rendered its decision that Amgen’s patents arevalid, upholding the JPO’s earlier decision.
In January 2019, the TDC ruled in Amgen’s favor, finding itspatents valid and infringed. The TDC did not order provisionalenforcement of an injunction.
Dupixent® (dupilumab)-related Amgen Patent Opposition andRevocation in Europe
Immunex Corporation, an Amgen affiliate, is the registeredproprietor of European Patent EP2292665. The claims of thispatent relate to, among other things, human monoclonalantibodies that are capable of inhibiting IL-4 induced biologicalactivity and which compete with one of four reference antibodiesfor binding to a cell that expresses human IL-4R. In April 2016,Sanofi and Regeneron each filed an opposition in the EuropeanPatent Office (EPO) against EP2292665, seeking its revocationon the basis that, inter alia, the claims are invalid for prohibited“added matter”, lack of novelty, lack of inventive step and lack ofsufficient disclosure. In September 2016, Sanofi also filed a civilaction in the UK High Court (Chancery Division/Patents Court)seeking revocation of the UK designation of EP2292665 onsimilar grounds. In January 2017, at the joint request of Sanofiand Immunex, the UK High Court ordered that the revocationaction be stayed pending the final determination of the pendingEPO opposition proceedings.
The EPO rendered its decision in November 2017 and revokedthe patent in its entirety. The decision revoking the patent wasissued in January 2018. In early 2018, Immunex appealed thedecision of the EPO. A hearing date for the appeal has not beenscheduled yet.
In September 2017, Sanofi and Regeneron filed oppositions inthe EPO against Amgen’s European Patent EP2990420, which isa divisional of the EP2292665 Patent discussed above. Theissues in this opposition were similar to those made in theoppositions against EP2292665.
Dupixent® (dupilumab)-related Amgen Inter Partes Reviews andPatent Litigation in the US
In March and July 2017, Sanofi and Regeneron filed collectivelythree petitions for Inter Partes Review (IPR) for US PatentNo. 8,679,487 with the United States Patent and TrademarkOffice (USPTO). In these petitions, Sanofi and Regeneroncollectively attack the validity of all the claims of this patent. TheUSPTO declined to institute an IPR on the first petition butgranted Sanofi and Regeneron’s second and third petitions andinstituted Inter Partes Reviews of all challenged claims in the ‘487Patent. The USPTO held oral arguments for the two IPRs inNovember 2018.
In April 2017, Immunex filed a complaint in the U.S. District Courtfor the Central District of California against Sanofi andRegeneron asserting that the commercialization of Dupixentinfringes U.S. Patent No. 8,679,487. In response, among otherthings, Sanofi and Regeneron asserted affirmative defenses ofnon-infringement, invalidity, and unenforceability.
Plavix® Litigation (Commonwealth) in Australia
In August 2007, GenRX (a subsidiary of Apotex) obtainedregistration of a generic clopidogrel bisulfate product on theAustralian Register of Therapeutic Goods. At the same time,
F-96 SANOFI / FORM 20-F 2018
NOTES TO THE CONSOLIDATED FINANCIAL STATEMENTS – (Continued)
GenRX filed a patent invalidation action with the Federal Court ofAustralia, seeking revocation of Sanofi’s Australian enantiomerpatent claiming clopidogrel salts (a “nullity action”). In September2007, Sanofi obtained a preliminary injunction from the FederalCourt preventing commercial launch of this generic clopidogrelbisulfate product until judgment on the substantive issues ofpatent validity and infringement. In February 2008, SpiritPharmaceuticals Pty. Ltd. also filed a nullity action againstSanofi’s Australian enantiomer patent. The Spirit proceeding wasconsolidated with the Apotex proceeding.
In August 2008, the Australian Federal Court confirmed that theclaim in Sanofi’s Australian enantiomer patent directed toclopidogrel bisulfate (the salt form in Plavix®) was valid and thepatent infringed. On appeal, the Full Federal Court of Australiaheld in September 2009 that all claims in the patent are invalid.Sanofi’s appeal to the Australia High Court was denied in March2010. The security bond posted by Sanofi in connection with thepreliminary injunction obtained in 2007 was subsequentlyincreased from AUD40 million to AUD204 million (€25 million to€125 million as of December 31, 2018). Apotex sought damagesin the range of AUD20 million to AUD236 million (€12 million to€145 million as of December 31, 2018), plus interest for havingbeen subject to an injunction.
On April 8, 2013, the Australian Department of Health and Ageingfiled an application before the Federal Court of Australia seekingpayment of damages from Sanofi related to the Apotexpreliminary injunction of up to AUD449 million (€276 million as ofDecember 31, 2018), plus interest.
Sanofi and BMS settled the patent litigation with Apotex inNovember 2014. In light of the Apotex settlement, theCommonwealth has requested that the Court consider a set oflegal issues separate from trial that could simplify the trial. InDecember 2015, the Court held that the relevant statute does notpreclude the Commonwealth from seeking damages in casessuch as this. Sanofi and BMS have applied for special leave toappeal against this decision. Sanofi’s special appeal to the HighCourt on the issue of the invalidity of the patent was denied inNovember 2015.
In May 2016, Sanofi’s and BMS’s application for special leave toappeal to the High Court of Australia was denied. Consequently,the substantive claim on damages sought by the Commonwealthhas continued to trial. A decision is expected during the first halfof 2019.
c) Other litigation and arbitration
CVR Trustee Claim
In November 2015, American Stock Transfer & Trust CompanyLLC (“AST”), the Trustee of the CVR Agreement between ASTand Sanofi-Aventis, dated March 30, 2011, filed a complaintagainst Sanofi in the US District Court for the Southern District ofNew York, alleging that Sanofi breached the CVR Agreement andthe implied covenant of good faith and fair dealing, including byallegedly failing to use “Diligent Efforts,” as defined in the CVR
Agreement, with respect to the regulatory approval and sale ofLemtrada®.
On January 29, 2016, Sanofi moved to dismiss Counts II (breachof contract relating to the Product Sales Milestones) and III(breach of the implied covenant of good faith and fair dealing) ofthe complaint. In May 2016, AST submitted a notice ofresignation as Trustee. Before the resignation became effective,AST filed a Supplemental Complaint seeking the entry of adeclaratory judgment that it is entitled to, among other things,reimbursement for legal fees and expenses incurred by itsoutside counsel for the investigation and prosecution of theclaims in the case under the CVR Agreement. In June 2016, anew Trustee, UMB Bank, N.A. (“UMB”) was appointed. In July2016, UMB moved for partial summary judgment on itsdeclaratory judgment claim seeking, among other things, thereimbursement of legal fees and expenses incurred by its outsidecounsel for the investigation and prosecution of the claims in thecase. In September 2016, the Court issued an order denying (inpart) Sanofi’s motion to dismiss Count II of the complaint,granting Sanofi’s motion to dismiss Count III of the complaint inits entirety, and denying UMB’s motion for partial summaryjudgment relating to its request for the payment of the fees andexpenses incurred by its outside counsel. In October 2016, UMBappealed the portion of the order denying its motion for partialsummary judgment to the US Court of Appeals for the SecondCircuit. In December 2016, the US Court of Appeals for theSecond Circuit granted Sanofi’s motion to dismiss the appeal forlack of appellate jurisdiction.
In February 2017, the Trustee amended the complaint to assertbreach of contract claims with respect to its requests for booksand records, as well as its request for an audit. On March 24,2017, the Trustee sought leave to amend its complaint for asecond time to assert a breach of contract claim with respect tothe Production Milestone, which request was granted onAugust 23, 2017. Discovery is ongoing with respect to the claimsrelating to the FDA approval milestone, Product Sales Milestone#1 and the Production Milestone. On October 6, 2017, theTrustee filed a motion for summary judgment with respect to itsrequest for an audit pursuant to Section 7.6(a) of the CVRAgreement, such motion was ultimately denied. Expert discoveryis expected to end in July 2019.
d) Contingencies arising from certain Business Divestitures
Sanofi and its subsidiaries, Hoechst and Aventis Agriculture,divested a variety of mostly chemical, including agro-chemical,businesses as well as certain health product businesses. As aresult of these divestitures, the Company is subject to a numberof ongoing contractual and legal obligations regarding the state ofthe sold businesses, their assets, and their liabilities.
Aventis Behring Retained Liabilities
The divestment of Aventis Behring and related protein therapiesassets became effective on March 31, 2004. The purchase
SANOFI / FORM 20-F 2018 F-97
NOTES TO THE CONSOLIDATED FINANCIAL STATEMENTS – (Continued)
agreement contained customary representations and warrantiesrunning from Sanofi as seller to CSL Limited as purchaser. Sanofihas indemnification obligations that generally expired onMarch 31, 2006 (the second anniversary of the closing date).However, some indemnification obligations, having a longerduration, remain in effect. For example, indemnificationobligations relating to the due organization, capital stock andownership of Aventis Behring Companies ran through March 31,2014, and product liability indemnification runs through March 31,2019, subject to an extension for claims related to certain typesof product liability notified before such date. Furthermore, fortax-related issues, the indemnification obligation of Sanofi coversall taxable periods that end on or before the closing date andexpires thirty days after the expiration of the applicable statute oflimitations. In addition, the indemnification obligations relating tocertain specified liabilities, including HIV liability, surviveindefinitely.
Under the indemnification agreement, Sanofi is generallyobligated to indemnify CSL Limited, only to the extentindemnifiable, losses exceeding $10 million and up to amaximum aggregate amount of $300 million. For environmentalclaims, the indemnification due by Sanofi equals 90% of theindemnifiable losses. Product liability claims are generally treatedseparately, and the aggregate indemnification is capped at$500 million. Certain indemnification obligations, including thoserelated to HIV liability, as well as tax claims, are not capped inamount.
Aventis CropScience Retained Liabilities
The sale by Aventis Agriculture S.A. and Hoechst GmbH (bothlegacy companies of Sanofi) of their aggregate 76% participationin Aventis CropScience Holding (ACS) to Bayer and BayerCropScience AG (BCS), the wholly owned subsidiary of Bayerwhich holds the ACS shares, was effective on June 3, 2002. TheStock Purchase Agreement (SPA) dated October 2, 2001,contained customary representations and warranties with respectto the sold business, as well as a number of indemnifications, inparticular with respect to: environmental liabilities (therepresentations and warranties and the indemnification aresubject to a cap of €836 million, except for certain legalrepresentations and warranties and specific environmentalliabilities); taxes; certain legal proceedings; claims related toStarLink® corn; and certain pre-closing liabilities, in particular,product liability cases (which are subject to a cap of €418 millionwithin the above global cap of €836 million). There are variousperiods of limitation depending upon the nature or subject of theindemnification claim. Further, Bayer and BCS are subject to anumber of obligations regarding mitigation and cooperation.
Since December 2005, Aventis Agriculture and Hoechst GmbHhave concluded several settlement agreements to resolve asubstantial number of disputes with Bayer and BCS, including thetermination of arbitration proceedings initiated in August 2003 foran alleged breach of a financial statement-related representationcontained in the SPA, and numerous other warranty and
indemnification claims, including certain environmental andproduct liabilities claims. A number of other outstanding claimsremain unresolved.
LLRICE601 and LLRICE604 – Arbitration
On December 19, 2014, BCS initiated a claim for arbitrationagainst Aventis Agriculture S.A. and Hoechst GmbH seekingindemnification under various provisions of the SPA, with ademand for €787.5 million. Bayer is seeking indemnification fordamages allegedly suffered in several hundred individualcomplaints and lawsuits by rice growers, millers and distributorsarising in US state and federal courts against a number ofCropScience companies, formerly part of ACS before itsdivestiture, following the detection in 2006 of trace amounts ofgenetically-modified rice (the Liberty Link® Rice 601 and 604) insamples of commercial long grain rice. Bayer alleges that it hasincurred losses in excess of $1.2 billion in judgments, settlementsand litigation costs. The final claimed amount of €693 million plusinterest corresponds to the residual portion of the indemnificationavailable under the SPA.
Sanofi does not consider that these claims constituteindemnifiable losses under the SPA and has opposed Bayer’srequest for indemnification in an arbitration proceeding beforeDIS (German Arbitral Tribunal). The evidentiary hearing tookplace in May 2018 and the award is expected to be rendered nosooner than June 2019.
Aventis Animal Nutrition Retained Liabilities
Aventis Animal Nutrition S.A. and Aventis (both legacycompanies of Sanofi) signed an agreement for the sale toDrakkar Holdings S.A. of the Aventis Animal Nutrition businesseffective in April 2002. The sale agreement contained customaryrepresentations and warranties. Sanofi’s indemnificationobligations ran through April 2004, except for environmentalindemnification obligations (which ran through April 2012), taxindemnification obligations (which run through the expiration ofthe applicable statutory limitation period), and antitrustindemnification obligations (which extend indefinitely). Theindemnification undertakings are subject to an overall cap of€223 million, with a lower cap for certain environmental claims.Indemnification obligations for antitrust and tax claims are notcapped.
Celanese AG Retained Liabilities
The demerger of the specialty chemicals business from Hoechstto Celanese AG (now trading as “Celanese GmbH”) becameeffective on October 22, 1999. Under the demerger agreementbetween Hoechst and Celanese, Hoechst expressly excludedany representations and warranties regarding the shares andassets demerged to Celanese. Celanese subsequentlycontributed rights and obligations relating to environmentalliabilities resulting from the demerger agreement to a subsidiaryCCC Environmental Management and Solutions GmbH & Co. KG(“CCC”). The following obligations of Hoechst are ongoing:
F-98 SANOFI / FORM 20-F 2018

NOTES TO THE CONSOLIDATED FINANCIAL STATEMENTS – (Continued)
◆ While all obligations of Hoechst (i) resulting from public law or(ii) pursuant to current or future environmental laws or(iii) vis-à-vis third parties pursuant to private or public lawrelated to contamination (as defined) were transferred toCelanese under the demerger agreement in full, after thesubsequent contribution CCC can request indemnification fromHoechst for two thirds of any such cost incurred under theseobligations.
◆ To the extent Hoechst is liable to purchasers of certain of itsdivested businesses (as listed in the demerger agreement),CCC is liable to indemnify Hoechst, as far as environmentaldamages are concerned, for aggregate liabilities up to€250 million, liabilities exceeding such amount will be borne byHoechst alone up to €750 million, and amounts exceeding€750 million will be borne 2/3 by Hoechst and 1/3 by CCCwithout any further caps. Subsequent to the contribution ofrights and obligations relating to environmental liabilities byCelanese, Celanese was jointly liable with CCC until November2016. Thereafter, Celanese remains liable for knownenvironmental claims specified in 2013.
Rhodia Shareholder Litigation
In January 2004, two minority shareholders of Rhodia and theirrespective investment vehicles filed two claims before theCommercial Court of Paris (Tribunal de Commerce de Paris)against Aventis, to which Sanofi is successor in interest, togetherwith other defendants including former directors and statutoryauditors of Rhodia from the time of the alleged events. Theclaimants seek a judgment holding the defendants collectivelyliable for alleged management errors and for alleged publicationof misstatements between 1999 and 2002, and inter aliaregarding Rhodia’s acquisition of the companies Albright &Wilson and ChiRex. These shareholders seek a finding of jointand several liability for damages to be awarded to Rhodia in anamount of €925 million for alleged harm to it (a derivative action),as well as personal claims of €4.3 million and €125.4 million fortheir own alleged individual losses. Sanofi contests both thesubstance and the admissibility of these claims.
Sanofi is also aware of three criminal complaints filed in Franceby the same plaintiffs and of a criminal investigation order issuedby the Paris public prosecutor following the submission of thereport issued by the AMF regarding Rhodia’s financialcommunications. In 2006, the Commercial Court of Parisaccepted Sanofi’s and the other defendants’ motion to stay thecivil litigation pending the conclusion of the criminal proceedings.
In December 2016, the Court of Appeals of Paris dismissed theappeal lodged by the same plaintiffs against the order of theinvestigating judge dated October 2015, dismissing all criminalcharges in this case. The plaintiffs appealed the December 2016decision before the French Supreme Court (Cour de cassation).Following this decision, the plaintiffs may also petition the
Commercial Court of Paris and seek the reopening of thecommercial cases mentioned above on the basis that the criminalproceedings have now concluded.
Clariant Retained Liabilities – Specialty Chemicals Business
Hoechst conveyed its specialty chemicals business to ClariantAG (Clariant) pursuant to a 1997 agreement. Clariant hasundertaken to indemnify Hoechst for all costs incurred forenvironmental matters relating to purchased sites. However,certain indemnification obligations of Hoechst for environmentalmatters in favor of Clariant remain with Hoechst.
Hoechst must indemnify Clariant indefinitely (i) with respect tosites taken over by Clariant, for costs which relate toenvironmental pollutions attributable to certain activities ofHoechst or of third parties, (ii) for costs attributable to fourdefined waste deposit sites in Germany which are located outsidethe sites taken over by Clariant (to the extent exceeding anindexed amount of approximately €20.5 million), (iii) for costsfrom certain locally concentrated pollutions in the sites taken overby Clariant but not caused by specialty chemicals activities in thepast, and (iv) for 75% of the costs relating to a specific wastedeposit site in Frankfurt, Germany.
Infraserv Höchst Retained Liabilities
By the Asset Contribution Agreement dated December 19/20, 1996,as amended in 1997, Hoechst contributed all lands, buildings, andrelated assets of the Hoechst site at Frankfurt Höchst to InfraservGmbH & Co. Höchst KG. Infraserv Höchst undertook to indemnifyHoechst against environmental liabilities at the Höchst site and withrespect to certain landfills. As consideration for the indemnificationundertaking, Hoechst transferred to Infraserv Höchst approximately€57 million to fund reserves. In 1997, Hoechst also agreed it wouldreimburse current and future Infraserv Höchst environmentalexpenses up to €143 million. As a former operator of the land andas a former user of the landfills, Hoechst may ultimately be liable forcosts of remedial action in excess of this amount.
Boehringer Ingelheim (BI) Retained Liabilities
Following the closing in January 2017 of the swap of Sanofi’sAnimal Health business for BI’s Consumer Healthcare (CHC)business, both parties have issued claims against one another forbreaches of representations, payments for certain studies,withdrawal of products from particular markets, and claimsrelated to liabilities arising before Closing. The asset swap dealwas structured such that the Consumer Health sale and purchaseagreement and the Animal Health sale and purchase agreementare nearly identical and have mirroring indemnification provisions.Accordingly, both agreements contain escalation procedures tobe followed to resolve claims amicably in advance of formaldispute resolution. Sanofi is working to investigate the validity ofBI’s claims related to Animal Health and to pursue its claimspertaining to Consumer Health.
SANOFI / FORM 20-F 2018 F-99
NOTES TO THE CONSOLIDATED FINANCIAL STATEMENTS – (Continued)
D.23. Provisions for discounts, rebates and sales returns
Adjustments between gross sales and net sales, as described in Note B.14., are recognized either as provisions or as reductions inaccounts receivable, depending on their nature.
The table below shows movements in these items:
(€ million)
Government
and State
programs(a)
Managed care
and GPO
programs(b)
Chargeback
incentives
Rebates
and
discounts
Sales
returns
Other
deductions Total
Balance at January 1, 2016 2,173 672 349 944 480 5 4,623
Provision related to current periodsales 5,240 1,869 4,132 5,394 547 14 17,196
Net change in provision related toprior period sales (6) — (8) (20) 18 (1) (17)
Payments made (5,078) (1,796) (4,204) (5,230) (509) (15) (16,832)
Currency translation differences 69 26 11 23 14 — 143
Balance at December 31, 2016(c) 2,398 771 280 1,111 550 3 5,113
Provision related to current periodsales 5,131 2,027 4,069 5,897 537 29 17,690
Net change in provision related toprior period sales (46) (11) (8) 30 (11) — (46)
Payments made (5,129) (2,031) (3,925) (5,897) (466) (26) (17,474)
Currency translation differences (268) (93) (39) (74) (63) — (537)
Balance at December 31, 2017(c) 2,086 663 377 1,067 547 6 4,746
Changes in scope of consolidation 37 2 — (123) — 2 (82)
Provision related to current periodsales 4,624 2,038 3,620 5,942 465 56 16,745
Net change in provision related toprior period sales (2) (4) (1) (11) (35) 3 (50)
Payments made (4,673) (2,055) (3,714) (5,732) (448) (54) (16,676)
Currency translation differences 76 30 12 (3) 17 — 132
Balance at December 31, 2018(c) 2,148 674 294 1,140 546 13 4,815
(a) Primarily the US government’s Medicare and Medicaid programs.(b) Mainly rebates and other price reductions granted to healthcare authorities in the United States.(c) Provisions related to US net sales amounted to €3,509 million as of December 31, 2018, €3,487 million as of December 31, 2017 and €3,818 million as of
December 31, 2016.
D.24. Personnel costs
Total personnel costs include the following items:
(€ million) 2018 2017(a) 2016(a)
Salaries 6,547 6,592 6,424
Social security charges (including defined-contribution pension plans) 1,954 1,977 1,948
Stock options and other share-based payment expense 282 258 250
Defined-benefit pension plans 261 275 273
Other employee benefits 225 219 224
Total 9,269 9,321 9,119
(a) Excluding personnel costs for the Animal Health business: immaterial in 2017 and €0.6 billion in 2016.
The total number of registered employees (excluding those of theAnimal Health business) was 104,226 as of December 31, 2018,
compared with 106,566 as of December 31, 2017 and 106,859as of December 31, 2016.
F-100 SANOFI / FORM 20-F 2018

NOTES TO THE CONSOLIDATED FINANCIAL STATEMENTS – (Continued)
Employee numbers by function as of December 31 are shown below:
2018 2017(a) 2016(a)
Production 38,790 40,417 41,867
Research and development 15,140 14,764 15,148
Sales force 28,914 30,284 30,815
Marketing and support functions 21,382 21,101 19,029
Total 104,226 106,566 106,859
(a) Excluding employees of the Animal Health business: 4 employees in 2017 and 6,957 in 2016.
D.25. Other operating income
Other operating income totaled €484 million in 2018, versus€237 million in 2017 and €355 million in 2016.
Income from Sanofi’s pharmaceutical partners amounted to€32 million in 2018, €7 million in 2017, and €191 million in 2016(of which €141 million related to Regeneron).
Other operating income also includes (i) net operating foreignexchange gains and losses (see Note B.16.1.), whichrepresented net losses of €91 million in 2018, €80 million in 2017and €146 million in 2016; (ii) gains from disposals relating toongoing operations, which in 2018 reflect the divestment of somemature products in Latin America and some ConsumerHealthcare products in Europe (€326 million in 2018, €90 millionin 2017 and €40 million in 2016); plus a gain of €112 millionrelated to a data transfer agreement in 2018 (payments receivedon an out-of-court settlement of litigation in 2017).
D.26. Other operating expenses
Other operating expenses totaled €548 million in 2018,compared with €233 million in 2017 and €482 million in 2016.
In 2018, this line item includes €225 million of expenses relatingto the agreement with Regeneron, versus €11 million in 2017 and€10 million in 2016. This reflects Regeneron’s share of profits/losses from the commercialization of monoclonal antibodies(€177 million in 2018) net of commercialization-related expensesincurred by Regeneron €388 million in 2018, along withRegeneron’s €14 million share of profits/losses generated by thecommercialization of Zaltrap® (€11 million in 2017, €10 million in2016).
In 2018, Sanofi recognized provisions of €122 million, mainly tocover litigation and environmental risks, plus acquisition-relatedcosts of €56 million. In 2017, Sanofi recognized an impairmentloss of €87 million against property, plant and equipmentassociated with the dengue vaccine project.
This line item also includes shares of profits due to alliancepartners (other than BMS and the alliance partner under theActonel® agreement) under product marketing agreements(€50 million in 2018, versus €25 million in 2017 and €86 million in2016).
D.27. Restructuring costs and similar items
Restructuring costs and similar items amounted to €1,480 million in 2018, €731 million in 2017 and €879 million in 2016, and comprisethe following items:
(€ million) 2018 2017 2016
Employee-related expenses 517 336 650
Expenses related to property, plant and equipment and to inventories 162 221 139
Compensation for early termination of contracts (other than contracts of employment) 352 61 31
Decontamination costs 5 (4) 3
Other restructuring costs 444 117 56
Total 1,480 731 879
Restructuring costs recognized in 2018 included:
(a) termination benefit payments of €517 million in 2018,including provisions associated with the headcountadjustments in Europe announced in December 2018.
(b)a provision of €283 million booked as of December 31,2018 for penalties arising from the restructuring of theimmuno-oncology research and development agreementwith Regeneron, and in particular on termination of thecollaboration on research programs included in the initial
SANOFI / FORM 20-F 2018 F-101

NOTES TO THE CONSOLIDATED FINANCIAL STATEMENTS – (Continued)
July 2015 agreement (see Note C.1) which gives Sanofi theoption of pursuing its own immuno-oncology developmentprojects independently;
(c) losses on property, plant and equipment due to siteclosures or divestments under transformation orreorganization programs (€162 million);
(d) the costs of transferring the infectious diseases early stageR&D pipeline and research unit. Those transfer costsamounted to €252 million and primarily consist of paymentsto Evotec over a five-year period, including an upfrontpayment of €60 million on finalization of the agreement inearly July 2018.
In 2017, restructuring costs mainly comprised employee-relatedexpenses arising from headcount adjustment plans in the UnitedStates and Europe, and asset write-downs.
Costs relating to Sanofi transformation programs included withinthe “Other restructuring costs” line, as defined in Note B.19.,amounted to €145 million in 2018 compared with €110 million in2017 and €45 million in 2016.
The restructuring costs recognized in 2016 related mainly to theimplementation of an organizational transformation program inFrance and the rest of the world as part of the 2020 strategicroadmap.
D.28. Other gains and losses, and litigation
In 2018, the line item Other gains and losses, and litigation
consists of the pre-tax gain of €502 million arising on thedivestment of the European Generics business (completedSeptember 30, 2018), net of separation costs (see Note D.1.1.).
In 2017, this line item showed a net expense of €215 million,including an additional charge to provisions for vendor’s liabilityguarantees on past divestments and a negative price adjustmentof €31 million on the 2016 divestment of Sanofi’s interest in theSPMSD joint venture.
On December 30, 2016 Sanofi divested its interest in the SPMSDjoint venture to MSD, generating a pre-tax gain of €211 million(see Note D.1.3.).
D.29. Financial expenses and income
An analysis of Financial expenses and Financial income is set forth below:
(€ million) 2018 2017(a) 2016(a)
Cost of debt(b) (396) (326) (310)
Interest income(c) 123 89 73
Cost of net debt (273) (237) (237)
Non-operating foreign exchange gains/(losses) 6 (5) (2)
Unwinding of discounting of provisions(d) (24) (33) (33)
Net interest cost related to employee benefits (75) (92) (114)
Gains/(losses) on disposals of financial assets 63 96 36
Impairment losses on financial assets, net of reversals — (7) (487)(e)
Other 32 5 (19)
Net financial income/(expenses) (271) (273) (856)
comprising: Financial expenses (435) (420) (924)
Financial income 164 147 68
(a) The results of the Animal Health business are presented separately in accordance with IFRS 5 (Non-Current Assets Held for Sale and DiscontinuedOperations); (see Notes D.2. and D.36.).
(b) Includes net gains on interest rate and currency derivatives used to manage debt: €75 million in 2018, €20 million in 2017 and €50 million in 2016.(c) Includes net gains on interest rate and currency derivatives used to manage cash and cash equivalents: €51 million in 2018, €33 million in 2017 and
€17 million in 2016.(d) Primarily on provisions for environmental risks, restructuring provisions, and provisions for product-related risks (see Note D.19.).(e) On October 5, 2016, Alnylam Pharmaceuticals, Inc. announced that it was terminating its revusiran development program, as a result of which its share
price fell by 48% on October 6, 2016. Consequently, Sanofi recognized an impairment loss reflecting the difference between the historical acquisition costof its shares in Alnylam and their market value. That impairment loss amounted to €457 million as of December 31, 2016.
In 2018, 2017 and 2016, the impact of the ineffective portion of hedging relationships was not material.
F-102 SANOFI / FORM 20-F 2018
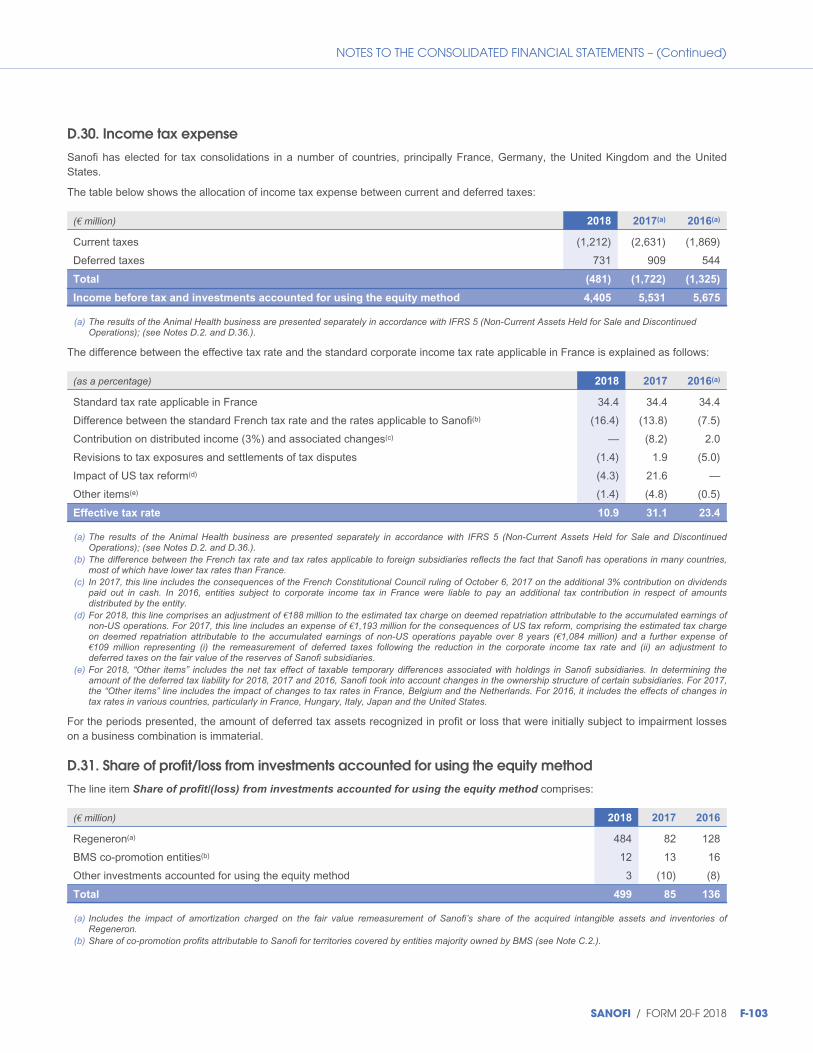
NOTES TO THE CONSOLIDATED FINANCIAL STATEMENTS – (Continued)
D.30. Income tax expense
Sanofi has elected for tax consolidations in a number of countries, principally France, Germany, the United Kingdom and the UnitedStates.
The table below shows the allocation of income tax expense between current and deferred taxes:
(€ million) 2018 2017(a) 2016(a)
Current taxes (1,212) (2,631) (1,869)
Deferred taxes 731 909 544
Total (481) (1,722) (1,325)
Income before tax and investments accounted for using the equity method 4,405 5,531 5,675
(a) The results of the Animal Health business are presented separately in accordance with IFRS 5 (Non-Current Assets Held for Sale and DiscontinuedOperations); (see Notes D.2. and D.36.).
The difference between the effective tax rate and the standard corporate income tax rate applicable in France is explained as follows:
(as a percentage) 2018 2017 2016(a)
Standard tax rate applicable in France 34.4 34.4 34.4
Difference between the standard French tax rate and the rates applicable to Sanofi(b) (16.4) (13.8) (7.5)
Contribution on distributed income (3%) and associated changes(c) — (8.2) 2.0
Revisions to tax exposures and settlements of tax disputes (1.4) 1.9 (5.0)
Impact of US tax reform(d) (4.3) 21.6 —
Other items(e) (1.4) (4.8) (0.5)
Effective tax rate 10.9 31.1 23.4
(a) The results of the Animal Health business are presented separately in accordance with IFRS 5 (Non-Current Assets Held for Sale and DiscontinuedOperations); (see Notes D.2. and D.36.).
(b) The difference between the French tax rate and tax rates applicable to foreign subsidiaries reflects the fact that Sanofi has operations in many countries,most of which have lower tax rates than France.
(c) In 2017, this line includes the consequences of the French Constitutional Council ruling of October 6, 2017 on the additional 3% contribution on dividendspaid out in cash. In 2016, entities subject to corporate income tax in France were liable to pay an additional tax contribution in respect of amountsdistributed by the entity.
(d) For 2018, this line comprises an adjustment of €188 million to the estimated tax charge on deemed repatriation attributable to the accumulated earnings ofnon-US operations. For 2017, this line includes an expense of €1,193 million for the consequences of US tax reform, comprising the estimated tax chargeon deemed repatriation attributable to the accumulated earnings of non-US operations payable over 8 years (€1,084 million) and a further expense of€109 million representing (i) the remeasurement of deferred taxes following the reduction in the corporate income tax rate and (ii) an adjustment todeferred taxes on the fair value of the reserves of Sanofi subsidiaries.
(e) For 2018, “Other items” includes the net tax effect of taxable temporary differences associated with holdings in Sanofi subsidiaries. In determining theamount of the deferred tax liability for 2018, 2017 and 2016, Sanofi took into account changes in the ownership structure of certain subsidiaries. For 2017,the “Other items” line includes the impact of changes to tax rates in France, Belgium and the Netherlands. For 2016, it includes the effects of changes intax rates in various countries, particularly in France, Hungary, Italy, Japan and the United States.
For the periods presented, the amount of deferred tax assets recognized in profit or loss that were initially subject to impairment losseson a business combination is immaterial.
D.31. Share of profit/loss from investments accounted for using the equity method
The line item Share of profit/(loss) from investments accounted for using the equity method comprises:
(€ million) 2018 2017 2016
Regeneron(a) 484 82 128
BMS co-promotion entities(b) 12 13 16
Other investments accounted for using the equity method 3 (10) (8)
Total 499 85 136
(a) Includes the impact of amortization charged on the fair value remeasurement of Sanofi’s share of the acquired intangible assets and inventories ofRegeneron.
(b) Share of co-promotion profits attributable to Sanofi for territories covered by entities majority owned by BMS (see Note C.2.).
SANOFI / FORM 20-F 2018 F-103
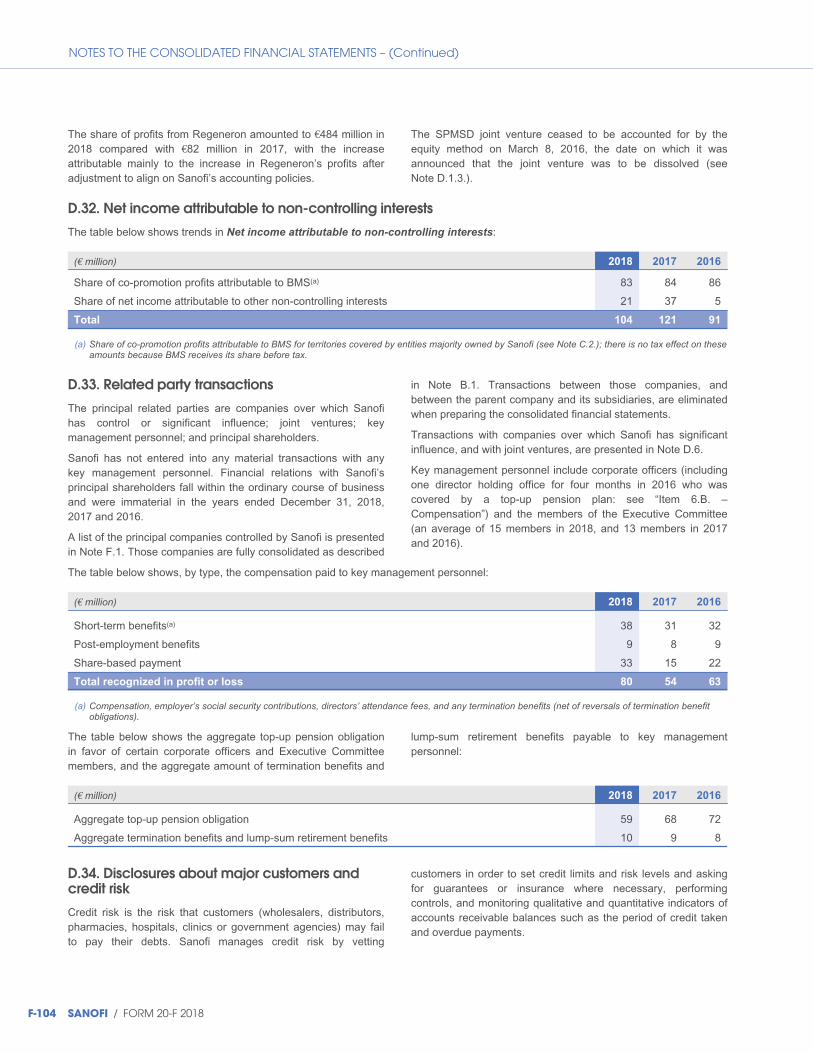
NOTES TO THE CONSOLIDATED FINANCIAL STATEMENTS – (Continued)
The share of profits from Regeneron amounted to €484 million in2018 compared with €82 million in 2017, with the increaseattributable mainly to the increase in Regeneron’s profits afteradjustment to align on Sanofi’s accounting policies.
The SPMSD joint venture ceased to be accounted for by theequity method on March 8, 2016, the date on which it wasannounced that the joint venture was to be dissolved (seeNote D.1.3.).
D.32. Net income attributable to non-controlling interests
The table below shows trends in Net income attributable to non-controlling interests:
(€ million) 2018 2017 2016
Share of co-promotion profits attributable to BMS(a) 83 84 86
Share of net income attributable to other non-controlling interests 21 37 5
Total 104 121 91
(a) Share of co-promotion profits attributable to BMS for territories covered by entities majority owned by Sanofi (see Note C.2.); there is no tax effect on theseamounts because BMS receives its share before tax.
D.33. Related party transactions
The principal related parties are companies over which Sanofihas control or significant influence; joint ventures; keymanagement personnel; and principal shareholders.
Sanofi has not entered into any material transactions with anykey management personnel. Financial relations with Sanofi’sprincipal shareholders fall within the ordinary course of businessand were immaterial in the years ended December 31, 2018,2017 and 2016.
A list of the principal companies controlled by Sanofi is presentedin Note F.1. Those companies are fully consolidated as described
in Note B.1. Transactions between those companies, andbetween the parent company and its subsidiaries, are eliminatedwhen preparing the consolidated financial statements.
Transactions with companies over which Sanofi has significantinfluence, and with joint ventures, are presented in Note D.6.
Key management personnel include corporate officers (includingone director holding office for four months in 2016 who wascovered by a top-up pension plan: see “Item 6.B. –Compensation”) and the members of the Executive Committee(an average of 15 members in 2018, and 13 members in 2017and 2016).
The table below shows, by type, the compensation paid to key management personnel:
(€ million) 2018 2017 2016
Short-term benefits(a) 38 31 32
Post-employment benefits 9 8 9
Share-based payment 33 15 22
Total recognized in profit or loss 80 54 63
(a) Compensation, employer’s social security contributions, directors’ attendance fees, and any termination benefits (net of reversals of termination benefitobligations).
The table below shows the aggregate top-up pension obligationin favor of certain corporate officers and Executive Committeemembers, and the aggregate amount of termination benefits and
lump-sum retirement benefits payable to key managementpersonnel:
(€ million) 2018 2017 2016
Aggregate top-up pension obligation 59 68 72
Aggregate termination benefits and lump-sum retirement benefits 10 9 8
D.34. Disclosures about major customers andcredit risk
Credit risk is the risk that customers (wholesalers, distributors,pharmacies, hospitals, clinics or government agencies) may failto pay their debts. Sanofi manages credit risk by vetting
customers in order to set credit limits and risk levels and askingfor guarantees or insurance where necessary, performingcontrols, and monitoring qualitative and quantitative indicators ofaccounts receivable balances such as the period of credit takenand overdue payments.
F-104 SANOFI / FORM 20-F 2018

NOTES TO THE CONSOLIDATED FINANCIAL STATEMENTS – (Continued)
Customer credit risk also arises as a result of the concentrationof Sanofi’s sales with its largest customers, in particular certainwholesalers in the United States. Sanofi’s three largestcustomers respectively accounted for approximately 9%, 6% and4% of consolidated revenues in 2018 (9%, 5% and 4% in 2017;12%, 7% and 6% in 2016).
D.35. Segment information
With effect from December 31, 2017 Sanofi has three operatingsegments: Pharmaceuticals, Consumer Healthcare and HumanVaccines (Vaccines).
The Pharmaceuticals segment comprises the commercialoperations of the following global franchises: Specialty Care(Rare Diseases, Multiple Sclerosis, Oncology, Immunology),Diabetes & Cardiovascular, Established Prescription Productsand Generics, together with research, development andproduction activities dedicated to our Pharmaceuticals segment.This segment also includes associates whose activities arerelated to pharmaceuticals, in particular our share of Regeneron.
The Consumer Healthcare segment comprises, for allgeographical territories, the commercial operations for ourConsumer Healthcare products, together with research,development and production activities dedicated to thoseproducts.
The Vaccines segment comprises, for all geographical territories(including certain territories previously included in the SanofiPasteur MSD joint venture), the commercial operations of SanofiPasteur, together with research, development and productionactivities dedicated to vaccines.
Inter-segment transactions are not material.
The costs of Sanofi’s global functions (Medical Affairs, ExternalAffairs, Finance, Human Resources, Legal Affairs, InformationSolutions & Technologies, Sanofi Business Services, etc.) aremanaged centrally at group-wide level. The costs of thosefunctions are presented within the “Other” category, which alsoincludes other reconciling items such as retained commitments inrespect of divested activities.
SANOFI / FORM 20-F 2018 F-105
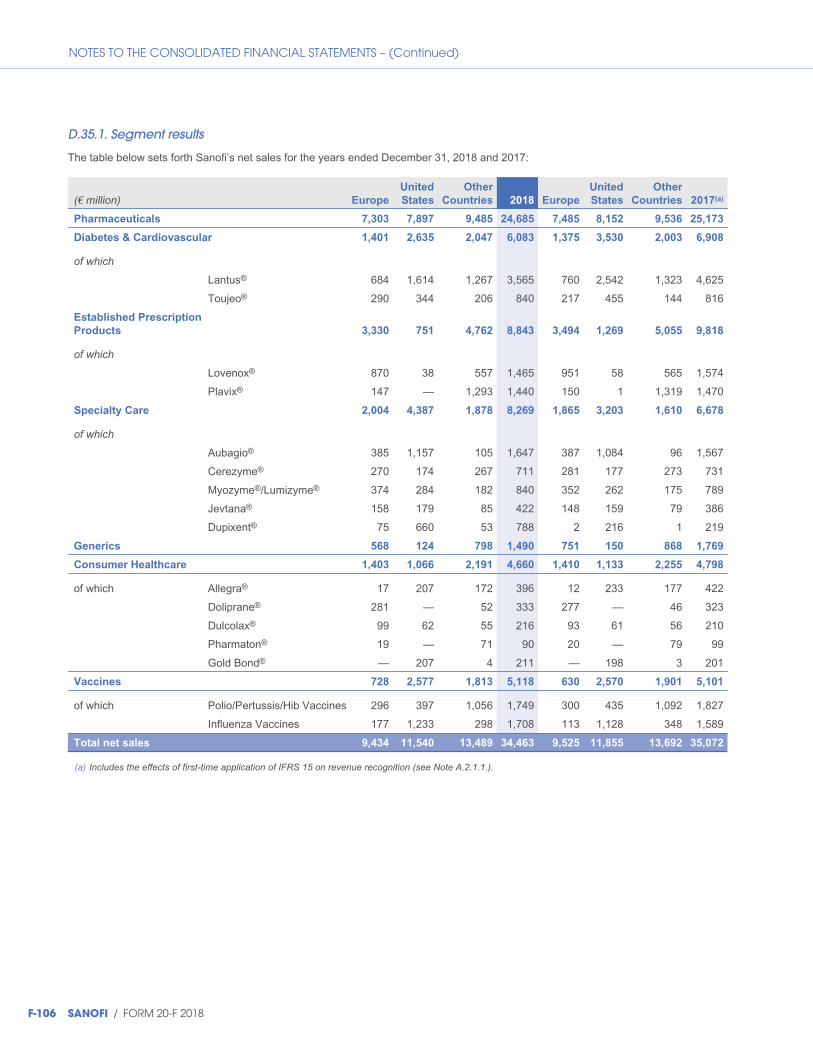
NOTES TO THE CONSOLIDATED FINANCIAL STATEMENTS – (Continued)
D.35.1. Segment results
The table below sets forth Sanofi’s net sales for the years ended December 31, 2018 and 2017:
(€ million) Europe
United
States
Other
Countries 2018 Europe
United
States
Other
Countries 2017(a)
Pharmaceuticals 7,303 7,897 9,485 24,685 7,485 8,152 9,536 25,173
Diabetes & Cardiovascular 1,401 2,635 2,047 6,083 1,375 3,530 2,003 6,908
of which
Lantus® 684 1,614 1,267 3,565 760 2,542 1,323 4,625
Toujeo® 290 344 206 840 217 455 144 816
Established Prescription
Products 3,330 751 4,762 8,843 3,494 1,269 5,055 9,818
of which
Lovenox® 870 38 557 1,465 951 58 565 1,574
Plavix® 147 — 1,293 1,440 150 1 1,319 1,470
Specialty Care 2,004 4,387 1,878 8,269 1,865 3,203 1,610 6,678
of which
Aubagio® 385 1,157 105 1,647 387 1,084 96 1,567
Cerezyme® 270 174 267 711 281 177 273 731
Myozyme®/Lumizyme® 374 284 182 840 352 262 175 789
Jevtana® 158 179 85 422 148 159 79 386
Dupixent® 75 660 53 788 2 216 1 219
Generics 568 124 798 1,490 751 150 868 1,769
Consumer Healthcare 1,403 1,066 2,191 4,660 1,410 1,133 2,255 4,798
of which Allegra® 17 207 172 396 12 233 177 422
Doliprane® 281 — 52 333 277 — 46 323
Dulcolax® 99 62 55 216 93 61 56 210
Pharmaton® 19 — 71 90 20 — 79 99
Gold Bond® — 207 4 211 — 198 3 201
Vaccines 728 2,577 1,813 5,118 630 2,570 1,901 5,101
of which Polio/Pertussis/Hib Vaccines 296 397 1,056 1,749 300 435 1,092 1,827
Influenza Vaccines 177 1,233 298 1,708 113 1,128 348 1,589
Total net sales 9,434 11,540 13,489 34,463 9,525 11,855 13,692 35,072
(a) Includes the effects of first-time application of IFRS 15 on revenue recognition (see Note A.2.1.1.).
F-106 SANOFI / FORM 20-F 2018

NOTES TO THE CONSOLIDATED FINANCIAL STATEMENTS – (Continued)
The table below sets forth Sanofi’s net sales for the years ended December 31, 2017 and 2016:
(€ million) Europe
United
States
Other
Countries 2017 Europe
United
States
Other
Countries 2016
Pharmaceuticals 7,473 8,152 9,497 25,122 7,532 8,913 9,469 25,914
Diabetes &
Cardiovascular 1,375 3,530 2,000 6,905 1,381 4,511 1,907 7,799
of which
Lantus® 760 2,542 1,320 4,622 878 3,528 1,308 5,714
Toujeo® 217 455 144 816 120 475 54 649
Established
Prescription
Products 3,473 1,269 5,019 9,761 3,642 1,490 5,179 10,311
of which
Lovenox® 951 58 566 1,575 1,027 54 555 1,636
Plavix® 150 1 1,320 1,471 162 1 1,381 1,544
Specialty Care 1,865 3,203 1,610 6,678 1,707 2,737 1,506 5,950
of which
Aubagio® 387 1,084 96 1,567 308 908 79 1,295
Cerezyme® 281 177 272 730 280 181 287 748
Myozyme®/Lumizyme® 352 262 175 789 327 240 158 725
Jevtana® 148 159 79 386 139 152 67 358
Dupixent® 2 216 1 219 — — — —
Generics 760 150 868 1,778 802 175 877 1,854
Consumer
Healthcare 1,422 1,133 2,277 4,832 879 938 1,513 3,330
of which Allegra® 12 233 178 423 9 243 165 417
Doliprane® 277 — 46 323 260 — 49 309
Vaccines 630 2,570 1,901 5,101 268 2,540 1,769 4,577
of which Polio/Pertussis/Hib Vaccines 300 435 1,092 1,827 105 405 985 1,495
Influenza Vaccines 113 1,128 348 1,589 83 1,117 321 1,521
Total published
net sales 9,525 11,855 13,675 35,055 8,679 12,391 12,751 33,821
Impact of IFRS 15 17 (12)
Total net sales
(including impact of IFRS 15) 35,072 33,809
Sanofi reports segment results on the basis of “Businessoperating income”. This indicator is used internally by Sanofi’schief operating decision maker to measure the performance ofeach operating segment and to allocate resources.
Business operating income is derived from Operating income,adjusted as follows:
◆ the amounts reported in the line items Restructuring costs
and similar items, Fair value remeasurement of contingent
consideration and Other gains and losses, and litigation
are eliminated;
◆ amortization and impairment losses charged against intangibleassets (other than software and other rights of an industrial oroperational nature) are eliminated;
◆ the share of profits/losses from investments accounted forusing the equity method is added;
◆ net income attributable to non-controlling interests is deducted;
SANOFI / FORM 20-F 2018 F-107
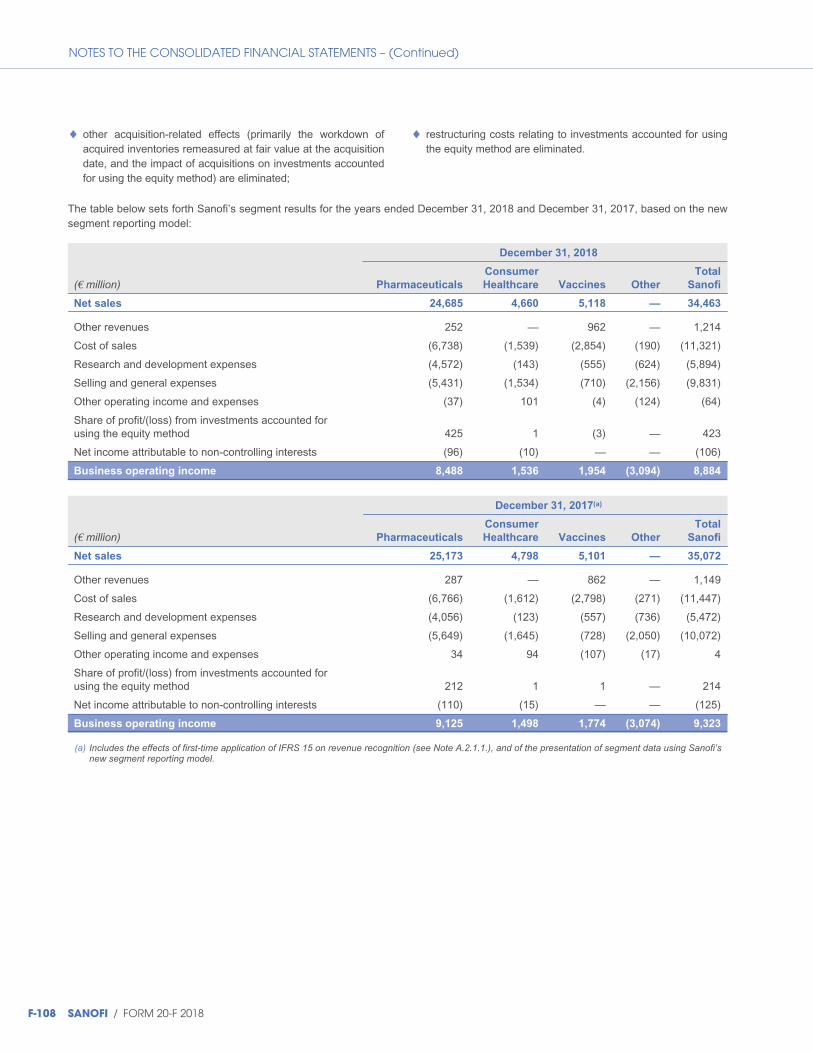
NOTES TO THE CONSOLIDATED FINANCIAL STATEMENTS – (Continued)
◆ other acquisition-related effects (primarily the workdown ofacquired inventories remeasured at fair value at the acquisitiondate, and the impact of acquisitions on investments accountedfor using the equity method) are eliminated;
◆ restructuring costs relating to investments accounted for usingthe equity method are eliminated.
The table below sets forth Sanofi’s segment results for the years ended December 31, 2018 and December 31, 2017, based on the newsegment reporting model:
December 31, 2018
(€ million) Pharmaceuticals
Consumer
Healthcare Vaccines Other
Total
Sanofi
Net sales 24,685 4,660 5,118 — 34,463
Other revenues 252 — 962 — 1,214
Cost of sales (6,738) (1,539) (2,854) (190) (11,321)
Research and development expenses (4,572) (143) (555) (624) (5,894)
Selling and general expenses (5,431) (1,534) (710) (2,156) (9,831)
Other operating income and expenses (37) 101 (4) (124) (64)
Share of profit/(loss) from investments accounted forusing the equity method 425 1 (3) — 423
Net income attributable to non-controlling interests (96) (10) — — (106)
Business operating income 8,488 1,536 1,954 (3,094) 8,884
December 31, 2017(a)
(€ million) Pharmaceuticals
Consumer
Healthcare Vaccines Other
Total
Sanofi
Net sales 25,173 4,798 5,101 — 35,072
Other revenues 287 — 862 — 1,149
Cost of sales (6,766) (1,612) (2,798) (271) (11,447)
Research and development expenses (4,056) (123) (557) (736) (5,472)
Selling and general expenses (5,649) (1,645) (728) (2,050) (10,072)
Other operating income and expenses 34 94 (107) (17) 4
Share of profit/(loss) from investments accounted forusing the equity method 212 1 1 — 214
Net income attributable to non-controlling interests (110) (15) — — (125)
Business operating income 9,125 1,498 1,774 (3,074) 9,323
(a) Includes the effects of first-time application of IFRS 15 on revenue recognition (see Note A.2.1.1.), and of the presentation of segment data using Sanofi’snew segment reporting model.
F-108 SANOFI / FORM 20-F 2018
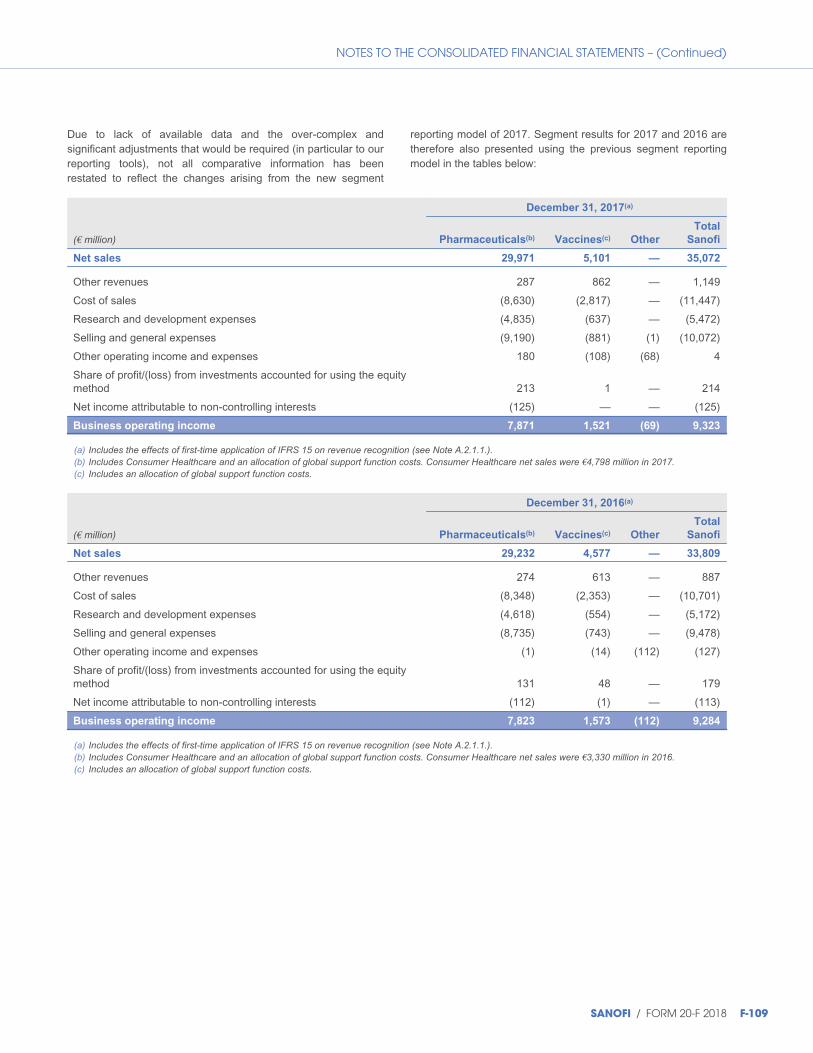
NOTES TO THE CONSOLIDATED FINANCIAL STATEMENTS – (Continued)
Due to lack of available data and the over-complex andsignificant adjustments that would be required (in particular to ourreporting tools), not all comparative information has beenrestated to reflect the changes arising from the new segment
reporting model of 2017. Segment results for 2017 and 2016 aretherefore also presented using the previous segment reportingmodel in the tables below:
December 31, 2017(a)
(€ million) Pharmaceuticals(b) Vaccines(c) Other
Total
Sanofi
Net sales 29,971 5,101 — 35,072
Other revenues 287 862 — 1,149
Cost of sales (8,630) (2,817) — (11,447)
Research and development expenses (4,835) (637) — (5,472)
Selling and general expenses (9,190) (881) (1) (10,072)
Other operating income and expenses 180 (108) (68) 4
Share of profit/(loss) from investments accounted for using the equitymethod 213 1 — 214
Net income attributable to non-controlling interests (125) — — (125)
Business operating income 7,871 1,521 (69) 9,323
(a) Includes the effects of first-time application of IFRS 15 on revenue recognition (see Note A.2.1.1.).(b) Includes Consumer Healthcare and an allocation of global support function costs. Consumer Healthcare net sales were €4,798 million in 2017.(c) Includes an allocation of global support function costs.
December 31, 2016(a)
(€ million) Pharmaceuticals(b) Vaccines(c) Other
Total
Sanofi
Net sales 29,232 4,577 — 33,809
Other revenues 274 613 — 887
Cost of sales (8,348) (2,353) — (10,701)
Research and development expenses (4,618) (554) — (5,172)
Selling and general expenses (8,735) (743) — (9,478)
Other operating income and expenses (1) (14) (112) (127)
Share of profit/(loss) from investments accounted for using the equitymethod 131 48 — 179
Net income attributable to non-controlling interests (112) (1) — (113)
Business operating income 7,823 1,573 (112) 9,284
(a) Includes the effects of first-time application of IFRS 15 on revenue recognition (see Note A.2.1.1.).(b) Includes Consumer Healthcare and an allocation of global support function costs. Consumer Healthcare net sales were €3,330 million in 2016.(c) Includes an allocation of global support function costs.
SANOFI / FORM 20-F 2018 F-109

NOTES TO THE CONSOLIDATED FINANCIAL STATEMENTS – (Continued)
The table below, presented in compliance with IFRS 8, shows areconciliation between aggregated “Business operating income”
for the segments and Income before tax and investments
accounted for using the equity method:
(€ million) 2018 2017(a) 2016(a)
Business operating income 8,884 9,323 9,284
Share of profit/(loss) from investments accounted for using the equity method(b) (423) (214) (179)
Net income attributable to non-controlling interests(c) 106 125 113
Amortization and impairment of intangible assets (2,888) (2,159) (1,884)
Fair value remeasurement of contingent consideration 117 (159) (135)
Expenses arising from the impact of acquisitions on inventories(d) (114) (166) —
Restructuring costs and similar items (1,480) (731) (879)
Other expenses related to business combinations (28) — —
Other gains and losses, and litigation(e) 502 (215) 211
Operating income 4,676 5,804 6,531
Financial expenses(f) (435) (420) (924)
Financial income 164 147 68
Income before tax and investments accounted for using the equity method 4,405 5,531 5,675
(a) Includes the effects of first-time application of IFRS 15 on revenue recognition (see Note A.2.1.1.), and of the presentation of segment data using Sanofi’snew segment reporting model.
(b) Excluding restructuring costs relating to investments accounted for using the equity method and expenses arising from the impact of acquisitions oninvestments accounted for using the equity method, and after elimination of Sanofi’s share of the business net income of Sanofi Pasteur MSD from thedate when Sanofi and Merck announced their intention to end their joint venture (€52 million in 2016).
(c) Excludes (i) restructuring costs and (ii) other adjustments attributable to non-controlling interests.(d) This line records the impact of the workdown of acquired inventories remeasured at fair value at the acquisition date.(e) For 2018, the gain resulting from the European Generics business divestiture amounting to €510 million.
For 2017, this line includes an adjustment to provisions for vendor’s liability guarantees relating to past divestments.For 2016, it includes the pre-tax gain on divestment of Sanofi’s interest in the Sanofi Pasteur MSD joint venture.
(f) For 2016, this line includes an impairment loss of €457 million taken against Sanofi’s equity investment in Alnylam Pharmaceuticals, Inc. (see Note D.29.).
D.35.2. Other segment information
The tables below show the split by operating segment of (i) thecarrying amount of investments accounted for using the equitymethod, (ii) acquisitions of property, plant and equipment, and(iii) acquisitions of intangible assets.
The principal investments accounted for using the equity methodare: for the Pharmaceuticals segment, RegeneronPharmaceuticals, Inc., the entities majority owned by BMS (seeNote C.2.), and Infraserv GmbH & Co. Höchst KG; and for theVaccines segment, Sanofi Pasteur MSD (until March 8, 2016;see Notes B.1. and D.1.3.).
Acquisitions of intangible assets and property, plant and equipment correspond to acquisitions paid for during the period.
2018
(€ million) Pharmaceuticals
Consumer
Healthcare Vaccines Total
Investments accounted for using the equity method 3,352 20 30 3,402
Acquisitions of property, plant and equipment 1,046 5 364 1,415
Acquisitions of other intangible assets 434 7 121 562
2017
(€ million) Pharmaceuticals
Consumer
Healthcare Vaccines Total
Investments accounted for using the equity method(a) 2,815 19 13 2,847
Acquisitions of property, plant and equipment 1,033 9 346 1,388
Acquisitions of other intangible assets 367 9 192 568
(a) Includes the effects of first-time application of IFRS 15 on revenue recognition (see Note A.2.1.1.), and of the presentation of segment data using Sanofi’snew segment reporting model.
F-110 SANOFI / FORM 20-F 2018
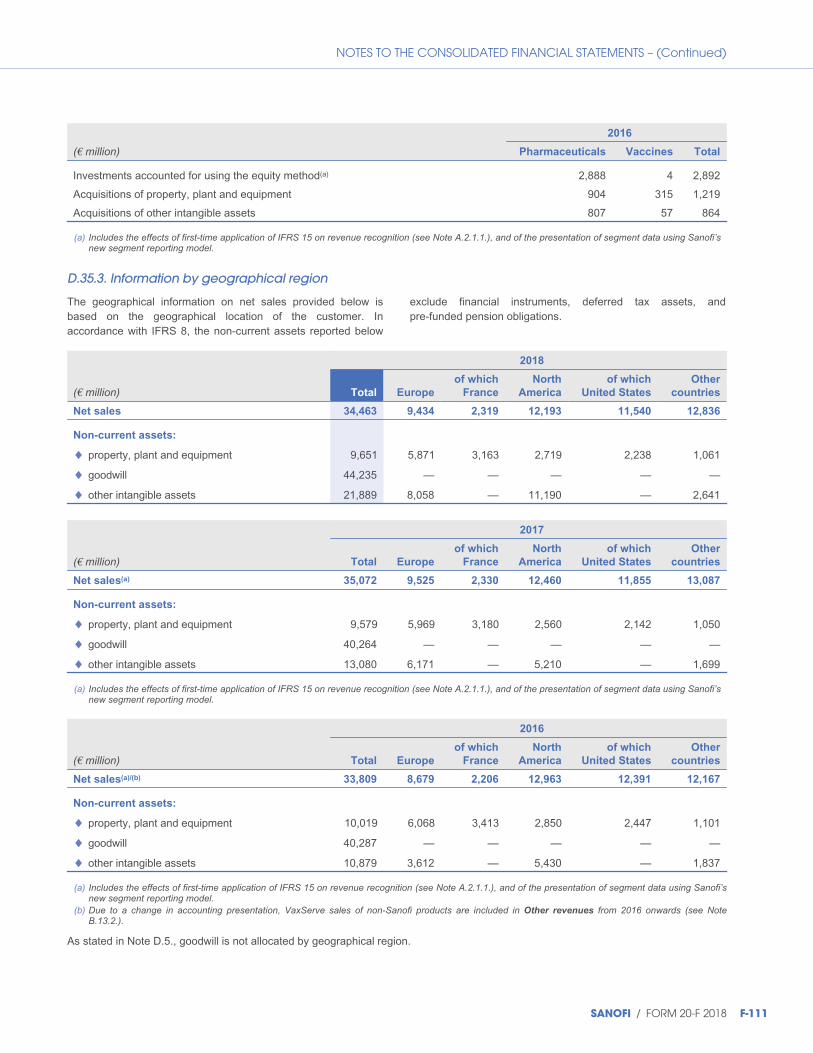
NOTES TO THE CONSOLIDATED FINANCIAL STATEMENTS – (Continued)
2016
(€ million) Pharmaceuticals Vaccines Total
Investments accounted for using the equity method(a) 2,888 4 2,892
Acquisitions of property, plant and equipment 904 315 1,219
Acquisitions of other intangible assets 807 57 864
(a) Includes the effects of first-time application of IFRS 15 on revenue recognition (see Note A.2.1.1.), and of the presentation of segment data using Sanofi’snew segment reporting model.
D.35.3. Information by geographical region
The geographical information on net sales provided below isbased on the geographical location of the customer. Inaccordance with IFRS 8, the non-current assets reported below
exclude financial instruments, deferred tax assets, andpre-funded pension obligations.
2018
(€ million) Total Europe
of which
France
North
America
of which
United States
Other
countries
Net sales 34,463 9,434 2,319 12,193 11,540 12,836
Non-current assets:
property, plant and equipment 9,651 5,871 3,163 2,719 2,238 1,061
goodwill 44,235 — — — — —
other intangible assets 21,889 8,058 — 11,190 — 2,641
◆
◆
◆
2017
(€ million) Total Europe
of which
France
North
America
of which
United States
Other
countries
Net sales(a) 35,072 9,525 2,330 12,460 11,855 13,087
Non-current assets:
property, plant and equipment 9,579 5,969 3,180 2,560 2,142 1,050
goodwill 40,264 — — — — —
other intangible assets 13,080 6,171 — 5,210 — 1,699
◆
◆
◆
(a) Includes the effects of first-time application of IFRS 15 on revenue recognition (see Note A.2.1.1.), and of the presentation of segment data using Sanofi’snew segment reporting model.
2016
(€ million) Total Europe
of which
France
North
America
of which
United States
Other
countries
Net sales(a)/(b) 33,809 8,679 2,206 12,963 12,391 12,167
Non-current assets:
property, plant and equipment 10,019 6,068 3,413 2,850 2,447 1,101
goodwill 40,287 — — — — —
other intangible assets 10,879 3,612 — 5,430 — 1,837
◆
◆
◆
(a) Includes the effects of first-time application of IFRS 15 on revenue recognition (see Note A.2.1.1.), and of the presentation of segment data using Sanofi’snew segment reporting model.
(b) Due to a change in accounting presentation, VaxServe sales of non-Sanofi products are included in Other revenues from 2016 onwards (see NoteB.13.2.).
As stated in Note D.5., goodwill is not allocated by geographical region.
SANOFI / FORM 20-F 2018 F-111
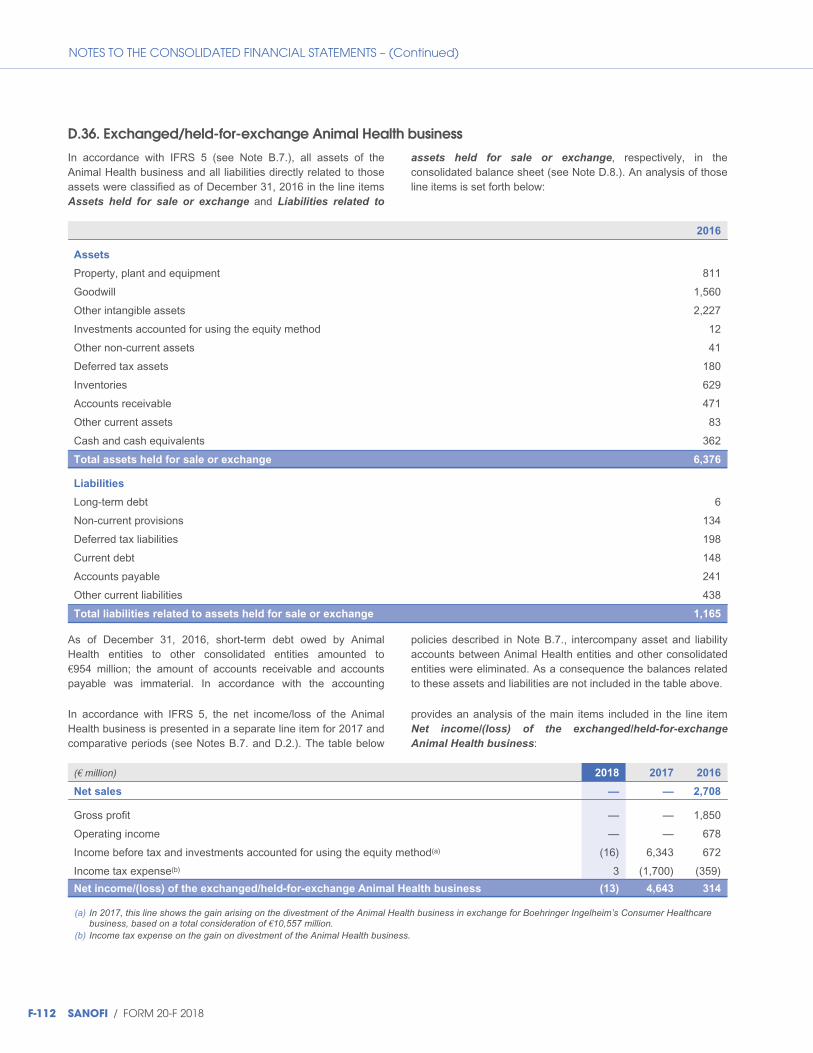
NOTES TO THE CONSOLIDATED FINANCIAL STATEMENTS – (Continued)
D.36. Exchanged/held-for-exchange Animal Health business
In accordance with IFRS 5 (see Note B.7.), all assets of theAnimal Health business and all liabilities directly related to thoseassets were classified as of December 31, 2016 in the line itemsAssets held for sale or exchange and Liabilities related to
assets held for sale or exchange, respectively, in theconsolidated balance sheet (see Note D.8.). An analysis of thoseline items is set forth below:
2016
Assets
Property, plant and equipment 811
Goodwill 1,560
Other intangible assets 2,227
Investments accounted for using the equity method 12
Other non-current assets 41
Deferred tax assets 180
Inventories 629
Accounts receivable 471
Other current assets 83
Cash and cash equivalents 362
Total assets held for sale or exchange 6,376
Liabilities
Long-term debt 6
Non-current provisions 134
Deferred tax liabilities 198
Current debt 148
Accounts payable 241
Other current liabilities 438
Total liabilities related to assets held for sale or exchange 1,165
As of December 31, 2016, short-term debt owed by AnimalHealth entities to other consolidated entities amounted to€954 million; the amount of accounts receivable and accountspayable was immaterial. In accordance with the accounting
policies described in Note B.7., intercompany asset and liabilityaccounts between Animal Health entities and other consolidatedentities were eliminated. As a consequence the balances relatedto these assets and liabilities are not included in the table above.
In accordance with IFRS 5, the net income/loss of the AnimalHealth business is presented in a separate line item for 2017 andcomparative periods (see Notes B.7. and D.2.). The table below
provides an analysis of the main items included in the line itemNet income/(loss) of the exchanged/held-for-exchange
Animal Health business:
(€ million) 2018 2017 2016
Net sales — — 2,708
Gross profit — — 1,850
Operating income — — 678
Income before tax and investments accounted for using the equity method(a) (16) 6,343 672
Income tax expense(b) 3 (1,700) (359)
Net income/(loss) of the exchanged/held-for-exchange Animal Health business (13) 4,643 314
(a) In 2017, this line shows the gain arising on the divestment of the Animal Health business in exchange for Boehringer Ingelheim’s Consumer Healthcarebusiness, based on a total consideration of €10,557 million.
(b) Income tax expense on the gain on divestment of the Animal Health business.
F-112 SANOFI / FORM 20-F 2018
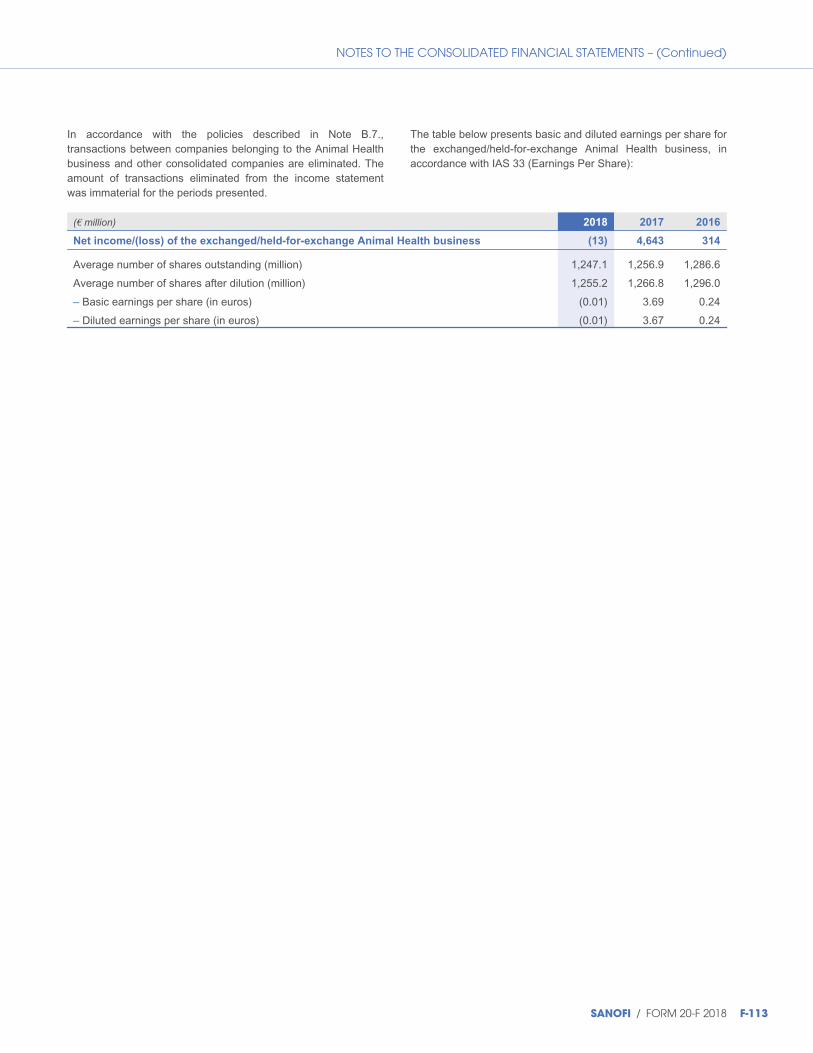
NOTES TO THE CONSOLIDATED FINANCIAL STATEMENTS – (Continued)
In accordance with the policies described in Note B.7.,transactions between companies belonging to the Animal Healthbusiness and other consolidated companies are eliminated. Theamount of transactions eliminated from the income statementwas immaterial for the periods presented.
The table below presents basic and diluted earnings per share forthe exchanged/held-for-exchange Animal Health business, inaccordance with IAS 33 (Earnings Per Share):
(€ million) 2018 2017 2016
Net income/(loss) of the exchanged/held-for-exchange Animal Health business (13) 4,643 314
Average number of shares outstanding (million) 1,247.1 1,256.9 1,286.6
Average number of shares after dilution (million) 1,255.2 1,266.8 1,296.0
Basic earnings per share (in euros) (0.01) 3.69 0.24
Diluted earnings per share (in euros) (0.01) 3.67 0.24
–
–
SANOFI / FORM 20-F 2018 F-113
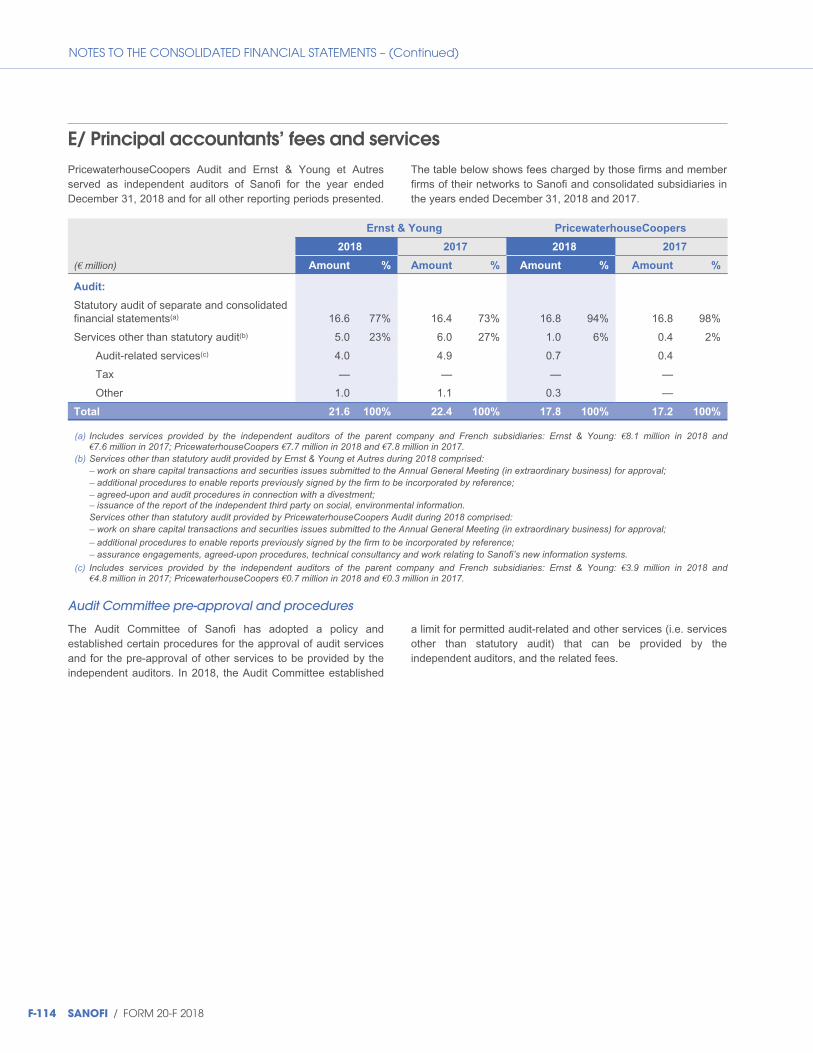
NOTES TO THE CONSOLIDATED FINANCIAL STATEMENTS – (Continued)
E/ Principal accountants’ fees and servicesPricewaterhouseCoopers Audit and Ernst & Young et Autresserved as independent auditors of Sanofi for the year endedDecember 31, 2018 and for all other reporting periods presented.
The table below shows fees charged by those firms and memberfirms of their networks to Sanofi and consolidated subsidiaries inthe years ended December 31, 2018 and 2017.
Ernst & Young PricewaterhouseCoopers
2018 2017 2018 2017
(€ million) Amount % Amount % Amount % Amount %
Audit:
Statutory audit of separate and consolidatedfinancial statements(a) 16.6 77% 16.4 73% 16.8 94% 16.8 98%
Services other than statutory audit(b) 5.0 23% 6.0 27% 1.0 6% 0.4 2%
Audit-related services(c) 4.0 4.9 0.7 0.4
Tax — — — —
Other 1.0 1.1 0.3 —
Total 21.6 100% 22.4 100% 17.8 100% 17.2 100%
(a) Includes services provided by the independent auditors of the parent company and French subsidiaries: Ernst & Young: €8.1 million in 2018 and€7.6 million in 2017; PricewaterhouseCoopers €7.7 million in 2018 and €7.8 million in 2017.
(b) Services other than statutory audit provided by Ernst & Young et Autres during 2018 comprised:– work on share capital transactions and securities issues submitted to the Annual General Meeting (in extraordinary business) for approval;– additional procedures to enable reports previously signed by the firm to be incorporated by reference;– agreed-upon and audit procedures in connection with a divestment;– issuance of the report of the independent third party on social, environmental information.Services other than statutory audit provided by PricewaterhouseCoopers Audit during 2018 comprised:– work on share capital transactions and securities issues submitted to the Annual General Meeting (in extraordinary business) for approval;– additional procedures to enable reports previously signed by the firm to be incorporated by reference;– assurance engagements, agreed-upon procedures, technical consultancy and work relating to Sanofi’s new information systems.
(c) Includes services provided by the independent auditors of the parent company and French subsidiaries: Ernst & Young: €3.9 million in 2018 and€4.8 million in 2017; PricewaterhouseCoopers €0.7 million in 2018 and €0.3 million in 2017.
Audit Committee pre-approval and procedures
The Audit Committee of Sanofi has adopted a policy andestablished certain procedures for the approval of audit servicesand for the pre-approval of other services to be provided by theindependent auditors. In 2018, the Audit Committee established
a limit for permitted audit-related and other services (i.e. servicesother than statutory audit) that can be provided by theindependent auditors, and the related fees.
F-114 SANOFI / FORM 20-F 2018

NOTES TO THE CONSOLIDATED FINANCIAL STATEMENTS – (Continued)
F/ List of principal companies included in the consolidation scope during 2018
F.1. Principal fully consolidated companies
The table below shows the principal companies and their country of incorporation:
Europe
Financial interest (%) as
of December 31, 2018
Hoechst GmbH Germany 100.0
Sanofi-Aventis Deutschland GmbH Germany 100.0
Aventis Beteiligungsverwaltung GmbH Germany 100.0
Sanofi-Aventis GmbH Austria 100.0
Sanofi Belgium Belgium 100.0
Sanofi European Treasury Center Belgium 100.0
Ablynx N.V. Belgium 100.0
Genzyme Flanders BVBA Belgium 100.0
Sanofi-Aventis Denmark A/S Denmark 100.0
Sanofi-Aventis SA Spain 100.0
Sanofi Oy Finland 100.0
Sanofi France 100.0
Sanofi-Aventis France France 100.0
Sanofi Winthrop Industries France 100.0
Sanofi-Aventis Recherche et Développement France 100.0
Sanofi-Aventis Groupe France 100.0
Sanofi CLIR France 50.1
Sanofi Chimie France 100.0
Francopia France 100.0
Sanofi-Aventis Participations SAS France 100.0
Genzyme Polyclonals SAS France 100.0
Sanofi Pasteur (France) SA France 100.0
Aventis Pharma SA (France) France 100.0
Aventis Agriculture France 100.0
Biopark By Sanofi France 100.0
Chattem Greece S.A. Greece 100.0
Sanofi-Aventis A.E.B.E. Greece 100.0
Sanofi-Aventis Private Co, Ltd Hungary 99.6
Chinoin Private Co. Ltd Hungary 99.6
Carraig Insurance DAC Ireland 100.0
Sanofi-Aventis Ireland Ltd Ireland 100.0
Genzyme Ireland Limited Ireland 100.0
Sanofi Spa Italy 100.0
Genzyme Global Sarl Luxembourg 100.0
Sanofi-Aventis Norge AS Norway 100.0
Sanofi-Aventis Netherlands B.V. Netherlands 100.0
SANOFI / FORM 20-F 2018 F-115
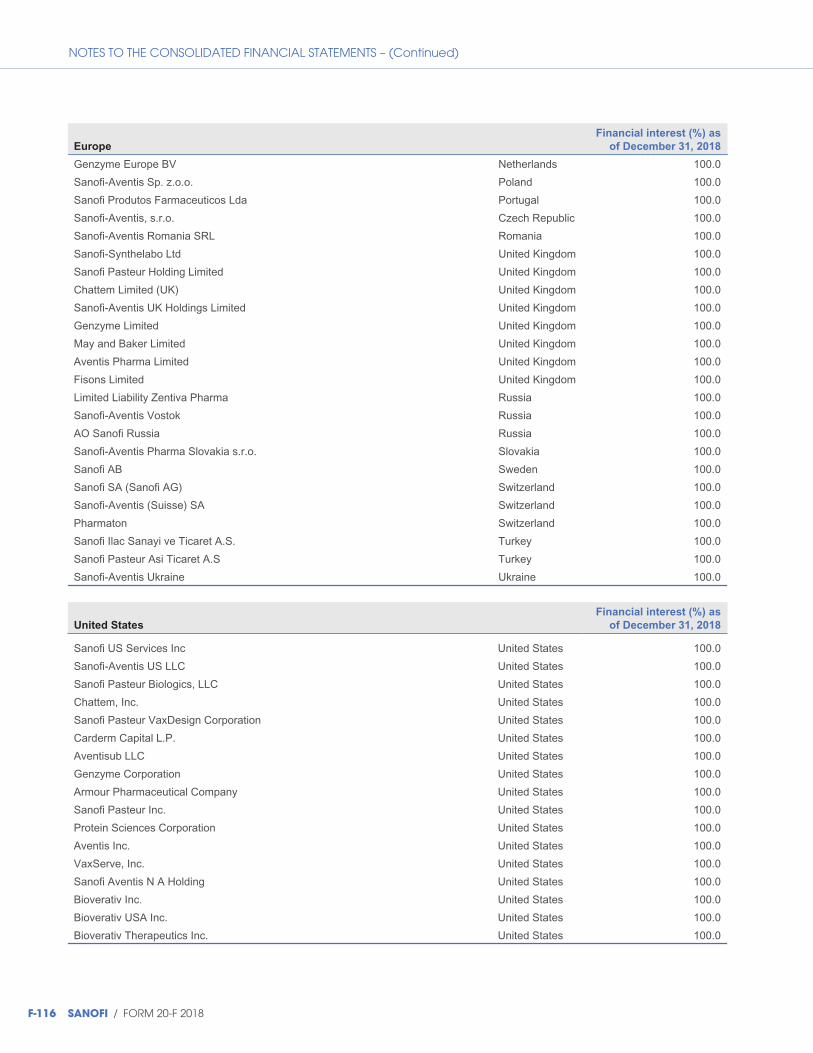
NOTES TO THE CONSOLIDATED FINANCIAL STATEMENTS – (Continued)
Europe
Financial interest (%) as
of December 31, 2018
Genzyme Europe BV Netherlands 100.0
Sanofi-Aventis Sp. z.o.o. Poland 100.0
Sanofi Produtos Farmaceuticos Lda Portugal 100.0
Sanofi-Aventis, s.r.o. Czech Republic 100.0
Sanofi-Aventis Romania SRL Romania 100.0
Sanofi-Synthelabo Ltd United Kingdom 100.0
Sanofi Pasteur Holding Limited United Kingdom 100.0
Chattem Limited (UK) United Kingdom 100.0
Sanofi-Aventis UK Holdings Limited United Kingdom 100.0
Genzyme Limited United Kingdom 100.0
May and Baker Limited United Kingdom 100.0
Aventis Pharma Limited United Kingdom 100.0
Fisons Limited United Kingdom 100.0
Limited Liability Zentiva Pharma Russia 100.0
Sanofi-Aventis Vostok Russia 100.0
AO Sanofi Russia Russia 100.0
Sanofi-Aventis Pharma Slovakia s.r.o. Slovakia 100.0
Sanofi AB Sweden 100.0
Sanofi SA (Sanofi AG) Switzerland 100.0
Sanofi-Aventis (Suisse) SA Switzerland 100.0
Pharmaton Switzerland 100.0
Sanofi Ilac Sanayi ve Ticaret A.S. Turkey 100.0
Sanofi Pasteur Asi Ticaret A.S Turkey 100.0
Sanofi-Aventis Ukraine Ukraine 100.0
United States
Financial interest (%) as
of December 31, 2018
Sanofi US Services Inc United States 100.0
Sanofi-Aventis US LLC United States 100.0
Sanofi Pasteur Biologics, LLC United States 100.0
Chattem, Inc. United States 100.0
Sanofi Pasteur VaxDesign Corporation United States 100.0
Carderm Capital L.P. United States 100.0
Aventisub LLC United States 100.0
Genzyme Corporation United States 100.0
Armour Pharmaceutical Company United States 100.0
Sanofi Pasteur Inc. United States 100.0
Protein Sciences Corporation United States 100.0
Aventis Inc. United States 100.0
VaxServe, Inc. United States 100.0
Sanofi Aventis N A Holding United States 100.0
Bioverativ Inc. United States 100.0
Bioverativ USA Inc. United States 100.0
Bioverativ Therapeutics Inc. United States 100.0
F-116 SANOFI / FORM 20-F 2018
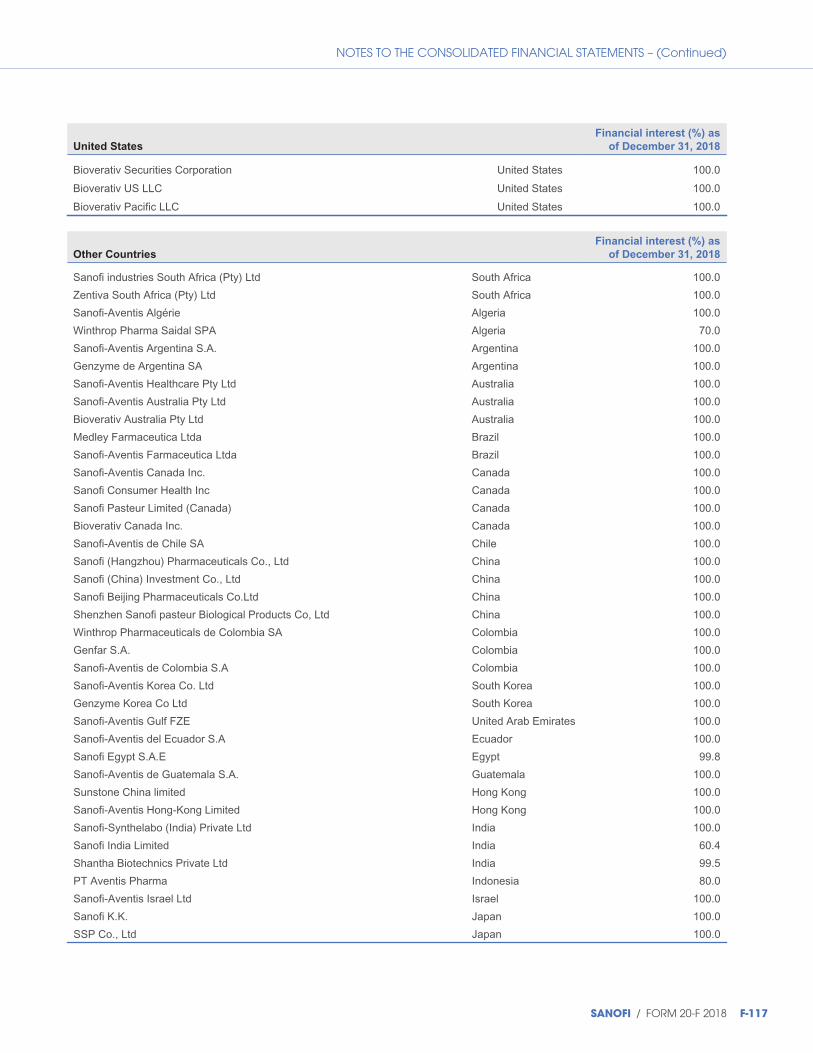
NOTES TO THE CONSOLIDATED FINANCIAL STATEMENTS – (Continued)
United States
Financial interest (%) as
of December 31, 2018
Bioverativ Securities Corporation United States 100.0
Bioverativ US LLC United States 100.0
Bioverativ Pacific LLC United States 100.0
Other Countries
Financial interest (%) as
of December 31, 2018
Sanofi industries South Africa (Pty) Ltd South Africa 100.0
Zentiva South Africa (Pty) Ltd South Africa 100.0
Sanofi-Aventis Algérie Algeria 100.0
Winthrop Pharma Saidal SPA Algeria 70.0
Sanofi-Aventis Argentina S.A. Argentina 100.0
Genzyme de Argentina SA Argentina 100.0
Sanofi-Aventis Healthcare Pty Ltd Australia 100.0
Sanofi-Aventis Australia Pty Ltd Australia 100.0
Bioverativ Australia Pty Ltd Australia 100.0
Medley Farmaceutica Ltda Brazil 100.0
Sanofi-Aventis Farmaceutica Ltda Brazil 100.0
Sanofi-Aventis Canada Inc. Canada 100.0
Sanofi Consumer Health Inc Canada 100.0
Sanofi Pasteur Limited (Canada) Canada 100.0
Bioverativ Canada Inc. Canada 100.0
Sanofi-Aventis de Chile SA Chile 100.0
Sanofi (Hangzhou) Pharmaceuticals Co., Ltd China 100.0
Sanofi (China) Investment Co., Ltd China 100.0
Sanofi Beijing Pharmaceuticals Co.Ltd China 100.0
Shenzhen Sanofi pasteur Biological Products Co, Ltd China 100.0
Winthrop Pharmaceuticals de Colombia SA Colombia 100.0
Genfar S.A. Colombia 100.0
Sanofi-Aventis de Colombia S.A Colombia 100.0
Sanofi-Aventis Korea Co. Ltd South Korea 100.0
Genzyme Korea Co Ltd South Korea 100.0
Sanofi-Aventis Gulf FZE United Arab Emirates 100.0
Sanofi-Aventis del Ecuador S.A Ecuador 100.0
Sanofi Egypt S.A.E Egypt 99.8
Sanofi-Aventis de Guatemala S.A. Guatemala 100.0
Sunstone China limited Hong Kong 100.0
Sanofi-Aventis Hong-Kong Limited Hong Kong 100.0
Sanofi-Synthelabo (India) Private Ltd India 100.0
Sanofi India Limited India 60.4
Shantha Biotechnics Private Ltd India 99.5
PT Aventis Pharma Indonesia 80.0
Sanofi-Aventis Israel Ltd Israel 100.0
Sanofi K.K. Japan 100.0
SSP Co., Ltd Japan 100.0
SANOFI / FORM 20-F 2018 F-117
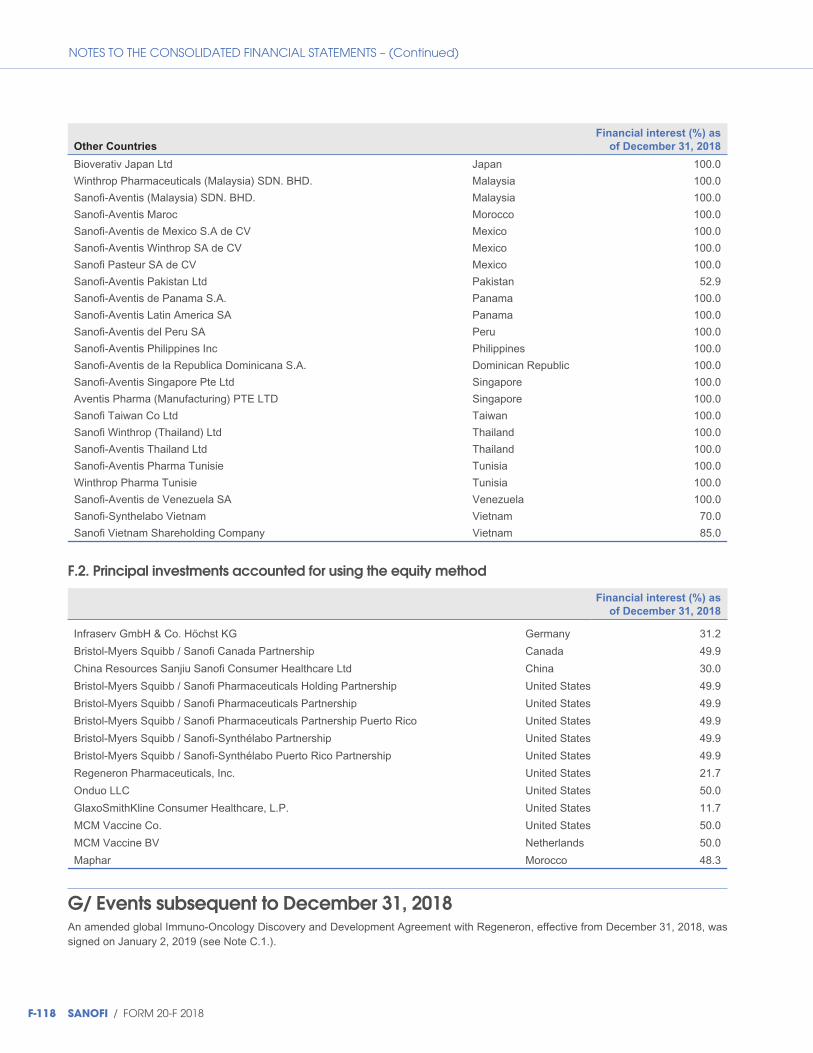
NOTES TO THE CONSOLIDATED FINANCIAL STATEMENTS – (Continued)
Other Countries
Financial interest (%) as
of December 31, 2018
Bioverativ Japan Ltd Japan 100.0
Winthrop Pharmaceuticals (Malaysia) SDN. BHD. Malaysia 100.0
Sanofi-Aventis (Malaysia) SDN. BHD. Malaysia 100.0
Sanofi-Aventis Maroc Morocco 100.0
Sanofi-Aventis de Mexico S.A de CV Mexico 100.0
Sanofi-Aventis Winthrop SA de CV Mexico 100.0
Sanofi Pasteur SA de CV Mexico 100.0
Sanofi-Aventis Pakistan Ltd Pakistan 52.9
Sanofi-Aventis de Panama S.A. Panama 100.0
Sanofi-Aventis Latin America SA Panama 100.0
Sanofi-Aventis del Peru SA Peru 100.0
Sanofi-Aventis Philippines Inc Philippines 100.0
Sanofi-Aventis de la Republica Dominicana S.A. Dominican Republic 100.0
Sanofi-Aventis Singapore Pte Ltd Singapore 100.0
Aventis Pharma (Manufacturing) PTE LTD Singapore 100.0
Sanofi Taiwan Co Ltd Taiwan 100.0
Sanofi Winthrop (Thailand) Ltd Thailand 100.0
Sanofi-Aventis Thailand Ltd Thailand 100.0
Sanofi-Aventis Pharma Tunisie Tunisia 100.0
Winthrop Pharma Tunisie Tunisia 100.0
Sanofi-Aventis de Venezuela SA Venezuela 100.0
Sanofi-Synthelabo Vietnam Vietnam 70.0
Sanofi Vietnam Shareholding Company Vietnam 85.0
F.2. Principal investments accounted for using the equity method
Financial interest (%) as
of December 31, 2018
Infraserv GmbH & Co. Höchst KG Germany 31.2
Bristol-Myers Squibb / Sanofi Canada Partnership Canada 49.9
China Resources Sanjiu Sanofi Consumer Healthcare Ltd China 30.0
Bristol-Myers Squibb / Sanofi Pharmaceuticals Holding Partnership United States 49.9
Bristol-Myers Squibb / Sanofi Pharmaceuticals Partnership United States 49.9
Bristol-Myers Squibb / Sanofi Pharmaceuticals Partnership Puerto Rico United States 49.9
Bristol-Myers Squibb / Sanofi-Synthélabo Partnership United States 49.9
Bristol-Myers Squibb / Sanofi-Synthélabo Puerto Rico Partnership United States 49.9
Regeneron Pharmaceuticals, Inc. United States 21.7
Onduo LLC United States 50.0
GlaxoSmithKline Consumer Healthcare, L.P. United States 11.7
MCM Vaccine Co. United States 50.0
MCM Vaccine BV Netherlands 50.0
Maphar Morocco 48.3
G/ Events subsequent to December 31, 2018An amended global Immuno-Oncology Discovery and Development Agreement with Regeneron, effective from December 31, 2018, wassigned on January 2, 2019 (see Note C.1.).
F-118 SANOFI / FORM 20-F 2018

Design and production:
English translation and language consultancy: Stephen Reynolds & Jane Lambert.
Photo credits: Front cover: ©Tang Ming Tung/GettyImages – p .139 : ©Marthe Lemelle – p. 140 : ©Denis Felix– p. 141 to 154 : ©Frank Parisot.

54, rue La Boétie 75008 Paris – France – Tel.: +33 (0)1 53 77 40 00 – www.sanofi.com