Embed Size (px)
Citation preview
UNITED STATESSECURITIES AND EXCHANGE COMMISSION
Washington, D.C. 20549
Form 10-Q(Mark One)
� QUARTERLY REPORT PURSUANT TO SECTION 13 OR 15(d) OF THE SECURITIES EXCHANGEACT OF 1934
For the quarterly period ended March 31, 2010
or
� TRANSITION REPORT PURSUANT TO SECTION 13 OR 15(d) OF THE SECURITIES EXCHANGEACT OF 1934
For the transition period from to
Commission File Number 1-8787
American International Group, Inc.(Exact name of registrant as specified in its charter)
Delaware 13-2592361(State or other jurisdiction of (I.R.S. Employerincorporation or organization) Identification No.)
70 Pine Street, New York, New York 10270(Address of principal executive offices) (Zip Code)
Registrant’s telephone number, including area code: (212) 770-7000
Former name, former address and former fiscal year, if changed since last report: Not applicable
Indicate by check mark whether the registrant (1) has filed all reports required to be filed by Section 13 or15(d) of the Securities Exchange Act of 1934 during the preceding 12 months (or for such shorter periodthat the registrant was required to file such reports), and (2) has been subject to such filing requirements forthe past 90 days. Yes � No �
Indicate by check mark whether the registrant has submitted electronically and posted on its corporateWeb site, if any, every Interactive Data File required to be submitted and posted pursuant to Rule 405 ofRegulation S-T (§232.405 of this chapter) during the preceding 12 months (or for such shorter period thatthe registrant was required to submit and post such files). Yes � No �
Indicate by check mark whether the registrant is a large accelerated filer, an accelerated filer, anon-accelerated filer, or a smaller reporting company. See the definitions of ‘‘large accelerated filer,’’‘‘accelerated filer’’ and ‘‘smaller reporting company’’ in Rule 12b-2 of the Exchange Act.
Large accelerated filer � Accelerated filer � Non-accelerated filer � Smaller reporting company �(Do not check if a smaller
reporting company)
Indicate by check mark whether the registrant is a shell company (as defined in Rule 12b-2 of theExchange Act). Yes � No �
As of April 30, 2010, there were 135,070,621 shares outstanding of the registrant’s common stock.

(This page intentionally left blank)
2
American International Group, Inc., and Subsidiaries
Table of Contents
Description Page Number
PART I – FINANCIAL INFORMATIONItem 1. Financial Statements (unaudited) 4Item 2. Management’s Discussion and Analysis of Financial Condition and Results of Operations 87Item 3. Quantitative and Qualitative Disclosures About Market Risk 177Item 4. Controls and Procedures 177
PART II – OTHER INFORMATIONItem 1. Legal Proceedings 178Item 1A. Risk Factors 178Item 6. Exhibits 178
Signatures 179
3
American International Group, Inc., and Subsidiaries
Part I – FINANCIAL INFORMATION
ITEM 1. Financial Statements (unaudited)
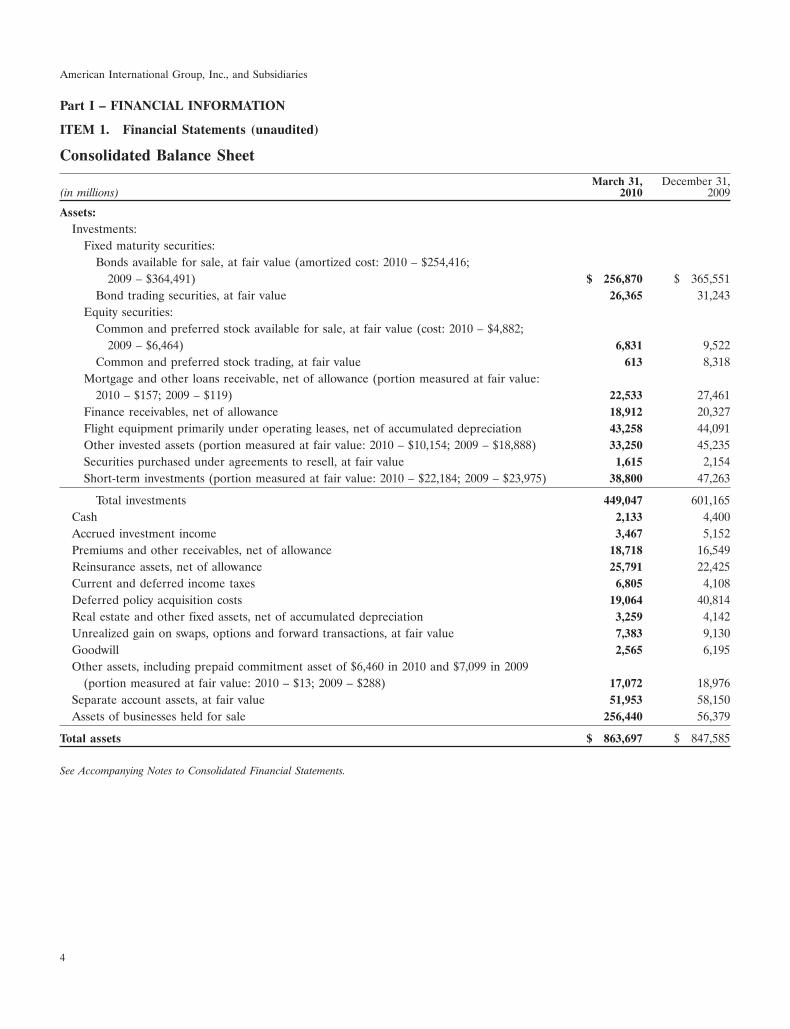
Consolidated Balance Sheet
March 31, December 31,(in millions) 2010 2009
Assets:Investments:
Fixed maturity securities:Bonds available for sale, at fair value (amortized cost: 2010 – $254,416;
2009 – $364,491) $ 256,870 $ 365,551Bond trading securities, at fair value 26,365 31,243
Equity securities:Common and preferred stock available for sale, at fair value (cost: 2010 – $4,882;
2009 – $6,464) 6,831 9,522Common and preferred stock trading, at fair value 613 8,318
Mortgage and other loans receivable, net of allowance (portion measured at fair value:2010 – $157; 2009 – $119) 22,533 27,461
Finance receivables, net of allowance 18,912 20,327Flight equipment primarily under operating leases, net of accumulated depreciation 43,258 44,091Other invested assets (portion measured at fair value: 2010 – $10,154; 2009 – $18,888) 33,250 45,235Securities purchased under agreements to resell, at fair value 1,615 2,154Short-term investments (portion measured at fair value: 2010 – $22,184; 2009 – $23,975) 38,800 47,263
Total investments 449,047 601,165Cash 2,133 4,400Accrued investment income 3,467 5,152Premiums and other receivables, net of allowance 18,718 16,549Reinsurance assets, net of allowance 25,791 22,425Current and deferred income taxes 6,805 4,108Deferred policy acquisition costs 19,064 40,814Real estate and other fixed assets, net of accumulated depreciation 3,259 4,142Unrealized gain on swaps, options and forward transactions, at fair value 7,383 9,130Goodwill 2,565 6,195Other assets, including prepaid commitment asset of $6,460 in 2010 and $7,099 in 2009
(portion measured at fair value: 2010 – $13; 2009 – $288) 17,072 18,976Separate account assets, at fair value 51,953 58,150Assets of businesses held for sale 256,440 56,379
Total assets $ 863,697 $ 847,585
See Accompanying Notes to Consolidated Financial Statements.
4

American International Group, Inc., and Subsidiaries
Consolidated Balance Sheet (Continued)
March 31, December 31,(in millions, except share data) 2010 2009
Liabilities:Liability for unpaid claims and claims adjustment expense $ 86,489 $ 85,386Unearned premiums 26,350 21,363Future policy benefits for life and accident and health insurance contracts 47,752 116,001Policyholder contract deposits (portion measured at fair value: 2010 – $641; 2009 – $5,214) 142,932 220,128Other policyholder funds 7,493 13,252Commissions, expenses and taxes payable 2,874 4,950Insurance balances payable 4,004 4,393Funds held by companies under reinsurance treaties 708 774Securities sold under agreements to repurchase (portion measured at fair value: 2010 –
$3,418; 2009 – $3,221) 3,418 3,505Securities and spot commodities sold but not yet purchased, at fair value 458 1,030Unrealized loss on swaps, options and forward transactions, at fair value 6,296 5,403Trust deposits and deposits due to banks and other depositors (portion measured at fair
value: 2010 – $16; 2009 – $15) 1,030 1,641Other liabilities 21,015 22,503Federal Reserve Bank of New York Commercial Paper Funding Facility (portion measured
at fair value: 2010 – $2,285; 2009 – $2,742) 2,285 4,739Federal Reserve Bank of New York credit facility 27,400 23,435Other long-term debt (portion measured at fair value: 2010 – $12,800; 2009 – $13,195) 109,744 113,298Separate account liabilities 51,953 58,150Liabilities of businesses held for sale 217,837 48,599
Total liabilities 760,038 748,550
Commitments, contingencies and guarantees (see Note 9)Redeemable noncontrolling interests in partially owned consolidated subsidiaries (including
$1,270 and $211 associated with businesses held for sale in 2010 and 2009, respectively) 1,940 959AIG shareholders’ equity:
Preferred stockSeries E; $5.00 par value; shares issued: 2010 and 2009 – 400,000, at aggregate liquidation
value 41,605 41,605Series F; $5.00 par value; shares issued: 2010 and 2009 – 300,000, aggregate liquidation
value: 2010 – $7,543; 2009 – $5,344 7,378 5,179Series C; $5.00 par value; shares issued: 2010 and 2009 – 100,000, aggregate liquidation
value: 2010 and 2009 – $0.5 23,000 23,000Common stock, $2.50 par value; 5,000,000,000 shares authorized; shares issued: 2010 –
141,605,834; 2009 – 141,732,263 354 354Treasury stock, at cost; 2010 – 6,661,350; 2009 – 6,661,356 shares of common stock (874) (874)Additional paid-in capital 6,356 6,358Accumulated deficit (9,871) (11,491)Accumulated other comprehensive income 7,053 5,693
Total AIG shareholders’ equity 75,001 69,824
Noncontrolling interests:Noncontrolling nonvoting, callable, junior and senior preferred interests held by Federal
Reserve Bank of New York 25,059 24,540Other (including $374 and $2,234 associated with businesses held for sale in 2010 and 2009,
respectively) 1,659 3,712
Total noncontrolling interests 26,718 28,252
Total equity 101,719 98,076
Total liabilities and equity $ 863,697 $ 847,585
See Accompanying Notes to Consolidated Financial Statements.
5
American International Group, Inc., and Subsidiaries
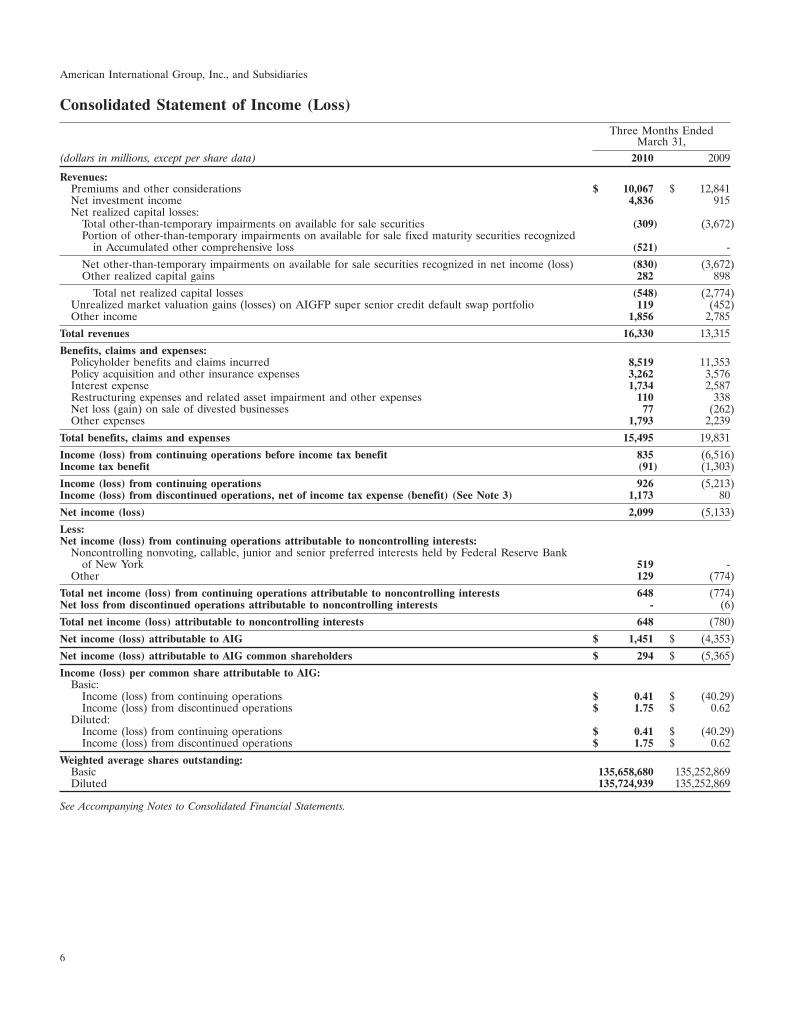
Consolidated Statement of Income (Loss)
Three Months EndedMarch 31,
(dollars in millions, except per share data) 2010 2009
Revenues:Premiums and other considerations $ 10,067 $ 12,841Net investment income 4,836 915Net realized capital losses:
Total other-than-temporary impairments on available for sale securities (309) (3,672)Portion of other-than-temporary impairments on available for sale fixed maturity securities recognized
in Accumulated other comprehensive loss (521) -
Net other-than-temporary impairments on available for sale securities recognized in net income (loss) (830) (3,672)Other realized capital gains 282 898
Total net realized capital losses (548) (2,774)Unrealized market valuation gains (losses) on AIGFP super senior credit default swap portfolio 119 (452)Other income 1,856 2,785
Total revenues 16,330 13,315
Benefits, claims and expenses:Policyholder benefits and claims incurred 8,519 11,353Policy acquisition and other insurance expenses 3,262 3,576Interest expense 1,734 2,587Restructuring expenses and related asset impairment and other expenses 110 338Net loss (gain) on sale of divested businesses 77 (262)Other expenses 1,793 2,239
Total benefits, claims and expenses 15,495 19,831
Income (loss) from continuing operations before income tax benefit 835 (6,516)Income tax benefit (91) (1,303)
Income (loss) from continuing operations 926 (5,213)Income (loss) from discontinued operations, net of income tax expense (benefit) (See Note 3) 1,173 80
Net income (loss) 2,099 (5,133)
Less:Net income (loss) from continuing operations attributable to noncontrolling interests:
Noncontrolling nonvoting, callable, junior and senior preferred interests held by Federal Reserve Bankof New York 519 -
Other 129 (774)
Total net income (loss) from continuing operations attributable to noncontrolling interests 648 (774)Net loss from discontinued operations attributable to noncontrolling interests - (6)
Total net income (loss) attributable to noncontrolling interests 648 (780)
Net income (loss) attributable to AIG $ 1,451 $ (4,353)
Net income (loss) attributable to AIG common shareholders $ 294 $ (5,365)
Income (loss) per common share attributable to AIG:Basic:
Income (loss) from continuing operations $ 0.41 $ (40.29)Income (loss) from discontinued operations $ 1.75 $ 0.62
Diluted:Income (loss) from continuing operations $ 0.41 $ (40.29)Income (loss) from discontinued operations $ 1.75 $ 0.62
Weighted average shares outstanding:Basic 135,658,680 135,252,869Diluted 135,724,939 135,252,869
See Accompanying Notes to Consolidated Financial Statements.
6
American International Group, Inc., and Subsidiaries
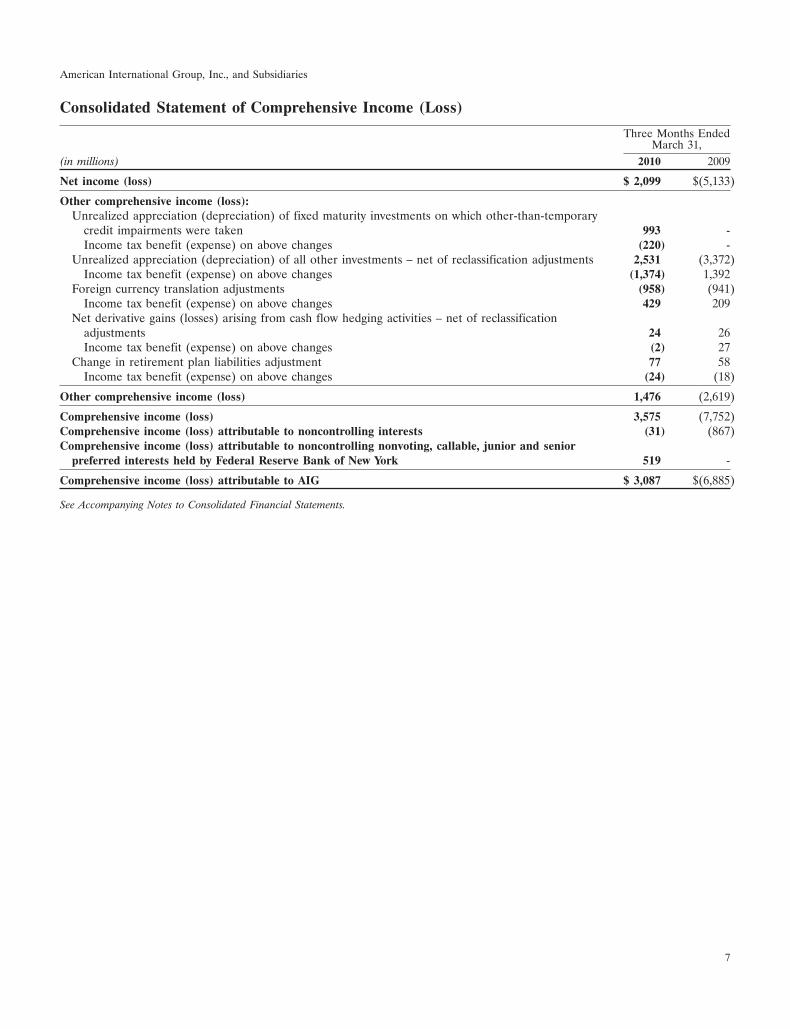
Consolidated Statement of Comprehensive Income (Loss)
Three Months EndedMarch 31,
(in millions) 2010 2009
Net income (loss) $ 2,099 $(5,133)
Other comprehensive income (loss):Unrealized appreciation (depreciation) of fixed maturity investments on which other-than-temporary
credit impairments were taken 993 -Income tax benefit (expense) on above changes (220) -
Unrealized appreciation (depreciation) of all other investments – net of reclassification adjustments 2,531 (3,372)Income tax benefit (expense) on above changes (1,374) 1,392
Foreign currency translation adjustments (958) (941)Income tax benefit (expense) on above changes 429 209
Net derivative gains (losses) arising from cash flow hedging activities – net of reclassificationadjustments 24 26Income tax benefit (expense) on above changes (2) 27
Change in retirement plan liabilities adjustment 77 58Income tax benefit (expense) on above changes (24) (18)
Other comprehensive income (loss) 1,476 (2,619)
Comprehensive income (loss) 3,575 (7,752)Comprehensive income (loss) attributable to noncontrolling interests (31) (867)Comprehensive income (loss) attributable to noncontrolling nonvoting, callable, junior and senior
preferred interests held by Federal Reserve Bank of New York 519 -
Comprehensive income (loss) attributable to AIG $ 3,087 $(6,885)
See Accompanying Notes to Consolidated Financial Statements.
7
American International Group, Inc., and Subsidiaries
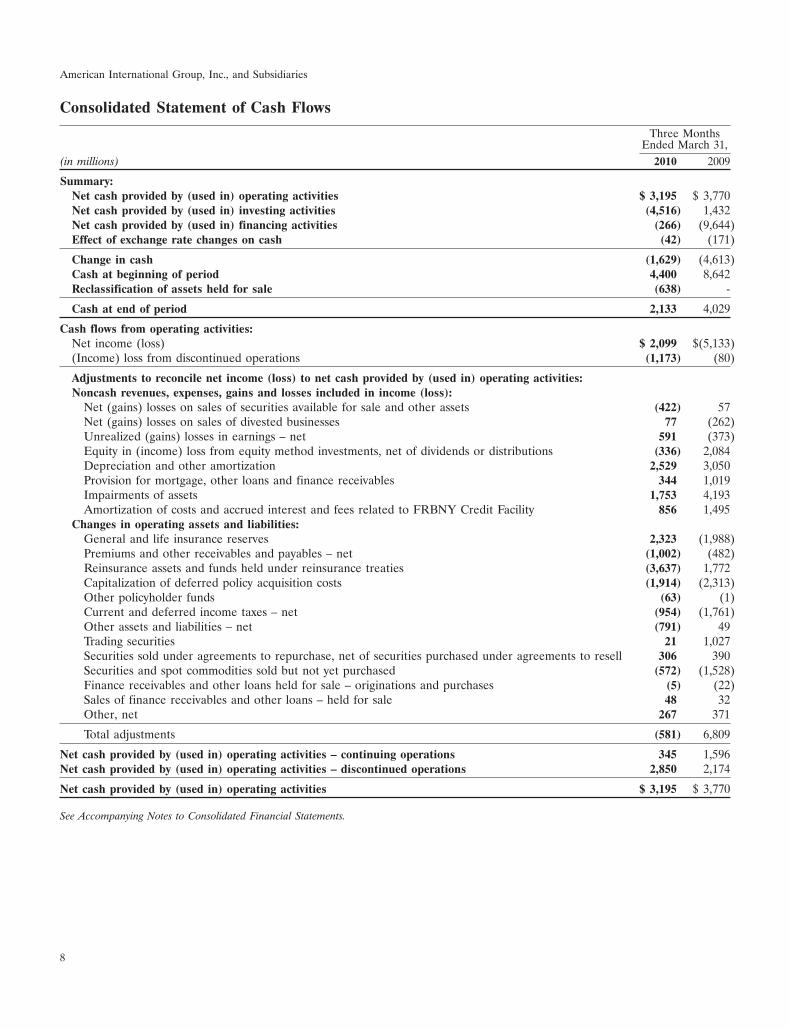
Consolidated Statement of Cash Flows
Three MonthsEnded March 31,
(in millions) 2010 2009
Summary:Net cash provided by (used in) operating activities $ 3,195 $ 3,770Net cash provided by (used in) investing activities (4,516) 1,432Net cash provided by (used in) financing activities (266) (9,644)Effect of exchange rate changes on cash (42) (171)
Change in cash (1,629) (4,613)Cash at beginning of period 4,400 8,642Reclassification of assets held for sale (638) -
Cash at end of period 2,133 4,029
Cash flows from operating activities:Net income (loss) $ 2,099 $(5,133)(Income) loss from discontinued operations (1,173) (80)
Adjustments to reconcile net income (loss) to net cash provided by (used in) operating activities:Noncash revenues, expenses, gains and losses included in income (loss):
Net (gains) losses on sales of securities available for sale and other assets (422) 57Net (gains) losses on sales of divested businesses 77 (262)Unrealized (gains) losses in earnings – net 591 (373)Equity in (income) loss from equity method investments, net of dividends or distributions (336) 2,084Depreciation and other amortization 2,529 3,050Provision for mortgage, other loans and finance receivables 344 1,019Impairments of assets 1,753 4,193Amortization of costs and accrued interest and fees related to FRBNY Credit Facility 856 1,495
Changes in operating assets and liabilities:General and life insurance reserves 2,323 (1,988)Premiums and other receivables and payables – net (1,002) (482)Reinsurance assets and funds held under reinsurance treaties (3,637) 1,772Capitalization of deferred policy acquisition costs (1,914) (2,313)Other policyholder funds (63) (1)Current and deferred income taxes – net (954) (1,761)Other assets and liabilities – net (791) 49Trading securities 21 1,027Securities sold under agreements to repurchase, net of securities purchased under agreements to resell 306 390Securities and spot commodities sold but not yet purchased (572) (1,528)Finance receivables and other loans held for sale – originations and purchases (5) (22)Sales of finance receivables and other loans – held for sale 48 32Other, net 267 371
Total adjustments (581) 6,809
Net cash provided by (used in) operating activities – continuing operations 345 1,596Net cash provided by (used in) operating activities – discontinued operations 2,850 2,174
Net cash provided by (used in) operating activities $ 3,195 $ 3,770
See Accompanying Notes to Consolidated Financial Statements.
8
American International Group, Inc., and Subsidiaries
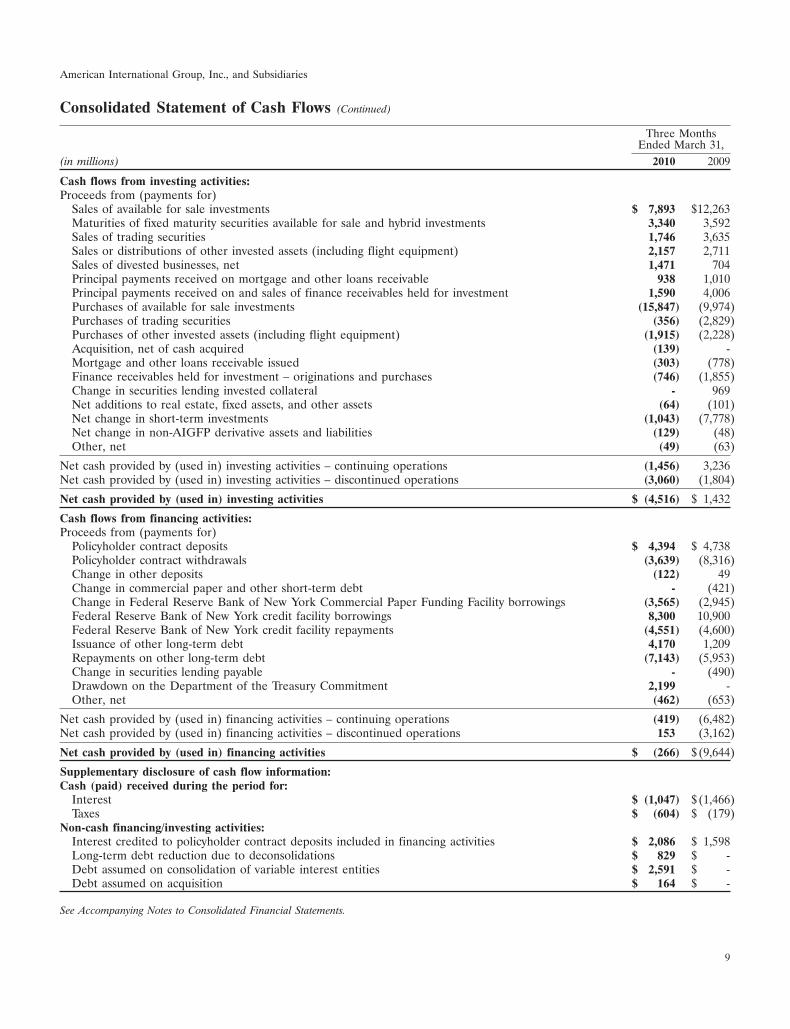
Consolidated Statement of Cash Flows (Continued)
Three MonthsEnded March 31,
(in millions) 2010 2009
Cash flows from investing activities:Proceeds from (payments for)
Sales of available for sale investments $ 7,893 $12,263Maturities of fixed maturity securities available for sale and hybrid investments 3,340 3,592Sales of trading securities 1,746 3,635Sales or distributions of other invested assets (including flight equipment) 2,157 2,711Sales of divested businesses, net 1,471 704Principal payments received on mortgage and other loans receivable 938 1,010Principal payments received on and sales of finance receivables held for investment 1,590 4,006Purchases of available for sale investments (15,847) (9,974)Purchases of trading securities (356) (2,829)Purchases of other invested assets (including flight equipment) (1,915) (2,228)Acquisition, net of cash acquired (139) -Mortgage and other loans receivable issued (303) (778)Finance receivables held for investment – originations and purchases (746) (1,855)Change in securities lending invested collateral - 969Net additions to real estate, fixed assets, and other assets (64) (101)Net change in short-term investments (1,043) (7,778)Net change in non-AIGFP derivative assets and liabilities (129) (48)Other, net (49) (63)
Net cash provided by (used in) investing activities – continuing operations (1,456) 3,236Net cash provided by (used in) investing activities – discontinued operations (3,060) (1,804)
Net cash provided by (used in) investing activities $ (4,516) $ 1,432
Cash flows from financing activities:Proceeds from (payments for)
Policyholder contract deposits $ 4,394 $ 4,738Policyholder contract withdrawals (3,639) (8,316)Change in other deposits (122) 49Change in commercial paper and other short-term debt - (421)Change in Federal Reserve Bank of New York Commercial Paper Funding Facility borrowings (3,565) (2,945)Federal Reserve Bank of New York credit facility borrowings 8,300 10,900Federal Reserve Bank of New York credit facility repayments (4,551) (4,600)Issuance of other long-term debt 4,170 1,209Repayments on other long-term debt (7,143) (5,953)Change in securities lending payable - (490)Drawdown on the Department of the Treasury Commitment 2,199 -Other, net (462) (653)
Net cash provided by (used in) financing activities – continuing operations (419) (6,482)Net cash provided by (used in) financing activities – discontinued operations 153 (3,162)
Net cash provided by (used in) financing activities $ (266) $(9,644)
Supplementary disclosure of cash flow information:Cash (paid) received during the period for:
Interest $ (1,047) $(1,466)Taxes $ (604) $ (179)
Non-cash financing/investing activities:Interest credited to policyholder contract deposits included in financing activities $ 2,086 $ 1,598Long-term debt reduction due to deconsolidations $ 829 $ -Debt assumed on consolidation of variable interest entities $ 2,591 $ -Debt assumed on acquisition $ 164 $ -
See Accompanying Notes to Consolidated Financial Statements.
9
American International Group, Inc., and Subsidiaries
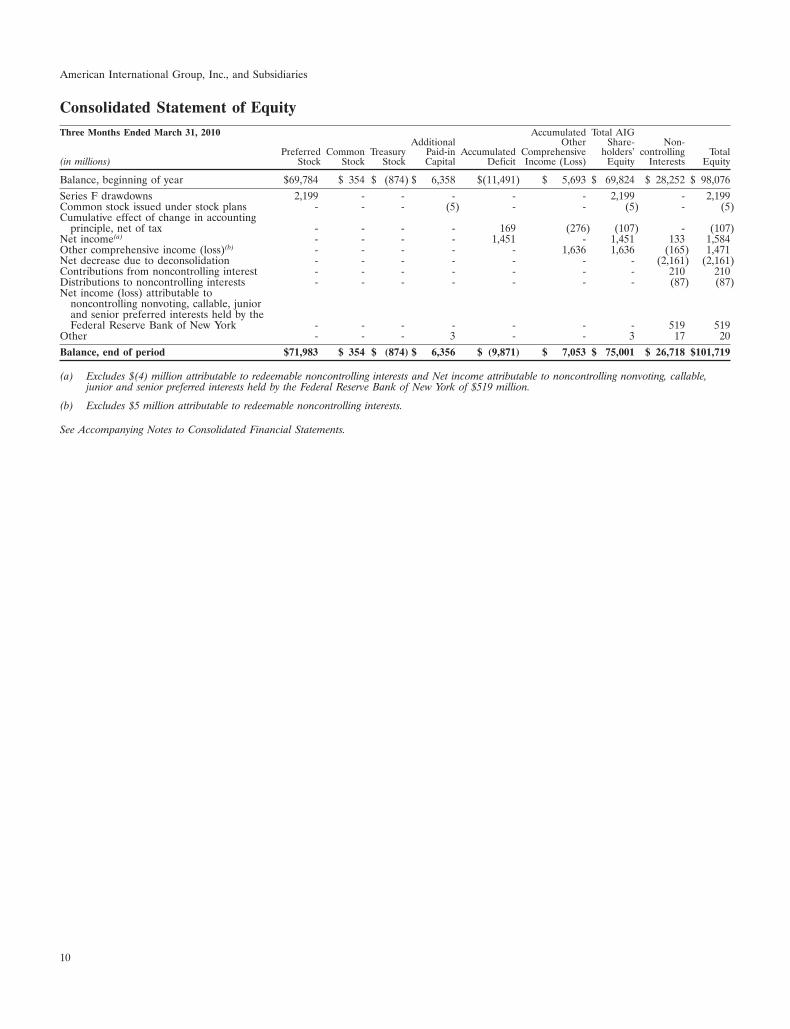
Consolidated Statement of EquityThree Months Ended March 31, 2010 Accumulated Total AIG
Additional Other Share- Non-Preferred Common Treasury Paid-in Accumulated Comprehensive holders’ controlling Total
(in millions) Stock Stock Stock Capital Deficit Income (Loss) Equity Interests Equity
Balance, beginning of year $69,784 $ 354 $ (874) $ 6,358 $(11,491) $ 5,693 $ 69,824 $ 28,252 $ 98,076Series F drawdowns 2,199 - - - - - 2,199 - 2,199Common stock issued under stock plans - - - (5) - - (5) - (5)Cumulative effect of change in accounting
principle, net of tax - - - - 169 (276) (107) - (107)Net income(a) - - - - 1,451 - 1,451 133 1,584Other comprehensive income (loss)(b) - - - - - 1,636 1,636 (165) 1,471Net decrease due to deconsolidation - - - - - - - (2,161) (2,161)Contributions from noncontrolling interest - - - - - - - 210 210Distributions to noncontrolling interests - - - - - - - (87) (87)Net income (loss) attributable to
noncontrolling nonvoting, callable, juniorand senior preferred interests held by theFederal Reserve Bank of New York - - - - - - - 519 519
Other - - - 3 - - 3 17 20Balance, end of period $71,983 $ 354 $ (874) $ 6,356 $ (9,871) $ 7,053 $ 75,001 $ 26,718 $101,719
(a) Excludes $(4) million attributable to redeemable noncontrolling interests and Net income attributable to noncontrolling nonvoting, callable,junior and senior preferred interests held by the Federal Reserve Bank of New York of $519 million.
(b) Excludes $5 million attributable to redeemable noncontrolling interests.
See Accompanying Notes to Consolidated Financial Statements.
10
American International Group, Inc., and Subsidiaries
NOTES TO CONSOLIDATED FINANCIAL STATEMENTS (unaudited)
1. Summary of Significant Accounting Policies
Basis of Presentation
These unaudited condensed consolidated financial statements do not include all disclosures required byaccounting principles generally accepted in the United States (GAAP) for complete consolidated financialstatements and should be read in conjunction with the audited consolidated financial statements and the relatednotes included in the Annual Report on Form 10-K of American International Group, Inc. (AIG) for the yearended December 31, 2009 (2009 Annual Report on Form 10-K).
In the opinion of management, these consolidated financial statements contain the normal recurring adjustmentsnecessary for a fair statement of the results presented herein. AIG evaluated the need to disclose events thatoccurred subsequent to the balance sheet date. All material intercompany accounts and transactions have beeneliminated.
Use of Estimates
The preparation of financial statements in conformity with GAAP requires the application of accounting policiesthat often involve a significant degree of judgment. AIG considers its accounting policies that are most dependenton the application of estimates and assumptions, and therefore viewed as critical accounting estimates, are thoserelating to items considered by management in the determination of:
• AIG’s ability to continue as a going concern;
• liability for general insurance unpaid claims and claims adjustment expenses;
• future policy benefits for life and accident and health contracts;
• recoverability of deferred policy acquisition costs (DAC);
• estimated gross profits for investment-oriented products;
• the allowance for finance receivable losses;
• flight equipment recoverability;
• other-than-temporary impairments;
• goodwill impairment;
• liabilities for legal contingencies;
• estimates with respect to income taxes, including recoverability of deferred tax assets;
• fair value measurements of certain financial assets and liabilities, including credit default swaps (CDS) andAIG’s economic interest in Maiden Lane II LLC (ML II) and equity interest in Maiden Lane III LLC (MLIII) (together, the Maiden Lane Interests);
• classification of entities as held-for-sale or as discontinued operations; and
• fair value of the assets and liabilities, including non-controlling interests, related to acquisitions.
These accounting estimates require the use of assumptions about matters, some of which are highly uncertain atthe time of estimation. To the extent actual experience differs from the assumptions used, AIG’s consolidatedfinancial condition, results of operations and cash flows would be materially affected.
Out of Period Adjustments
For the three months ended March 31, 2010, AIG recorded out of period adjustments relating to prior yearsthat decreased Net income attributable to AIG by $158 million, primarily related to the effect of recording
11
American International Group, Inc., and Subsidiaries
NOTES TO CONSOLIDATED FINANCIAL STATEMENTS (unaudited)
impairments on certain consolidated investments held in the Institutional Asset Management operations, whichaffected the calculation of income taxes. While these adjustments were noteworthy for the quarter, after evaluatingthe quantitative and qualitative aspects of these corrections, AIG concluded that its prior period financialstatements were not materially misstated and, therefore, no restatement was required.
Had these and all previously reported out of period adjustments been recorded in their appropriate periods, thenet loss attributable to AIG for the year ended December 31, 2009 would have increased by $604 million, from$10.9 billion to $11.5 billion.
Going Concern Considerations
In the audited financial statements included in the 2009 Annual Report on Form 10-K, management disclosedthe conditions and events that led management to conclude that AIG would have adequate liquidity to financeand operate AIG’s businesses, execute its asset disposition plan and repay its obligations for at least the nexttwelve months.
Liquidity of Parent and Subsidiaries
AIG manages liquidity at both the parent and subsidiary levels. AIG Parent has not had access to its traditionalsources of financing through the public debt markets. While no assurance can be given that AIG will be able toaccess its traditional sources of long-term or short-term financing through the public markets again, AIGperiodically evaluates its ability to access the capital markets.
Historically, AIG depended on dividends, distributions, and other payments from subsidiaries to fund paymentson its obligations. In light of AIG’s current financial situation, certain of its regulated subsidiaries are restrictedfrom making dividend payments, or advancing funds, to AIG. As a result, AIG has also been dependent on theFederal Reserve Bank of New York (FRBNY) Credit Facility (the FRBNY Credit Facility) provided by theFRBNY under the Credit Agreement, dated as of September 22, 2008 (as amended, the FRBNY CreditAgreement), between AIG and the FRBNY, and the FRBNY’s Commercial Paper Funding Facility (CPFF),through April 26, 2010, as its primary sources of liquidity; and on the agreement by the United States Departmentof the Treasury (the Department of the Treasury) to provide up to $29.835 billion (Department of TreasuryCommitment) in exchange for increases in the liquidation preference of the AIG Series F Fixed RateNon-Cumulative Perpetual Preferred Stock, par value $5.00 per share (AIG Series F Preferred Stock), to supportthe capital needs of its insurance company subsidiaries. Primary uses of cash flow are debt service and subsidiaryfunding.
During the first four months of 2010, International Lease Finance Corporation (ILFC) and American GeneralFinance, Inc. (AGF) made substantial progress in addressing their liquidity needs. During March and April of2010, ILFC significantly increased its liquidity position through a combination of new secured and unsecured debtissuances of approximately $4.0 billion and an extension of the maturity date of $2.16 billion of its $2.5 billionrevolving credit facility from October 2011 to October 2012. Availability of $550 million of the approximately$4.0 billion of debt issuances and the extension of $2.16 billion of the revolving credit facility are subject to thesatisfaction of certain collateralization milestones. In addition, in April 2010, ILFC signed an agreement to sell53 aircraft with an aggregate book value of approximately $2.3 billion, which is expected to generateapproximately $2.0 billion in gross proceeds during 2010. As of March 31, 2010, none of these aircraft met thecriteria to be recorded as held-for-sale. During March and April of 2010, AGF significantly enhanced its liquidityposition through the following actions: AGF received cash proceeds of more than $500 million from a $1.0 billionasset securitization in March 2010 and executed and drew down fully a $3.0 billion secured term loan transactionin April 2010. AGF used a portion of the proceeds from these transactions, cash on hand and proceeds fromAIG’s repayment of two demand promissory notes to repay all of its outstanding obligations under its $2.45 billionone-year term loans in March 2010 and its $2.125 billion five-year revolving credit facility in April 2010 (both ofwhich were due in July 2010).
12
American International Group, Inc., and Subsidiaries
NOTES TO CONSOLIDATED FINANCIAL STATEMENTS (unaudited)
Certain subsidiaries also have been dependent on the FRBNY and the Department of the Treasury to meetcollateral posting requirements, to make debt repayments as amounts come due, and to meet capital or liquidityrequirements.
Progress on Management’s Plans for Stabilization of AIG and Repayment of AIG’s Obligations as They Come Due
Since September 2008, AIG has been working to protect and enhance the value of its key businesses, execute anorderly asset disposition plan, and position itself for the future. AIG continually reassesses this plan to maximizevalue while maintaining flexibility in managing its liquidity and capital, and expects to accomplish these objectivesover a longer time frame than originally contemplated.
Sales of Businesses and Specific Asset Dispositions
AIA Sale
As of March 1, 2010, AIG and AIA Aurora LLC, a special purpose vehicle formed by AIG and the FRBNY(AIA Holdings), entered into a definitive agreement (the AIA Share Purchase Agreement) with Prudential plc(Prudential) and Prudential Group Limited (formerly known as Petrohue (UK) Investments Limited), for the saleof AIA Group Limited (AIA) to Prudential Group Limited for approximately $35.5 billion, consisting of$25 billion in cash, approximately $5.5 billion in face value of ordinary shares in the capital of Prudential GroupLimited, $3 billion in face value of mandatory convertible securities of Prudential Group Limited, and $2 billion inface value of preferred stock of Prudential (or at Prudential’s election, Prudential Group Limited), subject toclosing adjustments. The obligations of Prudential Group Limited under the AIA Share Purchase Agreement areguaranteed by Prudential.
The cash portion of the proceeds from the sale will be paid to the FRBNY to redeem preferred interests with aliquidation preference of approximately $16 billion plus accrued but unpaid preferred returns held by the FRBNYin AIA Holdings, and, unless otherwise agreed with the FRBNY, to repay approximately $9 billion under theFRBNY Credit Facility. AIG intends to monetize the $10.5 billion in face value of Prudential securities over time,subject to market conditions, following the lapse of agreed-upon minimum holding periods. Unless otherwiseagreed with the FRBNY, net cash proceeds from the monetization of these securities will be used to repay anyoutstanding debt under the FRBNY Credit Facility.
ALICO Sale
As of March 7, 2010, AIG and ALICO Holdings LLC, a special purpose vehicle formed by AIG and theFRBNY (ALICO Holdings), entered into a definitive agreement (the ALICO Stock Purchase Agreement) withMetLife, Inc. (MetLife) for the sale of American Life Insurance Company (ALICO) by ALICO Holdings toMetLife, and the sale of Delaware American Life Insurance Company by AIG to MetLife, for approximately$15.5 billion, consisting of $6.8 billion in cash and the remainder in equity securities of MetLife, subject to closingadjustments.
The cash portion of the proceeds from the sale will be paid to the FRBNY to reduce the liquidation preferenceof a portion of the preferred interests owned by the FRBNY in ALICO Holdings and ALICO Holdings will holdthe remainder of the transaction consideration, consisting of 78,239,712 shares of MetLife common stock,6,857,000 shares of newly issued participating preferred stock convertible into 68,570,000 shares of common stockupon the approval of MetLife shareholders, and 40,000,000 equity units of MetLife with an aggregate stated valueof $3 billion. AIG intends to monetize these MetLife securities over time, subject to market conditions, followingthe lapse of agreed-upon minimum holding periods. Unless otherwise agreed with the FRBNY, net cash proceedsfrom the monetization of these securities will be used to reduce the liquidation preference of the preferredinterests owned by the FRBNY in ALICO Holdings and thereafter to repay any outstanding debt under theFRBNY Credit Facility.
13
American International Group, Inc., and Subsidiaries
NOTES TO CONSOLIDATED FINANCIAL STATEMENTS (unaudited)
Dispositions of certain businesses will be subject to regulatory approval. Unless a waiver is obtained from theFRBNY, net proceeds from these dispositions, to the extent they do not represent capital of AIG’s insurancesubsidiaries required for regulatory or ratings purposes or are not to be utilized to redeem the preferred interestsheld by the FRBNY in AIA Holdings and ALICO Holdings, are contractually required to be applied toward therepayment of the FRBNY Credit Facility as mandatory prepayments.
Since September 2008 and through April 28, 2010, AIG entered into agreements to sell or completed the saleof other operations and assets, excluding AIA, ALICO and the assets held by AIG Financial Products Corp. andAIG Trading Group Inc. and their respective subsidiaries (collectively, AIGFP), that had aggregate assets andliabilities with carrying values of $95.5 billion and $77.5 billion, respectively, at March 31, 2010 or the date of sale.Of these amounts, pending transactions with aggregate assets and liabilities of $54.7 billion and $49.2 billion,respectively, at March 31, 2010 are expected to generate approximately $709 million of aggregate net cashproceeds that will be available to reduce the amount of the FRBNY Credit Facility, after taking into accounttaxes, transaction expenses, settlement of intercompany loan facilities, and capital required to be retained forregulatory or ratings purposes. Gains and losses recorded in connection with the dispositions of businesses includeestimates that are subject to subsequent adjustment. Based on the transactions closed to date, AIG does notbelieve that such adjustments will be material to future consolidated results of operations or cash flows.
Management’s Assessment and Conclusion
In assessing AIG’s current financial position and developing operating plans for the future, management hasmade significant judgments and estimates with respect to the potential financial and liquidity effects of AIG’s risksand uncertainties, including but not limited to:
• the commitment of the FRBNY and the Department of the Treasury to the orderly restructuring of AIGand their commitment to continuing to work with AIG to maintain its ability to meet its obligations as theycome due;
• the potential adverse effects on AIG’s businesses that could result if there are further downgrades by ratingagencies, including in particular, the uncertainty of estimates relating to the derivative transactions ofAIGFP, such as estimates of both the number of counterparties who may elect to terminate undercontractual termination provisions and the amount that would be required to be paid in the event of adowngrade;
• the potential for delays in asset dispositions and reduction in the anticipated proceeds therefrom;
• the potential for declines in bond and equity markets;
• pending sales of significant subsidiaries;
• the potential effect on AIG if the capital levels of its regulated and unregulated subsidiaries proveinadequate to support current business plans;
• the effect on AIG’s businesses of continued compliance with the covenants of the FRBNY CreditAgreement and other agreements with the FRBNY and the Department of the Treasury;
• AIG’s highly leveraged capital structure;
• the effect of the provisions of the Troubled Asset Relief Program (TARP) Standards for Compensation andCorporate Governance and the Determination Memoranda issued by the Office of the Special Master forTARP Executive Compensation with respect to AIG’s compensation practices and structures on AIG’s abilityto retain and motivate key employees or hire new employees;
• the potential that loss of key personnel could reduce the value of AIG’s business and impair its ability tostabilize businesses and effect a successful asset disposition plan; and
14
American International Group, Inc., and Subsidiaries
NOTES TO CONSOLIDATED FINANCIAL STATEMENTS (unaudited)
• the potential for regulatory actions in one or more countries, including possible actions resulting from theexecution of management’s plans for stabilization of AIG and repayment of AIG’s obligations as they comedue.
Based on the U.S. government’s continuing commitment, the already completed transactions and the otherexpected transactions with the FRBNY, management’s plans and progress made to stabilize AIG’s businesses anddispose of certain assets, and after consideration of the risks and uncertainties of such plans, management believesthat it will have adequate liquidity to finance and operate AIG’s businesses, execute its asset disposition plan andrepay its obligations for at least the next twelve months.
It is possible that the actual outcome of one or more of management’s plans could be materially different, orthat one or more of management’s significant judgments or estimates about the potential effects of these risks anduncertainties could prove to be materially incorrect or that the transactions with the FRBNY discussed above failto achieve the desired objectives. If one or more of these possible outcomes is realized and third party financing isnot available, AIG may need additional U.S. government support to meet its obligations as they come due. Underthese adverse assumptions, without additional support from the U.S. government in the future there could existsubstantial doubt about AIG’s ability to continue as a going concern.
In connection with making the going concern assessment and conclusion, management and the Board ofDirectors of AIG have confirmed in connection with the filing in February 2010 of the 2009 Annual Report onForm 10-K that ‘‘As first stated by the U.S. Treasury and the Federal Reserve in connection with theannouncement of the AIG Restructuring Plan on March 2, 2009, the U.S. Government remains committed tocontinuing to work with AIG to maintain its ability to meet its obligations as they come due.’’
AIG’s consolidated financial statements have been prepared on a going concern basis, which contemplates therealization of assets and the satisfaction of liabilities in the normal course of business. These consolidated financialstatements do not include any adjustments relating to the recoverability and classification of recorded assets orrelating to the amounts and classification of liabilities that may be necessary should AIG be unable to continue asa going concern.
Accounting Policies
Transfers of Financial Assets
Securities purchased (sold) under agreements to resell (repurchase), at contract value: Securities purchased underagreements to resell and Securities sold under agreements to repurchase (other than those entered into byAIGFP) generally are accounted for as collateralized borrowing or lending transactions and are recorded at theircontracted resale or repurchase amounts plus accrued interest. AIGFP carries such agreements at fair value basedon market observable interest rates and credit spreads. AIG’s policy is to take possession of or obtain a securityinterest in securities purchased under agreements to resell.
When AIG does not obtain cash collateral sufficient to fund substantially all of the cost of purchasing identicalreplacement securities during the term of the contract, AIG accounts for the transaction as a sale of the securityand reports the obligation to repurchase the security as a derivative contract. Where securities are carried in theavailable for sale category, AIG records a gain or loss in income. Where changes in fair value of securities arerecognized through income, no additional gain or loss is recognized. The fair value of securities transferred underrepurchase agreements accounted for as sales was $2.1 billion and $2.3 billion at March 31, 2010 andDecember 31, 2009, respectively, and the related cash collateral obtained was $1.7 billion and $1.5 billion atMarch 31, 2010 and December 31, 2009, respectively.
AIG minimizes the risk that counterparties to transactions might be unable to fulfill their contractual obligationsby monitoring customer credit exposure and collateral value and generally requiring additional collateral to bedeposited with AIG when necessary.
15
American International Group, Inc., and Subsidiaries
NOTES TO CONSOLIDATED FINANCIAL STATEMENTS (unaudited)
Securities lending invested collateral, at fair value and Securities lending payable: In 2008, AIG exited the domesticsecurities lending program, and as of March 31, 2010, AIG had exited its foreign securities lending activities.
Recent Accounting Standards
Accounting Changes
AIG adopted the following accounting standards during the first quarter of 2010:
Accounting for Transfers of Financial Assets
In June 2009, the Financial Accounting Standards Board (FASB) issued an accounting standard addressing transfersof financial assets that removes the concept of a qualifying special-purpose entity (QSPE) from the FASB AccountingStandards Codification and removes the exception that exempted transferors from applying the consolidation rules toQSPEs. The new standard is effective for interim and annual periods beginning on January 1, 2010 for AIG. Earlierapplication is prohibited. The adoption of this standard increased both assets and liabilities by approximately$1.3 billion as a result of consolidating two previously unconsolidated QSPEs. The adoption of this new standard didnot have a material effect on AIG’s consolidated results of operations or cash flows.
Consolidation of Variable Interest Entities
In June 2009, the FASB issued an accounting standard that amends the rules addressing consolidation of certainvariable interest entities with an approach focused on identifying which enterprise has the power to direct theactivities of a variable interest entity that most significantly affect the entity’s economic performance and has(1) the obligation to absorb losses of the entity or (2) the right to receive benefits from the entity. The newstandard also requires enhanced financial reporting by enterprises involved with variable interest entities.
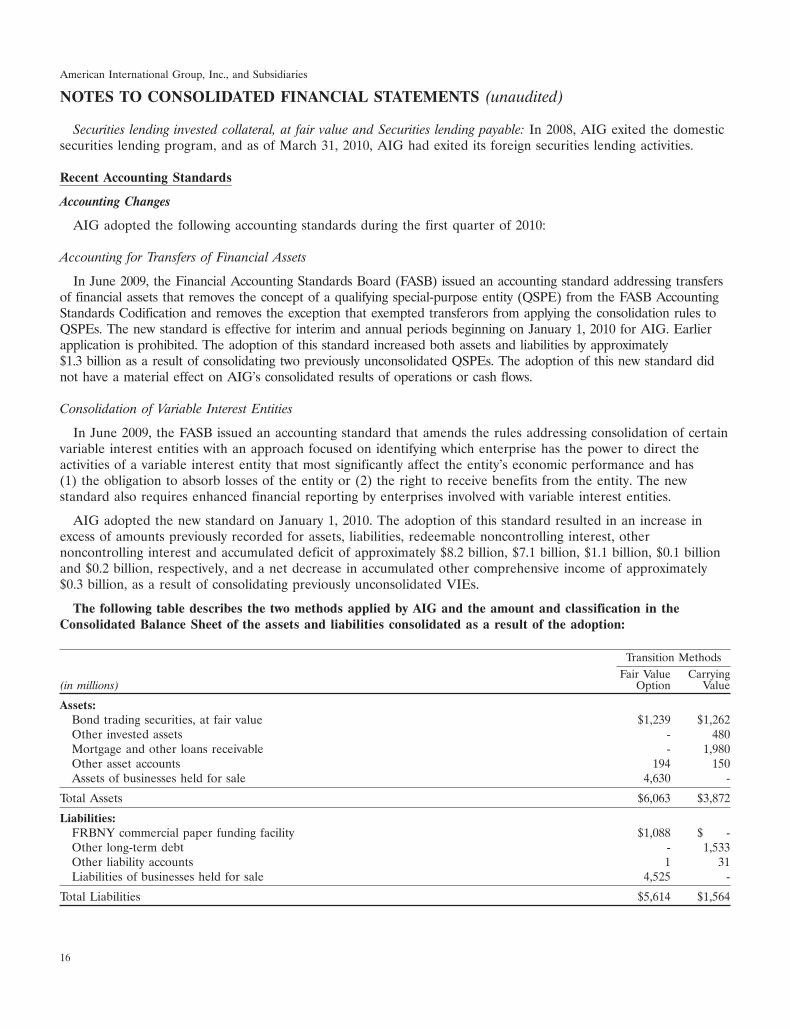
AIG adopted the new standard on January 1, 2010. The adoption of this standard resulted in an increase inexcess of amounts previously recorded for assets, liabilities, redeemable noncontrolling interest, othernoncontrolling interest and accumulated deficit of approximately $8.2 billion, $7.1 billion, $1.1 billion, $0.1 billionand $0.2 billion, respectively, and a net decrease in accumulated other comprehensive income of approximately$0.3 billion, as a result of consolidating previously unconsolidated VIEs.
The following table describes the two methods applied by AIG and the amount and classification in theConsolidated Balance Sheet of the assets and liabilities consolidated as a result of the adoption:
Transition MethodsFair Value Carrying
(in millions) Option Value
Assets:Bond trading securities, at fair value $1,239 $1,262Other invested assets - 480Mortgage and other loans receivable - 1,980Other asset accounts 194 150Assets of businesses held for sale 4,630 -
Total Assets $6,063 $3,872
Liabilities:FRBNY commercial paper funding facility $1,088 $ -Other long-term debt - 1,533Other liability accounts 1 31Liabilities of businesses held for sale 4,525 -
Total Liabilities $5,614 $1,564
16
American International Group, Inc., and Subsidiaries
NOTES TO CONSOLIDATED FINANCIAL STATEMENTS (unaudited)
The cumulative effect adjustment of electing the fair value option was not material to AIG’s accumulated deficit.
In February 2010, the FASB also issued an update to the aforementioned accounting standard that defers therevised consolidation rules for variable interest entities with attributes of, or similar to, an investment company ormoney market fund. The primary effect of this deferral for AIG is that AIG will continue to apply theconsolidation rules in effect before the amended guidance discussed above for its interests in eligible entities, suchas certain mutual funds.
Future Application of Accounting Standards
In March 2010, the FASB issued an accounting standard that amends the scope for embedded credit derivativefeatures related to the redistribution of credit risk in the form of subordination of one financial instrument toanother in a securitization vehicle. The new standard clarifies how to determine which embedded credit derivativefeatures, including those in collateralized debt obligations (CDOs), credit linked notes (CLNs) and syntheticCDOs and CLNs, are considered to be embedded derivatives that should not be analyzed for potential bifurcationand separate accounting. The new standard is effective for interim and annual periods beginning on July 1, 2010for AIG. AIG is assessing the effect adopting this new standard will have on its consolidated financial condition,results of operations, and cash flows.
2. Segment Information
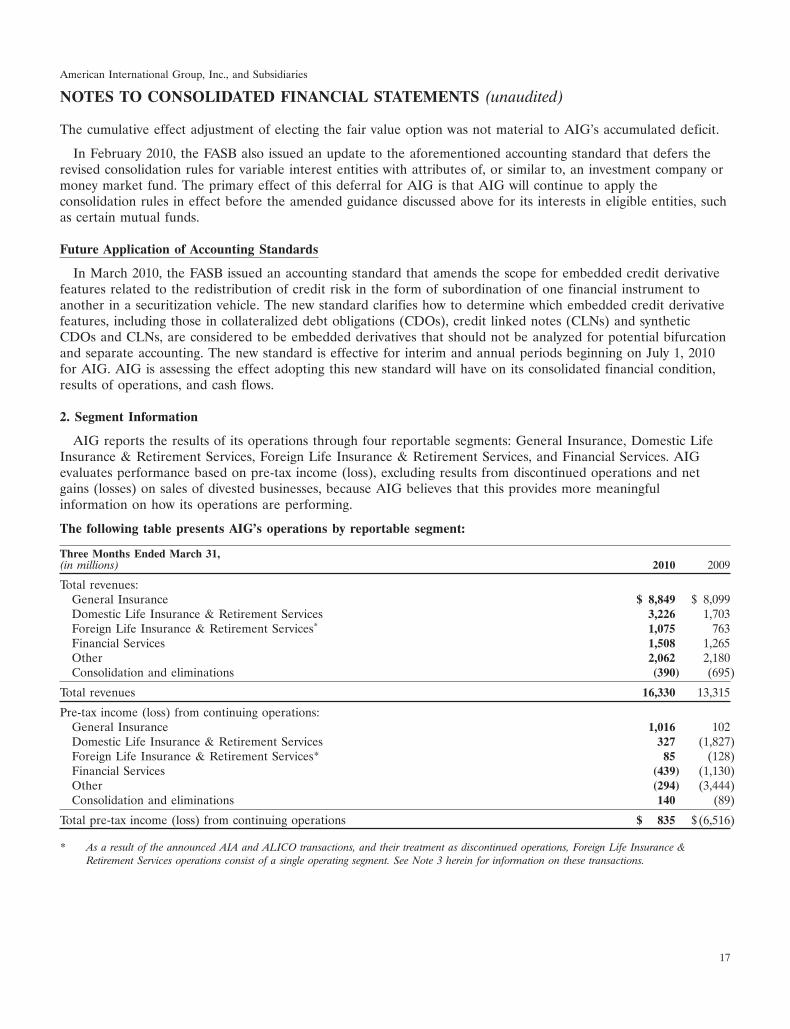
AIG reports the results of its operations through four reportable segments: General Insurance, Domestic LifeInsurance & Retirement Services, Foreign Life Insurance & Retirement Services, and Financial Services. AIGevaluates performance based on pre-tax income (loss), excluding results from discontinued operations and netgains (losses) on sales of divested businesses, because AIG believes that this provides more meaningfulinformation on how its operations are performing.
The following table presents AIG’s operations by reportable segment:
Three Months Ended March 31,(in millions) 2010 2009
Total revenues:General Insurance $ 8,849 $ 8,099Domestic Life Insurance & Retirement Services 3,226 1,703Foreign Life Insurance & Retirement Services* 1,075 763Financial Services 1,508 1,265Other 2,062 2,180Consolidation and eliminations (390) (695)
Total revenues 16,330 13,315
Pre-tax income (loss) from continuing operations:General Insurance 1,016 102Domestic Life Insurance & Retirement Services 327 (1,827)Foreign Life Insurance & Retirement Services* 85 (128)Financial Services (439) (1,130)Other (294) (3,444)Consolidation and eliminations 140 (89)
Total pre-tax income (loss) from continuing operations $ 835 $(6,516)
* As a result of the announced AIA and ALICO transactions, and their treatment as discontinued operations, Foreign Life Insurance &Retirement Services operations consist of a single operating segment. See Note 3 herein for information on these transactions.
17

American International Group, Inc., and Subsidiaries
NOTES TO CONSOLIDATED FINANCIAL STATEMENTS (unaudited)
The following table presents AIG’s operations by operating segment:
Three Months Ended March 31,(in millions) 2010 2009
General InsuranceTotal revenues:
Commercial Insurance $5,403 $ 5,024Foreign General Insurance 3,446 3,075
Total revenues $8,849 $ 8,099
Pre-tax income (loss):Commercial Insurance $ 730 $ (224)Foreign General Insurance 286 326
Total pre-tax income (loss) $1,016 $ 102
Domestic Life Insurance & Retirement ServicesTotal revenues:
Domestic Life Insurance $1,934 $ 1,526Domestic Retirement Services 1,292 177
Total revenues $3,226 $ 1,703
Pre-tax income (loss):Domestic Life Insurance $ 227 $ (298)Domestic Retirement Services 100 (1,529)
Total pre-tax income (loss) $ 327 $(1,827)
Financial ServicesTotal revenues:
Aircraft Leasing $ 882 $ 1,281Capital Markets (234) (969)Consumer Finance 779 813Other, including intercompany adjustments 81 140
Total revenues $1,508 $ 1,265
Pre-tax income (loss):Aircraft Leasing $ (81) $ 316Capital Markets (298) (1,121)Consumer Finance (25) (306)Other, including intercompany adjustments (35) (19)
Total pre-tax income (loss) $ (439) $(1,130)
OtherTotal revenues:
Parent & Other $1,119 $ 105Mortgage Guaranty 298 317Change in fair value of ML III 751 —Noncore Asset Management (19) (239)Other noncore insurance (17) 1,997Consolidation and eliminations (70) -
Total revenues $2,062 $ 2,180
Pre-tax income (loss):Parent & Other $ (645) $(2,057)Mortgage Guaranty 96 (480)Change in fair value of ML III 751 —Noncore Asset Management (463) (1,012)Other noncore insurance (33) 105
Total pre-tax income (loss) $ (294) $(3,444)
18
American International Group, Inc., and Subsidiaries
NOTES TO CONSOLIDATED FINANCIAL STATEMENTS (unaudited)
3. Discontinued Operations and Held-for-Sale Classification
Discontinued Operations
As discussed in Note 1 herein, during the first quarter of 2010, AIG entered into agreements to sell AIA andALICO. Also, on October 12, 2009, AIG entered into an agreement to sell its 97.57 percent share of Nan ShanLife Insurance Company, Ltd. (Nan Shan) for approximately $2.15 billion. AIG expects each of these sales toclose in 2010. These transactions met the criteria for held-for-sale and discontinued operations accounting.
Accordingly, results of operations for these companies are included as discontinued operations in AIG’sConsolidated Statement of Income (Loss) for all periods shown and their aggregated assets and liabilities arepresented separately as single line items in the asset and liability sections of the Consolidated Balance Sheet atMarch 31, 2010 for AIA and ALICO and at March 31, 2010 and December 31, 2009 for Nan Shan. Each of thesecompanies previously had been a component of the Foreign Life Insurance & Retirement Services reportablesegment.
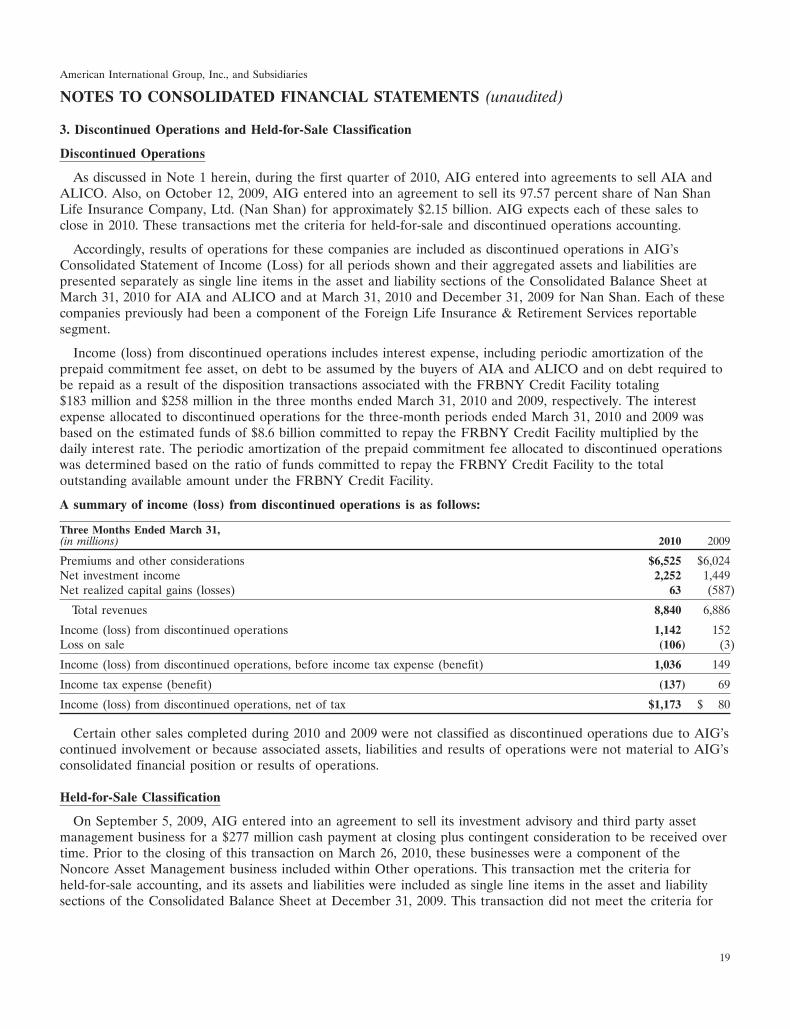
Income (loss) from discontinued operations includes interest expense, including periodic amortization of theprepaid commitment fee asset, on debt to be assumed by the buyers of AIA and ALICO and on debt required tobe repaid as a result of the disposition transactions associated with the FRBNY Credit Facility totaling$183 million and $258 million in the three months ended March 31, 2010 and 2009, respectively. The interestexpense allocated to discontinued operations for the three-month periods ended March 31, 2010 and 2009 wasbased on the estimated funds of $8.6 billion committed to repay the FRBNY Credit Facility multiplied by thedaily interest rate. The periodic amortization of the prepaid commitment fee allocated to discontinued operationswas determined based on the ratio of funds committed to repay the FRBNY Credit Facility to the totaloutstanding available amount under the FRBNY Credit Facility.
A summary of income (loss) from discontinued operations is as follows:
Three Months Ended March 31,(in millions) 2010 2009
Premiums and other considerations $6,525 $6,024Net investment income 2,252 1,449Net realized capital gains (losses) 63 (587)
Total revenues 8,840 6,886
Income (loss) from discontinued operations 1,142 152Loss on sale (106) (3)
Income (loss) from discontinued operations, before income tax expense (benefit) 1,036 149
Income tax expense (benefit) (137) 69
Income (loss) from discontinued operations, net of tax $1,173 $ 80
Certain other sales completed during 2010 and 2009 were not classified as discontinued operations due to AIG’scontinued involvement or because associated assets, liabilities and results of operations were not material to AIG’sconsolidated financial position or results of operations.
Held-for-Sale Classification
On September 5, 2009, AIG entered into an agreement to sell its investment advisory and third party assetmanagement business for a $277 million cash payment at closing plus contingent consideration to be received overtime. Prior to the closing of this transaction on March 26, 2010, these businesses were a component of theNoncore Asset Management business included within Other operations. This transaction met the criteria forheld-for-sale accounting, and its assets and liabilities were included as single line items in the asset and liabilitysections of the Consolidated Balance Sheet at December 31, 2009. This transaction did not meet the criteria for
19
American International Group, Inc., and Subsidiaries
NOTES TO CONSOLIDATED FINANCIAL STATEMENTS (unaudited)
discontinued operations accounting because of a significant continuation of activities between AIG and thebusiness sold.
On July 28, 2009, AIG entered into an agreement to combine its consumer finance business in Poland,conducted through AIG Bank Polska S.A., into the Polish consumer finance business of Santander ConsumerFinance S.A. (SCB). In exchange, AIG will receive an equity interest in SCB. The closing is expected to occur inthe second quarter of 2010. This transaction met the criteria for held-for-sale accounting and, as a result, its assetsand liabilities are included as single line items in the asset and liability sections of the Consolidated Balance Sheetat March 31, 2010 and December 31, 2009. AIG Bank Polska is a component of the Financial Services reportablesegment. This transaction did not meet the criteria for discontinued operations accounting because of AIG’sretained equity interest in SCB.
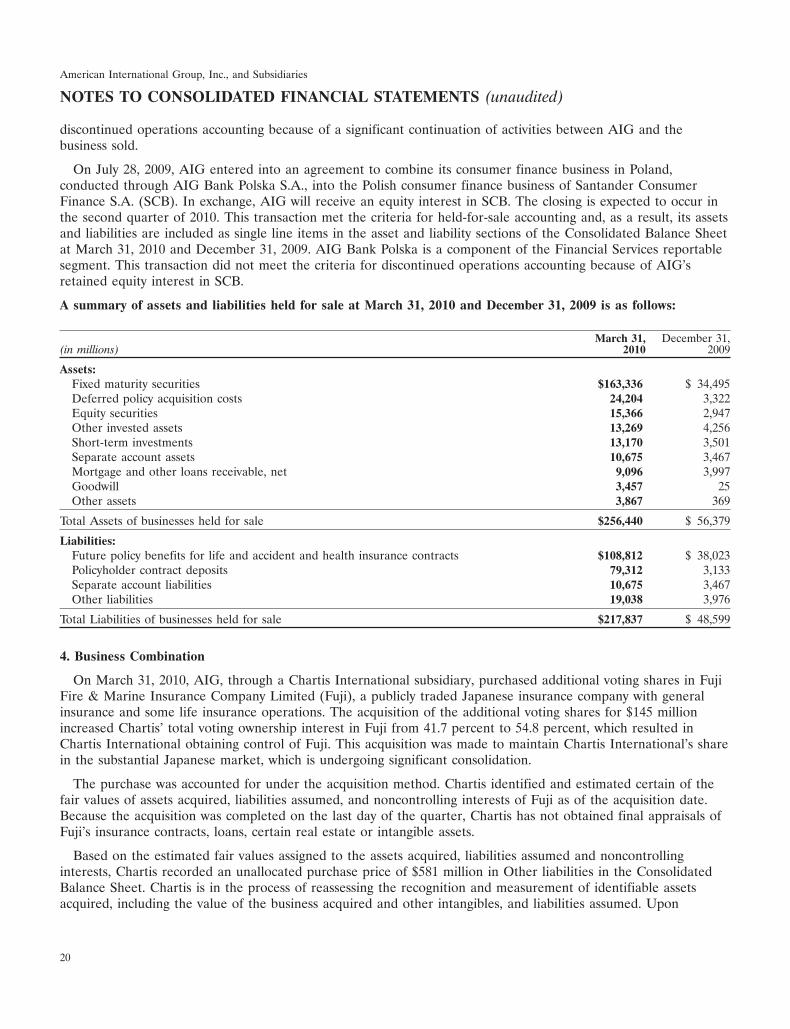
A summary of assets and liabilities held for sale at March 31, 2010 and December 31, 2009 is as follows:
March 31, December 31,(in millions) 2010 2009
Assets:Fixed maturity securities $163,336 $ 34,495Deferred policy acquisition costs 24,204 3,322Equity securities 15,366 2,947Other invested assets 13,269 4,256Short-term investments 13,170 3,501Separate account assets 10,675 3,467Mortgage and other loans receivable, net 9,096 3,997Goodwill 3,457 25Other assets 3,867 369
Total Assets of businesses held for sale $256,440 $ 56,379
Liabilities:Future policy benefits for life and accident and health insurance contracts $108,812 $ 38,023Policyholder contract deposits 79,312 3,133Separate account liabilities 10,675 3,467Other liabilities 19,038 3,976
Total Liabilities of businesses held for sale $217,837 $ 48,599
4. Business Combination
On March 31, 2010, AIG, through a Chartis International subsidiary, purchased additional voting shares in FujiFire & Marine Insurance Company Limited (Fuji), a publicly traded Japanese insurance company with generalinsurance and some life insurance operations. The acquisition of the additional voting shares for $145 millionincreased Chartis’ total voting ownership interest in Fuji from 41.7 percent to 54.8 percent, which resulted inChartis International obtaining control of Fuji. This acquisition was made to maintain Chartis International’s sharein the substantial Japanese market, which is undergoing significant consolidation.
The purchase was accounted for under the acquisition method. Chartis identified and estimated certain of thefair values of assets acquired, liabilities assumed, and noncontrolling interests of Fuji as of the acquisition date.Because the acquisition was completed on the last day of the quarter, Chartis has not obtained final appraisals ofFuji’s insurance contracts, loans, certain real estate or intangible assets.
Based on the estimated fair values assigned to the assets acquired, liabilities assumed and noncontrollinginterests, Chartis recorded an unallocated purchase price of $581 million in Other liabilities in the ConsolidatedBalance Sheet. Chartis is in the process of reassessing the recognition and measurement of identifiable assetsacquired, including the value of the business acquired and other intangibles, and liabilities assumed. Upon
20
American International Group, Inc., and Subsidiaries
NOTES TO CONSOLIDATED FINANCIAL STATEMENTS (unaudited)
completion of the reassessment process, Chartis will adjust the fair value of the assets acquired and liabilitiesassumed for any significant differences to the provisional fair values. An adjustment to the purchase priceallocation may also occur if new information on Fuji becomes known or discovered within one year from theacquisition date. To the extent an unallocated purchase price credit remains, AIG will record a bargain purchasegain. It is anticipated that any gain recognized will not be subject to U.S. or foreign income tax, because such gainwould only be recognized for tax purposes upon sale of the Fuji shares.
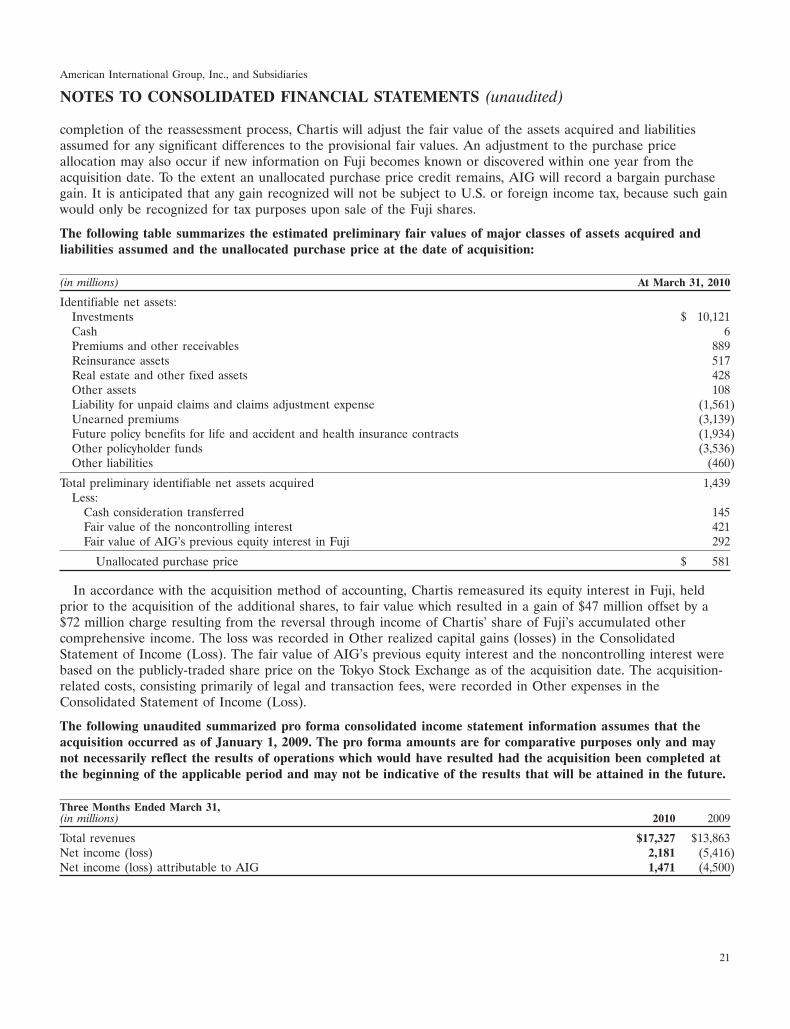
The following table summarizes the estimated preliminary fair values of major classes of assets acquired andliabilities assumed and the unallocated purchase price at the date of acquisition:
(in millions) At March 31, 2010
Identifiable net assets:Investments $ 10,121Cash 6Premiums and other receivables 889Reinsurance assets 517Real estate and other fixed assets 428Other assets 108Liability for unpaid claims and claims adjustment expense (1,561)Unearned premiums (3,139)Future policy benefits for life and accident and health insurance contracts (1,934)Other policyholder funds (3,536)Other liabilities (460)
Total preliminary identifiable net assets acquired 1,439Less:
Cash consideration transferred 145Fair value of the noncontrolling interest 421Fair value of AIG’s previous equity interest in Fuji 292
Unallocated purchase price $ 581
In accordance with the acquisition method of accounting, Chartis remeasured its equity interest in Fuji, heldprior to the acquisition of the additional shares, to fair value which resulted in a gain of $47 million offset by a$72 million charge resulting from the reversal through income of Chartis’ share of Fuji’s accumulated othercomprehensive income. The loss was recorded in Other realized capital gains (losses) in the ConsolidatedStatement of Income (Loss). The fair value of AIG’s previous equity interest and the noncontrolling interest werebased on the publicly-traded share price on the Tokyo Stock Exchange as of the acquisition date. The acquisition-related costs, consisting primarily of legal and transaction fees, were recorded in Other expenses in theConsolidated Statement of Income (Loss).
The following unaudited summarized pro forma consolidated income statement information assumes that theacquisition occurred as of January 1, 2009. The pro forma amounts are for comparative purposes only and maynot necessarily reflect the results of operations which would have resulted had the acquisition been completed atthe beginning of the applicable period and may not be indicative of the results that will be attained in the future.
Three Months Ended March 31,(in millions) 2010 2009
Total revenues $17,327 $13,863Net income (loss) 2,181 (5,416)Net income (loss) attributable to AIG 1,471 (4,500)
21
American International Group, Inc., and Subsidiaries
NOTES TO CONSOLIDATED FINANCIAL STATEMENTS (unaudited)
5. Fair Value Measurements
Fair Value Measurements on a Recurring Basis
AIG measures the following financial instruments at fair value on a recurring basis:
• trading and available for sale securities portfolios;
• certain mortgage and other loans receivable;
• derivative assets and liabilities;
• securities purchased/sold under agreements to resell/repurchase;
• non-traded equity investments and certain private limited partnerships and certain hedge funds included inother invested assets;
• certain short-term investments;
• separate and variable account assets;
• certain policyholder contract deposits;
• securities and spot commodities sold but not yet purchased;
• certain trust deposits and deposits due to banks and other depositors;
• certain CPFF;
• certain long-term debt; and
• certain hybrid financial instruments included in Other liabilities.
The fair value of a financial instrument is the amount that would be received to sell an asset or paid to transfera liability in an orderly transaction between willing, able and knowledgeable market participants at themeasurement date.
The degree of judgment used in measuring the fair value of financial instruments generally correlates with thelevel of pricing observability. Financial instruments with quoted prices in active markets generally have morepricing observability and less judgment is used in measuring fair value. Conversely, financial instruments traded inother-than-active markets or that do not have quoted prices have less observability and are measured at fair valueusing valuation models or other pricing techniques that require more judgment. An active market is one in whichtransactions for the asset or liability being valued occur with sufficient frequency and volume to provide pricinginformation on an ongoing basis. An other-than-active market is one in which there are few transactions, theprices are not current, price quotations vary substantially either over time or among market makers, or in whichlittle information is released publicly for the asset or liability being valued. Pricing observability is affected by anumber of factors, including the type of financial instrument, whether the financial instrument is new to themarket and not yet established, the characteristics specific to the transaction and general market conditions.
Fair Value Hierarchy
Assets and liabilities recorded at fair value in the Consolidated Balance Sheet are measured and classified in ahierarchy for disclosure purposes consisting of three ‘‘levels’’ based on the observability of inputs available in themarketplace used to measure the fair values as discussed below:
• Level 1: Fair value measurements that are quoted prices (unadjusted) in active markets that AIG has theability to access for identical assets or liabilities. Market price data generally is obtained from exchange ordealer markets. AIG does not adjust the quoted price for such instruments. Assets and liabilities measuredat fair value on a recurring basis and classified as Level 1 include certain government and agency securities,
22
American International Group, Inc., and Subsidiaries
NOTES TO CONSOLIDATED FINANCIAL STATEMENTS (unaudited)
actively traded listed common stocks and derivative contracts, most separate account assets and most mutualfunds.
• Level 2: Fair value measurements based on inputs other than quoted prices included in Level 1, that areobservable for the asset or liability, either directly or indirectly. Level 2 inputs include quoted prices forsimilar assets and liabilities in active markets, and inputs other than quoted prices that are observable forthe asset or liability, such as interest rates and yield curves that are observable at commonly quotedintervals. Assets and liabilities measured at fair value on a recurring basis and classified as Level 2 generallyinclude certain government and agency securities, most investment-grade and high-yield corporate bonds,certain residential mortgage-backed securities (RMBS), commercial mortgage-backed securities (CMBS) andcollateralized debt obligations/asset backed securities (CDO/ABS), certain listed equities, state, municipaland provincial obligations, hybrid securities, mutual fund and hedge fund investments, certain derivativecontracts, guaranteed investment agreements (GIAs) and CPFF at AIGFP, other long-term debt and physicalcommodities.
• Level 3: Fair value measurements based on valuation techniques that use significant inputs that areunobservable. These measurements include circumstances in which there is little, if any, market activity forthe asset or liability. In certain cases, the inputs used to measure fair value may fall into different levels ofthe fair value hierarchy. In such cases, the level in the fair value hierarchy within which the fair valuemeasurement in its entirety falls is determined based on the lowest level input that is significant to the fairvalue measurement in its entirety. AIG’s assessment of the significance of a particular input to the fair valuemeasurement in its entirety requires judgment. In making the assessment, AIG considers factors specific tothe asset or liability. Assets and liabilities measured at fair value on a recurring basis and classified asLevel 3 include certain RMBS, CMBS and CDO/ABS, corporate debt, certain municipal and sovereign debt,certain derivative contracts (including AIGFP’s super senior credit default swap portfolio), policyholdercontract deposits carried at fair value, private equity and real estate fund investments, and direct privateequity investments. AIG’s non-financial instrument assets that are measured at fair value on a non-recurringbasis generally are classified as Level 3.
The following is a description of the valuation methodologies used for instruments carried at fair value:
Valuation Methodologies
Incorporation of Credit Risk in Fair Value Measurements
• AIG’s Own Credit Risk. Fair value measurements for AIGFP’s debt, GIAs, structured note liabilities andfreestanding derivatives incorporate AIG’s own credit risk by determining the explicit cost for eachcounterparty to protect against its net credit exposure to AIG at the balance sheet date by reference toobservable AIG credit default swap or cash bond spreads. A counterparty’s net credit exposure to AIG isdetermined based on master netting agreements, when applicable, which take into consideration all positionswith AIG, as well as collateral posted by AIG with the counterparty at the balance sheet date.
Fair value measurements for embedded policy derivatives and policyholder contract deposits take intoconsideration that policyholder liabilities are senior in priority to general creditors of AIG and therefore aremuch less sensitive to changes in AIG credit default swap or cash issuance spreads.
• Counterparty Credit Risk. Fair value measurements for freestanding derivatives incorporate counterpartycredit by determining the explicit cost for AIG to protect against its net credit exposure to each counterpartyat the balance sheet date by reference to observable counterparty credit default swap spreads, whenavailable. When not available, other directly or indirectly observable credit spreads are used to derive thebest estimates of the counterparty spreads. AIG’s net credit exposure to a counterparty is determined basedon master netting agreements, which take into consideration all derivative positions with the counterparty, aswell as collateral posted by the counterparty at the balance sheet date.
23

American International Group, Inc., and Subsidiaries
NOTES TO CONSOLIDATED FINANCIAL STATEMENTS (unaudited)
A CDS is a derivative contract that allows the transfer of third party credit risk from one party to the other.The buyer of the CDS pays an upfront and/or annual premium to the seller. The seller’s payment obligation istriggered by the occurrence of a credit event under a specified reference security and is determined by the loss onthat specified reference security. The present value of the amount of the annual and/or upfront premium thereforerepresents a market-based expectation of the likelihood that the specified reference party will fail to perform onthe reference obligation, a key market observable indicator of non-performance risk (the CDS spread).
Fair values for fixed maturity securities based on observable market prices for identical or similar instrumentsimplicitly incorporate counterparty credit risk. Fair values for fixed maturity securities based on internal modelsincorporate counterparty credit risk by using discount rates that take into consideration cash issuance spreads forsimilar instruments or other observable information.
The cost of credit protection is determined under a discounted present value approach considering the marketlevels for single name CDS spreads for each specific counterparty, the mid market value of the net exposure(reflecting the amount of protection required) and the weighted average life of the net exposure. CDS spreads areprovided to AIG by an independent third party. AIG utilizes an interest rate based on the benchmark LondonInterbank Offered Rate (LIBOR) curve to derive its discount rates.
While this approach does not explicitly consider all potential future behavior of the derivative transactions orpotential future changes in valuation inputs, AIG believes this approach provides a reasonable estimate of the fairvalue of the assets and liabilities, including consideration of the impact of non-performance risk.
Fixed Maturity Securities — Trading and Available for Sale
AIG maximizes the use of observable inputs and minimizes the use of unobservable inputs when measuring fairvalue. Whenever available, AIG obtains quoted prices in active markets for identical assets at the balance sheetdate to measure at fair value fixed maturity securities in its trading and available for sale portfolios. Market pricedata is generally obtained from dealer markets.
AIG estimates the fair value of fixed maturity securities not traded in active markets, including receivables(payables) arising from securities purchased (sold) under agreements to resell (repurchase), and mortgage andother loans receivable for which AIG elected the fair value option, by referring to traded securities with similarattributes, using dealer quotations, a matrix pricing methodology, discounted cash flow analyses and/or internalvaluation models. This methodology considers such factors as the issuer’s industry, the security’s rating and tenor,its coupon rate, its position in the capital structure of the issuer, yield curves, credit curves, prepayment rates andother relevant factors. For certain fixed maturity instruments (for example, private placements) that are not tradedin active markets or that are subject to transfer restrictions, valuations are adjusted to reflect illiquidity and/ornon-transferability, and such adjustments generally are based on available market evidence. In the absence of suchevidence, management’s best estimate is used.
Maiden Lane II and Maiden Lane III
At their inception, ML II and ML III were valued and recorded at the transaction prices of $1 billion and$5 billion, respectively. Subsequently, the Maiden Lane Interests are valued using a discounted cash flowmethodology that uses the estimated future cash flows of the Maiden Lane assets. AIG applies model-determinedmarket discount rates to its interests. These discount rates are calibrated to the changes in the estimated assetvalues for the underlying assets commensurate with AIG’s interests in the capital structure of the respectiveentities. Estimated cash flows and discount rates used in the valuations are validated, to the extent possible, usingmarket observable information for securities with similar asset pools, structure and terms.
The fair value methodology used assumes that the underlying collateral in the Maiden Lane Interests willcontinue to be held and generate cash flows into the foreseeable future and does not assume a current liquidationof the assets underlying the Maiden Lane Interests. Other methodologies employed or assumptions made in
24

American International Group, Inc., and Subsidiaries
NOTES TO CONSOLIDATED FINANCIAL STATEMENTS (unaudited)
determining fair value for these investments could result in amounts that differ significantly from the amountsreported.
Adjustments to the fair value of AIG’s interest in ML II are recorded on the Consolidated Statement of Income(Loss) in Net investment income for AIG’s Domestic Life Insurance companies. Adjustments to the fair value ofAIG’s interest in ML III are recorded on the Consolidated Statement of Income (Loss) in Net investment incomeand, beginning in the second quarter of 2009, were included in Other Noncore business results, reflecting thecontribution to an AIG subsidiary. Prior to the second quarter of 2009, such amounts had been included in OtherParent company results. AIG’s Maiden Lane Interests are included in bond trading securities, at fair value, on theConsolidated Balance Sheet.
As of March 31, 2010, AIG expected to receive cash flows (undiscounted) in excess of AIG’s initial investment,and any accrued interest, in the Maiden Lane Interests over the remaining life of the investments after repaymentof the first priority obligations owed to the FRBNY. AIG’s cash flow methodology considers the capital structureof the collateral securities and their expected credit losses from the underlying asset pools. The fair values of theMaiden Lane Interests are most affected by changes in the discount rates and changes in the underlying estimatedfuture collateral cash flow assumptions used in the valuation model.
The LIBOR interest rate curve changes are determined based on observable prices, interpolated or extrapolatedto derive a LIBOR for a specific maturity term as necessary. The spreads over LIBOR for the Maiden LaneInterests (including collateral-specific credit and liquidity spreads) can change as a result of changes in marketexpectations about the future performance of these investments as well as changes in the risk premium thatmarket participants would demand at the time of the transactions.
Changes in estimated future cash flows would primarily be the result of changes in expectations for defaults,recoveries, and prepayments on underlying loans.
Changes in the discount rate or the estimated future cash flows used in the valuation would alter AIG’s estimateof the fair value of the Maiden Lane Interests as shown in the table below.
Fair Value ChangeMarch 31, 2010(in millions) Maiden Lane II Maiden Lane III
Discount Rates:200 basis point increase $ (90) $ (659)200 basis point decrease 101 769400 basis point increase (170) (1,225)400 basis point decrease 215 1,672
Estimated Future Cash Flows:10% increase 292 83310% decrease (296) (831)20% increase 579 1,66120% decrease (588) (1,653)
AIG believes that the ranges of discount rates used in these analyses are reasonable based on implied spreadvolatilities of similar collateral securities and implied volatilities of LIBOR interest rates. The ranges of estimatedfuture cash flows were determined based on variability in estimated future cash flows implied by cumulative lossestimates for similar instruments. Because of these factors, the fair values of the Maiden Lane Interests are likelyto vary, perhaps materially, from the amount estimated.
Equity Securities Traded in Active Markets — Trading and Available for Sale
AIG maximizes the use of observable inputs and minimizes the use of unobservable inputs when measuring fairvalue. Whenever available, AIG obtains quoted prices in active markets for identical assets at the balance sheet
25
American International Group, Inc., and Subsidiaries
NOTES TO CONSOLIDATED FINANCIAL STATEMENTS (unaudited)
date to measure at fair value marketable equity securities in its trading and available for sale portfolios. Marketprice data is generally obtained from exchange or dealer markets.
Direct Private Equity Investments — Other Invested Assets
AIG initially estimates the fair value of equity instruments not traded in active markets, which includes directprivate equity investments, by reference to the transaction price. This valuation is adjusted for changes in inputsand assumptions which are corroborated by evidence such as transactions in similar instruments, completed orpending third-party transactions in the underlying investment or comparable entities, subsequent rounds offinancing, recapitalizations and other transactions across the capital structure, offerings in the equity capitalmarkets, and/or changes in financial ratios or cash flows. For equity securities that are not traded in activemarkets or that are subject to transfer restrictions, valuations are adjusted to reflect illiquidity and/ornon-transferability and such adjustments generally are based on available market evidence. In the absence of suchevidence, management’s best estimate is used.
Hedge Funds, Private Equity Funds and Other Investment Partnerships — Other Invested Assets
AIG initially estimates the fair value of investments in certain hedge funds, private equity funds and otherinvestment partnerships by reference to the transaction price. Subsequently, AIG generally obtains the fair valueof these investments from net asset value information provided by the general partner or manager of theinvestments, the financial statements of which are generally audited annually. AIG considers observable marketdata and performs diligence procedures in validating the appropriateness of using the net asset value as a fairvalue measurement.
Separate Account Assets
Separate account assets are composed primarily of registered and unregistered open-end mutual funds thatgenerally trade daily and are measured at fair value in the manner discussed above for equity securities traded inactive markets.
Freestanding Derivatives
Derivative assets and liabilities can be exchange-traded or traded over-the-counter (OTC). AIG generally valuesexchange-traded derivatives using quoted prices in active markets for identical derivatives at the balance sheetdate.
OTC derivatives are valued using market transactions and other market evidence whenever possible, includingmarket-based inputs to models, model calibration to market clearing transactions, broker or dealer quotations oralternative pricing sources with reasonable levels of price transparency. When models are used, the selection of aparticular model to value an OTC derivative depends on the contractual terms of, and specific risks inherent inthe instrument, as well as the availability of pricing information in the market. AIG generally uses similar modelsto value similar instruments. Valuation models require a variety of inputs, including contractual terms, marketprices and rates, yield curves, credit curves, measures of volatility, prepayment rates and correlations of suchinputs. For OTC derivatives that trade in liquid markets, such as generic forwards, swaps and options, modelinputs can generally be corroborated by observable market data by correlation or other means, and modelselection does not involve significant management judgment.
Certain OTC derivatives trade in less liquid markets with limited pricing information, and the determination offair value for these derivatives is inherently more difficult. When AIG does not have corroborating marketevidence to support significant model inputs and cannot verify the model to market transactions, the transactionprice is initially used as the best estimate of fair value. Accordingly, when a pricing model is used to value such aninstrument, the model is adjusted so the model value at inception equals the transaction price. Subsequent toinitial recognition, AIG updates valuation inputs when corroborated by evidence such as similar market
26
American International Group, Inc., and Subsidiaries
NOTES TO CONSOLIDATED FINANCIAL STATEMENTS (unaudited)
transactions, third party pricing services and/or broker or dealer quotations, or other empirical market data. Whenappropriate, valuations are adjusted for various factors such as liquidity, bid/offer spreads and creditconsiderations. Such adjustments are generally based on available market evidence. In the absence of suchevidence, management’s best estimate is used.
Embedded Policy Derivatives
The fair value of embedded policy derivatives contained in certain variable annuity and equity-indexed annuityand life contracts is measured based on actuarial and capital market assumptions related to projected cash flowsover the expected lives of the contracts. These cash flow estimates primarily include benefits and related feesassessed, when applicable, and incorporate expectations about policyholder behavior. Estimates of futurepolicyholder behavior are subjective and based primarily on AIG’s historical experience. With respect toembedded policy derivatives in AIG’s variable annuity contracts, because of the dynamic and complex nature ofthe expected cash flows, risk neutral valuations are used. Estimating the underlying cash flows for these productsinvolves many estimates and judgments, including those regarding expected market rates of return, marketvolatility, correlations of market index returns to funds, fund performance, discount rates and policyholderbehavior. With respect to embedded policy derivatives in AIG’s equity-indexed annuity and life contracts, optionpricing models are used to estimate fair value, taking into account assumptions for future equity index growthrates, volatility of the equity index, future interest rates, and determinations on adjusting the participation rate andthe cap on equity indexed credited rates in light of market conditions and policyholder behavior assumptions.These methodologies incorporate an explicit risk margin to take into consideration market participant estimates ofprojected cash flows and policyholder behavior.
AIGFP’s Super Senior Credit Default Swap Portfolio
AIGFP values its CDS transactions written on the super senior risk layers of designated pools of debt securitiesor loans using internal valuation models, third-party price estimates and market indices. The principal market wasdetermined to be the market in which super senior credit default swaps of this type and size would be transacted,or have been transacted, with the greatest volume or level of activity. AIG has determined that the principalmarket participants, therefore, would consist of other large financial institutions who participate in sophisticatedover-the-counter derivatives markets. The specific valuation methodologies vary based on the nature of thereferenced obligations and availability of market prices.
The valuation of the super senior credit derivatives is challenging given the limitation on the availability ofmarket observable information due to the lack of trading and price transparency in the structured finance market.These market conditions have increased the reliance on management estimates and judgments in arriving at anestimate of fair value for financial reporting purposes. Further, disparities in the valuation methodologiesemployed by market participants and the varying judgments reached by such participants when assessing volatilemarkets have increased the likelihood that the various parties to these instruments may arrive at significantlydifferent estimates as to their fair values.
AIGFP’s valuation methodologies for the super senior credit default swap portfolio have evolved over time inresponse to market conditions and the availability of market observable information. AIG has sought to calibratethe methodologies to available market information and to review the assumptions of the methodologies on aregular basis.
Regulatory capital portfolio: In the case of credit default swaps written to facilitate regulatory capital relief,AIGFP estimates the fair value of these derivatives by considering observable market transactions. Thetransactions with the most observability are the early terminations of these transactions by counterparties. AIGFPcontinues to reassess the expected maturity of the portfolio. AIGFP has not been required to make any paymentsas part of terminations initiated by counterparties. The regulatory benefit of these transactions for AIGFP’sfinancial institution counterparties is generally derived from the terms of the Capital Accord of the Basel
27
American International Group, Inc., and Subsidiaries
NOTES TO CONSOLIDATED FINANCIAL STATEMENTS (unaudited)
Committee on Banking Supervision (Basel I) that existed through the end of 2007 and which is in the process ofbeing replaced by the Revised Framework for the International Convergence of Capital Measurement and CapitalStandards issued by the Basel Committee on Banking Supervision (Basel II). It was expected that financialinstitution counterparties would have transitioned from Basel I to Basel II by the end of the two-year adoptionperiod on December 31, 2009, after which they would have received little or no additional regulatory benefit fromthese CDS transactions, except in a small number of specific instances. However, the Basel Committee announcedthat it had agreed to keep in place the Basel I capital floors beyond the end of 2009, although it remains to beseen how this extension will be implemented by the various European Central Banking districts. Should certaincounterparties continue to receive favorable regulatory capital benefits from these transactions, thosecounterparties may not exercise their options to terminate the transactions in the expected time frame. Inassessing the fair value of the regulatory capital CDS transactions, AIGFP also considers other market data, to theextent relevant and available. For further discussion, see Note 8 herein.
Multi-sector CDO portfolios: AIGFP uses a modified version of the Binomial Expansion Technique (BET) modelto value its credit default swap portfolio written on super senior tranches of multi-sector collateralized debtobligations (CDOs) of ABS, including maturity-shortening puts that allow the holders of the securities issued bycertain CDOs to treat the securities as short-term 2a-7 eligible investments under the Investment Company Act of1940 (2a-7 Puts). The BET model was developed in 1996 by a major rating agency to generate expected lossestimates for CDO tranches and derive a credit rating for those tranches, and remains widely used.
AIGFP has adapted the BET model to estimate the price of the super senior risk layer or tranche of the CDO.AIG modified the BET model to imply default probabilities from market prices for the underlying securities andnot from rating agency assumptions. To generate the estimate, the model uses the price estimates for the securitiescomprising the portfolio of a CDO as an input and converts those estimates to credit spreads over currentLIBOR-based interest rates. These credit spreads are used to determine implied probabilities of default andexpected losses on the underlying securities. This data is then aggregated and used to estimate the expected cashflows of the super senior tranche of the CDO.
Prices for the individual securities held by a CDO are obtained in most cases from the CDO collateralmanagers, to the extent available. CDO collateral managers provided market prices for 63.4 percent of theunderlying securities used in the valuation at March 31, 2010. When a price for an individual security is notprovided by a CDO collateral manager, AIGFP derives the price through a pricing matrix using prices from CDOcollateral managers for similar securities. Matrix pricing is a mathematical technique used principally to value debtsecurities without relying exclusively on quoted prices for the specific securities, but rather by relying on therelationship of the security to other benchmark quoted securities. Substantially all of the CDO collateral managerswho provided prices used dealer prices for all or part of the underlying securities, in some cases supplemented bythird-party pricing services.
The BET model also uses diversity scores, weighted average lives, recovery rates and discount rates. AIGFPemploys a Monte Carlo simulation to assist in quantifying the effect on the valuation of the CDO of the uniqueaspects of the CDO’s structure such as triggers that divert cash flows to the most senior part of the capitalstructure. The Monte Carlo simulation is used to determine whether an underlying security defaults in a givensimulation scenario and, if it does, the security’s implied random default time and expected loss. This informationis used to project cash flow streams and to determine the expected losses of the portfolio.
In addition to calculating an estimate of the fair value of the super senior CDO security referenced in the creditdefault swaps using its internal model, AIGFP also considers the price estimates for the super senior CDOsecurities provided by third parties, including counterparties to these transactions, to validate the results of themodel and to determine the best available estimate of fair value. In determining the fair value of the super seniorCDO security referenced in the credit default swaps, AIGFP uses a consistent process which considers allavailable pricing data points and eliminates the use of outlying data points. When pricing data points are within areasonable range an averaging technique is applied.
28
American International Group, Inc., and Subsidiaries
NOTES TO CONSOLIDATED FINANCIAL STATEMENTS (unaudited)
Corporate debt/Collateralized loan obligation (CLO) portfolios: In the case of credit default swaps written onportfolios of investment-grade corporate debt, AIGFP uses a mathematical model that produces results that areclosely aligned with prices received from third parties. This methodology is widely used by other marketparticipants and uses the current market credit spreads of the names in the portfolios along with the basecorrelations implied by the current market prices of comparable tranches of the relevant market traded creditindices as inputs. One transaction, representing one percent of the total notional amount of the corporatearbitrage transactions, is valued using third party quotes given its unique attributes.
AIGFP estimates the fair value of its obligations resulting from credit default swaps written on CLOs to beequivalent to the par value less the current market value of the referenced obligation. Accordingly, the value isdetermined by obtaining third-party quotes on the underlying super senior tranches referenced under the creditdefault swap contract.
Policyholder Contract Deposits
Policyholder contract deposits accounted for at fair value are measured using an earnings approach by takinginto consideration the following factors:
• Current policyholder account values and related surrender charges;
• The present value of estimated future cash inflows (policy fees) and outflows (benefits and maintenanceexpenses) associated with the product using risk neutral valuations, incorporating expectations aboutpolicyholder behavior, market returns and other factors; and
• A risk margin that market participants would require for a market return and the uncertainty inherent in themodel inputs.
The change in fair value of these policyholder contract deposits is recorded as Policyholder benefits and claimsincurred in the Consolidated Statement of Income (Loss).
Securities and spot commodities sold but not yet purchased
Fair values for securities sold but not yet purchased are based on current market prices. Fair values of spotcommodities sold but not yet purchased are based on current market prices of reference spot futures contractstraded on exchanges.
Other long-term debt
When fair value accounting has been elected, the fair value of non-structured liabilities is generally determinedby using market prices from exchange or dealer markets, when available, or discounting expected cash flows usingthe appropriate discount rate for the applicable maturity. The discount rate is based on an implicit ratedetermined with the use of observable CDS market spreads to determine the risk of non-performance for AIG.Such instruments are generally classified in Level 2 of the fair value hierarchy as substantially all inputs are readilyobservable. AIG determines the fair value of structured liabilities (where performance is linked to structuredinterest rates, inflation or currency risks) and hybrid financial instruments (performance linked to risks other thaninterest rates, inflation or currency risks) using the appropriate derivative valuation methodology (described above)given the nature of the embedded risk profile. Such instruments are classified in Level 2 or Level 3 depending onthe observability of significant inputs to the model. In addition, adjustments are made to the valuations of bothnon-structured and structured liabilities to reflect AIG’s own credit worthiness based on observable credit spreadsof AIG.
29

American International Group, Inc., and Subsidiaries
NOTES TO CONSOLIDATED FINANCIAL STATEMENTS (unaudited)
Assets and Liabilities Measured at Fair Value on a Recurring Basis
The following table presents information about assets and liabilities measured at fair value on a recurring basisand indicates the level of the fair value measurement based on the levels of the inputs used:At March 31, 2010 Counterparty Cash(in millions) Level 1 Level 2 Level 3 Netting(a) Collateral(b) Total
Assets:Bonds available for sale:
U.S. government and government sponsored entities $ 100 $ 4,756 $ - $ - $ - $ 4,856Obligations of states, municipalities and Political subdivisions 320 50,885 948 - - 52,153Non-U.S. governments 197 23,615 5 - - 23,817Corporate debt - 130,435 3,917 - - 134,352Residential mortgage-backed securities (RMBS) - 20,387 6,832 - - 27,219Commercial mortgage-backed securities (CMBS) - 3,549 4,396 - - 7,945Collateralized Debt Obligations/Asset Backed Securities (CDO/ABS) - 1,952 4,576 - - 6,528
Total bonds available for sale 617 235,579 20,674 - - 256,870
Bond trading securities:U.S. government and government sponsored entities 433 6,313 - - - 6,746Obligations of states, municipalities and Political subdivisions - 348 - - - 348Non-U.S. governments 1 395 2 - - 398Corporate debt - 1,658 7 - - 1,665RMBS - 2,534 5 - - 2,539CMBS - 2,282 294 - - 2,576CDO/ABS - 4,198 7,895 - - 12,093
Total bond trading securities 434 17,728 8,203 - - 26,365
Equity securities available for sale:Common stock 4,219 7 36 - - 4,262Preferred stock - 685 52 - - 737Mutual funds 1,800 32 - - - 1,832
Total equity securities available for sale 6,019 724 88 - - 6,831
Equity securities trading:Common stock 416 95 1 - - 512Mutual funds 101 - - - - 101
Total equity securities trading 517 95 1 - - 613
Mortgage and other loans receivable - 157 - - - 157Other invested assets(c) 1,432 2,869 5,853 - - 10,154Unrealized gain on swaps, options and forward transactions:
Interest rate contracts - 26,308 207 - - 26,515Foreign exchange contracts - 393 32 - - 425Equity contracts 59 567 202 - - 828Commodity contracts - 46 20 - - 66Credit contracts - 3 556 - - 559Other contracts 4 562 72 - - 638Counterparty netting and cash collateral - - - (16,816) (4,832) (21,648)
Total unrealized gain on swaps, options and forward transactions 63 27,879 1,089 (16,816) (4,832) 7,383
Securities purchased under agreements to resell - 1,615 - - - 1,615Short-term investments 3,986 18,198 - - - 22,184Separate account assets 49,740 2,213 - - - 51,953Other assets - 13 - - - 13
Total $62,808 $307,070 $35,908 $ (16,816) $ (4,832) $384,138
Liabilities:Policyholder contract deposits $ - $ - $ 641 $ - $ - $ 641Securities sold under agreements to repurchase - 3,418 - - - 3,418Securities and spot commodities sold but not yet purchased 303 155 - - - 458Unrealized loss on swaps, options and forward transactions:
Interest rate contracts - 20,214 1,493 - - 21,707Foreign exchange contracts - 702 3 - - 705Equity contracts 3 631 147 - - 781Commodity contracts - 53 - - - 53Credit contracts(d) - 41 5,466 - - 5,507Other contracts - 218 202 - - 420Counterparty netting and cash collateral - - - (16,816) (6,061) (22,877)
Total unrealized loss on swaps, options and forward transactions 3 21,859 7,311 (16,816) (6,061) 6,296
Trust deposits and deposits due to banks and other depositors - 16 - - - 16Federal Reserve Bank of New York Commercial Paper Funding Facility - 2,285 - - - 2,285Other long-term debt - 11,677 1,123 - - 12,800
Total $ 306 $ 39,410 $ 9,075 $ (16,816) $ (6,061) $ 25,914
30
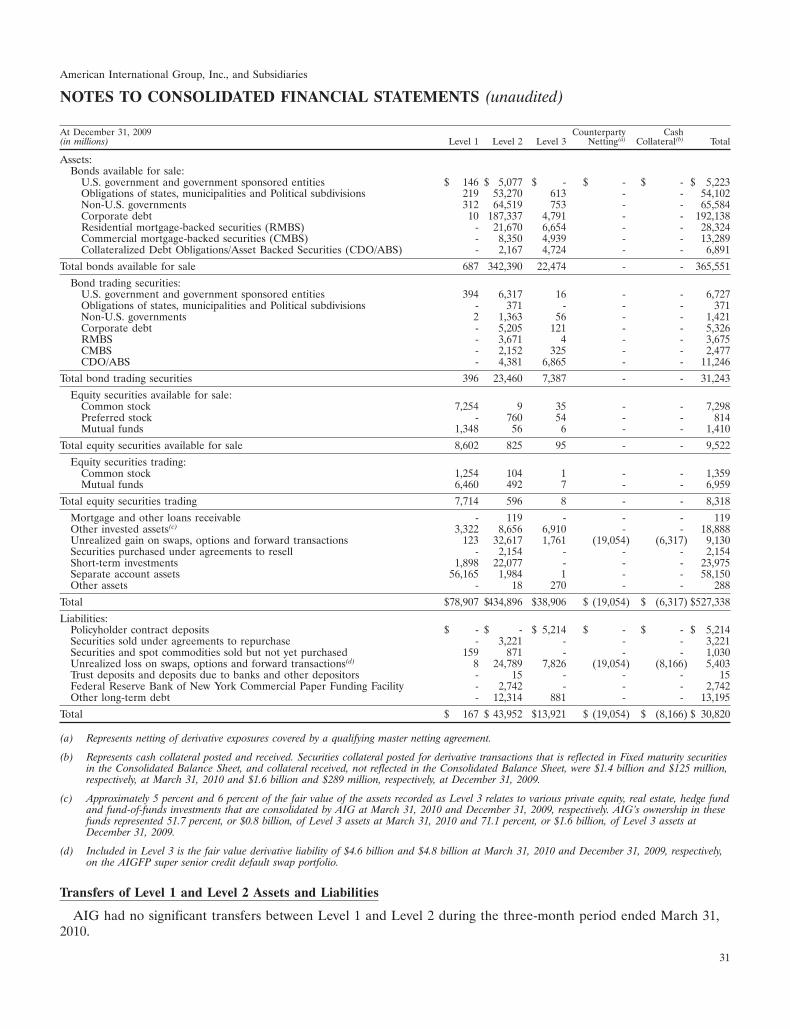
American International Group, Inc., and Subsidiaries
NOTES TO CONSOLIDATED FINANCIAL STATEMENTS (unaudited)
At December 31, 2009 Counterparty Cash(in millions) Level 1 Level 2 Level 3 Netting(a) Collateral(b) Total
Assets:Bonds available for sale:
U.S. government and government sponsored entities $ 146 $ 5,077 $ - $ - $ - $ 5,223Obligations of states, municipalities and Political subdivisions 219 53,270 613 - - 54,102Non-U.S. governments 312 64,519 753 - - 65,584Corporate debt 10 187,337 4,791 - - 192,138Residential mortgage-backed securities (RMBS) - 21,670 6,654 - - 28,324Commercial mortgage-backed securities (CMBS) - 8,350 4,939 - - 13,289Collateralized Debt Obligations/Asset Backed Securities (CDO/ABS) - 2,167 4,724 - - 6,891
Total bonds available for sale 687 342,390 22,474 - - 365,551
Bond trading securities:U.S. government and government sponsored entities 394 6,317 16 - - 6,727Obligations of states, municipalities and Political subdivisions - 371 - - - 371Non-U.S. governments 2 1,363 56 - - 1,421Corporate debt - 5,205 121 - - 5,326RMBS - 3,671 4 - - 3,675CMBS - 2,152 325 - - 2,477CDO/ABS - 4,381 6,865 - - 11,246
Total bond trading securities 396 23,460 7,387 - - 31,243
Equity securities available for sale:Common stock 7,254 9 35 - - 7,298Preferred stock - 760 54 - - 814Mutual funds 1,348 56 6 - - 1,410
Total equity securities available for sale 8,602 825 95 - - 9,522
Equity securities trading:Common stock 1,254 104 1 - - 1,359Mutual funds 6,460 492 7 - - 6,959
Total equity securities trading 7,714 596 8 - - 8,318
Mortgage and other loans receivable - 119 - - - 119Other invested assets(c) 3,322 8,656 6,910 - - 18,888Unrealized gain on swaps, options and forward transactions 123 32,617 1,761 (19,054) (6,317) 9,130Securities purchased under agreements to resell - 2,154 - - - 2,154Short-term investments 1,898 22,077 - - - 23,975Separate account assets 56,165 1,984 1 - - 58,150Other assets - 18 270 - - 288
Total $78,907 $434,896 $38,906 $ (19,054) $ (6,317) $527,338
Liabilities:Policyholder contract deposits $ - $ - $ 5,214 $ - $ - $ 5,214Securities sold under agreements to repurchase - 3,221 - - - 3,221Securities and spot commodities sold but not yet purchased 159 871 - - - 1,030Unrealized loss on swaps, options and forward transactions(d) 8 24,789 7,826 (19,054) (8,166) 5,403Trust deposits and deposits due to banks and other depositors - 15 - - - 15Federal Reserve Bank of New York Commercial Paper Funding Facility - 2,742 - - - 2,742Other long-term debt - 12,314 881 - - 13,195
Total $ 167 $ 43,952 $13,921 $ (19,054) $ (8,166) $ 30,820
(a) Represents netting of derivative exposures covered by a qualifying master netting agreement.
(b) Represents cash collateral posted and received. Securities collateral posted for derivative transactions that is reflected in Fixed maturity securitiesin the Consolidated Balance Sheet, and collateral received, not reflected in the Consolidated Balance Sheet, were $1.4 billion and $125 million,respectively, at March 31, 2010 and $1.6 billion and $289 million, respectively, at December 31, 2009.
(c) Approximately 5 percent and 6 percent of the fair value of the assets recorded as Level 3 relates to various private equity, real estate, hedge fundand fund-of-funds investments that are consolidated by AIG at March 31, 2010 and December 31, 2009, respectively. AIG’s ownership in thesefunds represented 51.7 percent, or $0.8 billion, of Level 3 assets at March 31, 2010 and 71.1 percent, or $1.6 billion, of Level 3 assets atDecember 31, 2009.
(d) Included in Level 3 is the fair value derivative liability of $4.6 billion and $4.8 billion at March 31, 2010 and December 31, 2009, respectively,on the AIGFP super senior credit default swap portfolio.
Transfers of Level 1 and Level 2 Assets and Liabilities
AIG had no significant transfers between Level 1 and Level 2 during the three-month period ended March 31,2010.
31
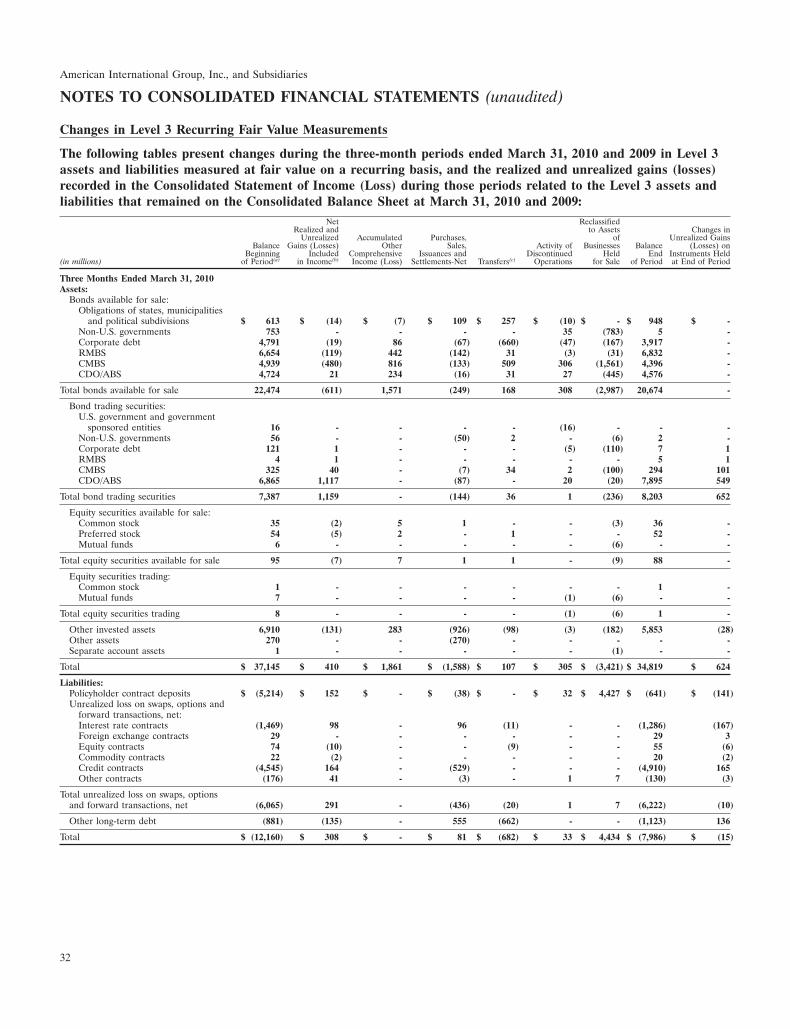
American International Group, Inc., and Subsidiaries
NOTES TO CONSOLIDATED FINANCIAL STATEMENTS (unaudited)
Changes in Level 3 Recurring Fair Value Measurements
The following tables present changes during the three-month periods ended March 31, 2010 and 2009 in Level 3assets and liabilities measured at fair value on a recurring basis, and the realized and unrealized gains (losses)recorded in the Consolidated Statement of Income (Loss) during those periods related to the Level 3 assets andliabilities that remained on the Consolidated Balance Sheet at March 31, 2010 and 2009:
Net ReclassifiedRealized and to Assets Changes in
Unrealized Accumulated Purchases, of Unrealized GainsBalance Gains (Losses) Other Sales, Activity of Businesses Balance (Losses) on
Beginning Included Comprehensive Issuances and Discontinued Held End Instruments Held(in millions) of Period(a) in Income(b) Income (Loss) Settlements-Net Transfers(c) Operations for Sale of Period at End of Period
Three Months Ended March 31, 2010Assets:
Bonds available for sale:Obligations of states, municipalities
and political subdivisions $ 613 $ (14) $ (7) $ 109 $ 257 $ (10) $ - $ 948 $ -Non-U.S. governments 753 - - - - 35 (783) 5 -Corporate debt 4,791 (19) 86 (67) (660) (47) (167) 3,917 -RMBS 6,654 (119) 442 (142) 31 (3) (31) 6,832 -CMBS 4,939 (480) 816 (133) 509 306 (1,561) 4,396 -CDO/ABS 4,724 21 234 (16) 31 27 (445) 4,576 -
Total bonds available for sale 22,474 (611) 1,571 (249) 168 308 (2,987) 20,674 -
Bond trading securities:U.S. government and government
sponsored entities 16 - - - - (16) - - -Non-U.S. governments 56 - - (50) 2 - (6) 2 -Corporate debt 121 1 - - - (5) (110) 7 1RMBS 4 1 - - - - - 5 1CMBS 325 40 - (7) 34 2 (100) 294 101CDO/ABS 6,865 1,117 - (87) - 20 (20) 7,895 549
Total bond trading securities 7,387 1,159 - (144) 36 1 (236) 8,203 652
Equity securities available for sale:Common stock 35 (2) 5 1 - - (3) 36 -Preferred stock 54 (5) 2 - 1 - - 52 -Mutual funds 6 - - - - - (6) - -
Total equity securities available for sale 95 (7) 7 1 1 - (9) 88 -
Equity securities trading:Common stock 1 - - - - - - 1 -Mutual funds 7 - - - - (1) (6) - -
Total equity securities trading 8 - - - - (1) (6) 1 -
Other invested assets 6,910 (131) 283 (926) (98) (3) (182) 5,853 (28)Other assets 270 - - (270) - - - - -Separate account assets 1 - - - - - (1) - -
Total $ 37,145 $ 410 $ 1,861 $ (1,588) $ 107 $ 305 $ (3,421) $ 34,819 $ 624
Liabilities:Policyholder contract deposits $ (5,214) $ 152 $ - $ (38) $ - $ 32 $ 4,427 $ (641) $ (141)Unrealized loss on swaps, options and
forward transactions, net:Interest rate contracts (1,469) 98 - 96 (11) - - (1,286) (167)Foreign exchange contracts 29 - - - - - - 29 3Equity contracts 74 (10) - - (9) - - 55 (6)Commodity contracts 22 (2) - - - - - 20 (2)Credit contracts (4,545) 164 - (529) - - - (4,910) 165Other contracts (176) 41 - (3) - 1 7 (130) (3)
Total unrealized loss on swaps, optionsand forward transactions, net (6,065) 291 - (436) (20) 1 7 (6,222) (10)
Other long-term debt (881) (135) - 555 (662) - - (1,123) 136
Total $ (12,160) $ 308 $ - $ 81 $ (682) $ 33 $ 4,434 $ (7,986) $ (15)
32
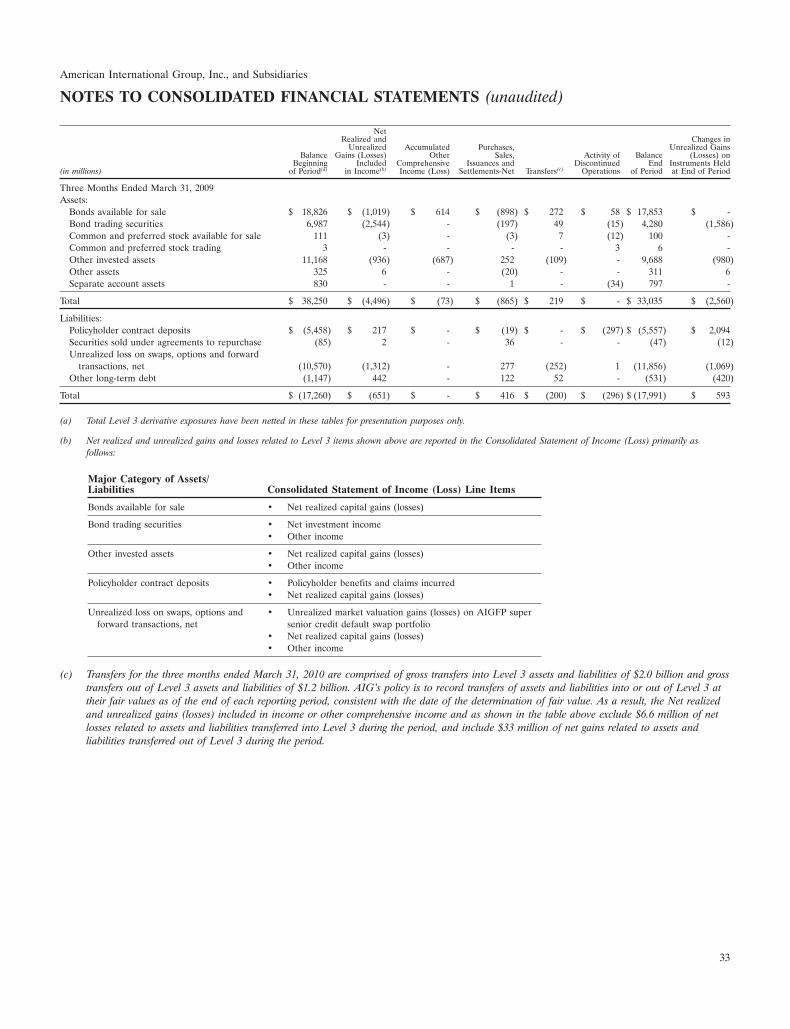
American International Group, Inc., and Subsidiaries
NOTES TO CONSOLIDATED FINANCIAL STATEMENTS (unaudited)
NetRealized and Changes in
Unrealized Accumulated Purchases, Unrealized GainsBalance Gains (Losses) Other Sales, Activity of Balance (Losses) on
Beginning Included Comprehensive Issuances and Discontinued End Instruments Held(in millions) of Period(a) in Income(b) Income (Loss) Settlements-Net Transfers(c) Operations of Period at End of Period
Three Months Ended March 31, 2009Assets:
Bonds available for sale $ 18,826 $ (1,019) $ 614 $ (898) $ 272 $ 58 $ 17,853 $ -Bond trading securities 6,987 (2,544) - (197) 49 (15) 4,280 (1,586)Common and preferred stock available for sale 111 (3) - (3) 7 (12) 100 -Common and preferred stock trading 3 - - - - 3 6 -Other invested assets 11,168 (936) (687) 252 (109) - 9,688 (980)Other assets 325 6 - (20) - - 311 6Separate account assets 830 - - 1 - (34) 797 -
Total $ 38,250 $ (4,496) $ (73) $ (865) $ 219 $ - $ 33,035 $ (2,560)
Liabilities:Policyholder contract deposits $ (5,458) $ 217 $ - $ (19) $ - $ (297) $ (5,557) $ 2,094Securities sold under agreements to repurchase (85) 2 - 36 - - (47) (12)Unrealized loss on swaps, options and forward
transactions, net (10,570) (1,312) - 277 (252) 1 (11,856) (1,069)Other long-term debt (1,147) 442 - 122 52 - (531) (420)
Total $ (17,260) $ (651) $ - $ 416 $ (200) $ (296) $ (17,991) $ 593
(a) Total Level 3 derivative exposures have been netted in these tables for presentation purposes only.
(b) Net realized and unrealized gains and losses related to Level 3 items shown above are reported in the Consolidated Statement of Income (Loss) primarily asfollows:
Major Category of Assets/Liabilities Consolidated Statement of Income (Loss) Line Items
Bonds available for sale • Net realized capital gains (losses)
Bond trading securities • Net investment income• Other income
Other invested assets • Net realized capital gains (losses)• Other income
Policyholder contract deposits • Policyholder benefits and claims incurred• Net realized capital gains (losses)
Unrealized loss on swaps, options and • Unrealized market valuation gains (losses) on AIGFP superforward transactions, net senior credit default swap portfolio
• Net realized capital gains (losses)• Other income
(c) Transfers for the three months ended March 31, 2010 are comprised of gross transfers into Level 3 assets and liabilities of $2.0 billion and grosstransfers out of Level 3 assets and liabilities of $1.2 billion. AIG’s policy is to record transfers of assets and liabilities into or out of Level 3 attheir fair values as of the end of each reporting period, consistent with the date of the determination of fair value. As a result, the Net realizedand unrealized gains (losses) included in income or other comprehensive income and as shown in the table above exclude $6.6 million of netlosses related to assets and liabilities transferred into Level 3 during the period, and include $33 million of net gains related to assets andliabilities transferred out of Level 3 during the period.
33
American International Group, Inc., and Subsidiaries
NOTES TO CONSOLIDATED FINANCIAL STATEMENTS (unaudited)
Both observable and unobservable inputs may be used to determine the fair values of positions classified inLevel 3 in the tables above. As a result, the unrealized gains (losses) on instruments held at March 31, 2010 andMarch 31, 2009 may include changes in fair value that were attributable to both observable (e.g., changes inmarket interest rates) and unobservable inputs (e.g., changes in unobservable long-dated volatilities).
Transfers of Level 3 Assets and Liabilities
AIG’s policy is to transfer assets and liabilities into Level 3 when a significant input cannot be corroboratedwith market observable data. This may include: circumstances in which market activity has dramatically decreasedand transparency to underlying inputs cannot be observed, current prices are not available, and substantial pricevariances in quotations among market participants exist.
In certain cases, the inputs used to measure the fair value may fall into different levels of the fair valuehierarchy. In such cases, the level in the fair value hierarchy within which the fair value measurement in itsentirety falls is determined based on the lowest level input that is significant to the fair value measurement. AIG’sassessment of the significance of a particular input to the fair value measurement in its entirety requires judgment.In making the assessment, AIG considers factors specific to the asset or liability.
During the three-month period ended March 31, 2010, AIG transferred into Level 3 approximately $1.2 billionof assets, consisting of certain ABS, CMBS and RMBS, as well as private placement corporate debt and certainmunicipal bonds related to SunAmerica Affordable Housing partnerships. A majority of the transfers into Level 3related to investments in ABS, RMBS and CMBS and was due to a decrease in market transparency anddownward credit migration in these securities. Transfers into Level 3 for private placement corporate debt areprimarily the result of AIG overriding third party matrix pricing information downward to better reflect theadditional risk premium associated with those securities that AIG believes was not captured in the matrix. Certainmunicipal bonds were transferred into Level 3 based on limited market activity for the particular issuances andrelated limitations on observable inputs for their valuation.
Assets are transferred out of Level 3 when circumstances change such that significant inputs can becorroborated with market observable data. This may be due to a significant increase in market activity for theasset, a specific event, one or more significant input(s) becoming observable, or when a long-term interest ratesignificant to a valuation becomes short-term and thus observable. During the three-month period endedMarch 31, 2010, AIG transferred approximately $1.1 billion of assets out of Level 3. These transfers out ofLevel 3 are primarily related to investments in private placement corporate debt, as well as investments in certainABS and RMBS. Transfers out of Level 3 for private placement corporate debt and for ABS were primarily theresult of AIG using observable pricing information or a third party pricing quote that appropriately reflects thefair value of those securities, without the need for adjustment based on AIG’s own assumptions regarding thecharacteristics of a specific security or the current liquidity in the market. Transfers out of Level 3 for RMBSinvestments were primarily due to increased usage of pricing from valuation service providers that were reflectiveof market activity, where previously an internally adjusted price had been used.
During the three-month period ended March 31, 2010, AIG transferred into Level 3 approximately $710 millionof liabilities related to term notes and hybrid term notes, primarily due to an unobservable credit linkedcomponent comprising a significant amount of the valuations. The remaining $64 million transfer in was due tomovement in market variables. A majority of the transfers out of Level 3 liabilities, which totaled $92 million,were due to recognition of the cash flow variability on interest rate and cross currency swaps with securitizationvehicles. Other transfers out of Level 3 liabilities were due to movement in market variables.
AIG uses various hedging techniques to manage risks associated with certain positions, including those classifiedwithin Level 3. Such techniques may include the purchase or sale of financial instruments that are classified withinLevel 1 and/or Level 2. As a result, the realized and unrealized gains (losses) for assets and liabilities classifiedwithin Level 3 presented in the table above do not reflect the related realized or unrealized gains (losses) onhedging instruments that are classified within Level 1 and/or Level 2.
34

American International Group, Inc., and Subsidiaries
NOTES TO CONSOLIDATED FINANCIAL STATEMENTS (unaudited)
Investments in certain entities carried at fair value using net asset value per share
The following table includes information related to AIG’s investments in certain other invested assets, includingprivate equity funds, hedge funds and other alternative investments that calculate net asset value per share (orits equivalent). For these investments, which are measured at fair value on a recurring or non-recurring basis,AIG uses the net asset value per share as a practical expedient for fair value.
March 31, 2010(a) December 31, 2009
Fair Value Fair ValueUsing Net Unfunded Using Net Unfunded
(in millions) Investment Category Includes Asset Value Commitments Asset Value Commitments
Investment CategoryPrivate equity funds:
Leveraged buyout Debt and/or equity investments made as part of a $ 2,538 $ 1,532 $ 3,166 $ 1,553transaction in which assets of mature companies areacquired from the current shareholders, typically with theuse of financial leverage.
Non-U.S. Investments that focus primarily on Asian and European 360 105 543 103based buyouts, expansion capital, special situations,turnarounds, venture capital, mezzanine and distressedopportunities strategies.
Venture capital Early-stage, high-potential, growth companies expected to 281 47 427 48generate a return through an eventual realization event,such as an initial public offering or sale of the company.
Fund of funds Funds that invest in other funds, which invest in various 794 166 616 40diversified strategies
Distressed Securities of companies that are already in default, under 215 94 238 91bankruptcy protection, or troubled.
Other Real estate, energy, multi-strategy, mezzanine, and industry- 230 130 223 117focused strategies.
Total private equity funds 4,418 2,074 5,213 1,952
Hedge funds:Event-driven Securities of companies undergoing material structural 718 - 1,373 -
changes, including. mergers, acquisitions, and otherreorganizations.
Long-short Securities the manager believes are undervalued, with 352 - 825 -corresponding short positions to hedge market risk.
Fund of funds Funds that invest in other funds, which invest in various 290 - 304 -diversified strategies.
Relative value Simultaneous long and short positions in closely related 9 - 286 -markets.
Distressed Securities of companies that are already in default, under 297 - 272 -bankruptcy protection, or troubled.
Other Non-U.S. companies, futures and commodities, and multi- 225 - 394 -strategy and industry-focused strategies.
Total hedge funds 1,891 - 3,454 -
Global real estate funds U.S. and Non-U.S. commercial real estate. 899 87 929 64
Total $ 7,208(b) $ 2,161 $ 9,596(b) $ 2,016
(a) Due to the sale of the investment advisory business, certain partnerships and hedge funds are no longer carried at net asset value per share.
(b) Includes investments of entities classified as held for sale of approximately $0.1 billion and $1.1 billion at March 31, 2010 and December 31, 2009, respectively.
At March 31, 2010, private equity fund investments included above are not redeemable during the lives of thefunds, and have expected remaining lives that extend in some cases more than 10 years. At that date, 43 percentof the total above have expected remaining lives of less than three years, 35 percent between 3 and 7 years, and
35
American International Group, Inc., and Subsidiaries
NOTES TO CONSOLIDATED FINANCIAL STATEMENTS (unaudited)
22 percent between 7 and 10 years. Expected lives are based upon legal maturity, which can be extended at thegeneral manager’s discretion, typically in one year increments.
At March 31, 2010, hedge fund investments included above are redeemable monthly (11 percent), quarterly(34 percent), semi-annually (11 percent) and annually (44 percent), with redemption notices ranging from 1 day to180 days. More than 77 percent require redemption notices of less than 90 days. Investments representingapproximately 14 percent of the value of the hedge fund investments cannot be redeemed because the investmentsinclude restrictions that do not allow for redemptions within a pre-defined timeframe. These restrictions expire nolater than December 31, 2012. Funds that equate to 62 percent of the total value of hedge funds hold at least oneinvestment that the general manager deems to be illiquid. In order to treat investors fairly and to accommodatesubsequent subscription and redemption requests, the general manager isolates these illiquid assets from the restof the fund until the assets become liquid.
At March 31, 2010, global real estate fund investments included above are not redeemable during the lives ofthe funds, and have expected remaining lives that extend in some cases more than 10 years. Twelve percent ofthese funds have expected remaining lives of less than three years, 69 percent between 3 and 7 years, and19 percent between 7 and 10 years. Expected lives are based upon legal maturity, which can be extended at thegeneral manager’s discretion, typically in one year increments.
Fair Value Measurements on a Non-Recurring Basis
AIG also measures the fair value of certain assets on a non-recurring basis, generally quarterly, annually, orwhen events or changes in circumstances indicate that the carrying amount of the assets may not be recoverable.These assets include cost and equity-method investments, life settlement contracts, flight equipment primarilyunder operating leases, collateral securing foreclosed loans and real estate and other fixed assets, goodwill, andother intangible assets. AIG uses a variety of techniques to measure the fair value of these assets whenappropriate, as described below:
• Cost and Equity-Method Investments: When AIG determines that the carrying value of these assets may notbe recoverable, AIG records the assets at fair value with the loss recognized in earnings. In such cases, AIGmeasures the fair value of these assets using the techniques discussed in Valuation Methodologies, above, forOther invested assets.
• Life Settlement Contracts: AIG measures the fair value of individual life settlement contracts (which areincluded in other invested assets) whenever the carrying value plus the undiscounted future costs that areexpected to be incurred to keep the life settlement contract in force exceed the expected proceeds from thecontract. In those situations, the fair value is determined on a discounted cash flow basis, incorporatingcurrent life expectancy assumptions. The discount rate incorporates current information about marketinterest rates, the credit exposure to the insurance company that issued the life settlement contract andAIG’s estimate of the risk margin an investor in the contracts would require.
• Flight Equipment Primarily Under Operating Leases: When AIG determines the carrying value of itscommercial aircraft may not be recoverable, AIG records the aircraft at fair value with the loss recognizedin earnings. AIG measures the fair value of its commercial aircraft using an earnings approach based on thepresent value of all cash flows from existing and projected lease payments (based on historical experienceand current expectations regarding market participants), including net contingent rentals for the periodextending to the end of the aircraft’s economic life in its highest and best use configuration, plus itsdisposition value.
• Collateral Securing Foreclosed Loans and Real Estate and Other Fixed Assets: When AIG takes collateral inconnection with foreclosed loans, AIG generally bases its estimate of fair value on the price that would bereceived in a current transaction to sell the asset by itself, by reference to observable transactions for similarassets.
36
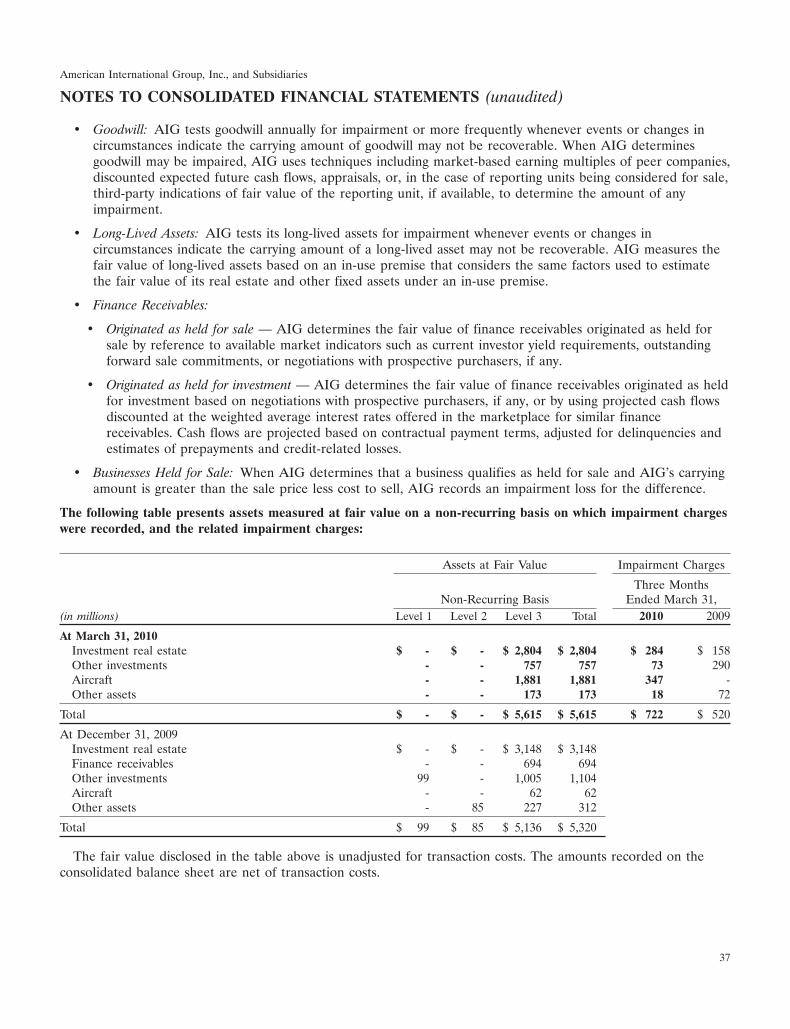
American International Group, Inc., and Subsidiaries
NOTES TO CONSOLIDATED FINANCIAL STATEMENTS (unaudited)
• Goodwill: AIG tests goodwill annually for impairment or more frequently whenever events or changes incircumstances indicate the carrying amount of goodwill may not be recoverable. When AIG determinesgoodwill may be impaired, AIG uses techniques including market-based earning multiples of peer companies,discounted expected future cash flows, appraisals, or, in the case of reporting units being considered for sale,third-party indications of fair value of the reporting unit, if available, to determine the amount of anyimpairment.
• Long-Lived Assets: AIG tests its long-lived assets for impairment whenever events or changes incircumstances indicate the carrying amount of a long-lived asset may not be recoverable. AIG measures thefair value of long-lived assets based on an in-use premise that considers the same factors used to estimatethe fair value of its real estate and other fixed assets under an in-use premise.
• Finance Receivables:
• Originated as held for sale — AIG determines the fair value of finance receivables originated as held forsale by reference to available market indicators such as current investor yield requirements, outstandingforward sale commitments, or negotiations with prospective purchasers, if any.
• Originated as held for investment — AIG determines the fair value of finance receivables originated as heldfor investment based on negotiations with prospective purchasers, if any, or by using projected cash flowsdiscounted at the weighted average interest rates offered in the marketplace for similar financereceivables. Cash flows are projected based on contractual payment terms, adjusted for delinquencies andestimates of prepayments and credit-related losses.
• Businesses Held for Sale: When AIG determines that a business qualifies as held for sale and AIG’s carryingamount is greater than the sale price less cost to sell, AIG records an impairment loss for the difference.
The following table presents assets measured at fair value on a non-recurring basis on which impairment chargeswere recorded, and the related impairment charges:
Assets at Fair Value Impairment Charges
Three MonthsNon-Recurring Basis Ended March 31,
(in millions) Level 1 Level 2 Level 3 Total 2010 2009
At March 31, 2010Investment real estate $ - $ - $ 2,804 $ 2,804 $ 284 $ 158Other investments - - 757 757 73 290Aircraft - - 1,881 1,881 347 -Other assets - - 173 173 18 72
Total $ - $ - $ 5,615 $ 5,615 $ 722 $ 520
At December 31, 2009Investment real estate $ - $ - $ 3,148 $ 3,148Finance receivables - - 694 694Other investments 99 - 1,005 1,104Aircraft - - 62 62Other assets - 85 227 312
Total $ 99 $ 85 $ 5,136 $ 5,320
The fair value disclosed in the table above is unadjusted for transaction costs. The amounts recorded on theconsolidated balance sheet are net of transaction costs.
37
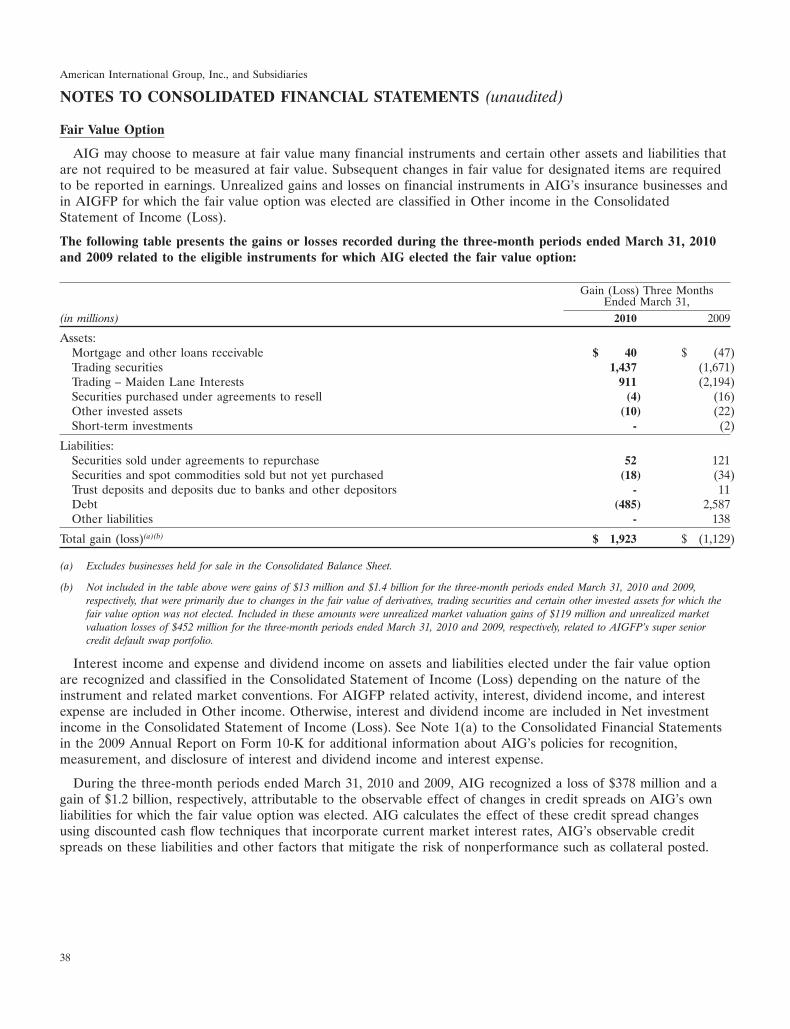
American International Group, Inc., and Subsidiaries
NOTES TO CONSOLIDATED FINANCIAL STATEMENTS (unaudited)
Fair Value Option
AIG may choose to measure at fair value many financial instruments and certain other assets and liabilities thatare not required to be measured at fair value. Subsequent changes in fair value for designated items are requiredto be reported in earnings. Unrealized gains and losses on financial instruments in AIG’s insurance businesses andin AIGFP for which the fair value option was elected are classified in Other income in the ConsolidatedStatement of Income (Loss).
The following table presents the gains or losses recorded during the three-month periods ended March 31, 2010and 2009 related to the eligible instruments for which AIG elected the fair value option:
Gain (Loss) Three MonthsEnded March 31,
(in millions) 2010 2009
Assets:Mortgage and other loans receivable $ 40 $ (47)Trading securities 1,437 (1,671)Trading – Maiden Lane Interests 911 (2,194)Securities purchased under agreements to resell (4) (16)Other invested assets (10) (22)Short-term investments - (2)
Liabilities:Securities sold under agreements to repurchase 52 121Securities and spot commodities sold but not yet purchased (18) (34)Trust deposits and deposits due to banks and other depositors - 11Debt (485) 2,587Other liabilities - 138
Total gain (loss)(a)(b) $ 1,923 $ (1,129)
(a) Excludes businesses held for sale in the Consolidated Balance Sheet.
(b) Not included in the table above were gains of $13 million and $1.4 billion for the three-month periods ended March 31, 2010 and 2009,respectively, that were primarily due to changes in the fair value of derivatives, trading securities and certain other invested assets for which thefair value option was not elected. Included in these amounts were unrealized market valuation gains of $119 million and unrealized marketvaluation losses of $452 million for the three-month periods ended March 31, 2010 and 2009, respectively, related to AIGFP’s super seniorcredit default swap portfolio.
Interest income and expense and dividend income on assets and liabilities elected under the fair value optionare recognized and classified in the Consolidated Statement of Income (Loss) depending on the nature of theinstrument and related market conventions. For AIGFP related activity, interest, dividend income, and interestexpense are included in Other income. Otherwise, interest and dividend income are included in Net investmentincome in the Consolidated Statement of Income (Loss). See Note 1(a) to the Consolidated Financial Statementsin the 2009 Annual Report on Form 10-K for additional information about AIG’s policies for recognition,measurement, and disclosure of interest and dividend income and interest expense.
During the three-month periods ended March 31, 2010 and 2009, AIG recognized a loss of $378 million and again of $1.2 billion, respectively, attributable to the observable effect of changes in credit spreads on AIG’s ownliabilities for which the fair value option was elected. AIG calculates the effect of these credit spread changesusing discounted cash flow techniques that incorporate current market interest rates, AIG’s observable creditspreads on these liabilities and other factors that mitigate the risk of nonperformance such as collateral posted.
38

American International Group, Inc., and Subsidiaries
NOTES TO CONSOLIDATED FINANCIAL STATEMENTS (unaudited)
The following table presents the difference between fair values and the aggregate contractual principal amountsof mortgage and other loans receivable and long-term borrowings, for which the fair value option was elected:
At March 31, 2010 At December 31, 2009Fair Outstanding Fair Outstanding
(in millions) Value Principal Amount Difference Value Principal Amount Difference
Assets:Mortgage and other loans receivable $ 157 $ 258 $ (101) $ 119 $ 253 $ (134)
Liabilities:Long-term debt $11,094 $9,755 $1,339 $11,308 $10,111 $1,197
At March 31, 2010 and December 31, 2009, there were no significant mortgage or other loans receivable forwhich the fair value option was elected that were 90 days or more past due and in non-accrual status.
Fair Value Information about Financial Instruments Not Measured at Fair Value
Information regarding the estimation of fair value for financial instruments not carried at fair value (excludinginsurance contracts and lease contracts) is discussed below:
• Mortgage and other loans receivable: Fair values of loans on real estate and collateral loans were estimatedfor disclosure purposes using discounted cash flow calculations based upon discount rates that AIG believesmarket participants would use in determining the price they would pay for such assets. For certain loans,AIG’s current incremental lending rates for similar type loans is used as the discount rate, as it is believedthat this rate approximates the rates market participants would use. The fair values of policy loans were notestimated as AIG believes it would have to expend excessive costs for the benefits derived.
• Finance receivables: Fair values of net finance receivables, less allowance for finance receivable losses, wereestimated for disclosure purposes using projected cash flows, computed by category of finance receivable,discounted at the weighted average interest rates offered for similar finance receivables at the balance sheetdate. Cash flows were projected based on contractual payment terms adjusted for delinquencies andestimates of losses. The fair value estimates do not reflect the underlying customer relationships or therelated distribution systems.
• Cash, short-term investments, trade receivables, trade payables, securities purchased (sold) under agreements toresell (repurchase), and commercial paper and other short-term debt: The carrying values of these assets andliabilities approximate fair values because of the relatively short period of time between origination andexpected realization.
• Policyholder contract deposits associated with investment-type contracts: Fair values for policyholder contractdeposits associated with investment-type contracts not accounted for at fair value were estimated fordisclosure purposes using discounted cash flow calculations based upon interest rates currently being offeredfor similar contracts with maturities consistent with those remaining for the contracts being valued. Whereno similar contracts are being offered, the discount rate is the appropriate tenor swap rates (if available) orcurrent risk-free interest rates consistent with the currency in which the cash flows are denominated.
• Trust deposits and deposits due to banks and other depositors: The fair values of certificates of deposit whichmature in more than one year are estimated for disclosure purposes using discounted cash flow calculationsbased upon interest rates currently offered for deposits with similar maturities. For demand deposits andcertificates of deposit which mature in less than one year, carrying values approximate fair value.
• Long-term debt: Fair values of these obligations were determined for disclosure purposes by reference toquoted market prices, where available and appropriate, or discounted cash flow calculations based upon
39
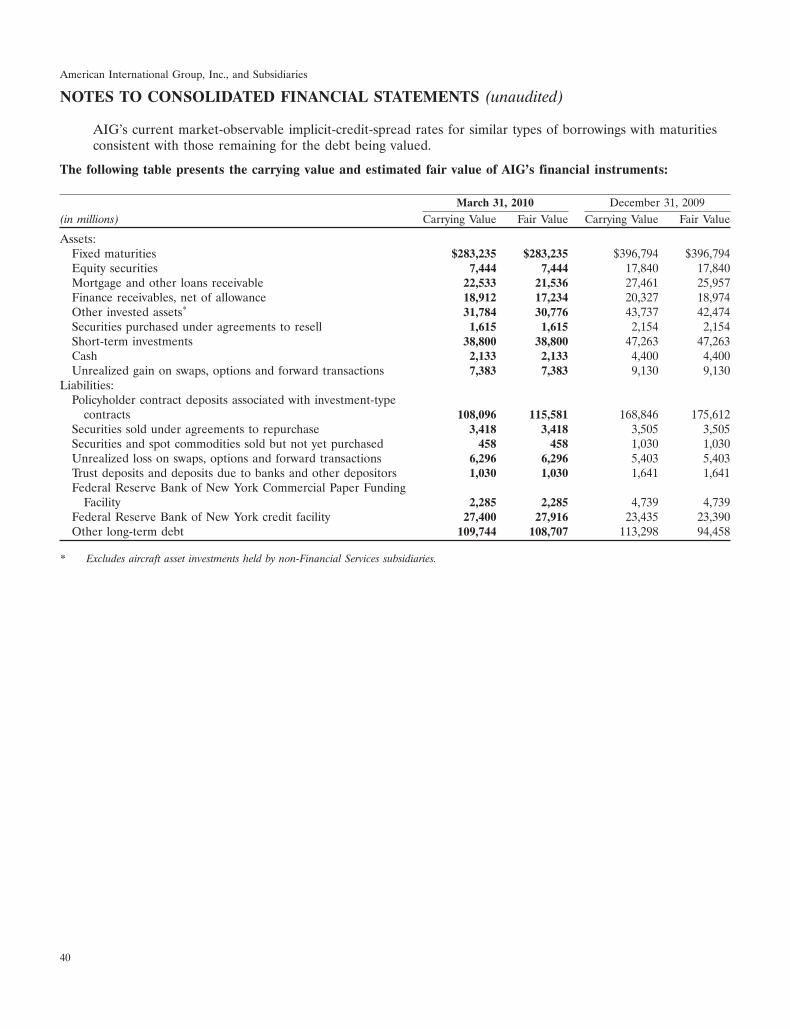
American International Group, Inc., and Subsidiaries
NOTES TO CONSOLIDATED FINANCIAL STATEMENTS (unaudited)
AIG’s current market-observable implicit-credit-spread rates for similar types of borrowings with maturitiesconsistent with those remaining for the debt being valued.
The following table presents the carrying value and estimated fair value of AIG’s financial instruments:
March 31, 2010 December 31, 2009(in millions) Carrying Value Fair Value Carrying Value Fair Value
Assets:Fixed maturities $283,235 $283,235 $396,794 $396,794Equity securities 7,444 7,444 17,840 17,840Mortgage and other loans receivable 22,533 21,536 27,461 25,957Finance receivables, net of allowance 18,912 17,234 20,327 18,974Other invested assets* 31,784 30,776 43,737 42,474Securities purchased under agreements to resell 1,615 1,615 2,154 2,154Short-term investments 38,800 38,800 47,263 47,263Cash 2,133 2,133 4,400 4,400Unrealized gain on swaps, options and forward transactions 7,383 7,383 9,130 9,130
Liabilities:Policyholder contract deposits associated with investment-type
contracts 108,096 115,581 168,846 175,612Securities sold under agreements to repurchase 3,418 3,418 3,505 3,505Securities and spot commodities sold but not yet purchased 458 458 1,030 1,030Unrealized loss on swaps, options and forward transactions 6,296 6,296 5,403 5,403Trust deposits and deposits due to banks and other depositors 1,030 1,030 1,641 1,641Federal Reserve Bank of New York Commercial Paper Funding
Facility 2,285 2,285 4,739 4,739Federal Reserve Bank of New York credit facility 27,400 27,916 23,435 23,390Other long-term debt 109,744 108,707 113,298 94,458
* Excludes aircraft asset investments held by non-Financial Services subsidiaries.
40
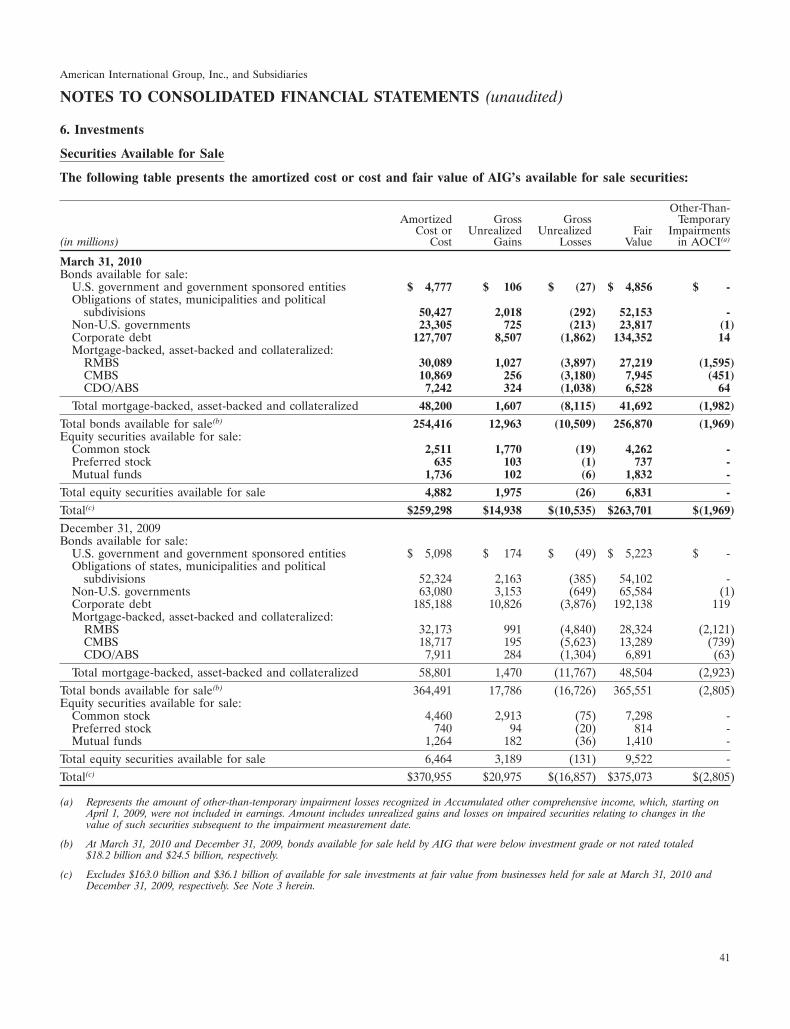
American International Group, Inc., and Subsidiaries
NOTES TO CONSOLIDATED FINANCIAL STATEMENTS (unaudited)
6. Investments
Securities Available for Sale
The following table presents the amortized cost or cost and fair value of AIG’s available for sale securities:
Other-Than-Amortized Gross Gross Temporary
Cost or Unrealized Unrealized Fair Impairments(in millions) Cost Gains Losses Value in AOCI(a)
March 31, 2010Bonds available for sale:
U.S. government and government sponsored entities $ 4,777 $ 106 $ (27) $ 4,856 $ -Obligations of states, municipalities and political
subdivisions 50,427 2,018 (292) 52,153 -Non-U.S. governments 23,305 725 (213) 23,817 (1)Corporate debt 127,707 8,507 (1,862) 134,352 14Mortgage-backed, asset-backed and collateralized:
RMBS 30,089 1,027 (3,897) 27,219 (1,595)CMBS 10,869 256 (3,180) 7,945 (451)CDO/ABS 7,242 324 (1,038) 6,528 64
Total mortgage-backed, asset-backed and collateralized 48,200 1,607 (8,115) 41,692 (1,982)
Total bonds available for sale(b) 254,416 12,963 (10,509) 256,870 (1,969)Equity securities available for sale:
Common stock 2,511 1,770 (19) 4,262 -Preferred stock 635 103 (1) 737 -Mutual funds 1,736 102 (6) 1,832 -
Total equity securities available for sale 4,882 1,975 (26) 6,831 -
Total(c) $259,298 $14,938 $(10,535) $263,701 $(1,969)
December 31, 2009Bonds available for sale:
U.S. government and government sponsored entities $ 5,098 $ 174 $ (49) $ 5,223 $ -Obligations of states, municipalities and political
subdivisions 52,324 2,163 (385) 54,102 -Non-U.S. governments 63,080 3,153 (649) 65,584 (1)Corporate debt 185,188 10,826 (3,876) 192,138 119Mortgage-backed, asset-backed and collateralized:
RMBS 32,173 991 (4,840) 28,324 (2,121)CMBS 18,717 195 (5,623) 13,289 (739)CDO/ABS 7,911 284 (1,304) 6,891 (63)
Total mortgage-backed, asset-backed and collateralized 58,801 1,470 (11,767) 48,504 (2,923)Total bonds available for sale(b) 364,491 17,786 (16,726) 365,551 (2,805)Equity securities available for sale:
Common stock 4,460 2,913 (75) 7,298 -Preferred stock 740 94 (20) 814 -Mutual funds 1,264 182 (36) 1,410 -
Total equity securities available for sale 6,464 3,189 (131) 9,522 -Total(c) $370,955 $20,975 $(16,857) $375,073 $(2,805)
(a) Represents the amount of other-than-temporary impairment losses recognized in Accumulated other comprehensive income, which, starting onApril 1, 2009, were not included in earnings. Amount includes unrealized gains and losses on impaired securities relating to changes in thevalue of such securities subsequent to the impairment measurement date.
(b) At March 31, 2010 and December 31, 2009, bonds available for sale held by AIG that were below investment grade or not rated totaled$18.2 billion and $24.5 billion, respectively.
(c) Excludes $163.0 billion and $36.1 billion of available for sale investments at fair value from businesses held for sale at March 31, 2010 andDecember 31, 2009, respectively. See Note 3 herein.
41
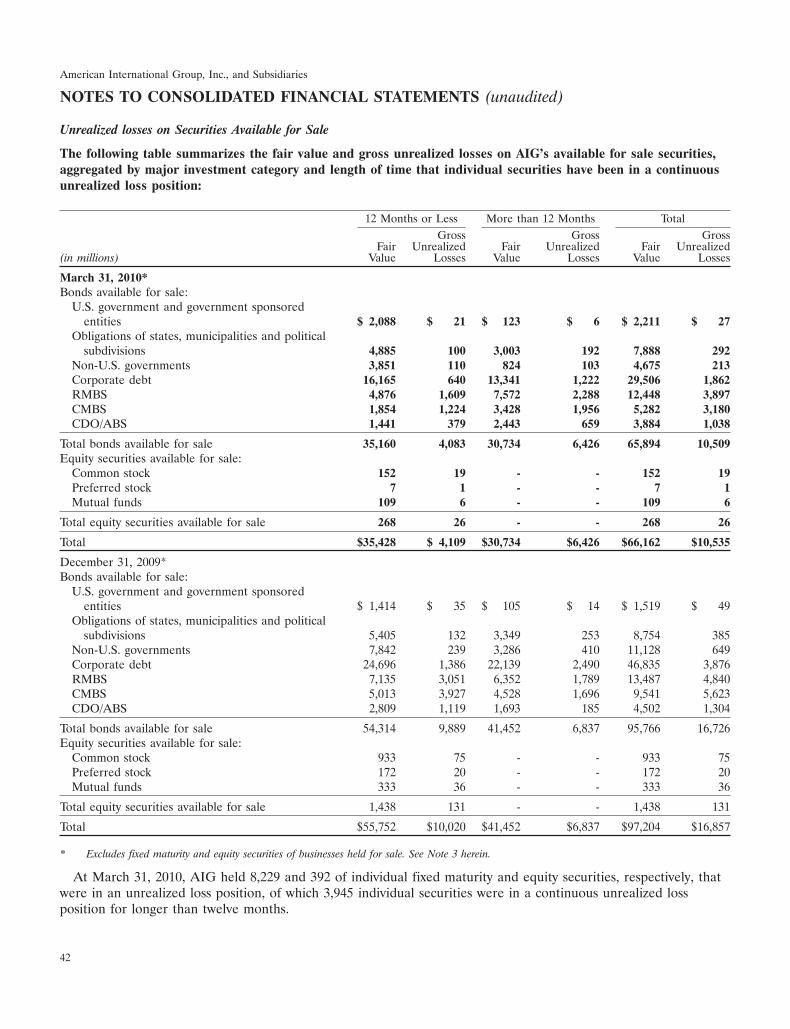
American International Group, Inc., and Subsidiaries
NOTES TO CONSOLIDATED FINANCIAL STATEMENTS (unaudited)
Unrealized losses on Securities Available for Sale
The following table summarizes the fair value and gross unrealized losses on AIG’s available for sale securities,aggregated by major investment category and length of time that individual securities have been in a continuousunrealized loss position:
12 Months or Less More than 12 Months TotalGross Gross Gross
Fair Unrealized Fair Unrealized Fair Unrealized(in millions) Value Losses Value Losses Value Losses
March 31, 2010*Bonds available for sale:
U.S. government and government sponsoredentities $ 2,088 $ 21 $ 123 $ 6 $ 2,211 $ 27
Obligations of states, municipalities and politicalsubdivisions 4,885 100 3,003 192 7,888 292
Non-U.S. governments 3,851 110 824 103 4,675 213Corporate debt 16,165 640 13,341 1,222 29,506 1,862RMBS 4,876 1,609 7,572 2,288 12,448 3,897CMBS 1,854 1,224 3,428 1,956 5,282 3,180CDO/ABS 1,441 379 2,443 659 3,884 1,038
Total bonds available for sale 35,160 4,083 30,734 6,426 65,894 10,509Equity securities available for sale:
Common stock 152 19 - - 152 19Preferred stock 7 1 - - 7 1Mutual funds 109 6 - - 109 6
Total equity securities available for sale 268 26 - - 268 26
Total $35,428 $ 4,109 $30,734 $6,426 $66,162 $10,535
December 31, 2009*Bonds available for sale:
U.S. government and government sponsoredentities $ 1,414 $ 35 $ 105 $ 14 $ 1,519 $ 49
Obligations of states, municipalities and politicalsubdivisions 5,405 132 3,349 253 8,754 385
Non-U.S. governments 7,842 239 3,286 410 11,128 649Corporate debt 24,696 1,386 22,139 2,490 46,835 3,876RMBS 7,135 3,051 6,352 1,789 13,487 4,840CMBS 5,013 3,927 4,528 1,696 9,541 5,623CDO/ABS 2,809 1,119 1,693 185 4,502 1,304
Total bonds available for sale 54,314 9,889 41,452 6,837 95,766 16,726Equity securities available for sale:
Common stock 933 75 - - 933 75Preferred stock 172 20 - - 172 20Mutual funds 333 36 - - 333 36
Total equity securities available for sale 1,438 131 - - 1,438 131
Total $55,752 $10,020 $41,452 $6,837 $97,204 $16,857
* Excludes fixed maturity and equity securities of businesses held for sale. See Note 3 herein.
At March 31, 2010, AIG held 8,229 and 392 of individual fixed maturity and equity securities, respectively, thatwere in an unrealized loss position, of which 3,945 individual securities were in a continuous unrealized lossposition for longer than twelve months.
42

American International Group, Inc., and Subsidiaries
NOTES TO CONSOLIDATED FINANCIAL STATEMENTS (unaudited)
AIG did not recognize in earnings the unrealized losses on these fixed maturity securities at March 31, 2010,because management neither intends to sell the securities nor does it believe that it is more likely than not that itwill be required to sell these securities before recovery of their amortized cost basis. Furthermore, managementexpects to recover the entire amortized cost basis of these securities. In performing this evaluation, managementconsidered the recovery periods for securities in previous periods of broad market declines. For fixed maturitysecurities with significant declines, management performed fundamental credit analysis on a security-by-securitybasis, which included consideration of credit enhancements, expected defaults on underlying collateral, review ofrelevant industry analyst reports and forecasts and other available market data.
Contractual Maturities
The following table presents the amortized cost and fair value of fixed maturity securities available for sale bycontractual maturity:
Total Fixed Maturity Fixed MaturityAvailable for Sale Securities Securities in a Loss Position
March 31, 2010 Amortized Fair Amortized Fair(in millions) Cost Value Cost Value
Due in one year or less $ 10,516 $ 10,766 $ 1,698 $ 1,666Due after one year through five years 52,935 55,234 11,151 10,538Due after five years through ten years 64,693 67,641 12,825 12,239Due after ten years 78,072 81,537 21,000 19,837Mortgage-backed, asset-backed and collateralized 48,200 41,692 29,729 21,614
Total $254,416 $256,870 $76,403 $65,894
Actual maturities may differ from contractual maturities because certain borrowers have the right to call orprepay certain obligations with or without call or prepayment penalties.
The following table presents the gross realized gains and gross realized losses from sales of AIG’s available forsale securities:
Three Months Ended March 31,2010 2009
Gross Gross Gross GrossRealized Realized Realized Realized
(in millions) Gains Losses Gains Losses
Fixed maturities $369 $74 $355 $355Equity securities 114 4 63 120
Total $483 $78 $418 $475
For the three-month period ended March 31, 2010, the aggregate fair value of available for sale securities soldat a loss was $883 million, which resulted in a net realized capital loss of $63 million. The average periods of timethat securities sold at a loss during the three-month period ended March 31, 2010 were trading continuously at aprice below cost or amortized cost was approximately four months.
Evaluating Investments for Other-Than-Temporary Impairments
On April 1, 2009, AIG adopted a new accounting standard on a prospective basis addressing the evaluation offixed maturity securities for other-than-temporary impairments. These requirements have significantly alteredAIG’s policies and procedures for determining impairment charges recognized through earnings. The newstandard requires a company to recognize the credit component (a credit impairment) of an other-than-temporary
43
American International Group, Inc., and Subsidiaries
NOTES TO CONSOLIDATED FINANCIAL STATEMENTS (unaudited)
impairment of a fixed maturity security in earnings and the non-credit component in Accumulated othercomprehensive income when the company does not intend to sell the security or it is more likely than not that thecompany will not be required to sell the security prior to recovery. The new standard also changes the thresholdfor determining when an other-than-temporary impairment has occurred on a fixed maturity security with respectto intent and ability to hold the security until recovery and requires additional disclosures. A credit impairment,which is recognized in earnings when it occurs, is the difference between the amortized cost of the fixed maturitysecurity and the estimated present value of cash flows expected to be collected (recovery value), as determined bymanagement. The difference between fair value and amortized cost that is not related to a credit impairment isrecognized as a separate component of Accumulated other comprehensive income (loss). AIG refers to both creditimpairments and impairments recognized as a result of intent to sell as ‘‘impairment charges.’’ The impairmentmodel for equity securities was not affected by the new standard.
Impairment Policy — Effective April 1, 2009 and Thereafter
Fixed Maturity Securities
If AIG intends to sell a fixed maturity security or it is more likely than not that AIG will be required to sell afixed maturity security before recovery of its amortized cost basis and the fair value of the security is belowamortized cost, an other-than-temporary impairment has occurred and the amortized cost is written down tocurrent fair value, with a corresponding charge to earnings.
For all other fixed maturity securities for which a credit impairment has occurred, the amortized cost is writtendown to the estimated recovery value with a corresponding charge to earnings. Changes in fair value compared torecovery value, if any, are charged to unrealized appreciation (depreciation) of fixed maturity investments onwhich other-than-temporary credit impairments were taken (a component of Accumulated other comprehensiveincome (loss)).
When assessing AIG’s intent to sell a fixed maturity security, or whether it is more likely than not that AIG willbe required to sell a fixed maturity security before recovery of its amortized cost basis, management evaluatesrelevant facts and circumstances including, but not limited to, decisions to reposition AIG’s investment portfolio,sales of securities to meet cash flow needs and sales of securities to capitalize on favorable pricing.
AIG considers severe price declines and the duration of such price declines in its assessment of potential creditimpairments. AIG also modifies its modeled outputs for certain securities when it determines that price declinesare indicative of factors not accounted for in the cash flow models.
In periods subsequent to the recognition of an other-than-temporary impairment charge that is not foreignexchange related for available for sale fixed maturity securities, AIG generally prospectively accretes into earningsover the remaining expected holding period of the security the difference between the new amortized cost and theexpected undiscounted recovery value.
44
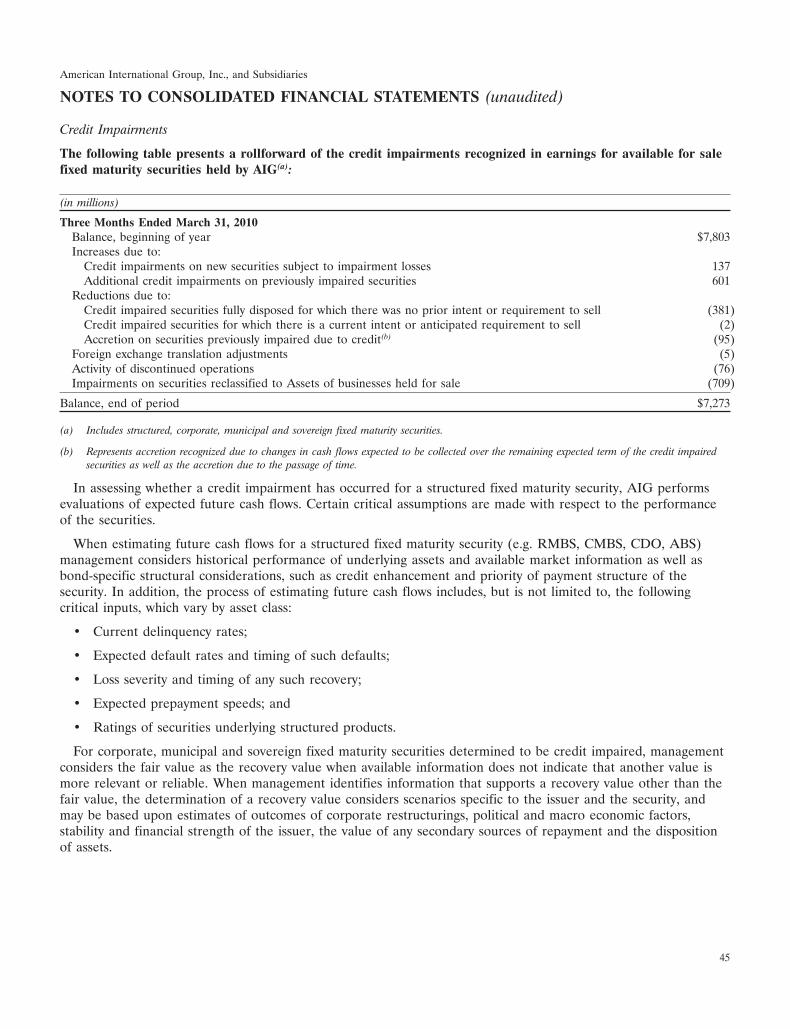
American International Group, Inc., and Subsidiaries
NOTES TO CONSOLIDATED FINANCIAL STATEMENTS (unaudited)
Credit Impairments
The following table presents a rollforward of the credit impairments recognized in earnings for available for salefixed maturity securities held by AIG(a):
(in millions)
Three Months Ended March 31, 2010Balance, beginning of year $7,803Increases due to:
Credit impairments on new securities subject to impairment losses 137Additional credit impairments on previously impaired securities 601
Reductions due to:Credit impaired securities fully disposed for which there was no prior intent or requirement to sell (381)Credit impaired securities for which there is a current intent or anticipated requirement to sell (2)Accretion on securities previously impaired due to credit(b) (95)
Foreign exchange translation adjustments (5)Activity of discontinued operations (76)Impairments on securities reclassified to Assets of businesses held for sale (709)
Balance, end of period $7,273
(a) Includes structured, corporate, municipal and sovereign fixed maturity securities.
(b) Represents accretion recognized due to changes in cash flows expected to be collected over the remaining expected term of the credit impairedsecurities as well as the accretion due to the passage of time.
In assessing whether a credit impairment has occurred for a structured fixed maturity security, AIG performsevaluations of expected future cash flows. Certain critical assumptions are made with respect to the performanceof the securities.
When estimating future cash flows for a structured fixed maturity security (e.g. RMBS, CMBS, CDO, ABS)management considers historical performance of underlying assets and available market information as well asbond-specific structural considerations, such as credit enhancement and priority of payment structure of thesecurity. In addition, the process of estimating future cash flows includes, but is not limited to, the followingcritical inputs, which vary by asset class:
• Current delinquency rates;
• Expected default rates and timing of such defaults;
• Loss severity and timing of any such recovery;
• Expected prepayment speeds; and
• Ratings of securities underlying structured products.
For corporate, municipal and sovereign fixed maturity securities determined to be credit impaired, managementconsiders the fair value as the recovery value when available information does not indicate that another value ismore relevant or reliable. When management identifies information that supports a recovery value other than thefair value, the determination of a recovery value considers scenarios specific to the issuer and the security, andmay be based upon estimates of outcomes of corporate restructurings, political and macro economic factors,stability and financial strength of the issuer, the value of any secondary sources of repayment and the dispositionof assets.
45
American International Group, Inc., and Subsidiaries
NOTES TO CONSOLIDATED FINANCIAL STATEMENTS (unaudited)
Equity Securities
The impairment model for equity securities and other cost and equity method investments was not affected bythe adoption of the new accounting standard related to other-than-temporary impairments in the second quarterof 2009. AIG continues to evaluate its available for sale equity securities, equity method and cost methodinvestments for impairment by considering such securities as candidates for other-than-temporary impairment ifthey meet any of the following criteria:
• The security has traded at a significant (25 percent or more) discount to cost for an extended period of time(nine consecutive months or longer);
• A discrete credit event has occurred resulting in (i) the issuer defaulting on a material outstandingobligation; (ii) the issuer seeking protection from creditors under the bankruptcy laws or any similar lawsintended for court supervised reorganization of insolvent enterprises; or (iii) the issuer proposing a voluntaryreorganization pursuant to which creditors are asked to exchange their claims for cash or securities having afair value substantially lower than par value of their claims; or
• AIG has concluded that it may not realize a full recovery on its investment, regardless of the occurrence ofone of the foregoing events.
The determination that an equity security is other-than-temporarily impaired requires the judgment ofmanagement and consideration of the fundamental condition of the issuer, its near-term prospects and all therelevant facts and circumstances. The above criteria also consider circumstances of a rapid and severe marketvaluation decline in which AIG could not reasonably assert that the impairment period would be temporary(severity losses).
Other Invested Assets
AIG’s investments in funds and investment partnerships are evaluated for impairment consistent with theevaluation of equity securities for impairments as discussed above. Such evaluation considers market conditions,events and volatility that may impact the recoverability of the underlying investments within these funds andinvestment partnerships and is based on the nature of the underlying investments and specific inherent risks. Suchrisks may evolve based on the nature of the underlying investments.
AIG’s investments in life settlement contracts are monitored for impairment based on the underlying lifeinsurance policies, with cash flows reported monthly. An investment in a life settlement contract is consideredimpaired if the undiscounted cash flows resulting from the expected proceeds from the insurance policy are lessthan the carrying amount of the investment plus anticipated continuing costs. If an impairment loss is recognized,the investment is written down to fair value.
AIG’s aircraft asset investments and investments in real estate are periodically evaluated for recoverabilitywhenever changes in circumstances indicate the carrying amount of an asset may be impaired. When impairmentindicators are present, AIG compares expected investment cash flows to carrying value. When the expected cashflows are less than the carrying value, the investments are written down to fair value with a corresponding chargeto earnings.
Fixed Maturity Securities Impairment Policy — Prior to April 1, 2009
In all periods prior to April 1, 2009, AIG assessed its ability to hold any fixed maturity available for salesecurity in an unrealized loss position to its recovery at each balance sheet date. The decision to sell any suchfixed maturity security classified as available for sale reflected the judgment of AIG’s management that thesecurity sold was unlikely to provide, on a relative value basis, as attractive a return in the future as alternativesecurities entailing comparable risks. With respect to distressed securities, the sale decision reflectedmanagement’s judgment that the risk-adjusted ultimate recovery was less than the value achievable on sale.
46
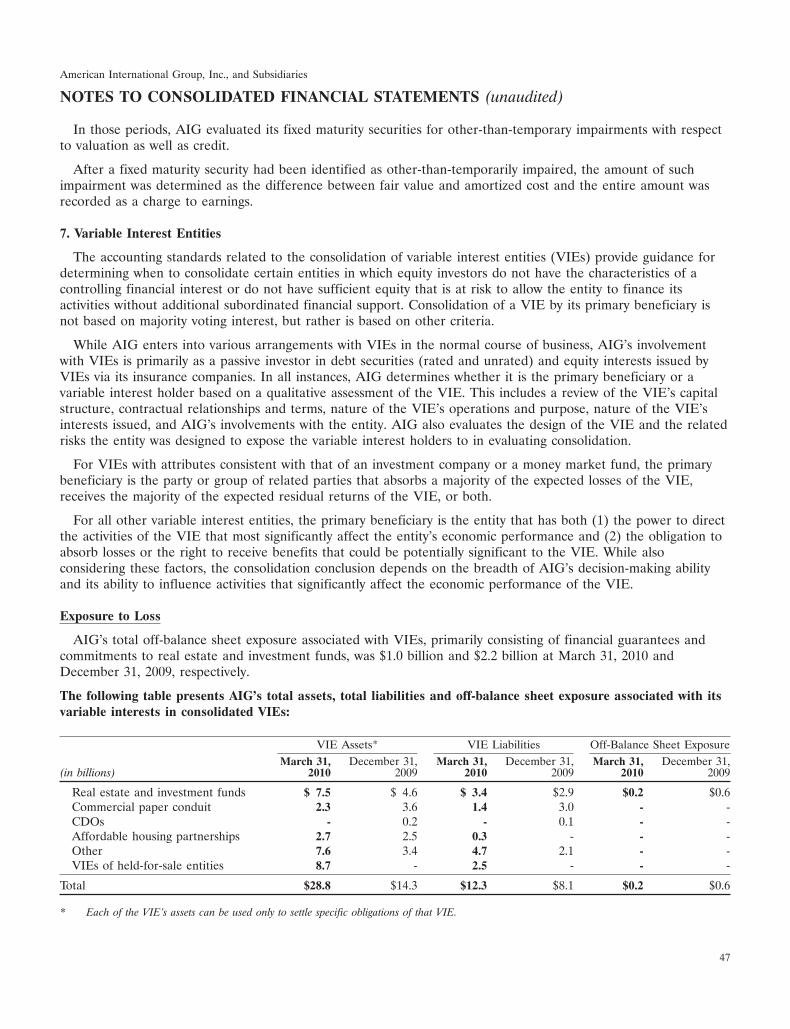
American International Group, Inc., and Subsidiaries
NOTES TO CONSOLIDATED FINANCIAL STATEMENTS (unaudited)
In those periods, AIG evaluated its fixed maturity securities for other-than-temporary impairments with respectto valuation as well as credit.
After a fixed maturity security had been identified as other-than-temporarily impaired, the amount of suchimpairment was determined as the difference between fair value and amortized cost and the entire amount wasrecorded as a charge to earnings.
7. Variable Interest Entities
The accounting standards related to the consolidation of variable interest entities (VIEs) provide guidance fordetermining when to consolidate certain entities in which equity investors do not have the characteristics of acontrolling financial interest or do not have sufficient equity that is at risk to allow the entity to finance itsactivities without additional subordinated financial support. Consolidation of a VIE by its primary beneficiary isnot based on majority voting interest, but rather is based on other criteria.
While AIG enters into various arrangements with VIEs in the normal course of business, AIG’s involvementwith VIEs is primarily as a passive investor in debt securities (rated and unrated) and equity interests issued byVIEs via its insurance companies. In all instances, AIG determines whether it is the primary beneficiary or avariable interest holder based on a qualitative assessment of the VIE. This includes a review of the VIE’s capitalstructure, contractual relationships and terms, nature of the VIE’s operations and purpose, nature of the VIE’sinterests issued, and AIG’s involvements with the entity. AIG also evaluates the design of the VIE and the relatedrisks the entity was designed to expose the variable interest holders to in evaluating consolidation.
For VIEs with attributes consistent with that of an investment company or a money market fund, the primarybeneficiary is the party or group of related parties that absorbs a majority of the expected losses of the VIE,receives the majority of the expected residual returns of the VIE, or both.
For all other variable interest entities, the primary beneficiary is the entity that has both (1) the power to directthe activities of the VIE that most significantly affect the entity’s economic performance and (2) the obligation toabsorb losses or the right to receive benefits that could be potentially significant to the VIE. While alsoconsidering these factors, the consolidation conclusion depends on the breadth of AIG’s decision-making abilityand its ability to influence activities that significantly affect the economic performance of the VIE.
Exposure to Loss
AIG’s total off-balance sheet exposure associated with VIEs, primarily consisting of financial guarantees andcommitments to real estate and investment funds, was $1.0 billion and $2.2 billion at March 31, 2010 andDecember 31, 2009, respectively.
The following table presents AIG’s total assets, total liabilities and off-balance sheet exposure associated with itsvariable interests in consolidated VIEs:
VIE Assets* VIE Liabilities Off-Balance Sheet ExposureMarch 31, December 31, March 31, December 31, March 31, December 31,
(in billions) 2010 2009 2010 2009 2010 2009
Real estate and investment funds $ 7.5 $ 4.6 $ 3.4 $2.9 $0.2 $0.6Commercial paper conduit 2.3 3.6 1.4 3.0 - -CDOs - 0.2 - 0.1 - -Affordable housing partnerships 2.7 2.5 0.3 - - -Other 7.6 3.4 4.7 2.1 - -VIEs of held-for-sale entities 8.7 - 2.5 - - -
Total $28.8 $14.3 $12.3 $8.1 $0.2 $0.6
* Each of the VIE’s assets can be used only to settle specific obligations of that VIE.
47

American International Group, Inc., and Subsidiaries
NOTES TO CONSOLIDATED FINANCIAL STATEMENTS (unaudited)
AIG calculates its maximum exposure to loss to be (i) the amount invested in the debt or equity of the VIE,(ii) the notional amount of VIE assets or liabilities where AIG has also provided credit protection to the VIE withthe VIE as the referenced obligation, and (iii) other commitments and guarantees to the VIE. Interest holders inVIEs sponsored by AIG generally have recourse only to the assets and cash flows of the VIEs and do not haverecourse to AIG, except in limited circumstances when AIG has provided a guarantee to the VIE’s interestholders.
The following table presents total assets of unconsolidated VIEs in which AIG holds a variable interest, as well asAIG’s maximum exposure to loss associated with these VIEs:
Maximum Exposure to LossOff-Balance
On-Balance Sheet SheetTotal Purchased CommitmentsVIE and Retained and
(in billions) Assets Interests Other Guarantees Total
March 31, 2010Real estate and investment funds $14.9 $ 2.2 $0.2 $0.6 $ 3.0Affordable housing partnerships 1.3 - 1.3 - 1.3Maiden Lane Interests 39.9 6.2 - - 6.2Other 0.9 0.2 - - 0.2VIEs of held-for-sale entities 11.5 2.6 0.6 0.2 3.4
Total $68.5 $11.2 $2.1 $0.8 $14.1
December 31, 2009Real estate and investment funds $23.3 $ 3.2 $0.4 $1.6 $ 5.2Affordable housing partnerships 1.3 - 1.3 - 1.3Maiden Lane Interests 38.7 5.3 - - 5.3Other 7.6 1.2 0.5 - 1.7
Total $70.9 $ 9.7 $2.2 $1.6 $13.5
48
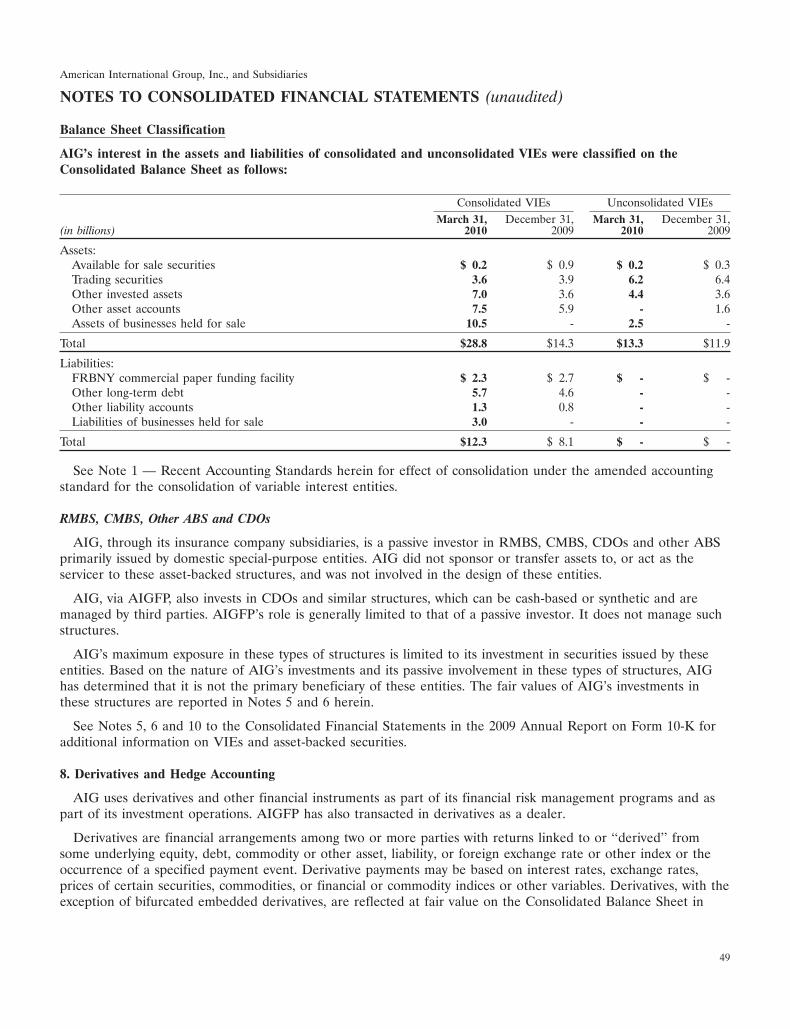
American International Group, Inc., and Subsidiaries
NOTES TO CONSOLIDATED FINANCIAL STATEMENTS (unaudited)
Balance Sheet Classification
AIG’s interest in the assets and liabilities of consolidated and unconsolidated VIEs were classified on theConsolidated Balance Sheet as follows:
Consolidated VIEs Unconsolidated VIEsMarch 31, December 31, March 31, December 31,
(in billions) 2010 2009 2010 2009
Assets:Available for sale securities $ 0.2 $ 0.9 $ 0.2 $ 0.3Trading securities 3.6 3.9 6.2 6.4Other invested assets 7.0 3.6 4.4 3.6Other asset accounts 7.5 5.9 - 1.6Assets of businesses held for sale 10.5 - 2.5 -
Total $28.8 $14.3 $13.3 $11.9
Liabilities:FRBNY commercial paper funding facility $ 2.3 $ 2.7 $ - $ -Other long-term debt 5.7 4.6 - -Other liability accounts 1.3 0.8 - -Liabilities of businesses held for sale 3.0 - - -
Total $12.3 $ 8.1 $ - $ -
See Note 1 — Recent Accounting Standards herein for effect of consolidation under the amended accountingstandard for the consolidation of variable interest entities.
RMBS, CMBS, Other ABS and CDOs
AIG, through its insurance company subsidiaries, is a passive investor in RMBS, CMBS, CDOs and other ABSprimarily issued by domestic special-purpose entities. AIG did not sponsor or transfer assets to, or act as theservicer to these asset-backed structures, and was not involved in the design of these entities.
AIG, via AIGFP, also invests in CDOs and similar structures, which can be cash-based or synthetic and aremanaged by third parties. AIGFP’s role is generally limited to that of a passive investor. It does not manage suchstructures.
AIG’s maximum exposure in these types of structures is limited to its investment in securities issued by theseentities. Based on the nature of AIG’s investments and its passive involvement in these types of structures, AIGhas determined that it is not the primary beneficiary of these entities. The fair values of AIG’s investments inthese structures are reported in Notes 5 and 6 herein.
See Notes 5, 6 and 10 to the Consolidated Financial Statements in the 2009 Annual Report on Form 10-K foradditional information on VIEs and asset-backed securities.
8. Derivatives and Hedge Accounting
AIG uses derivatives and other financial instruments as part of its financial risk management programs and aspart of its investment operations. AIGFP has also transacted in derivatives as a dealer.
Derivatives are financial arrangements among two or more parties with returns linked to or ‘‘derived’’ fromsome underlying equity, debt, commodity or other asset, liability, or foreign exchange rate or other index or theoccurrence of a specified payment event. Derivative payments may be based on interest rates, exchange rates,prices of certain securities, commodities, or financial or commodity indices or other variables. Derivatives, with theexception of bifurcated embedded derivatives, are reflected at fair value on the Consolidated Balance Sheet in
49
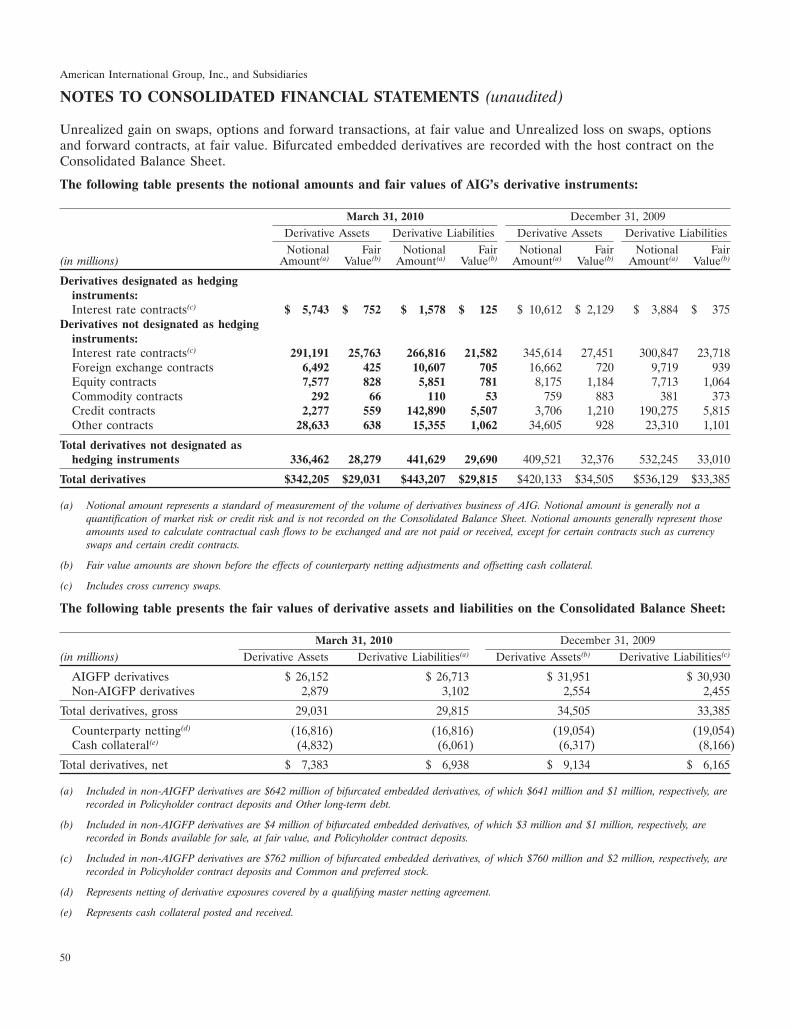
American International Group, Inc., and Subsidiaries
NOTES TO CONSOLIDATED FINANCIAL STATEMENTS (unaudited)
Unrealized gain on swaps, options and forward transactions, at fair value and Unrealized loss on swaps, optionsand forward contracts, at fair value. Bifurcated embedded derivatives are recorded with the host contract on theConsolidated Balance Sheet.
The following table presents the notional amounts and fair values of AIG’s derivative instruments:
March 31, 2010 December 31, 2009Derivative Assets Derivative Liabilities Derivative Assets Derivative LiabilitiesNotional Fair Notional Fair Notional Fair Notional Fair
(in millions) Amount(a) Value(b) Amount(a) Value(b) Amount(a) Value(b) Amount(a) Value(b)
Derivatives designated as hedginginstruments:Interest rate contracts(c) $ 5,743 $ 752 $ 1,578 $ 125 $ 10,612 $ 2,129 $ 3,884 $ 375
Derivatives not designated as hedginginstruments:Interest rate contracts(c) 291,191 25,763 266,816 21,582 345,614 27,451 300,847 23,718Foreign exchange contracts 6,492 425 10,607 705 16,662 720 9,719 939Equity contracts 7,577 828 5,851 781 8,175 1,184 7,713 1,064Commodity contracts 292 66 110 53 759 883 381 373Credit contracts 2,277 559 142,890 5,507 3,706 1,210 190,275 5,815Other contracts 28,633 638 15,355 1,062 34,605 928 23,310 1,101
Total derivatives not designated ashedging instruments 336,462 28,279 441,629 29,690 409,521 32,376 532,245 33,010
Total derivatives $342,205 $29,031 $443,207 $29,815 $420,133 $34,505 $536,129 $33,385
(a) Notional amount represents a standard of measurement of the volume of derivatives business of AIG. Notional amount is generally not aquantification of market risk or credit risk and is not recorded on the Consolidated Balance Sheet. Notional amounts generally represent thoseamounts used to calculate contractual cash flows to be exchanged and are not paid or received, except for certain contracts such as currencyswaps and certain credit contracts.
(b) Fair value amounts are shown before the effects of counterparty netting adjustments and offsetting cash collateral.
(c) Includes cross currency swaps.
The following table presents the fair values of derivative assets and liabilities on the Consolidated Balance Sheet:
March 31, 2010 December 31, 2009(in millions) Derivative Assets Derivative Liabilities(a) Derivative Assets(b) Derivative Liabilities(c)
AIGFP derivatives $ 26,152 $ 26,713 $ 31,951 $ 30,930Non-AIGFP derivatives 2,879 3,102 2,554 2,455
Total derivatives, gross 29,031 29,815 34,505 33,385
Counterparty netting(d) (16,816) (16,816) (19,054) (19,054)Cash collateral(e) (4,832) (6,061) (6,317) (8,166)
Total derivatives, net $ 7,383 $ 6,938 $ 9,134 $ 6,165
(a) Included in non-AIGFP derivatives are $642 million of bifurcated embedded derivatives, of which $641 million and $1 million, respectively, arerecorded in Policyholder contract deposits and Other long-term debt.
(b) Included in non-AIGFP derivatives are $4 million of bifurcated embedded derivatives, of which $3 million and $1 million, respectively, arerecorded in Bonds available for sale, at fair value, and Policyholder contract deposits.
(c) Included in non-AIGFP derivatives are $762 million of bifurcated embedded derivatives, of which $760 million and $2 million, respectively, arerecorded in Policyholder contract deposits and Common and preferred stock.
(d) Represents netting of derivative exposures covered by a qualifying master netting agreement.
(e) Represents cash collateral posted and received.
50
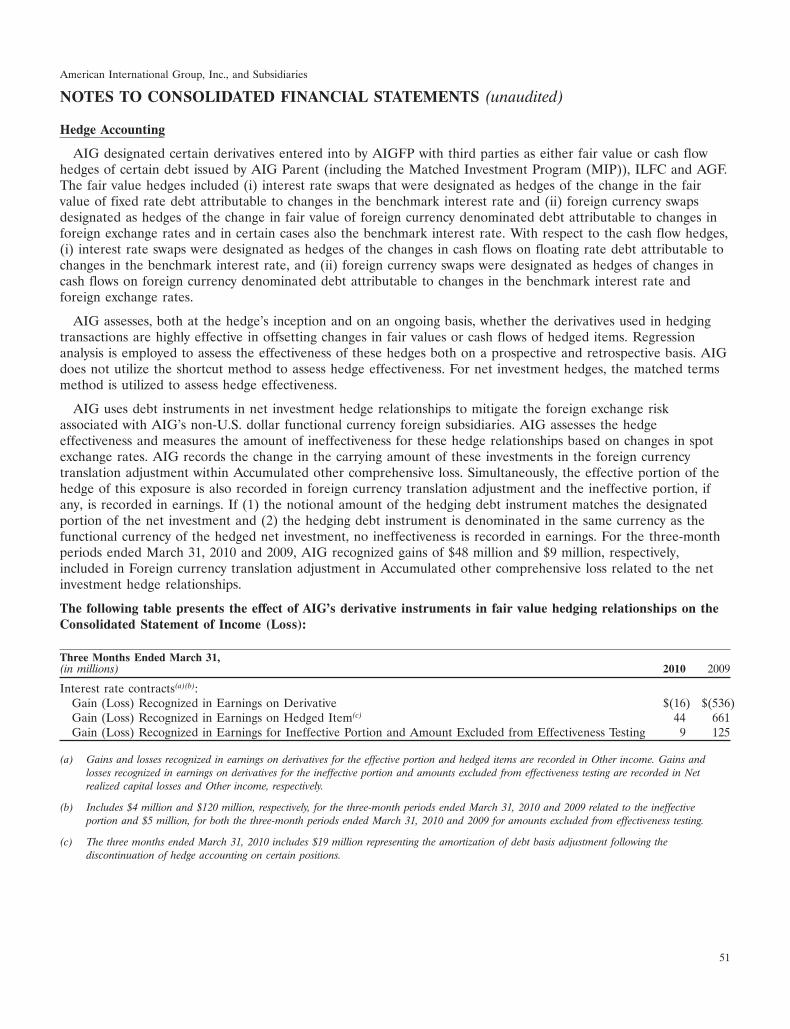
American International Group, Inc., and Subsidiaries
NOTES TO CONSOLIDATED FINANCIAL STATEMENTS (unaudited)
Hedge Accounting
AIG designated certain derivatives entered into by AIGFP with third parties as either fair value or cash flowhedges of certain debt issued by AIG Parent (including the Matched Investment Program (MIP)), ILFC and AGF.The fair value hedges included (i) interest rate swaps that were designated as hedges of the change in the fairvalue of fixed rate debt attributable to changes in the benchmark interest rate and (ii) foreign currency swapsdesignated as hedges of the change in fair value of foreign currency denominated debt attributable to changes inforeign exchange rates and in certain cases also the benchmark interest rate. With respect to the cash flow hedges,(i) interest rate swaps were designated as hedges of the changes in cash flows on floating rate debt attributable tochanges in the benchmark interest rate, and (ii) foreign currency swaps were designated as hedges of changes incash flows on foreign currency denominated debt attributable to changes in the benchmark interest rate andforeign exchange rates.
AIG assesses, both at the hedge’s inception and on an ongoing basis, whether the derivatives used in hedgingtransactions are highly effective in offsetting changes in fair values or cash flows of hedged items. Regressionanalysis is employed to assess the effectiveness of these hedges both on a prospective and retrospective basis. AIGdoes not utilize the shortcut method to assess hedge effectiveness. For net investment hedges, the matched termsmethod is utilized to assess hedge effectiveness.
AIG uses debt instruments in net investment hedge relationships to mitigate the foreign exchange riskassociated with AIG’s non-U.S. dollar functional currency foreign subsidiaries. AIG assesses the hedgeeffectiveness and measures the amount of ineffectiveness for these hedge relationships based on changes in spotexchange rates. AIG records the change in the carrying amount of these investments in the foreign currencytranslation adjustment within Accumulated other comprehensive loss. Simultaneously, the effective portion of thehedge of this exposure is also recorded in foreign currency translation adjustment and the ineffective portion, ifany, is recorded in earnings. If (1) the notional amount of the hedging debt instrument matches the designatedportion of the net investment and (2) the hedging debt instrument is denominated in the same currency as thefunctional currency of the hedged net investment, no ineffectiveness is recorded in earnings. For the three-monthperiods ended March 31, 2010 and 2009, AIG recognized gains of $48 million and $9 million, respectively,included in Foreign currency translation adjustment in Accumulated other comprehensive loss related to the netinvestment hedge relationships.
The following table presents the effect of AIG’s derivative instruments in fair value hedging relationships on theConsolidated Statement of Income (Loss):
Three Months Ended March 31,(in millions) 2010 2009
Interest rate contracts(a)(b):Gain (Loss) Recognized in Earnings on Derivative $(16) $(536)Gain (Loss) Recognized in Earnings on Hedged Item(c) 44 661Gain (Loss) Recognized in Earnings for Ineffective Portion and Amount Excluded from Effectiveness Testing 9 125
(a) Gains and losses recognized in earnings on derivatives for the effective portion and hedged items are recorded in Other income. Gains andlosses recognized in earnings on derivatives for the ineffective portion and amounts excluded from effectiveness testing are recorded in Netrealized capital losses and Other income, respectively.
(b) Includes $4 million and $120 million, respectively, for the three-month periods ended March 31, 2010 and 2009 related to the ineffectiveportion and $5 million, for both the three-month periods ended March 31, 2010 and 2009 for amounts excluded from effectiveness testing.
(c) The three months ended March 31, 2010 includes $19 million representing the amortization of debt basis adjustment following thediscontinuation of hedge accounting on certain positions.
51
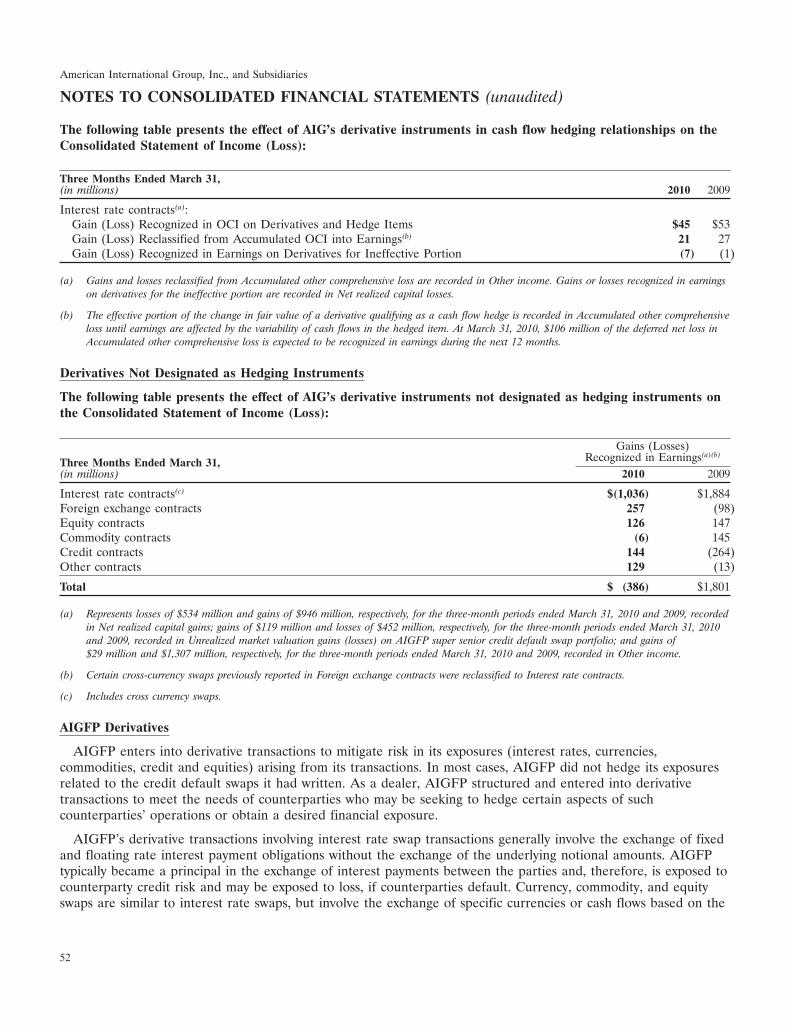
American International Group, Inc., and Subsidiaries
NOTES TO CONSOLIDATED FINANCIAL STATEMENTS (unaudited)
The following table presents the effect of AIG’s derivative instruments in cash flow hedging relationships on theConsolidated Statement of Income (Loss):
Three Months Ended March 31,(in millions) 2010 2009
Interest rate contracts(a):Gain (Loss) Recognized in OCI on Derivatives and Hedge Items $45 $53Gain (Loss) Reclassified from Accumulated OCI into Earnings(b) 21 27Gain (Loss) Recognized in Earnings on Derivatives for Ineffective Portion (7) (1)
(a) Gains and losses reclassified from Accumulated other comprehensive loss are recorded in Other income. Gains or losses recognized in earningson derivatives for the ineffective portion are recorded in Net realized capital losses.
(b) The effective portion of the change in fair value of a derivative qualifying as a cash flow hedge is recorded in Accumulated other comprehensiveloss until earnings are affected by the variability of cash flows in the hedged item. At March 31, 2010, $106 million of the deferred net loss inAccumulated other comprehensive loss is expected to be recognized in earnings during the next 12 months.
Derivatives Not Designated as Hedging Instruments
The following table presents the effect of AIG’s derivative instruments not designated as hedging instruments onthe Consolidated Statement of Income (Loss):
Gains (Losses)Recognized in Earnings(a)(b)
Three Months Ended March 31,(in millions) 2010 2009
Interest rate contracts(c) $(1,036) $1,884Foreign exchange contracts 257 (98)Equity contracts 126 147Commodity contracts (6) 145Credit contracts 144 (264)Other contracts 129 (13)
Total $ (386) $1,801
(a) Represents losses of $534 million and gains of $946 million, respectively, for the three-month periods ended March 31, 2010 and 2009, recordedin Net realized capital gains; gains of $119 million and losses of $452 million, respectively, for the three-month periods ended March 31, 2010and 2009, recorded in Unrealized market valuation gains (losses) on AIGFP super senior credit default swap portfolio; and gains of$29 million and $1,307 million, respectively, for the three-month periods ended March 31, 2010 and 2009, recorded in Other income.
(b) Certain cross-currency swaps previously reported in Foreign exchange contracts were reclassified to Interest rate contracts.
(c) Includes cross currency swaps.
AIGFP Derivatives
AIGFP enters into derivative transactions to mitigate risk in its exposures (interest rates, currencies,commodities, credit and equities) arising from its transactions. In most cases, AIGFP did not hedge its exposuresrelated to the credit default swaps it had written. As a dealer, AIGFP structured and entered into derivativetransactions to meet the needs of counterparties who may be seeking to hedge certain aspects of suchcounterparties’ operations or obtain a desired financial exposure.
AIGFP’s derivative transactions involving interest rate swap transactions generally involve the exchange of fixedand floating rate interest payment obligations without the exchange of the underlying notional amounts. AIGFPtypically became a principal in the exchange of interest payments between the parties and, therefore, is exposed tocounterparty credit risk and may be exposed to loss, if counterparties default. Currency, commodity, and equityswaps are similar to interest rate swaps, but involve the exchange of specific currencies or cash flows based on the
52
American International Group, Inc., and Subsidiaries
NOTES TO CONSOLIDATED FINANCIAL STATEMENTS (unaudited)
underlying commodity, equity securities or indices. Also, they may involve the exchange of notional amounts at thebeginning and end of the transaction. Swaptions are options where the holder has the right but not the obligationto enter into a swap transaction or cancel an existing swap transaction.
AIGFP follows a policy of minimizing interest rate, currency, commodity, and equity risks associated withinvestment securities by entering into offsetting positions, on a security by security basis within its derivativesportfolio, thereby offsetting a significant portion of the unrealized appreciation and depreciation. In addition, toreduce its credit risk, AIGFP has entered into credit derivative transactions with respect to $556 million ofsecurities to economically hedge its credit risk.
The timing and the amount of cash flows relating to AIGFP’s foreign exchange forwards and exchange tradedfutures and options contracts are determined by each of the respective contractual agreements.
Futures and forward contracts are contracts that obligate the holder to sell or purchase foreign currencies,commodities or financial indices in which the seller/purchaser agrees to make/take delivery at a specified futuredate of a specified instrument, at a specified price or yield. Options are contracts that allow the holder of theoption to purchase or sell the underlying commodity, currency or index at a specified price and within, or at, aspecified period of time. As a writer of options, AIGFP generally receives an option premium and then managesthe risk of any unfavorable change in the value of the underlying commodity, currency or index by entering intooffsetting transactions with third-party market participants. Risks arise as a result of movements in current marketprices from contracted prices, and the potential inability of the counterparties to meet their obligations under thecontracts.
AIGFP Super Senior Credit Default Swaps
AIGFP entered into credit default swap transactions with the intention of earning revenue on credit exposure.In the majority of AIGFP’s credit default swap transactions, AIGFP sold credit protection on a designatedportfolio of loans or debt securities. Generally, AIGFP provides such credit protection on a ‘‘second loss’’ basis,meaning that AIGFP would incur credit losses only after a shortfall of principal and/or interest, or other creditevents, in respect of the protected loans and debt securities, exceeds a specified threshold amount or level of ‘‘firstlosses.’’
Typically, the credit risk associated with a designated portfolio of loans or debt securities has been tranched intodifferent layers of risk, which are then analyzed and rated by the credit rating agencies. At origination, there isusually an equity layer covering the first credit losses in respect of the portfolio up to a specified percentage ofthe total portfolio, and then successive layers ranging generally from a BBB-rated layer to one or moreAAA-rated layers. A significant majority of AIGFP transactions that were rated by rating agencies had risk layersor tranches rated AAA at origination and are immediately junior to the threshold level above which AIGFP’spayment obligation would generally arise. In transactions that were not rated, AIGFP applied equivalent riskcriteria for setting the threshold level for its payment obligations. Therefore, the risk layer assumed by AIGFPwith respect to the designated portfolio of loans or debt securities in these transactions is often called the ‘‘supersenior’’ risk layer, defined as a layer of credit risk senior to one or more risk layers rated AAA by the creditrating agencies, or if the transaction is not rated, structured to the equivalent thereto.
53
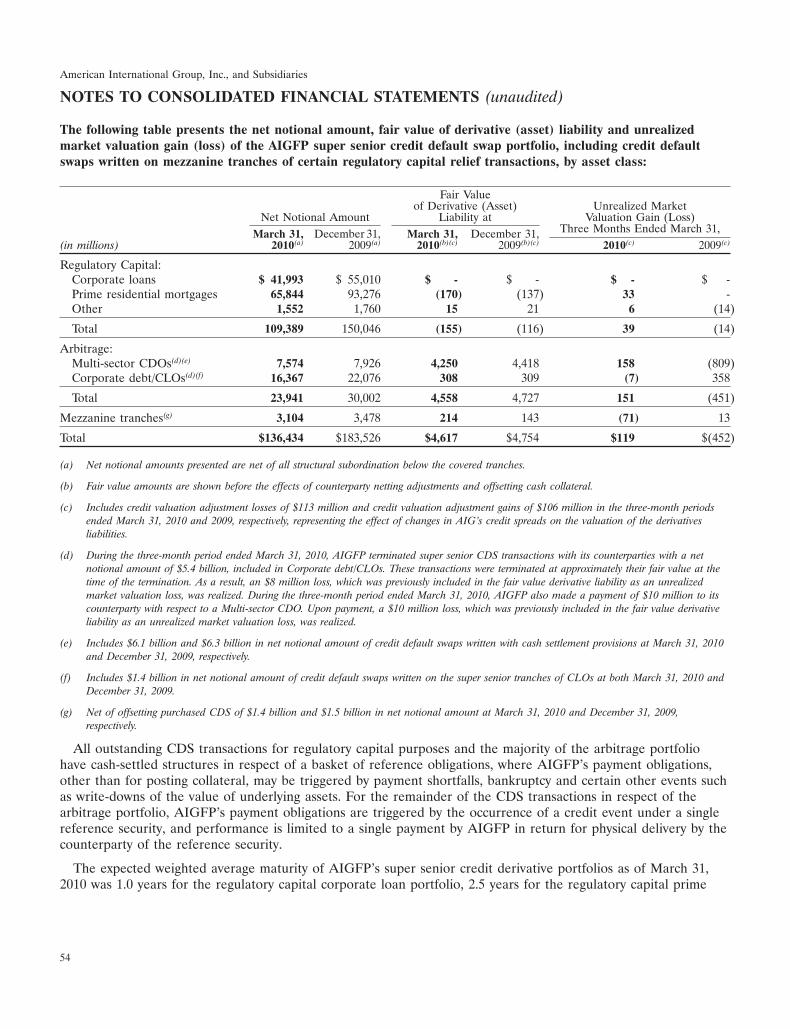
American International Group, Inc., and Subsidiaries
NOTES TO CONSOLIDATED FINANCIAL STATEMENTS (unaudited)
The following table presents the net notional amount, fair value of derivative (asset) liability and unrealizedmarket valuation gain (loss) of the AIGFP super senior credit default swap portfolio, including credit defaultswaps written on mezzanine tranches of certain regulatory capital relief transactions, by asset class:
Fair Valueof Derivative (Asset) Unrealized Market
Net Notional Amount Liability at Valuation Gain (Loss)Three Months Ended March 31,March 31, December 31, March 31, December 31,
(in millions) 2010(a) 2009(a) 2010(b)(c) 2009(b)(c) 2010(c) 2009(c)
Regulatory Capital:Corporate loans $ 41,993 $ 55,010 $ - $ - $ - $ -Prime residential mortgages 65,844 93,276 (170) (137) 33 -Other 1,552 1,760 15 21 6 (14)
Total 109,389 150,046 (155) (116) 39 (14)
Arbitrage:Multi-sector CDOs(d)(e) 7,574 7,926 4,250 4,418 158 (809)Corporate debt/CLOs(d)(f) 16,367 22,076 308 309 (7) 358
Total 23,941 30,002 4,558 4,727 151 (451)
Mezzanine tranches(g) 3,104 3,478 214 143 (71) 13
Total $136,434 $183,526 $4,617 $4,754 $119 $(452)
(a) Net notional amounts presented are net of all structural subordination below the covered tranches.
(b) Fair value amounts are shown before the effects of counterparty netting adjustments and offsetting cash collateral.
(c) Includes credit valuation adjustment losses of $113 million and credit valuation adjustment gains of $106 million in the three-month periodsended March 31, 2010 and 2009, respectively, representing the effect of changes in AIG’s credit spreads on the valuation of the derivativesliabilities.
(d) During the three-month period ended March 31, 2010, AIGFP terminated super senior CDS transactions with its counterparties with a netnotional amount of $5.4 billion, included in Corporate debt/CLOs. These transactions were terminated at approximately their fair value at thetime of the termination. As a result, an $8 million loss, which was previously included in the fair value derivative liability as an unrealizedmarket valuation loss, was realized. During the three-month period ended March 31, 2010, AIGFP also made a payment of $10 million to itscounterparty with respect to a Multi-sector CDO. Upon payment, a $10 million loss, which was previously included in the fair value derivativeliability as an unrealized market valuation loss, was realized.
(e) Includes $6.1 billion and $6.3 billion in net notional amount of credit default swaps written with cash settlement provisions at March 31, 2010and December 31, 2009, respectively.
(f) Includes $1.4 billion in net notional amount of credit default swaps written on the super senior tranches of CLOs at both March 31, 2010 andDecember 31, 2009.
(g) Net of offsetting purchased CDS of $1.4 billion and $1.5 billion in net notional amount at March 31, 2010 and December 31, 2009,respectively.
All outstanding CDS transactions for regulatory capital purposes and the majority of the arbitrage portfoliohave cash-settled structures in respect of a basket of reference obligations, where AIGFP’s payment obligations,other than for posting collateral, may be triggered by payment shortfalls, bankruptcy and certain other events suchas write-downs of the value of underlying assets. For the remainder of the CDS transactions in respect of thearbitrage portfolio, AIGFP’s payment obligations are triggered by the occurrence of a credit event under a singlereference security, and performance is limited to a single payment by AIGFP in return for physical delivery by thecounterparty of the reference security.
The expected weighted average maturity of AIGFP’s super senior credit derivative portfolios as of March 31,2010 was 1.0 years for the regulatory capital corporate loan portfolio, 2.5 years for the regulatory capital prime
54
American International Group, Inc., and Subsidiaries
NOTES TO CONSOLIDATED FINANCIAL STATEMENTS (unaudited)
residential mortgage portfolio, 5.5 years for the regulatory capital other portfolio, 6.0 years for the multi-sectorCDO arbitrage portfolio and 5.0 years for the corporate debt/CLO portfolio.
Regulatory Capital Portfolio
The regulatory capital portfolio represents derivatives written for financial institutions in Europe, for thepurpose of providing regulatory capital relief rather than for arbitrage purposes. In exchange for a periodic fee,the counterparties receive credit protection with respect to a portfolio of diversified loans they own, thus reducingtheir minimum capital requirements. These CDS transactions were structured with early termination rights forcounterparties allowing them to terminate these transactions at no cost to AIGFP at a certain period of time orupon a regulatory event such as the implementation of Basel II. During the three-month period ended March 31,2010, $25.6 billion in net notional amount was terminated or matured at no cost to AIGFP. Through April 30,2010, AIGFP had also received a formal termination notice for an additional $11.6 billion in net notional amountwith an effective termination date in 2010.
The regulatory capital relief CDS transactions require cash settlement and, other than for collateral posting,AIGFP is required to make a payment in connection with a regulatory capital relief transaction only if realizedcredit losses in respect of the underlying portfolio exceed AIGFP’s attachment point.
All of the regulatory capital transactions directly or indirectly reference tranched pools of large numbers ofwhole loans that were originated by the financial institution (or its affiliates) receiving the credit protection, ratherthan structured securities containing loans originated by other third parties. In the vast majority of transactions,the loans are intended to be retained by the originating financial institution and in all cases the originatingfinancial institution is the purchaser of the CDS, either directly or through an intermediary.
The super senior tranches of these CDS transactions continue to be supported by high levels of subordination,which, in most instances, have increased since origination. The weighted average subordination supporting theprime residential mortgage and corporate loan referenced portfolios at March 31, 2010 was 10.74 percent and27.19 percent, respectively. The highest level of realized losses to date in any single residential mortgage andcorporate loan pool was 2.49 percent and 0.52 percent, respectively. The corporate loan transactions are eachcomprised of several hundred secured and unsecured loans diversified by industry and, in some instances, bycountry, and have per-issuer concentration limits. Both types of transactions generally allow some substitution andreplenishment of loans, subject to defined constraints, as older loans mature or are prepaid. These replenishmentrights generally expire within the first few years of the trade, after which the proceeds of any prepaid or maturingloans are applied first to the super senior tranche (sequentially), thereby increasing the relative level ofsubordination supporting the balance of AIGFP’s super senior CDS exposure.
Given the current performance of the underlying portfolios, the level of subordination and AIGFP’s ownassessment of the credit quality of the underlying portfolio, as well as the risk mitigants inherent in the transactionstructures, AIGFP does not expect that it will be required to make payments pursuant to the contractual terms ofthose transactions providing regulatory relief. AIGFP continues to reassess the expected maturity of this portfolio.As of March 31, 2010, AIGFP estimated that the weighted average expected maturity of the portfolio was1.89 years. AIGFP has not been required to make any payments as part of terminations initiated bycounterparties. The regulatory benefit of these transactions for AIGFP’s financial institution counterparties isgenerally derived from the terms of Basel I that existed through the end of 2007 and which is in the process ofbeing replaced by Basel II. It was expected that financial institution counterparties would have transitioned fromBasel I to Basel II by the end of the two-year adoption period on December 31, 2009, after which they wouldhave received little or no additional regulatory benefit from these CDS transactions, except in a small number ofspecific instances. However, in 2009, the Basel Committee announced that it had agreed to keep in place theBasel I capital floors beyond the end of 2009, although it remains to be seen how this extension will beimplemented by the various European Central Banking districts. Should certain counterparties continue to receive
55
American International Group, Inc., and Subsidiaries
NOTES TO CONSOLIDATED FINANCIAL STATEMENTS (unaudited)
favorable regulatory capital benefits from these transactions, those counterparties may not exercise their options toterminate the transactions in the expected time frame.
Arbitrage Portfolio
The arbitrage portfolio includes arbitrage-motivated transactions written on multi-sector CDOs or designatedpools of investment grade senior unsecured corporate debt or CLOs.
The outstanding multi-sector CDO portfolio at March 31, 2010 was written on CDO transactions (includingsynthetic CDOs) that generally held a concentration of RMBS, CMBS and inner CDO securities. At March 31,2010, approximately $3.8 billion net notional amount (fair value liability of $2.4 billion) of this portfolio waswritten on super senior multi-sector CDOs that contain some level of sub-prime RMBS collateral, with aconcentration in the 2005 and earlier vintages of sub-prime RMBS. AIGFP’s portfolio also included both highgrade and mezzanine CDOs.
The majority of multi-sector CDO CDS transactions require cash settlement and, other than for collateralposting, AIGFP is required to make a payment in connection with such transactions only if realized credit lossesin respect of the underlying portfolio exceed AIGFP’s attachment point. In the remainder of the portfolio,AIGFP’s payment obligations are triggered by the occurrence of a credit event under a single reference security,and performance is limited to a single payment by AIGFP in return for physical delivery by the counterparty ofthe reference security.
Included in the multi-sector CDO portfolio are 2a-7 Puts. Holders of securities are required, in certaincircumstances, to tender their securities to the issuer at par. If an issuer’s remarketing agent is unable to resell thesecurities so tendered, AIGFP must purchase the securities at par so long as the security has not experienced apayment default or certain bankruptcy events with respect to the issuer of such security have not occurred. Atboth March 31, 2010 and December 31, 2009, there was $1.6 billion net notional amount of 2a-7 Puts issued byAIGFP outstanding. AIGFP is not a party to any commitments to issue any additional 2a-7 Puts.
ML III has agreed not to exercise its put option on multi-sector CDOs or simultaneously to exercise its putoption with a corresponding par purchase of the multi-sector CDOs with respect to the $853 million notionalamount of multi-sector CDOs held by ML III with 2a-7 Puts that may be exercised on or prior to December 31,2010 and $530 million notional amount of multi-sector CDOs held by ML III with 2a-7 Puts that may be exercisedon or prior to April 30, 2011. In addition, there are $182 million notional amount of multi-sector CDOs held byML III with 2a-7 Puts that may not be exercised on or prior to December 31, 2010, for which ML III has onlyagreed not to exercise its put option on multi-sector CDOs or simultaneously to exercise its put option with acorresponding par purchase of the multi-sector CDOs through December 31, 2010. In exchange, AIGFP hasagreed to pay to ML III the consideration that it receives for providing the put protection. Additionally, ML IIIhas agreed that if it sells any such multi-sector CDO with a 2a-7 Put to a third-party purchaser, that such sale willbe conditioned upon, among other things, such third-party purchaser agreeing that until the legal final maturitydate of such multi-sector CDO it will not exercise its put option on such multi-sector CDO or it will make acorresponding par purchase of such multi-sector CDO simultaneously with the exercise of its put option. Inexchange for such commitment from the third-party purchaser, AIGFP will agree to pay to such third-partypurchaser the consideration that it receives for providing the put protection.
ML III has agreed to assist AIGFP in efforts to mitigate or eliminate AIGFP’s obligations under such 2a-7 Putsrelating to multi-sector CDOs held by ML III prior to the expiration of ML III’s obligations with respect to suchmulti-sector CDOs. There can be no assurances that such efforts will be successful. To the extent that such effortsare not successful with respect to a multi-sector CDO held by ML III with a 2a-7 Put and ML III has not soldsuch multi-sector CDO to a third-party who has committed not to exercise its put option on such multi-sectorCDO or to make a corresponding par purchase of such multi-sector CDO simultaneously with the exercise of itsput option then, upon the expiration of ML III’s aforementioned obligations with respect to such multi-sector
56
American International Group, Inc., and Subsidiaries
NOTES TO CONSOLIDATED FINANCIAL STATEMENTS (unaudited)
CDO, AIGFP will be obligated under the related 2a-7 Put to purchase such multi-sector CDO at par in thecircumstances and subject to the limited conditions contained in the applicable agreements.
The corporate arbitrage portfolio consists principally of CDS transactions written on portfolios of seniorunsecured corporate obligations that were generally rated investment grade at inception of the CDS. These CDStransactions require cash settlement. Also, included in this portfolio are CDS transactions with a net notionalamount of $1.4 billion written on the senior part of the capital structure of CLOs, which require physicalsettlement.
Certain of the super senior credit default swaps provide the counterparties with an additional termination rightif AIG’s rating level falls to BBB or Baa2. At that level, counterparties to the CDS transactions with a netnotional amount of $10.2 billion at March 31, 2010 have the right to terminate the transactions early. Ifcounterparties exercise this right, the contracts provide for the counterparties to be compensated for the cost toreplace the transactions, or an amount reasonably determined in good faith to estimate the losses thecounterparties would incur as a result of the termination of the transactions.
Due to long-term maturities of the CDS in the arbitrage portfolio, AIG is unable to make reasonable estimatesof the periods during which any payments would be made. However, the net notional amount represents themaximum exposure to loss on the super senior credit default swap portfolio.
Collateral
Most of AIGFP’s super senior credit default swaps are subject to collateral posting provisions, which typicallyare governed by International Swaps and Derivatives Association, Inc. (ISDA) Master Agreements (MasterAgreements) and related Credit Support Annexes (CSA). These provisions differ among counterparties and assetclasses. AIGFP has received collateral calls from counterparties in respect of certain super senior credit defaultswaps, of which a large majority relate to multi-sector CDOs. To a lesser extent, AIGFP has also receivedcollateral calls in respect of certain super senior credit default swaps entered into by counterparties for regulatorycapital relief purposes and in respect of corporate arbitrage.
The amount of future collateral posting requirements is a function of AIG’s credit ratings, the rating of thereference obligations and the market value of the relevant reference obligations, with the latter being the mostsignificant factor. While a high level of correlation exists between the amount of collateral posted and thevaluation of these contracts in respect of the arbitrage portfolio, a similar relationship does not exist with respectto the regulatory capital portfolio given the nature of how the amount of collateral for these transactions isdetermined. Given the severe market disruption, lack of observable data and the uncertainty of future marketprice movements, AIGFP is unable to reasonably estimate the amounts of collateral that it may be required topost in the future.
At March 31, 2010 and December 31, 2009, the amount of collateral postings with respect to AIGFP’s supersenior credit default swap portfolio (prior to offsets for other transactions) was $4.5 billion and $4.6 billion,respectively.
AIGFP Written Single Name Credit Default Swaps
AIGFP has also entered into credit default swap contracts referencing single-name exposures written oncorporate, index, and asset-backed credits, with the intention of earning spread income on credit exposure. Someof these transactions were entered into as part of a long short strategy allowing AIGFP to earn the net spreadbetween CDS they wrote and ones they purchased. At March 31, 2010, the net notional amount of these writtenCDS contracts was $1.9 billion. AIGFP has hedged these exposures by purchasing offsetting CDS contracts of$314 million in net notional amount. The net unhedged position of approximately $1.6 billion represents themaximum exposure to loss on these CDS contracts. The average maturity of the written CDS contracts is
57
American International Group, Inc., and Subsidiaries
NOTES TO CONSOLIDATED FINANCIAL STATEMENTS (unaudited)
6.6 years. At March 31, 2010, the fair value of derivative liability (which represents the carrying value) of theportfolio of CDS was $264 million.
Upon a triggering event (e.g., a default) with respect to the underlying credit, AIGFP would normally have theoption to settle the position through an auction process (cash settlement) or pay the notional amount of thecontract to the counterparty in exchange for a bond issued by the underlying credit obligor (physical settlement).
AIGFP wrote these written CDS contracts under Master Agreements. The majority of these Master Agreementsinclude CSA, which provide for collateral postings at various ratings and threshold levels. At March 31, 2010,AIGFP had posted $318 million of collateral under these contracts.
Non-AIGFP Derivatives
AIG and its subsidiaries (other than AIGFP) also use derivatives and other instruments as part of theirfinancial risk management programs. Interest rate derivatives (such as interest rate swaps) are used to manageinterest rate risk associated with investments in fixed income securities, outstanding medium- and long-term notes,and other interest rate sensitive assets and liabilities. In addition, foreign exchange derivatives (principally foreignexchange forwards and options) are used to economically mitigate risk associated with non-U.S. dollardenominated debt, net capital exposures and foreign exchange transactions. The derivatives are effective economichedges of the exposures they are meant to offset.
In addition to hedging activities, AIG also uses derivative instruments with respect to investment operations,which include, among other things, credit default swaps, and purchasing investments with embedded derivatives,such as equity linked notes and convertible bonds.
Matched Investment Program Written Credit Default Swaps
The MIP, which is currently in run-off, has entered into CDS contracts as a writer of protection, with theintention of earning spread income on credit exposure in an unfunded form. The portfolio of CDS contracts weresingle-name exposures and, at inception, were predominantly high grade corporate credits.
The MIP invested in written CDS contracts through an affiliate which then transacts directly with unaffiliatedthird parties under ISDA agreements. As of March 31, 2010, the notional amount of written CDS contracts was$3.9 billion with an average credit rating of BBB+. The average maturity of the written CDS contracts is 2.2 yearsas of March 31, 2010. As of March 31, 2010, the fair value of the derivative liability (which represents the carryingvalue) of the MIP’s written CDS was $65.1 million.
The majority of the ISDA agreements include CSA provisions, which provide for collateral postings at variousratings and threshold levels. At March 31, 2010, $26.7 million of collateral was posted for CDS contracts relatedto the MIP. The notional amount represents the maximum exposure to loss on the written CDS contracts.However, due to the average investment grade rating and expected default recovery rates, actual losses areexpected to be less.
Upon a triggering event (e.g., a default) with respect to the underlying credit, the MIP would normally have theoption to settle the position through an auction process (cash settlement) or pay the notional amount of thecontract to the counterparty in exchange for a bond issued by the underlying credit (physical settlement).
Credit Risk-Related Contingent Features
AIG transacts in derivative transactions directly with unaffiliated third parties under ISDA agreements. Many ofthe ISDA agreements also include CSA provisions, which provide for collateral postings at various ratings andthreshold levels. In addition, AIG attempts to reduce credit risk with certain counterparties by entering intoagreements that enable collateral to be obtained from a counterparty on an upfront or contingent basis.
58
American International Group, Inc., and Subsidiaries
NOTES TO CONSOLIDATED FINANCIAL STATEMENTS (unaudited)
The aggregate fair value of AIG’s derivative instruments, including those of AIGFP, that contain creditrisk-related contingent features that are in a net liability position at March 31, 2010 was approximately$8.7 billion. The aggregate fair value of assets posted as collateral under these contracts at March 31, 2010, was$8.7 billion.
It is estimated that as of the close of business on March 31, 2010, based on AIG’s outstanding financialderivative transactions, including those of AIGFP at that date, a one-notch downgrade of AIG’s long-term seniordebt ratings to Baa1 by Moody’s Investors Service (Moody’s) and BBB+ by Standard & Poor’s FinancialServices LLC, a subsidiary of The McGraw-Hill Companies, Inc. (S&P), would permit counterparties to makeadditional collateral calls and permit the counterparties to elect early termination of contracts, resulting in up toapproximately $1.6 billion of corresponding collateral postings and termination payments; a two-notch downgradeto Baa2 by Moody’s and BBB by S&P would result in approximately $1.2 billion in additional collateral postingsand termination payments above the one-notch downgrade amount; and a three-notch downgrade to Baa3 byMoody’s and BBB- by S&P would result in approximately $0.4 billion in additional collateral postings andtermination payments above the two-notch downgrade amount. Additional collateral postings upon downgrade areestimated based on the factors in the individual collateral posting provisions of the CSA with each counterpartyand current exposure as of March 31, 2010. Factors considered in estimating the termination payments upondowngrade include current market conditions, the complexity of the derivative transactions, historical terminationexperience and other observable market events such as bankruptcy and downgrade events that have occurred atother companies. The actual termination payments could significantly differ from management’s estimates givenmarket conditions at the time of downgrade and the level of uncertainty in estimating both the number ofcounterparties who may elect to exercise their right to terminate and the payment that may be triggered inconnection with any such exercise.
9. Commitments, Contingencies and Guarantees
In the normal course of business, various commitments and contingent liabilities are entered into by AIG andcertain of its subsidiaries. In addition, AIG guarantees various obligations of certain subsidiaries.
Although AIG cannot currently quantify its ultimate liability for unresolved litigation and investigation mattersincluding those referred to below, it is possible that such liability could have a material adverse effect on AIG’sconsolidated financial condition or its consolidated results of operations or consolidated cash flows for anindividual reporting period.
(a) Litigation and Investigations
Litigation Arising from Operations. AIG and its subsidiaries, in common with the insurance and financialservices industries in general, are subject to litigation, including claims for punitive damages, in the normal courseof their business. In AIG’s insurance operations (including United Guaranty Corporation (UGC)), litigationarising from claims settlement activities is generally considered in the establishment of AIG’s Liability for unpaidclaims and claims adjustment expense. However, the potential for increasing jury awards and settlements makes itdifficult to assess the ultimate outcome of such litigation.
Various federal, state and foreign regulatory and governmental agencies are reviewing certain public disclosures,transactions and practices of AIG and its subsidiaries in connection with, among other matters, AIG’s liquidityproblems, payments by AIG subsidiaries to non-U.S. persons and industry-wide and other inquiries includingmatters relating to compensation paid to AIGFP employees and payments made to AIGFP counterparties. Thesereviews include ongoing investigations by the U.S. Securities and Exchange Commission (SEC) and U.S.Department of Justice (DOJ) with respect to the valuation of AIGFP’s multi- sector CDO super senior creditdefault swap portfolio under fair value accounting rules, and the adequacy of AIG’s enterprise risk managementprocesses with respect to AIG’s exposure to the U.S. residential mortgage market, and disclosures relating thereto.There is also an investigation by the U.K. Serious Fraud Office and inquiries by the U.K. Financial Services
59
American International Group, Inc., and Subsidiaries
NOTES TO CONSOLIDATED FINANCIAL STATEMENTS (unaudited)
Authority with respect to the U.K. operations of AIGFP. AIG has cooperated, and will continue to cooperate, inproducing documents and other information in response to subpoenas and other requests.
In connection with certain SEC investigations, AIG understands that some of its employees have received Wellsnotices and it is possible that additional current and former employees could receive similar notices in the future.Under SEC procedures, a Wells notice is an indication that the SEC staff has made a preliminary decision torecommend enforcement action that provides recipients with an opportunity to respond to the SEC staff before aformal recommendation is finalized.
Litigation Relating to AIG’s Subprime Exposure and AIGFP’s Employee Retention Plan
Securities Actions — Southern District of New York. Between May 21, 2008 and January 15, 2009, eightpurported securities class action complaints were filed against AIG and certain directors and officers of AIG andAIGFP, AIG’s outside auditors, and the underwriters of various securities offerings in the United States DistrictCourt for the Southern District of New York (the Southern District of New York), alleging claims under theSecurities Exchange Act of 1934 (Exchange Act) or claims under the Securities Act of 1933 (the Securities Act).On March 20, 2009, the Court consolidated all eight of the purported securities class actions as In re AmericanInternational Group, Inc. 2008 Securities Litigation (the Consolidated 2008 Securities Litigation) and appointedthe State of Michigan Retirement Systems as lead plaintiff.
On May 19, 2009, lead plaintiff in the Consolidated 2008 Securities Litigation filed a consolidated complaint onbehalf of purchasers of AIG stock during the alleged class period of March 16, 2006 through September 16, 2008,and on behalf of purchasers of various AIG securities offered pursuant to three shelf registration statements filedon June 12, 2003, June 12, 2007, and May 12, 2008. The consolidated complaint alleges that defendants madestatements during the class period in press releases, AIG’s quarterly and year-end filings, during conference calls,and in various registration statements and prospectuses in connection with the various offerings that werematerially false and misleading and that artificially inflated the price of AIG’s stock. The alleged false andmisleading statements relate to, among other things, unrealized market valuation losses on AIGFP’s super seniorcredit default swap portfolio as a result of severe credit market disruption and AIG’s securities lending program.The consolidated complaint alleges violations of Sections 10(b) and 20(a) of the Exchange Act and Sections 11,12(a)(2), and 15 of the Securities Act. On August 5, 2009, defendants filed motions to dismiss the consolidatedcomplaint, and those motions are pending.
ERISA Actions — Southern District of New York. Between June 25, 2008, and November 25, 2008, AIG, certaindirectors and officers of AIG, and members of AIG’s Retirement Board and Investment Committee were namedas defendants in eight purported class action complaints asserting claims on behalf of participants in certainpension plans sponsored by AIG or its subsidiaries. On March 19, 2009, the Court consolidated these eight actionsas In re American International Group, Inc. ERISA Litigation II, and appointed interim lead plaintiffs’ counsel.On June 26, 2009, lead plaintiffs’ counsel filed a consolidated amended complaint. The action purports to bebrought as a class action under the Employee Retirement Income Security Act of 1974, as amended (ERISA), onbehalf of all participants in or beneficiaries of the AIG Incentive Savings Plan, American General Agents’ andManagers’ Thrift Plan, and the CommoLoCo Thrift Plan (the Plans) during the period June 15, 2007 through thepresent and whose participant accounts included shares of AIG’s common stock. In the consolidated amendedcomplaint, plaintiffs allege, among other things, that the defendants breached their fiduciary responsibilities toPlan participants and their beneficiaries under ERISA, by continuing to offer the AIG Stock Fund as aninvestment option in the Plans after it allegedly became imprudent to do so. The alleged ERISA violations relateto, among other things, the defendants’ purported failure to monitor and/or disclose unrealized market valuationlosses on AIGFP’s super senior credit default swap portfolio as a result of severe credit market disruption. OnSeptember 18, 2009, defendants filed motions to dismiss the consolidated amended complaint, and those motionsare pending.
60
American International Group, Inc., and Subsidiaries
NOTES TO CONSOLIDATED FINANCIAL STATEMENTS (unaudited)
Derivative Action — Southern District of New York. On November 20, 2007, two purported shareholderderivative actions were filed in the Southern District of New York naming as defendants directors and officers ofAIG and its subsidiaries and asserting claims on behalf of nominal defendant AIG. The actions were consolidatedas In re American International Group, Inc. 2007 Derivative Litigation (the Consolidated 2007 DerivativeLitigation). The factual allegations involve AIG’s exposure to the U.S. residential subprime mortgage market(Subprime Exposure) and are generally the same as those alleged in the Consolidated 2008 Securities Litigation.On August 6, 2008, a third purported shareholder derivative action was filed in the Southern District of New Yorkasserting claims on behalf of AIG based generally on the same allegations as in the Consolidated 2007 DerivativeLitigation. On February 11, 2009, the Court approved a stipulation consolidating the derivative action filed onAugust 6, 2008 with the Consolidated 2007 Derivative Litigation. On June 3, 2009, lead plaintiff filed aconsolidated amended complaint naming additional directors and officers of AIG and its subsidiaries asdefendants, adding allegations concerning AIGFP employee retention payments, and asserting claims on behalf ofnominal defendant AIG for breach of fiduciary duty, waste of corporate assets, unjust enrichment, contributionand violations of Sections 10(b) and 20(a) of the Exchange Act. On August 5 and 26, 2009, AIG and defendantsfiled motions to dismiss the consolidated complaint. On September 30, 2009, plaintiff in the purported derivativeaction discussed below filed on April 1, 2009 in the Superior Court of the State of California, Los Angeles Countymoved to intervene in the Consolidated 2007 Derivative Litigation. On December 23, 2009, the Court denied themotion.
On November 20, 2009, a stipulation was filed with the Court voluntarily dismissing the claims against two ofthe senior officers of AIG named as defendants, Brian T. Schreiber and Frank G. Wisner, without prejudice. Therequested voluntary dismissal was not the product of a settlement between lead plaintiff and Mr. Schreiber andMr. Wisner. Neither lead plaintiff nor lead plaintiff’s counsel sought or received any consideration in return forthis voluntary dismissal. By order of the Court on January 21, 2010, notice of this voluntary dismissal withoutprejudice of Mr. Schreiber and Mr. Wisner was given to AIG’s shareholders in AIG’s 2009 Annual Report onForm 10-K, and any shareholder objecting to the voluntary dismissal without prejudice of Mr. Schreiber andMr. Wisner was required to file any objections to the proposed dismissal within 30 days of the filing of the 2009Annual Report on Form 10-K, i.e., by March 28, 2010. No objections were received. On March 30, 2010, theCourt dismissed the action due to plaintiff’s failure to make a pre-suit demand on AIG’s Board of Directors. OnMarch 31, 2010, judgment was entered. As a result, no order was submitted to the Court regarding the dismissalwithout prejudice of Mr. Schreiber and Mr. Wisner. On April 29, 2010, plaintiff filed a notice of appeal to theUnited States Court of Appeals for the Second Circuit, seeking to reverse the Court’s decision to dismiss theaction.
Derivative Action — Supreme Court of New York, Nassau County. On February 29, 2008, a purportedshareholder derivative complaint was filed in the Supreme Court of Nassau County naming as defendants certaindirectors and officers of AIG and its subsidiaries concerning AIG’s Subprime Exposure. Plaintiff asserts claims onbehalf of nominal defendant AIG for breach of fiduciary duty, waste of corporate assets, and unjust enrichment inconnection with AIG’s public disclosures regarding its Subprime Exposure. On May 19, 2008, defendants filed amotion to dismiss or to stay the proceedings in light of the pending Consolidated 2007 Derivative Litigation. OnMarch 9, 2009, the Court granted defendants’ motion to stay the action.
Derivative Action — Supreme Court of New York, New York County. On March 20, 2009, a purportedshareholder derivative complaint was filed in the Supreme Court of New York County naming as defendantscertain directors and officers of AIG and recipients of AIGFP retention payments. Plaintiffs assert claims onbehalf of nominal defendant AIG concerning AIGFP retention payments. Plaintiff alleges claims for breach offiduciary duty, waste of corporate assets and rescission and constructive trust.
Derivative Actions — Delaware Court of Chancery. On September 17, 2008, a purported shareholder derivativecomplaint was filed in the Delaware Court of Chancery naming as defendants certain directors and officers ofAIG and its subsidiaries. Plaintiff asserts claims on behalf of nominal defendant AIG for breach of fiduciary duty,
61
American International Group, Inc., and Subsidiaries
NOTES TO CONSOLIDATED FINANCIAL STATEMENTS (unaudited)
waste of corporate assets, and mismanagement in connection with AIG’s public disclosures regarding its SubprimeExposure. On December 19, 2008, a motion to stay or dismiss the action in favor of the Consolidated 2007Derivative Litigation was filed. On July 17, 2009, the Court granted defendants’ motion to stay the action.
On January 15, 2009, a purported shareholder derivative complaint was filed in the Delaware Court of Chancerynaming as defendants certain directors of AIG and Joseph Cassano, the former Chief Executive Officer of AIGFP.Plaintiff asserts claims against Mr. Cassano on behalf of nominal defendant AIGFP and AIG as the soleshareholder of AIGFP concerning AIG’s and AIGFP’s Subprime Exposure alleging breach of fiduciary duty andunjust enrichment. On July 17, 2009, plaintiff filed an amended complaint that asserts the same claims as theoriginal complaint. On August 5, 2009, the Court entered an order staying the action pending disposition of themotions to dismiss of the Consolidated 2007 Derivative Litigation.
Derivative Actions — Superior Court for the State of California, Los Angeles County. On April 1, 2009, apurported shareholder derivative complaint was filed in the Superior Court for the State of California, LosAngeles County, asserting claims on behalf of nominal defendant AIG against certain directors and officers ofAIG. The complaint asserts claims for waste of corporate assets, breach of fiduciary duty, abuse of control, andunjust enrichment and constructive trust in connection with defendants’ approval of bonuses and retentionpayments. On May 29, 2009, defendants moved to stay or dismiss the action in favor of the Consolidated 2007Derivative Litigation and to quash service of summons due to lack of personal jurisdiction over certain individualdefendants. On August 27, 2009, the Court granted defendants’ motion to stay the action.
On November 20, 2009, a purported shareholder derivative complaint was filed in the Superior Court for theState of California, Los Angeles County, naming as defendants certain former and present directors and officersof AIG and its subsidiaries. Plaintiff asserts claims on behalf of nominal defendant AIG concerning AIG’sSubprime Exposure alleging breach of fiduciary duty, waste of corporate assets, and mismanagement. OnNovember 24, 2009, an amended complaint was filed asserting the same claims. On February 4, 2010, the partiesfiled a stipulation staying the action in favor of the Consolidated 2007 Derivative Litigation. On February 9, 2010,the Court signed a stipulation staying the action pending resolution of the Consolidated 2007 DerivativeLitigation.
Canadian Securities Class Action — Ontario Superior Court of Justice. On November 12, 2008, an applicationwas filed in the Ontario Superior Court of Justice for leave to bring a purported securities fraud class actionagainst AIG, AIGFP, certain directors and officers of AIG and the former Chief Executive Officer of AIGFP. Ifthe Court grants the application, a class plaintiff will be permitted to file a statement of claim against defendants.The proposed statement of claim would assert a class period of November 10, 2006 through September 16, 2008(later amended to March 16, 2006 through September 16, 2008), and would allege that during this perioddefendants made false and misleading statements and omissions in quarterly and annual reports and during oralpresentations in violation of the Ontario Securities Act. On April 17, 2009, defendants filed a motion record insupport of their motion to stay or dismiss for lack of jurisdiction and forum non conveniens. On May 29, 2009, theapplicant filed responding affidavits and an amended draft statement of claim. The factual allegations aregenerally the same as those alleged in the Consolidated 2008 Securities Litigation. On November 20 and 30, andDecember 4, 2009, defendants filed briefs in support of their motions to dismiss, and those motions are pending.
Panama Action — Tribunal del Circuito Civil, Panama City, Panama. On February 26, 2009, SICO soughtpermission to file a complaint in Panamanian Court against AIG. In the complaint, SICO alleges that AIGintentionally concealed from its shareholders, including SICO, its unstable financial situation and risk of losses,which ultimately resulted in losses to the value of SICO’s shares of AIG Common Stock. On August 12, 2009,AIG filed a motion to dismiss the complaint and a motion for correction of the complaint. On August 13, 2009,AIG filed a motion with the Panama Supreme Court challenging on constitutional grounds a motion by SICO toamend the complaint. Under the terms of the settlement agreement and memorandum of understanding signed byAIG, on the one hand, and Greenberg, Howard I. Smith, AIG’s former Chief Financial Officer, C.V. Starr &Company, Inc. (C.V. Starr) and Starr International Company, Inc. (SICO), on the other hand (the Starr Parties)that was announced on November 25, 2009 (the AIG/Greenberg MOU), SICO agreed to undertake to dismiss thisaction with prejudice. On February 10, 2010, the parties filed a joint request to dismiss the case. On March 2,2010, the Court posted its approval of the dismissal of claims and the action was terminated.
62
American International Group, Inc., and Subsidiaries
NOTES TO CONSOLIDATED FINANCIAL STATEMENTS (unaudited)
Litigation Matter Relating to AIGFP. On September 30, 2009, Brookfield Asset Management, Inc. and BrysonsInternational, Ltd. (together, ‘‘Brookfield’’) filed a complaint against AIG and AIGFP in the Southern District ofNew York. Brookfield seeks a declaration that a 1990 interest rate swap agreement between Brookfield andAIGFP (guaranteed by AIG) terminated upon the occurrence of certain alleged events that Brookfield contendsconstituted defaults under the swap agreement’s standard ‘‘bankruptcy’’ default provision. Brookfield claims that itis excused from all future payment obligations under the swap agreement on the basis of the purportedtermination. At March 31, 2010, the estimated present value of expected future cash flows discounted at LIBORwas $1.3 billion. It is AIG’s position that no termination event has occurred and that the swap agreement remainsin effect. A determination that AIG triggered a ‘‘bankruptcy event of default’’ under the swap agreement could,depending on the Court’s precise holding, affect other AIG or AIGFP agreements that contain the same orsimilar default provisions. Such a determination could also affect derivative agreements or other contracts betweenthird parties, such as credit default swaps under which AIG is a reference credit, which could affect the tradingprice of AIG securities. On December 17, 2009 defendants filed a motion to dismiss, and that motion is pending.
2006 Regulatory Settlements and Related Matters
2006 Regulatory Settlements. In February 2006, AIG reached a resolution of claims and matters underinvestigation with the DOJ, the SEC, the Office of the New York Attorney General (NYAG) and the New YorkState Department of Insurance (DOI). AIG recorded an after-tax charge of $1.15 billion relating to thesesettlements in the fourth quarter of 2005. The settlements resolved investigations conducted by the SEC, NYAGand DOI in connection with the accounting, financial reporting and insurance brokerage practices of AIG and itssubsidiaries, as well as claims relating to the underpayment of certain workers’ compensation premium taxes andother assessments. These settlements did not, however, resolve investigations by regulators from other states intoinsurance brokerage practices related to contingent commissions and other broker-related conduct, such as allegedbid rigging. Nor did the settlements resolve any obligations that AIG may have to state guarantee funds inconnection with any of these matters.
As a result of these settlements, AIG made payments or placed amounts in escrow in 2006 totalingapproximately $1.64 billion, $225 million of which represented fines and penalties. Amounts held in escrowtotaling approximately $338 million, including interest thereon, are included in Other assets at March 31, 2010. Atthat date, all of the funds were escrowed for settlement of claims resulting from the underpayment by AIG of itsresidual market assessments for workers’ compensation.
In addition to the escrowed funds, $800 million was deposited into a fund under the supervision of the SEC aspart of the settlements to be available to resolve claims asserted against AIG by investors, including the securitiesclass action shareholder lawsuits described below. On April 14, 2008, the Court overseeing the Fair Fund approveda plan for distribution of monies in the fund, and on May 18, 2009 ordered that the Distribution Agent wasauthorized to commence distribution of Fair Fund monies to approved eligible claimants.
Also, as part of the settlements, AIG agreed to retain, for a period of three years, an independent consultant toconduct a review that included, among other things, the adequacy of AIG’s internal control over financialreporting, the policies, procedures and effectiveness of AIG’s regulatory, compliance and legal functions and theremediation plan that AIG has implemented as a result of its own internal review.
Other Regulatory Settlements. AIG’s 2006 regulatory settlements with the SEC, DOJ, NYAG and DOI did notresolve investigations by regulators from other states into insurance brokerage practices. AIG entered intoagreements effective January 29, 2008 with the Attorneys General of the States of Florida, Hawaii, Maryland,Michigan, Oregon, Texas and West Virginia; the Commonwealths of Massachusetts and Pennsylvania; and theDistrict of Columbia; as well as the Florida Department of Financial Services and the Florida Office of InsuranceRegulation, relating to their respective industry-wide investigations into producer compensation and insuranceplacement practices. The settlements call for total payments of $12.5 million to be allocated among the tenjurisdictions representing restitution to state agencies and reimbursement of the costs of the investigation. During
63
American International Group, Inc., and Subsidiaries
NOTES TO CONSOLIDATED FINANCIAL STATEMENTS (unaudited)
the term of the settlement agreements, which run through early 2018, AIG will continue to maintain certainproducer compensation disclosure and ongoing compliance initiatives. AIG will also continue to cooperate withthe industry-wide investigations. The agreement with the Texas Attorney General also settles allegations ofanticompetitive conduct relating to AIG’s relationship with Allied World Assurance Company and includes anadditional settlement payment of $500,000 related thereto.
AIG entered into an agreement effective March 13, 2008 with the Pennsylvania Insurance Department relatingto the Department’s investigation into the affairs of AIG and certain of its Pennsylvania-domiciled insurancecompany subsidiaries. The settlement calls for total payments of approximately $13.5 million, of whichapproximately $4.4 million was paid under previous settlement agreements. During the term of the settlementagreement, which runs for a period of three years from May 1, 2008, AIG will provide annual reinsurance reports,as well as maintain certain producer compensation disclosure and ongoing compliance initiatives.
NAIC Examination of Workers’ Compensation Premium Reporting. During 2006, the Settlement Review WorkingGroup of the National Association of Insurance Commissioners (NAIC), under the direction of the states ofIndiana, Minnesota and Rhode Island, began an investigation into AIG’s reporting of workers’ compensationpremiums. In late 2007, the Settlement Review Working Group recommended that a multi-state targeted marketconduct examination focusing on workers’ compensation insurance be commenced under the direction of theNAIC’s Market Analysis Working Group. AIG was informed of the multi-state targeted market conductexamination in January 2008. The lead states in the multi-state examination are Delaware, Florida, Indiana,Massachusetts, Minnesota, New York, Pennsylvania, and Rhode Island. All other states (and the District ofColumbia) have agreed to participate in the multi-state examination. To date, the examination has focused onlegacy issues related to AIG’s writing and reporting of workers’ compensation insurance prior to 1996. AIG hasalso been advised that the examination will focus on current compliance with legal requirements applicable to suchbusiness. AIG has not been advised that any determinations have been made with respect to these issues, andcannot predict either the outcome of the investigation or provide any assurance regarding regulatory action thatmay result from the investigation.
Securities Action — Southern District of New York. Beginning in October 2004, a number of putative securitiesfraud class action suits were filed in the Southern District of New York against AIG and consolidated as In reAmerican International Group, Inc. Securities Litigation. Subsequently, a separate, though similar, securities fraudaction was also brought against AIG by certain Florida pension funds. The lead plaintiff in the class action is agroup of public retirement systems and pension funds benefiting Ohio state employees, suing on behalf ofthemselves and all purchasers of AIG’s publicly traded securities between October 28, 1999 and April 1, 2005. Thenamed defendants are AIG and a number of present and former AIG officers and directors, as well as Starr,SICO, General Reinsurance Corporation (General Re), and PricewaterhouseCoopers LLP (PwC), among others.The lead plaintiff alleges, among other things, that AIG: (1) concealed that it engaged in anti-competitive conductthrough alleged payment of contingent commissions to brokers and participation in illegal bid-rigging;(2) concealed that it used ‘‘income smoothing’’ products and other techniques to inflate its earnings; (3) concealedthat it marketed and sold ‘‘income smoothing’’ insurance products to other companies; and (4) misled investorsabout the scope of government investigations. In addition, the lead plaintiff alleges that AIG’s former ChiefExecutive Officer, Maurice R. Greenberg, manipulated AIG’s stock price. The lead plaintiff asserts claims forviolations of Sections 11 and 15 of the Securities Act, Section 10(b) of the Exchange Act and Rule 10b-5promulgated thereunder, Section 20(a) of the Exchange Act, and Section 20A of the Exchange Act. In April 2006,the Court denied the defendants’ motions to dismiss the second amended class action complaint and the Floridacomplaint. In December 2006, a third amended class action complaint was filed, which does not differ substantiallyfrom the prior complaint. Fact discovery is currently ongoing. On February 20, 2008, the lead plaintiff filed amotion for class certification. In October 2009, the lead plaintiff advised the Court that it had entered into asettlement agreement with Maurice R. Greenberg, Howard I. Smith, Christian M. Milton, Michael J. Castelli,SICO and Starr. At the lead plaintiff’s request, the Court has entered an order dismissing all of the lead plaintiff’sclaims against these defendants ‘‘without prejudice’’ to any party. The lead plaintiff has also voluntarily dismissed
64
American International Group, Inc., and Subsidiaries
NOTES TO CONSOLIDATED FINANCIAL STATEMENTS (unaudited)
Frank Hoenemeyer, L. Michael Murphy, and Richmond Insurance Company, Ltd. On February 22, 2010, theCourt issued an opinion granting, in part, lead plaintiffs’ motion for class certification. The Court rejected leadplaintiffs’ request to include in the class purchasers of certain AIG bonds on the grounds that (a) lead plaintiffslack standing to pursue claims pursuant to the Securities Act with respect to such bonds, and (b) lead plaintiffshad failed to establish that common issues predominate over individual issues with regard to claims under theExchange Act relating to AIG bonds. On that basis the Court declined to certify a class with respect to Counts Ithrough IV of the Complaint and dismissed those claims for lack of standing. With respect the remaining claimsunder the Exchange Act on behalf of putative class members who had purchased AIG Common Stock, the Courtdeclined to certify a class as to certain defendants other than AIG and rejected lead plaintiffs’ claims that classmembers could establish injury based on disclosures on two of the six dates lead plaintiffs had proposed, butcertified a class consisting of all shareholders who purchased or otherwise acquired AIG Common Stock duringthe class period of October 28, 1999 to April 1, 2005, and who possessed that stock over one or more of the datesOctober 14, 2004, October 15, 2004, March 17, 2005 or April 1, 2005, as well as persons who held AIG CommonStock in two companies at the time they were acquired by AIG in exchange for AIG Common Stock, and wereallegedly damaged thereby. In light of the class certification decision, on March 5, 2010, the Court denied as mootGen Re’s and lead plaintiffs’ motion to certify their proposed settlement, and on March 18, 2010, PwC withdrewits motion to approve its proposed settlement with lead plaintiffs. Lead plaintiffs and AIG have each filedpetitions pursuant to Fed R. Civ. P. 23(f) requesting permission to appeal the class certification decision. AIG,Gen Re, Richard Napier and Ronald Ferguson have each filed opposition briefs to lead plaintiff’s Rule 23(f)petition. Lead plaintiff also filed an opposition brief to AIG’s Rule 23(f) petition. The Rule 23(f) petitions remainpending at this time.
Derivative Action — Southern District of New York. Between October 25, 2004 and July 14, 2005, seven separatederivative actions were filed in the Southern District of New York, five of which were consolidated into a singleaction (the New York 2004/2005 Derivative Litigation). The complaint in this action contains nearly the sametypes of allegations made in the securities fraud action described above. The named defendants include currentand former officers and directors of AIG, as well as Marsh & McLennan Companies, Inc. (Marsh), SICO, Starr,ACE Limited and subsidiaries (Ace), General Re, PwC, and certain employees or officers of these entitydefendants. Plaintiffs assert claims for breach of fiduciary duty, gross mismanagement, waste of corporate assets,unjust enrichment, insider selling, auditor breach of contract, auditor professional negligence and disgorgementfrom AIG’s former Chief Executive Officer, Maurice R. Greenberg, and former Chief Financial Officer, HowardI. Smith, of incentive-based compensation and AIG share proceeds under Section 304 of the Sarbanes-Oxley Act,among others. Plaintiffs seek, among other things, compensatory damages, corporate governance reforms, and avoiding of the election of certain AIG directors. AIG’s Board of Directors has appointed a special committee ofindependent directors (Special Committee) to review the matters asserted in the operative consolidated derivativecomplaint. The Court has entered an order staying this action pending resolution of the Delaware 2004/2005Derivative Litigation discussed below. The Court also has entered an order that termination of certain nameddefendants from the Delaware action applies to this action without further order of the Court. On February 26,2009, the Court dismissed those AIG officer and director defendants against whom the shareholder plaintiffs inthe Delaware action had not pursued claims. It is AIG’s position that the terms of the AIG/Greenberg MOU donot require dismissal of the derivative claims against Greenberg, Smith and SICO in the New York 2004/2005Derivative Litigation. The Starr Parties have taken the opposite position.
Derivative Actions — Delaware Chancery Court. From October 2004 to April 2005, AIG shareholders filed fivederivative complaints in the Delaware Chancery Court. All of these derivative lawsuits were consolidated into asingle action as In re American International Group, Inc. Consolidated Derivative Litigation (the Delaware2004/2005 Derivative Litigation). The amended consolidated complaint named 43 defendants (not includingnominal defendant AIG) who, as in the New York 2004/2005 Derivative Litigation, were current and formerofficers and directors of AIG, as well as other entities and certain of their current and former employees anddirectors. The factual allegations, legal claims and relief sought in this action are similar to those alleged in the
65
American International Group, Inc., and Subsidiaries
NOTES TO CONSOLIDATED FINANCIAL STATEMENTS (unaudited)
New York 2004/2005 Derivative Litigation, except that the claims are only under state law. In early 2007, theCourt approved an agreement that AIG be realigned as plaintiff, and, on June 13, 2007, acting on the direction ofthe Special Committee, AIG filed an amended complaint against former directors and officers Maurice R.Greenberg and Howard I. Smith, alleging breach of fiduciary duty and indemnification. Also on June 13, 2007, theSpecial Committee filed a motion to terminate the litigation as to certain defendants, while taking no action as toothers. Defendants Greenberg and Smith filed answers to AIG’s complaint and brought third-party complaintsagainst certain current and former AIG directors and officers, PwC and INS Regulatory Insurance Services, Inc.On September 28, 2007, AIG and the shareholder plaintiffs filed a combined amended complaint in which AIGcontinued to assert claims against defendants Greenberg and Smith and took no position as to the claims assertedby the shareholder plaintiffs in the remainder of the combined amended complaint. In that pleading, theshareholder plaintiffs are no longer pursuing claims against certain AIG officers and directors. On February 12,2008, the Court granted AIG’s motion to stay discovery pending the resolution of claims against AIG in the NewYork consolidated securities action. On April 11, 2008, the shareholder plaintiffs filed the First AmendedCombined Complaint, which added claims against former AIG directors and officers Maurice Greenberg, EdwardMatthews, and Thomas Tizzio for breach of fiduciary duty based on alleged bid-rigging in the municipalderivatives market. On June 13, 2008, certain defendants filed motions to dismiss the shareholder plaintiffs’portions of the complaint. On February 10, 2009, the Court denied the motions to dismiss filed by MauriceGreenberg, Edward Matthews, and Thomas Tizzio; granted the motion to dismiss filed by PwC without prejudice;and granted the motion to dismiss filed by certain former employees of AIG without prejudice for lack ofpersonal jurisdiction. On March 6, 2009, the Court granted an Order of Dismissal, Notice and Order of VoluntaryDismissal and Stipulation and Order of Dismissal to dismiss those individual defendants who were similarlysituated to the individuals dismissed by the Court for lack of personal jurisdiction. On March 12, 2009, DefendantGreenberg filed his verified answer to AIG’s complaint; cross-claims against Marsh, ACE, General Re, andThomas Tizzio; and a third-party complaint against certain current and former AIG directors and officers, as wellas INS Regulatory Insurance Services, Inc. Defendant Smith has also filed his answer to AIG’s complaint, whichwas amended on July 9, 2009 to add cross-claims against Thomas Tizzio and third-party claims against certaincurrent and former AIG directors and officers, as well as INS Regulatory Insurance Services, Inc. On June 17,2009, the Court issued an opinion granting the motions to dismiss filed by General Re, Marsh, ACE, and SusanRivera. On July 13, 2009 and July 17, 2009, the Court entered final judgments in favor of PwC, General Re,Marsh, ACE, and Susan Rivera. Shortly thereafter, the shareholder plaintiffs filed separate appeals: oneaddressing the dismissal of PwC, and the other addressing the dismissals of ACE, General Re, and Marsh. Theiropening briefs were filed on September 24, 2009. By November 12, 2009, those appeals were fully briefed. Underthe AIG/Greenberg MOU, AIG agreed to undertake to dismiss its direct claims against Greenberg and Smith inthe Delaware 2004/2005 Derivative Litigation with prejudice. On November 27, 2009, counsel for the shareholderplaintiffs filed a motion for a temporary restraining order enjoining AIG from proceeding with its November 25,2009 settlement with Greenberg. AIG opposed the motion on the ground, among other things, that the AIG/Greenberg MOU did not extinguish the shareholder plaintiffs’ derivative claims. On November 30, 2009, counselfor the shareholder plaintiffs wrote to the Court and stated that ‘‘there appears to be nothing to enjoin’’ becausethe AIG/Greenberg MOU was the final, operative settlement agreement, and noted that the shareholder plaintiffsmay request declaratory relief regarding the impact of the AIG/Greenberg MOU at a subsequent time. OnFebruary 5, 2010, AIG, Greenberg and Smith submitted a stipulation to the Court dismissing AIG’s direct claimsagainst Greenberg and Smith. The Starr Parties have taken the position that the AIG/Greenberg MOU alsoreleases certain of the derivative claims being pursued by the shareholder plaintiffs. AIG has taken the oppositeposition.
AIG was also named as a defendant in a derivative action in the Delaware Chancery Court brought byshareholders of Marsh. On July 10, 2008, shareholder plaintiffs filed a second consolidated amended complaint,which contains claims against AIG for aiding and abetting a breach of fiduciary duty and contribution andindemnification in connection with alleged bid-rigging and steering practices in the commercial insurance marketthat are the subject of the Policyholder Antitrust and Racketeering Influenced and Corrupt Organizations Act
66
American International Group, Inc., and Subsidiaries
NOTES TO CONSOLIDATED FINANCIAL STATEMENTS (unaudited)
(RICO) Actions described below. On November 10, 2008, AIG and certain defendants filed motions to dismiss theshareholder plaintiffs’ portions of the complaint. On June 17, 2009, the Court dismissed the claims against AIG,Maurice R. Greenberg, and Zachary Carter with prejudice and denied the motions to dismiss filed by theremaining defendants. Final judgment was entered on June 19, 2009. The Court granted a motion by AIG forentry of final judgment under Rule 54(b), and entered final judgment dismissing AIG and Maurice R. Greenbergon September 2, 2009. The shareholder plaintiffs filed their notice of appeal on October 1, 2009. AIG moved toconsolidate the appeal with the appeal of the dismissal of ACE, General Re, and Marsh in the Delaware2004/2005 Derivative Litigation. The shareholders of Marsh moved to stay this appeal pending the decision in theappeal of the dismissal of ACE, General Re, and Marsh in the Delaware 2004/2005 Derivative Litigation. OnNovember 10, 2009, the Delaware Supreme Court granted AIG’s motion to consolidate the appeals for thepurposes of oral argument and denied the Marsh shareholders’ motion to stay. The shareholders of Marsh filedtheir opening brief on November 16, 2009. The appeal has been fully briefed, and oral argument was held beforea three-judge panel of the Delaware Supreme Court on February 17, 2010. On February 22, 2010, the Courtissued an order notifying the parties that the appeal would be heard by the Court en banc. The argument beforethe en banc court has not been scheduled.
Derivative Action — Supreme Court of New York. On February 11, 2009, shareholder plaintiffs in the Delaware2004/2005 Derivative Litigation filed a derivative complaint in the Supreme Court of New York against theindividual defendants who moved to dismiss the complaint in the Delaware 2004/2005 Derivative Litigation onpersonal jurisdiction grounds. The defendants include current and former officers and employees of AIG, Marsh,and General Re; AIG is named as a nominal defendant. The complaint in this action contains similar allegationsto those made in the Delaware 2004/2005 Derivative Litigation described above. Discovery in this action is stayedpending the resolution of the claims against AIG in the securities actions described above under SecuritiesActions — Southern District of New York. Defendants filed motions to dismiss the complaint on May 1, 2009 andhave completed their briefing. The shareholder plaintiffs have reached an agreement staying discovery as well asany motions to dismiss with the General Re and Marsh defendants pending final adjudication of any claimsagainst those parties in the Delaware 2004/2005 Derivative Litigation. Oral argument on the other motions todismiss has been adjourned until June 24, 2010.
Policyholder Antitrust and RICO Actions. Commencing in 2004, policyholders brought multiple federal antitrustand RICO class actions in jurisdictions across the nation against insurers and brokers, including AIG and anumber of its subsidiaries, alleging that the insurers and brokers engaged in a broad conspiracy to allocatecustomers, steer business, and rig bids. These actions, including 24 complaints filed in different federal Courtsnaming AIG or an AIG subsidiary as a defendant, were consolidated by the judicial panel on multi-districtlitigation and transferred to the United States District Court for the District of New Jersey (District of NewJersey) for coordinated pretrial proceedings. The consolidated actions have proceeded in that Court in twoparallel actions, In re Insurance Brokerage Antitrust Litigation (the Commercial Complaint) and In re EmployeeBenefits Insurance Brokerage Antitrust Litigation (the Employee Benefits Complaint, and, together with theCommercial Complaint, the Multi-district Litigation).
The plaintiffs in the Commercial Complaint are a group of corporations, individuals and public entities thatcontracted with the broker defendants for the provision of insurance brokerage services for a variety of insuranceneeds. The broker defendants are alleged to have placed insurance coverage on the plaintiffs’ behalf with anumber of insurance companies named as defendants, including AIG subsidiaries. The Commercial Complaintalso named various brokers and other insurers as defendants (three of which have since settled). The CommercialComplaint alleges, among other things, that defendants engaged in a widespread conspiracy to allocate customersthrough bid-rigging and steering practices. Plaintiffs assert that the defendants violated the Sherman Antitrust Act,RICO, and the antitrust laws of 48 states and the District of Columbia, and are liable under common law breachof fiduciary duty and unjust enrichment theories. Plaintiffs seek treble damages plus interest and attorneys’ fees asa result of the alleged RICO and Sherman Antitrust Act violations.
67
American International Group, Inc., and Subsidiaries
NOTES TO CONSOLIDATED FINANCIAL STATEMENTS (unaudited)
The plaintiffs in the Employee Benefits Complaint are a group of individual employees and corporate andmunicipal employers alleging claims on behalf of two separate nationwide purported classes: an employee classand an employer class that acquired insurance products from the defendants from January 1, 1998 toDecember 31, 2004. The Employee Benefits Complaint names AIG, as well as various other brokers and insurers,as defendants. The activities alleged in the Employee Benefits Complaint, with certain exceptions, track theallegations made in the Commercial Complaint.
The Court, in connection with the Commercial Complaint, granted (without leave to amend) defendants’motions to dismiss the federal antitrust and RICO claims on August 31, 2007 and September 28, 2007,respectively. The Court declined to exercise supplemental jurisdiction over the state law claims in the CommercialComplaint and therefore dismissed it in its entirety. On January 14, 2008, the Court granted defendants’ motionfor summary judgment on the ERISA claims in the Employee Benefits Complaint and subsequently dismissed theremaining state law claims without prejudice, thereby dismissing the Employee Benefits Complaint in its entirety.On February 12, 2008, plaintiffs filed a notice of appeal to the United States Court of Appeals for the ThirdCircuit with respect to the dismissal of the Employee Benefits Complaint. Plaintiffs previously appealed thedismissal of the Commercial Complaint to the United States Court of Appeals for the Third Circuit onOctober 10, 2007. Both appeals are fully briefed and oral argument in both appeals was held on April 21, 2009.
A number of complaints making allegations similar to those in the Multi- district Litigation have been filedagainst AIG and other defendants in state and federal courts around the country. The defendants have thus farbeen successful in having the federal actions transferred to the District of New Jersey and consolidated into theMulti-district Litigation. These additional consolidated actions are still pending in the District of New Jersey, butare currently stayed. The AIG defendants have also sought to have state court actions making similar allegationsstayed pending resolution of the Multi-district Litigation proceeding. These efforts have generally been successful,although discovery recently commenced in one case pending in Kansas state court. Discovery has been stayed inanother case pending in Texas state court. In that case, the plaintiff filed an amended petition on July 13, 2009,and defendants filed special exceptions in connection with plaintiff’s amended petition on August 14, 2009. Ahearing on the special exceptions was held on November 11, 2009. AIG has settled several of the various federaland state actions alleging claims similar to those in the Multi-district Litigation, including state court actionspending in Florida and in New Jersey in which discovery had been allowed to proceed.
Ohio Attorney General Action — Ohio Court of Common Pleas. On August 24, 2007, the Ohio AttorneyGeneral filed a complaint in the Ohio Court of Common Pleas against AIG and a number of its subsidiaries, aswell as several other broker and insurer defendants, asserting violation of Ohio’s antitrust laws. The complaint,which is similar to the Commercial Complaint, alleges that AIG and the other broker and insurer defendantsconspired to allocate customers, divide markets, and restrain competition in commercial lines of casualty insurancesold through the broker defendant. The complaint seeks treble damages on behalf of Ohio public purchasers ofcommercial casualty insurance, disgorgement on behalf of both public and private purchasers of commercialcasualty insurance, and a $500-per-day penalty for each day of conspiratorial conduct. On April 7, 2010, it wasannounced that AIG and the Ohio Attorney General agreed to settle the Ohio Attorney General’s claims. Underthe settlement agreement, AIG agreed to make a payment of $9 million and to continue to maintain certainproducer compensation disclosure and ongoing compliance initiatives.
Actions Relating to Workers’ Compensation Premium Reporting — Northern District of Illinois. On May 24, 2007,the National Workers’ Compensation Reinsurance Pool (the NWCRP), on behalf of its participant members, fileda lawsuit in the United States District Court for the Northern District of Illinois against AIG with respect to theunderpayment by AIG of its residual market assessments for workers’ compensation insurance. The complaintalleged claims for violations of RICO, breach of contract, fraud and related state law claims arising out of AIG’salleged underpayment of these assessments between 1970 and the present and sought damages purportedly inexcess of $1 billion. On August 6, 2007, the Court denied AIG’s motion seeking to dismiss or stay the complaintor, in the alternative, to transfer to the Southern District of New York. On December 26, 2007, the Court denied
68
American International Group, Inc., and Subsidiaries
NOTES TO CONSOLIDATED FINANCIAL STATEMENTS (unaudited)
AIG’s motion to dismiss the complaint. On March 17, 2008, AIG filed an amended answer, counterclaims andthird-party claims against the National Council on Compensation Insurance (in its capacity as attorney-in-fact forthe NWCRP), the NWCRP, its board members, and certain of the other insurance companies that are members ofthe NWCRP alleging violations of RICO, as well as claims for conspiracy, fraud, and other state law claims. Thecounterclaim-defendants and third-party defendants filed motions to dismiss on June 9, 2008. On January 26, 2009,AIG filed a motion to dismiss all claims in the complaint for lack of subject-matter jurisdiction. On February 23,2009, the Court issued a decision and order sustaining AIG’s counterclaims and sustaining, in part, AIG’s third-party claims. The Court also dismissed certain of AIG’s third-party claims without prejudice. On April 13, 2009,third-party defendant Liberty Mutual filed third-party counterclaims against AIG, certain of its subsidiaries, andformer AIG executives. On August 23, 2009, the Court granted AIG’s motion to dismiss the complaint for lack ofstanding. On September 25, 2009, AIG filed its First Amended Complaint, reasserting its RICO claims againstcertain insurance companies that both underreported their workers’ compensation premium and served on theNWCRP Board, and repleading its fraud and other state law claims. Defendants filed a motion to dismiss theFirst Amended Complaint on October 30, 2009. On October 8, 2009, Liberty Mutual filed an amendedcounterclaim against AIG. The amended counterclaim is substantially similar to the complaint initially filed by theNWCRP, but also seeks damages related to non-NWCRP states, guaranty funds, and special assessments, inaddition to asserting claims for other violations of state law. The amended counterclaim also removes asdefendants the former AIG executives. On October 30, 2009, AIG filed a motion to dismiss the Liberty amendedcounterclaim. Discovery is proceeding and fact discovery is currently scheduled to be completed by March 15,2011.
On April 1, 2009, Safeco Insurance Company of America and Ohio Casualty Insurance Company filed acomplaint in the United States District Court for the Northern District of Illinois, on behalf of a purported classof all NWCRP participant members, against AIG and certain of its subsidiaries with respect to the underpaymentby AIG of its residual market assessments for workers’ compensation insurance. The complaint was styled as an‘‘alternative complaint,’’ should the Court grant AIG’s motion to dismiss the NWCRP lawsuit for lack of subject-matter jurisdiction. The allegations in the class action complaint are substantially similar to those filed by theNWCRP, but the complaint names former AIG executives as defendants and asserts a RICO claim against thoseexecutives. On August 28, 2009, the class action plaintiffs filed an amended complaint, removing the AIGexecutives as defendants. On October 30, 2009, AIG filed a motion to dismiss the amended complaint. Discoveryrelated to class certification issues has begun and is scheduled to be completed by March 12, 2010. Discovery isproceeding and is currently scheduled to be completed by March 15, 2011.
Litigation Matters Relating to AIG’s General Insurance Operations
Caremark. AIG and certain of its subsidiaries have been named defendants in two putative class actions instate court in Alabama that arise out of the 1999 settlement of class and derivative litigation involving CaremarkRx, Inc. (Caremark). The plaintiffs in the second-filed action have intervened in the first-filed action, and thesecond-filed action has been dismissed. An excess policy issued by a subsidiary of AIG with respect to the 1999litigation was expressly stated to be without limit of liability. In the current actions, plaintiffs allege that the judgeapproving the 1999 settlement was misled as to the extent of available insurance coverage and would not haveapproved the settlement had he known of the existence and/or unlimited nature of the excess policy. They furtherallege that AIG, its subsidiaries, and Caremark are liable for fraud and suppression for misrepresenting and/orconcealing the nature and extent of coverage. In addition, the intervenor- plaintiffs originally alleged that variouslawyers and law firms who represented parties in the underlying class and derivative litigation (the LawyerDefendants) were also liable for fraud and suppression, misrepresentation, and breach of fiduciary duty. Thecomplaints filed by the plaintiffs and the intervenor-plaintiffs request compensatory damages for the 1999 class inthe amount of $3.2 billion, plus punitive damages. AIG and its subsidiaries deny the allegations of fraud andsuppression and have asserted that information concerning the excess policy was publicly disclosed months prior tothe approval of the settlement. AIG and its subsidiaries further assert that the current claims are barred by thestatute of limitations and that plaintiffs’ assertions that the statute was tolled cannot stand against the public
69

American International Group, Inc., and Subsidiaries
NOTES TO CONSOLIDATED FINANCIAL STATEMENTS (unaudited)
disclosure of the excess coverage. The plaintiffs and intervenor-plaintiffs, in turn, have asserted that the disclosurewas insufficient to inform them of the nature of the coverage and did not start the running of the statute oflimitations. On November 26, 2007, the trial court issued an order that dismissed the intervenors’ complaintagainst the Lawyer Defendants and entered a final judgment in favor of the Lawyer Defendants. The matter wasstayed pending appeal to the Alabama Supreme Court. In September 2008, the Alabama Supreme Court affirmedthe trial court’s dismissal of the Lawyer Defendants. After the case was sent back down to the trial court, theintervenor-plaintiffs retained additional counsel — the law firm of Haskell Slaughter Young & Rediker, LLC(Haskell Slaughter) — and filed an Amended Complaint in Intervention on December 1, 2008. The AmendedComplaint in Intervention names only Caremark and AIG and various subsidiaries as defendants and purports tobring claims against all defendants for deceit and conspiracy to deceive. In addition, the Amended Complaint inIntervention purports to bring a claim against AIG and its subsidiaries for aiding and abetting Caremark’s allegeddeception. The defendants have moved to dismiss the Amended Complaint, and, in the alternative, for a moredefinite statement. The intervenor-plaintiffs have yet to respond to defendants’ motion but have indicated to thecourt that they intend to remedy any defects in their Amended Complaint by filing another amended complaint.After the appearance of the Haskell Slaughter firm on behalf of the intervenor-plaintiffs, the plaintiffs moved todisqualify all of the lawyers for the intervenor-plaintiffs because, among other things, the Haskell Slaughter firmpreviously represented Caremark. The intervenor-plaintiffs, in turn, moved to disqualify the lawyers for theplaintiffs in the first-filed action. The trial court heard oral argument on the motions to disqualify on February 6,2009. On March 2, 2009, both sets of plaintiffs filed motions to withdraw their respective motions to disqualifyeach other after reaching an agreement among themselves that the Lauriello plaintiffs would act as lead counsel.The McArthur intervenors also moved to withdraw their Amended Complaint in Intervention. The trial courtgranted all motions to withdraw and ordered the parties to appear on March 26, 2009 for a status conference.Before the conference, the McArthur intervenors purported to dismiss their claims against Lauriello withprejudice pursuant to Ala. R. Civ. P. 41. The defendants argued that such dismissal was improper absent Courtapproval, but the Court approved the dismissal on April 2, 2009. At a class action scheduling conference held onApril 14, 2009, the Court established a schedule for class action discovery that led to a hearing on classcertification in March 2010. The Court then entered an order appointing a special master to resolve certaindiscovery disputes and requiring the parties to submit a new discovery schedule after those disputes are resolved.The parties are presently engaged in class discovery.
Litigation Matters Relating to AIG’s Domestic Life Insurance & Retirement Services Operations
Superior National. On December 30, 2004, an arbitration panel issued its ruling in connection with a 1998workers’ compensation quota share reinsurance agreement under which Superior National Insurance Company,among others, was reinsured by USLIFE, a subsidiary of AGC. In its 2-1 ruling, the arbitration panel refused torescind the contract as requested by USLIFE. Instead, the panel reformed the contract to reduce USLIFE’sparticipation by ten percent. Further, the arbitration ruling established a second phase of arbitration for USLIFEto present its challenges to certain cessions to the contract. In the second phase the arbitration panel issued twoawards resolving the challenges in favor of the cedents. On January 4, 2010, the Ninth Circuit Court of Appealsaffirmed the arbitration awards. USLIFE is currently considering its legal options. AIG had reserves of$639 million as of March 31, 2010. AIG believes that the reserves should be adequate to fund unpaid claims.
(b) Commitments
Flight Equipment
At March 31, 2010, ILFC had committed to purchase 120 new aircraft deliverable from 2010 through 2019, atan estimated aggregate purchase price of $13.7 billion, including $243 million for 2010. ILFC will be required tofind lessees for any aircraft acquired and to arrange financing for a substantial portion of the purchase price.
Included in the 120 new aircraft are 74 Boeing 787 aircraft (B787s), with the first aircraft currently scheduled tobe delivered in July 2012. ILFC is in discussion with Boeing related to revisions to the delivery schedule and
70
American International Group, Inc., and Subsidiaries
NOTES TO CONSOLIDATED FINANCIAL STATEMENTS (unaudited)
potential delay compensation and penalties for which ILFC may be eligible. ILFC has signed contracts for 29 ofthe 74 B787s on order. Under the terms of ILFC’s B787 leases, the lessees may be entitled to share in anycompensation which ILFC receives from Boeing for late delivery of the aircraft.
Other Commitments
On March 29, 2010, AIG’s Compensation and Management Resources Committee approved AIG’s 2010 LongTerm Incentive Plan (LTIP) and an additional component to AIG’s 2009 LTIP for middle management employeesthroughout AIG. Under both plans, recipients were offered the opportunity to receive additional compensation inthe form of cash and stock appreciation rights (SARs) if certain metrics are met. The ultimate value is contingenton the achievement of performance measures aligned to the participant’s business unit over a two-year period andsuch value could range from zero to twice the target amount. Subsequent to the performance period, portions ofthe earned awards are subject to an additional time-vesting period of up to two years. The awards granted toparticipants based on their target amounts for the 2010 LTIP totaled approximately $380 million for the cash andSARs components, while the SARs component of the 2009 LTIP totaled approximately $90 million. AIGrecognizes compensation expense over the vesting period for these plans.
In the normal course of business, AIG enters into commitments to invest in limited partnerships, privateequities, hedge funds and mutual funds and to purchase and develop real estate in the U.S. and abroad. Thesecommitments totaled $6.2 billion at March 31, 2010.
On June 27, 2005, AIG entered into an agreement pursuant to which AIG agreed, subject to certain conditions,to make any payment that is not promptly paid with respect to the benefits accrued by certain employees of AIGand its subsidiaries under the SICO Plans (as discussed in (c) below under ‘‘Benefits Provided by StarrInternational Company, Inc.’’).
(c) Contingencies
Liability for unpaid claims and claims adjustment expense
Although AIG regularly reviews the adequacy of the established Liability for unpaid claims and claimsadjustment expense, there can be no assurance that AIG’s ultimate Liability for unpaid claims and claimsadjustment expense will not develop adversely and materially exceed AIG’s current Liability for unpaid claims andclaims adjustment expense. Estimation of ultimate net claims, claims adjustment expenses and Liability for unpaidclaims and claims adjustment expense is a complex process for long-tail casualty lines of business, which includeexcess and umbrella liability, directors and officers liability (D&O), professional liability, medical malpractice,workers’ compensation, general liability, products liability and related classes, as well as for asbestos andenvironmental exposures. Generally, actual historical loss development factors are used to project future lossdevelopment. However, there can be no assurance that future loss development patterns will be the same as in thepast. Moreover, any deviation in loss cost trends or in loss development factors might not be discernible for anextended period of time subsequent to the recording of the initial loss reserve estimates for any accident year.Thus, there is the potential for reserves with respect to a number of years to be significantly affected by changesin loss cost trends or loss development factors that were relied upon in setting the reserves. These changes in losscost trends or loss development factors could be attributable to changes in inflation, in labor and material costs orin the judicial environment, or in other social or economic phenomena affecting claims.
Benefits Provided by Starr International Company, Inc.
SICO has provided a series of two-year Deferred Compensation Profit Participation Plans (SICO Plans) tocertain AIG employees. The SICO Plans were created in 1975 when the voting shareholders and Board ofDirectors of SICO, a private holding company whose principal asset is AIG Common Stock, decided that aportion of the capital value of SICO should be used to provide an incentive plan for the current and succeedingmanagements of all American International companies, including AIG.
71
American International Group, Inc., and Subsidiaries
NOTES TO CONSOLIDATED FINANCIAL STATEMENTS (unaudited)
None of the costs of the various benefits provided under the SICO Plans has been paid by AIG, although AIGhas recorded a charge to reported earnings for the deferred compensation amounts paid to AIG employees bySICO, with an offsetting amount credited to Additional paid-in capital reflecting amounts considered to becontributed by SICO. The SICO Plans provide that shares currently owned by SICO are set aside by SICO for thebenefit of the participant and distributed upon retirement. The SICO Board of Directors currently may permit anearly payout of units under certain circumstances. Prior to payout, the participant is not entitled to vote, disposeof or receive dividends with respect to such shares, and shares are subject to forfeiture under certain conditions,including but not limited to the participant’s voluntary termination of employment with AIG prior to normalretirement age. Under the SICO Plans, SICO’s Board of Directors may elect to pay a participant cash in lieu ofshares of AIG Common Stock. Following notification from SICO to participants in the SICO Plans that it willsettle specific future awards under the SICO Plans with shares rather than cash, AIG modified its accounting forthe SICO Plans from variable to fixed measurement accounting. AIG gave effect to this change in settlementmethod beginning on December 9, 2005, the date of SICO’s notice to participants in the SICO Plans.
(d) Guarantees
• See Note 7 herein for commitments and guarantees associated with VIEs.
• See Note 8 herein for disclosures on derivatives, including AIGFP and MIP written credit default swaps andother derivatives with credit risk-related contingent features.
• See Note 15 herein for additional disclosures on guarantees of outstanding debt.
Subsidiaries
AIG has issued unconditional guarantees with respect to the prompt payment, when due, of all present andfuture payment obligations and liabilities of AIG Financial Products and certain of its subsidiaries arising fromtransactions entered into by such companies.
In connection with AIGFP’s leasing business, AIGFP has issued, in a limited number of transactions, standbyletters of credit or similar facilities to equity investors in an amount equal to the termination value owing to theequity investor by the lessee in the event of a lessee default (the equity termination value). The total amountoutstanding at March 31, 2010 was $1.3 billion. In those transactions, AIGFP has agreed to pay such amount ifthe lessee fails to pay. The amount payable by AIGFP is usually, but not always, partially offset by amountspayable under other instruments typically equal to the accreted value of a deposit held by AIGFP. In the eventAIGFP is required to make a payment to the equity investor, the lessee is unconditionally obligated to reimburseAIGFP. To the extent the equity investor is paid the equity termination value from the standby letter of creditand/or other sources, including payments by the lessee, AIGFP takes an assignment of the equity investor’s rightsunder the lease of the underlying property. Because the obligations of the lessee under the lease transactions aregenerally economically defeased, lessee bankruptcy is the most likely circumstance in which AIGFP would berequired to pay. AIGFP selected transactions in which it agreed to provide this product only in circumstanceswhere lessee bankruptcy is considered remote or, in the case of certain municipal lessees, not permitted undercurrent law.
Asset Dispositions
AIG is also subject to financial guarantees and indemnity arrangements in connection with the sales ofbusinesses pursuant to its asset disposition plan, including the sales of AIA and ALICO. The various indemnitiesand guarantees may be triggered by, among other things, breaches of representations, warranties or covenantsprovided by AIG. These obligations are typically subject to various time limitations, defined by the contract or byoperation of law, such as statutes of limitation. In some cases, the maximum potential obligation is subject tocontractual limitations, while in other cases such limitations are not specified or applicable. AIG is unable todevelop an estimate of the maximum payout under certain of these guarantees and indemnifications. However,
72
American International Group, Inc., and Subsidiaries
NOTES TO CONSOLIDATED FINANCIAL STATEMENTS (unaudited)
AIG believes that it is unlikely it will have to make any material payments under these arrangements, and nosignificant liabilities related to these arrangements have been recorded in the Consolidated Balance Sheet. SeeNote 1 herein for additional information on sales of businesses and asset dispositions.
10. Total Equity and Earnings (Loss) Per Share
The following table provides a reconciliation of the beginning and ending balances of the components of totalequity (excluding the effects of redeemable noncontrolling interests):
2010 2009Three Months Ended March 31,Total AIG Non- Total AIG Non-
Shareholders’ Controlling Total Shareholders’ Controlling Total(In millions) Equity Interest Equity Equity Interest Equity
Balance, beginning of year $69,824 $28,252 $ 98,076 $52,710 $8,095 $60,805
Series C issuance - - - 1 - 1Series F drawdowns 2,199 - 2,199 - - -Common stock issued under stock plans (5) - (5) (1) - (1)Cumulative effect of change in accounting
principle, net of tax (107) - (107) 15 - 15Net income (loss) 1,451 133 1,584 (4,353) (792) (5,145)Other comprehensive income (loss) 1,636 (165) 1,471 (2,532) (87) (2,619)Net decrease due to deconsolidation - (2,161) (2,161) - 476 476Contributions from noncontrolling interest - 210 210 - 391 391Distributions to noncontrolling interests - (87) (87) - (589) (589)Net income (loss) attributable to
noncontrolling nonvoting, callable, juniorand senior preferred interests held by theFederal Reserve Bank of New York - 519 519 - - -
Other 3 17 20 (81) (44) (125)
Balance, end of period $75,001 $26,718 $101,719 $45,759 $7,450 $53,209
Preferred Stock
During the first quarter of 2010, AIG drew approximately $2.2 billion under the Department of the TreasuryCommitment and, as a result, the liquidation preference of the AIG Series F Preferred Stock increased to$7.543 billion in the aggregate.
As a result of AIG’s failure to declare and pay dividends on Series E Fixed Rate Non-Cumulative PerpetualPreferred Stock, par value $5.00 per share (AIG Series E Preferred Stock), and AIG Series F Preferred Stock forfour quarterly dividend payment periods, the United States Department of the Treasury, as the sole holder of theAIG Series E Preferred Stock and AIG Series F Preferred Stock, exercised its right and elected Ronald A.Rittenmeyer and Donald H. Layton (the Preferred Directors) to the Board of Directors of AIG (the Board) bywritten consent effective April 1, 2010. The Preferred Directors are to hold office until the next annual meeting(or special meeting called for the purpose of electing directors) or until all the dividends payable on alloutstanding shares of the AIG Series E Preferred Stock and the AIG Series F Preferred Stock have been declaredand paid in full for four consecutive quarters.
See Note 16 of Notes to Consolidated Financial Statements of AIG’s 2009 Annual Report on Form 10-K for adiscussion of the terms of AIG’s outstanding Preferred Stock.
73
American International Group, Inc., and Subsidiaries
NOTES TO CONSOLIDATED FINANCIAL STATEMENTS (unaudited)
Accumulated Other Comprehensive Income (Loss)
A rollforward of Accumulated other comprehensive income (loss) is as follows:
Unrealized Appreciation Net Derivative(Depreciation) of Fixed Unrealized Gains (losses)
Maturity Investments Appreciation Foreign Arising from Retirementon Which Other-Than- (Depreciation) Currency Cash Flow Plan
Three Months Ended March 31, 2010 Temporary Credit of All Other Translation Hedging Liabilities(in millions) Impairments Were Taken Investments Adjustments Activities Adjustment Total
Balance, beginning of year, net of tax $(1,810) $ 7,145 $1,630 $(128) $(1,144)$ 5,693
Unrealized appreciation(depreciation) of investments 993 2,531 - - - 3,524
Net changes in foreign currencytranslation adjustments - - (958) - - (958)
Net gains (losses) on cash flow hedges - - - 24 - 24Net actuarial gain - - - - 78 78Prior service cost - - - - (1) (1)Deferred tax asset (liability) (220) (1,374) 429 (2) (24) (1,191)
Total other comprehensive income 773 1,157 (529) 22 53 1,476Cumulative effect of change in
accounting principle, net of tax - (276) - - - (276)Noncontrolling interests 5 (60) (105) - - (160)
Balance, end of period, net of tax $(1,042) $ 8,086 $1,206 $(106) $(1,091)$ 7,053
Noncontrolling interests
In connection with the ongoing execution of its orderly asset disposition plan, as well as plans to timely repaythe FRBNY Credit Facility, on November 30, 2009, AIG transferred two of its wholly owned businesses, AIA andALICO, to two newly-created special purpose vehicles (SPVs) in exchange for all the common and preferredinterests of those SPVs. On December 1, 2009, AIG transferred the preferred interests in the SPVs to theFRBNY in consideration for a $25 billion reduction of the outstanding loan balance and of the maximum amountof credit available under the FRBNY Credit Facility and amended the terms of the Facility as discussed below.
The common interests, which were retained by AIG, entitle AIG to 100 percent of the voting power of theSPVs. The voting power allows AIG to elect the boards of managers of the SPVs, who oversee the managementand operation of the SPVs. Primarily due to the substantive participation rights of the preferred interests, theSPVs were determined to be variable interest entities. As the primary beneficiary of the SPVs, AIG consolidatesthe SPVs.
The preferred interests are redeemable at the option of AIG and are transferable at the FRBNY’s discretion. Ifthe FRBNY obtains control of the SPVs, through a default by AIG under the FRBNY Credit Agreement orotherwise, the agreements governing the transactions explicitly prohibit redemption of the preferred interests. Inthe event the board of managers of either SPV initiates a public offering, liquidation or winding up or a voluntarysale of the SPV, the proceeds must be distributed to the preferred interests until the preferred interests’redemption value has been paid. The redemption value of the preferred interests is the liquidation preference,which includes any undistributed preferred returns through the redemption date, and the amount of distributionsthat the preferred interests would receive in the event of a 100 percent distribution to all the common andpreferred interest holders at the redemption date as described below.
See Note 16 of Notes to Consolidated Financial Statements of AIG’s 2009 Annual Report on Form 10-K forfurther discussion of the terms of the junior and senior non-voting, callable preferred interests.
74
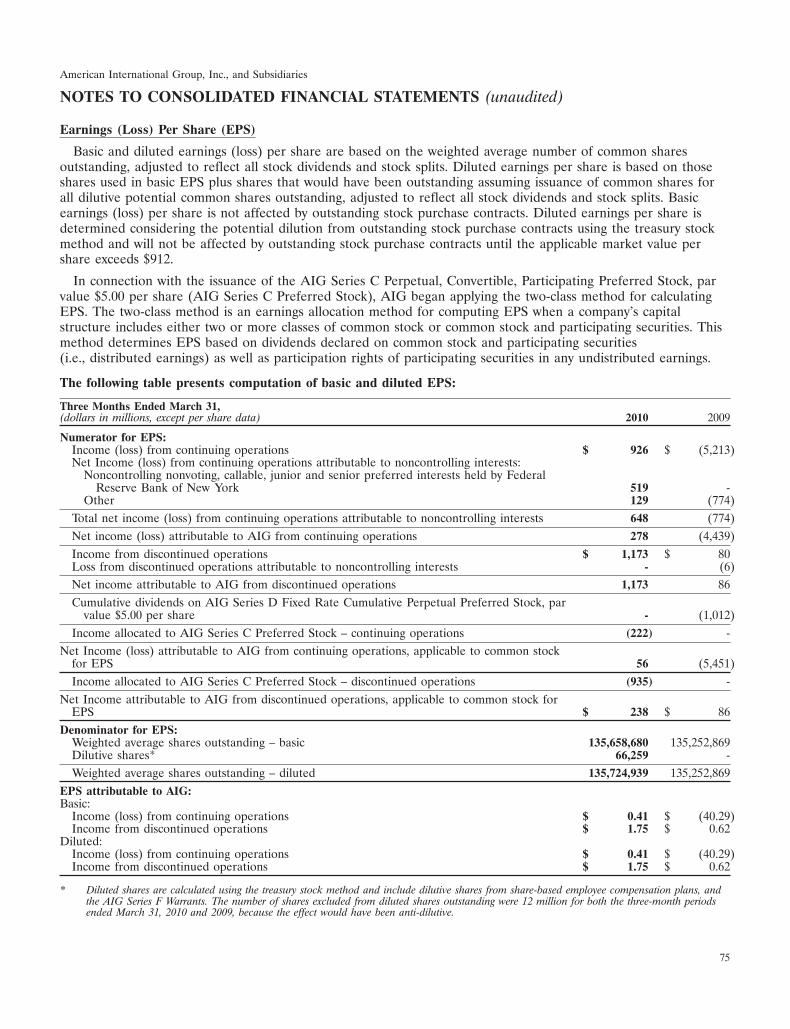
American International Group, Inc., and Subsidiaries
NOTES TO CONSOLIDATED FINANCIAL STATEMENTS (unaudited)
Earnings (Loss) Per Share (EPS)
Basic and diluted earnings (loss) per share are based on the weighted average number of common sharesoutstanding, adjusted to reflect all stock dividends and stock splits. Diluted earnings per share is based on thoseshares used in basic EPS plus shares that would have been outstanding assuming issuance of common shares forall dilutive potential common shares outstanding, adjusted to reflect all stock dividends and stock splits. Basicearnings (loss) per share is not affected by outstanding stock purchase contracts. Diluted earnings per share isdetermined considering the potential dilution from outstanding stock purchase contracts using the treasury stockmethod and will not be affected by outstanding stock purchase contracts until the applicable market value pershare exceeds $912.
In connection with the issuance of the AIG Series C Perpetual, Convertible, Participating Preferred Stock, parvalue $5.00 per share (AIG Series C Preferred Stock), AIG began applying the two-class method for calculatingEPS. The two-class method is an earnings allocation method for computing EPS when a company’s capitalstructure includes either two or more classes of common stock or common stock and participating securities. Thismethod determines EPS based on dividends declared on common stock and participating securities(i.e., distributed earnings) as well as participation rights of participating securities in any undistributed earnings.
The following table presents computation of basic and diluted EPS:
Three Months Ended March 31,(dollars in millions, except per share data) 2010 2009
Numerator for EPS:Income (loss) from continuing operations $ 926 $ (5,213)Net Income (loss) from continuing operations attributable to noncontrolling interests:
Noncontrolling nonvoting, callable, junior and senior preferred interests held by FederalReserve Bank of New York 519 -
Other 129 (774)Total net income (loss) from continuing operations attributable to noncontrolling interests 648 (774)Net income (loss) attributable to AIG from continuing operations 278 (4,439)Income from discontinued operations $ 1,173 $ 80Loss from discontinued operations attributable to noncontrolling interests - (6)Net income attributable to AIG from discontinued operations 1,173 86Cumulative dividends on AIG Series D Fixed Rate Cumulative Perpetual Preferred Stock, par
value $5.00 per share - (1,012)Income allocated to AIG Series C Preferred Stock – continuing operations (222) -
Net Income (loss) attributable to AIG from continuing operations, applicable to common stockfor EPS 56 (5,451)Income allocated to AIG Series C Preferred Stock – discontinued operations (935) -
Net Income attributable to AIG from discontinued operations, applicable to common stock forEPS $ 238 $ 86
Denominator for EPS:Weighted average shares outstanding – basic 135,658,680 135,252,869Dilutive shares* 66,259 -Weighted average shares outstanding – diluted 135,724,939 135,252,869
EPS attributable to AIG:Basic:
Income (loss) from continuing operations $ 0.41 $ (40.29)Income from discontinued operations $ 1.75 $ 0.62
Diluted:Income (loss) from continuing operations $ 0.41 $ (40.29)Income from discontinued operations $ 1.75 $ 0.62
* Diluted shares are calculated using the treasury stock method and include dilutive shares from share-based employee compensation plans, andthe AIG Series F Warrants. The number of shares excluded from diluted shares outstanding were 12 million for both the three-month periodsended March 31, 2010 and 2009, because the effect would have been anti-dilutive.
75
American International Group, Inc., and Subsidiaries
NOTES TO CONSOLIDATED FINANCIAL STATEMENTS (unaudited)
11. Restructuring
Since September 2008, AIG has been working to execute an orderly disposition plan of non-core businesses andassets, protect and enhance the value of its key businesses, and position itself for the future. AIG continuallyreassesses this plan to maximize value while maintaining flexibility in its liquidity and capital, and expects toaccomplish this over a longer time frame than originally contemplated.
Successful execution of the restructuring plan involves significant separation activities. Accordingly, in 2008 AIGestablished retention programs for its key employees to maintain ongoing business operations and to facilitate thesuccessful execution of the restructuring plan. Additionally, given the market disruption in the first quarter of2008, AIGFP established a retention plan for its employees to manage and unwind its complex businesses. Othermajor activities include the separation of shared services, corporate functions, infrastructure and assets amongbusiness units.
In connection with its restructuring and separation activities, AIG expects to incur significant expenses,including legal, banking, accounting, consulting and other professional fees. In addition, AIG is contractuallyobligated to reimburse or advance certain professional fees and other expenses incurred by the FRBNY and thetrustees of the AIG Credit Facility Trust, a trust established for the sole benefit of the United States Treasury(together with its trustees, the Trust).
Based on AIG’s announced plans, AIG has made estimates of these expenses, although for some restructuringand separation activities estimates cannot be reasonably made due to the evolving nature of the plans and theuncertain timing of the transactions involved. Future reimbursement or advancement payments to the FRBNY andthe trustees cannot reasonably be estimated by AIG. Even for those expenses that have been estimated, actualexpenses will vary depending on the identity of the ultimate purchasers of the divested entities or counterpartiesto transactions, the transactions and activities that ultimately are consummated or undertaken, and the ultimatetime period over which these activities occur.
For those restructuring and separation expenses that have been cumulatively incurred or can be reasonablyexpected to be incurred, the total expenses are approximately $2.1 billion and $2.3 billion, respectively, atMarch 31, 2010, as set forth in the table below. These amounts exclude expenses that could not be reasonablyestimated at March 31, 2010, as well as expenses (principally professional fees) that are expected to be capitalized.With respect to the FRBNY and the trustees of the Trust, these amounts include only actual reimbursement andadvancement payments made through March 31, 2010.
76
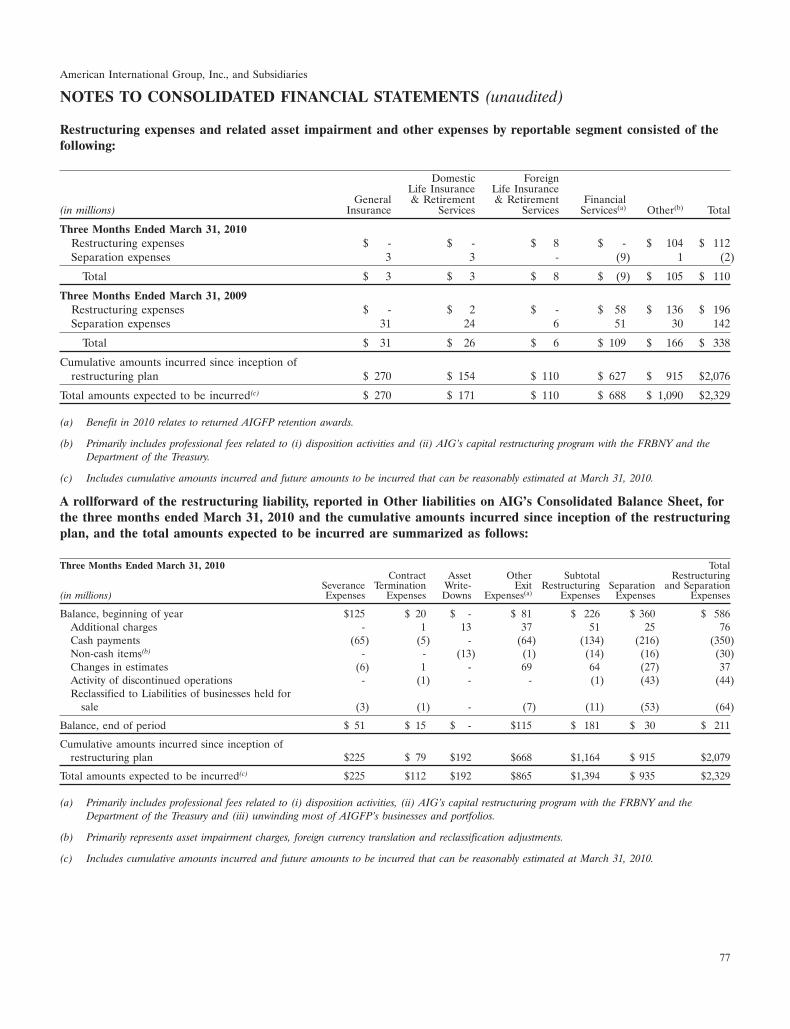
American International Group, Inc., and Subsidiaries
NOTES TO CONSOLIDATED FINANCIAL STATEMENTS (unaudited)
Restructuring expenses and related asset impairment and other expenses by reportable segment consisted of thefollowing:
Domestic ForeignLife Insurance Life Insurance
General & Retirement & Retirement Financial(in millions) Insurance Services Services Services(a) Other(b) Total
Three Months Ended March 31, 2010Restructuring expenses $ - $ - $ 8 $ - $ 104 $ 112Separation expenses 3 3 - (9) 1 (2)
Total $ 3 $ 3 $ 8 $ (9) $ 105 $ 110
Three Months Ended March 31, 2009Restructuring expenses $ - $ 2 $ - $ 58 $ 136 $ 196Separation expenses 31 24 6 51 30 142
Total $ 31 $ 26 $ 6 $ 109 $ 166 $ 338
Cumulative amounts incurred since inception ofrestructuring plan $ 270 $ 154 $ 110 $ 627 $ 915 $2,076
Total amounts expected to be incurred(c) $ 270 $ 171 $ 110 $ 688 $ 1,090 $2,329
(a) Benefit in 2010 relates to returned AIGFP retention awards.
(b) Primarily includes professional fees related to (i) disposition activities and (ii) AIG’s capital restructuring program with the FRBNY and theDepartment of the Treasury.
(c) Includes cumulative amounts incurred and future amounts to be incurred that can be reasonably estimated at March 31, 2010.
A rollforward of the restructuring liability, reported in Other liabilities on AIG’s Consolidated Balance Sheet, forthe three months ended March 31, 2010 and the cumulative amounts incurred since inception of the restructuringplan, and the total amounts expected to be incurred are summarized as follows:
Three Months Ended March 31, 2010 TotalContract Asset Other Subtotal Restructuring
Severance Termination Write- Exit Restructuring Separation and Separation(in millions) Expenses Expenses Downs Expenses(a) Expenses Expenses Expenses
Balance, beginning of year $125 $ 20 $ - $ 81 $ 226 $ 360 $ 586Additional charges - 1 13 37 51 25 76Cash payments (65) (5) - (64) (134) (216) (350)Non-cash items(b) - - (13) (1) (14) (16) (30)Changes in estimates (6) 1 - 69 64 (27) 37Activity of discontinued operations - (1) - - (1) (43) (44)Reclassified to Liabilities of businesses held for
sale (3) (1) - (7) (11) (53) (64)
Balance, end of period $ 51 $ 15 $ - $115 $ 181 $ 30 $ 211
Cumulative amounts incurred since inception ofrestructuring plan $225 $ 79 $192 $668 $1,164 $ 915 $2,079
Total amounts expected to be incurred(c) $225 $112 $192 $865 $1,394 $ 935 $2,329
(a) Primarily includes professional fees related to (i) disposition activities, (ii) AIG’s capital restructuring program with the FRBNY and theDepartment of the Treasury and (iii) unwinding most of AIGFP’s businesses and portfolios.
(b) Primarily represents asset impairment charges, foreign currency translation and reclassification adjustments.
(c) Includes cumulative amounts incurred and future amounts to be incurred that can be reasonably estimated at March 31, 2010.
77
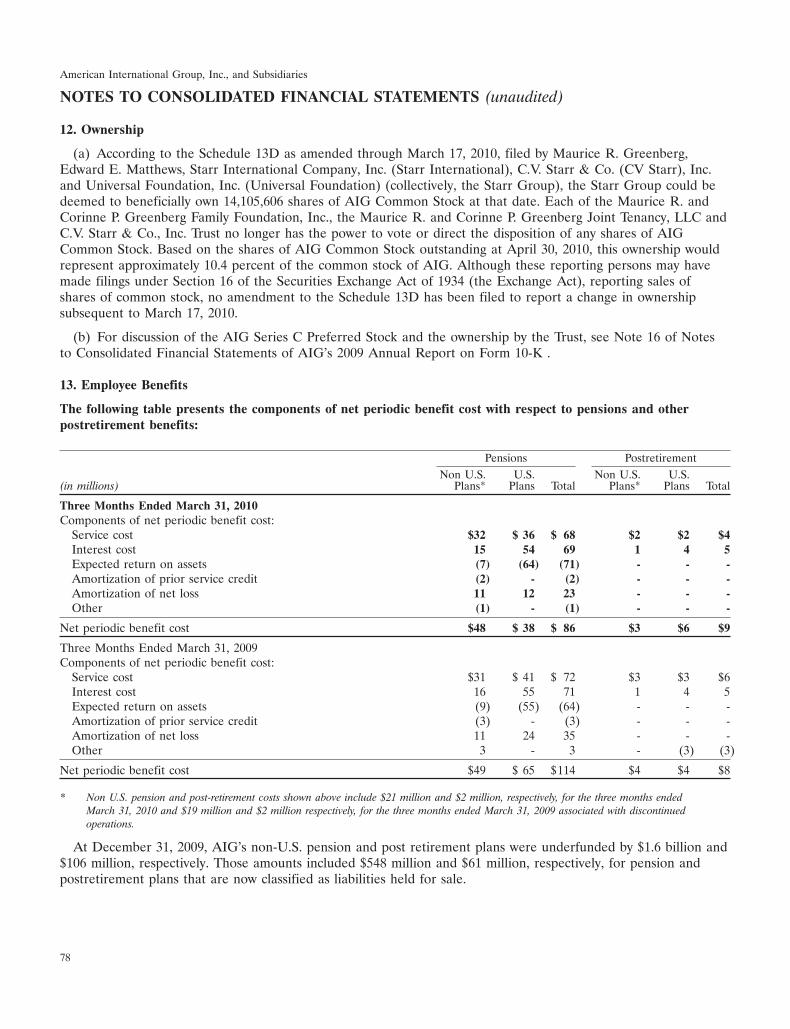
American International Group, Inc., and Subsidiaries
NOTES TO CONSOLIDATED FINANCIAL STATEMENTS (unaudited)
12. Ownership
(a) According to the Schedule 13D as amended through March 17, 2010, filed by Maurice R. Greenberg,Edward E. Matthews, Starr International Company, Inc. (Starr International), C.V. Starr & Co. (CV Starr), Inc.and Universal Foundation, Inc. (Universal Foundation) (collectively, the Starr Group), the Starr Group could bedeemed to beneficially own 14,105,606 shares of AIG Common Stock at that date. Each of the Maurice R. andCorinne P. Greenberg Family Foundation, Inc., the Maurice R. and Corinne P. Greenberg Joint Tenancy, LLC andC.V. Starr & Co., Inc. Trust no longer has the power to vote or direct the disposition of any shares of AIGCommon Stock. Based on the shares of AIG Common Stock outstanding at April 30, 2010, this ownership wouldrepresent approximately 10.4 percent of the common stock of AIG. Although these reporting persons may havemade filings under Section 16 of the Securities Exchange Act of 1934 (the Exchange Act), reporting sales ofshares of common stock, no amendment to the Schedule 13D has been filed to report a change in ownershipsubsequent to March 17, 2010.
(b) For discussion of the AIG Series C Preferred Stock and the ownership by the Trust, see Note 16 of Notesto Consolidated Financial Statements of AIG’s 2009 Annual Report on Form 10-K .
13. Employee Benefits
The following table presents the components of net periodic benefit cost with respect to pensions and otherpostretirement benefits:
Pensions PostretirementNon U.S. U.S. Non U.S. U.S.
(in millions) Plans* Plans Total Plans* Plans Total
Three Months Ended March 31, 2010Components of net periodic benefit cost:
Service cost $32 $ 36 $ 68 $2 $2 $4Interest cost 15 54 69 1 4 5Expected return on assets (7) (64) (71) - - -Amortization of prior service credit (2) - (2) - - -Amortization of net loss 11 12 23 - - -Other (1) - (1) - - -
Net periodic benefit cost $48 $ 38 $ 86 $3 $6 $9
Three Months Ended March 31, 2009Components of net periodic benefit cost:
Service cost $31 $ 41 $ 72 $3 $3 $6Interest cost 16 55 71 1 4 5Expected return on assets (9) (55) (64) - - -Amortization of prior service credit (3) - (3) - - -Amortization of net loss 11 24 35 - - -Other 3 - 3 - (3) (3)
Net periodic benefit cost $49 $ 65 $114 $4 $4 $8
* Non U.S. pension and post-retirement costs shown above include $21 million and $2 million, respectively, for the three months endedMarch 31, 2010 and $19 million and $2 million respectively, for the three months ended March 31, 2009 associated with discontinuedoperations.
At December 31, 2009, AIG’s non-U.S. pension and post retirement plans were underfunded by $1.6 billion and$106 million, respectively. Those amounts included $548 million and $61 million, respectively, for pension andpostretirement plans that are now classified as liabilities held for sale.
78
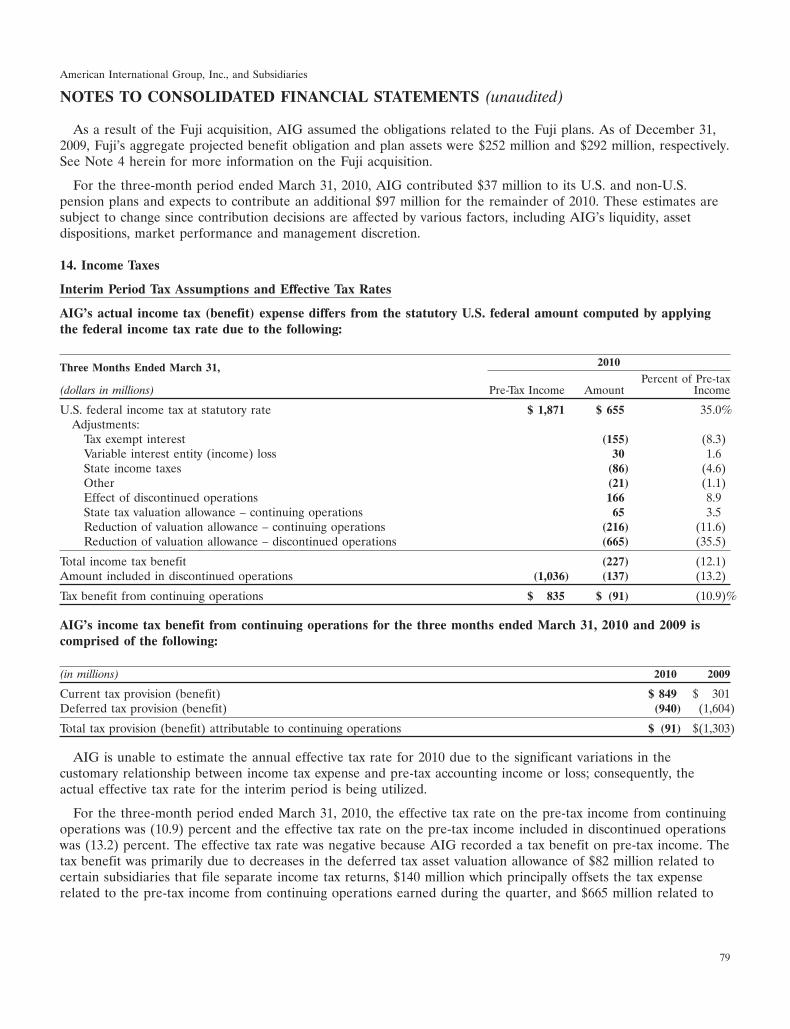
American International Group, Inc., and Subsidiaries
NOTES TO CONSOLIDATED FINANCIAL STATEMENTS (unaudited)
As a result of the Fuji acquisition, AIG assumed the obligations related to the Fuji plans. As of December 31,2009, Fuji’s aggregate projected benefit obligation and plan assets were $252 million and $292 million, respectively.See Note 4 herein for more information on the Fuji acquisition.
For the three-month period ended March 31, 2010, AIG contributed $37 million to its U.S. and non-U.S.pension plans and expects to contribute an additional $97 million for the remainder of 2010. These estimates aresubject to change since contribution decisions are affected by various factors, including AIG’s liquidity, assetdispositions, market performance and management discretion.
14. Income Taxes
Interim Period Tax Assumptions and Effective Tax Rates
AIG’s actual income tax (benefit) expense differs from the statutory U.S. federal amount computed by applyingthe federal income tax rate due to the following:
2010Three Months Ended March 31,Percent of Pre-tax
(dollars in millions) Pre-Tax Income Amount Income
U.S. federal income tax at statutory rate $ 1,871 $ 655 35.0%Adjustments:
Tax exempt interest (155) (8.3)Variable interest entity (income) loss 30 1.6State income taxes (86) (4.6)Other (21) (1.1)Effect of discontinued operations 166 8.9State tax valuation allowance – continuing operations 65 3.5Reduction of valuation allowance – continuing operations (216) (11.6)Reduction of valuation allowance – discontinued operations (665) (35.5)
Total income tax benefit (227) (12.1)Amount included in discontinued operations (1,036) (137) (13.2)
Tax benefit from continuing operations $ 835 $ (91) (10.9)%
AIG’s income tax benefit from continuing operations for the three months ended March 31, 2010 and 2009 iscomprised of the following:
(in millions) 2010 2009
Current tax provision (benefit) $ 849 $ 301Deferred tax provision (benefit) (940) (1,604)
Total tax provision (benefit) attributable to continuing operations $ (91) $(1,303)
AIG is unable to estimate the annual effective tax rate for 2010 due to the significant variations in thecustomary relationship between income tax expense and pre-tax accounting income or loss; consequently, theactual effective tax rate for the interim period is being utilized.
For the three-month period ended March 31, 2010, the effective tax rate on the pre-tax income from continuingoperations was (10.9) percent and the effective tax rate on the pre-tax income included in discontinued operationswas (13.2) percent. The effective tax rate was negative because AIG recorded a tax benefit on pre-tax income. Thetax benefit was primarily due to decreases in the deferred tax asset valuation allowance of $82 million related tocertain subsidiaries that file separate income tax returns, $140 million which principally offsets the tax expenserelated to the pre-tax income from continuing operations earned during the quarter, and $665 million related to
79
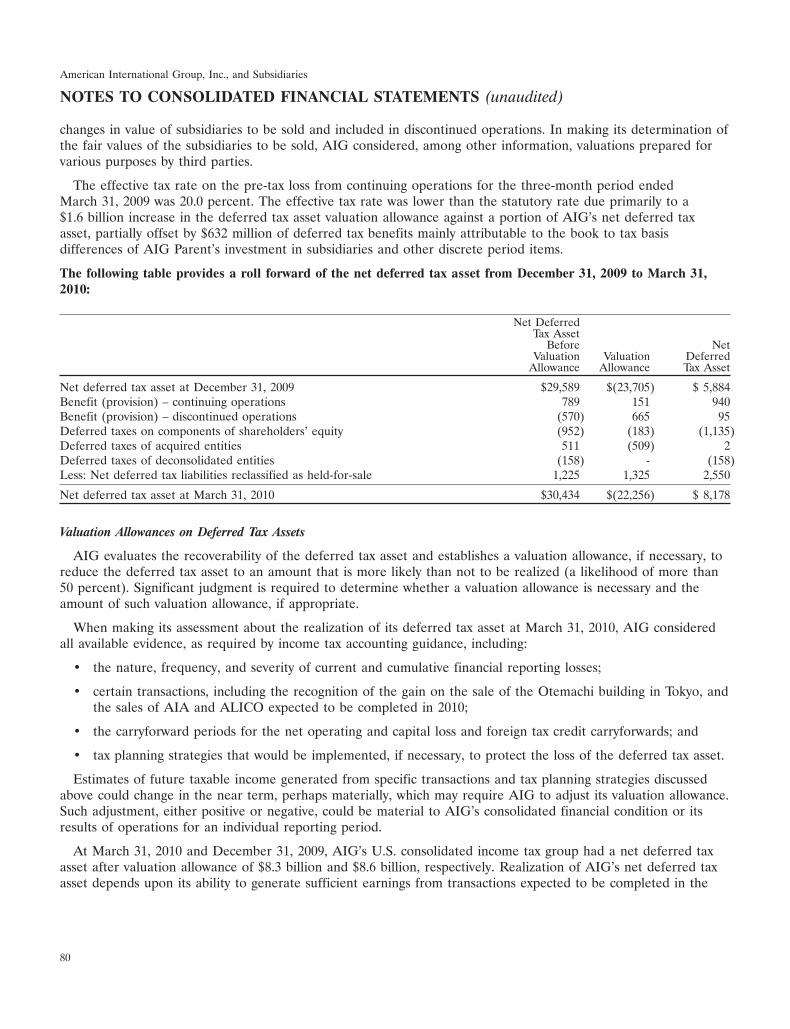
American International Group, Inc., and Subsidiaries
NOTES TO CONSOLIDATED FINANCIAL STATEMENTS (unaudited)
changes in value of subsidiaries to be sold and included in discontinued operations. In making its determination ofthe fair values of the subsidiaries to be sold, AIG considered, among other information, valuations prepared forvarious purposes by third parties.
The effective tax rate on the pre-tax loss from continuing operations for the three-month period endedMarch 31, 2009 was 20.0 percent. The effective tax rate was lower than the statutory rate due primarily to a$1.6 billion increase in the deferred tax asset valuation allowance against a portion of AIG’s net deferred taxasset, partially offset by $632 million of deferred tax benefits mainly attributable to the book to tax basisdifferences of AIG Parent’s investment in subsidiaries and other discrete period items.
The following table provides a roll forward of the net deferred tax asset from December 31, 2009 to March 31,2010:
Net DeferredTax Asset
Before NetValuation Valuation Deferred
Allowance Allowance Tax Asset
Net deferred tax asset at December 31, 2009 $29,589 $(23,705) $ 5,884Benefit (provision) – continuing operations 789 151 940Benefit (provision) – discontinued operations (570) 665 95Deferred taxes on components of shareholders’ equity (952) (183) (1,135)Deferred taxes of acquired entities 511 (509) 2Deferred taxes of deconsolidated entities (158) - (158)Less: Net deferred tax liabilities reclassified as held-for-sale 1,225 1,325 2,550
Net deferred tax asset at March 31, 2010 $30,434 $(22,256) $ 8,178
Valuation Allowances on Deferred Tax Assets
AIG evaluates the recoverability of the deferred tax asset and establishes a valuation allowance, if necessary, toreduce the deferred tax asset to an amount that is more likely than not to be realized (a likelihood of more than50 percent). Significant judgment is required to determine whether a valuation allowance is necessary and theamount of such valuation allowance, if appropriate.
When making its assessment about the realization of its deferred tax asset at March 31, 2010, AIG consideredall available evidence, as required by income tax accounting guidance, including:
• the nature, frequency, and severity of current and cumulative financial reporting losses;
• certain transactions, including the recognition of the gain on the sale of the Otemachi building in Tokyo, andthe sales of AIA and ALICO expected to be completed in 2010;
• the carryforward periods for the net operating and capital loss and foreign tax credit carryforwards; and
• tax planning strategies that would be implemented, if necessary, to protect the loss of the deferred tax asset.
Estimates of future taxable income generated from specific transactions and tax planning strategies discussedabove could change in the near term, perhaps materially, which may require AIG to adjust its valuation allowance.Such adjustment, either positive or negative, could be material to AIG’s consolidated financial condition or itsresults of operations for an individual reporting period.
At March 31, 2010 and December 31, 2009, AIG’s U.S. consolidated income tax group had a net deferred taxasset after valuation allowance of $8.3 billion and $8.6 billion, respectively. Realization of AIG’s net deferred taxasset depends upon its ability to generate sufficient earnings from transactions expected to be completed in the
80
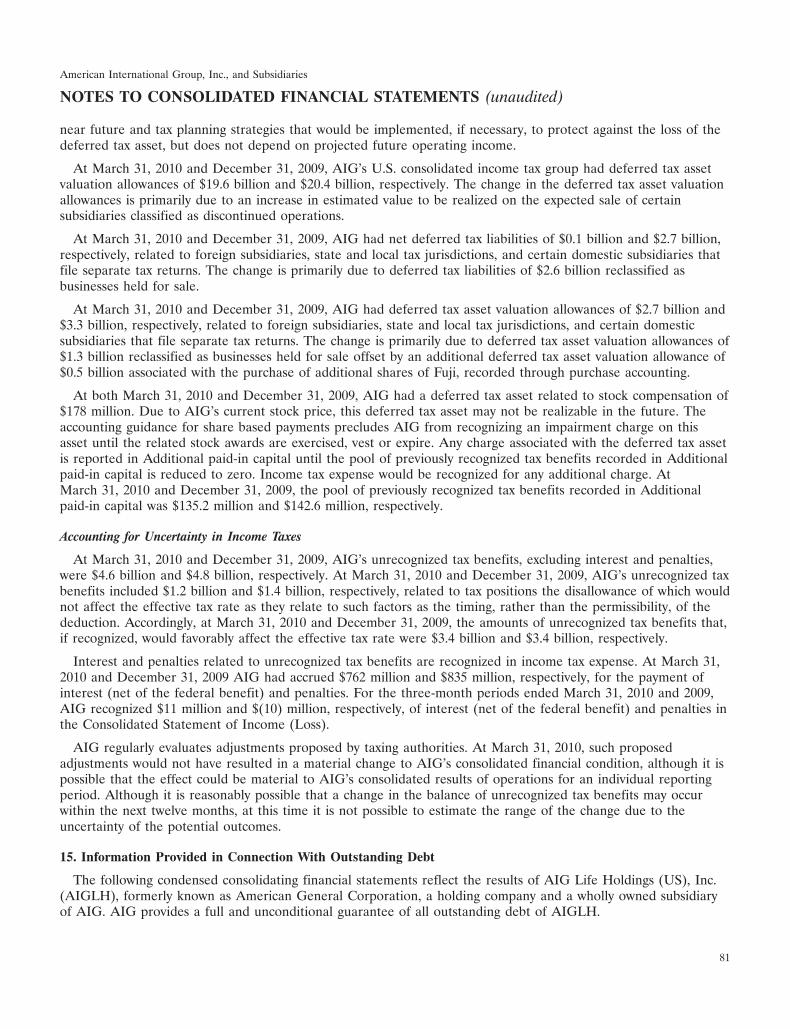
American International Group, Inc., and Subsidiaries
NOTES TO CONSOLIDATED FINANCIAL STATEMENTS (unaudited)
near future and tax planning strategies that would be implemented, if necessary, to protect against the loss of thedeferred tax asset, but does not depend on projected future operating income.
At March 31, 2010 and December 31, 2009, AIG’s U.S. consolidated income tax group had deferred tax assetvaluation allowances of $19.6 billion and $20.4 billion, respectively. The change in the deferred tax asset valuationallowances is primarily due to an increase in estimated value to be realized on the expected sale of certainsubsidiaries classified as discontinued operations.
At March 31, 2010 and December 31, 2009, AIG had net deferred tax liabilities of $0.1 billion and $2.7 billion,respectively, related to foreign subsidiaries, state and local tax jurisdictions, and certain domestic subsidiaries thatfile separate tax returns. The change is primarily due to deferred tax liabilities of $2.6 billion reclassified asbusinesses held for sale.
At March 31, 2010 and December 31, 2009, AIG had deferred tax asset valuation allowances of $2.7 billion and$3.3 billion, respectively, related to foreign subsidiaries, state and local tax jurisdictions, and certain domesticsubsidiaries that file separate tax returns. The change is primarily due to deferred tax asset valuation allowances of$1.3 billion reclassified as businesses held for sale offset by an additional deferred tax asset valuation allowance of$0.5 billion associated with the purchase of additional shares of Fuji, recorded through purchase accounting.
At both March 31, 2010 and December 31, 2009, AIG had a deferred tax asset related to stock compensation of$178 million. Due to AIG’s current stock price, this deferred tax asset may not be realizable in the future. Theaccounting guidance for share based payments precludes AIG from recognizing an impairment charge on thisasset until the related stock awards are exercised, vest or expire. Any charge associated with the deferred tax assetis reported in Additional paid-in capital until the pool of previously recognized tax benefits recorded in Additionalpaid-in capital is reduced to zero. Income tax expense would be recognized for any additional charge. AtMarch 31, 2010 and December 31, 2009, the pool of previously recognized tax benefits recorded in Additionalpaid-in capital was $135.2 million and $142.6 million, respectively.
Accounting for Uncertainty in Income Taxes
At March 31, 2010 and December 31, 2009, AIG’s unrecognized tax benefits, excluding interest and penalties,were $4.6 billion and $4.8 billion, respectively. At March 31, 2010 and December 31, 2009, AIG’s unrecognized taxbenefits included $1.2 billion and $1.4 billion, respectively, related to tax positions the disallowance of which wouldnot affect the effective tax rate as they relate to such factors as the timing, rather than the permissibility, of thededuction. Accordingly, at March 31, 2010 and December 31, 2009, the amounts of unrecognized tax benefits that,if recognized, would favorably affect the effective tax rate were $3.4 billion and $3.4 billion, respectively.
Interest and penalties related to unrecognized tax benefits are recognized in income tax expense. At March 31,2010 and December 31, 2009 AIG had accrued $762 million and $835 million, respectively, for the payment ofinterest (net of the federal benefit) and penalties. For the three-month periods ended March 31, 2010 and 2009,AIG recognized $11 million and $(10) million, respectively, of interest (net of the federal benefit) and penalties inthe Consolidated Statement of Income (Loss).
AIG regularly evaluates adjustments proposed by taxing authorities. At March 31, 2010, such proposedadjustments would not have resulted in a material change to AIG’s consolidated financial condition, although it ispossible that the effect could be material to AIG’s consolidated results of operations for an individual reportingperiod. Although it is reasonably possible that a change in the balance of unrecognized tax benefits may occurwithin the next twelve months, at this time it is not possible to estimate the range of the change due to theuncertainty of the potential outcomes.
15. Information Provided in Connection With Outstanding Debt
The following condensed consolidating financial statements reflect the results of AIG Life Holdings (US), Inc.(AIGLH), formerly known as American General Corporation, a holding company and a wholly owned subsidiaryof AIG. AIG provides a full and unconditional guarantee of all outstanding debt of AIGLH.
81

American International Group, Inc., and Subsidiaries
NOTES TO CONSOLIDATED FINANCIAL STATEMENTS (unaudited)
Condensed Consolidating Balance Sheet
AmericanInternational Reclassifications
Group, Inc. Other and Consolidated(in millions) (As Guarantor) AIGLH(a) Subsidiaries Eliminations AIG
March 31, 2010Assets:
Investments(a) $ 9,271 $ - $584,700 $(144,924) $449,047Cash 360 - 1,773 - 2,133Loans to subsidiaries(b) 74,191 - (74,191) - -Debt issuance costs, including prepaid commitment asset of $6,460 6,739 - 212 - 6,951Investment in consolidated subsidiaries(b) 76,020 29,941 (1,950) (104,011) -Other assets, including current and deferred income taxes 11,035 2,650 138,630 (3,189) 149,126Assets of businesses held for sale - - 253,301 3,139 256,440
Total assets $177,616 $32,591 $902,475 $(248,985) $863,697
Liabilities:Insurance liabilities $ - $ - $316,096 $ (368) $315,728Federal Reserve Bank of New York Commercial Paper Funding Facility - - 2,285 - 2,285Federal Reserve Bank of New York credit facility 27,400 - - - 27,400Other debt 43,378 2,137 208,608 (144,379) 109,744Other liabilities, including intercompany balances(a)(c) 31,837 4,227 51,843 (863) 87,044Liabilities of businesses held for sale - - 217,801 36 217,837
Total liabilities 102,615 6,364 796,633 (145,574) 760,038
Redeemable noncontrolling interests in partially owned consolidatedsubsidiaries (including $1,270 associated with businesses held for sale in2010) - - 1,282 658 1,940
Total AIG shareholders’ equity 75,001 26,227 103,036 (129,263) 75,001Noncontrolling interests:
Noncontrolling nonvoting, callable, junior and senior preferred interestheld by Federal Reserve Bank of New York - - - 25,059 25,059
Other (including $374 million associated with businesses held for sale in2010) - - 1,524 135 1,659
Total noncontrolling interests - - 1,524 25,194 26,718
Total equity 75,001 26,227 104,560 (104,069) 101,719
Total liabilities and equity $177,616 $32,591 $902,475 $(248,985) $863,697
December 31, 2009Assets:
Investments(a) $ 10,702 $ - $736,977 $(146,514) $601,165Cash 57 2 4,341 - 4,400Loans to subsidiaries(b) 72,926 - (72,926) - -Debt issuance costs, including prepaid commitment asset of $7,099 7,383 - 159 - 7,542Investment in consolidated subsidiaries(b) 71,419 28,580 (980) (99,019) -Other assets, including current and deferred income taxes 10,986 2,618 164,670 (175) 178,099Assets of businesses held for sale - - 56,379 - 56,379
Total assets $173,473 $31,200 $888,620 $(245,708) $847,585
Liabilities:Insurance liabilities $ - $ - $461,706 $ (409) $461,297Federal Reserve Bank of New York Commercial Paper Funding Facility - - 4,739 - 4,739Federal Reserve Bank of New York credit facility 23,435 - - - 23,435Other debt 45,436 2,097 210,512 (144,747) 113,298Other liabilities, including intercompany balances(a)(c) 34,778 4,209 60,135 (1,940) 97,182Liabilities of businesses held for sale - - 48,599 - 48,599
Total liabilities 103,649 6,306 785,691 (147,096) 748,550
Redeemable noncontrolling interests in partially owned consolidatedsubsidiaries - - 177 782 959
Total AIG shareholders’ equity 69,824 24,894 83,303 (108,197) 69,824Noncontrolling interests:
Noncontrolling nonvoting, callable, junior and senior preferred interestheld by Federal Reserve Bank of New York - - 15,596 8,944 24,540
Other (including $2.2 billion associated with businesses held for sale in 2009) - - 3,853 (141) 3,712
Total noncontrolling interests - - 19,449 8,803 28,252
Total equity 69,824 24,894 102,752 (99,394) 98,076
Total liabilities and equity $173,473 $31,200 $888,620 $(245,708) $847,585
(a) Includes intercompany derivative positions, which are reported at fair value before credit valuation adjustment.(b) Eliminated in consolidation.(c) For March 31, 2010 and December 31, 2009, includes intercompany tax payable of $28.7 billion and $28.7 billion, respectively, for American International
Group, Inc. (As Guarantor) and intercompany tax receivable of $60 million and $45 million, respectively, for AIGLH.
82
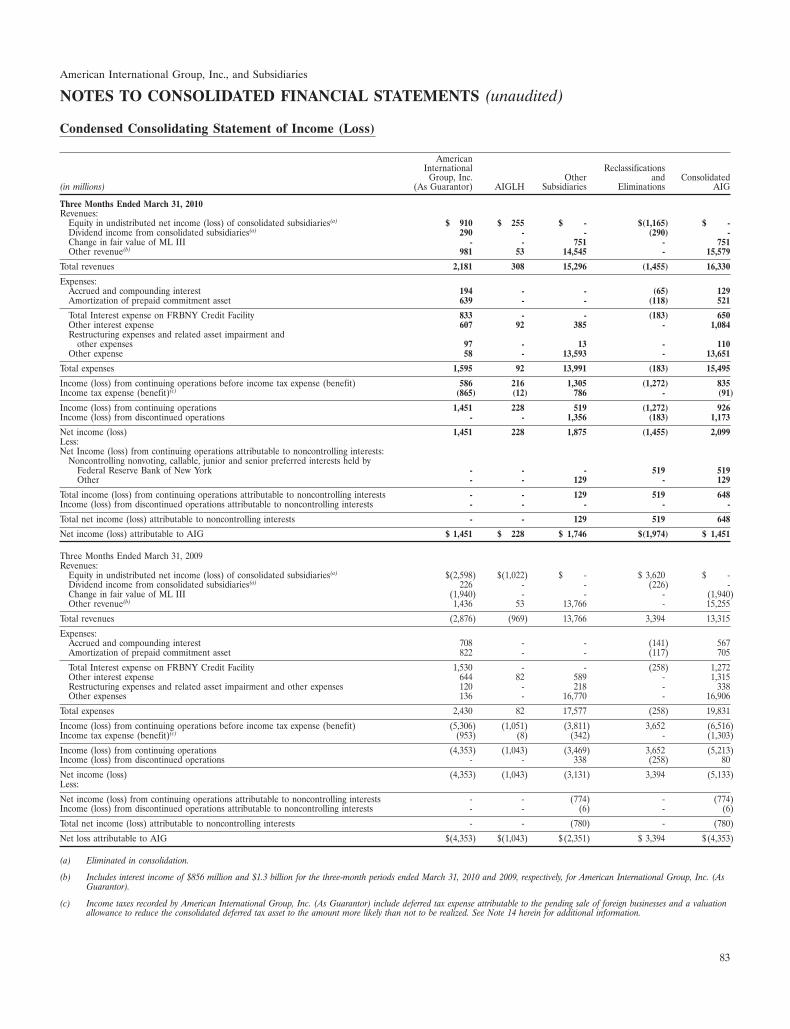
American International Group, Inc., and Subsidiaries
NOTES TO CONSOLIDATED FINANCIAL STATEMENTS (unaudited)
Condensed Consolidating Statement of Income (Loss)
AmericanInternational Reclassifications
Group, Inc. Other and Consolidated(in millions) (As Guarantor) AIGLH Subsidiaries Eliminations AIG
Three Months Ended March 31, 2010Revenues:
Equity in undistributed net income (loss) of consolidated subsidiaries(a) $ 910 $ 255 $ - $(1,165) $ -Dividend income from consolidated subsidiaries(a) 290 - - (290) -Change in fair value of ML III - - 751 - 751Other revenue(b) 981 53 14,545 - 15,579
Total revenues 2,181 308 15,296 (1,455) 16,330
Expenses:Accrued and compounding interest 194 - - (65) 129Amortization of prepaid commitment asset 639 - - (118) 521
Total Interest expense on FRBNY Credit Facility 833 - - (183) 650Other interest expense 607 92 385 - 1,084Restructuring expenses and related asset impairment and
other expenses 97 - 13 - 110Other expense 58 - 13,593 - 13,651
Total expenses 1,595 92 13,991 (183) 15,495
Income (loss) from continuing operations before income tax expense (benefit) 586 216 1,305 (1,272) 835Income tax expense (benefit)(c) (865) (12) 786 - (91)
Income (loss) from continuing operations 1,451 228 519 (1,272) 926Income (loss) from discontinued operations - - 1,356 (183) 1,173
Net income (loss) 1,451 228 1,875 (1,455) 2,099Less:Net Income (loss) from continuing operations attributable to noncontrolling interests:
Noncontrolling nonvoting, callable, junior and senior preferred interests held byFederal Reserve Bank of New York - - - 519 519Other - - 129 - 129
Total income (loss) from continuing operations attributable to noncontrolling interests - - 129 519 648Income (loss) from discontinued operations attributable to noncontrolling interests - - - - -
Total net income (loss) attributable to noncontrolling interests - - 129 519 648
Net income (loss) attributable to AIG $ 1,451 $ 228 $ 1,746 $(1,974) $ 1,451
Three Months Ended March 31, 2009Revenues:
Equity in undistributed net income (loss) of consolidated subsidiaries(a) $(2,598) $(1,022) $ - $ 3,620 $ -Dividend income from consolidated subsidiaries(a) 226 - - (226) -Change in fair value of ML III (1,940) - - - (1,940)Other revenue(b) 1,436 53 13,766 - 15,255
Total revenues (2,876) (969) 13,766 3,394 13,315
Expenses:Accrued and compounding interest 708 - - (141) 567Amortization of prepaid commitment asset 822 - - (117) 705
Total Interest expense on FRBNY Credit Facility 1,530 - - (258) 1,272Other interest expense 644 82 589 - 1,315Restructuring expenses and related asset impairment and other expenses 120 - 218 - 338Other expenses 136 - 16,770 - 16,906
Total expenses 2,430 82 17,577 (258) 19,831
Income (loss) from continuing operations before income tax expense (benefit) (5,306) (1,051) (3,811) 3,652 (6,516)Income tax expense (benefit)(c) (953) (8) (342) - (1,303)
Income (loss) from continuing operations (4,353) (1,043) (3,469) 3,652 (5,213)Income (loss) from discontinued operations - - 338 (258) 80
Net income (loss) (4,353) (1,043) (3,131) 3,394 (5,133)Less:
Net income (loss) from continuing operations attributable to noncontrolling interests - - (774) - (774)Income (loss) from discontinued operations attributable to noncontrolling interests - - (6) - (6)
Total net income (loss) attributable to noncontrolling interests - - (780) - (780)
Net loss attributable to AIG $(4,353) $(1,043) $(2,351) $ 3,394 $(4,353)
(a) Eliminated in consolidation.
(b) Includes interest income of $856 million and $1.3 billion for the three-month periods ended March 31, 2010 and 2009, respectively, for American International Group, Inc. (AsGuarantor).
(c) Income taxes recorded by American International Group, Inc. (As Guarantor) include deferred tax expense attributable to the pending sale of foreign businesses and a valuationallowance to reduce the consolidated deferred tax asset to the amount more likely than not to be realized. See Note 14 herein for additional information.
83
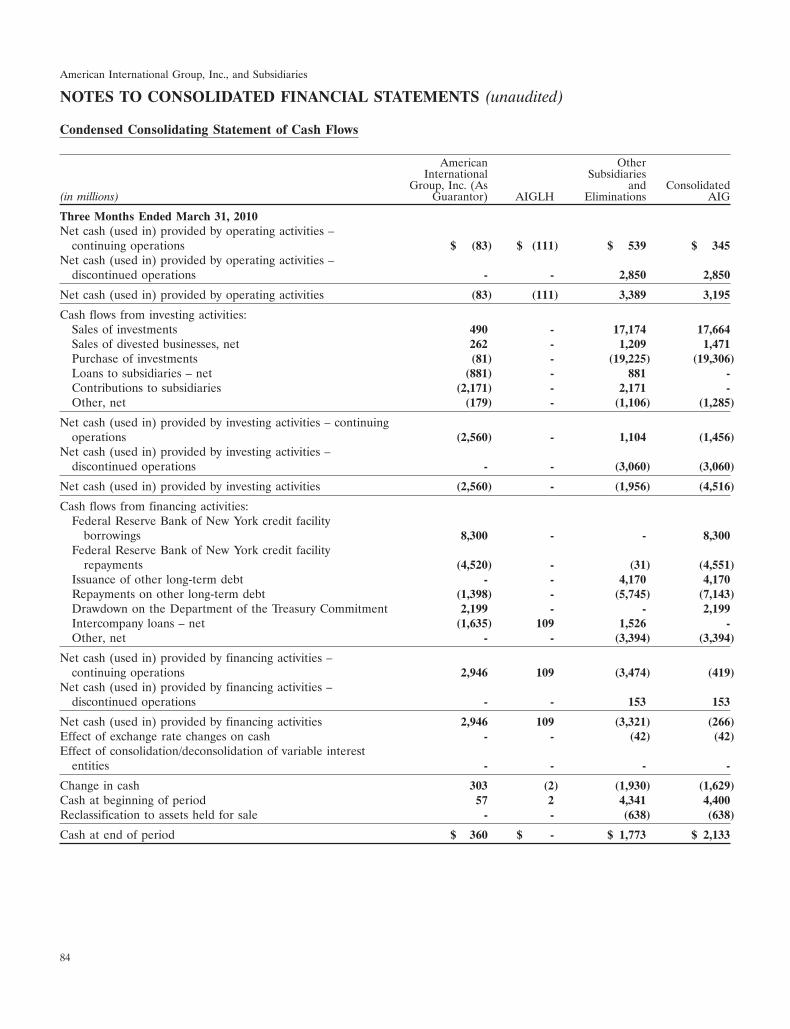
American International Group, Inc., and Subsidiaries
NOTES TO CONSOLIDATED FINANCIAL STATEMENTS (unaudited)
Condensed Consolidating Statement of Cash Flows
American OtherInternational Subsidiaries
Group, Inc. (As and Consolidated(in millions) Guarantor) AIGLH Eliminations AIG
Three Months Ended March 31, 2010Net cash (used in) provided by operating activities –
continuing operations $ (83) $ (111) $ 539 $ 345Net cash (used in) provided by operating activities –
discontinued operations - - 2,850 2,850
Net cash (used in) provided by operating activities (83) (111) 3,389 3,195
Cash flows from investing activities:Sales of investments 490 - 17,174 17,664Sales of divested businesses, net 262 - 1,209 1,471Purchase of investments (81) - (19,225) (19,306)Loans to subsidiaries – net (881) - 881 -Contributions to subsidiaries (2,171) - 2,171 -Other, net (179) - (1,106) (1,285)
Net cash (used in) provided by investing activities – continuingoperations (2,560) - 1,104 (1,456)
Net cash (used in) provided by investing activities –discontinued operations - - (3,060) (3,060)
Net cash (used in) provided by investing activities (2,560) - (1,956) (4,516)
Cash flows from financing activities:Federal Reserve Bank of New York credit facility
borrowings 8,300 - - 8,300Federal Reserve Bank of New York credit facility
repayments (4,520) - (31) (4,551)Issuance of other long-term debt - - 4,170 4,170Repayments on other long-term debt (1,398) - (5,745) (7,143)Drawdown on the Department of the Treasury Commitment 2,199 - - 2,199Intercompany loans – net (1,635) 109 1,526 -Other, net - - (3,394) (3,394)
Net cash (used in) provided by financing activities –continuing operations 2,946 109 (3,474) (419)
Net cash (used in) provided by financing activities –discontinued operations - - 153 153
Net cash (used in) provided by financing activities 2,946 109 (3,321) (266)Effect of exchange rate changes on cash - - (42) (42)Effect of consolidation/deconsolidation of variable interest
entities - - - -
Change in cash 303 (2) (1,930) (1,629)Cash at beginning of period 57 2 4,341 4,400Reclassification to assets held for sale - - (638) (638)
Cash at end of period $ 360 $ - $ 1,773 $ 2,133
84
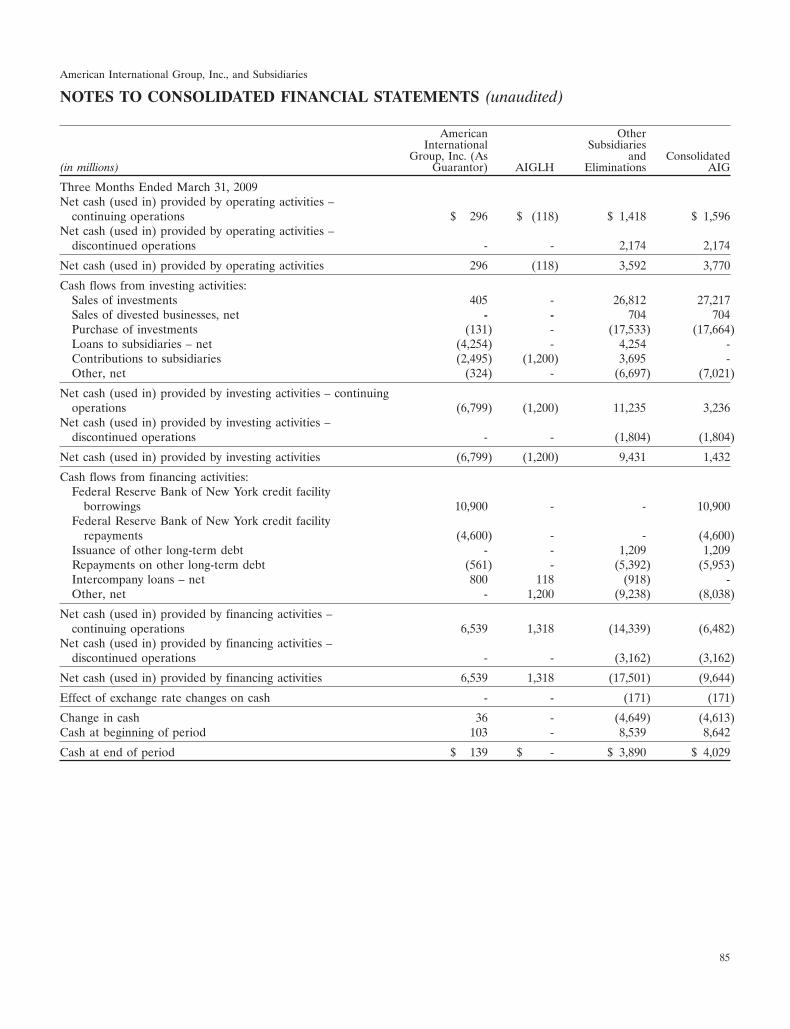
American International Group, Inc., and Subsidiaries
NOTES TO CONSOLIDATED FINANCIAL STATEMENTS (unaudited)
American OtherInternational Subsidiaries
Group, Inc. (As and Consolidated(in millions) Guarantor) AIGLH Eliminations AIG
Three Months Ended March 31, 2009Net cash (used in) provided by operating activities –
continuing operations $ 296 $ (118) $ 1,418 $ 1,596Net cash (used in) provided by operating activities –
discontinued operations - - 2,174 2,174
Net cash (used in) provided by operating activities 296 (118) 3,592 3,770
Cash flows from investing activities:Sales of investments 405 - 26,812 27,217Sales of divested businesses, net - - 704 704Purchase of investments (131) - (17,533) (17,664)Loans to subsidiaries – net (4,254) - 4,254 -Contributions to subsidiaries (2,495) (1,200) 3,695 -Other, net (324) - (6,697) (7,021)
Net cash (used in) provided by investing activities – continuingoperations (6,799) (1,200) 11,235 3,236
Net cash (used in) provided by investing activities –discontinued operations - - (1,804) (1,804)
Net cash (used in) provided by investing activities (6,799) (1,200) 9,431 1,432
Cash flows from financing activities:Federal Reserve Bank of New York credit facility
borrowings 10,900 - - 10,900Federal Reserve Bank of New York credit facility
repayments (4,600) - - (4,600)Issuance of other long-term debt - - 1,209 1,209Repayments on other long-term debt (561) - (5,392) (5,953)Intercompany loans – net 800 118 (918) -Other, net - 1,200 (9,238) (8,038)
Net cash (used in) provided by financing activities –continuing operations 6,539 1,318 (14,339) (6,482)
Net cash (used in) provided by financing activities –discontinued operations - - (3,162) (3,162)
Net cash (used in) provided by financing activities 6,539 1,318 (17,501) (9,644)
Effect of exchange rate changes on cash - - (171) (171)
Change in cash 36 - (4,649) (4,613)Cash at beginning of period 103 - 8,539 8,642
Cash at end of period $ 139 $ - $ 3,890 $ 4,029
85
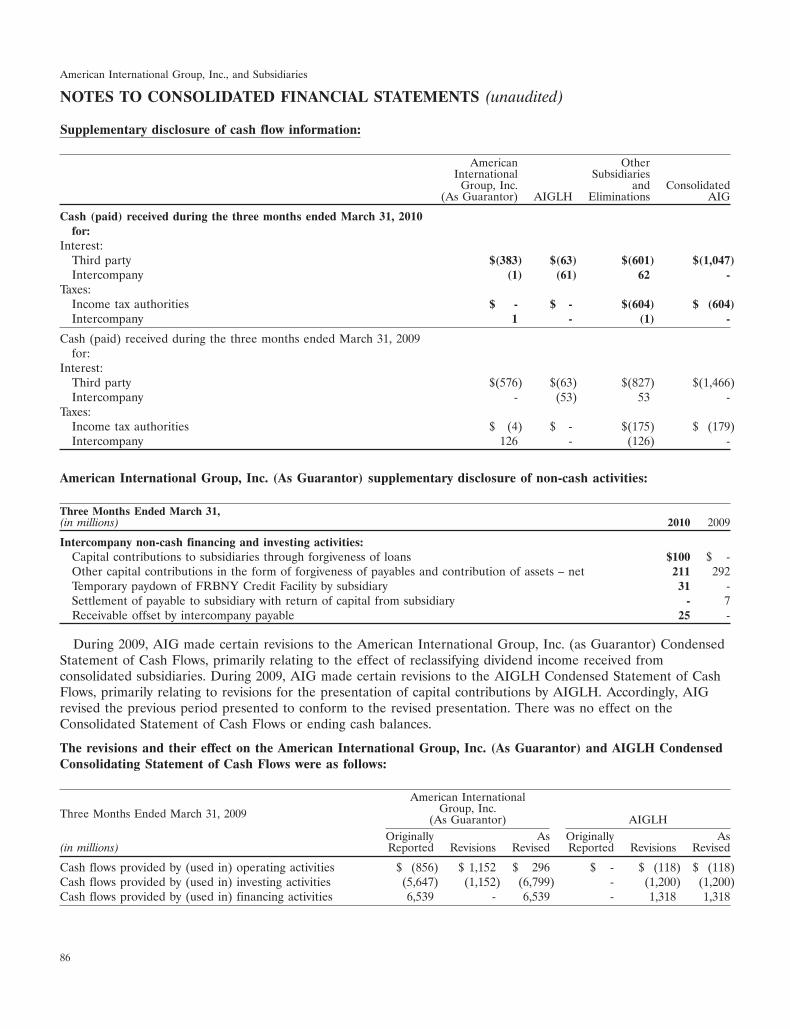
American International Group, Inc., and Subsidiaries
NOTES TO CONSOLIDATED FINANCIAL STATEMENTS (unaudited)
Supplementary disclosure of cash flow information:
American OtherInternational Subsidiaries
Group, Inc. and Consolidated(As Guarantor) AIGLH Eliminations AIG
Cash (paid) received during the three months ended March 31, 2010for:
Interest:Third party $(383) $(63) $(601) $(1,047)Intercompany (1) (61) 62 -
Taxes:Income tax authorities $ - $ - $(604) $ (604)Intercompany 1 - (1) -
Cash (paid) received during the three months ended March 31, 2009for:
Interest:Third party $(576) $(63) $(827) $(1,466)Intercompany - (53) 53 -
Taxes:Income tax authorities $ (4) $ - $(175) $ (179)Intercompany 126 - (126) -
American International Group, Inc. (As Guarantor) supplementary disclosure of non-cash activities:
Three Months Ended March 31,(in millions) 2010 2009
Intercompany non-cash financing and investing activities:Capital contributions to subsidiaries through forgiveness of loans $100 $ -Other capital contributions in the form of forgiveness of payables and contribution of assets – net 211 292Temporary paydown of FRBNY Credit Facility by subsidiary 31 -Settlement of payable to subsidiary with return of capital from subsidiary - 7Receivable offset by intercompany payable 25 -
During 2009, AIG made certain revisions to the American International Group, Inc. (as Guarantor) CondensedStatement of Cash Flows, primarily relating to the effect of reclassifying dividend income received fromconsolidated subsidiaries. During 2009, AIG made certain revisions to the AIGLH Condensed Statement of CashFlows, primarily relating to revisions for the presentation of capital contributions by AIGLH. Accordingly, AIGrevised the previous period presented to conform to the revised presentation. There was no effect on theConsolidated Statement of Cash Flows or ending cash balances.
The revisions and their effect on the American International Group, Inc. (As Guarantor) and AIGLH CondensedConsolidating Statement of Cash Flows were as follows:
American InternationalGroup, Inc.Three Months Ended March 31, 2009 (As Guarantor) AIGLH
Originally As Originally As(in millions) Reported Revisions Revised Reported Revisions Revised
Cash flows provided by (used in) operating activities $ (856) $ 1,152 $ 296 $ - $ (118) $ (118)Cash flows provided by (used in) investing activities (5,647) (1,152) (6,799) - (1,200) (1,200)Cash flows provided by (used in) financing activities 6,539 - 6,539 - 1,318 1,318
86
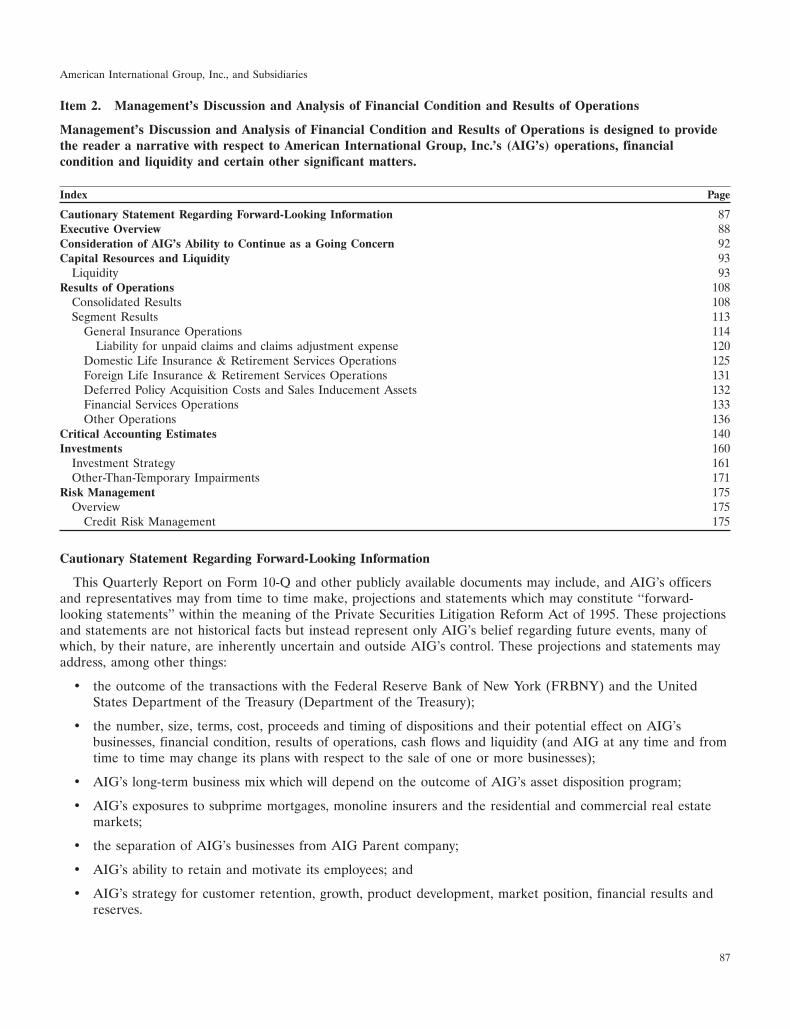
American International Group, Inc., and Subsidiaries
Item 2. Management’s Discussion and Analysis of Financial Condition and Results of Operations
Management’s Discussion and Analysis of Financial Condition and Results of Operations is designed to providethe reader a narrative with respect to American International Group, Inc.’s (AIG’s) operations, financialcondition and liquidity and certain other significant matters.
Index Page
Cautionary Statement Regarding Forward-Looking Information 87Executive Overview 88Consideration of AIG’s Ability to Continue as a Going Concern 92Capital Resources and Liquidity 93
Liquidity 93Results of Operations 108
Consolidated Results 108Segment Results 113
General Insurance Operations 114Liability for unpaid claims and claims adjustment expense 120
Domestic Life Insurance & Retirement Services Operations 125Foreign Life Insurance & Retirement Services Operations 131Deferred Policy Acquisition Costs and Sales Inducement Assets 132Financial Services Operations 133Other Operations 136
Critical Accounting Estimates 140Investments 160
Investment Strategy 161Other-Than-Temporary Impairments 171
Risk Management 175Overview 175
Credit Risk Management 175
Cautionary Statement Regarding Forward-Looking Information
This Quarterly Report on Form 10-Q and other publicly available documents may include, and AIG’s officersand representatives may from time to time make, projections and statements which may constitute ‘‘forward-looking statements’’ within the meaning of the Private Securities Litigation Reform Act of 1995. These projectionsand statements are not historical facts but instead represent only AIG’s belief regarding future events, many ofwhich, by their nature, are inherently uncertain and outside AIG’s control. These projections and statements mayaddress, among other things:
• the outcome of the transactions with the Federal Reserve Bank of New York (FRBNY) and the UnitedStates Department of the Treasury (Department of the Treasury);
• the number, size, terms, cost, proceeds and timing of dispositions and their potential effect on AIG’sbusinesses, financial condition, results of operations, cash flows and liquidity (and AIG at any time and fromtime to time may change its plans with respect to the sale of one or more businesses);
• AIG’s long-term business mix which will depend on the outcome of AIG’s asset disposition program;
• AIG’s exposures to subprime mortgages, monoline insurers and the residential and commercial real estatemarkets;
• the separation of AIG’s businesses from AIG Parent company;
• AIG’s ability to retain and motivate its employees; and
• AIG’s strategy for customer retention, growth, product development, market position, financial results andreserves.
87
American International Group, Inc., and Subsidiaries
It is possible that AIG’s actual results and financial condition will differ, possibly materially, from theanticipated results and financial condition indicated in these projections and statements. Factors that could causeAIG’s actual results to differ, possibly materially, from those in the specific projections and statements include:
• a failure to close transactions contemplated in AIG’s restructuring plan;
• developments in global credit markets; and
• such other factors as discussed throughout this Management’s Discussion and Analysis of FinancialCondition and Results of Operations and in Part I, Item 1A. Risk Factors of the Annual Report onForm 10-K for the year ended December 31, 2009 (2009 Annual Report on Form 10-K).
AIG is not under any obligation (and expressly disclaims any obligation) to update or alter any projection orother statement, whether written or oral, that may be made from time to time, whether as a result of newinformation, future events or otherwise.
In addition to reviewing AIG’s results for the three-month period ended March 31, 2010, this Management’sDiscussion and Analysis of Financial Condition and Results of Operations (MD&A) supplements and updates theinformation and discussion included in the 2009 Annual Report on Form 10-K, to reflect developments in oraffecting AIG’s business to date during 2010.
Throughout this Management’s Discussion and Analysis of Financial Condition and Results of Operations, AIGpresents its operations in the way it believes will be most meaningful, as well as most transparent. Certain of themeasurements used by AIG management are ‘‘non-GAAP financial measures’’ under SEC rules and regulations.Underwriting profit (loss) is utilized to report results for AIG’s General Insurance operations and pre-tax income(loss) before net realized capital gains (losses) is utilized to report results for AIG’s life insurance and retirementservices operations as these measures enhance the understanding of the underlying profitability of the ongoingoperations of these businesses and allow for more meaningful comparisons with AIG’s insurance competitors.
AIG has also incorporated into this discussion a number of cross-references to additional information includedthroughout this Quarterly Report on Form 10-Q and in the 2009 Annual Report on Form 10-K to assist readersseeking additional information related to a particular subject.
Executive Overview
AIG reports the results of its operations through four reportable segments: General Insurance, Domestic LifeInsurance & Retirement Services, Foreign Life Insurance & Retirement Services, and Financial Services.
• General Insurance — branded as Chartis in 2009, is comprised of multiple line companies writingsubstantially all lines of property and casualty insurance and various personal lines both domestically andabroad.
• Domestic Life Insurance & Retirement Services — branded as SunAmerica Financial Group in 2009. AIG’sDomestic Life Insurance businesses offer a broad range of protection products, including individual term anduniversal life insurance, and group life and health products. In addition, Domestic Life Insurance offers avariety of payout annuities, which include single premium immediate annuities, structured settlements andterminal funding annuities. Domestic Retirement Services businesses offer group retirement products andindividual fixed and variable annuities. Certain previously acquired closed blocks and other fixed andvariable annuity blocks that have been discontinued are reported as ‘‘runoff’’ annuities. Domestic RetirementServices also maintains a runoff block of Guaranteed Investment Contracts (GICs) that were written in (orissued to) the institutional market place prior to 2006.
• Foreign Life Insurance & Retirement Services — provides individual insurance and investment-orientedproducts such as term and whole life, endowments, term and whole life medical, cancer, fixed annuities andgroup products including life, medical and pension. Following the classification of AIA Group Limited(AIA), American Life Insurance Company (ALICO), and Nan Shan Life Insurance Company, Ltd. (NanShan) as discontinued operations (see Note 3 to the Consolidated Financial Statements) and the
88
American International Group, Inc., and Subsidiaries
reclassification of certain immaterial non-core entities to Other non-core operations, AIG’s remainingForeign Life Insurance & Retirement Services operations are conducted in Japan through AIG Star LifeInsurance Co. Ltd and AIG Edison Life Insurance Company.
• Financial Services — engages in diversified activities, including commercial aircraft and equipment leasing,capital markets operations, consumer finance and insurance premium financing, both in the United Statesand abroad.
Priorities for 2010
AIG is focused on the following priorities for 2010:
• continuing the stabilization and strengthening of AIG’s businesses;
• realizing additional progress in restructuring and asset disposition initiatives to enable repayment of amountsoutstanding under the FRBNY credit facility (the FRBNY Credit Facility) provided by the FRBNY underthe Credit Agreement, dated as of September 22, 2008 (as amended, the FRBNY Credit Agreement),between AIG and the FRBNY;
• closing the pending sales transactions for AIA, ALICO and Nan Shan and implementing plans to monetizesecurities expected to be received upon the AIA and ALICO closings;
• beginning to address its highly leveraged capital structure;
• continuing the wind-down of AIG’s exposure to certain financial products and derivatives trading activities;and
• continuing to address the long-term financing needs of International Lease Finance Corporation (ILFC) andAmerican General Finance, Inc. (AGF).
2010 Financial Overview
The continued improvement in the financial markets contributed significantly to AIG’s income from continuingoperations before income taxes, which amounted to $835 million in the first quarter of 2010 compared to a loss of$6.5 billion in the same period of 2009, as evidenced by the following:
• growth in net investment income primarily related to gains on AIG’s interests in Maiden Lane II andMaiden Lane III which totaled $911 million in the first quarter of 2010 compared to losses of $2.2 billion inthe same period of 2009, and increased income from partnership investments reflecting improvement in theequity markets;
• a decline in other-than-temporary impairments on available for sale securities due to the improved marketconditions. The 2009 period included non-credit impairments (i.e., severity losses) that are no longerrequired for fixed maturity securities upon adoption of a new other-than-temporary impairments accountingstandard commencing in the second quarter of 2009. See Note 6 to the Consolidated Financial Statements;and Investments — Evaluating Investments for Other-Than-Temporary Impairments for more information onthis accounting standard;
• a reduction in losses for Capital Markets as lower unwind costs and a decline in Unrealized marketvaluation losses related to AIGFP’s super senior credit default swap portfolio more than offset a decline innet credit valuation adjustment gains on AIGFP’s assets and liabilities; and
• A significant improvement in earnings for the Mortgage Guaranty business.
Negatively impacting first quarter 2010 results were $481 million of catastrophe losses in General Insuranceprimarily related to the Chile earthquake, U.S. wind storms and Madeira (Portugal) floods.
89
American International Group, Inc., and Subsidiaries
2010 Business Outlook
The following discussion supplements and updates the Business Outlook contained in AIG’s 2009 AnnualReport on Form 10-K.
General Insurance
On March 31, 2010, AIG, through a Chartis International subsidiary, purchased additional voting shares in FujiFire & Marine Insurance Company Limited (Fuji), a publicly traded Japanese insurance company with generalinsurance and some life operations. Fuji’s financial information is reported on a one-quarter lag. As a result, Fuji’sresults will be consolidated beginning in the third quarter of 2010, and will be reported in the Foreign GeneralInsurance operating segment. Further, AIG has not completed the determination of the fair values of the assetsacquired and the liabilities assumed and, as a result, recorded an unallocated purchase price liability. Upon finaldetermination of fair values, AIG may recognize a bargain purchase gain, which could be substantial. See Note 4to the Consolidated Financial Statements for pro forma results and additional information about the terms of theacquisition.
On April 20, 2010, an explosion on the Deepwater Horizon offshore drilling rig, operating in the Gulf ofMexico off the coast of Louisiana, resulted in a fire that sank the rig and caused a massive-scale oil spill. AIGestimates that its exposure to property loss on this event was approximately $20 million, which has been paid. Itwill not be possible to estimate the amount of casualty loss associated with this event, if any, until thedetermination of the cause and responsibility for the explosion and resulting oil spill and the assessment ofdamages resulting from the oil spill, as well as other factors, have been resolved. Therefore, although AIG cannotcurrently quantify its ultimate liabilities arising from this event, it is possible that such liabilities could have amaterial adverse effect on AIG’s consolidated results of operations or consolidated cash flows for an individualreporting period.
Divestitures
In connection with the announced sale of ALICO on March 7, 2010 and management’s decision that ALICOmet the held-for-sale criteria on March 31, 2010, total goodwill of $4.6 billion associated with the Foreign LifeInsurance & Retirement Services — Japan & Other reporting unit was allocated among ALICO and the Japan &Other businesses to be retained based on their relative fair values as of March 31, 2010. This resulted in$3.3 billion and $1.3 billion of goodwill being allocated to ALICO and the retained businesses, respectively. Futurechanges in any of the assumptions used to measure the fair value of the ALICO reporting unit could result in apotential impairment of the goodwill allocated to ALICO of up to $3.3 billion, which would be reported inIncome (loss) from discontinued operations on the Consolidated Statement of Income (Loss). AIG will continueto monitor overall competitive, business and economic conditions, and other events or circumstances, includingALICO’s operating results and the performance of MetLife, Inc.’s (MetLife) common stock, that might result inan impairment of goodwill in the future. See Critical Accounting Estimates — Goodwill Impairment for additionalinformation.
AIG and AIA are working closely with Prudential to complete the sale of AIA, which AIG expects will close in2010. Upon closing, AIG expects to realize a significant gain on the transaction, which will be reported in Income(loss) from discontinued operations on the Consolidated Statement of Income (Loss).
Mortgage Guaranty
The improvement in UGC’s results is primarily the result of lower levels of newly reported delinquencies inboth the first and second-lien products, higher cure rates on existing first-lien delinquent loans, the recognition ofstop loss limits on certain second-lien policies, increased rescission activity on domestic first- and second-lienclaims and increased efforts to modify payment plans for currently delinquent loans. If these trends continue,UGC’s financial results may show improvement in future quarters. However, there remains considerableuncertainty about the longer term outlook for the housing market, U.S. unemployment rates, the impact of future
90
American International Group, Inc., and Subsidiaries
foreclosures on domestic home prices, loan modification programs and mortgage insurance rescission rates and theeffects, if any, these factors will have on UGC’s financial results.
Significant Events in 2010
AIA Sale
As of March 1, 2010, AIG and AIA Aurora LLC, a special purpose vehicle formed by AIG and the FRBNY(AIA Holdings), entered into a definitive agreement (the AIA Share Purchase Agreement) with Prudential plc(Prudential) and Prudential Group Limited (formerly known as Petrohue (UK) Investments Limited), for the saleof AIA to Prudential Group Limited for approximately $35.5 billion, consisting of $25 billion in cash,approximately $5.5 billion in face value of ordinary shares in the capital of Prudential Group Limited, $3 billion inface value of mandatory convertible securities of Prudential Group Limited, and $2 billion in face value ofpreferred stock of Prudential (or at Prudential’s election, Prudential Group Limited), subject to closingadjustments. The obligations of Prudential Group Limited under the AIA Share Purchase Agreement areguaranteed by Prudential.
The cash portion of the proceeds from the sale will be paid to the FRBNY to redeem preferred interests with aliquidation preference of approximately $16 billion plus accrued but unpaid preferred return held by the FRBNYin AIA Holdings, and unless otherwise agreed with the FRBNY, to repay approximately $9 billion under theFRBNY Credit Facility. AIG intends to monetize the $10.5 billion in face value of Prudential Group Limitedsecurities over time, subject to market conditions, following the lapse of agreed-upon minimum holding periods.Unless otherwise agreed with the FRBNY, net cash proceeds from the monetization of these securities will beused to repay any outstanding debt under the FRBNY Credit Facility.
ALICO Sale
As of March 7, 2010, AIG and ALICO Holdings LLC, a special purpose vehicle formed by AIG and theFRBNY (ALICO Holdings) entered into a definitive agreement (the ALICO Stock Purchase Agreement) withMetLife for the sale of ALICO by ALICO Holdings to MetLife, and the sale of Delaware American LifeInsurance Company by AIG to MetLife, for approximately $15.5 billion, consisting of $6.8 billion in cash and theremainder in equity securities of MetLife, subject to closing adjustments.
The cash portion of the proceeds from this sale will be paid to the FRBNY to reduce the liquidation preferenceof a portion of the preferred interests owned by the FRBNY in ALICO Holdings (together with the preferredinterests owned by the FRBNY in AIA Holdings, the Preferred Interests). Upon the closing of this sale toMetLife, ALICO Holdings will receive and pay to the FRBNY the cash consideration and will hold the remainderof the transaction consideration, consisting of 78,239,712 shares of MetLife common stock, 6,857,000 shares ofnewly issued participating preferred stock convertible into 68,570,000 shares of common stock upon the approvalof MetLife shareholders, and 40,000,000 equity units of MetLife with an aggregate stated value of $3 billion. AIGintends to monetize these MetLife securities over time, subject to market conditions, following the lapse ofagreed-upon minimum holding periods. Unless otherwise agreed with the FRBNY, net cash proceeds from themonetization of these securities will be used to reduce the liquidation preference of the Preferred Interests ownedby the FRBNY in ALICO Holdings and thereafter to repay any outstanding debt under the FRBNY CreditFacility.
Retained Financial Interest
In the case of the sales of AIA and ALICO, the value of the securities consideration is subject to fluctuationfrom the date of signing of the AIA Share Purchase Agreement or the ALICO Stock Purchase Agreement, as thecase may be, through closing of each sale until the ultimate monetization by AIG of the Prudential Group Limitedsecurities and the MetLife securities. These fluctuations will be influenced by market prices of Prudential GroupLimited securities and MetLife securities generally, and the market prices of Prudential Group Limited ordinaryshares and MetLife common stock in particular, which will rise and fall in response to various factors beyond thecontrol of AIG, including the business and financial performance of Prudential and MetLife. AIG is subject in
91
American International Group, Inc., and Subsidiaries
each case to agreed-upon minimum holding periods that also restrict AIG’s ability to enter into hedgingtransactions that might protect AIG against fluctuations in the value of the securities consideration. Theseminimum holding periods and hedging restrictions cannot be altered without the consent of Prudential or MetLife,as the case may be, so AIG will bear the risk of these market price fluctuations during the applicable holdingperiods. The amount of any gain or loss recognized by AIG upon each sale will depend upon the fair value of thesecurities consideration received as of closing and the proceeds received by AIG from the monetization of thesecurities. This may also result in AIG realizing ultimate cash proceeds from the monetization of the securitiesconsideration that is substantially less than what might be expected from the value of such consideration as of thedate of signing of the relevant purchase agreement. During the holding period, AIG will carry these securities asavailable-for-sale investments, with changes in the fair value of the securities recorded to Accumulated othercomprehensive income (loss).
For a discussion of risks surrounding the AIA and ALICO transactions, see Item 1A. — Risk Factors in thisQuarterly Report on Form 10-Q.
ILFC and AGF Liquidity
During the first four months of 2010, ILFC and AGF made substantial progress in addressing their liquidityneeds. During March and April of 2010, ILFC significantly increased its liquidity position through a combinationof new secured and unsecured debt issuances of approximately $4.0 billion and an extension of the maturity dateof $2.16 billion of its $2.5 billion revolving credit facility from October 2011 to October 2012. Availability of$550 million of the approximately $4.0 billion of debt issuances and the extension of the $2.16 billion revolvingcredit facility are subject to the satisfaction of certain collateralization milestones. In addition, in April 2010, ILFCsigned an agreement to sell 53 aircraft, with an aggregate book value of approximately $2.3 billion, which isexpected to generate approximately $2.0 billion in gross proceeds during 2010. As of March 31, 2010, none ofthese aircraft met the criteria to be recorded as held for sale. During March and April of 2010, AGF significantlyenhanced its liquidity position through the following actions: AGF received cash proceeds of more than$500 million from a $1.0 billion asset securitization in March 2010 and executed and drew down fully a $3.0 billionsecured term loan transaction in April 2010. AGF used a portion of the proceeds from these transactions, cash onhand and proceeds from AIG’s repayment of two demand promissory notes to repay all of its outstandingobligations under its $2.45 billion one-year term loans in March 2010 and its $2.125 billion five-year revolvingcredit facility in April 2010 (both of which were due in July 2010). See Capital Resources and Liquidity —Liquidity — Financial Services for a further discussion.
Sale of Interest in Transatlantic
On March 15, 2010, AIG closed a secondary public offering of 8,466,693 shares of Transatlantic Holdings, Inc.(Transatlantic) common stock owned by American Home Assurance Company, a subsidiary of AIG, for aggregategross proceeds of $452 million.
Consideration of AIG’s Ability to Continue as a Going Concern
In connection with the preparation of this Quarterly Report on Form 10-Q, management has assessed whetherAIG has the ability to continue as a going concern. In making this assessment, AIG has considered:
• The commitment of the U.S. government to continue to work with AIG to maintain its ability to meet itsobligations as they come due;
• AIG’s liquidity-related actions and plans to stabilize its businesses and repay the debt outstanding under theFRBNY Credit Facility;
• The additional capital provided or committed through the Department of the Treasury Commitment (asdefined below under Department of the Treasury Commitment);
• The provisions of the definitive agreements for the sales of AIA and ALICO;
92
American International Group, Inc., and Subsidiaries
• The level of AIG’s realized and unrealized losses and the negative impact of these losses in shareholders’equity and on the capital levels of AIG’s insurance subsidiaries;
• The continuing liquidity needs in certain of AIG’s businesses and AIG’s actions to address such needs; and
• The substantial risks to which AIG is subject.
In considering these items, management made significant judgments and estimates with respect to thepotentially adverse financial and liquidity effects of AIG’s risks and uncertainties. Management also assessed otheritems and risks arising in AIG’s businesses and made reasonable judgments and estimates with respect thereto.After consideration, management believes that it will have adequate liquidity to finance and operate AIG’sbusinesses and continue as a going concern for at least the next twelve months.
It is possible that the actual outcome of one or more of management’s plans could be materially different orthat one or more of management’s significant judgments or estimates about the potential effects of the risks anduncertainties could prove to be materially incorrect. If one or more of these possible outcomes is realized andthird party financing is not available, AIG may need additional U.S. government support to meet its obligations asthey come due. Under these adverse assumptions, if additional support is not available in such circumstances,there could exist substantial doubt about AIG’s ability to operate as a going concern.
See Note 1 to the Consolidated Financial Statements for additional discussion regarding going concernconsiderations.
Capital Resources and Liquidity
Liquidity
Overview
AIG manages liquidity at both the parent and subsidiary levels. AIG believes that it has sufficient liquidity tomeet its obligations for at least the next twelve months. AIG expects that dividends, distributions, and otherpayments from subsidiaries will support its liquidity needs; the FRBNY Credit Facility is also expected to continueto be a primary source of liquidity. In addition, the Department of the Treasury Commitment may also be used asa source of funding, primarily to support the capital needs of AIG’s insurance company subsidiaries. AIG expectsthat its primary uses of available cash will be debt service and subsidiary funding. Unless otherwise agreed withthe FRBNY, net proceeds from the sales of operations and assets are expected to be used to pay the PreferredInterests and to repay any outstanding debt under the FRBNY Credit Facility, after taking into account taxes,transaction expenses, settlement of intercompany loan facilities, and capital required to be retained for regulatoryor ratings purposes.
At March 31, 2010, remaining amounts available under the FRBNY Credit Facility and the Department of theTreasury Commitment were $12.5 billion and $22.3 billion, respectively, compared to $17.1 billion and$24.5 billion, respectively, at December 31, 2009.
Net borrowings under the FRBNY Credit Facility increased by approximately $1.5 billion from March 31, 2010to April 28, 2010. The proceeds were primarily used to repay $2.3 billion of commercial paper outstanding underthe FRBNY Commercial Paper Funding Facility (CPFF) for Curzon Funding LLC and Nightingale Finance LLC(Nightingale) on April 26, 2010.
93
American International Group, Inc., and Subsidiaries
FRBNY Credit Facility
The following table presents changes in net borrowings outstanding and the remaining available amount that canbe borrowed under the FRBNY Credit Facility:
Three Months Ended March 31, 2010(in millions)
Net borrowings outstanding, January 1, 2010 $ 17,900Loans to AIGFP for collateral postings, GIA and other maturities 700AIGFP repayments to AIG (454)Debt payments 1,615AIG Funding commercial paper maturities 2,000Dividends from subsidiaries (256)Return of deposit to AGF 1,550Net cash proceeds from asset sales applied as mandatory prepayments (844)Other borrowings and repayments, net (562)
Net borrowings outstanding, March 31, 2010 21,649Accrued compounding interest and fees inception through December 31, 2009 5,535Accrued compounding interest and fees January 1, 2010 through March 31, 2010* 216
Total balance outstanding, March 31, 2010 $ 27,400
Total FRBNY Credit Facility, January 1, 2010 $ 35,000Mandatory prepayments (844)
Total FRBNY Credit Facility, March 31, 2010 $ 34,156Less: borrowings outstanding, March 31, 2010 (21,649)
Remaining available amount, March 31, 2010 $ 12,507
* Excludes interest payable of $3 million at March 31, 2010, which was included in Other liabilities.
Department of the Treasury Commitment
On April 17, 2009, AIG entered into a Securities Purchase Agreement with the Department of the Treasury,pursuant to which (i) AIG issued to the Department of the Treasury (a) 300,000 shares of AIG Series F FixedRate Non-Cumulative Perpetual Preferred Stock, par value $5.00 per share (AIG Series F Preferred Stock), and(b) a warrant to purchase 150 shares of AIG Common Stock, par value $2.50 per share, and (ii) the Departmentof the Treasury agreed to provide up to $29.835 billion (Department of the Treasury Commitment) in exchangefor increases in the liquidation preference of the AIG Series F Preferred Stock. See Note 10 to the ConsolidatedFinancial Statements and Note 16 to the Consolidated Financial Statements in AIG’s 2009 Annual Report onForm 10-K for further discussion.
The following table presents changes in drawdowns and the remaining available amount under the Department ofthe Treasury Commitment:
Three Months Ended March 31, 2010(in millions)
Total drawdowns, January 1, 2010 $ 5,344Redemption and repurchase of securities held by insurance subsidiaries 2,148UGC related restructuring transactions 48Temporary repayment of FRBNY Credit Facility 3
Total drawdowns, March 31, 2010 $ 7,543
Total Department of the Treasury commitment, January 1, 2010 $29,835Less: drawdowns, March 31, 2010 (7,543)
Remaining available amount, March 31, 2010 $22,292
94
American International Group, Inc., and Subsidiaries
Additional details regarding liquidity sources are included in Liquidity of Parent and Subsidiaries below.
AIG’s Strategy for Stabilization and Repayment of its Obligations as They Come Due
Future Cash Requirements
AIG expects that the repayment of future debt maturities and the payment of the preferred returns andliquidation preference on the Preferred Interests will be its primary uses of available cash. Unless otherwiseagreed with the FRBNY, the net proceeds from the cash consideration and the monetization of the securitiesconsideration from the sales of AIA and ALICO will first be used to pay the Preferred Interests, and then torepay the FRBNY Credit Facility.
The following table summarizes the maturing debt at March 31, 2010 of AIG and its subsidiaries for the nextfour quarters:
Second Third Fourth FirstQuarter Quarter Quarter Quarter
(in millions) 2010 2010 2010 2011 Total
ILFC $1,485 $2,003 $2,501 $1,642 $ 7,631AGF 659 2,797 210 679 4,345AIG Matched Investment Program - 888 776 - 1,664AIGFP 600 270 269 189 1,328AIG - - 500 12 512Other 19 511 7 6 543
Total $2,763 $6,469 $4,263 $2,528 $16,023
AIG’s plans for meeting these maturing obligations are as follows:
• ILFC’s sources of liquidity available to meet these needs include existing cash, future cash flows fromoperations, debt issuances and aircraft sales (see Liquidity of Parent and Subsidiaries — FinancialServices — ILFC below). During March and April of 2010, ILFC significantly enhanced its liquidity positionthrough a combination of new secured and unsecured debt issuances of approximately $4.0 billion and anextension of the maturity date of $2.16 billion of its $2.5 billion revolving credit facility from October 2011to October 2012. Availability of $550 million of the approximate $4.0 billion of debt issuances and theextension of $2.16 billion of the revolving credit facility are subject to the satisfaction of certaincollateralization milestones. In addition, in April 2010, ILFC signed an agreement to sell 53 aircraft, with anaggregate book value of approximately $2.3 billion, which is expected to generate approximately $2.0 billionin gross proceeds during 2010. Based on this level of increased liquidity and expected future sources offunding, including future cash flows from operations and potential aircraft sales, AIG now expects that ILFCwill be able to meet its existing obligations as they become due for at least the next twelve months solelyfrom its own future cash flows. Therefore, while AIG has acknowledged its intent to support ILFC throughFebruary 28, 2011, at the current time AIG believes that any further extension of such support will not benecessary.
• AGF anticipates that its primary sources of liquidity will be customer receivable collections, additionalon-balance sheet securitizations, portfolio sales and borrowings (see Liquidity of Parent and Subsidiaries —Financial Services — AGF below). During March and April of 2010, AGF significantly enhanced its liquidityposition through the following actions: AGF received cash proceeds of more than $500 million from a$1.0 billion asset securitization in March 2010 and executed and fully drew down a $3.0 billion secured termloan transaction in April 2010. AGF used a portion of the proceeds from these transactions, cash on handand proceeds from AIG’s repayment of two demand promissory notes to repay all of its outstandingobligations under its $2.45 billion one-year term loans in March 2010 and its $2.125 billion five-yearrevolving credit facility in April 2010 (both of which were due in July 2010). Based on this level of increased
95
American International Group, Inc., and Subsidiaries
liquidity and expected future sources of funding, including future cash flows from operations, AIG nowexpects that AGF will be able to meet its existing obligations as they become due for at least the next twelvemonths solely from its own future cash flows. Therefore, while AIG has acknowledged its intent to supportAGF through February 28, 2011, at the current time AIG believes that any further extension of such supportwill not be necessary. AIG is continuing to explore strategic alternatives for AGF, including a potential saleof a majority interest.
• Debt maturities for the Matched Investment Program (MIP) are expected to be funded through cash flowsgenerated from invested assets, as well as the sale or financing of the asset portfolios in the program.However, mismatches in the timing of cash flows of the MIP, as well as any shortfalls due to impairments ofMIP assets, would need to be funded by AIG Parent. In addition, as a result of AIG’s restructuringactivities, AIG expects to utilize assets from its noncore businesses and subsidiaries to provide future cashflow enhancement and help the MIP meet its maturing debt obligations.
• Approximately $813 million of AIGFP’s debt maturities through March 31, 2011 are fully collateralized, withassets backing the corresponding liabilities; however, mismatches in the timing of cash inflows on the assetsand outflows with respect to the liabilities may require assets to be sold to satisfy maturing liabilities.Depending on market conditions and AIGFP’s ability to sell assets at that time, proceeds from sales may notbe sufficient to satisfy the full amount due on maturing liabilities. Any shortfalls would need to be funded byAIG Parent.
• AIG expects to meet its debt maturities primarily through borrowings under the FRBNY Credit Facility, anddividends, distributions, and other payments from subsidiaries. The Department of the Treasury Commitmentis primarily used for capital support of subsidiaries. In the future, AIG may need to provide additionalcapital support for its subsidiaries. AIG has developed certain plans, some of which have already beenimplemented, to provide stability to its businesses and to provide for the timely repayment of the FRBNYCredit Facility. In addition, certain of AIG’s outstanding financial derivative transactions could requirecollateral calls or termination payments based on a downgrade in AIG’s credit rating. See Note 8 to theConsolidated Financial Statements.
Sales of Other Businesses
Since September 2008 and through April 28, 2010, AIG entered into agreements to sell or completed the saleof operations and assets, excluding AIA, ALICO and assets held by AIG Financial Products Corp. and AIGTrading Group Inc. and their respective subsidiaries (collectively, AIGFP), that had aggregate assets and liabilitieswith carrying values of $95.5 billion and $77.5 billion, respectively, at March 31, 2010 or the date of sale. Of theseamounts, pending transactions with aggregate assets and liabilities of $54.7 billion and $49.2, respectively, atMarch 31, 2010 are expected to generate approximately $709 million of aggregate net cash proceeds that will beavailable to reduce the amount of the FRBNY Credit Facility, after taking into account taxes, transactionexpenses, settlement of intercompany loan facilities, and capital required to be retained for regulatory or ratingspurposes. Gains and losses recorded in connection with the dispositions of businesses include estimates that aresubject to subsequent adjustment. Based on the transactions closed to date, AIG does not believe that suchadjustments will be material to future consolidated results of operations or cash flows.
See Notes 1 and 3 to the Consolidated Financial Statements for additional information.
96
American International Group, Inc., and Subsidiaries
Liquidity of Parent and Subsidiaries
AIG Parent
The following table presents AIG Parent’s sources of liquidity:
As of(In millions) March 31, 2010 April 28, 2010
Available borrowing under the FRBNY Credit Facility $ 12,507 $ 11,007Cash and short-term investments 372 375Available capacity under the Department of the Treasury Commitment 22,292 22,292
Total $ 35,171 $ 33,674
AIG believes that it has sufficient liquidity at the AIG Parent level to meet its obligations through at least thenext twelve months. However, no assurance can be given that AIG’s cash needs will not exceed projectedamounts. Additional collateral calls, deterioration in investment portfolios affecting statutory surplus, highersurrenders of annuities and other policies, further downgrades in AIG’s credit ratings, catastrophic losses orreserve strengthening, or a further deterioration in the super senior credit default swap portfolio may result insignificant additional cash needs, or loss of some sources of liquidity, or both. Regulatory and other legalrestrictions could limit AIG’s ability to transfer funds freely, either to or from its subsidiaries.
Historically, AIG has depended on dividends, distributions, and other payments from subsidiaries to fundpayments on its obligations. In light of AIG’s current financial situation, certain of its regulated subsidiaries arerestricted from making dividend payments, or advancing funds, to AIG. As a result, AIG has also been dependenton the FRBNY as a primary source of liquidity, and on the Department of the Treasury Commitment to supportthe capital needs of AIG’s insurance company subsidiaries. In the first three months of 2010, AIG Parent collected$323 million in dividends and other payments from subsidiaries (primarily from insurance company subsidiaries),which included $250 million in dividends from Chartis U.S.
AIG’s primary uses of cash flow are for debt service and subsidiary funding. In the first three months of 2010,AIG Parent retired $850 million of debt and made interest payments totaling $345 million, excluding MIP andSeries AIGFP debt. AIG Parent made $2.2 billion in net capital contributions to subsidiaries in the three monthsended March 31, 2010, of which the majority was contributed to AIG Capital Corporation, enabling AIG CapitalCorporation to redeem its preferred securities held by a Chartis U.S. subsidiary. In addition, in March 2010, AIGParent repurchased AIG common stock from an insurance subsidiary and repaid $1.6 billion in loans to AGF.
At the current time, AIG Parent has no access to the commercial paper market, one of its traditional sourcesfor its short-term working capital needs. While no assurance can be given that AIG will be able to access itstraditional sources of long-term or short-term financing through the public debt markets again, AIG periodicallyevaluates its ability to access the capital markets.
General Insurance
AIG currently expects that its Chartis subsidiaries will be able to continue to meet their obligations as theycome due through cash from operations and, to the extent necessary, asset dispositions. One or more largecatastrophes, however, may require AIG to provide additional support to the affected General Insuranceoperations. In addition, further downgrades in AIG’s credit ratings could put pressure on the insurer financialstrength ratings of its subsidiaries. A downgrade in the insurer financial strength ratings of an insurance companysubsidiary could result in non-renewals or cancellations by policyholders and adversely affect the subsidiary’sability to meet its own obligations and require AIG to provide capital or liquidity support to the subsidiary.Increases in market interest rates may adversely affect the financial strength ratings of General Insurancesubsidiaries as rating agency capital models may reduce the amount of available capital relative to required capital.
Given the size and liquidity profile of AIG’s General Insurance investment portfolios, AIG believes thatdeviations from its projected claim experience do not constitute a significant liquidity risk. AIG’s asset/liability
97
American International Group, Inc., and Subsidiaries
management process takes into account the expected maturity of investments and the specific nature and riskprofile of liabilities. Historically, there has been no significant variation between the expected maturities of AIG’sGeneral Insurance investments and the payment of claims. See Management’s Discussion and Analysis ofFinancial Condition and Results of Operations — Investments for further information.
Domestic and Foreign Life Insurance & Retirement Services operations
The most significant potential liquidity needs of AIG’s Domestic and Foreign Life Insurance & RetirementServices companies are the funding of surrenders and withdrawals. A substantial increase in these needs couldplace stress on the liquidity of these companies. However, management considers the sources of liquidity forDomestic and Foreign Life Insurance & Retirement Services subsidiaries adequate to meet foreseeable liquidityneeds. These subsidiaries generally have been lengthening their maturity profile by purchasing investment gradefixed income securities, in order to reduce the high levels of liquidity which had been maintained during 2009.Given the size and liquidity profile of AIG’s Domestic and Foreign Life Insurance & Retirement Servicesinvestment portfolios, AIG believes that deviations from their projected claim experience do not constitute asignificant liquidity risk. A significant increase in policy surrenders and withdrawals, which could be triggered by avariety of factors, including AIG specific concerns, could result in a substantial liquidity strain. Other potentialevents causing a liquidity strain could include economic collapse of a nation or region significant to Domestic andForeign Life Insurance & Retirement Services operations, nationalization, catastrophic terrorist acts, pandemics orother economic or political upheaval.
AIG believes that its Domestic and Foreign Life Insurance & Retirement Services companies currently haveadequate capital to support their business plans. However, to the extent that these subsidiaries experiencesignificant future losses or declines in their investment portfolios, AIG may need to contribute capital to thesecompanies.
Financial Services
AIG’s major Financial Services operating subsidiaries consist of ILFC, AIGFP, AGF and AIG ConsumerFinance Group, Inc (AIGCFG). Traditional sources of funds to meet the liquidity needs of these operations aregenerally no longer available. These sources included issuances of guaranteed investment agreements (GIAs),issuance of long- and short-term debt, issuance of commercial paper, bank loans and bank credit facilities.However, during the three months ended March 31, 2010 and through April 30, 2010, ILFC and AGF madesignificant progress in addressing their foreseeable liquidity needs, as further described below. In addition,AIGCFG has been able to retain a significant portion of customer deposits, providing a measure of liquidity.
ILFC
During the first three months of 2010, ILFC refinanced five aircraft under its ECA Facility, borrowed$1.3 billion through secured financing arrangements and issued $2.0 billion senior notes as part of a privateplacement. Subsequent to March 31, 2010, ILFC issued an additional $750 million of senior notes under the sameindenture as that used in the private placement.
At March 31, 2010, ILFC had reached the maximum amount available for secured financing under its revolvingcredit facilities and term loans. The capacity was approximately $5.3 billion. In addition, ILFC also reached themaximum amount of secured financing available for ILFC and its restricted subsidiaries under its bond indentures.Subsequent to March 31, 2010, ILFC amended its bank facilities and term loans to increase its capacity to enterinto secured financings to 35 percent of its consolidated tangible net assets as defined in its revolving creditfacilities, which assets approximated $15.0 billion at March 31, 2010 (subject to certain prepayment requirements),and extended the maturity date of $2.16 billion of its $2.5 billion revolving credit facility from October 2011 toOctober 2012. This agreement is subject to the satisfaction of certain collateralization milestones.
In addition, in April 2010, ILFC signed an agreement to sell 53 aircraft, with an aggregate book value ofapproximately $2.3 billion, which is expected to generate approximately $2.0 billion in gross proceeds during 2010.
98
American International Group, Inc., and Subsidiaries
The sales of the individual aircraft are expected to be consummated during the remainder of 2010 and the relatedproceeds are receivable upon the completion of each individual sale. ILFC is currently pursuing additionalpotential aircraft sales. Proposed portfolios have been presented to potential buyers; some bids have been receivedand are being evaluated. In evaluating these bids, ILFC management is balancing the need for funds with thelong-term value of holding aircraft and other financing alternatives. Significant uncertainties currently exist aboutthe possibility of additional sales, including the aircraft comprising an actual sale portfolio, the sale price andwhether a sale agreement could be reached on acceptable terms.
Because the current market for aircraft is depressed due to the economic downturn and limited availability ofbuyer financing, it is likely that if additional aircraft are sold to meet liquidity needs, realized losses may beincurred. For the three months ended March 31, 2010, ILFC recorded asset impairment charges aggregating$347 million and operating lease related losses of $84 million on aircraft under contract to be sold.
AIG expects that ILFC’s existing cash balances, future cash flows from operations, including potential debtissuances and aircraft sales will be sufficient for ILFC to meet its existing obligations for at least the next twelvemonths.
ILFC Notes and Bonds Payable
As of March 31, 2010 notes and bonds aggregating $18.2 billion were outstanding with maturity dates rangingfrom 2010 to 2016. To the extent considered appropriate, ILFC may enter into swap transactions to manage itseffective borrowing rates with respect to these notes and bonds.
On October 13, 2009, ILFC entered into two term loan agreements (the Term Loans) with AIG Fundingcomprised of a new $2.0 billion credit agreement and a $1.7 billion amended and restated credit agreement. TheTerm Loans are secured by a portfolio of aircraft and all related equipment and leases. ILFC used the proceedsfrom the $2.0 billion loan to repay in full its obligations under its $2.0 billion revolving credit facility that maturedon October 15, 2009. The second credit agreement amended and restated the two demand note agreementsaggregating $1.7 billion that ILFC entered into in March 2009 with AIG Funding, including extending the maturitydate of such demand notes. Both Term Loans mature on September 13, 2013 and currently bear interest at3-month LIBOR plus 6.025 percent, of which 3.0 percent is permitted to be paid-in-kind and is added to theprincipal balance of the loans. The Term Loans are due in full at maturity with no scheduled amortization. OnDecember 4, 2009, the new $2.0 billion credit agreement was increased to $2.2 billion. The funds for the TermLoans were provided to AIG Funding through the FRBNY Credit Facility. As a condition of the FRBNYapproving the Term Loans, ILFC entered into agreements to guarantee the repayment of AIG’s obligations underthe FRBNY Credit Agreement up to an amount equal to the aggregate outstanding balance of the Term Loans.
ILFC ECA Facilities
ILFC has a $4.3 billion 1999 ECA Facility that was used in connection with the purchase of 62 Airbus aircraftdelivered through 2001. This facility is guaranteed by various European Export Credit Agencies. The interest ratevaries from 5.81 percent to 5.86 percent on these amortizing ten-year borrowings depending on the delivery dateof the aircraft. At March 31, 2010, ILFC had 27 loans with a remaining principal balance of $120 millionoutstanding under this facility. At March 31, 2010, the net book value of the related aircraft was $1.7 billion. Thedebt is collateralized by a pledge of shares of an ILFC subsidiary, which holds title to the aircraft financed underthe facility.
ILFC has a similarly structured 2004 ECA Facility, which was amended in May 2009 to allow ILFC to borrowup to a maximum of $4.6 billion to fund the purchase of Airbus aircraft delivered through June 30, 2010. Thefacility becomes available as the various European Export Credit Agencies provide their guarantees for aircraftbased on a forward-looking calendar, and the interest rate is determined through a bid process. The interest ratesare either LIBOR based with spreads ranging from (0.04) percent to 2.25 percent or at fixed rates ranging from4.20 percent to 4.71 percent. At March 31, 2010, ILFC had financed 71 aircraft using approximately $4.1 billionunder this facility and approximately $2.9 billion was outstanding. At March 31, 2010, the interest rate of the loans
99
American International Group, Inc., and Subsidiaries
outstanding ranged from 0.35 percent to 4.71 percent. The debt is collateralized by a pledge of shares of asubsidiary of ILFC, which holds title to the aircraft financed under the facility. At March 31, 2010, the net bookvalue of the related aircraft was approximately $4.2 billion. Borrowings with respect to these facilities are includedin ILFC’s notes and bonds payable in the table below.
Under its current long-term debt ratings, ILFC needs written consent from the security trustee of its 2004 ECAFacility before it can fund Airbus aircraft deliveries under the facility. As of April 30, 2010, ILFC hadapproximately $500 million available under the 2004 ECA Facility to finance its Airbus aircraft purchases throughJune 2010. ILFC refinanced five aircraft under the 2004 ECA Facility during the first three months of 2010.ILFC’s current credit ratings also require (i) the segregation of security deposits, maintenance reserves and rentalpayments received for aircraft funded under both its 1999 and 2004 ECA Facilities into separate accounts,controlled by the trustees of the 1999 and 2004 ECA Facilities; and (ii) the filings of individual mortgages on theaircraft funded under the facility in the respective local jurisdictions in which the aircraft is registered. AtMarch 31, 2010, ILFC had segregated security deposits, maintenance reserves and rental payments aggregating$350 million related to such aircraft. Segregated rental payments are used to pay principal and interest on theECA facilities as they become due.
During the three months ended March 31, 2010, ILFC entered into agreements to cross-collateralize the twoECA Facilities. In conjunction with the agreement, ILFC agreed to an acceleration event, which would accelerateall debt related to aircraft funded during 2010 if, among other things, ILFC were to sell aircraft with an aggregatebook value exceeding an agreed upon amount, currently approximately $10.8 billion, within a period starting fromthe date of the agreement until December 31, 2012.
ILFC Bank Financings
At March 31, 2010, the total funded amount of ILFC’s bank financings was $5.0 billion, which includes$4.5 billion of revolving credit facilities. The fundings mature through February 2012. The interest rates areLIBOR-based, with spreads ranging from 0.25 percent to 0.40 percent. At March 31, 2010, the interest ratesranged from 0.56 percent to 0.90 percent. AIG does not guarantee any of the debt obligations of ILFC.
Subsequent to March 31, 2010, ILFC amended covenants under its revolving credit facilities and term loans toincrease its capacity to enter into secured financings from 12.5 percent to 35 percent of its consolidated tangiblenet assets, as defined in its credit facility agreement, which assets approximated $15.0 billion at March 31, 2010(subject to certain prepayment requirements). In conjunction with the amendment, ILFC (i) extended the maturitydate of $2.16 billion of its $2.5 billion revolving credit facility from October 2011 to October 2012 (subject to thesatisfaction of certain collateralization milestones), with the loan secured by aircraft with an initial loan-to-valueratio of 75 percent, and increased the interest rate by 1.5 percent; (ii) pre-paid $410 million of bank term debtwith original maturity dates through 2012; and, (iii) increased the interest rate by 1.5 percent on $75 millionprincipal amount of bank term debt.
AIGFP
Prior to September 2008, AIGFP had historically funded its operations through the issuance of notes and bonds,GIA borrowings, other structured financing transactions and repurchase agreements.
On April 26, 2010, an aggregate of $2.3 billion of commercial paper of Curzon Funding LLC and NightingaleFinance LLC outstanding under the CPFF was repaid through an increase in borrowings under the FRBNYCredit Facility. AIGFP continues to rely on AIG Parent to meet most of its liquidity needs.
100
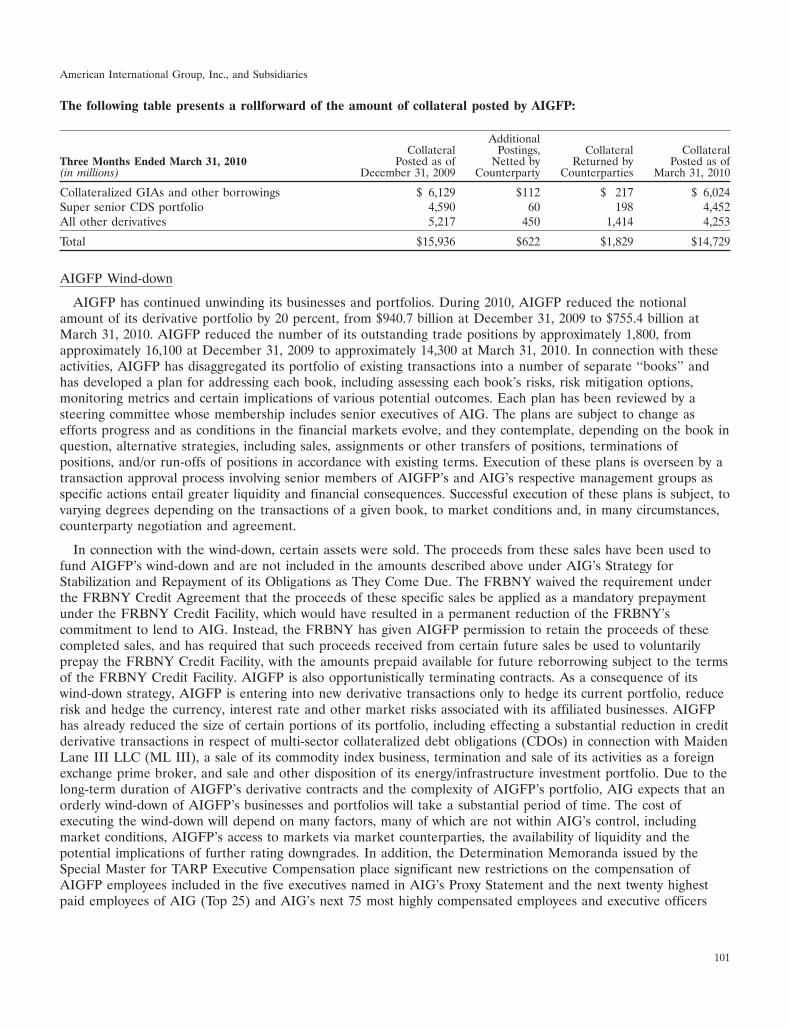
American International Group, Inc., and Subsidiaries
The following table presents a rollforward of the amount of collateral posted by AIGFP:
AdditionalCollateral Postings, Collateral Collateral
Posted as of Netted by Returned by Posted as ofThree Months Ended March 31, 2010(in millions) December 31, 2009 Counterparty Counterparties March 31, 2010
Collateralized GIAs and other borrowings $ 6,129 $112 $ 217 $ 6,024Super senior CDS portfolio 4,590 60 198 4,452All other derivatives 5,217 450 1,414 4,253
Total $15,936 $622 $1,829 $14,729
AIGFP Wind-down
AIGFP has continued unwinding its businesses and portfolios. During 2010, AIGFP reduced the notionalamount of its derivative portfolio by 20 percent, from $940.7 billion at December 31, 2009 to $755.4 billion atMarch 31, 2010. AIGFP reduced the number of its outstanding trade positions by approximately 1,800, fromapproximately 16,100 at December 31, 2009 to approximately 14,300 at March 31, 2010. In connection with theseactivities, AIGFP has disaggregated its portfolio of existing transactions into a number of separate ‘‘books’’ andhas developed a plan for addressing each book, including assessing each book’s risks, risk mitigation options,monitoring metrics and certain implications of various potential outcomes. Each plan has been reviewed by asteering committee whose membership includes senior executives of AIG. The plans are subject to change asefforts progress and as conditions in the financial markets evolve, and they contemplate, depending on the book inquestion, alternative strategies, including sales, assignments or other transfers of positions, terminations ofpositions, and/or run-offs of positions in accordance with existing terms. Execution of these plans is overseen by atransaction approval process involving senior members of AIGFP’s and AIG’s respective management groups asspecific actions entail greater liquidity and financial consequences. Successful execution of these plans is subject, tovarying degrees depending on the transactions of a given book, to market conditions and, in many circumstances,counterparty negotiation and agreement.
In connection with the wind-down, certain assets were sold. The proceeds from these sales have been used tofund AIGFP’s wind-down and are not included in the amounts described above under AIG’s Strategy forStabilization and Repayment of its Obligations as They Come Due. The FRBNY waived the requirement underthe FRBNY Credit Agreement that the proceeds of these specific sales be applied as a mandatory prepaymentunder the FRBNY Credit Facility, which would have resulted in a permanent reduction of the FRBNY’scommitment to lend to AIG. Instead, the FRBNY has given AIGFP permission to retain the proceeds of thesecompleted sales, and has required that such proceeds received from certain future sales be used to voluntarilyprepay the FRBNY Credit Facility, with the amounts prepaid available for future reborrowing subject to the termsof the FRBNY Credit Facility. AIGFP is also opportunistically terminating contracts. As a consequence of itswind-down strategy, AIGFP is entering into new derivative transactions only to hedge its current portfolio, reducerisk and hedge the currency, interest rate and other market risks associated with its affiliated businesses. AIGFPhas already reduced the size of certain portions of its portfolio, including effecting a substantial reduction in creditderivative transactions in respect of multi-sector collateralized debt obligations (CDOs) in connection with MaidenLane III LLC (ML III), a sale of its commodity index business, termination and sale of its activities as a foreignexchange prime broker, and sale and other disposition of its energy/infrastructure investment portfolio. Due to thelong-term duration of AIGFP’s derivative contracts and the complexity of AIGFP’s portfolio, AIG expects that anorderly wind-down of AIGFP’s businesses and portfolios will take a substantial period of time. The cost ofexecuting the wind-down will depend on many factors, many of which are not within AIG’s control, includingmarket conditions, AIGFP’s access to markets via market counterparties, the availability of liquidity and thepotential implications of further rating downgrades. In addition, the Determination Memoranda issued by theSpecial Master for TARP Executive Compensation place significant new restrictions on the compensation ofAIGFP employees included in the five executives named in AIG’s Proxy Statement and the next twenty highestpaid employees of AIG (Top 25) and AIG’s next 75 most highly compensated employees and executive officers
101
American International Group, Inc., and Subsidiaries
(together, the Top 100) and may impair AIGFP’s ability to retain these employees, and consequently negativelyimpact the wind-down of AIGFP’s businesses and portfolios.
AGF
Prior to September 2008, AGF’s traditional source of liquidity had been collections of customer receivables andborrowings in the public markets.
AGF anticipates that its primary sources of funds to support its operations and repay its obligations will becustomer receivable collections, additional on-balance sheet securitizations, portfolio sales and other borrowings.In order to improve cash flow from operations, AGF has significantly limited its lending activities and aggressivelymanaged its expenses. Since year end 2009, AGF has continued to manage its liquidity with proceeds of more than$500 million from a real estate loan securitization in March 2010 and the execution and full drawdown of a$3.0 billion five-year secured term loan in April 2010. In addition, AIG is exploring other strategic alternatives forAGF, including a potential sale of a majority interest. AIG made an $11 million capital contribution to AGF(through AIG Capital Corporation) during the first three months of 2010. In March 2010, AGF repaid the$2.45 billion one-year term loans and in April 2010, AGF repaid the $2.125 billion revolving credit facility, bothprior to their due dates in July 2010. AIG manages its liquidity on a consolidated basis, which may include makingor receiving short-term loans with AGF.
AGF Notes and Bonds Payable
As of March 31, 2010, notes and bonds payable aggregating $16.9 billion were outstanding with maturity datesranging from 2010 to 2031 at interest rates ranging from 0.51 percent to 9.00 percent. To the extent consideredappropriate, AGF may enter into swap transactions to manage its effective borrowing rates with respect to thesenotes and bonds. AIG does not guarantee any of the debt obligations of AGF.
AIGCFG
AIG believes that the funding needs of AIGCFG have stabilized, as AIGCFG has been able to retain asignificant portion of customer deposits, but it is possible that renewed customer and counterparty concerns couldincrease AIGCFG’s liquidity needs in 2010.
102
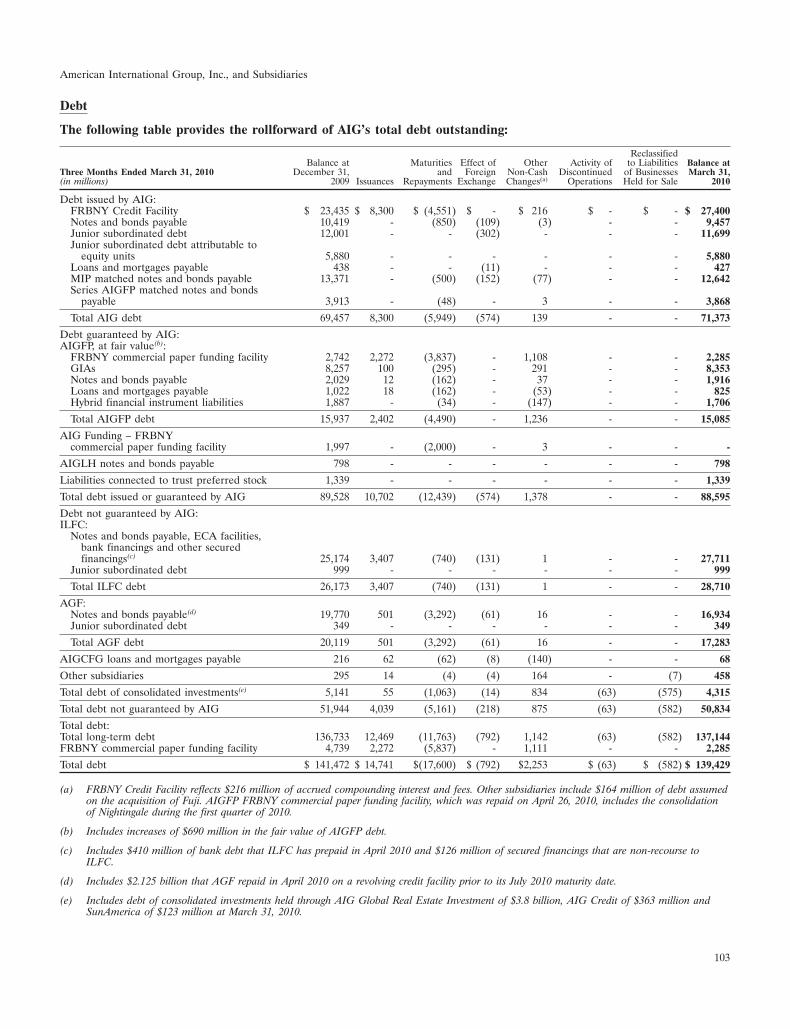
American International Group, Inc., and Subsidiaries
Debt
The following table provides the rollforward of AIG’s total debt outstanding:
ReclassifiedBalance at Maturities Effect of Other Activity of to Liabilities Balance at
Three Months Ended March 31, 2010 December 31, and Foreign Non-Cash Discontinued of Businesses March 31,(in millions) 2009 Issuances Repayments Exchange Changes(a) Operations Held for Sale 2010
Debt issued by AIG:FRBNY Credit Facility $ 23,435 $ 8,300 $ (4,551) $ - $ 216 $ - $ - $ 27,400Notes and bonds payable 10,419 - (850) (109) (3) - - 9,457Junior subordinated debt 12,001 - - (302) - - - 11,699Junior subordinated debt attributable to
equity units 5,880 - - - - - - 5,880Loans and mortgages payable 438 - - (11) - - - 427MIP matched notes and bonds payable 13,371 - (500) (152) (77) - - 12,642Series AIGFP matched notes and bonds
payable 3,913 - (48) - 3 - - 3,868
Total AIG debt 69,457 8,300 (5,949) (574) 139 - - 71,373
Debt guaranteed by AIG:AIGFP, at fair value(b):
FRBNY commercial paper funding facility 2,742 2,272 (3,837) - 1,108 - - 2,285GIAs 8,257 100 (295) - 291 - - 8,353Notes and bonds payable 2,029 12 (162) - 37 - - 1,916Loans and mortgages payable 1,022 18 (162) - (53) - - 825Hybrid financial instrument liabilities 1,887 - (34) - (147) - - 1,706
Total AIGFP debt 15,937 2,402 (4,490) - 1,236 - - 15,085
AIG Funding – FRBNYcommercial paper funding facility 1,997 - (2,000) - 3 - - -
AIGLH notes and bonds payable 798 - - - - - - 798
Liabilities connected to trust preferred stock 1,339 - - - - - - 1,339
Total debt issued or guaranteed by AIG 89,528 10,702 (12,439) (574) 1,378 - - 88,595
Debt not guaranteed by AIG:ILFC:
Notes and bonds payable, ECA facilities,bank financings and other securedfinancings(c) 25,174 3,407 (740) (131) 1 - - 27,711
Junior subordinated debt 999 - - - - - - 999
Total ILFC debt 26,173 3,407 (740) (131) 1 - - 28,710
AGF:Notes and bonds payable(d) 19,770 501 (3,292) (61) 16 - - 16,934Junior subordinated debt 349 - - - - - - 349
Total AGF debt 20,119 501 (3,292) (61) 16 - - 17,283
AIGCFG loans and mortgages payable 216 62 (62) (8) (140) - - 68
Other subsidiaries 295 14 (4) (4) 164 - (7) 458
Total debt of consolidated investments(e) 5,141 55 (1,063) (14) 834 (63) (575) 4,315
Total debt not guaranteed by AIG 51,944 4,039 (5,161) (218) 875 (63) (582) 50,834
Total debt:Total long-term debt 136,733 12,469 (11,763) (792) 1,142 (63) (582) 137,144FRBNY commercial paper funding facility 4,739 2,272 (5,837) - 1,111 - - 2,285
Total debt $ 141,472 $ 14,741 $(17,600) $ (792) $2,253 $ (63) $ (582) $ 139,429
(a) FRBNY Credit Facility reflects $216 million of accrued compounding interest and fees. Other subsidiaries include $164 million of debt assumedon the acquisition of Fuji. AIGFP FRBNY commercial paper funding facility, which was repaid on April 26, 2010, includes the consolidationof Nightingale during the first quarter of 2010.
(b) Includes increases of $690 million in the fair value of AIGFP debt.
(c) Includes $410 million of bank debt that ILFC has prepaid in April 2010 and $126 million of secured financings that are non-recourse toILFC.
(d) Includes $2.125 billion that AGF repaid in April 2010 on a revolving credit facility prior to its July 2010 maturity date.
(e) Includes debt of consolidated investments held through AIG Global Real Estate Investment of $3.8 billion, AIG Credit of $363 million andSunAmerica of $123 million at March 31, 2010.
103

American International Group, Inc., and Subsidiaries
The following table summarizes maturities of long-term debt, excluding borrowings of consolidated investments:
Year EndingRemainderAt March 31, 2010(in millions) Total of 2010 2011 2012 2013 2014 2015 Thereafter
AIG:FRBNY Credit Facility $ 27,400 $ - $ - $ - $27,400 $ - $ - $ -Notes and bonds payable 9,457 500 543 27 998 - 998 6,391Junior subordinated debt 11,699 - - - - - - 11,699Junior subordinated debt attributable to equity
units 5,880 - - - - - - 5,880Loans and mortgages payable 427 - - - 358 - 2 67MIP matched notes and bonds payable 12,642 1,664 3,090 2,138 856 436 363 4,095Series AIGFP matched notes and bonds
payable 3,868 - 27 56 3 - - 3,782
Total AIG 71,373 2,164 3,660 2,221 29,615 436 1,363 31,914
AIGFP, at fair value:GIAs 8,353 791 272 268 303 670 570 5,479Notes and bonds payable 1,916 100 171 707 5 67 113 753Loans and mortgages payable 825 39 222 192 81 140 - 151Hybrid financial instrument liabilities 1,706 209 276 96 161 57 178 729
Total AIGFP 12,800 1,139 941 1,263 550 934 861 7,112
AIGLH notes and bonds payable 798 500 - - - - - 298
Liabilities connected to trust preferred stock 1,339 - - - - - - 1,339
ILFC(a):Notes and bonds payable 18,234 3,558 4,560 3,571 3,542 1,041 1,011 951Junior subordinated debt 999 - - - - - - 999ECA Facilities(b) 3,021 373 443 414 414 409 321 647Bank financings and other secured financings(c) 6,456 2,058 2,849 165 16 37 760 571
Total ILFC 28,710 5,989 7,852 4,150 3,972 1,487 2,092 3,168
AGF(a):Notes and bonds payable(d) 16,934 3,666 3,436 2,379 2,339 595 855 3,664Junior subordinated debt 349 - - - - - - 349
Total AGF 17,283 3,666 3,436 2,379 2,339 595 855 4,013
AIGCFG Loans and mortgages payable(a) 68 32 13 9 8 4 2 -Other subsidiaries(a) 458 5 8 7 5 8 19 406
Total $132,829 $ 13,495 $15,910 $10,029 $36,489 $3,464 $5,192 $48,250
(a) AIG does not guarantee these borrowings.
(b) Reflects future minimum payment for ILFC’s borrowings under the 1999 and 2004 ECA Facilities.
(c) Includes $126 million of secured financings that are non-recourse to ILFC. On April 16, 2010, ILFC extended the maturity date of$2.16 billion of its $2.5 billion revolving credit facility from October 2011 to October 2012 (subject to the satisfaction of certain collateralizationmilestones). Includes $410 million of bank debt that ILFC prepaid in April 2010.
(d) Includes $2.125 billion that AGF repaid in April 2010 on a revolving credit facility prior to its July 2010 maturity date.
Credit Ratings
The cost and availability of unsecured financing for AIG and its subsidiaries are generally dependent on theirshort-and long-term debt ratings. The following table presents the credit ratings of AIG and certain of itssubsidiaries as of April 30, 2010. In parentheses, following the initial occurrence in the table of each rating, is anindication of that rating’s relative rank within the agency’s rating categories. That ranking refers only to the
104
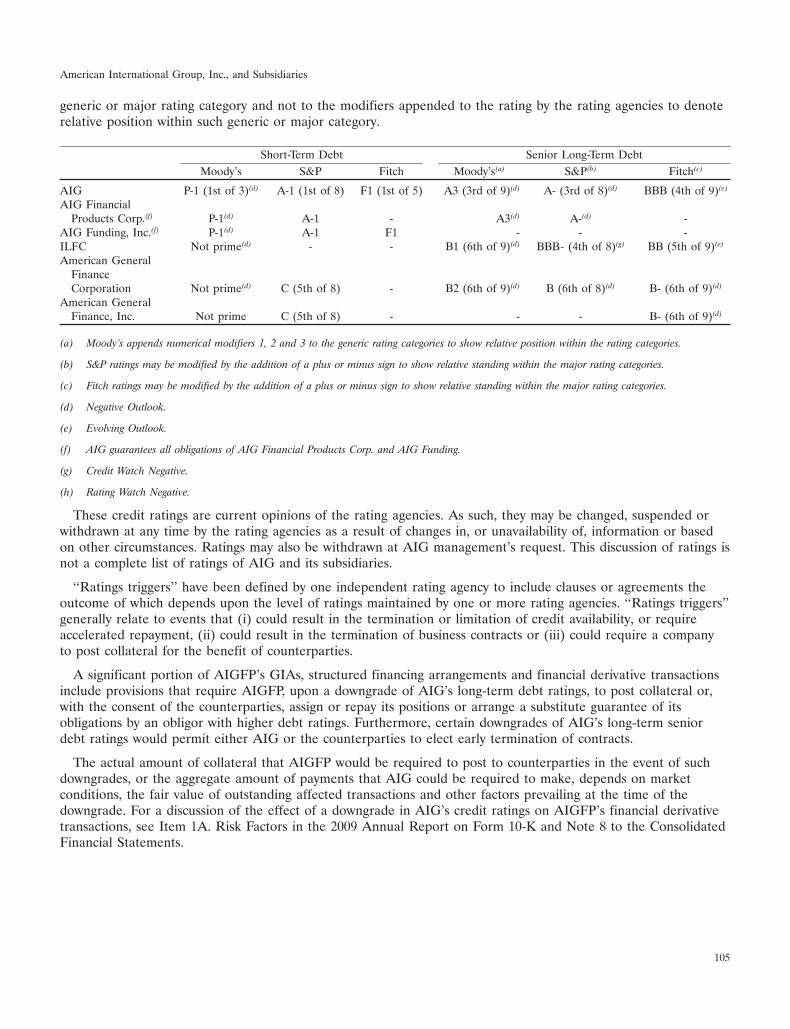
American International Group, Inc., and Subsidiaries
generic or major rating category and not to the modifiers appended to the rating by the rating agencies to denoterelative position within such generic or major category.
Short-Term Debt Senior Long-Term DebtMoody’s S&P Fitch Moody’s(a) S&P(b) Fitch(c)
AIG P-1 (1st of 3)(d) A-1 (1st of 8) F1 (1st of 5) A3 (3rd of 9)(d) A- (3rd of 8)(d) BBB (4th of 9)(e)
AIG FinancialProducts Corp.(f) P-1(d) A-1 - A3(d) A-(d) -
AIG Funding, Inc.(f) P-1(d) A-1 F1 - - -ILFC Not prime(d) - - B1 (6th of 9)(d) BBB- (4th of 8)(g) BB (5th of 9)(e)
American GeneralFinanceCorporation Not prime(d) C (5th of 8) - B2 (6th of 9)(d) B (6th of 8)(d) B- (6th of 9)(d)
American GeneralFinance, Inc. Not prime C (5th of 8) - - - B- (6th of 9)(d)
(a) Moody’s appends numerical modifiers 1, 2 and 3 to the generic rating categories to show relative position within the rating categories.
(b) S&P ratings may be modified by the addition of a plus or minus sign to show relative standing within the major rating categories.
(c) Fitch ratings may be modified by the addition of a plus or minus sign to show relative standing within the major rating categories.
(d) Negative Outlook.
(e) Evolving Outlook.
(f) AIG guarantees all obligations of AIG Financial Products Corp. and AIG Funding.
(g) Credit Watch Negative.
(h) Rating Watch Negative.
These credit ratings are current opinions of the rating agencies. As such, they may be changed, suspended orwithdrawn at any time by the rating agencies as a result of changes in, or unavailability of, information or basedon other circumstances. Ratings may also be withdrawn at AIG management’s request. This discussion of ratings isnot a complete list of ratings of AIG and its subsidiaries.
‘‘Ratings triggers’’ have been defined by one independent rating agency to include clauses or agreements theoutcome of which depends upon the level of ratings maintained by one or more rating agencies. ‘‘Ratings triggers’’generally relate to events that (i) could result in the termination or limitation of credit availability, or requireaccelerated repayment, (ii) could result in the termination of business contracts or (iii) could require a companyto post collateral for the benefit of counterparties.
A significant portion of AIGFP’s GIAs, structured financing arrangements and financial derivative transactionsinclude provisions that require AIGFP, upon a downgrade of AIG’s long-term debt ratings, to post collateral or,with the consent of the counterparties, assign or repay its positions or arrange a substitute guarantee of itsobligations by an obligor with higher debt ratings. Furthermore, certain downgrades of AIG’s long-term seniordebt ratings would permit either AIG or the counterparties to elect early termination of contracts.
The actual amount of collateral that AIGFP would be required to post to counterparties in the event of suchdowngrades, or the aggregate amount of payments that AIG could be required to make, depends on marketconditions, the fair value of outstanding affected transactions and other factors prevailing at the time of thedowngrade. For a discussion of the effect of a downgrade in AIG’s credit ratings on AIGFP’s financial derivativetransactions, see Item 1A. Risk Factors in the 2009 Annual Report on Form 10-K and Note 8 to the ConsolidatedFinancial Statements.
105
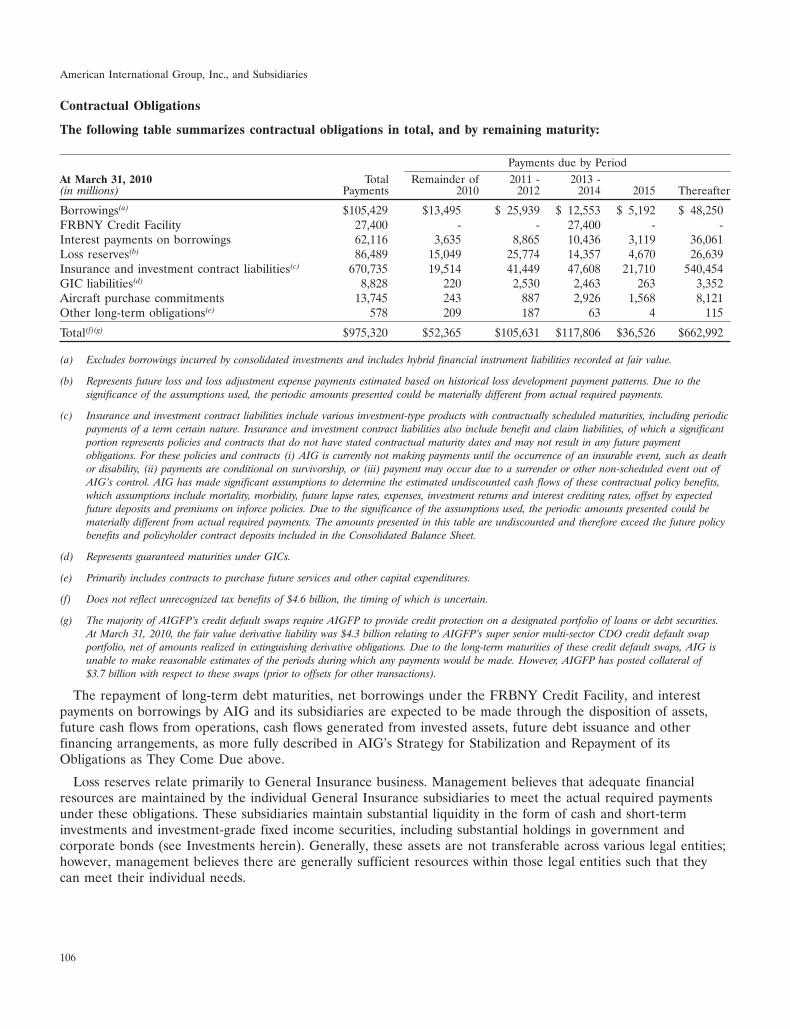
American International Group, Inc., and Subsidiaries
Contractual Obligations
The following table summarizes contractual obligations in total, and by remaining maturity:
Payments due by PeriodAt March 31, 2010 Total Remainder of 2011 - 2013 -(in millions) Payments 2010 2012 2014 2015 Thereafter
Borrowings(a) $105,429 $13,495 $ 25,939 $ 12,553 $ 5,192 $ 48,250FRBNY Credit Facility 27,400 - - 27,400 - -Interest payments on borrowings 62,116 3,635 8,865 10,436 3,119 36,061Loss reserves(b) 86,489 15,049 25,774 14,357 4,670 26,639Insurance and investment contract liabilities(c) 670,735 19,514 41,449 47,608 21,710 540,454GIC liabilities(d) 8,828 220 2,530 2,463 263 3,352Aircraft purchase commitments 13,745 243 887 2,926 1,568 8,121Other long-term obligations(e) 578 209 187 63 4 115
Total(f)(g) $975,320 $52,365 $105,631 $117,806 $36,526 $662,992
(a) Excludes borrowings incurred by consolidated investments and includes hybrid financial instrument liabilities recorded at fair value.
(b) Represents future loss and loss adjustment expense payments estimated based on historical loss development payment patterns. Due to thesignificance of the assumptions used, the periodic amounts presented could be materially different from actual required payments.
(c) Insurance and investment contract liabilities include various investment-type products with contractually scheduled maturities, including periodicpayments of a term certain nature. Insurance and investment contract liabilities also include benefit and claim liabilities, of which a significantportion represents policies and contracts that do not have stated contractual maturity dates and may not result in any future paymentobligations. For these policies and contracts (i) AIG is currently not making payments until the occurrence of an insurable event, such as deathor disability, (ii) payments are conditional on survivorship, or (iii) payment may occur due to a surrender or other non-scheduled event out ofAIG’s control. AIG has made significant assumptions to determine the estimated undiscounted cash flows of these contractual policy benefits,which assumptions include mortality, morbidity, future lapse rates, expenses, investment returns and interest crediting rates, offset by expectedfuture deposits and premiums on inforce policies. Due to the significance of the assumptions used, the periodic amounts presented could bematerially different from actual required payments. The amounts presented in this table are undiscounted and therefore exceed the future policybenefits and policyholder contract deposits included in the Consolidated Balance Sheet.
(d) Represents guaranteed maturities under GICs.
(e) Primarily includes contracts to purchase future services and other capital expenditures.
(f) Does not reflect unrecognized tax benefits of $4.6 billion, the timing of which is uncertain.
(g) The majority of AIGFP’s credit default swaps require AIGFP to provide credit protection on a designated portfolio of loans or debt securities.At March 31, 2010, the fair value derivative liability was $4.3 billion relating to AIGFP’s super senior multi-sector CDO credit default swapportfolio, net of amounts realized in extinguishing derivative obligations. Due to the long-term maturities of these credit default swaps, AIG isunable to make reasonable estimates of the periods during which any payments would be made. However, AIGFP has posted collateral of$3.7 billion with respect to these swaps (prior to offsets for other transactions).
The repayment of long-term debt maturities, net borrowings under the FRBNY Credit Facility, and interestpayments on borrowings by AIG and its subsidiaries are expected to be made through the disposition of assets,future cash flows from operations, cash flows generated from invested assets, future debt issuance and otherfinancing arrangements, as more fully described in AIG’s Strategy for Stabilization and Repayment of itsObligations as They Come Due above.
Loss reserves relate primarily to General Insurance business. Management believes that adequate financialresources are maintained by the individual General Insurance subsidiaries to meet the actual required paymentsunder these obligations. These subsidiaries maintain substantial liquidity in the form of cash and short-terminvestments and investment-grade fixed income securities, including substantial holdings in government andcorporate bonds (see Investments herein). Generally, these assets are not transferable across various legal entities;however, management believes there are generally sufficient resources within those legal entities such that theycan meet their individual needs.
106
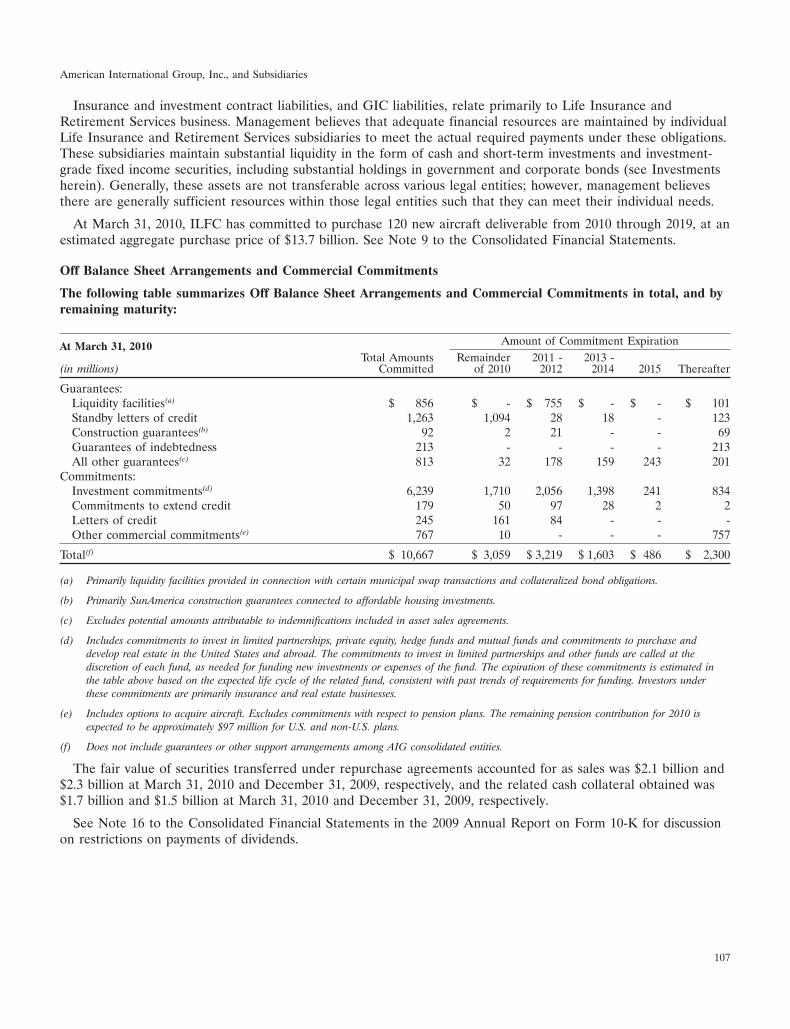
American International Group, Inc., and Subsidiaries
Insurance and investment contract liabilities, and GIC liabilities, relate primarily to Life Insurance andRetirement Services business. Management believes that adequate financial resources are maintained by individualLife Insurance and Retirement Services subsidiaries to meet the actual required payments under these obligations.These subsidiaries maintain substantial liquidity in the form of cash and short-term investments and investment-grade fixed income securities, including substantial holdings in government and corporate bonds (see Investmentsherein). Generally, these assets are not transferable across various legal entities; however, management believesthere are generally sufficient resources within those legal entities such that they can meet their individual needs.
At March 31, 2010, ILFC has committed to purchase 120 new aircraft deliverable from 2010 through 2019, at anestimated aggregate purchase price of $13.7 billion. See Note 9 to the Consolidated Financial Statements.
Off Balance Sheet Arrangements and Commercial Commitments
The following table summarizes Off Balance Sheet Arrangements and Commercial Commitments in total, and byremaining maturity:
Amount of Commitment ExpirationAt March 31, 2010Total Amounts Remainder 2011 - 2013 -
(in millions) Committed of 2010 2012 2014 2015 Thereafter
Guarantees:Liquidity facilities(a) $ 856 $ - $ 755 $ - $ - $ 101Standby letters of credit 1,263 1,094 28 18 - 123Construction guarantees(b) 92 2 21 - - 69Guarantees of indebtedness 213 - - - - 213All other guarantees(c) 813 32 178 159 243 201
Commitments:Investment commitments(d) 6,239 1,710 2,056 1,398 241 834Commitments to extend credit 179 50 97 28 2 2Letters of credit 245 161 84 - - -Other commercial commitments(e) 767 10 - - - 757
Total(f) $ 10,667 $ 3,059 $ 3,219 $ 1,603 $ 486 $ 2,300
(a) Primarily liquidity facilities provided in connection with certain municipal swap transactions and collateralized bond obligations.
(b) Primarily SunAmerica construction guarantees connected to affordable housing investments.
(c) Excludes potential amounts attributable to indemnifications included in asset sales agreements.
(d) Includes commitments to invest in limited partnerships, private equity, hedge funds and mutual funds and commitments to purchase anddevelop real estate in the United States and abroad. The commitments to invest in limited partnerships and other funds are called at thediscretion of each fund, as needed for funding new investments or expenses of the fund. The expiration of these commitments is estimated inthe table above based on the expected life cycle of the related fund, consistent with past trends of requirements for funding. Investors underthese commitments are primarily insurance and real estate businesses.
(e) Includes options to acquire aircraft. Excludes commitments with respect to pension plans. The remaining pension contribution for 2010 isexpected to be approximately $97 million for U.S. and non-U.S. plans.
(f) Does not include guarantees or other support arrangements among AIG consolidated entities.
The fair value of securities transferred under repurchase agreements accounted for as sales was $2.1 billion and$2.3 billion at March 31, 2010 and December 31, 2009, respectively, and the related cash collateral obtained was$1.7 billion and $1.5 billion at March 31, 2010 and December 31, 2009, respectively.
See Note 16 to the Consolidated Financial Statements in the 2009 Annual Report on Form 10-K for discussionon restrictions on payments of dividends.
107
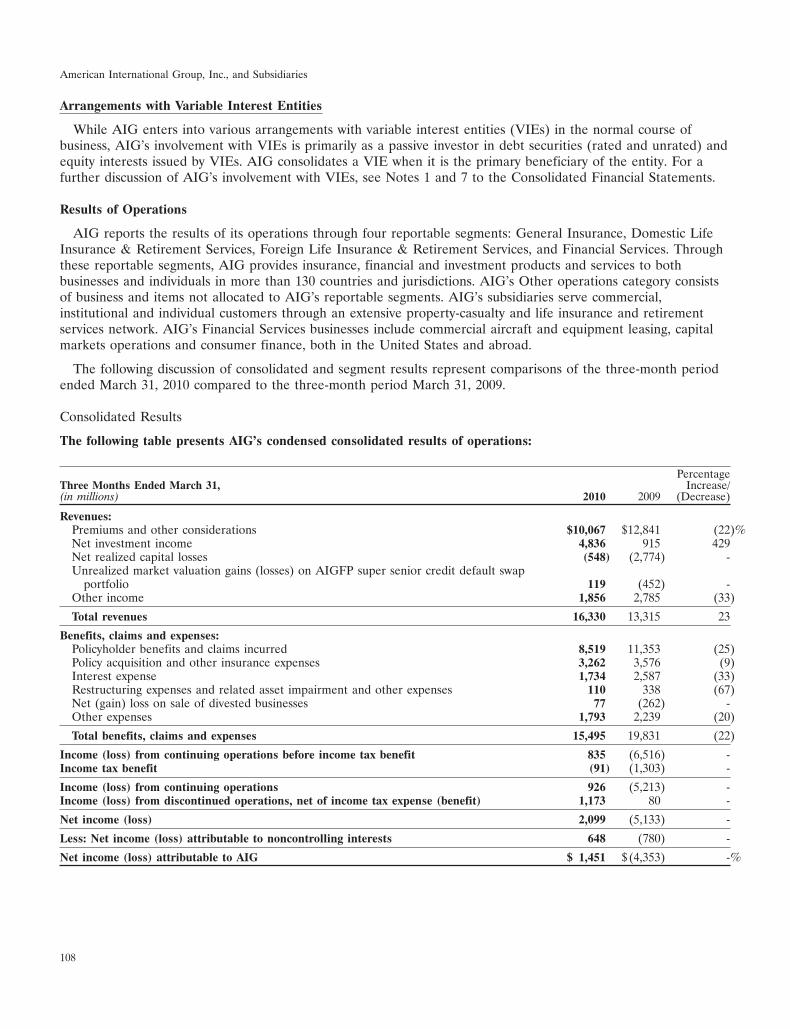
American International Group, Inc., and Subsidiaries
Arrangements with Variable Interest Entities
While AIG enters into various arrangements with variable interest entities (VIEs) in the normal course ofbusiness, AIG’s involvement with VIEs is primarily as a passive investor in debt securities (rated and unrated) andequity interests issued by VIEs. AIG consolidates a VIE when it is the primary beneficiary of the entity. For afurther discussion of AIG’s involvement with VIEs, see Notes 1 and 7 to the Consolidated Financial Statements.
Results of Operations
AIG reports the results of its operations through four reportable segments: General Insurance, Domestic LifeInsurance & Retirement Services, Foreign Life Insurance & Retirement Services, and Financial Services. Throughthese reportable segments, AIG provides insurance, financial and investment products and services to bothbusinesses and individuals in more than 130 countries and jurisdictions. AIG’s Other operations category consistsof business and items not allocated to AIG’s reportable segments. AIG’s subsidiaries serve commercial,institutional and individual customers through an extensive property-casualty and life insurance and retirementservices network. AIG’s Financial Services businesses include commercial aircraft and equipment leasing, capitalmarkets operations and consumer finance, both in the United States and abroad.
The following discussion of consolidated and segment results represent comparisons of the three-month periodended March 31, 2010 compared to the three-month period March 31, 2009.
Consolidated Results
The following table presents AIG’s condensed consolidated results of operations:
PercentageThree Months Ended March 31, Increase/(in millions) 2010 2009 (Decrease)
Revenues:Premiums and other considerations $10,067 $12,841 (22)%Net investment income 4,836 915 429Net realized capital losses (548) (2,774) -Unrealized market valuation gains (losses) on AIGFP super senior credit default swap
portfolio 119 (452) -Other income 1,856 2,785 (33)
Total revenues 16,330 13,315 23
Benefits, claims and expenses:Policyholder benefits and claims incurred 8,519 11,353 (25)Policy acquisition and other insurance expenses 3,262 3,576 (9)Interest expense 1,734 2,587 (33)Restructuring expenses and related asset impairment and other expenses 110 338 (67)Net (gain) loss on sale of divested businesses 77 (262) -Other expenses 1,793 2,239 (20)
Total benefits, claims and expenses 15,495 19,831 (22)
Income (loss) from continuing operations before income tax benefit 835 (6,516) -Income tax benefit (91) (1,303) -
Income (loss) from continuing operations 926 (5,213) -Income (loss) from discontinued operations, net of income tax expense (benefit) 1,173 80 -
Net income (loss) 2,099 (5,133) -
Less: Net income (loss) attributable to noncontrolling interests 648 (780) -
Net income (loss) attributable to AIG $ 1,451 $(4,353) -%
108
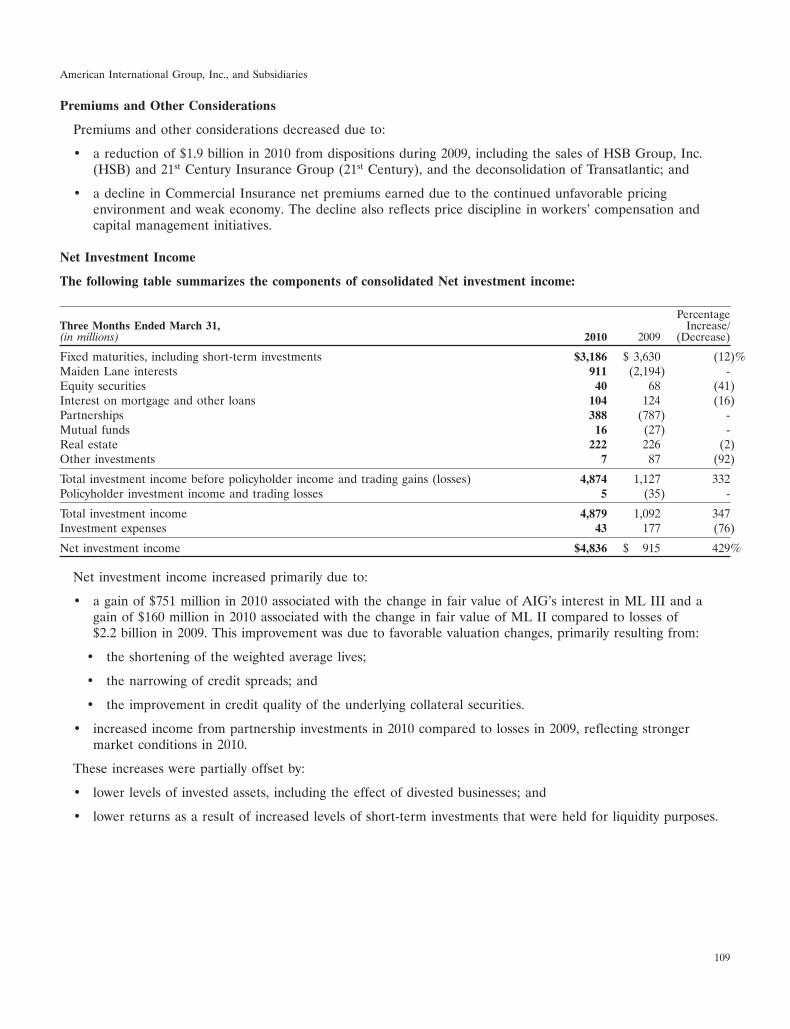
American International Group, Inc., and Subsidiaries
Premiums and Other Considerations
Premiums and other considerations decreased due to:
• a reduction of $1.9 billion in 2010 from dispositions during 2009, including the sales of HSB Group, Inc.(HSB) and 21st Century Insurance Group (21st Century), and the deconsolidation of Transatlantic; and
• a decline in Commercial Insurance net premiums earned due to the continued unfavorable pricingenvironment and weak economy. The decline also reflects price discipline in workers’ compensation andcapital management initiatives.
Net Investment Income
The following table summarizes the components of consolidated Net investment income:
PercentageThree Months Ended March 31, Increase/(in millions) 2010 2009 (Decrease)
Fixed maturities, including short-term investments $3,186 $ 3,630 (12)%Maiden Lane interests 911 (2,194) -Equity securities 40 68 (41)Interest on mortgage and other loans 104 124 (16)Partnerships 388 (787) -Mutual funds 16 (27) -Real estate 222 226 (2)Other investments 7 87 (92)
Total investment income before policyholder income and trading gains (losses) 4,874 1,127 332Policyholder investment income and trading losses 5 (35) -
Total investment income 4,879 1,092 347Investment expenses 43 177 (76)
Net investment income $4,836 $ 915 429%
Net investment income increased primarily due to:
• a gain of $751 million in 2010 associated with the change in fair value of AIG’s interest in ML III and again of $160 million in 2010 associated with the change in fair value of ML II compared to losses of$2.2 billion in 2009. This improvement was due to favorable valuation changes, primarily resulting from:
• the shortening of the weighted average lives;
• the narrowing of credit spreads; and
• the improvement in credit quality of the underlying collateral securities.
• increased income from partnership investments in 2010 compared to losses in 2009, reflecting strongermarket conditions in 2010.
These increases were partially offset by:
• lower levels of invested assets, including the effect of divested businesses; and
• lower returns as a result of increased levels of short-term investments that were held for liquidity purposes.
109
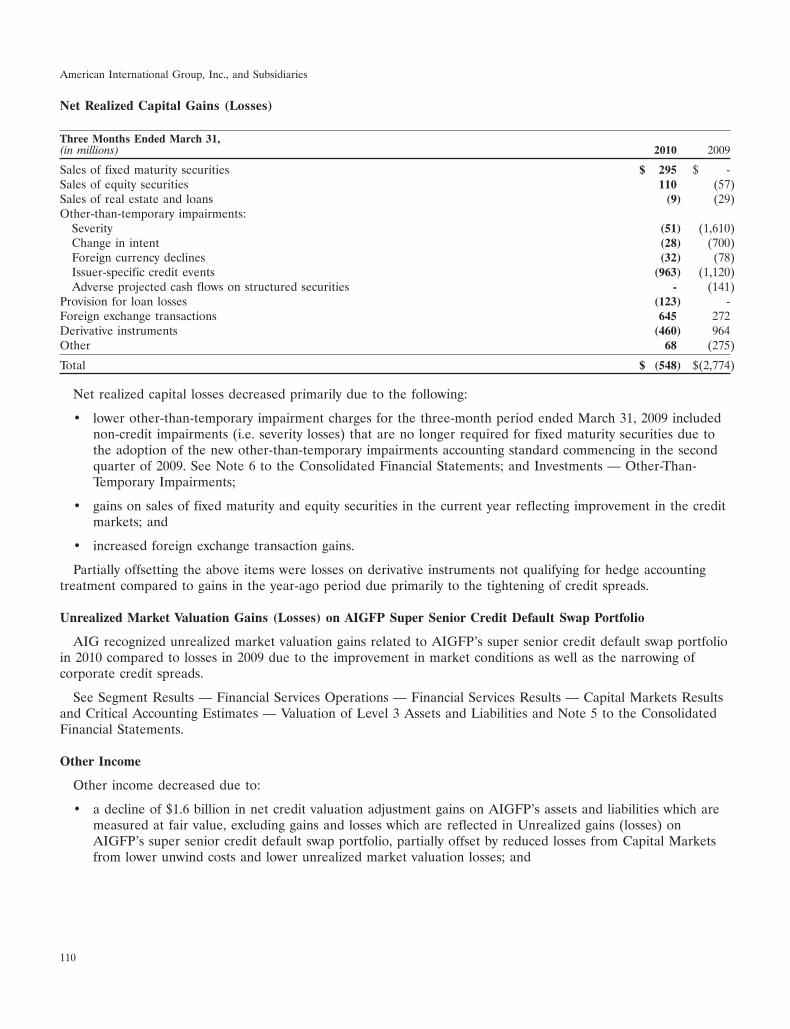
American International Group, Inc., and Subsidiaries
Net Realized Capital Gains (Losses)
Three Months Ended March 31,(in millions) 2010 2009
Sales of fixed maturity securities $ 295 $ -Sales of equity securities 110 (57)Sales of real estate and loans (9) (29)Other-than-temporary impairments:
Severity (51) (1,610)Change in intent (28) (700)Foreign currency declines (32) (78)Issuer-specific credit events (963) (1,120)Adverse projected cash flows on structured securities - (141)
Provision for loan losses (123) -Foreign exchange transactions 645 272Derivative instruments (460) 964Other 68 (275)
Total $ (548) $(2,774)
Net realized capital losses decreased primarily due to the following:
• lower other-than-temporary impairment charges for the three-month period ended March 31, 2009 includednon-credit impairments (i.e. severity losses) that are no longer required for fixed maturity securities due tothe adoption of the new other-than-temporary impairments accounting standard commencing in the secondquarter of 2009. See Note 6 to the Consolidated Financial Statements; and Investments — Other-Than-Temporary Impairments;
• gains on sales of fixed maturity and equity securities in the current year reflecting improvement in the creditmarkets; and
• increased foreign exchange transaction gains.
Partially offsetting the above items were losses on derivative instruments not qualifying for hedge accountingtreatment compared to gains in the year-ago period due primarily to the tightening of credit spreads.
Unrealized Market Valuation Gains (Losses) on AIGFP Super Senior Credit Default Swap Portfolio
AIG recognized unrealized market valuation gains related to AIGFP’s super senior credit default swap portfolioin 2010 compared to losses in 2009 due to the improvement in market conditions as well as the narrowing ofcorporate credit spreads.
See Segment Results — Financial Services Operations — Financial Services Results — Capital Markets Resultsand Critical Accounting Estimates — Valuation of Level 3 Assets and Liabilities and Note 5 to the ConsolidatedFinancial Statements.
Other Income
Other income decreased due to:
• a decline of $1.6 billion in net credit valuation adjustment gains on AIGFP’s assets and liabilities which aremeasured at fair value, excluding gains and losses which are reflected in Unrealized gains (losses) onAIGFP’s super senior credit default swap portfolio, partially offset by reduced losses from Capital Marketsfrom lower unwind costs and lower unrealized market valuation losses; and
110
American International Group, Inc., and Subsidiaries
• lower aircraft leasing revenues resulting from ILFC aircraft asset impairment charges of $347 million withrespect to aircraft which will be sold subsequent to March 31, 2010, and operating lease related chargestotaling $84 million related to those aircraft for the three-month period ended March 31, 2010.
Policyholder Benefits and Claims Incurred
Policyholder benefits and claims incurred decreased due to:
• a reduction of $1.3 billion as a result of dispositions in 2009, including the sales of HSB and 21st Century,and the deconsolidation of Transatlantic;
• lower production levels for General Insurance and Domestic Life & Retirement Services; and
• a decrease in claims and claims adjustment expense for Mortgage Guaranty operations of $794 millionprimarily due to lower levels of newly reported delinquencies and higher cure rates on existing first-liendelinquent loans and the recognition of stop loss limits on certain second-lien policies.
Partially offsetting the items above were catastrophe losses for General Insurance in 2010 totaling $481 millionprimarily related to the Chile earthquake, U.S. wind storms and Madeira (Portugal) floods.
Policy Acquisition and Other Insurance Expenses
Policy acquisition and other insurance expenses decreased primarily due a reduction of $580 million as a resultof dispositions during 2009, including the sales of HSB, 21st Century and the deconsolidation of Transatlantic,partially offset by the effects of $222 million of amortization of a premium deficiency reserve by UGC in 2009.
Interest Expense
Interest expense decreased primarily due to lower interest expense on the FRBNY Credit Facility. Interestexpense on the FRBNY Credit Facility benefited from a reduced interest rate of 3.25 percent in 2010 compared to6.5 percent in 2009 as well as a lower outstanding balance of $27.4 billion at March 31, 2010 compared to$47.4 billion at March 31, 2009. Interest expense on the FRBNY Credit Facility was $650 million in 2010compared to $1.3 billion in 2009. Interest expense in 2010 included $521 million of amortization of the prepaidcommitment fee asset associated with the FRBNY Credit Facility compared to $705 million in 2009.
Restructuring Expenses and Related Asset Impairment and Other Expenses
Restructuring expenses decreased in 2010 reflecting progress made under the restructuring plan and assetdisposition initiatives. See Note 11 to the Consolidated Financial Statements for additional discussion regardingrestructuring and separation expenses.
Net (gain) loss on Sale of Divested Businesses
Net gain (loss) on sale of divested businesses includes the net gain (loss) on the sale of divested businesses thatdid not qualify as discontinued operations. In 2009, included a gain of $251 million from the sale of HSB. SeeSegment Results — Other Operations — Other Results herein for further information.
Other Expenses
Other expenses decreased primarily due to lower compensation-related costs for the noncore Asset Managementbusinesses reflecting the effect of the deconsolidation of certain portfolio investments, as well as a decline inConsumer Finance provision for loan losses of $226 million.
Income Tax Benefits
For the three-month period ended March 31, 2010, the effective tax rate on the pre-tax income from continuingoperations was (10.9) percent and the effective tax rate on the pre-tax income included in discontinued operations
111
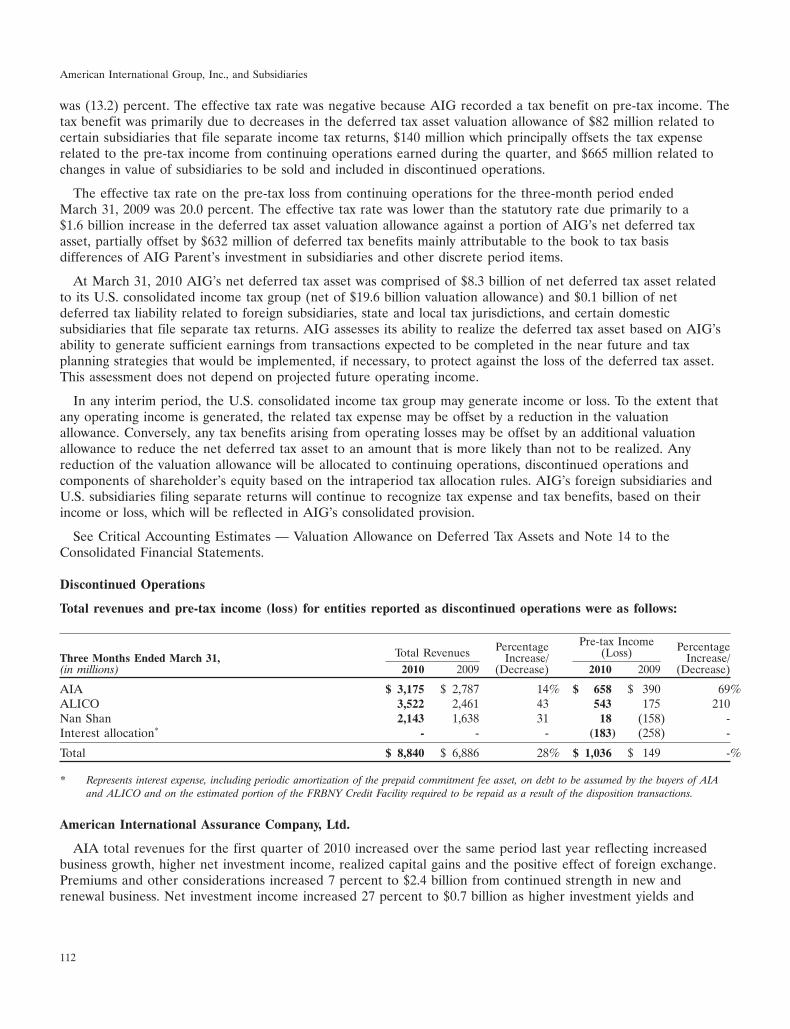
American International Group, Inc., and Subsidiaries
was (13.2) percent. The effective tax rate was negative because AIG recorded a tax benefit on pre-tax income. Thetax benefit was primarily due to decreases in the deferred tax asset valuation allowance of $82 million related tocertain subsidiaries that file separate income tax returns, $140 million which principally offsets the tax expenserelated to the pre-tax income from continuing operations earned during the quarter, and $665 million related tochanges in value of subsidiaries to be sold and included in discontinued operations.
The effective tax rate on the pre-tax loss from continuing operations for the three-month period endedMarch 31, 2009 was 20.0 percent. The effective tax rate was lower than the statutory rate due primarily to a$1.6 billion increase in the deferred tax asset valuation allowance against a portion of AIG’s net deferred taxasset, partially offset by $632 million of deferred tax benefits mainly attributable to the book to tax basisdifferences of AIG Parent’s investment in subsidiaries and other discrete period items.
At March 31, 2010 AIG’s net deferred tax asset was comprised of $8.3 billion of net deferred tax asset relatedto its U.S. consolidated income tax group (net of $19.6 billion valuation allowance) and $0.1 billion of netdeferred tax liability related to foreign subsidiaries, state and local tax jurisdictions, and certain domesticsubsidiaries that file separate tax returns. AIG assesses its ability to realize the deferred tax asset based on AIG’sability to generate sufficient earnings from transactions expected to be completed in the near future and taxplanning strategies that would be implemented, if necessary, to protect against the loss of the deferred tax asset.This assessment does not depend on projected future operating income.
In any interim period, the U.S. consolidated income tax group may generate income or loss. To the extent thatany operating income is generated, the related tax expense may be offset by a reduction in the valuationallowance. Conversely, any tax benefits arising from operating losses may be offset by an additional valuationallowance to reduce the net deferred tax asset to an amount that is more likely than not to be realized. Anyreduction of the valuation allowance will be allocated to continuing operations, discontinued operations andcomponents of shareholder’s equity based on the intraperiod tax allocation rules. AIG’s foreign subsidiaries andU.S. subsidiaries filing separate returns will continue to recognize tax expense and tax benefits, based on theirincome or loss, which will be reflected in AIG’s consolidated provision.
See Critical Accounting Estimates — Valuation Allowance on Deferred Tax Assets and Note 14 to theConsolidated Financial Statements.
Discontinued Operations
Total revenues and pre-tax income (loss) for entities reported as discontinued operations were as follows:
Pre-tax IncomePercentage PercentageTotal Revenues (Loss)Three Months Ended March 31, Increase/ Increase/(in millions) 2010 2009 (Decrease) 2010 2009 (Decrease)
AIA $ 3,175 $ 2,787 14% $ 658 $ 390 69%ALICO 3,522 2,461 43 543 175 210Nan Shan 2,143 1,638 31 18 (158) -Interest allocation* - - - (183) (258) -
Total $ 8,840 $ 6,886 28% $ 1,036 $ 149 -%
* Represents interest expense, including periodic amortization of the prepaid commitment fee asset, on debt to be assumed by the buyers of AIAand ALICO and on the estimated portion of the FRBNY Credit Facility required to be repaid as a result of the disposition transactions.
American International Assurance Company, Ltd.
AIA total revenues for the first quarter of 2010 increased over the same period last year reflecting increasedbusiness growth, higher net investment income, realized capital gains and the positive effect of foreign exchange.Premiums and other considerations increased 7 percent to $2.4 billion from continued strength in new andrenewal business. Net investment income increased 27 percent to $0.7 billion as higher investment yields and
112
American International Group, Inc., and Subsidiaries
growth in assets under management offset higher net investment losses related to policyholder investment incomeand trading gains (losses) which are offset in policyholder benefits and claims incurred. In the first quarter of 2010AIA reported net realized capital gains of $107 million compared to $25 million in the same period last year. Theimprovement in net realized capital gains was due to lower impairment charges and equity gains realized in 2010.
Pre-tax income increased significantly over last year largely due to growth in business, higher realized capitalgains, higher investment returns, and the positive effect of foreign exchange.
American Life Insurance Company
ALICO total revenues for the first quarter of 2010 increased over the same period last year reflecting increasedbusiness growth, higher net investment income and lower net realized capital losses. Premiums and otherconsiderations increased 7 percent to $2.5 billion from continued strength in new and renewal business. Netinvestment income more than doubled from last year to $1.1 billion due to net investment income related topolicyholder investment income and trading gains (losses) of $292 million in 2010 compared to a net investmentloss related to policyholder investment income and trading gains (losses) of $239 million in 2009, as well as fairvalue gains on trading account assets in the U.K. Net investment income related to policyholder investmentincome and trading gains (losses) is offset in policyholder benefits and claims incurred. Realized capital lossesdeclined in the first quarter of 2010 compared to the prior year primarily due to lower other-than-temporaryimpairment charges.
Pre-tax income increased significantly over last year largely due to lower realized capital losses and higherinvestment returns from trading gains in 2010 compared to trading losses in 2009. In addition, 2009 included aDAC benefit related to net realized capital losses of $232 million which more than offset the negative effect ofmarket volatility on Japan annuity and investment-linked products.
Nan Shan Life Insurance Company
Nan Shan total revenues increased over the same period last year primarily due to net realized capital gains of$74 million in 2010 compared to net realized capital losses of $243 million in 2009, growth in business and thefavorable effect of foreign exchange. Net realized capital gains in 2010 were driven mainly by realized capital gainson equity securities which more than offset impairment and derivative losses. The net realized capital losses in2009 were comprised primarily of losses on derivatives hedging currency risk and other-than-temporaryimpairment charges.
Nan Shan reported pre-tax income in 2010 compared to a loss in 2009 primarily due to the realized capitalgains which offset the effect of increased negative interest rate spreads.
Net income from discontinued operations also reflects a partial release of a valuation allowance attributable toan increase in estimated value to be realized on the expected sales of AIA and ALICO, which are classified asdiscontinued operations. See Note 14 to the Consolidated Financial Statements.
See Note 3 to the Consolidated Financial Statements.
Segment Results
AIG believes it should present and discuss its financial information in a manner most meaningful to its financialstatement users. In managing its businesses, AIG analyzes the operating performance of each business based onpre-tax income (loss), excluding net realized capital gains (losses), results from discontinued operations and netgains (losses) on sales of divested businesses, because AIG believes that this permits better assessment andenhances understanding of the operating performance of each business by highlighting the results from ongoingoperations and the underlying profitability of its businesses. When such measures are disclosed, reconciliations toGAAP pre-tax income are provided.
113
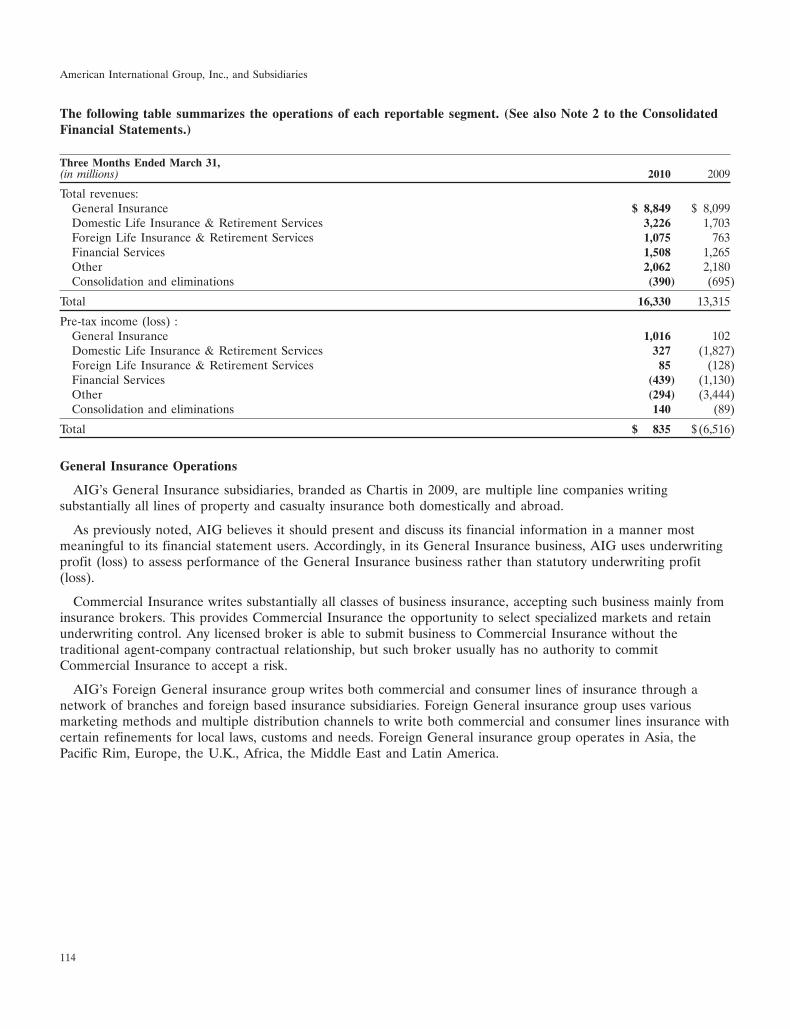
American International Group, Inc., and Subsidiaries
The following table summarizes the operations of each reportable segment. (See also Note 2 to the ConsolidatedFinancial Statements.)
Three Months Ended March 31,(in millions) 2010 2009
Total revenues:General Insurance $ 8,849 $ 8,099Domestic Life Insurance & Retirement Services 3,226 1,703Foreign Life Insurance & Retirement Services 1,075 763Financial Services 1,508 1,265Other 2,062 2,180Consolidation and eliminations (390) (695)
Total 16,330 13,315
Pre-tax income (loss) :General Insurance 1,016 102Domestic Life Insurance & Retirement Services 327 (1,827)Foreign Life Insurance & Retirement Services 85 (128)Financial Services (439) (1,130)Other (294) (3,444)Consolidation and eliminations 140 (89)
Total $ 835 $(6,516)
General Insurance Operations
AIG’s General Insurance subsidiaries, branded as Chartis in 2009, are multiple line companies writingsubstantially all lines of property and casualty insurance both domestically and abroad.
As previously noted, AIG believes it should present and discuss its financial information in a manner mostmeaningful to its financial statement users. Accordingly, in its General Insurance business, AIG uses underwritingprofit (loss) to assess performance of the General Insurance business rather than statutory underwriting profit(loss).
Commercial Insurance writes substantially all classes of business insurance, accepting such business mainly frominsurance brokers. This provides Commercial Insurance the opportunity to select specialized markets and retainunderwriting control. Any licensed broker is able to submit business to Commercial Insurance without thetraditional agent-company contractual relationship, but such broker usually has no authority to commitCommercial Insurance to accept a risk.
AIG’s Foreign General insurance group writes both commercial and consumer lines of insurance through anetwork of branches and foreign based insurance subsidiaries. Foreign General insurance group uses variousmarketing methods and multiple distribution channels to write both commercial and consumer lines insurance withcertain refinements for local laws, customs and needs. Foreign General insurance group operates in Asia, thePacific Rim, Europe, the U.K., Africa, the Middle East and Latin America.
114
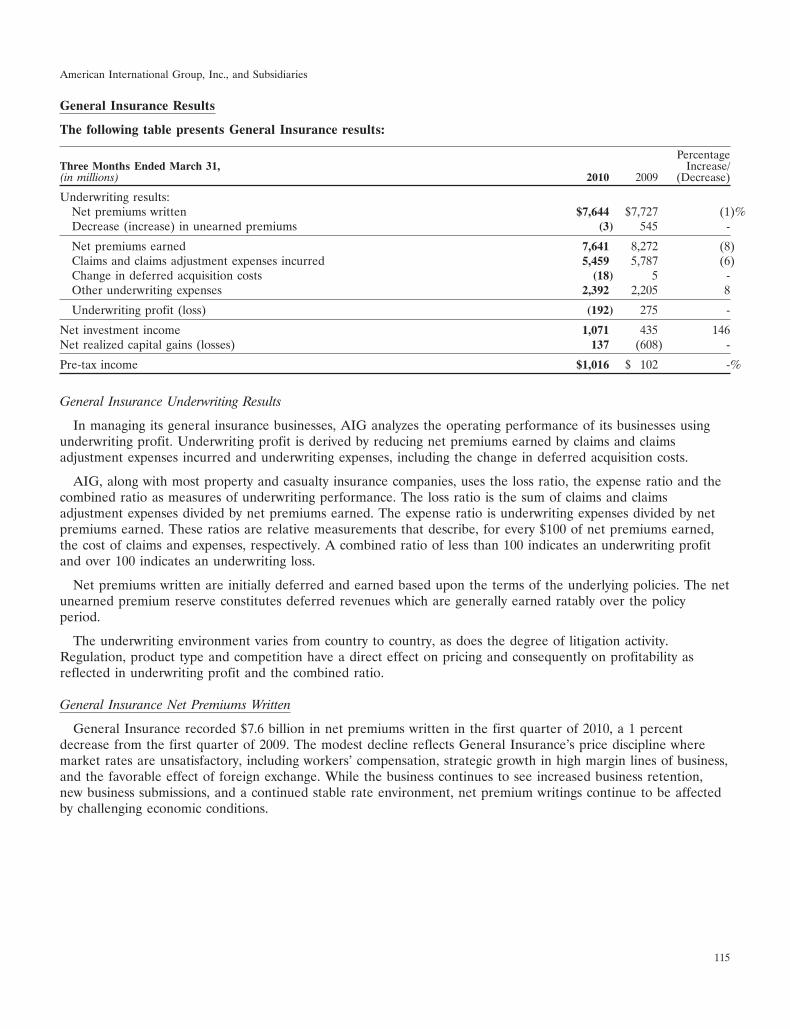
American International Group, Inc., and Subsidiaries
General Insurance Results
The following table presents General Insurance results:
PercentageThree Months Ended March 31, Increase/(in millions) 2010 2009 (Decrease)
Underwriting results:Net premiums written $7,644 $7,727 (1)%Decrease (increase) in unearned premiums (3) 545 -
Net premiums earned 7,641 8,272 (8)Claims and claims adjustment expenses incurred 5,459 5,787 (6)Change in deferred acquisition costs (18) 5 -Other underwriting expenses 2,392 2,205 8
Underwriting profit (loss) (192) 275 -
Net investment income 1,071 435 146Net realized capital gains (losses) 137 (608) -
Pre-tax income $1,016 $ 102 -%
General Insurance Underwriting Results
In managing its general insurance businesses, AIG analyzes the operating performance of its businesses usingunderwriting profit. Underwriting profit is derived by reducing net premiums earned by claims and claimsadjustment expenses incurred and underwriting expenses, including the change in deferred acquisition costs.
AIG, along with most property and casualty insurance companies, uses the loss ratio, the expense ratio and thecombined ratio as measures of underwriting performance. The loss ratio is the sum of claims and claimsadjustment expenses divided by net premiums earned. The expense ratio is underwriting expenses divided by netpremiums earned. These ratios are relative measurements that describe, for every $100 of net premiums earned,the cost of claims and expenses, respectively. A combined ratio of less than 100 indicates an underwriting profitand over 100 indicates an underwriting loss.
Net premiums written are initially deferred and earned based upon the terms of the underlying policies. The netunearned premium reserve constitutes deferred revenues which are generally earned ratably over the policyperiod.
The underwriting environment varies from country to country, as does the degree of litigation activity.Regulation, product type and competition have a direct effect on pricing and consequently on profitability asreflected in underwriting profit and the combined ratio.
General Insurance Net Premiums Written
General Insurance recorded $7.6 billion in net premiums written in the first quarter of 2010, a 1 percentdecrease from the first quarter of 2009. The modest decline reflects General Insurance’s price discipline wheremarket rates are unsatisfactory, including workers’ compensation, strategic growth in high margin lines of business,and the favorable effect of foreign exchange. While the business continues to see increased business retention,new business submissions, and a continued stable rate environment, net premium writings continue to be affectedby challenging economic conditions.
115
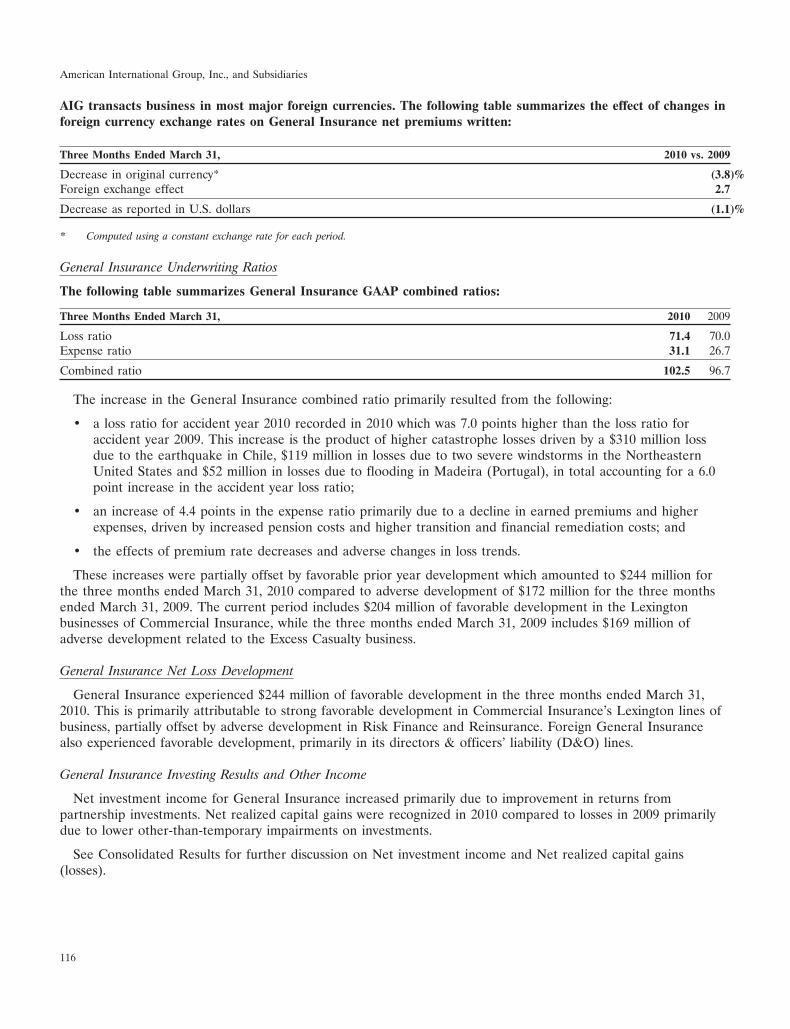
American International Group, Inc., and Subsidiaries
AIG transacts business in most major foreign currencies. The following table summarizes the effect of changes inforeign currency exchange rates on General Insurance net premiums written:
Three Months Ended March 31, 2010 vs. 2009
Decrease in original currency* (3.8)%Foreign exchange effect 2.7
Decrease as reported in U.S. dollars (1.1)%
* Computed using a constant exchange rate for each period.
General Insurance Underwriting Ratios
The following table summarizes General Insurance GAAP combined ratios:
Three Months Ended March 31, 2010 2009
Loss ratio 71.4 70.0Expense ratio 31.1 26.7
Combined ratio 102.5 96.7
The increase in the General Insurance combined ratio primarily resulted from the following:
• a loss ratio for accident year 2010 recorded in 2010 which was 7.0 points higher than the loss ratio foraccident year 2009. This increase is the product of higher catastrophe losses driven by a $310 million lossdue to the earthquake in Chile, $119 million in losses due to two severe windstorms in the NortheasternUnited States and $52 million in losses due to flooding in Madeira (Portugal), in total accounting for a 6.0point increase in the accident year loss ratio;
• an increase of 4.4 points in the expense ratio primarily due to a decline in earned premiums and higherexpenses, driven by increased pension costs and higher transition and financial remediation costs; and
• the effects of premium rate decreases and adverse changes in loss trends.
These increases were partially offset by favorable prior year development which amounted to $244 million forthe three months ended March 31, 2010 compared to adverse development of $172 million for the three monthsended March 31, 2009. The current period includes $204 million of favorable development in the Lexingtonbusinesses of Commercial Insurance, while the three months ended March 31, 2009 includes $169 million ofadverse development related to the Excess Casualty business.
General Insurance Net Loss Development
General Insurance experienced $244 million of favorable development in the three months ended March 31,2010. This is primarily attributable to strong favorable development in Commercial Insurance’s Lexington lines ofbusiness, partially offset by adverse development in Risk Finance and Reinsurance. Foreign General Insurancealso experienced favorable development, primarily in its directors & officers’ liability (D&O) lines.
General Insurance Investing Results and Other Income
Net investment income for General Insurance increased primarily due to improvement in returns frompartnership investments. Net realized capital gains were recognized in 2010 compared to losses in 2009 primarilydue to lower other-than-temporary impairments on investments.
See Consolidated Results for further discussion on Net investment income and Net realized capital gains(losses).
116
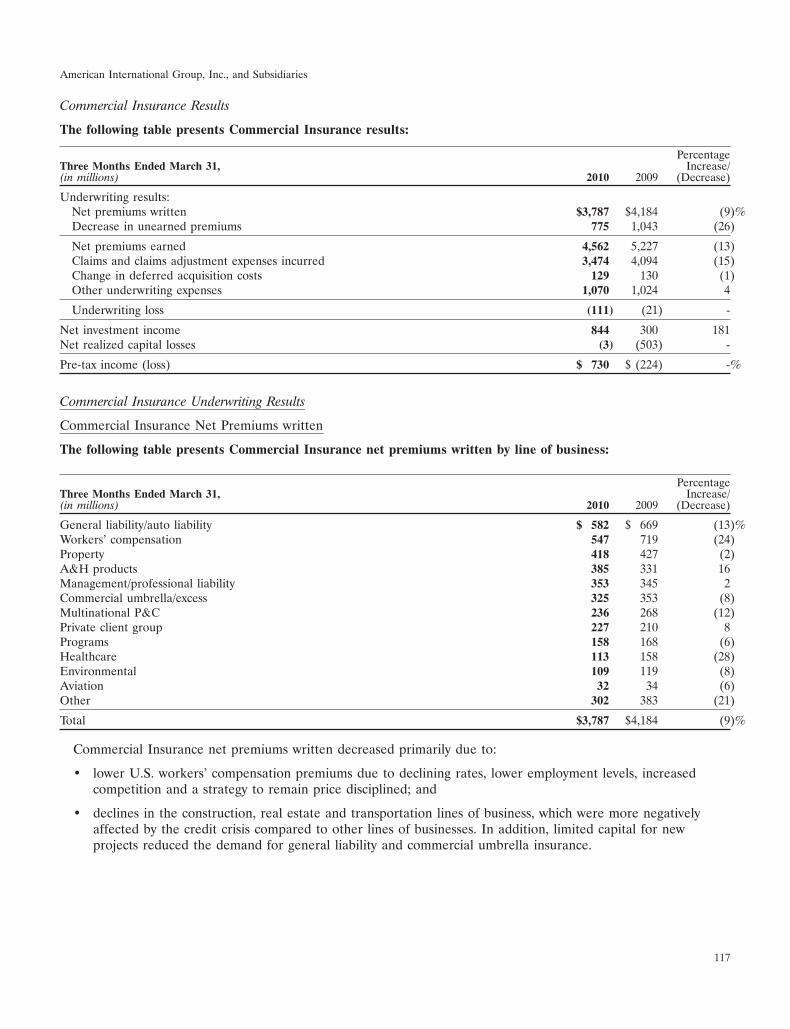
American International Group, Inc., and Subsidiaries
Commercial Insurance Results
The following table presents Commercial Insurance results:
PercentageThree Months Ended March 31, Increase/(in millions) 2010 2009 (Decrease)
Underwriting results:Net premiums written $3,787 $4,184 (9)%Decrease in unearned premiums 775 1,043 (26)
Net premiums earned 4,562 5,227 (13)Claims and claims adjustment expenses incurred 3,474 4,094 (15)Change in deferred acquisition costs 129 130 (1)Other underwriting expenses 1,070 1,024 4
Underwriting loss (111) (21) -
Net investment income 844 300 181Net realized capital losses (3) (503) -
Pre-tax income (loss) $ 730 $ (224) -%
Commercial Insurance Underwriting Results
Commercial Insurance Net Premiums written
The following table presents Commercial Insurance net premiums written by line of business:
PercentageThree Months Ended March 31, Increase/(in millions) 2010 2009 (Decrease)
General liability/auto liability $ 582 $ 669 (13)%Workers’ compensation 547 719 (24)Property 418 427 (2)A&H products 385 331 16Management/professional liability 353 345 2Commercial umbrella/excess 325 353 (8)Multinational P&C 236 268 (12)Private client group 227 210 8Programs 158 168 (6)Healthcare 113 158 (28)Environmental 109 119 (8)Aviation 32 34 (6)Other 302 383 (21)
Total $3,787 $4,184 (9)%
Commercial Insurance net premiums written decreased primarily due to:
• lower U.S. workers’ compensation premiums due to declining rates, lower employment levels, increasedcompetition and a strategy to remain price disciplined; and
• declines in the construction, real estate and transportation lines of business, which were more negativelyaffected by the credit crisis compared to other lines of businesses. In addition, limited capital for newprojects reduced the demand for general liability and commercial umbrella insurance.
117
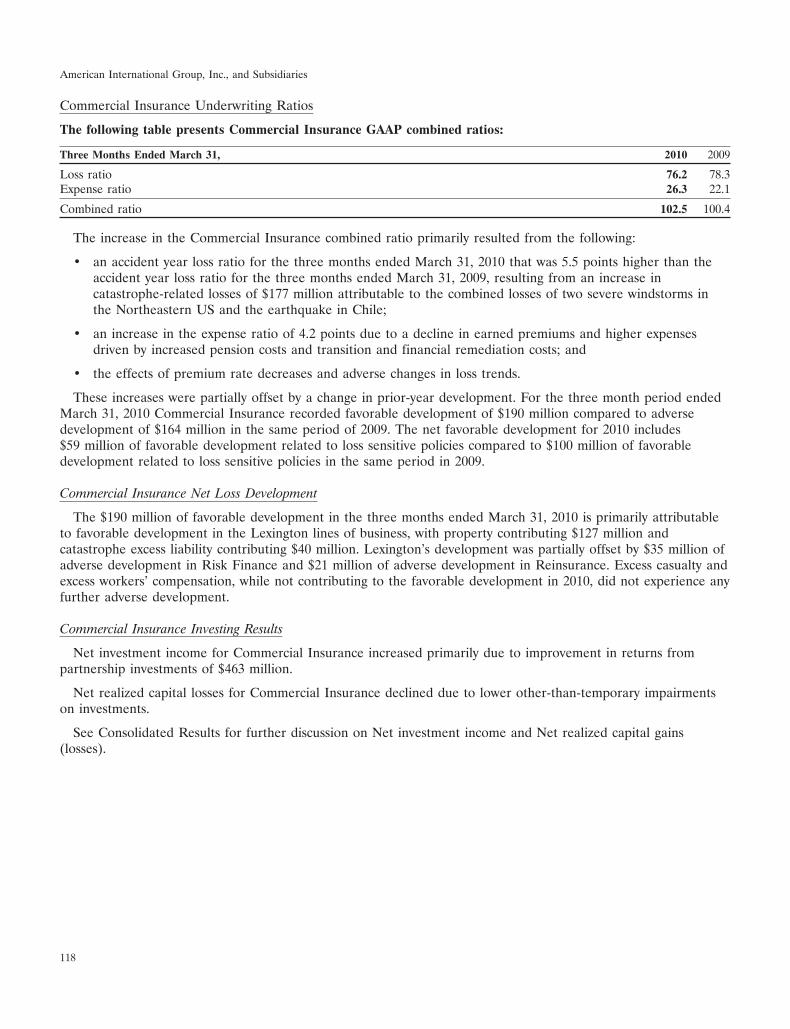
American International Group, Inc., and Subsidiaries
Commercial Insurance Underwriting Ratios
The following table presents Commercial Insurance GAAP combined ratios:
Three Months Ended March 31, 2010 2009
Loss ratio 76.2 78.3Expense ratio 26.3 22.1
Combined ratio 102.5 100.4
The increase in the Commercial Insurance combined ratio primarily resulted from the following:
• an accident year loss ratio for the three months ended March 31, 2010 that was 5.5 points higher than theaccident year loss ratio for the three months ended March 31, 2009, resulting from an increase incatastrophe-related losses of $177 million attributable to the combined losses of two severe windstorms inthe Northeastern US and the earthquake in Chile;
• an increase in the expense ratio of 4.2 points due to a decline in earned premiums and higher expensesdriven by increased pension costs and transition and financial remediation costs; and
• the effects of premium rate decreases and adverse changes in loss trends.
These increases were partially offset by a change in prior-year development. For the three month period endedMarch 31, 2010 Commercial Insurance recorded favorable development of $190 million compared to adversedevelopment of $164 million in the same period of 2009. The net favorable development for 2010 includes$59 million of favorable development related to loss sensitive policies compared to $100 million of favorabledevelopment related to loss sensitive policies in the same period in 2009.
Commercial Insurance Net Loss Development
The $190 million of favorable development in the three months ended March 31, 2010 is primarily attributableto favorable development in the Lexington lines of business, with property contributing $127 million andcatastrophe excess liability contributing $40 million. Lexington’s development was partially offset by $35 million ofadverse development in Risk Finance and $21 million of adverse development in Reinsurance. Excess casualty andexcess workers’ compensation, while not contributing to the favorable development in 2010, did not experience anyfurther adverse development.
Commercial Insurance Investing Results
Net investment income for Commercial Insurance increased primarily due to improvement in returns frompartnership investments of $463 million.
Net realized capital losses for Commercial Insurance declined due to lower other-than-temporary impairmentson investments.
See Consolidated Results for further discussion on Net investment income and Net realized capital gains(losses).
118

American International Group, Inc., and Subsidiaries
Foreign General Insurance Results
The following table presents Foreign General Insurance results:
PercentageThree Months Ended March 31, Increase/(in millions) 2010 2009 (Decrease)
Underwriting results:Net premiums written $3,857 $3,543 9%Increase in unearned premiums (778) (498) -
Net premiums earned 3,079 3,045 1Claims and claims adjustment expenses incurred 1,985 1,693 17Change in deferred acquisition costs (147) (125) -Other underwriting expenses 1,322 1,181 12
Underwriting profit (loss) (81) 296 -
Net investment income 227 135 68Net realized capital gains (losses) 140 (105) -
Pre-tax income $ 286 $ 326 (12)%
Foreign General Insurance Underwriting Results
Foreign General Insurance Net Premiums Written
The following table presents Foreign General Insurance net premiums written by line of business:
PercentageThree Months Ended March 31, Increase/(in millions) 2010 2009 (Decrease)
A&H products $ 982 $ 937 5%Specialty lines 781 689 13Casualty 671 579 16Personal lines 567 553 3Marine & Energy 259 204 27Lloyds 235 231 2Property 174 165 5Aviation 104 102 2Other 84 83 1
Total $3,857 $3,543 9%
Foreign General Insurance net premiums written increased primarily due to:
• positive effect of changes in foreign exchange rates, which contributed 6 percent to the increase; and
• new business as global economic conditions improved.
From a regional perspective, Europe achieved growth of 6.0 percent in its critical renewal season. In addition,positive growth of 1.6 percent in the U.K and Ireland operations contributed to the continuing upward trend inproduction since the third quarter of 2009 which is attributable to improved retention and strong new businesssubmissions.
119
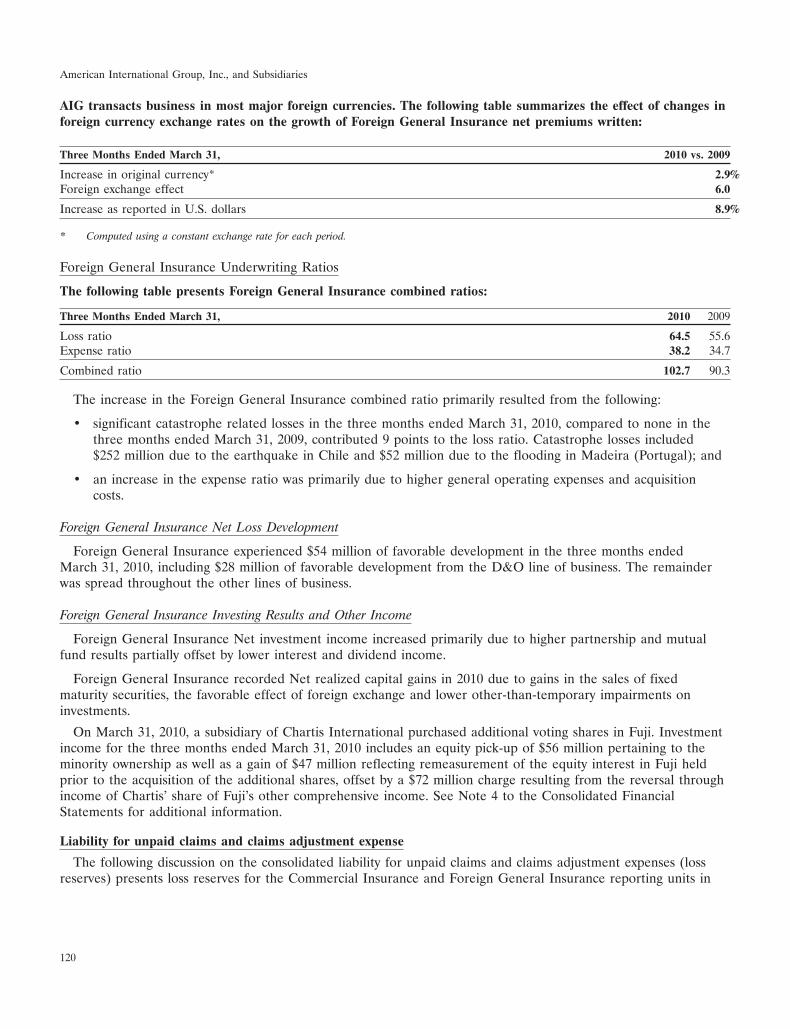
American International Group, Inc., and Subsidiaries
AIG transacts business in most major foreign currencies. The following table summarizes the effect of changes inforeign currency exchange rates on the growth of Foreign General Insurance net premiums written:
Three Months Ended March 31, 2010 vs. 2009
Increase in original currency* 2.9%Foreign exchange effect 6.0
Increase as reported in U.S. dollars 8.9%
* Computed using a constant exchange rate for each period.
Foreign General Insurance Underwriting Ratios
The following table presents Foreign General Insurance combined ratios:
Three Months Ended March 31, 2010 2009
Loss ratio 64.5 55.6Expense ratio 38.2 34.7
Combined ratio 102.7 90.3
The increase in the Foreign General Insurance combined ratio primarily resulted from the following:
• significant catastrophe related losses in the three months ended March 31, 2010, compared to none in thethree months ended March 31, 2009, contributed 9 points to the loss ratio. Catastrophe losses included$252 million due to the earthquake in Chile and $52 million due to the flooding in Madeira (Portugal); and
• an increase in the expense ratio was primarily due to higher general operating expenses and acquisitioncosts.
Foreign General Insurance Net Loss Development
Foreign General Insurance experienced $54 million of favorable development in the three months endedMarch 31, 2010, including $28 million of favorable development from the D&O line of business. The remainderwas spread throughout the other lines of business.
Foreign General Insurance Investing Results and Other Income
Foreign General Insurance Net investment income increased primarily due to higher partnership and mutualfund results partially offset by lower interest and dividend income.
Foreign General Insurance recorded Net realized capital gains in 2010 due to gains in the sales of fixedmaturity securities, the favorable effect of foreign exchange and lower other-than-temporary impairments oninvestments.
On March 31, 2010, a subsidiary of Chartis International purchased additional voting shares in Fuji. Investmentincome for the three months ended March 31, 2010 includes an equity pick-up of $56 million pertaining to theminority ownership as well as a gain of $47 million reflecting remeasurement of the equity interest in Fuji heldprior to the acquisition of the additional shares, offset by a $72 million charge resulting from the reversal throughincome of Chartis’ share of Fuji’s other comprehensive income. See Note 4 to the Consolidated FinancialStatements for additional information.
Liability for unpaid claims and claims adjustment expense
The following discussion on the consolidated liability for unpaid claims and claims adjustment expenses (lossreserves) presents loss reserves for the Commercial Insurance and Foreign General Insurance reporting units in
120
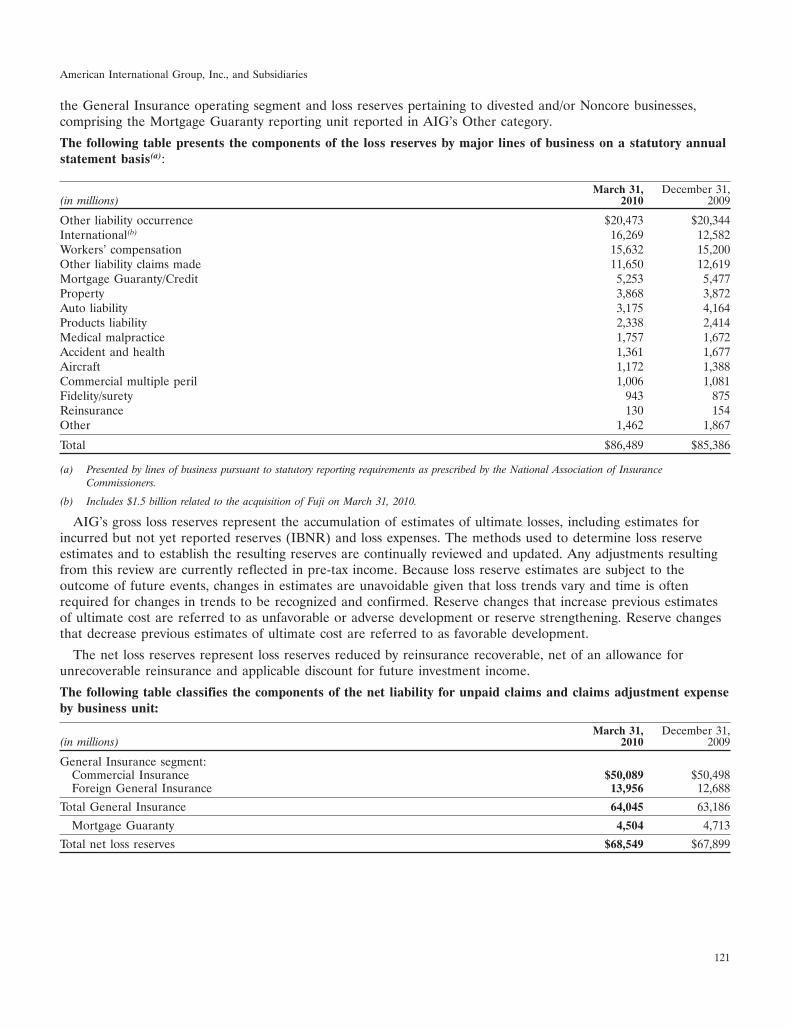
American International Group, Inc., and Subsidiaries
the General Insurance operating segment and loss reserves pertaining to divested and/or Noncore businesses,comprising the Mortgage Guaranty reporting unit reported in AIG’s Other category.
The following table presents the components of the loss reserves by major lines of business on a statutory annualstatement basis(a):
March 31, December 31,(in millions) 2010 2009
Other liability occurrence $20,473 $20,344International(b) 16,269 12,582Workers’ compensation 15,632 15,200Other liability claims made 11,650 12,619Mortgage Guaranty/Credit 5,253 5,477Property 3,868 3,872Auto liability 3,175 4,164Products liability 2,338 2,414Medical malpractice 1,757 1,672Accident and health 1,361 1,677Aircraft 1,172 1,388Commercial multiple peril 1,006 1,081Fidelity/surety 943 875Reinsurance 130 154Other 1,462 1,867
Total $86,489 $85,386
(a) Presented by lines of business pursuant to statutory reporting requirements as prescribed by the National Association of InsuranceCommissioners.
(b) Includes $1.5 billion related to the acquisition of Fuji on March 31, 2010.
AIG’s gross loss reserves represent the accumulation of estimates of ultimate losses, including estimates forincurred but not yet reported reserves (IBNR) and loss expenses. The methods used to determine loss reserveestimates and to establish the resulting reserves are continually reviewed and updated. Any adjustments resultingfrom this review are currently reflected in pre-tax income. Because loss reserve estimates are subject to theoutcome of future events, changes in estimates are unavoidable given that loss trends vary and time is oftenrequired for changes in trends to be recognized and confirmed. Reserve changes that increase previous estimatesof ultimate cost are referred to as unfavorable or adverse development or reserve strengthening. Reserve changesthat decrease previous estimates of ultimate cost are referred to as favorable development.
The net loss reserves represent loss reserves reduced by reinsurance recoverable, net of an allowance forunrecoverable reinsurance and applicable discount for future investment income.
The following table classifies the components of the net liability for unpaid claims and claims adjustment expenseby business unit:
March 31, December 31,(in millions) 2010 2009
General Insurance segment:Commercial Insurance $50,089 $50,498Foreign General Insurance 13,956 12,688
Total General Insurance 64,045 63,186
Mortgage Guaranty 4,504 4,713
Total net loss reserves $68,549 $67,899
121

American International Group, Inc., and Subsidiaries
Discounting of Reserves
At March 31, 2010, net loss reserves reflect a loss reserve discount of $2.66 billion, including tabular andnon-tabular calculations. The tabular workers’ compensation discount is calculated using a 3.5 percent interest rateand the 1979-81 Decennial Mortality Table. The non-tabular workers’ compensation discount is calculatedseparately for companies domiciled in New York and Pennsylvania, and follows the statutory regulations for eachstate. For New York companies, the discount is based on a five percent interest rate and the companies’ ownpayout patterns. For Pennsylvania companies, the statute has specified discount factors for accident years 2001 andprior, which are based on a six percent interest rate and an industry payout pattern. For accident years 2002 andsubsequent, the discount is based on the payout patterns and investment yields of the companies. The discount iscomprised of the following: $669 million — tabular discount for workers’ compensation in Commercial Insuranceand $1.99 billion — non-tabular discount for workers’ compensation in Commercial Insurance.
Quarterly Reserving Process
AIG believes that the net loss reserves are adequate to cover net losses and loss expenses as of March 31, 2010.While AIG regularly reviews the adequacy of established loss reserves, there can be no assurance that AIG’sultimate loss reserves will not develop adversely and materially exceed AIG’s loss reserves as of March 31, 2010.In the opinion of management, such adverse development and resulting increase in reserves is not likely to have amaterial adverse effect on AIG’s consolidated financial condition, although it could have a material adverse effecton AIG’s consolidated results of operations for an individual reporting period.
The following table presents the reconciliation of net loss reserves:
Three Months Ended March 31,(in millions) 2010 2009
Net liability for unpaid claims and claims adjustment expense at beginning of year $67,899 $72,455Foreign exchange effect (553) (290)Acquisitions(a) 1,538 -Dispositions (25) (287)(b)
Losses and loss expenses incurred:(c)
Current year 5,998 7,862Prior years, other than accretion of discount (476) 64Prior years, accretion of discount 86 98
Losses and loss expenses incurred 5,608 8,024
Losses and loss expenses paid(c) 5,916 7,648
Reclassified to liabilities of businesses held for sale (2) -
Net liability for unpaid claims and claims adjustment expense at end of period $68,549 $72,254
(a) Represents the acquisition of Fuji on March 31, 2010.
(b) HSB was sold during the first quarter of 2009.
(c) Includes amounts related to dispositions through the date of disposition.
122
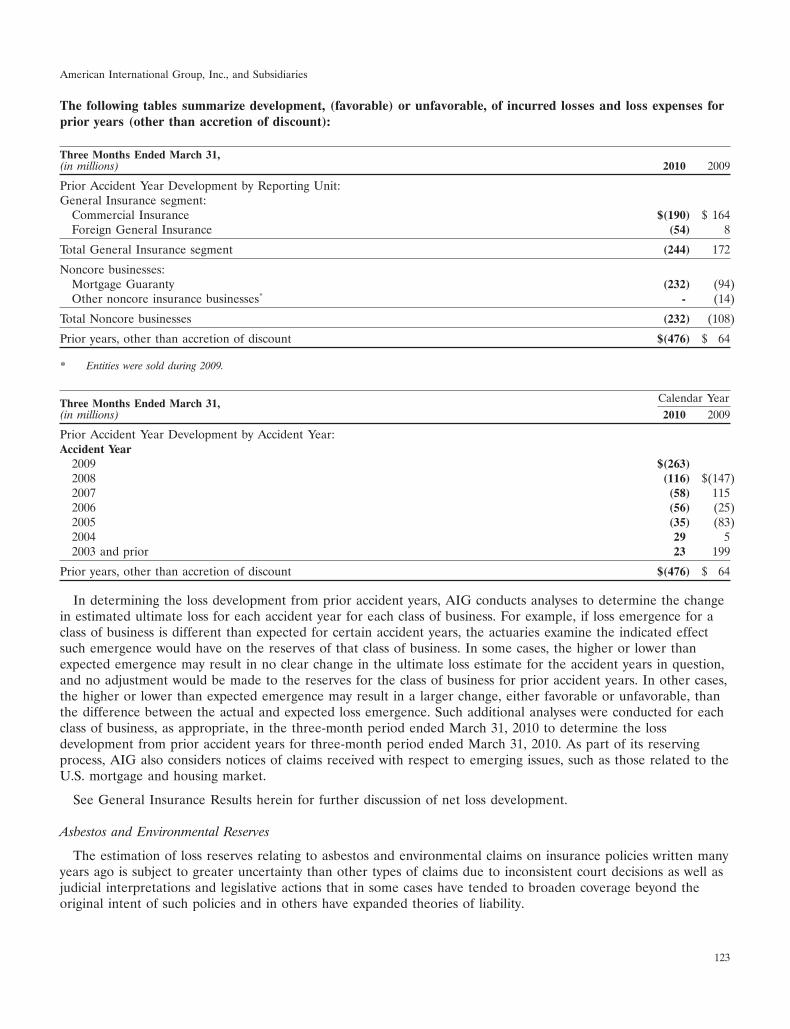
American International Group, Inc., and Subsidiaries
The following tables summarize development, (favorable) or unfavorable, of incurred losses and loss expenses forprior years (other than accretion of discount):
Three Months Ended March 31,(in millions) 2010 2009
Prior Accident Year Development by Reporting Unit:General Insurance segment:
Commercial Insurance $(190) $ 164Foreign General Insurance (54) 8
Total General Insurance segment (244) 172
Noncore businesses:Mortgage Guaranty (232) (94)Other noncore insurance businesses* - (14)
Total Noncore businesses (232) (108)
Prior years, other than accretion of discount $(476) $ 64
* Entities were sold during 2009.
Calendar YearThree Months Ended March 31,(in millions) 2010 2009
Prior Accident Year Development by Accident Year:Accident Year
2009 $(263)2008 (116) $(147)2007 (58) 1152006 (56) (25)2005 (35) (83)2004 29 52003 and prior 23 199
Prior years, other than accretion of discount $(476) $ 64
In determining the loss development from prior accident years, AIG conducts analyses to determine the changein estimated ultimate loss for each accident year for each class of business. For example, if loss emergence for aclass of business is different than expected for certain accident years, the actuaries examine the indicated effectsuch emergence would have on the reserves of that class of business. In some cases, the higher or lower thanexpected emergence may result in no clear change in the ultimate loss estimate for the accident years in question,and no adjustment would be made to the reserves for the class of business for prior accident years. In other cases,the higher or lower than expected emergence may result in a larger change, either favorable or unfavorable, thanthe difference between the actual and expected loss emergence. Such additional analyses were conducted for eachclass of business, as appropriate, in the three-month period ended March 31, 2010 to determine the lossdevelopment from prior accident years for three-month period ended March 31, 2010. As part of its reservingprocess, AIG also considers notices of claims received with respect to emerging issues, such as those related to theU.S. mortgage and housing market.
See General Insurance Results herein for further discussion of net loss development.
Asbestos and Environmental Reserves
The estimation of loss reserves relating to asbestos and environmental claims on insurance policies written manyyears ago is subject to greater uncertainty than other types of claims due to inconsistent court decisions as well asjudicial interpretations and legislative actions that in some cases have tended to broaden coverage beyond theoriginal intent of such policies and in others have expanded theories of liability.
123
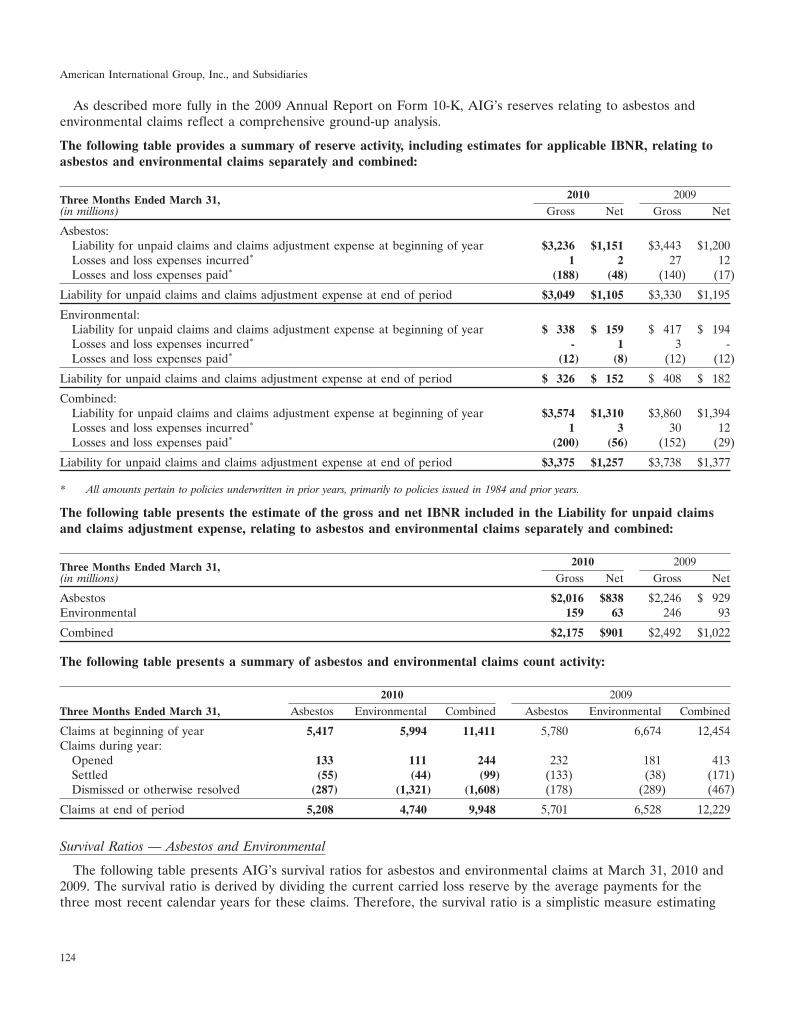
American International Group, Inc., and Subsidiaries
As described more fully in the 2009 Annual Report on Form 10-K, AIG’s reserves relating to asbestos andenvironmental claims reflect a comprehensive ground-up analysis.
The following table provides a summary of reserve activity, including estimates for applicable IBNR, relating toasbestos and environmental claims separately and combined:
2010 2009Three Months Ended March 31,(in millions) Gross Net Gross Net
Asbestos:Liability for unpaid claims and claims adjustment expense at beginning of year $3,236 $1,151 $3,443 $1,200Losses and loss expenses incurred* 1 2 27 12Losses and loss expenses paid* (188) (48) (140) (17)
Liability for unpaid claims and claims adjustment expense at end of period $3,049 $1,105 $3,330 $1,195
Environmental:Liability for unpaid claims and claims adjustment expense at beginning of year $ 338 $ 159 $ 417 $ 194Losses and loss expenses incurred* - 1 3 -Losses and loss expenses paid* (12) (8) (12) (12)
Liability for unpaid claims and claims adjustment expense at end of period $ 326 $ 152 $ 408 $ 182
Combined:Liability for unpaid claims and claims adjustment expense at beginning of year $3,574 $1,310 $3,860 $1,394Losses and loss expenses incurred* 1 3 30 12Losses and loss expenses paid* (200) (56) (152) (29)
Liability for unpaid claims and claims adjustment expense at end of period $3,375 $1,257 $3,738 $1,377
* All amounts pertain to policies underwritten in prior years, primarily to policies issued in 1984 and prior years.
The following table presents the estimate of the gross and net IBNR included in the Liability for unpaid claimsand claims adjustment expense, relating to asbestos and environmental claims separately and combined:
2010 2009Three Months Ended March 31,(in millions) Gross Net Gross Net
Asbestos $2,016 $838 $2,246 $ 929Environmental 159 63 246 93
Combined $2,175 $901 $2,492 $1,022
The following table presents a summary of asbestos and environmental claims count activity:
2010 2009Three Months Ended March 31, Asbestos Environmental Combined Asbestos Environmental Combined
Claims at beginning of year 5,417 5,994 11,411 5,780 6,674 12,454Claims during year:
Opened 133 111 244 232 181 413Settled (55) (44) (99) (133) (38) (171)Dismissed or otherwise resolved (287) (1,321) (1,608) (178) (289) (467)
Claims at end of period 5,208 4,740 9,948 5,701 6,528 12,229
Survival Ratios — Asbestos and Environmental
The following table presents AIG’s survival ratios for asbestos and environmental claims at March 31, 2010 and2009. The survival ratio is derived by dividing the current carried loss reserve by the average payments for thethree most recent calendar years for these claims. Therefore, the survival ratio is a simplistic measure estimating
124
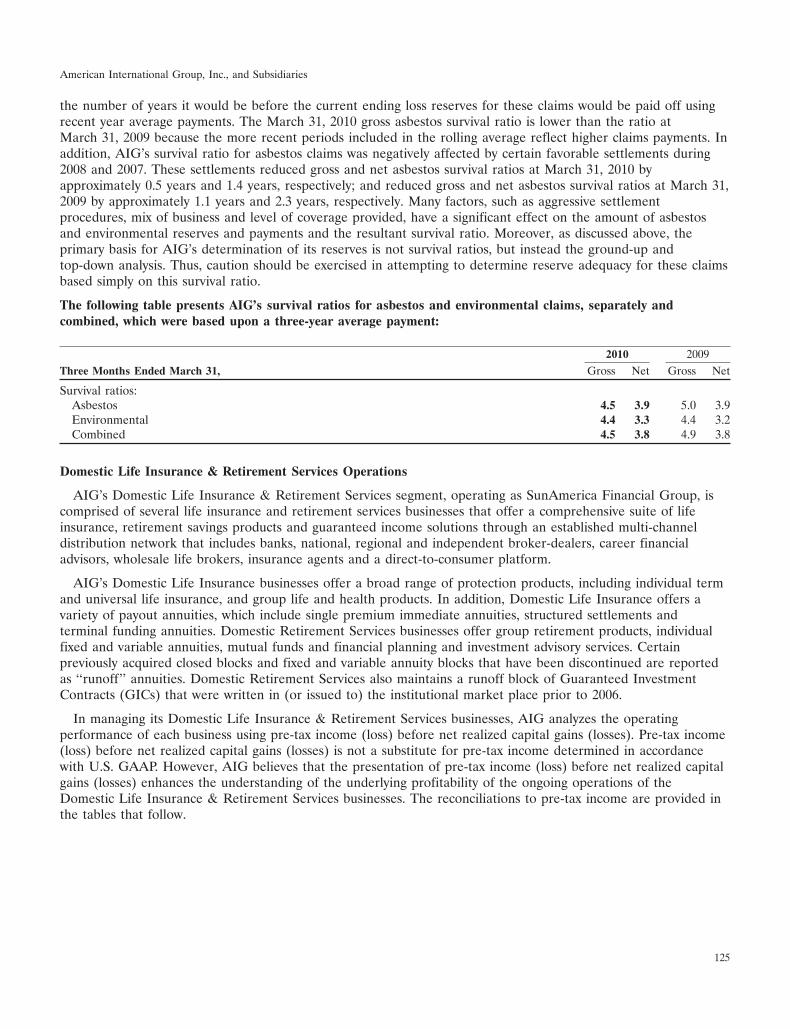
American International Group, Inc., and Subsidiaries
the number of years it would be before the current ending loss reserves for these claims would be paid off usingrecent year average payments. The March 31, 2010 gross asbestos survival ratio is lower than the ratio atMarch 31, 2009 because the more recent periods included in the rolling average reflect higher claims payments. Inaddition, AIG’s survival ratio for asbestos claims was negatively affected by certain favorable settlements during2008 and 2007. These settlements reduced gross and net asbestos survival ratios at March 31, 2010 byapproximately 0.5 years and 1.4 years, respectively; and reduced gross and net asbestos survival ratios at March 31,2009 by approximately 1.1 years and 2.3 years, respectively. Many factors, such as aggressive settlementprocedures, mix of business and level of coverage provided, have a significant effect on the amount of asbestosand environmental reserves and payments and the resultant survival ratio. Moreover, as discussed above, theprimary basis for AIG’s determination of its reserves is not survival ratios, but instead the ground-up andtop-down analysis. Thus, caution should be exercised in attempting to determine reserve adequacy for these claimsbased simply on this survival ratio.
The following table presents AIG’s survival ratios for asbestos and environmental claims, separately andcombined, which were based upon a three-year average payment:
2010 2009Three Months Ended March 31, Gross Net Gross Net
Survival ratios:Asbestos 4.5 3.9 5.0 3.9Environmental 4.4 3.3 4.4 3.2Combined 4.5 3.8 4.9 3.8
Domestic Life Insurance & Retirement Services Operations
AIG’s Domestic Life Insurance & Retirement Services segment, operating as SunAmerica Financial Group, iscomprised of several life insurance and retirement services businesses that offer a comprehensive suite of lifeinsurance, retirement savings products and guaranteed income solutions through an established multi-channeldistribution network that includes banks, national, regional and independent broker-dealers, career financialadvisors, wholesale life brokers, insurance agents and a direct-to-consumer platform.
AIG’s Domestic Life Insurance businesses offer a broad range of protection products, including individual termand universal life insurance, and group life and health products. In addition, Domestic Life Insurance offers avariety of payout annuities, which include single premium immediate annuities, structured settlements andterminal funding annuities. Domestic Retirement Services businesses offer group retirement products, individualfixed and variable annuities, mutual funds and financial planning and investment advisory services. Certainpreviously acquired closed blocks and fixed and variable annuity blocks that have been discontinued are reportedas ‘‘runoff’’ annuities. Domestic Retirement Services also maintains a runoff block of Guaranteed InvestmentContracts (GICs) that were written in (or issued to) the institutional market place prior to 2006.
In managing its Domestic Life Insurance & Retirement Services businesses, AIG analyzes the operatingperformance of each business using pre-tax income (loss) before net realized capital gains (losses). Pre-tax income(loss) before net realized capital gains (losses) is not a substitute for pre-tax income determined in accordancewith U.S. GAAP. However, AIG believes that the presentation of pre-tax income (loss) before net realized capitalgains (losses) enhances the understanding of the underlying profitability of the ongoing operations of theDomestic Life Insurance & Retirement Services businesses. The reconciliations to pre-tax income are provided inthe tables that follow.
125
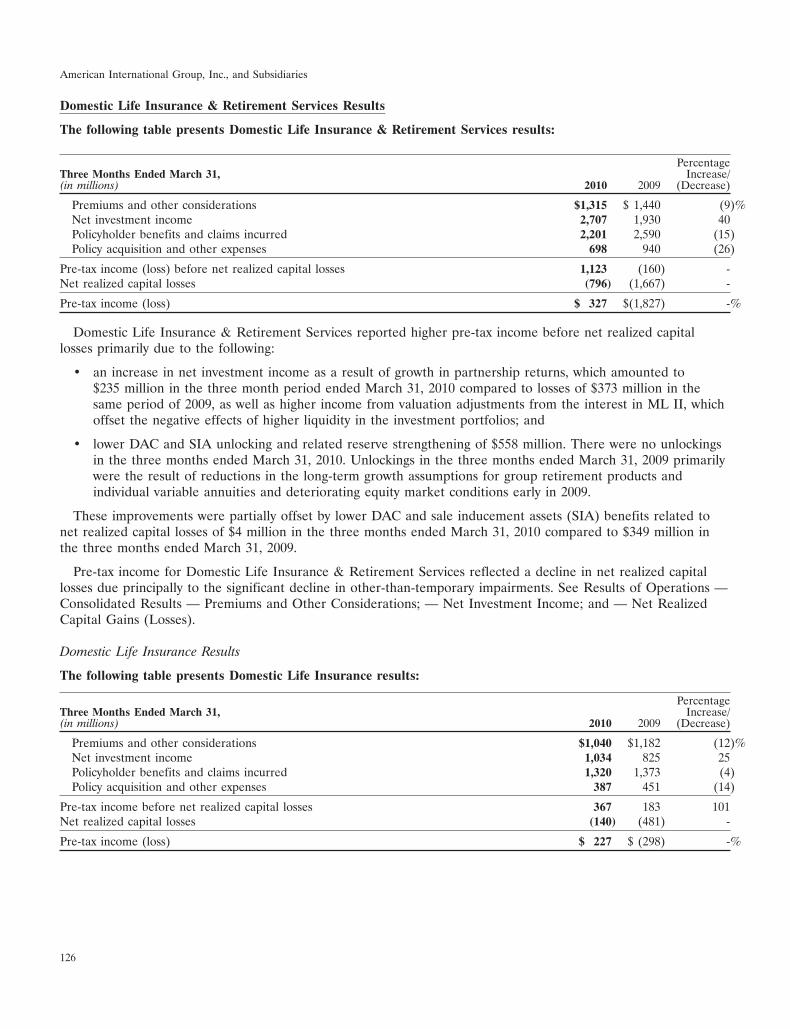
American International Group, Inc., and Subsidiaries
Domestic Life Insurance & Retirement Services Results
The following table presents Domestic Life Insurance & Retirement Services results:
PercentageThree Months Ended March 31, Increase/(in millions) 2010 2009 (Decrease)
Premiums and other considerations $1,315 $ 1,440 (9)%Net investment income 2,707 1,930 40Policyholder benefits and claims incurred 2,201 2,590 (15)Policy acquisition and other expenses 698 940 (26)
Pre-tax income (loss) before net realized capital losses 1,123 (160) -Net realized capital losses (796) (1,667) -
Pre-tax income (loss) $ 327 $(1,827) -%
Domestic Life Insurance & Retirement Services reported higher pre-tax income before net realized capitallosses primarily due to the following:
• an increase in net investment income as a result of growth in partnership returns, which amounted to$235 million in the three month period ended March 31, 2010 compared to losses of $373 million in thesame period of 2009, as well as higher income from valuation adjustments from the interest in ML II, whichoffset the negative effects of higher liquidity in the investment portfolios; and
• lower DAC and SIA unlocking and related reserve strengthening of $558 million. There were no unlockingsin the three months ended March 31, 2010. Unlockings in the three months ended March 31, 2009 primarilywere the result of reductions in the long-term growth assumptions for group retirement products andindividual variable annuities and deteriorating equity market conditions early in 2009.
These improvements were partially offset by lower DAC and sale inducement assets (SIA) benefits related tonet realized capital losses of $4 million in the three months ended March 31, 2010 compared to $349 million inthe three months ended March 31, 2009.
Pre-tax income for Domestic Life Insurance & Retirement Services reflected a decline in net realized capitallosses due principally to the significant decline in other-than-temporary impairments. See Results of Operations —Consolidated Results — Premiums and Other Considerations; — Net Investment Income; and — Net RealizedCapital Gains (Losses).
Domestic Life Insurance Results
The following table presents Domestic Life Insurance results:
PercentageThree Months Ended March 31, Increase/(in millions) 2010 2009 (Decrease)
Premiums and other considerations $1,040 $1,182 (12)%Net investment income 1,034 825 25Policyholder benefits and claims incurred 1,320 1,373 (4)Policy acquisition and other expenses 387 451 (14)
Pre-tax income before net realized capital losses 367 183 101Net realized capital losses (140) (481) -
Pre-tax income (loss) $ 227 $ (298) -%
126
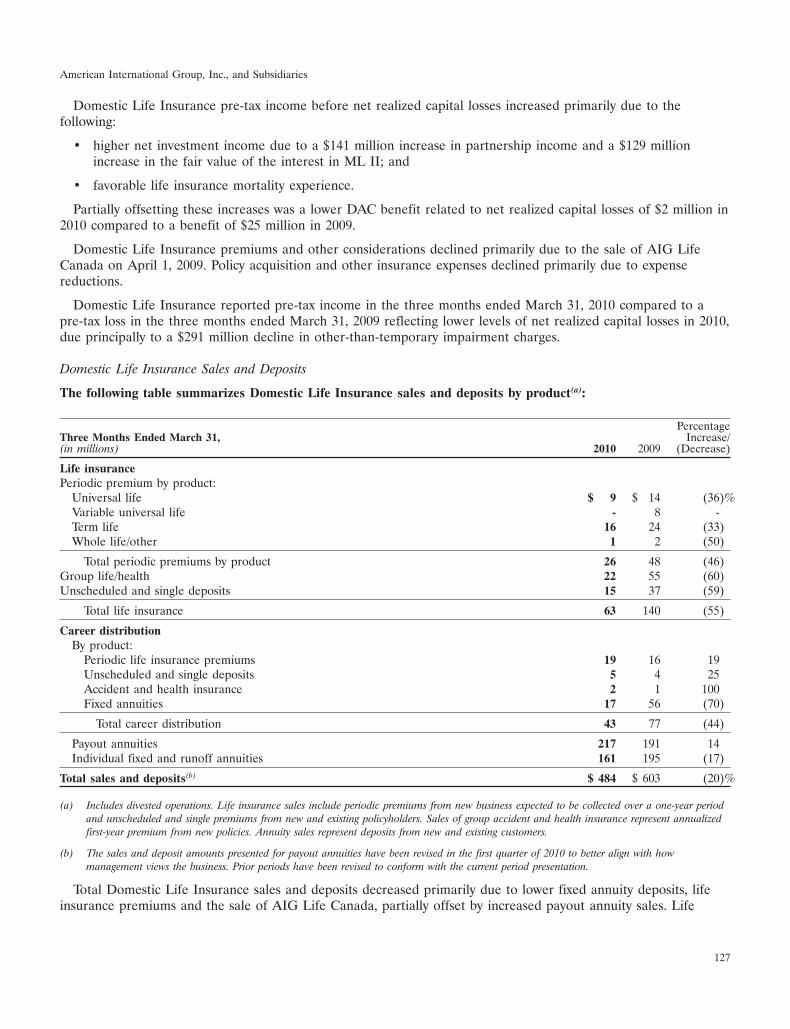
American International Group, Inc., and Subsidiaries
Domestic Life Insurance pre-tax income before net realized capital losses increased primarily due to thefollowing:
• higher net investment income due to a $141 million increase in partnership income and a $129 millionincrease in the fair value of the interest in ML II; and
• favorable life insurance mortality experience.
Partially offsetting these increases was a lower DAC benefit related to net realized capital losses of $2 million in2010 compared to a benefit of $25 million in 2009.
Domestic Life Insurance premiums and other considerations declined primarily due to the sale of AIG LifeCanada on April 1, 2009. Policy acquisition and other insurance expenses declined primarily due to expensereductions.
Domestic Life Insurance reported pre-tax income in the three months ended March 31, 2010 compared to apre-tax loss in the three months ended March 31, 2009 reflecting lower levels of net realized capital losses in 2010,due principally to a $291 million decline in other-than-temporary impairment charges.
Domestic Life Insurance Sales and Deposits
The following table summarizes Domestic Life Insurance sales and deposits by product(a):
PercentageThree Months Ended March 31, Increase/(in millions) 2010 2009 (Decrease)
Life insurancePeriodic premium by product:
Universal life $ 9 $ 14 (36)%Variable universal life - 8 -Term life 16 24 (33)Whole life/other 1 2 (50)
Total periodic premiums by product 26 48 (46)Group life/health 22 55 (60)Unscheduled and single deposits 15 37 (59)
Total life insurance 63 140 (55)
Career distributionBy product:
Periodic life insurance premiums 19 16 19Unscheduled and single deposits 5 4 25Accident and health insurance 2 1 100Fixed annuities 17 56 (70)
Total career distribution 43 77 (44)
Payout annuities 217 191 14Individual fixed and runoff annuities 161 195 (17)
Total sales and deposits(b) $ 484 $ 603 (20)%
(a) Includes divested operations. Life insurance sales include periodic premiums from new business expected to be collected over a one-year periodand unscheduled and single premiums from new and existing policyholders. Sales of group accident and health insurance represent annualizedfirst-year premium from new policies. Annuity sales represent deposits from new and existing customers.
(b) The sales and deposit amounts presented for payout annuities have been revised in the first quarter of 2010 to better align with howmanagement views the business. Prior periods have been revised to conform with the current period presentation.
Total Domestic Life Insurance sales and deposits decreased primarily due to lower fixed annuity deposits, lifeinsurance premiums and the sale of AIG Life Canada, partially offset by increased payout annuity sales. Life
127
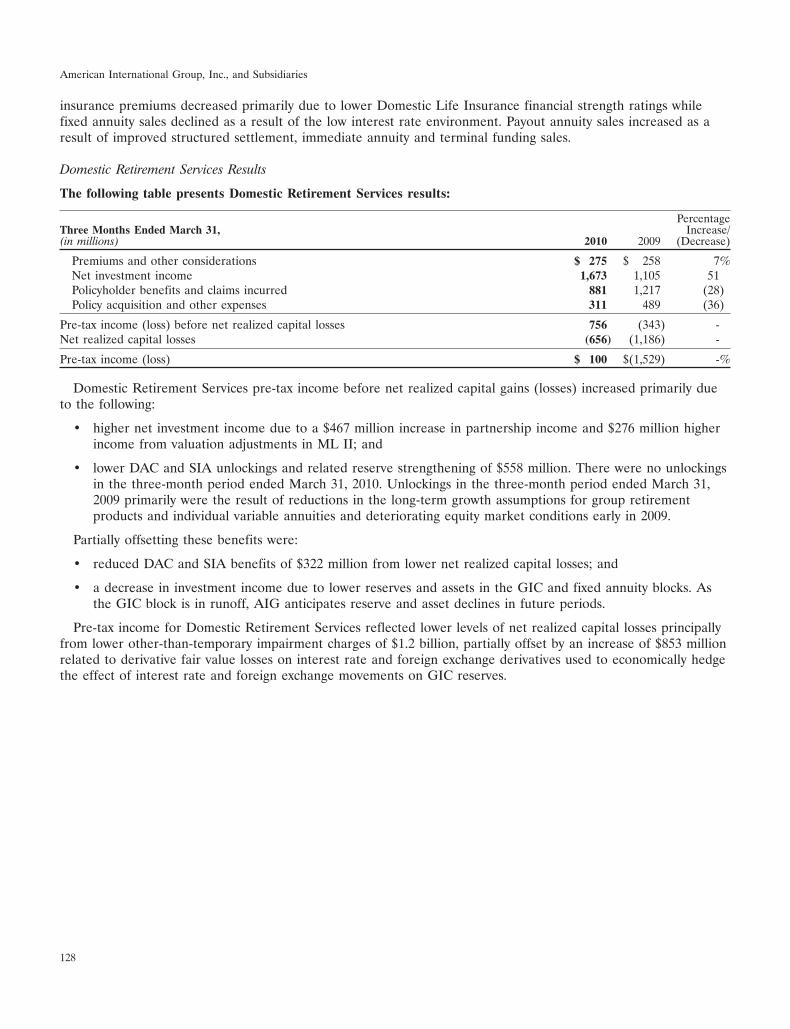
American International Group, Inc., and Subsidiaries
insurance premiums decreased primarily due to lower Domestic Life Insurance financial strength ratings whilefixed annuity sales declined as a result of the low interest rate environment. Payout annuity sales increased as aresult of improved structured settlement, immediate annuity and terminal funding sales.
Domestic Retirement Services Results
The following table presents Domestic Retirement Services results:
PercentageThree Months Ended March 31, Increase/(in millions) 2010 2009 (Decrease)
Premiums and other considerations $ 275 $ 258 7%Net investment income 1,673 1,105 51Policyholder benefits and claims incurred 881 1,217 (28)Policy acquisition and other expenses 311 489 (36)
Pre-tax income (loss) before net realized capital losses 756 (343) -Net realized capital losses (656) (1,186) -
Pre-tax income (loss) $ 100 $(1,529) -%
Domestic Retirement Services pre-tax income before net realized capital gains (losses) increased primarily dueto the following:
• higher net investment income due to a $467 million increase in partnership income and $276 million higherincome from valuation adjustments in ML II; and
• lower DAC and SIA unlockings and related reserve strengthening of $558 million. There were no unlockingsin the three-month period ended March 31, 2010. Unlockings in the three-month period ended March 31,2009 primarily were the result of reductions in the long-term growth assumptions for group retirementproducts and individual variable annuities and deteriorating equity market conditions early in 2009.
Partially offsetting these benefits were:
• reduced DAC and SIA benefits of $322 million from lower net realized capital losses; and
• a decrease in investment income due to lower reserves and assets in the GIC and fixed annuity blocks. Asthe GIC block is in runoff, AIG anticipates reserve and asset declines in future periods.
Pre-tax income for Domestic Retirement Services reflected lower levels of net realized capital losses principallyfrom lower other-than-temporary impairment charges of $1.2 billion, partially offset by an increase of $853 millionrelated to derivative fair value losses on interest rate and foreign exchange derivatives used to economically hedgethe effect of interest rate and foreign exchange movements on GIC reserves.
128
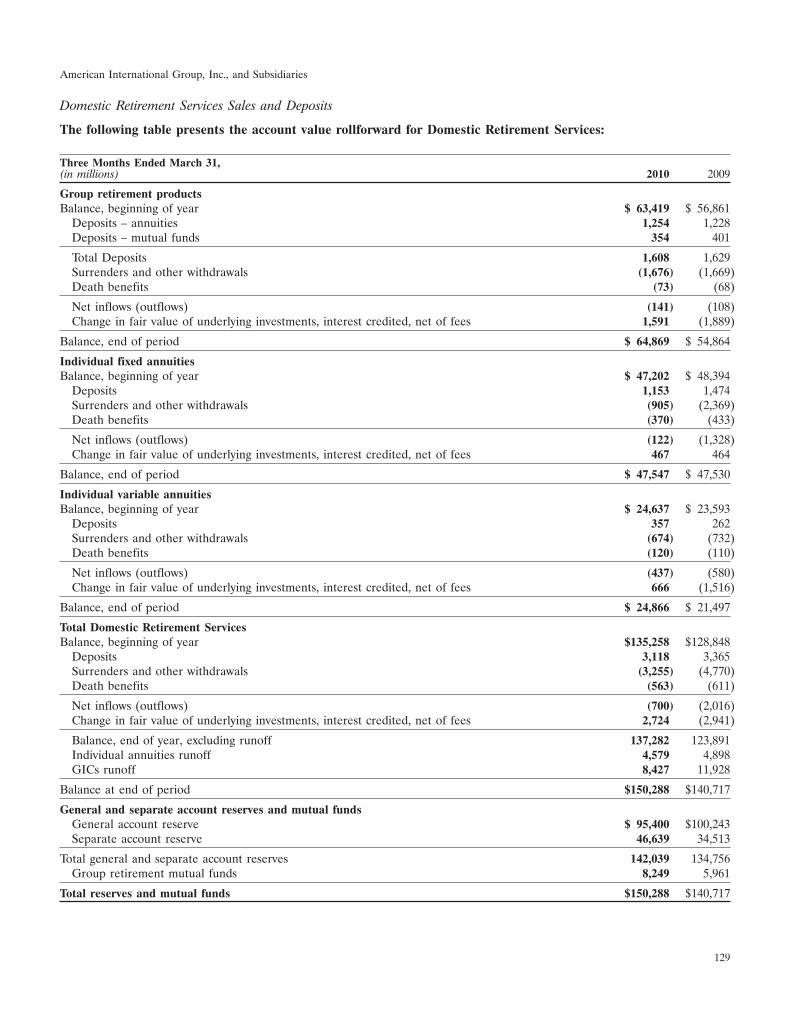
American International Group, Inc., and Subsidiaries
Domestic Retirement Services Sales and Deposits
The following table presents the account value rollforward for Domestic Retirement Services:
Three Months Ended March 31,(in millions) 2010 2009
Group retirement productsBalance, beginning of year $ 63,419 $ 56,861
Deposits – annuities 1,254 1,228Deposits – mutual funds 354 401
Total Deposits 1,608 1,629Surrenders and other withdrawals (1,676) (1,669)Death benefits (73) (68)
Net inflows (outflows) (141) (108)Change in fair value of underlying investments, interest credited, net of fees 1,591 (1,889)
Balance, end of period $ 64,869 $ 54,864
Individual fixed annuitiesBalance, beginning of year $ 47,202 $ 48,394
Deposits 1,153 1,474Surrenders and other withdrawals (905) (2,369)Death benefits (370) (433)
Net inflows (outflows) (122) (1,328)Change in fair value of underlying investments, interest credited, net of fees 467 464
Balance, end of period $ 47,547 $ 47,530
Individual variable annuitiesBalance, beginning of year $ 24,637 $ 23,593
Deposits 357 262Surrenders and other withdrawals (674) (732)Death benefits (120) (110)
Net inflows (outflows) (437) (580)Change in fair value of underlying investments, interest credited, net of fees 666 (1,516)
Balance, end of period $ 24,866 $ 21,497
Total Domestic Retirement ServicesBalance, beginning of year $135,258 $128,848
Deposits 3,118 3,365Surrenders and other withdrawals (3,255) (4,770)Death benefits (563) (611)
Net inflows (outflows) (700) (2,016)Change in fair value of underlying investments, interest credited, net of fees 2,724 (2,941)
Balance, end of year, excluding runoff 137,282 123,891Individual annuities runoff 4,579 4,898GICs runoff 8,427 11,928
Balance at end of period $150,288 $140,717
General and separate account reserves and mutual fundsGeneral account reserve $ 95,400 $100,243Separate account reserve 46,639 34,513
Total general and separate account reserves 142,039 134,756Group retirement mutual funds 8,249 5,961
Total reserves and mutual funds $150,288 $140,717
129
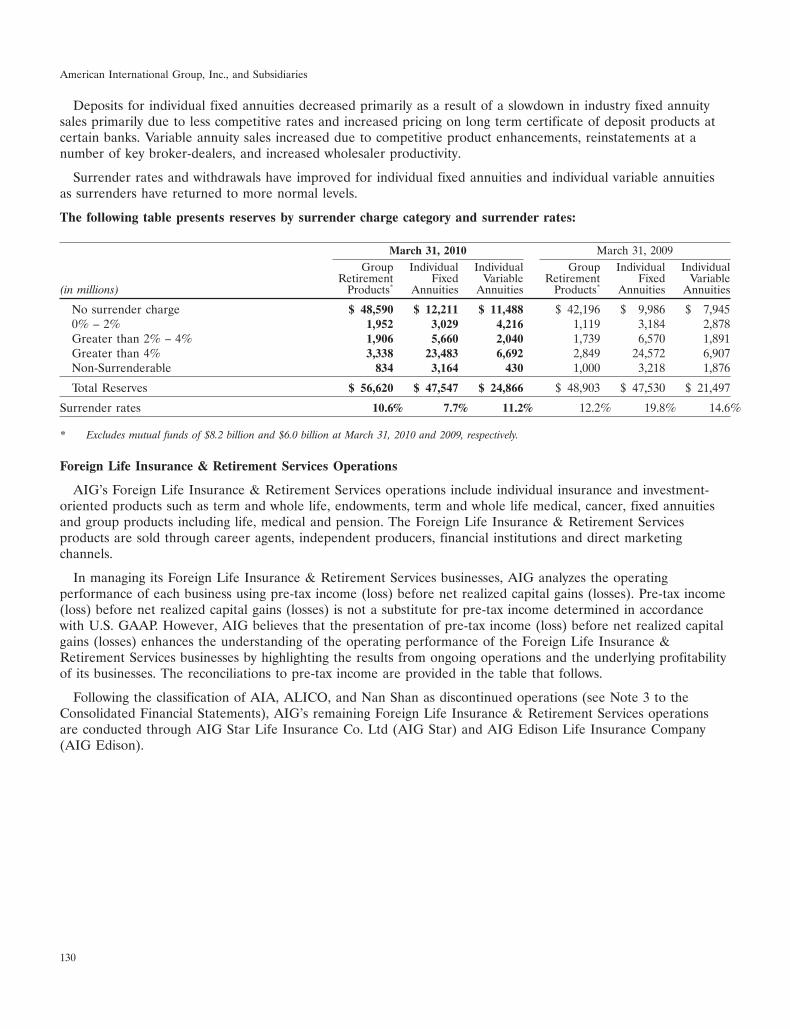
American International Group, Inc., and Subsidiaries
Deposits for individual fixed annuities decreased primarily as a result of a slowdown in industry fixed annuitysales primarily due to less competitive rates and increased pricing on long term certificate of deposit products atcertain banks. Variable annuity sales increased due to competitive product enhancements, reinstatements at anumber of key broker-dealers, and increased wholesaler productivity.
Surrender rates and withdrawals have improved for individual fixed annuities and individual variable annuitiesas surrenders have returned to more normal levels.
The following table presents reserves by surrender charge category and surrender rates:
March 31, 2010 March 31, 2009Group Individual Individual Group Individual Individual
Retirement Fixed Variable Retirement Fixed Variable(in millions) Products* Annuities Annuities Products* Annuities Annuities
No surrender charge $ 48,590 $ 12,211 $ 11,488 $ 42,196 $ 9,986 $ 7,9450% – 2% 1,952 3,029 4,216 1,119 3,184 2,878Greater than 2% – 4% 1,906 5,660 2,040 1,739 6,570 1,891Greater than 4% 3,338 23,483 6,692 2,849 24,572 6,907Non-Surrenderable 834 3,164 430 1,000 3,218 1,876
Total Reserves $ 56,620 $ 47,547 $ 24,866 $ 48,903 $ 47,530 $ 21,497
Surrender rates 10.6% 7.7% 11.2% 12.2% 19.8% 14.6%
* Excludes mutual funds of $8.2 billion and $6.0 billion at March 31, 2010 and 2009, respectively.
Foreign Life Insurance & Retirement Services Operations
AIG’s Foreign Life Insurance & Retirement Services operations include individual insurance and investment-oriented products such as term and whole life, endowments, term and whole life medical, cancer, fixed annuitiesand group products including life, medical and pension. The Foreign Life Insurance & Retirement Servicesproducts are sold through career agents, independent producers, financial institutions and direct marketingchannels.
In managing its Foreign Life Insurance & Retirement Services businesses, AIG analyzes the operatingperformance of each business using pre-tax income (loss) before net realized capital gains (losses). Pre-tax income(loss) before net realized capital gains (losses) is not a substitute for pre-tax income determined in accordancewith U.S. GAAP. However, AIG believes that the presentation of pre-tax income (loss) before net realized capitalgains (losses) enhances the understanding of the operating performance of the Foreign Life Insurance &Retirement Services businesses by highlighting the results from ongoing operations and the underlying profitabilityof its businesses. The reconciliations to pre-tax income are provided in the table that follows.
Following the classification of AIA, ALICO, and Nan Shan as discontinued operations (see Note 3 to theConsolidated Financial Statements), AIG’s remaining Foreign Life Insurance & Retirement Services operationsare conducted through AIG Star Life Insurance Co. Ltd (AIG Star) and AIG Edison Life Insurance Company(AIG Edison).
130
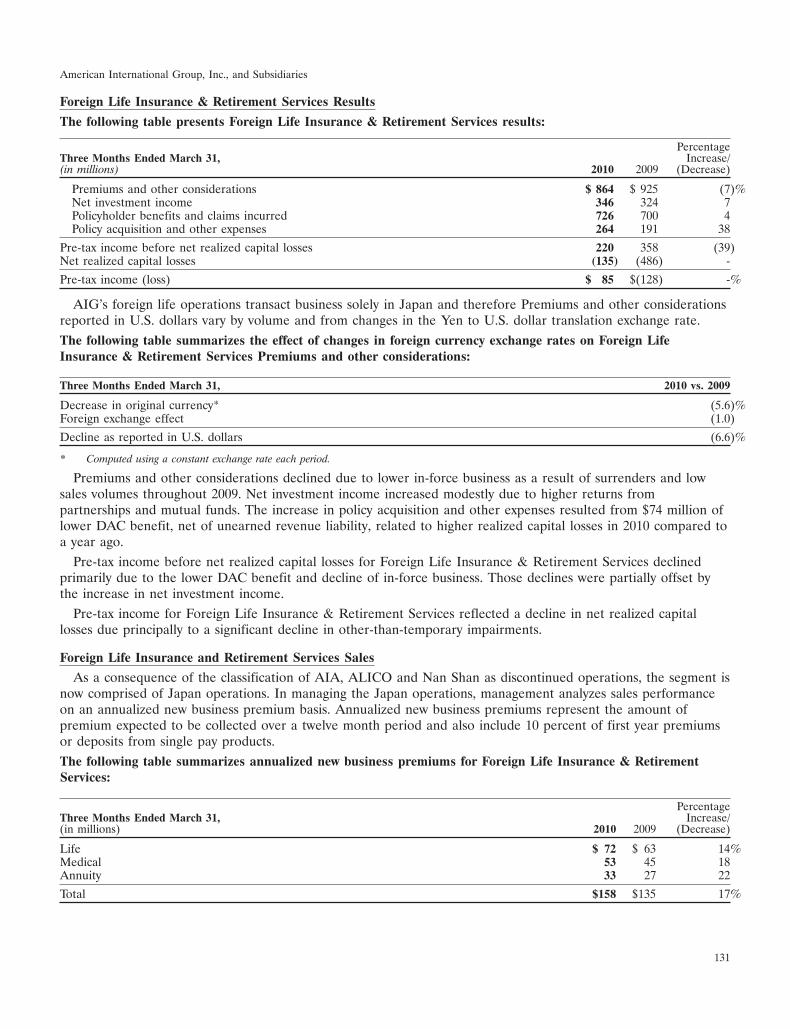
American International Group, Inc., and Subsidiaries
Foreign Life Insurance & Retirement Services Results
The following table presents Foreign Life Insurance & Retirement Services results:
PercentageThree Months Ended March 31, Increase/(in millions) 2010 2009 (Decrease)
Premiums and other considerations $ 864 $ 925 (7)%Net investment income 346 324 7Policyholder benefits and claims incurred 726 700 4Policy acquisition and other expenses 264 191 38
Pre-tax income before net realized capital losses 220 358 (39)Net realized capital losses (135) (486) -
Pre-tax income (loss) $ 85 $(128) -%
AIG’s foreign life operations transact business solely in Japan and therefore Premiums and other considerationsreported in U.S. dollars vary by volume and from changes in the Yen to U.S. dollar translation exchange rate.The following table summarizes the effect of changes in foreign currency exchange rates on Foreign LifeInsurance & Retirement Services Premiums and other considerations:
Three Months Ended March 31, 2010 vs. 2009
Decrease in original currency* (5.6)%Foreign exchange effect (1.0)
Decline as reported in U.S. dollars (6.6)%
* Computed using a constant exchange rate each period.
Premiums and other considerations declined due to lower in-force business as a result of surrenders and lowsales volumes throughout 2009. Net investment income increased modestly due to higher returns frompartnerships and mutual funds. The increase in policy acquisition and other expenses resulted from $74 million oflower DAC benefit, net of unearned revenue liability, related to higher realized capital losses in 2010 compared toa year ago.
Pre-tax income before net realized capital losses for Foreign Life Insurance & Retirement Services declinedprimarily due to the lower DAC benefit and decline of in-force business. Those declines were partially offset bythe increase in net investment income.
Pre-tax income for Foreign Life Insurance & Retirement Services reflected a decline in net realized capitallosses due principally to a significant decline in other-than-temporary impairments.
Foreign Life Insurance and Retirement Services Sales
As a consequence of the classification of AIA, ALICO and Nan Shan as discontinued operations, the segment isnow comprised of Japan operations. In managing the Japan operations, management analyzes sales performanceon an annualized new business premium basis. Annualized new business premiums represent the amount ofpremium expected to be collected over a twelve month period and also include 10 percent of first year premiumsor deposits from single pay products.The following table summarizes annualized new business premiums for Foreign Life Insurance & RetirementServices:
PercentageThree Months Ended March 31, Increase/(in millions) 2010 2009 (Decrease)
Life $ 72 $ 63 14%Medical 53 45 18Annuity 33 27 22
Total $158 $135 17%
131
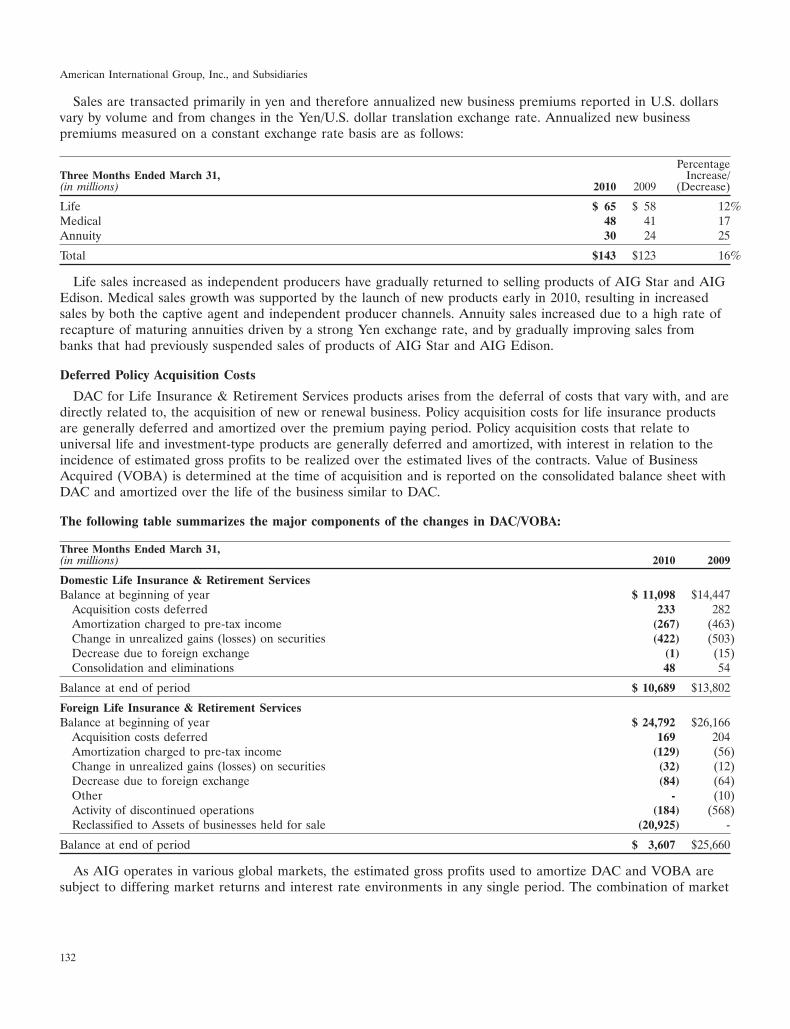
American International Group, Inc., and Subsidiaries
Sales are transacted primarily in yen and therefore annualized new business premiums reported in U.S. dollarsvary by volume and from changes in the Yen/U.S. dollar translation exchange rate. Annualized new businesspremiums measured on a constant exchange rate basis are as follows:
PercentageThree Months Ended March 31, Increase/(in millions) 2010 2009 (Decrease)
Life $ 65 $ 58 12%Medical 48 41 17Annuity 30 24 25
Total $143 $123 16%
Life sales increased as independent producers have gradually returned to selling products of AIG Star and AIGEdison. Medical sales growth was supported by the launch of new products early in 2010, resulting in increasedsales by both the captive agent and independent producer channels. Annuity sales increased due to a high rate ofrecapture of maturing annuities driven by a strong Yen exchange rate, and by gradually improving sales frombanks that had previously suspended sales of products of AIG Star and AIG Edison.
Deferred Policy Acquisition Costs
DAC for Life Insurance & Retirement Services products arises from the deferral of costs that vary with, and aredirectly related to, the acquisition of new or renewal business. Policy acquisition costs for life insurance productsare generally deferred and amortized over the premium paying period. Policy acquisition costs that relate touniversal life and investment-type products are generally deferred and amortized, with interest in relation to theincidence of estimated gross profits to be realized over the estimated lives of the contracts. Value of BusinessAcquired (VOBA) is determined at the time of acquisition and is reported on the consolidated balance sheet withDAC and amortized over the life of the business similar to DAC.
The following table summarizes the major components of the changes in DAC/VOBA:
Three Months Ended March 31,(in millions) 2010 2009
Domestic Life Insurance & Retirement ServicesBalance at beginning of year $ 11,098 $14,447
Acquisition costs deferred 233 282Amortization charged to pre-tax income (267) (463)Change in unrealized gains (losses) on securities (422) (503)Decrease due to foreign exchange (1) (15)Consolidation and eliminations 48 54
Balance at end of period $ 10,689 $13,802
Foreign Life Insurance & Retirement ServicesBalance at beginning of year $ 24,792 $26,166
Acquisition costs deferred 169 204Amortization charged to pre-tax income (129) (56)Change in unrealized gains (losses) on securities (32) (12)Decrease due to foreign exchange (84) (64)Other - (10)Activity of discontinued operations (184) (568)Reclassified to Assets of businesses held for sale (20,925) -
Balance at end of period $ 3,607 $25,660
As AIG operates in various global markets, the estimated gross profits used to amortize DAC and VOBA aresubject to differing market returns and interest rate environments in any single period. The combination of market
132
American International Group, Inc., and Subsidiaries
returns and interest rates may lead to acceleration of amortization in some products and regions and simultaneousdeceleration of amortization in other products and regions.
DAC and VOBA for insurance-oriented, investment-oriented and retirement services products are reviewed forrecoverability, which involves estimating the future profitability of current business. This review involves significantmanagement judgment. If actual future profitability is substantially lower than estimated, AIG’s DAC and VOBAmay be subject to an impairment charge and AIG’s results of operations could be significantly affected in futureperiods.
Financial Services Operations
AIG’s Financial Services subsidiaries engage in diversified activities including aircraft leasing, capital markets,and consumer finance and insurance premium finance. Together, the Aircraft Leasing, Capital Markets andConsumer Finance operations generate the majority of the revenues produced by the Financial Servicesoperations.
Aircraft Leasing
AIG’s Aircraft Leasing operations are the operations of ILFC, which generates its revenues primarily fromleasing new and used commercial jet aircraft to foreign and domestic airlines. Revenues also result from theremarketing of commercial jet aircraft for ILFC’s own account, and remarketing and fleet management servicesfor airlines and other aircraft fleet owners.
Capital Markets
Capital Markets represents the operations of AIGFP, which engaged as principal in a wide variety of financialtransactions, including standard and customized financial products involving commodities, credit, currencies,energy, equities and interest rates. AIGFP also invests in a diversified portfolio of securities and engaged inborrowing activities that involve issuing standard and structured notes and other securities and entering into GIAs.AIGFP has continued to unwind its businesses and portfolios, including those associated with credit protectionwritten through credit default swaps on super senior risk tranches of diversified pools of loans and debt securities.See Liquidity of Parent and Subsidiaries — Financial Services — AIGFP Wind-down.
Historically, AIG’s Capital Markets operations derived a significant portion of their revenues from hedgedfinancial positions entered into in connection with counterparty transactions. AIGFP has also participated as adealer in a wide variety of financial derivatives transactions. Revenues and pre-tax income of the Capital Marketsoperations and the percentage change in these amounts for any given period are significantly affected by changesin the fair value of AIGFP’s assets and liabilities and by the number, size and profitability of transactions enteredinto during that period relative to those entered into during the comparative period.
Consumer Finance
AIG’s Consumer Finance operations in North America are principally conducted through AGF. AGF derivesmost of its revenues from finance charges assessed on real estate loans, secured and unsecured non-real estateloans and retail sales finance receivables.
AIG’s foreign consumer finance operations are principally conducted through AIGCFG. AIGCFG operatesprimarily in emerging and developing markets. At March 31, 2010, AIGCFG had operations in Argentina, Poland,Taiwan, India and Colombia. During 2009 and through April 30, 2010, AIG has completed the sale of theAIGCFG operations in China, Colombia, Thailand, the Philippines, Mexico, Hong Kong, Brazil, Russia andTaiwan. AIG has also entered into contracts to sell the AIGCFG operations in Argentina, India and Poland.
133
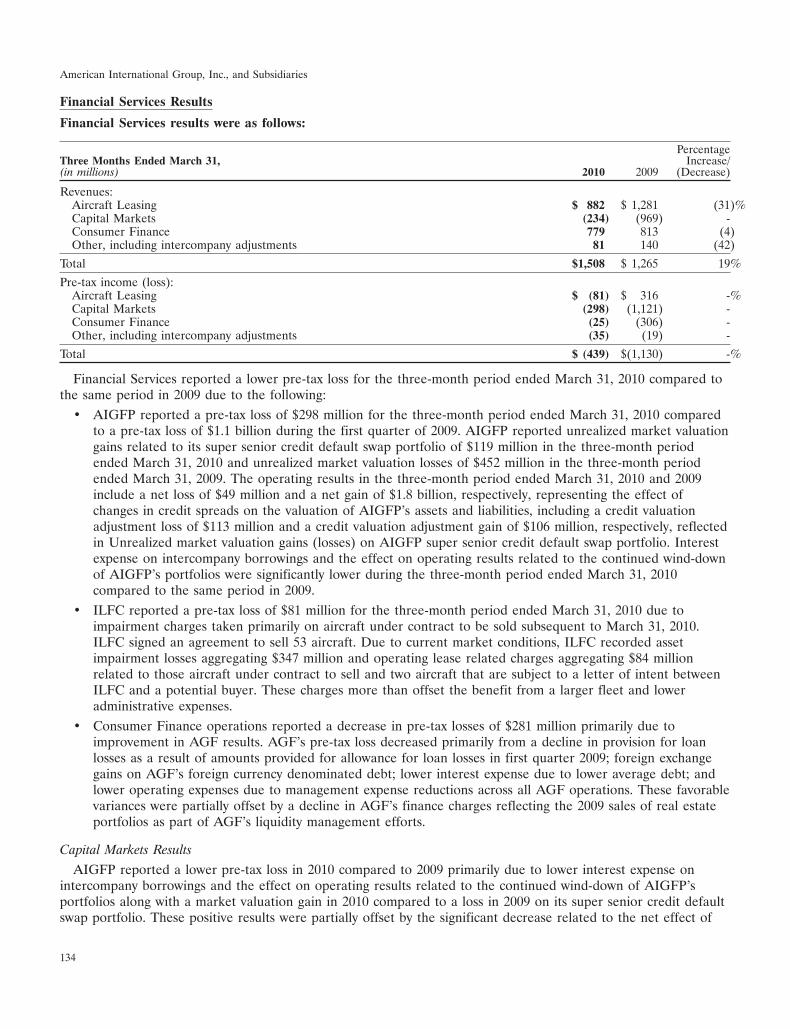
American International Group, Inc., and Subsidiaries
Financial Services Results
Financial Services results were as follows:
PercentageThree Months Ended March 31, Increase/(in millions) 2010 2009 (Decrease)
Revenues:Aircraft Leasing $ 882 $ 1,281 (31)%Capital Markets (234) (969) -Consumer Finance 779 813 (4)Other, including intercompany adjustments 81 140 (42)
Total $1,508 $ 1,265 19%
Pre-tax income (loss):Aircraft Leasing $ (81) $ 316 -%Capital Markets (298) (1,121) -Consumer Finance (25) (306) -Other, including intercompany adjustments (35) (19) -
Total $ (439) $(1,130) -%
Financial Services reported a lower pre-tax loss for the three-month period ended March 31, 2010 compared tothe same period in 2009 due to the following:
• AIGFP reported a pre-tax loss of $298 million for the three-month period ended March 31, 2010 comparedto a pre-tax loss of $1.1 billion during the first quarter of 2009. AIGFP reported unrealized market valuationgains related to its super senior credit default swap portfolio of $119 million in the three-month periodended March 31, 2010 and unrealized market valuation losses of $452 million in the three-month periodended March 31, 2009. The operating results in the three-month period ended March 31, 2010 and 2009include a net loss of $49 million and a net gain of $1.8 billion, respectively, representing the effect ofchanges in credit spreads on the valuation of AIGFP’s assets and liabilities, including a credit valuationadjustment loss of $113 million and a credit valuation adjustment gain of $106 million, respectively, reflectedin Unrealized market valuation gains (losses) on AIGFP super senior credit default swap portfolio. Interestexpense on intercompany borrowings and the effect on operating results related to the continued wind-downof AIGFP’s portfolios were significantly lower during the three-month period ended March 31, 2010compared to the same period in 2009.
• ILFC reported a pre-tax loss of $81 million for the three-month period ended March 31, 2010 due toimpairment charges taken primarily on aircraft under contract to be sold subsequent to March 31, 2010.ILFC signed an agreement to sell 53 aircraft. Due to current market conditions, ILFC recorded assetimpairment losses aggregating $347 million and operating lease related charges aggregating $84 millionrelated to those aircraft under contract to sell and two aircraft that are subject to a letter of intent betweenILFC and a potential buyer. These charges more than offset the benefit from a larger fleet and loweradministrative expenses.
• Consumer Finance operations reported a decrease in pre-tax losses of $281 million primarily due toimprovement in AGF results. AGF’s pre-tax loss decreased primarily from a decline in provision for loanlosses as a result of amounts provided for allowance for loan losses in first quarter 2009; foreign exchangegains on AGF’s foreign currency denominated debt; lower interest expense due to lower average debt; andlower operating expenses due to management expense reductions across all AGF operations. These favorablevariances were partially offset by a decline in AGF’s finance charges reflecting the 2009 sales of real estateportfolios as part of AGF’s liquidity management efforts.
Capital Markets Results
AIGFP reported a lower pre-tax loss in 2010 compared to 2009 primarily due to lower interest expense onintercompany borrowings and the effect on operating results related to the continued wind-down of AIGFP’sportfolios along with a market valuation gain in 2010 compared to a loss in 2009 on its super senior credit defaultswap portfolio. These positive results were partially offset by the significant decrease related to the net effect of
134
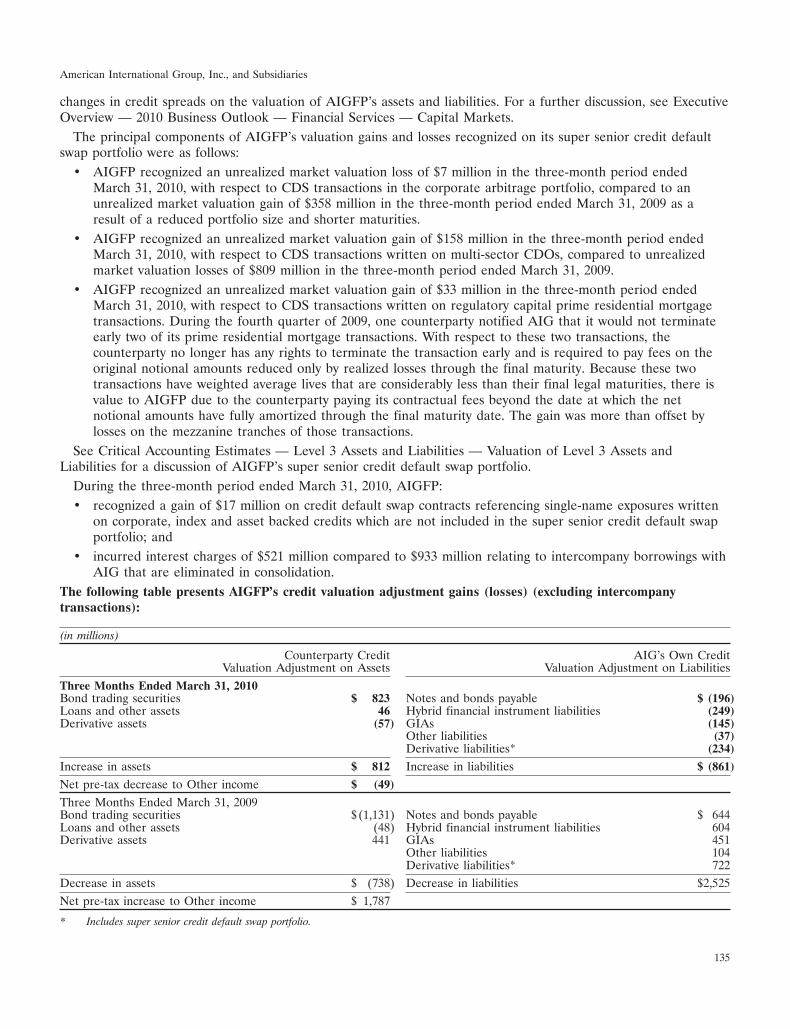
American International Group, Inc., and Subsidiaries
changes in credit spreads on the valuation of AIGFP’s assets and liabilities. For a further discussion, see ExecutiveOverview — 2010 Business Outlook — Financial Services — Capital Markets.
The principal components of AIGFP’s valuation gains and losses recognized on its super senior credit defaultswap portfolio were as follows:
• AIGFP recognized an unrealized market valuation loss of $7 million in the three-month period endedMarch 31, 2010, with respect to CDS transactions in the corporate arbitrage portfolio, compared to anunrealized market valuation gain of $358 million in the three-month period ended March 31, 2009 as aresult of a reduced portfolio size and shorter maturities.
• AIGFP recognized an unrealized market valuation gain of $158 million in the three-month period endedMarch 31, 2010, with respect to CDS transactions written on multi-sector CDOs, compared to unrealizedmarket valuation losses of $809 million in the three-month period ended March 31, 2009.
• AIGFP recognized an unrealized market valuation gain of $33 million in the three-month period endedMarch 31, 2010, with respect to CDS transactions written on regulatory capital prime residential mortgagetransactions. During the fourth quarter of 2009, one counterparty notified AIG that it would not terminateearly two of its prime residential mortgage transactions. With respect to these two transactions, thecounterparty no longer has any rights to terminate the transaction early and is required to pay fees on theoriginal notional amounts reduced only by realized losses through the final maturity. Because these twotransactions have weighted average lives that are considerably less than their final legal maturities, there isvalue to AIGFP due to the counterparty paying its contractual fees beyond the date at which the netnotional amounts have fully amortized through the final maturity date. The gain was more than offset bylosses on the mezzanine tranches of those transactions.
See Critical Accounting Estimates — Level 3 Assets and Liabilities — Valuation of Level 3 Assets andLiabilities for a discussion of AIGFP’s super senior credit default swap portfolio.
During the three-month period ended March 31, 2010, AIGFP:• recognized a gain of $17 million on credit default swap contracts referencing single-name exposures written
on corporate, index and asset backed credits which are not included in the super senior credit default swapportfolio; and
• incurred interest charges of $521 million compared to $933 million relating to intercompany borrowings withAIG that are eliminated in consolidation.
The following table presents AIGFP’s credit valuation adjustment gains (losses) (excluding intercompanytransactions):
(in millions)
Counterparty Credit AIG’s Own CreditValuation Adjustment on Assets Valuation Adjustment on Liabilities
Three Months Ended March 31, 2010Bond trading securities $ 823 Notes and bonds payable $ (196)Loans and other assets 46 Hybrid financial instrument liabilities (249)Derivative assets (57) GIAs (145)
Other liabilities (37)Derivative liabilities* (234)
Increase in assets $ 812 Increase in liabilities $ (861)
Net pre-tax decrease to Other income $ (49)
Three Months Ended March 31, 2009Bond trading securities $(1,131) Notes and bonds payable $ 644Loans and other assets (48) Hybrid financial instrument liabilities 604Derivative assets 441 GIAs 451
Other liabilities 104Derivative liabilities* 722
Decrease in assets $ (738) Decrease in liabilities $2,525Net pre-tax increase to Other income $ 1,787
* Includes super senior credit default swap portfolio.
135
American International Group, Inc., and Subsidiaries
AIGFP’s pre-tax loss in the three-month period ended March 31, 2010 includes a net loss representing theeffect of changes in credit spreads on the valuation of AIGFP’s assets and liabilities, including $113 million oflosses reflected in the unrealized market valuation gain on super senior credit default swaps. The loss wasprimarily the result of tightening of AIG’s credit spreads during the first quarter, and was partially offset by thecontinued tightening of spreads on asset-backed securities and CDOs, which represent a significant segment ofAIGFP’s investment portfolio.
AIGFP’s operating loss in the three-month period ended March 31, 2009 includes a net gain representing theeffect of changes in credit spreads on the valuation of AIGFP’s assets and liabilities, including $106 million ofgains reflected in the unrealized market valuation loss on super senior credit default swaps. The gain in the firstquarter of 2009 was primarily the result of significant widening in AIG’s credit spreads during the quarter, andwas partially offset by continued widening of spreads on asset-backed securities and CDOs, which represent asignificant component of AIGFP’s investment portfolio.
Other Operations
AIG’s Other operations includes results from Parent & Other operations, after allocations to AIG’s businesssegments, and results from noncore businesses.
AIG’s Parent & Other operations consist primarily of interest expense, restructuring costs, expenses ofcorporate staff not attributable to specific reportable segments, expenses related to efforts to improve internalcontrols, corporate initiatives, certain compensation plan expenses, corporate level net realized capital gains andlosses, certain litigation related charges and net gains and losses on sale of divested businesses.
Noncore businesses include results of certain businesses that have been divested or are being wound down orrepositioned.
136
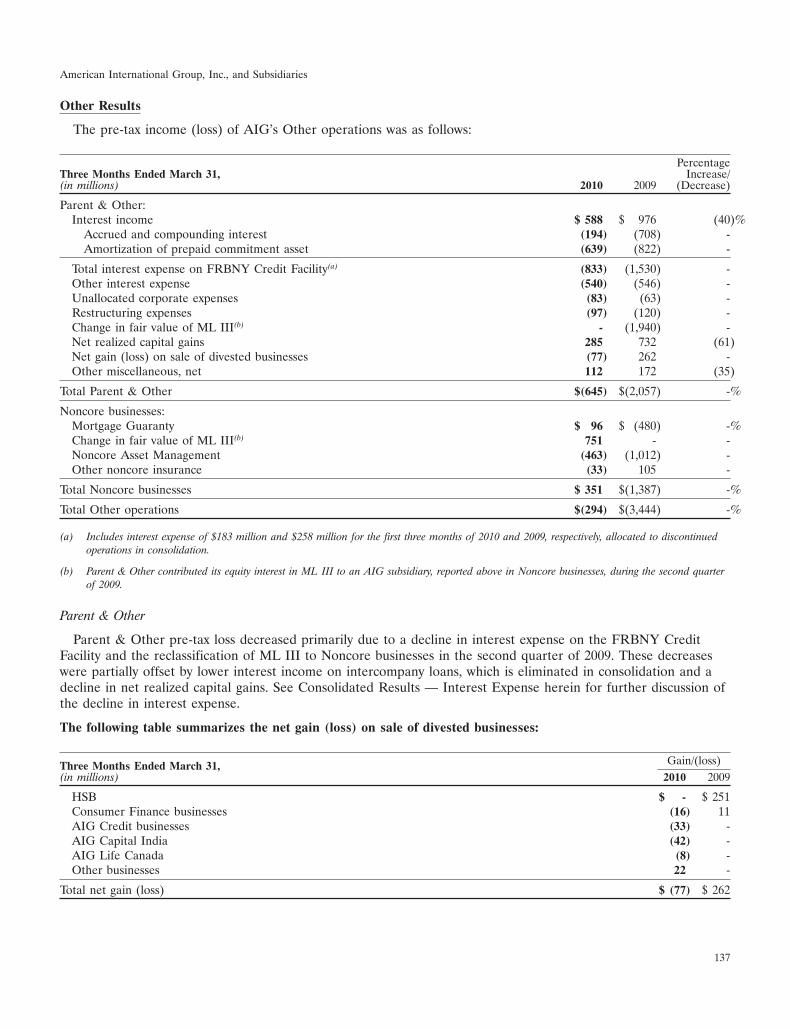
American International Group, Inc., and Subsidiaries
Other Results
The pre-tax income (loss) of AIG’s Other operations was as follows:
PercentageThree Months Ended March 31, Increase/(in millions) 2010 2009 (Decrease)
Parent & Other:Interest income $ 588 $ 976 (40)%
Accrued and compounding interest (194) (708) -Amortization of prepaid commitment asset (639) (822) -
Total interest expense on FRBNY Credit Facility(a) (833) (1,530) -Other interest expense (540) (546) -Unallocated corporate expenses (83) (63) -Restructuring expenses (97) (120) -Change in fair value of ML III(b) - (1,940) -Net realized capital gains 285 732 (61)Net gain (loss) on sale of divested businesses (77) 262 -Other miscellaneous, net 112 172 (35)
Total Parent & Other $(645) $(2,057) -%
Noncore businesses:Mortgage Guaranty $ 96 $ (480) -%Change in fair value of ML III(b) 751 - -Noncore Asset Management (463) (1,012) -Other noncore insurance (33) 105 -
Total Noncore businesses $ 351 $(1,387) -%
Total Other operations $(294) $(3,444) -%
(a) Includes interest expense of $183 million and $258 million for the first three months of 2010 and 2009, respectively, allocated to discontinuedoperations in consolidation.
(b) Parent & Other contributed its equity interest in ML III to an AIG subsidiary, reported above in Noncore businesses, during the second quarterof 2009.
Parent & Other
Parent & Other pre-tax loss decreased primarily due to a decline in interest expense on the FRBNY CreditFacility and the reclassification of ML III to Noncore businesses in the second quarter of 2009. These decreaseswere partially offset by lower interest income on intercompany loans, which is eliminated in consolidation and adecline in net realized capital gains. See Consolidated Results — Interest Expense herein for further discussion ofthe decline in interest expense.
The following table summarizes the net gain (loss) on sale of divested businesses:
Gain/(loss)Three Months Ended March 31,(in millions) 2010 2009
HSB $ - $ 251Consumer Finance businesses (16) 11AIG Credit businesses (33) -AIG Capital India (42) -AIG Life Canada (8) -Other businesses 22 -
Total net gain (loss) $ (77) $ 262
137
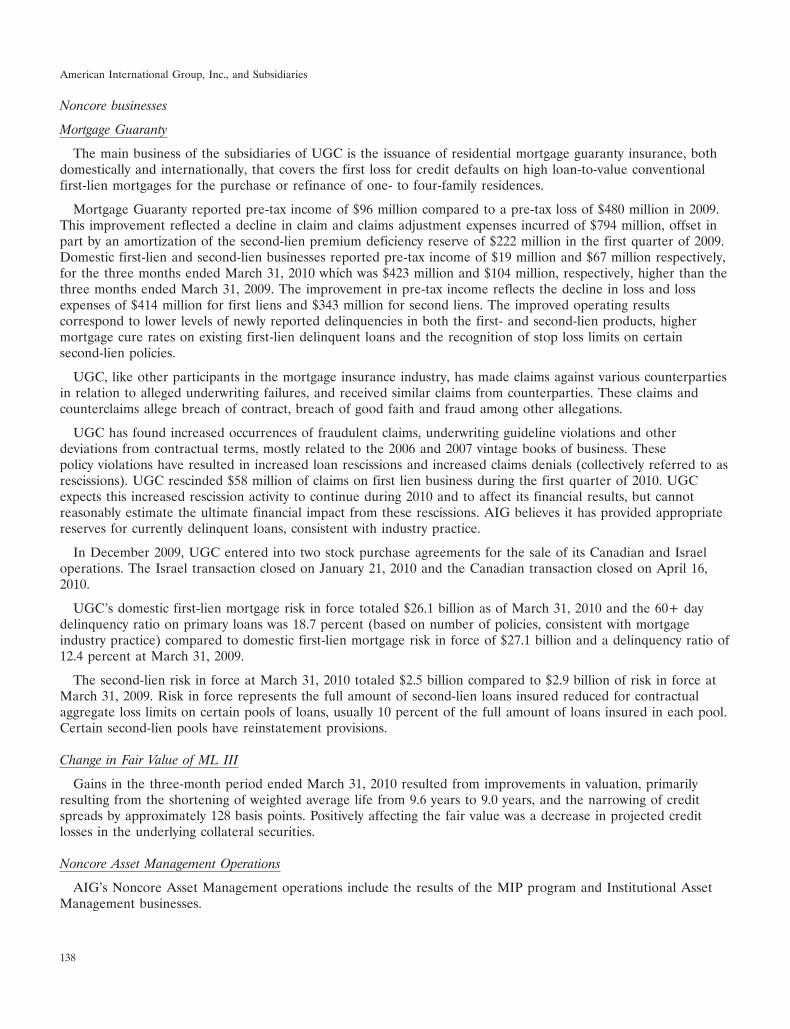
American International Group, Inc., and Subsidiaries
Noncore businesses
Mortgage Guaranty
The main business of the subsidiaries of UGC is the issuance of residential mortgage guaranty insurance, bothdomestically and internationally, that covers the first loss for credit defaults on high loan-to-value conventionalfirst-lien mortgages for the purchase or refinance of one- to four-family residences.
Mortgage Guaranty reported pre-tax income of $96 million compared to a pre-tax loss of $480 million in 2009.This improvement reflected a decline in claim and claims adjustment expenses incurred of $794 million, offset inpart by an amortization of the second-lien premium deficiency reserve of $222 million in the first quarter of 2009.Domestic first-lien and second-lien businesses reported pre-tax income of $19 million and $67 million respectively,for the three months ended March 31, 2010 which was $423 million and $104 million, respectively, higher than thethree months ended March 31, 2009. The improvement in pre-tax income reflects the decline in loss and lossexpenses of $414 million for first liens and $343 million for second liens. The improved operating resultscorrespond to lower levels of newly reported delinquencies in both the first- and second-lien products, highermortgage cure rates on existing first-lien delinquent loans and the recognition of stop loss limits on certainsecond-lien policies.
UGC, like other participants in the mortgage insurance industry, has made claims against various counterpartiesin relation to alleged underwriting failures, and received similar claims from counterparties. These claims andcounterclaims allege breach of contract, breach of good faith and fraud among other allegations.
UGC has found increased occurrences of fraudulent claims, underwriting guideline violations and otherdeviations from contractual terms, mostly related to the 2006 and 2007 vintage books of business. Thesepolicy violations have resulted in increased loan rescissions and increased claims denials (collectively referred to asrescissions). UGC rescinded $58 million of claims on first lien business during the first quarter of 2010. UGCexpects this increased rescission activity to continue during 2010 and to affect its financial results, but cannotreasonably estimate the ultimate financial impact from these rescissions. AIG believes it has provided appropriatereserves for currently delinquent loans, consistent with industry practice.
In December 2009, UGC entered into two stock purchase agreements for the sale of its Canadian and Israeloperations. The Israel transaction closed on January 21, 2010 and the Canadian transaction closed on April 16,2010.
UGC’s domestic first-lien mortgage risk in force totaled $26.1 billion as of March 31, 2010 and the 60+ daydelinquency ratio on primary loans was 18.7 percent (based on number of policies, consistent with mortgageindustry practice) compared to domestic first-lien mortgage risk in force of $27.1 billion and a delinquency ratio of12.4 percent at March 31, 2009.
The second-lien risk in force at March 31, 2010 totaled $2.5 billion compared to $2.9 billion of risk in force atMarch 31, 2009. Risk in force represents the full amount of second-lien loans insured reduced for contractualaggregate loss limits on certain pools of loans, usually 10 percent of the full amount of loans insured in each pool.Certain second-lien pools have reinstatement provisions.
Change in Fair Value of ML III
Gains in the three-month period ended March 31, 2010 resulted from improvements in valuation, primarilyresulting from the shortening of weighted average life from 9.6 years to 9.0 years, and the narrowing of creditspreads by approximately 128 basis points. Positively affecting the fair value was a decrease in projected creditlosses in the underlying collateral securities.
Noncore Asset Management Operations
AIG’s Noncore Asset Management operations include the results of the MIP program and Institutional AssetManagement businesses.
138
American International Group, Inc., and Subsidiaries
On March 26, 2010, AIG completed the sale of its third party asset management business. The results ofoperations from January 1 through the closing of the sale are included in the Institutional Asset Managementresults. Subsequent to the sale of AIG’s third party asset management business, the revenues of the InstitutionalAsset Management business (excluding AIG Global Real Estate) are derived from providing asset managementservices to AIG and its subsidiaries. Both AIG Global Real Estate and the MIP’s operating results are impactedby performance in the credit, equity and real estate markets.
MIP Results
The MIP reported a lower pre-tax loss due to significantly lower other-than-temporary impairments on fixedmaturity investments due primarily to the improved credit environment and the adoption of the new accountingstandard on other-than-temporary impairments. The results were also affected by the discontinuation of hedgeaccounting in the first quarter of 2010 as a result of the novation of certain intercompany derivative transactionswith AIGFP to another AIG subsidiary, AIG Markets, which is part of Institutional Asset Management. Thesenovations were done in conjunction with the wind-down of AIGFP. The discontinuation of hedge accountingresulted in additional income statement volatility which will continue for the foreseeable future until hedgeaccounting is reestablished. Residual balances from de-designated hedges will be amortized prospectively intooperating income.
AIG enters into derivative arrangements to hedge the effect of changes in currency and interest rates associatedwith the fixed and floating rate and foreign currency denominated obligations issued under these programs.Further, the MIP invests in short single name credit default swaps in order to obtain unfunded credit exposure.
Institutional Asset Management Results
Institutional Asset Management recognized higher pre-tax operating losses primarily resulting from higher realestate impairments and the negative impact of AIG’s narrowing credit spreads on the valuation of derivativeliabilities held through AIG Markets. These losses were partially offset by lower operating losses on investmentsoriginally acquired for warehouse purposes, as many of these investments have been divested, and lowerunrealized carried interest losses.
Real estate impairments of $309 million during 2010 were incurred in the direct investment portfolio as well asthrough real estate joint ventures as a result of continued pressure on real estate values, occupancy rates andleasing activity. Approximately $37 million of these impairments was included in noncontrolling interests, which isnot part of pre-tax income (loss). The availability of refinancing and required capital has caused management toreduce the estimated time period before sale for certain investments, resulting in impairments. AIG Markets actsas a derivative intermediary transacting with AIG and its subsidiaries and the third parities.
Other Noncore Insurance Businesses
Other noncore insurance businesses include the operating results of the following divested businesses throughthe date of their sale.
• Transatlantic
Transatlantic offers reinsurance capacity on both a treaty and facultative basis both in the U.S. andabroad. Transatlantic structures programs for a full range of property and casualty products with anemphasis on specialty risk.
On June 10, 2009, AIG closed a secondary public offering of 29.9 million shares of Transatlantic commonstock owned directly and indirectly by AIG for aggregate gross proceeds of $1.1 billion. At the close of thepublic offering, AIG indirectly retained 13.9 percent of the Transatlantic common stock issued andoutstanding. As a result, AIG deconsolidated Transatlantic, which resulted in a $1.4 billion reduction inNoncontrolling interests, a component of Total equity. On March 15, 2010, AIG closed a secondary public
139
American International Group, Inc., and Subsidiaries
offering of 8,466,693 shares of Transatlantic common stock owned by American Home Assurance Company,a subsidiary of AIG, for aggregate gross proceeds of approximately $452 million.
• 21st Century
On July 1, 2009, AIG closed the sale of 21st Century Insurance Group and the Agency Auto Division(excluding AIG Private Client Group).
• HSB
On March 31, 2009, AIG closed the sale of HSB, the parent company of the Hartford Steam BoilerInspection and Insurance Company.
Critical Accounting Estimates
The preparation of financial statements in conformity with GAAP requires the application of accounting policiesthat often involve a significant degree of judgment. AIG considers its accounting policies that are most dependenton the application of estimates and assumptions, and therefore viewed as critical accounting estimates, to be thoserelating to items considered by management in the determination of:
• AIG’s ability to continue as a going concern. See Note 1 to the Consolidated Financial Statements foradditional discussion regarding going concern considerations;
• liability for general insurance unpaid claims and claims adjustment expenses;
• future policy benefits for life and accident and health contracts;
• recoverability of DAC;
• estimated gross profits for investment-oriented products;
• the allowance for finance receivable losses;
• flight equipment recoverability;
• other-than-temporary impairments of investments;
• goodwill impairment;
• liability for legal contingencies;
• estimates with respect to income taxes;
• fair value measurements of certain financial assets and liabilities, including credit default swaps and AIG’sinterests in ML II and ML III (Maiden Lane Interests);
• classification of entities as discontinued operations; and
• measurement of the fair values of the assets and liabilities including noncontrolling interests related toacquisitions.
These accounting estimates require the use of assumptions about matters, some of which are highly uncertain atthe time of estimation. To the extent actual experience differs from the assumptions used, AIG’s financialcondition and results of operations would be directly affected. Refer to the 2009 Annual Report on Form 10-K formore information on AIG’s accounting estimates.
Allowance for Finance Receivable Losses
AGF estimates its allowance for finance receivable losses primarily using migration analysis and the MonteCarlo technique applied to sub-portfolios of large numbers of relatively small homogenous accounts. Bothtechniques are historically-based statistical techniques that attempt to predict the future amount of losses forexisting pools of finance receivables. AGF adjusts the amounts determined by migration and Monte Carlo for
140
American International Group, Inc., and Subsidiaries
AGF management’s estimate of the effects of model imprecision, any changes to its underwriting criteria, portfolioseasoning, and current economic conditions, including the levels of unemployment and personal bankruptcies.
AGF uses its internal data of net charge-offs and delinquency by sub-portfolio as the basis to determine thehistorical loss experience component of its allowance for finance receivable losses. AGF used monthly bankruptcystatistics, monthly unemployment statistics, and various other monthly or periodic economic statistics published bydepartments of the U.S. government and other economic statistics providers to determine the economiccomponent of its allowance for finance receivable losses.
AGF also establishes troubled debt restructuring (TDR) reserves for impaired loans, which are included in itsallowance for finance receivable losses. The allowance for finance receivable losses related to AGF’s TDRs iscalculated in homogeneous aggregated pools of impaired loans that have common risk characteristics. AGFestablishes its allowance for finance receivable losses related to its TDRs by calculating the present value(discounted at the loan’s effective interest rate prior to modification) of all expected cash flows less the recordedinvestment in the aggregated pool. AGF uses certain assumptions to estimate the expected cash flows from itsTDRs. The primary assumptions for AGF’s model are prepayment speeds, default rates, and severity rates.
Goodwill Impairment:
Goodwill is the excess of the cost of an acquired business over the fair value of the identifiable net assets of theacquired business. Goodwill is tested for impairment annually or more frequently if circumstances indicateimpairment may have occurred. As a result of entering into the ALICO Stock Purchase Agreement, AIGperformed a goodwill impairment test at March 31, 2010 for ALICO and separately for the businesses to beretained that previously composed the Japan & Other reporting unit.
The impairment assessment involves a two-step process in which an initial assessment for potential impairmentis performed and, if potential impairment is present, the amount of impairment is measured (if any) and recorded.Impairment is tested at the reporting unit level.
Management initially assesses the potential for impairment by estimating the fair value of each of AIG’sreporting units and comparing the estimated fair values with the carrying amounts of those reporting units,including allocated goodwill. The estimate of a reporting unit’s fair value may be based on one or a combinationof approaches including market-based earning multiples of the unit’s peer companies, discounted expected futurecash flows, external appraisals or, in the case of reporting units being considered for sale, third-party indications offair value, if available. Management considers one or more of these estimates when determining the fair value of areporting unit to be used in the impairment test. As part of the impairment test, management compares the sumof the estimated fair values of all of AIG’s reporting units with AIG’s market capitalization as a basis forconcluding on the reasonableness of the estimated reporting unit fair values.
If the estimated fair value of a reporting unit exceeds its carrying value, goodwill is not impaired. If the carryingvalue of a reporting unit exceeds its estimated fair value, goodwill associated with that reporting unit potentially isimpaired. The amount of impairment, if any, is measured as the excess of the carrying value of goodwill over theestimated fair value of the goodwill. The estimated fair value of the goodwill is measured as the excess of the fairvalue of the reporting unit over the amounts that would be assigned to the reporting unit’s assets and liabilities ina hypothetical business combination. An impairment charge is recognized in earnings to the extent of the excess.
In connection with the announced sale of ALICO on March 7, 2010 and management’s decision that ALICOmet the held-for-sale criteria on March 31, 2010, total goodwill of $4.6 billion associated with the Foreign LifeInsurance & Retirement Services — Japan & Other reporting unit was allocated among ALICO and the Japan &Other businesses to be retained based on their relative fair values as of March 31, 2010. This resulted in$3.3 billion and $1.3 billion of goodwill being allocated to ALICO and the retained businesses, respectively.Management tested goodwill for impairment in both groups and determined the fair values of ALICO and theretained businesses exceeded book value at March 31, 2010, by 1 percent and 51 percent, respectively, and,therefore, the goodwill of these reporting units was considered not impaired.
141
American International Group, Inc., and Subsidiaries
The fair value of ALICO used to test goodwill for impairment was determined by AIG by considering, amongother information, a third-party valuation at March 31, 2010 of the announced proceeds from the sale of ALICOto MetLife. Given the significance of the equity component of the consideration, the fair value of ALICO issensitive to the market value and volatility of MetLife common stock, the risk-free interest rate yield curve anddiscount rate assumptions used in estimating fair value. Given that the amount of estimated fair value of ALICOonly exceeded the book value by 1 percent, a relatively modest change in any of these assumptions could haveresulted in a potential impairment of the goodwill allocated to ALICO, ranging from zero to $3.3 billion. Theevaluation of the potential impairment is an ongoing requirement. As such, an increase in the net assets ofALICO through future operating or comprehensive income generation could result in impairment when comparedto the fair value of consideration at that future time.
AIG will continue to monitor overall competitive, business and economic conditions, and other events orcircumstances, including ALICO’s operating results and level of net assets and the performance of MetLife’scommon stock, that might result in an impairment of goodwill in the future.
Valuation Allowance on Deferred Tax Assets:
At March 31, 2010 and December 31, 2009, AIG recorded a net deferred tax asset after valuation allowance of$8.2 billion and $5.9 billion, respectively. A valuation allowance is established, if necessary, to reduce the deferredtax asset to an amount that is more likely than not to be realized (a likelihood of more than 50 percent).Realization of AIG’s net deferred tax asset depends upon its ability to generate sufficient earnings fromtransactions expected to be completed in the near future and tax planning strategies that would be implemented, ifnecessary, to protect against the loss of the deferred tax asset, but does not depend on projected future operatingincome.
When making its assessment about the realization of its deferred tax asset at March 31, 2010, AIG consideredall available evidence, including:
• the nature, frequency, and severity of current and cumulative financial reporting losses;
• transactions completed, including the sale of the Otemachi building in Tokyo, and the sales of AIA andALICO expected to be completed in 2010;
• the carryforward periods for the net operating and capital loss and foreign tax credit carryforwards; and
• tax planning strategies that would be implemented, if necessary, to protect against the loss of the deferredtax asset.
Estimates of future taxable income generated from specific transactions and tax planning strategies discussedabove could change in the near term, perhaps materially, which may require AIG to adjust its valuation allowance.Such adjustment, either positive or negative, could be material to AIG’s consolidated financial condition or itsresults of operations for an individual reporting period.
U.S. Income Taxes on Earnings of Certain Foreign Subsidiaries:
Due to the complexity of the U.S. federal income tax laws involved in determining the amount of income taxesincurred on potential dispositions, as well as AIG’s reliance on reasonable assumptions and estimates incalculating this liability, AIG considers the U.S. federal income taxes accrued on the earnings of certain foreignsubsidiaries to be a critical accounting estimate.
Measurement of the Fair Values of the Assets Acquired, Liabilities Assumed, and Noncontrolling Interests of Fuji
On March 31, 2010, AIG, through a Chartis International subsidiary, purchased additional voting shares in Fuji.The acquisition of the additional voting shares for $145 million increased Chartis’ total voting ownership interestin Fuji from 41.7 percent to 54.8 percent, which resulted in Chartis obtaining control of Fuji.
142
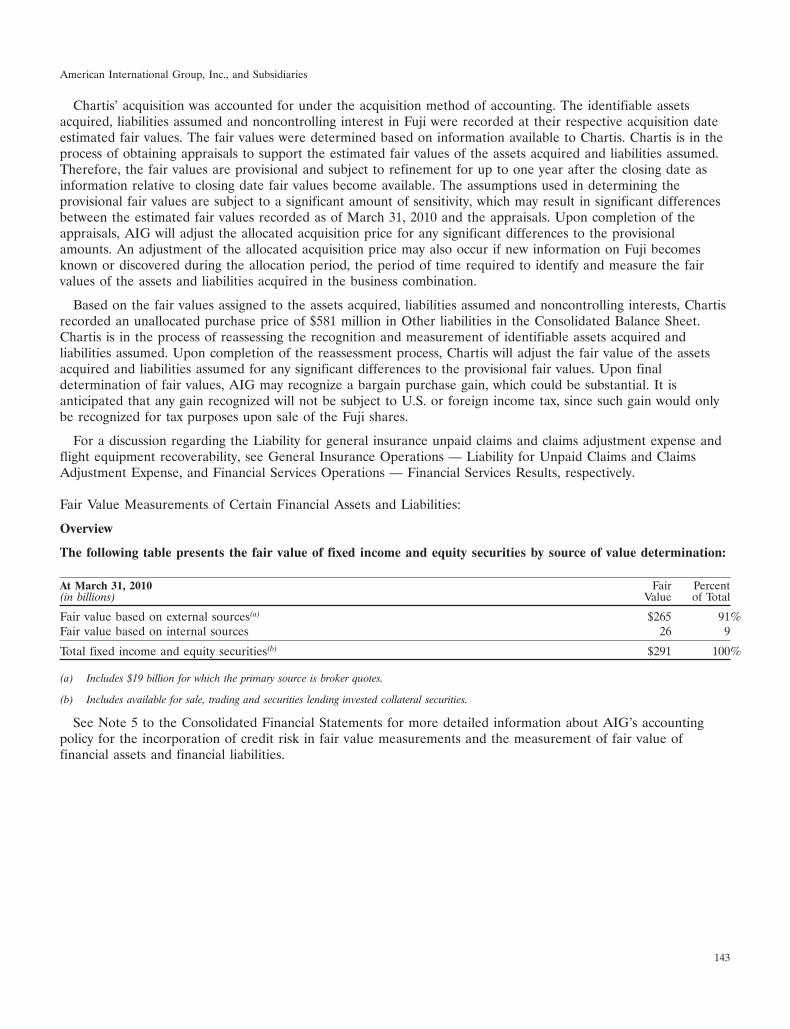
American International Group, Inc., and Subsidiaries
Chartis’ acquisition was accounted for under the acquisition method of accounting. The identifiable assetsacquired, liabilities assumed and noncontrolling interest in Fuji were recorded at their respective acquisition dateestimated fair values. The fair values were determined based on information available to Chartis. Chartis is in theprocess of obtaining appraisals to support the estimated fair values of the assets acquired and liabilities assumed.Therefore, the fair values are provisional and subject to refinement for up to one year after the closing date asinformation relative to closing date fair values become available. The assumptions used in determining theprovisional fair values are subject to a significant amount of sensitivity, which may result in significant differencesbetween the estimated fair values recorded as of March 31, 2010 and the appraisals. Upon completion of theappraisals, AIG will adjust the allocated acquisition price for any significant differences to the provisionalamounts. An adjustment of the allocated acquisition price may also occur if new information on Fuji becomesknown or discovered during the allocation period, the period of time required to identify and measure the fairvalues of the assets and liabilities acquired in the business combination.
Based on the fair values assigned to the assets acquired, liabilities assumed and noncontrolling interests, Chartisrecorded an unallocated purchase price of $581 million in Other liabilities in the Consolidated Balance Sheet.Chartis is in the process of reassessing the recognition and measurement of identifiable assets acquired andliabilities assumed. Upon completion of the reassessment process, Chartis will adjust the fair value of the assetsacquired and liabilities assumed for any significant differences to the provisional fair values. Upon finaldetermination of fair values, AIG may recognize a bargain purchase gain, which could be substantial. It isanticipated that any gain recognized will not be subject to U.S. or foreign income tax, since such gain would onlybe recognized for tax purposes upon sale of the Fuji shares.
For a discussion regarding the Liability for general insurance unpaid claims and claims adjustment expense andflight equipment recoverability, see General Insurance Operations — Liability for Unpaid Claims and ClaimsAdjustment Expense, and Financial Services Operations — Financial Services Results, respectively.
Fair Value Measurements of Certain Financial Assets and Liabilities:
Overview
The following table presents the fair value of fixed income and equity securities by source of value determination:
At March 31, 2010 Fair Percent(in billions) Value of Total
Fair value based on external sources(a) $265 91%Fair value based on internal sources 26 9
Total fixed income and equity securities(b) $291 100%
(a) Includes $19 billion for which the primary source is broker quotes.
(b) Includes available for sale, trading and securities lending invested collateral securities.
See Note 5 to the Consolidated Financial Statements for more detailed information about AIG’s accountingpolicy for the incorporation of credit risk in fair value measurements and the measurement of fair value offinancial assets and financial liabilities.
143
American International Group, Inc., and Subsidiaries
Level 3 Assets and Liabilities
Assets and liabilities recorded at fair value in the Consolidated Balance Sheet are classified in a hierarchy fordisclosure purposes consisting of three ‘‘levels’’ based on the observability of inputs available in the marketplaceused to measure the fair value. See Note 5 to the Consolidated Financial Statements for additional informationabout the three levels of observability.
At March 31, 2010, AIG classified $35.9 billion and $9.1 billion of assets and liabilities, respectively, measuredat fair value on a recurring basis as Level 3. This represented 4.2 percent and 1.2 percent of the total assets andliabilities, respectively, at March 31, 2010. At December 31, 2009, AIG classified $38.9 billion and $13.9 billion ofassets and liabilities, respectively, measured at fair value on a recurring basis as Level 3. This represented4.6 percent and 1.9 percent of the total assets and liabilities, respectively, at December 31, 2009. Level 3 fair valuemeasurements are based on valuation techniques that use at least one significant input that is unobservable. Thesemeasurements are made under circumstances in which there is little, if any, market activity for the asset orliability. AIG’s assessment of the significance of a particular input to the fair value measurement in its entiretyrequires judgment.
In making the assessment, AIG considers factors specific to the asset or liability. In certain cases, the inputsused to measure fair value of an asset or a liability may fall into different levels of the fair value hierarchy. Insuch cases, the level in the fair value hierarchy within which the fair value measurement in its entirety is classifiedis determined based on the lowest level input that is significant to the fair value measurement in its entirety.
Level 3 Transfers
During the three-month period ended March 31, 2010, AIG transferred into Level 3 approximately $1.2 billionof assets, primarily representing investments in certain ABS, RMBS and CMBS, which coincided with a decreasein market transparency and downward credit migration of these securities, and investments in private placementcorporate debt securities, for which pricing adjustments were made to reflect an additional risk premium notcaptured in the matrix pricing. In addition certain municipal bonds related to SunAmerica Affordable Housingpartnerships were transferred into Level 3 based on limitations on market activity and related input for theirvaluation. During the three-month period ended March 31, 2010, AIG transferred approximately $1.1 billion ofassets out of Level 3. These transfers out of Level 3 primarily related to investments in certain ABS and RMBSand investments in private placement corporate debt. See Note 5 to the Consolidated Financial Statements foradditional information about transfers into and out of Level 3.
Valuation of Level 3 Assets and Liabilities
AIG values its assets and liabilities classified as Level 3 using judgment and valuation models or other pricingtechniques that require a variety of inputs including contractual terms, market prices and rates, yield curves, creditcurves, measures of volatility, prepayment rates and correlations of such inputs, some of which may beunobservable. The following paragraphs describe the methods AIG uses to measure on a recurring basis the fairvalue of the major classes of assets and liabilities classified in Level 3.
Private equity and real estate fund investments: These assets initially are valued at the transaction price, i.e., theprice paid to acquire the asset. Subsequently, they are measured based on net asset value using informationprovided by the general partner or manager of these investments, the accounts of which generally are audited onan annual basis. AIG considers observable market data and performs diligence procedures in validating theappropriateness of using the net asset value as a fair value measurement.
Corporate bonds and private placement debt: These assets initially are valued at the transaction price.Subsequently, they are valued using market data for similar instruments (e.g., recent transactions, bond spreads orcredit default swap spreads). When observable price quotations are not available, fair value is determined basedon cash flow models using yield curves observed from indices or credit default swap spreads.
144

American International Group, Inc., and Subsidiaries
Certain RMBS and CMBS: These assets initially are valued at the transaction price. Subsequently, they may bevalued by comparison to transactions in instruments with similar collateral and risk profiles considering remittancesreceived and updated cumulative loss data on underlying obligations, or discounted cash flow techniques.
Certain ABS — non-mortgage: These assets initially are valued at the transaction price. Subsequently, they maybe valued based on external price/spread data. When position-specific external price data are not observable, thevaluation is based on prices of comparable securities.
CDOs: These assets initially are valued at the transaction price. Subsequently, they are valued based onexternal price/spread data from independent third parties, dealer quotations, matrix pricing, the BinomialExpansion Technique (BET) model or a combination of these methods.
Interests in the Maiden Lane Interests: At their inception, ML II and ML III were valued at the transactionprices of $1 billion and $5 billion, respectively. Subsequently, Maiden Lane Interests are valued using a discountedcash flow methodology that uses the estimated future cash flows of the assets to which the Maiden Lane Interestsare entitled and the discount rates applicable to such interests as derived from the fair value of the entire assetpool. The implicit discount rates are calibrated to the changes in the estimated asset values for the underlyingassets commensurate with AIG’s interests in the capital structure of the respective entities. Estimated cash flowsand discount rates used in the valuations are validated, to the extent possible, using market observable informationfor securities with similar asset pools, structure and terms.
The fair value methodology used assumes that the underlying collateral in the Maiden Lane Interests willcontinue to be held and generate cash flows into the foreseeable future and does not assume a current liquidationof the assets of the Maiden Lane Interests. Other methodologies employed or assumptions made in determiningfair value for these investments could result in amounts that differ significantly from the amounts reported.
Refer to Note 5 for sensitivity analysis disclosures with respect to the Maiden Lane Interests.
AIGFP’s Super Senior Credit Default Swap Portfolio: AIGFP wrote credit protection on the super senior risklayer of collateralized loan obligations (CLOs), multi-sector CDOs and diversified portfolios of corporate debt,and prime residential mortgages. In these transactions, AIGFP is at risk of credit performance on the super seniorrisk layer related to such assets. To a lesser extent, AIGFP also wrote protection on tranches below the supersenior risk layer, primarily in respect of regulatory capital relief transactions.
The following table presents the net notional amount, fair value of derivative (asset) liability and unrealizedmarket valuation gain (loss) of the AIGFP super senior credit default swap portfolio, including credit defaultswaps written on mezzanine tranches of certain regulatory capital relief transactions, by asset class:
Fair Value of Derivative Unrealized Market ValuationNet Notional Amount (Asset) Liability at Gain (Loss) Three Months
Ended March 31,March 31, December 31, March 31, December 31,(in millions) 2010(a) 2009(a) 2010(b)(c) 2009(b)(c) 2010(c) 2009(c)
Regulatory Capital:Corporate loans $ 41,993 $ 55,010 $ - $ - $ - $ -Prime residential mortgages 65,844 93,276 (170) (137) 33 -Other 1,552 1,760 15 21 6 (14)
Total 109,389 150,046 (155) (116) 39 (14)
Arbitrage:Multi-sector CDOs(d)(e) 7,574 7,926 4,250 4,418 158 (809)Corporate debt/CLOs(d)(f) 16,367 22,076 308 309 (7) 358
Total 23,941 30,002 4,558 4,727 151 (451)
Mezzanine tranches(g) 3,104 3,478 214 143 (71) 13
Total $136,434 $183,526 $4,617 $4,754 $119 $ (452)
(a) Net notional amounts presented are net of all structural subordination below the covered tranches.
145
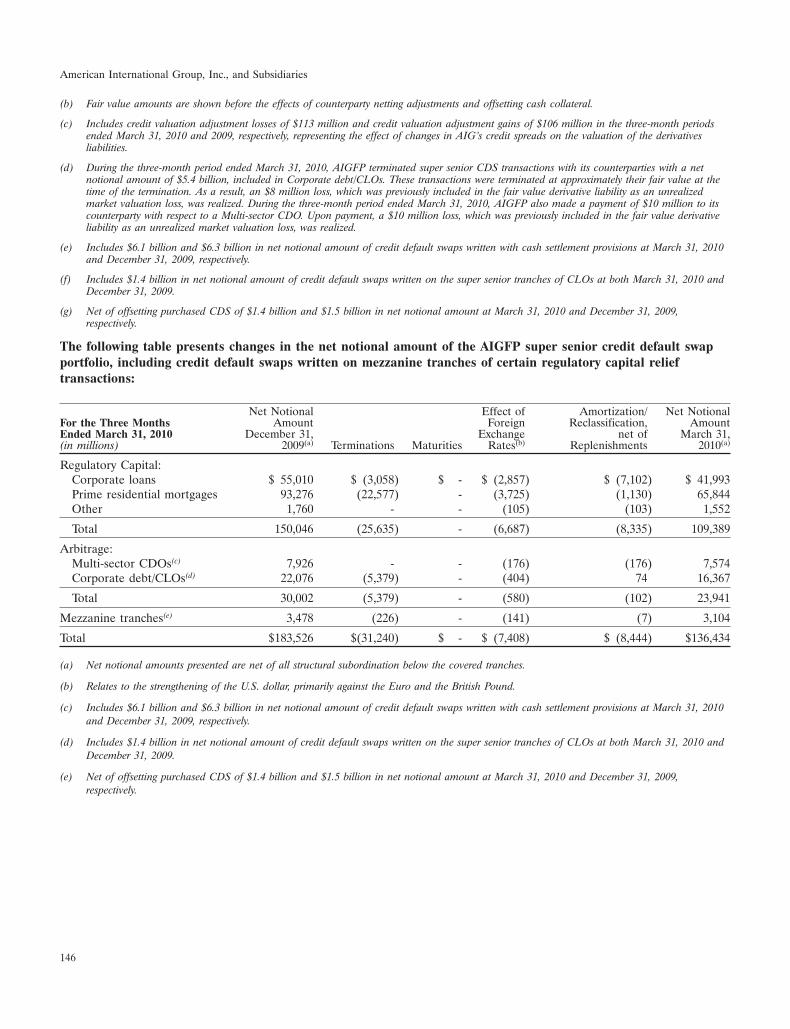
American International Group, Inc., and Subsidiaries
(b) Fair value amounts are shown before the effects of counterparty netting adjustments and offsetting cash collateral.
(c) Includes credit valuation adjustment losses of $113 million and credit valuation adjustment gains of $106 million in the three-month periodsended March 31, 2010 and 2009, respectively, representing the effect of changes in AIG’s credit spreads on the valuation of the derivativesliabilities.
(d) During the three-month period ended March 31, 2010, AIGFP terminated super senior CDS transactions with its counterparties with a netnotional amount of $5.4 billion, included in Corporate debt/CLOs. These transactions were terminated at approximately their fair value at thetime of the termination. As a result, an $8 million loss, which was previously included in the fair value derivative liability as an unrealizedmarket valuation loss, was realized. During the three-month period ended March 31, 2010, AIGFP also made a payment of $10 million to itscounterparty with respect to a Multi-sector CDO. Upon payment, a $10 million loss, which was previously included in the fair value derivativeliability as an unrealized market valuation loss, was realized.
(e) Includes $6.1 billion and $6.3 billion in net notional amount of credit default swaps written with cash settlement provisions at March 31, 2010and December 31, 2009, respectively.
(f) Includes $1.4 billion in net notional amount of credit default swaps written on the super senior tranches of CLOs at both March 31, 2010 andDecember 31, 2009.
(g) Net of offsetting purchased CDS of $1.4 billion and $1.5 billion in net notional amount at March 31, 2010 and December 31, 2009,respectively.
The following table presents changes in the net notional amount of the AIGFP super senior credit default swapportfolio, including credit default swaps written on mezzanine tranches of certain regulatory capital relieftransactions:
Net Notional Effect of Amortization/ Net NotionalFor the Three Months Amount Foreign Reclassification, AmountEnded March 31, 2010 December 31, Exchange net of March 31,(in millions) 2009(a) Terminations Maturities Rates(b) Replenishments 2010(a)
Regulatory Capital:Corporate loans $ 55,010 $ (3,058) $ - $ (2,857) $ (7,102) $ 41,993Prime residential mortgages 93,276 (22,577) - (3,725) (1,130) 65,844Other 1,760 - - (105) (103) 1,552
Total 150,046 (25,635) - (6,687) (8,335) 109,389
Arbitrage:Multi-sector CDOs(c) 7,926 - - (176) (176) 7,574Corporate debt/CLOs(d) 22,076 (5,379) - (404) 74 16,367
Total 30,002 (5,379) - (580) (102) 23,941
Mezzanine tranches(e) 3,478 (226) - (141) (7) 3,104
Total $183,526 $(31,240) $ - $ (7,408) $ (8,444) $136,434
(a) Net notional amounts presented are net of all structural subordination below the covered tranches.
(b) Relates to the strengthening of the U.S. dollar, primarily against the Euro and the British Pound.
(c) Includes $6.1 billion and $6.3 billion in net notional amount of credit default swaps written with cash settlement provisions at March 31, 2010and December 31, 2009, respectively.
(d) Includes $1.4 billion in net notional amount of credit default swaps written on the super senior tranches of CLOs at both March 31, 2010 andDecember 31, 2009.
(e) Net of offsetting purchased CDS of $1.4 billion and $1.5 billion in net notional amount at March 31, 2010 and December 31, 2009,respectively.
146
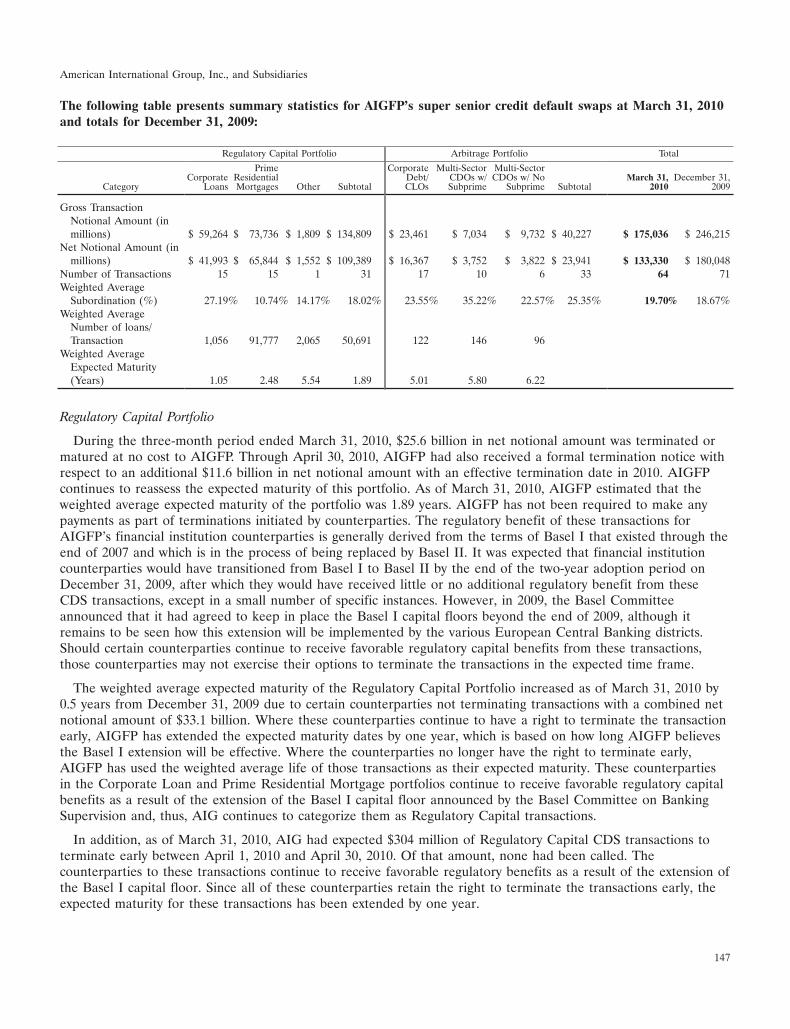
American International Group, Inc., and Subsidiaries
The following table presents summary statistics for AIGFP’s super senior credit default swaps at March 31, 2010and totals for December 31, 2009:
Regulatory Capital Portfolio Arbitrage Portfolio Total
Prime Corporate Multi-Sector Multi-SectorCorporate Residential Debt/ CDOs w/ CDOs w/ No March 31, December 31,
Category Loans Mortgages Other Subtotal CLOs Subprime Subprime Subtotal 2010 2009
Gross TransactionNotional Amount (inmillions) $ 59,264 $ 73,736 $ 1,809 $ 134,809 $ 23,461 $ 7,034 $ 9,732 $ 40,227 $ 175,036 $ 246,215
Net Notional Amount (inmillions) $ 41,993 $ 65,844 $ 1,552 $ 109,389 $ 16,367 $ 3,752 $ 3,822 $ 23,941 $ 133,330 $ 180,048
Number of Transactions 15 15 1 31 17 10 6 33 64 71Weighted Average
Subordination (%) 27.19% 10.74% 14.17% 18.02% 23.55% 35.22% 22.57% 25.35% 19.70% 18.67%Weighted Average
Number of loans/Transaction 1,056 91,777 2,065 50,691 122 146 96
Weighted AverageExpected Maturity(Years) 1.05 2.48 5.54 1.89 5.01 5.80 6.22
Regulatory Capital Portfolio
During the three-month period ended March 31, 2010, $25.6 billion in net notional amount was terminated ormatured at no cost to AIGFP. Through April 30, 2010, AIGFP had also received a formal termination notice withrespect to an additional $11.6 billion in net notional amount with an effective termination date in 2010. AIGFPcontinues to reassess the expected maturity of this portfolio. As of March 31, 2010, AIGFP estimated that theweighted average expected maturity of the portfolio was 1.89 years. AIGFP has not been required to make anypayments as part of terminations initiated by counterparties. The regulatory benefit of these transactions forAIGFP’s financial institution counterparties is generally derived from the terms of Basel I that existed through theend of 2007 and which is in the process of being replaced by Basel II. It was expected that financial institutioncounterparties would have transitioned from Basel I to Basel II by the end of the two-year adoption period onDecember 31, 2009, after which they would have received little or no additional regulatory benefit from theseCDS transactions, except in a small number of specific instances. However, in 2009, the Basel Committeeannounced that it had agreed to keep in place the Basel I capital floors beyond the end of 2009, although itremains to be seen how this extension will be implemented by the various European Central Banking districts.Should certain counterparties continue to receive favorable regulatory capital benefits from these transactions,those counterparties may not exercise their options to terminate the transactions in the expected time frame.
The weighted average expected maturity of the Regulatory Capital Portfolio increased as of March 31, 2010 by0.5 years from December 31, 2009 due to certain counterparties not terminating transactions with a combined netnotional amount of $33.1 billion. Where these counterparties continue to have a right to terminate the transactionearly, AIGFP has extended the expected maturity dates by one year, which is based on how long AIGFP believesthe Basel I extension will be effective. Where the counterparties no longer have the right to terminate early,AIGFP has used the weighted average life of those transactions as their expected maturity. These counterpartiesin the Corporate Loan and Prime Residential Mortgage portfolios continue to receive favorable regulatory capitalbenefits as a result of the extension of the Basel I capital floor announced by the Basel Committee on BankingSupervision and, thus, AIG continues to categorize them as Regulatory Capital transactions.
In addition, as of March 31, 2010, AIG had expected $304 million of Regulatory Capital CDS transactions toterminate early between April 1, 2010 and April 30, 2010. Of that amount, none had been called. Thecounterparties to these transactions continue to receive favorable regulatory benefits as a result of the extension ofthe Basel I capital floor. Since all of these counterparties retain the right to terminate the transactions early, theexpected maturity for these transactions has been extended by one year.
147

American International Group, Inc., and Subsidiaries
Included in the Regulatory Capital portfolio are transactions with one counterparty that notified AIG that itwould not terminate early two of its Prime Residential Mortgage transactions with a combined net notionalamount of $29.7 billion that were expected to be terminated in the first quarter of 2010. With respect to thesetransactions, the counterparty no longer has any rights to terminate the transactions early and is required to payAIG fees on the original notional amounts reduced only by realized losses through the final contractual maturity.Since the two transactions have weighted average lives that are considerably less than their final contractualmaturities, there is value to AIGFP representing counterparty contractual fees to be received beyond the date atwhich the net notional amounts have fully amortized through to the final contractual maturity date. The fair valueof these two super senior transactions as of March 31, 2010 was a derivative asset of $170 million. With respect tothese two transactions, AIGFP has also written CDS transactions on the mezzanine tranches of these portfolios;however, the majority of the transactions on the mezzanine tranches were hedged by AIGFP with other thirdparty CDS transactions. The fair value of the net derivative liability for all mezzanine tranches (including hedgetransactions) increased from $143 million as of December 31, 2009 to $214 million as of March 31, 2010. Formore information on AIGFP collateral calls, see Collateral Calls below.
In light of early termination experience to date and after analyses of other market data, to the extent deemedrelevant and available, AIG determined that there was no unrealized market valuation adjustment for any of thetransactions in this regulatory capital relief portfolio for the three-month period ended March 31, 2010 other than(1) for transactions where AIGFP believes the counterparty is no longer using the transaction to obtain regulatorycapital relief as discussed above and (2) for transactions where the counterparty has failed to terminate thetransaction early as expected and no longer has any rights to terminate early in the future. Although AIGFPbelieves the value of contractual fees receivable on these transactions through maturity exceeds the economicbenefits of any potential payments to the counterparties, the counterparties’ early termination rights, and AIGFP’sexpectation that such rights will be exercised, preclude the recognition of a derivative asset for these transactions.
The following table presents, for each of the regulatory capital CDS transactions in the corporate loan portfolio,the gross transaction notional amount, net notional amount, attachment points, inception to date realized lossesand percent non-investment grade:
Realized PercentGross Transaction Net Notional Attachment Losses Non-investment
(dollars in millions) Notional Amount at Amount at Attachment Point at through Grade atMarch 31, March 31, Point at March 31, March 31, March 31,
CDS 2010 2010 Inception(a) 2010(a) 2010(b) 2010(c)
1 $ 588 $ 492 10.03% 16.38% 0.52% 25.57%2(d) 8,609 2,662 44.00% 69.08% 0.00% 9.29%3 1,839 1,599 10.00% 13.02% 0.16% 25.86%4 8,001 7,094 11.00% 11.33% 0.00% 10.84%5 369 126 18.00% 65.90% 0.00% 67.80%6 10,241 9,073 10.80% 11.41% 0.00% 6.78%7(e) 5,619 4,223 11.30% 24.84% 0.19% 32.30%8 5,052 4,462 11.00% 11.68% 0.09% 12.71%9 3,757 3,210 13.26% 14.54% 0.00% 70.12%10(f) 2,907 617 12.00% 39.06% 0.00% 8.21%11 2,369 1,973 15.85% 16.73% 0.00% 11.57%12 1,122 657 14.00% 32.54% 0.16% 36.34%13 710 386 14.00% 32.54% 0.16% 36.34%14 1,735 1,363 14.00% 32.54% 0.16% 36.34%15(g) 6,346 4,056 17.00% 36.10% 0.05% 17.48%
Total $59,264 $41,993
(a) Expressed as a percentage of gross transaction notional amount of the referenced obligations. As a result of participation ratios andreplenishment rights, the attachment point may not always be computed by dividing net notional amount by gross transaction notional amount.
148
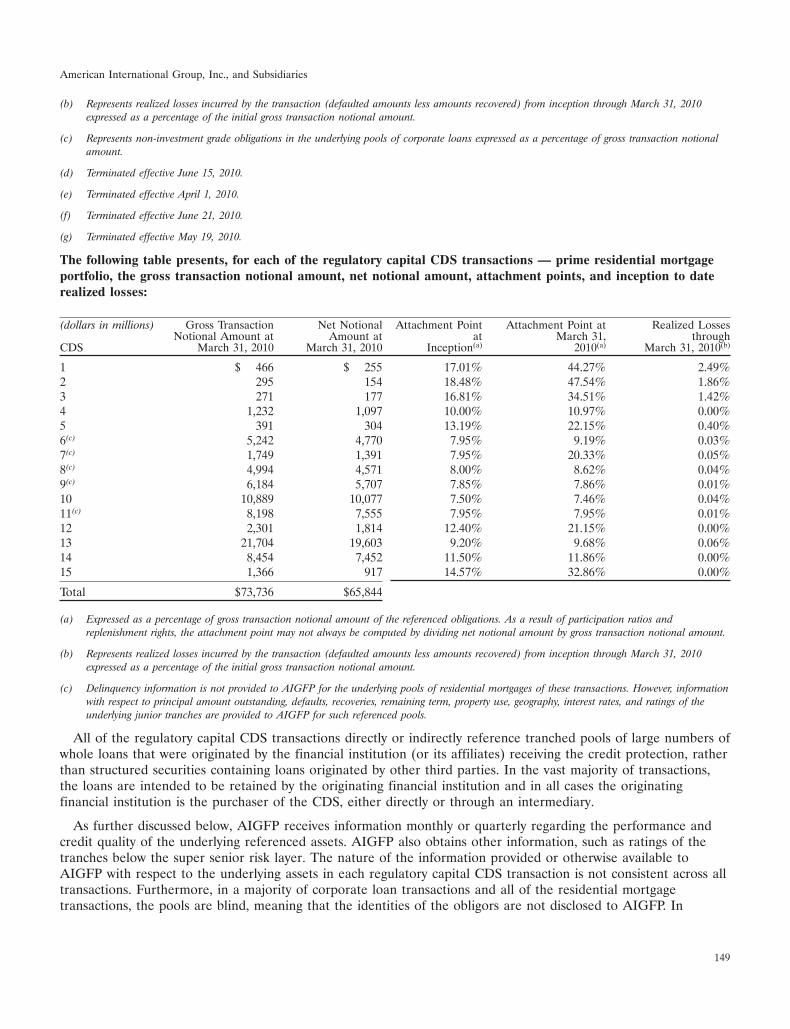
American International Group, Inc., and Subsidiaries
(b) Represents realized losses incurred by the transaction (defaulted amounts less amounts recovered) from inception through March 31, 2010expressed as a percentage of the initial gross transaction notional amount.
(c) Represents non-investment grade obligations in the underlying pools of corporate loans expressed as a percentage of gross transaction notionalamount.
(d) Terminated effective June 15, 2010.
(e) Terminated effective April 1, 2010.
(f) Terminated effective June 21, 2010.
(g) Terminated effective May 19, 2010.
The following table presents, for each of the regulatory capital CDS transactions — prime residential mortgageportfolio, the gross transaction notional amount, net notional amount, attachment points, and inception to daterealized losses:
(dollars in millions) Gross Transaction Net Notional Attachment Point Attachment Point at Realized LossesNotional Amount at Amount at at March 31, through
CDS March 31, 2010 March 31, 2010 Inception(a) 2010(a) March 31, 2010(b)
1 $ 466 $ 255 17.01% 44.27% 2.49%2 295 154 18.48% 47.54% 1.86%3 271 177 16.81% 34.51% 1.42%4 1,232 1,097 10.00% 10.97% 0.00%5 391 304 13.19% 22.15% 0.40%6(c) 5,242 4,770 7.95% 9.19% 0.03%7(c) 1,749 1,391 7.95% 20.33% 0.05%8(c) 4,994 4,571 8.00% 8.62% 0.04%9(c) 6,184 5,707 7.85% 7.86% 0.01%10 10,889 10,077 7.50% 7.46% 0.04%11(c) 8,198 7,555 7.95% 7.95% 0.01%12 2,301 1,814 12.40% 21.15% 0.00%13 21,704 19,603 9.20% 9.68% 0.06%14 8,454 7,452 11.50% 11.86% 0.00%15 1,366 917 14.57% 32.86% 0.00%
Total $73,736 $65,844
(a) Expressed as a percentage of gross transaction notional amount of the referenced obligations. As a result of participation ratios andreplenishment rights, the attachment point may not always be computed by dividing net notional amount by gross transaction notional amount.
(b) Represents realized losses incurred by the transaction (defaulted amounts less amounts recovered) from inception through March 31, 2010expressed as a percentage of the initial gross transaction notional amount.
(c) Delinquency information is not provided to AIGFP for the underlying pools of residential mortgages of these transactions. However, informationwith respect to principal amount outstanding, defaults, recoveries, remaining term, property use, geography, interest rates, and ratings of theunderlying junior tranches are provided to AIGFP for such referenced pools.
All of the regulatory capital CDS transactions directly or indirectly reference tranched pools of large numbers ofwhole loans that were originated by the financial institution (or its affiliates) receiving the credit protection, ratherthan structured securities containing loans originated by other third parties. In the vast majority of transactions,the loans are intended to be retained by the originating financial institution and in all cases the originatingfinancial institution is the purchaser of the CDS, either directly or through an intermediary.
As further discussed below, AIGFP receives information monthly or quarterly regarding the performance andcredit quality of the underlying referenced assets. AIGFP also obtains other information, such as ratings of thetranches below the super senior risk layer. The nature of the information provided or otherwise available toAIGFP with respect to the underlying assets in each regulatory capital CDS transaction is not consistent across alltransactions. Furthermore, in a majority of corporate loan transactions and all of the residential mortgagetransactions, the pools are blind, meaning that the identities of the obligors are not disclosed to AIGFP. In
149
American International Group, Inc., and Subsidiaries
addition, although AIGFP receives periodic reports on the underlying asset pools, virtually all of the regulatorycapital CDS transactions contain confidentiality restrictions that preclude AIGFP’s public disclosure of informationrelating to the underlying referenced assets. The originating financial institutions, calculation agents or trustees(each a Report Provider) provide periodic reports on all underlying referenced assets as described below, includingfor those within the blind pools. While much of this information received by AIGFP cannot be aggregated in acomparable way for disclosure purposes because of the confidentiality restrictions and the inconsistency of theinformation, it does provide a sufficient basis for AIGFP to evaluate the risks of the portfolio and to determine areasonable estimate of fair value.
For regulatory capital CDS transactions written on underlying pools of corporate loans, AIGFP receivesmonthly or quarterly updates from one or more Report Providers for each such referenced pool detailing, withrespect to the corporate loans comprising such pool, the principal amount outstanding and defaults. In virtually allof these reports, AIGFP also receives information on recoveries and realized losses. AIGFP also receives quarterlystratification tables for each pool incorporating geography, industry and, when not publicly rated, thecounterparty’s assessment of the credit quality of the underlying corporate loans. Additionally, for a significantmajority of these regulatory capital CDS transactions, upon the occurrence of a credit event with respect to anycorporate loan included in any such pool, AIG receives a notice detailing the identity or identification number ofthe borrower, notional amount of such loan and the effective date of such credit event.
Ratings from independent ratings agencies for the underlying assets of the corporate loan portfolio are notuniversally available, but AIGFP estimates the ratings for the assets not rated by independent agencies bymapping the information obtained from the Report Providers to rating agency criteria. The ‘‘PercentNon-Investment Grade’’ information in the table above is provided as an indication of the nature of loansunderlying the transactions, not necessarily as an indicator of relative risk of the CDS transactions, which isdetermined by the individual transaction structures. For example, Small and Medium Enterprise (SME) loanbalances tend to be rated lower than loans to large, well-established enterprises. However, the greater number ofloans and the smaller average size of the SME loans mitigate the risk profile of the pools. In addition, thetransaction structures reflect AIGFP’s assessment of the loan collateral arrangements, expected recovery values,and reserve accounts in determining the level of subordination required to minimize the risk of loss. Thepercentage of non-investment grade obligations in the underlying pools of corporate loans varies considerably. Thetwo pools containing the highest percentages of non-investment grade obligations, which include all transactionswith pools having non-investment grade percentages greater than 40.00 percent, are all granular SME loan poolswhich benefit from collateral arrangements made by the originating financial institutions and from work out ofrecoveries by the originating financial institutions. The average number of loans in each pool is over 4,800. Thislarge number of SME loans increases the predictability of the expected loss and lessens the probability thatdiscrete events will have a meaningful impact on the results of the overall pool. These transactions benefit from atranche junior to it which was still rated AAA by at least two rating agencies at March 31, 2010. Three otherpools, with a total net notional amount of $2.4 billion, have non-investment grade percentages greater than35.00 percent, each with a remaining life to maturity of 16.0 years. These pools have realized losses of0.16 percent from inception through March 31, 2010 and have current weighted average attachment points of32.54 percent. Approximately 0.47 percent of the assets underlying the corporate loan transactions are in default.The percentage of assets in default by transaction was available for all transactions and ranged from 0.00 percentto 2.86 percent.
For regulatory capital CDS transactions written on underlying pools of residential mortgages, AIGFP receivesquarterly reports for each such referenced pool detailing, with respect to the residential mortgages comprisingsuch pool, the aggregate principal amount outstanding, defaults and realized losses. These reports includeadditional information on delinquencies for the large majority of the transactions and recoveries for substantiallyall transactions. AIGFP also receives quarterly stratification tables for each pool incorporating geography for theunderlying residential mortgages. The stratification tables also include information on remaining term, propertyuse and interest rates for a large majority of the transactions.
150
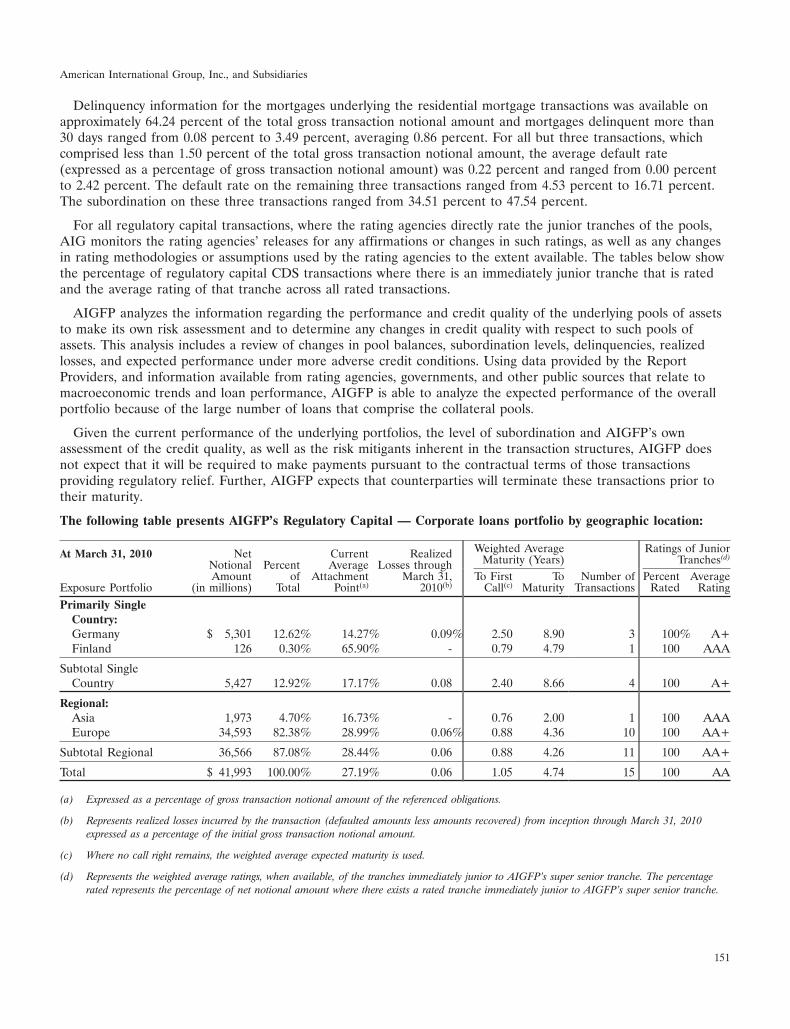
American International Group, Inc., and Subsidiaries
Delinquency information for the mortgages underlying the residential mortgage transactions was available onapproximately 64.24 percent of the total gross transaction notional amount and mortgages delinquent more than30 days ranged from 0.08 percent to 3.49 percent, averaging 0.86 percent. For all but three transactions, whichcomprised less than 1.50 percent of the total gross transaction notional amount, the average default rate(expressed as a percentage of gross transaction notional amount) was 0.22 percent and ranged from 0.00 percentto 2.42 percent. The default rate on the remaining three transactions ranged from 4.53 percent to 16.71 percent.The subordination on these three transactions ranged from 34.51 percent to 47.54 percent.
For all regulatory capital transactions, where the rating agencies directly rate the junior tranches of the pools,AIG monitors the rating agencies’ releases for any affirmations or changes in such ratings, as well as any changesin rating methodologies or assumptions used by the rating agencies to the extent available. The tables below showthe percentage of regulatory capital CDS transactions where there is an immediately junior tranche that is ratedand the average rating of that tranche across all rated transactions.
AIGFP analyzes the information regarding the performance and credit quality of the underlying pools of assetsto make its own risk assessment and to determine any changes in credit quality with respect to such pools ofassets. This analysis includes a review of changes in pool balances, subordination levels, delinquencies, realizedlosses, and expected performance under more adverse credit conditions. Using data provided by the ReportProviders, and information available from rating agencies, governments, and other public sources that relate tomacroeconomic trends and loan performance, AIGFP is able to analyze the expected performance of the overallportfolio because of the large number of loans that comprise the collateral pools.
Given the current performance of the underlying portfolios, the level of subordination and AIGFP’s ownassessment of the credit quality, as well as the risk mitigants inherent in the transaction structures, AIGFP doesnot expect that it will be required to make payments pursuant to the contractual terms of those transactionsproviding regulatory relief. Further, AIGFP expects that counterparties will terminate these transactions prior totheir maturity.
The following table presents AIGFP’s Regulatory Capital — Corporate loans portfolio by geographic location:
Weighted Average Ratings of JuniorAt March 31, 2010 Net Current Realized Maturity (Years) Tranches(d)Notional Percent Average Losses throughAmount of Attachment March 31, To First To Number of Percent Average
Exposure Portfolio (in millions) Total Point(a) 2010(b) Call(c) Maturity Transactions Rated Rating
Primarily SingleCountry:Germany $ 5,301 12.62% 14.27% 0.09% 2.50 8.90 3 100% A+Finland 126 0.30% 65.90% - 0.79 4.79 1 100 AAA
Subtotal SingleCountry 5,427 12.92% 17.17% 0.08 2.40 8.66 4 100 A+
Regional:Asia 1,973 4.70% 16.73% - 0.76 2.00 1 100 AAAEurope 34,593 82.38% 28.99% 0.06% 0.88 4.36 10 100 AA+
Subtotal Regional 36,566 87.08% 28.44% 0.06 0.88 4.26 11 100 AA+
Total $ 41,993 100.00% 27.19% 0.06 1.05 4.74 15 100 AA
(a) Expressed as a percentage of gross transaction notional amount of the referenced obligations.
(b) Represents realized losses incurred by the transaction (defaulted amounts less amounts recovered) from inception through March 31, 2010expressed as a percentage of the initial gross transaction notional amount.
(c) Where no call right remains, the weighted average expected maturity is used.
(d) Represents the weighted average ratings, when available, of the tranches immediately junior to AIGFP’s super senior tranche. The percentagerated represents the percentage of net notional amount where there exists a rated tranche immediately junior to AIGFP’s super senior tranche.
151

American International Group, Inc., and Subsidiaries
The following table presents AIGFP’s Regulatory Capital — Prime residential mortgage portfolio summarized bygeographic location:
Weighted Average Ratings of JuniorAt March 31, 2010 Net Current Realized Maturity (Years) Tranches(d)Notional Percent Average Losses throughAmount of Attachment March 31, To First To Number of Percent Average
(in millions) Total Point(a) 2010(b) Call(c) Maturity Transactions Rated Rating
Country:Denmark $29,680 45.08% 8.94% 0.05% 4.36 29.48 2 100.00% AAAFrance 23,994 36.44 9.12% 0.03% 0.96 29.95 5 100.00 AAAGermany 3,621 5.50 28.73% 0.59% 1.53 43.41 6 75.00 AAA
NotNetherlands 1,097 1.66 10.97% 0.00% 0.75 70.75 1 - ratedSweden 7,452 11.32 11.86% 0.00% 0.85 29.85 1 100.00 AAA
Total $65,844 100.00% 10.74% 0.10% 2.48 31.34 15 97.00% AAA
(a) Expressed as a percentage of gross transaction notional amount of the referenced obligations.
(b) Represents realized losses incurred by the transaction (defaulted amounts less amounts recovered) from inception through March 31, 2010expressed as a percentage of the initial gross transaction notional amount.
(c) Where no call right remains, the weighted average expected maturity is used.
(d) Represents the weighted average ratings, when available, of the tranches immediately junior to AIGFP’s super senior tranche. The percentagerated represents the percentage of net notional amount where there exists a rated tranche immediately junior to AIGFP’s super senior tranche.
Arbitrage Portfolio
A portion of AIGFP’s super senior credit default swaps as of March 31, 2010 are arbitrage-motivatedtransactions written on multi-sector CDOs or designated pools of investment grade senior unsecured corporatedebt or CLOs.
Multi-Sector CDOs
The following table summarizes gross transaction notional amount of the multi-sector CDOs on which AIGFPwrote protection on the super senior tranche, subordination below the super senior risk layer, net notionalamount and fair value of derivative liability by underlying collateral type:
At March 31, 2010 Gross SubordinationTransaction Below the Net Fair Value of
Notional Super Senior Notional Derivative(in millions) Amount(a) Risk Layer Amount Liability
High grade with sub-prime collateral $ 3,459 $ 1,847 $ 1,612 $ 681High grade with no sub-prime collateral 8,057 5,032 3,025 1,263
Total high grade(b) 11,516 6,879 4,637 1,944
Mezzanine with sub-prime collateral 3,575 1,435 2,140 1,693Mezzanine with no sub-prime collateral 1,675 878 797 613
Total mezzanine(c) 5,250 2,313 2,937 2,306
Total $ 16,766 $ 9,192 $ 7,574 $ 4,250
(a) Total outstanding principal amount of securities held by a CDO.
(b) ‘‘High grade’’ refers to transactions in which the underlying collateral credit ratings on a stand-alone basis were predominantly AA or higher atorigination.
(c) ‘‘Mezzanine’’ refers to transactions in which the underlying collateral credit ratings on a stand-alone basis were predominantly A or lower atorigination.
152
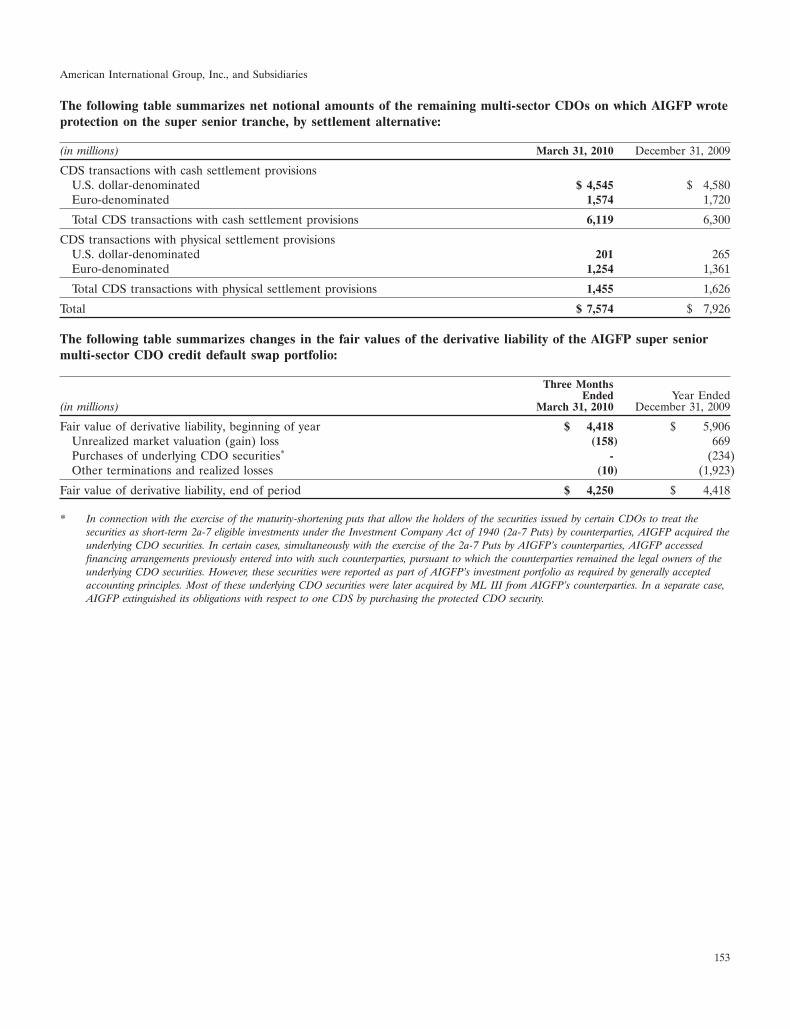
American International Group, Inc., and Subsidiaries
The following table summarizes net notional amounts of the remaining multi-sector CDOs on which AIGFP wroteprotection on the super senior tranche, by settlement alternative:
(in millions) March 31, 2010 December 31, 2009
CDS transactions with cash settlement provisionsU.S. dollar-denominated $ 4,545 $ 4,580Euro-denominated 1,574 1,720
Total CDS transactions with cash settlement provisions 6,119 6,300
CDS transactions with physical settlement provisionsU.S. dollar-denominated 201 265Euro-denominated 1,254 1,361
Total CDS transactions with physical settlement provisions 1,455 1,626
Total $ 7,574 $ 7,926
The following table summarizes changes in the fair values of the derivative liability of the AIGFP super seniormulti-sector CDO credit default swap portfolio:
Three MonthsEnded Year Ended
(in millions) March 31, 2010 December 31, 2009
Fair value of derivative liability, beginning of year $ 4,418 $ 5,906Unrealized market valuation (gain) loss (158) 669Purchases of underlying CDO securities* - (234)Other terminations and realized losses (10) (1,923)
Fair value of derivative liability, end of period $ 4,250 $ 4,418
* In connection with the exercise of the maturity-shortening puts that allow the holders of the securities issued by certain CDOs to treat thesecurities as short-term 2a-7 eligible investments under the Investment Company Act of 1940 (2a-7 Puts) by counterparties, AIGFP acquired theunderlying CDO securities. In certain cases, simultaneously with the exercise of the 2a-7 Puts by AIGFP’s counterparties, AIGFP accessedfinancing arrangements previously entered into with such counterparties, pursuant to which the counterparties remained the legal owners of theunderlying CDO securities. However, these securities were reported as part of AIGFP’s investment portfolio as required by generally acceptedaccounting principles. Most of these underlying CDO securities were later acquired by ML III from AIGFP’s counterparties. In a separate case,AIGFP extinguished its obligations with respect to one CDS by purchasing the protected CDO security.
153
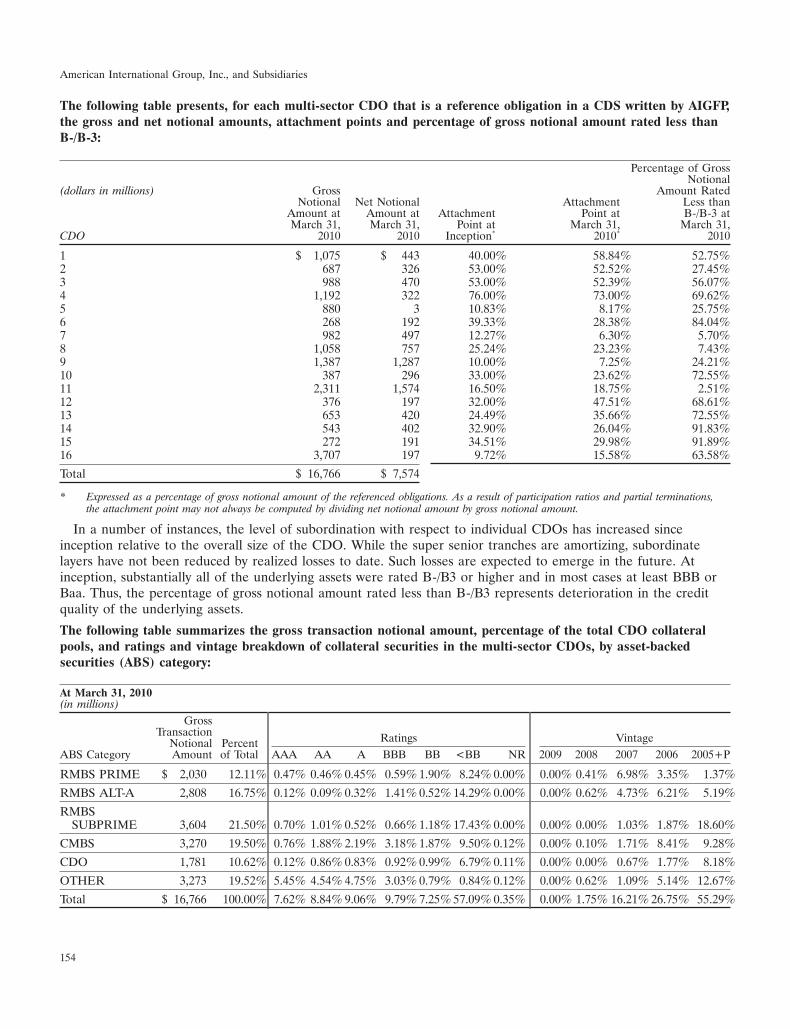
American International Group, Inc., and Subsidiaries
The following table presents, for each multi-sector CDO that is a reference obligation in a CDS written by AIGFP,the gross and net notional amounts, attachment points and percentage of gross notional amount rated less thanB-/B-3:
Percentage of GrossNotional
(dollars in millions) Gross Amount RatedNotional Net Notional Attachment Less than
Amount at Amount at Attachment Point at B-/B-3 atMarch 31, March 31, Point at March 31, March 31,
CDO 2010 2010 Inception* 2010* 2010
1 $ 1,075 $ 443 40.00% 58.84% 52.75%2 687 326 53.00% 52.52% 27.45%3 988 470 53.00% 52.39% 56.07%4 1,192 322 76.00% 73.00% 69.62%5 880 3 10.83% 8.17% 25.75%6 268 192 39.33% 28.38% 84.04%7 982 497 12.27% 6.30% 5.70%8 1,058 757 25.24% 23.23% 7.43%9 1,387 1,287 10.00% 7.25% 24.21%10 387 296 33.00% 23.62% 72.55%11 2,311 1,574 16.50% 18.75% 2.51%12 376 197 32.00% 47.51% 68.61%13 653 420 24.49% 35.66% 72.55%14 543 402 32.90% 26.04% 91.83%15 272 191 34.51% 29.98% 91.89%16 3,707 197 9.72% 15.58% 63.58%
Total $ 16,766 $ 7,574
* Expressed as a percentage of gross notional amount of the referenced obligations. As a result of participation ratios and partial terminations,the attachment point may not always be computed by dividing net notional amount by gross notional amount.
In a number of instances, the level of subordination with respect to individual CDOs has increased sinceinception relative to the overall size of the CDO. While the super senior tranches are amortizing, subordinatelayers have not been reduced by realized losses to date. Such losses are expected to emerge in the future. Atinception, substantially all of the underlying assets were rated B-/B3 or higher and in most cases at least BBB orBaa. Thus, the percentage of gross notional amount rated less than B-/B3 represents deterioration in the creditquality of the underlying assets.
The following table summarizes the gross transaction notional amount, percentage of the total CDO collateralpools, and ratings and vintage breakdown of collateral securities in the multi-sector CDOs, by asset-backedsecurities (ABS) category:
At March 31, 2010(in millions)
GrossTransaction Ratings VintageNotional Percent
ABS Category Amount of Total AAA AA A BBB BB <BB NR 2009 2008 2007 2006 2005+P
RMBS PRIME $ 2,030 12.11% 0.47% 0.46% 0.45% 0.59% 1.90% 8.24% 0.00% 0.00% 0.41% 6.98% 3.35% 1.37%
RMBS ALT-A 2,808 16.75% 0.12% 0.09% 0.32% 1.41% 0.52% 14.29% 0.00% 0.00% 0.62% 4.73% 6.21% 5.19%
RMBSSUBPRIME 3,604 21.50% 0.70% 1.01% 0.52% 0.66% 1.18% 17.43% 0.00% 0.00% 0.00% 1.03% 1.87% 18.60%
CMBS 3,270 19.50% 0.76% 1.88% 2.19% 3.18% 1.87% 9.50% 0.12% 0.00% 0.10% 1.71% 8.41% 9.28%
CDO 1,781 10.62% 0.12% 0.86% 0.83% 0.92% 0.99% 6.79% 0.11% 0.00% 0.00% 0.67% 1.77% 8.18%
OTHER 3,273 19.52% 5.45% 4.54% 4.75% 3.03% 0.79% 0.84% 0.12% 0.00% 0.62% 1.09% 5.14% 12.67%
Total $ 16,766 100.00% 7.62% 8.84% 9.06% 9.79% 7.25% 57.09% 0.35% 0.00% 1.75% 16.21% 26.75% 55.29%
154

American International Group, Inc., and Subsidiaries
Corporate Debt/CLOs
The corporate arbitrage portfolio consists principally of CDS written on portfolios of corporate obligations thatwere generally rated investment grade at the inception of the CDS. These CDS transactions require cashsettlement. This portfolio also includes CDS with a net notional amount of $1.4 billion written on the senior partof the capital structure of CLOs, which require physical settlement.
The following table summarizes gross transaction notional amount of CDS transactions written on portfolios ofcorporate obligations, percentage of the total referenced portfolios, and ratings by industry sector, in addition tothe subordinations below the super senior risk layer, AIGFP’s net notional amounts and fair value of derivativeliability:
RatingsAt March 31, 2010 Gross Transaction Percent(in millions) Notional Amount of Total Aa A Baa Ba <Ba NR
Industry SectorUnited States
Industrial $ 8,660 36.9% 0.2% 5.1% 17.4% 4.1% 8.1% 2.0%Financial 2,336 10.0% 0.2% 3.3% 3.3% 0.2% 1.8% 1.2%Utilities 672 2.9% 0.0% 0.3% 2.4% 0.0% 0.1% 0.1%Other 162 0.7% 0.0% 0.1% 0.1% 0.1% 0.0% 0.4%
Total United States 11,830 50.5% 0.4% 8.8% 23.2% 4.4% 10.0% 3.7%
Non-United StatesIndustrial 9,199 39.2% 0.2% 6.0% 12.7% 4.3% 4.8% 11.2%Financial 1,152 4.9% 0.0% 2.5% 1.7% 0.1% 0.2% 0.4%Government 884 3.8% 0.1% 1.6% 1.5% 0.4% 0.0% 0.2%Utilities 314 1.3% 0.0% 0.1% 0.7% 0.0% 0.1% 0.4%Other 82 0.3% 0.0% 0.1% 0.0% 0.0% 0.1% 0.1%
Total Non-United States 11,631 49.5% 0.3% 10.3% 16.6% 4.8% 5.2% 12.3%
Total gross transaction notional amount 23,461 100.0% 0.7% 19.1% 39.8% 9.2% 15.2% 16.0%
Subordination 7,094
Net Notional Amount $ 16,367
Fair Value of Derivative Liability $ 308
155
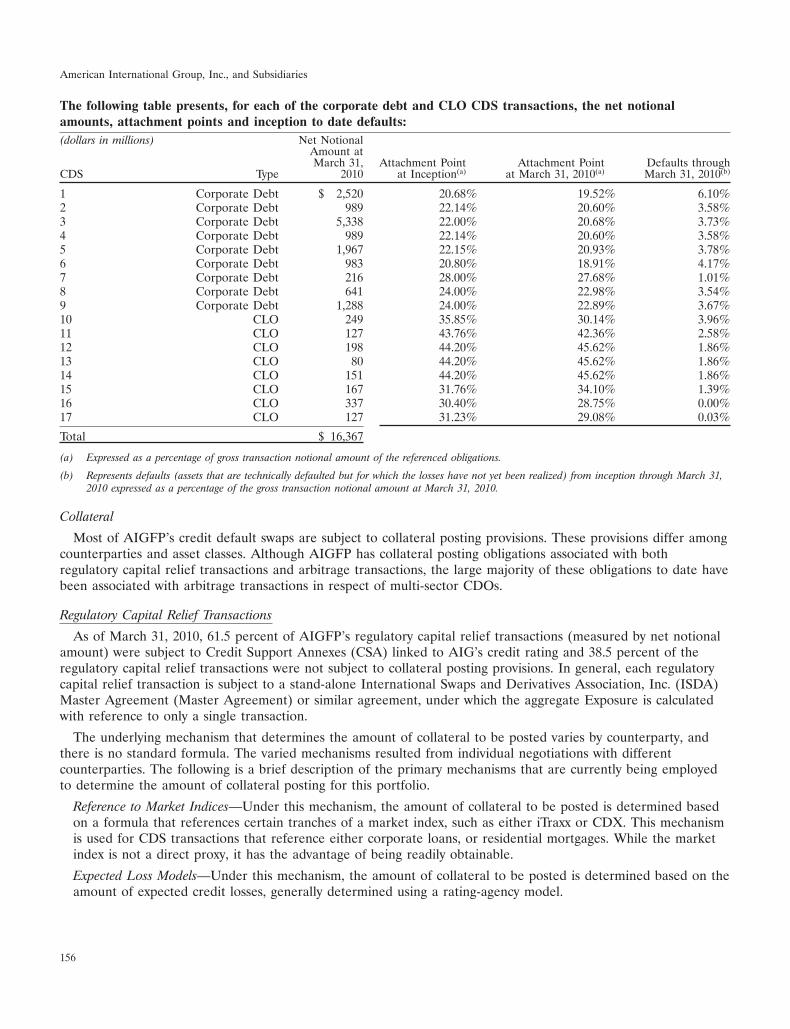
American International Group, Inc., and Subsidiaries
The following table presents, for each of the corporate debt and CLO CDS transactions, the net notionalamounts, attachment points and inception to date defaults:(dollars in millions) Net Notional
Amount atMarch 31, Attachment Point Attachment Point Defaults through
CDS Type 2010 at Inception(a) at March 31, 2010(a) March 31, 2010(b)
1 Corporate Debt $ 2,520 20.68% 19.52% 6.10%2 Corporate Debt 989 22.14% 20.60% 3.58%3 Corporate Debt 5,338 22.00% 20.68% 3.73%4 Corporate Debt 989 22.14% 20.60% 3.58%5 Corporate Debt 1,967 22.15% 20.93% 3.78%6 Corporate Debt 983 20.80% 18.91% 4.17%7 Corporate Debt 216 28.00% 27.68% 1.01%8 Corporate Debt 641 24.00% 22.98% 3.54%9 Corporate Debt 1,288 24.00% 22.89% 3.67%10 CLO 249 35.85% 30.14% 3.96%11 CLO 127 43.76% 42.36% 2.58%12 CLO 198 44.20% 45.62% 1.86%13 CLO 80 44.20% 45.62% 1.86%14 CLO 151 44.20% 45.62% 1.86%15 CLO 167 31.76% 34.10% 1.39%16 CLO 337 30.40% 28.75% 0.00%17 CLO 127 31.23% 29.08% 0.03%
Total $ 16,367
(a) Expressed as a percentage of gross transaction notional amount of the referenced obligations.
(b) Represents defaults (assets that are technically defaulted but for which the losses have not yet been realized) from inception through March 31,2010 expressed as a percentage of the gross transaction notional amount at March 31, 2010.
Collateral
Most of AIGFP’s credit default swaps are subject to collateral posting provisions. These provisions differ amongcounterparties and asset classes. Although AIGFP has collateral posting obligations associated with bothregulatory capital relief transactions and arbitrage transactions, the large majority of these obligations to date havebeen associated with arbitrage transactions in respect of multi-sector CDOs.
Regulatory Capital Relief Transactions
As of March 31, 2010, 61.5 percent of AIGFP’s regulatory capital relief transactions (measured by net notionalamount) were subject to Credit Support Annexes (CSA) linked to AIG’s credit rating and 38.5 percent of theregulatory capital relief transactions were not subject to collateral posting provisions. In general, each regulatorycapital relief transaction is subject to a stand-alone International Swaps and Derivatives Association, Inc. (ISDA)Master Agreement (Master Agreement) or similar agreement, under which the aggregate Exposure is calculatedwith reference to only a single transaction.
The underlying mechanism that determines the amount of collateral to be posted varies by counterparty, andthere is no standard formula. The varied mechanisms resulted from individual negotiations with differentcounterparties. The following is a brief description of the primary mechanisms that are currently being employedto determine the amount of collateral posting for this portfolio.
Reference to Market Indices—Under this mechanism, the amount of collateral to be posted is determined basedon a formula that references certain tranches of a market index, such as either iTraxx or CDX. This mechanismis used for CDS transactions that reference either corporate loans, or residential mortgages. While the marketindex is not a direct proxy, it has the advantage of being readily obtainable.
Expected Loss Models—Under this mechanism, the amount of collateral to be posted is determined based on theamount of expected credit losses, generally determined using a rating-agency model.
156
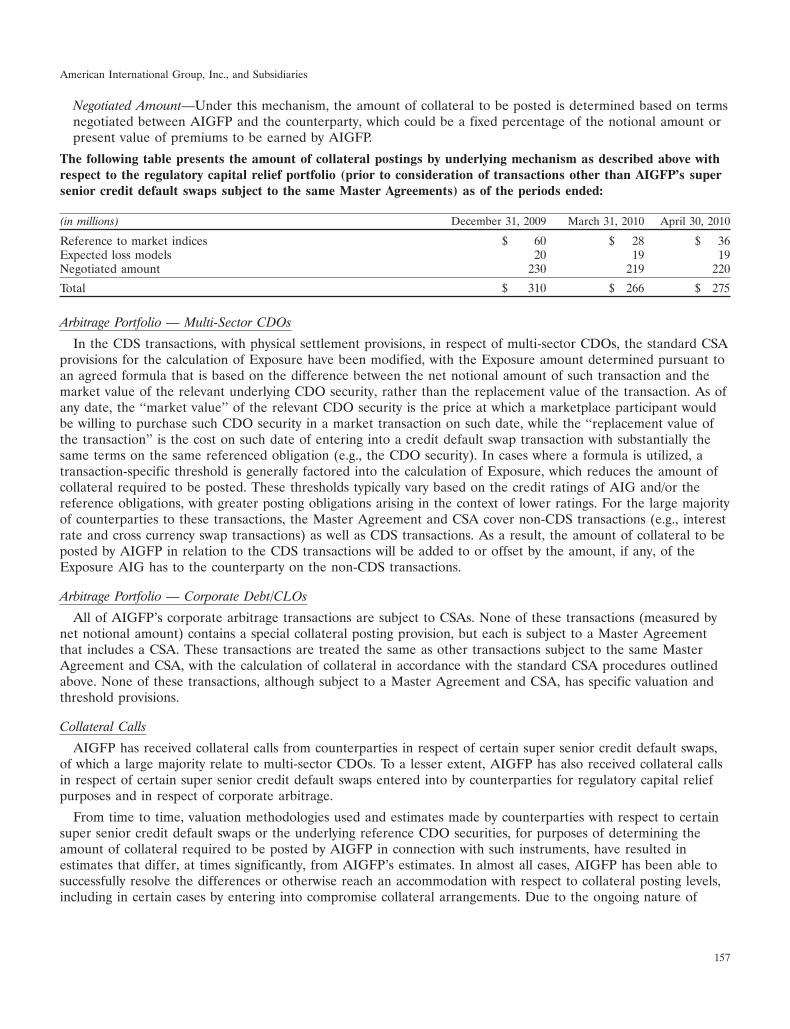
American International Group, Inc., and Subsidiaries
Negotiated Amount—Under this mechanism, the amount of collateral to be posted is determined based on termsnegotiated between AIGFP and the counterparty, which could be a fixed percentage of the notional amount orpresent value of premiums to be earned by AIGFP.
The following table presents the amount of collateral postings by underlying mechanism as described above withrespect to the regulatory capital relief portfolio (prior to consideration of transactions other than AIGFP’s supersenior credit default swaps subject to the same Master Agreements) as of the periods ended:
(in millions) December 31, 2009 March 31, 2010 April 30, 2010
Reference to market indices $ 60 $ 28 $ 36Expected loss models 20 19 19Negotiated amount 230 219 220
Total $ 310 $ 266 $ 275
Arbitrage Portfolio — Multi-Sector CDOs
In the CDS transactions, with physical settlement provisions, in respect of multi-sector CDOs, the standard CSAprovisions for the calculation of Exposure have been modified, with the Exposure amount determined pursuant toan agreed formula that is based on the difference between the net notional amount of such transaction and themarket value of the relevant underlying CDO security, rather than the replacement value of the transaction. As ofany date, the ‘‘market value’’ of the relevant CDO security is the price at which a marketplace participant wouldbe willing to purchase such CDO security in a market transaction on such date, while the ‘‘replacement value ofthe transaction’’ is the cost on such date of entering into a credit default swap transaction with substantially thesame terms on the same referenced obligation (e.g., the CDO security). In cases where a formula is utilized, atransaction-specific threshold is generally factored into the calculation of Exposure, which reduces the amount ofcollateral required to be posted. These thresholds typically vary based on the credit ratings of AIG and/or thereference obligations, with greater posting obligations arising in the context of lower ratings. For the large majorityof counterparties to these transactions, the Master Agreement and CSA cover non-CDS transactions (e.g., interestrate and cross currency swap transactions) as well as CDS transactions. As a result, the amount of collateral to beposted by AIGFP in relation to the CDS transactions will be added to or offset by the amount, if any, of theExposure AIG has to the counterparty on the non-CDS transactions.
Arbitrage Portfolio — Corporate Debt/CLOs
All of AIGFP’s corporate arbitrage transactions are subject to CSAs. None of these transactions (measured bynet notional amount) contains a special collateral posting provision, but each is subject to a Master Agreementthat includes a CSA. These transactions are treated the same as other transactions subject to the same MasterAgreement and CSA, with the calculation of collateral in accordance with the standard CSA procedures outlinedabove. None of these transactions, although subject to a Master Agreement and CSA, has specific valuation andthreshold provisions.
Collateral Calls
AIGFP has received collateral calls from counterparties in respect of certain super senior credit default swaps,of which a large majority relate to multi-sector CDOs. To a lesser extent, AIGFP has also received collateral callsin respect of certain super senior credit default swaps entered into by counterparties for regulatory capital reliefpurposes and in respect of corporate arbitrage.
From time to time, valuation methodologies used and estimates made by counterparties with respect to certainsuper senior credit default swaps or the underlying reference CDO securities, for purposes of determining theamount of collateral required to be posted by AIGFP in connection with such instruments, have resulted inestimates that differ, at times significantly, from AIGFP’s estimates. In almost all cases, AIGFP has been able tosuccessfully resolve the differences or otherwise reach an accommodation with respect to collateral posting levels,including in certain cases by entering into compromise collateral arrangements. Due to the ongoing nature of
157
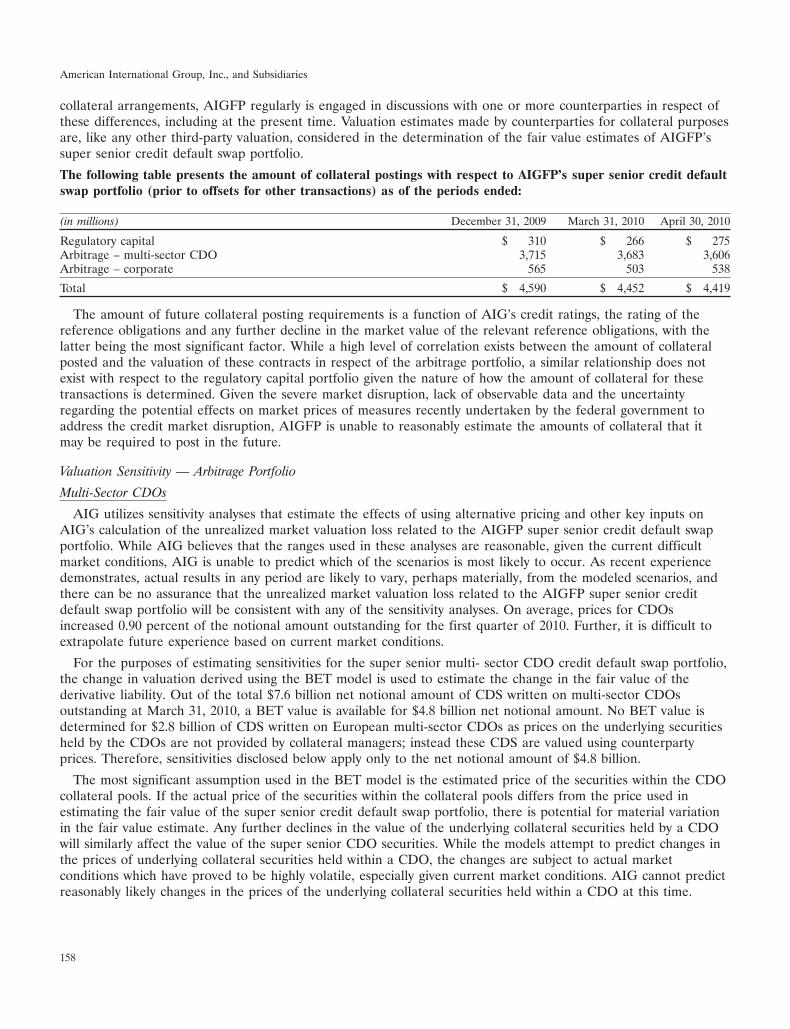
American International Group, Inc., and Subsidiaries
collateral arrangements, AIGFP regularly is engaged in discussions with one or more counterparties in respect ofthese differences, including at the present time. Valuation estimates made by counterparties for collateral purposesare, like any other third-party valuation, considered in the determination of the fair value estimates of AIGFP’ssuper senior credit default swap portfolio.
The following table presents the amount of collateral postings with respect to AIGFP’s super senior credit defaultswap portfolio (prior to offsets for other transactions) as of the periods ended:
(in millions) December 31, 2009 March 31, 2010 April 30, 2010
Regulatory capital $ 310 $ 266 $ 275Arbitrage – multi-sector CDO 3,715 3,683 3,606Arbitrage – corporate 565 503 538
Total $ 4,590 $ 4,452 $ 4,419
The amount of future collateral posting requirements is a function of AIG’s credit ratings, the rating of thereference obligations and any further decline in the market value of the relevant reference obligations, with thelatter being the most significant factor. While a high level of correlation exists between the amount of collateralposted and the valuation of these contracts in respect of the arbitrage portfolio, a similar relationship does notexist with respect to the regulatory capital portfolio given the nature of how the amount of collateral for thesetransactions is determined. Given the severe market disruption, lack of observable data and the uncertaintyregarding the potential effects on market prices of measures recently undertaken by the federal government toaddress the credit market disruption, AIGFP is unable to reasonably estimate the amounts of collateral that itmay be required to post in the future.
Valuation Sensitivity — Arbitrage Portfolio
Multi-Sector CDOs
AIG utilizes sensitivity analyses that estimate the effects of using alternative pricing and other key inputs onAIG’s calculation of the unrealized market valuation loss related to the AIGFP super senior credit default swapportfolio. While AIG believes that the ranges used in these analyses are reasonable, given the current difficultmarket conditions, AIG is unable to predict which of the scenarios is most likely to occur. As recent experiencedemonstrates, actual results in any period are likely to vary, perhaps materially, from the modeled scenarios, andthere can be no assurance that the unrealized market valuation loss related to the AIGFP super senior creditdefault swap portfolio will be consistent with any of the sensitivity analyses. On average, prices for CDOsincreased 0.90 percent of the notional amount outstanding for the first quarter of 2010. Further, it is difficult toextrapolate future experience based on current market conditions.
For the purposes of estimating sensitivities for the super senior multi- sector CDO credit default swap portfolio,the change in valuation derived using the BET model is used to estimate the change in the fair value of thederivative liability. Out of the total $7.6 billion net notional amount of CDS written on multi-sector CDOsoutstanding at March 31, 2010, a BET value is available for $4.8 billion net notional amount. No BET value isdetermined for $2.8 billion of CDS written on European multi-sector CDOs as prices on the underlying securitiesheld by the CDOs are not provided by collateral managers; instead these CDS are valued using counterpartyprices. Therefore, sensitivities disclosed below apply only to the net notional amount of $4.8 billion.
The most significant assumption used in the BET model is the estimated price of the securities within the CDOcollateral pools. If the actual price of the securities within the collateral pools differs from the price used inestimating the fair value of the super senior credit default swap portfolio, there is potential for material variationin the fair value estimate. Any further declines in the value of the underlying collateral securities held by a CDOwill similarly affect the value of the super senior CDO securities. While the models attempt to predict changes inthe prices of underlying collateral securities held within a CDO, the changes are subject to actual marketconditions which have proved to be highly volatile, especially given current market conditions. AIG cannot predictreasonably likely changes in the prices of the underlying collateral securities held within a CDO at this time.
158
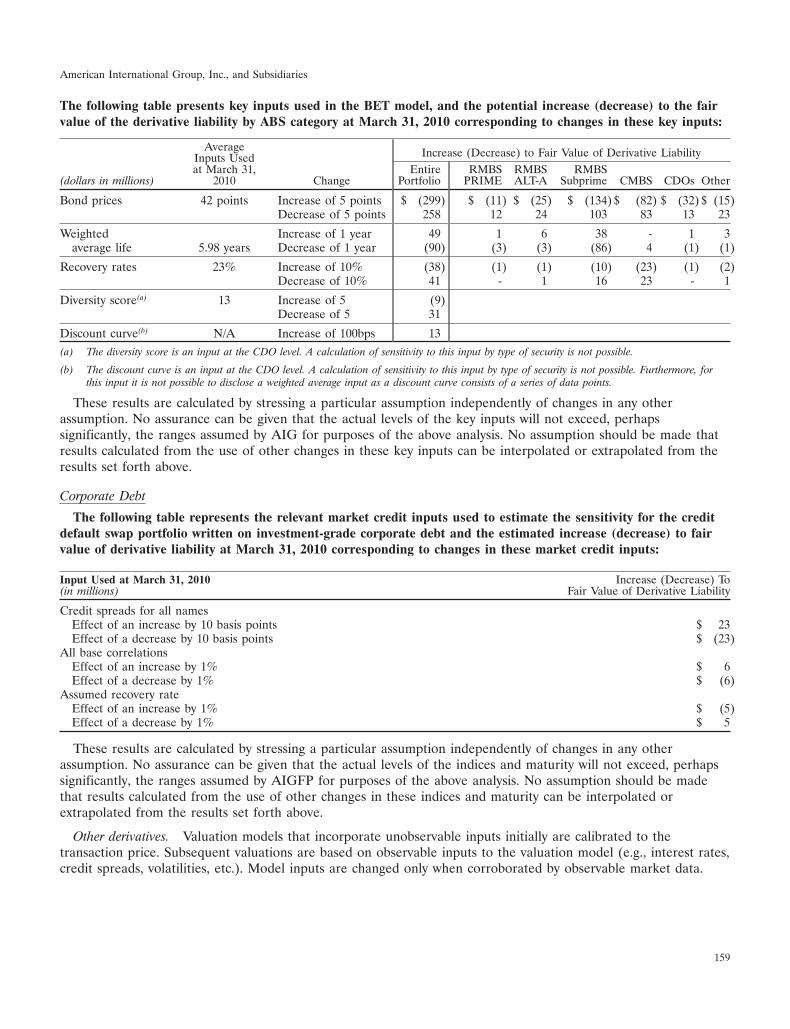
American International Group, Inc., and Subsidiaries
The following table presents key inputs used in the BET model, and the potential increase (decrease) to the fairvalue of the derivative liability by ABS category at March 31, 2010 corresponding to changes in these key inputs:
Average Increase (Decrease) to Fair Value of Derivative LiabilityInputs Usedat March 31, Entire RMBS RMBS RMBS
(dollars in millions) 2010 Change Portfolio PRIME ALT-A Subprime CMBS CDOs Other
Bond prices 42 points Increase of 5 points $ (299) $ (11) $ (25) $ (134) $ (82) $ (32) $ (15)Decrease of 5 points 258 12 24 103 83 13 23
Weighted Increase of 1 year 49 1 6 38 - 1 3average life 5.98 years Decrease of 1 year (90) (3) (3) (86) 4 (1) (1)
Recovery rates 23% Increase of 10% (38) (1) (1) (10) (23) (1) (2)Decrease of 10% 41 - 1 16 23 - 1
Diversity score(a) 13 Increase of 5 (9)Decrease of 5 31
Discount curve(b) N/A Increase of 100bps 13(a) The diversity score is an input at the CDO level. A calculation of sensitivity to this input by type of security is not possible.
(b) The discount curve is an input at the CDO level. A calculation of sensitivity to this input by type of security is not possible. Furthermore, forthis input it is not possible to disclose a weighted average input as a discount curve consists of a series of data points.
These results are calculated by stressing a particular assumption independently of changes in any otherassumption. No assurance can be given that the actual levels of the key inputs will not exceed, perhapssignificantly, the ranges assumed by AIG for purposes of the above analysis. No assumption should be made thatresults calculated from the use of other changes in these key inputs can be interpolated or extrapolated from theresults set forth above.
Corporate Debt
The following table represents the relevant market credit inputs used to estimate the sensitivity for the creditdefault swap portfolio written on investment-grade corporate debt and the estimated increase (decrease) to fairvalue of derivative liability at March 31, 2010 corresponding to changes in these market credit inputs:
Input Used at March 31, 2010 Increase (Decrease) To(in millions) Fair Value of Derivative Liability
Credit spreads for all namesEffect of an increase by 10 basis points $ 23Effect of a decrease by 10 basis points $ (23)
All base correlationsEffect of an increase by 1% $ 6Effect of a decrease by 1% $ (6)
Assumed recovery rateEffect of an increase by 1% $ (5)Effect of a decrease by 1% $ 5
These results are calculated by stressing a particular assumption independently of changes in any otherassumption. No assurance can be given that the actual levels of the indices and maturity will not exceed, perhapssignificantly, the ranges assumed by AIGFP for purposes of the above analysis. No assumption should be madethat results calculated from the use of other changes in these indices and maturity can be interpolated orextrapolated from the results set forth above.
Other derivatives. Valuation models that incorporate unobservable inputs initially are calibrated to thetransaction price. Subsequent valuations are based on observable inputs to the valuation model (e.g., interest rates,credit spreads, volatilities, etc.). Model inputs are changed only when corroborated by observable market data.
159

American International Group, Inc., and Subsidiaries
Investments
Investments by Segment
The following tables summarize the composition of AIG’s investments by segment:
Domestic Life Foreign LifeInsurance & Insurance &
General Retirement Retirement Financial(in millions) Insurance Services Services Services Other Total
At March 31, 2010Fixed maturity securities:
Bonds available for sale, at fair value $ 86,560 $ 122,669 $ 35,553 $ 2,025 $ 10,063 $256,870Bond trading securities, at fair value - 960 208 19,927 5,270 26,365
Equity securities:Common and preferred stock available for
sale, at fair value 4,466 293 1,383 22 667 6,831Common and preferred stock trading, at
fair value 50 1 238 317 7 613Mortgage and other loans receivable, net of
allowance 623 17,222 1,587 467 2,634 22,533Finance receivables, net of allowance - - - 18,912 - 18,912Flight equipment primarily under operating
leases, net of accumulated depreciation - - - 43,258 - 43,258Other invested assets 12,184 13,131 1,754 182 5,999 33,250Securities purchased under agreements to
resell, at fair value - - - 1,615 - 1,615Short-term investments 13,094 14,808 838 7,056 3,004 38,800
Total investments(a) 116,977 169,084 41,561 93,781 27,644 449,047Cash 694 299 168 460 512 2,133
Total cash and investments(b) $ 117,671 $ 169,383 $ 41,729 $ 94,241 $ 28,156 $451,180
Domestic Life Foreign LifeInsurance & Insurance &
General Retirement Retirement Financial(in millions) Insurance Services Services Services Other Total
At December 31, 2009Fixed maturity securities:
Bonds available for sale, at fair value $ 79,507 $ 116,629 $ 158,279 $ 2,057 $ 9,079 $365,551Bond trading securities, at fair value - 846 6,227 19,651 4,519 31,243
Equity securities:Common and preferred stock available for
sale, at fair value 2,770 320 5,781 22 629 9,522Common and preferred stock trading, at
fair value 48 1 7,881 388 - 8,318Mortgage and other loans receivable, net of
allowance 9 17,728 6,810 428 2,486 27,461Finance receivables, net of allowance - - - 20,327 - 20,327Flight equipment primarily under operating
leases, net of accumulated depreciation - - - 44,091 - 44,091Other invested assets 11,668 13,141 13,749 213 6,464 45,235Securities purchased under agreements to
resell, at fair value - - - 2,154 - 2,154Short-term investments 12,094 17,456 10,840 3,767 3,106 47,263Total investments(a) 106,096 166,121 209,567 93,098 26,283 601,165Cash 780 63 1,151 1,847 559 4,400Total cash and investments $ 106,876 $ 166,184 $ 210,718 $ 94,945 $ 26,842 $605,565
(a) At March 31, 2010, approximately 82 percent and 18 percent of investments were held by domestic and foreign entities, respectively, comparedto approximately 60 percent and 40 percent, respectively, at December 31, 2009.
(b) Total cash and investments of businesses held for sale amounted to $216.2 billion at March 31, 2010. See Note 3 to the Consolidated FinancialStatements.
160
American International Group, Inc., and Subsidiaries
Investment Strategy
AIG’s investment strategies are tailored to the specific business needs of each operating unit. The investmentobjectives are driven by the business model for each of the businesses: General Insurance, life insurance,retirement services and the Matched Investment Program. The primary objectives are generation of investmentincome, preservation of capital, liquidity management and growth of surplus to support the insurance products.
At the local operating unit level, investment strategies are based on considerations that include the local market,liability duration and cash flow characteristics, rating agency and regulatory capital considerations, legal investmentlimitations, tax optimization and diversification.
The majority of assets backing insurance liabilities at AIG consist of intermediate and long duration fixedmaturity securities. In the case of life insurance & retirement services companies, as well as in the MIP portfolio,the fundamental investment strategy is, as nearly as is practicable, to match the duration characteristics of theliabilities with comparable duration assets. Fixed maturity securities held by the insurance companies included inthe Commercial Insurance Group historically have consisted primarily of laddered holdings of tax-exemptmunicipal bonds, which provided attractive after-tax returns and limited credit risk. In order to meet theCommercial Insurance Group’s current risk/return and tax objectives, the domestic property and casualtycompanies have begun to shift investment allocations away from tax exempt municipal bonds towards taxableinstruments which meet the companies’ liquidity, duration and quality objectives as well as current risk-return andtax objectives. Fixed maturity securities held by Foreign General Insurance companies consist primarily ofintermediate duration high grade securities.
The market price of fixed maturity securities reflects numerous components, including interest rate environment,credit spread, embedded optionality (such as call features), liquidity, structural complexity, foreign exchange risk,and other credit and non-credit factors. However, in most circumstances, pricing is most sensitive to interest rates,such that the market price declines as interest rates rise, and increases as interest rates fall. This effect is morepronounced for longer duration securities.
AIG accounts for the vast majority of the invested assets held by its insurance companies at fair value.However, with limited exceptions (primarily with respect to separate account products on AIG’s ConsolidatedBalance Sheet), AIG does not mark-to-market its insurance liabilities for changes in interest rates, even thoughrising interest rates have the effect of reducing the fair value of such liabilities, and falling interest rates have theopposite effect. This results in the recording of changes in unrealized gains (losses) on securities in Accumulatedother comprehensive income resulting from changes in interest rates without any correlative, inverse changes ingains (losses) on AIG’s liabilities. Because AIG’s asset duration in certain low-yield currencies, particularly Japanand Taiwan, is shorter than its liability duration, AIG views increasing interest rates in these countries aseconomically advantageous, notwithstanding the effect that higher rates have on the market value of its fixedmaturity portfolio.
At March 31, 2010, approximately 78 percent of the fixed maturity securities were in domestic entities.Approximately 29 percent of such securities were rated AAA by one or more of the principal rating agencies.Approximately 11 percent were below investment grade or not rated. AIG’s investment decision process reliesprimarily on internally generated fundamental analysis and internal risk ratings. Third-party rating services’ ratingsand opinions provide one source of independent perspectives for consideration in the internal analysis.
A significant portion of the foreign fixed maturity portfolio is rated by Moody’s, S&P or similar foreign ratingservices. Rating services are not available in all overseas locations. AIG’s Credit Risk Committee closely reviewsthe credit quality of the foreign portfolio’s non-rated fixed maturity securities. At March 31, 2010, approximately17 percent of the foreign fixed income investments were either rated AAA or, on the basis of AIG’s internalanalysis, were equivalent from a credit standpoint to securities so rated. Approximately 2 percent were belowinvestment grade or not rated at that date. Approximately one third of the foreign fixed maturity portfolio issovereign fixed maturity securities supporting policy liabilities in the country of issuance.
161
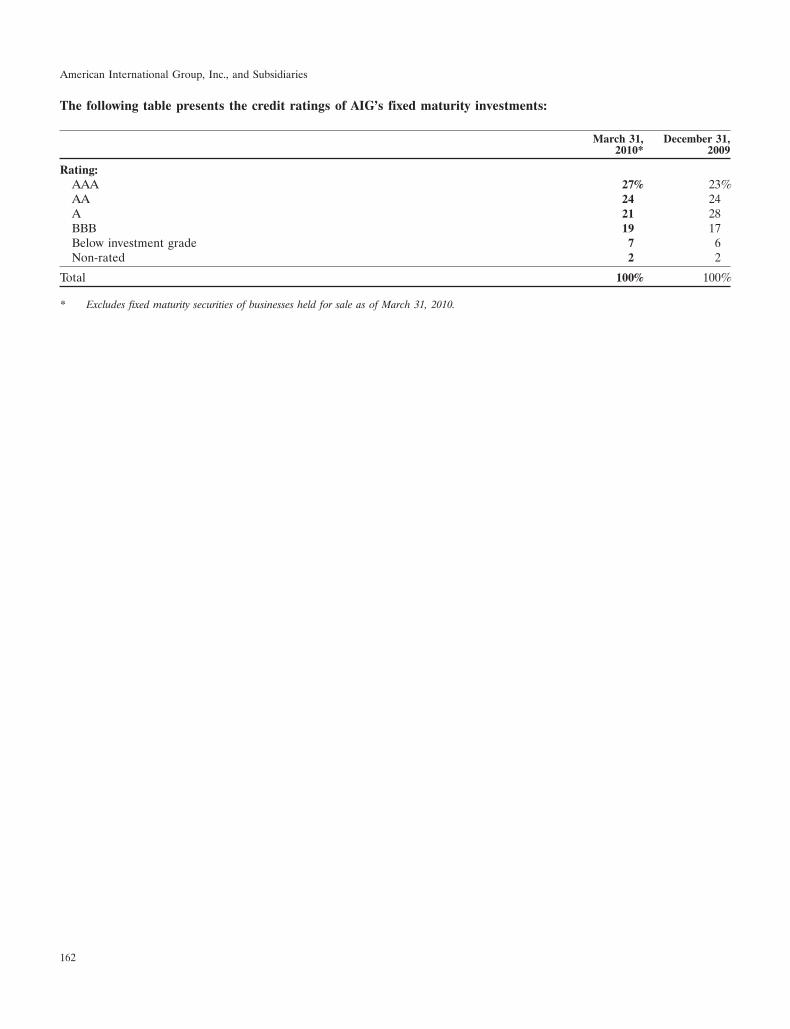
American International Group, Inc., and Subsidiaries
The following table presents the credit ratings of AIG’s fixed maturity investments:
March 31, December 31,2010* 2009
Rating:AAA 27% 23%AA 24 24A 21 28BBB 19 17Below investment grade 7 6Non-rated 2 2
Total 100% 100%
* Excludes fixed maturity securities of businesses held for sale as of March 31, 2010.
162
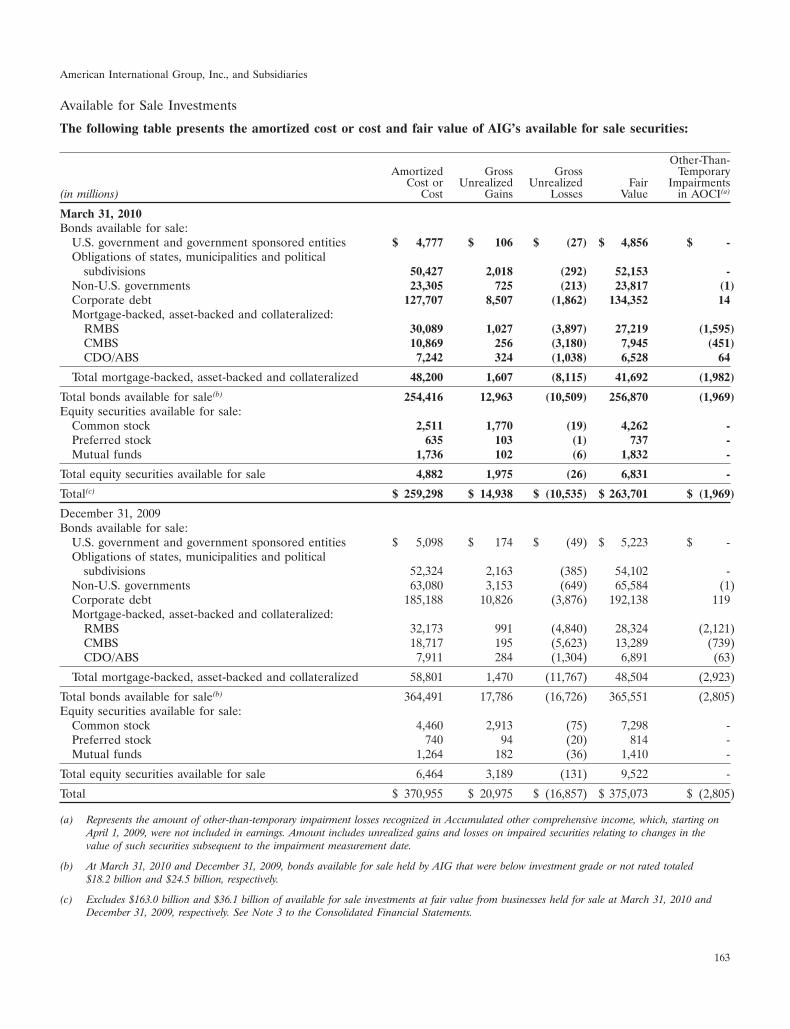
American International Group, Inc., and Subsidiaries
Available for Sale Investments
The following table presents the amortized cost or cost and fair value of AIG’s available for sale securities:
Other-Than-Amortized Gross Gross Temporary
Cost or Unrealized Unrealized Fair Impairments(in millions) Cost Gains Losses Value in AOCI(a)
March 31, 2010Bonds available for sale:
U.S. government and government sponsored entities $ 4,777 $ 106 $ (27) $ 4,856 $ -Obligations of states, municipalities and political
subdivisions 50,427 2,018 (292) 52,153 -Non-U.S. governments 23,305 725 (213) 23,817 (1)Corporate debt 127,707 8,507 (1,862) 134,352 14Mortgage-backed, asset-backed and collateralized:
RMBS 30,089 1,027 (3,897) 27,219 (1,595)CMBS 10,869 256 (3,180) 7,945 (451)CDO/ABS 7,242 324 (1,038) 6,528 64
Total mortgage-backed, asset-backed and collateralized 48,200 1,607 (8,115) 41,692 (1,982)
Total bonds available for sale(b) 254,416 12,963 (10,509) 256,870 (1,969)Equity securities available for sale:
Common stock 2,511 1,770 (19) 4,262 -Preferred stock 635 103 (1) 737 -Mutual funds 1,736 102 (6) 1,832 -
Total equity securities available for sale 4,882 1,975 (26) 6,831 -
Total(c) $ 259,298 $ 14,938 $ (10,535) $ 263,701 $ (1,969)
December 31, 2009Bonds available for sale:
U.S. government and government sponsored entities $ 5,098 $ 174 $ (49) $ 5,223 $ -Obligations of states, municipalities and political
subdivisions 52,324 2,163 (385) 54,102 -Non-U.S. governments 63,080 3,153 (649) 65,584 (1)Corporate debt 185,188 10,826 (3,876) 192,138 119Mortgage-backed, asset-backed and collateralized:
RMBS 32,173 991 (4,840) 28,324 (2,121)CMBS 18,717 195 (5,623) 13,289 (739)CDO/ABS 7,911 284 (1,304) 6,891 (63)
Total mortgage-backed, asset-backed and collateralized 58,801 1,470 (11,767) 48,504 (2,923)
Total bonds available for sale(b) 364,491 17,786 (16,726) 365,551 (2,805)Equity securities available for sale:
Common stock 4,460 2,913 (75) 7,298 -Preferred stock 740 94 (20) 814 -Mutual funds 1,264 182 (36) 1,410 -
Total equity securities available for sale 6,464 3,189 (131) 9,522 -
Total $ 370,955 $ 20,975 $ (16,857) $ 375,073 $ (2,805)
(a) Represents the amount of other-than-temporary impairment losses recognized in Accumulated other comprehensive income, which, starting onApril 1, 2009, were not included in earnings. Amount includes unrealized gains and losses on impaired securities relating to changes in thevalue of such securities subsequent to the impairment measurement date.
(b) At March 31, 2010 and December 31, 2009, bonds available for sale held by AIG that were below investment grade or not rated totaled$18.2 billion and $24.5 billion, respectively.
(c) Excludes $163.0 billion and $36.1 billion of available for sale investments at fair value from businesses held for sale at March 31, 2010 andDecember 31, 2009, respectively. See Note 3 to the Consolidated Financial Statements.
163
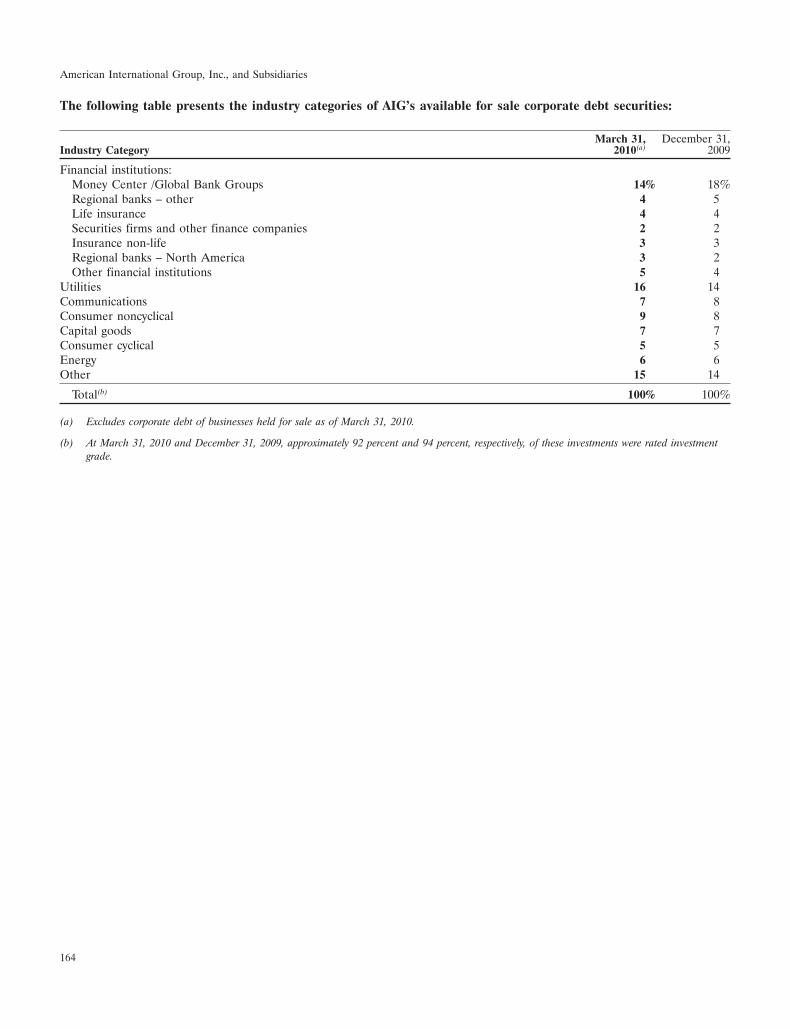
American International Group, Inc., and Subsidiaries
The following table presents the industry categories of AIG’s available for sale corporate debt securities:
March 31, December 31,Industry Category 2010(a) 2009
Financial institutions:Money Center /Global Bank Groups 14% 18%Regional banks – other 4 5Life insurance 4 4Securities firms and other finance companies 2 2Insurance non-life 3 3Regional banks – North America 3 2Other financial institutions 5 4
Utilities 16 14Communications 7 8Consumer noncyclical 9 8Capital goods 7 7Consumer cyclical 5 5Energy 6 6Other 15 14
Total(b) 100% 100%
(a) Excludes corporate debt of businesses held for sale as of March 31, 2010.
(b) At March 31, 2010 and December 31, 2009, approximately 92 percent and 94 percent, respectively, of these investments were rated investmentgrade.
164
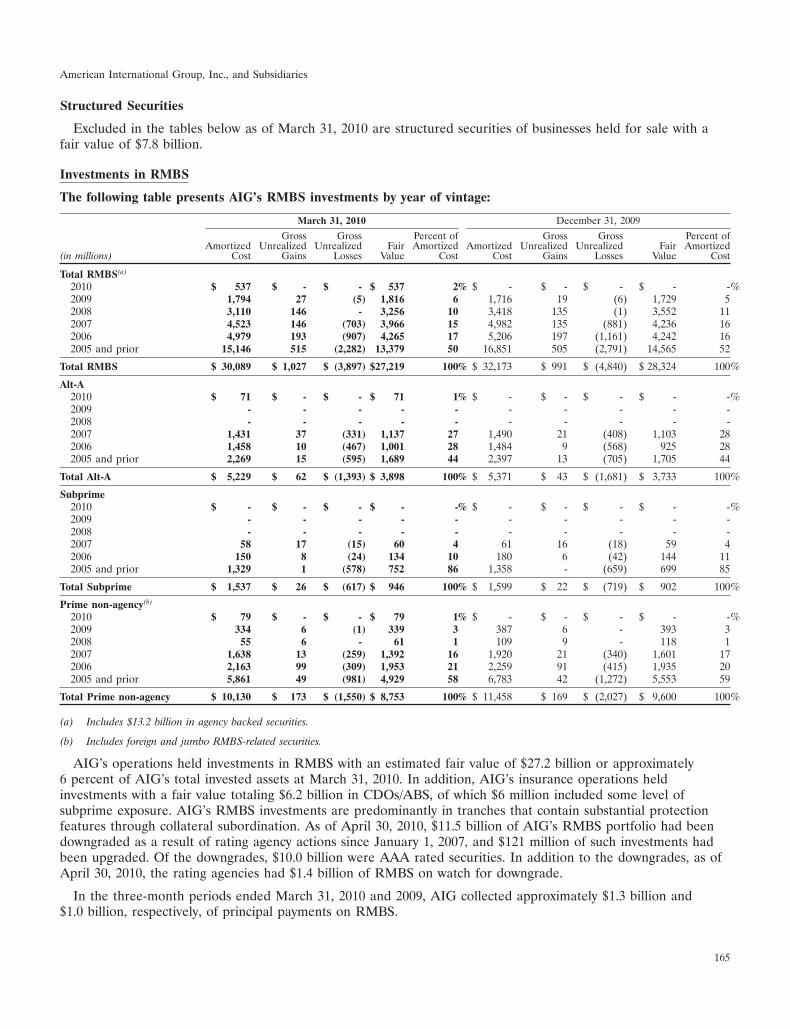
American International Group, Inc., and Subsidiaries
Structured Securities
Excluded in the tables below as of March 31, 2010 are structured securities of businesses held for sale with afair value of $7.8 billion.
Investments in RMBS
The following table presents AIG’s RMBS investments by year of vintage:
March 31, 2010 December 31, 2009
Gross Gross Percent of Gross Gross Percent ofAmortized Unrealized Unrealized Fair Amortized Amortized Unrealized Unrealized Fair Amortized
(in millions) Cost Gains Losses Value Cost Cost Gains Losses Value Cost
Total RMBS(a)
2010 $ 537 $ - $ - $ 537 2% $ - $ - $ - $ - -%2009 1,794 27 (5) 1,816 6 1,716 19 (6) 1,729 52008 3,110 146 - 3,256 10 3,418 135 (1) 3,552 112007 4,523 146 (703) 3,966 15 4,982 135 (881) 4,236 162006 4,979 193 (907) 4,265 17 5,206 197 (1,161) 4,242 162005 and prior 15,146 515 (2,282) 13,379 50 16,851 505 (2,791) 14,565 52
Total RMBS $ 30,089 $ 1,027 $ (3,897) $27,219 100% $ 32,173 $ 991 $ (4,840) $ 28,324 100%
Alt-A2010 $ 71 $ - $ - $ 71 1% $ - $ - $ - $ - -%2009 - - - - - - - - - -2008 - - - - - - - - - -2007 1,431 37 (331) 1,137 27 1,490 21 (408) 1,103 282006 1,458 10 (467) 1,001 28 1,484 9 (568) 925 282005 and prior 2,269 15 (595) 1,689 44 2,397 13 (705) 1,705 44
Total Alt-A $ 5,229 $ 62 $ (1,393) $ 3,898 100% $ 5,371 $ 43 $ (1,681) $ 3,733 100%
Subprime2010 $ - $ - $ - $ - -% $ - $ - $ - $ - -%2009 - - - - - - - - - -2008 - - - - - - - - - -2007 58 17 (15) 60 4 61 16 (18) 59 42006 150 8 (24) 134 10 180 6 (42) 144 112005 and prior 1,329 1 (578) 752 86 1,358 - (659) 699 85
Total Subprime $ 1,537 $ 26 $ (617) $ 946 100% $ 1,599 $ 22 $ (719) $ 902 100%
Prime non-agency(b)
2010 $ 79 $ - $ - $ 79 1% $ - $ - $ - $ - -%2009 334 6 (1) 339 3 387 6 - 393 32008 55 6 - 61 1 109 9 - 118 12007 1,638 13 (259) 1,392 16 1,920 21 (340) 1,601 172006 2,163 99 (309) 1,953 21 2,259 91 (415) 1,935 202005 and prior 5,861 49 (981) 4,929 58 6,783 42 (1,272) 5,553 59
Total Prime non-agency $ 10,130 $ 173 $ (1,550) $ 8,753 100% $ 11,458 $ 169 $ (2,027) $ 9,600 100%
(a) Includes $13.2 billion in agency backed securities.
(b) Includes foreign and jumbo RMBS-related securities.
AIG’s operations held investments in RMBS with an estimated fair value of $27.2 billion or approximately6 percent of AIG’s total invested assets at March 31, 2010. In addition, AIG’s insurance operations heldinvestments with a fair value totaling $6.2 billion in CDOs/ABS, of which $6 million included some level ofsubprime exposure. AIG’s RMBS investments are predominantly in tranches that contain substantial protectionfeatures through collateral subordination. As of April 30, 2010, $11.5 billion of AIG’s RMBS portfolio had beendowngraded as a result of rating agency actions since January 1, 2007, and $121 million of such investments hadbeen upgraded. Of the downgrades, $10.0 billion were AAA rated securities. In addition to the downgrades, as ofApril 30, 2010, the rating agencies had $1.4 billion of RMBS on watch for downgrade.
In the three-month periods ended March 31, 2010 and 2009, AIG collected approximately $1.3 billion and$1.0 billion, respectively, of principal payments on RMBS.
165
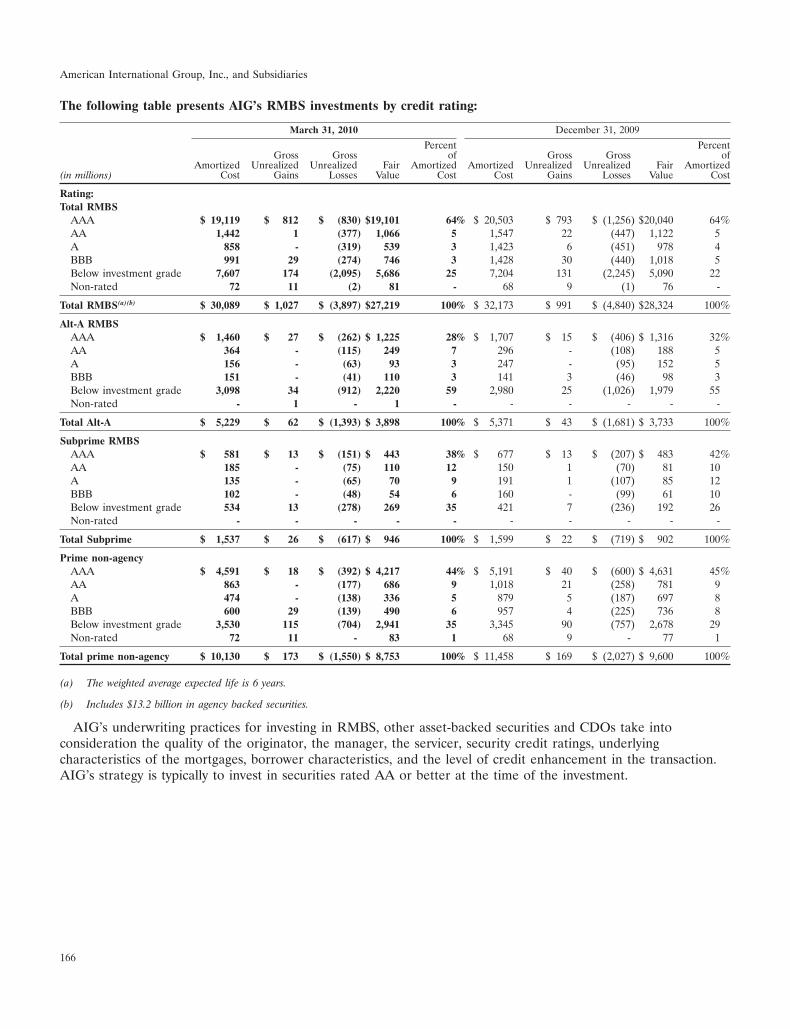
American International Group, Inc., and Subsidiaries
The following table presents AIG’s RMBS investments by credit rating:
March 31, 2010 December 31, 2009
Percent PercentGross Gross of Gross Gross of
Amortized Unrealized Unrealized Fair Amortized Amortized Unrealized Unrealized Fair Amortized(in millions) Cost Gains Losses Value Cost Cost Gains Losses Value Cost
Rating:Total RMBS
AAA $ 19,119 $ 812 $ (830) $19,101 64% $ 20,503 $ 793 $ (1,256) $20,040 64%AA 1,442 1 (377) 1,066 5 1,547 22 (447) 1,122 5A 858 - (319) 539 3 1,423 6 (451) 978 4BBB 991 29 (274) 746 3 1,428 30 (440) 1,018 5Below investment grade 7,607 174 (2,095) 5,686 25 7,204 131 (2,245) 5,090 22Non-rated 72 11 (2) 81 - 68 9 (1) 76 -
Total RMBS(a)(b) $ 30,089 $ 1,027 $ (3,897) $27,219 100% $ 32,173 $ 991 $ (4,840) $28,324 100%
Alt-A RMBSAAA $ 1,460 $ 27 $ (262) $ 1,225 28% $ 1,707 $ 15 $ (406) $ 1,316 32%AA 364 - (115) 249 7 296 - (108) 188 5A 156 - (63) 93 3 247 - (95) 152 5BBB 151 - (41) 110 3 141 3 (46) 98 3Below investment grade 3,098 34 (912) 2,220 59 2,980 25 (1,026) 1,979 55Non-rated - 1 - 1 - - - - - -
Total Alt-A $ 5,229 $ 62 $ (1,393) $ 3,898 100% $ 5,371 $ 43 $ (1,681) $ 3,733 100%
Subprime RMBSAAA $ 581 $ 13 $ (151) $ 443 38% $ 677 $ 13 $ (207) $ 483 42%AA 185 - (75) 110 12 150 1 (70) 81 10A 135 - (65) 70 9 191 1 (107) 85 12BBB 102 - (48) 54 6 160 - (99) 61 10Below investment grade 534 13 (278) 269 35 421 7 (236) 192 26Non-rated - - - - - - - - - -
Total Subprime $ 1,537 $ 26 $ (617) $ 946 100% $ 1,599 $ 22 $ (719) $ 902 100%
Prime non-agencyAAA $ 4,591 $ 18 $ (392) $ 4,217 44% $ 5,191 $ 40 $ (600) $ 4,631 45%AA 863 - (177) 686 9 1,018 21 (258) 781 9A 474 - (138) 336 5 879 5 (187) 697 8BBB 600 29 (139) 490 6 957 4 (225) 736 8Below investment grade 3,530 115 (704) 2,941 35 3,345 90 (757) 2,678 29Non-rated 72 11 - 83 1 68 9 - 77 1
Total prime non-agency $ 10,130 $ 173 $ (1,550) $ 8,753 100% $ 11,458 $ 169 $ (2,027) $ 9,600 100%
(a) The weighted average expected life is 6 years.
(b) Includes $13.2 billion in agency backed securities.
AIG’s underwriting practices for investing in RMBS, other asset-backed securities and CDOs take intoconsideration the quality of the originator, the manager, the servicer, security credit ratings, underlyingcharacteristics of the mortgages, borrower characteristics, and the level of credit enhancement in the transaction.AIG’s strategy is typically to invest in securities rated AA or better at the time of the investment.
166
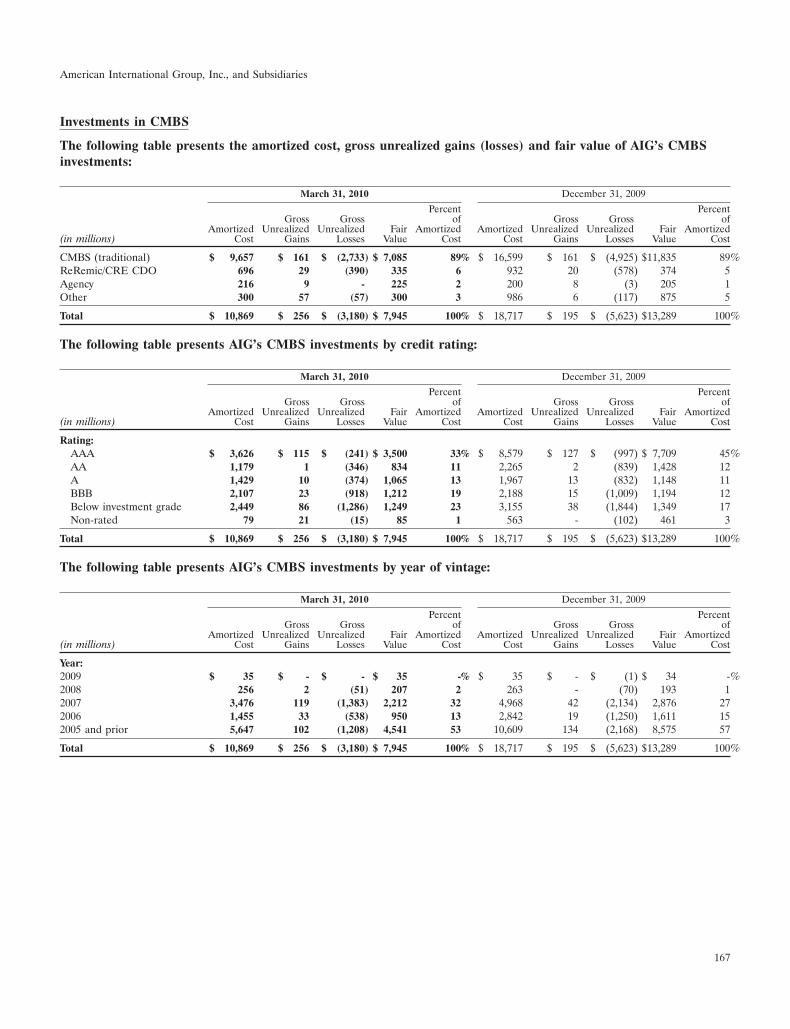
American International Group, Inc., and Subsidiaries
Investments in CMBS
The following table presents the amortized cost, gross unrealized gains (losses) and fair value of AIG’s CMBSinvestments:
March 31, 2010 December 31, 2009
Percent PercentGross Gross of Gross Gross of
Amortized Unrealized Unrealized Fair Amortized Amortized Unrealized Unrealized Fair Amortized(in millions) Cost Gains Losses Value Cost Cost Gains Losses Value Cost
CMBS (traditional) $ 9,657 $ 161 $ (2,733) $ 7,085 89% $ 16,599 $ 161 $ (4,925) $11,835 89%ReRemic/CRE CDO 696 29 (390) 335 6 932 20 (578) 374 5Agency 216 9 - 225 2 200 8 (3) 205 1Other 300 57 (57) 300 3 986 6 (117) 875 5
Total $ 10,869 $ 256 $ (3,180) $ 7,945 100% $ 18,717 $ 195 $ (5,623) $13,289 100%
The following table presents AIG’s CMBS investments by credit rating:
March 31, 2010 December 31, 2009
Percent PercentGross Gross of Gross Gross of
Amortized Unrealized Unrealized Fair Amortized Amortized Unrealized Unrealized Fair Amortized(in millions) Cost Gains Losses Value Cost Cost Gains Losses Value Cost
Rating:AAA $ 3,626 $ 115 $ (241) $ 3,500 33% $ 8,579 $ 127 $ (997) $ 7,709 45%AA 1,179 1 (346) 834 11 2,265 2 (839) 1,428 12A 1,429 10 (374) 1,065 13 1,967 13 (832) 1,148 11BBB 2,107 23 (918) 1,212 19 2,188 15 (1,009) 1,194 12Below investment grade 2,449 86 (1,286) 1,249 23 3,155 38 (1,844) 1,349 17Non-rated 79 21 (15) 85 1 563 - (102) 461 3
Total $ 10,869 $ 256 $ (3,180) $ 7,945 100% $ 18,717 $ 195 $ (5,623) $13,289 100%
The following table presents AIG’s CMBS investments by year of vintage:
March 31, 2010 December 31, 2009
Percent PercentGross Gross of Gross Gross of
Amortized Unrealized Unrealized Fair Amortized Amortized Unrealized Unrealized Fair Amortized(in millions) Cost Gains Losses Value Cost Cost Gains Losses Value Cost
Year:2009 $ 35 $ - $ - $ 35 -% $ 35 $ - $ (1) $ 34 -%2008 256 2 (51) 207 2 263 - (70) 193 12007 3,476 119 (1,383) 2,212 32 4,968 42 (2,134) 2,876 272006 1,455 33 (538) 950 13 2,842 19 (1,250) 1,611 152005 and prior 5,647 102 (1,208) 4,541 53 10,609 134 (2,168) 8,575 57
Total $ 10,869 $ 256 $ (3,180) $ 7,945 100% $ 18,717 $ 195 $ (5,623) $13,289 100%
167
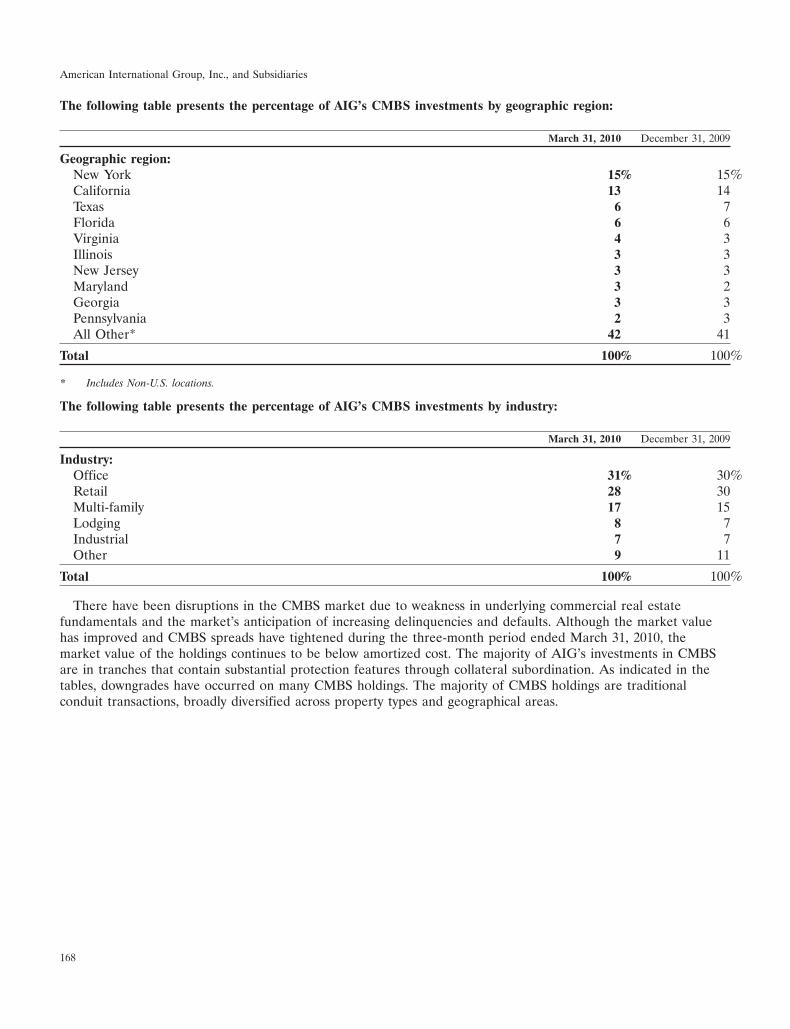
American International Group, Inc., and Subsidiaries
The following table presents the percentage of AIG’s CMBS investments by geographic region:
March 31, 2010 December 31, 2009
Geographic region:New York 15% 15%California 13 14Texas 6 7Florida 6 6Virginia 4 3Illinois 3 3New Jersey 3 3Maryland 3 2Georgia 3 3Pennsylvania 2 3All Other* 42 41
Total 100% 100%
* Includes Non-U.S. locations.
The following table presents the percentage of AIG’s CMBS investments by industry:
March 31, 2010 December 31, 2009
Industry:Office 31% 30%Retail 28 30Multi-family 17 15Lodging 8 7Industrial 7 7Other 9 11
Total 100% 100%
There have been disruptions in the CMBS market due to weakness in underlying commercial real estatefundamentals and the market’s anticipation of increasing delinquencies and defaults. Although the market valuehas improved and CMBS spreads have tightened during the three-month period ended March 31, 2010, themarket value of the holdings continues to be below amortized cost. The majority of AIG’s investments in CMBSare in tranches that contain substantial protection features through collateral subordination. As indicated in thetables, downgrades have occurred on many CMBS holdings. The majority of CMBS holdings are traditionalconduit transactions, broadly diversified across property types and geographical areas.
168
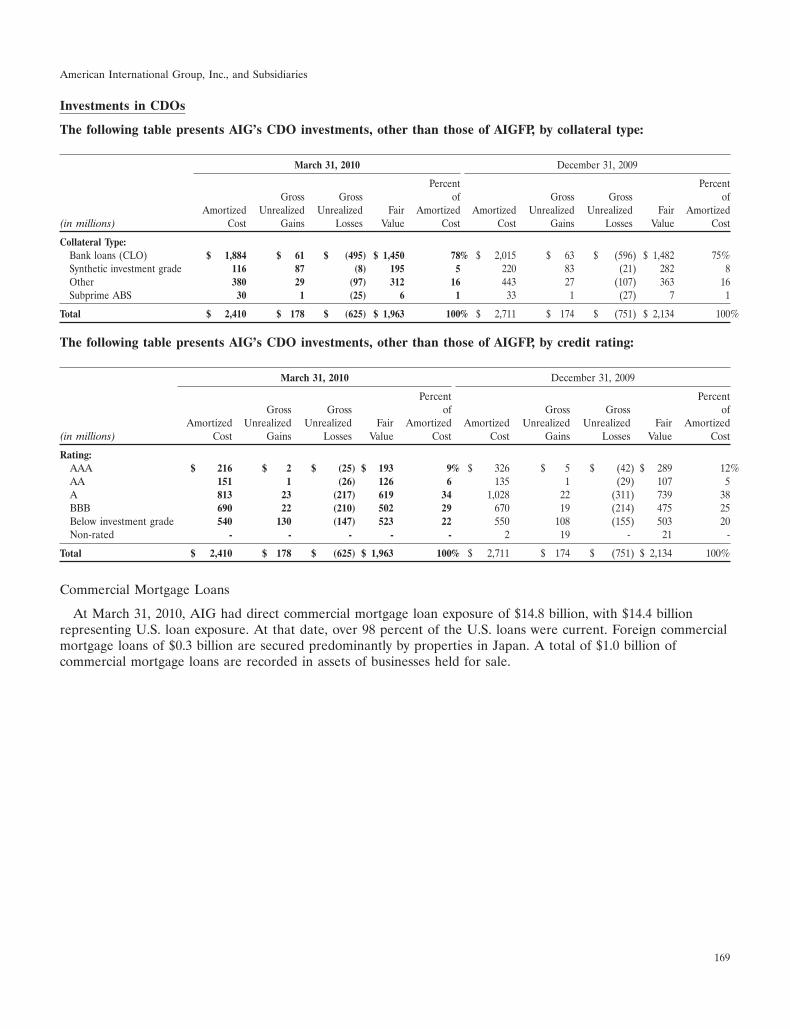
American International Group, Inc., and Subsidiaries
Investments in CDOs
The following table presents AIG’s CDO investments, other than those of AIGFP, by collateral type:
March 31, 2010 December 31, 2009
Percent PercentGross Gross of Gross Gross of
Amortized Unrealized Unrealized Fair Amortized Amortized Unrealized Unrealized Fair Amortized(in millions) Cost Gains Losses Value Cost Cost Gains Losses Value Cost
Collateral Type:Bank loans (CLO) $ 1,884 $ 61 $ (495) $ 1,450 78% $ 2,015 $ 63 $ (596) $ 1,482 75%Synthetic investment grade 116 87 (8) 195 5 220 83 (21) 282 8Other 380 29 (97) 312 16 443 27 (107) 363 16Subprime ABS 30 1 (25) 6 1 33 1 (27) 7 1
Total $ 2,410 $ 178 $ (625) $ 1,963 100% $ 2,711 $ 174 $ (751) $ 2,134 100%
The following table presents AIG’s CDO investments, other than those of AIGFP, by credit rating:
March 31, 2010 December 31, 2009
Percent PercentGross Gross of Gross Gross of
Amortized Unrealized Unrealized Fair Amortized Amortized Unrealized Unrealized Fair Amortized(in millions) Cost Gains Losses Value Cost Cost Gains Losses Value Cost
Rating:AAA $ 216 $ 2 $ (25) $ 193 9% $ 326 $ 5 $ (42) $ 289 12%AA 151 1 (26) 126 6 135 1 (29) 107 5A 813 23 (217) 619 34 1,028 22 (311) 739 38BBB 690 22 (210) 502 29 670 19 (214) 475 25Below investment grade 540 130 (147) 523 22 550 108 (155) 503 20Non-rated - - - - - 2 19 - 21 -
Total $ 2,410 $ 178 $ (625) $ 1,963 100% $ 2,711 $ 174 $ (751) $ 2,134 100%
Commercial Mortgage Loans
At March 31, 2010, AIG had direct commercial mortgage loan exposure of $14.8 billion, with $14.4 billionrepresenting U.S. loan exposure. At that date, over 98 percent of the U.S. loans were current. Foreign commercialmortgage loans of $0.3 billion are secured predominantly by properties in Japan. A total of $1.0 billion ofcommercial mortgage loans are recorded in assets of businesses held for sale.
169
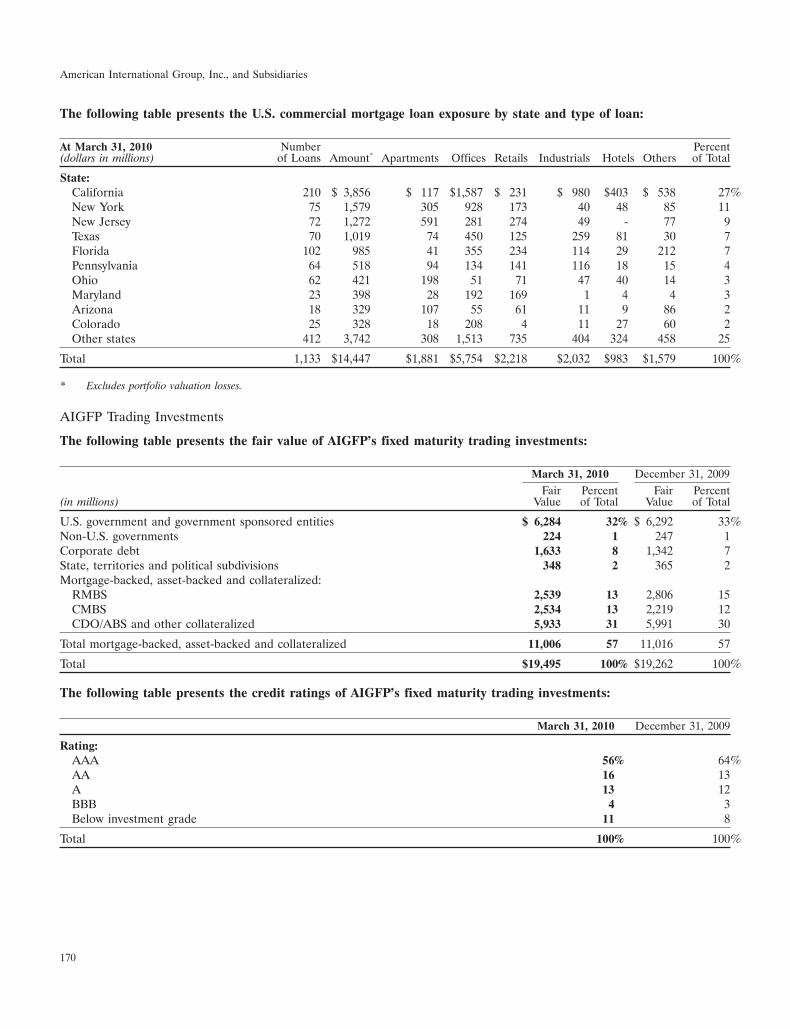
American International Group, Inc., and Subsidiaries
The following table presents the U.S. commercial mortgage loan exposure by state and type of loan:
At March 31, 2010 Number Percent(dollars in millions) of Loans Amount* Apartments Offices Retails Industrials Hotels Others of Total
State:California 210 $ 3,856 $ 117 $1,587 $ 231 $ 980 $403 $ 538 27%New York 75 1,579 305 928 173 40 48 85 11New Jersey 72 1,272 591 281 274 49 - 77 9Texas 70 1,019 74 450 125 259 81 30 7Florida 102 985 41 355 234 114 29 212 7Pennsylvania 64 518 94 134 141 116 18 15 4Ohio 62 421 198 51 71 47 40 14 3Maryland 23 398 28 192 169 1 4 4 3Arizona 18 329 107 55 61 11 9 86 2Colorado 25 328 18 208 4 11 27 60 2Other states 412 3,742 308 1,513 735 404 324 458 25
Total 1,133 $14,447 $1,881 $5,754 $2,218 $2,032 $983 $1,579 100%
* Excludes portfolio valuation losses.
AIGFP Trading Investments
The following table presents the fair value of AIGFP’s fixed maturity trading investments:
March 31, 2010 December 31, 2009Fair Percent Fair Percent
(in millions) Value of Total Value of Total
U.S. government and government sponsored entities $ 6,284 32% $ 6,292 33%Non-U.S. governments 224 1 247 1Corporate debt 1,633 8 1,342 7State, territories and political subdivisions 348 2 365 2Mortgage-backed, asset-backed and collateralized:
RMBS 2,539 13 2,806 15CMBS 2,534 13 2,219 12CDO/ABS and other collateralized 5,933 31 5,991 30
Total mortgage-backed, asset-backed and collateralized 11,006 57 11,016 57
Total $19,495 100% $19,262 100%
The following table presents the credit ratings of AIGFP’s fixed maturity trading investments:
March 31, 2010 December 31, 2009
Rating:AAA 56% 64%AA 16 13A 13 12BBB 4 3Below investment grade 11 8
Total 100% 100%
170
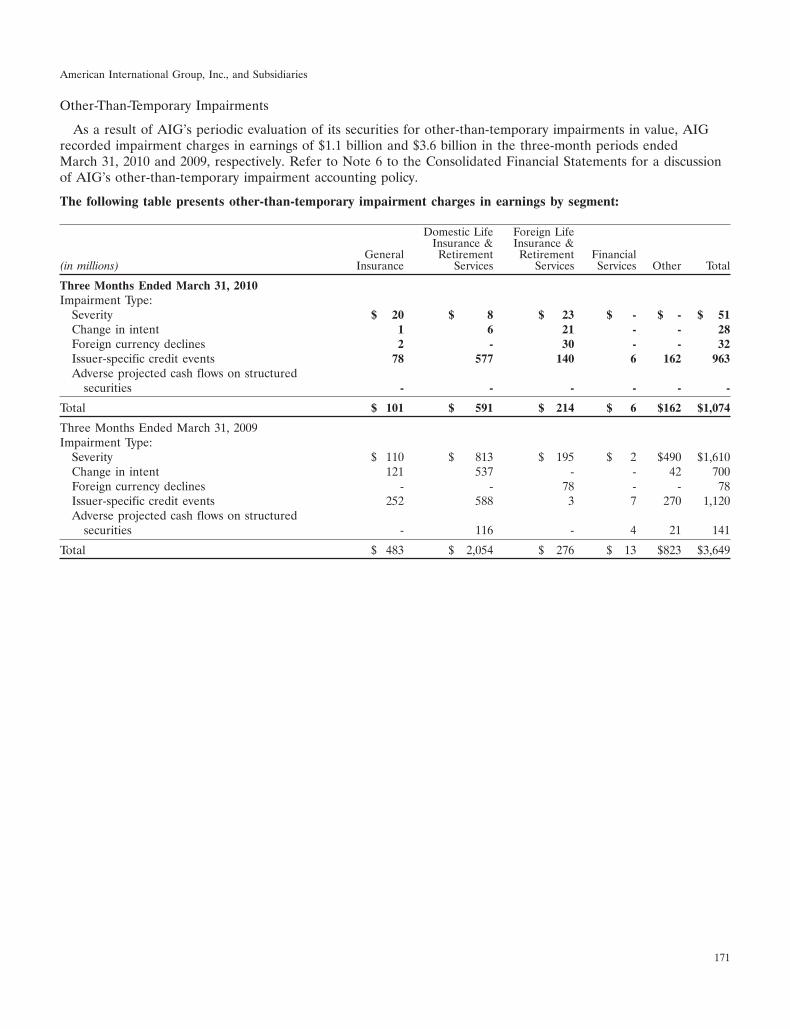
American International Group, Inc., and Subsidiaries
Other-Than-Temporary Impairments
As a result of AIG’s periodic evaluation of its securities for other-than-temporary impairments in value, AIGrecorded impairment charges in earnings of $1.1 billion and $3.6 billion in the three-month periods endedMarch 31, 2010 and 2009, respectively. Refer to Note 6 to the Consolidated Financial Statements for a discussionof AIG’s other-than-temporary impairment accounting policy.
The following table presents other-than-temporary impairment charges in earnings by segment:
Domestic Life Foreign LifeInsurance & Insurance &
General Retirement Retirement Financial(in millions) Insurance Services Services Services Other Total
Three Months Ended March 31, 2010Impairment Type:
Severity $ 20 $ 8 $ 23 $ - $ - $ 51Change in intent 1 6 21 - - 28Foreign currency declines 2 - 30 - - 32Issuer-specific credit events 78 577 140 6 162 963Adverse projected cash flows on structured
securities - - - - - -
Total $ 101 $ 591 $ 214 $ 6 $162 $1,074
Three Months Ended March 31, 2009Impairment Type:
Severity $ 110 $ 813 $ 195 $ 2 $490 $1,610Change in intent 121 537 - - 42 700Foreign currency declines - - 78 - - 78Issuer-specific credit events 252 588 3 7 270 1,120Adverse projected cash flows on structured
securities - 116 - 4 21 141
Total $ 483 $ 2,054 $ 276 $ 13 $823 $3,649
171
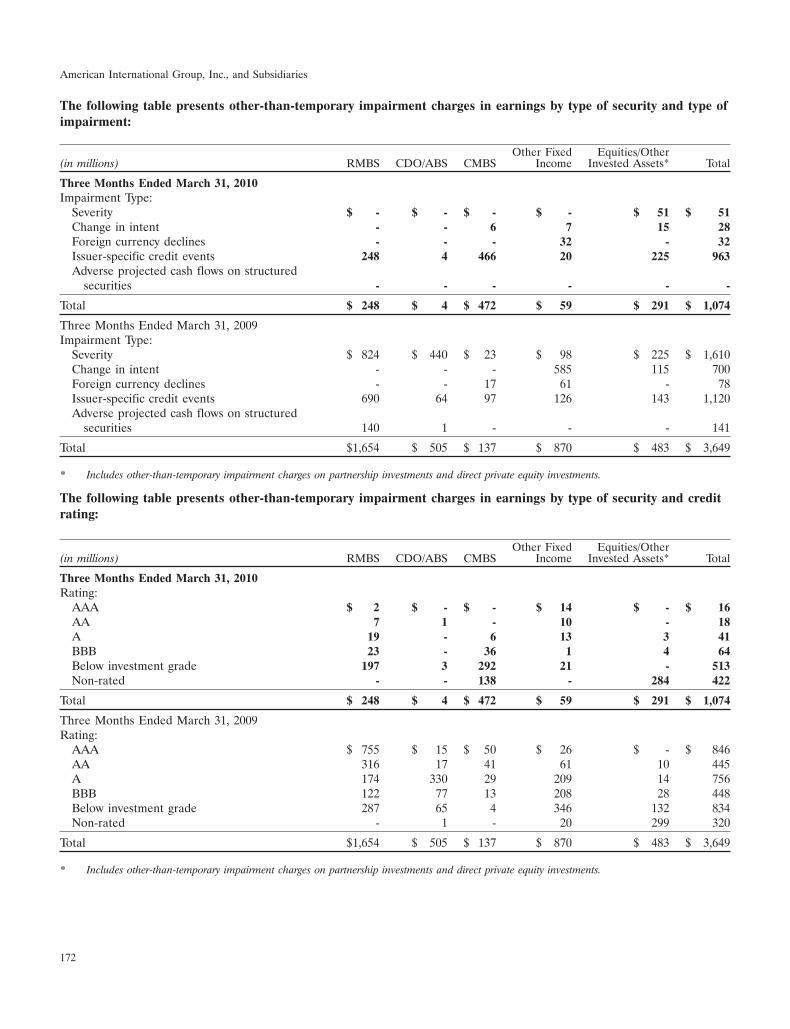
American International Group, Inc., and Subsidiaries
The following table presents other-than-temporary impairment charges in earnings by type of security and type ofimpairment:
Other Fixed Equities/Other(in millions) RMBS CDO/ABS CMBS Income Invested Assets* Total
Three Months Ended March 31, 2010Impairment Type:
Severity $ - $ - $ - $ - $ 51 $ 51Change in intent - - 6 7 15 28Foreign currency declines - - - 32 - 32Issuer-specific credit events 248 4 466 20 225 963Adverse projected cash flows on structured
securities - - - - - -
Total $ 248 $ 4 $ 472 $ 59 $ 291 $ 1,074
Three Months Ended March 31, 2009Impairment Type:
Severity $ 824 $ 440 $ 23 $ 98 $ 225 $ 1,610Change in intent - - - 585 115 700Foreign currency declines - - 17 61 - 78Issuer-specific credit events 690 64 97 126 143 1,120Adverse projected cash flows on structured
securities 140 1 - - - 141
Total $1,654 $ 505 $ 137 $ 870 $ 483 $ 3,649
* Includes other-than-temporary impairment charges on partnership investments and direct private equity investments.
The following table presents other-than-temporary impairment charges in earnings by type of security and creditrating:
Other Fixed Equities/Other(in millions) RMBS CDO/ABS CMBS Income Invested Assets* Total
Three Months Ended March 31, 2010Rating:
AAA $ 2 $ - $ - $ 14 $ - $ 16AA 7 1 - 10 - 18A 19 - 6 13 3 41BBB 23 - 36 1 4 64Below investment grade 197 3 292 21 - 513Non-rated - - 138 - 284 422
Total $ 248 $ 4 $ 472 $ 59 $ 291 $ 1,074
Three Months Ended March 31, 2009Rating:
AAA $ 755 $ 15 $ 50 $ 26 $ - $ 846AA 316 17 41 61 10 445A 174 330 29 209 14 756BBB 122 77 13 208 28 448Below investment grade 287 65 4 346 132 834Non-rated - 1 - 20 299 320
Total $1,654 $ 505 $ 137 $ 870 $ 483 $ 3,649
* Includes other-than-temporary impairment charges on partnership investments and direct private equity investments.
172
American International Group, Inc., and Subsidiaries
AIG has recognized the other-than-temporary impairment charges (severity losses) shown above in the three-month periods ended March 31, 2010 and 2009, respectively. With the adoption of the new other-than-temporaryimpairments accounting standard on April 1, 2009, such severity loss charges subsequent to that date exclusivelyrelated to equity securities and other invested assets. In all prior periods, such charges primarily related tomortgage-backed, asset-backed and collateralized securities, corporate debt securities of financial institutions andother equity securities. Notwithstanding AIG’s intent and ability to hold such securities until they had recoveredtheir cost or amortized cost basis, and despite structures that indicated, at the time, that a substantial amount ofthe securities should have continued to perform in accordance with original terms, AIG concluded, at the time,that it could not reasonably assert that the impairment would be temporary.
Determinations of other-than-temporary impairments are based on fundamental credit analyses of individualsecurities without regard to rating agency ratings. Based on this analysis, AIG expects to receive cash flowssufficient to cover the amortized cost of all below investment grade securities for which credit losses were notrecognized.
In addition to the above severity losses, AIG recorded other-than-temporary impairment charges in the three-month periods ended March 31, 2010 and 2009 related to:
• securities for which AIG has changed its intent to hold or sell;
• declines due to foreign exchange rates;
• issuer-specific credit events;
• certain structured securities; and
• other impairments, including equity securities, partnership investments and private equity investments.
With respect to the issuer-specific credit events shown above, no other-than-temporary impairment charge withrespect to any one single credit was significant to AIG’s consolidated financial condition or results of operations,and no individual other-than-temporary impairment charge exceeded 0.10 percent and 0.06 percent of Total equityin the three-month periods ended March 31, 2010 and 2009, respectively.
In periods subsequent to the recognition of an other-than-temporary impairment charge for available for salefixed maturity securities that is not foreign exchange related, AIG generally prospectively accretes into earningsthe difference between the new amortized cost and the expected undiscounted recovery value over the remainingexpected holding period of the security. The amounts of accretion recognized in earnings for the three-monthperiods ended March 31, 2010 and 2009 were $92 million and $445 million, respectively. For a discussion of recentaccounting standards affecting fair values and other-than-temporary impairments, see Notes 1 and 6 to theConsolidated Financial Statements.
173
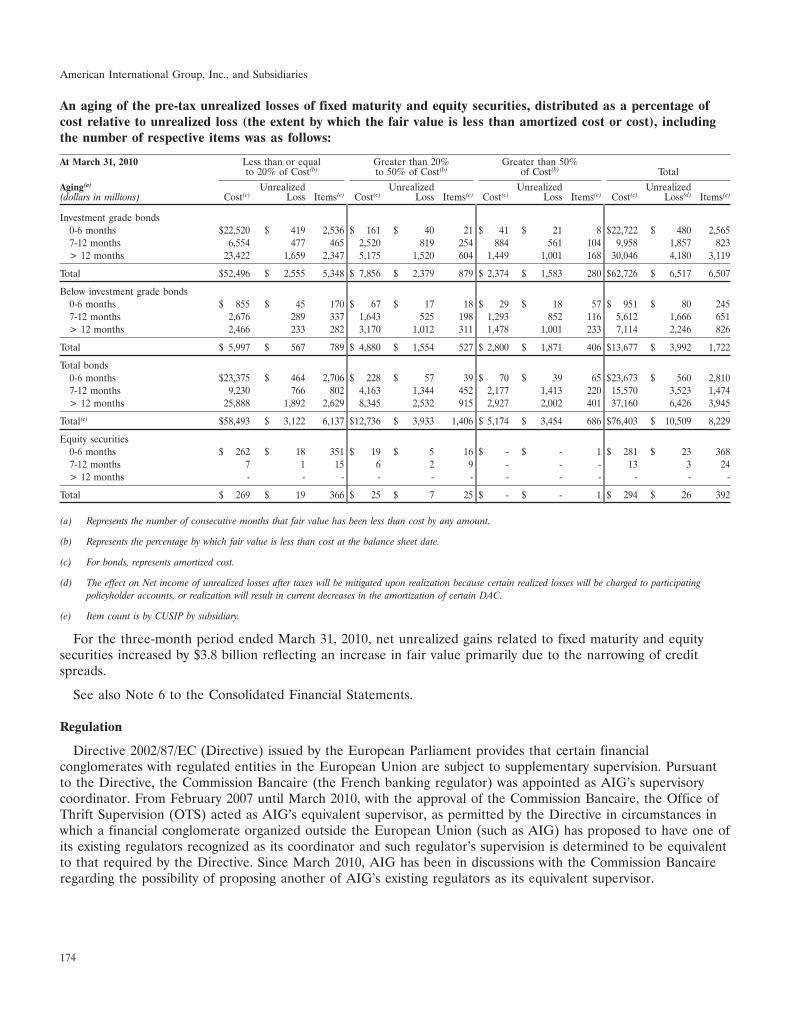
American International Group, Inc., and Subsidiaries
An aging of the pre-tax unrealized losses of fixed maturity and equity securities, distributed as a percentage ofcost relative to unrealized loss (the extent by which the fair value is less than amortized cost or cost), includingthe number of respective items was as follows:
At March 31, 2010 Less than or equal Greater than 20% Greater than 50%to 20% of Cost(b) to 50% of Cost(b) of Cost(b) Total
Aging(a) Unrealized Unrealized Unrealized Unrealized(dollars in millions) Cost(c) Loss Items(e) Cost(c) Loss Items(e) Cost(c) Loss Items(e) Cost(c) Loss(d) Items(e)
Investment grade bonds0-6 months $22,520 $ 419 2,536 $ 161 $ 40 21 $ 41 $ 21 8 $22,722 $ 480 2,5657-12 months 6,554 477 465 2,520 819 254 884 561 104 9,958 1,857 823> 12 months 23,422 1,659 2,347 5,175 1,520 604 1,449 1,001 168 30,046 4,180 3,119
Total $52,496 $ 2,555 5,348 $ 7,856 $ 2,379 879 $ 2,374 $ 1,583 280 $62,726 $ 6,517 6,507
Below investment grade bonds0-6 months $ 855 $ 45 170 $ 67 $ 17 18 $ 29 $ 18 57 $ 951 $ 80 2457-12 months 2,676 289 337 1,643 525 198 1,293 852 116 5,612 1,666 651> 12 months 2,466 233 282 3,170 1,012 311 1,478 1,001 233 7,114 2,246 826
Total $ 5,997 $ 567 789 $ 4,880 $ 1,554 527 $ 2,800 $ 1,871 406 $13,677 $ 3,992 1,722
Total bonds0-6 months $23,375 $ 464 2,706 $ 228 $ 57 39 $ 70 $ 39 65 $23,673 $ 560 2,8107-12 months 9,230 766 802 4,163 1,344 452 2,177 1,413 220 15,570 3,523 1,474> 12 months 25,888 1,892 2,629 8,345 2,532 915 2,927 2,002 401 37,160 6,426 3,945
Total(e) $58,493 $ 3,122 6,137 $12,736 $ 3,933 1,406 $ 5,174 $ 3,454 686 $76,403 $ 10,509 8,229
Equity securities0-6 months $ 262 $ 18 351 $ 19 $ 5 16 $ - $ - 1 $ 281 $ 23 3687-12 months 7 1 15 6 2 9 - - - 13 3 24> 12 months - - - - - - - - - - - -
Total $ 269 $ 19 366 $ 25 $ 7 25 $ - $ - 1 $ 294 $ 26 392
(a) Represents the number of consecutive months that fair value has been less than cost by any amount.
(b) Represents the percentage by which fair value is less than cost at the balance sheet date.
(c) For bonds, represents amortized cost.
(d) The effect on Net income of unrealized losses after taxes will be mitigated upon realization because certain realized losses will be charged to participatingpolicyholder accounts, or realization will result in current decreases in the amortization of certain DAC.
(e) Item count is by CUSIP by subsidiary.
For the three-month period ended March 31, 2010, net unrealized gains related to fixed maturity and equitysecurities increased by $3.8 billion reflecting an increase in fair value primarily due to the narrowing of creditspreads.
See also Note 6 to the Consolidated Financial Statements.
Regulation
Directive 2002/87/EC (Directive) issued by the European Parliament provides that certain financialconglomerates with regulated entities in the European Union are subject to supplementary supervision. Pursuantto the Directive, the Commission Bancaire (the French banking regulator) was appointed as AIG’s supervisorycoordinator. From February 2007 until March 2010, with the approval of the Commission Bancaire, the Office ofThrift Supervision (OTS) acted as AIG’s equivalent supervisor, as permitted by the Directive in circumstances inwhich a financial conglomerate organized outside the European Union (such as AIG) has proposed to have one ofits existing regulators recognized as its coordinator and such regulator’s supervision is determined to be equivalentto that required by the Directive. Since March 2010, AIG has been in discussions with the Commission Bancaireregarding the possibility of proposing another of AIG’s existing regulators as its equivalent supervisor.
174
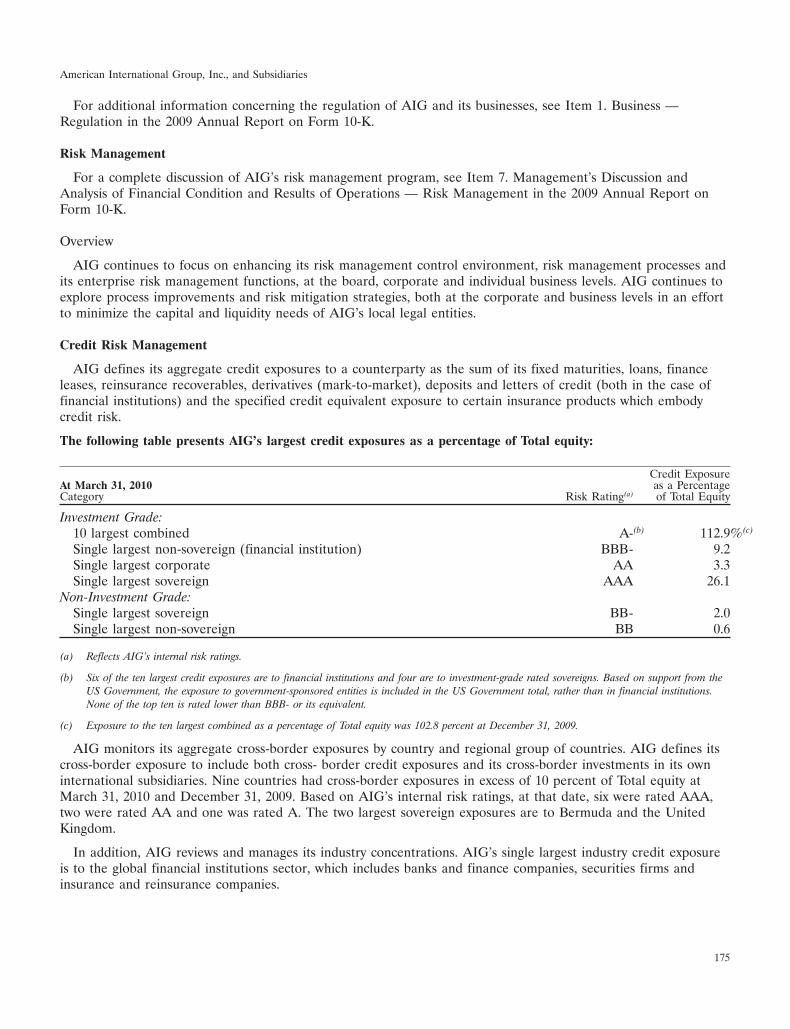
American International Group, Inc., and Subsidiaries
For additional information concerning the regulation of AIG and its businesses, see Item 1. Business —Regulation in the 2009 Annual Report on Form 10-K.
Risk Management
For a complete discussion of AIG’s risk management program, see Item 7. Management’s Discussion andAnalysis of Financial Condition and Results of Operations — Risk Management in the 2009 Annual Report onForm 10-K.
Overview
AIG continues to focus on enhancing its risk management control environment, risk management processes andits enterprise risk management functions, at the board, corporate and individual business levels. AIG continues toexplore process improvements and risk mitigation strategies, both at the corporate and business levels in an effortto minimize the capital and liquidity needs of AIG’s local legal entities.
Credit Risk Management
AIG defines its aggregate credit exposures to a counterparty as the sum of its fixed maturities, loans, financeleases, reinsurance recoverables, derivatives (mark-to-market), deposits and letters of credit (both in the case offinancial institutions) and the specified credit equivalent exposure to certain insurance products which embodycredit risk.
The following table presents AIG’s largest credit exposures as a percentage of Total equity:
Credit ExposureAt March 31, 2010 as a PercentageCategory Risk Rating(a) of Total Equity
Investment Grade:10 largest combined A-(b) 112.9%(c)
Single largest non-sovereign (financial institution) BBB- 9.2Single largest corporate AA 3.3Single largest sovereign AAA 26.1
Non-Investment Grade:Single largest sovereign BB- 2.0Single largest non-sovereign BB 0.6
(a) Reflects AIG’s internal risk ratings.
(b) Six of the ten largest credit exposures are to financial institutions and four are to investment-grade rated sovereigns. Based on support from theUS Government, the exposure to government-sponsored entities is included in the US Government total, rather than in financial institutions.None of the top ten is rated lower than BBB- or its equivalent.
(c) Exposure to the ten largest combined as a percentage of Total equity was 102.8 percent at December 31, 2009.
AIG monitors its aggregate cross-border exposures by country and regional group of countries. AIG defines itscross-border exposure to include both cross- border credit exposures and its cross-border investments in its owninternational subsidiaries. Nine countries had cross-border exposures in excess of 10 percent of Total equity atMarch 31, 2010 and December 31, 2009. Based on AIG’s internal risk ratings, at that date, six were rated AAA,two were rated AA and one was rated A. The two largest sovereign exposures are to Bermuda and the UnitedKingdom.
In addition, AIG reviews and manages its industry concentrations. AIG’s single largest industry credit exposureis to the global financial institutions sector, which includes banks and finance companies, securities firms andinsurance and reinsurance companies.
175
American International Group, Inc., and Subsidiaries
The following table presents AIG’s largest credit exposures to the global financial institution sector as apercentage of Total equity:
Credit Exposureas a Percentage
of TotalAt March 31, 2010 Equity(a)
Industry Category:Money Center / Global Bank Groups 82.6%(b)
European Regional Financial Institutions 14.7Global Life Insurance Companies 13.2Global Reinsurance Companies 12.4Asian Regional Financial Institutions 10.1Supranational Banks 8.0North American Based Regional Financial Institutions 7.7
(a) The table includes amounts related to AIA, ALICO and Nan Shan because their respective sales have not yet closed.
(b) Exposure to Money Center/Global Bank Groups as a percentage of Total equity was 83.9 percent at December 31, 2009.
AIG’s exposure to its five largest money center/global bank group institutions was 34.0 percent of Total equity atMarch 31, 2010 compared to 33.5 percent of Total equity at December 31, 2009.
AIG also has a risk concentration through the investment portfolios of its insurance companies in the U.S.municipal sector. AIG holds approximately $48.8 billion of tax-exempt and taxable securities issued by a widenumber of municipal authorities across the U.S. and its territories. A majority of these securities are held inavailable-for-sale portfolios of AIG’s domestic property-casualty insurance companies. These securities arecomprised of the general obligations of states and local governments, revenue bonds issued by these samegovernments and bonds issued by transportation authorities, universities, state housing finance agencies andhospital systems. The average credit quality of these issuers is A-.
Currently, several states, local governments and other issuers are facing pressures on their budget revenues fromthe effects of the recession and have had to cut spending and draw on reserve funds. Consequently, severalmunicipal issuers in AIG’s portfolios have been downgraded one or more notches by the rating agencies. Themost notable of these issuers is the State of California, of which AIG holds approximately $1.1 billion of generalobligation bonds, $95.7 million of which are defeased, and which at March 31, 2010 was also the largest singleissuer in AIG’s municipal finance portfolio. Nevertheless, despite the budget pressures facing the sector, AIG doesnot expect any significant defaults in portfolio holdings of municipal issuers.
On April 27, 2010 one nationally recognized statistical rating agency lowered its rating of the government ofGreece to sub-investment grade. As of May 4, 2010, AIG holds sovereign bonds issued by the Greek governmentamounting to $1.03 billion, the majority of which is in ALICO and its subsidiaries. AIG also holds sovereign bondsissued by the governments of Italy, Spain, Portugal and Ireland which collectively total approximately $2.0 billion.Although all are still investment grade, both Spain and Portugal were recently downgraded. The majority(approximately $1.2 billion) is held by ALICO and its subsidiaries.
The Credit Risk Committee (CRC) reviews quarterly concentration reports in all categories listed above as wellas credit trends by risk ratings. The CRC may adjust limits to provide reasonable assurance that AIG does notincur excessive levels of credit risk and that AIG’s credit risk profile is properly calibrated across business units.
176

American International Group, Inc., and Subsidiaries
ITEM 3. Quantitative and Qualitative Disclosures About Market Risk
Included in Item 2. Management’s Discussion and Analysis of Financial Condition and Results of Operations.
ITEM 4. Controls and Procedures
In connection with the preparation of this Quarterly Report on Form 10-Q, an evaluation was carried out byAIG’s management, with the participation of AIG’s Chief Executive Officer and Chief Financial Officer, of theeffectiveness of AIG’s disclosure controls and procedures (as defined in Rules 13a-15(e) and 15d-15(e) under theSecurities Exchange Act of 1934 (Exchange Act)). Disclosure controls and procedures are designed to ensure thatinformation required to be disclosed in reports filed or submitted under the Exchange Act is recorded, processed,summarized and reported within the time periods specified in SEC rules and forms and that such information isaccumulated and communicated to management, including the Chief Executive Officer and Chief FinancialOfficer, to allow timely decisions regarding required disclosures. Based on that evaluation, AIG’s Chief ExecutiveOfficer and Chief Financial Officer have concluded that, as of March 31, 2010, AIG’s disclosure controls andprocedures were effective. There has been no change in AIG’s internal control over financial reporting (as definedin Rule 13a-15(f) under the Exchange Act) that occurred during the quarter ended March 31, 2010 that hasmaterially affected, or is reasonably likely to materially affect, AIG’s internal control over financial reporting.
177
American International Group, Inc., and Subsidiaries
Part II — OTHER INFORMATION
ITEM 1. Legal Proceedings
Included in Note 9(a) to the Consolidated Financial Statements.
ITEM 1A. Risk Factors
The following updates the ‘‘Execution of Restructuring Plan’’ risk factor in Item 1A. Risk Factors of the 2009Annual Report on Form 10-K.
Significant conditions precedent must be satisfied in order to complete the AIA and ALICO sales on the agreedterms.
Completion of the AIA sale is subject to the satisfaction (or waiver) of a number of conditions precedent,including:
• the approval of the transaction by 75 percent of Prudential shareholders;
• the approval of the scheme of arrangement between Prudential and existing Prudential shareholders by TheHigh Court of Justice in England and Wales;
• regulatory approvals in various foreign jurisdictions in connection with the acquisition by Prudential of thetransferred businesses; and
• regulatory approvals in certain U.S. states and various foreign jurisdictions in connection with the acquisitionby AIG of the securities consideration.
The ALICO sale also is subject to the satisfaction (or waiver) of similar regulatory approvals in both the UnitedStates and various foreign jurisdictions.
Any relevant regulatory body may refuse its approval or may seek to make its approval subject to compliance byPrudential or MetLife, as the case may be, with unanticipated or onerous conditions, or, even if approval is notrequired, the regulator may impose requirements on Prudential or MetLife or the local operations of thetransferred businesses. Prudential or MetLife, as the case may be, may not agree to those requirements.
Because of the closing conditions applicable to each transaction, completion of either or both of the AIA saleand ALICO sale is not assured or may be delayed or, even if completed, may need to be significantly restructured.
Failure to complete the sales of AIA and ALICO could negatively affect AIG’s businesses and financial results.
If the sale of AIA or ALICO is not completed, the ongoing businesses of AIG may be adversely affected andAIG will be subject to several risks, including the following:
• alternative plans to dispose of AIA or ALICO may be difficult to structure and may take extended periodsof time to implement;
• AIG may not be able to realize equivalent value for AIA or ALICO under an alternative asset dispositionplan;
• AIG will have incurred certain significant costs relating to the sales without receiving the benefits of thesales; and
• negative customer perception could adversely affect the ability of the retained businesses to compete for, orto win, new and renewal business in the marketplace.
ITEM 6. Exhibits
See accompanying Exhibit Index.
178
American International Group, Inc., and Subsidiaries
SIGNATURES
Pursuant to the requirements of the Securities Exchange Act of 1934, the registrant has duly caused this reportto be signed on its behalf by the undersigned thereunto duly authorized.
AMERICAN INTERNATIONAL GROUP, INC.(Registrant)
/s/ DAVID L. HERZOG
David L. HerzogExecutive Vice PresidentChief Financial OfficerPrincipal Financial Officer
/s/ JOSEPH D. COOK
Joseph D.CookVice PresidentControllerPrincipal Accounting Officer
Dated: May 7, 2010
179
American International Group, Inc., and Subsidiaries
Exhibit Index
ExhibitNumber Description Location
2.1 Share Purchase Agreement, dated as of March 1, 2010 Incorporated by reference to Exhibit 2.1 to AIG’sbetween AIA Aurora LLC, American International Current Report on Form 8-K filed with the SEC onGroup, Inc., Prudential Group Limited and March 5, 2010 (File No. 1-8787)Prudential plc
2.2 Stock Purchase Agreement, dated as of March 7, 2010, Incorporated by reference to Exhibit 2.1 to AIG’samong American International Group, Inc., ALICO Current Report on Form 8-K filed with the SEC onHoldings LLC and MetLife, Inc. March 11, 2010 (File No. 1-8787)
10.1 Determination Memorandum, dated March 23, 2010, Incorporated by reference to Exhibit 10.1 to AIG’sfrom the Office of the Special Master for TARP Current Report on Form 8-K filed with the SEC onExecutive Compensation to AIG April 2, 2010 (File No. 1-8787)
10.2 Determination Memorandum, dated April 16, 2010, Filed herewith.from the Office of the Special Master for TARPExecutive Compensation to AIG
10.3 Asset Purchase Agreement, dated as of December 12, Filed herewith.2008, among the Sellers party thereto, AIF SecuritiesLending Corp., AIG, Maiden Lane II LLC and theFederal Reserve Bank of New York
11 Statement re computation of per share earnings Included in Note 9 to the Consolidated FinancialStatements.
12 Computation of ratios of earnings to fixed charges Filed herewith.
31 Rule 13a-14(a)/15d-14(a) Certifications Filed herewith.
32 Section 1350 Certifications Filed herewith.
101 Interactive data files pursuant to Rule 405 of Filed herewith.Regulation S-T: (i) the Consolidated Balance Sheet asof March 31, 2010 and December 31, 2009, (ii) theConsolidated Statement of Income (Loss) for the threemonths ended March 31, 2010 and March 31, 2009,(iii) the Consolidated Statement of Equity for the threemonths ended March 31, 2010, (iv) the ConsolidatedStatement of Cash Flows for the three months endedMarch 31, 2010 and March 31, 2009, (v) theConsolidated Statement of Comprehensive Income(Loss) for the three months ended March 31, 2010 andMarch 31, 2009 and (vi) the Notes to the ConsolidatedFinancial Statements, tagged as blocks of text.*
* As provided in Rule 406T of Regulation S-T, this information is furnished and not filed for purposes of Sections 11 and 12 of the Securities Actof 1933 and Section 18 of the Securities Exchange Act of 1934.
180
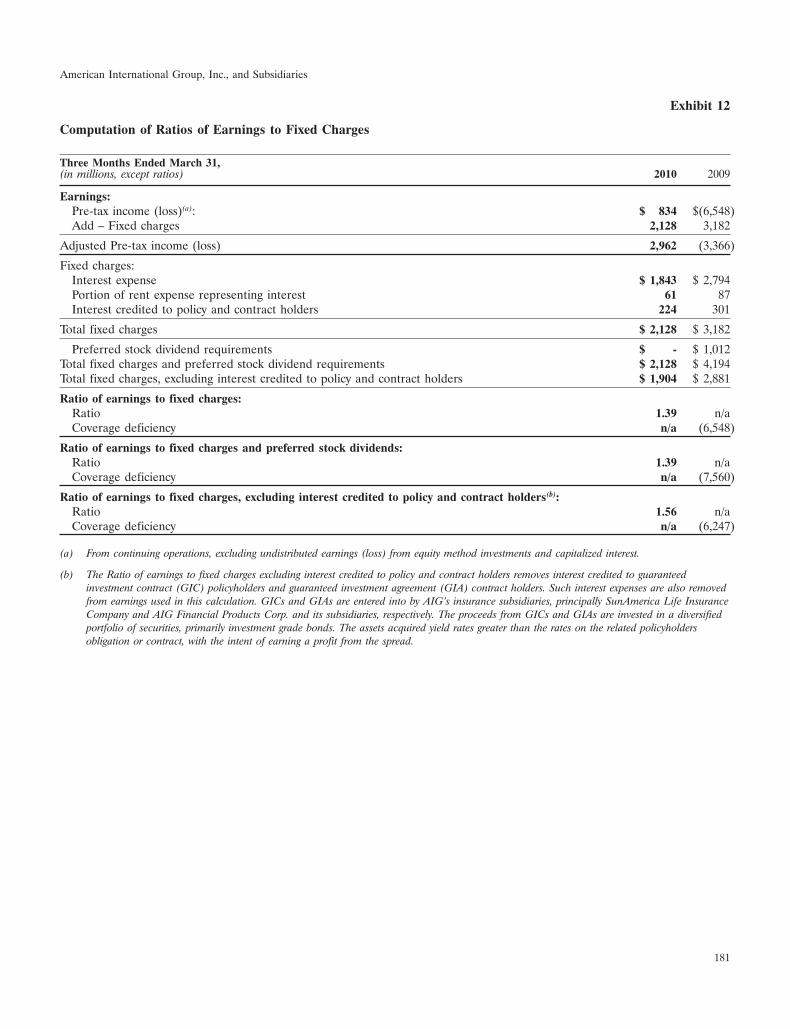
American International Group, Inc., and Subsidiaries
Exhibit 12
Computation of Ratios of Earnings to Fixed Charges
Three Months Ended March 31,(in millions, except ratios) 2010 2009
Earnings:Pre-tax income (loss)(a): $ 834 $(6,548)Add – Fixed charges 2,128 3,182
Adjusted Pre-tax income (loss) 2,962 (3,366)
Fixed charges:Interest expense $ 1,843 $ 2,794Portion of rent expense representing interest 61 87Interest credited to policy and contract holders 224 301
Total fixed charges $ 2,128 $ 3,182
Preferred stock dividend requirements $ - $ 1,012Total fixed charges and preferred stock dividend requirements $ 2,128 $ 4,194Total fixed charges, excluding interest credited to policy and contract holders $ 1,904 $ 2,881
Ratio of earnings to fixed charges:Ratio 1.39 n/aCoverage deficiency n/a (6,548)
Ratio of earnings to fixed charges and preferred stock dividends:Ratio 1.39 n/aCoverage deficiency n/a (7,560)
Ratio of earnings to fixed charges, excluding interest credited to policy and contract holders(b):Ratio 1.56 n/aCoverage deficiency n/a (6,247)
(a) From continuing operations, excluding undistributed earnings (loss) from equity method investments and capitalized interest.
(b) The Ratio of earnings to fixed charges excluding interest credited to policy and contract holders removes interest credited to guaranteedinvestment contract (GIC) policyholders and guaranteed investment agreement (GIA) contract holders. Such interest expenses are also removedfrom earnings used in this calculation. GICs and GIAs are entered into by AIG’s insurance subsidiaries, principally SunAmerica Life InsuranceCompany and AIG Financial Products Corp. and its subsidiaries, respectively. The proceeds from GICs and GIAs are invested in a diversifiedportfolio of securities, primarily investment grade bonds. The assets acquired yield rates greater than the rates on the related policyholdersobligation or contract, with the intent of earning a profit from the spread.
181
American International Group, Inc., and Subsidiaries
Exhibit 31
CERTIFICATIONS
I, Robert H. Benmosche, certify that:
1. I have reviewed this Quarterly Report on Form 10-Q of American International Group, Inc.;
2. Based on my knowledge, this report does not contain any untrue statement of a material fact or omit to statea material fact necessary to make the statements made, in light of the circumstances under which such statementswere made, not misleading with respect to the period covered by this report;
3. Based on my knowledge, the financial statements, and other financial information included in this report,fairly present in all material respects the financial condition, results of operations and cash flows of the registrantas of, and for, the periods presented in this report;
4. The registrant’s other certifying officer and I are responsible for establishing and maintaining disclosurecontrols and procedures (as defined in Exchange Act Rules 13a-15(e) and 15d-15(e)) and internal control overfinancial reporting (as defined in Exchange Act Rules 13a-15(f) and 15d-15(f)) for the registrant and have:
(a) Designed such disclosure controls and procedures, or caused such disclosure controls and procedures tobe designed under our supervision, to ensure that material information relating to the registrant, including itsconsolidated subsidiaries, is made known to us by others within those entities, particularly during the periodin which this report is being prepared;
(b) Designed such internal control over financial reporting, or caused such internal control over financialreporting to be designed under our supervision, to provide reasonable assurance regarding the reliability offinancial reporting and the preparation of financial statements for external purposes in accordance withgenerally accepted accounting principles;
(c) Evaluated the effectiveness of the registrant’s disclosure controls and procedures and presented in thisreport our conclusions about the effectiveness of the disclosure controls and procedures, as of the end of theperiod covered by this report based on such evaluation; and
(d) Disclosed in this report any change in the registrant’s internal control over financial reporting thatoccurred during the registrant’s most recent fiscal quarter (the registrant’s fourth fiscal quarter in the case ofan annual report) that has materially affected, or is reasonably likely to materially affect, the registrant’sinternal control over financial reporting; and
5. The registrant’s other certifying officer and I have disclosed, based on our most recent evaluation of internalcontrol over financial reporting, to the registrant’s auditors and the audit committee of the registrant’s board ofdirectors (or persons performing the equivalent functions):
(a) All significant deficiencies and material weaknesses in the design or operation of internal control overfinancial reporting which are reasonably likely to adversely affect the registrant’s ability to record, process,summarize and report financial information; and
(b) Any fraud, whether or not material, that involves management or other employees who have asignificant role in the registrant’s internal control over financial reporting.
Date: May 7, 2010
/s/ ROBERT H. BENMOSCHE
Robert H. BenmoschePresident and Chief Executive Officer
182

American International Group, Inc., and Subsidiaries
CERTIFICATIONS
I, David L. Herzog, certify that:
1. I have reviewed this Quarterly Report on Form 10-Q of American International Group, Inc.;
2. Based on my knowledge, this report does not contain any untrue statement of a material fact or omit to statea material fact necessary to make the statements made, in light of the circumstances under which such statementswere made, not misleading with respect to the period covered by this report;
3. Based on my knowledge, the financial statements, and other financial information included in this report,fairly present in all material respects the financial condition, results of operations and cash flows of the registrantas of, and for, the periods presented in this report;
4. The registrant’s other certifying officer and I are responsible for establishing and maintaining disclosurecontrols and procedures (as defined in Exchange Act Rules 13a-15(e) and 15d-15(e)) and internal control overfinancial reporting (as defined in Exchange Act Rules 13a-15(f) and 15d-15(f)) for the registrant and have:
(a) Designed such disclosure controls and procedures, or caused such disclosure controls and procedures tobe designed under our supervision, to ensure that material information relating to the registrant, including itsconsolidated subsidiaries, is made known to us by others within those entities, particularly during the periodin which this report is being prepared;
(b) Designed such internal control over financial reporting, or caused such internal control over financialreporting to be designed under our supervision, to provide reasonable assurance regarding the reliability offinancial reporting and the preparation of financial statements for external purposes in accordance withgenerally accepted accounting principles;
(c) Evaluated the effectiveness of the registrant’s disclosure controls and procedures and presented in thisreport our conclusions about the effectiveness of the disclosure controls and procedures, as of the end of theperiod covered by this report based on such evaluation; and
(d) Disclosed in this report any change in the registrant’s internal control over financial reporting thatoccurred during the registrant’s most recent fiscal quarter (the registrant’s fourth fiscal quarter in the case ofan annual report) that has materially affected, or is reasonably likely to materially affect, the registrant’sinternal control over financial reporting; and
5. The registrant’s other certifying officer and I have disclosed, based on our most recent evaluation of internalcontrol over financial reporting, to the registrant’s auditors and the audit committee of the registrant’s board ofdirectors (or persons performing the equivalent functions):
(a) All significant deficiencies and material weaknesses in the design or operation of internal control overfinancial reporting which are reasonably likely to adversely affect the registrant’s ability to record, process,summarize and report financial information; and
(b) Any fraud, whether or not material, that involves management or other employees who have asignificant role in the registrant’s internal control over financial reporting.
Date: May 7, 2010
/s/ DAVID L. HERZOG
David L. HerzogExecutive Vice President
and Chief Financial Officer
183
American International Group, Inc., and Subsidiaries
Exhibit 32
CERTIFICATION
In connection with this Quarterly Report on Form 10-Q of American International Group, Inc. (the‘‘Company’’) for the quarter ended March 31, 2010, as filed with the Securities and Exchange Commission on thedate hereof (the ‘‘Report’’), I, Robert H. Benmosche, President and Chief Executive Officer of the Company,certify, pursuant to 18 U.S.C. Section 1350, that to my knowledge:
(1) The Report fully complies with the requirements of Section 13(a) or 15(d), as applicable, of the SecuritiesExchange Act of 1934; and
(2) The information contained in the Report fairly presents, in all material respects, the financial condition andresults of operations of the Company.
Date: May 7, 2010
/s/ ROBERT H. BENMOSCHE
Robert H. BenmoschePresident and Chief Executive Officer
The foregoing certification is being furnished solely pursuant to 18 U.S.C. Section 1350 and is not being filed aspart of the Report or as a separate disclosure document.
184
American International Group, Inc., and Subsidiaries
CERTIFICATION
In connection with this Quarterly Report on Form 10-Q of American International Group, Inc. (the‘‘Company’’) for the quarter ended March 31, 2010, as filed with the Securities and Exchange Commission on thedate hereof (the ‘‘Report’’), I, David L. Herzog, Executive Vice President and Chief Financial Officer of theCompany, certify, pursuant to 18 U.S.C. Section 1350, that to my knowledge:
(1) The Report fully complies with the requirements of Section 13(a) or 15(d), as applicable, of the SecuritiesExchange Act of 1934; and
(2) The information contained in the Report fairly presents, in all material respects, the financial condition andresults of operations of the Company.
Date: May 7, 2010
/s/ DAVID L. HERZOG
David L. HerzogExecutive Vice President and
Chief Financial Officer
The foregoing certification is being furnished solely pursuant to 18 U.S.C. Section 1350 and is not being filed aspart of the Report or as a separate disclosure document.
185