Embed Size (px)
Citation preview

UNITED STATES SECURITIES AND EXCHANGE COMMISSION Washington, D.C. 20549
FORM 10-K
(X) ANNUAL REPORT PURSUANT TO SECTION 13 OR 15(d) OF THE SECURITIES
EXCHANGE ACT OF 1934 For the fiscal year ended DECEMBER 31, 2003
( ) TRANSITION REPORT PURSUANT TO SECTION 13 OR 15(d) OF THE SECURITIES EXCHANGE ACT OF 1934 For the transition period from _________ to _________
Commission file number 1-8339
NORFOLK SOUTHERN CORPORATION (Exact name of registrant as specified in its charter)
Virginia 52-1188014
(State or other jurisdiction of incorporation) (IRS Employer Identification No.)
Three Commercial Place Norfolk, Virginia 23510-2191
(Address of principal executive offices) Zip Code
Registrant's telephone number, including area code (757) 629-2680
No Change (Former name, former address and former fiscal year, if changed since last report.)
Securities registered pursuant to Section 12(b) of the Act:
Title of each Class Name of each exchange
Norfolk Southern Corporation on which registered Common Stock (Par Value $1.00) New York Stock Exchange
Securities registered pursuant to Section 12(g) of the Act: NONE Indicate by check mark whether the registrant (1) has filed all reports required to be filed by Section 13 or 15(d) of the Securities Exchange Act of 1934 during the preceding 12 months (or for such shorter period that the registrant was required to file such reports) and (2) has been subject to such filing requirements for the past 90 days. Yes (X) No ( ) Indicate by check mark if disclosure of delinquent filers pursuant to Item 405 of Regulation S-K is not contained herein and will not be contained, to the best of registrant's knowledge, in definitive proxy or information statements incorporated by reference in Part III of this Form 10-K or any amendment to this Form 10-K. ( ) The number of shares outstanding of each of the registrant's classes of common stock, as of January 31, 2004: 391,852,750 (excluding 21,016,125 shares held by registrant's consolidated subsidiaries). Indicate by check mark whether the registrant is an accelerated filer (as defined in Rule 12b-2 of the Act). Yes (X) No ( )
The aggregate market value of the voting common equity held by nonaffiliates as of June 30, 2003 was $7,491,970,330 (based on the closing price as quoted on the New York Stock Exchange on that date).
DOCUMENTS INCORPORATED BY REFERENCE:
Portions of the Registrant's definitive proxy statement to be filed electronically pursuant to Regulation 14A not later than 120 days after the end of the fiscal year, are incorporated by reference in Part III.

K2
TABLE OF CONTENTS
NORFOLK SOUTHERN CORPORATION AND SUBSIDIARIES (NS)
Page Part I. 1. Business K3 2. Properties K3 3. Legal Proceedings K14 4. Submission of Matters to a Vote of Security Holders K14 Executive Officers of the Registrant Part II. 5. Market for Registrant's Common Equity and Related Stockholders Matters K16 6. Selected Financial Data K17 7. Management's Discussion and Analysis of Financial Condition and Results of Operations K19 7A. Quantitative and Qualitative Disclosures About Market Risk K38 8. Financial Statements and Supplementary Data K39 9. Changes in and Disagreements with Accountants on Accounting and Financial Disclosure K74 9A. Controls and Procedures K74 Part III. 10. Directors and Executive Officers of the Registrant K75 11. Executive Compensation K75 12. Security Ownership of Certain Beneficial Owners and Management and Related Stockholder Matters K75 13. Certain Relationships and Related Transactions K78 14. Principal Accountant Fees and Services K78 Part IV. 15. Exhibits, Financial Statement Schedule and Reports on Form 8-K K79 Index to Consolidated Financial Statement Schedule Power of Attorney K86 Signatures K86 Exhibit Index K89

K3
PART I
NORFOLK SOUTHERN CORPORATION AND SUBSIDIARIES (NS) Item 1. Business. and Item 2. Properties. GENERAL - Norfolk Southern Corporation (Norfolk Southern) was incorporated on July 23, 1980, under the laws of the Commonwealth of Virginia. On June l, 1982, Norfolk Southern acquired control of two major operating railroads, Norfolk and Western Railway Company (NW) and Southern Railway Company (Southern) in accordance with an Agreement of Merger and Reorganization dated as of July 31, 1980, and with the approval of the transaction by the Interstate Commerce Commission (ICC) (now the Surface Transportation Board [STB]). Effective Dec. 31, 1990, Norfolk Southern transferred all the common stock of NW to Southern, and Southern's name was changed to Norfolk Southern Railway Company (Norfolk Southern Railway or NSR). Effective Sept. 1, 1998, NW was merged with and into Norfolk Southern Railway. As of Dec. 31, 2003, all the common stock of Norfolk Southern Railway was owned directly by Norfolk Southern. Through a jointly owned entity, Norfolk Southern and CSX Corporation (CSX) own the stock of Conrail Inc., which owns the major freight railroad in the Northeast. Norfolk Southern has a 58% economic and 50% voting interest in the jointly owned entity. See also the discussion concerning operation of a portion of Conrail's rail assets, below. On March 28, 1998, Norfolk Southern closed the sale of its motor carrier company, North American Van Lines, Inc. (NAVL) (see “Discontinued Operations” and Note 17). NAVL's results are presented as “Discontinued operations” in the accompanying financial information. Norfolk Southern makes available free of charge through its website, www.nscorp.com, its annual report on Form 10-K, quarterly reports on Form 10-Q, current reports on Form 8-K, and all amendments to those reports as soon as reasonably practicable after such material is electronically filed with or furnished to the Securities and Exchange Commission (SEC). Additionally, Norfolk Southern’s corporate governance guidelines, board committee charters, code of ethics and code of ethical conduct for senior financial officers are available on the company’s website and in print to any shareholder who requests them. Unless indicated otherwise, Norfolk Southern and its subsidiaries are referred to collectively as NS. OPERATION OF A PORTION OF THE CONRAIL RAIL ASSETS - On June 1, 1999, Norfolk Southern and CSX, through their respective railroad subsidiaries, began operating separate portions of Conrail's rail routes and assets. Substantially all such assets are owned by two wholly owned subsidiaries of Consolidated Rail Corporation (CRC); one of those subsidiaries, Pennsylvania Lines LLC (PRR), has entered into various operating and leasing arrangements, more particularly described in Note 2, with Norfolk Southern Railway. The other subsidiary, New York Central Lines LLC (NYC) has entered into similar arrangements with CSX Transportation, Inc. (CSXT). Certain rail assets (Shared Assets Areas) still are owned by CRC, which operates them for joint and exclusive use by Norfolk Southern Railway and CSXT. Operation of the PRR routes and assets increased the size of the system over which Norfolk Southern Railway provides service by nearly 50% and afforded access to the New York metropolitan area, to much of the Northeast and to most of the major East Coast ports north of Norfolk, Virginia. Also, leasing

K4
arrangements with PRR augmented Norfolk Southern Railway's locomotive, freight car and intermodal fleet. Conrail Corporate Reorganization NS, CSX and Conrail are jointly seeking to reorganize Conrail and establish direct ownership and control by NSR and CSXT of PRR and NYC, respectively. The proposed reorganization would replace the operating agreements described above and allow NSR and CSXT to directly own and operate PRR and NYC, respectively. Consummation of the reorganization requires a ruling from the Internal Revenue Service (IRS), the approval of the STB and filings with the SEC. In addition, NS, CSX and Conrail must obtain the consent of Conrail’s debt holders to carry out the transaction and will obtain a valuation of PRR and of NYC. In 2003, the IRS issued a ruling that the reorganization would qualify as a tax-free distribution. Also in 2003, the STB granted its authorization to carry out the reorganization, subject to a condition requiring NS, CSX and Conrail to either: (i) obtain the voluntary consent of the Conrail debt holders; or (ii) propose further proceedings to determine whether the terms offered to the Conrail debt holders are fair, just and reasonable. In 2004, NS, CSX and Conrail intend to file registration statements on Form S-4 with the SEC to allow a proposed exchange offer relating to Conrail’s unsecured debt (see below). In order to implement the reorganization approved by the IRS, the companies have engaged an investment banking firm to provide a valuation. The results of the valuation could impact NS’ carrying amount of its investment in Conrail and the recording of the corporate reorganization. As a part of the proposed reorganization, Conrail would undertake a restructuring of its existing unsecured and secured public indebtedness. There are currently two series of unsecured public debentures with an outstanding principal amount of $800 million and 13 series of secured debt with an outstanding principal amount of approximately $321 million. It is currently contemplated that guaranteed debt securities of two newly formed corporate subsidiaries of NSR and CSXT would be offered in a 58%/42% ratio in exchange for Conrail’s unsecured debentures. Upon completion of the proposed transaction, the new debt securities would become direct unsecured obligations of NSR and CSXT, respectively, and would rank equally with all existing and future senior unsecured debt obligations, if any, of NSR and CSXT. These new debt securities will have maturity dates, interest rates and principal and interest payment dates identical to those of the respective series of Conrail’s unsecured debentures. In addition, these new debt securities will have covenants substantially similar to those of the publicly traded debt securities of NS and CSX, respectively. Conrail’s secured debt and lease obligations will remain obligations of Conrail and are expected to be supported by new leases and subleases which, upon completion of the proposed transaction, would be the direct lease and sublease obligations of NSR or CSXT. NS, CSX and Conrail are diligently working to complete all steps necessary to consummate the Conrail corporate reorganization in 2004. Upon consummation of the proposed transaction, NS’ investment in Conrail will no longer include amounts related to PRR and NYC. Instead, the assets and liabilities of PRR will be reflected in their respective line items in NS’ Consolidated Balance Sheet, and any amounts owed to PRR would be extinguished. RAILROAD OPERATIONS - As of Dec. 31, 2003, NS' railroads operated approximately 21,500 miles of road in the states of Alabama, Delaware, Florida, Georgia, Illinois, Indiana, Iowa, Kentucky, Louisiana, Maryland, Michigan, Mississippi, Missouri, New Jersey, New York, North Carolina, Ohio, Pennsylvania, South Carolina, Tennessee, Virginia, West Virginia, the District of Columbia and in the Province of Ontario, Canada. The miles operated were as follows:

K5
Mileage Operated as of Dec. 31, 2003 Passing Track,
Miles of Road
Second and Other Main
Track
Crossovers and
Turnouts
Way and Yard
Switching Total Owned 11,707 1,383 1,623 5,972 20,685Operated under lease, contract or trackage rights 9,813 3,435 891 3,647 17,786 Total 21,520 4,818 2,514 9,619 38,471
In addition to the lines leased from Conrail previously discussed, NS' railroads have major leased lines between Cincinnati, Ohio, and Chattanooga, Tennessee, and operate over trackage owned by North Carolina Railway Company (NCRR). The Cincinnati-Chattanooga lease, covering about 335 miles of road, expires in 2026, and is subject to an option to extend the lease for an additional 25 years, at terms to be agreed upon. The trackage rights over NCRR cover approximately 315 miles of road under an agreement through 2014 with the right to renew for two additional 15-year periods. NS' railroads carry raw materials, intermediate products and finished goods primarily in the Southeast, East and Midwest, and via interchange with other rail carriers, to and from the rest of the United States and parts of Canada. They also transport overseas freight through several Atlantic and Gulf Coast ports. Atlantic ports served by NS include: Norfolk, Virginia; Morehead City, North Carolina; Charleston, South Carolina; Savannah and Brunswick, Georgia; Jacksonville, Florida; Baltimore, Maryland; Philadelphia, Pennsylvania/Camden, New Jersey; Wilmington, Delaware; and the Ports of New York/New Jersey. Gulf Coast ports served include Mobile, Alabama and New Orleans, Louisiana. The lines of NS' railroads reach most of the larger industrial and trading centers of the Southeast, Northeast, Mid-Atlantic region and Midwest. Chicago, Norfolk, Detroit, Atlanta, Metropolitan New York City, Jacksonville, Kansas City (Missouri), Baltimore, Buffalo, Charleston, Cleveland, Columbus, Philadelphia, Pittsburgh, Toledo, Greensboro, Charlotte and Savannah are among the leading centers originating and terminating freight traffic on the system. In addition, haulage arrangements with connecting carriers allow NS' railroads to provide single-line service to and from additional markets, including haulage provided by Florida East Coast Railway Company to serve southern and eastern Florida, including the port cities of Miami, West Palm Beach and Fort Lauderdale; and haulage provided by The Kansas City Southern Railway Company to provide transcontinental intermodal service via a connection with the Burlington Northern and Santa Fe Railway Company. Service is provided to New England, including the Port of Boston, via haulage, trackage rights and interline arrangements with Canadian Pacific Railway Company and Guilford Transportation Industries. The system's lines also reach many individual industries, electric generating facilities, mines (in western Virginia, eastern Kentucky, southern and northern West Virginia and western Pennsylvania), distribution centers, transload facilities and other businesses located in smaller communities in its service area. The traffic corridors carrying the heaviest volumes of freight include those from the New York City area to Chicago (via Allentown and Pittsburgh); Chicago to Jacksonville (via Cincinnati, Chattanooga and Atlanta); Appalachian coal fields of Virginia, West Virginia and Kentucky to Norfolk, Virginia and Sandusky, Ohio; Cleveland to Kansas City; and Knoxville to Chattanooga. Chicago, Memphis, Sidney/Salem, New Orleans, Kansas City, Buffalo, St. Louis and Meridian are major gateways for interterritorial system traffic.

K6
Triple Crown Operations - Until April 1993, NS' intermodal subsidiary, Triple Crown Services, Inc. (TCS), offered intermodal service using RoadRailer® equipment and domestic containers. RoadRailer® units are enclosed vans that can be pulled over highways in tractor-trailer configuration and over the rails by locomotives. On April 1, 1993, the business, name and operations of TCS were transferred to Triple Crown Services Company (TCSC), a partnership in which subsidiaries of NS and Conrail are equal partners. From April 1, 1993, to June 1, 1999, the revenues of TCSC were not consolidated with the results of NS; however, effective June 1, 1999, NS gained control of TCSC and, therefore, now includes TCSC's results in its consolidated financial statements. TCSC offers door-to-door intermodal service using RoadRailer® equipment in major traffic corridors, including those between the Midwest and the Northeast, the Midwest and the Southeast and the Midwest and Texas/Mexico. The following table sets forth certain statistics relating to NS railroads' operations for the past 5 years, including operations in the Northern Region that commenced June 1, 1999:
Rail Operating Statistics Year Ended Dec. 31, 2003 2002 2001 2000 1999 Revenue ton miles (billions) 183 179 182 197 167 Freight train miles traveled (millions) 73.9 72.6 70.0 74.4 61.5 Revenue per ton mile $0.0353 $0.0350 $0.0339 $0.0312 $0.0315 Revenue ton miles per man-hour worked 3,111 3,067 3,023 2,888 2,577 Percentage ratio of railway operating expenses to railway operating revenues 83.5%1 81.5% 83.7% 89.7%2 86.3%
1Includes $107 million of costs for a voluntary separation program, which added 1.6 percentage points to the ratio. 2Includes $165 million of costs for early retirement and separation programs, which added 2.7 percentage points to the ratio. RAILWAY OPERATING REVENUES - NS' total railway operating revenues were $6.5 billion in 2003. Revenue, shipments and revenue yield by principal railway operating revenue sources for the past five years are set forth in the following table (prior year amounts have been reclassified to conform to the current market groupings).
Principal Sources of Railway Operating Revenues Year Ended Dec. 31, 2003 2002 2001 2000 1999
(Revenues in millions, shipments in thousands, revenue yield in dollars per shipment) COAL Revenues $ 1,500 $ 1,441 $ 1,521 $ 1,435 $ 1,322 % of total revenues 23% 23% 25% 23% 25% Shipments 1,615 1,610 1,695 1,687 1,519 % of total shipments 24% 24% 26% 25% 25% Revenue Yield $ 929 $ 895 $ 897 $ 851 $ 870
K7
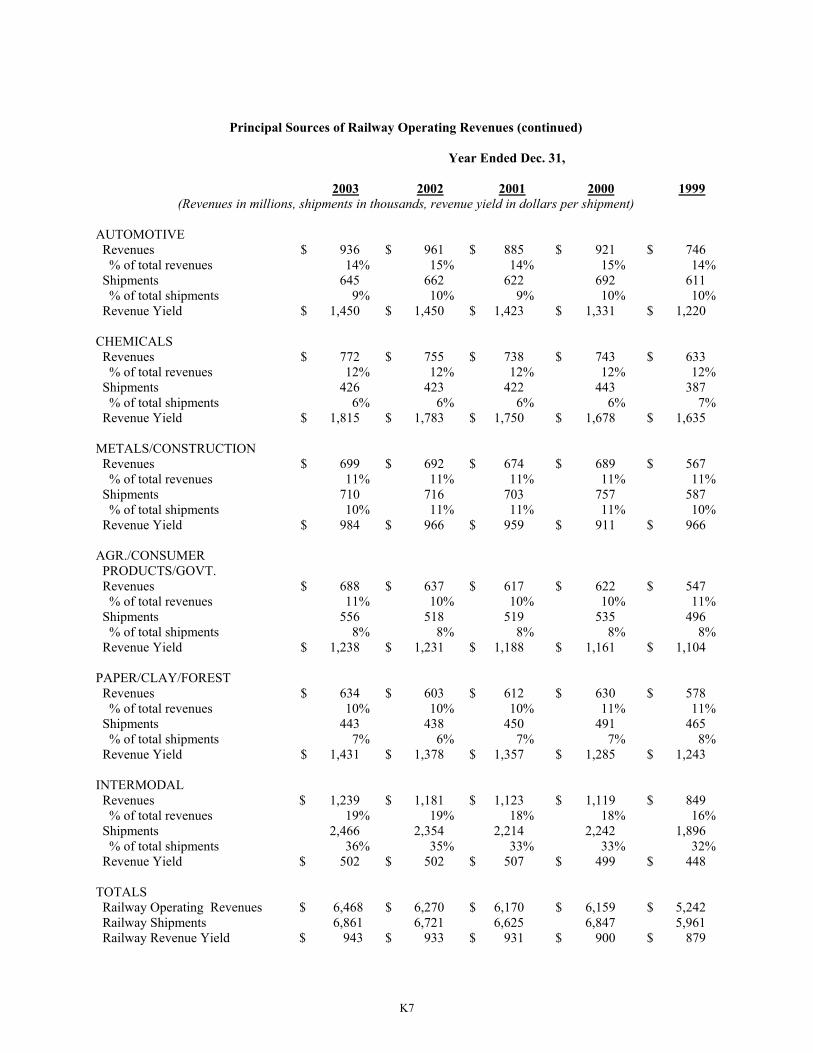
Principal Sources of Railway Operating Revenues (continued) Year Ended Dec. 31, 2003 2002 2001 2000 1999
(Revenues in millions, shipments in thousands, revenue yield in dollars per shipment) AUTOMOTIVE Revenues $ 936 $ 961 $ 885 $ 921 $ 746 % of total revenues 14% 15% 14% 15% 14% Shipments 645 662 622 692 611 % of total shipments 9% 10% 9% 10% 10% Revenue Yield $ 1,450 $ 1,450 $ 1,423 $ 1,331 $ 1,220 CHEMICALS Revenues $ 772 $ 755 $ 738 $ 743 $ 633 % of total revenues 12% 12% 12% 12% 12% Shipments 426 423 422 443 387 % of total shipments 6% 6% 6% 6% 7% Revenue Yield $ 1,815 $ 1,783 $ 1,750 $ 1,678 $ 1,635 METALS/CONSTRUCTION Revenues $ 699 $ 692 $ 674 $ 689 $ 567 % of total revenues 11% 11% 11% 11% 11% Shipments 710 716 703 757 587 % of total shipments 10% 11% 11% 11% 10% Revenue Yield $ 984 $ 966 $ 959 $ 911 $ 966 AGR./CONSUMER PRODUCTS/GOVT. Revenues $ 688 $ 637 $ 617 $ 622 $ 547 % of total revenues 11% 10% 10% 10% 11% Shipments 556 518 519 535 496 % of total shipments 8% 8% 8% 8% 8% Revenue Yield $ 1,238 $ 1,231 $ 1,188 $ 1,161 $ 1,104 PAPER/CLAY/FOREST Revenues $ 634 $ 603 $ 612 $ 630 $ 578 % of total revenues 10% 10% 10% 11% 11% Shipments 443 438 450 491 465 % of total shipments 7% 6% 7% 7% 8% Revenue Yield $ 1,431 $ 1,378 $ 1,357 $ 1,285 $ 1,243 INTERMODAL Revenues $ 1,239 $ 1,181 $ 1,123 $ 1,119 $ 849 % of total revenues 19% 19% 18% 18% 16% Shipments 2,466 2,354 2,214 2,242 1,896 % of total shipments 36% 35% 33% 33% 32% Revenue Yield $ 502 $ 502 $ 507 $ 499 $ 448 TOTALS Railway Operating Revenues $ 6,468 $ 6,270 $ 6,170 $ 6,159 $ 5,242 Railway Shipments 6,861 6,721 6,625 6,847 5,961 Railway Revenue Yield $ 943 $ 933 $ 931 $ 900 $ 879

K8
COAL TRAFFIC - Coal, coke and iron ore -- most of which is bituminous coal -- is NS' railroads' largest commodity group as measured by revenues. The railroads handled a total of 172 million tons in 2003, most of which originated on NS' lines in West Virginia, Virginia, Pennsylvania and Kentucky. Revenues from coal, coke and iron ore accounted for about 23% of NS' total railway operating revenues in 2003. Coal, coke and iron ore tonnage by market for the past five years are set forth in the following table.
Coal, Coke and Iron Ore Tonnage by Market Year Ended December 31, 2003 2002 2001 2000 1999 (tons in thousands) Utility 129,904 127,747 132,325 119,284 107,381Domestic Metallurgical 20,486 21,578 20,457 25,003 21,399Export 12,312 11,342 13,872 19,845 18,373Other 9,624 9,733 11,377 10,781 10,348 172,326 170,400 178,031 174,913 157,501 Total coal handled through all system ports in 2003 was 35 million tons. Of this total, 11 million tons (including coastwise traffic) moved through Norfolk, Virginia, 2 million tons moved through the Baltimore Terminal, 13 million tons moved to various docks on the Ohio River, and 9 million tons moved to various Lake Erie ports. Other than coal for export, virtually all coal handled by NS' railroads was terminated in states east of the Mississippi River. See the discussion of coal traffic, by type of coal, in Part II, Item 7, “Management's Discussion and Analysis of Financial Condition and Results of Operations.” GENERAL MERCHANDISE TRAFFIC - General merchandise traffic is composed of five major commodity groupings: automotive; chemicals; metals and construction; agriculture, consumer products and government; and paper, clay and forest products. The automotive group includes finished vehicles for BMW, DaimlerChrysler, Ford Motor Company, General Motors, Honda, Isuzu, Jaguar, Land Rover, Mazda, Mercedes-Benz, Mitsubishi, Nissan, Saab, Subaru, Suzuki, Toyota and Volkswagen, and auto parts for Ford Motor Company, General Motors, Mercedes-Benz and Toyota. The chemicals group includes sulfur and related chemicals, petroleum products, chlorine and bleaching compounds, plastics, rubber, industrial chemicals, chemical wastes and municipal wastes. The metals and construction group includes steel, aluminum products, machinery, scrap metals, cement, aggregates, bricks and minerals. The agriculture, consumer products and government group includes soybeans, wheat, corn, fertilizer, animal and poultry feed, food oils, flour, beverages, canned goods, sweeteners, consumer products, ethanol and items for the military. The paper, clay and forest products group includes lumber and wood products, pulpboard and paper products, woodfibers, woodpulp, scrap paper and clay. General merchandise carloads handled in 2003 were 2.78 million, compared with 2.76 million handled in 2002, an increase of 1%. In 2003, 134 million tons of general merchandise freight, or approximately 66% of total general merchandise tonnage handled by NS, originated online. The balance of general merchandise traffic was received from connecting carriers at interterritorial gateways. The principal interchange points for NS-received traffic included Chicago, Memphis, New Orleans, Cincinnati, Kansas City, Detroit, Hagerstown, St. Louis/East St. Louis and Louisville.

K9
See the discussion of general merchandise rail traffic by commodity group in Part II, Item 7, “Management's Discussion and Analysis.” INTERMODAL TRAFFIC - The intermodal market consists of shipments moving in trailers, domestic and international containers, and Roadrailer® equipment. These shipments are handled on behalf of intermodal marketing companies, international steamship lines, truckers and other shippers. Intermodal units handled in 2003 were 2.47 million, compared with 2.35 million handled in 2002, an increase of 5%. See the discussion of intermodal traffic in Part II, Item 7, “Management's Discussion and Analysis of Financial Conditions and Results of Operations.” FREIGHT RATES - In 2003, NS' railroads continued their reliance on private contracts and exempt price quotes as their predominant pricing mechanisms. Thus, a major portion of NS' railroads' freight business is not currently economically regulated by the government. In general, market forces have been substituted for government regulation and now are the primary determinant of rail service prices. However, in 2003 there were significant coal movements moving under common carrier (tariff) rates that had previously moved under rates contained in transportation contracts. Beginning Jan. 1, 2002, coal moving to Duke Energy's (Duke) Belew's Creek, Allen, Buck and Dan River generating stations moved under common carrier rates and beginning April 1, 2002, coal moving to Carolina Power and Light's (CP&L) Hyco and Mayo plants moved under common carrier rates. In 2002, Duke and CP&L filed rate reasonableness complaints at the STB alleging that NS’ tariff rates for the transportation of coal were unreasonable. In the Duke proceeding the STB initially found NS’ rates to be reasonable in November 2003, but subsequently issued technical corrections in February 2004 finding that in certain years some portion of the rates was unreasonable. The case is currently stayed because both parties have indicated that they intend to file petitions for reconsideration, and the STB has not yet ordered any rate relief. In the CP&L proceeding the STB found NS’ rates to be unreasonable in December 2003, but upheld a significant portion of NS’ tariff increase. Both of the STB’s rate decisions remain subject to petitions for rehearing and appeals. Future developments in the two cases could result in additional adjustments, and could have a significant impact on results of operations in a particular quarter. In 2003, NS' railroads were found by the STB not to be “revenue adequate” based on results for the year 2002. A railroad is “revenue adequate” under the applicable law when its return on net investment exceeds the rail industry's composite cost of capital. This determination is made pursuant to a statutory requirement and does not adversely impact NS' liquidity or capital resources. PASSENGER OPERATIONS - Regularly scheduled passenger trains are operated by Amtrak on NS' lines between Alexandria and New Orleans, and between Greensboro and Selma, North Carolina. Commuter trains are operated on the NS line between Manassas and Alexandria in accordance with contracts with two transportation commissions of the Commonwealth of Virginia. NS also leases the Chicago to Manhattan, Illinois, line to the Commuter Rail Division of the Regional Transportation Authority of Northeast Illinois. Since June 1, 1999, Norfolk Southern Railway has operated former Conrail lines on which Amtrak conducts regularly scheduled passenger operations between Chicago, Illinois, and Detroit, Michigan, and between Chicago and Harrisburg, Pennsylvania. Also since June 1, 1999, through its operation of PRR's routes, Norfolk Southern Railway has been providing freight service over former Conrail lines with significant ongoing Amtrak and commuter passenger operations, and is conducting freight operations over some trackage owned by Amtrak or by New Jersey Transit, the Southeastern Pennsylvania Transportation Authority, Metro-North Commuter Railroad Company and Maryland DOT. Finally, passenger operations are conducted either by Amtrak or by the commuter agencies over trackage owned by Pennsylvania Lines LLC, or by Conrail in the Shared Assets Areas.

K10
NONCARRIER OPERATIONS - NS' noncarrier subsidiaries engage principally in the acquisition, leasing and management of coal, oil, gas and minerals; the development of commercial real estate; telecommunications; and the leasing or sale of rail property and equipment. In 2003, no such noncarrier subsidiary or industry segment grouping of noncarrier subsidiaries met the requirements for a reportable business segment set forth in Statement of Financial Accounting Standards No. 131. RAILWAY PROPERTY The NS railroad system extends across 22 states, the District of Columbia and portions of Canada. The railroad infrastructure makes the company very capital intensive with total property of approximately $12 billion and investment in Conrail of approximately $6 billion. Capital Expenditures - Capital expenditures for road, equipment and other property for the past five years were as follows (including capitalized leases):
Capital Expenditures 2003 2002 2001 2000 1999 ($ in millions) Road $ 495 $ 519 $ 505 $ 557 $ 559Equipment 218 174 233 146 349Other property 7 2 8 28 4 Total $ 720 $ 695 $ 746 $ 731 $ 912
Capital spending and maintenance programs are and have been designed to assure the ability to provide safe, efficient and reliable transportation services. For 2004, NS has budgeted $810 million of capital spending. See the discussion following “Cash used for investing activities,” in Part II, Item 7, “Management's Discussion and Analysis of Financial Condition and Results of Operations.”

K11
Equipment - As of Dec. 31, 2003, NS owned or leased the following units of equipment:
Number of Units Capacity Owned* Leased** Total of Equipment Locomotives: (Horsepower) Multiple purpose 2,412 777 3,189 10,951,550 Switching 104 101 205 300,700 Auxiliary units 56 18 74 -- Total locomotives 2,572 896 3,468 11,252,250 Freight cars: (Tons) Hopper 16,099 5,014 21,113 2,232,141 Box 16,644 4,810 21,454 1,694,590 Covered hopper 9,369 3,084 12,453 1,359,205 Gondola 26,850 11,217 38,067 4,085,456 Flat 3,111 1,435 4,546 343,587 Caboose 162 50 212 -- Other 3,250 -- 3,250 162,514 Total freight cars 75,485 25,610 101,095 9,877,493 Other: Work equipment 4,479 1,022 5,501 Vehicles 3,629 959 4,588 Highway trailers and containers 877 7,345 8,222 RoadRailer® 5,549 -- 5,549 Miscellaneous 1,422 13,380 14,802 Total other 15,956 22,706 38,662 * Includes equipment leased to outside parties and equipment subject to equipment trusts, conditional sale agreements and capitalized leases. ** Includes locomotives, freight cars and units of other equipment leased from PRR.
The following table indicates the number and year built for locomotives and freight cars owned at Dec. 31, 2003.
Year Built 1992- 1987- 1986 & 2003 2002 2001 2000 1999 1998 1991 Before Total Locomotives: No. of units 100 --* 160 200 147 592 238 1,135 2,572 % of fleet 4% --% 6% 8% 6% 23% 9% 44% 100% Freight cars: No. of units -- -- -- 112 515 8,193 5,530 61,135 75,485 % of fleet --% --% --% --% 1% 11% 7% 81% 100%
*Fifty of the locomotives built in 2001 were purchased in 2002.

K12
As of Dec. 31, 2003, the average age of the locomotive fleet was 15.3 years. During 2003, 91 locomotives, the average age of which was 28.7 years, were retired. The average age of the freight car fleet at Dec. 31, 2003, was 26.6 years. During 2003, 4,855 freight cars were retired. Since 1988, about 29,000 coal cars have been rebodied. As a result, the remaining serviceability of the freight car fleet is greater than may be inferred from the high percentage of freight cars built in earlier years.
Annual Average Bad Order Ratio 2003 2002 2001 2000 1999 Freight cars: NS Rail 7.4% 8.1% 6.9% 5.7% 3.7% Locomotives: NS Rail 6.2% 6.3% 5.8% 5.5% 5.3%
Ongoing freight car and locomotive maintenance programs are intended to ensure the highest standards of safety, reliability, customer satisfaction and equipment marketability. In past years, the freight car bad order ratio reflected the storage of certain types of cars that were not in high demand. The ratio rose in 2000, 2001 and 2002 as a result of decreased maintenance activity. The decline in 2003 reflected an increase in maintenance activity as well as the retirement of unserviceable units. The locomotive bad order ratio includes units out of service for required inspections every 92 days and program work such as overhauls. The ratio rose slightly in 2000 as maintenance activities were curtailed in response to a slowing economy. The elevated ratio through 2003 reflected units out of service related to the resumption of maintenance and modification activities. Track Maintenance - Of the approximately 38,500 total miles of track operated, NS had responsibility for maintaining about 31,000 miles of track with the remainder being operated under trackage rights. Over 75% of the main line trackage (including first, second, third and branch main tracks, all excluding trackage rights) has rail ranging from 131 to 155 pounds per yard with the standard installation currently at 141 pounds per yard. Approximately 40% of NS lines carried 20 million or more gross tons per track mile. The following table summarizes several measurements regarding NS' track roadway additions and replacements during the past five years:
2003 2002 2001 2000 1999 Track miles of rail installed 233 235 254 390 403Miles of track surfaced 5,105 5,270 3,836 3,687 5,087New crossties installed (millions) 2.8 2.8 1.5 1.5 2.3
Microwave System - The NS microwave system, consisting of approximately 7,400 radio route miles, 424 core stations, 14 secondary stations and 5 passive repeater stations, provides communications between most operating locations. The microwave system is used primarily for voice communications, VHF radio control circuits, data and facsimile transmissions, traffic control operations and AEI data transmissions. Traffic Control - Of a total of 21,500 route miles operated by NS, excluding trackage rights over foreign lines, 10,978 miles are signalized, including 8,091 miles of centralized traffic control (CTC) and 2,887

K13
miles of automatic block signals. Of the 8,091 miles of CTC, 2,487 miles are controlled by data radio originating at 183 base station radio sites. Computers - A computer network consisting of a centralized data center in Atlanta, Georgia, and various distributed computers throughout the company connects the yards, terminals, transportation offices, rolling stock repair points, sales offices and other key system locations. Operating and traffic data are processed and stored to provide customers with information on their shipments throughout the system. Computer systems provide current information on the location of every train and each car on line, as well as related waybill and other train and car movement data. In addition, the computer systems are utilized to assist management in the performance of a variety of functions and services including payroll, car and revenue accounting, billing, material management activities and controls, and special studies. Other - The railroads have extensive facilities for support of operations, including freight depots, car construction shops, maintenance shops, office buildings, and signals and communications facilities. Encumbrances - Certain railroad equipment is subject to the prior lien of equipment financing obligations amounting to approximately $910 million as of Dec. 31, 2003, and $864 million at Dec. 31, 2002. Environmental Matters - Compliance with federal, state and local laws and regulations relating to the protection of the environment is a principal NS goal. To date, such compliance has not affected materially NS' capital additions, earnings, liquidity or competitive position. See the discussion of “Environmental Matters” in Part II, Item 7, “Management's Discussion and Analysis of Financial Condition and Results of Operations,” and in Note 18 to the Consolidated Financial Statements. EMPLOYEES - NS employed an average of 28,753 employees in 2003, compared with an average of 28,970 in 2002. The approximate average cost per employee during 2003 was $58,000 in wages and $28,000 in employee benefits. Approximately 85% of NS' railroad employees are covered by collective bargaining agreements with 14 different labor unions. See the discussion of “Labor Agreements” in Part II, Item 7, “Management's Discussion and Analysis of Financial Condition and Results of Operations.” GOVERNMENT REGULATION - In addition to environmental, safety, securities and other regulations generally applicable to all businesses, NS' railroads are subject to regulation by the STB. The STB has jurisdiction over some rates, routes, conditions of service and the extension or abandonment of rail lines. The STB also has jurisdiction over the consolidation, merger or acquisition of control of and by rail common carriers. The Department of Transportation regulates certain track and mechanical equipment standards. The relaxation of economic regulation of railroads, begun over two decades ago under the Staggers Rail Act of 1980, has continued. Significant exemptions are TOFC/COFC (i.e., “piggyback”) business, rail boxcar traffic, lumber, manufactured steel, automobiles and certain bulk commodities such as sand, gravel, pulpwood and wood chips for paper manufacturing. Transportation contracts on regulated shipments effectively remove those shipments from regulation as well. About 80% of NS' freight revenues come from either exempt traffic or traffic moving under transportation contracts. Efforts may be made in 2004 to re-subject the rail industry to unwarranted federal economic regulation. The Staggers Rail Act of 1980, which substantially reduced such regulation, encouraged and enabled rail carriers to innovate and to compete for business, thereby contributing to the economic health of the nation

K14
and to the revitalization of the industry. Accordingly, NS will oppose efforts to reimpose unwarranted economic regulation. COMPETITION - There is continuing strong competition among rail, water and highway carriers. Price is usually only one factor of importance as shippers and receivers choose a transport mode and specific hauling company. Inventory carrying costs, service reliability, ease of handling and the desire to avoid loss and damage during transit are also important considerations, especially for higher-valued finished goods, machinery and consumer products. Even for raw materials, semifinished goods and work-in-process, users are increasingly sensitive to transport arrangements that minimize problems at successive production stages. NS' primary rail competitor is the CSX system; both operate throughout much of the same territory. Other railroads also operate in parts of the territory. NS also competes with motor carriers, water carriers and with shippers who have the additional option of handling their own goods in private carriage. Certain marketing strategies among railroads and between railroads and motor carriers enable carriers to compete more effectively in specific markets. Item 3. Legal Proceedings. None. Item 4. Submission of Matters to a Vote of Security Holders. There were no matters submitted to a vote of security holders during the fourth quarter of 2003. Executive Officers of the Registrant. Norfolk Southern's executive officers generally are elected and designated annually by the Board of Directors at its first meeting held after the annual meeting of stockholders, and they hold office until their successors are elected. Executive officers also may be elected and designated throughout the year as the Board of Directors considers appropriate. There are no family relationships among the officers, nor any arrangement or understanding between any officer and any other person pursuant to which the officer was selected. The following table sets forth certain information, as of February 1, 2004, relating to the executive officers. Name, Age, Present Position Business Experience During Past Five Years David R. Goode, 63, Present position since September 1992. Chairman, President and Chief Executive Officer L. I. Prillaman, 60, Present position since August 1998. Vice Chairman and Chief Marketing Officer Stephen C. Tobias, 59, Present position since August 1998. Vice Chairman and Chief Operating Officer

K15
Henry C. Wolf, 61, Present position since August 1998. Vice Chairman and Chief Financial Officer James A. Hixon, 50, Present position since December 1, 2003. Served as Senior Senior Vice President Vice President Administration from February 2001 to Legal and Government Affairs December 1, 2003, Senior Vice President Employee Relations from November 1999 to February 2001, and prior thereto was Vice President Taxation. Henry D. Light, 63, Present position since January 2002. Served as Vice Senior Vice President Law President Law from April 2000 to January 2002, and prior thereto was General Counsel Operations. Kathryn B. McQuade, 47, Present position since December 1, 2003. Served as Senior Senior Vice President Vice President Financial Planning from April 2000 to Finance December 1, 2003, Vice President Financial Planning from August 1998 to April 2000, and prior thereto was Vice President Internal Audit. Charles W. Moorman, 52, Present position since December 1, 2003. Served as Senior Senior Vice President Vice President Corporate Services from February 1, 2003, to Corporate Planning and Services December 1, 2003; also served as President Thoroughbred Technology and Telecommunications, Inc. since October 1999, and prior thereto was Vice President Information Technology. John P. Rathbone, 52, Present position since December 1, 2003. Served as Senior Senior Vice President Vice President and Controller from April 2000 to December 1, Administration 2003; prior thereto was Vice President and Controller. Donald W. Seale, 51, Present position since December 1, 2003. Served as Senior Senior Vice President Vice President Merchandise Marketing from December 1999 to Marketing Services December 1, 2003; prior thereto was Vice President Merchandise Marketing. Daniel D. Smith, 52, Present position since December 1, 2003. Served as President Senior Vice President NS Development; prior thereto was President Pocahontas Energy and Properties Land Corporation. Marta R. Stewart, 46, Present position since December 1, 2003; prior thereto was Vice President and Controller Assistant Vice President Corporate Accounting.

K16
PART II Item 5. Market for Registrant's Common Stock and Related Stockholder Matters.
NORFOLK SOUTHERN CORPORATION AND SUBSIDIARIES STOCK PRICE AND DIVIDEND INFORMATION
The Common Stock of Norfolk Southern Corporation, owned by 52,091 stockholders of record as of Dec. 31, 2003, is traded on the New York Stock Exchange with the symbol NSC. The following table shows the high and low sales prices as reported by Bloomberg L.P. on its internet-based service and dividends per share, by quarter, for 2003 and 2002.
Quarter 2003 1st 2nd 3rd 4th
Market price High $ 20.89 $ 22.39 $ 20.20 $ 24.62 Low 17.35 18.31 18.00 18.32Dividends per share $ 0.07 $ 0.07 $ 0.08 $ 0.08
2002 Market price High $ 26.98 $ 24.45 $ 23.90 $ 22.54 Low 18.26 19.85 17.20 18.70Dividends per share $ 0.06 $ 0.06 $ 0.07 $ 0.07

K17
Item 6. Selected Financial Data.
NORFOLK SOUTHERN CORPORATION AND SUBSIDIARIES FIVE-YEAR FINANCIAL REVIEW 1999-2003
20031 2002 2001 20005 19996 ($ in millions, except per share amounts)
RESULTS OF OPERATIONS Railway operating revenues $ 6,468 $ 6,270 $ 6,170 $ 6,159 $ 5,242 Railway operating expenses 5,404 5,112 5,163 5,526 4,524 Income from railway operations
1,064 1,158 1,007 633 718
Other income – net 19 66 99 168 164 Interest expense on debt 497 518 553 551 531 Income from continuing operations before income taxes and accounting changes
586 706 553 250 351 Provision for income taxes 175 246 191 78 112 Income from continuing operations before accounting
changes 411 460 362 172 239 Discontinued operations2 10 -- 13 -- -- Cumulative effect of changes in accounting principles, net of taxes3 114 -- -- -- -- Net income $ 535 $ 460 $ 375 $ 172 $ 239 PER SHARE DATA Income from continuing operations before accounting changes – basic and diluted $ 1.05 $ 1.18 $ 0.94 $ 0.45 $ 0.63 Net income – basic and diluted $ 1.37 $ 1.18 $ 0.97 $ 0.45 $ 0.63 Dividends $ 0.30 $ 0.26 $ 0.24 $ 0.80 $ 0.80 Stockholders' equity at year end $ 17.83 $ 16.71 $ 15.78 $ 15.16 $ 15.50
FINANCIAL POSITION Total assets $ 20,596 $ 19,956 $ 19,418 $ 18,976 $ 19,250 Total long-term debt, including current maturities4 $ 7,160 $ 7,364 $ 7,632 $ 7,636 $ 8,059 Stockholders' equity $ 6,976 $ 6,500 $ 6,090 $ 5,824 $ 5,932 OTHER Capital expenditures $ 720 $ 695 $ 746 $ 731 $ 912 Average number of shares outstanding (thousands)
389,788 388,213 385,158 383,358 380,606
Number of stockholders at year end
52,091 51,418 53,042 53,194 51,123
Average number of employees: Rail 28,363 28,587 30,510 33,344 30,897 Nonrail 390 383 384 394 269 Total 28,753 28,970 30,894 33,738 31,166

K18
1 2003 operating expenses include a $107 million charge for a voluntary separation program. Other income –
net includes an $84 million charge to recognize the impaired value of certain telecommunications assets. These charges reduced net income by $119 million, or 30 cents per diluted share.
2 In 1998, NS sold all the common stock of its motor carrier subsidiary, North American Van Lines, Inc. (NAVL), for $207 million and recorded a $90 million pretax ($105 million, or 28 cents per diluted share, after-tax) gain. Accordingly, NAVL's results of operations, financial position and cash flows are presented as “Discontinued operations.” Results in 2001 include an additional after-tax gain of $13 million, or 3 cents per diluted share, that resulted from the expiration of certain indemnity obligations contained in the sales agreement. Results in 2003 include an additional after-tax gain of $10 million, or 3 cents per diluted share, resulting from resolution of tax issues related to the transaction.
3 Net income in 2003 reflects two accounting changes, the cumulative effect of which increased net income by $114 million, or 29 cents per diluted share: a change in accounting for the cost to remove railroad crossties, which increased net income by $110 million, and a change in accounting related to a special-purpose entity that leases certain locomotives to NS, which increased net income by $4 million. This entity’s assets and liabilities, principally the locomotives and debt related to their purchase, are now reflected in NS’ Consolidated Balance Sheet.
4 Excludes notes payable to Conrail of $716 million in 2003, $513 million in 2002, $301 million in 2001, $51 million in 2000 and $123 million in 1999.
5 2000 operating expenses include $165 million in work force reduction costs for early retirement and separation programs. These costs reduced net income by $101 million or 26 cents per diluted share.
6 On June 1, 1999, NS began operating a substantial portion of Conrail's properties. As a result, both its railroad route miles and the number of its railroad employees increased by approximately 50% on that date.

K19
Item 7. Management's Discussion and Analysis of Financial Condition and Results of Operations.
NORFOLK SOUTHERN CORPORATION AND SUBSIDIARIES Management's Discussion and Analysis of
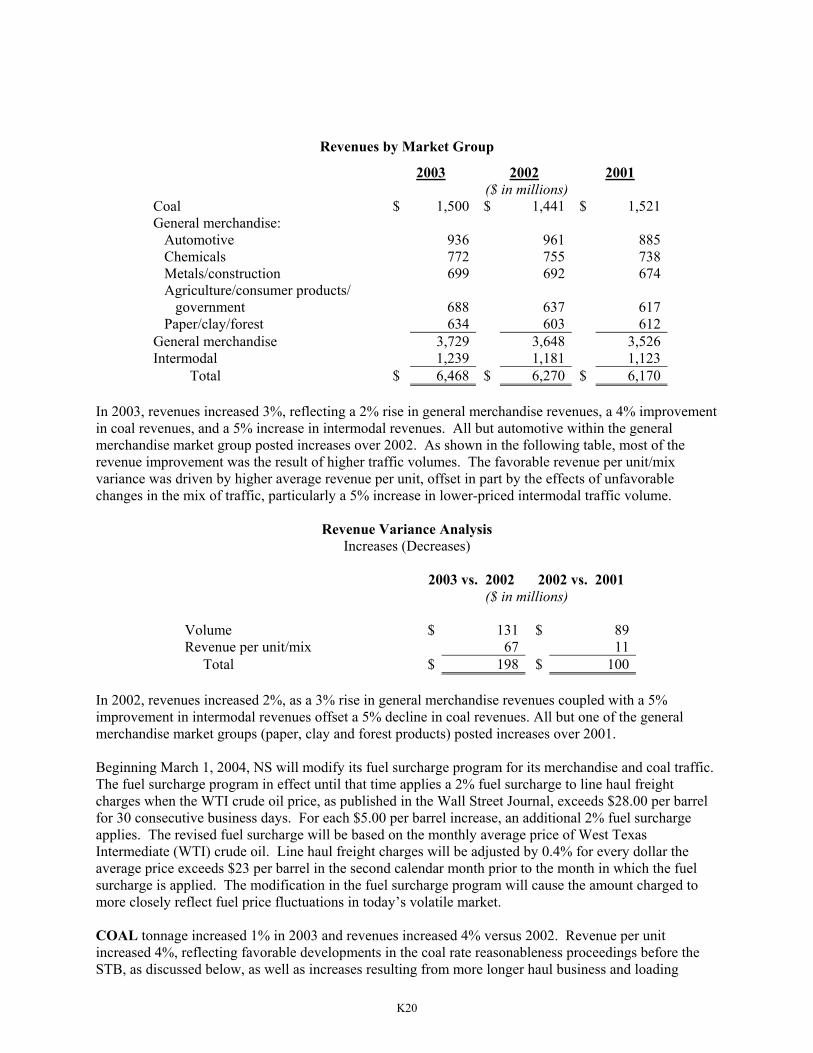
Financial Condition and Results of Operations The following discussion and analysis should be read in conjunction with the Consolidated Financial Statements and Notes and the Five-Year Financial Review. SUMMARIZED RESULTS OF OPERATIONS 2003 Compared with 2002 Net income was $535 million, or $1.37 per diluted share, in 2003, up $75 million, or 16%. Results in 2003 included a $10 million, or 3 cents per share, gain from discontinued operations (see Note 17) and a $114 million, or 29 cents per share, benefit related to the cumulative effect of changes in accounting principles (see Note 1). Income from continuing operations before accounting changes, which excludes these items, was $411 million, or $1.05 per diluted share, down $49 million, or 11%, compared with 2002, reflecting higher compensation and benefits costs, which included the costs of a voluntary separation program (see Note 11), and lower nonoperating income that reflected the impairment of certain telecommunications assets (see Note 6). The costs of the voluntary separation program and the asset impairment combined to reduce income by $119 million, or 30 cents per share. 2002 Compared with 2001 Net income was $460 million, or $1.18 per diluted share, in 2002, up $85 million, or 23%. Net income in 2001 was $375 million and included a $13 million, or 3 cents per share, gain from discontinued operations (see Note 17); accordingly, income from continuing operations was $362 million, or 94 cents per diluted share. Results in 2002 were $98 million, or 27%, above 2001’s income from continuing operations. The improvement was primarily the result of a $151 million, or 15%, increase in income from railway operations. DETAILED RESULTS OF OPERATIONS Railway Operating Revenues Railway operating revenues were $6.5 billion in 2003, $6.3 billion in 2002 and $6.2 billion in 2001. The following table presents a three-year comparison of revenues by market group (prior year amounts have been reclassified to conform to the current market groupings).
K20
Revenues by Market Group
2003 2002 2001 ($ in millions) Coal $ 1,500 $ 1,441 $ 1,521General merchandise: Automotive 936 961 885 Chemicals 772 755 738 Metals/construction 699 692 674 Agriculture/consumer products/ government 688 637 617 Paper/clay/forest 634 603 612General merchandise 3,729 3,648 3,526Intermodal 1,239 1,181 1,123 Total $ 6,468 $ 6,270 $ 6,170
In 2003, revenues increased 3%, reflecting a 2% rise in general merchandise revenues, a 4% improvement in coal revenues, and a 5% increase in intermodal revenues. All but automotive within the general merchandise market group posted increases over 2002. As shown in the following table, most of the revenue improvement was the result of higher traffic volumes. The favorable revenue per unit/mix variance was driven by higher average revenue per unit, offset in part by the effects of unfavorable changes in the mix of traffic, particularly a 5% increase in lower-priced intermodal traffic volume.
Revenue Variance Analysis Increases (Decreases)
2003 vs. 2002 2002 vs. 2001 ($ in millions) Volume $ 131 $ 89 Revenue per unit/mix 67 11 Total $ 198 $ 100
In 2002, revenues increased 2%, as a 3% rise in general merchandise revenues coupled with a 5% improvement in intermodal revenues offset a 5% decline in coal revenues. All but one of the general merchandise market groups (paper, clay and forest products) posted increases over 2001. Beginning March 1, 2004, NS will modify its fuel surcharge program for its merchandise and coal traffic. The fuel surcharge program in effect until that time applies a 2% fuel surcharge to line haul freight charges when the WTI crude oil price, as published in the Wall Street Journal, exceeds $28.00 per barrel for 30 consecutive business days. For each $5.00 per barrel increase, an additional 2% fuel surcharge applies. The revised fuel surcharge will be based on the monthly average price of West Texas Intermediate (WTI) crude oil. Line haul freight charges will be adjusted by 0.4% for every dollar the average price exceeds $23 per barrel in the second calendar month prior to the month in which the fuel surcharge is applied. The modification in the fuel surcharge program will cause the amount charged to more closely reflect fuel price fluctuations in today’s volatile market. COAL tonnage increased 1% in 2003 and revenues increased 4% versus 2002. Revenue per unit increased 4%, reflecting favorable developments in the coal rate reasonableness proceedings before the STB, as discussed below, as well as increases resulting from more longer haul business and loading

K21
productivity improvements that led to more tons per car. Coal, coke and iron ore revenues represented 23% of total railway operating revenues in 2003, and 86% of NS' coal shipments originated on lines it operates. In 2002, two of NS’ utility customers, Duke Energy (Duke) and Carolina Power & Light (CP&L), filed rate reasonableness complaints at the STB alleging that NS’ tariff rates for the transportation of coal were unreasonable. In the Duke proceeding the STB initially found NS’ rates to be reasonable in November 2003, but subsequently issued technical corrections in February 2004 finding that in certain years some portion of the rates was unreasonable. The case is currently stayed because both parties have indicated that they intend to file petitions for reconsideration, and the STB has not yet ordered any rate relief. In the CP&L proceeding the STB found NS’ rates to be unreasonable in December 2003, but upheld a significant portion of NS’ tariff increase. Both of the STB’s rate decisions remain subject to petitions for rehearing and appeals. Future developments in the two cases could result in additional adjustments and could have a significant impact on results of operations in a particular quarter. Over the long term, Management believes the STB decisions in the Duke and CP&L proceedings will help support improved pricing for coal transportation services. In 2002, coal tonnage decreased 4% and revenues declined 5%. Revenue per unit declined slightly, reflecting unfavorable changes in the mix of traffic (more shorter-haul business) that offset the effects of rate increases and gains in tonnage per car.
Total Coal, Coke and Iron Ore Tonnage 2003 2002 2001 (In millions of tons) Utility 130 128 132 Export 12 11 14 Domestic metallurgical 20 21 21 Other 10 10 11 Total 172 170 178
Utility coal tonnage increased 2%, compared to 2002, primarily due to a 6% gain in tonnage moving to the Northeast. These gains were led by a full year’s operation of two projects completed in 2002 that captured traffic from truck and barge. In the first quarter of 2003, higher natural gas prices and colder temperatures caused coal-fired generating stations to run at near capacity in the Northeast, reducing the high stockpiles that were carried forward from 2002. However, the mild temperatures through the remainder of the year diminished seasonal demand for coal. Volumes to utilities in the South decreased 4% due to milder weather and extended power plant outages for the installation of environmental emission-control technology. In 2002, utility coal tonnage decreased 3%, a result of lower demand that reflected the weak economy, high coal stockpile levels entering the year, mild temperatures in the first quarter, reduced stockpile targets set by utility companies and increased generation from new natural gas-fired plants. Licensing requirements for these new plants resulted in additional generation that temporarily displaced coal-fired generation. The outlook for utility coal remains positive. Coal-fired generation continues to be the lowest-cost source for electric generation that has additional growth capacity above current levels. Management expects

K22
utilities to use coal-fired plants to meet increased electricity demand because of coal’s low generating cost and the strengthening economy. As always, demand will be influenced by the weather. There remain a number of evolving environmental issues that have the potential to increase or ease cost pressures on the utility coal market, depending upon their outcome. These include a new national energy policy, proposed multi-emissions legislation, mercury emissions standard, new source review and the fate of the United States participation in the Kyoto Protocol. Although developments with these environmental issues could potentially increase cost pressures on coal-fired generation, the outlook remains positive for maintaining coal’s position in the power generation mix for regions served by NS. Favorable developments with these issues could actually ease cost pressures on coal-fired generation, further strengthening coal’s position. Export coal tonnage increased 9% in 2003, compared to 2002. Export coal through Norfolk, primarily metallurgical coal, increased by 24% in 2003, benefiting from a decline in exports from China. Strong steel production in China increased demand for metallurgical coal and coke and shifted Chinese exports of these commodities to domestic consumption. Also, ocean freight rates are at an all time high. Spot vessel rates from Australia to Europe have more than tripled, while transatlantic rates have increased less dramatically. The combination of the resulting gap in ocean freight rates and the shorter sailing times has given the United States a competitive advantage in European markets. Last, the decline in the value of the dollar against the Euro and Australian Dollar also increased demand for United States metallurgical coal abroad. Coal exported through Baltimore, primarily steam coal, declined 41% due to strong domestic demand for utility coal, as discussed above. In 2002, export coal tonnage declined 18% compared to 2001. Steam coal exports through Baltimore declined 4%, and export metallurgical coals through Norfolk declined 22%. During the first half of 2002, demand for U.S. coal was soft as international buyers focused their purchases toward other, lower-priced sources. Market uncertainty resulted in late contract settlements and delayed shipments. Late in 2002, demand for U.S. coking coals increased, reflecting a shift in the market as exports from China, Australia and Poland declined. As a result, shipments through Norfolk increased in the fourth quarter of 2002. Strong domestic steam coal prices and reduced metallurgical coal production have limited export growth in the United States. The stage is set for further recovery in export volumes in 2004. Export growth will depend, however, upon the availability of coal supply from key metallurgical mines on NS. Pricing is also expected to strengthen. Domestic metallurgical coal, coke and iron ore volumes decreased 5% in 2003, when compared to 2002, due to the temporary closing of a large mine that produced low-volatile coal, the continuing consolidation of the steel industry, and fewer blast furnaces operating than in the past. In 2002, domestic metallurgical coal, coke and iron ore tonnage increased 5%, reflecting higher U.S. steel production, aided by the imported steel tariff program implemented in 2002. In addition, continued strong vehicle production resulted in demand for steel. Future demand for domestic metallurgical coal, coke and iron ore is uncertain but may increase in 2004 due to the shortage that exists in the world market. Continuation of the anticipated rationalization of the steel industry is expected, resulting in fewer blast furnaces in operation; however, the furnaces that remain are expected to run near capacity. Growth may be limited by the availability of coal supply from a key metallurgical mine on NS that was idled in 2003 but is expected to reopen sometime in the second half of 2004. In addition, the end of the steel tariff in December 2003 could mean lower steel prices worldwide and may lead to further consolidations in the industry.

K23
Other coal volumes, principally steam coal shipped to manufacturing plants, finished the year down 1%, when compared to 2002. In 2002, other coal traffic decreased 14%, a result of the weak economy. GENERAL MERCHANDISE traffic volume (carloads) increased 1% in 2003, and revenues increased 2%, principally due to higher average revenues in most business groups and higher agriculture traffic volume. In 2002, traffic volume increased 2%, and revenues increased 3%, reflecting a 9% improvement in automotive revenues. Automotive traffic volume and revenues decreased 3% in 2003, principally due to reduced vehicle production. In 2002, automotive traffic volume increased 7%, and revenues increased 9%, principally due to a rise in vehicle production and new business. Revenue per unit increased 2%, reflecting some pricing improvements, extended length of haul, special ancillary services and the settlement of a disputed charge. Automotive revenues in 2004 are expected to be somewhat higher than those of 2003, due to several factors: light vehicle production is predicted to be slightly above the 2003 level, NS has increased rail service to a major customer with a second plant opening towards the end of 2004, and the addition of several new products. Chemicals traffic volume increased 1% and revenue increased 2% compared to 2002. Traffic volume benefited from higher shipments of industrial intermediates, petroleum and environmental products, and plastics. Also contributing to 2003 growth, approximately 2,000 annual carloads of new traffic were diverted from the waterways and highways. Revenue per unit reflected improved pricing to meet market conditions, as well as favorable changes in mix. In 2002, chemicals traffic volume increased slightly and revenues increased 2%. Higher traffic volume for plastics and a small increase for miscellaneous chemicals offset a decline for petroleum products. Demand for plastics was supported by increases in light vehicle production and housing starts. Traffic volume also benefited from increased shipments through NS' Thoroughbred Bulk Transfer (TBT) facilities that handle chemicals and bulk commodities for customers not located on NS-served lines. Revenue per unit increased as a result of a favorable change in the mix of traffic (more higher-rated business) and market-driven rate increases. Chemical volume is expected to improve in 2004, primarily due to expectations for a stronger economy and growth from new or expanded plastics plants. However, volume could be adversely affected by the price of energy in North America, particularly that of natural gas and crude oil. Both of these commodities account for more than 50% of the cost of most chemical products, and high North American prices are causing chemical producers increasingly to look off shore for production. Metals and construction traffic volume decreased 1%, but revenues increased 1% in 2003 compared with 2002. The decline in volume resulted from reduced metals volume (mostly iron and steel), offset in part by higher construction traffic. Revenue per unit improved 2%, reflecting favorable pricing and traffic mix changes. In 2002, metals and construction traffic volume increased 2%, and revenues improved 3%, reflecting improvement in the steel industry, aided by the two-year imported steel tariff program. Metals volume benefited from resumption of production at some mills that closed in 2001 and increased volume from new mills. Construction traffic declined, primarily as a result of reductions in highway projects due to state government budget pressures.

K24
Metals and construction revenues in 2004 are expected to benefit from an improved economic environment and converting motor carrier traffic to rail, although further consolidation in the steel industry is expected. New stone terminals on NS lines in Florida, Georgia and Tennessee will generate additional aggregate business, and new access to existing cement facilities will increase traffic. Agriculture, consumer products and government traffic volume increased 7% and revenues increased 8% compared with 2002. Commodities contributing most to these increases were corn, fertilizer, military, sweeteners and wheat. Only feed, food products and beverages showed a slight decrease. Corn shipments increased 4% in 2003 and revenue was up 8%. Due to the drought of 2002, which caused a depletion of inventories, there was a significant increase in demand for corn to Southeast feed mill customers and poultry producers in eastern Pennsylvania, Maryland, and Delaware, resulting in long haul rail movements from Midwest suppliers to these areas. Higher fertilizer traffic resulted from the re-opening of a large phosphate fertilizer plant. Shipments of military vehicles and military equipment increased 36% over 2002 levels due to the war in Iraq. In 2002, agriculture, consumer products and government traffic volume decreased slightly compared to 2001, but revenues increased 3%. Traffic volume increases for corn, food products and beverages largely offset declines for soybeans and feed. Corn volume benefited from increased shipments from the Midwest to drought-stricken areas in the East. The increase for food products was primarily the result of new business. Soybean and feed volumes were adversely affected by lower domestic and export demand. Revenue per unit increased because of higher rates, increased length of haul and favorable changes in the mix of traffic. Agriculture, consumer products and government revenues in 2004 are expected to remain steady, reflecting a more normalized 2003 crop, and the overall strong performance of the other commodities. Traffic levels should benefit from new southeastern feed mills that are expected to come on line by late 2004, as well as more shipments of corn, ethanol and transcontinental shipments of fresh and frozen foods. Paper, clay and forest products traffic increased 1% and revenues increased 5% compared to 2002, principally due to improved domestic demand for paper products. Paper traffic benefited from increased domestic orders for consumer products packaging and from the advertising sector, as well as new business. Newsprint shipments continued to remain soft, largely due to a prolonged decline in demand. Woodchip volume increased significantly as NS-served paper mills experienced shortages and were forced to source wood fiber from more distant suppliers due to wet weather in the Southeast. NS clay revenue was up compared to 2002 due to a strong increase in revenue per carload and a more positive mix as NS handled more long-haul domestic traffic. Lumber business was soft in early 2003 despite strong demand due in part to wet weather and several mill closures. Lumber business was up in the fourth quarter as weather in the Southeast and commodity prices improved. In 2002, paper, clay and forest products traffic volume declined 3%, and revenues decreased 1%, primarily due to continued weakness in the paper market, especially in the first half of the year. Traffic volume improved later in the year as the paper market strengthened. In addition, NS gained business from conversion of truck shipments to rail and from continued strength in housing starts. Revenue per unit benefited from rate increases and a decline in shorter-haul business. In 2004, paper, clay and forest product revenues are expected to experience modest growth consistent with the general outlook for the domestic economy. NS revenue growth initiatives will focus on converting motor carrier traffic to rail and offering more transload or rail/truck bundled services to non-rail served customers.

K25
INTERMODAL volume increased 5% and revenues increased 5% compared to 2002. Volume growth was driven by improved service performance that enabled the conversion of truck business to rail. Shipments for asset-based truckload carriers increased 14% as these trucking companies used intermodal to reduce their exposure to driver shortages and the need for larger fleets. International volume, which represents 45% of intermodal’s volume, grew 9%, primarily a result of strong import trade and new business driven by enhanced service. Triple Crown Services Company (TCS) grew 1% in 2003, hampered by a fleet at full capacity. NS is expanding this fleet in 2004. In 2002, intermodal traffic volume increased 6%, and revenues increased 5%, compared to 2001. Volume growth was principally the result of new and improved services that resulted in new business, including the conversion of truck business to rail. International traffic, which accounts for about half of intermodal volume, increased 10%, supported by growth in trade activity and new business. Domestic shipments grew 6%, primarily because of new business gained from the conversion of truck shipments. TCS volume increased 4%. Revenue per unit declined as a result of an increase in shorter-haul business and the absence of fuel surcharges that were in place in 2001, which were partially offset by some rate increases. In 2004, intermodal revenues are expected to benefit from unfavorable forces affecting trucking companies, including changes to the highway hours of service laws, driver shortages, new truck emission standards and, accordingly, higher truck prices. These forces are expected to accelerate truck to rail conversion in addition to creating an environment conducive to rail price increases. Railway Operating Expenses Railway operating expenses increased 6% in 2003, while carloads increased 2%. Expenses in 2003 included $107 million of costs related to a voluntary separation program to reduce the size of the work force, which resulted in 2% of the 6% expense increase. In 2002, railway operating expenses declined 1%, while carloads increased 1%. The railway operating ratio, which measures the percentage of railway operating revenues consumed by railway operating expenses, was 83.5% in 2003, compared with 81.5% in 2002 and 83.7% in 2001. The voluntary separation costs added 1.6 percentage points to the 2003 ratio. The following table shows the changes in railway operating expenses summarized by major classifications.
Operating Expense Variances Increases (Decreases)
2003 vs. 2002 2002 vs. 2001 ($ in millions)
Compensation and benefits* $ 253 $ 8 Materials, services and rents (30) 13 Conrail rents and services 7 (9) Depreciation (2) 1 Diesel fuel 38 (70) Casualties and other claims 10 28 Other 16 (22) Total $ 292 $ (51)
* Includes $107 million of voluntary separation costs in 2003.

K26
Compensation and benefits represented 42% of total railway operating expenses and increased 13% in 2003. Almost half of the increase was the result of the $107 million voluntary separation program. The remaining increase was principally due to higher wage rates (including the BLE bonus in lieu of wage increases), which added $45 million, increased health and welfare benefits costs, which were up $44 million, and reduced pension income down $34 million (see Note 11). Approximately $25 million of the increase in health and welfare benefit costs was attributable to retirees, reflecting a higher estimated medical inflation rate. NS expects these costs to be down slightly in 2004, a result of a recent plan amendment and changes in Medicare coverage (see Note 11). However, NS anticipates that this reduction will largely be offset by lower pension income. Therefore, total pension and postretirement expenses in 2004 are expected to be comparable to 2003. In 2002, compensation and benefits increased slightly and represented 40% of total railway operating expenses. Higher wage rates, reduced pension income (see Note 11) and increased health and welfare benefits costs more than offset savings from reduced employment levels and lower payroll taxes (see the discussion of the Railroad Retirement and Survivors' Improvement Act, below). The Railroad Retirement and Survivors' Improvement Act, which took effect on Jan. 1, 2002, provides for a phased reduction of the employers' portions of Tier II Railroad Retirement payroll taxes. The phase-in calls for a reduction from 14.2% in 2003 to 13.1% in 2004 and thereafter. In addition, the supplemental annuity tax was eliminated. These changes resulted in an estimated $21 million reduction in payroll taxes in 2003 and are expected to result in savings of $16 million in 2004, compared with 2003. However, these savings are expected to continue to be offset by an increase in the railroad unemployment tax rate, higher payroll taxes on increased wages and a higher wage base. The new law allows for investment of Tier II assets in a diversified portfolio through the newly established National Railroad Retirement Investment Trust. The law also provides a mechanism for automatic adjustment of future Tier II payroll taxes should the trust assets fall below a four-year reserve or exceed a six-year reserve. Materials, services and rents includes items used for the maintenance of the railroad's lines, structures and equipment; the costs of services purchased from outside contractors, including the net costs of operating joint (or leased) facilities with other railroads; and the net cost of equipment rentals. This category of expenses decreased 2% in 2003 and increased 1% in 2002. The 2003 decline reflected lower equipment rents costs, down $26 million, and reduced purchased services, down $20 million, including lower expenses for intermodal, automotive and bulk transfer services, and professional and legal fees. The increase in 2002 was the result of higher volume-related expenses for automotive and intermodal traffic, increased material costs for locomotives, higher expenses for roadway and bridge repairs and increased derailment costs. These higher costs were largely offset by a significant reduction in equipment rents. Equipment rents, which includes the cost to NS of using equipment (mostly freight cars) owned by other railroads or private owners, less the rent paid to NS for the use of its equipment, decreased 7% in 2003 and 14% in 2002. The decline in 2003 was principally the result of lower automotive traffic volume in addition to adjustments relating to periodic studies of equipment rents and favorable settlements of recent bills. In addition, the change in accounting related to certain leased locomotives (see Notes 1 and 6) also reduced equipment rents. The decline in 2002 was principally the result of continued improvement in cycle times, reflecting efficiency gains and, for intermodal equipment, service design and process changes implemented during the year.

K27
Locomotive repair costs increased in 2003 and 2002, due to more maintenance activity. Locomotive and freight car maintenance costs are expected to increase further in 2004. Conrail rents and services increased 2% in 2003 and decreased 2% in 2002. This item includes amounts due to PRR and CRC for use of their operating properties and equipment and CRC's operation of the Shared Assets Areas. Also included is NS' equity in Conrail's net earnings, plus the additional amortization related to the difference between NS' investment in Conrail and its underlying equity (see Note 2). The increase in 2003 reflects lower Conrail earnings and higher expenses in the Shared Assets Areas, whereas the decline in 2002 reflected higher Conrail earnings and lower expenses in the Shared Assets Areas (see “Conrail's Results of Operations, Financial Condition and Liquidity,” below). Depreciation expense was down slightly in 2003 and up slightly in 2002. Substantial levels of capital spending affected both years; however, expense in 2003 benefited from a change in accounting for the cost to remove crossties (see Note 1), and expenses in 2002 benefited from lower rates implemented early in the year following completion of a periodic study (see Note 1, “Properties,” for NS' depreciation policy). Diesel fuel expenses increased 11% in 2003 and decreased 17% in 2002. The increase in 2003 reflects an 11% rise in the average price per gallon and essentially flat consumption. The decline in 2002 reflected a 16% drop in the average price per gallon and slightly lower consumption. Expenses in 2003 and 2002 included benefits of $59 million and $10 million, respectively, from the diesel fuel hedging program (see “Market Risks and Hedging Activities,” below and Note 16). NS has hedged approximately 63% of expected 2004 diesel fuel requirements as of December 31, 2003, at an average price of 78 cents per gallon. Accordingly, if diesel fuel prices are volatile during 2004 it is unlikely that NS will experience the same degree of volatility in its diesel fuel expense. Casualties and other claims expenses (including the estimates of costs related to personal injury, property damage and environmental matters) increased 6% in 2003 and 20% in 2002. The higher expense in 2003 was due to adverse personal injury claims development and derailments earlier in the year as well as higher insurance costs. The increase in 2002 reflected adverse personal injury claims development and higher expenses for loss and damage to lading, as well as higher insurance and environmental remediation costs. The largest component of casualties and other claims expense is personal injury costs. In 2003, cases involving occupational injuries comprised about 40% of the total employee injury cases settled and 31% of the total settlement payments made. Injuries of this type are often not caused by a specific accident or event, but rather, result from a claimed exposure over time. Many such claims are being asserted by former or retired employees, some of whom have not been actively employed in the rail industry for decades. NS continues to work actively to eliminate all employee injuries and to reduce the associated costs. The rail industry remains uniquely susceptible to litigation involving job-related accidental injury and occupational claims because of the Federal Employers' Liability Act (FELA), which is applicable only to railroads. FELA, which covers employee claims for job-related injuries, produces results that are unpredictable and inconsistent as compared with a no-fault workers' compensation system. NS, like many other businesses in the U.S., has experienced difficulty obtaining property and casualty insurance on reasonable terms after the September 11 terrorist attacks. NS has been successful in maintaining a substantial amount of commercial insurance for third-party personal injury, property damage and FELA claims, although both the cost of this insurance and the amount of risk that NS retains

K28
through self-insurance have more than doubled since the attacks. The magnitude of the premium increases that NS experienced in 2002 began to subside in 2003, however. Other expenses increased 8% in 2003 but decreased 10% in 2002. The increase in 2003 was primarily attributable to higher state franchise and sales and use taxes, the absence of a favorable bad debt settlement that benefited 2002 and higher union employee travel expenses. The decline in 2002 reflected lower expenses for property and sales and use taxes. Other Income – Net Other income – net was $19 million in 2003, $66 million in 2002 and $99 million in 2001 (see Note 3). The decline in 2003 was primarily due to the $84 million telecommunications assets impairment charge that offset increased gains from the sale of properties, higher corporate-owned life insurance returns and lower interest accruals related to tax liabilities. The decline in 2002 was primarily the result of higher interest accruals on federal income tax liabilities, lower gains from the sale of properties and investments, and the absence of a $13 million gain from a nonrecurring settlement that benefited 2001. These reductions were partially offset by reduced discount from the sales of receivables (due to a lower amount of receivables sold and a lower interest rate environment, which favorably affects the amount of discount). Income Taxes Income tax expense in 2003 was $175 million for an effective rate of 30%, compared with effective rates of 35% in 2002 and 2001. Excluding NS’ equity in Conrail's after-tax earnings, the effective rate was 33% in 2003, and 38% in 2002 and 2001. In 2003, the effective rate was reduced by the favorable resolution of prior years’ tax audits. The effective rates in all three years benefited from favorable adjustments upon filing the prior year tax returns and favorable adjustments to state tax liabilities (see Note 4). In May 2003, the Jobs and Growth Tax Relief Reconciliation Act of 2003 was signed into law. The law increased from 30% to 50% the additional first-year depreciation allowance for property acquired after May 5, 2003, and before January 1, 2005. The 30% additional first-year depreciation allowance was an element of earlier tax legislation. The acceleration of tax depreciation deductions allowed by these laws reduces current taxes and increases deferred tax levels by significant amounts. Discontinued Operations Income from discontinued operations in 2003 consisted of a $10 million after-tax gain related to the resolution of tax issues arising from the sale of NS' motor carrier subsidiary. Income from discontinued operations in 2001 consisted of a $13 million after-tax gain resulting from the expiration of certain indemnities contained in the sales agreement (see Note 17). FINANCIAL CONDITION, LIQUIDITY AND CAPITAL RESOURCES Cash provided by operating activities, NS' principal source of liquidity, was $1,054 million in 2003, compared with $803 million in 2002 and $654 million in 2001. The increase in 2003 reflected a smaller change in the amount of accounts receivables sold; declines in receivables sold amounted to $30 million in 2003 and $270 million in 2002 (see Note 5). In 2002, the improvement was the result of higher income

K29
from railway operations and favorable changes in working capital, which were offset, in part, by fewer accounts receivable sold (see Note 5). Payments made to PRR (which are included in “Conrail Rents and Services” and, therefore, are a use of cash in “Cash provided by operating activities”) are largely cash neutral because a significant portion are borrowed back from a PRR subsidiary and, therefore, are a source of cash in “Proceeds from borrowings.” NS' net cash flow from these borrowings amounted to $203 million in 2003, $212 million in 2002 and $250 million in 2001. NS' working capital deficit was $376 million at Dec. 31, 2003, compared with $554 million at Dec. 31, 2002. The improvement resulted principally from an increase in cash flow from operations and a reduction in federal income taxes due within one year. Debt due in 2004 is expected to be paid using cash generated from operations (including sales of accounts receivable) and cash on hand. NS currently has the capability to increase the amount of accounts receivable being sold under the revolving sale program to meet its more immediate working capital needs. During 2003, the amount of receivables NS could sell under this program ranged from $358 million to $433 million, and the amount of receivables NS sold ranged from zero to $150 million. Moreover, NS has a $1 billion credit facility, which expires in 2006, that it can borrow under or use to support commercial paper debt; however, reductions in its credit rating could limit NS' ability to access the commercial paper markets (see also the discussion of financing activities, below). NS expects to generate sufficient cash flow from operations to meet its ongoing obligations. This expectation is based on a view that the economy will continue a moderate growth rate through 2004. Contractual obligations at Dec. 31, 2003, related to NS' long-term debt (including capital leases) (see Note 8), operating leases (see Note 9), agreements with CRC (see Note 2), unconditional purchase obligations (see Note 18) and other long-term obligations (see Note 18), are as follows:
Payments Due By Period 2005- 2007- 2009 and Total 2004 2006 2008 Subsequent ($ in millions) Long-term debt and capital leases $ 7,160 $ 360 $ 811 $ 1,338 $ 4,651Operating leases 837 111 164 109 453Agreements with CRC 718 32 67 68 551Unconditional purchase obligations 166 166 -- -- --Other long-term obligations 30 8 16 6 -- Total $ 8,911 $ 677 $ 1,058 $ 1,521 $ 5,655
NS also has a contractual obligation related to a lease covering 140 locomotives. The lessor is a special-purpose entity formed to enter into this transaction, but it is not related to NS and its owner has a substantive residual equity capital investment at risk in the entity. The lessor owns the locomotives and issued debt to finance their purchase; however, NS has no obligation related to the debt. NS has the option to purchase the locomotives, but also can return them to the lessor. If NS does not purchase the locomotives at the end of the maximum lease term, it is liable for any shortfall in the then fair value of the locomotives and a specified residual value. NS does not expect to be required to make any payments under this provision (see Note 9). As the primary beneficiary of the business of the lessor, effective

K30
Jan. 1, 2003, NS consolidated the assets (locomotives) and liabilities (debt) of this special-purpose entity when it implemented Financial Accounting Standards Board Interpretation No. 46 (see Note 1, “New Accounting Pronouncements”). In addition, NS has contractual obligations to PRR as disclosed in Note 2. However, NS has the ability to borrow back funds from PRR to the extent they are not needed to fund contractual obligations at Conrail. As an indirect owner of Conrail, NS may need to make capital contributions, loans or advances to Conrail to fund its contractual obligations. The following table presents 58% of Conrail's contractual obligations for long-term debt (including capital leases) and operating leases. Conrail has no unconditional purchase or other long-term obligations.
Payments Due by Period 2005- 2007- 2009 and Total 2004 2006 2008 Subsequent ($ in millions) Long-term debt and capital leases $ 676 $ 43 $ 60 $ 60 $ 513Operating leases 318 34 66 61 157 Total $ 994 $ 77 $ 126 $ 121 $ 670
Off balance sheet arrangements consist of an accounts receivable sale program (see Note 5). Under the program, NS sells without recourse undivided ownership interests in a pool of accounts receivable to two unrelated buyers. NS has no ownership interest in the buyers. The buyers issued debt to fund their initial purchase, and NS used the proceeds it received from the initial purchase primarily to pay down its outstanding debt. NS has no obligation related to the buyers' debt, and there is no existing obligation to repurchase sold receivables. Upon termination of the program, the buyers would cease purchasing new receivables and would retain collections related to the previously sold receivables (see Note 5). As of Dec. 31, 2003, there were no accounts receivable sold, however, NS has the capability to increase the amounts sold, as discussed above. Cash used for investing activities decreased 5% in 2003 and increased 12% in 2002. Property additions, which account for most of the recurring spending in this category, were up 4% in 2003 and down 8% in 2002. Property sales were higher in 2003, which resulted in the net decrease in cash used for investing activities. The following tables show capital spending (including capital leases) and track and equipment statistics for the past five years.
Capital Expenditures 2003 2002 2001 2000 1999 ($ in millions) Road $ 495 $ 519 $ 505 $ 557 $ 559Equipment 218 174 233 146 349Other property 7 2 8 28 4 Total $ 720 $ 695 $ 746 $ 731 $ 912
Capital expenditures increased 4% in 2003 and decreased 7% in 2002 (which included $6 million of capitalized leases). The increase in 2003 reflects higher locomotive purchases offset, in part, by lower spending on signal and electrical projects and computers. The decline in 2002 reflected higher spending

K31
on track program work that was offset by fewer locomotive purchases (50 in 2002 compared with 100 in 2001) and lower spending for intermodal facilities. NS and six other railroads (five Class I railroads and a commuter railroad) have agreed to participate in the Chicago Region Environmental and Transportation Efficiency (CREATE) project in Chicago. The project is a proposed public-private partnership between the railroads and city, state and federal governments to design and implement a comprehensive plan to keep passenger and freight trains moving on schedule through the metropolitan Chicago area, the largest rail transportation hub in the U.S. The intent is to reduce rail and highway congestion and add freight and passenger capacity. The project is estimated to cost $1.5 billion with city, state and federal support. The railroads’ financial contribution to the project is contingent upon a binding commitment that establishes the availability, on terms and conditions satisfactory to the railroads, of all required public funding and of third-party properties necessary to complete the entire project. If public funding is secured, the railroads will contribute a total of $232 million towards the project with NS’ share slated to be $34 million over an estimated six-year period.
Track Structure Statistics (Capital and Maintenance) 2003 2002 2001 2000 1999
Track miles of rail installed 233 235 254 390 403Miles of track surfaced 5,105 5,270 3,836 3,687 5,087New crossties installed (millions) 2.8 2.8 1.5 1.5 2.3
Average Age of Owned Railway Equipment
2003 2002 2001 2000 1999
(years) Freight cars 26.6 25.9 25.4 24.6 23.8 Locomotives 15.3 16.1 15.7 16.1 15.4 Retired locomotives 28.7 28.2 22.4 24.5 22.7
The table above excludes equipment leased from PRR (see Note 2), which comprises 17% of the freight car fleet and 22% of the locomotive fleet. Through its coal car rebody program, which was suspended in 2000, NS converted about 29,000 hopper cars into high-capacity steel gondolas or hoppers. As a result, the remaining service life of the freight-car fleet is greater than may be inferred from the increasing average age shown in the table above. For 2004, NS has budgeted $810 million for capital expenditures. The anticipated spending includes $517 million for roadway projects, of which $384 million is for track and bridge program work. Also included are projects for communications, signal and electrical systems, as well as projects for environmental and public improvements such as grade crossing separations and signal upgrades. Other roadway projects include marketing and industrial development initiatives, including increasing track capacity and access to coal receivers and vehicle production and distribution facilities, and continuing investments in intermodal infrastructure. Equipment spending of $220 million includes the purchase of 100 locomotives and upgrades to existing units, improvements to multilevel automobile racks, and projects related to computers and information technology, including additional security and backup systems.

K32
Cash used for financing activities was $314 million in 2003 and $150 million in 2002. Financing activities provided cash of $151 million in 2001. The comparisons reflect net reductions of debt in 2003 and 2002 and a net increase in 2001. Financing activities include loan transactions with a subsidiary of PRR that resulted in net borrowings of $203 million in 2003, $212 million in 2002 and $250 million in 2001 (see Note 2). Excluding these borrowings, debt was reduced $370 million in 2003, $303 million in 2002 and $20 million in 2001. NS' debt-to-total capitalization ratio (excluding notes payable to the PRR subsidiary) at year end was 50.7% in 2003 and 53.1% in 2002. In 2003, NS redeemed all publicly held shares of Norfolk Southern Railway’s $2.60 Cumulative Preferred Stock, Series A for a redemption price of $50 per share plus accrued and unpaid dividends, for an aggregate redemption price of $50.2066. The total use of cash was $43 million. NS currently has in place and available a $1 billion, five-year credit agreement, which provides for borrowings at prevailing rates and includes financial covenants (see Note 8). NS has outstanding $717 million of its 7.05% notes due May 1, 2037. Each holder of a 2037 note may require NS to redeem all or part of the note at face value, plus accrued and unpaid interest, on May 1, 2004. NS will not know the amount of 2037 notes that it may be required to redeem until April 1, 2004. Should it be necessary, NS has the ability and intent to refinance such notes properly presented. APPLICATION OF CRITICAL ACCOUNTING ESTIMATES The preparation of financial statements in accordance with accounting principles generally accepted in the United States of America requires management to make estimates and assumptions that affect the reported amounts of assets and liabilities, the disclosure of contingent assets and liabilities at the date of the financial statements and the reported amounts of revenues and expenses during the reporting period. These estimates and assumptions may require significant judgment about matters that are inherently uncertain, and future events are likely to occur that may require management to change them. Accordingly, management regularly reviews these estimates and assumptions based on historical experience, changes in the business environment and other factors that management believes to be reasonable under the circumstances. Management discusses the development, selection and disclosures concerning critical accounting estimates with the Audit Committee of its Board of Directors. Pensions and Other Postretirement Benefits Accounting for pensions and other postretirement benefit plans requires management to make several estimates and assumptions (see Note 11). These include the expected rate of return from investment of the plans' assets, projected increases in medical costs and the expected retirement age of employees as well as their projected earnings and mortality. In addition, the amounts recorded are affected by changes in the interest rate environment because the associated liabilities are discounted to their present value. Management makes these estimates based on the company's historical experience and other information that it deems pertinent under the circumstances (for example, expectations of future stock market performance). Management engages an independent consulting actuarial firm to aid it in selecting appropriate assumptions and valuing its related liabilities. NS' net pension benefit, which is included in “Compensation and benefits” on its Consolidated Income Statement, was $25 million for the year ended Dec. 31, 2003, including $19 million related to the voluntary separation program. In recording this amount, NS assumed a long-term investment rate of return of 9%. Investment experience of the pension fund over the past 10-, 15- and 20-year periods has

K33
been in excess of 10%. A one percentage point change to this rate of return assumption would result in a $17 million change to the pension credit and, as a result, an equal change in “Compensation and benefits” expense. Changes that are reasonably likely to occur in assumptions concerning retirement age, projected earnings and mortality would not be expected to have a material effect on NS' net pension benefit or net pension asset in the future. The net pension asset is recorded at its net present value using a discount rate that is based on the current interest rate environment; therefore, management has little discretion in this assumption. NS' net cost for other postretirement benefits, which is also included in “Compensation and benefits,” was $80 million for the year ended Dec. 31, 2003, which included $22 million related to the voluntary separation program. In recording this expense and valuing the net liability for other postretirement benefits, which is included in “Other benefits” as disclosed in Note 11, management estimated future increases in health-care costs. These assumptions, along with the effect of a one percentage point change in them, are described in Note 11. Additionally, as discussed in Note 11, recent changes to Medicare are expected to reduce NS’ postretirement benefit costs. Properties and Depreciation Most of NS' total assets are comprised of long-lived railway properties (see Note 6) and its investment in Conrail (see Note 2). Most of Conrail's assets are long-lived railway properties. As disclosed in Note 1, NS' properties are depreciated using group depreciation. Rail is depreciated primarily on the basis of use measured by gross-ton miles. Other properties are depreciated generally using the straight-line method over the lesser of estimated service or lease lives. NS reviews the carrying amount of properties whenever events or changes in circumstances indicate that such carrying amount may not be recoverable based on future undiscounted cash flows or estimated net realizable value. Assets that are deemed impaired as a result of such review are recorded at the lesser of carrying amount or fair value. NS is amortizing the excess of the purchase price paid for its investment in Conrail over its share of Conrail's net equity using the principles of purchase accounting, based primarily on the estimated remaining useful lives of Conrail's properties. NS' depreciation expense is based on management's assumptions concerning service lives of its properties as well as the expected net salvage that will be received upon their retirement. These assumptions are the product of periodic depreciation studies that are performed by a firm of consulting engineers. These studies analyze NS' historical patterns of asset use and retirement and take into account any expected change in operation or maintenance practices. NS' recent experience with these studies has been that while they do result in changes in the rates used to depreciate its properties, these changes have not caused a significant effect to its annual depreciation expense. The studies may also indicate that the recorded amount of accumulated depreciation is deficient (or in excess) of the amount indicated by the study. Any such deficiency (or excess) is amortized as a component of depreciation expense over the remaining service lives of the affected class of property. NS' “Depreciation expense” for the year ended Dec. 31, 2003, amounted to $513 million. NS' weighted-average depreciation rates for 2003 are disclosed in Note 6; a one-tenth percentage point increase (or decrease) in these rates would result in a $18 million increase (or decrease) to NS' depreciation expense. Personal Injury, Environmental and Legal Liabilities NS' expense for “Casualties and other claims” amounted to $181 million for the year ended Dec. 31, 2003. Most of this expense was composed of NS' accrual related to personal injury liabilities (see discussion of FELA in the discussion captioned “Casualties and other claims” on page K27). NS engages an independent consulting actuarial firm to aid in valuing its personal injury liability and determining the amount to accrue during the year. The actuarial firm studies NS' historical patterns of reserving for

K34
claims and subsequent settlements. The actuary also takes into account outside influences considered pertinent. The study uses the results of these analyses to estimate the ultimate amount of the liability, which includes amounts for incurred but unasserted claims. NS has recorded this actuarially determined liability. The liability is dependent upon many individual judgments made as to the specific case reserves as well as the judgments of the consulting actuary and management in the periodic studies. Accordingly, there could be significant changes in the liability, which NS would recognize when such a change became known. The most recent actuarial study was performed as of Sept. 30, 2003, and resulted in a slight decrease to NS' personal injury liability during the fourth quarter. While the liability recorded is supported by the most recent study, it is reasonably possible that the liability could be higher or lower. NS is subject to various jurisdictions' environmental laws and regulations. It is NS' policy to record a liability where such liability or loss is probable and its amount can be estimated reasonably (see Note 18). Environmental engineers regularly participate in ongoing evaluations of all known sites and in determining any necessary adjustments to liability estimates. NS also has established an Environmental Policy Council, composed of senior managers, to oversee and interpret its environmental policy. Operating expenses for environmental matters totaled approximately $9 million in 2003, $15 million in 2002 and $12 million in 2001, and capital expenditures totaled approximately $9 million in 2003, and $10 million in both 2002 and 2001. Capital expenditures in 2004 are expected to be comparable to those in 2003. NS' balance sheets included liabilities for environmental exposures in the amount of $25 million at Dec. 31, 2003, and $29 million at Dec. 31, 2002, (of which $8 million was accounted for as a current liability in each year). At Dec. 31, 2003, the liability represented NS' estimate of the probable cleanup and remediation costs based on available information at 113 identified locations. On that date, 10 sites accounted for $12 million of the liability, and no individual site was considered to be material. NS anticipates that much of this liability will be paid out over five years; however, some costs will be paid out over a longer period. At some of the 113 locations, certain NS subsidiaries, usually in conjunction with a number of other parties, have been identified as potentially responsible parties by the Environmental Protection Agency (EPA) or similar state authorities under the Comprehensive Environmental Response, Compensation and Liability Act of 1980, or comparable state statutes, which often impose joint and several liability for cleanup costs. With respect to known environmental sites (whether identified by NS or by the EPA or comparable state authorities), estimates of NS' ultimate potential financial exposure for a given site or in the aggregate for all such sites are necessarily imprecise because of the widely varying costs of currently available cleanup techniques, the likely development of new cleanup technologies, the difficulty of determining in advance the nature and full extent of contamination and each potential participant's share of any estimated loss (and that participant's ability to bear it), and evolving statutory and regulatory standards governing liability. NS estimates its environmental remediation liability on a site-by-site basis, using assumptions and judgments that management deems appropriate for each site. As a result, it is not practical to quantitatively describe the effects of changes in these many assumptions and judgments. NS has consistently applied its methodology of estimating its environmental liabilities. The risk of incurring environmental liability is inherent in the railroad business. Some of the commodities in NS' traffic mix, particularly those classified as hazardous materials, can pose special risks that NS and its subsidiaries work diligently to minimize. In addition, several NS subsidiaries own, or have owned, land used as operating property, or which is leased and operated by others, or held for sale. Because environmental problems may exist on these properties that are latent or undisclosed, there can be

K35
no assurance that NS will not incur environmentally related liabilities or costs with respect to one or more of them, the amount and materiality of which cannot be estimated reliably at this time. Moreover, lawsuits and claims involving these and potentially other unidentified environmental sites and matters are likely to arise from time to time. The resulting liabilities could have a significant effect on financial condition, results of operations or liquidity in a particular year or quarter. However, based on its assessment of the facts and circumstances now known, management believes that it has recorded the probable costs for dealing with those environmental matters of which the Corporation is aware. Further, management believes that it is unlikely that any known matters, either individually or in the aggregate, will have a material adverse effect on NS' financial position, results of operations or liquidity. Norfolk Southern and certain subsidiaries are defendants in numerous lawsuits and other claims relating principally to railroad operations. When management concludes that it is probable that a liability has been incurred and the amount of the liability can be reasonably estimated, it is accrued through a charge to expenses. While the ultimate amount of liability incurred in any of these lawsuits and claims is dependent on future developments, in management's opinion the recorded liability, if any, is adequate to cover the future payment of such liability and claims. However, the final outcome of any of these lawsuits and claims cannot be predicted with certainty, and unfavorable or unexpected outcomes could result in additional accruals that could be significant to results of operations in a particular year or quarter. Any adjustments to recorded liabilities will be reflected in expenses in the periods in which such adjustments are known. Income Taxes NS' net long-term deferred tax liability totaled $3,223 million at Dec. 31, 2003 (see Note 4). This liability is estimated based on the expected future tax consequences of items recognized in the financial statements. After application of the federal statutory tax rate to book income, judgment is required with respect to the timing and deductibility of expenses in the corporate income tax returns. For state income and other taxes, judgment is also required with respect to the apportionment among the various jurisdictions. A valuation allowance is recorded if management expects that it is more likely than not that its deferred tax assets will not be realized. NS has a $22 million valuation allowance on $628 million of deferred tax assets as of Dec. 31, 2003, reflecting the expectation that most of these assets will be realized. For 2003, 2002 and 2001, the effective tax rates, excluding NS' equity in Conrail's earnings, were 33%, 38% and 38%, respectively. For every one half percent change in the 2003 effective tax rate, net income would have changed by $3 million. CONRAIL'S RESULTS OF OPERATIONS, FINANCIAL CONDITION AND LIQUIDITY Conrail's net income was $203 million in 2003, compared with $180 million in 2002 and $174 million in 2001 (see Note 2). Results in 2003 included $40 million for the cumulative effect on years prior to 2003 of a change in accounting principles as required by Conrail’s adoption of SFAS No. 143. NS excluded this amount from its determination of equity in earnings of Conrail because an amount related to Conrail is included in NS’ cumulative effect adjustment for SFAS No. 143. Conrail’s income before the accounting change was $163 million, $17 million below 2002, reflecting lower income from operations. Conrail's operating revenues were $918 million in 2003, $893 million in 2002 and $903 million in 2001. The 2003 increase was primarily attributable to higher operating fees related to PRR and NYC. The decrease in 2002 resulted from the expiration of certain equipment leases and lower operating fees, largely because of reduced operating costs in the Shared Assets Areas.

K36
Conrail's operating expenses were $659 million in 2003, $623 million in 2002 and $639 million in 2001. The increase in 2003 was primarily the result of higher expenses for compensation and benefits, and casualties and insurance. The decrease in 2002 reflected lower expenses for materials, services and rents and compensation and benefits, which were offset, in part, by higher costs for casualties and other claims. Conrail's cash provided by operations decreased $11 million, or 3%, in 2003, and $79 million, or 16%, in 2002. The decrease in 2003 reflects the absence of an IRS refund received in 2002 that was partially offset by a decreased use of cash for casualty payments. The decline in 2002 was primarily the result of the absence of two items that benefited 2001: a $50 million cash payment for transferring to a third party certain rights to license, manage and market signboard advertising on Conrail's property for 25 years and proceeds from a favorable insurance settlement. This was offset, in part, by favorable changes in working capital. Cash generated from operations is Conrail's principal source of liquidity and is primarily used for debt repayments and capital expenditures. Debt repayments totaled $57 million in 2003 and $59 million in 2002. Capital expenditures totaled $35 million in 2003 and $23 million in 2002. Conrail had a working capital deficit of $22 million at Dec. 31, 2003, and $29 million at Dec. 31, 2002. Conrail is not an SEC registrant and, therefore, presently cannot issue any publicly traded securities. Conrail is expected to have sufficient cash flow to meet its ongoing obligations. NS' equity in earnings of Conrail, net of amortization, was $58 million in 2003, $54 million in 2002 and $44 million in 2001. NS' other comprehensive income (loss) for 2003, 2002 and 2001, as shown in the Consolidated Statement of Changes in Stockholders' Equity, included a $14 million gain, a $34 million loss and a $41 million loss, respectively, for its portion of Conrail's other comprehensive loss (see Note 13). OTHER MATTERS Labor Agreements Approximately 24,000 of NS' railroad employees are covered by collective bargaining agreements with 14 different labor unions. These agreements remain in effect until changed pursuant to the Railway Labor Act. Moratorium provisions in these agreements permitted NS and the unions to propose such changes in late 1999; negotiations at the national level commenced shortly thereafter. Agreements have been reached with the Brotherhood of Maintenance of Way Employes (BMWE), which represents about 4,200 NS employees; the United Transportation Union (UTU), which represents about 6,700 NS employees; the International Brotherhood of Boilermakers and Blacksmiths (IBB), which represents about 100 NS employees; the Transportation Communications International Union (TCU), which represents about 4,400 NS employees; the American Train Dispatchers Department (ATDD), which represents about 400 NS employees; the Brotherhood of Railroad Signalmen (BRS), which represents about 1,100 NS employees; and the Brotherhood of Locomotive Engineers (BLE), which represents about 4,500 NS employees. The agreement with the BLE was through 2004; NS recently reached a further contract extension with BLE through 2009. A tentative agreement with the International Brotherhood of Electrical Workers (IBEW), which represents about 900 NS employees, failed ratification. Health and welfare issues have been resolved with BMWE, TCU, BRS, BLE and UTU. Health and welfare issues with the other organizations have not yet been resolved.

K37
Market Risks and Hedging Activities NS uses derivative financial instruments to reduce the risk of volatility in its diesel fuel costs and to manage its overall exposure to fluctuations in interest rates. In 2001, NS began a program to hedge a portion of its diesel fuel consumption. The intent of the program is to assist in the management of NS' aggregate risk exposure to fuel price fluctuations, which can significantly affect NS' operating margins and profitability, through the use of one or more types of derivative instruments. Diesel fuel costs represented 7% of NS' operating expenses for 2003. The program provides that NS will not enter into any fuel hedges with a duration of more than 36 months, and that no more than 80% of NS' average monthly fuel consumption will be hedged for any month within any 36-month period. As of Dec. 31, 2003, through swap transactions, NS has hedged approximately 63% of expected 2004 diesel fuel requirements. The effect of the hedges is to yield an average cost of 78 cents per hedged gallon, including federal taxes and transportation. A 10% decrease in diesel fuel prices would reduce NS' asset related to the swaps by approximately $38 million as of Dec. 31, 2003. NS manages its overall exposure to fluctuations in interest rates by issuing both fixed- and floating-rate debt instruments and by entering into interest-rate hedging transactions to achieve an appropriate mix within its debt portfolio. At Dec. 31, 2003, NS' debt subject to interest rate fluctuations totaled $636 million (excluding debt due to the PRR subsidiary). A 1% increase in interest rates would increase NS' total annual interest expense related to all its variable debt by approximately $6 million. Management considers it unlikely that interest rate fluctuations applicable to these instruments will result in a material adverse effect on NS' financial position, results of operations or liquidity. Some of NS' capital leases, which carry an average fixed rate of 7%, were effectively converted to variable rate obligations using interest rate swap agreements. On Dec. 31, 2003, the average pay rate under these agreements was 1.6%, and the average receive rate was 7%. During 2003, the effect of the swaps was to reduce interest expense by $10 million. A portion of the lease obligations is payable in Japanese yen. NS eliminated the associated exchange rate risk at the inception of each lease with a yen deposit sufficient to fund the yen-denominated obligation. Most of these deposits are held by foreign banks, primarily Japanese. As a result, NS is exposed to financial market risk relative to Japan. Counterparties to the interest rate swaps and Japanese banks holding yen deposits are major financial institutions believed by management to be creditworthy. New Accounting Pronouncements As discussed in Note 1, effective Jan. 1, 2003, NS adopted Financial Accounting Standards Board (FASB) Statement No. 143, “Accounting for Asset Retirement Obligations,” (SFAS No. 143) and FASB Interpretation No. 46, “Consolidation of Variable Interest Entities,” (FIN No. 46). Inflation In preparing financial statements, accounting principles generally accepted in the United States of America require the use of historical cost that disregards the effects of inflation on the replacement cost of property. NS, a capital-intensive company, has most of its capital invested in such assets. The

K38
replacement cost of these assets, as well as the related depreciation expense, would be substantially greater than the amounts reported on the basis of historical cost. Trends Federal Economic Regulation -- Efforts may be made in 2004 to reimpose unwarranted federal economic regulation on the rail industry. The Staggers Rail Act of 1980, which substantially reduced such regulation, encouraged and enabled rail carriers to innovate and to compete for business. NS and other rail carriers will oppose any efforts to reimpose unwarranted economic regulation. Utility Deregulation -- Deregulation of the electrical utility industry is expected to increase competition among electric power generators; deregulation over time would permit wholesalers and possibly retailers of electric power to sell or purchase increasing quantities of power to or from distant parties. The effects of deregulation on NS and on its customers cannot be predicted with certainty; however, NS serves a number of efficient power producers who are expected to remain competitive in this evolving environment. Carbon-Based Fuel -- There is growing concern in some quarters that emissions resulting from burning carbon-based fuel, including coal, are contributing to global warming and causing other environmental changes. To the extent that these concerns evolve into a consensus among policy-makers, the impact could be either a reduction in the demand for coal or imposition of more stringent regulations on emissions, which might result in making coal a less economical source of power generation or make permitting of coal-fired facilities even more difficult. The revenues and net income of NSR and other railroads that move large quantities of coal could be affected adversely. FORWARD-LOOKING STATEMENTS This Management's Discussion and Analysis of Financial Condition and Results of Operations contains forward-looking statements that may be identified by the use of words like “believe,” “expect,” “anticipate” and “project.” Forward-looking statements reflect management's good-faith evaluation of information currently available. However, such statements are dependent on and, therefore, can be influenced by, a number of external variables over which management has little or no control, including: domestic and international economic conditions; the business environment in industries that produce and consume rail freight; competition and consolidation within the transportation industry; fluctuation in prices of key materials, in particular diesel fuel; labor difficulties, including strikes and work stoppages; legislative and regulatory developments; changes in securities and capital markets; and natural events such as severe weather, floods and earthquakes. Forward-looking statements are not, and should not be relied upon as, a guaranty of future performance or results. Nor will they necessarily prove to be accurate indications of the times at or by which any such performance or results will be achieved. As a result, actual outcomes and results may differ materially from those expressed in forward-looking statements. The Company undertakes no obligation to update or revise forward-looking statements. Item 7A. Quantitative and Qualitative Disclosures about Market Risk. The information required by this item is included in Part II, Item 7, “Management's Discussion and Analysis of Financial Condition and Results of Operations” under the heading “Market Risks and Hedging Activities.”

K39
Item 8. Financial Statements and Supplementary Data.
INDEX TO FINANCIAL STATEMENTS Page Report of Management K40 Independent Auditors' Report K41 Independent Accountants' Report on Internal Control over Financial Reporting K42 Consolidated Statements of Income K43 Years ended December 31, 2003, 2002 and 2001 Consolidated Balance Sheets K44 As of December 31, 2003 and 2002 Consolidated Statements of Cash Flows K45 Years ended December 31, 2003, 2002 and 2001 Consolidated Statements of Changes in Stockholders' Equity K46 Years ended December 31, 2003, 2002 and 2001 Notes to Consolidated Financial Statements K47 The Index to Consolidated Financial Statement Schedule in Item 15 K79

K40
Report of Management January 27, 2004 To the Stockholders Norfolk Southern Corporation Management is responsible for the preparation and fair presentation of the financial statements included in this annual report. The financial statements have been prepared in conformity with accounting principles generally accepted in the United States of America and reflect management's judgments and estimates concerning effects of events and transactions that are accounted for or disclosed. Management is also responsible for establishing and maintaining effective internal control over financial reporting. The Corporation's internal control over financial reporting includes those policies and procedures that pertain to the Corporation's ability to record, process, summarize and report reliable financial data. Management recognizes that there are inherent limitations in the effectiveness of any internal control over financial reporting, including the possibility of human error and the circumvention or overriding of internal control. Accordingly, even effective internal control over financial reporting can provide only reasonable assurance with respect to financial statement preparation. Further, because of changes in conditions, the effectiveness of internal control over financial reporting may vary over time. In order to ensure that the Corporation's internal control over financial reporting is effective, management regularly assesses such controls and did so most recently for its financial reporting as of December 31, 2003. This assessment was based on criteria for effective internal control over financial reporting described in Internal Control-Integrated Framework issued by the Committee of Sponsoring Organizations of the Treadway Commission. Based on this assessment, management believes the Corporation maintained effective internal control over financial reporting as of December 31, 2003. The Board of Directors, acting through its Audit Committee, is responsible for the oversight of the Corporation's accounting policies, financial reporting and internal control. The Audit Committee of the Board of Directors is comprised entirely of outside directors who are independent of management. The Audit Committee is responsible for the appointment and compensation of the independent auditor and approves decisions regarding the appointment or removal of the Vice President-Internal Audit. It meets periodically with management, the independent auditors and the internal auditors to ensure that they are carrying out their responsibilities. The Audit Committee is also responsible for performing an oversight role by reviewing and monitoring the financial, accounting and auditing procedures of the Corporation in addition to reviewing the Corporation's financial reports. The independent auditors and the internal auditors have full and unlimited access to the Audit Committee, with or without management, to discuss the adequacy of internal control over financial reporting, and any other matters which they believe should be brought to the attention of the Audit Committee. KPMG LLP, independent auditors of the Corporation's financial statements, has reported on management's assertion with respect to the effectiveness of the Corporation's internal control over financial reporting as of December 31, 2003.
/s/ David R. Goode /s/ Henry C. Wolf /s/ Marta R. Stewart David R. Goode Henry C. Wolf Marta R. Stewart Chairman, President and Vice Chairman and Vice President and Chief Executive Officer Chief Financial Officer Controller

K41
Independent Auditors' Report The Stockholders and Board of Directors Norfolk Southern Corporation: We have audited the accompanying consolidated balance sheets of Norfolk Southern Corporation and subsidiaries as of December 31, 2003 and 2002, and the related consolidated statements of income, changes in stockholders' equity and cash flows for each of the years in the three-year period ended December 31, 2003. In connection with our audits of the consolidated financial statements, we have also audited the financial statement schedule as listed in Item 15(A)2. These consolidated financial statements and financial statement schedule are the responsibility of the Company's management. Our responsibility is to express an opinion on these consolidated financial statements and financial statement schedule based on our audits. We conducted our audits in accordance with auditing standards generally accepted in the United States of America. Those standards require that we plan and perform the audit to obtain reasonable assurance about whether the financial statements are free of material misstatement. An audit includes examining, on a test basis, evidence supporting the amounts and disclosures in the financial statements. An audit also includes assessing the accounting principles used and significant estimates made by management, as well as evaluating the overall financial statement presentation. We believe that our audits provide a reasonable basis for our opinion. In our opinion, the consolidated financial statements referred to above present fairly, in all material respects, the financial position of Norfolk Southern Corporation and subsidiaries as of December 31, 2003 and 2002, and the results of their operations and their cash flows for each of the years in the three-year period ended December 31, 2003 in conformity with accounting principles generally accepted in the United States of America. Also, in our opinion, the related financial statement schedule, when considered in relation to the basic consolidated financial statements taken as a whole, presents fairly, in all material respects, the information set forth therein. As discussed in Note 1 to the consolidated financial statements, effective January 1, 2003 the Company adopted Financial Accounting Standards Board Statement No. 143, Accounting for Asset Retirement Obligations, and Financial Accounting Standards Board Interpretation No. 46, Consolidation of Variable Interest Entities. /s/ KPMG LLP Norfolk, Virginia January 27, 2004

K42
INDEPENDENT ACCOUNTANTS' REPORT ON INTERNAL CONTROL OVER FINANCIAL REPORTING
The Board of Directors Norfolk Southern Corporation: We have examined management's assertion, included in the accompanying Report of Management, that Norfolk Southern Corporation maintained effective internal control over financial reporting as of December 31, 2003 based on criteria established in Internal Control—Integrated Framework issued by the Committee of Sponsoring Organizations of the Treadway Commission (COSO). Norfolk Southern Corporation's management is responsible for maintaining effective internal control over financial reporting. Our responsibility is to express an opinion on management's assertion based on our examination. Our examination was conducted in accordance with attestation standards established by the American Institute of Certified Public Accountants and, accordingly, included obtaining an understanding of internal control over financial reporting, testing, and evaluating the design and operating effectiveness of internal control, and performing such other procedures as we considered necessary in the circumstances. We believe that our examination provides a reasonable basis for our opinion. Because of inherent limitations in any internal control, misstatements due to error or fraud may occur and not be detected. Also, projections of any evaluation of internal control over financial reporting to future periods are subject to the risk that the internal control may become inadequate because of changes in conditions, or that the degree of compliance with the policies or procedures may deteriorate. In our opinion, management's assertion that Norfolk Southern Corporation maintained effective internal control over financial reporting as of December 31, 2003 is fairly stated, in all material respects, based on criteria established in Internal Control—Integrated Framework issued by the Committee of Sponsoring Organizations of the Treadway Commission (COSO). /s/ KPMG LLP Norfolk, Virginia January 27, 2004

K43
Norfolk Southern Corporation And Subsidiaries Consolidated Statements of Income
Years ended December 31, 2003 2002 2001 ($ in millions, except earnings per share) Railway operating revenues $ 6,468 $ 6,270 $ 6,170 Railway operating expenses Compensation and benefits (Note 11) 2,275 2,022 2,014 Materials, services and rents 1,427 1,457 1,444 Conrail rents and services (Note 2) 419 412 421 Depreciation 513 515 514 Diesel fuel 380 342 412 Casualties and other claims 181 171 143 Other 209 193 215 Total railway operating expenses 5,404 5,112 5,163 Income from railway operations 1,064 1,158 1,007 Other income – net (Note 3) 19 66 99 Interest expense on debt (Note 6) (497) (518) (553) Income from continuing operations before income taxes and accounting changes 586 706 553 Provision for income taxes (Note 4) 175 246 191 Income from continuing operations before accounting changes 411 460 362 Discontinued operations – gain on sale of motor carrier, net of taxes (Note 17) 10 -- 13 Cumulative effect of changes in accounting principles, net of taxes (Note 1) 114 -- -- Net income $ 535 $ 460 $ 375 Earnings per share – basic and diluted (Note 14): Income from continuing operations before accounting changes $ 1.05 $ 1.18 $ 0.94 Discontinued operations 0.03 -- 0.03 Cumulative effect of changes in accounting principles 0.29 -- -- Net income $ 1.37 $ 1.18 $ 0.97 See accompanying notes to consolidated financial statements.
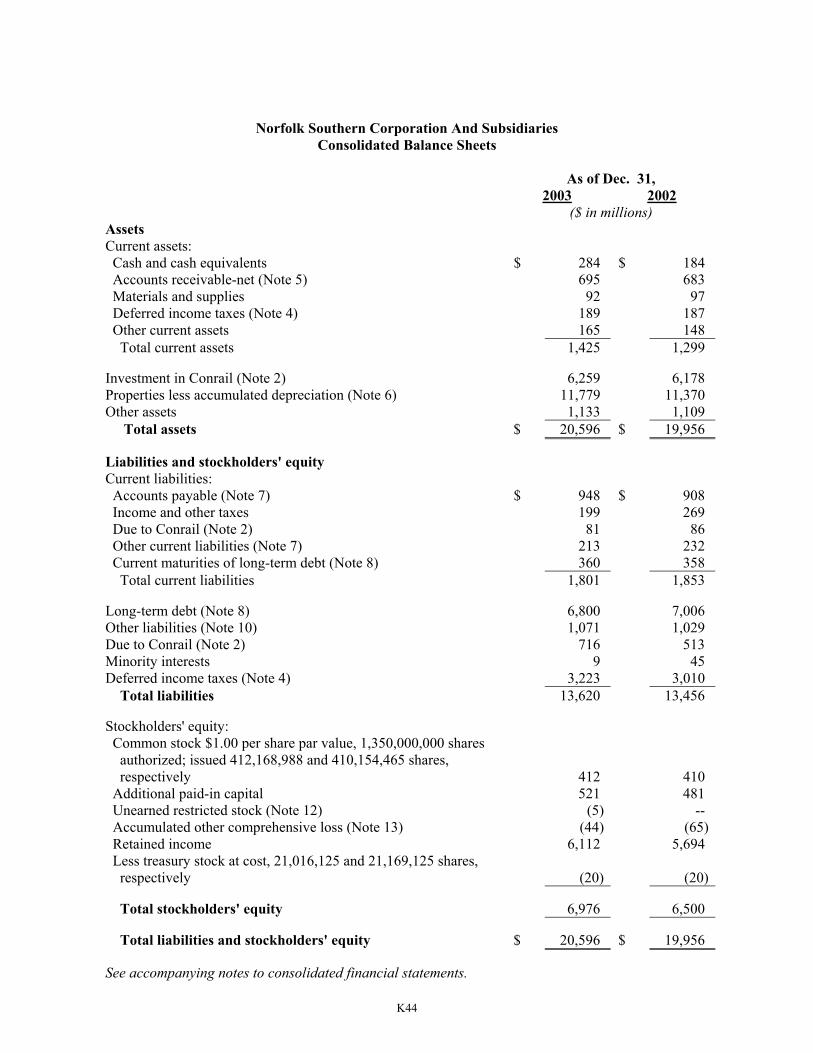
K44
Norfolk Southern Corporation And Subsidiaries Consolidated Balance Sheets
As of Dec. 31, 2003 2002 ($ in millions) Assets Current assets: Cash and cash equivalents $ 284 $ 184 Accounts receivable-net (Note 5) 695 683 Materials and supplies 92 97 Deferred income taxes (Note 4) 189 187 Other current assets 165 148 Total current assets 1,425 1,299 Investment in Conrail (Note 2) 6,259 6,178 Properties less accumulated depreciation (Note 6) 11,779 11,370 Other assets 1,133 1,109 Total assets $ 20,596 $ 19,956 Liabilities and stockholders' equity Current liabilities: Accounts payable (Note 7) $ 948 $ 908 Income and other taxes 199 269 Due to Conrail (Note 2) 81 86 Other current liabilities (Note 7) 213 232 Current maturities of long-term debt (Note 8) 360 358 Total current liabilities 1,801 1,853 Long-term debt (Note 8) 6,800 7,006 Other liabilities (Note 10) 1,071 1,029 Due to Conrail (Note 2) 716 513 Minority interests 9 45 Deferred income taxes (Note 4) 3,223 3,010 Total liabilities 13,620 13,456 Stockholders' equity: Common stock $1.00 per share par value, 1,350,000,000 shares authorized; issued 412,168,988 and 410,154,465 shares, respectively 412 410 Additional paid-in capital 521 481 Unearned restricted stock (Note 12) (5) -- Accumulated other comprehensive loss (Note 13) (44) (65) Retained income 6,112 5,694 Less treasury stock at cost, 21,016,125 and 21,169,125 shares, respectively
(20) (20)
Total stockholders' equity 6,976 6,500 Total liabilities and stockholders' equity $ 20,596 $ 19,956 See accompanying notes to consolidated financial statements.

K45
Norfolk Southern Corporation And Subsidiaries Consolidated Statements of Cash Flows
Years Ended Dec. 31, 2003 2002 2001 ($ in millions) Cash flows from operating activities Net income $ 535 $ 460 $ 375 Reconciliation of net income to net cash provided by operating activities: Net cumulative effects of changes in accounting principles (114) -- -- Depreciation 528 529 527 Deferred income taxes 132 178 44 Equity in earnings of Conrail (58) (54) (44) Gains and losses on properties and investments (45) (47) (59) Income from discontinued operations (10) -- (13) Changes in assets and liabilities affecting operations: Accounts receivable (Note 5) (12) (208) (74) Materials and supplies 5 (7) 1 Other current assets (4) 1 46 Current liabilities other than debt (25) 35 (27) Other – net (Notes 6 and 11) 122 (84) (122) Net cash provided by operating activities 1,054 803 654 Cash flows from investing activities Property additions (720) (689) (746) Property sales and other transactions 78 31 156 Investments, including short-term (106) (78) (99) Investment sales and other transactions 108 63 88 Net cash used for investing activities (640) (673) (601) Cash flows from financing activities Dividends (117) (101) (93) Common stock issued – net 13 42 14 Redemption of minority interest (43) -- -- Proceeds from borrowings 261 672 1,995 Debt repayments (428) (763) (1,765) Net cash provided by (used for) financing activities (314) (150) 151 Net increase (decrease) in cash and cash equivalents 100 (20) 204 Cash and cash equivalents At beginning of year 184 204 -- At end of year $ 284 $ 184 $ 204 Supplemental disclosure of cash flow information Cash paid during the year for: Interest (net of amounts capitalized) $ 510 $ 525 $ 550 Income taxes $ 93 $ 54 $ 74 See accompanying notes to consolidated financial statements.

K46
Norfolk Southern Corporation And Subsidiaries Consolidated Statements of Changes in Stockholders' Equity
Accum. Other Additional Compre- Unearned Common Paid-in hensive Restricted Retained Treasury Stock Capital Loss Stock Income Stock Total ($ in millions, except per share amounts) Balance Dec. 31, 2000 $ 405 $ 392 $ (6) $ -- $ 5,053 $ (20) $ 5,824 Comprehensive income Net income 375 375 Other comprehensive loss (Note 13) (49) (49) Total comprehensive income 326 Dividends on Common Stock, $0.24 per share (93) (93) Other (Notes 11 and 12) 2 31 33 Balance Dec. 31, 2001 407 423 (55) -- 5,335 (20) 6,090 Comprehensive income Net income 460 460 Other comprehensive loss (Note 13) (10) (10) Total comprehensive income 450 Dividends on Common Stock, $0.26 per share (101) (101) Other (Notes 11 and 12) 3 58 61 Balance Dec. 31, 2002 410 481 (65) -- 5,694 (20) 6,500 Comprehensive income Net income 535 535 Other comprehensive income (Note 13) 21 21 Total comprehensive income 556 Dividends on Common Stock, $0.30 per share (117) (117) Other (Notes 11 and 12) 2 40 (5) 37 Balance Dec. 31, 2003 $ 412 $ 521 $ (44) $ (5) $ 6,112 $ (20) $ 6,976 See accompanying notes to consolidated financial statements.

K47
NORFOLK SOUTHERN CORPORATION AND SUBSIDIARIES Notes to Consolidated Financial Statements
The following Notes are an integral part of the Consolidated Financial Statements. 1. Summary of Significant Accounting Policies Description of Business Norfolk Southern Corporation is a Virginia-based holding company engaged principally in the rail transportation business, operating approximately 21,500 route miles primarily in the East and Midwest. These consolidated financial statements include Norfolk Southern Corporation (Norfolk Southern) and its majority-owned and controlled subsidiaries (collectively, NS). Norfolk Southern's major subsidiary is Norfolk Southern Railway Company (NSR). All significant intercompany balances and transactions have been eliminated in consolidation. The railroad transports raw materials, intermediate products and finished goods classified in the following market groups (percent of total railway operating revenues in 2003): coal (23%); intermodal (19%); automotive (14%); chemicals (12%); metals/construction (11%); agriculture/consumer products/government (11%); and paper/clay/forest products (10%). Ultimate points of origination or destination for some of the freight (particularly coal bound for export and intermodal containers) are outside the United States. Approximately 85% of NS' railroad employees are covered by collective bargaining agreements with 14 different labor unions. Through a jointly owned entity, Norfolk Southern and CSX Corporation own the stock of Conrail Inc., which owns the major Northeast freight railroad. Norfolk Southern has a 58% economic and 50% voting interest in the jointly owned entity (see Note 2). Use of Estimates The preparation of financial statements in accordance with accounting principles generally accepted in the United States of America requires management to make estimates and assumptions that affect the reported amounts of assets and liabilities, the disclosure of contingent assets and liabilities at the date of the financial statements and the reported amounts of revenues and expenses during the reporting period. Management reviews its estimates, including those related to the recoverability and useful lives of assets, as well as liabilities for litigation, environmental remediation, casualty claims, income taxes, and pension and postretirement benefits. Changes in facts and circumstances may result in revised estimates. Cash Equivalents “Cash equivalents” are highly liquid investments purchased three months or less from maturity. Investments Marketable equity and debt securities are reported at amortized cost or fair value, depending upon their classification as securities “held-to-maturity,” “trading” or “available-for-sale.” Unrealized gains and losses for investments designated as “available-for-sale,” net of taxes, are recognized in “Accumulated other comprehensive loss.”

K48
Investments where NS has the ability to exercise significant influence over but does not control the entity are accounted for using the equity method in accordance with APB Opinion No. 18, “The Equity Method of Accounting for Investments in Common Stock.” Materials and Supplies “Materials and supplies,” consisting mainly of fuel oil and items for maintenance of property and equipment, are stated at the lower of average cost or market. The cost of materials and supplies expected to be used in capital additions or improvements is included in “Properties.” Properties “Properties” are stated principally at cost and are depreciated using group depreciation. Rail is depreciated primarily on the basis of use measured by gross ton-miles. Other properties are depreciated generally using the straight-line method over the lesser of estimated service or lease lives. NS capitalizes interest on major capital projects during the period of their construction. Expenditures, including those on leased assets that extend an asset's useful life or increase its utility, are capitalized. Maintenance expense is recognized when repairs are performed. When properties other than land and nonrail assets are sold or retired in the ordinary course of business, the cost of the assets, net of sale proceeds or salvage, is charged to accumulated depreciation rather than recognized through income. Gains and losses on disposal of land and nonrail assets are included in “Other income - net” (see Note 3). NS reviews the carrying amount of properties whenever events or changes in circumstances indicate that such carrying amount may not be recoverable based on future undiscounted cash flows or estimated net realizable value. Assets that are deemed impaired as a result of such review are recorded at the lower of carrying amount or fair value (see Note 6). Revenue Recognition Revenue is recognized proportionally as a shipment moves from origin to destination. Refunds are recorded as a reduction to revenues based on management's best estimate of projected liability. Derivatives NS does not engage in the trading of derivatives. NS uses derivative financial instruments to reduce the risk of volatility in its diesel fuel costs and in the management of its mix of fixed and floating-rate debt. Management has determined that these derivative instruments qualify as either fair-value or cash-flow hedges, having values that highly correlate with the underlying hedged exposures and have designated such instruments as hedging transactions. Income and expense related to the derivative financial instruments are recorded in the same category as generated by the underlying asset or liability. Credit risk related to the derivative financial instruments is considered to be minimal and is managed by requiring high credit standards for counterparties and periodic settlements. Stock-Based Compensation NS has stock-based employee compensation plans, which are more fully described in Note 12. NS applies the intrinsic value recognition and measurement principles of APB Opinion No. 25, “Accounting for Stock Issued to Employees” (APB Opinion No. 25), and related interpretations in accounting for these plans.

K49
The following table illustrates the effect on net income and earnings per share if NS had applied the fair value recognition provisions of Statement of Financial Accounting Standards No. 123, “Accounting for Stock-Based Compensation” (SFAS No. 123), to stock-based employee compensation:
2003 2002 2001 ($ in millions except per share) Net income, as reported $ 535 $ 460 $ 375 Add: Stock-based employee compensation expense included in reported net income, net of related tax effects 18 14 12 Deduct: Stock-based employee compensation expense determined under fair value method, net of related tax effects (35) (45) (29)Pro forma net income $ 518 $ 429 $ 358 Earnings per share: As reported – basic and diluted $ 1.37 $ 1.18 $ 0.97 Pro forma – basic and diluted $ 1.33 $ 1.10 $ 0.93
Required Accounting Changes NS adopted Financial Accounting Standards Board (FASB) Statement No. 143, “Accounting for Asset Retirement Obligations,” (SFAS No. 143) effective Jan. 1, 2003, and recorded a $110 million net adjustment ($182 million before taxes) for the cumulative effect of this change in accounting on years prior to 2003. Pursuant to SFAS No. 143, the cost to remove crossties must be recorded as an expense when incurred; previously these removal costs were accrued as a component of depreciation. This change in accounting lowered depreciation expense by about $26 million for 2003 (because the depreciation rate for crossties no longer reflects cost to remove) and increased compensation and benefits and other expenses by about $21 million for the year (for the costs to remove retired assets). NS also adopted FASB Interpretation No. 46, “Consolidation of Variable Interest Entities,” (FIN No. 46) effective Jan. 1, 2003, and recorded a $4 million net adjustment ($6 million before taxes) for the cumulative effect of this change in accounting on years prior to 2003. Pursuant to FIN No. 46, NS has consolidated a special-purpose entity that leases certain locomotives to NS (see Note 9). This entity’s assets and liabilities at Jan. 1, 2003, included $169 million of locomotives and $157 million of debt related to their purchase as well as a $6 million minority interest liability. This change in accounting increased depreciation and interest expense (to reflect the locomotives as owned assets) and lowered lease expense. The net effect to total railway operating expenses and net income was not material. Reclassifications Certain amounts in the consolidated financial statements and notes thereto have been reclassified to conform to the 2003 presentation. 2. Investment in Conrail and Operations Over Its Lines Overview Through a limited liability company, Norfolk Southern and CSX Corporation (CSX) jointly own Conrail Inc. (Conrail), whose primary subsidiary is Consolidated Rail Corporation (CRC), the major freight

K50
railroad in the Northeast. NS has a 58% economic and 50% voting interest in the jointly owned entity, and CSX has the remainder of the economic and voting interests. From time to time, Norfolk Southern and CSX, as the indirect owners of Conrail, may have to make capital contributions, loans or advances to Conrail under the terms of the Transaction Agreement among NS, CSX and Conrail. Norfolk Southern's railroad subsidiary, NSR, operates as a part of its rail system the routes and assets of Pennsylvania Lines LLC (PRR), a wholly owned subsidiary of CRC, pursuant to operating and lease agreements. CSX Transportation, Inc. (CSXT) operates the routes and assets of another CRC subsidiary under comparable terms. Operation of Conrail's Lines The June 1999 Operating Agreement between NSR and PRR governs substantially all track assets operated by NSR and has an initial 25-year term, renewable at the option of NSR for two five-year terms. Payments under the Operating Agreement are subject to adjustment every six years to reflect changes in values. NSR also has leased or subleased equipment for varying terms from PRR. Costs necessary to operate and maintain the PRR assets, including leasehold improvements, are borne by NSR. NSR receives all freight revenues on the PRR lines. NSR and CSXT also have entered into agreements with CRC governing other properties that continue to be owned and operated by CRC (the Shared Assets Areas). NSR and CSXT pay CRC a fee for joint and exclusive access to the Shared Assets Areas. In addition, NSR and CSXT pay, based on usage, the costs incurred by CRC to operate the Shared Assets Areas. Future minimum lease payments due to PRR under the Operating Agreement and lease agreements and to CRC under the Shared Assets Areas (SAA) agreements are as follows:
PRR Oper. PRR Lease SAA Agmt. Agmt. Agmts. ($ in millions) 2004 $ 238 $ 104 $ 322005 246 75 332006 246 61 342007 246 49 342008 246 44 342009 and subsequent years 4,039 89 551 Total $ 5,261 $ 422 $ 718
Operating lease expense related to the agreements, which is included in “Conrail rents and services,” amounted to $478 million in 2003, $468 million in 2002 and $467 million in 2001. Conrail Corporate Reorganization NS, CSX and Conrail are jointly seeking to reorganize Conrail and establish direct ownership and control by NSR and CSXT of PRR and NYC, respectively. The proposed reorganization would replace the operating agreements described above and allow NSR and CSXT to directly own and operate PRR and NYC, respectively. The reorganization would not involve the Shared Assets Areas, and would have no effect on the competitive rail service provided in the Shared Assets Areas. Conrail would continue to own, manage and operate the Shared Assets Areas as previously approved by the Surface Transportation Board (STB).

K51
Consummation of the reorganization requires a ruling from the Internal Revenue Service (IRS), the approval of the STB and filings with the Securities and Exchange Commission. In addition, NS, CSX and Conrail must obtain the consent of Conrail’s debt holders to carry out the transaction and will obtain a valuation of PRR and of NYC. In 2003, the IRS issued a ruling that the reorganization would qualify as a tax-free distribution. Also in 2003, the STB granted its authorization to carry out the reorganization, subject to a condition requiring NS, CSX and Conrail to either: (i) obtain the voluntary consent of the Conrail debt holders; or (ii) propose further proceedings to determine whether the terms offered to the Conrail debt holders are fair, just and reasonable. In 2004, NS, CSX and Conrail intend to file registration statements on Form S-4 with the Securities and Exchange Commission to allow a proposed exchange offer relating to Conrail’s unsecured debt (see below). In order to implement the reorganization approved by the IRS, the companies have engaged an investment banking firm to provide a valuation. The results of the valuation could impact NS’ carrying amount of its investment in Conrail and the recording of the corporate reorganization. As a part of the proposed reorganization, Conrail would undertake a restructuring of its existing unsecured and secured public indebtedness. There are currently two series of unsecured public debentures with an outstanding principal amount of $800 million and 13 series of secured debt with an outstanding principal amount of approximately $321 million. It is currently contemplated that guaranteed debt securities of two newly formed corporate subsidiaries of NSR and CSXT would be offered in a 58%/42% ratio in exchange for Conrail’s unsecured debentures. Upon completion of the proposed transaction, the new debt securities would become direct unsecured obligations of NSR and CSXT, respectively, and would rank equally with all existing and future senior unsecured debt obligations, if any, of NSR and CSXT. These new debt securities will have maturity dates, interest rates and principal and interest payment dates identical to those of the respective series of Conrail’s unsecured debentures. In addition, these new debt securities will have covenants substantially similar to those of the publicly traded debt securities of NS and CSX, respectively. Conrail’s secured debt and lease obligations will remain obligations of Conrail and are expected to be supported by new leases and subleases which, upon completion of the proposed transaction, would be the direct lease and sublease obligations of NSR or CSXT. NS, CSX and Conrail are diligently working to complete all steps necessary to consummate the Conrail corporate reorganization in 2004. Upon consummation of the proposed transaction, NS’ investment in Conrail will no longer include amounts related to PRR and NYC. Instead, the assets and liabilities of PRR will be reflected in their respective line items in NS’ Consolidated Balance Sheet, and any amounts due to PRR would be extinguished. Investment in Conrail NS is applying the equity method of accounting to its investment in Conrail in accordance with APB Opinion No. 18, “The Equity Method of Accounting for Investments in Common Stock.” NS is amortizing the excess of the purchase price over Conrail's net equity using the principles of purchase accounting, based primarily on the estimated remaining useful lives of Conrail's depreciable property and equipment, including the related deferred tax effect of the differences in tax and accounting bases for certain assets. At Dec. 31, 2003, the difference between NS' investment in Conrail and its share of Conrail's underlying net equity was $3.7 billion.

K52
NS' consolidated balance sheet at Dec. 31, 2003, includes $35 million of liabilities related to the Conrail transaction, principally for contractual obligations to Conrail employees imposed by the Surface Transportation Board when it approved the transaction. Through Dec. 31, 2003, NS had paid $168 million of such costs. Related-Party Transactions NS provides certain general and administrative support functions to Conrail, the fees for which are billed in accordance with several service-provider arrangements and totaled $7 million in 2003 and 2002 and $6 million in 2001. “Conrail rents and services” includes: (1) expenses for amounts due to PRR and CRC for use by NSR of operating properties and equipment and operation of the Shared Assets Areas and (2) NS' equity in the earnings of Conrail, net of amortization. A significant portion of payments made to PRR is borrowed back from a subsidiary of PRR. Previously, these loans were made under a demand note; however, in the first quarter of 2002, the subsidiary of PRR exchanged this demand note for a new note due in 2032. As a result, borrowings owed to the subsidiary of PRR now comprise the noncurrent balance “Due to Conrail.” The interest rate for these loans is variable and was 1.7% at Dec. 31, 2003. Upon consummation of the proposed reorganization, these loans would be extinguished. The current balance “Due to Conrail” at Dec. 31, 2003, is composed of amounts related to expenses included in “Conrail rents and services,” as discussed above. Summary Financial Information - Conrail The following historical cost basis financial information should be read in conjunction with Conrail's audited financial statements, included as Exhibit 99 to this Annual Report on Form 10-K. Summarized Consolidated Statements of Income - Conrail
Years Ended Dec. 31, 2003 2002 2001 ($ in millions) Operating revenues $ 918 $ 893 $ 903 Operating expenses 659 623 639 Operating income 259 270 264 Other – net (3) (10) (6) Income before income taxes 256 260 258 Provision for income taxes 93 80 84 Income before accounting change 163 180 174 Cumulative effect of change in accounting principle, net of taxes 40 -- -- Net income $ 203 $ 180 $ 174
Note: Conrail adopted SFAS No. 143, effective Jan. 1, 2003, and recorded a $40 million net adjustment for the cumulative effect of this change in accounting on years prior to 2003. NS excluded this amount from its determination of equity earnings of Conrail because an amount related to Conrail is included in NS’ cumulative effect adjustment for SFAS No. 143.

K53
Summarized Consolidated Balance Sheets - Conrail
As of Dec. 31, 2003 2002 ($ in millions) Assets: Current assets $ 257 $ 300 Noncurrent assets 7,959 7,857 Total assets $ 8,216 $ 8,157 Liabilities and stockholders' equity: Current maturities of long-term debt $ 58 $ 57 Other current liabilities 221 272 Long-term debt 1,067 1,123 Other noncurrent liabilities 2,416 2,479 Stockholders' equity 4,454 4,226 Total liabilities and stockholders equity $ 8,216 $ 8,157
Note: Current assets include amounts due from NS and CSX totaling $136 million at Dec. 31, 2003, and $158 million at Dec. 31, 2002. Noncurrent assets include amounts due from NS and CSX totaling $1,231 million at Dec. 31, 2003, and $892 million at Dec. 31, 2002. Current liabilities include amounts payable to NS and CSX totaling $5 million at Dec. 31, 2003, and $9 million at Dec. 31, 2002. 3. Other Income - Net
2003 2002 2001 ($ in millions)
Income from natural resources: Royalties from coal $ 39 $ 48 $ 52 Nonoperating depletion and depreciation (15) (14) (13) Subtotal 24 34 39 Gains from sale of properties and investments 45 47 59 Rental income 38 36 40 Corporate-owned life insurance – net 21 (1) 6 Interest income 10 12 15 Discount on sales of accounts receivable (Note 5) -- (4) (17)Impairment of telecommunications assets (Note 6) (84) -- -- Taxes on nonoperating property (8) (7) (11)Other interest expense (4) (31) 1 Charitable contributions (4) -- (4)Equity in earnings (losses) of partnerships -- (1) (8)Other (19) (19) (21) Total $ 19 $ 66 $ 99
“Other income - net” includes the income generated by the activities of NS' noncarrier subsidiaries as well as the costs incurred by those subsidiaries in their operations. “Other current assets” in the Consolidated Balance Sheets includes prepaid interest of $50 million at Dec. 31, 2003, and $46 million at Dec. 31, 2002, arising from corporate-owned life insurance borrowings.

K54
4. Income Taxes Provision for Income Taxes
2003 2002 2001 ($ in millions) Current: Federal $ 32 $ 61 $ 125 State 11 7 22 Total current taxes 43 68 147 Deferred: Federal 97 145 35 State 35 33 9 Total deferred taxes 132 178 44 Provision for income taxes $ 175 $ 246 $ 191
Reconciliation of Statutory Rate to Effective Rate Total income taxes as reflected in the Consolidated Statements of Income differ from the amounts computed by applying the statutory federal corporate tax rate as follows:
2003 2002 2001 Amount % Amount % Amount % ($ in millions) Federal income tax at statutory rate $ 205 35 $ 247 35 $ 194 35 State income taxes, net of federal tax benefit 30 5 26 4 20 4 Equity in earnings of Conrail (20) (3) (19) (3) (16) (3)Corporate-owned life insurance (8) (1) (1) -- (3) -- Other – net (32) (6) (7) (1) (4) (1) Provision for income taxes $ 175 30 $ 246 35 $ 191 35
Deferred Tax Assets and Liabilities Certain items are reported in different periods for financial reporting and income tax purposes. Deferred tax assets and liabilities are recorded in recognition of these differences.

K55
The tax effects of temporary differences that give rise to significant portions of the deferred tax assets and deferred tax liabilities are as follows:
December 31, 2003 2002 ($ in millions) Deferred tax assets: Reserves, including casualty and other claims $ 194 $ 178 Employee benefits -- 26 Retiree health and death benefit obligations 157 138 Taxes, including state and property 240 234 Other 37 16 Total gross deferred tax assets 628 592 Less valuation allowance (22) (24) Net deferred tax asset 606 568 Deferred tax liabilities: Property (3,466) (3,300) Employee benefits (8) -- Other (166) (91) Total gross deferred tax liabilities (3,640) (3,391) Net deferred tax liability (3,034) (2,823) Net current deferred tax asset 189 187 Net long-term deferred tax liability $ (3,223) $ (3,010)
Except for amounts for which a valuation allowance has been provided, management believes that it is more likely than not that future taxable income will support the realization of the other deferred tax assets. The total valuation allowance decreased $2 million in 2003 and increased $6 million in both 2002 and 2001. Internal Revenue Service (IRS) Reviews Consolidated federal income tax returns have been examined and Revenue Agent Reports have been received for all years up to and including 1999. The favorable resolution of prior years’ audits is reflected in the “Other – net” line of the reconciliation of statutory rate to the effective rate, as shown above, and for 2003 comprised most of that line item. The consolidated federal income tax returns for 2000 and 2001 are being audited by the IRS. In addition, the 1998 through 2001 federal income tax returns of a tax credit investment affiliate in which NS owns a minority interest are being audited by the IRS. Management believes that adequate provision has been made for any additional taxes and interest thereon that might arise as a result of IRS examinations. 5. Accounts Receivable Since May 2000, NS has sold, through a bankruptcy-remote special purpose subsidiary, undivided ownership interests in a pool of accounts receivable. The buyers have a priority collection interest in the entire pool of receivables and, as a result, NS has retained credit risk to the extent the pool of receivables exceeds the amount sold. NS services and collects the receivables on behalf of the buyers; however, no servicing asset or liability has been recognized because the benefits of servicing are estimated to be just

K56
adequate to compensate NS for its responsibilities. Payments collected from sold receivables can be reinvested in new accounts receivable on behalf of the buyers. Should NS' credit rating drop below investment grade, the buyers have the right to discontinue this reinvestment. No accounts receivable have been sold under this arrangement since the third quarter of 2003. At Dec. 31, 2002, $30 million of accounts receivable were sold, and therefore not included in “Accounts receivable, net” on the Consolidated Balance Sheets. NS' retained interest, which is included in “Accounts receivable, net,” is recorded at fair value using estimates of dilution based on NS' historical experience. These estimates are adjusted regularly based on NS' actual experience with the pool, including defaults and credit deterioration. NS has historically experienced very low levels of default. The fees associated with sales, which are based on the buyers' financing costs, are included in “Other income – net” (see Note 3). NS' allowance for doubtful accounts was $7 million at Dec. 31, 2003, and $5 million at Dec. 31, 2002. 6. Properties
December 31, Depreciation 2003 2002 Rate for 2003 ($ in millions) Railway property: Road $ 11,243 $ 10,859 2.7% Equipment 5,779 5,573 4.2%Other property 569 655 3.0% 17,591 17,087 Less accumulated depreciation (5,812) (5,717) Net properties $ 11,779 $ 11,370
Railway property includes $477 million at Dec. 31, 2003 and $480 million at Dec. 31, 2002, of assets recorded pursuant to capital leases. Other property includes the costs of obtaining rights to natural resources of $341 million at Dec. 31, 2003 and 2002. Impairment of Telecommunications Assets In 2003, NS recorded an $84 million non-cash reduction in the carrying value of certain telecommunications assets to recognize their impaired value in accordance with the provisions of SFAS No. 144, “Accounting for the Impairment or Disposal of Long-Lived Assets.” NS’ subsidiary, Thoroughbred Technology and Telecommunications (T-Cubed), developed fiber optic infrastructure with companies in the telecommunications industry. This industry has been in a severe downturn and, accordingly, T-Cubed monitored the carrying amount of these assets through independent fair market value appraisals. As a result of a deterioration in the long-term prospects for these assets, an updated appraisal obtained in the fourth quarter indicated a significant decline in their value. Capitalized Interest Total interest cost incurred on debt in 2003, 2002 and 2001 was $509 million, $529 million and $570 million, respectively, of which $12 million, $11 million and $17 million was capitalized.

K57
7. Current Liabilities
December 31, 2003 2002 ($ in millions) Accounts payable: Accounts and wages payable $ 491 $ 446 Casualty and other claims 218 207 Vacation liability 113 117 Equipment rents payable – net 103 116 Other 23 22 Total $ 948 $ 908 Other current liabilities: Interest payable $ 104 $ 118 Retiree health and death benefit obligations (Note 11) 38 31 Liabilities for forwarded traffic 37 34 Accrued Conrail-related costs (Note 2) 21 34 Other 13 15 Total $ 213 $ 232
8. Long-term Debt
December 31, 2003 2002 ($ in millions) Notes at average rates and maturities as follows: 7.17%, maturing 2004 to 2008 $ 1,790 $ 1,840 7.09%, maturing 2009 to 2011 1,000 1,200 8.10%, maturing 2017 to 2021 800 800 7.54%, maturing 2027 to 2031 1,500 1,500 7.05%, maturing 2037 717 717 7.90%, maturing 2097 350 350 Equipment obligations at an average rate of 3.8%, maturing to 2014 636 558 Capitalized leases at an average rate of 1.7%, maturing to 2023 274 306 Other debt at an average rate of 6.2%, maturing to 2019 118 122 Discounts and premiums, net (25) (29) Total long-term debt 7,160 7,364 Less current maturities (360) (358) Long-term debt excluding current maturities $ 6,800 $ 7,006 Long-term debt maturities subsequent to 2004 are as follows: 2005 $ 509 2006 302 2007 866 2008 472 2009 and subsequent years 4,651 Total $ 6,800

K58
Each holder of a 2037 note may require NS to redeem all or part of the note at face value, plus accrued and unpaid interest, on May 1, 2004. Should it be necessary, NS has the ability and intent to refinance such notes properly presented. The railroad equipment obligations and the capitalized leases are secured by liens on the underlying equipment. Certain lease obligations require the maintenance of yen-denominated deposits, which are pledged to the lessor to satisfy yen-denominated lease payments. These deposits are included in “Other assets” on the balance sheet and totaled $96 million at Dec. 31, 2003, and $86 million at Dec. 31, 2002. Shelf Registration NS filed on Form S-3 a shelf registration statement with the Securities and Exchange Commission covering the issuance of up to $1 billion of securities. As of Dec. 31, 2003, NS had issued a total of $550 million of notes under this shelf registration. Commercial Paper and Credit Agreement NS has the ability to issue commercial paper backed by a $1 billion credit agreement that expires in 2006. At Dec. 31, 2003, and Dec. 31, 2002, NS had no commercial paper outstanding. Any borrowings under the credit agreement are contingent on the continuing effectiveness of the representations and warranties made at the inception of the agreement. Debt Covenants NS is subject to various financial covenants with respect to its debt and under its credit agreement, including a minimum net worth requirement, a maximum leverage ratio restriction and certain restrictions on issuance of further debt. At Dec. 31, 2003, NS was in compliance with all debt covenants. 9. Lease Commitments NS is committed under long-term lease agreements, which expire on various dates through 2067, for equipment, lines of road and other property. The following amounts do not include payments to PRR under the Operating Agreement and lease agreements or to CRC under the SAA agreements (see Note 2). Future minimum lease payments and operating lease expense, other than to PRR and CRC, are as follows:
Operating Capital Leases Leases ($ in millions) 2004 $ 111 $ 47 2005 94 48 2006 70 43 2007 61 41 2008 48 14 2009 and subsequent years 453 113 Total $ 837 $ 306 Less imputed interest on capital leases at an average rate of 7.0% (32) Present value of minimum lease payments included in debt $ 274

K59
Operating Lease Expense
2003 2002 2001 ($ in millions) Minimum rents $ 130 $ 140 $ 149Contingent rents 63 60 55 Total $ 193 $ 200 $ 204
During 2000, NS entered into an operating lease for 140 locomotives, which is renewable annually at NS' option, has a maximum term of eight years and includes purchase options. The lessor is a special-purpose entity whose activities are limited to those incident to this particular transaction. As discussed in Note 1 under the heading “Required Accounting Changes,” NS has consolidated this entity for reporting purposes as of Jan. 1, 2003. For the periods prior to consolidation, the table above includes operating lease expense related to this lease of $13 million in 2002 and $18 million in 2001. If NS does not renew the lease during the eight-year period or does not purchase the locomotives at the end of the maximum lease term, it is liable for any shortfall in the then fair value of the locomotives and a specified residual value. NS does not expect to be required to make any payments under this provision. As of Dec. 31, 2003, the maximum liability under this provision, assuming NS chose not to renew the lease in 2004 and the then fair value of the locomotives was zero, would be $106 million. 10. Other Liabilities December 31, 2003 2002 ($ in millions) Retiree health and death benefit obligations (Note 11) $ 321 $ 286Casualty and other claims 270 254Deferred compensation 143 144Net pension obligations (Note 11) 89 82Accrued Conrail-related costs (Note 2) 14 26Other 234 237 Total $ 1,071 $ 1,029
11. Pensions and Other Postretirement Benefits Norfolk Southern and certain subsidiaries have both funded and unfunded defined benefit pension plans covering principally salaried employees. Norfolk Southern and certain subsidiaries also provide specified health care and death benefits to eligible retired employees and their dependents. Under the present plans, which may be amended or terminated at NS' option, a defined percentage of health care expenses is covered, reduced by any deductibles, copayments, Medicare payments and, in some cases, coverage provided under other group insurance policies. Pension Plan Asset Management Eleven investment firms manage the Company’s defined benefit pension plan’s assets under investment guidelines approved by the Board of Directors. Investments are restricted to domestic fixed income securities, a limited amount of international fixed income securities, domestic and international equity

K60
investments and unleveraged exchange-traded options and financial futures. Limitations restrict investment concentration and use of certain derivative instruments. Fixed income investments must have an average rating of “AA” or better and all fixed income securities must be rated “A” or better except bond index funds. Equity investments must be in liquid securities listed on national exchanges. No investment is permitted in the securities of Norfolk Southern Corporation or its subsidiaries (except through commingled pension trust funds). Investment managers’ returns are expected to exceed selected market indices by prescribed margins. The target asset allocation range for equity is between 65% and 75% of the fund’s assets, with approximately 10% of the fund’s assets allocated to international equity investments. The asset allocation on Dec. 31, 2003, was 25% in fixed income investments and 75% in equity investments, including 9% in international equities. This compared to 33%, 67% and 9%, respectively, on Dec. 31, 2002. The plan’s assumed future returns are based principally on the asset allocation and on the historic returns for the plan’s asset classes determined from both actual plan returns and, over longer time periods, market returns for those asset classes. As of Dec. 31, 2003, the plan had assets of $1.72 billion and a current pension obligation of $1.49 billion. Voluntary Separation Program Compensation and benefits expense in 2003 includes $107 million of costs related to a voluntary separation program undertaken in the fourth quarter. Through the program, 553 nonagreement employees were separated from service, of which 314 retired under Norfolk Southern’s retirement plan. The costs include $66 million for separation payments and other benefits of the program and $41 million of costs related to the pension and other benefit plans. Medicare Changes The Medicare Prescription Drug, Improvement, and Modernization Act of 2003 (the Act) was signed into law in December 2003. The Act introduces a new prescription drug benefit under Medicare (Medicare Part D) as well as a federal subsidy to sponsors of retiree health care benefit plans that provide a benefit that is at least actuarially equivalent to Medicare Part D. Norfolk Southern believes that its medical plan’s prescription drug benefit will qualify as actuarially equivalent to Medicare Part D based on a review by the plan’s external prescription drug administrator of the plan’s prescription drug benefit compared with the prescription drug benefit that would be paid under Medicare Part D beginning in 2006. Norfolk Southern has elected to take into account these legislative changes in the measurement of its postretirement benefit obligations in accordance with Financial Accounting Standards Board Staff Position No. 106-1. This resulted in a $45 million decrease in the end-of-year benefit obligation with a corresponding decline in the unrecognized actuarial loss for 2003. There was no effect on the net benefit cost in 2003; however, the effects of the Act will be reflected in the net benefit cost in 2004 and subsequent years. Specific authoritative guidance on the accounting for the Act’s subsidy is pending, and that guidance, when issued, could require Norfolk Southern to change information previously reported herein.
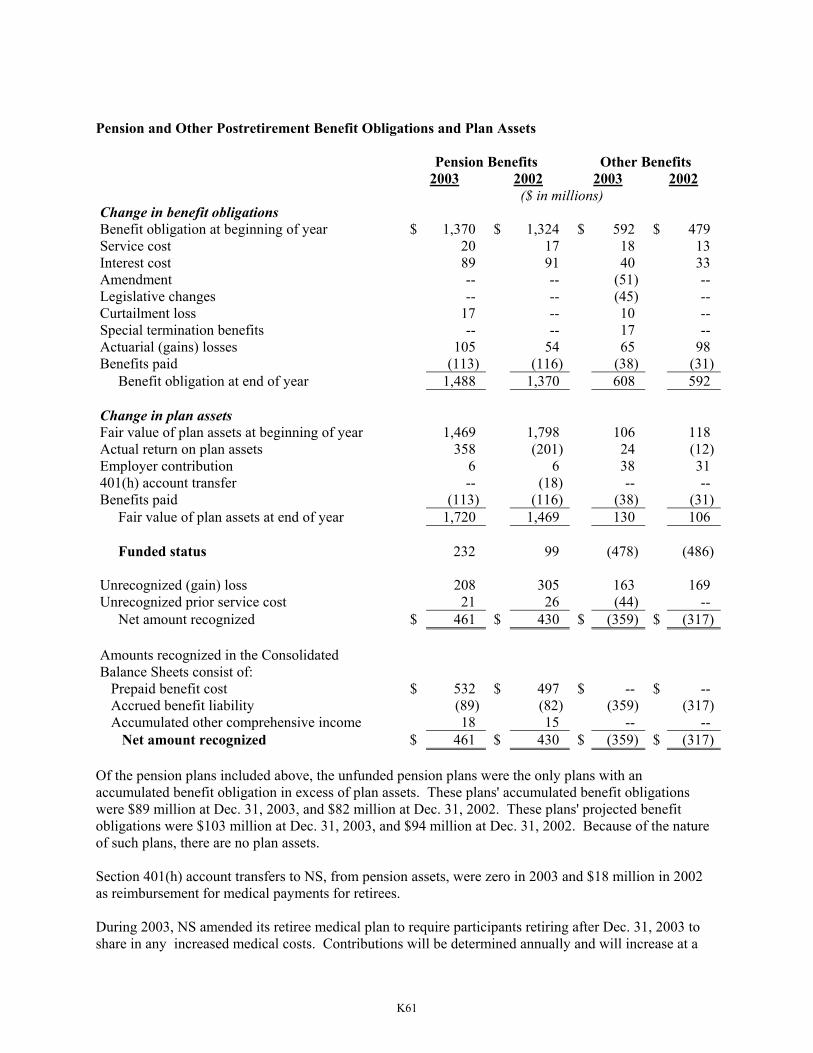
K61
Pension and Other Postretirement Benefit Obligations and Plan Assets Pension Benefits Other Benefits 2003 2002 2003 2002 ($ in millions) Change in benefit obligations Benefit obligation at beginning of year $ 1,370 $ 1,324 $ 592 $ 479 Service cost 20 17 18 13 Interest cost 89 91 40 33 Amendment -- -- (51) -- Legislative changes -- -- (45) -- Curtailment loss 17 -- 10 -- Special termination benefits -- -- 17 -- Actuarial (gains) losses 105 54 65 98 Benefits paid (113) (116) (38) (31) Benefit obligation at end of year 1,488 1,370 608 592 Change in plan assets Fair value of plan assets at beginning of year 1,469 1,798 106 118 Actual return on plan assets 358 (201) 24 (12)Employer contribution 6 6 38 31 401(h) account transfer -- (18) -- -- Benefits paid (113) (116) (38) (31) Fair value of plan assets at end of year 1,720 1,469 130 106 Funded status 232 99 (478) (486) Unrecognized (gain) loss 208 305 163 169 Unrecognized prior service cost 21 26 (44) -- Net amount recognized $ 461 $ 430 $ (359) $ (317) Amounts recognized in the Consolidated Balance Sheets consist of:
Prepaid benefit cost $ 532 $ 497 $ -- $ -- Accrued benefit liability (89) (82) (359) (317) Accumulated other comprehensive income 18 15 -- -- Net amount recognized $ 461 $ 430 $ (359) $ (317)
Of the pension plans included above, the unfunded pension plans were the only plans with an accumulated benefit obligation in excess of plan assets. These plans' accumulated benefit obligations were $89 million at Dec. 31, 2003, and $82 million at Dec. 31, 2002. These plans' projected benefit obligations were $103 million at Dec. 31, 2003, and $94 million at Dec. 31, 2002. Because of the nature of such plans, there are no plan assets. Section 401(h) account transfers to NS, from pension assets, were zero in 2003 and $18 million in 2002 as reimbursement for medical payments for retirees. During 2003, NS amended its retiree medical plan to require participants retiring after Dec. 31, 2003 to share in any increased medical costs. Contributions will be determined annually and will increase at a

K62
rate similar to that of active nonagreement employees. The amendment decreased the retiree medical benefit obligation by $51 million. Pension and Other Postretirement Benefit Costs Components
2003 2002 2001 ($ in millions) Pension benefits Service cost $ 20 $ 17 $ 15 Interest cost 89 91 94 Curtailment loss 17 -- -- Expected return on plan assets (158) (179) (202)Amortization of prior service cost 5 4 4 Amortization of initial net asset -- -- (3)Recognized net actuarial gains (losses) 2 (13) (24) Net benefit $ (25) $ (80) $ (116) Other postretirement benefits Service cost $ 18 $ 13 $ 14 Interest cost 40 33 33 Curtailment loss 10 -- -- Special termination benefits 17 -- -- Expected return on plan assets (12) (13) (13)Amortization of prior service cost (7) -- -- Amortization of unrecognized losses 14 -- -- Net cost $ 80 $ 33 $ 34
Pension Assumptions Pension and other postretirement benefit costs are determined based on actuarial valuations that reflect appropriate assumptions as of the measurement date, ordinarily the beginning of each year. The funded status of the plans is determined using appropriate assumptions as of each year end. A summary of the major assumptions follows:
2003 2002 2001Funded status: Discount rate 6.25% 6.75% 7.25% Future salary increases 4.5% 4.5% 5%Pension cost: Discount rate 6.75% 7.25% 7.50% Return on assets in plans 9% 9% 10% Future salary increases 4.5% 5% 5%
Health Care Cost Trend Assumptions For measurement purposes, increases in the per capita cost of covered health care benefits were assumed to be 9% for 2004 and 8% for 2005. It is assumed the rate will decrease gradually to an ultimate rate of 5% for 2008 and remain at that level thereafter.

K63
Assumed health care cost trend rates have a significant effect on the amounts reported in the financial statements. To illustrate, a one-percentage-point change in the assumed health care cost trend would have the following effects:
One percentage point Increase Decrease ($ in millions) Increase (decrease) in: Total service and interest cost components $ 8 $ (7) Postretirement benefit obligation $ 65 $ (47)
Contributions for Pension and Other Postretirement Benefits NS expects to contribute approximately $7 million to its pension plans and $42 million to its other postretirement benefit plans in 2004. Other Postretirement Coverage Under collective bargaining agreements, NS and certain subsidiaries participate in a multi-employer benefit plan, which provides certain postretirement health care and life insurance benefits to eligible union employees. Premiums under this plan are expensed as incurred and amounted to $18 million in 2003, $11 million in 2002 and $10 million in 2001. Section 401(k) Plans Norfolk Southern and certain subsidiaries provide Section 401(k) savings plans for employees. Under the plans, NS matches a portion of employee contributions, subject to applicable limitations. Since 1999, NS has contributed newly issued shares of Common Stock for its matching contributions. NS' expenses under these plans were $12 million in 2003, $12 million in 2002 and $11 million in 2001. 12. Stock-Based Compensation Under the stockholder-approved Long-Term Incentive Plan (LTIP), a committee of nonemployee directors of the Board may grant stock options, stock appreciation rights (SARs), restricted shares and performance share units (PSUs), up to a maximum of 88,025,000 shares of Norfolk Southern Common Stock (Common Stock). Of these shares, 5,000,000 were approved by the Board for issuance to non-officer participants; as a broadly based issuance, stockholder approval was not required. Under the Board-approved Thoroughbred Stock Option Plan (TSOP), the committee may grant stock options up to a maximum of 6,000,000 shares of Common Stock. Options may be granted for a term not to exceed 10 years, but may not be exercised prior to the first anniversary of the date of grant. Options are exercisable at the fair market value of Common Stock on the date of grant. The LTIP also permits the payment – on a current or a deferred basis and in cash or in stock – of dividend equivalents on shares of Common Stock covered by options or PSUs in an amount commensurate with dividends paid on Common Stock. Tax absorption payments also are authorized in amounts estimated to equal the federal and state income taxes applicable to shares of Common Stock issued subject to a share retention agreement.

K64
Accounting Method As disclosed in Note 1, NS applies APB Opinion 25 and related interpretations in accounting for awards made under the plans. Accordingly, grants of PSUs, restricted shares, dividend equivalents, tax absorption payments and SARs result in charges to net income, while grants of stock options have no effect on net income. Related compensation costs were $29 million in 2003, $23 million in 2002 and $20 million in 2001. NS recognized additional paid-in capital of $2 million in 2003, $6 million in 2002 and $1 million in 2001 related to the tax benefit generated by stock option exercises. Note 1 includes a table that illustrates the effect on net income and earnings per share had NS applied the fair value recognition provisions of SFAS No. 123 to stock-based employee compensation. The pro forma amounts include compensation costs calculated using the Black-Scholes option-pricing model, with average expected option lives of five years; average risk-free interest rates of 2.8% in 2003, 4.6% in 2002 and 5.1% in 2001; average stock-price volatilities of 33% in 2003, 32% in 2002 and 39% in 2001; and dividend yields of zero in 2003, zero in 2002 and 2% in 2001. These assumptions produced per-share grant-date fair values of $6.60 in 2003, $8.26 in 2002 and $5.48 in 2001. Stock Option Activity
Weighted Average Option Shares Exercise Price Balance 12/31/00 28,120,950 $ 24.96 Granted 6,985,000 15.48 Exercised (1,079,902) 16.58 Expired (612,525) 26.51 Balance 12/31/01 33,413,523 $ 23.21 Granted 7,384,000 22.49 Exercised (2,851,538) 17.48 Expired (287,341) 26.73 Balance 12/31/02 37,658,644 $ 23.47 Granted 5,700,000 19.63 Exercised (781,610) 16.13 Expired (863,219) 24.37 Balance 12/31/03 41,713,815 $ 23.07
Of the total options outstanding at Dec. 31, 2003, 36 million were vested and have a weighted-average exercise price of $23.61.

K65
Stock Options Outstanding
Number Weighted AverageExercise Price Outstanding Remaining
Range Weighted Average at 12/31/03 Contractual Life$15.48-$16.94 $16.27 11,568,474 6.5 years 19.63-22.49 21.21 14,070,100 7.9 years 24.31-27.69 26.84 7,658,250 3.7 years 29.46-33.25 32.09 8,416,991 4.4 years
$15.48-$33.25 $23.07 41,713,815 6.1 years Performance Share Units PSUs provide for awards based on achievement of certain predetermined corporate performance goals at the end of a three-year cycle. PSU grants and average grant-date fair market values were 946,000 and $19.63 in 2003; 815,000 and $22.49 in 2002; and 817,500 and $15.48 in 2001. PSUs may be paid in the form of shares of Common Stock, cash or any combination thereof. Shares earned and issued may be subject to share retention agreements and held by NS for up to five years. Restricted Shares 420,000 restricted shares were granted in 2003, with a grant-date fair market value of $19.63 and a three-year restriction period. At Dec. 31, 2003, the balance of unearned compensation was $5 million relating to 391,800 restricted shares. Shares Available and Issued Shares of stock available for future grants and issued in connection with all features of the LTIP and TSOP are as follows:
2003 2002 2001Available for future grants 12/31: LTIP 17,994,726 23,645,146 30,816,365 TSOP 2,737,200 2,568,200 2,535,000 Shares of Common Stock issued: LTIP 1,412,749 2,917,898 1,146,346 TSOP -- -- --

K66
13. Stockholders' Equity Accumulated Other Comprehensive Loss “Accumulated other comprehensive loss” reported in the Consolidated Statements of Changes in Stockholders' Equity consisted of the following:
Balance Net Balance at Beginning Gain Reclassification at End of Year (Loss) Adjustments of Year ($ in millions) December 31, 2003 Unrealized gains on securities $ 1 $ (1) $ -- $ -- Cash flow hedges 18 46 (36) 28 Minimum pension liability (84) 12 -- (72) Accumulated other comprehensive loss $ (65) $ 57 $ (36) $ (44) December 31, 2002 Unrealized gains on securities $ 6 $ -- $ (5) $ 1 Cash flow hedges (11) 35 (6) 18 Minimum pension liability (50) (34) -- (84) Accumulated other comprehensive loss $ (55) $ 1 $ (11) $ (65)

K67
“Other comprehensive income (loss)” reported in the Consolidated Statements of Changes in Stockholders' Equity consisted of the following:
Tax Pretax (Expense) Net-of-Tax Amount Benefit Amount ($ in millions) Year ended Dec. 31, 2003 Net gain (loss) arising during the year: Cash flow hedges $ 75 $ (29) $ 46 Reclassification adjustments for gains included in net income (59) 23 (36) Subtotal 16 (6) 10 Unrealized gains (losses) on securities (1) -- (1) Minimum pension liability 11 1 12 Other comprehensive income (loss) $ 26 $ (5) $ 21 Year ended Dec. 31, 2002 Net gain (loss) arising during the year: Cash flow hedges $ 58 $ (23) $ 35 Reclassification adjustments for gains included in net income (10) 4 (6) Subtotal 48 (19) 29 Reclassification adjustments for realized gains on securities included in net income (9) 4 (5) Minimum pension liability (34) -- (34) Other comprehensive income (loss) $ 5 $ (15) $ (10) Year ended Dec. 31, 2001 Net gain (loss) arising during the year: Cash flow hedges $ (27) $ 11 $ (16) Reclassification adjustments for gains included in Net income 8 (3) 5 Subtotal (19) 8 (11) Unrealized gains (losses) on securities (1) -- (1) Minimum pension liability (35) (2) (37) Other comprehensive income (loss) $ (55) $ 6 $ (49)
In 2003, 2002 and 2001, Conrail recorded a $25 million gain, a $59 million loss and a $70 million loss, respectively, in other comprehensive income (loss) related to its minimum pension liability. NS' “Other comprehensive income (loss)” includes a $14 million gain for 2003, a $34 million loss for 2002 and a $41 million loss for 2001, arising from the Conrail adjustments.

K68
Undistributed Earnings of Equity Investees “Retained income” includes undistributed earnings of equity investees, principally attributable to NS' equity in the earnings of Conrail, of $455 million at Dec. 31, 2003; $375 million at Dec. 31, 2002; and $355 million at Dec. 31, 2001. 14. Earnings Per Share The following table sets forth the calculation of basic and diluted earnings per share: 2003 2002 2001 ($ in millions except per share, shares in millions) Income available to common stockholders for basic and diluted computations $ 535 $ 460 $ 375 Basic earnings per share: Weighted-average shares outstanding 390 388 385 Basic earnings per share $ 1.37 $ 1.18 $ 0.97 Diluted earnings per share: Weighted-average shares outstanding per above 390 388 385 Dilutive effect of outstanding options, PSUs and restricted shares (as determined by the application of the treasury stock method) 2 2 1 Adjusted weighted-average shares outstanding 392 390 386 Diluted earnings per share $ 1.37 $ 1.18 $ 0.97 These calculations exclude options for which the exercise price exceeded the average market price of Common Stock as follows: 28 million in 2003, 24 million in 2002 and 21 million in 2001. There are no adjustments to “Net income” or “Income from continuing operations” for the diluted earnings per share computations. 15. Fair Values of Financial Instruments The fair values of “Cash and cash equivalents,” “Short-term investments,” “Accounts receivable” and “Accounts payable” approximate carrying values because of the short maturity of these financial instruments. The fair value of corporate-owned life insurance approximates carrying value. The carrying amounts and estimated fair values for the remaining financial instruments, excluding derivatives (see Note 16) and investments accounted for under the equity method in accordance with APB Opinion No. 18, consisted of the following at Dec. 31:
2003 2002 Carrying Fair Carrying Fair Amount Value Amount Value ($ in millions) Investments $ 32 $ 40 $ 30 $ 39 Notes receivable 93 105 93 104 Long-term debt (7,160) (8,101) (7,364) (8,412)

K69
Quoted market prices were used to determine the fair value of marketable securities; underlying net assets were used to estimate the fair value of other investments. The fair values of notes receivable are based on future discounted cash flows. The fair values of debt were estimated based on quoted market prices or discounted cash flows using current interest rates for debt with similar terms, company rating and remaining maturity. Carrying amounts of marketable securities reflect unrealized holding gains of $1 million on Dec. 31, 2003 and 2002. Sales of “available-for-sale” securities were immaterial for the years ended Dec. 31, 2003, 2002 and 2001. 16. Derivative Financial Instruments On Jan. 1, 2001, NS adopted Statement of Financial Accounting Standards No. 133, “Accounting for Derivative Instruments and Hedging Activities” (SFAS No. 133), as amended by Statement of Financial Accounting Standards No. 138, “Accounting for Certain Derivative Instruments and Certain Hedging Activities” (SFAS No. 138). The Statements establish accounting and reporting standards for derivative instruments and hedging activities, requiring that all derivatives be recognized in the financial statements as either assets or liabilities and that they be measured at fair value. Changes in fair value are recorded as adjustments to the assets or liabilities being hedged in “Other comprehensive income,” or in current earnings, depending on whether the derivative is designated and qualifies for hedge accounting, the type of hedge transaction represented and the effectiveness of the hedge. NS uses derivative financial instruments to reduce the risk of volatility in its diesel fuel costs and to manage its overall exposure to fluctuations in interest rates. NS does not engage in the trading of derivatives. Management has determined that its derivative financial instruments qualify as either fair-value or cash-flow hedges, having values that highly correlate with the underlying hedged exposures, and has designated such instruments as hedging transactions. Credit risk related to the derivative financial instruments is considered to be minimal and is managed by requiring high credit standards for counterparties and periodic settlements. Diesel Fuel Hedging In the second quarter of 2001, NS began a program to hedge a portion of its diesel fuel consumption. The intent of the program is to assist in the management of NS' aggregate risk exposure to fuel price fluctuations, which can significantly affect NS' operating margins and profitability. In order to minimize this risk, NS instituted a continuous hedging strategy for a portion of its estimated future fuel needs by entering into a series of swaps in order to lock in the purchase prices of some of its diesel fuel. Management has designated these derivative instruments as cash-flow hedges of the exposure to variability in expected future cash flows attributable to fluctuations in diesel fuel prices. Following is a summary of NS' diesel fuel swaps:
2003 2002 Number of swaps entered into during the year 286 288 Approximate number of gallons hedged (millions) 374 393 Approximate average price per gallon of Nymex No. 2 heating oil $0.76 $0.66 2004 2005 2006 Percent of estimated future diesel fuel consumption covered as of Dec. 31, 2003 63% 22% --

K70
Hedges are placed each month by competitive bid among selected counterparties. The goal of this hedging strategy is to average fuel costs over an extended period of time while minimizing the incremental cost of hedging. The program provides that NS will not enter into any fuel hedges with a duration of more than 36 months, and that no more than 80% of NS' average monthly fuel consumption will be hedged for each month within any 36-month period. Diesel fuel costs represented 7%, 7% and 8% of NS' operating expenses for the years ended Dec. 31, 2003, 2002 and 2001, respectively. In 2001, NS also purchased eight monthly call options at a strike price of 84 cents per gallon of Nymex No. 2 heating oil. The cost of the monthly options, which expired serially through Dec. 31, 2001, was amortized as a component of diesel fuel expense. Because the price of diesel fuel did not reach the strike price at any time during the period the options were outstanding, NS did not record any benefit related to these transactions. NS' fuel hedging activity resulted in a net decrease in 2003 diesel fuel expenses of $59 million, a net decrease in 2002 diesel fuel expense of $10 million and a net increase in 2001 diesel fuel expense of $8 million. Ineffectiveness related to the use of diesel fuel hedges in 2003, 2002 and 2001 was less than $1 million for each year. Interest Rate Hedging NS manages its overall exposure to fluctuations in interest rates by issuing both fixed and floating-rate debt instruments, and by entering into interest rate hedging transactions. NS had $186 million, or 2.8%, and $220 million, or 3.2%, of its fixed rate debt portfolio hedged at Dec. 31, 2003, and Dec. 31, 2002, respectively, using interest rate swaps that qualify for and are designated as fair-value hedge transactions. These swaps have been effective in hedging the changes in fair value of the related debt arising from changes in interest rates and, accordingly, there has been no impact on earnings resulting from ineffectiveness associated with these derivative transactions. Fair Values The fair values of NS' diesel fuel derivative instruments at Dec. 31, 2003 and 2002, were determined based upon current fair market values as quoted by third party dealers. Fair values of interest rate swaps were determined based upon the present value of expected future cash flows discounted at the appropriate implied spot rate from the spot rate yield curve. Fair value adjustments are noncash transactions and, accordingly, are excluded from the Consolidated Statement of Cash Flows. “Accumulated other comprehensive loss,” a component of “Stockholders' equity,” included $40 million (pretax) at Dec. 31, 2003, and $29 million (pretax) at Dec. 31, 2002, both relating to an increase in the fair value of derivative fuel hedging transactions that will terminate within 12 months. The asset and liability positions of NS' outstanding derivative financial instruments were as follows:
December 31, 2003 2002 ($ in millions) Interest rate hedges: Gross fair market asset position $ 16 $ 24 Gross fair market (liability) position -- --Fuel hedges: Gross fair market asset position 45 29 Gross fair market (liability) position -- -- Total net asset (liability) position $ 61 $ 53

K71
17. Discontinued Operations - Motor Carrier On March 28, 1998, NS sold all the common stock of North American Van Lines, Inc. (NAVL), its motor carrier subsidiary. Results in 2003 include an additional after-tax gain of $10 million, or 3 cents per share, that resulted from resolution of tax issues related to the transaction. Results in 2001 include an additional after-tax gain of $13 million, or 3 cents per share, that resulted from the expiration of certain indemnities contained in the sales agreement. 18. Commitments and Contingencies Lawsuits Norfolk Southern and certain subsidiaries are defendants in numerous lawsuits and other claims relating principally to railroad operations. When management concludes that it is probable that a liability has been incurred and the amount of the liability can be reasonably estimated, it is accrued through a charge to expenses. While the ultimate amount of liability incurred in any of these lawsuits and claims is dependent on future developments, in management's opinion, the recorded liability is adequate to cover the future payment of such liability. However, the final outcome of any of these lawsuits and claims cannot be predicted with certainty, and unfavorable or unexpected outcomes could result in accrual adjustments that could be significant to results of operations in a particular year or quarter. Any adjustments to the recorded liability will be reflected in expenses in the periods in which such adjustments are known. Casualty Claims NS is generally self-insured for casualty claims. Claims in excess of self-insurance levels are insured up to excess coverage limits. The casualty claims liability is determined actuarially, based upon claims filed and an estimate of claims incurred but not yet reported. While the ultimate amount of claims incurred is dependent on future developments, in management's opinion, the recorded liability is adequate to cover the future payments of claims. However, it is possible that the recorded liability may not be adequate to cover the future payment of claims. Adjustments to the recorded liability will be reflected in operating expenses in the periods in which such adjustments are known. Environmental Matters NS is subject to various jurisdictions' environmental laws and regulations. It is NS' policy to record a liability where such liability or loss is probable and its amount can be estimated reasonably. Claims, if any, against third parties for recovery of cleanup costs incurred by NS are reflected as receivables in the balance sheet and are not netted against the associated NS liability. Environmental engineers regularly participate in ongoing evaluations of all identified sites and in determining any necessary adjustments to initial liability estimates. NS also has established an Environmental Policy Council, composed of senior managers, to oversee and interpret its environmental policy. NS' balance sheets included liabilities for environmental exposures in the amount of $25 million at Dec. 31, 2003, and $29 million at Dec. 31, 2002, (of which $8 million was accounted for as a current liability in each year). At Dec. 31, 2003, the liability represented NS' estimate of the probable cleanup and remediation costs based on available information at 113 identified locations. On that date, 10 sites accounted for $12 million of the liability, and no individual site was considered to be material. NS anticipates that much of this liability will be paid out over five years; however, some costs will be paid out over a longer period.
K72
At some of the 113 locations, certain NS subsidiaries, usually in conjunction with a number of other parties, have been identified as potentially responsible parties by the Environmental Protection Agency (EPA) or similar state authorities under the Comprehensive Environmental Response, Compensation and Liability Act of 1980, or comparable state statutes, which often impose joint and several liability for cleanup costs. With respect to known environmental sites (whether identified by NS or by the EPA or comparable state authorities), estimates of NS' ultimate potential financial exposure for a given site or in the aggregate for all such sites are necessarily imprecise because of the widely varying costs of currently available cleanup techniques, the likely development of new cleanup technologies, the difficulty of determining in advance the nature and full extent of contamination and each potential participant's share of any estimated loss (and that participant's ability to bear it), and evolving statutory and regulatory standards governing liability. The risk of incurring environmental liability is inherent in the railroad business. Some of the commodities in NS' traffic mix, particularly those classified as hazardous materials, can pose special risks that NS and its subsidiaries work diligently to minimize. In addition, several NS subsidiaries own, or have owned, land used as operating property, or which is leased and operated by others, or held for sale. Because environmental problems may exist on these properties that are latent or undisclosed, there can be no assurance that NS will not incur environmentally related liabilities or costs with respect to one or more of them, the amount and materiality of which cannot be estimated reliably at this time. Moreover, lawsuits and claims involving these and potentially other unidentified environmental sites and matters are likely to arise from time to time. The resulting liabilities could have a significant effect on NS’ financial condition, results of operations or liquidity in a particular year or quarter. However, based on its assessment of the facts and circumstances now known, management believes that it has recorded the probable costs for dealing with those environmental matters of which the Corporation is aware. Further, management believes that it is unlikely that any identified matters, either individually or in the aggregate, will have a material adverse effect on NS' financial position, results of operations or liquidity. Purchase Commitments NSR had outstanding purchase commitments of approximately $166 million in connection with its 2004 capital program. In addition, Norfolk Southern has committed to purchase telecommunications services totaling $30 million through 2006. Change-In-Control Arrangements Norfolk Southern has compensation agreements with officers and certain key employees that become operative only upon a change in control of the Corporation, as defined in those agreements. The agreements provide generally for payments based on compensation at the time of a covered individual's involuntary or other specified termination and for certain other benefits. Guarantees In a number of instances, NS and its subsidiaries have agreed to indemnify lenders for additional costs they may bear as a result of certain changes in laws or regulations applicable to their loans. Such changes may include impositions or modifications with respect to taxes, duties, reserves, liquidity, capital adequacy, special deposits, and similar requirements relating to extensions of credit by, deposits with, or the assets or liabilities of such lenders. Similar provisions exist in NS' accounts receivable sales program.

K73
The nature and timing of changes in laws or regulations applicable to NS' financings are inherently unpredictable, and therefore NS' exposure in connection with the foregoing indemnifications cannot be quantified. No liability has been recorded related to these indemnifications. In the case of one type of equipment financing, NSR's Japanese leveraged leases, NSR may terminate the leases and ancillary agreements if such a change-in-law indemnity is triggered. Such a termination would require NSR to make early termination payments that would not be expected to have a material adverse effect on NS' financial condition, results of operations or liquidity. NS has indemnified parties in a number of transactions for U.S. income tax withholding imposed as a result of changes in U.S. tax law. In all cases, NS has the right to unwind the related transaction if the withholding cannot be avoided in the future. Because these indemnities would be triggered and are dependent upon a change in the tax law, the maximum exposure is not quantifiable. Management does not believe that it is likely that it will be required to make any payments under these indemnities. NS has outstanding warranty liabilities primarily related to work performed at its locomotive facilities. NS has recorded a reserve of $1 million as of Dec. 31, 2003, and less than $2 million as of Dec. 31, 2002 for these warranties. As of Dec. 31, 2003, certain Norfolk Southern subsidiaries are contingently liable as guarantors with respect to $8 million of indebtedness of an entity in which they have an ownership interest, the Terminal Railroad Association of St. Louis, due in 2019. Six other railroads are also jointly and severally liable as guarantors for this indebtedness. No liability has been recorded related to this guaranty. NS is liable for any shortfall in the then fair market value of certain leased locomotives and a specified residual value for the locomotives if the leases are not renewed, as discussed in Note 9.

K74
NORFOLK SOUTHERN CORPORATION AND SUBSIDIARIES QUARTERLY FINANCIAL DATA
Three Months Ended March 31 June 30 Sept. 30 Dec. 31 (In millions of dollars, except per share amounts) 2003 Railway operating revenues $ 1,561 $ 1,633 $ 1,598 $ 1,676 Income from railway operations 231 298 311 224**Income from continuing operations before accounting changes 85 137 137 52** Net income 209* 137 137 52**Earnings per share – basic and diluted: Income from continuing operations before accounting changes 0.22 0.35 0.35 0.13** Net income 0.54* 0.35 0.35 0.13** 2002 Railway operating revenues $ 1,498 $ 1,593 $ 1,598 $ 1,581 Income from railway operations 237 322 311 288 Net income 86 119 126 129 Earnings per share - basic and diluted $ 0.22 $ 0.31 $ 0.32 $ 0.33 * Includes a $114 million, or 29 cents per share, increase related to required accounting changes (see Note 1 on page K47), and a $10 million, or 3 cents per share, gain from discontinued operations (see Note 17 on page K71). ** Includes a $107 million pre-tax charge for a voluntary separation program (see Note 11 on page K59), which reduced net income by $66 million or 17 cents per share. Also includes an $84 million impairment charge (see Note 6 on page K56), which reduced net income by $53 million or 13 cents per share. Item 9. Changes in and Disagreements with Accountants on Accounting and Financial Disclosure. None. Item 9A. Controls and Procedures. (a) Evaluation of Disclosure Controls and Procedures.
Norfolk Southerns’ Chief Executive Officer and Chief Financial Officer have evaluated the effectiveness of NS' disclosure controls and procedures (as such term is defined in Rules 13a-15(e) and 15d-15(e) under the Securities Exchange Act of 1934, as amended (the “Exchange Act”)) as of December 31, 2003. Based on such evaluation, such officers have concluded that, as of December 31, 2003, NS' disclosure controls and procedures are effective in alerting them on a timely basis to material information relating to NS (including its consolidated subsidiaries) required to be included in NS' periodic filings under the Exchange Act.

K75
(b) Changes in Internal Controls.
During the fourth quarter of 2003, management has not identified any changes in NS' internal controls over financial reporting that have materially affected, or are reasonably likely to materially affect, NS’ internal controls over financial reporting.
PART III
NORFOLK SOUTHERN CORPORATION AND SUBSIDIARIES (NS) Item 10. Directors and Executive Officers of the Registrant. In accordance with General Instruction G(3), information called for by Item 10, Part III, is incorporated herein by reference from the information appearing under the caption “Election of Directors,” under the subcaptions “Committees” (including the information appearing under “Audit Committee”) and “Corporate Governance” under the caption “Board of Directors;” and under the caption “Section 16(a) Beneficial Ownership Reporting Compliance” in Norfolk Southern's definitive Proxy Statement, for the Norfolk Southern Annual Meeting of Stockholders to be held on May 13, 2004, which definitive Proxy Statement will be filed electronically with the Commission pursuant to Regulation 14A. The information regarding executive officers called for by Item 401 of Regulation S-K is included in Part I hereof beginning under “Executive Officers of the Registrant.” Item 11. Executive Compensation. In accordance with General Instruction G(3), information called for by Item 11, Part III, is incorporated herein by reference from the information appearing under the subcaption “Compensation” under the caption “Board of Directors” for directors and under the caption “Executive Compensation” for executives, including the information appearing in the “Summary Compensation Table” and under the subcaptions “Long-Term Incentive Plan” (including the three tables therein), “Pension Plans” (including the table therein), and “Change in Control Arrangements” in Norfolk Southern's definitive Proxy Statement, for the Norfolk Southern Annual Meeting of Stockholders to be held on May 13, 2004, which definitive Proxy Statement will be filed electronically with the Commission pursuant to Regulation 14A. Item 12. Security Ownership of Certain Beneficial Owners and Management and Related Stockholder Matters. In accordance with General Instruction G(3), information called for by Item 12, Part III, is incorporated herein by reference from the information appearing under the caption “Beneficial Ownership of Stock” in Norfolk Southern's definitive Proxy Statement, for the Norfolk Southern Annual Meeting of Stockholders to be held on May 13, 2004, which definitive Proxy Statement will be filed electronically with the Commission pursuant to Regulation 14A.

K76
Equity Compensation Plan Information (as of Dec. 31, 2003)
Number of securities remaining available
Number of
securities
Weighted-average for future issuance
under equity to be issued upon exercise price compensation plans exercise of of outstanding (excluding
Plan outstanding options, options, warrants securities reflected category warrants and rights and rights in column (a))
(a) (b) (c) Equity compensation plans approved by security holders1 36,024,515 23.114 17,994,7266
Equity compensation plans not approved by security holders2 8,262,8003 22.913,5 3,282,2007
Total 44,287,315 23.07 21,276,926 1 The Long-Term Incentive Plan, excluding five million shares for broad-based issuance to non-officers. 2 The Long-Term Incentive Plan's five million shares for broad-based issuance to non-officers, the Thoroughbred Stock Option Plan, the Directors' Restricted Stock Plan and the Safety Incentive Plan. 3 Includes options and performance share units granted under the Long-Term Incentive Plan on five million shares for non-officers and options granted under the Thoroughbred Stock Option Plan. 4 Calculated without regard to 2,328,500 outstanding performance share units. 5 Calculated without regard to 245,000 outstanding performance share units. 6 Of the shares remaining available for grant under plans approved by stockholders, 4,239,000 are available for grant as restricted shares or performance shares under the Long-Term Incentive Plan. 7 Of the shares remaining available for grant under plans not approved by stockholders, 39,000 are available for grant as restricted stock under the Directors' Restricted Stock Plan and 456,706 are available for grant as stock under the Safety Incentive Plan.
Norfolk Southern Corporation Long-Term Incentive Plan (“LTIP”) Established on June 28, 1983, and approved by the stockholders at their Annual Meetings on May 10, 1984, on May 11, 1995, and most recently on May 10, 2001, LTIP was adopted to promote the success of Norfolk Southern by providing an opportunity for officers and other key employees to acquire a proprietary interest in the Corporation. On January 23, 2001, the Board of Directors approved the issuance of an additional 5,000,000 shares of authorized but unissued Common Stock under LTIP to participants who are not officers of Norfolk Southern. The issuance of these shares was broadly-based, and stockholder approval of these shares was not required. Accordingly, this portion of LTIP is included in the number of securities available for future issuance for plans not approved by stockholders. The Board also adopted an amended plan effective January 23, 2001, subject to stockholder approval, which included the reservation for issuance of an additional 30,000,000 shares of authorized but unissued Norfolk Southern Common Stock, with no more than 6 million of such additional shares to be awarded as restricted shares or performance shares (including performance share units earned as performance shares). This amended plan was approved by stockholders on May 10, 2001, resulting in an aggregate of 74,878,604 shares of Common Stock authorized for issuance under LTIP. Non-employee directors, officers and other key employees residing in the United States or Canada are eligible for selection to receive LTIP awards. Under LTIP, the Performance-Based Compensation

K77
Committee (Committee) may grant incentive stock options, nonqualified stock options, stock appreciation rights, restricted shares and performance share units (in addition, dividend equivalents may be awarded for options and performance share units). The Committee may establish such terms and conditions for the awards as provided in the plan. For options, the option price per share will not be less than 100% of the fair market value of Norfolk Southern's Common Stock on the effective date the option is granted. All options are subject to a vesting period of at least one year, and the term of the option will not exceed ten years. LTIP specifically prohibits option repricing without stockholder approval, except for capital adjustments. Performance share units are performance-based awards which are earned upon achievement of goals the Committee establishes at the time of the grant for three equally weighted performance criteria approved by the stockholders -- return on average invested capital, operating ratio, and total return to NS stockholders as compared with the total return on all stocks comprising the S&P 500 Composite Stock Price Index -- and the units may be payable as shares of Norfolk Southern Common Stock or in cash. Norfolk Southern Corporation Thoroughbred Stock Option Plan The Board adopted the Norfolk Southern Corporation Thoroughbred Stock Option Plan (“TSOP”) on January 26, 1999, to promote the success of Norfolk Southern by providing an opportunity for nonagreement employees to acquire a proprietary interest in Norfolk Southern and thereby to provide an additional incentive to nonagreement employees to devote their maximum efforts and skills to the advancement, betterment, and prosperity of Norfolk Southern and its stockholders. The plan has not been approved by stockholders. Six million shares of authorized but unissued Common Stock were reserved for issuance under TSOP. Active full-time nonagreement employees residing in the United States or Canada are eligible for selection to receive TSOP awards. Under TSOP, the Compensation Committee of the Board of Directors may grant nonqualified stock options and may establish such terms and conditions as provided in the plan. The option price per share will not be less than 100% of the fair market value of Norfolk Southern's Common Stock on the effective date the option is granted. All options are subject to a vesting period of at least one year, and the term of the option will not exceed ten years. TSOP specifically prohibits option repricing without stockholder approval, except for capital adjustments. Norfolk Southern Corporation Directors' Restricted Stock Plan The Norfolk Southern Corporation Directors' Restricted Stock Plan (“Plan”) was adopted on January 1, 1994, and is designed to increase ownership of Norfolk Southern's Common Stock by its non-employee directors so as to further align their ownership interest in Norfolk Southern with that of stockholders. The Plan has not been approved by stockholders. Currently, a maximum of 66,000 shares of Corporation Common Stock may be granted under the Plan. To make the grants to eligible directors, Norfolk Southern purchases, through one or more subsidiary companies, the number of shares required in open-market transactions at prevailing market prices, or makes such grants from Common Stock already owned by one or more of Norfolk Southern's subsidiary companies. Only non-employee directors, who are not and never have been employees of Norfolk Southern, are eligible to participate in the Plan. Upon becoming a director, each eligible director receives a one-time grant of 3,000 restricted shares of Norfolk Southern Common Stock. No individual member of the Board exercises discretion concerning the eligibility of any director or the number of shares granted.

K78
The restriction period begins on the date of the grant and ends on the earlier of six months after the eligible director ceases to be a director by reason of disability, retirement or death. Directors will forfeit the right to receive the restricted shares if they cease to serve as a director of Norfolk Southern for reasons other than their disability, retirement or death. Norfolk Southern Corporation Safety Incentive Plan The Norfolk Southern Corporation Safety Incentive Plan (“SIP”) is designed to provide an additional incentive for eligible agreement employees to work safely. Under the plan, eligible employees who work without injury during the year receive a safety award whose equivalent value is between five and eight shares of Norfolk Southern Common Stock. Awards for the 2003 calendar year were payable in shares of Norfolk Southern Common Stock. SIP was amended effective Jan. 1, 2004, to provide for safety awards for calendar years beginning on or after Jan.1, 2004, to be made in the form of stock units payable in cash on the date of the award, so shares of Norfolk Southern Common Stock will no longer be awarded. SIP is broadly-based and has not been approved by stockholders. Shares of Common Stock issued under its terms are not registered under the Securities Act of 1933, pursuant to a no-action letter issued by the Securities and Exchange Commission on November 20, 1992. Accordingly, SIP does not define a specific amount of authorized shares for issuance under the plan. The Board approved using up to 500,000 authorized but unissued shares for awards under the plan, and the number of shares remaining under this authorization are included in the number of securities available for future issuance for plans not approved by shareholders. Item 13. Certain Relationships and Related Transactions. In accordance with General Instruction G(3), information called for by Item 13, Part III, is incorporated herein by reference from the information appearing under the caption “Certain Relationships and Related Transactions” in Norfolk Southern's definitive Proxy Statement, for the Norfolk Southern Annual Meeting of Stockholders to be held on May 13, 2004, which definitive Proxy Statement will be filed electronically with the Commission pursuant to Regulation 14A. Item 14. Principal Accountant Fees and Services. In accordance with General Instruction G(3), information called for by Item 14, Part III is incorporated herein by reference from the information appearing under the caption “Ratification of Appointment of Independent Public Accountants” in Norfolk Southern’s definitive Proxy Statement, for the Norfolk Southern Annual Meeting of Stockholders to be held on May 13, 2004, which definitive proxy statement will be filed electronically with the Commission pursuant to Regulation 14A.

K79
PART IV
NORFOLK SOUTHERN CORPORATION AND SUBSIDIARIES (NS)
Item 15. Exhibits, Financial Statement Schedule and Reports on Form 8-K.
Page (A) The following documents are filed as part of this report: 1. Index to Consolidated Financial Statements Independent Auditors' Report K41 Independent Accountants’ Report on Internal Control Over Financial Reporting K42 Consolidated Statements of Income, Years ended Dec. 31, 2003, 2002 and 2001 K43 Consolidated Balance Sheets As of Dec. 31, 2003 and 2002 K44 Consolidated Statements of Cash Flows, Years ended Dec. 31, 2003, 2002
and 2001 K45 Consolidated Statements of Changes in Stockholders' Equity, Years ended Dec. 31, 2003, 2002 and 2001 K46 Notes to Consolidated Financial Statements K47 2. Financial Statement Schedule: The following consolidated financial statement schedule should be read in connection with the consolidated financial statements: Index to Consolidated Financial Statement Schedule Page Schedule II - Valuation and Qualifying Accounts K88 Schedules other than the one listed above are omitted either because they are not
required or are inapplicable, or because the information is included in the consolidated financial statements or related notes.
3. Exhibits Exhibit Number Description
3 Articles of Incorporation and Bylaws - 3(i) The Restated Articles of Incorporation of Norfolk Southern Corporation are incorporated By reference to Exhibit 3(i) to Norfolk Southern Corporation's 10-K filed on March 5, 2001. 3(ii) The Bylaws of Norfolk Southern Corporation, as amended November 25, 2003, are filed herewith.

K80
4 Instruments Defining the Rights of Security Holders, Including Indentures: (a) Indenture, dated as of January 15, 1991, from Norfolk Southern Corporation to First Trust
of New York, National Association, as Trustee, related to the issuance of notes in the principal amount of $750 million, incorporated by reference to Exhibit 4.1 to Norfolk Southern Corporation's Registration Statement on Form S-3 (No. 33-38595).
(b) First Supplemental Indenture, dated May 19, 1997, between Norfolk Southern Corporation
and First Trust of New York, National Association, as Trustee, related to the issuance of notes in the principal amount of $4.3 billion, is incorporated herein by reference to Exhibit 1.1(d) to Norfolk Southern Corporation’s Form 8-K filed on May 21, 1997.
(c) Second Supplemental Indenture, dated April 26, 1999, between Norfolk Southern
Corporation and U.S. Bank Trust National Association, as Trustee, related to the issuance of notes in the principal amount of $400 million, is incorporated herein by reference to Exhibit 1.1(c) to Norfolk Southern Corporation’s Form 8-K filed on April 30, 1999.
(d) Third Supplemental Indenture, dated May 23, 2000, between Norfolk Southern
Corporation and U.S. Bank Trust National Association, as Trustee, related to the issuance of notes in the principal amount of $600 million, is incorporated herein by reference to Exhibit 4.1 to Norfolk Southern Corporation's Form 8-K filed on May 25, 2000.
(e) Fourth Supplemental Indenture, dated as of February 6, 2001, between Norfolk Southern
Corporation and U.S. Bank Trust National Association, as Trustee, related to the issuance of notes in the principal amount of $1 billion, is incorporated herein by reference to Exhibit 4.1 to Norfolk Southern Corporation's Form 8-K filed on February 7, 2001.
(f) Fifth Supplemental Indenture, dated as of July 5, 2001, between Norfolk Southern
Corporation and U.S. Bank Trust National Association, as Trustee, related to the issuance of notes in the principal amount of $250 million, is incorporated herein by reference to Exhibit 4.1 to Norfolk Southern Corporation's Form 8-K filed on July 5, 2001.
(g) Rights Agreement, dated as of September 26, 2000, between Norfolk Southern Corporation
and The Bank of New York, with exhibits thereto, is incorporated herein by reference to Exhibit 4 to Norfolk Southern Corporation's Form 8-K filed on September 26, 2000.
(h) Sixth Supplemental Indenture, dated as of April 30, 2002, between Norfolk Southern
Corporation and U.S. Bank Trust National Association, as Trustee, relating to the issuance of notes in the principal amount of $200 million, is incorporated herein by reference to Exhibit 4.1 to Norfolk Southern Corporation's Form 8-K filed on May 1, 2002.
(i) Seventh Supplemental Indenture, dated as of April 30, 2002, between Norfolk Southern
Corporation and U.S. Bank Trust National Association, as Trustee, relating to the issuance of notes in the principal amount of $100 million, is incorporated herein by reference to Exhibit 4.1 to Norfolk Southern Corporation's Form 8-K filed on May 1, 2002.

K81
(j) Amendment to Rights Agreement, dated as of November 26, 2002, between Norfolk Southern Corporation and The Bank of New York, with exhibits thereto, is incorporated by reference to Exhibit 4 to Norfolk Southern Corporation's Form 8-K filed on November 26, 2002.
In accordance with Item 601(b)(4)(iii) of Regulation S-K, copies of other instruments of
Norfolk Southern Corporation and its subsidiaries with respect to the rights of holders of long-term debt are not filed herewith, or incorporated by reference, but will be furnished to the Commission upon request.
10 Material Contracts - (a) The Transaction Agreement, dated as of June 10, 1997, by and among CSX, CSX
Transportation, Inc., Registrant, Norfolk Southern Railway Company, Conrail Inc., Consolidated Rail Corporation and CRR Holdings LLC, with certain schedules thereto, previously filed, is incorporated herein by reference to Exhibit 10(a) to Norfolk Southern Corporation’s Form 10-K filed on February 24, 2003.
(b) Amendment No. 1, dated as of August 22, 1998, to the Transaction Agreement, dated as of
June 10, 1997, by and among CSX Corporation, CSX Transportation, Inc., Norfolk Southern Corporation, Norfolk Southern Railway Company, Conrail Inc., Consolidated Rail Corporation and CRR Holdings LLC is incorporated herein by reference from Exhibit 10.1 to Norfolk Southern Corporation's Form 10-Q filed on August 11, 1999.
(c) Amendment No. 2, dated as of June 1, 1999, to the Transaction Agreement, dated June 10,
1997, by and among CSX Corporation, CSX Transportation, Inc., Norfolk Southern Corporation, Norfolk Southern Railway Company, Conrail Inc., Consolidated Rail Corporation and CRR Holdings LLC is incorporated herein by reference from Exhibit 10.2 to Norfolk Southern Corporation's Form 10-Q filed on August 11, 1999.
(d) Operating Agreement, dated as of June 1, 1999, by and between Pennsylvania Lines LLC
and Norfolk Southern Railway Company is incorporated herein by reference from Exhibit 10.3 to Norfolk Southern Corporation's Form 10-Q filed on August 11, 1999.
(e) Amendment No. 1, dated as of September 29, 2001, to Operating Agreement, dated as of
June 1, 1999, by and between Pennsylvania Lines LLC and Norfolk Southern Railway Company, is incorporated herein by reference from Exhibit 10(e) to Norfolk Southern Corporation's Form 10-K filed on February 21, 2002.
(f) Shared Assets Area Operating Agreement for North Jersey, dated as of June 1, 1999, by
and among Consolidated Rail Corporation, CSX Transportation, Inc. and Norfolk Southern Railway Company, with exhibit thereto, is incorporated herein by reference from Exhibit 10.4 to Norfolk Southern Corporation's Form 10-Q filed on August 11, 1999.
(g) Shared Assets Area Operating Agreement for South Jersey/ Philadelphia, dated as of June
1, 1999, by and among Consolidated Rail Corporation, CSX Transportation, Inc. and Norfolk Southern Railway Company, with exhibit thereto, is incorporated herein by reference from Exhibit 10.5 to Norfolk Southern Corporation's Form 10-Q filed on August 11, 1999.

K82
(h) Shared Assets Area Operating Agreement for Detroit, dated as of June 1, 1999, by and among Consolidated Rail Corporation, CSX Transportation, Inc. and Norfolk Southern Railway Company, with exhibit thereto, is incorporated herein by reference from Exhibit 10.6 to Norfolk Southern Corporation's Form 10-Q filed on August 11, 1999.
(i) Amendment No. 1, dated as of June 1, 2000, to the Shared Assets Areas Operating
Agreement for North Jersey, South Jersey/Philadelphia and Detroit, dated as of June 1, 1999, by and among Consolidated Rail Corporation, CSX Transportation, Inc. and Norfolk Southern Railway Company, with exhibit thereto, is incorporated herein by reference to Exhibit 10(h) to Norfolk Southern Corporation's 10-K filed on March 5, 2001.
(j) Amendment No. 2, dated as January 1, 2001, to the Shared Assets Area Operating
Agreements for North Jersey, South Jersey/Philadelphia and Detroit, dated as of June 1, 1999, by and among Consolidated Rail Corporation, CSX Transportation, Inc. and Norfolk Southern Railway Company, with exhibit thereto, is incorporated herein by reference to Exhibit 10(j) to Norfolk Southern Corporation's Form 10-K filed on February 21, 2002.
(k) Amendment No. 3, dated as of June 1, 2001, and executed in May of 2002, to the Shared
Assets Area Operating Agreement for North Jersey, South Jersey/Philadelphia and Detroit, dated as of June 1, 1999, by and among Consolidated Rail Corporation, CSX Transportation, Inc. and Norfolk Southern Railway Company, with exhibit thereto, is incorporated herein by reference to Exhibit 10(k) to Norfolk Southern Corporation’s Form 10-K filed on February 24, 2003.
(l) Monongahela Usage Agreement, dated as of June 1, 1999, by and among CSX
Transportation, Inc., Norfolk Southern Railway Company, Pennsylvania Lines LLC and New York Central Lines LLC, with exhibit thereto, is incorporated herein by reference from Exhibit 10.7 to Norfolk Southern Corporation's Form 10-Q filed on August 11, 1999.
(m) The Agreement, entered into as of July 27, 1999, between North Carolina Railroad
Company and Norfolk Southern Railway Company, is incorporated herein by reference from Exhibit 10(i) to Norfolk Southern Corporation's Form 10-K filed on March 6, 2000.
(n) The Supplementary Agreement, entered into as of January 1, 1987, between the Trustees of
the Cincinnati Southern Railway and The Cincinnati, New Orleans and Texas Pacific Railway Company (the latter a wholly owned subsidiary of Norfolk Southern Railway Company) - extending and amending a Lease, dated as of October 11, 1881 - is incorporated by reference to Exhibit 10(k) to Norfolk Southern Corporation's Form 10-K filed on March 5, 2001.
(o) The Norfolk Southern Corporation Executive Management Incentive Plan, effective
January 25, 2000, is incorporated by reference herein from Exhibit 10(1) to Norfolk Southern Corporation's Form 10-K filed on March 6, 2000.
(p) The Norfolk Southern Corporation Long-Term Incentive Plan, as amended effective
January 28, 2003, is incorporated herein by reference to Exhibit 10(p) to Norfolk Southern Corporation’s Form 10-K filed on February 24, 2003.

K83
(q) The Norfolk Southern Corporation Officers' Deferred Compensation Plan, as amended
effective September 26, 2000, is incorporated herein by reference to Exhibit 10(n) to Norfolk Southern Corporation's Form 10-K filed on March 5, 2001.
(r) The Norfolk Southern Corporation Executives' Deferred Compensation Plan, as amended
effective January 20, 2001, is incorporated herein by reference to Exhibit 10(o) to Norfolk Southern Corporation's Form 10-K filed on March 5, 2001.
(s) The Directors' Deferred Fee Plan of Norfolk Southern Corporation, as amended effective
January 23, 2001, is incorporated herein by reference to Exhibit 10(p) to Norfolk Southern Corporation's Form 10-K filed on March 5, 2001.
(t) The Norfolk Southern Corporation Directors' Restricted Stock Plan, effective January 1,
1994, as restated November 24, 1998, is incorporated herein by reference from Exhibit 10(h) to Norfolk Southern Corporation's Form 10-K filed on March 24, 1999.
(u) Form of Severance Agreement, dated as of June 1, 1996, between Norfolk Southern
Corporation and certain executive officers (including those defined as “named executive officers” and identified in the Corporation's Proxy Statement for the 1997 through 2001 Annual Meetings of Stockholders) is incorporated herein by reference from Exhibit 10(t) to Norfolk Southern Corporation's Form 10-K filed on February 21, 2002.
(v) Norfolk Southern Corporation Supplemental (formerly, Excess) Benefit Plan, effective as
of August 22, 1999, is incorporated herein by reference from Exhibit 10(r) to Norfolk Southern Corporation's Form 10-K filed on March 6, 2000.
(w) The Norfolk Southern Corporation Directors' Charitable Award Program, effective
February 1, 1996, is incorporated herein by reference from Exhibit 10(v) to Norfolk Southern Corporation's Form 10-K filed on February 21, 2002.
(x) The Norfolk Southern Corporation Outside Directors' Deferred Stock Unit Program, as
amended effective January 28, 2003, is incorporated herein by reference to Exhibit 10(x) to Norfolk Southern Corporation’s Form 10-K filed on February 24, 2003.
(y) Agreement, dated as of October 1, 2001, providing enhanced pension benefits to three
officers in exchange for their continued employment with Norfolk Southern Corporation for two years, is incorporated herein by reference to Exhibit 10(w) to Norfolk Southern Corporation's Form 10-Q filed on November 9, 2001. The agreement was entered into with L. Ike Prillaman, Vice Chairman and Chief Marketing Officer; Stephen C. Tobias, Vice Chairman and Chief Operating Officer; and Henry C. Wolf, Vice Chairman and Chief Financial Officer.
(z) The Norfolk Southern Corporation Thoroughbred Stock Option Plan, as amended effective
January 28, 2003, is incorporated herein by reference to Exhibit 10(z) to Norfolk Southern Corporation’s Form 10-K filed on February 24, 2003.
(aa) The Norfolk Southern Safety Incentive Plan for Operating Agreement Employees and For
Non-Operating Agreement Employees, as amended effective January 1, 2004, is filed herewith.

K84
(bb) The Norfolk Southern Corporation Restricted Stock Unit Plan, effective January 28, 2003, is incorporated herein by reference to Exhibit 10(bb) to Norfolk Southern Corporation’s Form 10-K filed on February 24, 2003.
(cc) The Norfolk Southern Corporation Executive Life Insurance Plan, as amended, effective
October 1, 2003, is incorporated herein by reference to Exhibit 10 to Norfolk Southern Corporation’s Form 10-Q filed on October 31, 2003.
12 Statement re: Computation of Ratio of Earnings to Fixed Charges. 21 Subsidiaries of the Registrant. 23 Consents of Experts - (a) Consent of KPMG LLP. (b) Consent of KPMG LLP and Ernst & Young LLP. 31 Rule 13a-14(a)/15d-14(a) Certifications. 32 Section 1350 Certifications. 99 Conrail Inc. 2003 Annual Report to Stockholders. (B) Reports on Form 8-K. A report on Form 8-K was filed December 23, 2003, advising of the Corporation’s review
of the Surface Transportation Board’s decision in Carolina Power & Light Company v. Norfolk Southern Railway Company and attaching as an exhibit the related press release.
A report on Form 8-K was filed December 17, 2003, advising that the Corporation would
record a pretax charge of approximately $80 million to its fourth-quarter earnings to recognize the impaired value of certain telecommunications assets and attaching as an exhibit the related press release.
A report on Form 8-K was filed December 1, 2003, advising of a series of senior-level
executive and organizational changes following the completion of the Corporation’s voluntary separation program for non-agreement employees and attaching as an exhibit the related press release.
A report on Form 8-K was filed November 24, 2003, advising that Norfolk Southern
Railway Company would redeem on December 29, 2003, all publicly held shares of its $2.60 Cumulative Preferred Stock, Series A and attaching as an exhibit the related press release.
A report on Form 8-K was filed November 10, 2003, advising that the Corporation had
reviewed the Surface Transportation Board’s ruling in Duke Energy Corp. v. Norfolk Southern Railway Company and concluded that the impact of the decision on earnings could not be determined at the time and attaching as an exhibit the related press release.

K85
A report on Form 8-K was filed November 6, 2003, advising of the Corporation’s review
of the Surface Transportation Board’s ruling in Duke Energy Corp. v. Norfolk Southern Railway Company and attaching as an exhibit the related press release.
A report on Form 8-K was filed November 5, 2003, advising that the Corporation had
expected to record a $107 million charge against fourth-quarter 2003 earnings related to the completion of its voluntary separation program for non-agreement employees and attaching as an exhibit the related press release.
A report on Form 8-K was filed October 29, 2003, advising of the Corporation’s third-
quarter 2003 results and attaching as an exhibit the related press release, which included the following financial statements for the Corporation and its subsidiaries: Consolidated Statements of Income (Unaudited) for the three months and nine months ended September 30, 2003 and 2002; Consolidated Balance Sheets (Unaudited) for September 30, 2003, and December 31, 2002; and Consolidated Statements of Cash Flows (Unaudited) for the nine months ended September 30, 2003 and 2002.
(C) Exhibits. The Exhibits required by Item 601 of Regulation S-K as listed in Item 15(A)3 are filed
herewith or incorporated herein by references. (D) Financial Statement Schedules. Financial statement schedules and separate financial statements specified by this Item are
included in Item 15(A)2 or are otherwise not required or are not applicable.

K86
POWER OF ATTORNEY Each person whose signature appears below under “SIGNATURES” hereby authorizes Henry C. Wolf and James A. Hixon, or either of them, to execute in the name of each such person, and to file, any amendment to this report and hereby appoints Henry C. Wolf and James A. Hixon, or either of them, as attorneys-in-fact to sign on his or her behalf, individually and in each capacity stated below, and to file, any and all amendments to this report.
SIGNATURES Pursuant to the requirements of Section 13 or 15(d) of the Securities Exchange Act of 1934, Norfolk Southern Corporation has duly caused this report to be signed on its behalf by the undersigned, thereunto duly authorized, on this 12th day of February, 2004. NORFOLK SOUTHERN CORPORATION By: /s/ David R. Goode (David R. Goode, Chairman, President and Chief Executive Officer) Pursuant to the requirements of the Securities Exchange Act of 1934, this report has been signed below on this 12th day of February, 2004, by the following persons on behalf of Norfolk Southern Corporation and in the capacities indicated. Signature Title
/s/ David R. Goode Chairman, President and Chief Executive Officer and Director (David R. Goode) (Principal Executive Officer)
/s/ Henry C. Wolf Vice Chairman and Chief Financial Officer (Henry C. Wolf) (Principal Financial Officer)
/s/ Marta R. Stewart Vice President and Controller (Marta R. Stewart) (Principal Accounting Officer)
/s/ Gerald L. Baliles Director (Gerald L. Baliles)
/s/ Gene R. Carter Director (Gene R. Carter)

K87
/s/ Alston D. Correll Director (Alston D. Correll)
/s/ Landon Hilliard Director (Landon Hilliard)
/s/ George D. Johnson, Jr. Director (George D. Johnson, Jr.)
/s/ Burton M. Joyce Director (Burton M. Joyce)
/s/ Steven F. Leer Director (Steven F. Leer)
/s/ Jane Margaret O’Brien Director (Jane Margaret O'Brien)
/s/ Harold W. Pote Director (Harold W. Pote)
/s/ J. Paul Reason Director (J. Paul Reason)

K88
Schedule II
Norfolk Southern Corporation and Subsidiaries Valuation and Qualifying Accounts Years Ended December 31, 2001, 2002 and 2003 (In millions of dollars)
Additions charged to: Beginning Other Ending
Balance Expenses Accounts Deductions Balance Year ended December 31, 2001 Valuation allowance (included net in deferred tax liability) for deferred tax assets $ 12 $ 6 $ -- $ -- $ 18 Casualty and other claims included in other liabilities $ 262 $ 110 $ 201 $ 1272 $ 265 Current portion of casualty and other claims included in accounts payable $ 223 $ 22 $ 1421 $ 1953 $ 192 Year ended December 31, 2002 Valuation allowance (included net in deferred tax liability) for deferred tax assets $ 18 $ 6 $ -- $ -- $ 24 Casualty and other claims included in other liabilities $ 265 $ 119 $ 91 $ 1392 $ 254 Current portion of casualty and other claims included in accounts payable $ 192 $ 32 $ 1241 $ 1413 $ 207 Year ended December 31, 2003 Valuation allowance (included net in deferred tax liability) for deferred tax assets $ 24 $ -- $ -- $ 2 $ 22 Casualty and other claims included in other liabilities $ 254 $ 134 $ 61 $ 1243 $ 270 Current portion of casualty and other claims included in accounts payable $ 207 $ 34 $ 1251 $ 1484 $ 218
1Includes revenue refunds and overcharges provided through deductions from operating revenues and transfers from other accounts.
2Reclassifications to/from other assets.
3Payments and reclassifications to/from accounts payable.
4Payments and reclassifications to/from other liabilities.
K89
EXHIBIT INDEX
NORFOLK SOUTHERN CORPORATION AND SUBSIDIARIES (NS) Electronic Submission Exhibit Number Description 3 (ii) The Bylaws of Norfolk Southern Corporation, as amended November 25, 2003, are filed
herewith. 10 (aa) The Norfolk Southern Safety Incentive Plan for Operating Agreement Employees and For
Non-Operating Agreement Employees, as amended effective January 1, 2004, is filed herewith.
12 Statement re: Computation of Ratio of Earnings to Fixed Charges. 21 Subsidiaries of Norfolk Southern Corporation. 23 Consents of Experts -
(a) Consent of KPMG LLP. (b) Consent of KPMG LLP and Ernst & Young LLP.
31 Rule 13a-14(a)/15d-14(a) Certifications. 32 Section 1350 Certifications. 99 Conrail, Inc. 2003 Annual Report to Stockholders. Exhibits 23(a), 23(b), 31 and 32 are included; remaining exhibits are not included in copies assembled for public dissemination. These exhibits are included in the 2003 Form 10-K posted on our website at www.nscorp.com under “Investors” and “SEC Filings” or you may request copies by writing to:
Office of Corporate Secretary Norfolk Southern Corporation
Three Commercial Place Norfolk, Virginia 23510-9219