Embed Size (px)
Citation preview
http://www.sec.gov/Archives/edgar/data/18647/000106139313000018/form10k.htm[8/23/2013 4:25:39 PM]
10-K 1 form10k.htm CH ENERGY GROUP 10-K 12-31-2012
UNITED STATES
SECURITIES AND EXCHANGE COMMISSION
Washington, D. C. 20549
FORM 10-K
(Mark One) x ANNUAL REPORT PURSUANT TO SECTION 13 OR 15(d) OF THE SECURITIES EXCHANGE ACT OF 1934
For the fiscal year ended December 31, 2012
OR
o TRANSITION REPORT PURSUANT TO SECTION 13 OR 15(d) OF THE SECURITIES EXCHANGE ACT OF 1934 For the transition period from _______________ to _______________
CommissionFile Number
Registrant, State of IncorporationAddress and Telephone Number
IRS EmployerIdentification No.
0-30512 CH Energy Group, Inc.(Incorporated in New York)284 South AvenuePoughkeepsie, New York 12601-4839(845) 452-2000
14-1804460
1-3268 Central Hudson Gas & Electric Corporation(Incorporated in New York)284 South AvenuePoughkeepsie, New York 12601-4839(845) 452-2000
14-0555980
Securities registered pursuant to Section 12(b) of the Act:
Title of each class Name of each exchange on which registeredCH Energy Group, Inc.Common Stock, $0.10 par value
New York Stock Exchange
Securities registered pursuant to Section 12(g) of the Act:
Title of each class Central Hudson Gas & Electric Corporation Cumulative Preferred Stock
4.50% Series4.75% Series
Indicate by check mark if the Registrant is a well-known seasoned issuer, as defined in Rule 405 of the Securities Act.
CH Energy Group, Inc. Yes þ No oCentral Hudson Gas & Electric Corporation Yes o No þ
http://www.sec.gov/Archives/edgar/data/18647/000106139313000018/form10k.htm[8/23/2013 4:25:39 PM]
Indicate by check mark if the Registrant is not required to file reports pursuant to Section 13 or Section 15(d) of the Act.
CH Energy Group, Inc. Yes o No þCentral Hudson Gas & Electric Corporation Yes o No þ Indicate by check mark whether the Registrant (1) has filed all reports required to be filed by Section 13 or 15(d) of the Securities Exchange Act of 1934 during thepreceding 12 months (or for such shorter period that the Registrant was required to file such reports), and (2) has been subject to such filing requirements for the past90 days.
CH Energy Group, Inc. Yes þ No oCentral Hudson Gas & Electric Corporation Yes þ No o Indicate by check mark whether the Registrant has submitted electronically and posted on its corporate Web site, if any, every Interactive Data File required to be submittedand posted pursuant to Rule 405 of Regulation S-T (§232.405 of this chapter) during the preceding 12 months (or for such shorter period that the registrant was required tosubmit and post such files).
CH Energy Group, Inc. Yes þ No oCentral Hudson Gas & Electric Corporation Yes þ No o
Indicate by check mark if disclosure of delinquent filers pursuant to Item 405 of Regulation S-K is not contained herein, and will not be contained, to the best of Registrants'knowledge, in definitive proxy or information statements incorporated by reference in Part III of this Form 10-K or any amendment to this Form 10-K. o Indicate by check mark whether the Registrant is a large accelerated filer, an accelerated filer, a non-accelerated filer, or a smaller reporting company. See the definitions of"large accelerated filer," "accelerated filer" and "smaller reporting company" in Rule 12b-2 of the Exchange Act. (Check one):
CH Energy Group, Inc. Central Hudson Gas & Electric CorporationLarge Accelerated Filer þ Large Accelerated Filer oAccelerated Filer o Accelerated Filer oNon-Accelerated Filer o Non-Accelerated Filer þSmaller Reporting Company o Smaller Reporting Company o Indicate by check mark whether the Registrant is a shell company (as defined in Rule 12b-2 of the Exchange Act):
CH Energy Group, Inc. Yes o No þCentral Hudson Gas & Electric Corporation Yes o No þ The aggregate market value of the voting and non-voting common equity of CH Energy Group held by non-affiliates as of February 1, 2013, was $972,139,350 based uponthe price at which CH Energy Group's Common Stock was last traded on that date, as reported on the New York Stock Exchange listing of composite transactions. The aggregate market value of the voting and non-voting common equity of CH Energy Group held by non-affiliates as of June 30, 2012, the last business day of CHEnergy Group's most recently completed second fiscal quarter, was $981,479,282 computed by reference to the price at which CH Energy Group's Common Stock was lasttraded on that date, as reported on the New York Stock Exchange listing of composite transactions. The aggregate market value of the voting and non-voting common equity of Central Hudson held by non-affiliates as of June 30, 2012 was zero. The number of shares outstanding of CH Energy Group's Common Stock, as of February 1, 2013, was 14,955,990. The number of shares outstanding of Central Hudson's Common Stock, as of February 1, 2013, was 16,862,087. All such shares are owned by CH Energy Group.
GLOSSARY OF TERMS
The following is a glossary of frequently used abbreviations or acronyms used herein.
CH Energy Group Companies and InvestmentsCHEC Central Hudson Enterprises Corporation (the parent company of Griffith Energy Services, Inc. (not regulated by the PSC) and wholly owned
subsidiary of CH Energy Group)Griffith Griffith Energy Services, Inc. (a wholly owned subsidiary of CHEC)Lyonsdale Lyonsdale Biomass, LLC (a former wholly owned subsidiary of CHEC)CH-Auburn CH-Auburn Energy, LLC (a former wholly owned subsidiary of CHEC)CH-Greentree CH-Greentree, LLC (a former wholly owned subsidiary of CHEC)CH Shirley Wind CH Shirley Wind, LLC (a former wholly owned subsidiary of CHEC which owned 90% controlling interest in Shirley Delaware, which owned
100% interest in Shirley Wind)
http://www.sec.gov/Archives/edgar/data/18647/000106139313000018/form10k.htm[8/23/2013 4:25:39 PM]
Shirley Delaware Shirley Wind (Delaware), LLC (100% owner of Shirley Wind)Shirley Wind Shirley Wind, LLC (a 20 megawatt wind project)Cornhusker Holdings Cornhusker Energy Lexington Holdings, LLC (a former CHEC investment)
Regulators NYS New York StatePSC NYS Public Service CommissionFERC Federal Energy Regulatory CommissionDEC NYS Department of Environmental Conservation
(i)
Terms Related to Business Operations Used By CH Energy Group1993 PSC Policy PSC's 1993 Statement of Policy regarding pension and other post-employment benefits2009 Rate Order Order Establishing Rate Plan issued by the PSC to Central Hudson on June 22, 20092010 Rate Order Order Establishing Rate Plan issued by the PSC to Central Hudson on June 18, 2010Dth DecathermsDistributed Generation An electrical generating facility located at a customer's point of delivery which may be connected in parallel operation to the utility systemkWh Kilowatt-hour(s)Mcf Thousand Cubic FeetMGP Manufactured Gas PlantMW / MWh Megawatt(s) / Megawatt-hour(s)OPEB Other Post-Employment BenefitsRDMs Revenue Decoupling MechanismsRetirement Plan Central Hudson's Non-Contributory Defined Benefit Retirement Income PlanROE Return on EquityROW Right-of-WaySettlement Agreement Amended and Restated Settlement Agreement dated January 2, 1998, and thereafter amended, among Central Hudson, PSC Staff, and Certain
Other PartiesTemporaryState Assessment
New York State Temporary State Energy and Utility Service Conservation Assessment required to be collected from April 4, 2009 to March 31,2014
Other COSO Committee of Sponsoring Organizations of the Treadway CommissionEITF FASB Emerging Issues Task ForceExchange Act Securities Exchange Act of 1934GAAP Accounting Principles Generally Accepted in the United States of AmericaNYISO New York Independent System OperatorNYSERDA New York State Energy Research and Development AuthorityRegistrants CH Energy Group and Central Hudson
(ii)
TABLE OF CONTENTS
PART I PAGEITEM 1 Business 2ITEM 1A Risk Factors 11ITEM 1B Unresolved Staff Comments 15ITEM 2 Properties 15ITEM 3 Legal Proceedings 17ITEM 4 Mine Safety Disclosures 17PART II ITEM 5 Market for Registrant's Common Equity, Related Stockholder Matters and Issuer Purchases of Equity Securities 18ITEM 6 Selected Financial Data of CH Energy Group and its Subsidiaries 22ITEM 7 Management's Discussion and Analysis of Financial Condition and Results of Operations 24ITEM 7A Quantitative and Qualitative Disclosure About Market Risk 86ITEM 8 Financial Statements and Supplementary Data 88ITEM 9 Changes in and Disagreements with Accountants on Accounting and Financial Disclosure 188ITEM 9A Controls and Procedures 188ITEM 9B Other Information 188PART III ITEM 10 Directors and Executive Officers of CH Energy Group 189ITEM 11 Executive Compensation 201ITEM 12 Security Ownership of Certain Beneficial Owners and Management and Related Stockholder Matters 252
http://www.sec.gov/Archives/edgar/data/18647/000106139313000018/form10k.htm[8/23/2013 4:25:39 PM]
ITEM 13 Certain Relationships and Related Transactions and Director Independence 256ITEM 14 Principal Accountant Fees and Services 259PART IV ITEM 15 Exhibits and Financial Statement Schedules 260
(iii)
Table of Contents
PART I
FILING FORMAT
This 10-K Annual Report for the fiscal year ended December 31, 2012, is a combined report being filed by two different Registrants: CH Energy Group and CentralHudson. Any references in this 10-K Annual Report to CH Energy Group include all subsidiaries of CH Energy Group, including Central Hudson, except where the contextclearly indicates otherwise. Central Hudson makes no representation as to the information contained in this 10-K Annual Report in relation to CH Energy Group and itssubsidiaries other than Central Hudson. When this 10-K Annual Report is incorporated by reference into any filing with the SEC made by Central Hudson, the portions ofthis 10-K Annual Report that relate to CH Energy Group and its subsidiaries, other than Central Hudson, are not incorporated by reference therein.
CH Energy Group's wholly owned subsidiaries include Central Hudson and CHEC. For additional information, see the sub-caption "CHEC and Its Subsidiaries andInvestments" in Item 1 - "Business" under the caption "Subsidiaries of CH Energy Group."
FORWARD-LOOKING STATEMENTS
Statements included in this Annual Report on Form 10-K and any documents incorporated by reference which are not historical in nature are intended to be, and are herebyidentified as, "forward-looking statements" for purposes of the safe harbor provided by Section 21E of the Exchange Act. Forward-looking statements may be identified bywords including "anticipates," "intends," "estimates," "believes," "projects," "expects," "plans," "assumes," "seeks," and similar expressions. Forward-looking statementsincluding, without limitation, those relating to CH Energy Group's and Central Hudson's future business prospects, revenues, proceeds, working capital, investmentvaluations, liquidity, income, and margins, as well as the acquisition by a subsidiary of Fortis Inc. and the expected timing of the transaction, are subject to certain risks anduncertainties that could cause actual results to differ materially from those indicated in the forward-looking statements, due to several important factors, including thoseidentified from time to time in the forward-looking statements. Those factors include, but are not limited to: the possibility that various conditions precedent to theconsummation of the proposed Fortis transaction will not be satisfied or waived, including regulatory approvals of the proposed Fortis transaction and the timing and termsthereof; the impact of delay or failure to complete the proposed Fortis transaction on CH Energy Group's stock price; the costs associated with the proposed Fortistransaction; deviations from normal seasonal weather and storm activity; fuel prices; energy supply and demand; potential future acquisitions; legislative, regulatory, andcompetitive developments; interest rates; access to capital; market risks; electric and natural gas industry restructuring and cost recovery; the ability to obtain adequate andtimely rate relief; changes in fuel supply or costs including future market prices for energy, capacity, and ancillary services; the success of strategies to satisfy electricity,natural gas, fuel oil, and propane requirements; the outcome of pending litigation and certain environmental matters, particularly the status of inactive hazardous wastedisposal sites and waste site remediation requirements; and certain presently unknown or unforeseen factors, including, but not limited to, acts of terrorism. CH EnergyGroup and Central Hudson undertake no obligation to update publicly any forward-looking statements, whether as a result of new information, future events, or otherwise. Given these uncertainties, undue reliance should not be placed on the forward-looking statements.
-1-
Table of Contents
Additional Information about the Fortis Transaction and Where to Find It
In connection with the proposed acquisition of CH Energy Group by Fortis, CH Energy Group filed a definitive proxy statement with the SEC on May 9, 2012, and has filedother relevant materials with the SEC as well. Investors and stockholders of CH Energy Group are urged to read the proxy statement and other relevant materials filed withthe SEC because they contain important information about the proposed acquisition and related matters. Investors and stockholders may obtain a free copy of the proxystatement and other documents filed by CH Energy Group, at the SEC's Web site, www.sec.gov. These documents can also be obtained by investors and stockholders freeof charge from CH Energy Group at CH Energy Group's website at www.chenergygroup.com, or by contacting CH Energy Group's Shareholder Relations Department at(845) 486-5204.
ITEM 1 - Business
CORPORATE STRUCTURE
CH Energy Group is the holding company parent corporation of two principal, wholly owned subsidiaries, Central Hudson and CHEC. Central Hudson is a regulatedelectric and natural gas subsidiary. CHEC, the parent company of CH Energy Group's unregulated businesses and investments, has one wholly owned subsidiary, GriffithEnergy Services, Inc. ("Griffith"). CHEC also has ownership interests in certain subsidiaries that are less than 100% owned. For more information, see sub-caption "OtherSubsidiaries and Investments" under caption "CHEC and Its Subsidiaries and Investments." For information concerning revenues, certain expenses, earnings per share, andinformation regarding assets of Central Hudson's regulated electric and regulated natural gas segments and of Griffith, see Note 13 - "Segments and Related Information."
HOLDING COMPANY REGULATION
CH Energy Group is a "holding company" under Public Utility Holding Company Act of 2005 ("PUHCA 2005") because of its ownership interests in Central Hudson andCHEC. CH Energy Group, however, is exempt from regulation as a holding company under PUHCA 2005, because it derives substantially all of its public utility company
http://www.sec.gov/Archives/edgar/data/18647/000106139313000018/form10k.htm[8/23/2013 4:25:39 PM]
revenues from business conducted within a single state, the State of New York. At the present time, CH Energy Group cannot predict whether and when its circumstancesmay change such that it no longer qualifies for exemption from PUHCA 2005.
-2-
Table of Contents
SUBSIDIARIES OF CH ENERGY GROUP
Central Hudson
Central Hudson is a New York State natural gas and electric corporation formed in 1926. Central Hudson purchases, sells at wholesale and retail, and distributes electricityand natural gas at retail in portions of New York State. Central Hudson also generates a small portion of its electricity requirements.
Central Hudson serves a territory comprising approximately 2,600 square miles in the Hudson Valley, with a population estimated at 681,000. Electric service is availablethroughout the territory, and natural gas service is provided in and about the cities of Poughkeepsie, Beacon, Newburgh, and Kingston, New York, and in certain outlyingand intervening territories. The number of Central Hudson employees at December 31, 2012, was 869.
Central Hudson's territory reflects a diversified economy, including manufacturing industries, governmental agencies, public and private institutions, wholesale and retailtrade operations, research firms, farms and resorts.
Seasonality and Other Weather Impacts
Central Hudson's delivery revenues have historically varied seasonally in response to weather. Sales of electricity are highest during the summer months, primarily due tothe use of air-conditioning and other cooling equipment. Sales of natural gas are highest during the winter months, primarily due to space heating usage. Central Hudson'srates are developed based on forecasts of annual sales volumes. Effective July 1, 2009 and continuing in the 2010 Rate Order through June 30, 2013, Central Hudson'sdelivery rate structure includes RDMs, which provide the ability to record revenues equal to those forecasted in the development of current rates for most of CentralHudson's customers. As a result, fluctuations in actual sales volumes as a result of weather or other factors as compared to those forecasted in rate proceedings no longerhave a significant impact on earnings. However, variations between actual expenses incurred due to storm activity and the amount set in rates may impact Central Hudson'searnings. Central Hudson has the ability to request regulatory recovery of significant incremental costs incurred if certain criteria are met as defined by the PSC and, assuch, any adverse impact on earnings for higher storm expenses should be limited to non-material amounts, as long as the other criteria for deferral accounting are met.
-3-
Table of Contents
Competition
Central Hudson is a regulated utility with a legal obligation to deliver electricity and natural gas within its PSC-approved franchise territory. Central Hudson has no directcompetitors in its electricity distribution business; indirect competitors include distributed generation systems, including net metered systems. Central Hudson's natural gasbusiness competes with other fuels, especially fuel oil and propane. The competitive marketplace continues to develop for electric and natural gas supply markets, andCentral Hudson's electric and natural gas customers may purchase energy and related services from other providers. Central Hudson's rate making structure neutralizes anyearnings impact of customers' decisions to purchase electricity and natural gas from other providers.
Regulation
Central Hudson is subject to regulation by the PSC regarding, among other things, services rendered (including the rates charged), major transmission facility siting,accounting treatment of certain items, and issuance of securities. For certain restrictions imposed by the Settlement Agreement, see Note 2 - "Regulatory Matters."
Certain activities of Central Hudson, including accounting and the acquisition and disposition of property, are subject to regulation by FERC under the Federal Power Act.
Central Hudson is not subject to the provisions of the Natural Gas Act. Central Hudson's hydroelectric facilities are not required to be licensed under the Federal Power Actbut are regulated by the DEC.
Central Hudson is subject to regulation by the North American Electric Reliability Corporation regarding its ownership, operation and use of a bulk power system.
Rates
General: The electric and natural gas rates charged by Central Hudson applicable to service supplied to retail customers within New York State are regulated by the PSC. Costs of service, both for electric and gas delivery service and for electric and gas supply costs, are recovered from customers through PSC approved tariffs, subject to astandard of prudency. Both transmission rates and rates for electricity sold for resale which involve interstate commerce are regulated by FERC.
Since July 2009, Central Hudson's rates have included RDMs which are intended to minimize the earnings impact resulting from reduced energy consumption as energyefficiency programs are implemented by breaking the link between energy sales and utility revenues and profits. Central Hudson's RDMs allow the Company to recognizeelectric delivery revenues and gas sales per customer at the levels approved in rates for most of Central Hudson's electric and gas customer classes.
-4-
http://www.sec.gov/Archives/edgar/data/18647/000106139313000018/form10k.htm[8/23/2013 4:25:39 PM]
Table of Contents
Central Hudson's retail electricity rate structure consists of various service classifications covering delivery service and full service (which includes electricity supply) forresidential, commercial, and industrial customers. Retail rates for delivery and supply are shown separately on retail bills to allow customers to see the costs associated withtheir commodity supply, and thus facilitate retail competition. During 2012, the average price of electricity for full service customers was 14.85 cents per kWh as comparedto an average of 14.48 cents per kWh in 2011. The PSC has authorized Central Hudson to recover the costs of the electric commodity from customers, without earning aprofit on the commodity costs. The average delivery price in 2012 was 6.24 cents per kWh and 5.60 cents per kWh in 2011. The increase in delivery price was primarilydue to the implementation of new rates as part of the 2010 Rate Order. The average delivery prices in 2012 and 2011 also include a surcharge resulting from the ElectricRDM.
Central Hudson's retail natural gas rate structure consists of various service classifications covering transport, retail access service, and full service (which includes naturalgas supply) for residential, commercial, and industrial customers. During 2012, the average price of natural gas for full-service customers was $13.81 per Mcf as comparedto an average of $15.50 per Mcf in 2011. The PSC has authorized Central Hudson to recover the costs of the gas commodity from customers, without earning a profit on thecommodity costs. The average delivery price for natural gas for retail and full service in 2012 was $7.52 per Mcf and $6.94 per Mcf in 2011. The increase in delivery pricewas primarily due to the implementation of new rates as part of the 2010 Rate Order and the result of fixed revenue spread over lower sales due to milder weather conditions. The average delivery price in 2012 includes a refund resulting from the Gas RDM, whereas the average delivery price in 2011 includes a surcharge resulting from the GasRDM.
For further information regarding the terms of the 2009 Rate Order and 2010 Rate Order under which Central Hudson operated during the current reporting period, see Note2 - "Regulatory Matters" under the caption "2009 and 2010 Rate Orders."
Cost Adjustment Clauses and RDMs: For information regarding Central Hudson's electric and natural gas cost adjustment clauses and RDMs, see Note 1 - "Summary ofSignificant Accounting Policies" under the caption "Rates, Revenues and Cost Adjustment Clauses."
Capital Expenditures and Financing
For estimates of future capital expenditures for Central Hudson, see the sub-caption "Anticipated Sources and Uses of Cash" in Item 7 - "Management's Discussion andAnalysis of Financial Condition and Results of Operations" of this 10-K Annual Report under the caption "Capital Resources and Liquidity."
Central Hudson's Certificate of Incorporation and its various debt instruments do not contain any limitations upon the issuance of authorized, but unissued, Preferred Stock orunsecured short-term debt.
-5-
Table of Contents
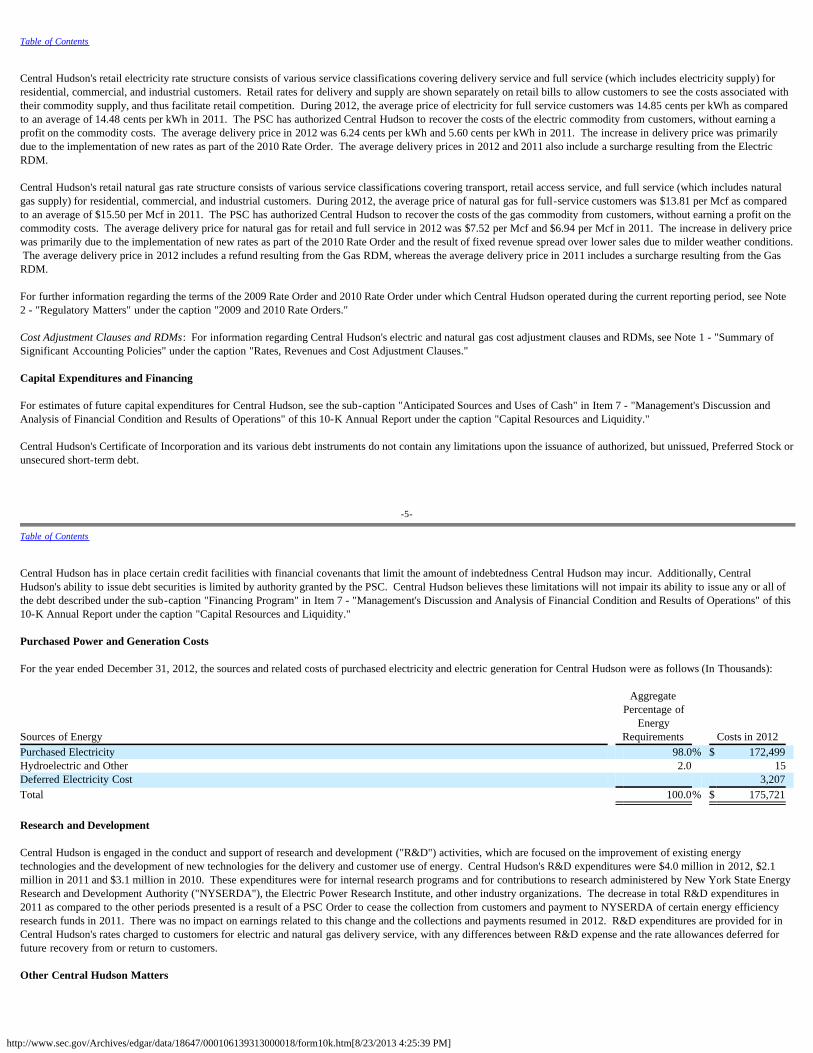
Central Hudson has in place certain credit facilities with financial covenants that limit the amount of indebtedness Central Hudson may incur. Additionally, CentralHudson's ability to issue debt securities is limited by authority granted by the PSC. Central Hudson believes these limitations will not impair its ability to issue any or all ofthe debt described under the sub-caption "Financing Program" in Item 7 - "Management's Discussion and Analysis of Financial Condition and Results of Operations" of this10-K Annual Report under the caption "Capital Resources and Liquidity." Purchased Power and Generation Costs For the year ended December 31, 2012, the sources and related costs of purchased electricity and electric generation for Central Hudson were as follows (In Thousands):
Sources of Energy
AggregatePercentage of
EnergyRequirements Costs in 2012
Purchased Electricity 98.0% $ 172,499 Hydroelectric and Other 2.0 15 Deferred Electricity Cost 3,207 Total 100.0% $ 175,721 Research and Development
Central Hudson is engaged in the conduct and support of research and development ("R&D") activities, which are focused on the improvement of existing energytechnologies and the development of new technologies for the delivery and customer use of energy. Central Hudson's R&D expenditures were $4.0 million in 2012, $2.1million in 2011 and $3.1 million in 2010. These expenditures were for internal research programs and for contributions to research administered by New York State EnergyResearch and Development Authority ("NYSERDA"), the Electric Power Research Institute, and other industry organizations. The decrease in total R&D expenditures in2011 as compared to the other periods presented is a result of a PSC Order to cease the collection from customers and payment to NYSERDA of certain energy efficiencyresearch funds in 2011. There was no impact on earnings related to this change and the collections and payments resumed in 2012. R&D expenditures are provided for inCentral Hudson's rates charged to customers for electric and natural gas delivery service, with any differences between R&D expense and the rate allowances deferred forfuture recovery from or return to customers.
Other Central Hudson Matters

http://www.sec.gov/Archives/edgar/data/18647/000106139313000018/form10k.htm[8/23/2013 4:25:39 PM]
Labor Relations: Central Hudson has an agreement with Local 320 of the International Brotherhood of Electrical Workers for its 526 unionized employees, representingconstruction and maintenance employees, customer service representatives, service workers, and clerical employees (excluding persons in managerial, professional, orsupervisory positions). This agreement became effective on May 1, 2011, and remains effective through April 30, 2016.
-6-
Table of Contents
CHEC and Its Subsidiaries and Investments
CHEC, a New York corporation, is a wholly owned subsidiary of CH Energy Group. CHEC's wholly owned subsidiary is Griffith. For further discussion of certain energy-related projects within other subsidiaries and investments, see Note 5 - "Acquisitions, Divestitures and Investments."
Griffith
Griffith is an energy services company engaged in fuel distribution, including heating oil, gasoline, diesel fuel, kerosene, and propane, and the installation and maintenanceof heating, ventilating, and air conditioning equipment. The number of Griffith employees at December 31, 2012 was 366.
Seasonality
A substantial portion of CHEC's revenues vary seasonally, as Griffith's fuel oil deliveries are directly related to use for space heating and are highest during the wintermonths. Griffith entered into a weather swap for the period beginning November 1, 2012 through March 31, 2013. The hedge is designed to minimize the impact onearnings of variations from normal temperatures on the sale of products and services whose use is weather sensitive. These products and services include the sale of heatingoil, propane, HVAC equipment, and billable service on HVAC equipment. In prior years, Griffith had entered into weather collars which reduced, but did not eliminate, theimpact of weather on earnings. Management believes that the weather swap will more effectively mitigate the impact of weather on earnings volatility.
Competition
Griffith participates in a competitive fuel distribution industry that is subject to different risks than those found in the businesses of the regulated utility, Central Hudson. Griffith faces competition from other fuel distribution companies and from companies supplying other sources for heating, such as electricity, natural gas, propane and heatpumps. For a discussion of Griffith's operating revenues and operating income, see the caption "Results of Operations" in Item 7 - "Management's Discussion and Analysisof Financial Condition and Results of Operations" of this 10-K Annual Report.
-7-
Table of Contents
ENVIRONMENTAL QUALITY REGULATION
Central Hudson and Griffith are subject to regulation by federal, state, and local authorities with respect to the environmental effects of their operations. Environmentalmatters may expose Central Hudson and Griffith to potential liability, which, in certain instances, may be imposed without regard to fault or may be premised on historicalactivities that were lawful at the time they occurred.
Central Hudson and Griffith each monitor their activities in order to determine their impact on the environment and to comply with applicable environmental laws andregulations.
The principal environmental areas relevant to these companies (air, water and industrial and hazardous wastes, other) are described below. Unless otherwise noted, allrequired permits and certifications have been obtained by the applicable company. Management believes that each company was in material compliance with these permitsand certifications during 2012, except as noted in Note 12 – "Commitments and Contingencies" under the caption "Environmental Matters" of this 10-K Annual Report.
Air Quality
The Clean Air Act Amendments of 1990 address attainment and maintenance of national air quality standards and impact Central Hudson electric generating facilities inSouth Cairo and Coxsackie, NY. See Note 12 - "Commitments and Contingencies" under the caption "Environmental Matters" regarding the investigation by the EPA intothe compliance of a former major Central Hudson generating asset.
Water Quality
The Clean Water Act established the basic framework for federal and state regulation of water pollution control and requires facilities that discharge waste or storm waterinto the waters of the United States to obtain permits. Central Hudson and Griffith have permits regulating pollutant discharges for relevant locations.
Industrial & Hazardous Substances and Wastes
Central Hudson and Griffith are subject to federal, state and local laws and regulations relating to the use, handling, storage, treatment, transportation, and disposal ofindustrial, hazardous, and toxic wastes. Currently, there are no permit or certification requirements for Griffith. See Note 12 - "Commitments and Contingencies" under thecaption "Environmental Matters" for additional discussion regarding, among other things, Central Hudson's former MGP facilities and Little Britain Road.
http://www.sec.gov/Archives/edgar/data/18647/000106139313000018/form10k.htm[8/23/2013 4:25:39 PM]
-8-
Table of Contents
Environmental Expenditures
2012 actual and 2013 estimated expenditures attributable in whole or in substantial part to environmental considerations are detailed in the table below (In Millions):
2012 2013 Central Hudson $ 4.1 $ 7.3 Griffith $ 0.4 $ 0.5
The increase in 2013 estimated expenditures relates to MGP remediation activities at the Catskill site, which commenced in September 2012. For further discussion of theseactivities, see Note 12 – "Commitments and Contingencies" under caption "Former Manufactured Gas Plant Facilities".
Central Hudson and Griffith are also subject to regulation with respect to other environmental matters, such as noise levels, protection of vegetation and wildlife, andlimitations on land use, and are in compliance with regulations in these areas.
Regarding environmental matters, except as described in Note 12 - "Commitments and Contingencies" under the caption "Environmental Matters," neither CH EnergyGroup, Central Hudson nor Griffith are involved as defendants in any material litigation, administrative proceeding, or investigation and, to the best of their knowledge, nosuch matters are threatened against any of them.
AVAILABLE INFORMATION
CH Energy Group and Central Hudson file annual, quarterly, and current reports and other information with the SEC. CH Energy Group also files proxy statements. Thepublic may read and copy any of the documents each company files at the SEC's Public Reference Room at 100 F Street N.E., Room 1580, Washington, D.C. 20549. Thepublic may obtain information on the operation of the Public Reference Room by calling the SEC at 1-800-SEC-0330. SEC filings are also available to the public from theSEC's Internet website at www.sec.gov.
CH Energy Group and Central Hudson make available free of charge at www.CHEnergyGroup.com their annual reports on Form 10-K, quarterly reports on Form 10-Q,current reports on Form 8-K, and amendments to those reports filed or furnished pursuant to Section 13(a) or 15(d) of the Exchange Act, as soon as reasonably practicableafter it electronically files such material with, or furnishes it to, the SEC. CH Energy Group's proxy statements, governance guidelines, Code of Business Conduct andEthics, and the charters of its Audit, Compensation, Governance and Nominating, and Strategy and Finance Committees are also available at www.CHEnergyGroup.com. The governance guidelines, the Code of Business Conduct and Ethics, and the charters may also be obtained by writing to the Corporate Secretary, CH Energy Group, Inc.,284 South Avenue, Poughkeepsie, New York 12601-4839.
-9-
Table of Contents
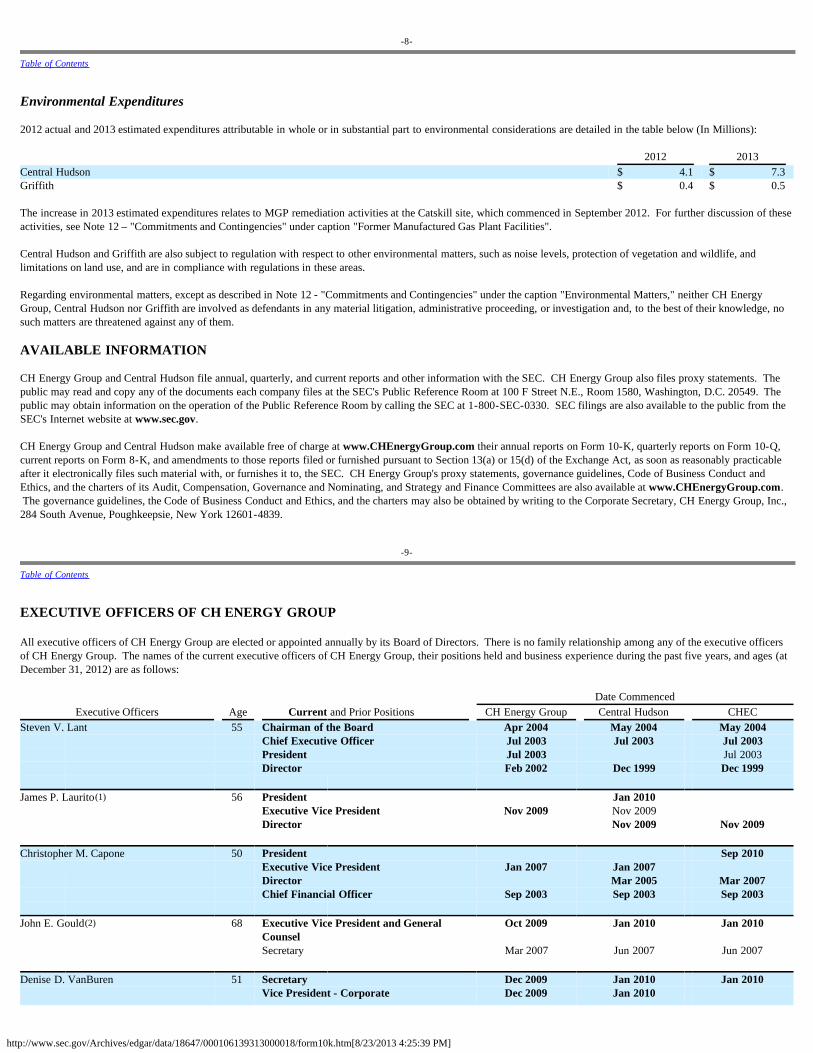
EXECUTIVE OFFICERS OF CH ENERGY GROUP All executive officers of CH Energy Group are elected or appointed annually by its Board of Directors. There is no family relationship among any of the executive officersof CH Energy Group. The names of the current executive officers of CH Energy Group, their positions held and business experience during the past five years, and ages (atDecember 31, 2012) are as follows:
Date CommencedExecutive Officers Age Current and Prior Positions CH Energy Group Central Hudson CHEC
Steven V. Lant 55 Chairman of the Board Apr 2004 May 2004 May 2004 Chief Executive Officer Jul 2003 Jul 2003 Jul 2003 President Jul 2003 Jul 2003 Director Feb 2002 Dec 1999 Dec 1999 James P. Laurito(1) 56 President Jan 2010 Executive Vice President Nov 2009 Nov 2009 Director Nov 2009 Nov 2009 Christopher M. Capone 50 President Sep 2010 Executive Vice President Jan 2007 Jan 2007 Director Mar 2005 Mar 2007 Chief Financial Officer Sep 2003 Sep 2003 Sep 2003 John E. Gould(2) 68 Executive Vice President and General
Counsel Oct 2009 Jan 2010 Jan 2010
Secretary Mar 2007 Jun 2007 Jun 2007 Denise D. VanBuren 51 Secretary Dec 2009 Jan 2010 Jan 2010 Vice President - Corporate Dec 2009 Jan 2010
http://www.sec.gov/Archives/edgar/data/18647/000106139313000018/form10k.htm[8/23/2013 4:25:39 PM]
Communications
Vice President - Public Affairs and Energy
Efficiency Aug 2007 Aug 2007
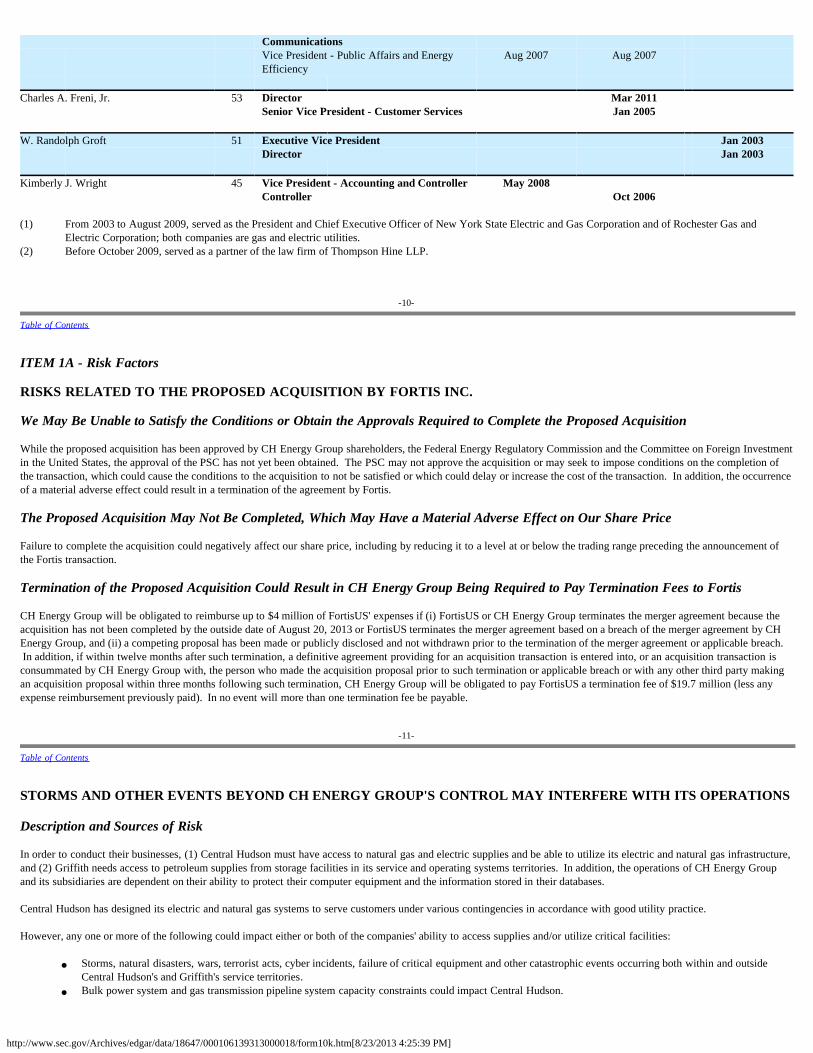
Charles A. Freni, Jr. 53 Director Mar 2011 Senior Vice President - Customer Services Jan 2005 W. Randolph Groft 51 Executive Vice President Jan 2003 Director Jan 2003 Kimberly J. Wright 45 Vice President - Accounting and Controller May 2008 Controller Oct 2006 (1) From 2003 to August 2009, served as the President and Chief Executive Officer of New York State Electric and Gas Corporation and of Rochester Gas and
Electric Corporation; both companies are gas and electric utilities.(2) Before October 2009, served as a partner of the law firm of Thompson Hine LLP.
-10-
Table of Contents
ITEM 1A - Risk Factors
RISKS RELATED TO THE PROPOSED ACQUISITION BY FORTIS INC.
We May Be Unable to Satisfy the Conditions or Obtain the Approvals Required to Complete the Proposed Acquisition
While the proposed acquisition has been approved by CH Energy Group shareholders, the Federal Energy Regulatory Commission and the Committee on Foreign Investmentin the United States, the approval of the PSC has not yet been obtained. The PSC may not approve the acquisition or may seek to impose conditions on the completion ofthe transaction, which could cause the conditions to the acquisition to not be satisfied or which could delay or increase the cost of the transaction. In addition, the occurrenceof a material adverse effect could result in a termination of the agreement by Fortis. The Proposed Acquisition May Not Be Completed, Which May Have a Material Adverse Effect on Our Share Price
Failure to complete the acquisition could negatively affect our share price, including by reducing it to a level at or below the trading range preceding the announcement ofthe Fortis transaction. Termination of the Proposed Acquisition Could Result in CH Energy Group Being Required to Pay Termination Fees to Fortis
CH Energy Group will be obligated to reimburse up to $4 million of FortisUS' expenses if (i) FortisUS or CH Energy Group terminates the merger agreement because theacquisition has not been completed by the outside date of August 20, 2013 or FortisUS terminates the merger agreement based on a breach of the merger agreement by CHEnergy Group, and (ii) a competing proposal has been made or publicly disclosed and not withdrawn prior to the termination of the merger agreement or applicable breach. In addition, if within twelve months after such termination, a definitive agreement providing for an acquisition transaction is entered into, or an acquisition transaction isconsummated by CH Energy Group with, the person who made the acquisition proposal prior to such termination or applicable breach or with any other third party makingan acquisition proposal within three months following such termination, CH Energy Group will be obligated to pay FortisUS a termination fee of $19.7 million (less anyexpense reimbursement previously paid). In no event will more than one termination fee be payable.
-11-
Table of Contents
STORMS AND OTHER EVENTS BEYOND CH ENERGY GROUP'S CONTROL MAY INTERFERE WITH ITS OPERATIONS Description and Sources of Risk
In order to conduct their businesses, (1) Central Hudson must have access to natural gas and electric supplies and be able to utilize its electric and natural gas infrastructure,and (2) Griffith needs access to petroleum supplies from storage facilities in its service and operating systems territories. In addition, the operations of CH Energy Groupand its subsidiaries are dependent on their ability to protect their computer equipment and the information stored in their databases.
Central Hudson has designed its electric and natural gas systems to serve customers under various contingencies in accordance with good utility practice. However, any one or more of the following could impact either or both of the companies' ability to access supplies and/or utilize critical facilities:
· Storms, natural disasters, wars, terrorist acts, cyber incidents, failure of critical equipment and other catastrophic events occurring both within and outsideCentral Hudson's and Griffith's service territories.
· Bulk power system and gas transmission pipeline system capacity constraints could impact Central Hudson.
http://www.sec.gov/Archives/edgar/data/18647/000106139313000018/form10k.htm[8/23/2013 4:25:39 PM]
· Unfavorable developments in the world oil markets could impact Griffith.
· Third-party facility owner or supplier financial distress.
· Unfavorable governmental actions or judicial orders.
Potential Impacts
The companies could experience service disruptions leading to lower earnings and/or reduced cash flows if the situation is not resolved in a timely manner or the financialimpacts of restoration are not alleviated through insurance policies, regulated rate recovery for Central Hudson or higher sales prices for Griffith. In addition, CentralHudson has experienced one cyber incident and could experience others which could result in the misappropriation, destruction, corruption or unavailability of critical dataor confidential customer information which could result in reputational damage and/or litigation.
-12-
Table of Contents
CENTRAL HUDSON'S RATES LIMIT ITS ABILITY TO RECOVER ITS COSTS FROM ITS CUSTOMERS
Description and Sources of Risk
Central Hudson's retail rates are regulated by the PSC. Rate plans generally may not be changed during their respective terms. Therefore, rates cannot be modified forhigher expenses than those assumed in the current rates, absent circumstances such as an increase in expenses that meet the PSC's threshold requirements for filing forapproval of deferral accounting. Central Hudson is operating under a three year rate plan approved by the PSC effective July 1, 2010. The following could unfavorablyimpact Central Hudson's financial results:
· Higher expenses than reflected in current rates. Higher expenses could result from, among other things, increases in taxes and assessments, unrecoverablestorm restoration expense, labor, health care benefits or other expense components.
· Penalties imposed by the PSC for the failure to achieve performance metrics in the rate plan, or violation of PSC Orders.
· Higher electric and natural gas capital project costs resulting from escalation of labor, material and equipment prices, as well as potential delays in the sitingand legislative and/or regulatory approval requirements associated with these projects.
· A determination by the PSC that the cost to place a project in service is above a level which is deemed prudent.
Potential Impacts
Central Hudson could have lower earnings and/or reduced cash flows if cost management and/or regulatory relief are not sufficient to alleviate the impact of higher costs.
Additional Information
See Note 2 - "Regulatory Matters" of this 10-K Annual Report.
-13-
Table of Contents
UNUSUAL TEMPERATURES IN GRIFFITH'S SERVICE TERRITORIES MAY ADVERSELY IMPACT EARNINGS
Description and Sources of Risk
Griffith serves the Mid-Atlantic region of the United States. This area experiences seasonal fluctuations in temperature. A considerable portion of Griffith's earnings isderived directly or indirectly from the weather-sensitive end uses of space heating and air conditioning. As a result, sales volumes fluctuate and vary from normal expectedlevels based on variations in weather from historically normal seasonal levels. Such variations could significantly reduce sales volumes. To mitigate this risk, Griffithentered into a weather swap for the period beginning November 1, 2012 through March 31, 2013. The hedge is designed to minimize the impact on earnings of variationsfrom normal temperatures on the sale of weather related products and services. These products and services include the sale of heating oil, propane, HVAC equipment, andbillable service on HVAC equipment. In prior years, Griffith had entered into weather collars which reduced, but did not eliminate, the impact of temperature variations. Management believes that the current weather swap will more effectively mitigate the impact of temperature variations on earnings volatility, but cannot provide assurancethat similar weather swaps will be available in the future.
Potential Impacts
If effective hedging arrangements such as the weather swap described above are not available in the future, Griffith could experience lower delivery volumes in periods ofmilder than normal weather, leading to lower earnings and reduced cash flows.
GRIFFITH'S INABILITY TO ATTRACT NEW CUSTOMERS, RETAIN EXISTING CUSTOMERS, MAINTAIN SALESVOLUMES, AND MAINTAIN MARGINS MAY ADVERSELY IMPACT EARNINGS
Description and Sources of Risk
http://www.sec.gov/Archives/edgar/data/18647/000106139313000018/form10k.htm[8/23/2013 4:25:39 PM]
Lower sales can occur for various reasons, including the following:
· Changes in customers' usage patterns driven by customer responses to product prices,
· Economic conditions,
· Energy efficiency programs, and/or
· The loss of major customers, the loss of a large number of residential customers, or the addition of fewer new customers than expected.
Significant increases in wholesale oil prices could negatively impact margins and/or cause current and/or prospective full service customers to reduce their usage and/orpurchase fuel from discount distributors.
-14-
Table of Contents
Potential Impacts
Any one or more of the following could result from these events:
· An adverse impact on Griffith's ability to attract new full-service residential customers and retain existing full-service residential customers.
· Sales volume reductions, and/or compressed margins.
· Increased working capital requirements stemming from an increase in oil and/or propane prices.
These events could materially reduce Griffith's contribution to CH Energy Group's earnings and cash flow.
CENTRAL HUDSON IS SUBJECT TO RISKS RELATING TO ASBESTOS LITIGATION AND MANUFACTURED GASPLANT FACILITIES
Description and Sources of Risk
Litigation has been commenced by third parties against Central Hudson arising from the use of asbestos at certain of its previously owned electric generating stations, andCentral Hudson is involved in a number of matters arising from contamination at former MGP sites.
Potential Impacts
To the extent not covered by insurance or recovered through rates, remediation costs, court decisions and settlements resulting from any litigation could reduce earnings andcash flows.
Additional Information
See Note 12 - "Commitments and Contingencies" and in particular the sub-captions in Note 12 regarding "Asbestos Litigation" and "Former Manufactured Gas PlantFacilities" under the caption "Environmental Matters."
ITEM 1B - Unresolved Staff Comments
None.
ITEM 2 - Properties
CH Energy Group has no significant properties other than those of Central Hudson and CHEC.
-15-
Table of Contents
CENTRAL HUDSON
Electric
Central Hudson owns hydroelectric and gas turbine generating facilities as described below. Type of Electric Generating Plant Year Placed in Service/Refurbished MW(1) Net CapabilityHydroelectric (3 stations) 1920-1986 22.4Gas turbine (2 stations) 1969-1970 42.5
Total 64.9

http://www.sec.gov/Archives/edgar/data/18647/000106139313000018/form10k.htm[8/23/2013 4:25:39 PM]
(1) Reflects maximum one-hour net capability (winter rating as of December 31, 2012) of Central Hudson's electric generating plants and therefore does not include firmpurchases or sales.
Central Hudson owns substations having an aggregate transformer capacity of 5.4 million kilovolt amperes. Central Hudson's electric transmission system consists of 629pole miles of line. The electric distribution system consists of approximately 7,300 pole miles of overhead lines and 1,400 trench miles of underground lines, as well ascustomer service lines and meters.
Electric Load and Capacity
Central Hudson's maximum one-hour demand for electricity within its own territory for the year ended December 31, 2012, occurred on July 17, 2012, and amounted to1,168 MW. Central Hudson's highest peak electric demand reached 1,295 MW on August 2, 2006. Central Hudson's maximum one-hour demand for electricity within itsown territory for that part of the 2012-2013 winter capability period through February 22, 2013, occurred on January 24, 2013, and amounted to 906 MW.
Central Hudson owns minimal generating capacity and relies on purchased capacity and energy from third-party providers to meet the demands of its full service customers. For more information, see Note 12 - "Commitments and Contingencies."
Natural Gas
Central Hudson's natural gas system consists of 164 miles of transmission pipelines and 1,193 miles of distribution pipelines, as well as customer service lines and meters. For the year ended December 31, 2012, the total amount of natural gas purchased by Central Hudson from all sources was 11,057,946 Mcf. During 2012, Central Hudsonretired and removed its propane-air mixing facilities, one located in Poughkeepsie, New York, and the other in Newburgh, New York. Additional investigation and testing ofthese sites will be required, which may require additional remediation. The cost to be incurred associated with the retirement of these facilities is not expected to be materialand will have no impact on earnings.
-16-
Table of Contents
The peak daily demand for natural gas of Central Hudson's customers for the year ended December 31, 2012, and for that part of the 2012-2013 heating season throughFebruary 22, 2013, occurred on January 23, 2013 and amounted to 115,070 Mcf. Central Hudson's highest winter period daily peak demand reached 125,496 Mcf onJanuary 27, 2005. Central Hudson's firm peak day natural gas capability in the 2012-2013 heating season was 130,090 Mcf.
Other Central Hudson Matters
Central Hudson owns its corporate headquarters located in Poughkeepsie, New York, as well as several district offices located throughout the Hudson Valley. CentralHudson's electric generating plants and important property units are generally held by it in fee simple, except for certain ROW and a portion of the property used inconnection with hydroelectric plants consisting of flowage or other riparian rights. Certain of the Central Hudson properties are subject to ROW and easements that do notinterfere with Central Hudson's operations. In the case of certain distribution lines, Central Hudson owns only a partial interest in the poles upon which its wires areinstalled and the remaining interest is owned by various telecommunications companies. In addition, certain electric and natural gas transmission facilities owned by othersare used by Central Hudson under long-term contracts.
During the three-year period ended December 31, 2012, Central Hudson made gross property additions of $270.1 million and property retirements and adjustments of $49.9million, resulting in a net increase (including construction work in progress) in gross utility plant of $220.2 million, or 16%.
CHEC
CHEC owns a 100% interest in Griffith. Griffith owns or leases several office, warehouse, and bulk petroleum storage facilities. These facilities are located in Delaware,Maryland, Virginia, and West Virginia. The bulk petroleum storage facilities have capacities from 60,000 gallons up to 760,000 gallons. Griffith leases its corporateheadquarters, which is located in Columbia, Maryland.
ITEM 3 - Legal Proceedings
For information about developments regarding certain legal proceedings, see Note 12 - "Commitments and Contingencies" of this 10-K Annual Report.
ITEM 4 – Mine Safety Disclosures
Not applicable.
-17-
Table of Contents
PART II
ITEM 5 - Market for Registrant's Common Equity, Related Stockholder Matters and Issuer Purchases of Equity Securities For information regarding the market for CH Energy Group's Common Stock and related stockholder matters, see Item 7 - "Management's Discussion and Analysis ofFinancial Condition and Results of Operations" of this 10-K Annual Report under the caption "Capital Resources and Liquidity - Financing Program" and Note 8 -
http://www.sec.gov/Archives/edgar/data/18647/000106139313000018/form10k.htm[8/23/2013 4:25:39 PM]
"Capitalization - Common and Preferred Stock."
Under applicable statutes and their respective Certificates of Incorporation, CH Energy Group may pay dividends on its Common Stock and Central Hudson may paydividends on its Common Stock and its Preferred Stock, in each case only out of surplus.
-18-
Table of Contents
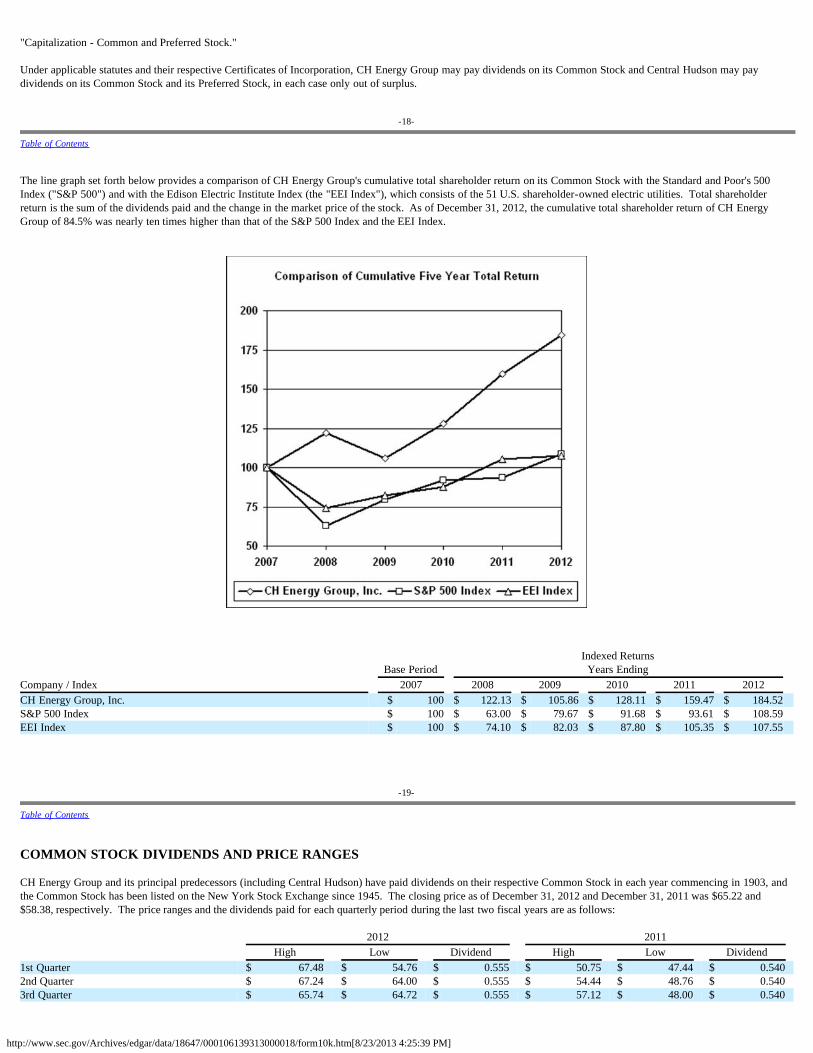
The line graph set forth below provides a comparison of CH Energy Group's cumulative total shareholder return on its Common Stock with the Standard and Poor's 500Index ("S&P 500") and with the Edison Electric Institute Index (the "EEI Index"), which consists of the 51 U.S. shareholder-owned electric utilities. Total shareholderreturn is the sum of the dividends paid and the change in the market price of the stock. As of December 31, 2012, the cumulative total shareholder return of CH EnergyGroup of 84.5% was nearly ten times higher than that of the S&P 500 Index and the EEI Index.
Indexed Returns Base Period Years Ending Company / Index 2007 2008 2009 2010 2011 2012 CH Energy Group, Inc. $ 100 $ 122.13 $ 105.86 $ 128.11 $ 159.47 $ 184.52 S&P 500 Index $ 100 $ 63.00 $ 79.67 $ 91.68 $ 93.61 $ 108.59 EEI Index $ 100 $ 74.10 $ 82.03 $ 87.80 $ 105.35 $ 107.55
-19-
Table of Contents
COMMON STOCK DIVIDENDS AND PRICE RANGES CH Energy Group and its principal predecessors (including Central Hudson) have paid dividends on their respective Common Stock in each year commencing in 1903, andthe Common Stock has been listed on the New York Stock Exchange since 1945. The closing price as of December 31, 2012 and December 31, 2011 was $65.22 and$58.38, respectively. The price ranges and the dividends paid for each quarterly period during the last two fiscal years are as follows: 2012 2011 High Low Dividend High Low Dividend 1st Quarter $ 67.48 $ 54.76 $ 0.555 $ 50.75 $ 47.44 $ 0.540 2nd Quarter $ 67.24 $ 64.00 $ 0.555 $ 54.44 $ 48.76 $ 0.540 3rd Quarter $ 65.74 $ 64.72 $ 0.555 $ 57.12 $ 48.00 $ 0.540
http://www.sec.gov/Archives/edgar/data/18647/000106139313000018/form10k.htm[8/23/2013 4:25:39 PM]
4th Quarter $ 65.69 $ 64.48 $ 0.555 $ 59.67 $ 50.55 $ 0.555
In 2012, the Board of Directors of CH Energy Group declared quarterly dividends of 55.5 cents per share. In declaring future dividends, CH Energy Group will evaluate allcircumstances at the time of making such decisions, including business, financial, and regulatory considerations.
On February 21, 2012, CH Energy Group announced that it had entered into an agreement and plan of merger under which it agreed, subject to shareholder approval and theapproval of applicable regulatory authorities, to be acquired by Fortis Inc. ("Fortis") for $65 per share of common stock in cash. The agreement permits the declaration orpayment of dividends and distributions in the normal course of business, up to 55.5 cents for quarterly dividends paid for periods commencing prior to March 19, 2013, and57.0 cents for quarterly dividends paid for periods commencing after such date.
CH Energy Group's ability to pay dividends to common shareholders is affected by the ability of its subsidiaries to pay dividends to the parent company. The Federal PowerAct limits the payment of dividends by Central Hudson to its level of retained earnings. More restrictive is the PSC's limit on the dividends Central Hudson may pay to CHEnergy Group which is 100% of the average annual income available for common stock, calculated on a two-year rolling average basis. Based on this calculation as ofDecember 31, 2012, Central Hudson would be able to pay a maximum of $45.1 million in dividends to CH Energy Group without violating the restrictions imposed by thePSC. Central Hudson's dividend would be reduced to 75% of its average annual income in the event of a downgrade of its senior debt rating below "BBB+" by more thanone rating agency if the stated reason for the downgrade is related to CH Energy Group or any of Central Hudson's affiliates. Further restrictions are imposed for anydowngrades below this level. During the year ended December 31, 2012, Central Hudson declared and paid dividends of $22.0 million to CH Energy Group. CH EnergyGroup's other subsidiaries do not have express restrictions on their ability to pay dividends.
-20-
Table of Contents
The number of registered holders of Common Stock of CH Energy Group as of December 31, 2012 was 12,815.
All of the outstanding Common Stock of Central Hudson and all of the outstanding Common Stock of CHEC are held by CH Energy Group.
Beginning in the fourth quarter of 2010 and continuing through 2011, CH Energy Group, using excess liquidity largely related to proceeds from divestitures, repurchasedshares of its own common stock. For more information regarding CH Energy Group's stock repurchase program, see the "Anticipated Sources and Uses of Cash" section ofItem 7 – "Management Discussion and Analysis." The following table provides a summary of shares repurchased by CH Energy Group for the quarter ended December 31, 2012:
Total Number of Shares
Purchased(1) Average Price Paid
per Share(2)
Total Number of Shares Purchased asPart of Publicly Announced Plans or
Programs
Maximum Number of Shares thatMay Yet be Purchased Under the
Plans or Programs(3)
October 1-31, 2012 1,038 $ 65.35 - - November 1-30, 2012 1 390 $ 64.83 - - December 1-31, 2012 1,611 $ 65.07 - - Total 3,039 $ 65.13 1 - (1) Consists of shares surrendered to CH Energy Group in satisfaction of tax withholdings on the vesting of restricted shares and performance shares.(2) Value at which reacquired shares of CH Energy Group's common stock credited on the date the stock was surrendered.(3) On July 31, 2007, the Board of Directors authorized the repurchase of up to 2,000,000 shares or approximately 13% of CH Energy Group's outstanding common
stock on that date, from time to time, over the five year period ending July 31, 2012. Upon expiration, the Board of Directors elected to not extend the repurchaseprogram.
-21-
Table of Contents
ITEM 6 - Selected Financial Data of CH Energy Group and Its Subsidiaries FIVE-YEAR SUMMARY OF CONSOLIDATED OPERATIONS AND SELECTED FINANCIAL DATA(1) (CH ENERGYGROUP)(In Thousands, except per share data) 2012 2011 2010 2009 2008 Operating Revenues:
Electric - Delivery $ 336,360 $ 332,388 $ 317,023 $ 275,167 $ 242,334 Electric - Supply 175,721 206,160 246,116 261,003 365,827 Natural Gas - Delivery 83,158 85,196 81,606 66,916 59,897 Natural Gas - Supply 49,276 76,778 75,189 107,221 129,649 Competitive business subsidiaries 280,204 284,998 240,174 211,250 330,254
Total 924,719 985,520 960,108 921,557 1,127,961
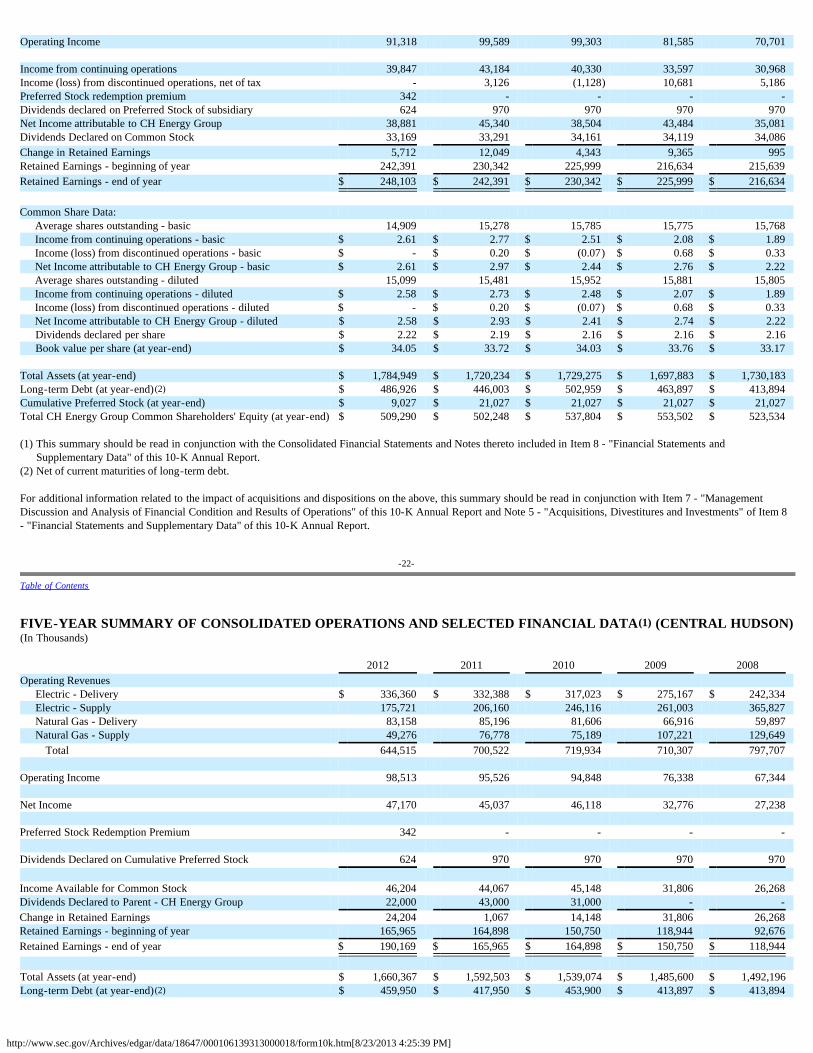
http://www.sec.gov/Archives/edgar/data/18647/000106139313000018/form10k.htm[8/23/2013 4:25:39 PM]
Operating Income 91,318 99,589 99,303 81,585 70,701 Income from continuing operations 39,847 43,184 40,330 33,597 30,968 Income (loss) from discontinued operations, net of tax - 3,126 (1,128) 10,681 5,186 Preferred Stock redemption premium 342 - - - - Dividends declared on Preferred Stock of subsidiary 624 970 970 970 970 Net Income attributable to CH Energy Group 38,881 45,340 38,504 43,484 35,081 Dividends Declared on Common Stock 33,169 33,291 34,161 34,119 34,086 Change in Retained Earnings 5,712 12,049 4,343 9,365 995 Retained Earnings - beginning of year 242,391 230,342 225,999 216,634 215,639 Retained Earnings - end of year $ 248,103 $ 242,391 $ 230,342 $ 225,999 $ 216,634 Common Share Data:
Average shares outstanding - basic 14,909 15,278 15,785 15,775 15,768 Income from continuing operations - basic $ 2.61 $ 2.77 $ 2.51 $ 2.08 $ 1.89 Income (loss) from discontinued operations - basic $ - $ 0.20 $ (0.07) $ 0.68 $ 0.33 Net Income attributable to CH Energy Group - basic $ 2.61 $ 2.97 $ 2.44 $ 2.76 $ 2.22 Average shares outstanding - diluted 15,099 15,481 15,952 15,881 15,805 Income from continuing operations - diluted $ 2.58 $ 2.73 $ 2.48 $ 2.07 $ 1.89 Income (loss) from discontinued operations - diluted $ - $ 0.20 $ (0.07) $ 0.68 $ 0.33 Net Income attributable to CH Energy Group - diluted $ 2.58 $ 2.93 $ 2.41 $ 2.74 $ 2.22 Dividends declared per share $ 2.22 $ 2.19 $ 2.16 $ 2.16 $ 2.16 Book value per share (at year-end) $ 34.05 $ 33.72 $ 34.03 $ 33.76 $ 33.17
Total Assets (at year-end) $ 1,784,949 $ 1,720,234 $ 1,729,275 $ 1,697,883 $ 1,730,183 Long-term Debt (at year-end)(2) $ 486,926 $ 446,003 $ 502,959 $ 463,897 $ 413,894 Cumulative Preferred Stock (at year-end) $ 9,027 $ 21,027 $ 21,027 $ 21,027 $ 21,027 Total CH Energy Group Common Shareholders' Equity (at year-end) $ 509,290 $ 502,248 $ 537,804 $ 553,502 $ 523,534 (1) This summary should be read in conjunction with the Consolidated Financial Statements and Notes thereto included in Item 8 - "Financial Statements and
Supplementary Data" of this 10-K Annual Report.(2) Net of current maturities of long-term debt. For additional information related to the impact of acquisitions and dispositions on the above, this summary should be read in conjunction with Item 7 - "ManagementDiscussion and Analysis of Financial Condition and Results of Operations" of this 10-K Annual Report and Note 5 - "Acquisitions, Divestitures and Investments" of Item 8- "Financial Statements and Supplementary Data" of this 10-K Annual Report.
-22-
Table of Contents
FIVE-YEAR SUMMARY OF CONSOLIDATED OPERATIONS AND SELECTED FINANCIAL DATA(1) (CENTRAL HUDSON)(In Thousands) 2012 2011 2010 2009 2008 Operating Revenues
Electric - Delivery $ 336,360 $ 332,388 $ 317,023 $ 275,167 $ 242,334 Electric - Supply 175,721 206,160 246,116 261,003 365,827 Natural Gas - Delivery 83,158 85,196 81,606 66,916 59,897 Natural Gas - Supply 49,276 76,778 75,189 107,221 129,649
Total 644,515 700,522 719,934 710,307 797,707 Operating Income 98,513 95,526 94,848 76,338 67,344 Net Income 47,170 45,037 46,118 32,776 27,238 Preferred Stock Redemption Premium 342 - - - - Dividends Declared on Cumulative Preferred Stock 624 970 970 970 970 Income Available for Common Stock 46,204 44,067 45,148 31,806 26,268 Dividends Declared to Parent - CH Energy Group 22,000 43,000 31,000 - - Change in Retained Earnings 24,204 1,067 14,148 31,806 26,268 Retained Earnings - beginning of year 165,965 164,898 150,750 118,944 92,676 Retained Earnings - end of year $ 190,169 $ 165,965 $ 164,898 $ 150,750 $ 118,944 Total Assets (at year-end) $ 1,660,367 $ 1,592,503 $ 1,539,074 $ 1,485,600 $ 1,492,196 Long-term Debt (at year-end)(2) $ 459,950 $ 417,950 $ 453,900 $ 413,897 $ 413,894
http://www.sec.gov/Archives/edgar/data/18647/000106139313000018/form10k.htm[8/23/2013 4:25:39 PM]
Cumulative Preferred Stock (at year-end) $ 9,027 $ 21,027 $ 21,027 $ 21,027 $ 21,027 Total Equity (at year-end) $ 469,661 $ 445,295 $ 444,228 $ 430,080 $ 373,274 (1) This summary should be read in conjunction with the Consolidated Financial Statements and Notes thereto included in Item 8 - "Financial Statements and
Supplementary Data" of this 10-K Annual Report.(2) Net of current maturities of long-term debt.
-23-
Table of Contents
ITEM 7 - Management's Discussion and Analysis of Financial Condition and Results of Operations INTRODUCTION
The following Management's Discussion and Analysis of Financial Condition and Results of Operations are intended to help the reader understand CH Energy Group andCentral Hudson.
Please note that the Executive Summary (below) is provided as a supplement to, and should be read together with, the remainder of this Item 7 - "Management's Discussionand Analysis of Financial Condition and Results of Operations," the Consolidated Financial Statements, including the Notes thereto, and the other information included inthis 10-K Annual Report.
EXECUTIVE SUMMARY
Business Overview
CH Energy Group's objective is to deliver value to its shareholders through current income, in the form of quarterly dividend payments, and through share appreciation thatis expected to result from earnings and dividend growth over the long term.
CH Energy Group is a holding company with four business units: Business Segments: (1) Central Hudson's regulated electric utility business; (2) Central Hudson's regulated natural gas utility business; (3) Griffith's fuel distribution business; Other Businesses and Investments: (4) CHEC's renewable energy investments and the holding company's activities, which consist primarily of financing its subsidiaries.
-24-
Table of Contents
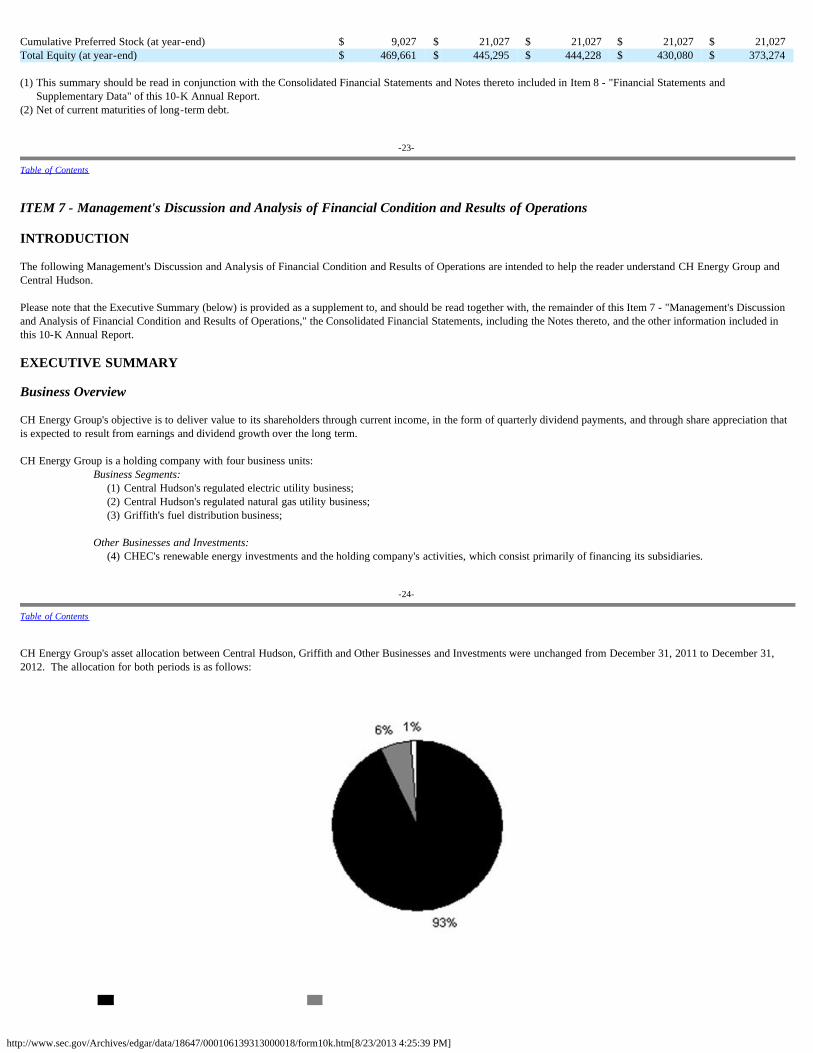
CH Energy Group's asset allocation between Central Hudson, Griffith and Other Businesses and Investments were unchanged from December 31, 2011 to December 31,2012. The allocation for both periods is as follows:
http://www.sec.gov/Archives/edgar/data/18647/000106139313000018/form10k.htm[8/23/2013 4:25:39 PM]
Central Hudson Griffith Other Businesses and Investments
Information Regarding the Fortis Transaction
On February 21, 2012, CH Energy Group announced that it had entered into an agreement and plan of merger under which it agreed, subject to shareholder approval and theapproval of applicable regulatory authorities, to be acquired by Fortis Inc. ("Fortis") for $65 per share of common stock in cash. On June 19, 2012, shareholders of CHEnergy Group approved the proposed acquisition of the Company by Fortis. As of December 31, 2012, the only outstanding approval needed for the transaction to close isfrom the New York State Public Service Commission ("PSC"). In January 2013, Fortis, Central Hudson PSC Staff and other parties reached an agreement of terms relatedto the proposed transaction. This joint proposal was filed with the PSC for its review and approval. While no assurance can be given, the transaction is expected to beapproved by the PSC in the second quarter of 2013. Under the terms of the merger agreement, Fortis must close the transaction if all conditions precedent are met, includingPSC approval, and a material adverse effect has not occurred. Closing of the transaction would follow shortly after Fortis' acceptance of the PSC's order approving thetransaction. Management can provide no assurances regarding the closing. Fortis' strategy includes the expansion of its utility operations, which are currently concentrated in Canada, into the U.S. CH Energy Group's mission and strategy remainsunchanged as discussed in more detail below.
-25-
Table of Contents
Mission and Strategy
CH Energy Group's mission is to provide electricity, natural gas, petroleum and related services to an expanding customer base in a safe, reliable, courteous and affordablemanner; to produce growing financial returns for shareholders; to foster a culture that encourages employees to reach their full potential; and to be a good corporate citizen.
CH Energy Group endeavors to fulfill its mission, providing an attractive risk adjusted return to CH Energy Group shareholders, by executing our plan to:
· Concentrate on energy distribution through Central Hudson in the Mid-Hudson Valley and through Griffith in the Mid-Atlantic region
· Invest primarily in utility electric and natural gas transmission and distribution
· Focus on risk management
- Limit commodity exposure
- Manage regulatory affairs effectively
- Maintain a financial profile that supports a credit rating in the "A" category
- Limit the impact of weather on Griffith's earnings
· Target stable and predictable earnings, with growth trend expectations of 5% or more per year
· Provide an annualized dividend that is approximately 65% to 70% of annual earnings
Strategy Execution
Based on the current investment and capital structure, CH Energy Group's management believes that it is well positioned to achieve its earnings growth and annualizeddividend goals.
Management continues to focus on Central Hudson's electric and natural gas infrastructure as the core growth drivers of CH Energy Group. Central Hudson's capitalexpenditure program is on course to achieve its targets under its three year rate plan. Central Hudson invested approximately $100 million in 2012 and the five year forecastincludes increasing annual capital investments. The capital program provides for continued strengthening of electric and gas infrastructure, as well as prudent investment intechnology that will improve reliability and customer satisfaction. Central Hudson has effectively managed its operational challenges, including significant weather eventsin the past few years and the impact of a significant recession on its customers' ability to pay bills, and has achieved a return approximately equal to its allowed return in2012.
Griffith's financial results in 2012 were impacted by extremely mild winter weather in the first quarter and escalating wholesale prices, which further dampened demand forits products. Griffith continued its focus on cost management in an effort to reduce the impact of the lower volumes and higher commodity costs on its cost of doingbusiness. Additionally, Griffith's high quality service and brand recognition enabled management to continue its history of increasing margins in an environment ofcontracting customer demand for petroleum products. Griffith also successfully acquired and tucked-in five companies in 2012, all of which are expected to be accretive in2013.
-26-
Table of Contents
The following information outlines the strategies for each of CH Energy Group's business units, including a description of the business core competencies, investmentopportunities, potential risks, and notable activity during 2012. Business unit contributions to operating revenues and net income for years ended December 31, 2012 and2011 are discussed in more detail in the Results of Operations section of this Management's Discussion and Analysis.
Central Hudson
http://www.sec.gov/Archives/edgar/data/18647/000106139313000018/form10k.htm[8/23/2013 4:25:39 PM]
Business Description and Strategy
Central Hudson's earnings are derived primarily from the revenue it generates from delivering energy to approximately 300,000 electric customers and 80,000 natural gascustomers. The delivery rates Central Hudson charges its customers are set by the PSC and are designed to recover the cost of providing safe and reliable service to CentralHudson's customers while providing the opportunity to earn a fair and reasonable return on the capital invested by shareholders.
Central Hudson's strategy is to provide exceptional value to its customers by:· practicing continuous improvement in everything we do;
· investing in transmission and infrastructure to enhance reliability, improve customer satisfaction and reduce risk;
· moderating cost pressures that increase customer bill levels and variability; and
· advocating on behalf of customers and other stakeholders.
Central Hudson believes that it has strong competencies in safe and efficient utility operations, financial management, risk management and regulatory affairs which willfacilitate the achievement of its strategy. Central Hudson's strategic and business planning processes provides goal alignment throughout all levels of the organization in aneffort to meet or exceed the expectations of its key stakeholders.
Opportunities and Risks
Earnings growth is primarily expected to come from increases in net utility plant. Central Hudson invests significant capital on an annual basis to strengthen its distributionsystem by replacing aging infrastructure and to attach new customers to the system. Central Hudson's investments enhance safety and reliability through cost-beneficialsolutions, which improve customer satisfaction and reduce risk. Opportunities to enhance transmission and distribution systems and information systems technologies areevaluated and prioritized based on their designed benefits, projected costs and estimated risks. Management continually monitors and evaluates its capital expenditureforecasts and project priorities, which include certain long-term investment opportunities in the system's distribution infrastructure and potentially in gas and electrictransmission.
-27-
Table of Contents
Future legislative or political actions could result in additional opportunities for infrastructure enhancement. Following Superstorm Sandy, Governor Cuomo formed theMoreland Commission to investigate utility storm preparedness and response. The ultimate recommendations of this Commission, if adopted, could result in increasedinvestment with the goal of reducing damage from storms in the future.
Central Hudson also believes there is an opportunity related to the expansion of its current natural gas customer base. Development of the Marcellus Shale formation andother shale formations has dramatically increased the domestic supply of natural gas and its price has fallen significantly. As a result, natural gas enjoys a significant priceadvantage over alternative fuels and management believes this will make it more attractive to customers. Central Hudson is surveying its service territory to identify themost cost-effective areas in which to expand its gas distribution system and attach new customers.
Central Hudson continues to advance its cost management efforts and seek opportunities to improve existing business processes utilizing Lean Six Sigma techniques. LeanSix Sigma is a data driven approach to develop processes that are faster, higher quality and less costly. Our incremental process improvements focus on producing morerevenue, providing cost savings and creating quality improvements, thereby providing benefits for both CH Energy Group shareholders and Central Hudson customers. Central Hudson also recognizes the importance of innovation and encourages employees to create new value and opportunities to reduce costs and improve quality throughthe application of technology in new ways and creative problem solving.
The key risks management sees in achieving this strategy are the regulatory environment, cost pressures and the economy in Central Hudson's service territory.
Central Hudson's ability to meet its financial objectives is largely dependent on supportive ratemaking practices by the PSC. Risks related to these practices include reducedallowed returns on equity and/or reduced probabilities of achieving allowed returns, an inability to recover the full costs of doing business, declining support for strongcapital structures and credit ratings, changes in deferral accounting that increase volatility of earnings and/or defer cash recovery of our costs, elimination of RDMs andchanges in the mechanisms currently in place for recovery of our commodity purchases. Falling interest rates since our last rate case decision could lead to a decrease in theauthorized ROE in a future rate proceeding. Management believes Central Hudson's commitments to providing safe and reliable service, customer satisfaction, operationalexcellence and promoting positive customer and regulatory relations are important for supportive regulatory relationships and obtaining full cost recovery and competitivereturns for shareholders.
-28-
Table of Contents
In February 2013, Central Hudson experienced a cyber incident that may have exposed certain confidential customer information to an unauthorized third party. CentralHudson commenced an investigation immediately upon becoming aware of the possible unauthorized access and began precautionary communications to Central Hudsoncustomers as well as to the applicable regulatory agencies. Central Hudson has also offered credit monitoring services to the potentially impacted customers free of charge. At this time the investigation is in its early stages, and management has not yet determined whether any customer information was downloaded or misused; therefore noprediction can be made regarding the ultimate outcome of this matter. The financial impact of the costs associated with the communication efforts and credit monitoringservices is currently estimated to be approximately $1 million. The current three-year rate plan, which commenced on July 1, 2010 and will continue until new rates are reset, reduces uncertainty and risk and supports investment inCentral Hudson's infrastructure to improve the quality of service to customers. The key provisions of the rate plan include an authorized regulatory return on equity of

http://www.sec.gov/Archives/edgar/data/18647/000106139313000018/form10k.htm[8/23/2013 4:25:39 PM]
10.0% and a 48% regulatory equity ratio; the continuation of a RDM; full recovery and deferral provisions for purchased electric and gas, MGP site remediation, pensionand OPEB expenses. The rate plan also contains a number of service quality thresholds; performance below these thresholds entails financial penalties. Additionally, PSCstaff approved and incorporated in the development of rates, the revenue requirements associated with Central Hudson's capital expenditure budget for the term of the three-year rate plan, subject to the achievement of certain defined Net Plant targets. The PSC's regulations also provide an opportunity to recover certain extraordinaryexpenditures that are not reflected in rates. However, the 3-pronged test criteria required for approval may limit Central Hudson from recovering some or all of such costs,reducing earnings for shareholders. Management believes the current rate plan and other regulatory orders under which Central Hudson operates demonstrate a constructiverelationship with New York State regulators and the willingness of regulators to enable Central Hudson to earn stable, predictable returns while providing reliable, highquality service and fulfilling New York State energy policy objectives.
The impacts of laws and regulations represent another risk to Central Hudson's strategy. The Moreland Commission formed following Superstorm Sandy was tasked byGovernor Cuomo to investigate utility storm preparedness and response. The outcome of the Commission's investigation and recommendations may create potentialopportunities, but may also create potential financial risks in terms of new or increased standards of performance, with associated penalties for failure to meet the standards. Central Hudson responded timely to the two subpoenas it received during the Moreland Commission investigation requesting information regarding storm preparedness andrestoration. The Moreland Commission issued an Interim Report on January 7, 2013 making recommendations that, if adopted, may affect the regulation of future stormpreparedness and response for all New York utilities, including Central Hudson. Central Hudson believes its current storm preparedness and response is excellent, butopportunities for improvement are continuously pursued. For example, Central Hudson's tree trimming program has proven to be a cost-effective measure to enhancereliability and reduce outages caused by falling branches, particularly in times of severe weather. Central Hudson plans to invest in technology to automate the electricdistribution system, which is expected to further reduce the frequency of outages. Management believes these programs provide the type of cost-effective measures toimprove resilience of the electric distribution system sought by state officials. Furthermore, Central Hudson has been recognized nationally for its storm response by theEdison Electric Institute in each of the past three consecutive years, including its storm response and restoration efforts following Superstorm Sandy in 2012. CentralHudson's dedicated and skilled workforce again demonstrated their ability to organize and execute high quality and efficient restoration for its customers, restoring power to90% of its customers within four days following Superstorm Sandy. Management does not believe it will be cited with any penalties related to prior storm restoration,however, continued regulatory support for recovery of the cost of these programs, along with recovery of incremental restoration costs will be necessary for Central Hudsonto achieve stable and predictable earnings.
-29-
Table of Contents
In addition to the recovery of costs of operation, Central Hudson's current rate structure includes a return on its projected rate base. Rate base represents Central Hudson'sinvestment in its utility infrastructure, less depreciation, adjusted for certain required regulatory items. Changes in tax legislation or regulatory accounting can reduce theamount of Central Hudson rate base, reducing Central Hudson's future rates and potential earnings. For example, Central Hudson's election to utilize bonus depreciation asit has been made available in recent years has had just such an impact. In addition, Central Hudson's change in accounting tax method related to costs to repair and maintainutility assets has resulted in an increase in its deferred tax liability and a corresponding decrease in its rate base. For additional discussion of these tax items, see Note 4 –"Income Tax."
Another risk is the ability to effectively manage costs, which is a key component of Central Hudson's strategy. The continued implementation of Lean Six Sigma techniquesto streamline existing business processes and innovation to create new value will play critical roles in managing the costs of doing business in a sustainable manner as wellas result in continuous improvement in services provided to customers.
The third risk, the economy in Central Hudson's service territory, affects the growth of utility rate base and earnings through a direct relationship to customer additions andpeak demand growth as well as affecting our ability to collect receivables. Management believes the economy in Central Hudson's service territory has good long-termgrowth prospects, but unexpected prolonged downturns could inhibit our ability to meet long-term business objectives. Central Hudson has an economic developmentprogram intended to increase job growth and income in its service territory.
Griffith
Business Description and Strategy
Griffith provides fuel distribution products and services to approximately 55,000 customers in Delaware, Washington, D.C., Maryland, Pennsylvania, Virginia and WestVirginia. Griffith's revenues, cash flows and earnings are derived from the sale and delivery of heating oil, gasoline, diesel fuel, kerosene and propane and from theinstallation and maintenance of heating, ventilating and air conditioning ("HVAC") equipment. For a breakdown of Griffith's gross profit by product and service line for theyears ended December 31, 2012, 2011 and 2010, see the chart in the Results of Operations under the caption – "Griffith."
-30-
Table of Contents
Griffith's strategy is to provide premium service to customers and to increase its profitability and reduce earnings volatility by:
· practicing continuous improvement in everything we do;
· growing through selective "tuck-in" acquisitions;
· managing the impacts of weather on earnings; and
· expanding its service offerings.
Opportunities and Risks
Griffith has a strong regional brand that management believes stands for quality, reliability and value. Griffith intends to continue its marketing efforts and focus on
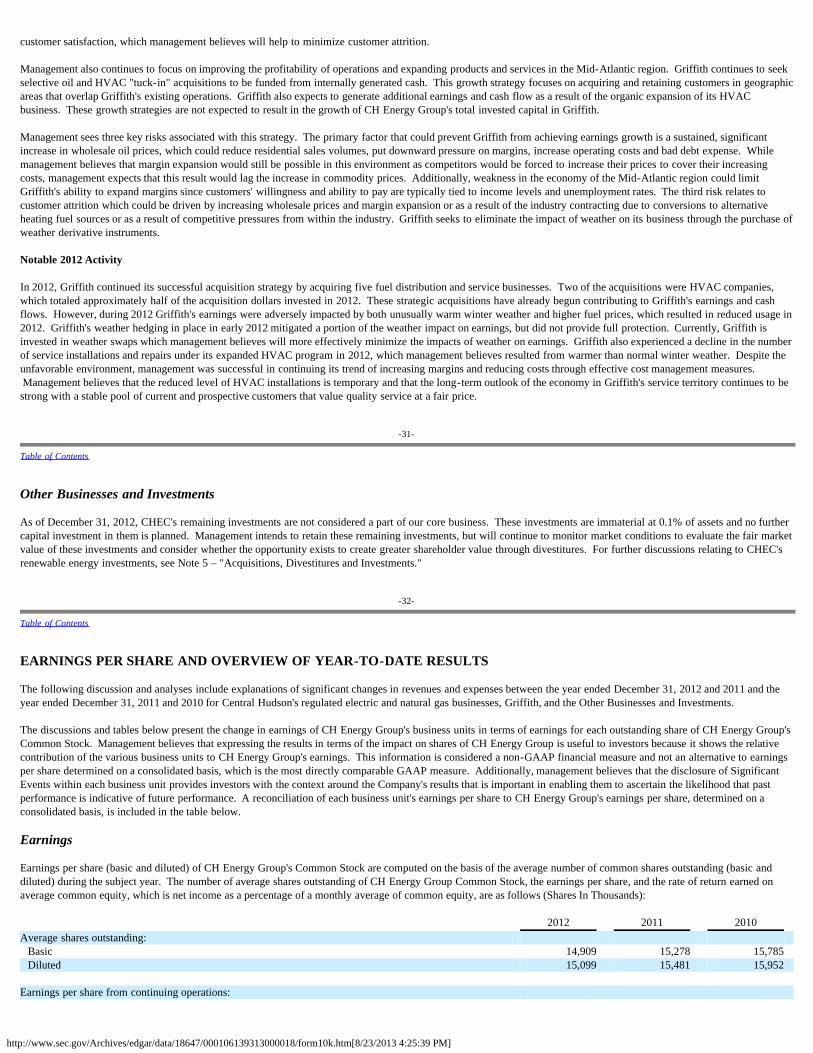
http://www.sec.gov/Archives/edgar/data/18647/000106139313000018/form10k.htm[8/23/2013 4:25:39 PM]
customer satisfaction, which management believes will help to minimize customer attrition.
Management also continues to focus on improving the profitability of operations and expanding products and services in the Mid-Atlantic region. Griffith continues to seekselective oil and HVAC "tuck-in" acquisitions to be funded from internally generated cash. This growth strategy focuses on acquiring and retaining customers in geographicareas that overlap Griffith's existing operations. Griffith also expects to generate additional earnings and cash flow as a result of the organic expansion of its HVACbusiness. These growth strategies are not expected to result in the growth of CH Energy Group's total invested capital in Griffith.
Management sees three key risks associated with this strategy. The primary factor that could prevent Griffith from achieving earnings growth is a sustained, significantincrease in wholesale oil prices, which could reduce residential sales volumes, put downward pressure on margins, increase operating costs and bad debt expense. Whilemanagement believes that margin expansion would still be possible in this environment as competitors would be forced to increase their prices to cover their increasingcosts, management expects that this result would lag the increase in commodity prices. Additionally, weakness in the economy of the Mid-Atlantic region could limitGriffith's ability to expand margins since customers' willingness and ability to pay are typically tied to income levels and unemployment rates. The third risk relates tocustomer attrition which could be driven by increasing wholesale prices and margin expansion or as a result of the industry contracting due to conversions to alternativeheating fuel sources or as a result of competitive pressures from within the industry. Griffith seeks to eliminate the impact of weather on its business through the purchase ofweather derivative instruments.
Notable 2012 Activity
In 2012, Griffith continued its successful acquisition strategy by acquiring five fuel distribution and service businesses. Two of the acquisitions were HVAC companies,which totaled approximately half of the acquisition dollars invested in 2012. These strategic acquisitions have already begun contributing to Griffith's earnings and cashflows. However, during 2012 Griffith's earnings were adversely impacted by both unusually warm winter weather and higher fuel prices, which resulted in reduced usage in2012. Griffith's weather hedging in place in early 2012 mitigated a portion of the weather impact on earnings, but did not provide full protection. Currently, Griffith isinvested in weather swaps which management believes will more effectively minimize the impacts of weather on earnings. Griffith also experienced a decline in the numberof service installations and repairs under its expanded HVAC program in 2012, which management believes resulted from warmer than normal winter weather. Despite theunfavorable environment, management was successful in continuing its trend of increasing margins and reducing costs through effective cost management measures. Management believes that the reduced level of HVAC installations is temporary and that the long-term outlook of the economy in Griffith's service territory continues to bestrong with a stable pool of current and prospective customers that value quality service at a fair price.
-31-
Table of Contents
Other Businesses and Investments
As of December 31, 2012, CHEC's remaining investments are not considered a part of our core business. These investments are immaterial at 0.1% of assets and no furthercapital investment in them is planned. Management intends to retain these remaining investments, but will continue to monitor market conditions to evaluate the fair marketvalue of these investments and consider whether the opportunity exists to create greater shareholder value through divestitures. For further discussions relating to CHEC'srenewable energy investments, see Note 5 – "Acquisitions, Divestitures and Investments."
-32-
Table of Contents
EARNINGS PER SHARE AND OVERVIEW OF YEAR-TO-DATE RESULTS
The following discussion and analyses include explanations of significant changes in revenues and expenses between the year ended December 31, 2012 and 2011 and theyear ended December 31, 2011 and 2010 for Central Hudson's regulated electric and natural gas businesses, Griffith, and the Other Businesses and Investments.
The discussions and tables below present the change in earnings of CH Energy Group's business units in terms of earnings for each outstanding share of CH Energy Group'sCommon Stock. Management believes that expressing the results in terms of the impact on shares of CH Energy Group is useful to investors because it shows the relativecontribution of the various business units to CH Energy Group's earnings. This information is considered a non-GAAP financial measure and not an alternative to earningsper share determined on a consolidated basis, which is the most directly comparable GAAP measure. Additionally, management believes that the disclosure of SignificantEvents within each business unit provides investors with the context around the Company's results that is important in enabling them to ascertain the likelihood that pastperformance is indicative of future performance. A reconciliation of each business unit's earnings per share to CH Energy Group's earnings per share, determined on aconsolidated basis, is included in the table below.
Earnings
Earnings per share (basic and diluted) of CH Energy Group's Common Stock are computed on the basis of the average number of common shares outstanding (basic anddiluted) during the subject year. The number of average shares outstanding of CH Energy Group Common Stock, the earnings per share, and the rate of return earned onaverage common equity, which is net income as a percentage of a monthly average of common equity, are as follows (Shares In Thousands): 2012 2011 2010 Average shares outstanding:
Basic 14,909 15,278 15,785 Diluted 15,099 15,481 15,952
Earnings per share from continuing operations:
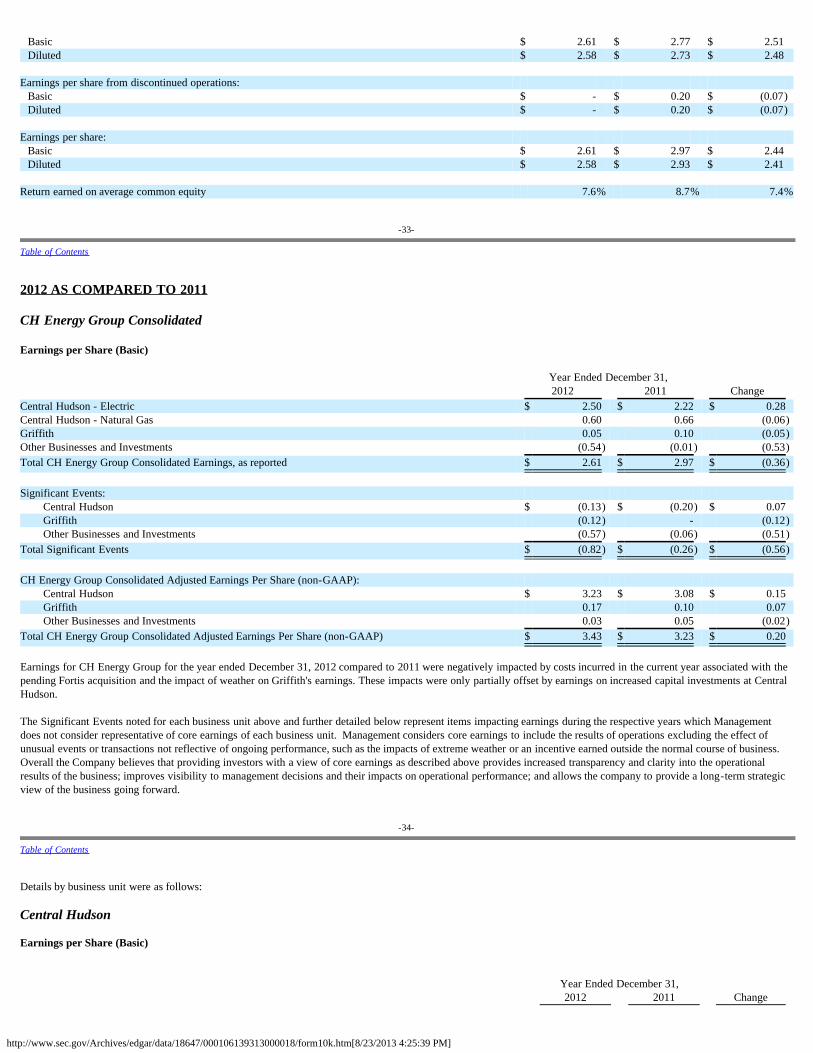
http://www.sec.gov/Archives/edgar/data/18647/000106139313000018/form10k.htm[8/23/2013 4:25:39 PM]
Basic $ 2.61 $ 2.77 $ 2.51 Diluted $ 2.58 $ 2.73 $ 2.48
Earnings per share from discontinued operations:
Basic $ - $ 0.20 $ (0.07)Diluted $ - $ 0.20 $ (0.07)
Earnings per share:
Basic $ 2.61 $ 2.97 $ 2.44 Diluted $ 2.58 $ 2.93 $ 2.41
Return earned on average common equity 7.6% 8.7% 7.4%
-33-
Table of Contents
2012 AS COMPARED TO 2011 CH Energy Group Consolidated Earnings per Share (Basic) Year Ended December 31, 2012 2011 Change Central Hudson - Electric $ 2.50 $ 2.22 $ 0.28 Central Hudson - Natural Gas 0.60 0.66 (0.06)Griffith 0.05 0.10 (0.05)Other Businesses and Investments (0.54) (0.01) (0.53)Total CH Energy Group Consolidated Earnings, as reported $ 2.61 $ 2.97 $ (0.36) Significant Events:
Central Hudson $ (0.13) $ (0.20) $ 0.07 Griffith (0.12) - (0.12)Other Businesses and Investments (0.57) (0.06) (0.51)
Total Significant Events $ (0.82) $ (0.26) $ (0.56) CH Energy Group Consolidated Adjusted Earnings Per Share (non-GAAP):
Central Hudson $ 3.23 $ 3.08 $ 0.15 Griffith 0.17 0.10 0.07 Other Businesses and Investments 0.03 0.05 (0.02)
Total CH Energy Group Consolidated Adjusted Earnings Per Share (non-GAAP) $ 3.43 $ 3.23 $ 0.20 Earnings for CH Energy Group for the year ended December 31, 2012 compared to 2011 were negatively impacted by costs incurred in the current year associated with thepending Fortis acquisition and the impact of weather on Griffith's earnings. These impacts were only partially offset by earnings on increased capital investments at CentralHudson. The Significant Events noted for each business unit above and further detailed below represent items impacting earnings during the respective years which Managementdoes not consider representative of core earnings of each business unit. Management considers core earnings to include the results of operations excluding the effect ofunusual events or transactions not reflective of ongoing performance, such as the impacts of extreme weather or an incentive earned outside the normal course of business.Overall the Company believes that providing investors with a view of core earnings as described above provides increased transparency and clarity into the operationalresults of the business; improves visibility to management decisions and their impacts on operational performance; and allows the company to provide a long-term strategicview of the business going forward.
-34-
Table of Contents
Details by business unit were as follows: Central Hudson Earnings per Share (Basic)
Year Ended December 31, 2012 2011 Change
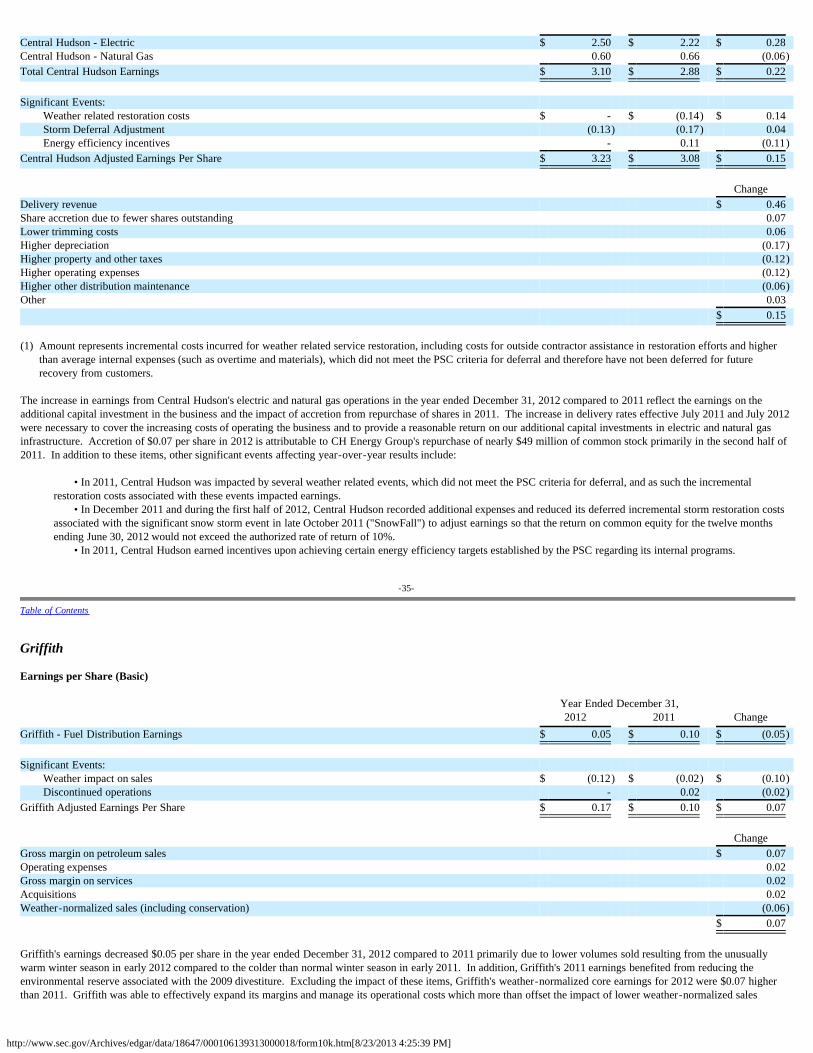
http://www.sec.gov/Archives/edgar/data/18647/000106139313000018/form10k.htm[8/23/2013 4:25:39 PM]
Central Hudson - Electric $ 2.50 $ 2.22 $ 0.28 Central Hudson - Natural Gas 0.60 0.66 (0.06)Total Central Hudson Earnings $ 3.10 $ 2.88 $ 0.22 Significant Events:
Weather related restoration costs $ - $ (0.14) $ 0.14 Storm Deferral Adjustment (0.13) (0.17) 0.04 Energy efficiency incentives - 0.11 (0.11)
Central Hudson Adjusted Earnings Per Share $ 3.23 $ 3.08 $ 0.15 Change Delivery revenue $ 0.46 Share accretion due to fewer shares outstanding 0.07 Lower trimming costs 0.06 Higher depreciation (0.17)Higher property and other taxes (0.12)Higher operating expenses (0.12)Higher other distribution maintenance (0.06)Other 0.03 $ 0.15 (1) Amount represents incremental costs incurred for weather related service restoration, including costs for outside contractor assistance in restoration efforts and higher
than average internal expenses (such as overtime and materials), which did not meet the PSC criteria for deferral and therefore have not been deferred for futurerecovery from customers.
The increase in earnings from Central Hudson's electric and natural gas operations in the year ended December 31, 2012 compared to 2011 reflect the earnings on theadditional capital investment in the business and the impact of accretion from repurchase of shares in 2011. The increase in delivery rates effective July 2011 and July 2012were necessary to cover the increasing costs of operating the business and to provide a reasonable return on our additional capital investments in electric and natural gasinfrastructure. Accretion of $0.07 per share in 2012 is attributable to CH Energy Group's repurchase of nearly $49 million of common stock primarily in the second half of2011. In addition to these items, other significant events affecting year-over-year results include:
• In 2011, Central Hudson was impacted by several weather related events, which did not meet the PSC criteria for deferral, and as such the incrementalrestoration costs associated with these events impacted earnings.
• In December 2011 and during the first half of 2012, Central Hudson recorded additional expenses and reduced its deferred incremental storm restoration costsassociated with the significant snow storm event in late October 2011 ("SnowFall") to adjust earnings so that the return on common equity for the twelve monthsending June 30, 2012 would not exceed the authorized rate of return of 10%.
• In 2011, Central Hudson earned incentives upon achieving certain energy efficiency targets established by the PSC regarding its internal programs.
-35-
Table of Contents
Griffith Earnings per Share (Basic) Year Ended December 31, 2012 2011 Change Griffith - Fuel Distribution Earnings $ 0.05 $ 0.10 $ (0.05) Significant Events:
Weather impact on sales $ (0.12) $ (0.02) $ (0.10)Discontinued operations - 0.02 (0.02)
Griffith Adjusted Earnings Per Share $ 0.17 $ 0.10 $ 0.07 Change Gross margin on petroleum sales $ 0.07 Operating expenses 0.02 Gross margin on services 0.02 Acquisitions 0.02 Weather-normalized sales (including conservation) (0.06) $ 0.07 Griffith's earnings decreased $0.05 per share in the year ended December 31, 2012 compared to 2011 primarily due to lower volumes sold resulting from the unusuallywarm winter season in early 2012 compared to the colder than normal winter season in early 2011. In addition, Griffith's 2011 earnings benefited from reducing theenvironmental reserve associated with the 2009 divestiture. Excluding the impact of these items, Griffith's weather-normalized core earnings for 2012 were $0.07 higherthan 2011. Griffith was able to effectively expand its margins and manage its operational costs which more than offset the impact of lower weather-normalized sales
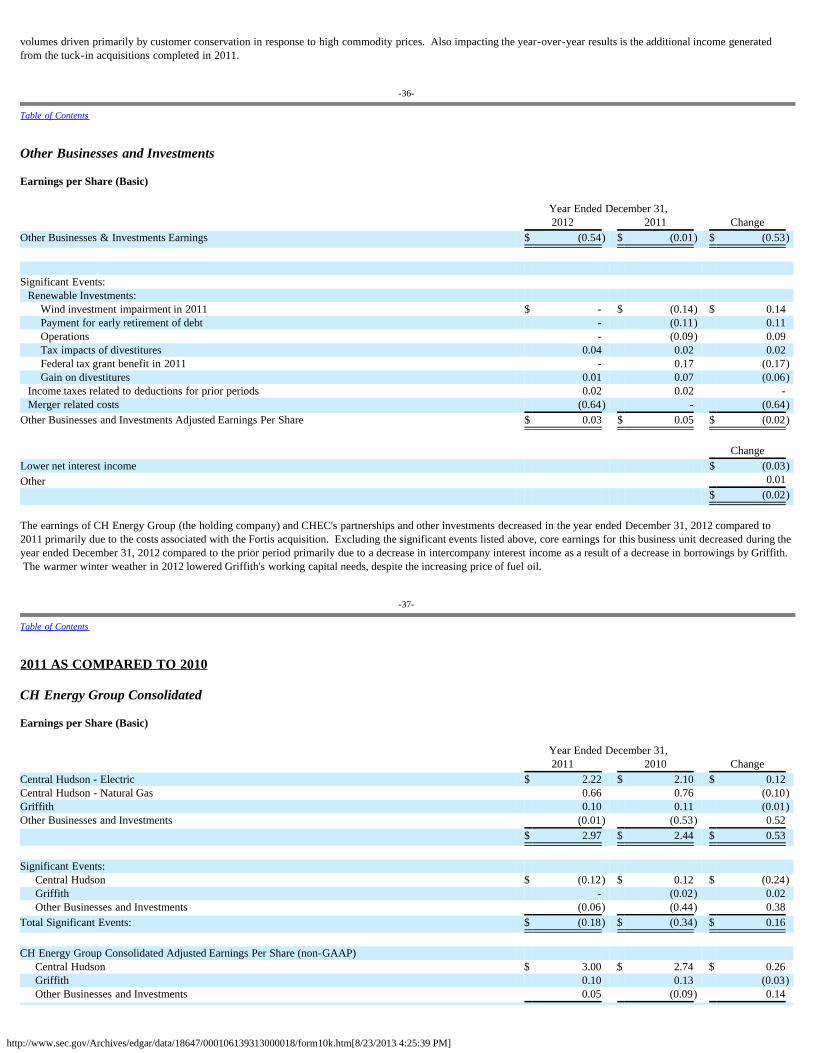
http://www.sec.gov/Archives/edgar/data/18647/000106139313000018/form10k.htm[8/23/2013 4:25:39 PM]
volumes driven primarily by customer conservation in response to high commodity prices. Also impacting the year-over-year results is the additional income generatedfrom the tuck-in acquisitions completed in 2011.
-36-
Table of Contents
Other Businesses and Investments Earnings per Share (Basic) Year Ended December 31, 2012 2011 Change Other Businesses & Investments Earnings $ (0.54) $ (0.01) $ (0.53) Significant Events: Renewable Investments:
Wind investment impairment in 2011 $ - $ (0.14) $ 0.14 Payment for early retirement of debt - (0.11) 0.11 Operations - (0.09) 0.09 Tax impacts of divestitures 0.04 0.02 0.02 Federal tax grant benefit in 2011 - 0.17 (0.17)Gain on divestitures 0.01 0.07 (0.06)
Income taxes related to deductions for prior periods 0.02 0.02 - Merger related costs (0.64) - (0.64)Other Businesses and Investments Adjusted Earnings Per Share $ 0.03 $ 0.05 $ (0.02) Change Lower net interest income $ (0.03)Other 0.01 $ (0.02) The earnings of CH Energy Group (the holding company) and CHEC's partnerships and other investments decreased in the year ended December 31, 2012 compared to2011 primarily due to the costs associated with the Fortis acquisition. Excluding the significant events listed above, core earnings for this business unit decreased during theyear ended December 31, 2012 compared to the prior period primarily due to a decrease in intercompany interest income as a result of a decrease in borrowings by Griffith. The warmer winter weather in 2012 lowered Griffith's working capital needs, despite the increasing price of fuel oil.
-37-
Table of Contents
2011 AS COMPARED TO 2010 CH Energy Group Consolidated Earnings per Share (Basic) Year Ended December 31, 2011 2010 Change Central Hudson - Electric $ 2.22 $ 2.10 $ 0.12 Central Hudson - Natural Gas 0.66 0.76 (0.10)Griffith 0.10 0.11 (0.01)Other Businesses and Investments (0.01) (0.53) 0.52 $ 2.97 $ 2.44 $ 0.53 Significant Events:
Central Hudson $ (0.12) $ 0.12 $ (0.24)Griffith - (0.02) 0.02 Other Businesses and Investments (0.06) (0.44) 0.38
Total Significant Events: $ (0.18) $ (0.34) $ 0.16 CH Energy Group Consolidated Adjusted Earnings Per Share (non-GAAP)
Central Hudson $ 3.00 $ 2.74 $ 0.26 Griffith 0.10 0.13 (0.03)Other Businesses and Investments 0.05 (0.09) 0.14
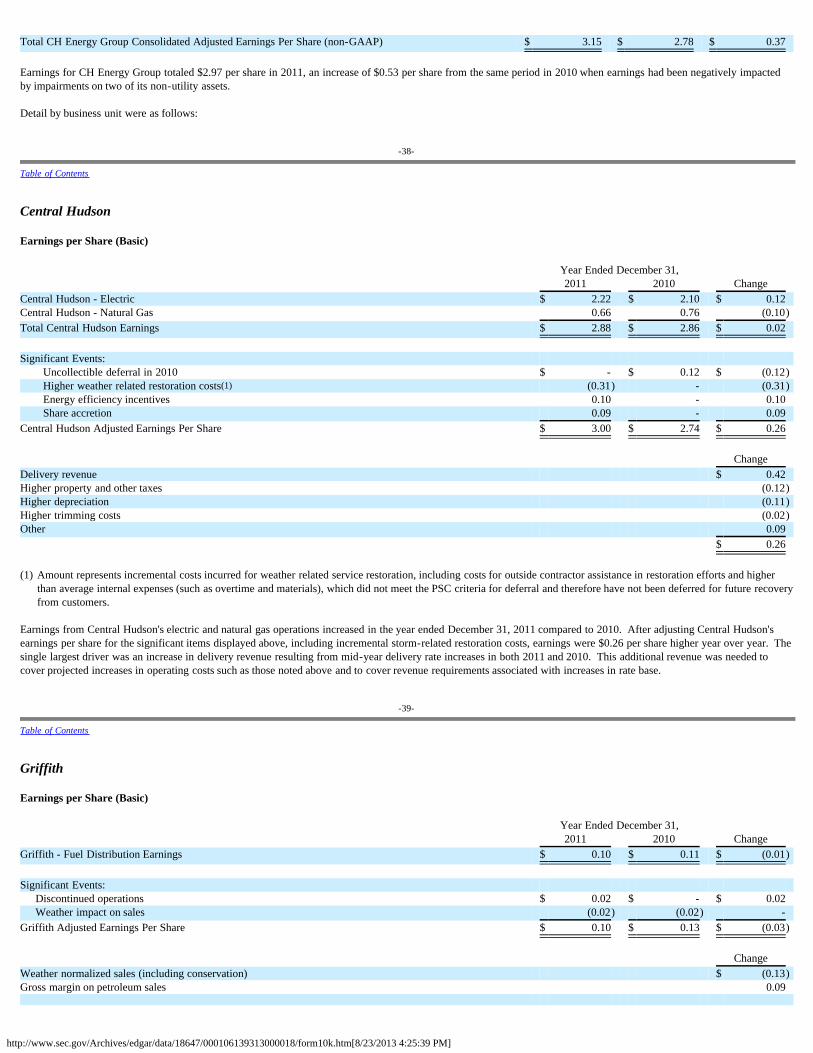
http://www.sec.gov/Archives/edgar/data/18647/000106139313000018/form10k.htm[8/23/2013 4:25:39 PM]
Total CH Energy Group Consolidated Adjusted Earnings Per Share (non-GAAP) $ 3.15 $ 2.78 $ 0.37 Earnings for CH Energy Group totaled $2.97 per share in 2011, an increase of $0.53 per share from the same period in 2010 when earnings had been negatively impactedby impairments on two of its non-utility assets.
Detail by business unit were as follows:
-38-
Table of Contents
Central Hudson Earnings per Share (Basic) Year Ended December 31, 2011 2010 Change Central Hudson - Electric $ 2.22 $ 2.10 $ 0.12 Central Hudson - Natural Gas 0.66 0.76 (0.10)Total Central Hudson Earnings $ 2.88 $ 2.86 $ 0.02 Significant Events:
Uncollectible deferral in 2010 $ - $ 0.12 $ (0.12)Higher weather related restoration costs(1) (0.31) - (0.31)Energy efficiency incentives 0.10 - 0.10 Share accretion 0.09 - 0.09
Central Hudson Adjusted Earnings Per Share $ 3.00 $ 2.74 $ 0.26 Change Delivery revenue $ 0.42 Higher property and other taxes (0.12)Higher depreciation (0.11)Higher trimming costs (0.02)Other 0.09 $ 0.26 (1) Amount represents incremental costs incurred for weather related service restoration, including costs for outside contractor assistance in restoration efforts and higher
than average internal expenses (such as overtime and materials), which did not meet the PSC criteria for deferral and therefore have not been deferred for future recoveryfrom customers.
Earnings from Central Hudson's electric and natural gas operations increased in the year ended December 31, 2011 compared to 2010. After adjusting Central Hudson'searnings per share for the significant items displayed above, including incremental storm-related restoration costs, earnings were $0.26 per share higher year over year. Thesingle largest driver was an increase in delivery revenue resulting from mid-year delivery rate increases in both 2011 and 2010. This additional revenue was needed tocover projected increases in operating costs such as those noted above and to cover revenue requirements associated with increases in rate base.
-39-
Table of Contents
Griffith Earnings per Share (Basic) Year Ended December 31, 2011 2010 Change Griffith - Fuel Distribution Earnings $ 0.10 $ 0.11 $ (0.01) Significant Events:
Discontinued operations $ 0.02 $ - $ 0.02 Weather impact on sales (0.02) (0.02) -
Griffith Adjusted Earnings Per Share $ 0.10 $ 0.13 $ (0.03) Change Weather normalized sales (including conservation) $ (0.13)Gross margin on petroleum sales 0.09
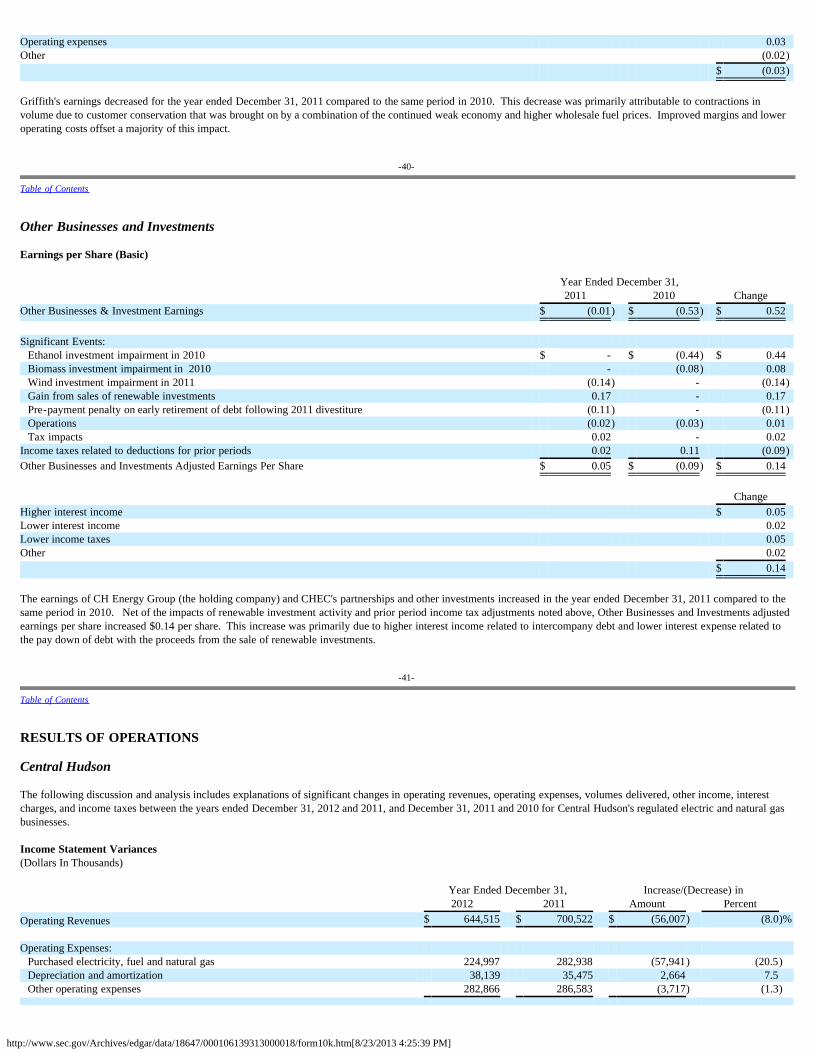
http://www.sec.gov/Archives/edgar/data/18647/000106139313000018/form10k.htm[8/23/2013 4:25:39 PM]
Operating expenses 0.03 Other (0.02) $ (0.03) Griffith's earnings decreased for the year ended December 31, 2011 compared to the same period in 2010. This decrease was primarily attributable to contractions involume due to customer conservation that was brought on by a combination of the continued weak economy and higher wholesale fuel prices. Improved margins and loweroperating costs offset a majority of this impact.
-40-
Table of Contents
Other Businesses and Investments Earnings per Share (Basic) Year Ended December 31, 2011 2010 Change Other Businesses & Investment Earnings $ (0.01) $ (0.53) $ 0.52 Significant Events: Ethanol investment impairment in 2010 $ - $ (0.44) $ 0.44 Biomass investment impairment in 2010 - (0.08) 0.08 Wind investment impairment in 2011 (0.14) - (0.14) Gain from sales of renewable investments 0.17 - 0.17 Pre-payment penalty on early retirement of debt following 2011 divestiture (0.11) - (0.11) Operations (0.02) (0.03) 0.01 Tax impacts 0.02 - 0.02 Income taxes related to deductions for prior periods 0.02 0.11 (0.09)Other Businesses and Investments Adjusted Earnings Per Share $ 0.05 $ (0.09) $ 0.14 Change Higher interest income $ 0.05 Lower interest income 0.02 Lower income taxes 0.05 Other 0.02 $ 0.14 The earnings of CH Energy Group (the holding company) and CHEC's partnerships and other investments increased in the year ended December 31, 2011 compared to thesame period in 2010. Net of the impacts of renewable investment activity and prior period income tax adjustments noted above, Other Businesses and Investments adjustedearnings per share increased $0.14 per share. This increase was primarily due to higher interest income related to intercompany debt and lower interest expense related tothe pay down of debt with the proceeds from the sale of renewable investments.
-41-
Table of Contents
RESULTS OF OPERATIONS
Central Hudson
The following discussion and analysis includes explanations of significant changes in operating revenues, operating expenses, volumes delivered, other income, interestcharges, and income taxes between the years ended December 31, 2012 and 2011, and December 31, 2011 and 2010 for Central Hudson's regulated electric and natural gasbusinesses. Income Statement Variances(Dollars In Thousands) Year Ended December 31, Increase/(Decrease) in 2012 2011 Amount Percent Operating Revenues $ 644,515 $ 700,522 $ (56,007) (8.0)% Operating Expenses: Purchased electricity, fuel and natural gas 224,997 282,938 (57,941) (20.5) Depreciation and amortization 38,139 35,475 2,664 7.5 Other operating expenses 282,866 286,583 (3,717) (1.3)
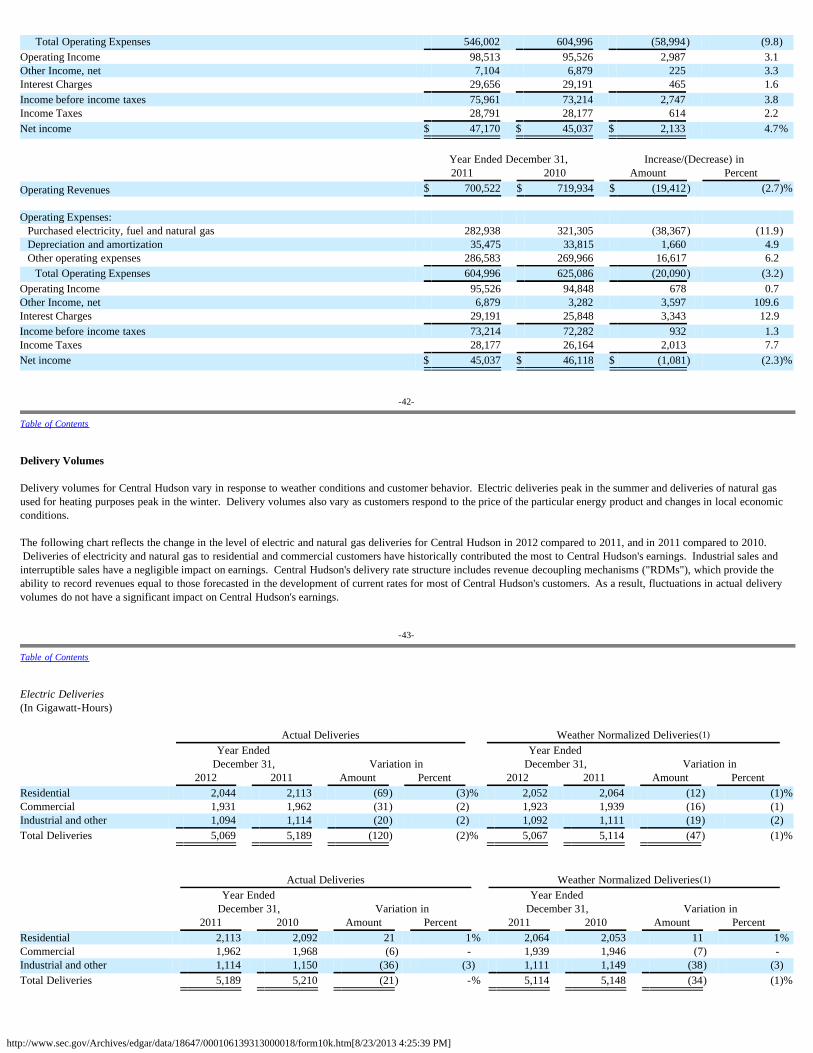
http://www.sec.gov/Archives/edgar/data/18647/000106139313000018/form10k.htm[8/23/2013 4:25:39 PM]
Total Operating Expenses 546,002 604,996 (58,994) (9.8)Operating Income 98,513 95,526 2,987 3.1 Other Income, net 7,104 6,879 225 3.3 Interest Charges 29,656 29,191 465 1.6 Income before income taxes 75,961 73,214 2,747 3.8 Income Taxes 28,791 28,177 614 2.2 Net income $ 47,170 $ 45,037 $ 2,133 4.7% Year Ended December 31, Increase/(Decrease) in 2011 2010 Amount Percent Operating Revenues $ 700,522 $ 719,934 $ (19,412) (2.7)% Operating Expenses: Purchased electricity, fuel and natural gas 282,938 321,305 (38,367) (11.9) Depreciation and amortization 35,475 33,815 1,660 4.9 Other operating expenses 286,583 269,966 16,617 6.2 Total Operating Expenses 604,996 625,086 (20,090) (3.2)Operating Income 95,526 94,848 678 0.7 Other Income, net 6,879 3,282 3,597 109.6 Interest Charges 29,191 25,848 3,343 12.9 Income before income taxes 73,214 72,282 932 1.3 Income Taxes 28,177 26,164 2,013 7.7 Net income $ 45,037 $ 46,118 $ (1,081) (2.3)%
-42-
Table of Contents
Delivery Volumes
Delivery volumes for Central Hudson vary in response to weather conditions and customer behavior. Electric deliveries peak in the summer and deliveries of natural gasused for heating purposes peak in the winter. Delivery volumes also vary as customers respond to the price of the particular energy product and changes in local economicconditions.
The following chart reflects the change in the level of electric and natural gas deliveries for Central Hudson in 2012 compared to 2011, and in 2011 compared to 2010. Deliveries of electricity and natural gas to residential and commercial customers have historically contributed the most to Central Hudson's earnings. Industrial sales andinterruptible sales have a negligible impact on earnings. Central Hudson's delivery rate structure includes revenue decoupling mechanisms ("RDMs"), which provide theability to record revenues equal to those forecasted in the development of current rates for most of Central Hudson's customers. As a result, fluctuations in actual deliveryvolumes do not have a significant impact on Central Hudson's earnings.
-43-
Table of Contents
Electric Deliveries(In Gigawatt-Hours) Actual Deliveries Weather Normalized Deliveries(1) Year Ended Year Ended December 31, Variation in December 31, Variation in 2012 2011 Amount Percent 2012 2011 Amount Percent Residential 2,044 2,113 (69) (3)% 2,052 2,064 (12) (1)%Commercial 1,931 1,962 (31) (2) 1,923 1,939 (16) (1)Industrial and other 1,094 1,114 (20) (2) 1,092 1,111 (19) (2)Total Deliveries 5,069 5,189 (120) (2)% 5,067 5,114 (47) (1)% Actual Deliveries Weather Normalized Deliveries(1) Year Ended Year Ended December 31, Variation in December 31, Variation in 2011 2010 Amount Percent 2011 2010 Amount Percent Residential 2,113 2,092 21 1% 2,064 2,053 11 1%Commercial 1,962 1,968 (6) - 1,939 1,946 (7) - Industrial and other 1,114 1,150 (36) (3) 1,111 1,149 (38) (3)Total Deliveries 5,189 5,210 (21) -% 5,114 5,148 (34) (1)%
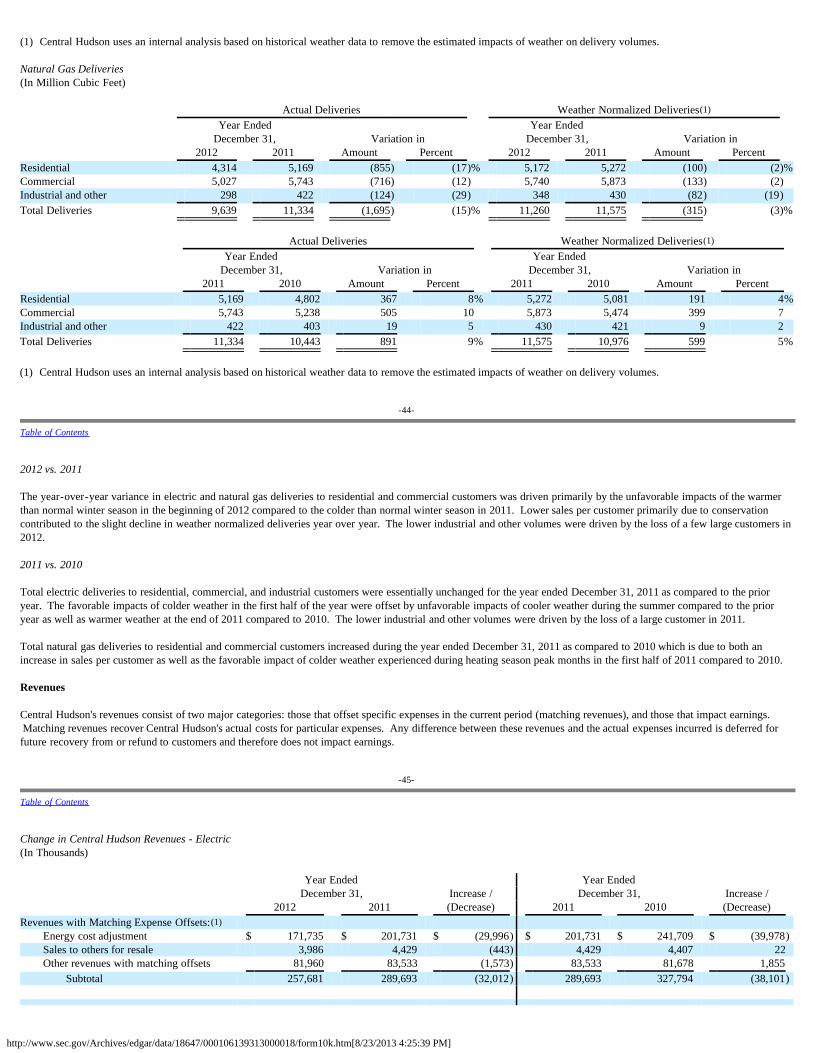
http://www.sec.gov/Archives/edgar/data/18647/000106139313000018/form10k.htm[8/23/2013 4:25:39 PM]
(1) Central Hudson uses an internal analysis based on historical weather data to remove the estimated impacts of weather on delivery volumes. Natural Gas Deliveries(In Million Cubic Feet) Actual Deliveries Weather Normalized Deliveries(1) Year Ended Year Ended December 31, Variation in December 31, Variation in 2012 2011 Amount Percent 2012 2011 Amount Percent Residential 4,314 5,169 (855) (17)% 5,172 5,272 (100) (2)%Commercial 5,027 5,743 (716) (12) 5,740 5,873 (133) (2)Industrial and other 298 422 (124) (29) 348 430 (82) (19)Total Deliveries 9,639 11,334 (1,695) (15)% 11,260 11,575 (315) (3)% Actual Deliveries Weather Normalized Deliveries(1) Year Ended Year Ended December 31, Variation in December 31, Variation in 2011 2010 Amount Percent 2011 2010 Amount Percent Residential 5,169 4,802 367 8% 5,272 5,081 191 4%Commercial 5,743 5,238 505 10 5,873 5,474 399 7 Industrial and other 422 403 19 5 430 421 9 2 Total Deliveries 11,334 10,443 891 9% 11,575 10,976 599 5% (1) Central Hudson uses an internal analysis based on historical weather data to remove the estimated impacts of weather on delivery volumes.
-44-
Table of Contents
2012 vs. 2011
The year-over-year variance in electric and natural gas deliveries to residential and commercial customers was driven primarily by the unfavorable impacts of the warmerthan normal winter season in the beginning of 2012 compared to the colder than normal winter season in 2011. Lower sales per customer primarily due to conservationcontributed to the slight decline in weather normalized deliveries year over year. The lower industrial and other volumes were driven by the loss of a few large customers in2012. 2011 vs. 2010
Total electric deliveries to residential, commercial, and industrial customers were essentially unchanged for the year ended December 31, 2011 as compared to the prioryear. The favorable impacts of colder weather in the first half of the year were offset by unfavorable impacts of cooler weather during the summer compared to the prioryear as well as warmer weather at the end of 2011 compared to 2010. The lower industrial and other volumes were driven by the loss of a large customer in 2011. Total natural gas deliveries to residential and commercial customers increased during the year ended December 31, 2011 as compared to 2010 which is due to both anincrease in sales per customer as well as the favorable impact of colder weather experienced during heating season peak months in the first half of 2011 compared to 2010.
Revenues
Central Hudson's revenues consist of two major categories: those that offset specific expenses in the current period (matching revenues), and those that impact earnings. Matching revenues recover Central Hudson's actual costs for particular expenses. Any difference between these revenues and the actual expenses incurred is deferred forfuture recovery from or refund to customers and therefore does not impact earnings.
-45-
Table of Contents
Change in Central Hudson Revenues - Electric(In Thousands) Year Ended Year Ended December 31, Increase / December 31, Increase / 2012 2011 (Decrease) 2011 2010 (Decrease) Revenues with Matching Expense Offsets:(1)
Energy cost adjustment $ 171,735 $ 201,731 $ (29,996) $ 201,731 $ 241,709 $ (39,978)Sales to others for resale 3,986 4,429 (443) 4,429 4,407 22 Other revenues with matching offsets 81,960 83,533 (1,573) 83,533 81,678 1,855
Subtotal 257,681 289,693 (32,012) 289,693 327,794 (38,101)
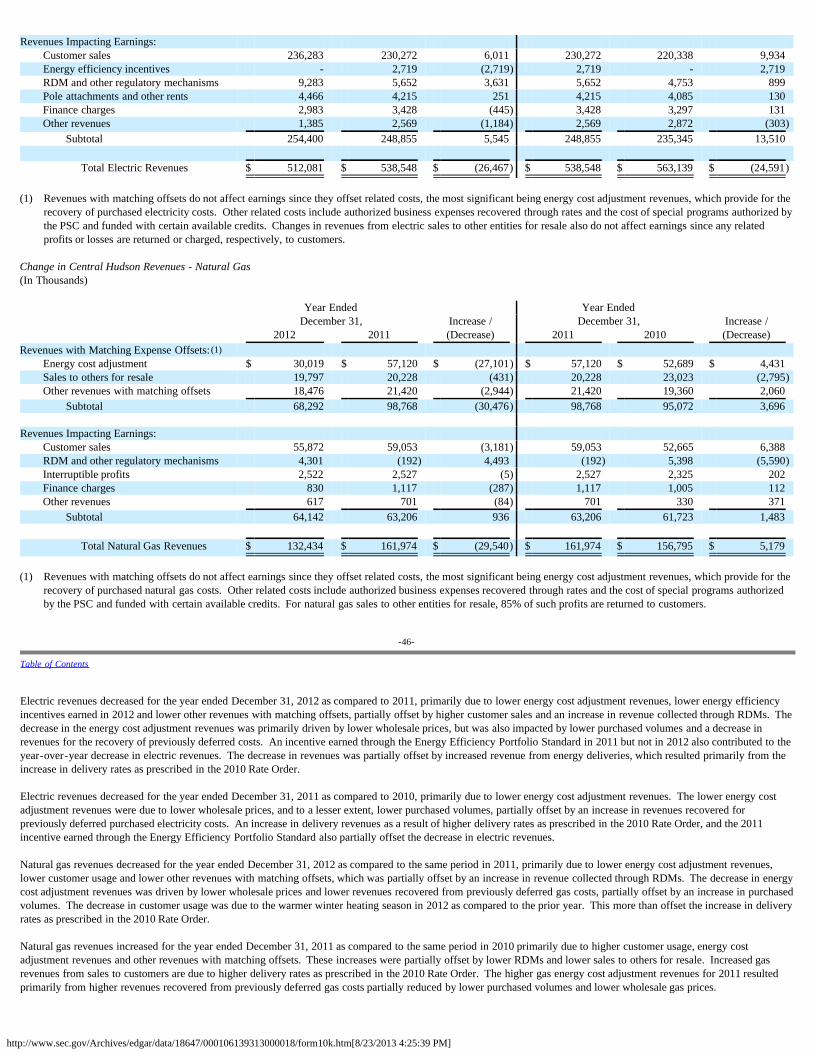
http://www.sec.gov/Archives/edgar/data/18647/000106139313000018/form10k.htm[8/23/2013 4:25:39 PM]
Revenues Impacting Earnings: Customer sales 236,283 230,272 6,011 230,272 220,338 9,934 Energy efficiency incentives - 2,719 (2,719) 2,719 - 2,719 RDM and other regulatory mechanisms 9,283 5,652 3,631 5,652 4,753 899 Pole attachments and other rents 4,466 4,215 251 4,215 4,085 130 Finance charges 2,983 3,428 (445) 3,428 3,297 131 Other revenues 1,385 2,569 (1,184) 2,569 2,872 (303)
Subtotal 254,400 248,855 5,545 248,855 235,345 13,510
Total Electric Revenues $ 512,081 $ 538,548 $ (26,467) $ 538,548 $ 563,139 $ (24,591) (1) Revenues with matching offsets do not affect earnings since they offset related costs, the most significant being energy cost adjustment revenues, which provide for the
recovery of purchased electricity costs. Other related costs include authorized business expenses recovered through rates and the cost of special programs authorized bythe PSC and funded with certain available credits. Changes in revenues from electric sales to other entities for resale also do not affect earnings since any relatedprofits or losses are returned or charged, respectively, to customers.
Change in Central Hudson Revenues - Natural Gas(In Thousands) Year Ended Year Ended December 31, Increase / December 31, Increase / 2012 2011 (Decrease) 2011 2010 (Decrease) Revenues with Matching Expense Offsets: (1)
Energy cost adjustment $ 30,019 $ 57,120 $ (27,101) $ 57,120 $ 52,689 $ 4,431 Sales to others for resale 19,797 20,228 (431) 20,228 23,023 (2,795)Other revenues with matching offsets 18,476 21,420 (2,944) 21,420 19,360 2,060
Subtotal 68,292 98,768 (30,476) 98,768 95,072 3,696 Revenues Impacting Earnings:
Customer sales 55,872 59,053 (3,181) 59,053 52,665 6,388 RDM and other regulatory mechanisms 4,301 (192) 4,493 (192) 5,398 (5,590)Interruptible profits 2,522 2,527 (5) 2,527 2,325 202 Finance charges 830 1,117 (287) 1,117 1,005 112 Other revenues 617 701 (84) 701 330 371
Subtotal 64,142 63,206 936 63,206 61,723 1,483
Total Natural Gas Revenues $ 132,434 $ 161,974 $ (29,540) $ 161,974 $ 156,795 $ 5,179 (1) Revenues with matching offsets do not affect earnings since they offset related costs, the most significant being energy cost adjustment revenues, which provide for the
recovery of purchased natural gas costs. Other related costs include authorized business expenses recovered through rates and the cost of special programs authorizedby the PSC and funded with certain available credits. For natural gas sales to other entities for resale, 85% of such profits are returned to customers.
-46-
Table of Contents
Electric revenues decreased for the year ended December 31, 2012 as compared to 2011, primarily due to lower energy cost adjustment revenues, lower energy efficiencyincentives earned in 2012 and lower other revenues with matching offsets, partially offset by higher customer sales and an increase in revenue collected through RDMs. Thedecrease in the energy cost adjustment revenues was primarily driven by lower wholesale prices, but was also impacted by lower purchased volumes and a decrease inrevenues for the recovery of previously deferred costs. An incentive earned through the Energy Efficiency Portfolio Standard in 2011 but not in 2012 also contributed to theyear-over-year decrease in electric revenues. The decrease in revenues was partially offset by increased revenue from energy deliveries, which resulted primarily from theincrease in delivery rates as prescribed in the 2010 Rate Order.
Electric revenues decreased for the year ended December 31, 2011 as compared to 2010, primarily due to lower energy cost adjustment revenues. The lower energy costadjustment revenues were due to lower wholesale prices, and to a lesser extent, lower purchased volumes, partially offset by an increase in revenues recovered forpreviously deferred purchased electricity costs. An increase in delivery revenues as a result of higher delivery rates as prescribed in the 2010 Rate Order, and the 2011incentive earned through the Energy Efficiency Portfolio Standard also partially offset the decrease in electric revenues.
Natural gas revenues decreased for the year ended December 31, 2012 as compared to the same period in 2011, primarily due to lower energy cost adjustment revenues,lower customer usage and lower other revenues with matching offsets, which was partially offset by an increase in revenue collected through RDMs. The decrease in energycost adjustment revenues was driven by lower wholesale prices and lower revenues recovered from previously deferred gas costs, partially offset by an increase in purchasedvolumes. The decrease in customer usage was due to the warmer winter heating season in 2012 as compared to the prior year. This more than offset the increase in deliveryrates as prescribed in the 2010 Rate Order.
Natural gas revenues increased for the year ended December 31, 2011 as compared to the same period in 2010 primarily due to higher customer usage, energy costadjustment revenues and other revenues with matching offsets. These increases were partially offset by lower RDMs and lower sales to others for resale. Increased gasrevenues from sales to customers are due to higher delivery rates as prescribed in the 2010 Rate Order. The higher gas energy cost adjustment revenues for 2011 resultedprimarily from higher revenues recovered from previously deferred gas costs partially reduced by lower purchased volumes and lower wholesale gas prices.
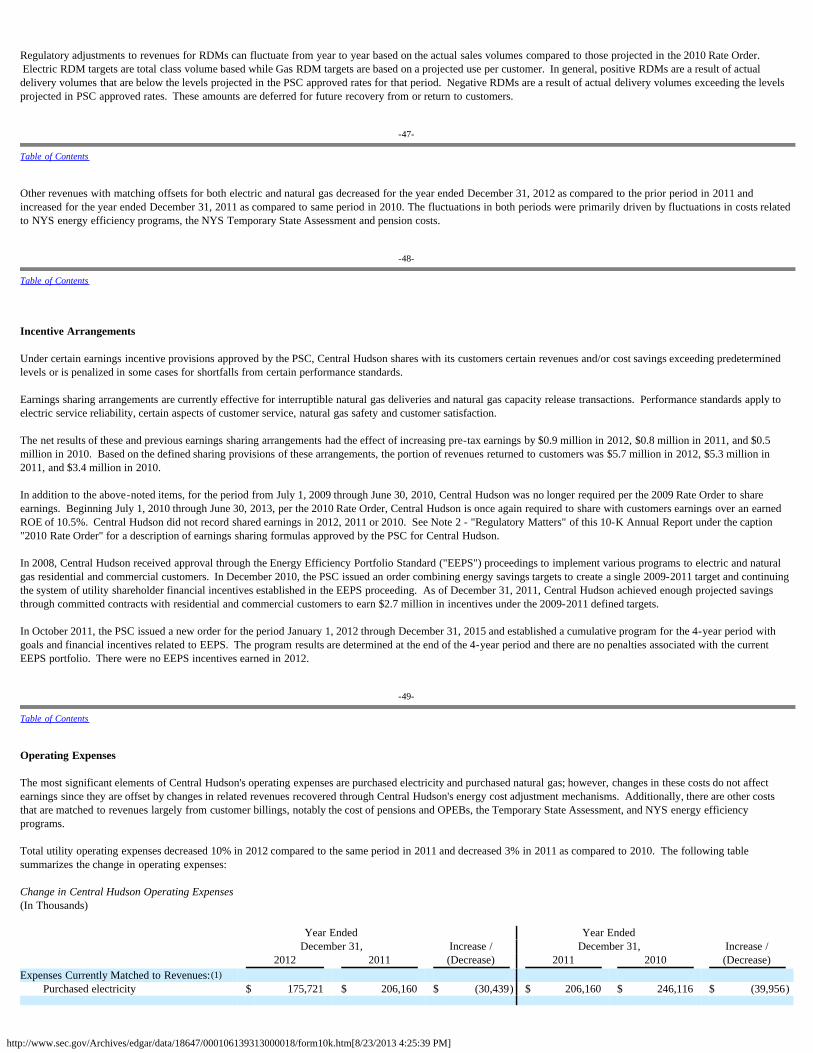
http://www.sec.gov/Archives/edgar/data/18647/000106139313000018/form10k.htm[8/23/2013 4:25:39 PM]
Regulatory adjustments to revenues for RDMs can fluctuate from year to year based on the actual sales volumes compared to those projected in the 2010 Rate Order. Electric RDM targets are total class volume based while Gas RDM targets are based on a projected use per customer. In general, positive RDMs are a result of actualdelivery volumes that are below the levels projected in the PSC approved rates for that period. Negative RDMs are a result of actual delivery volumes exceeding the levelsprojected in PSC approved rates. These amounts are deferred for future recovery from or return to customers.
-47-
Table of Contents
Other revenues with matching offsets for both electric and natural gas decreased for the year ended December 31, 2012 as compared to the prior period in 2011 andincreased for the year ended December 31, 2011 as compared to same period in 2010. The fluctuations in both periods were primarily driven by fluctuations in costs relatedto NYS energy efficiency programs, the NYS Temporary State Assessment and pension costs.
-48-
Table of Contents
Incentive Arrangements
Under certain earnings incentive provisions approved by the PSC, Central Hudson shares with its customers certain revenues and/or cost savings exceeding predeterminedlevels or is penalized in some cases for shortfalls from certain performance standards.
Earnings sharing arrangements are currently effective for interruptible natural gas deliveries and natural gas capacity release transactions. Performance standards apply toelectric service reliability, certain aspects of customer service, natural gas safety and customer satisfaction.
The net results of these and previous earnings sharing arrangements had the effect of increasing pre-tax earnings by $0.9 million in 2012, $0.8 million in 2011, and $0.5million in 2010. Based on the defined sharing provisions of these arrangements, the portion of revenues returned to customers was $5.7 million in 2012, $5.3 million in2011, and $3.4 million in 2010.
In addition to the above-noted items, for the period from July 1, 2009 through June 30, 2010, Central Hudson was no longer required per the 2009 Rate Order to shareearnings. Beginning July 1, 2010 through June 30, 2013, per the 2010 Rate Order, Central Hudson is once again required to share with customers earnings over an earnedROE of 10.5%. Central Hudson did not record shared earnings in 2012, 2011 or 2010. See Note 2 - "Regulatory Matters" of this 10-K Annual Report under the caption"2010 Rate Order" for a description of earnings sharing formulas approved by the PSC for Central Hudson.
In 2008, Central Hudson received approval through the Energy Efficiency Portfolio Standard ("EEPS") proceedings to implement various programs to electric and naturalgas residential and commercial customers. In December 2010, the PSC issued an order combining energy savings targets to create a single 2009-2011 target and continuingthe system of utility shareholder financial incentives established in the EEPS proceeding. As of December 31, 2011, Central Hudson achieved enough projected savingsthrough committed contracts with residential and commercial customers to earn $2.7 million in incentives under the 2009-2011 defined targets.
In October 2011, the PSC issued a new order for the period January 1, 2012 through December 31, 2015 and established a cumulative program for the 4-year period withgoals and financial incentives related to EEPS. The program results are determined at the end of the 4-year period and there are no penalties associated with the currentEEPS portfolio. There were no EEPS incentives earned in 2012.
-49-
Table of Contents
Operating Expenses
The most significant elements of Central Hudson's operating expenses are purchased electricity and purchased natural gas; however, changes in these costs do not affectearnings since they are offset by changes in related revenues recovered through Central Hudson's energy cost adjustment mechanisms. Additionally, there are other coststhat are matched to revenues largely from customer billings, notably the cost of pensions and OPEBs, the Temporary State Assessment, and NYS energy efficiencyprograms.
Total utility operating expenses decreased 10% in 2012 compared to the same period in 2011 and decreased 3% in 2011 as compared to 2010. The following tablesummarizes the change in operating expenses: Change in Central Hudson Operating Expenses(In Thousands) Year Ended Year Ended December 31, Increase / December 31, Increase / 2012 2011 (Decrease) 2011 2010 (Decrease) Expenses Currently Matched to Revenues:(1)
Purchased electricity $ 175,721 $ 206,160 $ (30,439) $ 206,160 $ 246,116 $ (39,956)
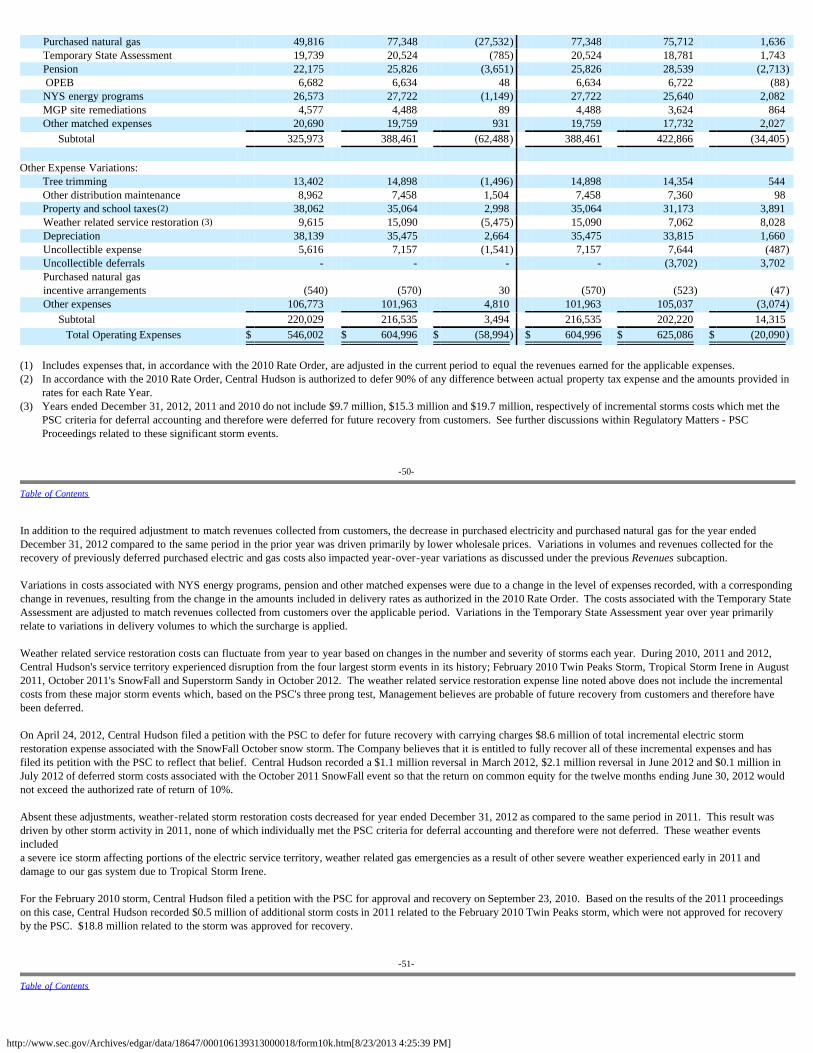
http://www.sec.gov/Archives/edgar/data/18647/000106139313000018/form10k.htm[8/23/2013 4:25:39 PM]
Purchased natural gas 49,816 77,348 (27,532) 77,348 75,712 1,636 Temporary State Assessment 19,739 20,524 (785) 20,524 18,781 1,743 Pension 22,175 25,826 (3,651) 25,826 28,539 (2,713) OPEB 6,682 6,634 48 6,634 6,722 (88)NYS energy programs 26,573 27,722 (1,149) 27,722 25,640 2,082 MGP site remediations 4,577 4,488 89 4,488 3,624 864 Other matched expenses 20,690 19,759 931 19,759 17,732 2,027
Subtotal 325,973 388,461 (62,488) 388,461 422,866 (34,405) Other Expense Variations:
Tree trimming 13,402 14,898 (1,496) 14,898 14,354 544 Other distribution maintenance 8,962 7,458 1,504 7,458 7,360 98 Property and school taxes(2) 38,062 35,064 2,998 35,064 31,173 3,891 Weather related service restoration (3) 9,615 15,090 (5,475) 15,090 7,062 8,028 Depreciation 38,139 35,475 2,664 35,475 33,815 1,660 Uncollectible expense 5,616 7,157 (1,541) 7,157 7,644 (487)Uncollectible deferrals - - - - (3,702) 3,702 Purchased natural gasincentive arrangements (540) (570) 30 (570) (523) (47)Other expenses 106,773 101,963 4,810 101,963 105,037 (3,074)
Subtotal 220,029 216,535 3,494 216,535 202,220 14,315 Total Operating Expenses $ 546,002 $ 604,996 $ (58,994) $ 604,996 $ 625,086 $ (20,090)
(1) Includes expenses that, in accordance with the 2010 Rate Order, are adjusted in the current period to equal the revenues earned for the applicable expenses.(2) In accordance with the 2010 Rate Order, Central Hudson is authorized to defer 90% of any difference between actual property tax expense and the amounts provided in
rates for each Rate Year.(3) Years ended December 31, 2012, 2011 and 2010 do not include $9.7 million, $15.3 million and $19.7 million, respectively of incremental storms costs which met the
PSC criteria for deferral accounting and therefore were deferred for future recovery from customers. See further discussions within Regulatory Matters - PSCProceedings related to these significant storm events.
-50-
Table of Contents
In addition to the required adjustment to match revenues collected from customers, the decrease in purchased electricity and purchased natural gas for the year endedDecember 31, 2012 compared to the same period in the prior year was driven primarily by lower wholesale prices. Variations in volumes and revenues collected for therecovery of previously deferred purchased electric and gas costs also impacted year-over-year variations as discussed under the previous Revenues subcaption.
Variations in costs associated with NYS energy programs, pension and other matched expenses were due to a change in the level of expenses recorded, with a correspondingchange in revenues, resulting from the change in the amounts included in delivery rates as authorized in the 2010 Rate Order. The costs associated with the Temporary StateAssessment are adjusted to match revenues collected from customers over the applicable period. Variations in the Temporary State Assessment year over year primarilyrelate to variations in delivery volumes to which the surcharge is applied.
Weather related service restoration costs can fluctuate from year to year based on changes in the number and severity of storms each year. During 2010, 2011 and 2012,Central Hudson's service territory experienced disruption from the four largest storm events in its history; February 2010 Twin Peaks Storm, Tropical Storm Irene in August2011, October 2011's SnowFall and Superstorm Sandy in October 2012. The weather related service restoration expense line noted above does not include the incrementalcosts from these major storm events which, based on the PSC's three prong test, Management believes are probable of future recovery from customers and therefore havebeen deferred.
On April 24, 2012, Central Hudson filed a petition with the PSC to defer for future recovery with carrying charges $8.6 million of total incremental electric stormrestoration expense associated with the SnowFall October snow storm. The Company believes that it is entitled to fully recover all of these incremental expenses and hasfiled its petition with the PSC to reflect that belief. Central Hudson recorded a $1.1 million reversal in March 2012, $2.1 million reversal in June 2012 and $0.1 million inJuly 2012 of deferred storm costs associated with the October 2011 SnowFall event so that the return on common equity for the twelve months ending June 30, 2012 wouldnot exceed the authorized rate of return of 10%.
Absent these adjustments, weather-related storm restoration costs decreased for year ended December 31, 2012 as compared to the same period in 2011. This result wasdriven by other storm activity in 2011, none of which individually met the PSC criteria for deferral accounting and therefore were not deferred. These weather eventsincludeda severe ice storm affecting portions of the electric service territory, weather related gas emergencies as a result of other severe weather experienced early in 2011 anddamage to our gas system due to Tropical Storm Irene.
For the February 2010 storm, Central Hudson filed a petition with the PSC for approval and recovery on September 23, 2010. Based on the results of the 2011 proceedingson this case, Central Hudson recorded $0.5 million of additional storm costs in 2011 related to the February 2010 Twin Peaks storm, which were not approved for recoveryby the PSC. $18.8 million related to the storm was approved for recovery.
-51-
Table of Contents
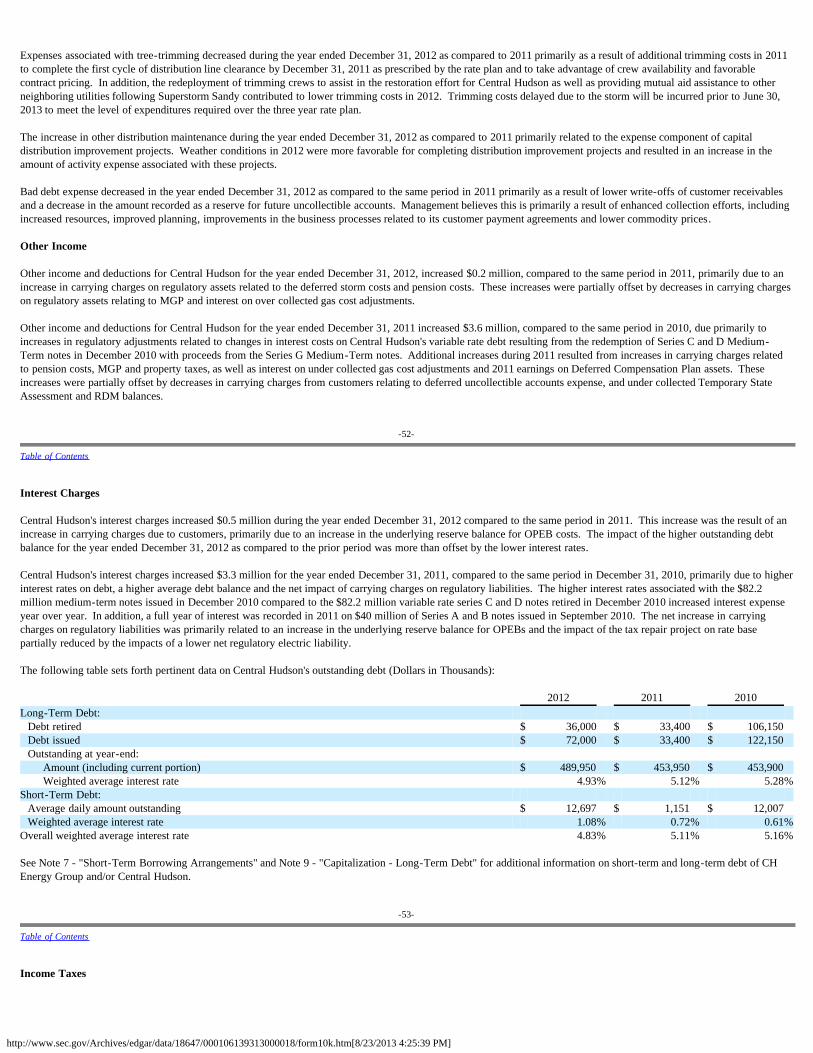
http://www.sec.gov/Archives/edgar/data/18647/000106139313000018/form10k.htm[8/23/2013 4:25:39 PM]
Expenses associated with tree-trimming decreased during the year ended December 31, 2012 as compared to 2011 primarily as a result of additional trimming costs in 2011to complete the first cycle of distribution line clearance by December 31, 2011 as prescribed by the rate plan and to take advantage of crew availability and favorablecontract pricing. In addition, the redeployment of trimming crews to assist in the restoration effort for Central Hudson as well as providing mutual aid assistance to otherneighboring utilities following Superstorm Sandy contributed to lower trimming costs in 2012. Trimming costs delayed due to the storm will be incurred prior to June 30,2013 to meet the level of expenditures required over the three year rate plan.
The increase in other distribution maintenance during the year ended December 31, 2012 as compared to 2011 primarily related to the expense component of capitaldistribution improvement projects. Weather conditions in 2012 were more favorable for completing distribution improvement projects and resulted in an increase in theamount of activity expense associated with these projects.
Bad debt expense decreased in the year ended December 31, 2012 as compared to the same period in 2011 primarily as a result of lower write-offs of customer receivablesand a decrease in the amount recorded as a reserve for future uncollectible accounts. Management believes this is primarily a result of enhanced collection efforts, includingincreased resources, improved planning, improvements in the business processes related to its customer payment agreements and lower commodity prices. Other Income
Other income and deductions for Central Hudson for the year ended December 31, 2012, increased $0.2 million, compared to the same period in 2011, primarily due to anincrease in carrying charges on regulatory assets related to the deferred storm costs and pension costs. These increases were partially offset by decreases in carrying chargeson regulatory assets relating to MGP and interest on over collected gas cost adjustments.
Other income and deductions for Central Hudson for the year ended December 31, 2011 increased $3.6 million, compared to the same period in 2010, due primarily toincreases in regulatory adjustments related to changes in interest costs on Central Hudson's variable rate debt resulting from the redemption of Series C and D Medium-Term notes in December 2010 with proceeds from the Series G Medium-Term notes. Additional increases during 2011 resulted from increases in carrying charges relatedto pension costs, MGP and property taxes, as well as interest on under collected gas cost adjustments and 2011 earnings on Deferred Compensation Plan assets. Theseincreases were partially offset by decreases in carrying charges from customers relating to deferred uncollectible accounts expense, and under collected Temporary StateAssessment and RDM balances.
-52-
Table of Contents
Interest Charges
Central Hudson's interest charges increased $0.5 million during the year ended December 31, 2012 compared to the same period in 2011. This increase was the result of anincrease in carrying charges due to customers, primarily due to an increase in the underlying reserve balance for OPEB costs. The impact of the higher outstanding debtbalance for the year ended December 31, 2012 as compared to the prior period was more than offset by the lower interest rates. Central Hudson's interest charges increased $3.3 million for the year ended December 31, 2011, compared to the same period in December 31, 2010, primarily due to higherinterest rates on debt, a higher average debt balance and the net impact of carrying charges on regulatory liabilities. The higher interest rates associated with the $82.2million medium-term notes issued in December 2010 compared to the $82.2 million variable rate series C and D notes retired in December 2010 increased interest expenseyear over year. In addition, a full year of interest was recorded in 2011 on $40 million of Series A and B notes issued in September 2010. The net increase in carryingcharges on regulatory liabilities was primarily related to an increase in the underlying reserve balance for OPEBs and the impact of the tax repair project on rate basepartially reduced by the impacts of a lower net regulatory electric liability. The following table sets forth pertinent data on Central Hudson's outstanding debt (Dollars in Thousands): 2012 2011 2010 Long-Term Debt:
Debt retired $ 36,000 $ 33,400 $ 106,150 Debt issued $ 72,000 $ 33,400 $ 122,150 Outstanding at year-end:
Amount (including current portion) $ 489,950 $ 453,950 $ 453,900 Weighted average interest rate 4.93% 5.12% 5.28%
Short-Term Debt: Average daily amount outstanding $ 12,697 $ 1,151 $ 12,007 Weighted average interest rate 1.08% 0.72% 0.61%
Overall weighted average interest rate 4.83% 5.11% 5.16% See Note 7 - "Short-Term Borrowing Arrangements" and Note 9 - "Capitalization - Long-Term Debt" for additional information on short-term and long-term debt of CHEnergy Group and/or Central Hudson.
-53-
Table of Contents
Income Taxes
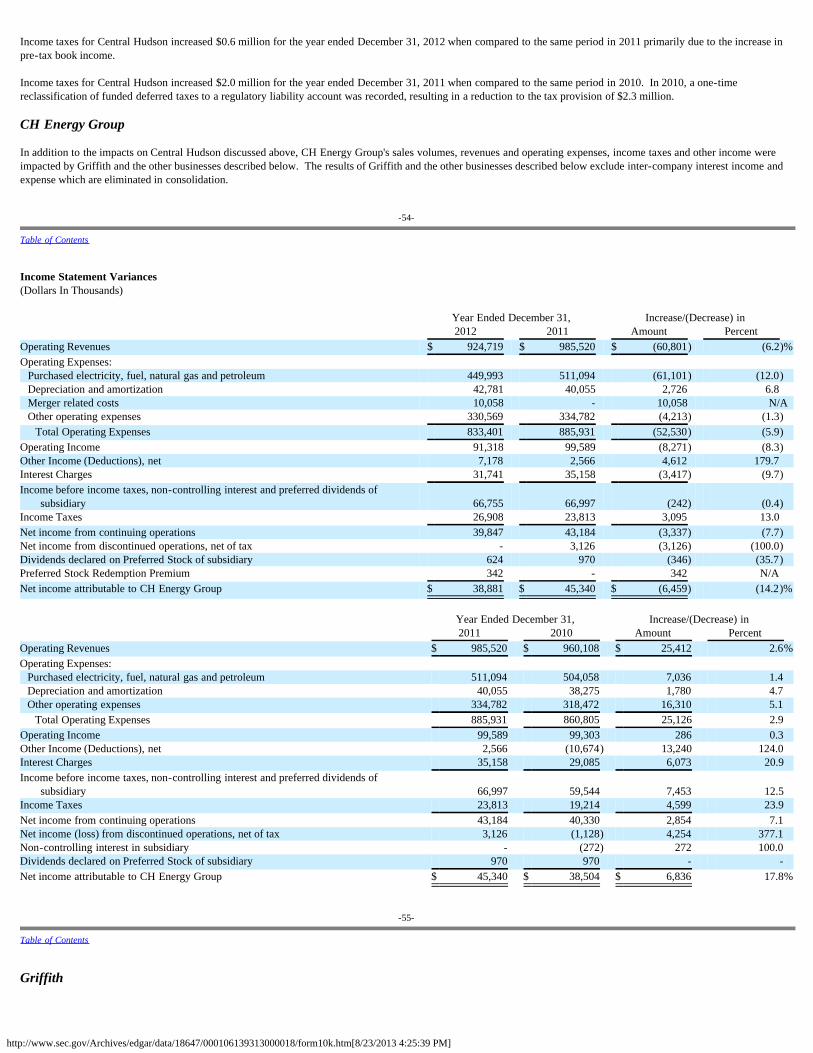
http://www.sec.gov/Archives/edgar/data/18647/000106139313000018/form10k.htm[8/23/2013 4:25:39 PM]
Income taxes for Central Hudson increased $0.6 million for the year ended December 31, 2012 when compared to the same period in 2011 primarily due to the increase inpre-tax book income.
Income taxes for Central Hudson increased $2.0 million for the year ended December 31, 2011 when compared to the same period in 2010. In 2010, a one-timereclassification of funded deferred taxes to a regulatory liability account was recorded, resulting in a reduction to the tax provision of $2.3 million.
CH Energy Group
In addition to the impacts on Central Hudson discussed above, CH Energy Group's sales volumes, revenues and operating expenses, income taxes and other income wereimpacted by Griffith and the other businesses described below. The results of Griffith and the other businesses described below exclude inter-company interest income andexpense which are eliminated in consolidation.
-54-
Table of Contents
Income Statement Variances(Dollars In Thousands) Year Ended December 31, Increase/(Decrease) in 2012 2011 Amount Percent Operating Revenues $ 924,719 $ 985,520 $ (60,801) (6.2)%Operating Expenses: Purchased electricity, fuel, natural gas and petroleum 449,993 511,094 (61,101) (12.0) Depreciation and amortization 42,781 40,055 2,726 6.8 Merger related costs 10,058 - 10,058 N/A Other operating expenses 330,569 334,782 (4,213) (1.3) Total Operating Expenses 833,401 885,931 (52,530) (5.9)Operating Income 91,318 99,589 (8,271) (8.3)Other Income (Deductions), net 7,178 2,566 4,612 179.7 Interest Charges 31,741 35,158 (3,417) (9.7)Income before income taxes, non-controlling interest and preferred dividends of
subsidiary 66,755 66,997 (242) (0.4)Income Taxes 26,908 23,813 3,095 13.0 Net income from continuing operations 39,847 43,184 (3,337) (7.7)Net income from discontinued operations, net of tax - 3,126 (3,126) (100.0)Dividends declared on Preferred Stock of subsidiary 624 970 (346) (35.7)Preferred Stock Redemption Premium 342 - 342 N/A Net income attributable to CH Energy Group $ 38,881 $ 45,340 $ (6,459) (14.2)% Year Ended December 31, Increase/(Decrease) in 2011 2010 Amount Percent Operating Revenues $ 985,520 $ 960,108 $ 25,412 2.6%Operating Expenses: Purchased electricity, fuel, natural gas and petroleum 511,094 504,058 7,036 1.4 Depreciation and amortization 40,055 38,275 1,780 4.7 Other operating expenses 334,782 318,472 16,310 5.1 Total Operating Expenses 885,931 860,805 25,126 2.9 Operating Income 99,589 99,303 286 0.3 Other Income (Deductions), net 2,566 (10,674) 13,240 124.0 Interest Charges 35,158 29,085 6,073 20.9 Income before income taxes, non-controlling interest and preferred dividends of
subsidiary 66,997 59,544 7,453 12.5 Income Taxes 23,813 19,214 4,599 23.9 Net income from continuing operations 43,184 40,330 2,854 7.1 Net income (loss) from discontinued operations, net of tax 3,126 (1,128) 4,254 377.1 Non-controlling interest in subsidiary - (272) 272 100.0 Dividends declared on Preferred Stock of subsidiary 970 970 - - Net income attributable to CH Energy Group $ 45,340 $ 38,504 $ 6,836 17.8%
-55-
Table of Contents
Griffith
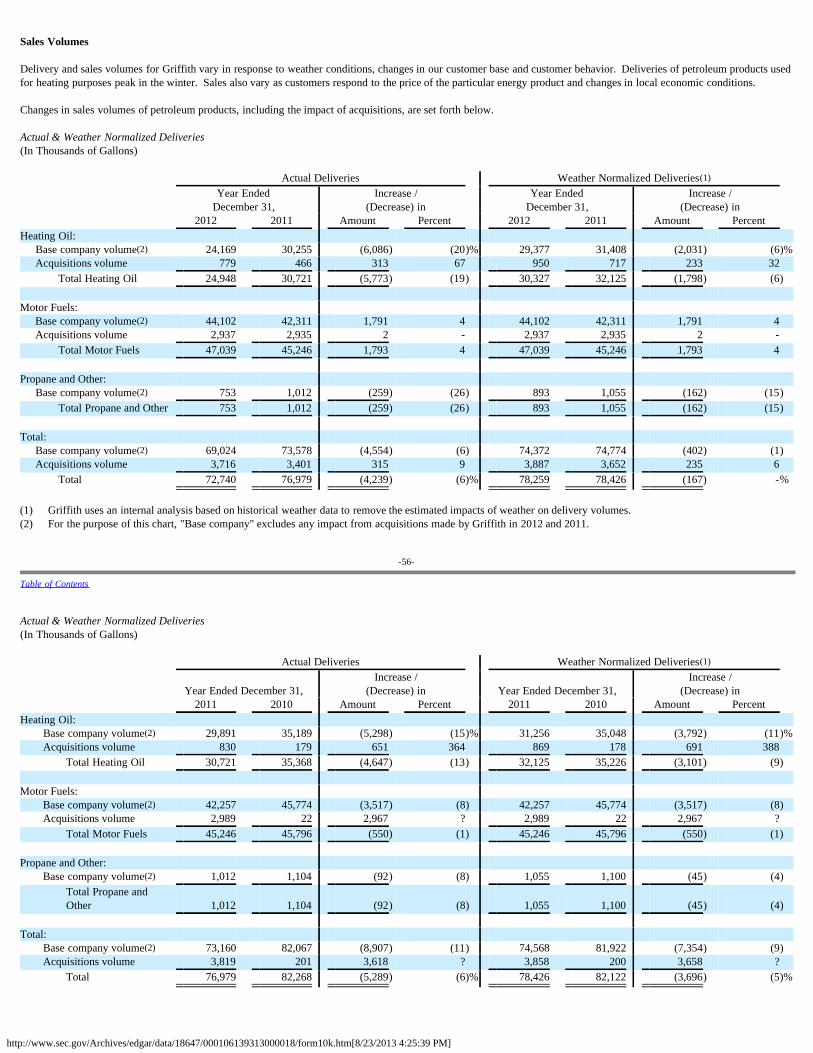
http://www.sec.gov/Archives/edgar/data/18647/000106139313000018/form10k.htm[8/23/2013 4:25:39 PM]
Sales Volumes
Delivery and sales volumes for Griffith vary in response to weather conditions, changes in our customer base and customer behavior. Deliveries of petroleum products usedfor heating purposes peak in the winter. Sales also vary as customers respond to the price of the particular energy product and changes in local economic conditions.
Changes in sales volumes of petroleum products, including the impact of acquisitions, are set forth below. Actual & Weather Normalized Deliveries(In Thousands of Gallons) Actual Deliveries Weather Normalized Deliveries(1)
Year Ended
December 31, Increase /
(Decrease) in Year Ended
December 31, Increase /
(Decrease) in 2012 2011 Amount Percent 2012 2011 Amount Percent Heating Oil:
Base company volume(2) 24,169 30,255 (6,086) (20)% 29,377 31,408 (2,031) (6)%Acquisitions volume 779 466 313 67 950 717 233 32
Total Heating Oil 24,948 30,721 (5,773) (19) 30,327 32,125 (1,798) (6) Motor Fuels:
Base company volume(2) 44,102 42,311 1,791 4 44,102 42,311 1,791 4 Acquisitions volume 2,937 2,935 2 - 2,937 2,935 2 -
Total Motor Fuels 47,039 45,246 1,793 4 47,039 45,246 1,793 4 Propane and Other:
Base company volume(2) 753 1,012 (259) (26) 893 1,055 (162) (15)Total Propane and Other 753 1,012 (259) (26) 893 1,055 (162) (15)
Total:
Base company volume(2) 69,024 73,578 (4,554) (6) 74,372 74,774 (402) (1)Acquisitions volume 3,716 3,401 315 9 3,887 3,652 235 6
Total 72,740 76,979 (4,239) (6)% 78,259 78,426 (167) -% (1) Griffith uses an internal analysis based on historical weather data to remove the estimated impacts of weather on delivery volumes.(2) For the purpose of this chart, "Base company" excludes any impact from acquisitions made by Griffith in 2012 and 2011.
-56-
Table of Contents
Actual & Weather Normalized Deliveries(In Thousands of Gallons) Actual Deliveries Weather Normalized Deliveries(1)
Year Ended December 31, Increase /
(Decrease) in Year Ended December 31, Increase /
(Decrease) in 2011 2010 Amount Percent 2011 2010 Amount Percent Heating Oil:
Base company volume(2) 29,891 35,189 (5,298) (15)% 31,256 35,048 (3,792) (11)%Acquisitions volume 830 179 651 364 869 178 691 388
Total Heating Oil 30,721 35,368 (4,647) (13) 32,125 35,226 (3,101) (9) Motor Fuels:
Base company volume(2) 42,257 45,774 (3,517) (8) 42,257 45,774 (3,517) (8)Acquisitions volume 2,989 22 2,967 ? 2,989 22 2,967 ?
Total Motor Fuels 45,246 45,796 (550) (1) 45,246 45,796 (550) (1) Propane and Other:
Base company volume(2) 1,012 1,104 (92) (8) 1,055 1,100 (45) (4)Total Propane andOther 1,012 1,104 (92) (8) 1,055 1,100 (45) (4)
Total:
Base company volume(2) 73,160 82,067 (8,907) (11) 74,568 81,922 (7,354) (9)Acquisitions volume 3,819 201 3,618 ? 3,858 200 3,658 ?
Total 76,979 82,268 (5,289) (6)% 78,426 82,122 (3,696) (5)%
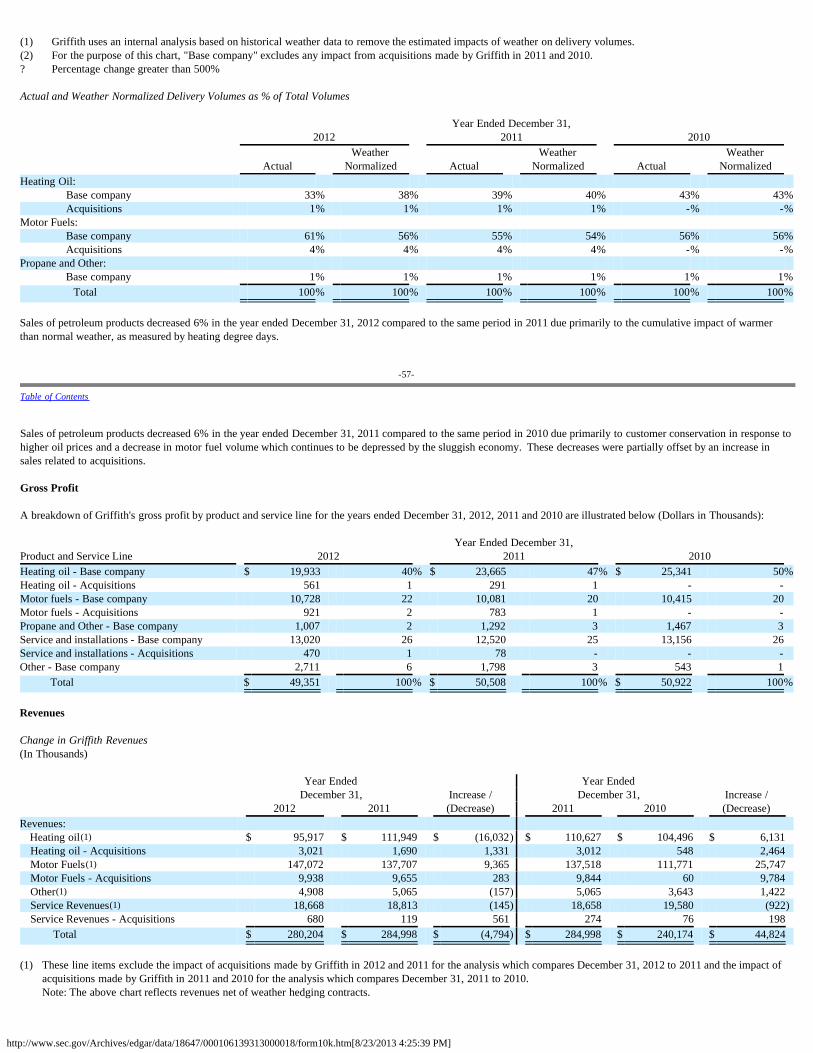
http://www.sec.gov/Archives/edgar/data/18647/000106139313000018/form10k.htm[8/23/2013 4:25:39 PM]
(1) Griffith uses an internal analysis based on historical weather data to remove the estimated impacts of weather on delivery volumes.(2) For the purpose of this chart, "Base company" excludes any impact from acquisitions made by Griffith in 2011 and 2010.? Percentage change greater than 500% Actual and Weather Normalized Delivery Volumes as % of Total Volumes Year Ended December 31, 2012 2011 2010
Actual Weather
Normalized Actual Weather
Normalized Actual Weather
Normalized Heating Oil:
Base company 33% 38% 39% 40% 43% 43%Acquisitions 1% 1% 1% 1% -% -%
Motor Fuels: Base company 61% 56% 55% 54% 56% 56%Acquisitions 4% 4% 4% 4% -% -%
Propane and Other: Base company 1% 1% 1% 1% 1% 1% Total 100% 100% 100% 100% 100% 100%
Sales of petroleum products decreased 6% in the year ended December 31, 2012 compared to the same period in 2011 due primarily to the cumulative impact of warmerthan normal weather, as measured by heating degree days.
-57-
Table of Contents
Sales of petroleum products decreased 6% in the year ended December 31, 2011 compared to the same period in 2010 due primarily to customer conservation in response tohigher oil prices and a decrease in motor fuel volume which continues to be depressed by the sluggish economy. These decreases were partially offset by an increase insales related to acquisitions.
Gross Profit A breakdown of Griffith's gross profit by product and service line for the years ended December 31, 2012, 2011 and 2010 are illustrated below (Dollars in Thousands): Year Ended December 31, Product and Service Line 2012 2011 2010 Heating oil - Base company $ 19,933 40% $ 23,665 47% $ 25,341 50%Heating oil - Acquisitions 561 1 291 1 - - Motor fuels - Base company 10,728 22 10,081 20 10,415 20 Motor fuels - Acquisitions 921 2 783 1 - - Propane and Other - Base company 1,007 2 1,292 3 1,467 3 Service and installations - Base company 13,020 26 12,520 25 13,156 26 Service and installations - Acquisitions 470 1 78 - - - Other - Base company 2,711 6 1,798 3 543 1
Total $ 49,351 100% $ 50,508 100% $ 50,922 100% Revenues Change in Griffith Revenues(In Thousands) Year Ended Year Ended December 31, Increase / December 31, Increase / 2012 2011 (Decrease) 2011 2010 (Decrease) Revenues:
Heating oil(1) $ 95,917 $ 111,949 $ (16,032) $ 110,627 $ 104,496 $ 6,131 Heating oil - Acquisitions 3,021 1,690 1,331 3,012 548 2,464 Motor Fuels(1) 147,072 137,707 9,365 137,518 111,771 25,747 Motor Fuels - Acquisitions 9,938 9,655 283 9,844 60 9,784 Other(1) 4,908 5,065 (157) 5,065 3,643 1,422 Service Revenues(1) 18,668 18,813 (145) 18,658 19,580 (922)Service Revenues - Acquisitions 680 119 561 274 76 198
Total $ 280,204 $ 284,998 $ (4,794) $ 284,998 $ 240,174 $ 44,824 (1) These line items exclude the impact of acquisitions made by Griffith in 2012 and 2011 for the analysis which compares December 31, 2012 to 2011 and the impact of
acquisitions made by Griffith in 2011 and 2010 for the analysis which compares December 31, 2011 to 2010. Note: The above chart reflects revenues net of weather hedging contracts.
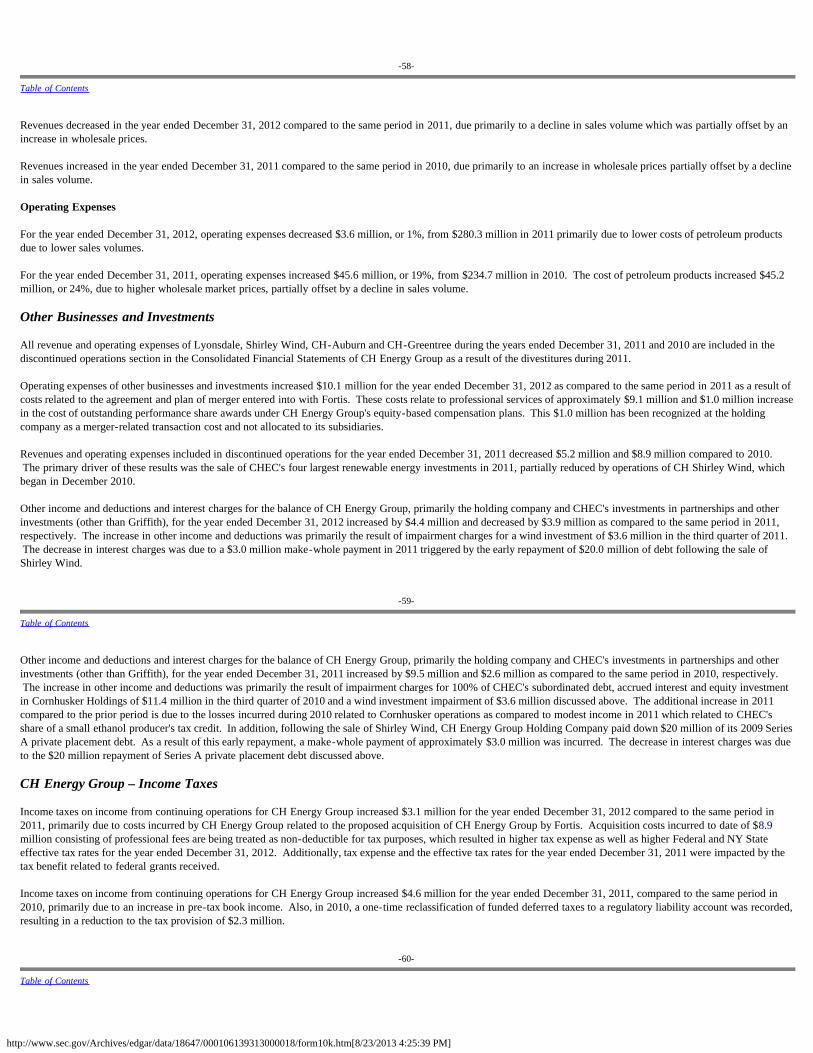
http://www.sec.gov/Archives/edgar/data/18647/000106139313000018/form10k.htm[8/23/2013 4:25:39 PM]
-58-
Table of Contents
Revenues decreased in the year ended December 31, 2012 compared to the same period in 2011, due primarily to a decline in sales volume which was partially offset by anincrease in wholesale prices.
Revenues increased in the year ended December 31, 2011 compared to the same period in 2010, due primarily to an increase in wholesale prices partially offset by a declinein sales volume.
Operating Expenses
For the year ended December 31, 2012, operating expenses decreased $3.6 million, or 1%, from $280.3 million in 2011 primarily due to lower costs of petroleum productsdue to lower sales volumes.
For the year ended December 31, 2011, operating expenses increased $45.6 million, or 19%, from $234.7 million in 2010. The cost of petroleum products increased $45.2million, or 24%, due to higher wholesale market prices, partially offset by a decline in sales volume.
Other Businesses and Investments
All revenue and operating expenses of Lyonsdale, Shirley Wind, CH-Auburn and CH-Greentree during the years ended December 31, 2011 and 2010 are included in thediscontinued operations section in the Consolidated Financial Statements of CH Energy Group as a result of the divestitures during 2011.
Operating expenses of other businesses and investments increased $10.1 million for the year ended December 31, 2012 as compared to the same period in 2011 as a result ofcosts related to the agreement and plan of merger entered into with Fortis. These costs relate to professional services of approximately $9.1 million and $1.0 million increasein the cost of outstanding performance share awards under CH Energy Group's equity-based compensation plans. This $1.0 million has been recognized at the holdingcompany as a merger-related transaction cost and not allocated to its subsidiaries.
Revenues and operating expenses included in discontinued operations for the year ended December 31, 2011 decreased $5.2 million and $8.9 million compared to 2010. The primary driver of these results was the sale of CHEC's four largest renewable energy investments in 2011, partially reduced by operations of CH Shirley Wind, whichbegan in December 2010.
Other income and deductions and interest charges for the balance of CH Energy Group, primarily the holding company and CHEC's investments in partnerships and otherinvestments (other than Griffith), for the year ended December 31, 2012 increased by $4.4 million and decreased by $3.9 million as compared to the same period in 2011,respectively. The increase in other income and deductions was primarily the result of impairment charges for a wind investment of $3.6 million in the third quarter of 2011. The decrease in interest charges was due to a $3.0 million make-whole payment in 2011 triggered by the early repayment of $20.0 million of debt following the sale ofShirley Wind.
-59-
Table of Contents
Other income and deductions and interest charges for the balance of CH Energy Group, primarily the holding company and CHEC's investments in partnerships and otherinvestments (other than Griffith), for the year ended December 31, 2011 increased by $9.5 million and $2.6 million as compared to the same period in 2010, respectively. The increase in other income and deductions was primarily the result of impairment charges for 100% of CHEC's subordinated debt, accrued interest and equity investmentin Cornhusker Holdings of $11.4 million in the third quarter of 2010 and a wind investment impairment of $3.6 million discussed above. The additional increase in 2011compared to the prior period is due to the losses incurred during 2010 related to Cornhusker operations as compared to modest income in 2011 which related to CHEC'sshare of a small ethanol producer's tax credit. In addition, following the sale of Shirley Wind, CH Energy Group Holding Company paid down $20 million of its 2009 SeriesA private placement debt. As a result of this early repayment, a make-whole payment of approximately $3.0 million was incurred. The decrease in interest charges was dueto the $20 million repayment of Series A private placement debt discussed above.
CH Energy Group – Income Taxes
Income taxes on income from continuing operations for CH Energy Group increased $3.1 million for the year ended December 31, 2012 compared to the same period in2011, primarily due to costs incurred by CH Energy Group related to the proposed acquisition of CH Energy Group by Fortis. Acquisition costs incurred to date of $8.9million consisting of professional fees are being treated as non-deductible for tax purposes, which resulted in higher tax expense as well as higher Federal and NY Stateeffective tax rates for the year ended December 31, 2012. Additionally, tax expense and the effective tax rates for the year ended December 31, 2011 were impacted by thetax benefit related to federal grants received.
Income taxes on income from continuing operations for CH Energy Group increased $4.6 million for the year ended December 31, 2011, compared to the same period in2010, primarily due to an increase in pre-tax book income. Also, in 2010, a one-time reclassification of funded deferred taxes to a regulatory liability account was recorded,resulting in a reduction to the tax provision of $2.3 million.
-60-
Table of Contents
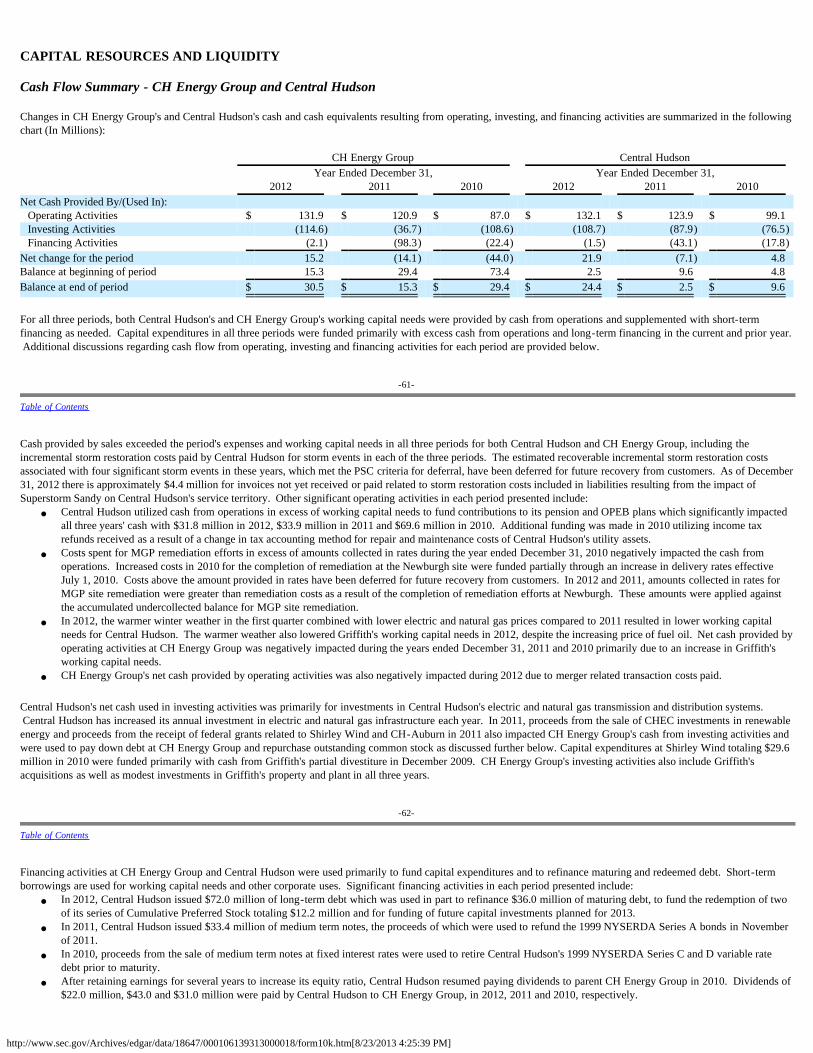
http://www.sec.gov/Archives/edgar/data/18647/000106139313000018/form10k.htm[8/23/2013 4:25:39 PM]
CAPITAL RESOURCES AND LIQUIDITY Cash Flow Summary - CH Energy Group and Central Hudson Changes in CH Energy Group's and Central Hudson's cash and cash equivalents resulting from operating, investing, and financing activities are summarized in the followingchart (In Millions): CH Energy Group Central Hudson Year Ended December 31, Year Ended December 31, 2012 2011 2010 2012 2011 2010 Net Cash Provided By/(Used In): Operating Activities $ 131.9 $ 120.9 $ 87.0 $ 132.1 $ 123.9 $ 99.1 Investing Activities (114.6) (36.7) (108.6) (108.7) (87.9) (76.5) Financing Activities (2.1) (98.3) (22.4) (1.5) (43.1) (17.8)Net change for the period 15.2 (14.1) (44.0) 21.9 (7.1) 4.8 Balance at beginning of period 15.3 29.4 73.4 2.5 9.6 4.8 Balance at end of period $ 30.5 $ 15.3 $ 29.4 $ 24.4 $ 2.5 $ 9.6
For all three periods, both Central Hudson's and CH Energy Group's working capital needs were provided by cash from operations and supplemented with short-termfinancing as needed. Capital expenditures in all three periods were funded primarily with excess cash from operations and long-term financing in the current and prior year. Additional discussions regarding cash flow from operating, investing and financing activities for each period are provided below.
-61-
Table of Contents
Cash provided by sales exceeded the period's expenses and working capital needs in all three periods for both Central Hudson and CH Energy Group, including theincremental storm restoration costs paid by Central Hudson for storm events in each of the three periods. The estimated recoverable incremental storm restoration costsassociated with four significant storm events in these years, which met the PSC criteria for deferral, have been deferred for future recovery from customers. As of December31, 2012 there is approximately $4.4 million for invoices not yet received or paid related to storm restoration costs included in liabilities resulting from the impact ofSuperstorm Sandy on Central Hudson's service territory. Other significant operating activities in each period presented include:
· Central Hudson utilized cash from operations in excess of working capital needs to fund contributions to its pension and OPEB plans which significantly impactedall three years' cash with $31.8 million in 2012, $33.9 million in 2011 and $69.6 million in 2010. Additional funding was made in 2010 utilizing income taxrefunds received as a result of a change in tax accounting method for repair and maintenance costs of Central Hudson's utility assets.
· Costs spent for MGP remediation efforts in excess of amounts collected in rates during the year ended December 31, 2010 negatively impacted the cash fromoperations. Increased costs in 2010 for the completion of remediation at the Newburgh site were funded partially through an increase in delivery rates effectiveJuly 1, 2010. Costs above the amount provided in rates have been deferred for future recovery from customers. In 2012 and 2011, amounts collected in rates forMGP site remediation were greater than remediation costs as a result of the completion of remediation efforts at Newburgh. These amounts were applied againstthe accumulated undercollected balance for MGP site remediation.
· In 2012, the warmer winter weather in the first quarter combined with lower electric and natural gas prices compared to 2011 resulted in lower working capitalneeds for Central Hudson. The warmer weather also lowered Griffith's working capital needs in 2012, despite the increasing price of fuel oil. Net cash provided byoperating activities at CH Energy Group was negatively impacted during the years ended December 31, 2011 and 2010 primarily due to an increase in Griffith'sworking capital needs.
· CH Energy Group's net cash provided by operating activities was also negatively impacted during 2012 due to merger related transaction costs paid.
Central Hudson's net cash used in investing activities was primarily for investments in Central Hudson's electric and natural gas transmission and distribution systems. Central Hudson has increased its annual investment in electric and natural gas infrastructure each year. In 2011, proceeds from the sale of CHEC investments in renewableenergy and proceeds from the receipt of federal grants related to Shirley Wind and CH-Auburn in 2011 also impacted CH Energy Group's cash from investing activities andwere used to pay down debt at CH Energy Group and repurchase outstanding common stock as discussed further below. Capital expenditures at Shirley Wind totaling $29.6million in 2010 were funded primarily with cash from Griffith's partial divestiture in December 2009. CH Energy Group's investing activities also include Griffith'sacquisitions as well as modest investments in Griffith's property and plant in all three years.
-62-
Table of Contents
Financing activities at CH Energy Group and Central Hudson were used primarily to fund capital expenditures and to refinance maturing and redeemed debt. Short-termborrowings are used for working capital needs and other corporate uses. Significant financing activities in each period presented include:
· In 2012, Central Hudson issued $72.0 million of long-term debt which was used in part to refinance $36.0 million of maturing debt, to fund the redemption of twoof its series of Cumulative Preferred Stock totaling $12.2 million and for funding of future capital investments planned for 2013.
· In 2011, Central Hudson issued $33.4 million of medium term notes, the proceeds of which were used to refund the 1999 NYSERDA Series A bonds in Novemberof 2011.
· In 2010, proceeds from the sale of medium term notes at fixed interest rates were used to retire Central Hudson's 1999 NYSERDA Series C and D variable ratedebt prior to maturity.
· After retaining earnings for several years to increase its equity ratio, Central Hudson resumed paying dividends to parent CH Energy Group in 2010. Dividends of$22.0 million, $43.0 and $31.0 million were paid by Central Hudson to CH Energy Group, in 2012, 2011 and 2010, respectively.
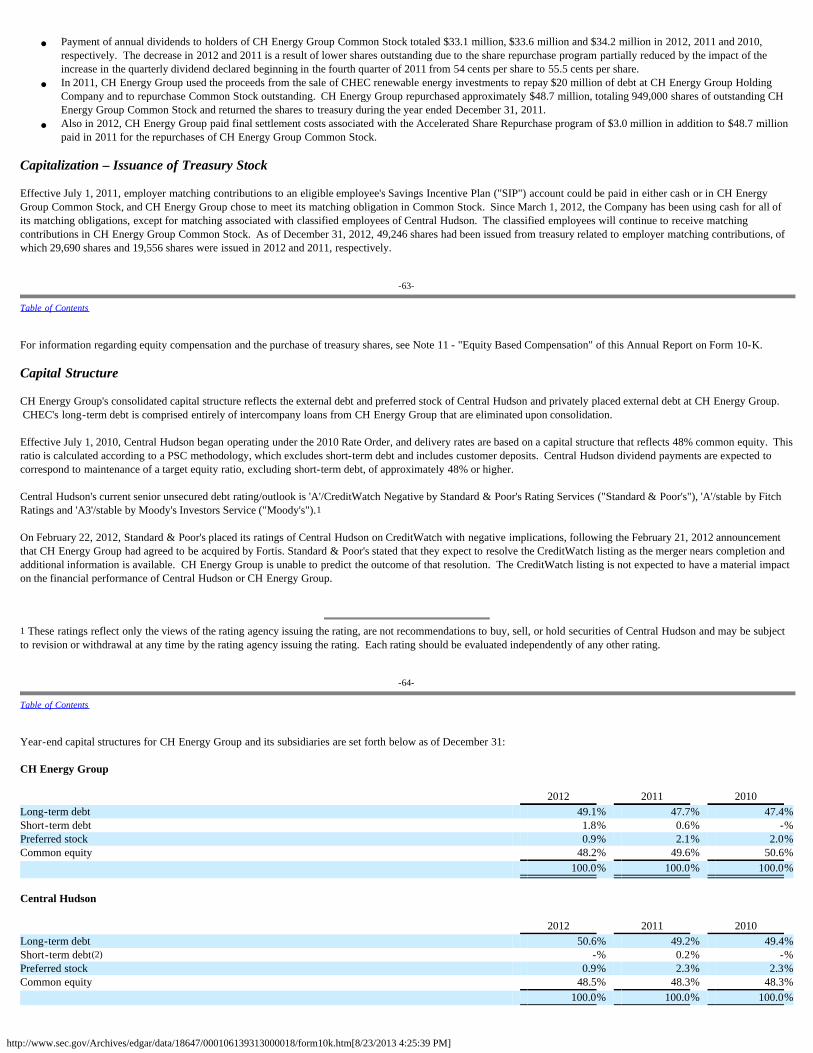
http://www.sec.gov/Archives/edgar/data/18647/000106139313000018/form10k.htm[8/23/2013 4:25:39 PM]
· Payment of annual dividends to holders of CH Energy Group Common Stock totaled $33.1 million, $33.6 million and $34.2 million in 2012, 2011 and 2010,respectively. The decrease in 2012 and 2011 is a result of lower shares outstanding due to the share repurchase program partially reduced by the impact of theincrease in the quarterly dividend declared beginning in the fourth quarter of 2011 from 54 cents per share to 55.5 cents per share.
· In 2011, CH Energy Group used the proceeds from the sale of CHEC renewable energy investments to repay $20 million of debt at CH Energy Group HoldingCompany and to repurchase Common Stock outstanding. CH Energy Group repurchased approximately $48.7 million, totaling 949,000 shares of outstanding CHEnergy Group Common Stock and returned the shares to treasury during the year ended December 31, 2011.
· Also in 2012, CH Energy Group paid final settlement costs associated with the Accelerated Share Repurchase program of $3.0 million in addition to $48.7 millionpaid in 2011 for the repurchases of CH Energy Group Common Stock.
Capitalization – Issuance of Treasury Stock
Effective July 1, 2011, employer matching contributions to an eligible employee's Savings Incentive Plan ("SIP") account could be paid in either cash or in CH EnergyGroup Common Stock, and CH Energy Group chose to meet its matching obligation in Common Stock. Since March 1, 2012, the Company has been using cash for all ofits matching obligations, except for matching associated with classified employees of Central Hudson. The classified employees will continue to receive matchingcontributions in CH Energy Group Common Stock. As of December 31, 2012, 49,246 shares had been issued from treasury related to employer matching contributions, ofwhich 29,690 shares and 19,556 shares were issued in 2012 and 2011, respectively.
-63-
Table of Contents
For information regarding equity compensation and the purchase of treasury shares, see Note 11 - "Equity Based Compensation" of this Annual Report on Form 10-K.
Capital Structure
CH Energy Group's consolidated capital structure reflects the external debt and preferred stock of Central Hudson and privately placed external debt at CH Energy Group. CHEC's long-term debt is comprised entirely of intercompany loans from CH Energy Group that are eliminated upon consolidation.
Effective July 1, 2010, Central Hudson began operating under the 2010 Rate Order, and delivery rates are based on a capital structure that reflects 48% common equity. Thisratio is calculated according to a PSC methodology, which excludes short-term debt and includes customer deposits. Central Hudson dividend payments are expected tocorrespond to maintenance of a target equity ratio, excluding short-term debt, of approximately 48% or higher.
Central Hudson's current senior unsecured debt rating/outlook is 'A'/CreditWatch Negative by Standard & Poor's Rating Services ("Standard & Poor's"), 'A'/stable by FitchRatings and 'A3'/stable by Moody's Investors Service ("Moody's").1
On February 22, 2012, Standard & Poor's placed its ratings of Central Hudson on CreditWatch with negative implications, following the February 21, 2012 announcementthat CH Energy Group had agreed to be acquired by Fortis. Standard & Poor's stated that they expect to resolve the CreditWatch listing as the merger nears completion andadditional information is available. CH Energy Group is unable to predict the outcome of that resolution. The CreditWatch listing is not expected to have a material impacton the financial performance of Central Hudson or CH Energy Group.
1 These ratings reflect only the views of the rating agency issuing the rating, are not recommendations to buy, sell, or hold securities of Central Hudson and may be subjectto revision or withdrawal at any time by the rating agency issuing the rating. Each rating should be evaluated independently of any other rating.
-64-
Table of Contents
Year-end capital structures for CH Energy Group and its subsidiaries are set forth below as of December 31:
CH Energy Group 2012 2011 2010 Long-term debt 49.1% 47.7% 47.4%Short-term debt 1.8% 0.6% -%Preferred stock 0.9% 2.1% 2.0%Common equity 48.2% 49.6% 50.6% 100.0% 100.0% 100.0% Central Hudson 2012 2011 2010 Long-term debt 50.6% 49.2% 49.4%Short-term debt(2) -% 0.2% -%Preferred stock 0.9% 2.3% 2.3%Common equity 48.5% 48.3% 48.3% 100.0% 100.0% 100.0%
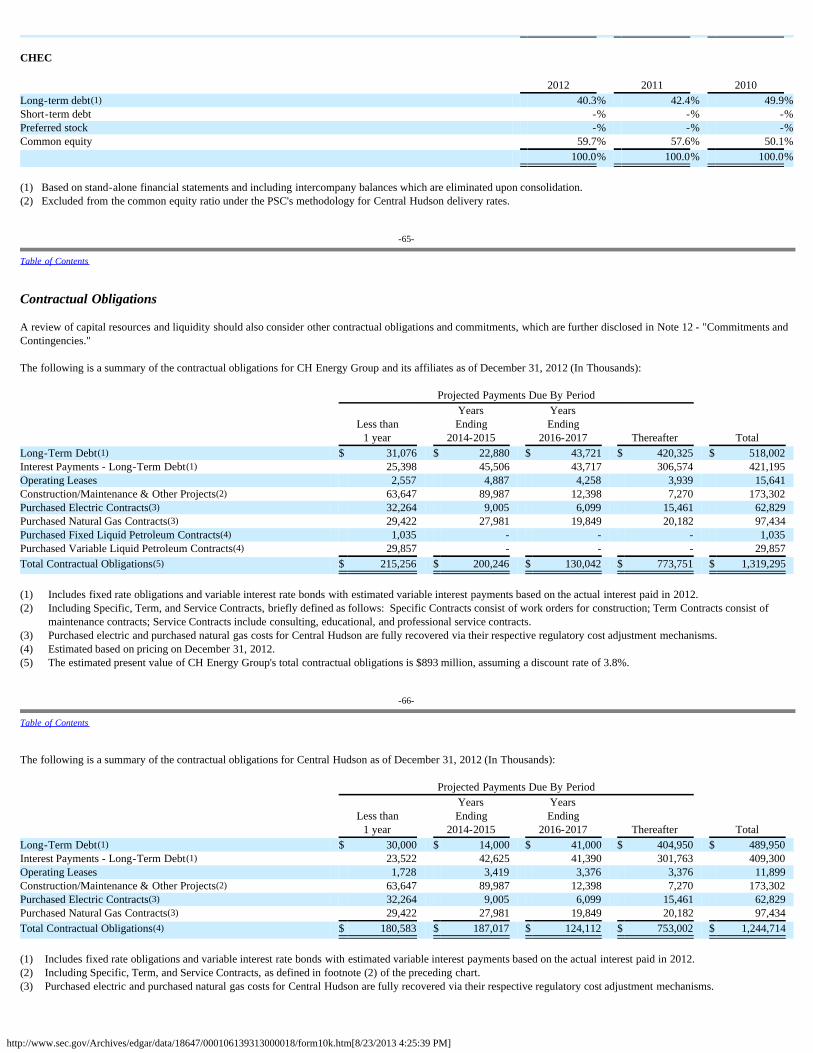
http://www.sec.gov/Archives/edgar/data/18647/000106139313000018/form10k.htm[8/23/2013 4:25:39 PM]
CHEC 2012 2011 2010 Long-term debt(1) 40.3% 42.4% 49.9%Short-term debt -% -% -%Preferred stock -% -% -%Common equity 59.7% 57.6% 50.1% 100.0% 100.0% 100.0% (1) Based on stand-alone financial statements and including intercompany balances which are eliminated upon consolidation. (2) Excluded from the common equity ratio under the PSC's methodology for Central Hudson delivery rates.
-65-
Table of Contents
Contractual Obligations
A review of capital resources and liquidity should also consider other contractual obligations and commitments, which are further disclosed in Note 12 - "Commitments andContingencies." The following is a summary of the contractual obligations for CH Energy Group and its affiliates as of December 31, 2012 (In Thousands): Projected Payments Due By Period
Less than
1 year
YearsEnding
2014-2015
YearsEnding
2016-2017 Thereafter Total Long-Term Debt(1) $ 31,076 $ 22,880 $ 43,721 $ 420,325 $ 518,002 Interest Payments - Long-Term Debt(1) 25,398 45,506 43,717 306,574 421,195 Operating Leases 2,557 4,887 4,258 3,939 15,641 Construction/Maintenance & Other Projects(2) 63,647 89,987 12,398 7,270 173,302 Purchased Electric Contracts(3) 32,264 9,005 6,099 15,461 62,829 Purchased Natural Gas Contracts(3) 29,422 27,981 19,849 20,182 97,434 Purchased Fixed Liquid Petroleum Contracts(4) 1,035 - - - 1,035 Purchased Variable Liquid Petroleum Contracts(4) 29,857 - - - 29,857 Total Contractual Obligations(5) $ 215,256 $ 200,246 $ 130,042 $ 773,751 $ 1,319,295 (1) Includes fixed rate obligations and variable interest rate bonds with estimated variable interest payments based on the actual interest paid in 2012.(2) Including Specific, Term, and Service Contracts, briefly defined as follows: Specific Contracts consist of work orders for construction; Term Contracts consist of
maintenance contracts; Service Contracts include consulting, educational, and professional service contracts.(3) Purchased electric and purchased natural gas costs for Central Hudson are fully recovered via their respective regulatory cost adjustment mechanisms.(4) Estimated based on pricing on December 31, 2012.(5) The estimated present value of CH Energy Group's total contractual obligations is $893 million, assuming a discount rate of 3.8%.
-66-
Table of Contents
The following is a summary of the contractual obligations for Central Hudson as of December 31, 2012 (In Thousands): Projected Payments Due By Period
Less than
1 year
YearsEnding
2014-2015
YearsEnding
2016-2017 Thereafter Total Long-Term Debt(1) $ 30,000 $ 14,000 $ 41,000 $ 404,950 $ 489,950 Interest Payments - Long-Term Debt(1) 23,522 42,625 41,390 301,763 409,300 Operating Leases 1,728 3,419 3,376 3,376 11,899 Construction/Maintenance & Other Projects(2) 63,647 89,987 12,398 7,270 173,302 Purchased Electric Contracts(3) 32,264 9,005 6,099 15,461 62,829 Purchased Natural Gas Contracts(3) 29,422 27,981 19,849 20,182 97,434 Total Contractual Obligations(4) $ 180,583 $ 187,017 $ 124,112 $ 753,002 $ 1,244,714 (1) Includes fixed rate obligations and variable interest rate bonds with estimated variable interest payments based on the actual interest paid in 2012.(2) Including Specific, Term, and Service Contracts, as defined in footnote (2) of the preceding chart.(3) Purchased electric and purchased natural gas costs for Central Hudson are fully recovered via their respective regulatory cost adjustment mechanisms.
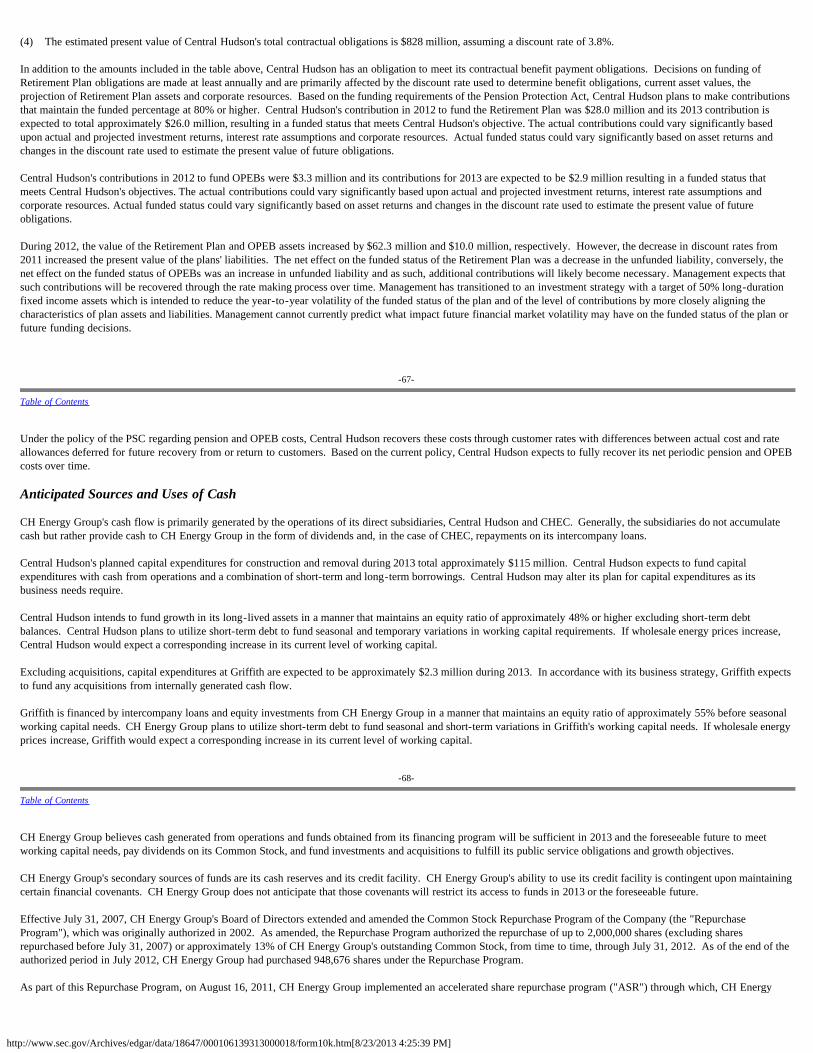
http://www.sec.gov/Archives/edgar/data/18647/000106139313000018/form10k.htm[8/23/2013 4:25:39 PM]
(4) The estimated present value of Central Hudson's total contractual obligations is $828 million, assuming a discount rate of 3.8%. In addition to the amounts included in the table above, Central Hudson has an obligation to meet its contractual benefit payment obligations. Decisions on funding ofRetirement Plan obligations are made at least annually and are primarily affected by the discount rate used to determine benefit obligations, current asset values, theprojection of Retirement Plan assets and corporate resources. Based on the funding requirements of the Pension Protection Act, Central Hudson plans to make contributionsthat maintain the funded percentage at 80% or higher. Central Hudson's contribution in 2012 to fund the Retirement Plan was $28.0 million and its 2013 contribution isexpected to total approximately $26.0 million, resulting in a funded status that meets Central Hudson's objective. The actual contributions could vary significantly basedupon actual and projected investment returns, interest rate assumptions and corporate resources. Actual funded status could vary significantly based on asset returns andchanges in the discount rate used to estimate the present value of future obligations.
Central Hudson's contributions in 2012 to fund OPEBs were $3.3 million and its contributions for 2013 are expected to be $2.9 million resulting in a funded status thatmeets Central Hudson's objectives. The actual contributions could vary significantly based upon actual and projected investment returns, interest rate assumptions andcorporate resources. Actual funded status could vary significantly based on asset returns and changes in the discount rate used to estimate the present value of futureobligations.
During 2012, the value of the Retirement Plan and OPEB assets increased by $62.3 million and $10.0 million, respectively. However, the decrease in discount rates from2011 increased the present value of the plans' liabilities. The net effect on the funded status of the Retirement Plan was a decrease in the unfunded liability, conversely, thenet effect on the funded status of OPEBs was an increase in unfunded liability and as such, additional contributions will likely become necessary. Management expects thatsuch contributions will be recovered through the rate making process over time. Management has transitioned to an investment strategy with a target of 50% long-durationfixed income assets which is intended to reduce the year-to-year volatility of the funded status of the plan and of the level of contributions by more closely aligning thecharacteristics of plan assets and liabilities. Management cannot currently predict what impact future financial market volatility may have on the funded status of the plan orfuture funding decisions.
-67-
Table of Contents
Under the policy of the PSC regarding pension and OPEB costs, Central Hudson recovers these costs through customer rates with differences between actual cost and rateallowances deferred for future recovery from or return to customers. Based on the current policy, Central Hudson expects to fully recover its net periodic pension and OPEBcosts over time.
Anticipated Sources and Uses of Cash
CH Energy Group's cash flow is primarily generated by the operations of its direct subsidiaries, Central Hudson and CHEC. Generally, the subsidiaries do not accumulatecash but rather provide cash to CH Energy Group in the form of dividends and, in the case of CHEC, repayments on its intercompany loans.
Central Hudson's planned capital expenditures for construction and removal during 2013 total approximately $115 million. Central Hudson expects to fund capitalexpenditures with cash from operations and a combination of short-term and long-term borrowings. Central Hudson may alter its plan for capital expenditures as itsbusiness needs require.
Central Hudson intends to fund growth in its long-lived assets in a manner that maintains an equity ratio of approximately 48% or higher excluding short-term debtbalances. Central Hudson plans to utilize short-term debt to fund seasonal and temporary variations in working capital requirements. If wholesale energy prices increase,Central Hudson would expect a corresponding increase in its current level of working capital.
Excluding acquisitions, capital expenditures at Griffith are expected to be approximately $2.3 million during 2013. In accordance with its business strategy, Griffith expectsto fund any acquisitions from internally generated cash flow.
Griffith is financed by intercompany loans and equity investments from CH Energy Group in a manner that maintains an equity ratio of approximately 55% before seasonalworking capital needs. CH Energy Group plans to utilize short-term debt to fund seasonal and short-term variations in Griffith's working capital needs. If wholesale energyprices increase, Griffith would expect a corresponding increase in its current level of working capital.
-68-
Table of Contents
CH Energy Group believes cash generated from operations and funds obtained from its financing program will be sufficient in 2013 and the foreseeable future to meetworking capital needs, pay dividends on its Common Stock, and fund investments and acquisitions to fulfill its public service obligations and growth objectives.
CH Energy Group's secondary sources of funds are its cash reserves and its credit facility. CH Energy Group's ability to use its credit facility is contingent upon maintainingcertain financial covenants. CH Energy Group does not anticipate that those covenants will restrict its access to funds in 2013 or the foreseeable future.
Effective July 31, 2007, CH Energy Group's Board of Directors extended and amended the Common Stock Repurchase Program of the Company (the "RepurchaseProgram"), which was originally authorized in 2002. As amended, the Repurchase Program authorized the repurchase of up to 2,000,000 shares (excluding sharesrepurchased before July 31, 2007) or approximately 13% of CH Energy Group's outstanding Common Stock, from time to time, through July 31, 2012. As of the end of theauthorized period in July 2012, CH Energy Group had purchased 948,676 shares under the Repurchase Program.
As part of this Repurchase Program, on August 16, 2011, CH Energy Group implemented an accelerated share repurchase program ("ASR") through which, CH Energy
http://www.sec.gov/Archives/edgar/data/18647/000106139313000018/form10k.htm[8/23/2013 4:25:39 PM]
Group paid $30 million and received 554,017 shares. Following the announcement of the proposed acquisition of CH Energy Group by Fortis on February 21, 2012, theagent elected to terminate the agreement. As a result of the termination, CH Energy Group paid an additional $3.0 million to the agent in final settlement of the ASRprogram. As a result of the increase in its stock price subsequent to August 16, 2011, CH Energy Group paid an additional $3.0 million to the agent in final settlement of theASR program. There was no change in the number of shares purchased. Financing Program
CH Energy Group believes that it is well positioned with a strong balance sheet and strong liquidity. CH Energy Group entered 2013 with modest short-term debt liabilitiesand significant available capacity under CH Energy Group's and Central Hudson's committed credit facilities. Central Hudson's strong investment-grade credit ratings helpfacilitate access to long-term debt; however, despite improving conditions in financial markets, management can make no assurance regarding the availability of financingor its terms and costs.
On October 19, 2012, CH Energy Group entered into a new three year $100 million revolving credit agreement with several commercial banks to provide committedliquidity for a term of three years. CH Energy Group felt that its strategic transition, including the disposition of certain CHEC assets, warranted a reduction in the size ofthe credit facility. The previous $150 million facility was terminated as of the effective date of the new agreement. At December 31, 2012, CH Energy Group had $19.5million in outstanding borrowings under its credit agreement. The lenders under this $100 million credit agreement consist of JPMorgan Chase Bank, N.A., Bank ofAmerica, N.A., HSBC Bank USA, N.A., and KeyBank National Association.
-69-
Table of Contents
Central Hudson maintains a $150 million committed revolving credit facility with JPMorgan Chase Bank, N.A., Bank of America, N.A., HSBC Bank USA, N.A., KeyBankNational Association and RBS Citizens Bank, N.A. as the participating banks. The credit facility has a term of five years, ending on October 19, 2016. In addition to thiscredit facility, Central Hudson maintains several uncommitted lines of credit with various banks. These arrangements give Central Hudson competitive options to minimizethe cost of its short-term borrowings. At December 31, 2012, Central Hudson had no outstanding balance under its uncommitted lines of credit or its committed creditfacility.
The availability of these facilities is contingent upon the ability of the lenders to fulfill their commitments. If one or more banks are deemed at risk of being unable to meettheir commitments, CH Energy Group and Central Hudson may seek alternative sources of committed credit to supplement the current agreements. However, alternatesources may not be readily available. CH Energy Group and Central Hudson plan for such a situation in part by reserving portions of the total commitment for unforeseenevents.
Central Hudson meets its need for long-term debt financing through a medium-term notes program and privately placed debt. As a regulated electric and natural gas utilitycompany, Central Hudson is required to obtain authorization from the PSC to issue securities with maturities greater than 12 months.
On September 14, 2012, the PSC authorized Central Hudson to enter into a multi-year committed credit in the principal amount of up to $175 million and to issue up to $250million of long-term debt through December 31, 2012. The Order authorized Central Hudson to issue the long-term debt to finance its construction expenditures, refundmaturing long-term debt, redeem existing debt and preferred stock and refinance its 1999 NYSERDA Bonds, Series B.
On March 30, 2012, Central Hudson issued $48.0 million of its Series G registered unsecured Medium-Term Notes. The notes bear interest at the rate of 4.776% per annumon a principal amount of $48.0 million and mature on April 1, 2042. The proceeds of the sale of the Notes were used by Central Hudson to repay short-term borrowings of$36.0 million incurred to refinance its 6.64% Series D Medium-Term Notes that matured March 28, 2012, and to redeem its Cumulative Preferred Stock, Series D (4.35%),with an aggregate redemption price of approximately $6.1 million, and its 4.96% Cumulative Preferred Stock, Series E, with an aggregate redemption price of approximately$6.1 million on May 18, 2012.
-70-
Table of Contents
On November 20, 2012, Central Hudson issued $24.0 million of its Series G registered unsecured Medium-Term Notes. The notes bear interest at the rate of 4.065% perannum on a principal amount of $24.0 million and mature on October 1, 2042.
Central Hudson has two outstanding series of tax-exempt pollution control revenue bonds, totaling $50.4 million in principal amount, which were issued throughNYSERDA. These NYSERDA bonds are insured by Ambac Assurance Corporation ("Ambac"), and the ratings on these bonds reflect the higher of the credit rating ofAmbac or Central Hudson, which currently is the rating of Central Hudson.
Central Hudson's Series B 1999 NYSERDA Bonds total $33.7 million and are tax-exempt multi-modal bonds that are currently in a variable rate mode. In its Orders, thePSC has authorized deferral accounting treatment for variations in the interest costs under these bonds. As such, variations between the actual interest rates on these bondsand the interest rate included in the current delivery rate structure for these bonds are deferred for future recovery from or refund to customers. As a result, variations ininterest rates do not have any impact on earnings.
To mitigate the potential cash flow impact from unexpected increases in short-term interest rates on the Series B Bonds, Central Hudson purchased an interest rate cap basedon an index of the short-term tax-exempt debt. The rate cap is two years in length with a notional amount aligned with the principal amount of the Series B and will expireon April 1, 2014. The cap is based on the monthly weighted average of an index of tax-exempt variable rate debt, multiplied by 175%. Central Hudson would receive apayout if the adjusted index exceeds 5.0% for a given month. As of December 31, 2012, no payout is expected and as such the fair value of this instrument is zero.
Central Hudson is currently evaluating what actions, if any, it may take in the future in connection with its 1999 NYSERDA Series B Bonds. Potential actions may include
http://www.sec.gov/Archives/edgar/data/18647/000106139313000018/form10k.htm[8/23/2013 4:25:39 PM]
converting the debt to another interest rate mode and/or refinancing with taxable bonds.
In November 2013, outstanding Medium-Term notes issued by Central Hudson totaling $30 million will mature. Central Hudson expects to refinance these notes usingeither publicly or privately placed debt.
Costs incurred in the issuance of the unsecured Series G Medium-Term notes have been allocated proportionately across the issuances and will be amortized over theirrespective terms. The amortization of debt costs for both outstanding and redeemed debt are incorporated in the revenue requirement for delivery rates as authorized by thePSC.
Griffith's debt financing of $33.0 million, as of December 31, 2012, is provided by CH Energy Group through intercompany loans at market rates.
-71-
Table of Contents
For more information on CH Energy Group's and Central Hudson's financing program, see Note 7 - "Short-Term Borrowing Arrangements," Note 8 - "Capitalization -Common and Preferred Stock," and Note 9 - "Capitalization - Long-Term Debt."
Parental Guarantees
For information on parental guarantees issued by CH Energy Group and CHEC, see Note 1 - "Summary of Significant Accounting Policies" under the caption "ParentalGuarantees."
Product Warranties
For information on product warranties issued by Griffith, see Note 1 - "Summary of Significant Accounting Policies" under the caption "Product Warranties."
Environmental Matters
For information on environmental matters related to CH Energy Group, Central Hudson, CHEC, and Griffith, see sub-caption "Environmental Matters" in Note 12 -"Commitments and Contingencies" under the caption "Contingencies."
Related Parties
For information on related parties to CH Energy Group and Central Hudson, see Note 1 - "Summary of Significant Accounting Policies" under the caption "Related PartyTransactions."
REGULATORY MATTERS – PSC PROCEEDINGS Fortis – Central Hudson Gas & Electric Corporation Section 70 Joint Petition(Case 12-M-0192 – Proceeding on the Joint Petition for Approval of the Acquisition of CH Energy Group, Inc. by Fortis Inc. and Related Transactions)
Background: On April 20, 2012, CH Energy Group, Central Hudson, Fortis, FortisUS Inc. ("FortisUS"), and Cascade Acquisition Sub Inc. ("Petitioners"), submitted a jointpetition to the PSC for approval of the acquisition of CH Energy Group by Fortis and related transactions. The petition describes how the acquisition of Central Hudson byFortis will produce benefits for constituencies that include customers, employees and communities in Central Hudson's service territory as well as positive public benefits. The petition categorizes the public benefits into three major areas: 1) FortisUS' commitments and intention to preserve and build on the existing strength of Central Hudsonas a "stand-alone" company, 2) comprehensive financial protections to mitigate any potential financial risks of the merger consistent with the PSC's disposition of specificissues that have arisen in prior utility merger proceedings in New York State and 3) identifiable financial customer benefits resulting from avoidance of costs otherwiseowed to customers by shareholders and cost savings made possible by the merger. The petition includes proposals and commitments that effectively mitigate any potentialrisks to Central Hudson's customers from foreign holding company ownership and rate increase risk. The petitioners have quantified the economic value of the proposals inthe merger to be in excess of $50 million.
-72-
Table of Contents
Notable Activity:Pursuant to the schedule adopted by the ALJs in the proceeding:
· On October 12, 2012, the PSC's Staff and other interested parties filed testimony and comments regarding the proposed acquisition.
· On November 5, 2012, the PSC Trial Staff filed Supplemental Testimony and Exhibits to correct errors related to their calculation of a Public Benefit Adjustment.
· On November 27, 2012, Petitioners submitted Reply Comments and Rebuttal Testimony and PSC Staff filed Rebuttal Testimony.
· On December 4, 2012, PSC filed surrebuttal testimony.
· Parties filed their lists of Disputed Issues of Material Fact on December 4, 2012.
· Pursuant to a Notice of Potential Settlement filed by the Petitioners on December 12, 2012, a series of settlement discussions were held between December 17,2012 and January 11, 2013.
· On January 25, 2013, a Joint Proposal with the Company, Fortis, PSC Staff, Multiple Intervenors, the Department of State Utility Intervention Unit (consumer
http://www.sec.gov/Archives/edgar/data/18647/000106139313000018/form10k.htm[8/23/2013 4:25:39 PM]
advocate), and Dutchess, Orange and Ulster counties as signatories, was submitted to the PSC. The signatory parties have concluded that, based on the terms of theSettlement Agreement, the acquisition is in the public interest pursuant to the New York State Public Service Law, Section 70, and recommended approval by theCommission.
· Statements in Support/Opposition to the Joint Proposal were due February 8, 2013, with Statement Replies due February 15, 2013.
· A PSC order regarding the Joint Proposal is expected in the second quarter of 2013.
The major components of the Joint Proposal include:· Quantified benefits, in addition to a one-year rate freeze for the period July 1, 2013 through June 30, 2014 including:
- synergy savings/guaranteed future rate mitigation of $1.85 million per year for 5 years, totaling $9.25 million;- $35 million to write off existing deferred regulatory assets and to provide additional future rate mitigation;- establishment of a Community Benefit Fund of $5 million to be used for economic development and low income programs;- earnings sharing was modified to reduce the threshold from 10.5% to 10% with 50/50 sharing beginning at 10%; and- a provision that Central Hudson file a formal Superstorm Sandy deferral petition as soon as reasonably practicable for review by the Commission on an
expedited basis. This petition was filed on February 6, 2013.
-73-
Table of Contents
The Joint Proposal also includes various governance, corporate and financial protection conditions. These protections include goodwill and acquisition cost conditions,credit quality and dividend restriction conditions, money pooling conditions and establishing a special class of preferred stock. In addition, the Joint Proposal establishedprovisions for financial transparency and reporting, affiliate transactions, cost allocations and code of conduct. Finally, the terms of the Joint Proposal provide additionalcustomer service protections and benefits.
Potential Impacts: A PSC order regarding the Joint Proposal is expected in the second quarter of 2013. Central Hudson believes the merger is in the public interest andshould be approved on the basis of the proposals set forth in the petition. Failure to complete the acquisition could negatively affect our share price, including by reducing itto a level at or below the trading range preceding the announcement of the Fortis transaction. No assurance can be given regarding the outcome of the matter at this time.Petition of Central Hudson Gas & Electric Corporation for Commission Approval of Deferred Incremental Costs Associated withSuperstorm Sandy(Case 13-E-0048)
Background: On October 29, 2012, Central Hudson's service territory was impacted by Superstorm Sandy, and approximately 103,000 electric customers were affected. The Sandy storm costs were included in the estimate of $22 million storm costs identified in the $35 million of regulatory liabilities to be funded by Fortis. Consistent withthe Joint Proposal, on February 6, 2013, Central Hudson filed a petition with the PSC seeking expedited Commission approval to recover $9.7 million of incremental electricstorm restoration expense, with carrying charges. These storm costs represent the amount Central Hudson deferred on its books as of December 31, 2012, based on actualcosts incurred, bills received and an estimate for bills outstanding and are above the respective rate allowance during the twelve months ended June 30, 2013, which is thethird rate year established by the PSC in its approval of a Joint Proposal in Case 09-E-0588. The Company believes the incremental costs associated with this storm meet thePSC's criteria for deferral: 1) the amount is incremental to the amount in rates; 2) the incremental amount is material and extraordinary in nature and 3) the utility's earningsare below the authorized rate of return on common equity.
Potential Impacts: If the PSC approves any amount less than the $9.7 million reflected in the petition, Central Hudson's expenses would increase by the unapproved amountduring the quarter in which the PSC's order is issued.
-74-
Table of Contents
SIR Proceeding(Case 11-M-0034 – Proceeding on Motion of the Commission to Commence a Review and Evaluation of the Treatment of the States' Regulated Utilities' Site Investigationand Remediation ("SIR") Costs)
Background: In February 2011, the PSC initiated a proceeding to review and evaluate the treatment of MGP SIR costs. Among the approaches explored during theproceeding were adoption of a generic cost sharing policy and other cost recovery mechanisms.
Notable Activity:· On November 28, 2012, the Commission issued its Order in this proceeding. The Order does not call for an allocation of costs between ratepayers and
shareholders due to concerns that instituting such a policy could lead to adverse credit action against utilities by rating agencies. Therefore, no change in thecurrent recovery structure of MGP SIR costs was ordered. However there is a possibility of sharing on a case by case basis and the PSC cited two particularcircumstances under which it would consider sharing:
1) As incentive to constrain SIR costs of companies that appear to need such an incentive; and2) In negotiation in rate plans where an earnings sharing mechanism is a provision, utilities may be directed to allocate some of the excess earnings to
pay down deferred SIR costs.· The SIR Order also adopted the following requirements:
1) annual reporting of SIR costs due at the same time utilities file their PSC Annual Report;2) filings of an inventory of best practices for SIR cost containment based on the utilities' efforts to date; and3) testimony in any future rate filing in which SIR cost recovery is sought to include: 1) confirmation that the remediation process is in compliance with
http://www.sec.gov/Archives/edgar/data/18647/000106139313000018/form10k.htm[8/23/2013 4:25:39 PM]
DEC requirements or existing timetable, 2) data on the Company's SIR cost control efforts (including reference to the best practice inventory), and 3)information related to the results of the Company's review of any internal processes with respect to SIR procedures, specifically with respect tointernal controls.
Potential Impacts: A change to the current recovery structure of MGP SIR costs could have an adverse impact on Central Hudson earnings and cash flow. For furtherdiscussion about Central Hudson's SIR activities, see Note 12 – "Commitments and Contingencies" under the caption "Former Manufactured Gas Plant Facilities" to theConsolidated Financial Statements of this 10-K Annual Report. The outcome of this proceeding did not have any impact on Central Hudson's current accounting andrecovery of MGP SIR costs.
-75-
Table of Contents
Petition of Central Hudson Gas & Electric Corporation for Commission Approval of Deferred Incremental Costs Associated withTropical Storm Irene(Case 11-E-0651)
Background: On November 28, 2011, Central Hudson filed a petition with the PSC to defer for future recovery with carrying charges $11.4 million of incremental electricstorm restoration expenses above the respective rate allowance during the twelve months ended June 30, 2012. These incremental costs represent the amount CentralHudson deferred on its books as of October 31, 2011 based on actual costs incurred, bills received and an estimate for bills outstanding. The Company believes theincremental costs associated with this storm meet the PSC's criteria for deferral: 1) the amount is incremental to the amount in rates; 2) the incremental amount is materialand extraordinary in nature and 3) the utility's earnings are below the authorized rate of return on common equity.
Potential Impacts: If the PSC approves any amount less than the $11.4 million reflected in the petition, Central Hudson's expenses would increase by the unapprovedamount during the quarter in which the PSC's order is issued.
Petition of Central Hudson Gas & Electric Corporation for Commission Approval of Deferral of October 29, 2011 SnowFall Costs(Case 12-M-0204)
Background: On October 29, 2011, Central Hudson experienced an unusual winter storm with snow accumulations of up to 20 inches in the service territory, resulting inelectric service outages to over 150,000 customers, extensive damage to the electric system and significant restoration costs. Following Tropical Storm Irene, the Octobersnowstorm represented the second extraordinary storm event that occurred within the second rate year established by the PSC in its Rate Plan adopting the terms of a JointProposal in Case 09-E-0588. On April 24, 2012, Central Hudson filed a petition with the PSC to defer for future recovery with carrying charges $8.6 million of totalincremental electric storm restoration expense. The Company believes that it is entitled to fully recover all of these incremental expenses and has filed its petition with thePSC to reflect that position. However, because the petition requests the PSC to deviate from its prior precedents, the amount the PSC may grant could be lower. Accordingly, management deferred only the portion of the incremental costs that strictly follows Commission practice used in the Company's previous requests to deferincremental storm costs. Approximately $3.7 million and $3.3 million of incremental restoration expense associated with this storm was expensed in 2011 and 2012,respectively, so that the return on common equity for the twelve months ending June 30, 2012 did not exceed the authorized rate of return of 10%.
-76-
Table of Contents
Potential Impacts: Depending on the amount approved by the PSC, Central Hudson's expenses could be impacted as follows:- Any amount approved in excess of $1.7 million would reduce Central Hudson's expenses.- If the PSC approves less than $1.7 million, Central Hudson's expenses would increase by the difference between the amount approved and $1.7 million.
Central Hudson Gas & Electric Corporation Financing Petition(Case 12-M-0172 - Petition of Central Hudson Gas & Electric Corporation for Authority to enter into multi-year committed credit agreements and issue and sell long-termdebt)
Background: On April 13, 2012, Central Hudson filed a petition with the PSC seeking approval to (a) enter into multi-year committed credit agreements to providecommitted funding to meet expected liquidity needs, in amounts not to exceed $175 million in the aggregate and maturities not to exceed five years, and (b) approval toissue and sell long-term debt, commencing immediately upon issuance of an order regarding the petition, and from time to time through December 31, 2015, in an amountnot to exceed $250 million in the aggregate.
Final Order: On September 14, 2012, the PSC issued its Order Authorizing Issuance of Securities for Central Hudson in this proceeding. The Order grants theauthorization requested for $175 million of committed credit; grants the authorization requested, with conditions, for $250 million of long-term debt; and revokes theauthorization granted in the prior financing order, avoiding the overlap in orders (the prior financing order covered a period ending December 31, 2012 and the new order iseffective immediately).
Impacts on Financing Needs: The PSC's order provides Central Hudson with the ability to meet its projected working capital, construction financing and maturing debtneeds.
Gas Expansion Case(Case 12-G-0297 – Proceeding on Motion of the Commission to Examine Polices Regarding the Expansion of Natural Gas Services)
Background: On November 30, 2012, the PSC issued an order instituting a new proceeding to examine and evaluate Commission policies, both within existing franchises
http://www.sec.gov/Archives/edgar/data/18647/000106139313000018/form10k.htm[8/23/2013 4:25:39 PM]
and in cases of franchise expansions, to consider policy revisions in hopes of expanding natural gas delivery service in order to take full advantage of prices and otherbenefits of natural gas. The Order directed Staff to convene a Technical Conference which was held on January 9, 2013, with presentations from each of the utilitiesconsisting of an overview of their gas system, current practices and policies, plans for expansions and addressing specific questions posed in the proceeding related tobarriers to extension and expansion of natural gas faculties, rate and ratepayer considerations, economic development, public/private partnerships and environmental impact. Three working groups consisting of 1) customers already within 100 feet of a gas main, 2) customers more than 100 feet from an existing main but within the franchisedservice territory and 3) customers outside of any existing natural gas franchise have been established to develop approaches to address expansion of gas service for eachcustomer group.
-77-
Table of Contents
Potential Impacts: No prediction can be made regarding the outcome of the matter or the potential impacts to the Company at this time.
AC Transmission Upgrades Proceeding(Case 12-T-0532 – Proceeding on Motion to Examine Alternating Current Transmission Upgrades)
Background: Following the release of the Governor's New York Energy Highway Blueprint, the PSC issued an order on November 30, 2012 instituting a new proceedingto solicit Statements of Intent from transmission owners and developers to address solutions for selected congested transmission corridors. The PSC held a TechnicalConference on December 17, 2012 to provide technical assistance to potential developers and transmission owners contemplating the submittal of Statements of Intent. OnJanuary 25, 2013, the New York Transco comprised of Central Hudson and the other New York Transmission Owners ("NYTOs") filed their Statement of Intent, outliningfive transmission infrastructure projects totaling $1.2 billion of investment that improve grid reliability, relieve system bottlenecks, provide economic benefits and protectthe environment.
Potential Impacts: No prediction can be made regarding the outcome of the matter or the potential impacts to the Company at this time.
Moreland Commission
Background: On November 13, 2012, Governor Cuomo signed an Executive Order to establish a commission under the Moreland Act that will investigate the response,preparation and management on New York State's power utility companies with major storms that hit the state over the past two years which include Tropical Storm Irene,Tropical Storm Lee and Superstorm Sandy. The Moreland Commission was tasked to undertake a thorough review of all actions taken by companies before and after theseemergencies and make specific recommendations to reform and modernize oversight, regulation and management of New York State's power delivery services. During theirinvestigation, Central Hudson received and responded to two subpoenas from the Commission seeking documents and information. On January 7, 2013, the MorelandCommission issued an Interim Report making the following recommendations: 1) strengthen state oversight of utilities, 2) unify state energy programs and policy and 3)restructure the Long Island Power Authority ("LIPA"). The Moreland Commission continues to review utility and LIPA operations and will conduct additional publichearings in storm affected areas across the state. A final report with additional recommendations is expected to be issued in the coming months.
-78-
Table of Contents
Potential Impacts: Enactment of many of the Moreland Commission's recommendations requires legislative action and some recommendations, if adopted, may affect theregulation of all NYS utilities', including Central Hudson's future storm preparedness and response as well as its investment plans and maintenance practices.
Other PSC Proceedings
For the year ended December 31, 2012, there has been no significant activity related to the following proceedings:
· Advanced Metering Infrastructure
· The American Recovery and Reinvestment Act of 2009
· Management Audit
· Energy Efficiency Portfolio Standard and State Energy Planning
Non-Utility Land Sales
For further information regarding non-utility land sales, see Note 2 - "Regulatory Matters."
Electric Reliability Performance
For further information regarding Central Hudson's electric reliability performance, see Note 2 - "Regulatory Matters."
OTHER MATTERS
Pension Protection Act
Under the Pension Protection Act signed into law in 2006, new defined benefit funding rules are effective for plan years beginning after December 31, 2007. Certain
http://www.sec.gov/Archives/edgar/data/18647/000106139313000018/form10k.htm[8/23/2013 4:25:39 PM]
transition rules apply for 2008 through 2010. For additional discussion regarding the Pension Protection Act, please see the "Retirement Plan" discussion that follows.
Changes In Accounting Standards
See Note 3 - "New Accounting Guidance" for a discussion of the status of new accounting guidance issued.
Off-Balance Sheet Arrangements
CH Energy Group and Central Hudson do not have any off-balance sheet arrangements.
-79-
Table of Contents
Retirement Plan
See Note 10 – "Post-Employment Benefits" and Critical Accounting Policies for a discussion of the Retirement Plan.
Climate
While it is possible that some form of global climate change program will be adopted at the federal level in the next term of Congress, it is too early to determine whatimpact such program will have on CH Energy Group. It should be noted, however, that the Company's calculated CO2 emission levels are relatively small, mainly becausethe Company does not generate electricity in significant quantities and the electricity it does generate is primarily from zero emission hydroelectric plants. Therefore,federally mandated greenhouse gas reductions or limits on CO2 emissions are not expected to have a material impact on the Company's financial position or results ofoperations. However, the Company can make no prediction as to the outcome of this matter. If the cost of CO2 emissions causes purchased electricity and natural gas coststo rise, such increases are expected to be collected through automatic adjustment clauses. If sales are depressed by higher costs through price elasticity, the RDMs areexpected to prevent an earnings impact on the Company.
CRITICAL ACCOUNTING POLICIES
Regulation
The Financial Statements were prepared in conformity with accounting principles generally accepted in the United States of America ("GAAP"), which for regulated publicutilities, includes specific guidance for Regulated Operations. For additional information regarding regulatory accounting, see Note 2 – "Regulatory Matters."
Use of Estimates
Preparation of the Consolidated Financial Statements in accordance with GAAP includes the use of estimates and assumptions by management that affect financial results. Actual results may differ from those estimated; however the methods used by CH Energy Group to prepare estimates have historically produced reliable results.
Expense items most affected by the use of estimates are depreciation and amortization (including amortization of intangible assets), reserves for uncollectible accountsreceivable, other operating reserves, tax reserves, unbilled revenues, and pension and other post-retirement benefits.
Depreciation and amortization is based on estimates of the useful lives and estimated net salvage value of properties. For Central Hudson, these estimates are subject tochange as the result of a future rate proceeding. Historical changes have not been material to the Company's financial results. For Griffith, any changes in estimates used fordepreciation are not expected to have a material impact on CH Energy Group's financial results. The amortization of CH Energy Group's other intangible assets is discussedin detail below under the caption "Goodwill and Other Intangible Assets."
-80-
Table of Contents
During 2010, Central Hudson elected to change its tax return methodology for claiming deductions for incidental repair and maintenance expenditures on its utility assets. The change accelerates the recognition of the tax deduction from later periods. Although the Company believes that its methodology for claiming the deduction isconsistent with the Internal Revenue Code and case law, it is unclear whether the Internal Revenue Service will accept the entirety of the deduction claimed. Accordingly,Central Hudson recorded a reserve in 2010 based upon the expected outcome on audit. In August 2011, the IRS released Revenue Procedure 2011-43, which provides a safeharbor method of accounting for determining the amount of expenditures required to be capitalized. The Revenue Procedure applies to electric transmission and distributionproperty only. It also provides procedures for obtaining automatic consent to change to the safe harbor method of accounting. Central Hudson adopted this RevenueProcedure effective with the filing of its 2011 Federal Income Tax return; therefore the electric portion of the reserve established in 2010 has been reclassified to deferred taxliability accounts. A similar Revenue Procedure related to the gas repair deduction is expected in 2013. See Note 4 – "Income Tax" for further discussion of the tax reserveestablished.
Estimates for uncollectible accounts are based on customer accounts receivable aging data as well as consideration of various quantitative and qualitative factors, includingeconomic factors such as future outlooks for the economy, unemployment rates, energy prices and special collection issues. The estimates for other operating reserves arebased on assessments of future obligations related to injuries and damages and workers compensation claims. Unbilled revenues are determined based on the estimated salesfor bi-monthly accounts that have not been billed by Central Hudson in the current month. The estimation methods used in determining these sales are the same methodsused for billing customers when actual meter readings cannot be obtained. Historical changes to these items have not been material to the Company's financial results.
http://www.sec.gov/Archives/edgar/data/18647/000106139313000018/form10k.htm[8/23/2013 4:25:39 PM]
See caption "Post-Employment Benefits" below for discussion of significant estimates and assumptions used in the accounting for pension and other post-retirementbenefits.
See Note 1 - "Summary of Significant Accounting Policies" under the caption "Use of Estimates" to the Consolidated Financial Statements of this 10-K Annual Report foradditional discussion.
Goodwill and Other Intangible Assets
The balances reflected on CH Energy Group's Consolidated Balance Sheet at December 31, 2012 and December 31, 2011 for "Goodwill" and "Other intangible assets - net"relate to Griffith. Goodwill represents the excess of cost over the fair value of the net tangible and identifiable intangible assets of businesses acquired as of the date ofacquisition.
-81-
Table of Contents
In accordance with current accounting guidance related to goodwill and other intangible assets, both goodwill and intangible assets not subject to amortization are reviewedat least annually for impairment and whenever events or circumstances make it more likely than not that an impairment may have occurred. Events such as a significantadverse change in the business climate or a decision to sell or dispose of a reporting unit are examples of likely circumstances. In assessing whether an impairment exists,the fair value of the reporting unit is compared to the carrying amount of assets. In the fourth quarter, management performed a qualitative assessment of any potentialimpairment of Griffith's goodwill. Based upon the qualitative analysis, management believes that it is more likely than not that the fair market value is more than thecarrying value of Griffith and therefore, the first and second steps of the impairment test prescribed in the guidance was deemed not necessary. The carrying amount forgoodwill was $39.0 million as of December 31, 2012 and $37.5 million as of December 31, 2011. If the operating cash flows of Griffith decline significantly relative to CHEnergy Group's investment in Griffith in the future, the result could be recognition of a goodwill impairment charge to operations and the amount could be material to CHEnergy Group's Consolidated Financial Statements. The last quantitative analysis of impairment was performed as of September 30, 2010, which reflected that the fair value of Griffith exceeded its carrying value byapproximately $34.2 million. Fair value of goodwill is estimated using a weighted average of the discounted cash flow and market approach methodologies. In applying thismethodology to the discounted cash flow, reliance is placed on a number of factors, including actual operating results, future business plans, economic projections andmarket data. The most significant assumptions used in the discounted cash flow valuation regarding Griffith's fair value in connection with goodwill valuations are: 1)detailed five-year cash flow projections; 2) the risk adjusted discount rate; and 3) Griffith's expected long-term growth rate, which approximates the growth rate imputedfrom the discrete period cash flow projections on key aspects of the business. The primary drivers of Griffith's cash flow projections include sales volumes, margin rates andexpense inflation, particularly for labor. The risk adjusted discount rate represents Griffith's weighted average cost of capital and is established based on: 1) the 30 year risk-free rate; 2) Griffith's indicated market-based rate of return on equity; and 3) the current after-tax rate of return on debt. In valuing its goodwill for 2010, Griffith used anaverage discount rate of 10.4%. Had the discount rate been 25 basis points higher, the aggregate estimated fair value of the reporting units would have decreased by $1.2million, or 1.4%. In addition, Griffith used an average expected terminal growth rate of 0.5%. If the expected terminal growth rate was 25 basis points lower, the aggregateestimated fair value of the reporting units would have decreased by $0.8 million, or 0.9%. Had each year in Griffith's five-year cash flow projections been lower by 1.0%,the aggregate estimated fair value of the reporting units would have decreased by $0.2 million, or 0.3%.
-82-
Table of Contents
Other intangible assets - net relate to Griffith and are comprised of customer relationships, trademarks and covenants not to compete. If events indicate that an impairmentexists, these assets are tested for impairment by comparing the carrying amount to the sum of undiscounted cash flows expected to be generated by the asset.
In accordance with current accounting guidance, intangible assets that have finite useful lives continue to be amortized over their useful lives. The estimated useful life forcustomer relationships is 15 years, which is believed to be appropriate in view of average historical customer attrition. The useful lives of trademarks were estimated to be10 years based upon Management's assessment of several variables such as brand recognition, Management's expected use of the trademark, and other factors that may haveaffected the duration of the trademark's life. The useful life of a covenant not to compete is based on the expiration date of the covenant, generally between three and tenyears. Amortization expense was $2.5 million, $2.4 million and $2.3 million for the years ended December 31, 2012, 2011 and 2010, respectively. The weighted averageamortization period for all assets acquired in the current year is 13 years. The weighted average amortization periods for customer relationships, trademarks and covenantsnot to compete are 15 years, 10 years and 4 years, respectively. The estimated useful life of Griffith's customer relationships is tested annually based on actual experience. The amortizable life of these assets has not changed since Griffith was acquired. The estimated annual amortization expense for each of the next five years, assuming no new acquisitions or divestitures, is as follows (In Thousands):
2013 2014 2015 2016 2017 Estimated Amortization Expense $ 2,645 $ 2,636 $ 2,374 $ 988 $ 683
See Note 6 - "Goodwill and Other Intangible Assets" of this 10-K Annual Report for additional discussion.
Post-Employment Benefits
In accordance with the terms of the 2009 and 2010 Rate Orders, Central Hudson is authorized to defer any differences between rate allowances and actual costs for both itsRetirement and OPEB plans. As a result, Central Hudson expects to fully recover its net periodic pension and OPEB costs over time.
Central Hudson's reported costs of providing non-contributory defined pension benefits as well as certain health care and life insurance benefits for retired employees are
http://www.sec.gov/Archives/edgar/data/18647/000106139313000018/form10k.htm[8/23/2013 4:25:39 PM]
dependent upon numerous factors resulting from actual plan experience and assumptions of future plan performance.
The significant assumptions and estimates used to account for the Retirement Plan and other post-retirement benefit expenses and liabilities are the discount rate, theexpected long-term rate of return on the pension plan and other post-retirement plan assets, health care cost trend rate, the rate of compensation increase, mortalityassumptions, termination assumptions, retirement assumptions and the method of amortizing gains and losses.
-83-
Table of Contents
For 2012, the Projected Benefit Obligation ("PBO") for Central Hudson's Retirement Plan ($608 million) and its obligation for OPEB costs ($157 million) were determinedusing a 3.8% and a 3.7% discount rate, respectively. These rates were determined using the Mercer Pension Discount Yield Curve reflecting projected cash flows. As ofNovember 30, 2012, the Mercer Pension Discount Yield Curve bond selection criteria was expanded to reflect a broader representation of the high quality corporate bonduniverse. The impact of this change on the resulting discount rate at December 31, 2012 was not material. A 0.25% change in the discount rate would affect the projection ofthe pension PBO by approximately $20.3 million and the OPEB obligation by approximately $5.3 million. Actuarial gains and losses, which include investment returns, discount rates and demographic experience that are different than anticipated based on the actuarialassumptions, are amortized in accordance with procedures set forth by the PSC which require the full gain or loss arising each year to be amortized uniformly over ten years.The cumulative experience for the years 2003 through 2012, which has not yet been amortized into pension expense, is a net loss of $132.4 million. This net loss includes asignificant decline in asset values in 2008 and a decrease in the discount rate in recent years. This cumulative net loss will be reflected in future pension expense for the nextten years in accordance with a set amortization schedule.
During the year ended December 31, 2012, Central Hudson contributed $28.0 million and $3.3 million to its Retirement and OPEB plans, respectively. The total value ofthe Retirement Plan assets increased by $62.3 million and the OPEB plan assets increased in value by $10.0 million. A decrease in discount rates from 2011 increased thepresent value of the plans' liabilities at December 31, 2012. The net effect on the funded status of the Retirement Plan was a decrease in the unfunded Retirement Planliability of $8.7 million. The net effect on the funded status of OPEBs was an increase in the unfunded OPEB liability of $5.4 million. A 0.25% change in the discount ratewould impact the net periodic benefit cost by $1.8 million for the Retirement Plan and $0.4 million for OPEBs. Additional contributions will likely become necessary underthe terms of the Pension Protection Act of 2006. Management expects that such contributions will continue to be incorporated in the rate making process over time. The rateof compensation increase was based on historical and current compensation practices of Central Hudson giving consideration to any anticipated changes in this practice. Central Hudson has investment policies for these plans which include asset allocation ranges designed to achieve a reasonable return over the long-term, recognizing theimpact of market volatility. Central Hudson monitors actual performance against target asset allocations and adjusts actual allocations and targets as deemed appropriate inaccordance with both the Retirement Plan and OPEBs investment strategies.
-84-
Table of Contents
Central Hudson's pension and other post-retirement plans' weighted average asset allocations at December 31, 2012 and 2011, by asset category are as follows: Pension Plan Other Plans
2012 2011 2012 2011 Equity Securities 50.5% 35.8% 61.6% 60.4%Debt Securities 47.4 54.4 37.9 38.1 Other 2.1 9.8 0.5 1.5 Total 100.0% 100.0% 100.0% 100.0% The expected long-term rate of return on Retirement Plan and OPEB assets are 6.25% and 7.8%, net of investment expense. In determining the expected long-term rate ofreturn on plan assets, Central Hudson considered forward-looking estimated returns for each asset class evaluated in light of current economic conditions. The expectedlong-term rate of return is a weighted average based on each plan's investment mix and the forward-looking estimated returns for each investment class. The actual annualreturn on Central Hudson's Retirement Plan and OPEB assets over the previous three years are summarized as follows: Calendar Year Performance 2012 2011 2010 Central Hudson Retirement Plan 14.1% 8.1% 13.3%Central Hudson OPEB (1) 14.3% 1.2% 14.1%Central Hudson OPEB (1) 14.1% 8.1% 11.8% (1) OPEB assets are comprised of two separate groups of investment funds. A 25 basis point decrease in the expected long-term rate of return on Retirement Plan and OPEB assets would have the following impact: increase the net periodic benefitcost by $1.1 million for the pension plan and $0.2 million for OPEBs. The expected long-term rate of return is reviewed annually in the fourth quarter and updated if thedeterminants have changed.
The estimates of health care cost trend rates are based on a review of actual recent trends and projected future trends. Assumed health care cost trend rates have a significanteffect on the amounts reported for the health care plan. A 1% change in assumed health care cost trend rates would have the following effects (In Thousands): One Percentage Point Increase Decrease Effect on total of service and interest cost components for 2012 $ 447 $ (382)
http://www.sec.gov/Archives/edgar/data/18647/000106139313000018/form10k.htm[8/23/2013 4:25:39 PM]
Effect on year-end 2012 post-retirement benefit obligation $ 4,916 $ (4,292) See Note 10 - "Post-Employment Benefits" of this 10-K Annual Report for additional discussion.
-85-
Table of Contents
Accounting for Derivatives
CH Energy Group and its subsidiaries use derivatives to manage their commodity and financial market risks; they do not enter into derivative instruments for speculativepurposes. As a result of deferrals under Central Hudson's regulatory mechanisms and offsetting changes of commodity prices for both Central Hudson and Griffith,derivatives that CH Energy Group and Central Hudson enter into do not materially impact earnings.
All derivatives, other than those specifically excepted, are reported on the Consolidated Balance Sheet at fair value. For discussions relating to market risk and derivativeinstruments, see Item 7A - "Quantitative and Qualitative Disclosure About Market Risk" and Note 14 - "Accounting for Derivative Instruments and Hedging Activities" ofthis 10-K Annual Report. ITEM 7A - Quantitative and Qualitative Disclosure About Market Risk
The practices employed by CH Energy Group and Central Hudson to mitigate risks discussed below continue to operate effectively. For related discussion on this activity,see Item 7 - "Management's Discussion and Analysis of Financial Condition and Results of Operations" under the sub-caption "Capital Resources and Liquidity," Note 14 -"Accounting for Derivative Instruments and Hedging Activities" and Note 9 – "Long-Term Debt" within this 10-K Annual Report.
The primary market risks for CH Energy Group and its subsidiaries and investments are commodity price risk and interest rate risk. Commodity price risk, related primarilyto purchases of natural gas, electricity, and petroleum products for resale to retail customers, is mitigated in several different ways. Central Hudson, as authorized by thePSC, collects its actual purchased electricity and purchased natural gas costs from its customers through cost adjustment clauses in its rates. These adjustment clausesprovide for the collection of costs, including risk management and working capital costs, to reflect the actual costs incurred in obtaining supply. Risk management costs aredefined by the PSC as "costs associated with transactions that are intended to reduce price volatility or reduce overall costs to customers. These costs include transactioncosts and gains and losses associated with risk management instruments." Depending on market conditions, Central Hudson may enter into long-term fixed supply andlong-term forward supply contracts for the purchase of these commodities. Central Hudson also uses natural gas storage facilities, which enable it to purchase and holdquantities of natural gas at pre-heating season prices for use during the heating season. Griffith may increase the prices charged for the commodities it sells in response tochanges in costs; however, its ability to raise prices is generally limited by what the competitive market in which it participates will bear.
Central Hudson and Griffith have in place an energy risk management program within their operations. This risk management program permits the use of derivativefinancial instruments for hedging purposes but does not permit their use for trading or speculative purposes. Central Hudson and Griffith have entered into either exchange-traded futures contracts or over-the-counter ("OTC") contracts with third parties to hedge commodity price risk associated with the purchase of natural gas, electricity, andpetroleum products and to hedge the effect on earnings due to significant variations in weather conditions from historical patterns. The types of derivative instrumentstypically used include natural gas futures and swaps to hedge natural gas purchases, contracts for differences to hedge electricity purchases, put and call options to hedge oilpurchases, and degree-day based weather derivatives to hedge weather variations. In this latter case, Griffith uses such derivative instruments to dampen the impact ofweather variations on delivery revenues. OTC derivative transactions are entered into only with counterparties that meet certain credit criteria. The creditworthiness ofthese counterparties is determined primarily by reference to published credit ratings.
-86-
Table of Contents
The use of derivative instruments for hedging purposes is discussed in more detail in Note 14 -"Accounting for Derivative Instruments and Hedging Activities," whichincorporates sensitivity analysis for each type of derivative instrument.
Interest rate risk affects Central Hudson but is managed through the issuance of fixed-rate debt with varying maturities and of variable rate debt for which interest is reset ona periodic basis to reflect current market conditions. In the case of Central Hudson's variable rate debt, the difference between costs associated with actual variable interestrates and costs embedded in customer rates is deferred for eventual refund to or recovery from customers. The variability in interest rates is also managed with the use of aderivative financial instrument known as an interest rate cap agreement, for which the premium cost and any realized benefits also pass through the aforementionedregulatory recovery mechanism. To mitigate the potential cash flow impact from unexpected increases in short-term interest rates on Series B NYSERDA Bonds, on March28, 2012, Central Hudson purchased an interest rate cap based on an index of short-term tax-exempt debt. The rate cap is two years in length with a notional amountaligned with Series B and will expire on April 1, 2014.
The cap is based on the monthly weighted average of an index of tax-exempt variable rate debt, multiplied by 175%. Central Hudson would receive a payout if the adjustedindex exceeds 5.0% for a given month. The rate cap replaced an expiring rate cap with substantially similar terms. Please refer to Note 9 - "Capitalization - Long-TermDebt," Note 15 - "Other Fair Value Measurements" and Item 7 - "Management's Discussion and Analysis of Financial Condition and Results of Operations" under the sub-caption "Capital Resources and Liquidity" for additional disclosure related to long-term debt.
-87-
Table of Contents
http://www.sec.gov/Archives/edgar/data/18647/000106139313000018/form10k.htm[8/23/2013 4:25:39 PM]
ITEM 8 - Financial Statements and Supplementary Data I - INDEX TO FINANCIAL STATEMENTS: PAGEReport of Independent Registered Public Accounting Firm 90Report of Management on Internal Control Over Financial Reporting 94 CH Energy Group CH Energy Group Consolidated Statement of Income for the three years ended December 31, 2012 96
CH Energy Group Consolidated Statement of Comprehensive Income for the three years ended December 31, 2012 97 CH Energy Group Consolidated Statement of Cash Flows for the three years ended December 31, 2012 98 CH Energy Group Consolidated Balance Sheet at December 31, 2012, and 2011 100 CH Energy Group Consolidated Statement of Equity for the three years ended December 31, 2012 102 Central Hudson Central Hudson Statement of Income for the three years ended December 31, 2012 103 Central Hudson Statement of Comprehensive Income for the three years ended December 31, 2012 103 Central Hudson Statement of Cash Flows for the three years ended December 31, 2012 104 Central Hudson Balance Sheet at December 31, 2012, and 2011 105 Central Hudson Statement of Equity for the three years ended December 31, 2012 107
-88-
Table of Contents
Notes to Consolidated Financial Statements NOTE 1 Summary of Significant Accounting Policies 108 NOTE 2 Regulatory Matters 119 NOTE 3 New Accounting Guidance 127 NOTE 4 Income Tax 128 NOTE 5 Acquisitions, Divestitures and Investments 134 NOTE 6 Goodwill and Other Intangible Assets 136 NOTE 7 Short-Term Borrowing Arrangements 138 NOTE 8 Capitalization - Common and Preferred Stock 139 NOTE 9 Capitalization - Long-Term Debt 141 NOTE
10Post-Employment Benefits 143
NOTE11
Equity-Based Compensation 153
NOTE12
Commitments and Contingencies 157
NOTE13
Segments and Related Information 168
NOTE14
Accounting for Derivative Instruments and Hedging Activities171
NOTE15
Other Fair Value Measurements 178
NOTE16
Subsequent Events 182
Selected Quarterly Financial Data (Unaudited) 183 Financial Statement Schedules Schedule I - Condensed Financial Information of Registrant 184 Schedule II - Reserves - CH Energy Group 187 Schedule II - Reserves - Central Hudson 187
All other schedules are omitted because they are not applicable or the required information is shown in the Consolidated Financial Statements or the Notes thereto.
II - SUPPLEMENTARY DATA:
Supplementary data are included in "Selected Quarterly Financial Data (Unaudited)" referred to in "I" above, and reference is made thereto.
-89-
Table of Contents
http://www.sec.gov/Archives/edgar/data/18647/000106139313000018/form10k.htm[8/23/2013 4:25:39 PM]
REPORT OF INDEPENDENT REGISTERED PUBLIC ACCOUNTING FIRM
To the Board of Directors and Shareholders of CH Energy Group, Inc.
In our opinion, the consolidated financial statements listed in the accompanying index present fairly, in all material respects, the financial position of CH Energy Group, Inc.and its subsidiaries (collectively, the "Company") at December 31, 2012 and 2011, and the results of their operations and their cash flows for each of the three years in theperiod ended December 31, 2012 in conformity with accounting principles generally accepted in the United States of America. In addition, in our opinion, the financialstatement schedules listed in the accompanying index present fairly, in all material respects, the information set forth therein when read in conjunction with the relatedconsolidated financial statements. Also in our opinion, the Company maintained, in all material respects, effective internal control over financial reporting as of December31, 2012, based on criteria established in Internal Control - Integrated Framework issued by the Committee of Sponsoring Organizations of the Treadway Commission(COSO). The Company's management is responsible for these financial statements and financial statement schedules, for maintaining effective internal control overfinancial reporting and for its assessment of the effectiveness of internal control over financial reporting, included in the accompanying CH Energy Group Report ofManagement on Internal Control over Financial Reporting. Our responsibility is to express opinions on these financial statements, on the financial statement schedules, andon the Company's internal control over financial reporting based on our integrated audits. We conducted our audits in accordance with the standards of the Public CompanyAccounting Oversight Board (United States). Those standards require that we plan and perform the audits to obtain reasonable assurance about whether the financialstatements are free of material misstatement and whether effective internal control over financial reporting was maintained in all material respects. Our audits of thefinancial statements included examining, on a test basis, evidence supporting the amounts and disclosures in the financial statements, assessing the accounting principlesused and significant estimates made by management, and evaluating the overall financial statement presentation. Our audit of internal control over financial reportingincluded obtaining an understanding of internal control over financial reporting, assessing the risk that a material weakness exists, and testing and evaluating the design andoperating effectiveness of internal control based on the assessed risk. Our audits also included performing such other procedures as we considered necessary in thecircumstances. We believe that our audits provide a reasonable basis for our opinions.
A company's internal control over financial reporting is a process designed to provide reasonable assurance regarding the reliability of financial reporting and the preparationof financial statements for external purposes in accordance with generally accepted accounting principles. A company's internal control over financial reporting includesthose policies and procedures that (i) pertain to the maintenance of records that, in reasonable detail, accurately and fairly reflect the transactions and dispositions of theassets of the company; (ii) provide reasonable assurance that transactions are recorded as necessary to permit preparation of financial statements in accordance withgenerally accepted accounting principles, and that receipts and expenditures of the company are being made only in accordance with authorizations of management anddirectors of the company; and (iii) provide reasonable assurance regarding prevention or timely detection of unauthorized acquisition, use, or disposition of the company'sassets that could have a material effect on the financial statements.
-90-
Table of Contents
Because of its inherent limitations, internal control over financial reporting may not prevent or detect misstatements. Also, projections of any evaluation of effectiveness tofuture periods are subject to the risk that controls may become inadequate because of changes in conditions, or that the degree of compliance with the policies or proceduresmay deteriorate.
/s/ PRICEWATERHOUSECOOPERS LLP
New York, New YorkFebruary 25, 2013
-91-
Table of Contents
REPORT OF INDEPENDENT REGISTERED PUBLIC ACCOUNTING FIRM
To the Board of Directors and Shareholders of Central Hudson Gas & Electric Corporation
In our opinion, the financial statements listed in the accompanying index present fairly, in all material respects, the financial position of Central Hudson Gas & ElectricCorporation (the "Company") at December 31, 2012 and 2011, and the results of its operations and its cash flows for each of the three years in the period ended December31, 2012 in conformity with accounting principles generally accepted in the United States of America. In addition, in our opinion, the financial statement schedule listed inthe accompanying index presents fairly, in all material respects, the information set forth therein when read in conjunction with the related financial statements. Also in ouropinion, the Company maintained, in all material respects, effective internal control over financial reporting as of December 31, 2012, based on criteria established inInternal Control - Integrated Framework issued by the Committee of Sponsoring Organizations of the Treadway Commission (COSO). The Company's management isresponsible for these financial statements and financial statement schedule, for maintaining effective internal control over financial reporting and for its assessment of theeffectiveness of internal control over financial reporting, included in the accompanying Central Hudson Report of Management on Internal Control over Financial Reporting. Our responsibility is to express opinions on these financial statements, on the financial statement schedule, and on the Company's internal control over financial reportingbased on our integrated audits. We conducted our audits in accordance with the standards of the Public Company Accounting Oversight Board (United States). Thosestandards require that we plan and perform the audits to obtain reasonable assurance about whether the financial statements are free of material misstatement and whethereffective internal control over financial reporting was maintained in all material respects. Our audits of the financial statements included examining, on a test basis, evidencesupporting the amounts and disclosures in the financial statements, assessing the accounting principles used and significant estimates made by management, and evaluatingthe overall financial statement presentation. Our audit of internal control over financial reporting included obtaining an understanding of internal control over financialreporting, assessing the risk that a material weakness exists, and testing and evaluating the design and operating effectiveness of internal control based on the assessed risk. Our audits also included performing such other procedures as we considered necessary in the circumstances. We believe that our audits provide a reasonable basis for ouropinions.
http://www.sec.gov/Archives/edgar/data/18647/000106139313000018/form10k.htm[8/23/2013 4:25:39 PM]
A company's internal control over financial reporting is a process designed to provide reasonable assurance regarding the reliability of financial reporting and the preparationof financial statements for external purposes in accordance with generally accepted accounting principles. A company's internal control over financial reporting includesthose policies and procedures that (i) pertain to the maintenance of records that, in reasonable detail, accurately and fairly reflect the transactions and dispositions of theassets of the company; (ii) provide reasonable assurance that transactions are recorded as necessary to permit preparation of financial statements in accordance withgenerally accepted accounting principles, and that receipts and expenditures of the company are being made only in accordance with authorizations of management anddirectors of the company; and (iii) provide reasonable assurance regarding prevention or timely detection of unauthorized acquisition, use, or disposition of the company'sassets that could have a material effect on the financial statements.
-92-
Table of Contents
Because of its inherent limitations, internal control over financial reporting may not prevent or detect misstatements. Also, projections of any evaluation of effectiveness tofuture periods are subject to the risk that controls may become inadequate because of changes in conditions, or that the degree of compliance with the policies or proceduresmay deteriorate.
/s/ PRICEWATERHOUSECOOPERS LLP
New York, New YorkFebruary 25, 2013
-93-
Table of Contents
REPORT OF MANAGEMENT ON INTERNAL CONTROL OVER FINANCIAL REPORTING – CH ENERGY GROUP
The management of CH Energy Group, Inc. ("management") is responsible for establishing and maintaining adequate internal control over financial reporting for CHEnergy Group, Inc. (the "Corporation") as defined in Rules 13a-15(f) and 15d-15(f) under the Securities Exchange Act of 1934. Internal control over financial reporting is aprocess designed to provide reasonable assurance regarding the reliability of financial reporting and the preparation of financial statements for external purposes inaccordance with accounting principles generally accepted in the United States of America. Internal control over financial reporting includes those policies and proceduresthat:
· pertain to the maintenance of records that, in reasonable detail, accurately and fairly reflect the transactions and dispositions of the assets of the Corporation;
· provide reasonable assurance that transactions are recorded as necessary to permit preparation of financial statements in accordance with accounting principlesgenerally accepted in the United States of America and that receipts and expenditures of the Corporation are being made only in accordance with authorizationof management and directors of the Corporation; and
· provide reasonable assurance regarding prevention or timely detection of unauthorized acquisition, use or disposition of assets that could have a material effecton the consolidated financial statements.
Internal control over financial reporting includes the controls themselves, monitoring (including internal auditing practices) and actions taken to correct deficiencies asidentified.
Because of its inherent limitations, internal control over financial reporting may not prevent or detect misstatements. Also, projections of any evaluation of effectiveness tofuture periods are subject to the risk that controls may become inadequate because of changes in conditions, or that the degree of compliance with the policies or proceduresmay deteriorate.
Management assessed the effectiveness of the Corporation's internal control over financial reporting as of December 31, 2012. Management based this assessment on criteriafor effective internal control over financial reporting described in "Internal Control - Integrated Framework" issued by the Committee of Sponsoring Organizations of theTreadway Commission (COSO). Based on this assessment, management determined that, as of December 31, 2012, the Corporation maintained effective internal controlover financial reporting.
The effectiveness of the Corporation's internal control over financial reporting as of December 31, 2012, has been audited by PricewaterhouseCoopers LLP, an independentregistered public accounting firm, as stated in their report which appears herein.
/s/ Steven V. Lant /s/ Christopher M. Capone Steven V. Lant Christopher M. Capone Chairman of the Board, President and Chief Executive Officer Executive Vice President and Chief Financial Officer
February 25, 2013
-94-
Table of Contents
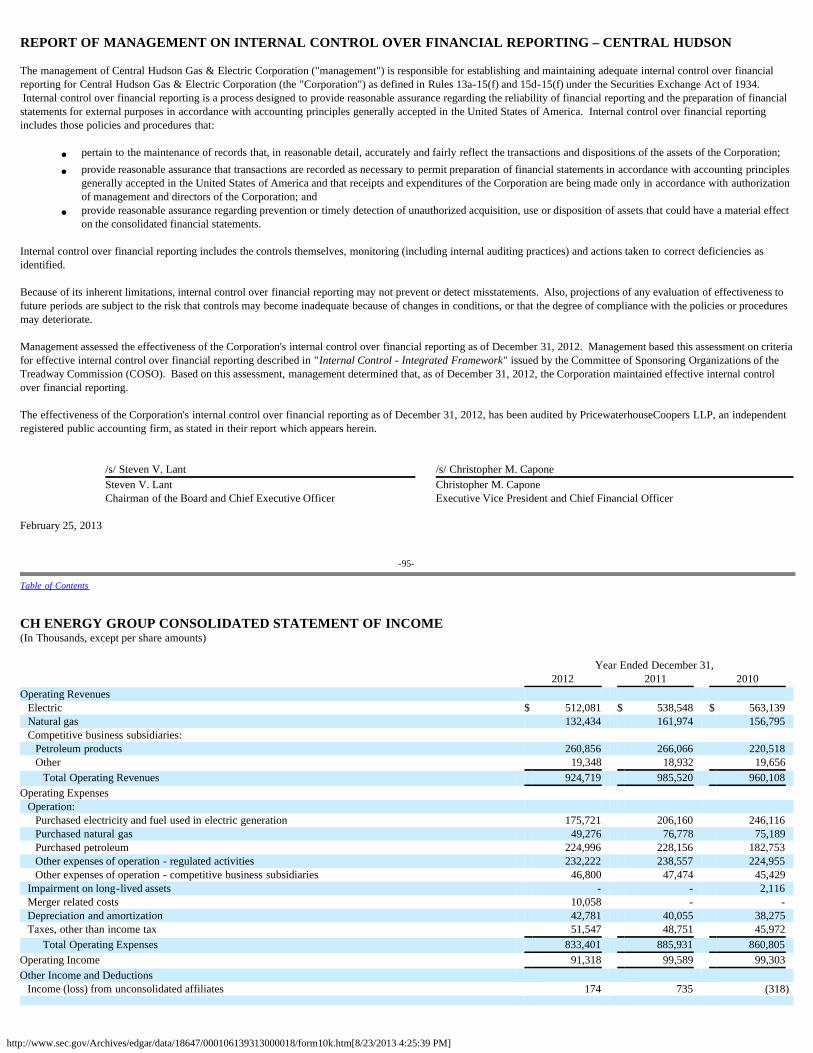
http://www.sec.gov/Archives/edgar/data/18647/000106139313000018/form10k.htm[8/23/2013 4:25:39 PM]
REPORT OF MANAGEMENT ON INTERNAL CONTROL OVER FINANCIAL REPORTING – CENTRAL HUDSON
The management of Central Hudson Gas & Electric Corporation ("management") is responsible for establishing and maintaining adequate internal control over financialreporting for Central Hudson Gas & Electric Corporation (the "Corporation") as defined in Rules 13a-15(f) and 15d-15(f) under the Securities Exchange Act of 1934. Internal control over financial reporting is a process designed to provide reasonable assurance regarding the reliability of financial reporting and the preparation of financialstatements for external purposes in accordance with accounting principles generally accepted in the United States of America. Internal control over financial reportingincludes those policies and procedures that:
· pertain to the maintenance of records that, in reasonable detail, accurately and fairly reflect the transactions and dispositions of the assets of the Corporation;
· provide reasonable assurance that transactions are recorded as necessary to permit preparation of financial statements in accordance with accounting principlesgenerally accepted in the United States of America and that receipts and expenditures of the Corporation are being made only in accordance with authorizationof management and directors of the Corporation; and
· provide reasonable assurance regarding prevention or timely detection of unauthorized acquisition, use or disposition of assets that could have a material effecton the consolidated financial statements.
Internal control over financial reporting includes the controls themselves, monitoring (including internal auditing practices) and actions taken to correct deficiencies asidentified.
Because of its inherent limitations, internal control over financial reporting may not prevent or detect misstatements. Also, projections of any evaluation of effectiveness tofuture periods are subject to the risk that controls may become inadequate because of changes in conditions, or that the degree of compliance with the policies or proceduresmay deteriorate.
Management assessed the effectiveness of the Corporation's internal control over financial reporting as of December 31, 2012. Management based this assessment on criteriafor effective internal control over financial reporting described in "Internal Control - Integrated Framework" issued by the Committee of Sponsoring Organizations of theTreadway Commission (COSO). Based on this assessment, management determined that, as of December 31, 2012, the Corporation maintained effective internal controlover financial reporting.
The effectiveness of the Corporation's internal control over financial reporting as of December 31, 2012, has been audited by PricewaterhouseCoopers LLP, an independentregistered public accounting firm, as stated in their report which appears herein.
/s/ Steven V. Lant /s/ Christopher M. Capone Steven V. Lant Christopher M. Capone Chairman of the Board and Chief Executive Officer Executive Vice President and Chief Financial Officer
February 25, 2013
-95-
Table of Contents
CH ENERGY GROUP CONSOLIDATED STATEMENT OF INCOME(In Thousands, except per share amounts) Year Ended December 31, 2012 2011 2010 Operating Revenues
Electric $ 512,081 $ 538,548 $ 563,139 Natural gas 132,434 161,974 156,795 Competitive business subsidiaries:
Petroleum products 260,856 266,066 220,518 Other 19,348 18,932 19,656 Total Operating Revenues 924,719 985,520 960,108
Operating Expenses Operation:
Purchased electricity and fuel used in electric generation 175,721 206,160 246,116 Purchased natural gas 49,276 76,778 75,189 Purchased petroleum 224,996 228,156 182,753 Other expenses of operation - regulated activities 232,222 238,557 224,955 Other expenses of operation - competitive business subsidiaries 46,800 47,474 45,429
Impairment on long-lived assets - - 2,116 Merger related costs 10,058 - - Depreciation and amortization 42,781 40,055 38,275 Taxes, other than income tax 51,547 48,751 45,972
Total Operating Expenses 833,401 885,931 860,805 Operating Income 91,318 99,589 99,303 Other Income and Deductions
Income (loss) from unconsolidated affiliates 174 735 (318)
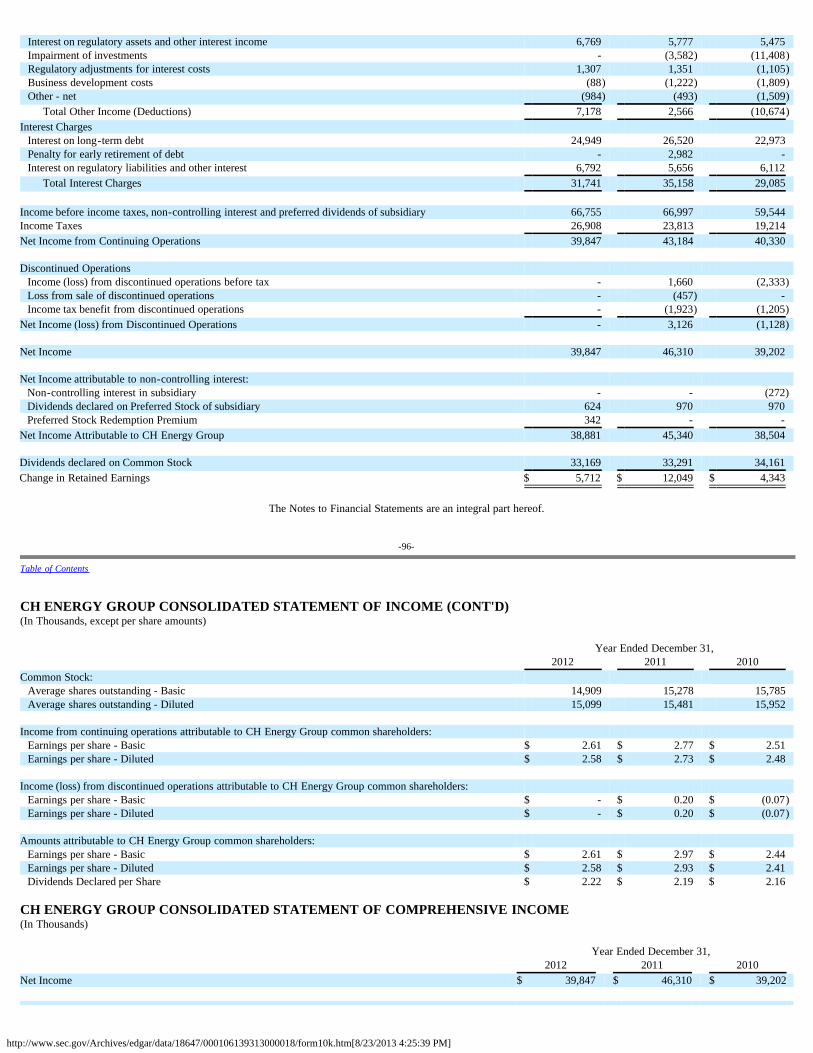
http://www.sec.gov/Archives/edgar/data/18647/000106139313000018/form10k.htm[8/23/2013 4:25:39 PM]
Interest on regulatory assets and other interest income 6,769 5,777 5,475 Impairment of investments - (3,582) (11,408)Regulatory adjustments for interest costs 1,307 1,351 (1,105)Business development costs (88) (1,222) (1,809)Other - net (984) (493) (1,509)
Total Other Income (Deductions) 7,178 2,566 (10,674)Interest Charges
Interest on long-term debt 24,949 26,520 22,973 Penalty for early retirement of debt - 2,982 - Interest on regulatory liabilities and other interest 6,792 5,656 6,112
Total Interest Charges 31,741 35,158 29,085 Income before income taxes, non-controlling interest and preferred dividends of subsidiary 66,755 66,997 59,544 Income Taxes 26,908 23,813 19,214 Net Income from Continuing Operations 39,847 43,184 40,330 Discontinued Operations
Income (loss) from discontinued operations before tax - 1,660 (2,333)Loss from sale of discontinued operations - (457) - Income tax benefit from discontinued operations - (1,923) (1,205)
Net Income (loss) from Discontinued Operations - 3,126 (1,128) Net Income 39,847 46,310 39,202 Net Income attributable to non-controlling interest:
Non-controlling interest in subsidiary - - (272)Dividends declared on Preferred Stock of subsidiary 624 970 970 Preferred Stock Redemption Premium 342 - -
Net Income Attributable to CH Energy Group 38,881 45,340 38,504 Dividends declared on Common Stock 33,169 33,291 34,161 Change in Retained Earnings $ 5,712 $ 12,049 $ 4,343
The Notes to Financial Statements are an integral part hereof.
-96-
Table of Contents
CH ENERGY GROUP CONSOLIDATED STATEMENT OF INCOME (CONT'D)(In Thousands, except per share amounts) Year Ended December 31, 2012 2011 2010 Common Stock:
Average shares outstanding - Basic 14,909 15,278 15,785 Average shares outstanding - Diluted 15,099 15,481 15,952
Income from continuing operations attributable to CH Energy Group common shareholders:
Earnings per share - Basic $ 2.61 $ 2.77 $ 2.51 Earnings per share - Diluted $ 2.58 $ 2.73 $ 2.48
Income (loss) from discontinued operations attributable to CH Energy Group common shareholders:
Earnings per share - Basic $ - $ 0.20 $ (0.07)Earnings per share - Diluted $ - $ 0.20 $ (0.07)
Amounts attributable to CH Energy Group common shareholders:
Earnings per share - Basic $ 2.61 $ 2.97 $ 2.44 Earnings per share - Diluted $ 2.58 $ 2.93 $ 2.41 Dividends Declared per Share $ 2.22 $ 2.19 $ 2.16
CH ENERGY GROUP CONSOLIDATED STATEMENT OF COMPREHENSIVE INCOME(In Thousands) Year Ended December 31, 2012 2011 2010 Net Income $ 39,847 $ 46,310 $ 39,202
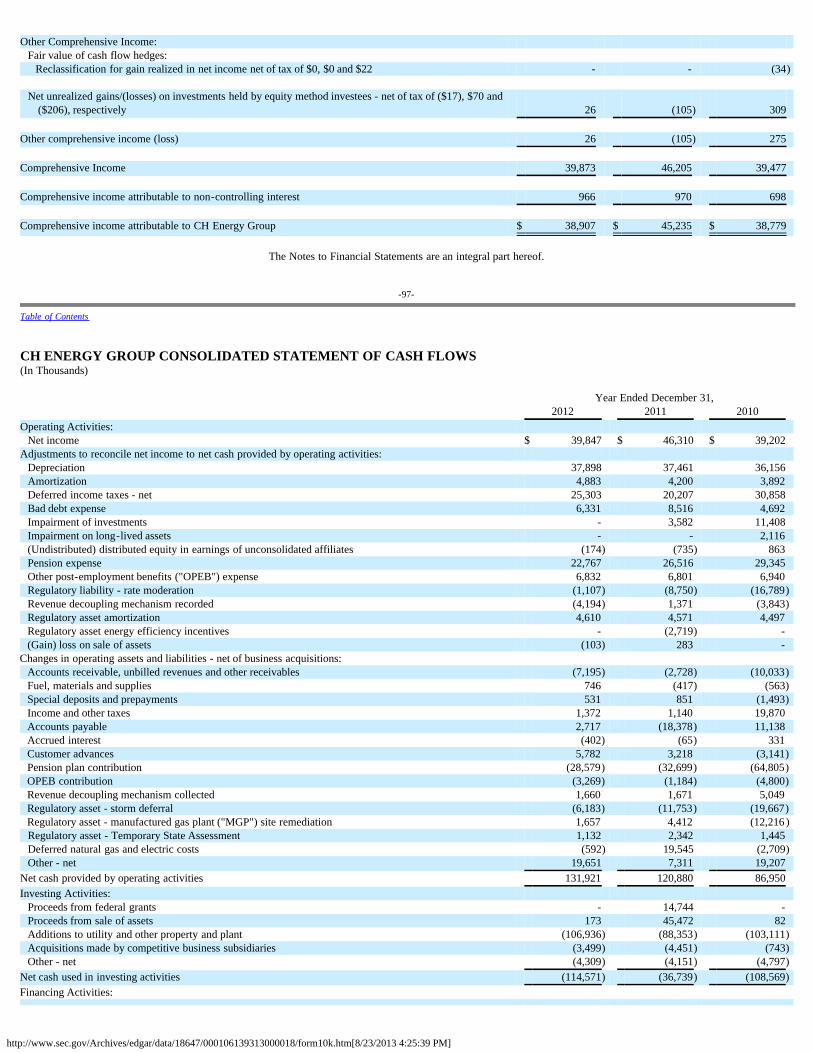
http://www.sec.gov/Archives/edgar/data/18647/000106139313000018/form10k.htm[8/23/2013 4:25:39 PM]
Other Comprehensive Income: Fair value of cash flow hedges:
Reclassification for gain realized in net income net of tax of $0, $0 and $22 - - (34)
Net unrealized gains/(losses) on investments held by equity method investees - net of tax of ($17), $70 and($206), respectively 26 (105) 309
Other comprehensive income (loss) 26 (105) 275 Comprehensive Income 39,873 46,205 39,477 Comprehensive income attributable to non-controlling interest 966 970 698 Comprehensive income attributable to CH Energy Group $ 38,907 $ 45,235 $ 38,779
The Notes to Financial Statements are an integral part hereof.
-97-
Table of Contents
CH ENERGY GROUP CONSOLIDATED STATEMENT OF CASH FLOWS(In Thousands) Year Ended December 31, 2012 2011 2010 Operating Activities:
Net income $ 39,847 $ 46,310 $ 39,202 Adjustments to reconcile net income to net cash provided by operating activities:
Depreciation 37,898 37,461 36,156 Amortization 4,883 4,200 3,892 Deferred income taxes - net 25,303 20,207 30,858 Bad debt expense 6,331 8,516 4,692 Impairment of investments - 3,582 11,408 Impairment on long-lived assets - - 2,116 (Undistributed) distributed equity in earnings of unconsolidated affiliates (174) (735) 863 Pension expense 22,767 26,516 29,345 Other post-employment benefits ("OPEB") expense 6,832 6,801 6,940 Regulatory liability - rate moderation (1,107) (8,750) (16,789)Revenue decoupling mechanism recorded (4,194) 1,371 (3,843)Regulatory asset amortization 4,610 4,571 4,497 Regulatory asset energy efficiency incentives - (2,719) - (Gain) loss on sale of assets (103) 283 -
Changes in operating assets and liabilities - net of business acquisitions: Accounts receivable, unbilled revenues and other receivables (7,195) (2,728) (10,033)Fuel, materials and supplies 746 (417) (563)Special deposits and prepayments 531 851 (1,493)Income and other taxes 1,372 1,140 19,870 Accounts payable 2,717 (18,378) 11,138 Accrued interest (402) (65) 331 Customer advances 5,782 3,218 (3,141)Pension plan contribution (28,579) (32,699) (64,805)OPEB contribution (3,269) (1,184) (4,800)Revenue decoupling mechanism collected 1,660 1,671 5,049 Regulatory asset - storm deferral (6,183) (11,753) (19,667)Regulatory asset - manufactured gas plant ("MGP") site remediation 1,657 4,412 (12,216 )Regulatory asset - Temporary State Assessment 1,132 2,342 1,445 Deferred natural gas and electric costs (592) 19,545 (2,709)Other - net 19,651 7,311 19,207
Net cash provided by operating activities 131,921 120,880 86,950 Investing Activities:
Proceeds from federal grants - 14,744 - Proceeds from sale of assets 173 45,472 82 Additions to utility and other property and plant (106,936) (88,353) (103,111)Acquisitions made by competitive business subsidiaries (3,499) (4,451) (743)Other - net (4,309) (4,151) (4,797)
Net cash used in investing activities (114,571) (36,739) (108,569)Financing Activities:
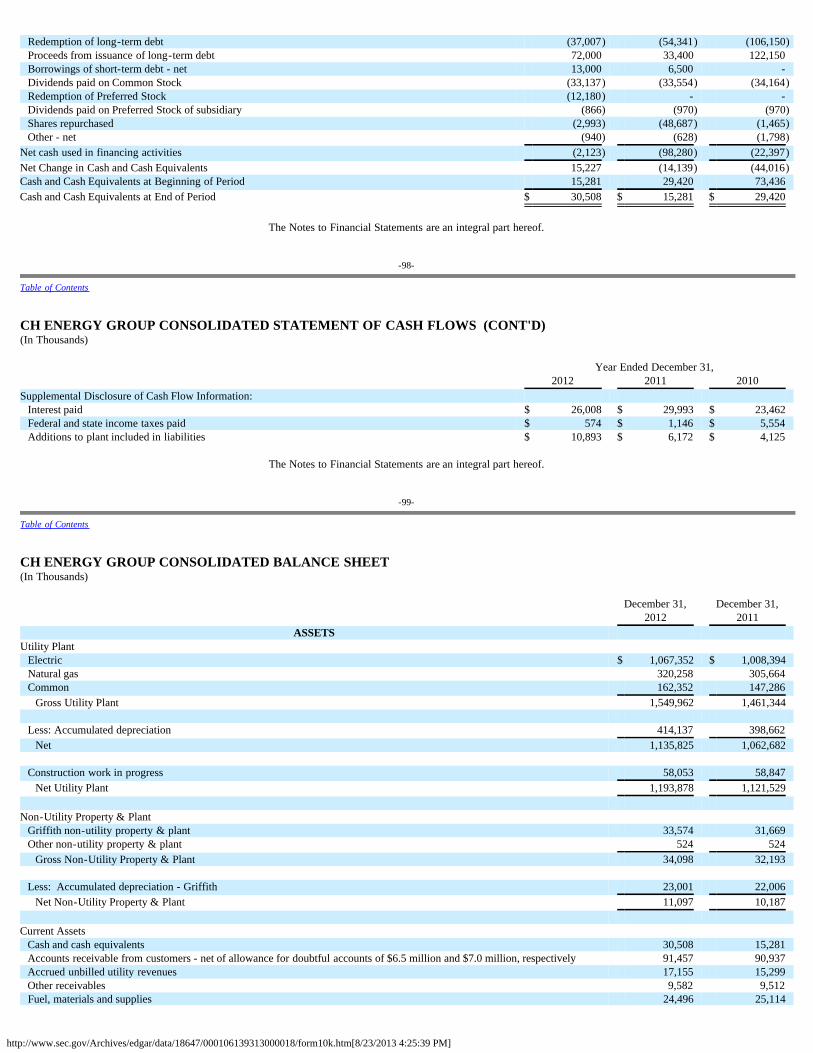
http://www.sec.gov/Archives/edgar/data/18647/000106139313000018/form10k.htm[8/23/2013 4:25:39 PM]
Redemption of long-term debt (37,007) (54,341) (106,150)Proceeds from issuance of long-term debt 72,000 33,400 122,150 Borrowings of short-term debt - net 13,000 6,500 - Dividends paid on Common Stock (33,137) (33,554) (34,164)Redemption of Preferred Stock (12,180) - - Dividends paid on Preferred Stock of subsidiary (866) (970) (970)Shares repurchased (2,993) (48,687) (1,465)Other - net (940) (628) (1,798)
Net cash used in financing activities (2,123) (98,280) (22,397)Net Change in Cash and Cash Equivalents 15,227 (14,139) (44,016)Cash and Cash Equivalents at Beginning of Period 15,281 29,420 73,436 Cash and Cash Equivalents at End of Period $ 30,508 $ 15,281 $ 29,420
The Notes to Financial Statements are an integral part hereof.
-98-
Table of Contents
CH ENERGY GROUP CONSOLIDATED STATEMENT OF CASH FLOWS (CONT'D)(In Thousands) Year Ended December 31, 2012 2011 2010 Supplemental Disclosure of Cash Flow Information:
Interest paid $ 26,008 $ 29,993 $ 23,462 Federal and state income taxes paid $ 574 $ 1,146 $ 5,554 Additions to plant included in liabilities $ 10,893 $ 6,172 $ 4,125
The Notes to Financial Statements are an integral part hereof.
-99-
Table of Contents
CH ENERGY GROUP CONSOLIDATED BALANCE SHEET(In Thousands) December 31, December 31,
2012 2011 ASSETS
Utility Plant Electric $ 1,067,352 $ 1,008,394 Natural gas 320,258 305,664 Common 162,352 147,286
Gross Utility Plant 1,549,962 1,461,344
Less: Accumulated depreciation 414,137 398,662 Net 1,135,825 1,062,682
Construction work in progress 58,053 58,847
Net Utility Plant 1,193,878 1,121,529 Non-Utility Property & Plant
Griffith non-utility property & plant 33,574 31,669 Other non-utility property & plant 524 524
Gross Non-Utility Property & Plant 34,098 32,193
Less: Accumulated depreciation - Griffith 23,001 22,006 Net Non-Utility Property & Plant 11,097 10,187
Current Assets
Cash and cash equivalents 30,508 15,281 Accounts receivable from customers - net of allowance for doubtful accounts of $6.5 million and $7.0 million, respectively 91,457 90,937 Accrued unbilled utility revenues 17,155 15,299 Other receivables 9,582 9,512 Fuel, materials and supplies 24,496 25,114
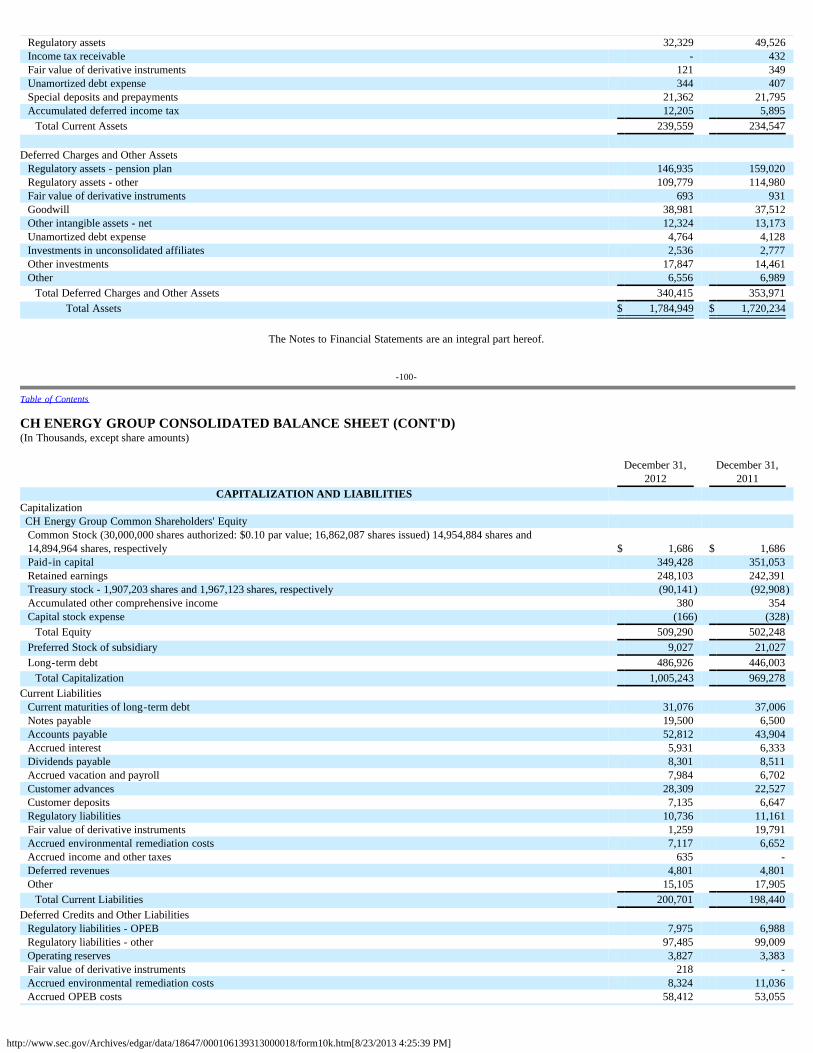
http://www.sec.gov/Archives/edgar/data/18647/000106139313000018/form10k.htm[8/23/2013 4:25:39 PM]
Regulatory assets 32,329 49,526 Income tax receivable - 432 Fair value of derivative instruments 121 349 Unamortized debt expense 344 407 Special deposits and prepayments 21,362 21,795 Accumulated deferred income tax 12,205 5,895
Total Current Assets 239,559 234,547 Deferred Charges and Other Assets
Regulatory assets - pension plan 146,935 159,020 Regulatory assets - other 109,779 114,980 Fair value of derivative instruments 693 931 Goodwill 38,981 37,512 Other intangible assets - net 12,324 13,173 Unamortized debt expense 4,764 4,128 Investments in unconsolidated affiliates 2,536 2,777 Other investments 17,847 14,461 Other 6,556 6,989
Total Deferred Charges and Other Assets 340,415 353,971 Total Assets $ 1,784,949 $ 1,720,234
The Notes to Financial Statements are an integral part hereof.
-100-
Table of Contents
CH ENERGY GROUP CONSOLIDATED BALANCE SHEET (CONT'D)(In Thousands, except share amounts) December 31, December 31,
2012 2011 CAPITALIZATION AND LIABILITIES
Capitalization CH Energy Group Common Shareholders' Equity
Common Stock (30,000,000 shares authorized: $0.10 par value; 16,862,087 shares issued) 14,954,884 shares and14,894,964 shares, respectively $ 1,686 $ 1,686 Paid-in capital 349,428 351,053 Retained earnings 248,103 242,391 Treasury stock - 1,907,203 shares and 1,967,123 shares, respectively (90,141) (92,908)Accumulated other comprehensive income 380 354 Capital stock expense (166) (328)
Total Equity 509,290 502,248 Preferred Stock of subsidiary 9,027 21,027 Long-term debt 486,926 446,003
Total Capitalization 1,005,243 969,278 Current Liabilities
Current maturities of long-term debt 31,076 37,006 Notes payable 19,500 6,500 Accounts payable 52,812 43,904 Accrued interest 5,931 6,333 Dividends payable 8,301 8,511 Accrued vacation and payroll 7,984 6,702 Customer advances 28,309 22,527 Customer deposits 7,135 6,647 Regulatory liabilities 10,736 11,161 Fair value of derivative instruments 1,259 19,791 Accrued environmental remediation costs 7,117 6,652 Accrued income and other taxes 635 - Deferred revenues 4,801 4,801 Other 15,105 17,905
Total Current Liabilities 200,701 198,440 Deferred Credits and Other Liabilities
Regulatory liabilities - OPEB 7,975 6,988 Regulatory liabilities - other 97,485 99,009 Operating reserves 3,827 3,383 Fair value of derivative instruments 218 - Accrued environmental remediation costs 8,324 11,036 Accrued OPEB costs 58,412 53,055
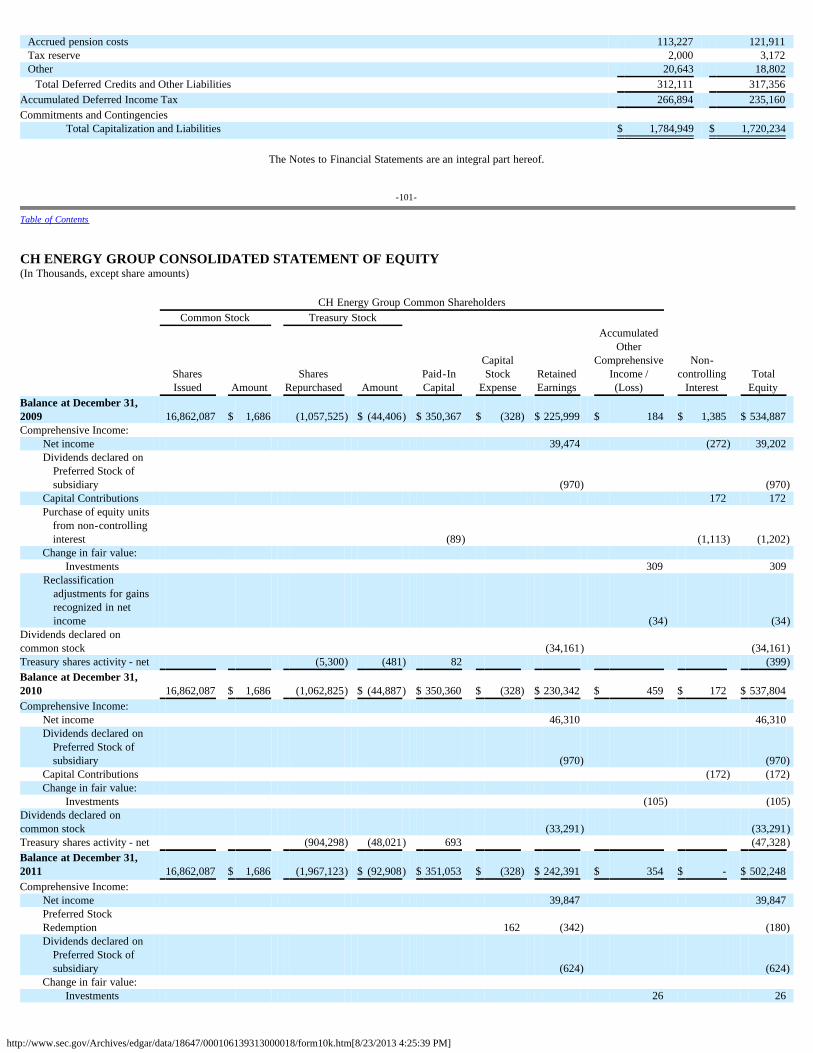
http://www.sec.gov/Archives/edgar/data/18647/000106139313000018/form10k.htm[8/23/2013 4:25:39 PM]
Accrued pension costs 113,227 121,911 Tax reserve 2,000 3,172 Other 20,643 18,802
Total Deferred Credits and Other Liabilities 312,111 317,356 Accumulated Deferred Income Tax 266,894 235,160 Commitments and Contingencies
Total Capitalization and Liabilities $ 1,784,949 $ 1,720,234
The Notes to Financial Statements are an integral part hereof.
-101-
Table of Contents
CH ENERGY GROUP CONSOLIDATED STATEMENT OF EQUITY(In Thousands, except share amounts) CH Energy Group Common Shareholders Common Stock Treasury Stock
SharesIssued Amount
SharesRepurchased Amount
Paid-InCapital
CapitalStock
Expense RetainedEarnings
AccumulatedOther
ComprehensiveIncome /(Loss)
Non-controlling
Interest Total
Equity Balance at December 31,2009 16,862,087 $ 1,686 (1,057,525) $ (44,406) $ 350,367 $ (328) $ 225,999 $ 184 $ 1,385 $ 534,887 Comprehensive Income:
Net income 39,474 (272) 39,202 Dividends declared on
Preferred Stock ofsubsidiary (970) (970)
Capital Contributions 172 172 Purchase of equity units
from non-controllinginterest (89) (1,113) (1,202)
Change in fair value: Investments 309 309
Reclassificationadjustments for gainsrecognized in netincome (34) (34)
Dividends declared oncommon stock (34,161) (34,161)Treasury shares activity - net (5,300) (481) 82 (399)Balance at December 31,2010 16,862,087 $ 1,686 (1,062,825) $ (44,887) $ 350,360 $ (328) $ 230,342 $ 459 $ 172 $ 537,804 Comprehensive Income:
Net income 46,310 46,310 Dividends declared on
Preferred Stock ofsubsidiary (970) (970)
Capital Contributions (172) (172)Change in fair value:
Investments (105) (105)Dividends declared oncommon stock (33,291) (33,291)Treasury shares activity - net (904,298) (48,021) 693 (47,328)Balance at December 31,2011 16,862,087 $ 1,686 (1,967,123) $ (92,908) $ 351,053 $ (328) $ 242,391 $ 354 $ - $ 502,248 Comprehensive Income:
Net income 39,847 39,847 Preferred StockRedemption 162 (342) (180)Dividends declared on
Preferred Stock ofsubsidiary (624) (624)
Change in fair value: Investments 26 26
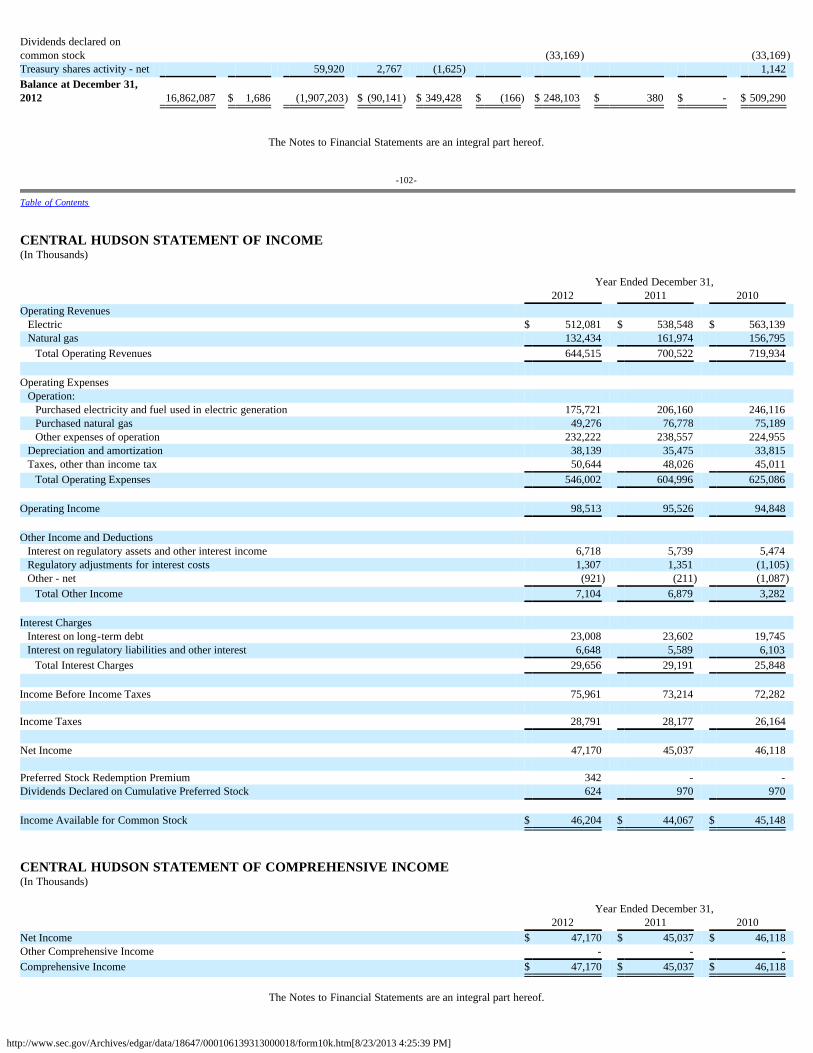
http://www.sec.gov/Archives/edgar/data/18647/000106139313000018/form10k.htm[8/23/2013 4:25:39 PM]
Dividends declared oncommon stock (33,169) (33,169)Treasury shares activity - net 59,920 2,767 (1,625) 1,142 Balance at December 31,2012 16,862,087 $ 1,686 (1,907,203) $ (90,141) $ 349,428 $ (166) $ 248,103 $ 380 $ - $ 509,290
The Notes to Financial Statements are an integral part hereof.
-102-
Table of Contents
CENTRAL HUDSON STATEMENT OF INCOME(In Thousands) Year Ended December 31, 2012 2011 2010 Operating Revenues
Electric $ 512,081 $ 538,548 $ 563,139 Natural gas 132,434 161,974 156,795
Total Operating Revenues 644,515 700,522 719,934 Operating Expenses
Operation: Purchased electricity and fuel used in electric generation 175,721 206,160 246,116 Purchased natural gas 49,276 76,778 75,189 Other expenses of operation 232,222 238,557 224,955
Depreciation and amortization 38,139 35,475 33,815 Taxes, other than income tax 50,644 48,026 45,011
Total Operating Expenses 546,002 604,996 625,086 Operating Income 98,513 95,526 94,848 Other Income and Deductions
Interest on regulatory assets and other interest income 6,718 5,739 5,474 Regulatory adjustments for interest costs 1,307 1,351 (1,105)Other - net (921) (211) (1,087)
Total Other Income 7,104 6,879 3,282 Interest Charges
Interest on long-term debt 23,008 23,602 19,745 Interest on regulatory liabilities and other interest 6,648 5,589 6,103
Total Interest Charges 29,656 29,191 25,848 Income Before Income Taxes 75,961 73,214 72,282 Income Taxes 28,791 28,177 26,164 Net Income 47,170 45,037 46,118 Preferred Stock Redemption Premium 342 - - Dividends Declared on Cumulative Preferred Stock 624 970 970 Income Available for Common Stock $ 46,204 $ 44,067 $ 45,148 CENTRAL HUDSON STATEMENT OF COMPREHENSIVE INCOME(In Thousands) Year Ended December 31, 2012 2011 2010 Net Income $ 47,170 $ 45,037 $ 46,118 Other Comprehensive Income - - - Comprehensive Income $ 47,170 $ 45,037 $ 46,118
The Notes to Financial Statements are an integral part hereof.
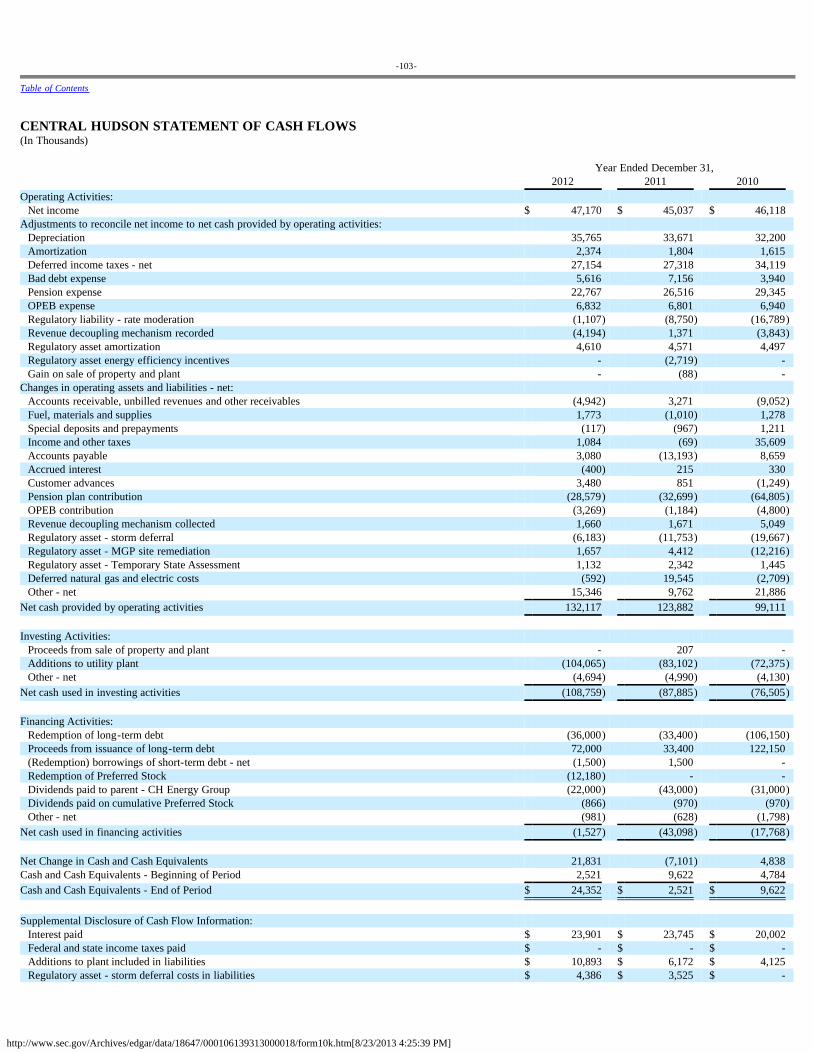
http://www.sec.gov/Archives/edgar/data/18647/000106139313000018/form10k.htm[8/23/2013 4:25:39 PM]
-103-
Table of Contents
CENTRAL HUDSON STATEMENT OF CASH FLOWS(In Thousands) Year Ended December 31, 2012 2011 2010 Operating Activities:
Net income $ 47,170 $ 45,037 $ 46,118 Adjustments to reconcile net income to net cash provided by operating activities:
Depreciation 35,765 33,671 32,200 Amortization 2,374 1,804 1,615 Deferred income taxes - net 27,154 27,318 34,119 Bad debt expense 5,616 7,156 3,940 Pension expense 22,767 26,516 29,345 OPEB expense 6,832 6,801 6,940 Regulatory liability - rate moderation (1,107) (8,750) (16,789)Revenue decoupling mechanism recorded (4,194) 1,371 (3,843)Regulatory asset amortization 4,610 4,571 4,497 Regulatory asset energy efficiency incentives - (2,719) - Gain on sale of property and plant - (88) -
Changes in operating assets and liabilities - net: Accounts receivable, unbilled revenues and other receivables (4,942) 3,271 (9,052)Fuel, materials and supplies 1,773 (1,010) 1,278 Special deposits and prepayments (117) (967) 1,211 Income and other taxes 1,084 (69) 35,609 Accounts payable 3,080 (13,193) 8,659 Accrued interest (400) 215 330 Customer advances 3,480 851 (1,249)Pension plan contribution (28,579) (32,699) (64,805)OPEB contribution (3,269) (1,184) (4,800)Revenue decoupling mechanism collected 1,660 1,671 5,049 Regulatory asset - storm deferral (6,183) (11,753) (19,667)Regulatory asset - MGP site remediation 1,657 4,412 (12,216)Regulatory asset - Temporary State Assessment 1,132 2,342 1,445 Deferred natural gas and electric costs (592) 19,545 (2,709)Other - net 15,346 9,762 21,886
Net cash provided by operating activities 132,117 123,882 99,111 Investing Activities:
Proceeds from sale of property and plant - 207 - Additions to utility plant (104,065) (83,102) (72,375)Other - net (4,694) (4,990) (4,130)
Net cash used in investing activities (108,759) (87,885) (76,505) Financing Activities:
Redemption of long-term debt (36,000) (33,400) (106,150)Proceeds from issuance of long-term debt 72,000 33,400 122,150 (Redemption) borrowings of short-term debt - net (1,500) 1,500 - Redemption of Preferred Stock (12,180) - - Dividends paid to parent - CH Energy Group (22,000) (43,000) (31,000)Dividends paid on cumulative Preferred Stock (866) (970) (970)Other - net (981) (628) (1,798)
Net cash used in financing activities (1,527) (43,098) (17,768) Net Change in Cash and Cash Equivalents 21,831 (7,101) 4,838 Cash and Cash Equivalents - Beginning of Period 2,521 9,622 4,784 Cash and Cash Equivalents - End of Period $ 24,352 $ 2,521 $ 9,622 Supplemental Disclosure of Cash Flow Information:
Interest paid $ 23,901 $ 23,745 $ 20,002 Federal and state income taxes paid $ - $ - $ - Additions to plant included in liabilities $ 10,893 $ 6,172 $ 4,125 Regulatory asset - storm deferral costs in liabilities $ 4,386 $ 3,525 $ -
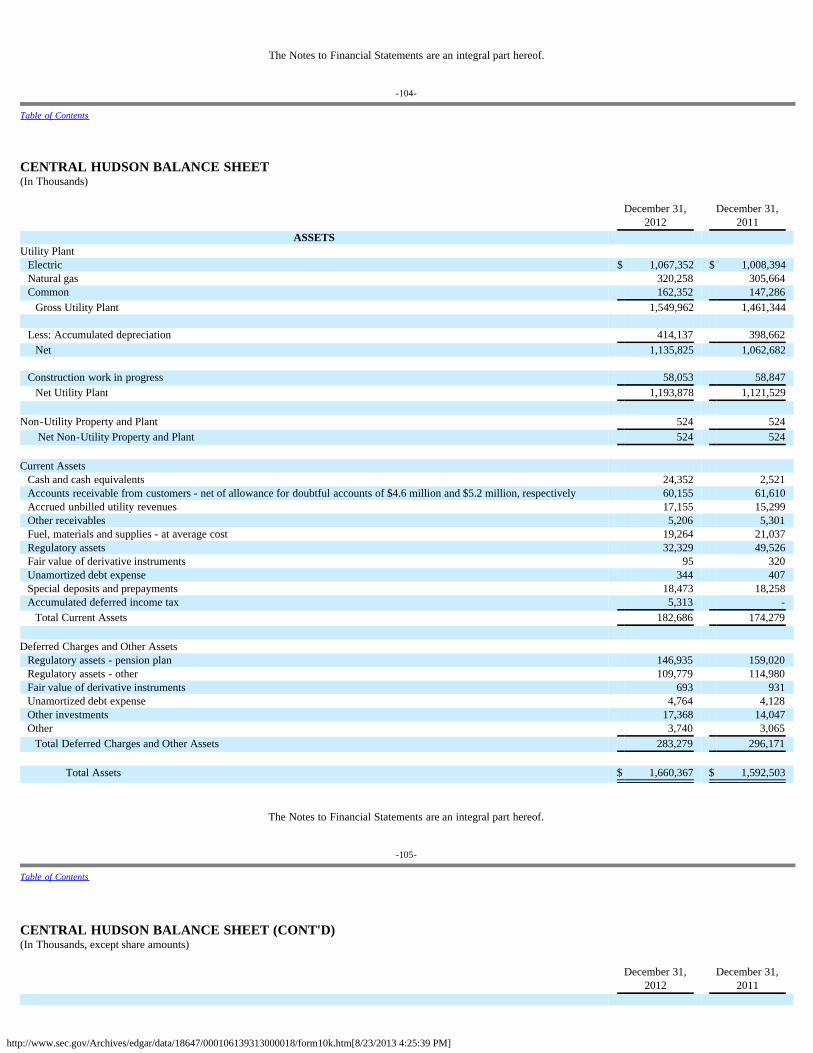
http://www.sec.gov/Archives/edgar/data/18647/000106139313000018/form10k.htm[8/23/2013 4:25:39 PM]
The Notes to Financial Statements are an integral part hereof.
-104-
Table of Contents
CENTRAL HUDSON BALANCE SHEET(In Thousands) December 31, December 31,
2012 2011 ASSETS
Utility Plant Electric $ 1,067,352 $ 1,008,394 Natural gas 320,258 305,664 Common 162,352 147,286
Gross Utility Plant 1,549,962 1,461,344
Less: Accumulated depreciation 414,137 398,662 Net 1,135,825 1,062,682
Construction work in progress 58,053 58,847
Net Utility Plant 1,193,878 1,121,529 Non-Utility Property and Plant 524 524 Net Non-Utility Property and Plant 524 524 Current Assets
Cash and cash equivalents 24,352 2,521 Accounts receivable from customers - net of allowance for doubtful accounts of $4.6 million and $5.2 million, respectively 60,155 61,610 Accrued unbilled utility revenues 17,155 15,299 Other receivables 5,206 5,301 Fuel, materials and supplies - at average cost 19,264 21,037 Regulatory assets 32,329 49,526 Fair value of derivative instruments 95 320 Unamortized debt expense 344 407 Special deposits and prepayments 18,473 18,258 Accumulated deferred income tax 5,313 -
Total Current Assets 182,686 174,279 Deferred Charges and Other Assets
Regulatory assets - pension plan 146,935 159,020 Regulatory assets - other 109,779 114,980 Fair value of derivative instruments 693 931 Unamortized debt expense 4,764 4,128 Other investments 17,368 14,047 Other 3,740 3,065
Total Deferred Charges and Other Assets 283,279 296,171
Total Assets $ 1,660,367 $ 1,592,503
The Notes to Financial Statements are an integral part hereof.
-105-
Table of Contents
CENTRAL HUDSON BALANCE SHEET (CONT'D)(In Thousands, except share amounts) December 31, December 31,
2012 2011
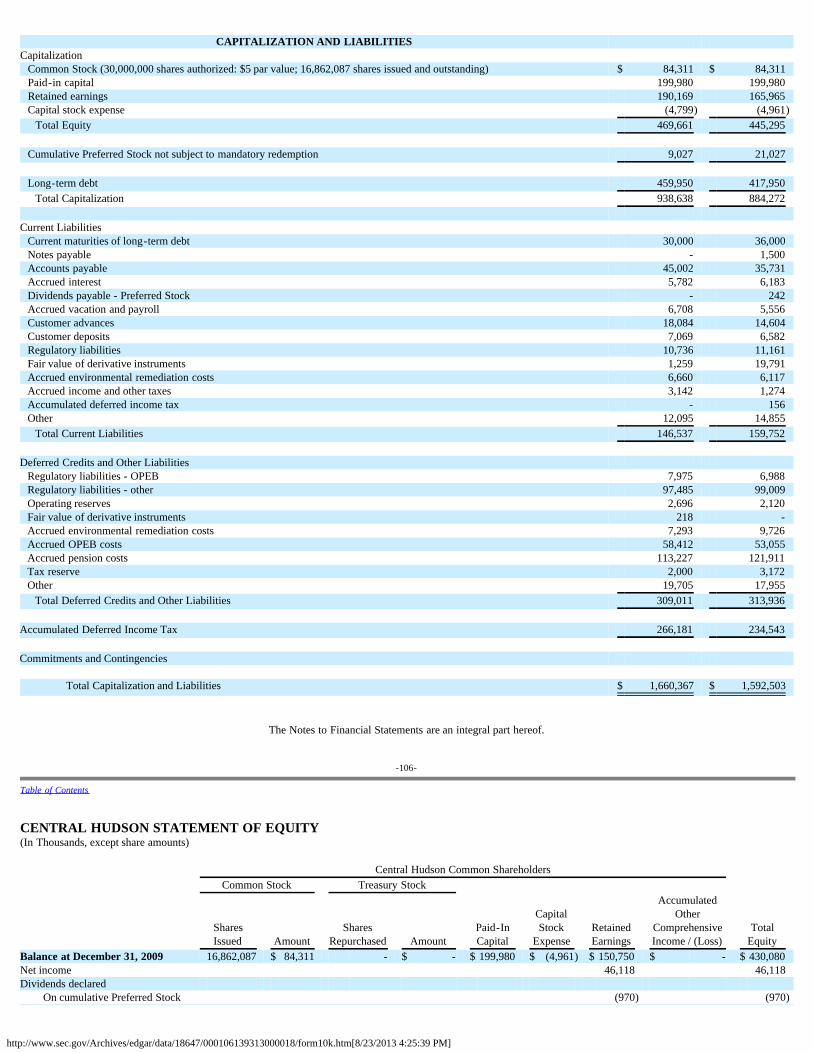
http://www.sec.gov/Archives/edgar/data/18647/000106139313000018/form10k.htm[8/23/2013 4:25:39 PM]
CAPITALIZATION AND LIABILITIES Capitalization
Common Stock (30,000,000 shares authorized: $5 par value; 16,862,087 shares issued and outstanding) $ 84,311 $ 84,311 Paid-in capital 199,980 199,980 Retained earnings 190,169 165,965 Capital stock expense (4,799) (4,961)
Total Equity 469,661 445,295
Cumulative Preferred Stock not subject to mandatory redemption 9,027 21,027
Long-term debt 459,950 417,950 Total Capitalization 938,638 884,272
Current Liabilities
Current maturities of long-term debt 30,000 36,000 Notes payable - 1,500 Accounts payable 45,002 35,731 Accrued interest 5,782 6,183 Dividends payable - Preferred Stock - 242 Accrued vacation and payroll 6,708 5,556 Customer advances 18,084 14,604 Customer deposits 7,069 6,582 Regulatory liabilities 10,736 11,161 Fair value of derivative instruments 1,259 19,791 Accrued environmental remediation costs 6,660 6,117 Accrued income and other taxes 3,142 1,274 Accumulated deferred income tax - 156 Other 12,095 14,855
Total Current Liabilities 146,537 159,752 Deferred Credits and Other Liabilities
Regulatory liabilities - OPEB 7,975 6,988 Regulatory liabilities - other 97,485 99,009 Operating reserves 2,696 2,120 Fair value of derivative instruments 218 - Accrued environmental remediation costs 7,293 9,726 Accrued OPEB costs 58,412 53,055 Accrued pension costs 113,227 121,911 Tax reserve 2,000 3,172 Other 19,705 17,955
Total Deferred Credits and Other Liabilities 309,011 313,936 Accumulated Deferred Income Tax 266,181 234,543 Commitments and Contingencies
Total Capitalization and Liabilities $ 1,660,367 $ 1,592,503
The Notes to Financial Statements are an integral part hereof.
-106-
Table of Contents
CENTRAL HUDSON STATEMENT OF EQUITY(In Thousands, except share amounts) Central Hudson Common Shareholders Common Stock Treasury Stock
SharesIssued Amount
SharesRepurchased Amount
Paid-InCapital
CapitalStock
Expense RetainedEarnings
AccumulatedOther
ComprehensiveIncome / (Loss)
TotalEquity
Balance at December 31, 2009 16,862,087 $ 84,311 - $ - $ 199,980 $ (4,961) $ 150,750 $ - $ 430,080 Net income 46,118 46,118 Dividends declared
On cumulative Preferred Stock (970) (970)
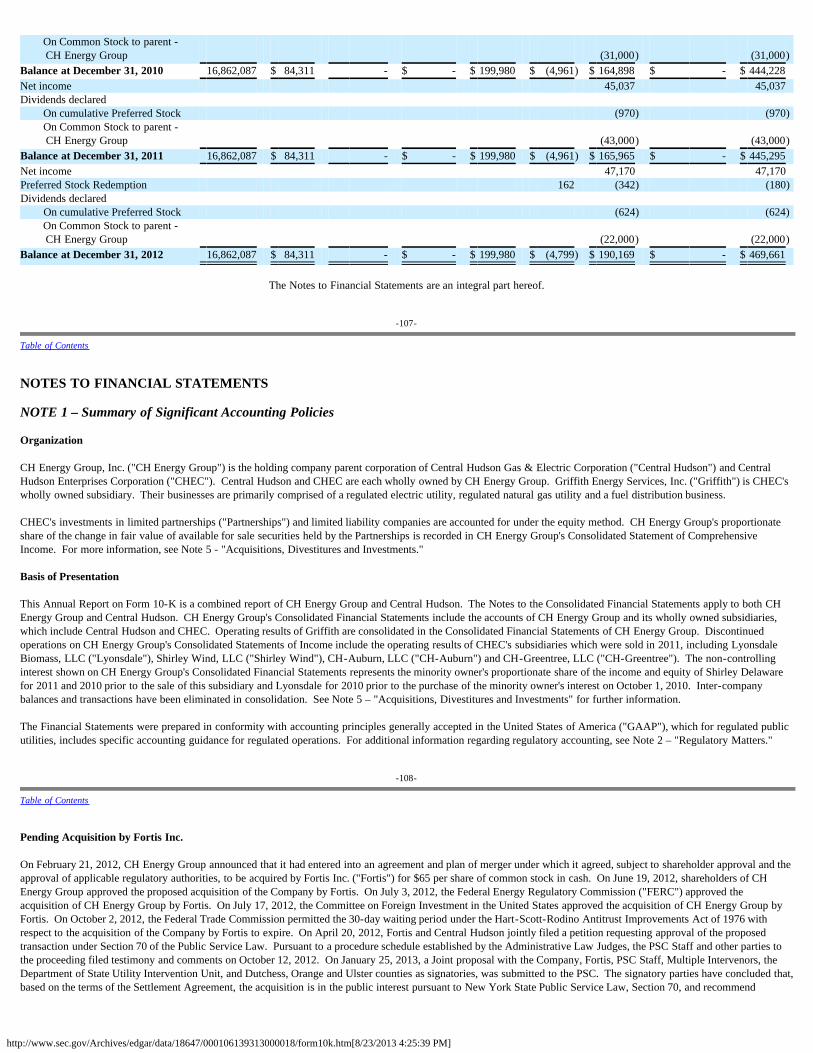
http://www.sec.gov/Archives/edgar/data/18647/000106139313000018/form10k.htm[8/23/2013 4:25:39 PM]
On Common Stock to parent - CH Energy Group (31,000) (31,000)
Balance at December 31, 2010 16,862,087 $ 84,311 - $ - $ 199,980 $ (4,961) $ 164,898 $ - $ 444,228 Net income 45,037 45,037 Dividends declared
On cumulative Preferred Stock (970) (970)On Common Stock to parent - CH Energy Group (43,000) (43,000)
Balance at December 31, 2011 16,862,087 $ 84,311 - $ - $ 199,980 $ (4,961) $ 165,965 $ - $ 445,295 Net income 47,170 47,170 Preferred Stock Redemption 162 (342) (180)Dividends declared
On cumulative Preferred Stock (624) (624)On Common Stock to parent - CH Energy Group (22,000) (22,000)
Balance at December 31, 2012 16,862,087 $ 84,311 - $ - $ 199,980 $ (4,799) $ 190,169 $ - $ 469,661
The Notes to Financial Statements are an integral part hereof.
-107-
Table of Contents
NOTES TO FINANCIAL STATEMENTS
NOTE 1 – Summary of Significant Accounting Policies
Organization
CH Energy Group, Inc. ("CH Energy Group") is the holding company parent corporation of Central Hudson Gas & Electric Corporation ("Central Hudson") and CentralHudson Enterprises Corporation ("CHEC"). Central Hudson and CHEC are each wholly owned by CH Energy Group. Griffith Energy Services, Inc. ("Griffith") is CHEC'swholly owned subsidiary. Their businesses are primarily comprised of a regulated electric utility, regulated natural gas utility and a fuel distribution business.
CHEC's investments in limited partnerships ("Partnerships") and limited liability companies are accounted for under the equity method. CH Energy Group's proportionateshare of the change in fair value of available for sale securities held by the Partnerships is recorded in CH Energy Group's Consolidated Statement of ComprehensiveIncome. For more information, see Note 5 - "Acquisitions, Divestitures and Investments."
Basis of Presentation
This Annual Report on Form 10-K is a combined report of CH Energy Group and Central Hudson. The Notes to the Consolidated Financial Statements apply to both CHEnergy Group and Central Hudson. CH Energy Group's Consolidated Financial Statements include the accounts of CH Energy Group and its wholly owned subsidiaries,which include Central Hudson and CHEC. Operating results of Griffith are consolidated in the Consolidated Financial Statements of CH Energy Group. Discontinuedoperations on CH Energy Group's Consolidated Statements of Income include the operating results of CHEC's subsidiaries which were sold in 2011, including LyonsdaleBiomass, LLC ("Lyonsdale"), Shirley Wind, LLC ("Shirley Wind"), CH-Auburn, LLC ("CH-Auburn") and CH-Greentree, LLC ("CH-Greentree"). The non-controllinginterest shown on CH Energy Group's Consolidated Financial Statements represents the minority owner's proportionate share of the income and equity of Shirley Delawarefor 2011 and 2010 prior to the sale of this subsidiary and Lyonsdale for 2010 prior to the purchase of the minority owner's interest on October 1, 2010. Inter-companybalances and transactions have been eliminated in consolidation. See Note 5 – "Acquisitions, Divestitures and Investments" for further information.
The Financial Statements were prepared in conformity with accounting principles generally accepted in the United States of America ("GAAP"), which for regulated publicutilities, includes specific accounting guidance for regulated operations. For additional information regarding regulatory accounting, see Note 2 – "Regulatory Matters."
-108-
Table of Contents
Pending Acquisition by Fortis Inc.
On February 21, 2012, CH Energy Group announced that it had entered into an agreement and plan of merger under which it agreed, subject to shareholder approval and theapproval of applicable regulatory authorities, to be acquired by Fortis Inc. ("Fortis") for $65 per share of common stock in cash. On June 19, 2012, shareholders of CHEnergy Group approved the proposed acquisition of the Company by Fortis. On July 3, 2012, the Federal Energy Regulatory Commission ("FERC") approved theacquisition of CH Energy Group by Fortis. On July 17, 2012, the Committee on Foreign Investment in the United States approved the acquisition of CH Energy Group byFortis. On October 2, 2012, the Federal Trade Commission permitted the 30-day waiting period under the Hart-Scott-Rodino Antitrust Improvements Act of 1976 withrespect to the acquisition of the Company by Fortis to expire. On April 20, 2012, Fortis and Central Hudson jointly filed a petition requesting approval of the proposedtransaction under Section 70 of the Public Service Law. Pursuant to a procedure schedule established by the Administrative Law Judges, the PSC Staff and other parties tothe proceeding filed testimony and comments on October 12, 2012. On January 25, 2013, a Joint proposal with the Company, Fortis, PSC Staff, Multiple Intervenors, theDepartment of State Utility Intervention Unit, and Dutchess, Orange and Ulster counties as signatories, was submitted to the PSC. The signatory parties have concluded that,based on the terms of the Settlement Agreement, the acquisition is in the public interest pursuant to New York State Public Service Law, Section 70, and recommend
http://www.sec.gov/Archives/edgar/data/18647/000106139313000018/form10k.htm[8/23/2013 4:25:39 PM]
approval by the Commission. While no assurance can be given until a PSC Order is issued and accepted by Fortis, a decision from the PSC regarding the Joint Proposal isnot expected until the second quarter of 2013. Reclassification
Certain amounts in the 2011 Financial Statements have been reclassified to conform to the 2012 presentation. For more information regarding reclassification ofdiscontinued operations, see Note 5 – "Acquisition, Divestitures and Investments." The Company reclassified amounts related to in-process work for cost of removal of plant assets from accumulated depreciation to deferred costs, regulatory liabilities. Thisreclassification resulted in a reduction to both balances of $9.9 million.
Use of Estimates
Preparation of the financial statements in accordance with GAAP includes the use of estimates and assumptions by management that affect the reported amounts of assetsand liabilities and disclosures of contingent assets and liabilities at the date of the financial statements and reported amounts of revenues and expenses during the reportingperiod. As with all estimates, actual results may differ from those estimated. Expense items most affected by the use of estimates are depreciation and amortization(including amortization of intangible assets), reserves for uncollectible accounts receivable, tax reserves, other operating reserves, unbilled revenues, and pension and otherpost-retirement benefits.
-109-
Table of Contents
· Depreciation and amortization is based on estimates of the useful lives and estimated net salvage value of properties (as described in this Note under the caption"Depreciation and Amortization"). Amortizable intangible assets include trademarks, covenants not to compete and customer relationships related to Griffith,which are amortized based on an assessment of customer attrition as described in Note 6 - "Goodwill and Other Intangible Assets."
· Estimates for uncollectible accounts are based on customer accounts receivable aging data as well as consideration of various quantitative and qualitativefactors, including special collection issues. In the current year, the decrease in the allowance for doubtful accounts reflects the impact of lower energy pricesalong with enhanced collection efforts.
· The tax reserve recorded by Central Hudson relates to a change in 2010 related to its tax return methodology for claiming deductions for incidental repair andmaintenance expenditures on its utility assets. Although the Company believes that its methodology for claiming the deduction is consistent with the InternalRevenue Code and case law, Management cannot predict whether the Internal Revenue Service will accept the entirety of the deduction claimed. Accordingly,Central Hudson recorded a reserve based upon the expected outcome on audit. See Note 4 – "Income Tax" for further discussion of the tax reserve established.
· The estimates for other operating reserves are based on assessments of future obligations related to injuries and damages and workers' compensation claims.
· Unbilled revenues are determined based on the estimated sales for bimonthly accounts that have not been billed by Central Hudson in the current month. Theestimation methods used in determining these sales are the same methods used for billing customers when actual meter readings cannot be obtained. Estimatedunbilled revenues are reported as current assets, and include amounts recorded both in revenues and as regulatory liabilities. Revenues for 2012, 2011 and2010 include an estimate for unbilled revenues of $11.2 million, $10.3 million and $10.1 million, respectively. Pursuant to regulatory requirements, a portionof unbilled revenue is offset by a regulatory liability and is not included in revenues. The portion of unbilled revenues offset by a regulatory liability atDecember 31, 2012, 2011 and 2010 was $6.0 million, $5.0 million and $6.1 million, respectively.
· The significant assumptions and estimates used to account for the pension plan and other post-retirement benefit expenses and liabilities are the discount rate,the expected long-term rate of return on the retirement plan and post-retirement plan assets, the rate of compensation increase, the healthcare cost trend rate,mortality assumptions, and the method of amortizing gains and losses. For more information of the significant assumptions and estimates, see Note 10 – "Post-Employment Benefits."
· Estimates are also reflected for certain commitments and contingencies where there is sufficient basis to project a future obligation. Disclosures related tothese certain commitments and contingencies are included in Note 12 - "Commitments and Contingencies."
-110-
Table of Contents
Rates, Revenues, and Cost Adjustment Clauses
Central Hudson's electric and natural gas retail rates are regulated by the New York State Public Service Commission ("PSC"). Transmission rates, facilities charges, andrates for electricity sold for resale in interstate commerce are regulated by the Federal Energy Regulatory Commission ("FERC").
Central Hudson's tariffs for retail electric and natural gas service include purchased electricity and purchased natural gas cost adjustment clauses by which electric andnatural gas rates are adjusted to collect the actual purchased electricity and purchased natural gas costs incurred in providing these services.
Central Hudson's delivery rate structure includes revenue decoupling mechanisms ("RDMs"), which provide the ability to record revenues equal to those forecasted in thedevelopment of current rates for most of Central Hudson's customers.
Revenue Recognition
Central Hudson records revenue on the basis of meters read. In addition, Central Hudson records an estimate of unbilled revenue for service rendered to bimonthlycustomers whose meters are read in the prior month. The estimate covers 30 days subsequent to the meter-read date. As of December 31, 2012, and 2011, the portion ofestimated electric unbilled revenues that is unrecognized in accordance with current regulatory agreements were $13.2 million and $11.8 million, respectively. The full
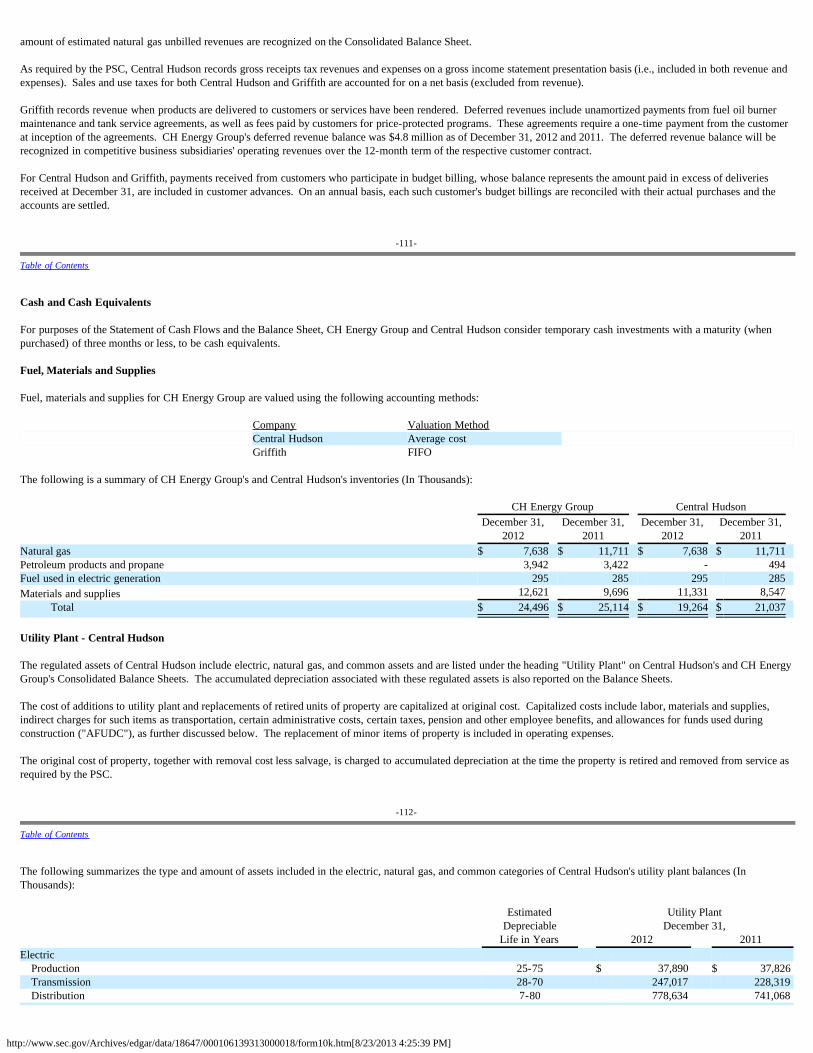
http://www.sec.gov/Archives/edgar/data/18647/000106139313000018/form10k.htm[8/23/2013 4:25:39 PM]
amount of estimated natural gas unbilled revenues are recognized on the Consolidated Balance Sheet.
As required by the PSC, Central Hudson records gross receipts tax revenues and expenses on a gross income statement presentation basis (i.e., included in both revenue andexpenses). Sales and use taxes for both Central Hudson and Griffith are accounted for on a net basis (excluded from revenue).
Griffith records revenue when products are delivered to customers or services have been rendered. Deferred revenues include unamortized payments from fuel oil burnermaintenance and tank service agreements, as well as fees paid by customers for price-protected programs. These agreements require a one-time payment from the customerat inception of the agreements. CH Energy Group's deferred revenue balance was $4.8 million as of December 31, 2012 and 2011. The deferred revenue balance will berecognized in competitive business subsidiaries' operating revenues over the 12-month term of the respective customer contract.
For Central Hudson and Griffith, payments received from customers who participate in budget billing, whose balance represents the amount paid in excess of deliveriesreceived at December 31, are included in customer advances. On an annual basis, each such customer's budget billings are reconciled with their actual purchases and theaccounts are settled.
-111-
Table of Contents
Cash and Cash Equivalents
For purposes of the Statement of Cash Flows and the Balance Sheet, CH Energy Group and Central Hudson consider temporary cash investments with a maturity (whenpurchased) of three months or less, to be cash equivalents.
Fuel, Materials and Supplies
Fuel, materials and supplies for CH Energy Group are valued using the following accounting methods:
Company Valuation Method Central Hudson Average cost Griffith FIFO The following is a summary of CH Energy Group's and Central Hudson's inventories (In Thousands): CH Energy Group Central Hudson December 31, December 31, December 31, December 31,
2012 2011 2012 2011 Natural gas $ 7,638 $ 11,711 $ 7,638 $ 11,711 Petroleum products and propane 3,942 3,422 - 494 Fuel used in electric generation 295 285 295 285 Materials and supplies 12,621 9,696 11,331 8,547
Total $ 24,496 $ 25,114 $ 19,264 $ 21,037 Utility Plant - Central Hudson
The regulated assets of Central Hudson include electric, natural gas, and common assets and are listed under the heading "Utility Plant" on Central Hudson's and CH EnergyGroup's Consolidated Balance Sheets. The accumulated depreciation associated with these regulated assets is also reported on the Balance Sheets.
The cost of additions to utility plant and replacements of retired units of property are capitalized at original cost. Capitalized costs include labor, materials and supplies,indirect charges for such items as transportation, certain administrative costs, certain taxes, pension and other employee benefits, and allowances for funds used duringconstruction ("AFUDC"), as further discussed below. The replacement of minor items of property is included in operating expenses.
The original cost of property, together with removal cost less salvage, is charged to accumulated depreciation at the time the property is retired and removed from service asrequired by the PSC.
-112-
Table of Contents
The following summarizes the type and amount of assets included in the electric, natural gas, and common categories of Central Hudson's utility plant balances (InThousands): Estimated Utility Plant Depreciable December 31, Life in Years 2012 2011 Electric Production 25-75 $ 37,890 $ 37,826 Transmission 28-70 247,017 228,319 Distribution 7-80 778,634 741,068
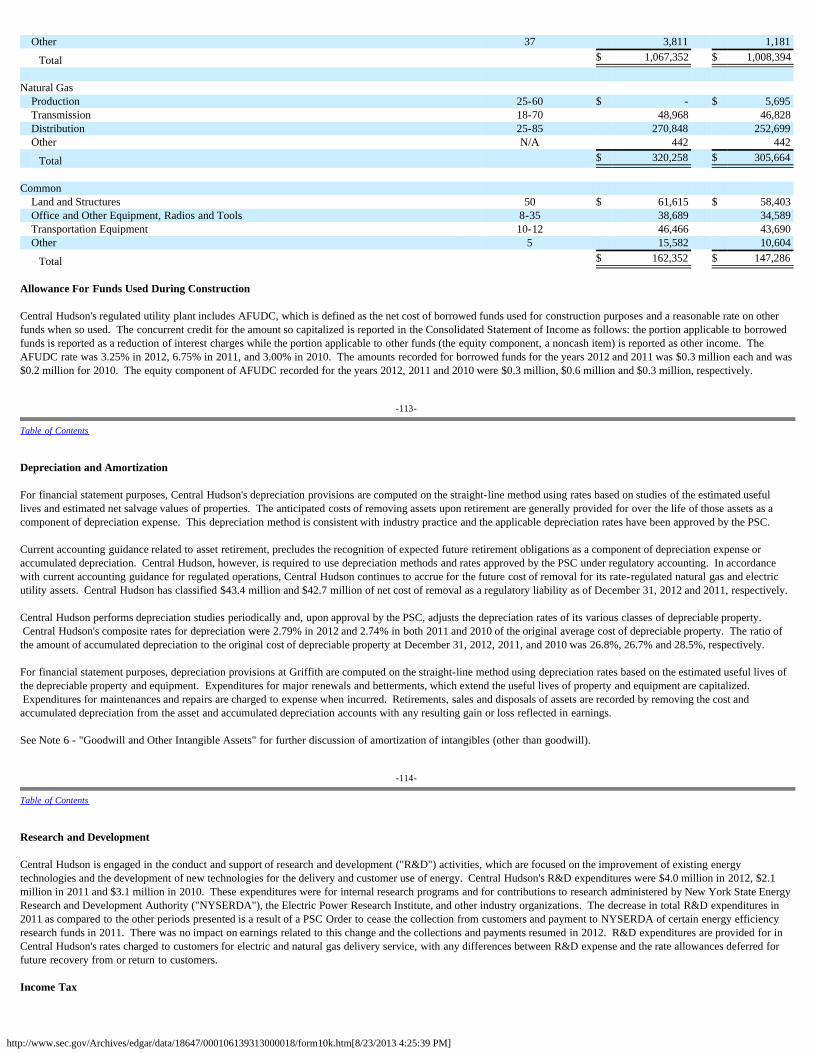
http://www.sec.gov/Archives/edgar/data/18647/000106139313000018/form10k.htm[8/23/2013 4:25:39 PM]
Other 37 3,811 1,181
Total $ 1,067,352 $ 1,008,394 Natural Gas Production 25-60 $ - $ 5,695 Transmission 18-70 48,968 46,828 Distribution 25-85 270,848 252,699 Other N/A 442 442
Total $ 320,258 $ 305,664 Common Land and Structures 50 $ 61,615 $ 58,403 Office and Other Equipment, Radios and Tools 8-35 38,689 34,589 Transportation Equipment 10-12 46,466 43,690 Other 5 15,582 10,604
Total $ 162,352 $ 147,286 Allowance For Funds Used During Construction
Central Hudson's regulated utility plant includes AFUDC, which is defined as the net cost of borrowed funds used for construction purposes and a reasonable rate on otherfunds when so used. The concurrent credit for the amount so capitalized is reported in the Consolidated Statement of Income as follows: the portion applicable to borrowedfunds is reported as a reduction of interest charges while the portion applicable to other funds (the equity component, a noncash item) is reported as other income. TheAFUDC rate was 3.25% in 2012, 6.75% in 2011, and 3.00% in 2010. The amounts recorded for borrowed funds for the years 2012 and 2011 was $0.3 million each and was$0.2 million for 2010. The equity component of AFUDC recorded for the years 2012, 2011 and 2010 were $0.3 million, $0.6 million and $0.3 million, respectively.
-113-
Table of Contents
Depreciation and Amortization
For financial statement purposes, Central Hudson's depreciation provisions are computed on the straight-line method using rates based on studies of the estimated usefullives and estimated net salvage values of properties. The anticipated costs of removing assets upon retirement are generally provided for over the life of those assets as acomponent of depreciation expense. This depreciation method is consistent with industry practice and the applicable depreciation rates have been approved by the PSC.
Current accounting guidance related to asset retirement, precludes the recognition of expected future retirement obligations as a component of depreciation expense oraccumulated depreciation. Central Hudson, however, is required to use depreciation methods and rates approved by the PSC under regulatory accounting. In accordancewith current accounting guidance for regulated operations, Central Hudson continues to accrue for the future cost of removal for its rate-regulated natural gas and electricutility assets. Central Hudson has classified $43.4 million and $42.7 million of net cost of removal as a regulatory liability as of December 31, 2012 and 2011, respectively.
Central Hudson performs depreciation studies periodically and, upon approval by the PSC, adjusts the depreciation rates of its various classes of depreciable property. Central Hudson's composite rates for depreciation were 2.79% in 2012 and 2.74% in both 2011 and 2010 of the original average cost of depreciable property. The ratio ofthe amount of accumulated depreciation to the original cost of depreciable property at December 31, 2012, 2011, and 2010 was 26.8%, 26.7% and 28.5%, respectively.
For financial statement purposes, depreciation provisions at Griffith are computed on the straight-line method using depreciation rates based on the estimated useful lives ofthe depreciable property and equipment. Expenditures for major renewals and betterments, which extend the useful lives of property and equipment are capitalized. Expenditures for maintenances and repairs are charged to expense when incurred. Retirements, sales and disposals of assets are recorded by removing the cost andaccumulated depreciation from the asset and accumulated depreciation accounts with any resulting gain or loss reflected in earnings.
See Note 6 - "Goodwill and Other Intangible Assets" for further discussion of amortization of intangibles (other than goodwill).
-114-
Table of Contents
Research and Development
Central Hudson is engaged in the conduct and support of research and development ("R&D") activities, which are focused on the improvement of existing energytechnologies and the development of new technologies for the delivery and customer use of energy. Central Hudson's R&D expenditures were $4.0 million in 2012, $2.1million in 2011 and $3.1 million in 2010. These expenditures were for internal research programs and for contributions to research administered by New York State EnergyResearch and Development Authority ("NYSERDA"), the Electric Power Research Institute, and other industry organizations. The decrease in total R&D expenditures in2011 as compared to the other periods presented is a result of a PSC Order to cease the collection from customers and payment to NYSERDA of certain energy efficiencyresearch funds in 2011. There was no impact on earnings related to this change and the collections and payments resumed in 2012. R&D expenditures are provided for inCentral Hudson's rates charged to customers for electric and natural gas delivery service, with any differences between R&D expense and the rate allowances deferred forfuture recovery from or return to customers.
Income Tax
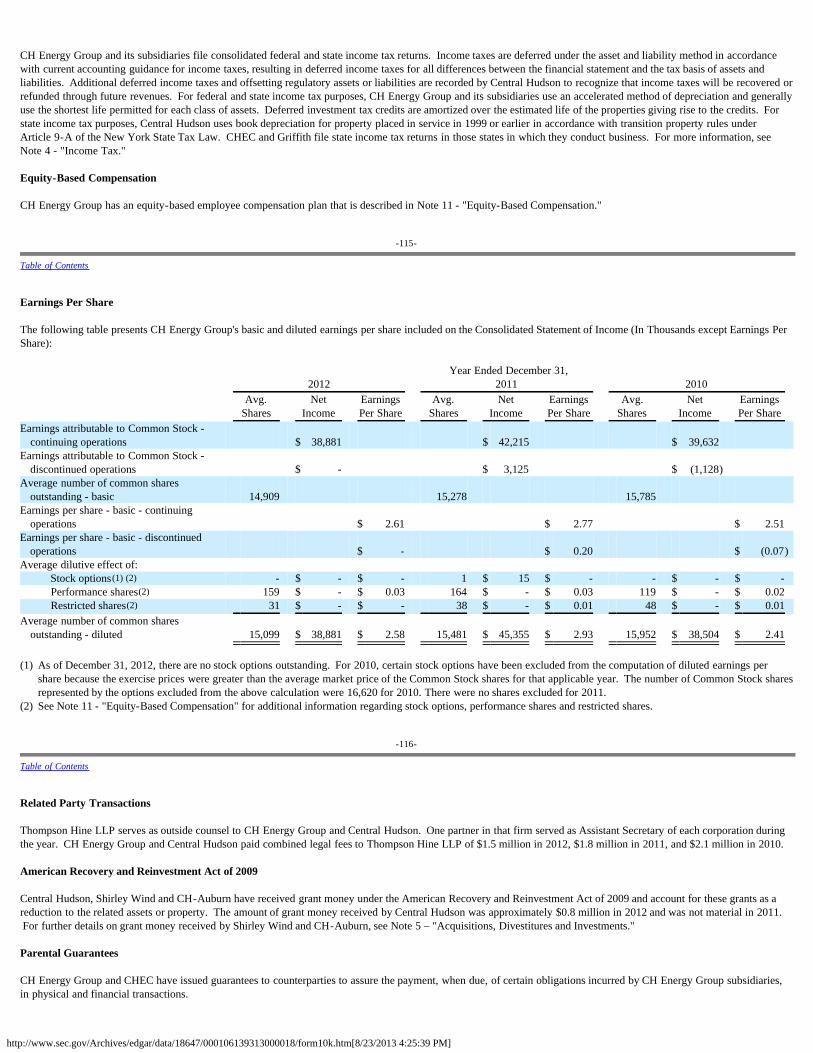
http://www.sec.gov/Archives/edgar/data/18647/000106139313000018/form10k.htm[8/23/2013 4:25:39 PM]
CH Energy Group and its subsidiaries file consolidated federal and state income tax returns. Income taxes are deferred under the asset and liability method in accordancewith current accounting guidance for income taxes, resulting in deferred income taxes for all differences between the financial statement and the tax basis of assets andliabilities. Additional deferred income taxes and offsetting regulatory assets or liabilities are recorded by Central Hudson to recognize that income taxes will be recovered orrefunded through future revenues. For federal and state income tax purposes, CH Energy Group and its subsidiaries use an accelerated method of depreciation and generallyuse the shortest life permitted for each class of assets. Deferred investment tax credits are amortized over the estimated life of the properties giving rise to the credits. Forstate income tax purposes, Central Hudson uses book depreciation for property placed in service in 1999 or earlier in accordance with transition property rules underArticle 9-A of the New York State Tax Law. CHEC and Griffith file state income tax returns in those states in which they conduct business. For more information, seeNote 4 - "Income Tax."
Equity-Based Compensation
CH Energy Group has an equity-based employee compensation plan that is described in Note 11 - "Equity-Based Compensation."
-115-
Table of Contents
Earnings Per Share The following table presents CH Energy Group's basic and diluted earnings per share included on the Consolidated Statement of Income (In Thousands except Earnings PerShare): Year Ended December 31, 2012 2011 2010 Avg. Net Earnings Avg. Net Earnings Avg. Net Earnings Shares Income Per Share Shares Income Per Share Shares Income Per Share Earnings attributable to Common Stock -
continuing operations $ 38,881 $ 42,215 $ 39,632 Earnings attributable to Common Stock -
discontinued operations $ - $ 3,125 $ (1,128) Average number of common shares
outstanding - basic 14,909 15,278 15,785 Earnings per share - basic - continuing
operations $ 2.61 $ 2.77 $ 2.51 Earnings per share - basic - discontinued
operations $ - $ 0.20 $ (0.07)Average dilutive effect of:
Stock options(1) (2) - $ - $ - 1 $ 15 $ - - $ - $ - Performance shares(2) 159 $ - $ 0.03 164 $ - $ 0.03 119 $ - $ 0.02 Restricted shares(2) 31 $ - $ - 38 $ - $ 0.01 48 $ - $ 0.01
Average number of common sharesoutstanding - diluted 15,099 $ 38,881 $ 2.58 15,481 $ 45,355 $ 2.93 15,952 $ 38,504 $ 2.41
(1) As of December 31, 2012, there are no stock options outstanding. For 2010, certain stock options have been excluded from the computation of diluted earnings per
share because the exercise prices were greater than the average market price of the Common Stock shares for that applicable year. The number of Common Stock sharesrepresented by the options excluded from the above calculation were 16,620 for 2010. There were no shares excluded for 2011.
(2) See Note 11 - "Equity-Based Compensation" for additional information regarding stock options, performance shares and restricted shares.
-116-
Table of Contents
Related Party Transactions
Thompson Hine LLP serves as outside counsel to CH Energy Group and Central Hudson. One partner in that firm served as Assistant Secretary of each corporation duringthe year. CH Energy Group and Central Hudson paid combined legal fees to Thompson Hine LLP of $1.5 million in 2012, $1.8 million in 2011, and $2.1 million in 2010.
American Recovery and Reinvestment Act of 2009
Central Hudson, Shirley Wind and CH-Auburn have received grant money under the American Recovery and Reinvestment Act of 2009 and account for these grants as areduction to the related assets or property. The amount of grant money received by Central Hudson was approximately $0.8 million in 2012 and was not material in 2011. For further details on grant money received by Shirley Wind and CH-Auburn, see Note 5 – "Acquisitions, Divestitures and Investments."
Parental Guarantees
CH Energy Group and CHEC have issued guarantees to counterparties to assure the payment, when due, of certain obligations incurred by CH Energy Group subsidiaries,in physical and financial transactions.
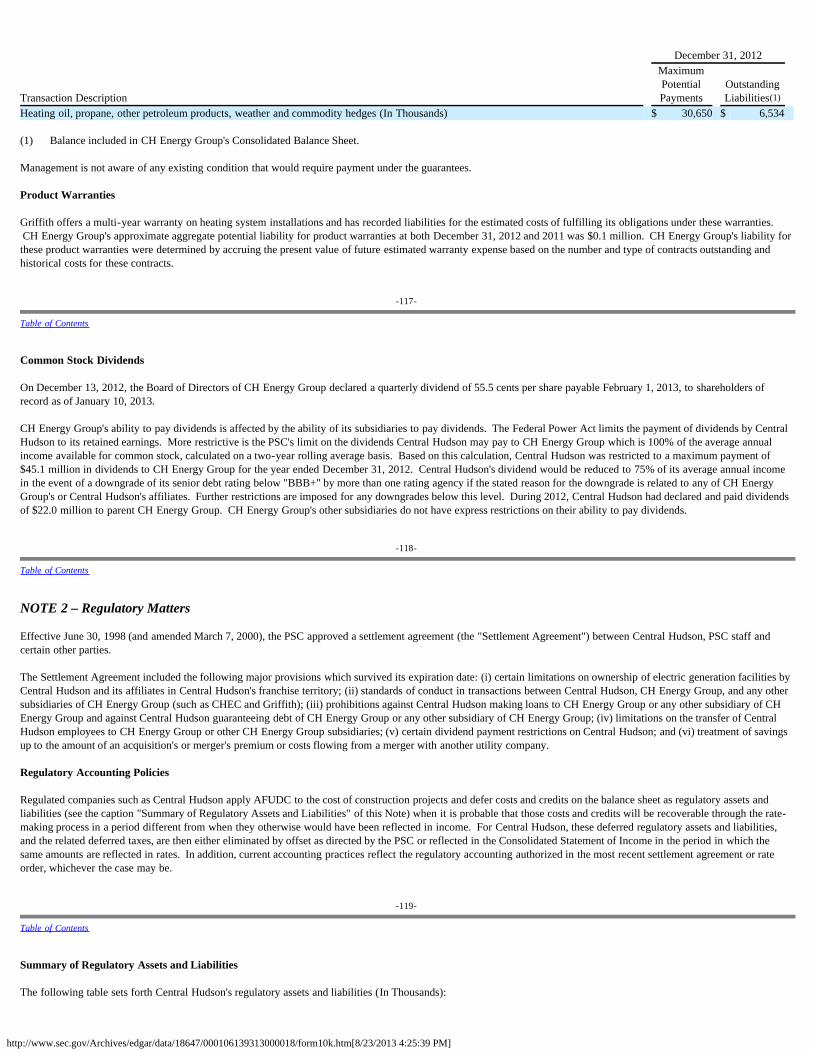
http://www.sec.gov/Archives/edgar/data/18647/000106139313000018/form10k.htm[8/23/2013 4:25:39 PM]
December 31, 2012
Transaction Description
MaximumPotentialPayments
OutstandingLiabilities(1)
Heating oil, propane, other petroleum products, weather and commodity hedges (In Thousands) $ 30,650 $ 6,534 (1) Balance included in CH Energy Group's Consolidated Balance Sheet. Management is not aware of any existing condition that would require payment under the guarantees.
Product Warranties
Griffith offers a multi-year warranty on heating system installations and has recorded liabilities for the estimated costs of fulfilling its obligations under these warranties. CH Energy Group's approximate aggregate potential liability for product warranties at both December 31, 2012 and 2011 was $0.1 million. CH Energy Group's liability forthese product warranties were determined by accruing the present value of future estimated warranty expense based on the number and type of contracts outstanding andhistorical costs for these contracts.
-117-
Table of Contents
Common Stock Dividends
On December 13, 2012, the Board of Directors of CH Energy Group declared a quarterly dividend of 55.5 cents per share payable February 1, 2013, to shareholders ofrecord as of January 10, 2013.
CH Energy Group's ability to pay dividends is affected by the ability of its subsidiaries to pay dividends. The Federal Power Act limits the payment of dividends by CentralHudson to its retained earnings. More restrictive is the PSC's limit on the dividends Central Hudson may pay to CH Energy Group which is 100% of the average annualincome available for common stock, calculated on a two-year rolling average basis. Based on this calculation, Central Hudson was restricted to a maximum payment of$45.1 million in dividends to CH Energy Group for the year ended December 31, 2012. Central Hudson's dividend would be reduced to 75% of its average annual incomein the event of a downgrade of its senior debt rating below "BBB+" by more than one rating agency if the stated reason for the downgrade is related to any of CH EnergyGroup's or Central Hudson's affiliates. Further restrictions are imposed for any downgrades below this level. During 2012, Central Hudson had declared and paid dividendsof $22.0 million to parent CH Energy Group. CH Energy Group's other subsidiaries do not have express restrictions on their ability to pay dividends.
-118-
Table of Contents
NOTE 2 – Regulatory Matters
Effective June 30, 1998 (and amended March 7, 2000), the PSC approved a settlement agreement (the "Settlement Agreement") between Central Hudson, PSC staff andcertain other parties.
The Settlement Agreement included the following major provisions which survived its expiration date: (i) certain limitations on ownership of electric generation facilities byCentral Hudson and its affiliates in Central Hudson's franchise territory; (ii) standards of conduct in transactions between Central Hudson, CH Energy Group, and any othersubsidiaries of CH Energy Group (such as CHEC and Griffith); (iii) prohibitions against Central Hudson making loans to CH Energy Group or any other subsidiary of CHEnergy Group and against Central Hudson guaranteeing debt of CH Energy Group or any other subsidiary of CH Energy Group; (iv) limitations on the transfer of CentralHudson employees to CH Energy Group or other CH Energy Group subsidiaries; (v) certain dividend payment restrictions on Central Hudson; and (vi) treatment of savingsup to the amount of an acquisition's or merger's premium or costs flowing from a merger with another utility company.
Regulatory Accounting Policies
Regulated companies such as Central Hudson apply AFUDC to the cost of construction projects and defer costs and credits on the balance sheet as regulatory assets andliabilities (see the caption "Summary of Regulatory Assets and Liabilities" of this Note) when it is probable that those costs and credits will be recoverable through the rate-making process in a period different from when they otherwise would have been reflected in income. For Central Hudson, these deferred regulatory assets and liabilities,and the related deferred taxes, are then either eliminated by offset as directed by the PSC or reflected in the Consolidated Statement of Income in the period in which thesame amounts are reflected in rates. In addition, current accounting practices reflect the regulatory accounting authorized in the most recent settlement agreement or rateorder, whichever the case may be.
-119-
Table of Contents
Summary of Regulatory Assets and Liabilities The following table sets forth Central Hudson's regulatory assets and liabilities (In Thousands):
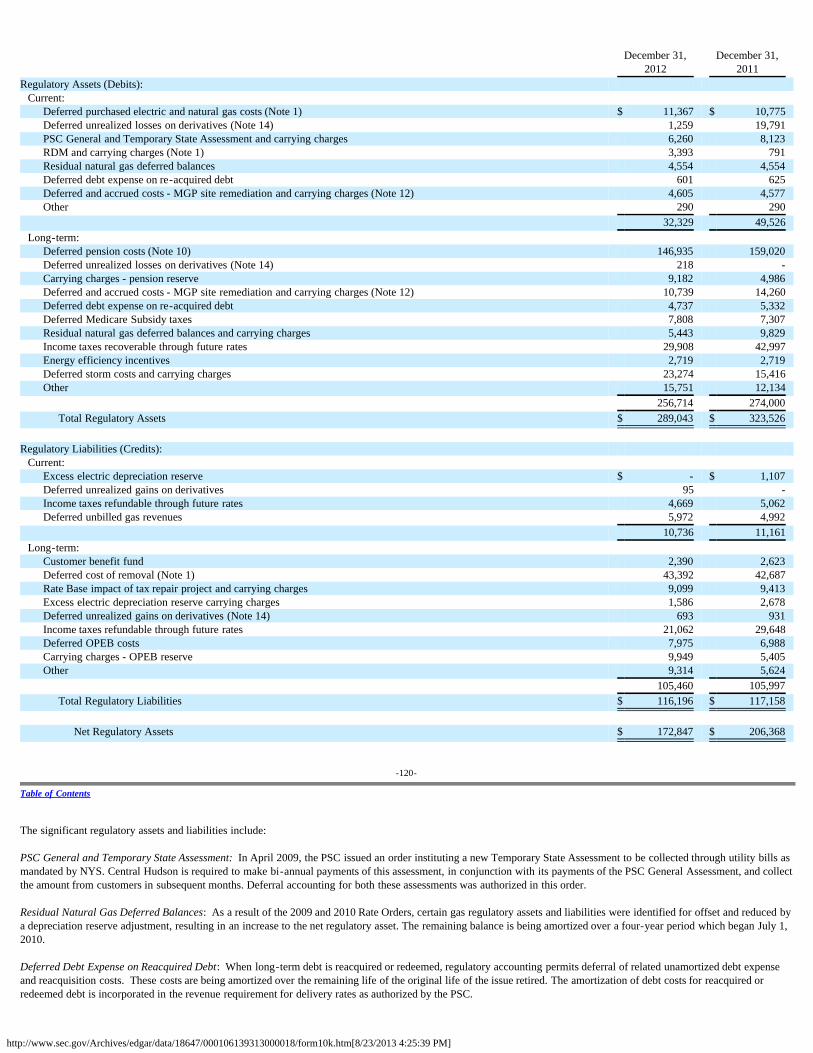
http://www.sec.gov/Archives/edgar/data/18647/000106139313000018/form10k.htm[8/23/2013 4:25:39 PM]
December 31, December 31, 2012 2011 Regulatory Assets (Debits):
Current: Deferred purchased electric and natural gas costs (Note 1) $ 11,367 $ 10,775 Deferred unrealized losses on derivatives (Note 14) 1,259 19,791 PSC General and Temporary State Assessment and carrying charges 6,260 8,123 RDM and carrying charges (Note 1) 3,393 791 Residual natural gas deferred balances 4,554 4,554 Deferred debt expense on re-acquired debt 601 625 Deferred and accrued costs - MGP site remediation and carrying charges (Note 12) 4,605 4,577 Other 290 290
32,329 49,526 Long-term:
Deferred pension costs (Note 10) 146,935 159,020 Deferred unrealized losses on derivatives (Note 14) 218 - Carrying charges - pension reserve 9,182 4,986 Deferred and accrued costs - MGP site remediation and carrying charges (Note 12) 10,739 14,260 Deferred debt expense on re-acquired debt 4,737 5,332 Deferred Medicare Subsidy taxes 7,808 7,307 Residual natural gas deferred balances and carrying charges 5,443 9,829 Income taxes recoverable through future rates 29,908 42,997 Energy efficiency incentives 2,719 2,719 Deferred storm costs and carrying charges 23,274 15,416 Other 15,751 12,134
256,714 274,000 Total Regulatory Assets $ 289,043 $ 323,526
Regulatory Liabilities (Credits):
Current: Excess electric depreciation reserve $ - $ 1,107 Deferred unrealized gains on derivatives 95 - Income taxes refundable through future rates 4,669 5,062 Deferred unbilled gas revenues 5,972 4,992
10,736 11,161 Long-term:
Customer benefit fund 2,390 2,623 Deferred cost of removal (Note 1) 43,392 42,687 Rate Base impact of tax repair project and carrying charges 9,099 9,413 Excess electric depreciation reserve carrying charges 1,586 2,678 Deferred unrealized gains on derivatives (Note 14) 693 931 Income taxes refundable through future rates 21,062 29,648 Deferred OPEB costs 7,975 6,988 Carrying charges - OPEB reserve 9,949 5,405 Other 9,314 5,624
105,460 105,997 Total Regulatory Liabilities $ 116,196 $ 117,158
Net Regulatory Assets $ 172,847 $ 206,368
-120-
Table of Contents
The significant regulatory assets and liabilities include:
PSC General and Temporary State Assessment: In April 2009, the PSC issued an order instituting a new Temporary State Assessment to be collected through utility bills asmandated by NYS. Central Hudson is required to make bi-annual payments of this assessment, in conjunction with its payments of the PSC General Assessment, and collectthe amount from customers in subsequent months. Deferral accounting for both these assessments was authorized in this order.
Residual Natural Gas Deferred Balances: As a result of the 2009 and 2010 Rate Orders, certain gas regulatory assets and liabilities were identified for offset and reduced bya depreciation reserve adjustment, resulting in an increase to the net regulatory asset. The remaining balance is being amortized over a four-year period which began July 1,2010.
Deferred Debt Expense on Reacquired Debt: When long-term debt is reacquired or redeemed, regulatory accounting permits deferral of related unamortized debt expenseand reacquisition costs. These costs are being amortized over the remaining life of the original life of the issue retired. The amortization of debt costs for reacquired orredeemed debt is incorporated in the revenue requirement for delivery rates as authorized by the PSC.
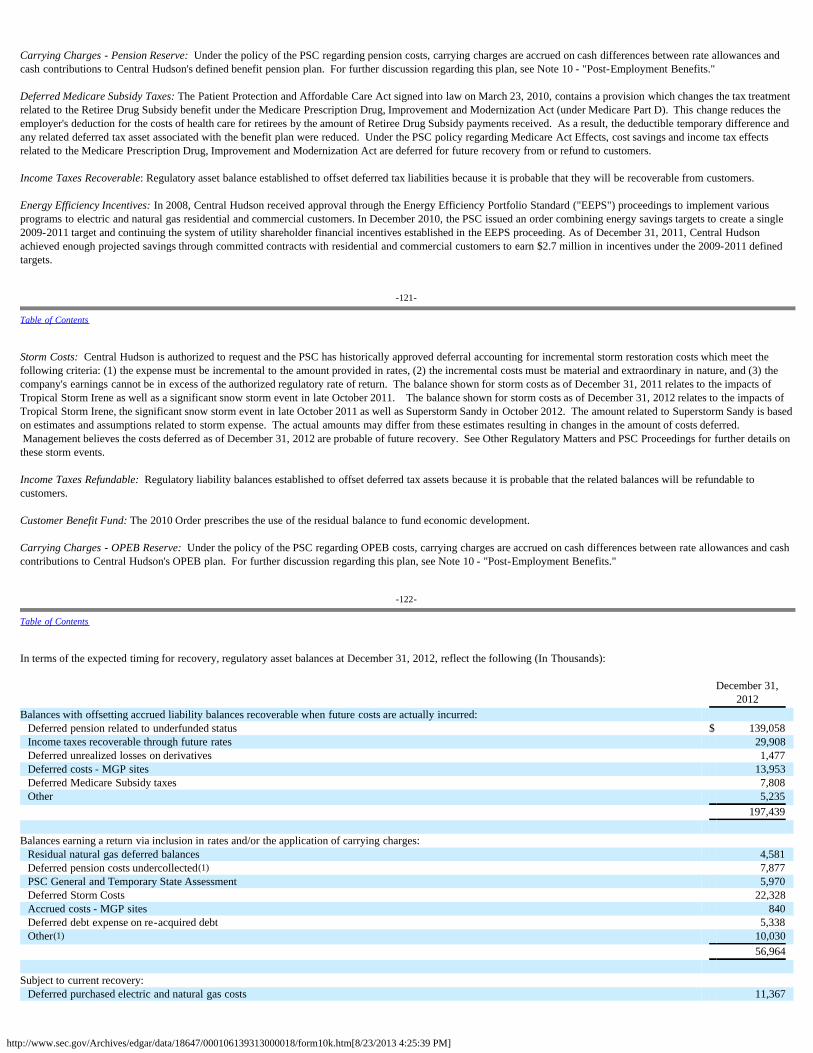
http://www.sec.gov/Archives/edgar/data/18647/000106139313000018/form10k.htm[8/23/2013 4:25:39 PM]
Carrying Charges - Pension Reserve: Under the policy of the PSC regarding pension costs, carrying charges are accrued on cash differences between rate allowances andcash contributions to Central Hudson's defined benefit pension plan. For further discussion regarding this plan, see Note 10 - "Post-Employment Benefits."
Deferred Medicare Subsidy Taxes: The Patient Protection and Affordable Care Act signed into law on March 23, 2010, contains a provision which changes the tax treatmentrelated to the Retiree Drug Subsidy benefit under the Medicare Prescription Drug, Improvement and Modernization Act (under Medicare Part D). This change reduces theemployer's deduction for the costs of health care for retirees by the amount of Retiree Drug Subsidy payments received. As a result, the deductible temporary difference andany related deferred tax asset associated with the benefit plan were reduced. Under the PSC policy regarding Medicare Act Effects, cost savings and income tax effectsrelated to the Medicare Prescription Drug, Improvement and Modernization Act are deferred for future recovery from or refund to customers.
Income Taxes Recoverable: Regulatory asset balance established to offset deferred tax liabilities because it is probable that they will be recoverable from customers.
Energy Efficiency Incentives: In 2008, Central Hudson received approval through the Energy Efficiency Portfolio Standard ("EEPS") proceedings to implement variousprograms to electric and natural gas residential and commercial customers. In December 2010, the PSC issued an order combining energy savings targets to create a single2009-2011 target and continuing the system of utility shareholder financial incentives established in the EEPS proceeding. As of December 31, 2011, Central Hudsonachieved enough projected savings through committed contracts with residential and commercial customers to earn $2.7 million in incentives under the 2009-2011 definedtargets.
-121-
Table of Contents
Storm Costs: Central Hudson is authorized to request and the PSC has historically approved deferral accounting for incremental storm restoration costs which meet thefollowing criteria: (1) the expense must be incremental to the amount provided in rates, (2) the incremental costs must be material and extraordinary in nature, and (3) thecompany's earnings cannot be in excess of the authorized regulatory rate of return. The balance shown for storm costs as of December 31, 2011 relates to the impacts ofTropical Storm Irene as well as a significant snow storm event in late October 2011. The balance shown for storm costs as of December 31, 2012 relates to the impacts ofTropical Storm Irene, the significant snow storm event in late October 2011 as well as Superstorm Sandy in October 2012. The amount related to Superstorm Sandy is basedon estimates and assumptions related to storm expense. The actual amounts may differ from these estimates resulting in changes in the amount of costs deferred. Management believes the costs deferred as of December 31, 2012 are probable of future recovery. See Other Regulatory Matters and PSC Proceedings for further details onthese storm events.
Income Taxes Refundable: Regulatory liability balances established to offset deferred tax assets because it is probable that the related balances will be refundable tocustomers.
Customer Benefit Fund: The 2010 Order prescribes the use of the residual balance to fund economic development.
Carrying Charges - OPEB Reserve: Under the policy of the PSC regarding OPEB costs, carrying charges are accrued on cash differences between rate allowances and cashcontributions to Central Hudson's OPEB plan. For further discussion regarding this plan, see Note 10 - "Post-Employment Benefits."
-122-
Table of Contents
In terms of the expected timing for recovery, regulatory asset balances at December 31, 2012, reflect the following (In Thousands):
December 31,
2012 Balances with offsetting accrued liability balances recoverable when future costs are actually incurred:
Deferred pension related to underfunded status $ 139,058 Income taxes recoverable through future rates 29,908 Deferred unrealized losses on derivatives 1,477 Deferred costs - MGP sites 13,953 Deferred Medicare Subsidy taxes 7,808 Other 5,235
197,439 Balances earning a return via inclusion in rates and/or the application of carrying charges:
Residual natural gas deferred balances 4,581 Deferred pension costs undercollected(1) 7,877 PSC General and Temporary State Assessment 5,970 Deferred Storm Costs 22,328 Accrued costs - MGP sites 840 Deferred debt expense on re-acquired debt 5,338 Other(1) 10,030
56,964 Subject to current recovery:
Deferred purchased electric and natural gas costs 11,367
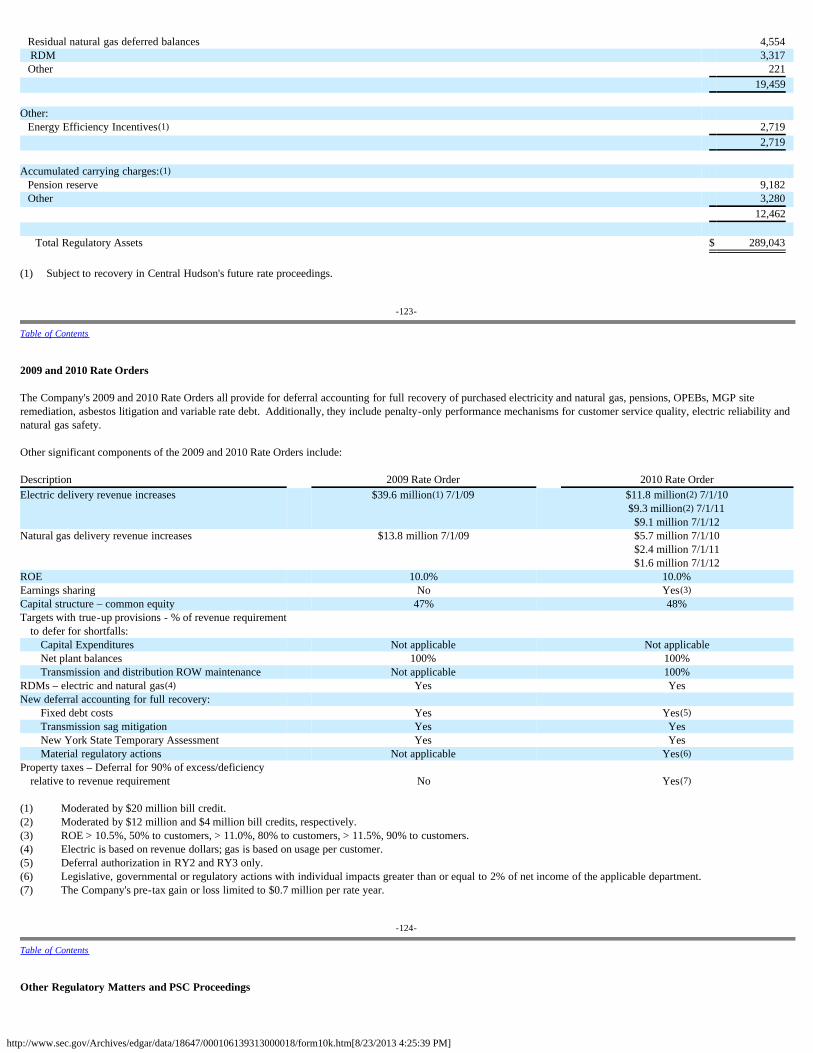
http://www.sec.gov/Archives/edgar/data/18647/000106139313000018/form10k.htm[8/23/2013 4:25:39 PM]
Residual natural gas deferred balances 4,554 RDM 3,317 Other 221
19,459 Other:
Energy Efficiency Incentives(1) 2,719 2,719 Accumulated carrying charges:(1)
Pension reserve 9,182 Other 3,280
12,462
Total Regulatory Assets $ 289,043 (1) Subject to recovery in Central Hudson's future rate proceedings.
-123-
Table of Contents
2009 and 2010 Rate Orders
The Company's 2009 and 2010 Rate Orders all provide for deferral accounting for full recovery of purchased electricity and natural gas, pensions, OPEBs, MGP siteremediation, asbestos litigation and variable rate debt. Additionally, they include penalty-only performance mechanisms for customer service quality, electric reliability andnatural gas safety.
Other significant components of the 2009 and 2010 Rate Orders include: Description 2009 Rate Order 2010 Rate OrderElectric delivery revenue increases $39.6 million(1) 7/1/09 $11.8 million(2) 7/1/10
$9.3 million(2) 7/1/11$9.1 million 7/1/12
Natural gas delivery revenue increases $13.8 million 7/1/09 $5.7 million 7/1/10$2.4 million 7/1/11$1.6 million 7/1/12
ROE 10.0% 10.0%Earnings sharing No Yes(3)Capital structure – common equity 47% 48%Targets with true-up provisions - % of revenue requirement
to defer for shortfalls: Capital Expenditures Not applicable Not applicableNet plant balances 100% 100%Transmission and distribution ROW maintenance Not applicable 100%
RDMs – electric and natural gas(4) Yes YesNew deferral accounting for full recovery:
Fixed debt costs Yes Yes(5)Transmission sag mitigation Yes YesNew York State Temporary Assessment Yes YesMaterial regulatory actions Not applicable Yes(6)
Property taxes – Deferral for 90% of excess/deficiencyrelative to revenue requirement No Yes(7)
(1) Moderated by $20 million bill credit.(2) Moderated by $12 million and $4 million bill credits, respectively.(3) ROE > 10.5%, 50% to customers, > 11.0%, 80% to customers, > 11.5%, 90% to customers.(4) Electric is based on revenue dollars; gas is based on usage per customer.(5) Deferral authorization in RY2 and RY3 only.(6) Legislative, governmental or regulatory actions with individual impacts greater than or equal to 2% of net income of the applicable department.(7) The Company's pre-tax gain or loss limited to $0.7 million per rate year.
-124-
Table of Contents
Other Regulatory Matters and PSC Proceedings
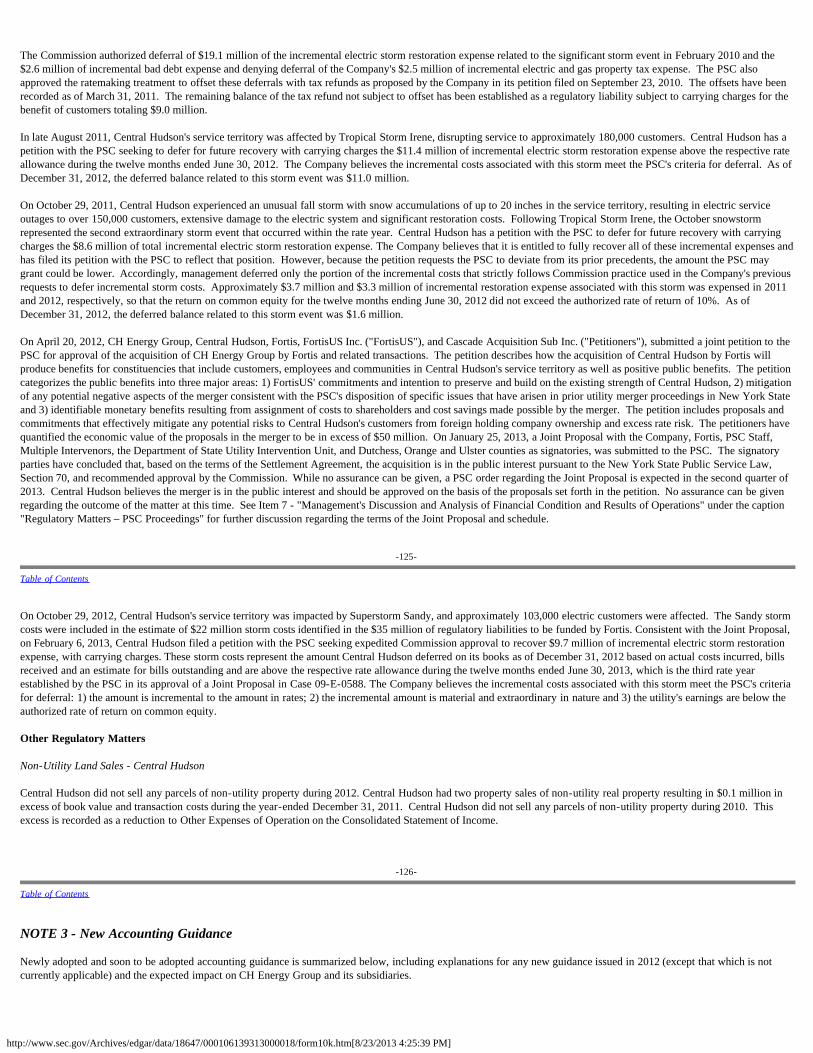
http://www.sec.gov/Archives/edgar/data/18647/000106139313000018/form10k.htm[8/23/2013 4:25:39 PM]
The Commission authorized deferral of $19.1 million of the incremental electric storm restoration expense related to the significant storm event in February 2010 and the$2.6 million of incremental bad debt expense and denying deferral of the Company's $2.5 million of incremental electric and gas property tax expense. The PSC alsoapproved the ratemaking treatment to offset these deferrals with tax refunds as proposed by the Company in its petition filed on September 23, 2010. The offsets have beenrecorded as of March 31, 2011. The remaining balance of the tax refund not subject to offset has been established as a regulatory liability subject to carrying charges for thebenefit of customers totaling $9.0 million.
In late August 2011, Central Hudson's service territory was affected by Tropical Storm Irene, disrupting service to approximately 180,000 customers. Central Hudson has apetition with the PSC seeking to defer for future recovery with carrying charges the $11.4 million of incremental electric storm restoration expense above the respective rateallowance during the twelve months ended June 30, 2012. The Company believes the incremental costs associated with this storm meet the PSC's criteria for deferral. As ofDecember 31, 2012, the deferred balance related to this storm event was $11.0 million.
On October 29, 2011, Central Hudson experienced an unusual fall storm with snow accumulations of up to 20 inches in the service territory, resulting in electric serviceoutages to over 150,000 customers, extensive damage to the electric system and significant restoration costs. Following Tropical Storm Irene, the October snowstormrepresented the second extraordinary storm event that occurred within the rate year. Central Hudson has a petition with the PSC to defer for future recovery with carryingcharges the $8.6 million of total incremental electric storm restoration expense. The Company believes that it is entitled to fully recover all of these incremental expenses andhas filed its petition with the PSC to reflect that position. However, because the petition requests the PSC to deviate from its prior precedents, the amount the PSC maygrant could be lower. Accordingly, management deferred only the portion of the incremental costs that strictly follows Commission practice used in the Company's previousrequests to defer incremental storm costs. Approximately $3.7 million and $3.3 million of incremental restoration expense associated with this storm was expensed in 2011and 2012, respectively, so that the return on common equity for the twelve months ending June 30, 2012 did not exceed the authorized rate of return of 10%. As ofDecember 31, 2012, the deferred balance related to this storm event was $1.6 million.
On April 20, 2012, CH Energy Group, Central Hudson, Fortis, FortisUS Inc. ("FortisUS"), and Cascade Acquisition Sub Inc. ("Petitioners"), submitted a joint petition to thePSC for approval of the acquisition of CH Energy Group by Fortis and related transactions. The petition describes how the acquisition of Central Hudson by Fortis willproduce benefits for constituencies that include customers, employees and communities in Central Hudson's service territory as well as positive public benefits. The petitioncategorizes the public benefits into three major areas: 1) FortisUS' commitments and intention to preserve and build on the existing strength of Central Hudson, 2) mitigationof any potential negative aspects of the merger consistent with the PSC's disposition of specific issues that have arisen in prior utility merger proceedings in New York Stateand 3) identifiable monetary benefits resulting from assignment of costs to shareholders and cost savings made possible by the merger. The petition includes proposals andcommitments that effectively mitigate any potential risks to Central Hudson's customers from foreign holding company ownership and excess rate risk. The petitioners havequantified the economic value of the proposals in the merger to be in excess of $50 million. On January 25, 2013, a Joint Proposal with the Company, Fortis, PSC Staff,Multiple Intervenors, the Department of State Utility Intervention Unit, and Dutchess, Orange and Ulster counties as signatories, was submitted to the PSC. The signatoryparties have concluded that, based on the terms of the Settlement Agreement, the acquisition is in the public interest pursuant to the New York State Public Service Law,Section 70, and recommended approval by the Commission. While no assurance can be given, a PSC order regarding the Joint Proposal is expected in the second quarter of2013. Central Hudson believes the merger is in the public interest and should be approved on the basis of the proposals set forth in the petition. No assurance can be givenregarding the outcome of the matter at this time. See Item 7 - "Management's Discussion and Analysis of Financial Condition and Results of Operations" under the caption"Regulatory Matters – PSC Proceedings" for further discussion regarding the terms of the Joint Proposal and schedule.
-125-
Table of Contents
On October 29, 2012, Central Hudson's service territory was impacted by Superstorm Sandy, and approximately 103,000 electric customers were affected. The Sandy stormcosts were included in the estimate of $22 million storm costs identified in the $35 million of regulatory liabilities to be funded by Fortis. Consistent with the Joint Proposal,on February 6, 2013, Central Hudson filed a petition with the PSC seeking expedited Commission approval to recover $9.7 million of incremental electric storm restorationexpense, with carrying charges. These storm costs represent the amount Central Hudson deferred on its books as of December 31, 2012 based on actual costs incurred, billsreceived and an estimate for bills outstanding and are above the respective rate allowance during the twelve months ended June 30, 2013, which is the third rate yearestablished by the PSC in its approval of a Joint Proposal in Case 09-E-0588. The Company believes the incremental costs associated with this storm meet the PSC's criteriafor deferral: 1) the amount is incremental to the amount in rates; 2) the incremental amount is material and extraordinary in nature and 3) the utility's earnings are below theauthorized rate of return on common equity.
Other Regulatory Matters
Non-Utility Land Sales - Central Hudson
Central Hudson did not sell any parcels of non-utility property during 2012. Central Hudson had two property sales of non-utility real property resulting in $0.1 million inexcess of book value and transaction costs during the year-ended December 31, 2011. Central Hudson did not sell any parcels of non-utility property during 2010. Thisexcess is recorded as a reduction to Other Expenses of Operation on the Consolidated Statement of Income.
-126-
Table of Contents
NOTE 3 - New Accounting Guidance Newly adopted and soon to be adopted accounting guidance is summarized below, including explanations for any new guidance issued in 2012 (except that which is notcurrently applicable) and the expected impact on CH Energy Group and its subsidiaries.
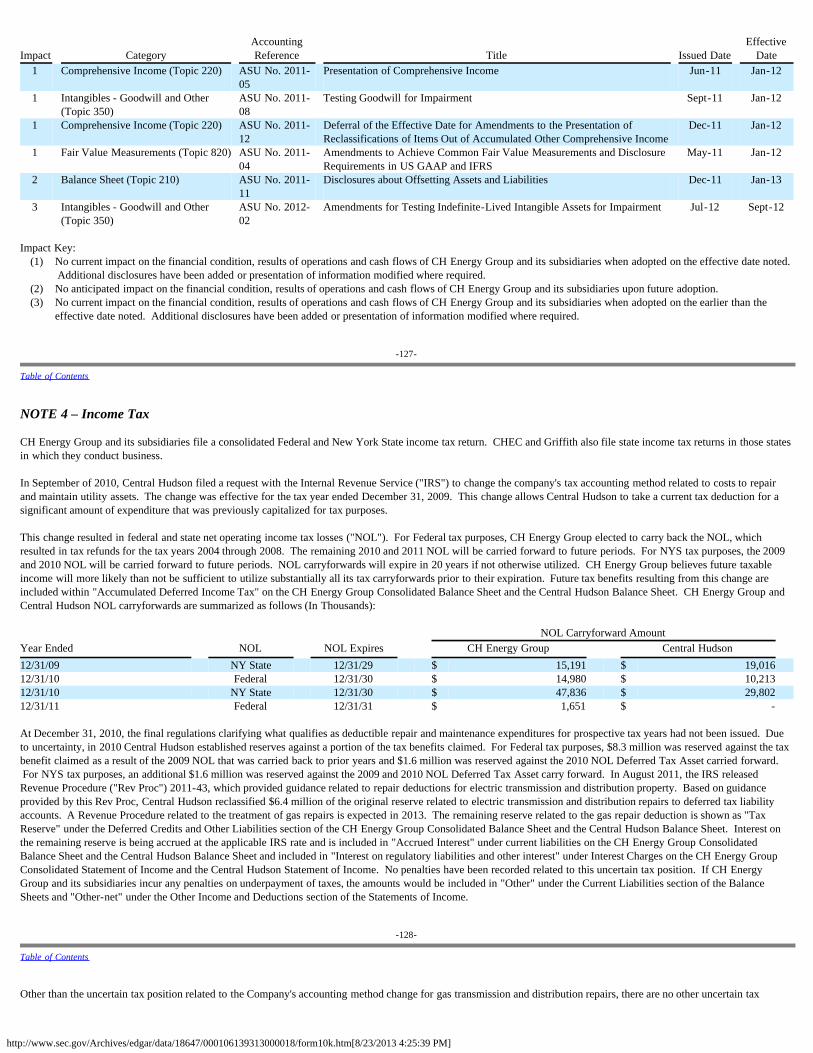
http://www.sec.gov/Archives/edgar/data/18647/000106139313000018/form10k.htm[8/23/2013 4:25:39 PM]
Impact Category AccountingReference Title Issued Date
EffectiveDate
1
Comprehensive Income (Topic 220)
ASU No. 2011-05
Presentation of Comprehensive Income
Jun-11 Jan-12
1
Intangibles - Goodwill and Other(Topic 350)
ASU No. 2011-08
Testing Goodwill for Impairment
Sept-11 Jan-12
1
Comprehensive Income (Topic 220)
ASU No. 2011-12
Deferral of the Effective Date for Amendments to the Presentation ofReclassifications of Items Out of Accumulated Other Comprehensive Income
Dec-11 Jan-12
1 Fair Value Measurements (Topic 820) ASU No. 2011-04
Amendments to Achieve Common Fair Value Measurements and DisclosureRequirements in US GAAP and IFRS
May-11 Jan-12
2 Balance Sheet (Topic 210) ASU No. 2011-11
Disclosures about Offsetting Assets and Liabilities Dec-11 Jan-13
3
Intangibles - Goodwill and Other(Topic 350)
ASU No. 2012-02
Amendments for Testing Indefinite-Lived Intangible Assets for Impairment
Jul-12 Sept-12
Impact Key:
(1) No current impact on the financial condition, results of operations and cash flows of CH Energy Group and its subsidiaries when adopted on the effective date noted. Additional disclosures have been added or presentation of information modified where required.
(2) No anticipated impact on the financial condition, results of operations and cash flows of CH Energy Group and its subsidiaries upon future adoption.(3) No current impact on the financial condition, results of operations and cash flows of CH Energy Group and its subsidiaries when adopted on the earlier than the
effective date noted. Additional disclosures have been added or presentation of information modified where required.
-127-
Table of Contents
NOTE 4 – Income Tax
CH Energy Group and its subsidiaries file a consolidated Federal and New York State income tax return. CHEC and Griffith also file state income tax returns in those statesin which they conduct business.
In September of 2010, Central Hudson filed a request with the Internal Revenue Service ("IRS") to change the company's tax accounting method related to costs to repairand maintain utility assets. The change was effective for the tax year ended December 31, 2009. This change allows Central Hudson to take a current tax deduction for asignificant amount of expenditure that was previously capitalized for tax purposes.
This change resulted in federal and state net operating income tax losses ("NOL"). For Federal tax purposes, CH Energy Group elected to carry back the NOL, whichresulted in tax refunds for the tax years 2004 through 2008. The remaining 2010 and 2011 NOL will be carried forward to future periods. For NYS tax purposes, the 2009and 2010 NOL will be carried forward to future periods. NOL carryforwards will expire in 20 years if not otherwise utilized. CH Energy Group believes future taxableincome will more likely than not be sufficient to utilize substantially all its tax carryforwards prior to their expiration. Future tax benefits resulting from this change areincluded within "Accumulated Deferred Income Tax" on the CH Energy Group Consolidated Balance Sheet and the Central Hudson Balance Sheet. CH Energy Group andCentral Hudson NOL carryforwards are summarized as follows (In Thousands): NOL Carryforward Amount Year Ended NOL NOL Expires CH Energy Group Central Hudson 12/31/09 NY State 12/31/29 $ 15,191 $ 19,016 12/31/10 Federal 12/31/30 $ 14,980 $ 10,213 12/31/10 NY State 12/31/30 $ 47,836 $ 29,802 12/31/11 Federal 12/31/31 $ 1,651 $ - At December 31, 2010, the final regulations clarifying what qualifies as deductible repair and maintenance expenditures for prospective tax years had not been issued. Dueto uncertainty, in 2010 Central Hudson established reserves against a portion of the tax benefits claimed. For Federal tax purposes, $8.3 million was reserved against the taxbenefit claimed as a result of the 2009 NOL that was carried back to prior years and $1.6 million was reserved against the 2010 NOL Deferred Tax Asset carried forward. For NYS tax purposes, an additional $1.6 million was reserved against the 2009 and 2010 NOL Deferred Tax Asset carry forward. In August 2011, the IRS releasedRevenue Procedure ("Rev Proc") 2011-43, which provided guidance related to repair deductions for electric transmission and distribution property. Based on guidanceprovided by this Rev Proc, Central Hudson reclassified $6.4 million of the original reserve related to electric transmission and distribution repairs to deferred tax liabilityaccounts. A Revenue Procedure related to the treatment of gas repairs is expected in 2013. The remaining reserve related to the gas repair deduction is shown as "TaxReserve" under the Deferred Credits and Other Liabilities section of the CH Energy Group Consolidated Balance Sheet and the Central Hudson Balance Sheet. Interest onthe remaining reserve is being accrued at the applicable IRS rate and is included in "Accrued Interest" under current liabilities on the CH Energy Group ConsolidatedBalance Sheet and the Central Hudson Balance Sheet and included in "Interest on regulatory liabilities and other interest" under Interest Charges on the CH Energy GroupConsolidated Statement of Income and the Central Hudson Statement of Income. No penalties have been recorded related to this uncertain tax position. If CH EnergyGroup and its subsidiaries incur any penalties on underpayment of taxes, the amounts would be included in "Other" under the Current Liabilities section of the BalanceSheets and "Other-net" under the Other Income and Deductions section of the Statements of Income.
-128-
Table of Contents
Other than the uncertain tax position related to the Company's accounting method change for gas transmission and distribution repairs, there are no other uncertain tax
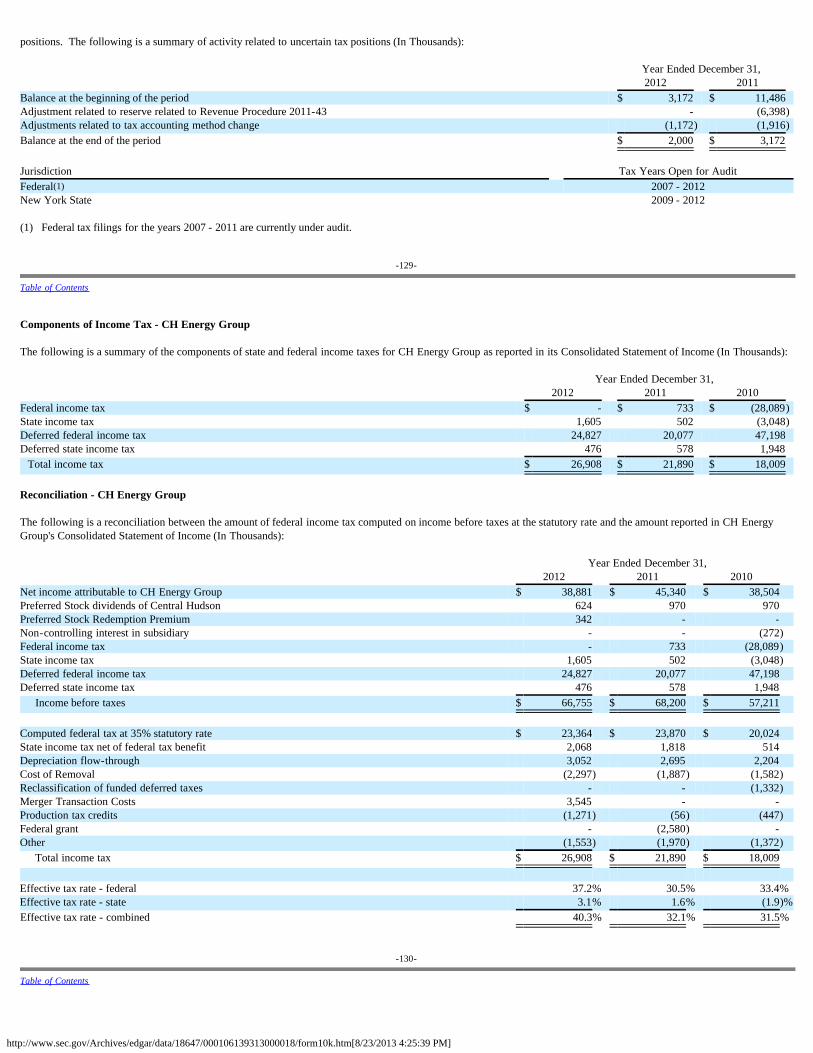
http://www.sec.gov/Archives/edgar/data/18647/000106139313000018/form10k.htm[8/23/2013 4:25:39 PM]
positions. The following is a summary of activity related to uncertain tax positions (In Thousands): Year Ended December 31, 2012 2011 Balance at the beginning of the period $ 3,172 $ 11,486 Adjustment related to reserve related to Revenue Procedure 2011-43 - (6,398)Adjustments related to tax accounting method change (1,172) (1,916)Balance at the end of the period $ 2,000 $ 3,172 Jurisdiction Tax Years Open for AuditFederal(1) 2007 - 2012New York State 2009 - 2012 (1) Federal tax filings for the years 2007 - 2011 are currently under audit.
-129-
Table of Contents
Components of Income Tax - CH Energy Group The following is a summary of the components of state and federal income taxes for CH Energy Group as reported in its Consolidated Statement of Income (In Thousands): Year Ended December 31, 2012 2011 2010 Federal income tax $ - $ 733 $ (28,089)State income tax 1,605 502 (3,048)Deferred federal income tax 24,827 20,077 47,198 Deferred state income tax 476 578 1,948 Total income tax $ 26,908 $ 21,890 $ 18,009 Reconciliation - CH Energy Group The following is a reconciliation between the amount of federal income tax computed on income before taxes at the statutory rate and the amount reported in CH EnergyGroup's Consolidated Statement of Income (In Thousands): Year Ended December 31, 2012 2011 2010 Net income attributable to CH Energy Group $ 38,881 $ 45,340 $ 38,504 Preferred Stock dividends of Central Hudson 624 970 970 Preferred Stock Redemption Premium 342 - - Non-controlling interest in subsidiary - - (272)Federal income tax - 733 (28,089)State income tax 1,605 502 (3,048)Deferred federal income tax 24,827 20,077 47,198 Deferred state income tax 476 578 1,948
Income before taxes $ 66,755 $ 68,200 $ 57,211 Computed federal tax at 35% statutory rate $ 23,364 $ 23,870 $ 20,024 State income tax net of federal tax benefit 2,068 1,818 514 Depreciation flow-through 3,052 2,695 2,204 Cost of Removal (2,297) (1,887) (1,582)Reclassification of funded deferred taxes - - (1,332)Merger Transaction Costs 3,545 - - Production tax credits (1,271) (56) (447)Federal grant - (2,580) - Other (1,553) (1,970) (1,372)
Total income tax $ 26,908 $ 21,890 $ 18,009 Effective tax rate - federal 37.2% 30.5% 33.4%Effective tax rate - state 3.1% 1.6% (1.9)%Effective tax rate - combined 40.3% 32.1% 31.5%
-130-
Table of Contents
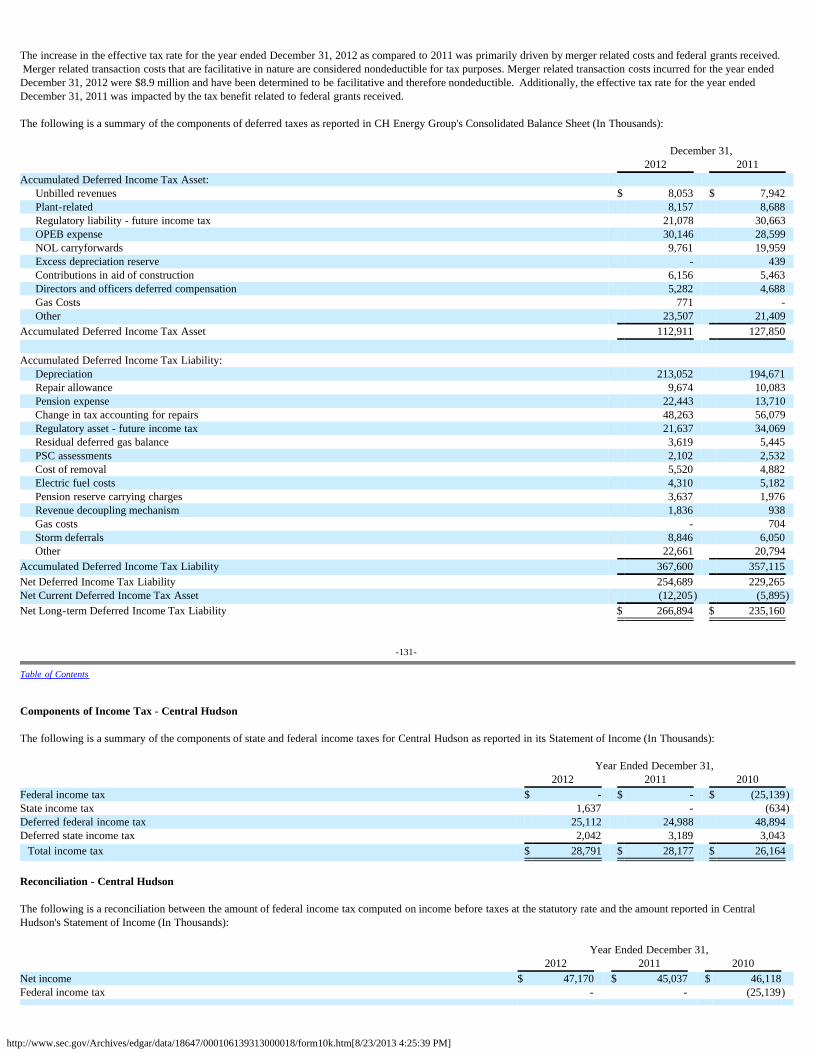
http://www.sec.gov/Archives/edgar/data/18647/000106139313000018/form10k.htm[8/23/2013 4:25:39 PM]
The increase in the effective tax rate for the year ended December 31, 2012 as compared to 2011 was primarily driven by merger related costs and federal grants received. Merger related transaction costs that are facilitative in nature are considered nondeductible for tax purposes. Merger related transaction costs incurred for the year endedDecember 31, 2012 were $8.9 million and have been determined to be facilitative and therefore nondeductible. Additionally, the effective tax rate for the year endedDecember 31, 2011 was impacted by the tax benefit related to federal grants received. The following is a summary of the components of deferred taxes as reported in CH Energy Group's Consolidated Balance Sheet (In Thousands): December 31, 2012 2011 Accumulated Deferred Income Tax Asset:
Unbilled revenues $ 8,053 $ 7,942 Plant-related 8,157 8,688 Regulatory liability - future income tax 21,078 30,663 OPEB expense 30,146 28,599 NOL carryforwards 9,761 19,959 Excess depreciation reserve - 439Contributions in aid of construction 6,156 5,463 Directors and officers deferred compensation 5,282 4,688 Gas Costs 771 - Other 23,507 21,409
Accumulated Deferred Income Tax Asset 112,911 127,850 Accumulated Deferred Income Tax Liability:
Depreciation 213,052 194,671 Repair allowance 9,674 10,083 Pension expense 22,443 13,710 Change in tax accounting for repairs 48,263 56,079 Regulatory asset - future income tax 21,637 34,069 Residual deferred gas balance 3,619 5,445 PSC assessments 2,102 2,532 Cost of removal 5,520 4,882 Electric fuel costs 4,310 5,182 Pension reserve carrying charges 3,637 1,976 Revenue decoupling mechanism 1,836 938 Gas costs - 704 Storm deferrals 8,846 6,050 Other 22,661 20,794
Accumulated Deferred Income Tax Liability 367,600 357,115 Net Deferred Income Tax Liability 254,689 229,265 Net Current Deferred Income Tax Asset (12,205) (5,895)Net Long-term Deferred Income Tax Liability $ 266,894 $ 235,160
-131-
Table of Contents
Components of Income Tax - Central Hudson The following is a summary of the components of state and federal income taxes for Central Hudson as reported in its Statement of Income (In Thousands): Year Ended December 31, 2012 2011 2010 Federal income tax $ - $ - $ (25,139)State income tax 1,637 - (634)Deferred federal income tax 25,112 24,988 48,894 Deferred state income tax 2,042 3,189 3,043 Total income tax $ 28,791 $ 28,177 $ 26,164 Reconciliation - Central Hudson The following is a reconciliation between the amount of federal income tax computed on income before taxes at the statutory rate and the amount reported in CentralHudson's Statement of Income (In Thousands): Year Ended December 31, 2012 2011 2010 Net income $ 47,170 $ 45,037 $ 46,118 Federal income tax - - (25,139)
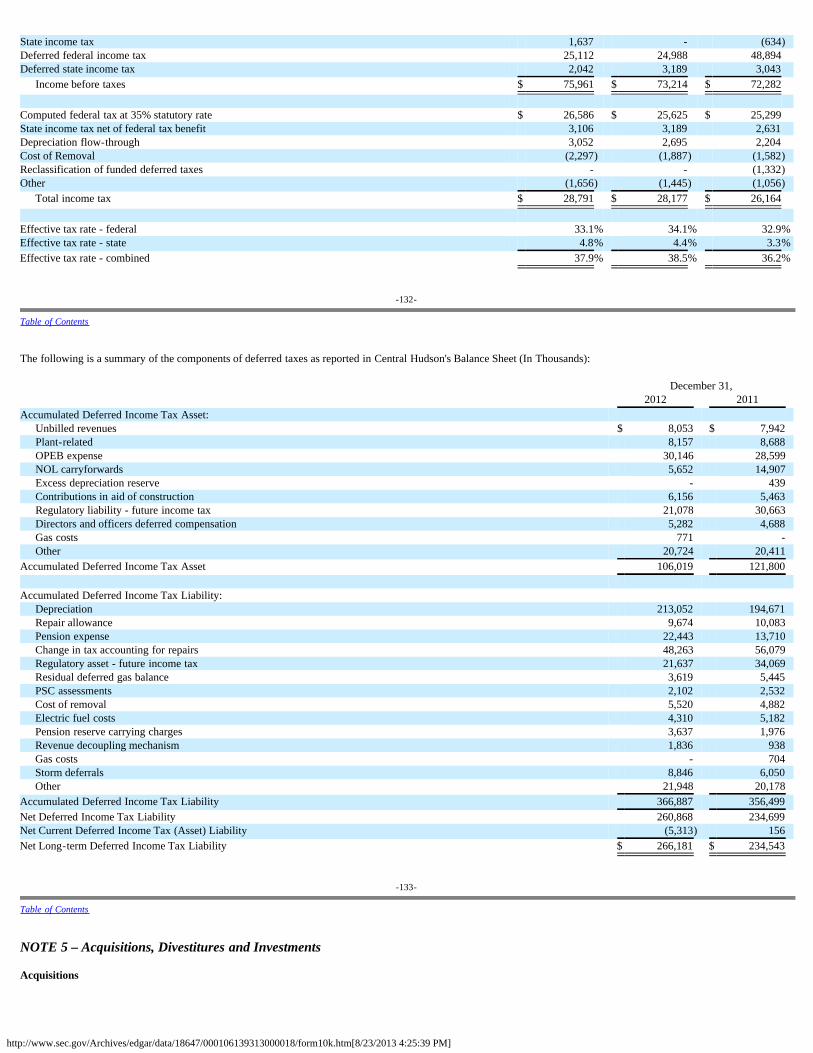
http://www.sec.gov/Archives/edgar/data/18647/000106139313000018/form10k.htm[8/23/2013 4:25:39 PM]
State income tax 1,637 - (634)Deferred federal income tax 25,112 24,988 48,894 Deferred state income tax 2,042 3,189 3,043
Income before taxes $ 75,961 $ 73,214 $ 72,282 Computed federal tax at 35% statutory rate $ 26,586 $ 25,625 $ 25,299 State income tax net of federal tax benefit 3,106 3,189 2,631 Depreciation flow-through 3,052 2,695 2,204 Cost of Removal (2,297) (1,887) (1,582)Reclassification of funded deferred taxes - - (1,332)Other (1,656) (1,445) (1,056)
Total income tax $ 28,791 $ 28,177 $ 26,164 Effective tax rate - federal 33.1% 34.1% 32.9%Effective tax rate - state 4.8% 4.4% 3.3% Effective tax rate - combined 37.9% 38.5% 36.2%
-132-
Table of Contents
The following is a summary of the components of deferred taxes as reported in Central Hudson's Balance Sheet (In Thousands): December 31, 2012 2011 Accumulated Deferred Income Tax Asset:
Unbilled revenues $ 8,053 $ 7,942 Plant-related 8,157 8,688 OPEB expense 30,146 28,599 NOL carryforwards 5,652 14,907 Excess depreciation reserve - 439 Contributions in aid of construction 6,156 5,463 Regulatory liability - future income tax 21,078 30,663 Directors and officers deferred compensation 5,282 4,688 Gas costs 771 - Other 20,724 20,411
Accumulated Deferred Income Tax Asset 106,019 121,800 Accumulated Deferred Income Tax Liability:
Depreciation 213,052 194,671 Repair allowance 9,674 10,083 Pension expense 22,443 13,710 Change in tax accounting for repairs 48,263 56,079 Regulatory asset - future income tax 21,637 34,069 Residual deferred gas balance 3,619 5,445 PSC assessments 2,102 2,532 Cost of removal 5,520 4,882 Electric fuel costs 4,310 5,182 Pension reserve carrying charges 3,637 1,976 Revenue decoupling mechanism 1,836 938 Gas costs - 704 Storm deferrals 8,846 6,050 Other 21,948 20,178
Accumulated Deferred Income Tax Liability 366,887 356,499 Net Deferred Income Tax Liability 260,868 234,699 Net Current Deferred Income Tax (Asset) Liability (5,313) 156 Net Long-term Deferred Income Tax Liability $ 266,181 $ 234,543
-133-
Table of Contents
NOTE 5 – Acquisitions, Divestitures and Investments
Acquisitions
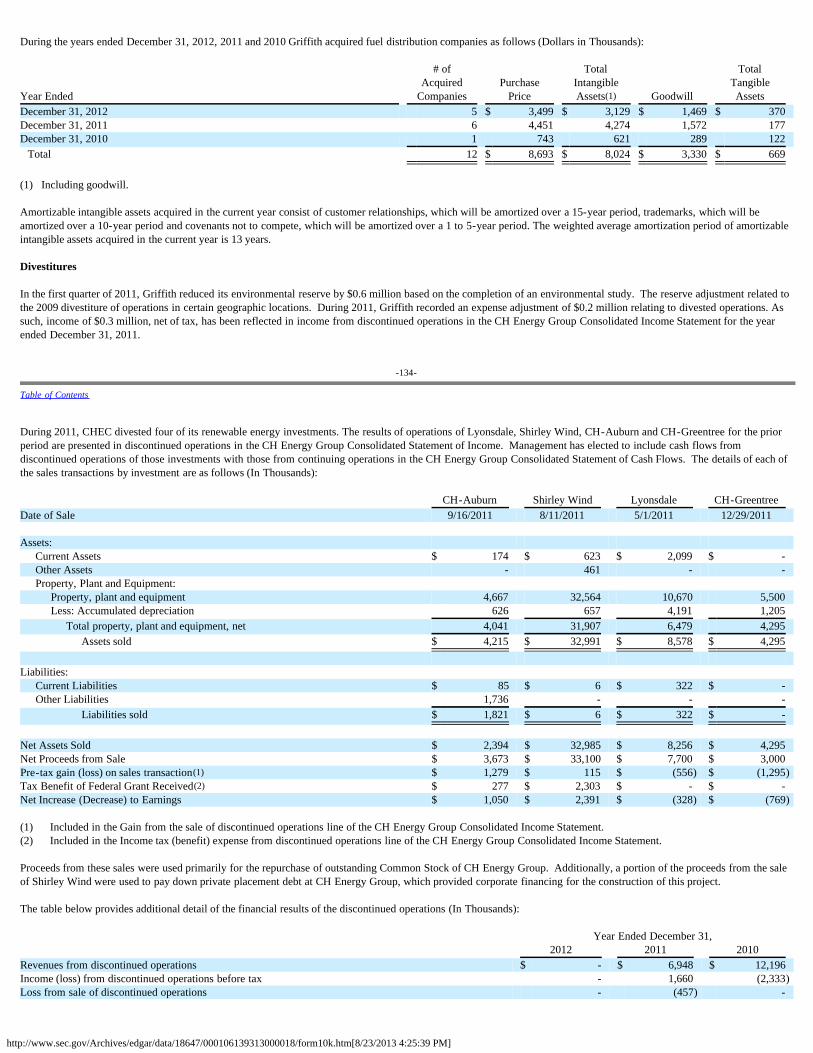
http://www.sec.gov/Archives/edgar/data/18647/000106139313000018/form10k.htm[8/23/2013 4:25:39 PM]
During the years ended December 31, 2012, 2011 and 2010 Griffith acquired fuel distribution companies as follows (Dollars in Thousands): # of Total Total
Acquired Purchase Intangible Tangible Year Ended Companies Price Assets(1) Goodwill Assets December 31, 2012 5 $ 3,499 $ 3,129 $ 1,469 $ 370 December 31, 2011 6 4,451 4,274 1,572 177 December 31, 2010 1 743 621 289 122 Total 12 $ 8,693 $ 8,024 $ 3,330 $ 669 (1) Including goodwill. Amortizable intangible assets acquired in the current year consist of customer relationships, which will be amortized over a 15-year period, trademarks, which will beamortized over a 10-year period and covenants not to compete, which will be amortized over a 1 to 5-year period. The weighted average amortization period of amortizableintangible assets acquired in the current year is 13 years.
Divestitures
In the first quarter of 2011, Griffith reduced its environmental reserve by $0.6 million based on the completion of an environmental study. The reserve adjustment related tothe 2009 divestiture of operations in certain geographic locations. During 2011, Griffith recorded an expense adjustment of $0.2 million relating to divested operations. Assuch, income of $0.3 million, net of tax, has been reflected in income from discontinued operations in the CH Energy Group Consolidated Income Statement for the yearended December 31, 2011.
-134-
Table of Contents
During 2011, CHEC divested four of its renewable energy investments. The results of operations of Lyonsdale, Shirley Wind, CH-Auburn and CH-Greentree for the priorperiod are presented in discontinued operations in the CH Energy Group Consolidated Statement of Income. Management has elected to include cash flows fromdiscontinued operations of those investments with those from continuing operations in the CH Energy Group Consolidated Statement of Cash Flows. The details of each ofthe sales transactions by investment are as follows (In Thousands): CH-Auburn Shirley Wind Lyonsdale CH-Greentree Date of Sale 9/16/2011 8/11/2011 5/1/2011 12/29/2011 Assets:
Current Assets $ 174 $ 623 $ 2,099 $ - Other Assets - 461 - - Property, Plant and Equipment:
Property, plant and equipment 4,667 32,564 10,670 5,500 Less: Accumulated depreciation 626 657 4,191 1,205
Total property, plant and equipment, net 4,041 31,907 6,479 4,295 Assets sold $ 4,215 $ 32,991 $ 8,578 $ 4,295
Liabilities:
Current Liabilities $ 85 $ 6 $ 322 $ - Other Liabilities 1,736 - - -
Liabilities sold $ 1,821 $ 6 $ 322 $ - Net Assets Sold $ 2,394 $ 32,985 $ 8,256 $ 4,295 Net Proceeds from Sale $ 3,673 $ 33,100 $ 7,700 $ 3,000 Pre-tax gain (loss) on sales transaction(1) $ 1,279 $ 115 $ (556) $ (1,295)Tax Benefit of Federal Grant Received(2) $ 277 $ 2,303 $ - $ - Net Increase (Decrease) to Earnings $ 1,050 $ 2,391 $ (328) $ (769) (1) Included in the Gain from the sale of discontinued operations line of the CH Energy Group Consolidated Income Statement.(2) Included in the Income tax (benefit) expense from discontinued operations line of the CH Energy Group Consolidated Income Statement. Proceeds from these sales were used primarily for the repurchase of outstanding Common Stock of CH Energy Group. Additionally, a portion of the proceeds from the saleof Shirley Wind were used to pay down private placement debt at CH Energy Group, which provided corporate financing for the construction of this project. The table below provides additional detail of the financial results of the discontinued operations (In Thousands): Year Ended December 31, 2012 2011 2010 Revenues from discontinued operations $ - $ 6,948 $ 12,196 Income (loss) from discontinued operations before tax - 1,660 (2,333)Loss from sale of discontinued operations - (457) -
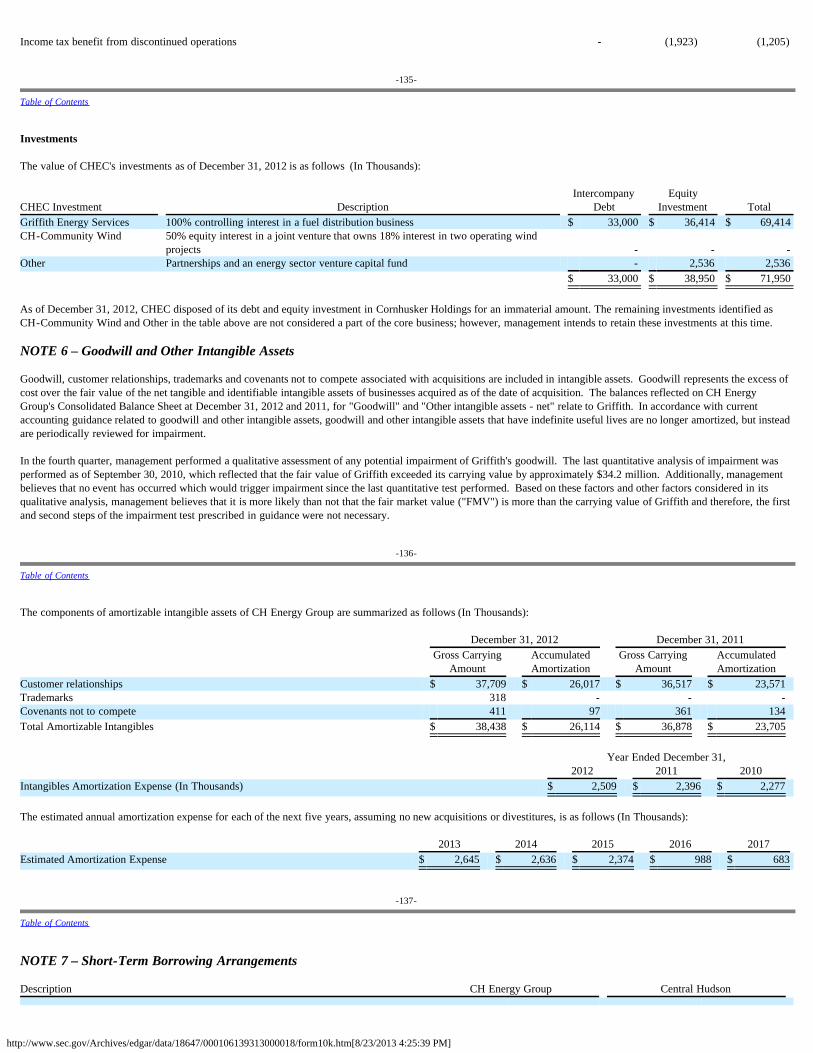
http://www.sec.gov/Archives/edgar/data/18647/000106139313000018/form10k.htm[8/23/2013 4:25:39 PM]
Income tax benefit from discontinued operations - (1,923) (1,205)
-135-
Table of Contents
Investments The value of CHEC's investments as of December 31, 2012 is as follows (In Thousands):
CHEC Investment Description Intercompany
Debt Equity
Investment TotalGriffith Energy Services 100% controlling interest in a fuel distribution business $ 33,000 $ 36,414 $ 69,414 CH-Community Wind 50% equity interest in a joint venture that owns 18% interest in two operating wind
projects 1 - - - Other Partnerships and an energy sector venture capital fund - 2,536 2,536
$ 33,000 $ 38,950 $ 71,950 As of December 31, 2012, CHEC disposed of its debt and equity investment in Cornhusker Holdings for an immaterial amount. The remaining investments identified asCH-Community Wind and Other in the table above are not considered a part of the core business; however, management intends to retain these investments at this time. NOTE 6 – Goodwill and Other Intangible Assets
Goodwill, customer relationships, trademarks and covenants not to compete associated with acquisitions are included in intangible assets. Goodwill represents the excess ofcost over the fair value of the net tangible and identifiable intangible assets of businesses acquired as of the date of acquisition. The balances reflected on CH EnergyGroup's Consolidated Balance Sheet at December 31, 2012 and 2011, for "Goodwill" and "Other intangible assets - net" relate to Griffith. In accordance with currentaccounting guidance related to goodwill and other intangible assets, goodwill and other intangible assets that have indefinite useful lives are no longer amortized, but insteadare periodically reviewed for impairment.
In the fourth quarter, management performed a qualitative assessment of any potential impairment of Griffith's goodwill. The last quantitative analysis of impairment wasperformed as of September 30, 2010, which reflected that the fair value of Griffith exceeded its carrying value by approximately $34.2 million. Additionally, managementbelieves that no event has occurred which would trigger impairment since the last quantitative test performed. Based on these factors and other factors considered in itsqualitative analysis, management believes that it is more likely than not that the fair market value ("FMV") is more than the carrying value of Griffith and therefore, the firstand second steps of the impairment test prescribed in guidance were not necessary.
-136-
Table of Contents
The components of amortizable intangible assets of CH Energy Group are summarized as follows (In Thousands): December 31, 2012 December 31, 2011
Gross Carrying
Amount AccumulatedAmortization
Gross CarryingAmount
AccumulatedAmortization
Customer relationships $ 37,709 $ 26,017 $ 36,517 $ 23,571 Trademarks 318 - - - Covenants not to compete 411 97 361 134 Total Amortizable Intangibles $ 38,438 $ 26,114 $ 36,878 $ 23,705 Year Ended December 31, 2012 2011 2010 Intangibles Amortization Expense (In Thousands) $ 2,509 $ 2,396 $ 2,277 The estimated annual amortization expense for each of the next five years, assuming no new acquisitions or divestitures, is as follows (In Thousands): 2013 2014 2015 2016 2017 Estimated Amortization Expense $ 2,645 $ 2,636 $ 2,374 $ 988 $ 683
-137-
Table of Contents
NOTE 7 – Short-Term Borrowing Arrangements Description CH Energy Group Central Hudson
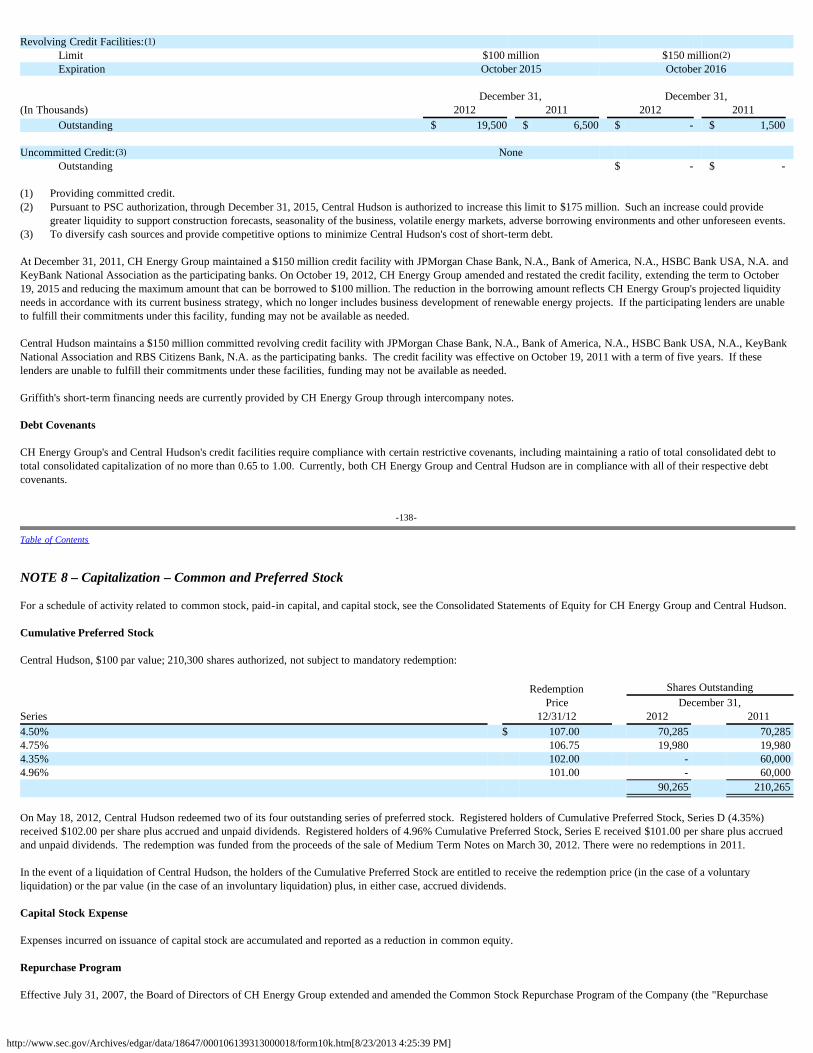
http://www.sec.gov/Archives/edgar/data/18647/000106139313000018/form10k.htm[8/23/2013 4:25:39 PM]
Revolving Credit Facilities:(1) Limit $100 million $150 million(2) Expiration October 2015 October 2016
December 31, December 31, (In Thousands) 2012 2011 2012 2011
Outstanding $ 19,500 $ 6,500 $ - $ 1,500 Uncommitted Credit:(3) None
Outstanding $ - $ - (1) Providing committed credit.(2) Pursuant to PSC authorization, through December 31, 2015, Central Hudson is authorized to increase this limit to $175 million. Such an increase could provide
greater liquidity to support construction forecasts, seasonality of the business, volatile energy markets, adverse borrowing environments and other unforeseen events.(3) To diversify cash sources and provide competitive options to minimize Central Hudson's cost of short-term debt. At December 31, 2011, CH Energy Group maintained a $150 million credit facility with JPMorgan Chase Bank, N.A., Bank of America, N.A., HSBC Bank USA, N.A. andKeyBank National Association as the participating banks. On October 19, 2012, CH Energy Group amended and restated the credit facility, extending the term to October19, 2015 and reducing the maximum amount that can be borrowed to $100 million. The reduction in the borrowing amount reflects CH Energy Group's projected liquidityneeds in accordance with its current business strategy, which no longer includes business development of renewable energy projects. If the participating lenders are unableto fulfill their commitments under this facility, funding may not be available as needed.
Central Hudson maintains a $150 million committed revolving credit facility with JPMorgan Chase Bank, N.A., Bank of America, N.A., HSBC Bank USA, N.A., KeyBankNational Association and RBS Citizens Bank, N.A. as the participating banks. The credit facility was effective on October 19, 2011 with a term of five years. If theselenders are unable to fulfill their commitments under these facilities, funding may not be available as needed.
Griffith's short-term financing needs are currently provided by CH Energy Group through intercompany notes.
Debt Covenants
CH Energy Group's and Central Hudson's credit facilities require compliance with certain restrictive covenants, including maintaining a ratio of total consolidated debt tototal consolidated capitalization of no more than 0.65 to 1.00. Currently, both CH Energy Group and Central Hudson are in compliance with all of their respective debtcovenants.
-138-
Table of Contents
NOTE 8 – Capitalization – Common and Preferred Stock
For a schedule of activity related to common stock, paid-in capital, and capital stock, see the Consolidated Statements of Equity for CH Energy Group and Central Hudson. Cumulative Preferred Stock Central Hudson, $100 par value; 210,300 shares authorized, not subject to mandatory redemption: Redemption Shares Outstanding Price December 31,Series 12/31/12 2012 2011 4.50% $ 107.00 70,285 70,285 4.75% 106.75 19,980 19,980 4.35% 102.00 - 60,000 4.96% 101.00 - 60,000 90,265 210,265 On May 18, 2012, Central Hudson redeemed two of its four outstanding series of preferred stock. Registered holders of Cumulative Preferred Stock, Series D (4.35%)received $102.00 per share plus accrued and unpaid dividends. Registered holders of 4.96% Cumulative Preferred Stock, Series E received $101.00 per share plus accruedand unpaid dividends. The redemption was funded from the proceeds of the sale of Medium Term Notes on March 30, 2012. There were no redemptions in 2011.
In the event of a liquidation of Central Hudson, the holders of the Cumulative Preferred Stock are entitled to receive the redemption price (in the case of a voluntaryliquidation) or the par value (in the case of an involuntary liquidation) plus, in either case, accrued dividends. Capital Stock Expense
Expenses incurred on issuance of capital stock are accumulated and reported as a reduction in common equity.
Repurchase Program
Effective July 31, 2007, the Board of Directors of CH Energy Group extended and amended the Common Stock Repurchase Program of the Company (the "Repurchase
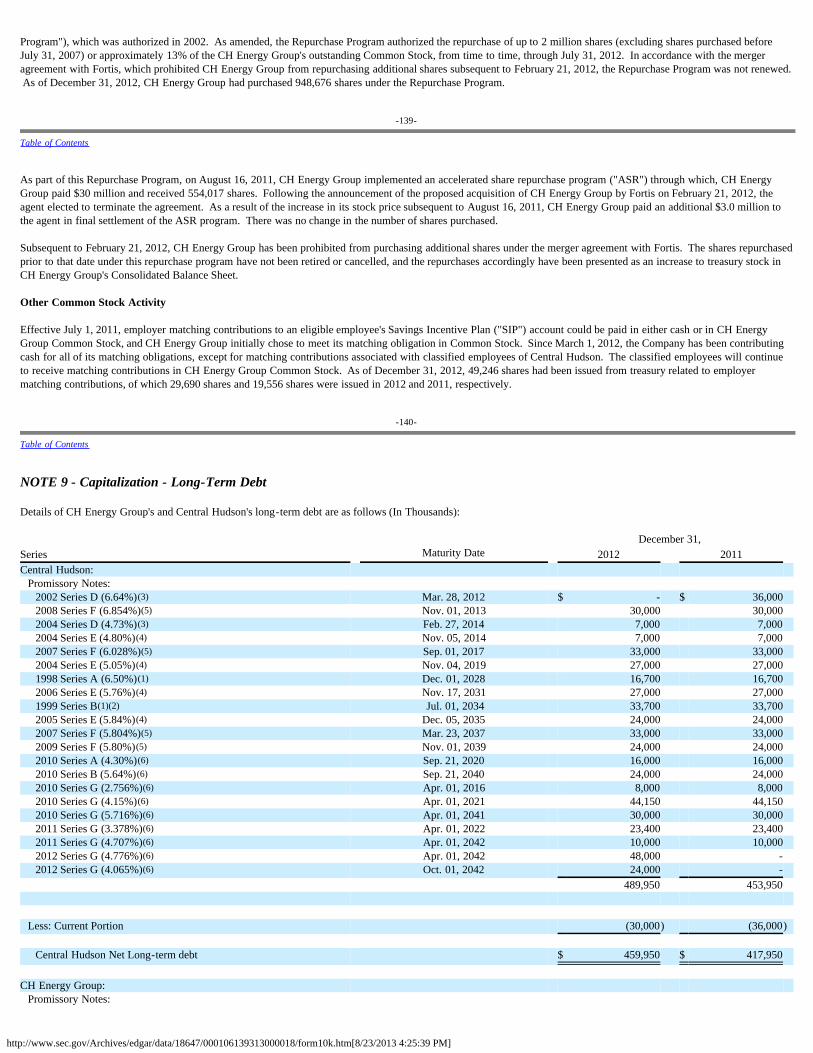
http://www.sec.gov/Archives/edgar/data/18647/000106139313000018/form10k.htm[8/23/2013 4:25:39 PM]
Program"), which was authorized in 2002. As amended, the Repurchase Program authorized the repurchase of up to 2 million shares (excluding shares purchased beforeJuly 31, 2007) or approximately 13% of the CH Energy Group's outstanding Common Stock, from time to time, through July 31, 2012. In accordance with the mergeragreement with Fortis, which prohibited CH Energy Group from repurchasing additional shares subsequent to February 21, 2012, the Repurchase Program was not renewed. As of December 31, 2012, CH Energy Group had purchased 948,676 shares under the Repurchase Program.
-139-
Table of Contents
As part of this Repurchase Program, on August 16, 2011, CH Energy Group implemented an accelerated share repurchase program ("ASR") through which, CH EnergyGroup paid $30 million and received 554,017 shares. Following the announcement of the proposed acquisition of CH Energy Group by Fortis on February 21, 2012, theagent elected to terminate the agreement. As a result of the increase in its stock price subsequent to August 16, 2011, CH Energy Group paid an additional $3.0 million tothe agent in final settlement of the ASR program. There was no change in the number of shares purchased. Subsequent to February 21, 2012, CH Energy Group has been prohibited from purchasing additional shares under the merger agreement with Fortis. The shares repurchasedprior to that date under this repurchase program have not been retired or cancelled, and the repurchases accordingly have been presented as an increase to treasury stock inCH Energy Group's Consolidated Balance Sheet.
Other Common Stock Activity
Effective July 1, 2011, employer matching contributions to an eligible employee's Savings Incentive Plan ("SIP") account could be paid in either cash or in CH EnergyGroup Common Stock, and CH Energy Group initially chose to meet its matching obligation in Common Stock. Since March 1, 2012, the Company has been contributingcash for all of its matching obligations, except for matching contributions associated with classified employees of Central Hudson. The classified employees will continueto receive matching contributions in CH Energy Group Common Stock. As of December 31, 2012, 49,246 shares had been issued from treasury related to employermatching contributions, of which 29,690 shares and 19,556 shares were issued in 2012 and 2011, respectively.
-140-
Table of Contents
NOTE 9 - Capitalization - Long-Term Debt Details of CH Energy Group's and Central Hudson's long-term debt are as follows (In Thousands): December 31, Series Maturity Date 2012 2011 Central Hudson: Promissory Notes: 2002 Series D (6.64%)(3) Mar. 28, 2012 $ - $ 36,000 2008 Series F (6.854%)(5) Nov. 01, 2013 30,000 30,000 2004 Series D (4.73%)(3) Feb. 27, 2014 7,000 7,000 2004 Series E (4.80%)(4) Nov. 05, 2014 7,000 7,000 2007 Series F (6.028%)(5) Sep. 01, 2017 33,000 33,000 2004 Series E (5.05%)(4) Nov. 04, 2019 27,000 27,000 1998 Series A (6.50%)(1) Dec. 01, 2028 16,700 16,700 2006 Series E (5.76%)(4) Nov. 17, 2031 27,000 27,000 1999 Series B(1)(2) Jul. 01, 2034 33,700 33,700 2005 Series E (5.84%)(4) Dec. 05, 2035 24,000 24,000 2007 Series F (5.804%)(5) Mar. 23, 2037 33,000 33,000 2009 Series F (5.80%)(5) Nov. 01, 2039 24,000 24,000 2010 Series A (4.30%)(6) Sep. 21, 2020 16,000 16,000 2010 Series B (5.64%)(6) Sep. 21, 2040 24,000 24,000 2010 Series G (2.756%)(6) Apr. 01, 2016 8,000 8,000 2010 Series G (4.15%)(6) Apr. 01, 2021 44,150 44,150 2010 Series G (5.716%)(6) Apr. 01, 2041 30,000 30,000 2011 Series G (3.378%)(6) Apr. 01, 2022 23,400 23,400 2011 Series G (4.707%)(6) Apr. 01, 2042 10,000 10,000 2012 Series G (4.776%)(6) Apr. 01, 2042 48,000 - 2012 Series G (4.065%)(6) Oct. 01, 2042 24,000 - 489,950 453,950 Less: Current Portion (30,000) (36,000) Central Hudson Net Long-term debt $ 459,950 $ 417,950 CH Energy Group: Promissory Notes:
http://www.sec.gov/Archives/edgar/data/18647/000106139313000018/form10k.htm[8/23/2013 4:25:39 PM]
2009 Series A (6.58%) Apr. 17, 2014 $ 6,500 $ 6,500 2009 Series B (6.80%) Dec. 15, 2025 21,552 22,559
Less: Current Portion (1,076) (1,006) CH Energy Group Net Long-term debt $ 486,926 $ 446,003 (1) Promissory Notes issued in connection with the sale by NYSERDA of tax-exempt pollution control revenue bonds.(2) Variable (auction) rate notes.(3) Issued pursuant to a 2001 PSC Order approving the issuance by Central Hudson prior to June 30, 2004, of up to $100 million of unsecured medium-term notes.(4) Issued pursuant to a 2004 PSC Order approving the issuance by Central Hudson prior to December 31, 2006, of up to $85 million of unsecured medium-term notes.(5) Issued pursuant to a 2006 PSC Order approving the issuance by Central Hudson prior to December 31, 2009, of up to $120 million of unsecured medium-term notes.(6) Issued pursuant to a 2009 PSC Order approving the issuance by Central Hudson prior to December 31, 2012, of up to $250 million of unsecured medium-term notes or
other forms of long-term indebtedness. Griffith had no third-party long-term debt outstanding as of December 31, 2012 or 2011.
-141-
Table of Contents
Long-Term Debt Maturities
See Note 15 - "Fair Value Measurements" for a schedule of long-term debt maturing or to be redeemed during the next five years and thereafter.
On September 22, 2009, the PSC authorized Central Hudson to issue up to $250 million of long-term debt through December 31, 2012 to finance its constructionexpenditures, refund maturing long-term debt, and potentially refinance its 1999 NYSERDA Bonds, Series B. On November 20, 2009, Central Hudson registered a newseries of notes, Series G, pursuant to the authority granted by the PSC. An amended registration statement was filed on December 23, 2009 and the registration of the SeriesG notes became effective on January 6, 2010.
On September 14, 2012, the PSC authorized Central Hudson to enter into a multi-year committed credit up to $175 million and to issue up to $250 million of long-term debtthrough December 31, 2015. The Order authorized Central Hudson to issue the long-term debt to finance its construction expenditures, refund maturing long-term debt,redeem existing callable debt and preferred stock, and refinance its 1999 NYSERDA Bonds, Series B.
NYSERDA
Central Hudson's outstanding Series B NYSERDA Bonds total $33.7 million at December 31, 2012. These bonds are tax-exempt multi-modal bonds that are currently in avariable rate mode. In its Orders, the PSC has authorized deferral accounting treatment for variations in the interest costs from these bonds. As such, variations between theactual interest rates on these bonds and the interest rate included in the current delivery rate structure for these bonds are deferred for future recovery from or refund tocustomers and therefore do not impact earnings.
To mitigate the potential cash flow impact from unexpected increases in short-term interest rates on Series B NYSERDA Bonds, on March 28, 2012, Central Hudsonpurchased an interest rate cap based on an index of short-term tax-exempt debt. The rate cap is two years in length with a notional amount aligned with Series B and willexpire on April 1, 2014. The cap is based on the monthly weighted average of an index of tax-exempt variable rate debt, multiplied by 175%. Central Hudson wouldreceive a payout if the adjusted index exceeds 5.0% for a given month. The rate cap replaced an expiring rate cap with substantially similar terms. See Note 14 –"Accounting for Derivative Instruments and Hedging Activities" for fair value disclosures related to this instrument.
Central Hudson is currently evaluating what actions, if any, it may take in the future in connection with its Series B NYSERDA Bonds. Potential actions may includeconverting the debt to another interest rate mode or refinancing with taxable bonds.
-142-
Table of Contents
Debt Expense
Expenses incurred in connection with CH Energy Group's or Central Hudson's debt issuance and any discount or premium on debt are deferred and amortized over the livesof the related issues. Expenses incurred and unamortized costs written off on redemptions of Central Hudson's debt prior to maturity have been deferred and are amortizedover the remaining lives of the related extinguished issues, as directed by the PSC.
Debt Covenants
CH Energy Group's $28.1 million of privately placed notes require compliance with certain restrictive covenants including maintaining a ratio of total consolidated debt tototal consolidated capitalization of no more than 0.65 to 1.00 and not permitting certain debt, other than the privately placed notes, associated with the unregulatedoperations of CH Energy Group to exceed 10% of total consolidated assets. Currently, CH Energy Group is in compliance with all of these debt covenants.
NOTE 10 – Post-Employment Benefits
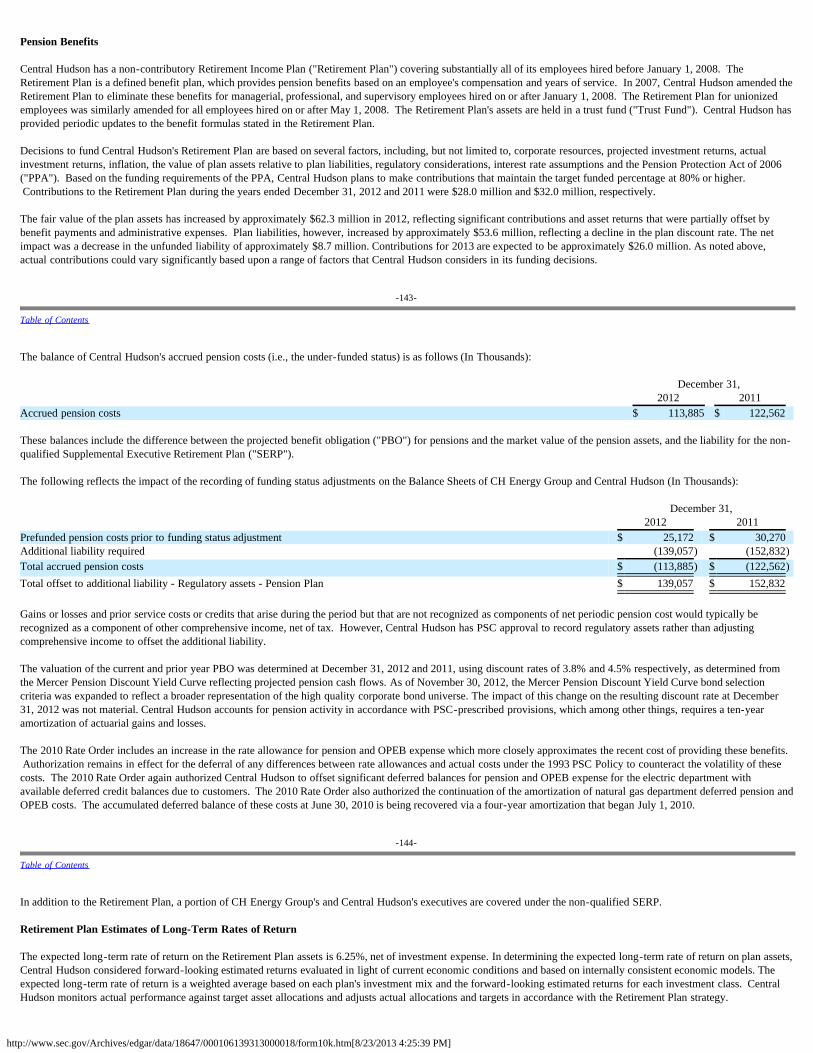
http://www.sec.gov/Archives/edgar/data/18647/000106139313000018/form10k.htm[8/23/2013 4:25:39 PM]
Pension Benefits
Central Hudson has a non-contributory Retirement Income Plan ("Retirement Plan") covering substantially all of its employees hired before January 1, 2008. TheRetirement Plan is a defined benefit plan, which provides pension benefits based on an employee's compensation and years of service. In 2007, Central Hudson amended theRetirement Plan to eliminate these benefits for managerial, professional, and supervisory employees hired on or after January 1, 2008. The Retirement Plan for unionizedemployees was similarly amended for all employees hired on or after May 1, 2008. The Retirement Plan's assets are held in a trust fund ("Trust Fund"). Central Hudson hasprovided periodic updates to the benefit formulas stated in the Retirement Plan.
Decisions to fund Central Hudson's Retirement Plan are based on several factors, including, but not limited to, corporate resources, projected investment returns, actualinvestment returns, inflation, the value of plan assets relative to plan liabilities, regulatory considerations, interest rate assumptions and the Pension Protection Act of 2006("PPA"). Based on the funding requirements of the PPA, Central Hudson plans to make contributions that maintain the target funded percentage at 80% or higher. Contributions to the Retirement Plan during the years ended December 31, 2012 and 2011 were $28.0 million and $32.0 million, respectively.
The fair value of the plan assets has increased by approximately $62.3 million in 2012, reflecting significant contributions and asset returns that were partially offset bybenefit payments and administrative expenses. Plan liabilities, however, increased by approximately $53.6 million, reflecting a decline in the plan discount rate. The netimpact was a decrease in the unfunded liability of approximately $8.7 million. Contributions for 2013 are expected to be approximately $26.0 million. As noted above,actual contributions could vary significantly based upon a range of factors that Central Hudson considers in its funding decisions.
-143-
Table of Contents
The balance of Central Hudson's accrued pension costs (i.e., the under-funded status) is as follows (In Thousands): December 31,
2012 2011 Accrued pension costs $ 113,885 $ 122,562 These balances include the difference between the projected benefit obligation ("PBO") for pensions and the market value of the pension assets, and the liability for the non-qualified Supplemental Executive Retirement Plan ("SERP"). The following reflects the impact of the recording of funding status adjustments on the Balance Sheets of CH Energy Group and Central Hudson (In Thousands): December 31,
2012 2011 Prefunded pension costs prior to funding status adjustment $ 25,172 $ 30,270 Additional liability required (139,057) (152,832)Total accrued pension costs $ (113,885) $ (122,562)Total offset to additional liability - Regulatory assets - Pension Plan $ 139,057 $ 152,832 Gains or losses and prior service costs or credits that arise during the period but that are not recognized as components of net periodic pension cost would typically berecognized as a component of other comprehensive income, net of tax. However, Central Hudson has PSC approval to record regulatory assets rather than adjustingcomprehensive income to offset the additional liability.
The valuation of the current and prior year PBO was determined at December 31, 2012 and 2011, using discount rates of 3.8% and 4.5% respectively, as determined fromthe Mercer Pension Discount Yield Curve reflecting projected pension cash flows. As of November 30, 2012, the Mercer Pension Discount Yield Curve bond selectioncriteria was expanded to reflect a broader representation of the high quality corporate bond universe. The impact of this change on the resulting discount rate at December31, 2012 was not material. Central Hudson accounts for pension activity in accordance with PSC-prescribed provisions, which among other things, requires a ten-yearamortization of actuarial gains and losses. The 2010 Rate Order includes an increase in the rate allowance for pension and OPEB expense which more closely approximates the recent cost of providing these benefits. Authorization remains in effect for the deferral of any differences between rate allowances and actual costs under the 1993 PSC Policy to counteract the volatility of thesecosts. The 2010 Rate Order again authorized Central Hudson to offset significant deferred balances for pension and OPEB expense for the electric department withavailable deferred credit balances due to customers. The 2010 Rate Order also authorized the continuation of the amortization of natural gas department deferred pension andOPEB costs. The accumulated deferred balance of these costs at June 30, 2010 is being recovered via a four-year amortization that began July 1, 2010.
-144-
Table of Contents
In addition to the Retirement Plan, a portion of CH Energy Group's and Central Hudson's executives are covered under the non-qualified SERP.
Retirement Plan Estimates of Long-Term Rates of Return
The expected long-term rate of return on the Retirement Plan assets is 6.25%, net of investment expense. In determining the expected long-term rate of return on plan assets,Central Hudson considered forward-looking estimated returns evaluated in light of current economic conditions and based on internally consistent economic models. Theexpected long-term rate of return is a weighted average based on each plan's investment mix and the forward-looking estimated returns for each investment class. CentralHudson monitors actual performance against target asset allocations and adjusts actual allocations and targets in accordance with the Retirement Plan strategy.
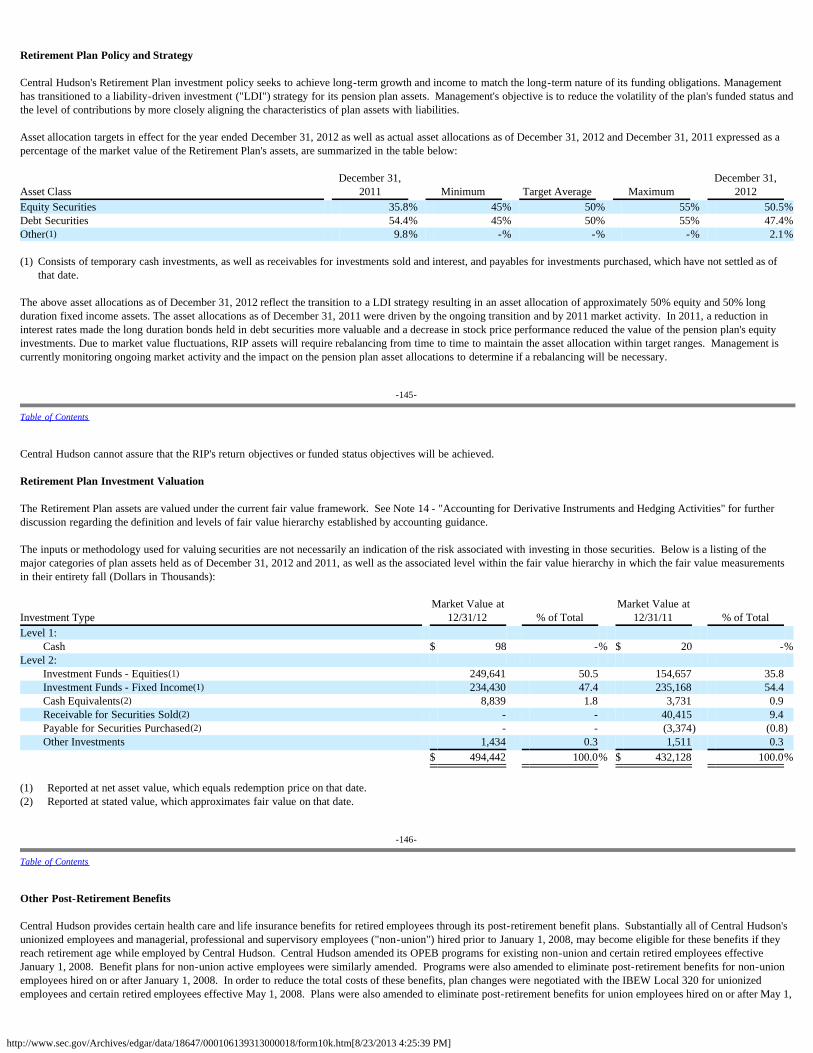
http://www.sec.gov/Archives/edgar/data/18647/000106139313000018/form10k.htm[8/23/2013 4:25:39 PM]
Retirement Plan Policy and Strategy
Central Hudson's Retirement Plan investment policy seeks to achieve long-term growth and income to match the long-term nature of its funding obligations. Managementhas transitioned to a liability-driven investment ("LDI") strategy for its pension plan assets. Management's objective is to reduce the volatility of the plan's funded status andthe level of contributions by more closely aligning the characteristics of plan assets with liabilities.
Asset allocation targets in effect for the year ended December 31, 2012 as well as actual asset allocations as of December 31, 2012 and December 31, 2011 expressed as apercentage of the market value of the Retirement Plan's assets, are summarized in the table below:
Asset Class December 31,
2011 Minimum Target Average Maximum December 31,
2012 Equity Securities 35.8% 45% 50% 55% 50.5%Debt Securities 54.4% 45% 50% 55% 47.4%Other(1) 9.8% -% -% -% 2.1% (1) Consists of temporary cash investments, as well as receivables for investments sold and interest, and payables for investments purchased, which have not settled as of
that date. The above asset allocations as of December 31, 2012 reflect the transition to a LDI strategy resulting in an asset allocation of approximately 50% equity and 50% longduration fixed income assets. The asset allocations as of December 31, 2011 were driven by the ongoing transition and by 2011 market activity. In 2011, a reduction ininterest rates made the long duration bonds held in debt securities more valuable and a decrease in stock price performance reduced the value of the pension plan's equityinvestments. Due to market value fluctuations, RIP assets will require rebalancing from time to time to maintain the asset allocation within target ranges. Management iscurrently monitoring ongoing market activity and the impact on the pension plan asset allocations to determine if a rebalancing will be necessary.
-145-
Table of Contents
Central Hudson cannot assure that the RIP's return objectives or funded status objectives will be achieved.
Retirement Plan Investment Valuation
The Retirement Plan assets are valued under the current fair value framework. See Note 14 - "Accounting for Derivative Instruments and Hedging Activities" for furtherdiscussion regarding the definition and levels of fair value hierarchy established by accounting guidance.
The inputs or methodology used for valuing securities are not necessarily an indication of the risk associated with investing in those securities. Below is a listing of themajor categories of plan assets held as of December 31, 2012 and 2011, as well as the associated level within the fair value hierarchy in which the fair value measurementsin their entirety fall (Dollars in Thousands):
Investment Type Market Value at
12/31/12 % of Total Market Value at
12/31/11 % of Total Level 1:
Cash $ 98 -% $ 20 -%Level 2:
Investment Funds - Equities(1) 249,641 50.5 154,657 35.8 Investment Funds - Fixed Income(1) 234,430 47.4 235,168 54.4 Cash Equivalents(2) 8,839 1.8 3,731 0.9 Receivable for Securities Sold(2) - - 40,415 9.4 Payable for Securities Purchased(2) - - (3,374) (0.8)Other Investments 1,434 0.3 1,511 0.3
$ 494,442 100.0% $ 432,128 100.0% (1) Reported at net asset value, which equals redemption price on that date. (2) Reported at stated value, which approximates fair value on that date.
-146-
Table of Contents
Other Post-Retirement Benefits
Central Hudson provides certain health care and life insurance benefits for retired employees through its post-retirement benefit plans. Substantially all of Central Hudson'sunionized employees and managerial, professional and supervisory employees ("non-union") hired prior to January 1, 2008, may become eligible for these benefits if theyreach retirement age while employed by Central Hudson. Central Hudson amended its OPEB programs for existing non-union and certain retired employees effectiveJanuary 1, 2008. Benefit plans for non-union active employees were similarly amended. Programs were also amended to eliminate post-retirement benefits for non-unionemployees hired on or after January 1, 2008. In order to reduce the total costs of these benefits, plan changes were negotiated with the IBEW Local 320 for unionizedemployees and certain retired employees effective May 1, 2008. Plans were also amended to eliminate post-retirement benefits for union employees hired on or after May 1,
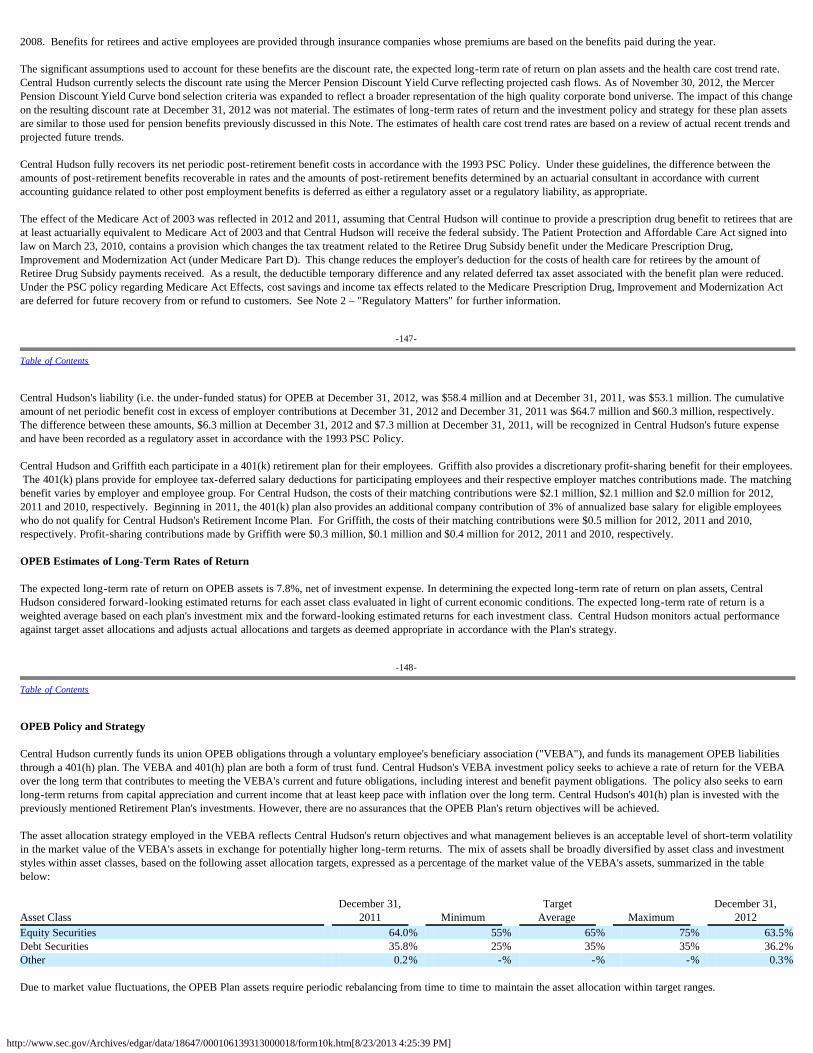
http://www.sec.gov/Archives/edgar/data/18647/000106139313000018/form10k.htm[8/23/2013 4:25:39 PM]
2008. Benefits for retirees and active employees are provided through insurance companies whose premiums are based on the benefits paid during the year.
The significant assumptions used to account for these benefits are the discount rate, the expected long-term rate of return on plan assets and the health care cost trend rate.Central Hudson currently selects the discount rate using the Mercer Pension Discount Yield Curve reflecting projected cash flows. As of November 30, 2012, the MercerPension Discount Yield Curve bond selection criteria was expanded to reflect a broader representation of the high quality corporate bond universe. The impact of this changeon the resulting discount rate at December 31, 2012 was not material. The estimates of long-term rates of return and the investment policy and strategy for these plan assetsare similar to those used for pension benefits previously discussed in this Note. The estimates of health care cost trend rates are based on a review of actual recent trends andprojected future trends.
Central Hudson fully recovers its net periodic post-retirement benefit costs in accordance with the 1993 PSC Policy. Under these guidelines, the difference between theamounts of post-retirement benefits recoverable in rates and the amounts of post-retirement benefits determined by an actuarial consultant in accordance with currentaccounting guidance related to other post employment benefits is deferred as either a regulatory asset or a regulatory liability, as appropriate.
The effect of the Medicare Act of 2003 was reflected in 2012 and 2011, assuming that Central Hudson will continue to provide a prescription drug benefit to retirees that areat least actuarially equivalent to Medicare Act of 2003 and that Central Hudson will receive the federal subsidy. The Patient Protection and Affordable Care Act signed intolaw on March 23, 2010, contains a provision which changes the tax treatment related to the Retiree Drug Subsidy benefit under the Medicare Prescription Drug,Improvement and Modernization Act (under Medicare Part D). This change reduces the employer's deduction for the costs of health care for retirees by the amount ofRetiree Drug Subsidy payments received. As a result, the deductible temporary difference and any related deferred tax asset associated with the benefit plan were reduced. Under the PSC policy regarding Medicare Act Effects, cost savings and income tax effects related to the Medicare Prescription Drug, Improvement and Modernization Actare deferred for future recovery from or refund to customers. See Note 2 – "Regulatory Matters" for further information.
-147-
Table of Contents
Central Hudson's liability (i.e. the under-funded status) for OPEB at December 31, 2012, was $58.4 million and at December 31, 2011, was $53.1 million. The cumulativeamount of net periodic benefit cost in excess of employer contributions at December 31, 2012 and December 31, 2011 was $64.7 million and $60.3 million, respectively.The difference between these amounts, $6.3 million at December 31, 2012 and $7.3 million at December 31, 2011, will be recognized in Central Hudson's future expenseand have been recorded as a regulatory asset in accordance with the 1993 PSC Policy.
Central Hudson and Griffith each participate in a 401(k) retirement plan for their employees. Griffith also provides a discretionary profit-sharing benefit for their employees. The 401(k) plans provide for employee tax-deferred salary deductions for participating employees and their respective employer matches contributions made. The matchingbenefit varies by employer and employee group. For Central Hudson, the costs of their matching contributions were $2.1 million, $2.1 million and $2.0 million for 2012,2011 and 2010, respectively. Beginning in 2011, the 401(k) plan also provides an additional company contribution of 3% of annualized base salary for eligible employeeswho do not qualify for Central Hudson's Retirement Income Plan. For Griffith, the costs of their matching contributions were $0.5 million for 2012, 2011 and 2010,respectively. Profit-sharing contributions made by Griffith were $0.3 million, $0.1 million and $0.4 million for 2012, 2011 and 2010, respectively.
OPEB Estimates of Long-Term Rates of Return
The expected long-term rate of return on OPEB assets is 7.8%, net of investment expense. In determining the expected long-term rate of return on plan assets, CentralHudson considered forward-looking estimated returns for each asset class evaluated in light of current economic conditions. The expected long-term rate of return is aweighted average based on each plan's investment mix and the forward-looking estimated returns for each investment class. Central Hudson monitors actual performanceagainst target asset allocations and adjusts actual allocations and targets as deemed appropriate in accordance with the Plan's strategy.
-148-
Table of Contents
OPEB Policy and Strategy
Central Hudson currently funds its union OPEB obligations through a voluntary employee's beneficiary association ("VEBA"), and funds its management OPEB liabilitiesthrough a 401(h) plan. The VEBA and 401(h) plan are both a form of trust fund. Central Hudson's VEBA investment policy seeks to achieve a rate of return for the VEBAover the long term that contributes to meeting the VEBA's current and future obligations, including interest and benefit payment obligations. The policy also seeks to earnlong-term returns from capital appreciation and current income that at least keep pace with inflation over the long term. Central Hudson's 401(h) plan is invested with thepreviously mentioned Retirement Plan's investments. However, there are no assurances that the OPEB Plan's return objectives will be achieved.
The asset allocation strategy employed in the VEBA reflects Central Hudson's return objectives and what management believes is an acceptable level of short-term volatilityin the market value of the VEBA's assets in exchange for potentially higher long-term returns. The mix of assets shall be broadly diversified by asset class and investmentstyles within asset classes, based on the following asset allocation targets, expressed as a percentage of the market value of the VEBA's assets, summarized in the tablebelow: Asset Class
December 31,2011
Minimum
TargetAverage
Maximum
December 31,2012
Equity Securities 64.0% 55% 65% 75% 63.5%Debt Securities 35.8% 25% 35% 35% 36.2%Other 0.2% -% -% -% 0.3% Due to market value fluctuations, the OPEB Plan assets require periodic rebalancing from time to time to maintain the asset allocation within target ranges.
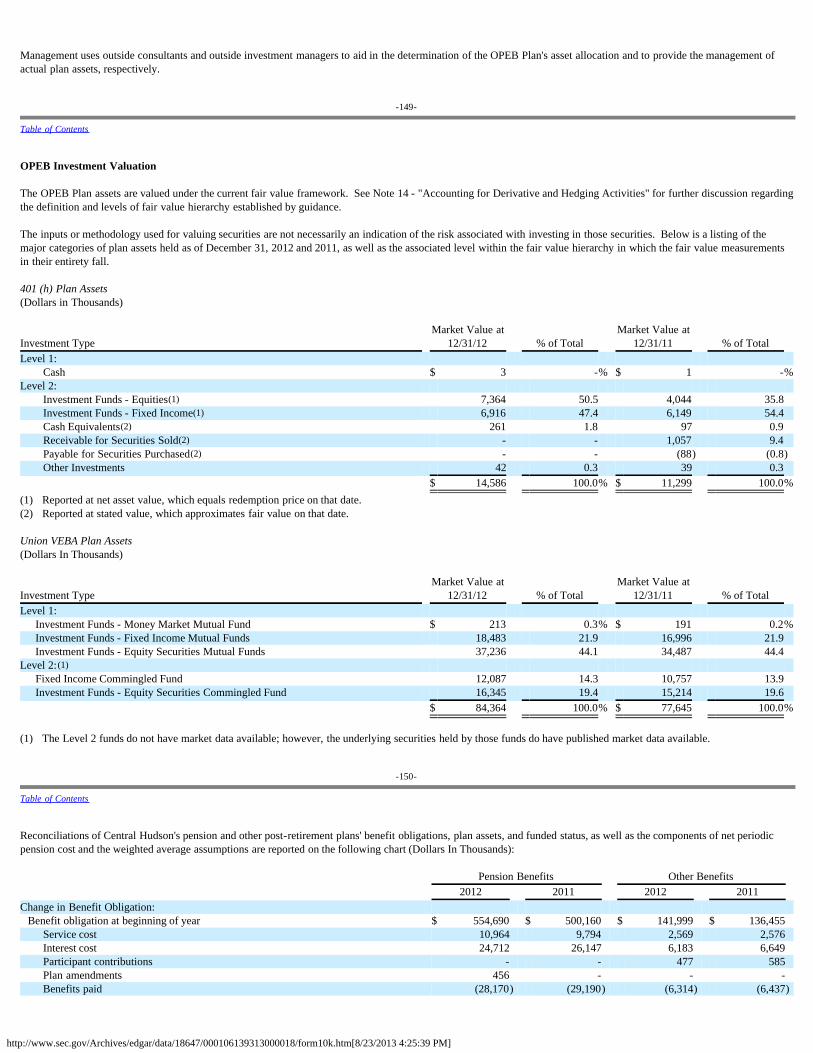
http://www.sec.gov/Archives/edgar/data/18647/000106139313000018/form10k.htm[8/23/2013 4:25:39 PM]
Management uses outside consultants and outside investment managers to aid in the determination of the OPEB Plan's asset allocation and to provide the management ofactual plan assets, respectively.
-149-
Table of Contents
OPEB Investment Valuation
The OPEB Plan assets are valued under the current fair value framework. See Note 14 - "Accounting for Derivative and Hedging Activities" for further discussion regardingthe definition and levels of fair value hierarchy established by guidance.
The inputs or methodology used for valuing securities are not necessarily an indication of the risk associated with investing in those securities. Below is a listing of themajor categories of plan assets held as of December 31, 2012 and 2011, as well as the associated level within the fair value hierarchy in which the fair value measurementsin their entirety fall. 401 (h) Plan Assets(Dollars in Thousands)
Investment Type Market Value at
12/31/12 % of Total Market Value at
12/31/11 % of Total Level 1:
Cash $ 3 -% $ 1 -%Level 2:
Investment Funds - Equities(1) 7,364 50.5 4,044 35.8 Investment Funds - Fixed Income(1) 6,916 47.4 6,149 54.4 Cash Equivalents(2) 261 1.8 97 0.9 Receivable for Securities Sold(2) - - 1,057 9.4 Payable for Securities Purchased(2) - - (88) (0.8)Other Investments 42 0.3 39 0.3
$ 14,586 100.0% $ 11,299 100.0%(1) Reported at net asset value, which equals redemption price on that date. (2) Reported at stated value, which approximates fair value on that date. Union VEBA Plan Assets(Dollars In Thousands)
Investment Type Market Value at
12/31/12 % of Total Market Value at
12/31/11 % of Total Level 1:
Investment Funds - Money Market Mutual Fund $ 213 0.3% $ 191 0.2%Investment Funds - Fixed Income Mutual Funds 18,483 21.9 16,996 21.9 Investment Funds - Equity Securities Mutual Funds 37,236 44.1 34,487 44.4
Level 2:(1) Fixed Income Commingled Fund 12,087 14.3 10,757 13.9 Investment Funds - Equity Securities Commingled Fund 16,345 19.4 15,214 19.6
$ 84,364 100.0% $ 77,645 100.0% (1) The Level 2 funds do not have market data available; however, the underlying securities held by those funds do have published market data available.
-150-
Table of Contents
Reconciliations of Central Hudson's pension and other post-retirement plans' benefit obligations, plan assets, and funded status, as well as the components of net periodicpension cost and the weighted average assumptions are reported on the following chart (Dollars In Thousands): Pension Benefits Other Benefits 2012 2011 2012 2011 Change in Benefit Obligation: Benefit obligation at beginning of year $ 554,690 $ 500,160 $ 141,999 $ 136,455
Service cost 10,964 9,794 2,569 2,576 Interest cost 24,712 26,147 6,183 6,649 Participant contributions - - 477 585 Plan amendments 456 - - - Benefits paid (28,170) (29,190) (6,314) (6,437)
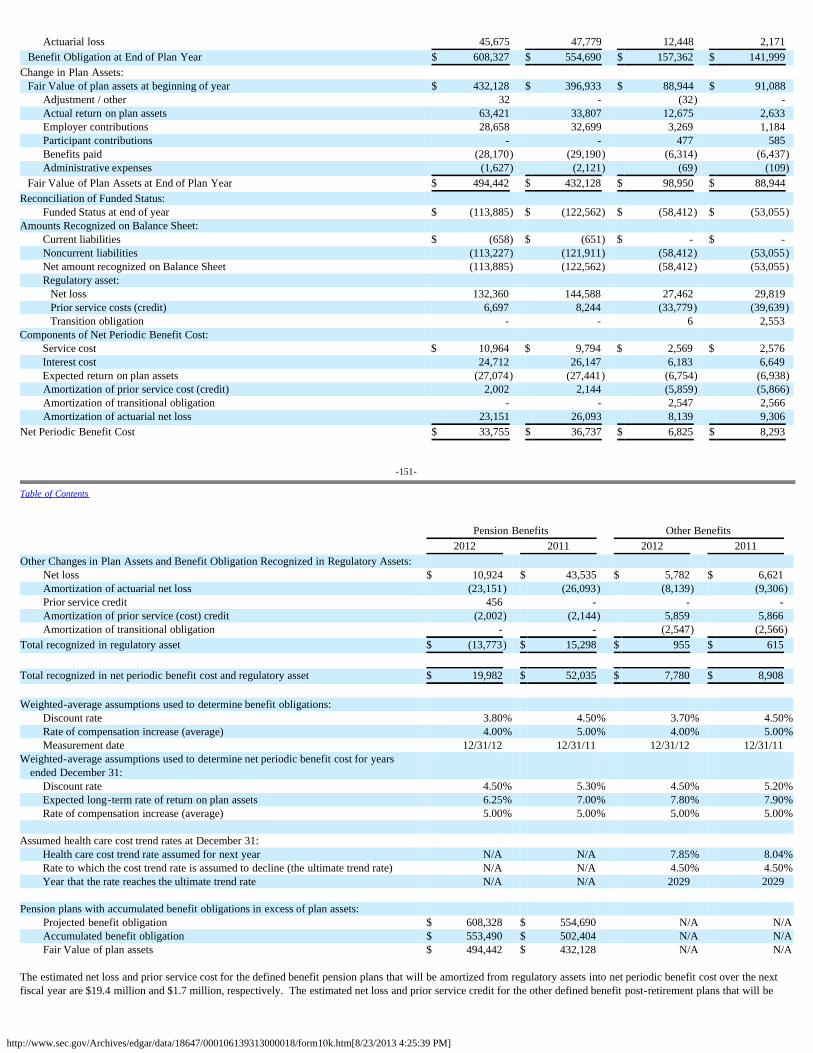
http://www.sec.gov/Archives/edgar/data/18647/000106139313000018/form10k.htm[8/23/2013 4:25:39 PM]
Actuarial loss 45,675 47,779 12,448 2,171 Benefit Obligation at End of Plan Year $ 608,327 $ 554,690 $ 157,362 $ 141,999 Change in Plan Assets: Fair Value of plan assets at beginning of year $ 432,128 $ 396,933 $ 88,944 $ 91,088
Adjustment / other 32 - (32) - Actual return on plan assets 63,421 33,807 12,675 2,633 Employer contributions 28,658 32,699 3,269 1,184 Participant contributions - - 477 585 Benefits paid (28,170) (29,190) (6,314) (6,437)Administrative expenses (1,627) (2,121) (69) (109)
Fair Value of Plan Assets at End of Plan Year $ 494,442 $ 432,128 $ 98,950 $ 88,944 Reconciliation of Funded Status:
Funded Status at end of year $ (113,885) $ (122,562) $ (58,412) $ (53,055)Amounts Recognized on Balance Sheet:
Current liabilities $ (658) $ (651) $ - $ - Noncurrent liabilities (113,227) (121,911) (58,412) (53,055)Net amount recognized on Balance Sheet (113,885) (122,562) (58,412) (53,055)Regulatory asset: Net loss 132,360 144,588 27,462 29,819 Prior service costs (credit) 6,697 8,244 (33,779) (39,639) Transition obligation - - 6 2,553
Components of Net Periodic Benefit Cost: Service cost $ 10,964 $ 9,794 $ 2,569 $ 2,576 Interest cost 24,712 26,147 6,183 6,649 Expected return on plan assets (27,074) (27,441) (6,754) (6,938)Amortization of prior service cost (credit) 2,002 2,144 (5,859) (5,866)Amortization of transitional obligation - - 2,547 2,566 Amortization of actuarial net loss 23,151 26,093 8,139 9,306
Net Periodic Benefit Cost $ 33,755 $ 36,737 $ 6,825 $ 8,293
-151-
Table of Contents
Pension Benefits Other Benefits 2012 2011 2012 2011 Other Changes in Plan Assets and Benefit Obligation Recognized in Regulatory Assets:
Net loss $ 10,924 $ 43,535 $ 5,782 $ 6,621 Amortization of actuarial net loss (23,151) (26,093) (8,139) (9,306)Prior service credit 456 - - - Amortization of prior service (cost) credit (2,002) (2,144) 5,859 5,866 Amortization of transitional obligation - - (2,547) (2,566)
Total recognized in regulatory asset $ (13,773) $ 15,298 $ 955 $ 615 Total recognized in net periodic benefit cost and regulatory asset $ 19,982 $ 52,035 $ 7,780 $ 8,908 Weighted-average assumptions used to determine benefit obligations:
Discount rate 3.80% 4.50% 3.70% 4.50%Rate of compensation increase (average) 4.00% 5.00% 4.00% 5.00%Measurement date 12/31/12 12/31/11 12/31/12 12/31/11
Weighted-average assumptions used to determine net periodic benefit cost for yearsended December 31:
Discount rate 4.50% 5.30% 4.50% 5.20%Expected long-term rate of return on plan assets 6.25% 7.00% 7.80% 7.90%Rate of compensation increase (average) 5.00% 5.00% 5.00% 5.00%
Assumed health care cost trend rates at December 31:
Health care cost trend rate assumed for next year N/A N/A 7.85% 8.04%Rate to which the cost trend rate is assumed to decline (the ultimate trend rate) N/A N/A 4.50% 4.50%Year that the rate reaches the ultimate trend rate N/A N/A 2029 2029
Pension plans with accumulated benefit obligations in excess of plan assets:
Projected benefit obligation $ 608,328 $ 554,690 N/A N/AAccumulated benefit obligation $ 553,490 $ 502,404 N/A N/AFair Value of plan assets $ 494,442 $ 432,128 N/A N/A
The estimated net loss and prior service cost for the defined benefit pension plans that will be amortized from regulatory assets into net periodic benefit cost over the nextfiscal year are $19.4 million and $1.7 million, respectively. The estimated net loss and prior service credit for the other defined benefit post-retirement plans that will be
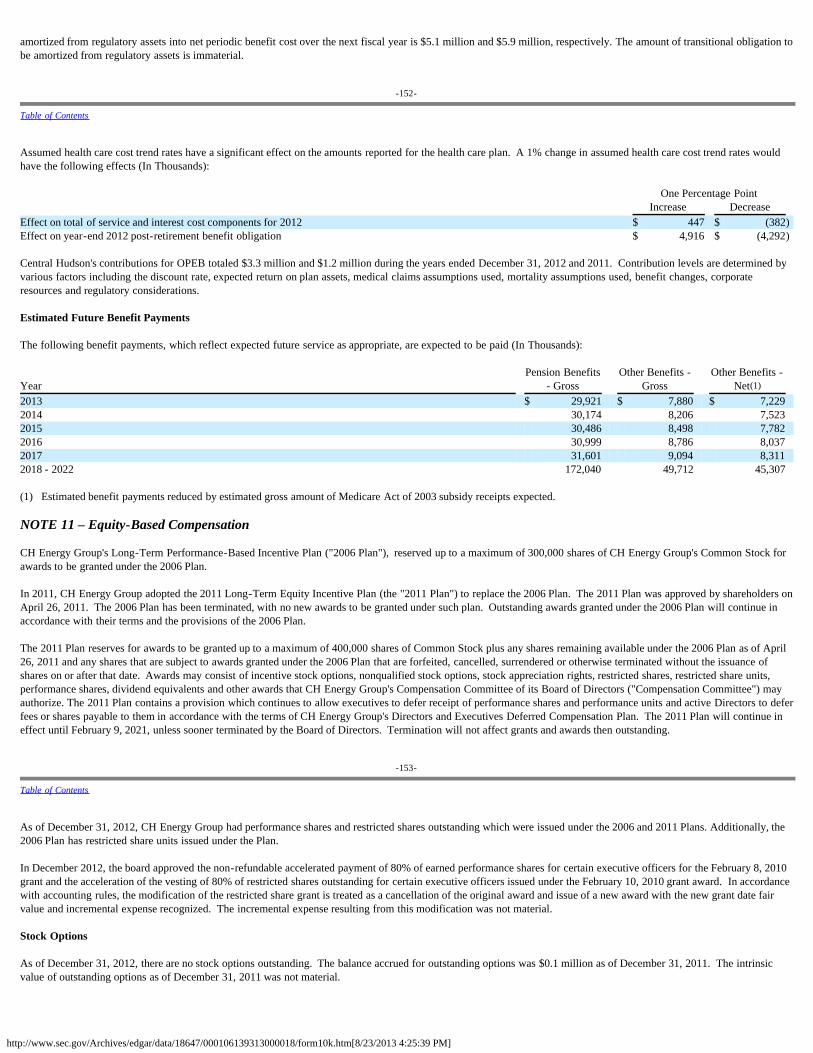
http://www.sec.gov/Archives/edgar/data/18647/000106139313000018/form10k.htm[8/23/2013 4:25:39 PM]
amortized from regulatory assets into net periodic benefit cost over the next fiscal year is $5.1 million and $5.9 million, respectively. The amount of transitional obligation tobe amortized from regulatory assets is immaterial.
-152-
Table of Contents
Assumed health care cost trend rates have a significant effect on the amounts reported for the health care plan. A 1% change in assumed health care cost trend rates wouldhave the following effects (In Thousands): One Percentage Point Increase Decrease Effect on total of service and interest cost components for 2012 $ 447 $ (382)Effect on year-end 2012 post-retirement benefit obligation $ 4,916 $ (4,292) Central Hudson's contributions for OPEB totaled $3.3 million and $1.2 million during the years ended December 31, 2012 and 2011. Contribution levels are determined byvarious factors including the discount rate, expected return on plan assets, medical claims assumptions used, mortality assumptions used, benefit changes, corporateresources and regulatory considerations. Estimated Future Benefit Payments The following benefit payments, which reflect expected future service as appropriate, are expected to be paid (In Thousands):
Year Pension Benefits
- Gross Other Benefits -
Gross Other Benefits -
Net(1) 2013 $ 29,921 $ 7,880 $ 7,229 2014 30,174 8,206 7,523 2015 30,486 8,498 7,782 2016 30,999 8,786 8,037 2017 31,601 9,094 8,311 2018 - 2022 172,040 49,712 45,307 (1) Estimated benefit payments reduced by estimated gross amount of Medicare Act of 2003 subsidy receipts expected. NOTE 11 – Equity-Based Compensation
CH Energy Group's Long-Term Performance-Based Incentive Plan ("2006 Plan"), reserved up to a maximum of 300,000 shares of CH Energy Group's Common Stock forawards to be granted under the 2006 Plan.
In 2011, CH Energy Group adopted the 2011 Long-Term Equity Incentive Plan (the "2011 Plan") to replace the 2006 Plan. The 2011 Plan was approved by shareholders onApril 26, 2011. The 2006 Plan has been terminated, with no new awards to be granted under such plan. Outstanding awards granted under the 2006 Plan will continue inaccordance with their terms and the provisions of the 2006 Plan.
The 2011 Plan reserves for awards to be granted up to a maximum of 400,000 shares of Common Stock plus any shares remaining available under the 2006 Plan as of April26, 2011 and any shares that are subject to awards granted under the 2006 Plan that are forfeited, cancelled, surrendered or otherwise terminated without the issuance ofshares on or after that date. Awards may consist of incentive stock options, nonqualified stock options, stock appreciation rights, restricted shares, restricted share units,performance shares, dividend equivalents and other awards that CH Energy Group's Compensation Committee of its Board of Directors ("Compensation Committee") mayauthorize. The 2011 Plan contains a provision which continues to allow executives to defer receipt of performance shares and performance units and active Directors to deferfees or shares payable to them in accordance with the terms of CH Energy Group's Directors and Executives Deferred Compensation Plan. The 2011 Plan will continue ineffect until February 9, 2021, unless sooner terminated by the Board of Directors. Termination will not affect grants and awards then outstanding.
-153-
Table of Contents
As of December 31, 2012, CH Energy Group had performance shares and restricted shares outstanding which were issued under the 2006 and 2011 Plans. Additionally, the2006 Plan has restricted share units issued under the Plan.
In December 2012, the board approved the non-refundable accelerated payment of 80% of earned performance shares for certain executive officers for the February 8, 2010grant and the acceleration of the vesting of 80% of restricted shares outstanding for certain executive officers issued under the February 10, 2010 grant award. In accordancewith accounting rules, the modification of the restricted share grant is treated as a cancellation of the original award and issue of a new award with the new grant date fairvalue and incremental expense recognized. The incremental expense resulting from this modification was not material. Stock Options As of December 31, 2012, there are no stock options outstanding. The balance accrued for outstanding options was $0.1 million as of December 31, 2011. The intrinsicvalue of outstanding options as of December 31, 2011 was not material.
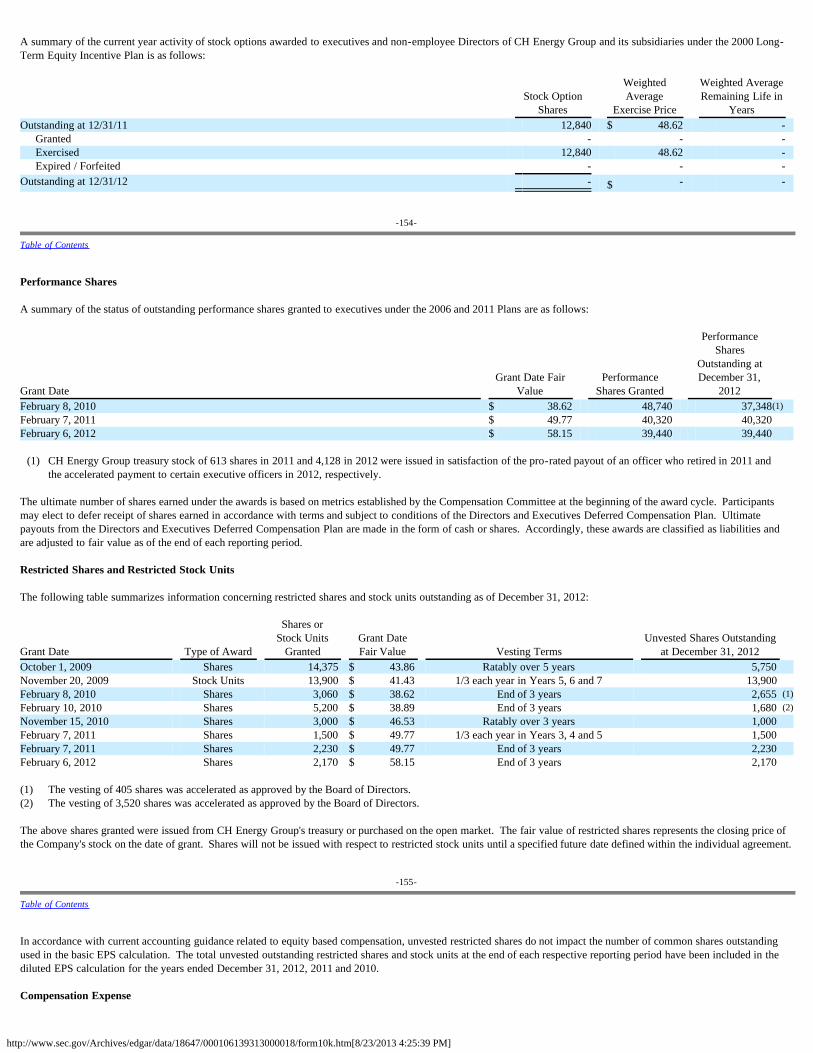
http://www.sec.gov/Archives/edgar/data/18647/000106139313000018/form10k.htm[8/23/2013 4:25:39 PM]
A summary of the current year activity of stock options awarded to executives and non-employee Directors of CH Energy Group and its subsidiaries under the 2000 Long-Term Equity Incentive Plan is as follows:
Stock Option
Shares
WeightedAverage
Exercise Price
Weighted AverageRemaining Life in
Years Outstanding at 12/31/11 12,840 $ 48.62 -
Granted - - - Exercised 12,840 48.62 - Expired / Forfeited - - -
Outstanding at 12/31/12 - $ - -
-154-
Table of Contents
Performance Shares A summary of the status of outstanding performance shares granted to executives under the 2006 and 2011 Plans are as follows:
Grant Date Grant Date Fair
Value Performance
Shares Granted
PerformanceShares
Outstanding atDecember 31,
2012 February 8, 2010 $ 38.62 48,740 37,348(1) February 7, 2011 $ 49.77 40,320 40,320 February 6, 2012 $ 58.15 39,440 39,440
(1) CH Energy Group treasury stock of 613 shares in 2011 and 4,128 in 2012 were issued in satisfaction of the pro-rated payout of an officer who retired in 2011 andthe accelerated payment to certain executive officers in 2012, respectively.
The ultimate number of shares earned under the awards is based on metrics established by the Compensation Committee at the beginning of the award cycle. Participantsmay elect to defer receipt of shares earned in accordance with terms and subject to conditions of the Directors and Executives Deferred Compensation Plan. Ultimatepayouts from the Directors and Executives Deferred Compensation Plan are made in the form of cash or shares. Accordingly, these awards are classified as liabilities andare adjusted to fair value as of the end of each reporting period. Restricted Shares and Restricted Stock Units The following table summarizes information concerning restricted shares and stock units outstanding as of December 31, 2012:
Grant Date Type of Award
Shares orStock Units
Granted Grant DateFair Value Vesting Terms
Unvested Shares Outstandingat December 31, 2012
October 1, 2009 Shares 14,375 $ 43.86 Ratably over 5 years 5,750 November 20, 2009 Stock Units 13,900 $ 41.43 1/3 each year in Years 5, 6 and 7 13,900 February 8, 2010 Shares 3,060 $ 38.62 End of 3 years 2,655 (1)February 10, 2010 Shares 5,200 $ 38.89 End of 3 years 1,680 (2)November 15, 2010 Shares 3,000 $ 46.53 Ratably over 3 years 1,000 February 7, 2011 Shares 1,500 $ 49.77 1/3 each year in Years 3, 4 and 5 1,500 February 7, 2011 Shares 2,230 $ 49.77 End of 3 years 2,230 February 6, 2012 Shares 2,170 $ 58.15 End of 3 years 2,170 (1) The vesting of 405 shares was accelerated as approved by the Board of Directors.(2) The vesting of 3,520 shares was accelerated as approved by the Board of Directors. The above shares granted were issued from CH Energy Group's treasury or purchased on the open market. The fair value of restricted shares represents the closing price ofthe Company's stock on the date of grant. Shares will not be issued with respect to restricted stock units until a specified future date defined within the individual agreement.
-155-
Table of Contents
In accordance with current accounting guidance related to equity based compensation, unvested restricted shares do not impact the number of common shares outstandingused in the basic EPS calculation. The total unvested outstanding restricted shares and stock units at the end of each respective reporting period have been included in thediluted EPS calculation for the years ended December 31, 2012, 2011 and 2010. Compensation Expense
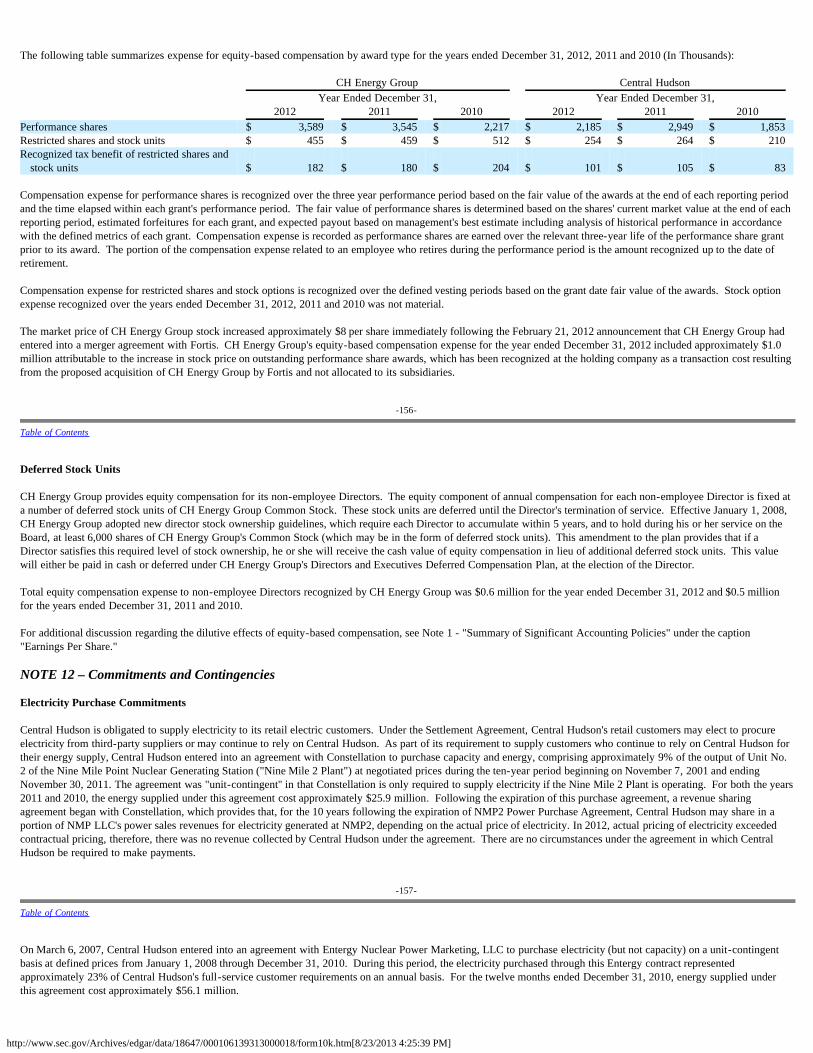
http://www.sec.gov/Archives/edgar/data/18647/000106139313000018/form10k.htm[8/23/2013 4:25:39 PM]
The following table summarizes expense for equity-based compensation by award type for the years ended December 31, 2012, 2011 and 2010 (In Thousands): CH Energy Group Central Hudson Year Ended December 31, Year Ended December 31,
2012 2011 2010 2012 2011 2010 Performance shares $ 3,589 $ 3,545 $ 2,217 $ 2,185 $ 2,949 $ 1,853 Restricted shares and stock units $ 455 $ 459 $ 512 $ 254 $ 264 $ 210 Recognized tax benefit of restricted shares and
stock units $ 182 $ 180 $ 204 $ 101 $ 105 $ 83 Compensation expense for performance shares is recognized over the three year performance period based on the fair value of the awards at the end of each reporting periodand the time elapsed within each grant's performance period. The fair value of performance shares is determined based on the shares' current market value at the end of eachreporting period, estimated forfeitures for each grant, and expected payout based on management's best estimate including analysis of historical performance in accordancewith the defined metrics of each grant. Compensation expense is recorded as performance shares are earned over the relevant three-year life of the performance share grantprior to its award. The portion of the compensation expense related to an employee who retires during the performance period is the amount recognized up to the date ofretirement.
Compensation expense for restricted shares and stock options is recognized over the defined vesting periods based on the grant date fair value of the awards. Stock optionexpense recognized over the years ended December 31, 2012, 2011 and 2010 was not material. The market price of CH Energy Group stock increased approximately $8 per share immediately following the February 21, 2012 announcement that CH Energy Group hadentered into a merger agreement with Fortis. CH Energy Group's equity-based compensation expense for the year ended December 31, 2012 included approximately $1.0million attributable to the increase in stock price on outstanding performance share awards, which has been recognized at the holding company as a transaction cost resultingfrom the proposed acquisition of CH Energy Group by Fortis and not allocated to its subsidiaries.
-156-
Table of Contents
Deferred Stock Units
CH Energy Group provides equity compensation for its non-employee Directors. The equity component of annual compensation for each non-employee Director is fixed ata number of deferred stock units of CH Energy Group Common Stock. These stock units are deferred until the Director's termination of service. Effective January 1, 2008,CH Energy Group adopted new director stock ownership guidelines, which require each Director to accumulate within 5 years, and to hold during his or her service on theBoard, at least 6,000 shares of CH Energy Group's Common Stock (which may be in the form of deferred stock units). This amendment to the plan provides that if aDirector satisfies this required level of stock ownership, he or she will receive the cash value of equity compensation in lieu of additional deferred stock units. This valuewill either be paid in cash or deferred under CH Energy Group's Directors and Executives Deferred Compensation Plan, at the election of the Director.
Total equity compensation expense to non-employee Directors recognized by CH Energy Group was $0.6 million for the year ended December 31, 2012 and $0.5 millionfor the years ended December 31, 2011 and 2010.
For additional discussion regarding the dilutive effects of equity-based compensation, see Note 1 - "Summary of Significant Accounting Policies" under the caption"Earnings Per Share."
NOTE 12 – Commitments and Contingencies
Electricity Purchase Commitments
Central Hudson is obligated to supply electricity to its retail electric customers. Under the Settlement Agreement, Central Hudson's retail customers may elect to procureelectricity from third-party suppliers or may continue to rely on Central Hudson. As part of its requirement to supply customers who continue to rely on Central Hudson fortheir energy supply, Central Hudson entered into an agreement with Constellation to purchase capacity and energy, comprising approximately 9% of the output of Unit No.2 of the Nine Mile Point Nuclear Generating Station ("Nine Mile 2 Plant") at negotiated prices during the ten-year period beginning on November 7, 2001 and endingNovember 30, 2011. The agreement was "unit-contingent'' in that Constellation is only required to supply electricity if the Nine Mile 2 Plant is operating. For both the years2011 and 2010, the energy supplied under this agreement cost approximately $25.9 million. Following the expiration of this purchase agreement, a revenue sharingagreement began with Constellation, which provides that, for the 10 years following the expiration of NMP2 Power Purchase Agreement, Central Hudson may share in aportion of NMP LLC's power sales revenues for electricity generated at NMP2, depending on the actual price of electricity. In 2012, actual pricing of electricity exceededcontractual pricing, therefore, there was no revenue collected by Central Hudson under the agreement. There are no circumstances under the agreement in which CentralHudson be required to make payments.
-157-
Table of Contents
On March 6, 2007, Central Hudson entered into an agreement with Entergy Nuclear Power Marketing, LLC to purchase electricity (but not capacity) on a unit-contingentbasis at defined prices from January 1, 2008 through December 31, 2010. During this period, the electricity purchased through this Entergy contract representedapproximately 23% of Central Hudson's full-service customer requirements on an annual basis. For the twelve months ended December 31, 2010, energy supplied underthis agreement cost approximately $56.1 million.
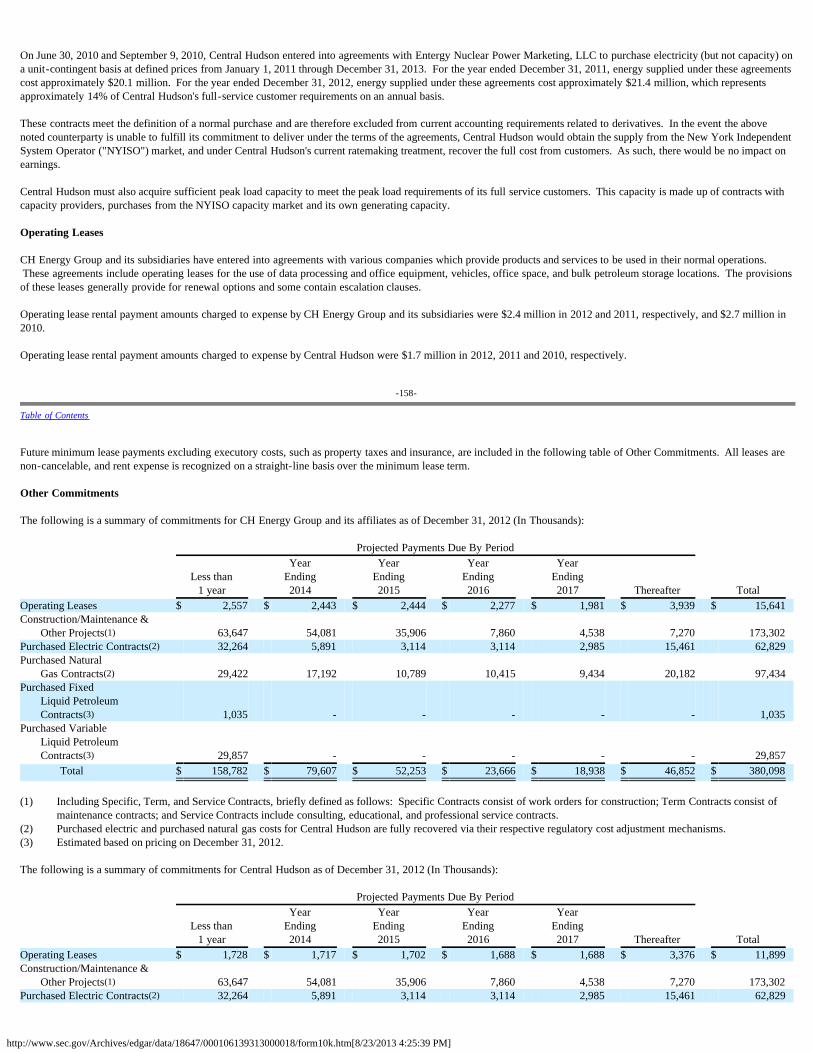
http://www.sec.gov/Archives/edgar/data/18647/000106139313000018/form10k.htm[8/23/2013 4:25:39 PM]
On June 30, 2010 and September 9, 2010, Central Hudson entered into agreements with Entergy Nuclear Power Marketing, LLC to purchase electricity (but not capacity) ona unit-contingent basis at defined prices from January 1, 2011 through December 31, 2013. For the year ended December 31, 2011, energy supplied under these agreementscost approximately $20.1 million. For the year ended December 31, 2012, energy supplied under these agreements cost approximately $21.4 million, which representsapproximately 14% of Central Hudson's full-service customer requirements on an annual basis.
These contracts meet the definition of a normal purchase and are therefore excluded from current accounting requirements related to derivatives. In the event the abovenoted counterparty is unable to fulfill its commitment to deliver under the terms of the agreements, Central Hudson would obtain the supply from the New York IndependentSystem Operator ("NYISO") market, and under Central Hudson's current ratemaking treatment, recover the full cost from customers. As such, there would be no impact onearnings.
Central Hudson must also acquire sufficient peak load capacity to meet the peak load requirements of its full service customers. This capacity is made up of contracts withcapacity providers, purchases from the NYISO capacity market and its own generating capacity.
Operating Leases
CH Energy Group and its subsidiaries have entered into agreements with various companies which provide products and services to be used in their normal operations. These agreements include operating leases for the use of data processing and office equipment, vehicles, office space, and bulk petroleum storage locations. The provisionsof these leases generally provide for renewal options and some contain escalation clauses.
Operating lease rental payment amounts charged to expense by CH Energy Group and its subsidiaries were $2.4 million in 2012 and 2011, respectively, and $2.7 million in2010.
Operating lease rental payment amounts charged to expense by Central Hudson were $1.7 million in 2012, 2011 and 2010, respectively.
-158-
Table of Contents
Future minimum lease payments excluding executory costs, such as property taxes and insurance, are included in the following table of Other Commitments. All leases arenon-cancelable, and rent expense is recognized on a straight-line basis over the minimum lease term.
Other Commitments The following is a summary of commitments for CH Energy Group and its affiliates as of December 31, 2012 (In Thousands): Projected Payments Due By Period
Less than
1 year
YearEnding2014
YearEnding2015
YearEnding2016
YearEnding2017 Thereafter Total
Operating Leases $ 2,557 $ 2,443 $ 2,444 $ 2,277 $ 1,981 $ 3,939 $ 15,641 Construction/Maintenance &
Other Projects(1) 63,647 54,081 35,906 7,860 4,538 7,270 173,302 Purchased Electric Contracts(2) 32,264 5,891 3,114 3,114 2,985 15,461 62,829 Purchased Natural
Gas Contracts(2) 29,422 17,192 10,789 10,415 9,434 20,182 97,434 Purchased Fixed
Liquid PetroleumContracts(3) 1,035 - - - - - 1,035
Purchased VariableLiquid PetroleumContracts(3) 29,857 - - - - - 29,857
Total $ 158,782 $ 79,607 $ 52,253 $ 23,666 $ 18,938 $ 46,852 $ 380,098 (1) Including Specific, Term, and Service Contracts, briefly defined as follows: Specific Contracts consist of work orders for construction; Term Contracts consist of
maintenance contracts; and Service Contracts include consulting, educational, and professional service contracts.(2) Purchased electric and purchased natural gas costs for Central Hudson are fully recovered via their respective regulatory cost adjustment mechanisms.(3) Estimated based on pricing on December 31, 2012. The following is a summary of commitments for Central Hudson as of December 31, 2012 (In Thousands): Projected Payments Due By Period
Less than
1 year
YearEnding2014
YearEnding2015
YearEnding2016
YearEnding2017 Thereafter Total
Operating Leases $ 1,728 $ 1,717 $ 1,702 $ 1,688 $ 1,688 $ 3,376 $ 11,899 Construction/Maintenance &
Other Projects(1) 63,647 54,081 35,906 7,860 4,538 7,270 173,302 Purchased Electric Contracts(2) 32,264 5,891 3,114 3,114 2,985 15,461 62,829
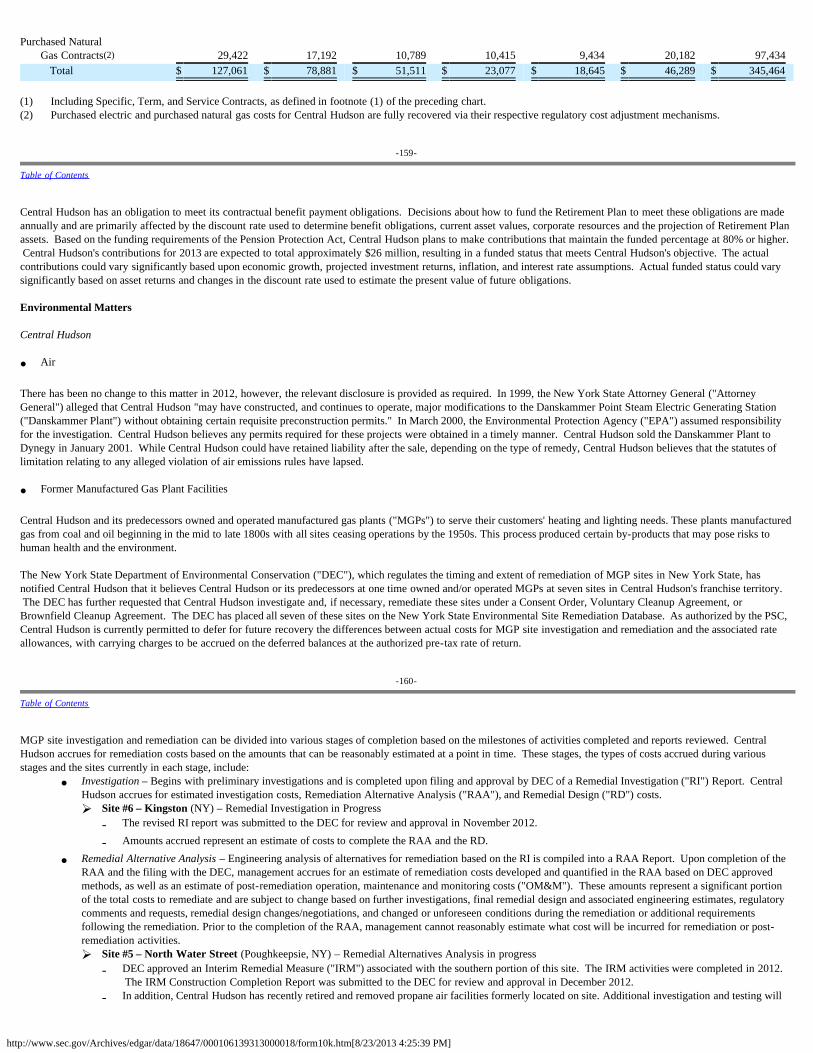
http://www.sec.gov/Archives/edgar/data/18647/000106139313000018/form10k.htm[8/23/2013 4:25:39 PM]
Purchased NaturalGas Contracts(2) 29,422 17,192 10,789 10,415 9,434 20,182 97,434
Total $ 127,061 $ 78,881 $ 51,511 $ 23,077 $ 18,645 $ 46,289 $ 345,464 (1) Including Specific, Term, and Service Contracts, as defined in footnote (1) of the preceding chart.(2) Purchased electric and purchased natural gas costs for Central Hudson are fully recovered via their respective regulatory cost adjustment mechanisms.
-159-
Table of Contents
Central Hudson has an obligation to meet its contractual benefit payment obligations. Decisions about how to fund the Retirement Plan to meet these obligations are madeannually and are primarily affected by the discount rate used to determine benefit obligations, current asset values, corporate resources and the projection of Retirement Planassets. Based on the funding requirements of the Pension Protection Act, Central Hudson plans to make contributions that maintain the funded percentage at 80% or higher. Central Hudson's contributions for 2013 are expected to total approximately $26 million, resulting in a funded status that meets Central Hudson's objective. The actualcontributions could vary significantly based upon economic growth, projected investment returns, inflation, and interest rate assumptions. Actual funded status could varysignificantly based on asset returns and changes in the discount rate used to estimate the present value of future obligations.
Environmental Matters
Central Hudson
· Air
There has been no change to this matter in 2012, however, the relevant disclosure is provided as required. In 1999, the New York State Attorney General ("AttorneyGeneral") alleged that Central Hudson "may have constructed, and continues to operate, major modifications to the Danskammer Point Steam Electric Generating Station("Danskammer Plant") without obtaining certain requisite preconstruction permits." In March 2000, the Environmental Protection Agency ("EPA") assumed responsibilityfor the investigation. Central Hudson believes any permits required for these projects were obtained in a timely manner. Central Hudson sold the Danskammer Plant toDynegy in January 2001. While Central Hudson could have retained liability after the sale, depending on the type of remedy, Central Hudson believes that the statutes oflimitation relating to any alleged violation of air emissions rules have lapsed.
· Former Manufactured Gas Plant Facilities
Central Hudson and its predecessors owned and operated manufactured gas plants ("MGPs") to serve their customers' heating and lighting needs. These plants manufacturedgas from coal and oil beginning in the mid to late 1800s with all sites ceasing operations by the 1950s. This process produced certain by-products that may pose risks tohuman health and the environment.
The New York State Department of Environmental Conservation ("DEC"), which regulates the timing and extent of remediation of MGP sites in New York State, hasnotified Central Hudson that it believes Central Hudson or its predecessors at one time owned and/or operated MGPs at seven sites in Central Hudson's franchise territory. The DEC has further requested that Central Hudson investigate and, if necessary, remediate these sites under a Consent Order, Voluntary Cleanup Agreement, orBrownfield Cleanup Agreement. The DEC has placed all seven of these sites on the New York State Environmental Site Remediation Database. As authorized by the PSC,Central Hudson is currently permitted to defer for future recovery the differences between actual costs for MGP site investigation and remediation and the associated rateallowances, with carrying charges to be accrued on the deferred balances at the authorized pre-tax rate of return.
-160-
Table of Contents
MGP site investigation and remediation can be divided into various stages of completion based on the milestones of activities completed and reports reviewed. CentralHudson accrues for remediation costs based on the amounts that can be reasonably estimated at a point in time. These stages, the types of costs accrued during variousstages and the sites currently in each stage, include:
· Investigation – Begins with preliminary investigations and is completed upon filing and approval by DEC of a Remedial Investigation ("RI") Report. CentralHudson accrues for estimated investigation costs, Remediation Alternative Analysis ("RAA"), and Remedial Design ("RD") costs.Ø Site #6 – Kingston (NY) – Remedial Investigation in Progress
- The revised RI report was submitted to the DEC for review and approval in November 2012.
- Amounts accrued represent an estimate of costs to complete the RAA and the RD.
· Remedial Alternative Analysis – Engineering analysis of alternatives for remediation based on the RI is compiled into a RAA Report. Upon completion of theRAA and the filing with the DEC, management accrues for an estimate of remediation costs developed and quantified in the RAA based on DEC approvedmethods, as well as an estimate of post-remediation operation, maintenance and monitoring costs ("OM&M"). These amounts represent a significant portionof the total costs to remediate and are subject to change based on further investigations, final remedial design and associated engineering estimates, regulatorycomments and requests, remedial design changes/negotiations, and changed or unforeseen conditions during the remediation or additional requirementsfollowing the remediation. Prior to the completion of the RAA, management cannot reasonably estimate what cost will be incurred for remediation or post-remediation activities.Ø Site #5 – North Water Street (Poughkeepsie, NY) – Remedial Alternatives Analysis in progress
- DEC approved an Interim Remedial Measure ("IRM") associated with the southern portion of this site. The IRM activities were completed in 2012. The IRM Construction Completion Report was submitted to the DEC for review and approval in December 2012.
- In addition, Central Hudson has recently retired and removed propane air facilities formerly located on site. Additional investigation and testing will
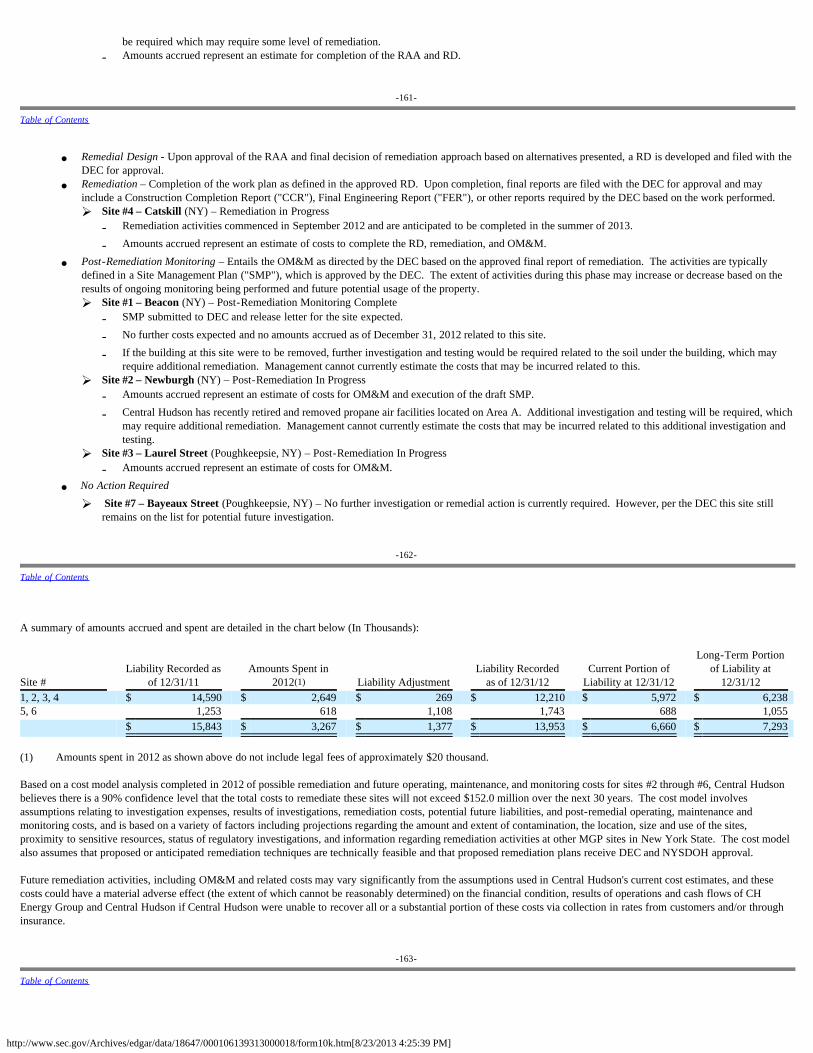
http://www.sec.gov/Archives/edgar/data/18647/000106139313000018/form10k.htm[8/23/2013 4:25:39 PM]
be required which may require some level of remediation.- Amounts accrued represent an estimate for completion of the RAA and RD.
-161-
Table of Contents
· Remedial Design - Upon approval of the RAA and final decision of remediation approach based on alternatives presented, a RD is developed and filed with the
DEC for approval.· Remediation – Completion of the work plan as defined in the approved RD. Upon completion, final reports are filed with the DEC for approval and may
include a Construction Completion Report ("CCR"), Final Engineering Report ("FER"), or other reports required by the DEC based on the work performed.Ø Site #4 – Catskill (NY) – Remediation in Progress
- Remediation activities commenced in September 2012 and are anticipated to be completed in the summer of 2013.
- Amounts accrued represent an estimate of costs to complete the RD, remediation, and OM&M.
· Post-Remediation Monitoring – Entails the OM&M as directed by the DEC based on the approved final report of remediation. The activities are typicallydefined in a Site Management Plan ("SMP"), which is approved by the DEC. The extent of activities during this phase may increase or decrease based on theresults of ongoing monitoring being performed and future potential usage of the property.Ø Site #1 – Beacon (NY) – Post-Remediation Monitoring Complete
- SMP submitted to DEC and release letter for the site expected.
- No further costs expected and no amounts accrued as of December 31, 2012 related to this site.
- If the building at this site were to be removed, further investigation and testing would be required related to the soil under the building, which mayrequire additional remediation. Management cannot currently estimate the costs that may be incurred related to this.
Ø Site #2 – Newburgh (NY) – Post-Remediation In Progress- Amounts accrued represent an estimate of costs for OM&M and execution of the draft SMP.
- Central Hudson has recently retired and removed propane air facilities located on Area A. Additional investigation and testing will be required, whichmay require additional remediation. Management cannot currently estimate the costs that may be incurred related to this additional investigation andtesting.
Ø Site #3 – Laurel Street (Poughkeepsie, NY) – Post-Remediation In Progress- Amounts accrued represent an estimate of costs for OM&M.
· No Action Required
Ø Site #7 – Bayeaux Street (Poughkeepsie, NY) – No further investigation or remedial action is currently required. However, per the DEC this site stillremains on the list for potential future investigation.
-162-
Table of Contents
A summary of amounts accrued and spent are detailed in the chart below (In Thousands):
Site # Liability Recorded as
of 12/31/11 Amounts Spent in
2012(1) Liability Adjustment Liability Recorded
as of 12/31/12 Current Portion of
Liability at 12/31/12
Long-Term Portionof Liability at
12/31/12 1, 2, 3, 4 $ 14,590 $ 2,649 $ 269 $ 12,210 $ 5,972 $ 6,238 5, 6 1,253 618 1,108 1,743 688 1,055
$ 15,843 $ 3,267 $ 1,377 $ 13,953 $ 6,660 $ 7,293 (1) Amounts spent in 2012 as shown above do not include legal fees of approximately $20 thousand. Based on a cost model analysis completed in 2012 of possible remediation and future operating, maintenance, and monitoring costs for sites #2 through #6, Central Hudsonbelieves there is a 90% confidence level that the total costs to remediate these sites will not exceed $152.0 million over the next 30 years. The cost model involvesassumptions relating to investigation expenses, results of investigations, remediation costs, potential future liabilities, and post-remedial operating, maintenance andmonitoring costs, and is based on a variety of factors including projections regarding the amount and extent of contamination, the location, size and use of the sites,proximity to sensitive resources, status of regulatory investigations, and information regarding remediation activities at other MGP sites in New York State. The cost modelalso assumes that proposed or anticipated remediation techniques are technically feasible and that proposed remediation plans receive DEC and NYSDOH approval.
Future remediation activities, including OM&M and related costs may vary significantly from the assumptions used in Central Hudson's current cost estimates, and thesecosts could have a material adverse effect (the extent of which cannot be reasonably determined) on the financial condition, results of operations and cash flows of CHEnergy Group and Central Hudson if Central Hudson were unable to recover all or a substantial portion of these costs via collection in rates from customers and/or throughinsurance.
-163-
Table of Contents
http://www.sec.gov/Archives/edgar/data/18647/000106139313000018/form10k.htm[8/23/2013 4:25:39 PM]
Central Hudson expects to recover its remediation costs from its customers. The current components of this recovery include:- Current Rate Order includes cash recovery from customers of $13.6 million spread equally over the three year settlement period ending June 30, 2013;- As part of the 2010 Rate Order, Central Hudson maintained previously granted deferral authority and subsequent recovery for amounts spent over the rate
allowance.- Total MGP Site Investigation and Remediation costs recovered through rates and other regulatory mechanisms from July 1, 2007 through December 31, 2012
was approximately $24.4million, with $4.6 million recovered in the twelve months ended December 31, 2012.- The total spent in 2012 related to site investigation and remediation was approximately $3.6 million.- The regulatory asset balance as of December 31, 2012 was $15.3 million, which represents the difference between amounts spent or currently accrued as a
liability and the amounts recovered through rate allowance, as well as carrying charges accrued. Upon completion of investigation at sites #5 and #6, whenremediation and post-remediation costs will be able to be reasonably estimated and therefore will be recorded as a liability, this regulatory asset balance willlikely increase significantly. Management projects that the investigation at these sites will likely be completed within the next two years.
Central Hudson has put its insurers on notice and intends to seek reimbursement from its insurers for its costs. Certain of these insurers have denied coverage. In additionto the rate allowance amounts noted above, Central Hudson recovered approximately $2.3 million from insurance, with $0.7 million recovered in 2012. However, we do notexpect insurance recoveries to offset a meaningful portion of total costs.
· Little Britain Road property owned by Central Hudson
There has been no change to this site in 2012, however, the relevant disclosure is provided as required. In 2000, Central Hudson and the DEC entered into a VoluntaryCleanup Agreement ("VCA") whereby Central Hudson removed approximately 3,100 tons of soil and conducted groundwater sampling. Central Hudson believes that it hasfulfilled its obligations under the VCA and should receive the release provided for in the VCA, but the DEC has proposed that additional groundwater work be done toaddress groundwater sampling results that showed the presence of certain contaminants at levels exceeding DEC criteria. Central Hudson believes that such work is notnecessary and has completed a soil vapor intrusion study showing that indoor air at the facility met Occupational Safety and Health Administration ("OSHA") and NYSDOHstandards. In October 2011, DEC requested a 'non-committal' meeting with Central Hudson to discuss the site and possible next steps. A meeting date has yet to beestablished.
-164-
Table of Contents
At this time Central Hudson does not have sufficient information to estimate the need for additional remediation or potential remediation costs. Central Hudson has put itsinsurers on notice regarding this matter and intends to seek reimbursement from its insurers for amounts, if any, for which it may become liable. Central Hudson cannotpredict the outcome of this matter.
· Eltings Corners
There has been no change to this site in 2012, however, the relevant disclosure is provided as required. Central Hudson owns and operates a maintenance and warehousefacility. In the course of Central Hudson's hazardous waste permit renewal process for this facility, sediment contamination was discovered within the wetland area acrossthe street from the main property. In cooperation with the DEC, Central Hudson continues to investigate the nature and extent of the contamination. Additional off-sitesediment and on-site groundwater sampling was performed during 2012 in accordance with a supplemental work plan approved by the DEC. Further investigation isexpected to take place in 2013. The extent of the contamination as well as the timing and costs for any future remediation efforts cannot be reasonably estimated at thistime.
CHEC
During the year ended December 31, 2012, Griffith spent $0.4 million on remediation efforts in Maryland, Virginia and Connecticut.
Griffith's reserve for environmental remediation is $1.5 million as of December 31, 2012, of which $0.5 million is expected to be spent in the next twelve months.
In connection with the 2009 sale of operations in certain geographic locations, Griffith agreed to indemnify the purchaser for certain claims, losses and expenses arising outof any breach by Griffith of the representations, warranties and covenants Griffith made in the sale agreement, certain environmental matters and all liabilities retained byGriffith. Griffith's indemnification obligation is subject to a number of limitations, including a five-year limitation within which certain claims must be brought, anaggregate deductible of $0.8 million applicable to certain types of non-environmental claims and other deductibles applicable to certain specific environmental claims, andcaps on Griffith's liability with respect to certain of the indemnification obligations. The sale agreement includes an aggregate cap of $5.7 million on Griffith's obligation toindemnify the purchaser for breaches of many of Griffith's representations and warranties and for certain environmental liabilities. In 2009, the Company reserved $2.6million for environmental remediation costs it may be obligated to pay based on its indemnification obligations under the sale agreement. To date, Griffith has paidapproximately $1.2 million under its environmental remediation cost obligation. In the first quarter of 2011, Griffith reduced the reserve by $0.6 million based on thecompletion of an environmental study. The balance as of December 31, 2012 related to the divestiture is $0.8 million. Management believes this is the most likely amountGriffith would pay with respect to its indemnification obligations under the sale agreement.
-165-
Table of Contents
Certain Litigation Related to the Fortis Transaction
Following the announcement of the proposed acquisition of CH Energy Group by Fortis on February 21, 2012, several complaints were filed by purported CH Energy Group
http://www.sec.gov/Archives/edgar/data/18647/000106139313000018/form10k.htm[8/23/2013 4:25:39 PM]
shareholders in the Supreme Court of the State of New York, County of New York (the "New York County Court") and the Supreme Court of the State of New York, Countyof Dutchess, challenging the proposed merger. The Dutchess County actions have been transferred to the New York County Court, and all actions have been joined under themaster caption In re CH Energy Group, Inc. Shareholder Litigation, Index No. 775,000/2012.
On April 9, 2012, a master amended complaint was filed in the joined litigation related to the proposed acquisition of CH Energy Group by Fortis. The master amendedcomplaint, which was filed on behalf of a putative class of CH Energy Group public shareholders, names as defendants CH Energy Group, its directors, Fortis, FortisUS, andCascade Acquisition Sub, Inc. and generally alleges that the individual defendants breached their fiduciary duties in connection with the proposed transaction and that theentity defendants aided and abetted that breach. The master amended complaint further alleges that the preliminary proxy filed in connection with the proposed transactionwith Fortis contains material misstatements and omissions. The master complaint seeks, among other things, an order preliminarily and permanently enjoining the proposedtransaction with Fortis, damages, and plaintiffs' expenses.
On May 9, 2012, the parties executed a memorandum of understanding that embodies their agreement in principle on the structure of a proposed settlement. The proposedsettlement, which is subject to certain conditions, including court approval following notice to a proposed settlement class consisting of all CH Energy Group shareholdersduring the period from February 19, 2012 through the date of the consummation of the proposed merger (the "Class"), would, among other things, dismiss all causes ofaction asserted in the master amended complaint and release all claims that members of the Class may have arising out of or relating in any manner to the proposed merger.Pursuant to the terms of the proposed settlement, defendants agreed to make certain disclosures to shareholders. In the meantime, the plaintiffs and their counsel haveagreed, among other things, to stay the litigation and not to initiate any proceedings (including, but not limited to, a motion for a preliminary injunction) other than thoseincident to effecting the settlement.
Absent court approval of the proposed settlement, the defendants intend to vigorously defend themselves against the action.
-166-
Table of Contents
Other Matters
Asbestos Litigation
As of December 31, 2012, of the 3,336 asbestos cases brought against Central Hudson, 1,164 remain pending. Of the cases no longer pending against Central Hudson, 2,017have been dismissed or discontinued without payment by Central Hudson, and Central Hudson has settled 155 cases. Central Hudson is presently unable to assess thevalidity of the remaining asbestos lawsuits; however, based on information known to Central Hudson at this time, including Central Hudson's experience in settling asbestoscases and in obtaining dismissals of asbestos cases, Central Hudson believes that the costs which may be incurred in connection with the remaining lawsuits will not have amaterial adverse effect on the financial position, results of operations or cash flows of either CH Energy Group or Central Hudson.
Central Hudson and Griffith are involved in various other legal and administrative proceedings incidental to their businesses, which are in various stages. While thesematters collectively could involve substantial amounts, based on the facts currently known, it is the opinion of management that their ultimate resolution will not have amaterial adverse effect on either of CH Energy Group's or the individual segment's financial positions, results of operations or cash flows.
CH Energy Group and Central Hudson expense legal costs as incurred.
-167-
Table of Contents
NOTE 13 – Segments and Related Information
CH Energy Group's reportable operating segments are the regulated electric utility business and regulated natural gas utility business of Central Hudson and the unregulatedfuel distribution business of Griffith. Other activities of CH Energy Group, which do not constitute a business segment, include CHEC's renewable energy investments andthe holding company's activities, which consist primarily of financing its subsidiaries, and are reported under the heading "Other Businesses and Investments."
Central Hudson purchases, sells at wholesale, and distributes electricity and natural gas at retail in New York State's Mid-Hudson River Valley. Electric service is availablethroughout the territory and natural gas service is provided in and about the cities of Poughkeepsie, Beacon, Newburgh, and Kingston, New York and certain outlying andintervening territories. Central Hudson also generates a small portion of its electricity requirements.
Griffith is engaged in fuel distribution including heating oil, gasoline, diesel fuel, kerosene, and propane, and the installation and maintenance of heating, ventilating, and airconditioning equipment in Virginia, West Virginia, Maryland, Delaware, Pennsylvania, and Washington, D.C. Management regularly reviews Griffith's operating results asa standalone component of CH Energy Group and assesses its performance as a basis for allocating resources.
Certain additional information regarding these segments is set forth in the following tables. General corporate expenses and Central Hudson's property common to bothelectric and natural gas segments have been allocated in accordance with practices established for regulatory purposes.
In the following segment charts for CH Energy Group, information related to Griffith and Other Businesses and Investments represents continuing operations unlessotherwise noted.
-168-
Table of Contents
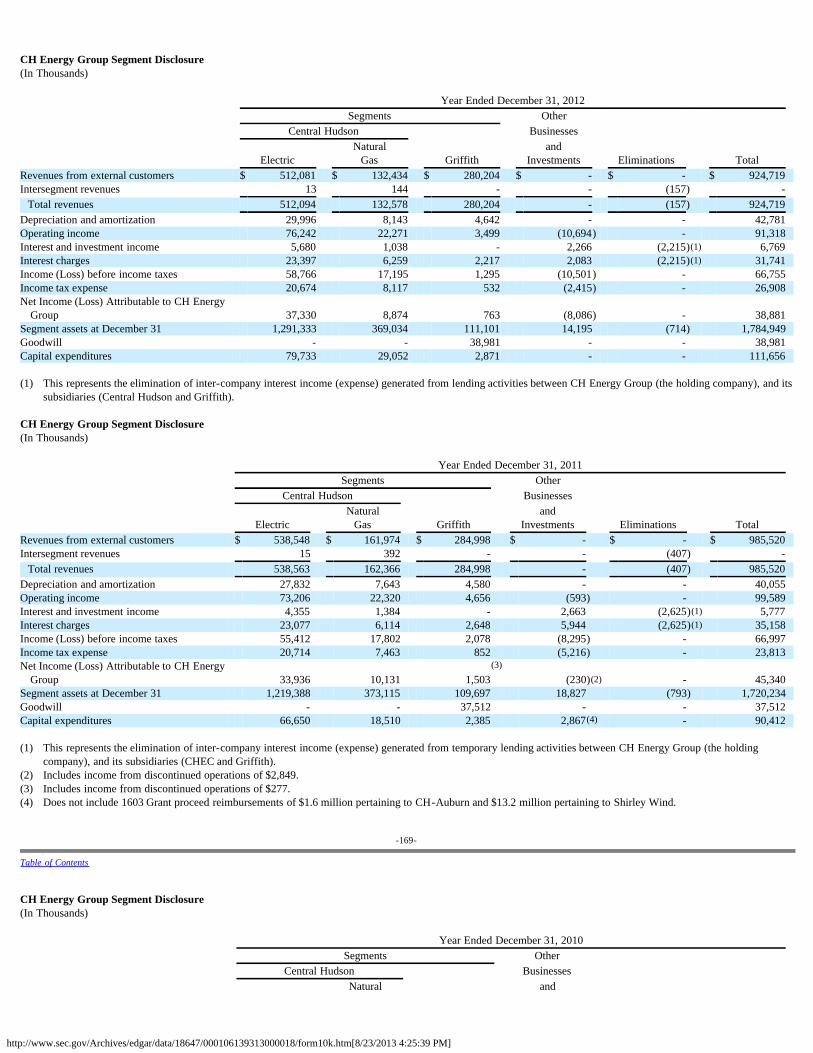
http://www.sec.gov/Archives/edgar/data/18647/000106139313000018/form10k.htm[8/23/2013 4:25:39 PM]
CH Energy Group Segment Disclosure(In Thousands) Year Ended December 31, 2012
Segments Other Central Hudson Businesses
Natural and Electric Gas Griffith Investments Eliminations Total
Revenues from external customers $ 512,081 $ 132,434 $ 280,204 $ - $ - $ 924,719 Intersegment revenues 13 144 - - (157) - Total revenues 512,094 132,578 280,204 - (157) 924,719 Depreciation and amortization 29,996 8,143 4,642 - - 42,781 Operating income 76,242 22,271 3,499 (10,694) - 91,318 Interest and investment income 5,680 1,038 - 2,266 (2,215)(1) 6,769 Interest charges 23,397 6,259 2,217 2,083 (2,215)(1) 31,741 Income (Loss) before income taxes 58,766 17,195 1,295 (10,501) - 66,755 Income tax expense 20,674 8,117 532 (2,415) - 26,908 Net Income (Loss) Attributable to CH Energy
Group 37,330 8,874 763 (8,086) - 38,881 Segment assets at December 31 1,291,333 369,034 111,101 14,195 (714) 1,784,949 Goodwill - - 38,981 - - 38,981 Capital expenditures 79,733 29,052 2,871 - - 111,656 (1) This represents the elimination of inter-company interest income (expense) generated from lending activities between CH Energy Group (the holding company), and its
subsidiaries (Central Hudson and Griffith). CH Energy Group Segment Disclosure(In Thousands) Year Ended December 31, 2011
Segments Other Central Hudson Businesses
Natural and Electric Gas Griffith Investments Eliminations Total
Revenues from external customers $ 538,548 $ 161,974 $ 284,998 $ - $ - $ 985,520 Intersegment revenues 15 392 - - (407) - Total revenues 538,563 162,366 284,998 - (407) 985,520 Depreciation and amortization 27,832 7,643 4,580 - - 40,055 Operating income 73,206 22,320 4,656 (593) - 99,589 Interest and investment income 4,355 1,384 - 2,663 (2,625)(1) 5,777 Interest charges 23,077 6,114 2,648 5,944 (2,625)(1) 35,158 Income (Loss) before income taxes 55,412 17,802 2,078 (8,295) - 66,997 Income tax expense 20,714 7,463 852 (5,216) - 23,813 Net Income (Loss) Attributable to CH Energy
Group 33,936 10,131 1,503(3)
(230)(2) - 45,340 Segment assets at December 31 1,219,388 373,115 109,697 18,827 (793) 1,720,234 Goodwill - - 37,512 - - 37,512 Capital expenditures 66,650 18,510 2,385 2,867(4) - 90,412 (1) This represents the elimination of inter-company interest income (expense) generated from temporary lending activities between CH Energy Group (the holding
company), and its subsidiaries (CHEC and Griffith).(2) Includes income from discontinued operations of $2,849.(3) Includes income from discontinued operations of $277.(4) Does not include 1603 Grant proceed reimbursements of $1.6 million pertaining to CH-Auburn and $13.2 million pertaining to Shirley Wind.
-169-
Table of Contents
CH Energy Group Segment Disclosure(In Thousands) Year Ended December 31, 2010
Segments Other Central Hudson Businesses
Natural and
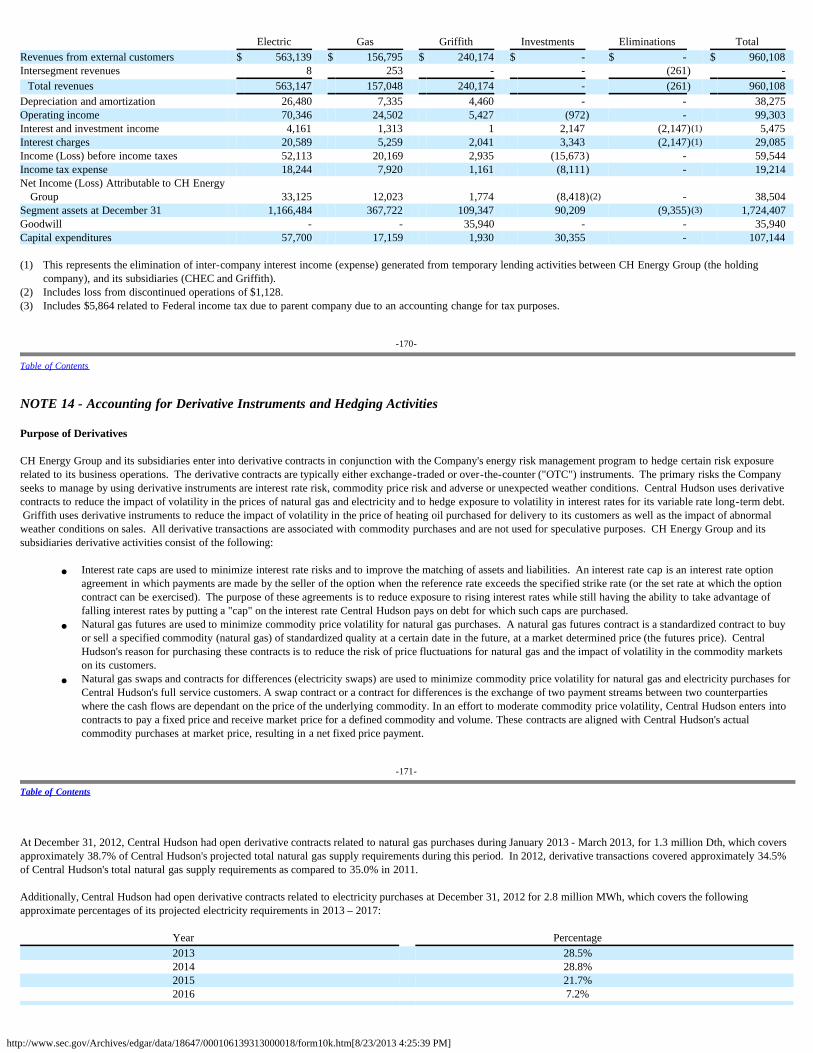
http://www.sec.gov/Archives/edgar/data/18647/000106139313000018/form10k.htm[8/23/2013 4:25:39 PM]
Electric Gas Griffith Investments Eliminations Total Revenues from external customers $ 563,139 $ 156,795 $ 240,174 $ - $ - $ 960,108 Intersegment revenues 8 253 - - (261) - Total revenues 563,147 157,048 240,174 - (261) 960,108 Depreciation and amortization 26,480 7,335 4,460 - - 38,275 Operating income 70,346 24,502 5,427 (972) - 99,303 Interest and investment income 4,161 1,313 1 2,147 (2,147)(1) 5,475 Interest charges 20,589 5,259 2,041 3,343 (2,147)(1) 29,085 Income (Loss) before income taxes 52,113 20,169 2,935 (15,673) - 59,544 Income tax expense 18,244 7,920 1,161 (8,111) - 19,214 Net Income (Loss) Attributable to CH Energy
Group 33,125 12,023 1,774 (8,418)(2) - 38,504 Segment assets at December 31 1,166,484 367,722 109,347 90,209 (9,355)(3) 1,724,407 Goodwill - - 35,940 - - 35,940 Capital expenditures 57,700 17,159 1,930 30,355 - 107,144 (1) This represents the elimination of inter-company interest income (expense) generated from temporary lending activities between CH Energy Group (the holding
company), and its subsidiaries (CHEC and Griffith).(2) Includes loss from discontinued operations of $1,128.(3) Includes $5,864 related to Federal income tax due to parent company due to an accounting change for tax purposes.
-170-
Table of Contents
NOTE 14 - Accounting for Derivative Instruments and Hedging Activities Purpose of Derivatives
CH Energy Group and its subsidiaries enter into derivative contracts in conjunction with the Company's energy risk management program to hedge certain risk exposurerelated to its business operations. The derivative contracts are typically either exchange-traded or over-the-counter ("OTC") instruments. The primary risks the Companyseeks to manage by using derivative instruments are interest rate risk, commodity price risk and adverse or unexpected weather conditions. Central Hudson uses derivativecontracts to reduce the impact of volatility in the prices of natural gas and electricity and to hedge exposure to volatility in interest rates for its variable rate long-term debt. Griffith uses derivative instruments to reduce the impact of volatility in the price of heating oil purchased for delivery to its customers as well as the impact of abnormalweather conditions on sales. All derivative transactions are associated with commodity purchases and are not used for speculative purposes. CH Energy Group and itssubsidiaries derivative activities consist of the following:
· Interest rate caps are used to minimize interest rate risks and to improve the matching of assets and liabilities. An interest rate cap is an interest rate optionagreement in which payments are made by the seller of the option when the reference rate exceeds the specified strike rate (or the set rate at which the optioncontract can be exercised). The purpose of these agreements is to reduce exposure to rising interest rates while still having the ability to take advantage offalling interest rates by putting a "cap" on the interest rate Central Hudson pays on debt for which such caps are purchased.
· Natural gas futures are used to minimize commodity price volatility for natural gas purchases. A natural gas futures contract is a standardized contract to buyor sell a specified commodity (natural gas) of standardized quality at a certain date in the future, at a market determined price (the futures price). CentralHudson's reason for purchasing these contracts is to reduce the risk of price fluctuations for natural gas and the impact of volatility in the commodity marketson its customers.
· Natural gas swaps and contracts for differences (electricity swaps) are used to minimize commodity price volatility for natural gas and electricity purchases forCentral Hudson's full service customers. A swap contract or a contract for differences is the exchange of two payment streams between two counterpartieswhere the cash flows are dependant on the price of the underlying commodity. In an effort to moderate commodity price volatility, Central Hudson enters intocontracts to pay a fixed price and receive market price for a defined commodity and volume. These contracts are aligned with Central Hudson's actualcommodity purchases at market price, resulting in a net fixed price payment.
-171-
Table of Contents
At December 31, 2012, Central Hudson had open derivative contracts related to natural gas purchases during January 2013 - March 2013, for 1.3 million Dth, which coversapproximately 38.7% of Central Hudson's projected total natural gas supply requirements during this period. In 2012, derivative transactions covered approximately 34.5%of Central Hudson's total natural gas supply requirements as compared to 35.0% in 2011.
Additionally, Central Hudson had open derivative contracts related to electricity purchases at December 31, 2012 for 2.8 million MWh, which covers the followingapproximate percentages of its projected electricity requirements in 2013 – 2017:
Year Percentage2013 28.5%2014 28.8%2015 21.7%2016 7.2%
http://www.sec.gov/Archives/edgar/data/18647/000106139313000018/form10k.htm[8/23/2013 4:25:39 PM]
2017 7.1%
In 2012, OTC derivative contracts covered approximately 43.4% of Central Hudson's total electricity supply requirements as compared to 26.5% in 2011. The increase incoverage of financial contracts was in response to the expiration of physical contracts as discussed in Note 12 – "Commitments and Contingences".
· On March 18, 2011, Central Hudson entered into a total return master swap agreement with Bank of America with the intent to enter into future swap contractsto exchange total returns on CH Energy Group, Inc. common stock for fixed payments to Bank of America. The purpose was to reduce the volatility toearnings from deferred stock units under CH Energy Group's Directors and Executives Deferred Compensation Plan. During 2012 and 2011, the swap hasresulted in income of approximately $0.6 million and $0.4 million, respectively.
· Option contracts on heating oil are used to establish ceiling prices to limit Griffith's exposure to changes in heating oil prices for forecasted heating oil supplyrequirements for capped price programs that are not covered by firm purchase commitments. An option contract is the right, but not the obligation, to buy (fora call option) or sell (for a put option) a specific amount of the given commodity, at a specified price (the strike price) during a specified period of time.At December 31, 2012, Griffith had open OTC call option positions covering approximately 1.0% of its anticipated fuel oil supply requirements for the periodJanuary 2013 through May 2013. In 2012, derivative instruments covered 1.6% of total fuel oil requirements as compared to 1.5% in 2011.
· Weather derivative contracts are used to limit the effect on earnings of significant variances in weather conditions from normal patterns. Weather derivativesare financial instruments that can be used as part of a risk management strategy to reduce risk associated with adverse or unexpected weather conditions.
-172-
Table of Contents
Accounting for Derivatives
Central Hudson has been authorized to fully recover risk management costs as a component for its natural gas and electricity cost adjustment charge clauses. Riskmanagement costs are defined by the PSC as "costs associated with transactions that are intended to reduce price volatility or reduce overall costs to customers. These costsinclude transaction costs, and gains and losses associated with risk management instruments." The related gains and losses associated with Central Hudson's derivatives areincluded as part of Central Hudson's commodity cost and/or price-reconciled in its natural gas and electricity cost adjustment charge clauses, and are not designated ashedges. Additionally, Central Hudson has been authorized to fully recover the interest costs associated with its variable rate debt, which includes costs and gains and lossesassociated with its interest rate cap contracts. As a result, derivative activity at Central Hudson does not impact earnings.
Derivative contracts related to Griffith's heating oil contracts are not material.
Derivative Risks
The basic types of risks associated with derivatives are market risk (that the value of the derivative will be adversely impacted by changes in the market, primarily thechange in interest and exchange rates) and credit risk (that the counterparty will not perform according to the terms of the contract). The market risk of the derivativesgenerally offset the market risk associated with the hedged commodity.
The majority of Central Hudson and Griffith's derivative instruments contain provisions that require the company to maintain specified issuer credit ratings and financialstrength ratings. Should the company's ratings fall below these specified levels, it would be in violation of the provisions, and the derivatives' counterparties could terminatethe contracts and request immediate payment.
To help limit the credit exposure of their derivatives, Central Hudson and Griffith enter into master netting agreements with counterparties whereby contracts in a gainposition can be offset against contracts in a loss position. Central Hudson and Griffith both hold contracts for derivative instruments under master netting agreements. Ofthe eighteen total agreements held by both companies, eleven contain credit-risk related contingent features. As of December 31, 2012, there were twenty-four openderivative contracts under these eleven master netting agreements containing credit-risk related contingent features, of which nine contracts were in a liability position. Asof December 31, 2012, the amount that would be required to settle these instruments if the contingent features were triggered is immaterial.
CH Energy Group and Central Hudson have elected gross presentation for their derivative contracts under master netting agreements and collateral positions. On December31, 2012, neither Central Hudson nor Griffith had collateral posted against the fair value amount of derivatives.
-173-
Table of Contents
The fair value of CH Energy Group's and Central Hudson's derivative instruments and their location in the respective Balance Sheets are summarized in the table below,followed by a summarization of their effect on the respective Statements of Income. For additional information regarding Central Hudson's physical hedges, see thediscussion following the caption "Electricity Purchase Commitments" in Note 12 - "Commitments and Contingencies."
Gross Fair Value of Derivative Instruments
Current accounting guidance related to fair value measurements establishes a fair value hierarchy to prioritize the inputs used in valuation techniques based on observableand unobservable data, but not the valuation techniques themselves. Observable inputs are inputs that reflect the assumptions market participants would use in pricing theasset or liability. Unobservable inputs are inputs that reflect the reporting entity's own assumptions about the assumptions market participants would use in pricing an assetor a liability. Classification of inputs is determined based on the lowest level input that is significant to the overall valuation. The fair value hierarchy prioritizes the inputsto valuation techniques into the three categories described below:
Level 1 Inputs: Quoted prices (unadjusted) in active markets for identical assets or liabilities.
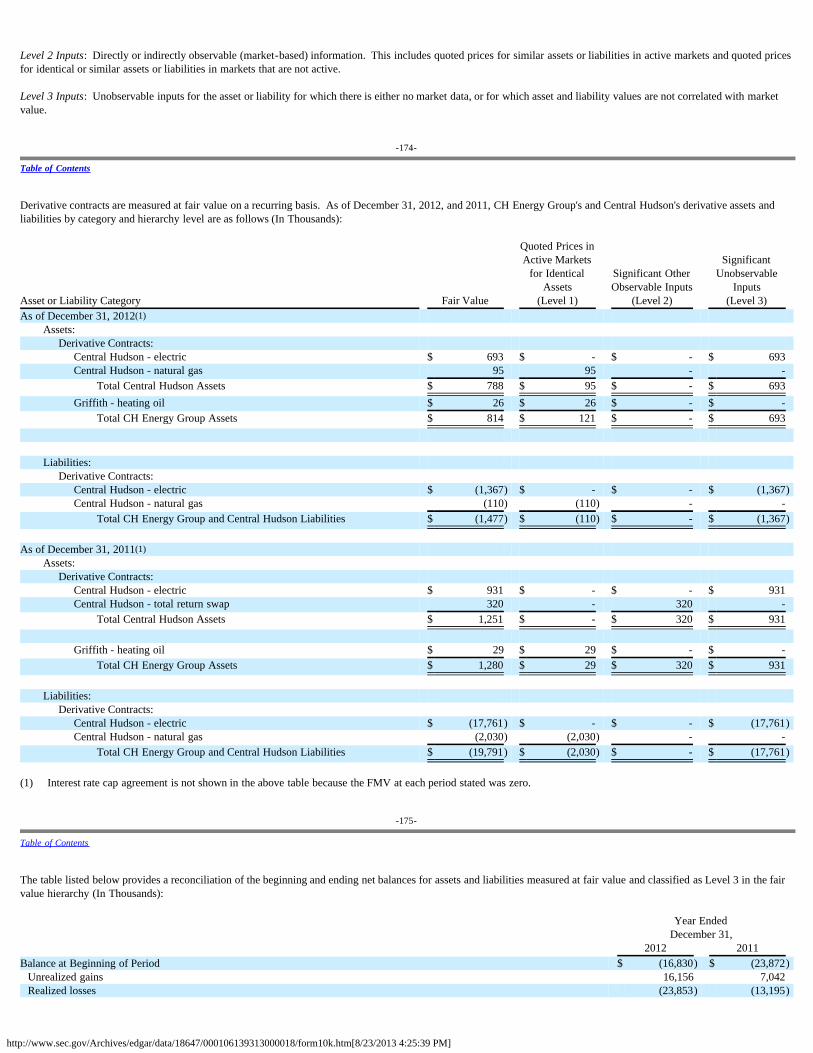
http://www.sec.gov/Archives/edgar/data/18647/000106139313000018/form10k.htm[8/23/2013 4:25:39 PM]
Level 2 Inputs: Directly or indirectly observable (market-based) information. This includes quoted prices for similar assets or liabilities in active markets and quoted pricesfor identical or similar assets or liabilities in markets that are not active.
Level 3 Inputs: Unobservable inputs for the asset or liability for which there is either no market data, or for which asset and liability values are not correlated with marketvalue.
-174-
Table of Contents
Derivative contracts are measured at fair value on a recurring basis. As of December 31, 2012, and 2011, CH Energy Group's and Central Hudson's derivative assets andliabilities by category and hierarchy level are as follows (In Thousands):
Asset or Liability Category Fair Value
Quoted Prices inActive Markets
for IdenticalAssets
(Level 1)
Significant OtherObservable Inputs
(Level 2)
SignificantUnobservable
Inputs(Level 3)
As of December 31, 2012(1)Assets:
Derivative Contracts:Central Hudson - electric $ 693 $ - $ - $ 693Central Hudson - natural gas 95 95 - -
Total Central Hudson Assets $ 788 $ 95 $ - $ 693Griffith - heating oil $ 26 $ 26 $ - $ -
Total CH Energy Group Assets $ 814 $ 121 $ - $ 693
Liabilities:Derivative Contracts:
Central Hudson - electric $ (1,367) $ - $ - $ (1,367)Central Hudson - natural gas (110) (110) - -
Total CH Energy Group and Central Hudson Liabilities $ (1,477) $ (110) $ - $ (1,367) As of December 31, 2011(1)
Assets:Derivative Contracts:
Central Hudson - electric $ 931 $ - $ - $ 931Central Hudson - total return swap 320 - 320 -
Total Central Hudson Assets $ 1,251 $ - $ 320 $ 931
Griffith - heating oil $ 29 $ 29 $ - $ -Total CH Energy Group Assets $ 1,280 $ 29 $ 320 $ 931
Liabilities:
Derivative Contracts:Central Hudson - electric $ (17,761) $ - $ - $ (17,761)Central Hudson - natural gas (2,030) (2,030) - -
Total CH Energy Group and Central Hudson Liabilities $ (19,791) $ (2,030) $ - $ (17,761) (1) Interest rate cap agreement is not shown in the above table because the FMV at each period stated was zero.
-175-
Table of Contents
The table listed below provides a reconciliation of the beginning and ending net balances for assets and liabilities measured at fair value and classified as Level 3 in the fairvalue hierarchy (In Thousands): Year Ended December 31, 2012 2011 Balance at Beginning of Period $ (16,830) $ (23,872)
Unrealized gains 16,156 7,042 Realized losses (23,853) (13,195)
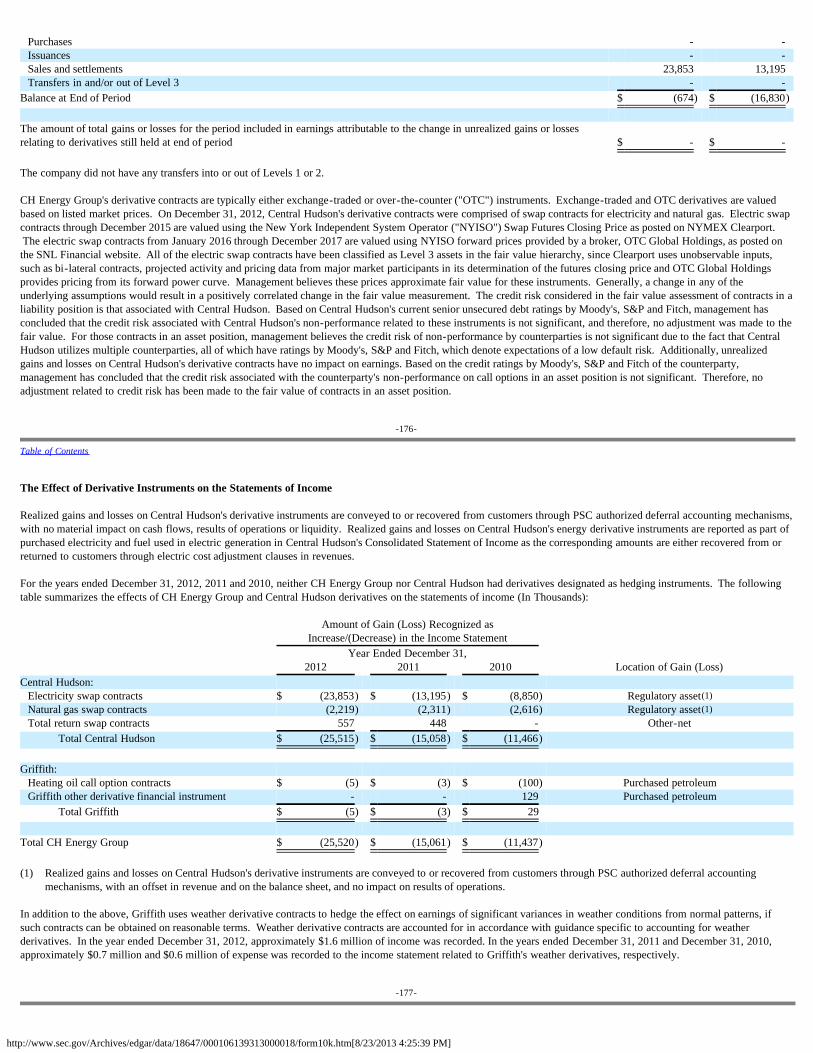
http://www.sec.gov/Archives/edgar/data/18647/000106139313000018/form10k.htm[8/23/2013 4:25:39 PM]
Purchases - - Issuances - - Sales and settlements 23,853 13,195 Transfers in and/or out of Level 3 - -
Balance at End of Period $ (674) $ (16,830) The amount of total gains or losses for the period included in earnings attributable to the change in unrealized gains or lossesrelating to derivatives still held at end of period $ - $ - The company did not have any transfers into or out of Levels 1 or 2. CH Energy Group's derivative contracts are typically either exchange-traded or over-the-counter ("OTC") instruments. Exchange-traded and OTC derivatives are valuedbased on listed market prices. On December 31, 2012, Central Hudson's derivative contracts were comprised of swap contracts for electricity and natural gas. Electric swapcontracts through December 2015 are valued using the New York Independent System Operator ("NYISO") Swap Futures Closing Price as posted on NYMEX Clearport. The electric swap contracts from January 2016 through December 2017 are valued using NYISO forward prices provided by a broker, OTC Global Holdings, as posted onthe SNL Financial website. All of the electric swap contracts have been classified as Level 3 assets in the fair value hierarchy, since Clearport uses unobservable inputs,such as bi-lateral contracts, projected activity and pricing data from major market participants in its determination of the futures closing price and OTC Global Holdingsprovides pricing from its forward power curve. Management believes these prices approximate fair value for these instruments. Generally, a change in any of theunderlying assumptions would result in a positively correlated change in the fair value measurement. The credit risk considered in the fair value assessment of contracts in aliability position is that associated with Central Hudson. Based on Central Hudson's current senior unsecured debt ratings by Moody's, S&P and Fitch, management hasconcluded that the credit risk associated with Central Hudson's non-performance related to these instruments is not significant, and therefore, no adjustment was made to thefair value. For those contracts in an asset position, management believes the credit risk of non-performance by counterparties is not significant due to the fact that CentralHudson utilizes multiple counterparties, all of which have ratings by Moody's, S&P and Fitch, which denote expectations of a low default risk. Additionally, unrealizedgains and losses on Central Hudson's derivative contracts have no impact on earnings. Based on the credit ratings by Moody's, S&P and Fitch of the counterparty,management has concluded that the credit risk associated with the counterparty's non-performance on call options in an asset position is not significant. Therefore, noadjustment related to credit risk has been made to the fair value of contracts in an asset position.
-176-
Table of Contents
The Effect of Derivative Instruments on the Statements of Income
Realized gains and losses on Central Hudson's derivative instruments are conveyed to or recovered from customers through PSC authorized deferral accounting mechanisms,with no material impact on cash flows, results of operations or liquidity. Realized gains and losses on Central Hudson's energy derivative instruments are reported as part ofpurchased electricity and fuel used in electric generation in Central Hudson's Consolidated Statement of Income as the corresponding amounts are either recovered from orreturned to customers through electric cost adjustment clauses in revenues.
For the years ended December 31, 2012, 2011 and 2010, neither CH Energy Group nor Central Hudson had derivatives designated as hedging instruments. The followingtable summarizes the effects of CH Energy Group and Central Hudson derivatives on the statements of income (In Thousands):
Amount of Gain (Loss) Recognized as
Increase/(Decrease) in the Income Statement Year Ended December 31, 2012 2011 2010 Location of Gain (Loss)Central Hudson: Electricity swap contracts $ (23,853) $ (13,195) $ (8,850) Regulatory asset(1) Natural gas swap contracts (2,219) (2,311) (2,616) Regulatory asset(1) Total return swap contracts 557 448 - Other-net
Total Central Hudson $ (25,515) $ (15,058) $ (11,466) Griffith: Heating oil call option contracts $ (5) $ (3) $ (100) Purchased petroleum Griffith other derivative financial instrument - - 129 Purchased petroleum
Total Griffith $ (5) $ (3) $ 29 Total CH Energy Group $ (25,520) $ (15,061) $ (11,437) (1) Realized gains and losses on Central Hudson's derivative instruments are conveyed to or recovered from customers through PSC authorized deferral accounting
mechanisms, with an offset in revenue and on the balance sheet, and no impact on results of operations. In addition to the above, Griffith uses weather derivative contracts to hedge the effect on earnings of significant variances in weather conditions from normal patterns, ifsuch contracts can be obtained on reasonable terms. Weather derivative contracts are accounted for in accordance with guidance specific to accounting for weatherderivatives. In the year ended December 31, 2012, approximately $1.6 million of income was recorded. In the years ended December 31, 2011 and December 31, 2010,approximately $0.7 million and $0.6 million of expense was recorded to the income statement related to Griffith's weather derivatives, respectively.
-177-
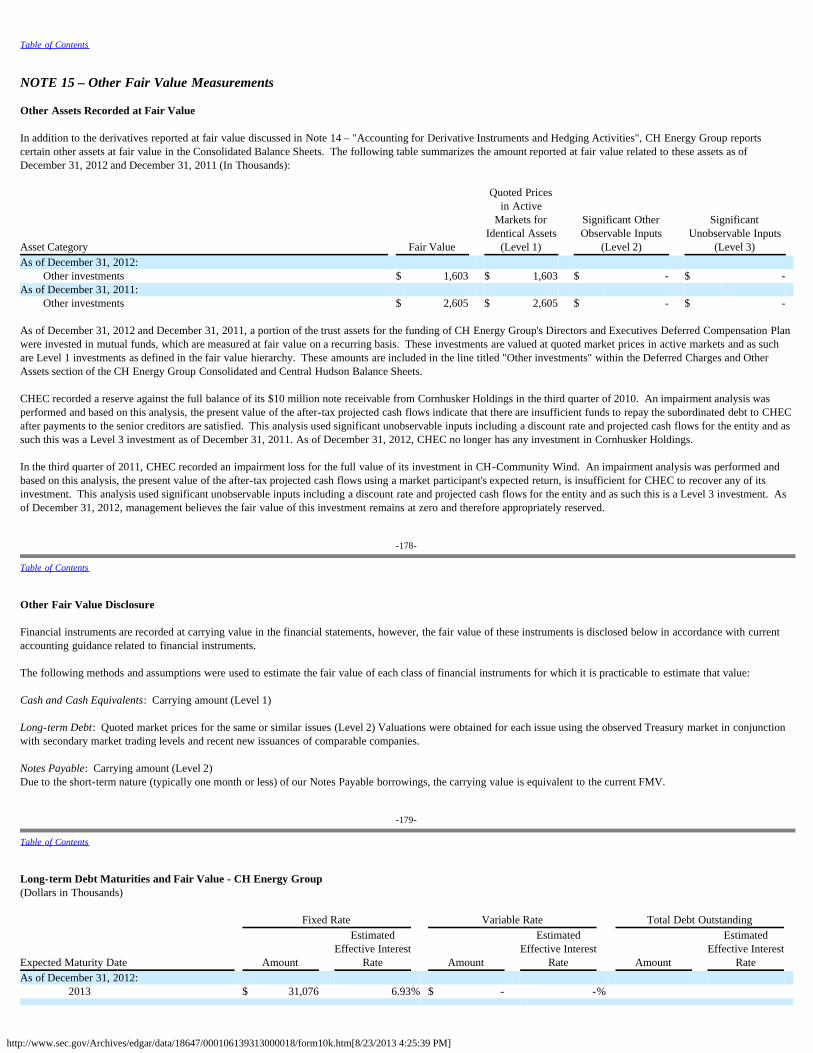
http://www.sec.gov/Archives/edgar/data/18647/000106139313000018/form10k.htm[8/23/2013 4:25:39 PM]
Table of Contents
NOTE 15 – Other Fair Value Measurements
Other Assets Recorded at Fair Value
In addition to the derivatives reported at fair value discussed in Note 14 – "Accounting for Derivative Instruments and Hedging Activities", CH Energy Group reportscertain other assets at fair value in the Consolidated Balance Sheets. The following table summarizes the amount reported at fair value related to these assets as ofDecember 31, 2012 and December 31, 2011 (In Thousands):
Asset Category Fair Value
Quoted Pricesin Active
Markets forIdentical Assets
(Level 1)
Significant OtherObservable Inputs
(Level 2)
SignificantUnobservable Inputs
(Level 3) As of December 31, 2012:
Other investments $ 1,603 $ 1,603 $ - $ - As of December 31, 2011:
Other investments $ 2,605 $ 2,605 $ - $ - As of December 31, 2012 and December 31, 2011, a portion of the trust assets for the funding of CH Energy Group's Directors and Executives Deferred Compensation Planwere invested in mutual funds, which are measured at fair value on a recurring basis. These investments are valued at quoted market prices in active markets and as suchare Level 1 investments as defined in the fair value hierarchy. These amounts are included in the line titled "Other investments" within the Deferred Charges and OtherAssets section of the CH Energy Group Consolidated and Central Hudson Balance Sheets.
CHEC recorded a reserve against the full balance of its $10 million note receivable from Cornhusker Holdings in the third quarter of 2010. An impairment analysis wasperformed and based on this analysis, the present value of the after-tax projected cash flows indicate that there are insufficient funds to repay the subordinated debt to CHECafter payments to the senior creditors are satisfied. This analysis used significant unobservable inputs including a discount rate and projected cash flows for the entity and assuch this was a Level 3 investment as of December 31, 2011. As of December 31, 2012, CHEC no longer has any investment in Cornhusker Holdings.
In the third quarter of 2011, CHEC recorded an impairment loss for the full value of its investment in CH-Community Wind. An impairment analysis was performed andbased on this analysis, the present value of the after-tax projected cash flows using a market participant's expected return, is insufficient for CHEC to recover any of itsinvestment. This analysis used significant unobservable inputs including a discount rate and projected cash flows for the entity and as such this is a Level 3 investment. Asof December 31, 2012, management believes the fair value of this investment remains at zero and therefore appropriately reserved.
-178-
Table of Contents
Other Fair Value Disclosure
Financial instruments are recorded at carrying value in the financial statements, however, the fair value of these instruments is disclosed below in accordance with currentaccounting guidance related to financial instruments.
The following methods and assumptions were used to estimate the fair value of each class of financial instruments for which it is practicable to estimate that value:
Cash and Cash Equivalents: Carrying amount (Level 1)
Long-term Debt: Quoted market prices for the same or similar issues (Level 2) Valuations were obtained for each issue using the observed Treasury market in conjunctionwith secondary market trading levels and recent new issuances of comparable companies.
Notes Payable: Carrying amount (Level 2)Due to the short-term nature (typically one month or less) of our Notes Payable borrowings, the carrying value is equivalent to the current FMV.
-179-
Table of Contents
Long-term Debt Maturities and Fair Value - CH Energy Group(Dollars in Thousands) Fixed Rate Variable Rate Total Debt Outstanding
Expected Maturity Date Amount
EstimatedEffective Interest
Rate Amount
EstimatedEffective Interest
Rate Amount
EstimatedEffective Interest
Rate As of December 31, 2012:
2013 $ 31,076 6.93% $ - -%
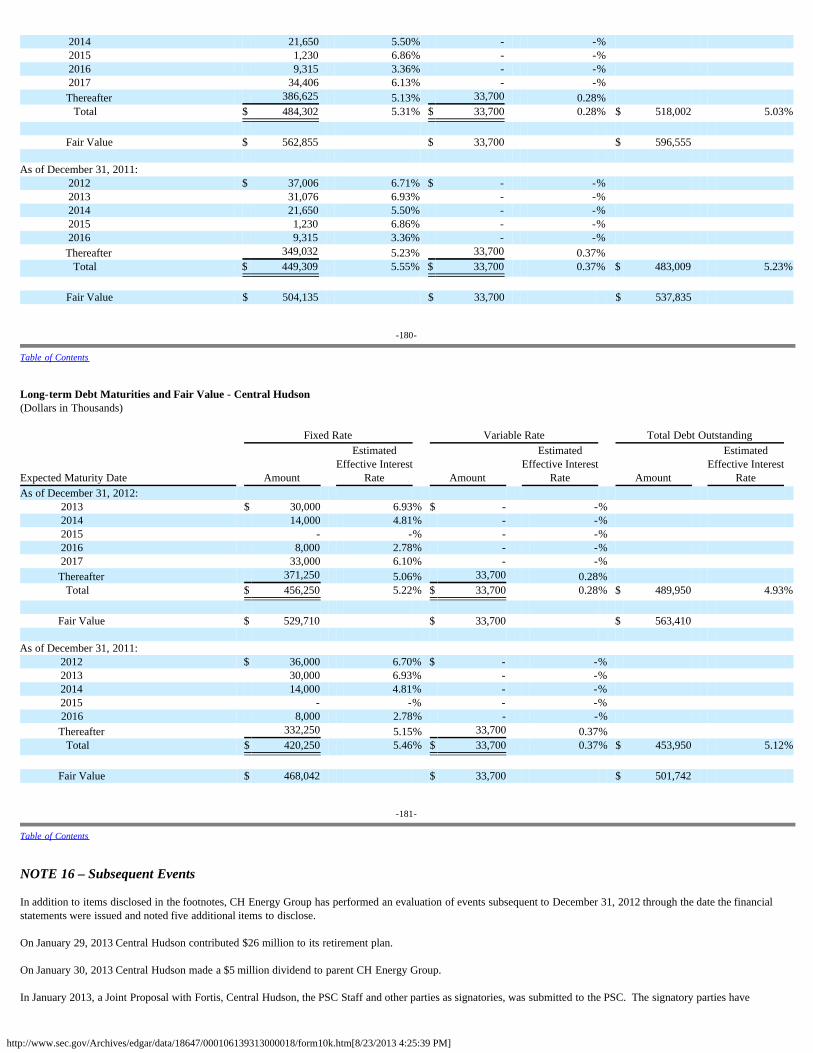
http://www.sec.gov/Archives/edgar/data/18647/000106139313000018/form10k.htm[8/23/2013 4:25:39 PM]
2014 21,650 5.50% - -% 2015 1,230 6.86% - -% 2016 9,315 3.36% - -% 2017 34,406 6.13% - -% Thereafter 386,625 5.13% 33,700 0.28% Total $ 484,302 5.31% $ 33,700 0.28% $ 518,002 5.03%
Fair Value $ 562,855 $ 33,700 $ 596,555
As of December 31, 2011:
2012 $ 37,006 6.71% $ - -% 2013 31,076 6.93% - -% 2014 21,650 5.50% - -% 2015 1,230 6.86% - -% 2016 9,315 3.36% - -% Thereafter 349,032 5.23% 33,700 0.37% Total $ 449,309 5.55% $ 33,700 0.37% $ 483,009 5.23%
Fair Value $ 504,135 $ 33,700 $ 537,835
-180-
Table of Contents
Long-term Debt Maturities and Fair Value - Central Hudson(Dollars in Thousands) Fixed Rate Variable Rate Total Debt Outstanding
Expected Maturity Date Amount
EstimatedEffective Interest
Rate Amount
EstimatedEffective Interest
Rate Amount
EstimatedEffective Interest
Rate As of December 31, 2012:
2013 $ 30,000 6.93% $ - -% 2014 14,000 4.81% - -% 2015 - -% - -% 2016 8,000 2.78% - -% 2017 33,000 6.10% - -% Thereafter 371,250 5.06% 33,700 0.28% Total $ 456,250 5.22% $ 33,700 0.28% $ 489,950 4.93%
Fair Value $ 529,710 $ 33,700 $ 563,410
As of December 31, 2011:
2012 $ 36,000 6.70% $ - -% 2013 30,000 6.93% - -% 2014 14,000 4.81% - -% 2015 - -% - -% 2016 8,000 2.78% - -% Thereafter 332,250 5.15% 33,700 0.37% Total $ 420,250 5.46% $ 33,700 0.37% $ 453,950 5.12%
Fair Value $ 468,042 $ 33,700 $ 501,742
-181-
Table of Contents
NOTE 16 – Subsequent Events
In addition to items disclosed in the footnotes, CH Energy Group has performed an evaluation of events subsequent to December 31, 2012 through the date the financialstatements were issued and noted five additional items to disclose.
On January 29, 2013 Central Hudson contributed $26 million to its retirement plan. On January 30, 2013 Central Hudson made a $5 million dividend to parent CH Energy Group. In January 2013, a Joint Proposal with Fortis, Central Hudson, the PSC Staff and other parties as signatories, was submitted to the PSC. The signatory parties have
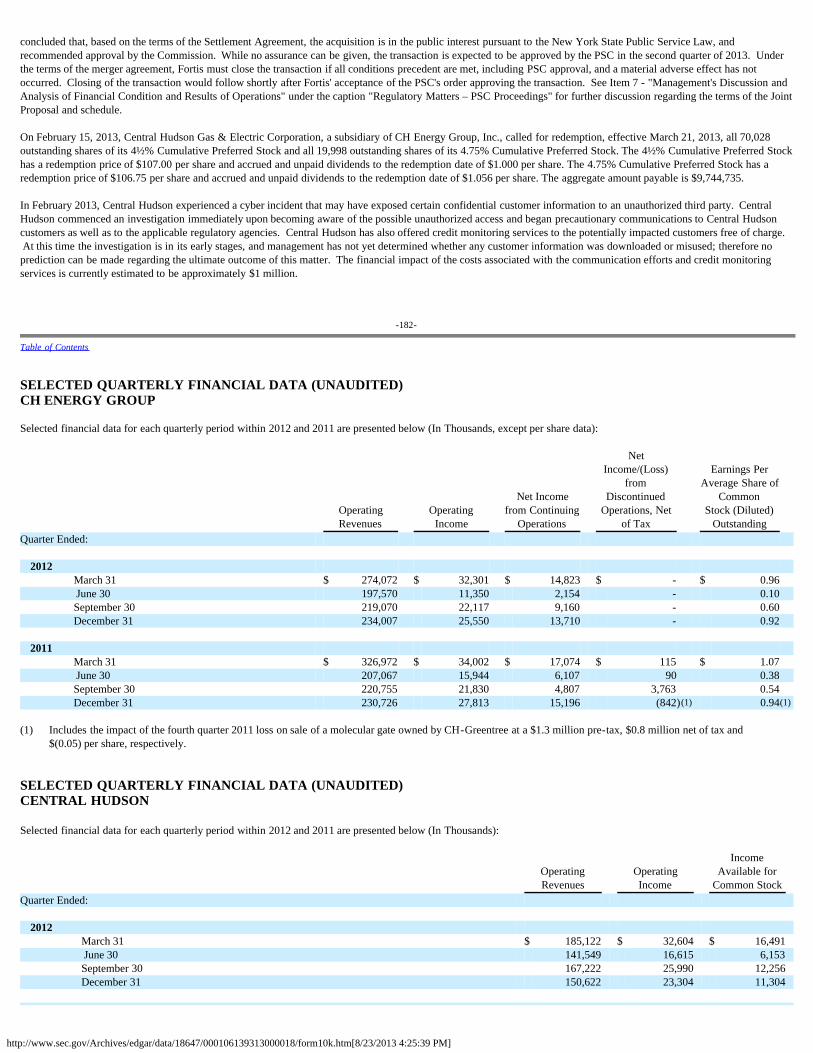
http://www.sec.gov/Archives/edgar/data/18647/000106139313000018/form10k.htm[8/23/2013 4:25:39 PM]
concluded that, based on the terms of the Settlement Agreement, the acquisition is in the public interest pursuant to the New York State Public Service Law, andrecommended approval by the Commission. While no assurance can be given, the transaction is expected to be approved by the PSC in the second quarter of 2013. Underthe terms of the merger agreement, Fortis must close the transaction if all conditions precedent are met, including PSC approval, and a material adverse effect has notoccurred. Closing of the transaction would follow shortly after Fortis' acceptance of the PSC's order approving the transaction. See Item 7 - "Management's Discussion andAnalysis of Financial Condition and Results of Operations" under the caption "Regulatory Matters – PSC Proceedings" for further discussion regarding the terms of the JointProposal and schedule. On February 15, 2013, Central Hudson Gas & Electric Corporation, a subsidiary of CH Energy Group, Inc., called for redemption, effective March 21, 2013, all 70,028outstanding shares of its 4½% Cumulative Preferred Stock and all 19,998 outstanding shares of its 4.75% Cumulative Preferred Stock. The 4½% Cumulative Preferred Stockhas a redemption price of $107.00 per share and accrued and unpaid dividends to the redemption date of $1.000 per share. The 4.75% Cumulative Preferred Stock has aredemption price of $106.75 per share and accrued and unpaid dividends to the redemption date of $1.056 per share. The aggregate amount payable is $9,744,735. In February 2013, Central Hudson experienced a cyber incident that may have exposed certain confidential customer information to an unauthorized third party. CentralHudson commenced an investigation immediately upon becoming aware of the possible unauthorized access and began precautionary communications to Central Hudsoncustomers as well as to the applicable regulatory agencies. Central Hudson has also offered credit monitoring services to the potentially impacted customers free of charge. At this time the investigation is in its early stages, and management has not yet determined whether any customer information was downloaded or misused; therefore noprediction can be made regarding the ultimate outcome of this matter. The financial impact of the costs associated with the communication efforts and credit monitoringservices is currently estimated to be approximately $1 million.
-182-
Table of Contents
SELECTED QUARTERLY FINANCIAL DATA (UNAUDITED)CH ENERGY GROUP Selected financial data for each quarterly period within 2012 and 2011 are presented below (In Thousands, except per share data):
OperatingRevenues
OperatingIncome
Net Incomefrom Continuing
Operations
NetIncome/(Loss)
fromDiscontinued
Operations, Netof Tax
Earnings PerAverage Share of
CommonStock (Diluted)
Outstanding Quarter Ended:
2012 March 31 $ 274,072 $ 32,301 $ 14,823 $ - $ 0.96 June 30 197,570 11,350 2,154 - 0.10 September 30 219,070 22,117 9,160 - 0.60 December 31 234,007 25,550 13,710 - 0.92
2011
March 31 $ 326,972 $ 34,002 $ 17,074 $ 115 $ 1.07 June 30 207,067 15,944 6,107 90 0.38 September 30 220,755 21,830 4,807 3,763 0.54 December 31 230,726 27,813 15,196 (842)(1) 0.94(1)
(1) Includes the impact of the fourth quarter 2011 loss on sale of a molecular gate owned by CH-Greentree at a $1.3 million pre-tax, $0.8 million net of tax and
$(0.05) per share, respectively. SELECTED QUARTERLY FINANCIAL DATA (UNAUDITED)CENTRAL HUDSON Selected financial data for each quarterly period within 2012 and 2011 are presented below (In Thousands):
OperatingRevenues
OperatingIncome
IncomeAvailable for
Common Stock Quarter Ended:
2012 March 31 $ 185,122 $ 32,604 $ 16,491 June 30 141,549 16,615 6,153 September 30 167,222 25,990 12,256 December 31 150,622 23,304 11,304
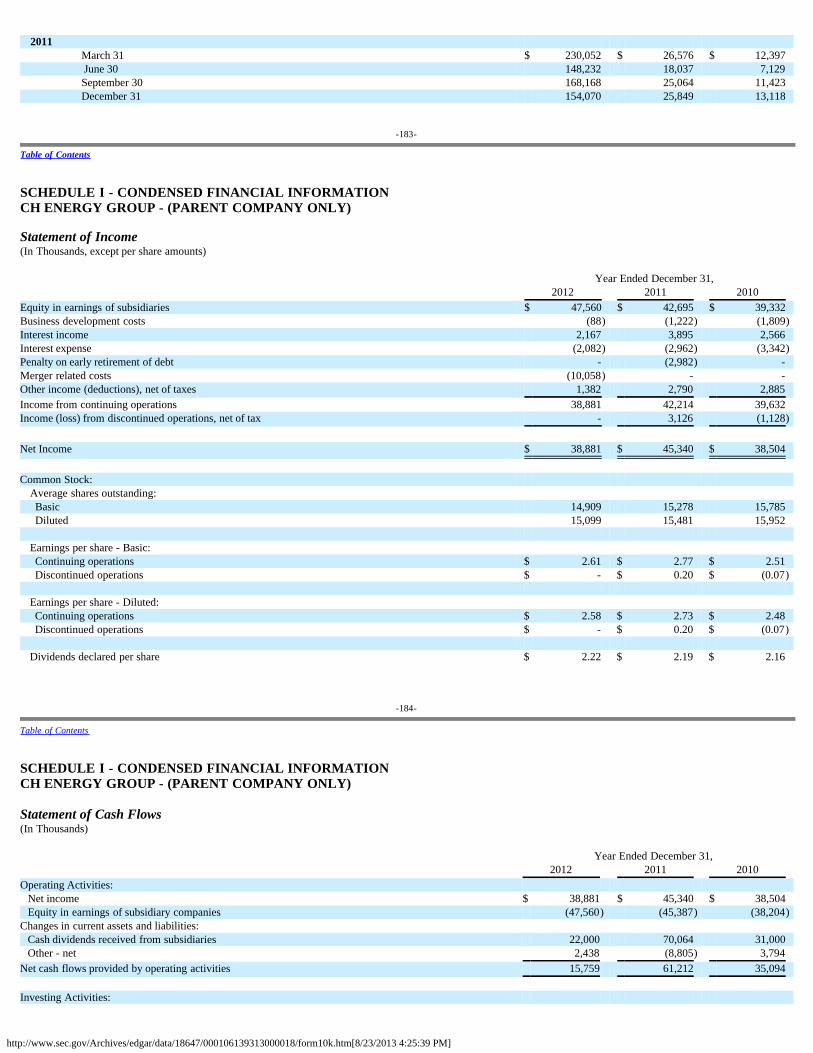
http://www.sec.gov/Archives/edgar/data/18647/000106139313000018/form10k.htm[8/23/2013 4:25:39 PM]
2011 March 31 $ 230,052 $ 26,576 $ 12,397 June 30 148,232 18,037 7,129 September 30 168,168 25,064 11,423 December 31 154,070 25,849 13,118
-183-
Table of Contents
SCHEDULE I - CONDENSED FINANCIAL INFORMATIONCH ENERGY GROUP - (PARENT COMPANY ONLY) Statement of Income(In Thousands, except per share amounts) Year Ended December 31,
2012 2011 2010 Equity in earnings of subsidiaries $ 47,560 $ 42,695 $ 39,332 Business development costs (88) (1,222) (1,809)Interest income 2,167 3,895 2,566 Interest expense (2,082) (2,962) (3,342)Penalty on early retirement of debt - (2,982) - Merger related costs (10,058) - - Other income (deductions), net of taxes 1,382 2,790 2,885 Income from continuing operations 38,881 42,214 39,632 Income (loss) from discontinued operations, net of tax - 3,126 (1,128) Net Income $ 38,881 $ 45,340 $ 38,504 Common Stock: Average shares outstanding:
Basic 14,909 15,278 15,785 Diluted 15,099 15,481 15,952
Earnings per share - Basic:
Continuing operations $ 2.61 $ 2.77 $ 2.51 Discontinued operations $ - $ 0.20 $ (0.07)
Earnings per share - Diluted:
Continuing operations $ 2.58 $ 2.73 $ 2.48 Discontinued operations $ - $ 0.20 $ (0.07)
Dividends declared per share $ 2.22 $ 2.19 $ 2.16
-184-
Table of Contents
SCHEDULE I - CONDENSED FINANCIAL INFORMATIONCH ENERGY GROUP - (PARENT COMPANY ONLY) Statement of Cash Flows(In Thousands) Year Ended December 31,
2012 2011 2010 Operating Activities:
Net income $ 38,881 $ 45,340 $ 38,504 Equity in earnings of subsidiary companies (47,560) (45,387) (38,204)
Changes in current assets and liabilities: Cash dividends received from subsidiaries 22,000 70,064 31,000 Other - net 2,438 (8,805) 3,794
Net cash flows provided by operating activities 15,759 61,212 35,094 Investing Activities:
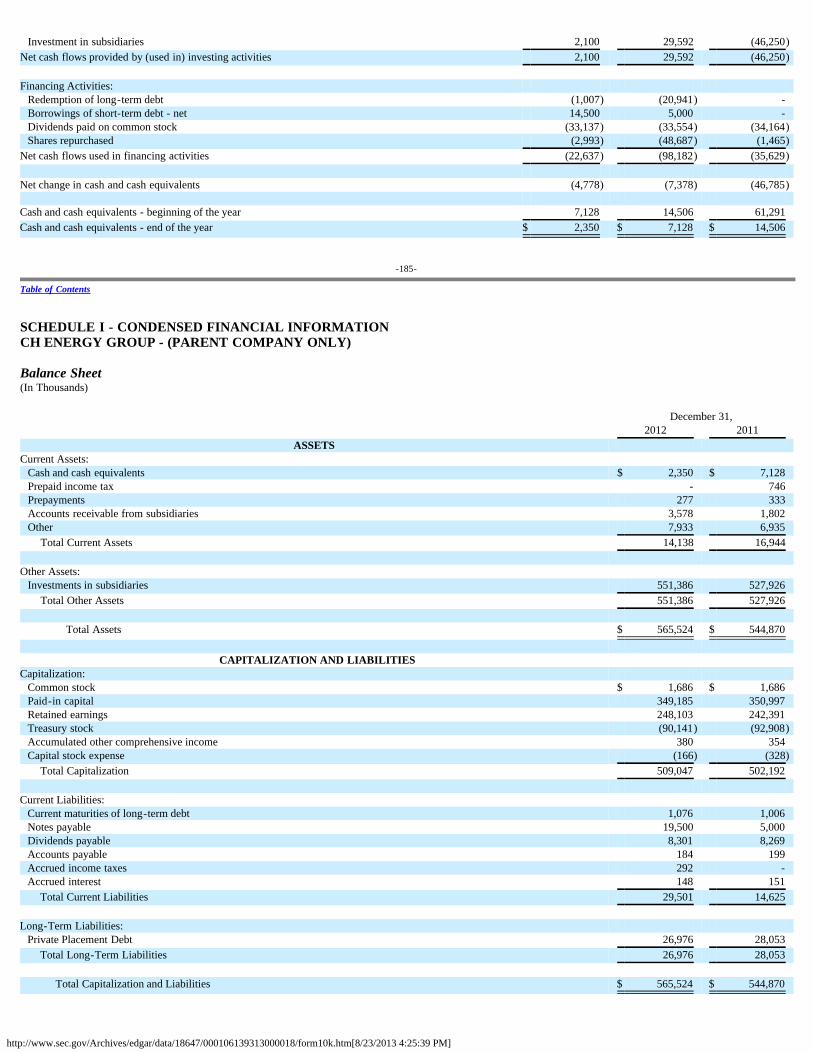
http://www.sec.gov/Archives/edgar/data/18647/000106139313000018/form10k.htm[8/23/2013 4:25:39 PM]
Investment in subsidiaries 2,100 29,592 (46,250)Net cash flows provided by (used in) investing activities 2,100 29,592 (46,250) Financing Activities:
Redemption of long-term debt (1,007) (20,941) - Borrowings of short-term debt - net 14,500 5,000 - Dividends paid on common stock (33,137) (33,554) (34,164)Shares repurchased (2,993) (48,687) (1,465)
Net cash flows used in financing activities (22,637) (98,182) (35,629) Net change in cash and cash equivalents (4,778) (7,378) (46,785) Cash and cash equivalents - beginning of the year 7,128 14,506 61,291 Cash and cash equivalents - end of the year $ 2,350 $ 7,128 $ 14,506
-185-
Table of Contents
SCHEDULE I - CONDENSED FINANCIAL INFORMATIONCH ENERGY GROUP - (PARENT COMPANY ONLY) Balance Sheet(In Thousands) December 31,
2012 2011 ASSETS
Current Assets: Cash and cash equivalents $ 2,350 $ 7,128 Prepaid income tax - 746 Prepayments 277 333 Accounts receivable from subsidiaries 3,578 1,802 Other 7,933 6,935 Total Current Assets 14,138 16,944
Other Assets:
Investments in subsidiaries 551,386 527,926 Total Other Assets 551,386 527,926
Total Assets $ 565,524 $ 544,870
CAPITALIZATION AND LIABILITIES
Capitalization: Common stock $ 1,686 $ 1,686 Paid-in capital 349,185 350,997 Retained earnings 248,103 242,391 Treasury stock (90,141) (92,908)Accumulated other comprehensive income 380 354 Capital stock expense (166) (328) Total Capitalization 509,047 502,192
Current Liabilities:
Current maturities of long-term debt 1,076 1,006 Notes payable 19,500 5,000 Dividends payable 8,301 8,269 Accounts payable 184 199 Accrued income taxes 292 - Accrued interest 148 151 Total Current Liabilities 29,501 14,625
Long-Term Liabilities:
Private Placement Debt 26,976 28,053 Total Long-Term Liabilities 26,976 28,053
Total Capitalization and Liabilities $ 565,524 $ 544,870
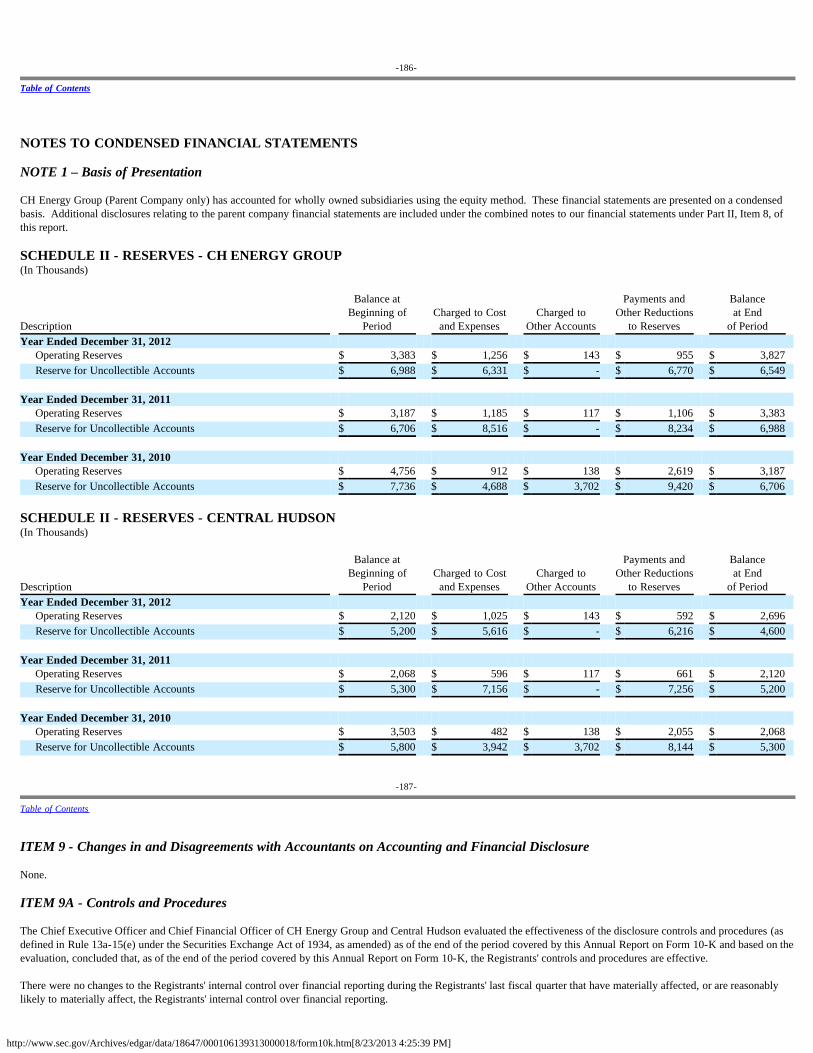
http://www.sec.gov/Archives/edgar/data/18647/000106139313000018/form10k.htm[8/23/2013 4:25:39 PM]
-186-
Table of Contents
NOTES TO CONDENSED FINANCIAL STATEMENTS
NOTE 1 – Basis of Presentation
CH Energy Group (Parent Company only) has accounted for wholly owned subsidiaries using the equity method. These financial statements are presented on a condensedbasis. Additional disclosures relating to the parent company financial statements are included under the combined notes to our financial statements under Part II, Item 8, ofthis report. SCHEDULE II - RESERVES - CH ENERGY GROUP(In Thousands)
Description
Balance atBeginning of
Period Charged to Cost
and Expenses Charged to
Other Accounts
Payments andOther Reductions
to Reserves
Balanceat End
of Period Year Ended December 31, 2012
Operating Reserves $ 3,383 $ 1,256 $ 143 $ 955 $ 3,827 Reserve for Uncollectible Accounts $ 6,988 $ 6,331 $ - $ 6,770 $ 6,549
Year Ended December 31, 2011
Operating Reserves $ 3,187 $ 1,185 $ 117 $ 1,106 $ 3,383 Reserve for Uncollectible Accounts $ 6,706 $ 8,516 $ - $ 8,234 $ 6,988
Year Ended December 31, 2010
Operating Reserves $ 4,756 $ 912 $ 138 $ 2,619 $ 3,187 Reserve for Uncollectible Accounts $ 7,736 $ 4,688 $ 3,702 $ 9,420 $ 6,706
SCHEDULE II - RESERVES - CENTRAL HUDSON(In Thousands)
Description
Balance atBeginning of
Period Charged to Cost
and Expenses Charged to
Other Accounts
Payments andOther Reductions
to Reserves
Balanceat End
of Period Year Ended December 31, 2012
Operating Reserves $ 2,120 $ 1,025 $ 143 $ 592 $ 2,696 Reserve for Uncollectible Accounts $ 5,200 $ 5,616 $ - $ 6,216 $ 4,600
Year Ended December 31, 2011
Operating Reserves $ 2,068 $ 596 $ 117 $ 661 $ 2,120 Reserve for Uncollectible Accounts $ 5,300 $ 7,156 $ - $ 7,256 $ 5,200
Year Ended December 31, 2010
Operating Reserves $ 3,503 $ 482 $ 138 $ 2,055 $ 2,068 Reserve for Uncollectible Accounts $ 5,800 $ 3,942 $ 3,702 $ 8,144 $ 5,300
-187-
Table of Contents
ITEM 9 - Changes in and Disagreements with Accountants on Accounting and Financial Disclosure None.
ITEM 9A - Controls and Procedures
The Chief Executive Officer and Chief Financial Officer of CH Energy Group and Central Hudson evaluated the effectiveness of the disclosure controls and procedures (asdefined in Rule 13a-15(e) under the Securities Exchange Act of 1934, as amended) as of the end of the period covered by this Annual Report on Form 10-K and based on theevaluation, concluded that, as of the end of the period covered by this Annual Report on Form 10-K, the Registrants' controls and procedures are effective.
There were no changes to the Registrants' internal control over financial reporting during the Registrants' last fiscal quarter that have materially affected, or are reasonablylikely to materially affect, the Registrants' internal control over financial reporting.
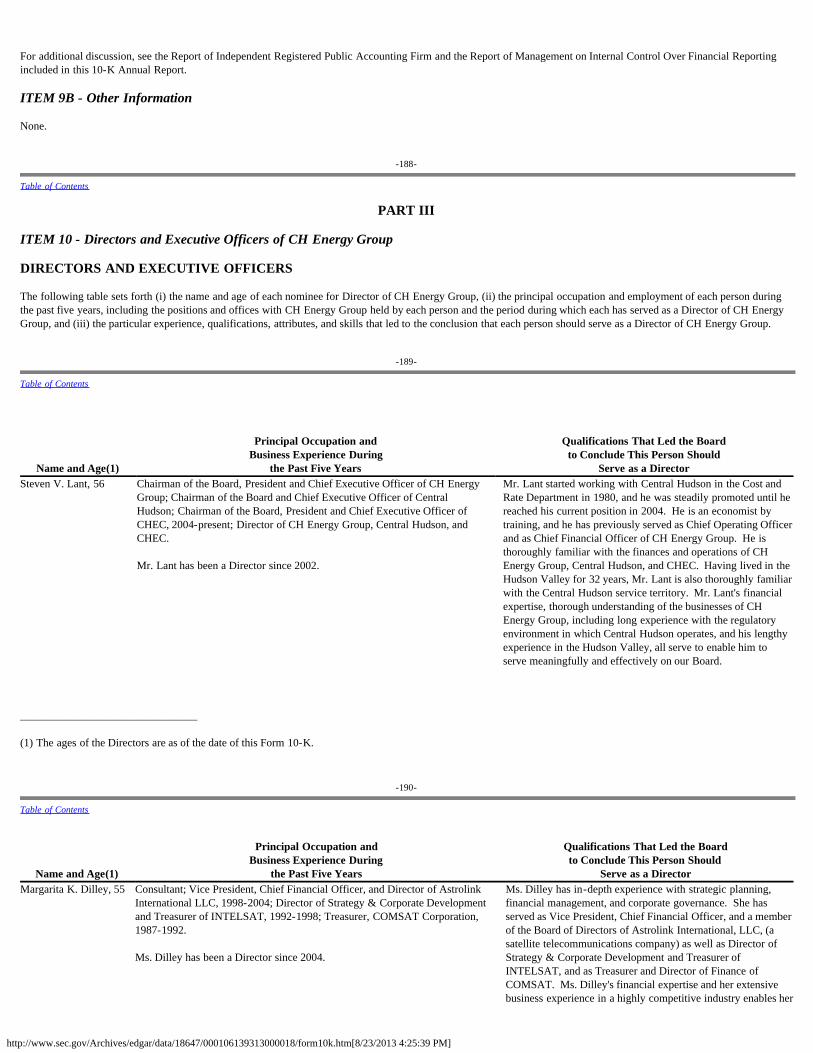
http://www.sec.gov/Archives/edgar/data/18647/000106139313000018/form10k.htm[8/23/2013 4:25:39 PM]
For additional discussion, see the Report of Independent Registered Public Accounting Firm and the Report of Management on Internal Control Over Financial Reportingincluded in this 10-K Annual Report.
ITEM 9B - Other Information
None.
-188-
Table of Contents
PART III ITEM 10 - Directors and Executive Officers of CH Energy Group DIRECTORS AND EXECUTIVE OFFICERS
The following table sets forth (i) the name and age of each nominee for Director of CH Energy Group, (ii) the principal occupation and employment of each person duringthe past five years, including the positions and offices with CH Energy Group held by each person and the period during which each has served as a Director of CH EnergyGroup, and (iii) the particular experience, qualifications, attributes, and skills that led to the conclusion that each person should serve as a Director of CH Energy Group.
-189-
Table of Contents
Name and Age(1)
Principal Occupation andBusiness Experience During
the Past Five Years
Qualifications That Led the Boardto Conclude This Person Should
Serve as a DirectorSteven V. Lant, 56
Chairman of the Board, President and Chief Executive Officer of CH EnergyGroup; Chairman of the Board and Chief Executive Officer of CentralHudson; Chairman of the Board, President and Chief Executive Officer ofCHEC, 2004-present; Director of CH Energy Group, Central Hudson, andCHEC. Mr. Lant has been a Director since 2002.
Mr. Lant started working with Central Hudson in the Cost andRate Department in 1980, and he was steadily promoted until hereached his current position in 2004. He is an economist bytraining, and he has previously served as Chief Operating Officerand as Chief Financial Officer of CH Energy Group. He isthoroughly familiar with the finances and operations of CHEnergy Group, Central Hudson, and CHEC. Having lived in theHudson Valley for 32 years, Mr. Lant is also thoroughly familiarwith the Central Hudson service territory. Mr. Lant's financialexpertise, thorough understanding of the businesses of CHEnergy Group, including long experience with the regulatoryenvironment in which Central Hudson operates, and his lengthyexperience in the Hudson Valley, all serve to enable him toserve meaningfully and effectively on our Board.
________________________________
(1) The ages of the Directors are as of the date of this Form 10-K.
-190-
Table of Contents
Name and Age(1)
Principal Occupation andBusiness Experience During
the Past Five Years
Qualifications That Led the Boardto Conclude This Person Should
Serve as a DirectorMargarita K. Dilley, 55
Consultant; Vice President, Chief Financial Officer, and Director of AstrolinkInternational LLC, 1998-2004; Director of Strategy & Corporate Developmentand Treasurer of INTELSAT, 1992-1998; Treasurer, COMSAT Corporation,1987-1992. Ms. Dilley has been a Director since 2004.
Ms. Dilley has in-depth experience with strategic planning,financial management, and corporate governance. She hasserved as Vice President, Chief Financial Officer, and a memberof the Board of Directors of Astrolink International, LLC, (asatellite telecommunications company) as well as Director ofStrategy & Corporate Development and Treasurer ofINTELSAT, and as Treasurer and Director of Finance ofCOMSAT. Ms. Dilley's financial expertise and her extensivebusiness experience in a highly competitive industry enables her

http://www.sec.gov/Archives/edgar/data/18647/000106139313000018/form10k.htm[8/23/2013 4:25:39 PM]
to serve meaningfully and effectively on our Board. Innominating Ms. Dilley, the Governance and NominatingCommittee also gave positive consideration to her qualificationto serve as an "audit committee financial expert."
________________________________
(1) The ages of the Directors are as of the date of this Form 10-K.
-191-
Table of Contents
Name and Age(1)
Principal Occupation andBusiness Experience During
the Past Five Years
Qualifications That Led the Boardto Conclude This Person Should
Serve as a DirectorSteven M. Fetter, 61
President, Regulation UnFettered, a consulting firm, 2002-present; GroupHead and Managing Director, Global Power Group, Fitch Ratings, 1998-2002;Chairman and Commissioner of the Michigan Public Service Commission,1987-1993; Acting Associate Deputy Under Secretary of Labor, U.S.Department of Labor, 1987; Majority General Counsel, Michigan State Senate,1984-1985. Mr. Fetter has been a Director since 2002.
Mr. Fetter has extensive experience in connection with theregulated utility industry, having served as the Chairman of theMichigan Public Service Commission and as Group Head andManaging Director of the Global Power Group within FitchRatings. He currently serves as President of RegulationUnFettered, a consulting firm specializing in matters relating tothe regulation of electric and natural gas utilities. Mr. Fetter'sextensive experience in the energy industry enables him toserve meaningfully and effectively on our Board.
________________________________
(1) The ages of the Directors are as of the date of this Form 10-K.
-192-
Table of Contents
Name and Age(1)
Principal Occupation andBusiness Experience During
the Past Five Years
Qualifications That Led the Boardto Conclude This Person Should
Serve as a DirectorStanley J. Grubel, 70
Consultant; Director, Asyst Technologies, Inc., 1997-2009; Vice President andGeneral Manager, Philips Semiconductor Manufacturing, Inc., 2000-2001;Chief Executive Officer, MiCRUS, 1995-2000. Mr. Grubel has been a Director since 1999.
Mr. Grubel previously served as the Chief Executive Officer ofMiCRUS, an advanced semiconductor manufacturing companyemploying approximately 1,300 employees in the CentralHudson service territory. Mr. Grubel also served as a Director ofthe New York Business Council and as Chair of the Marist
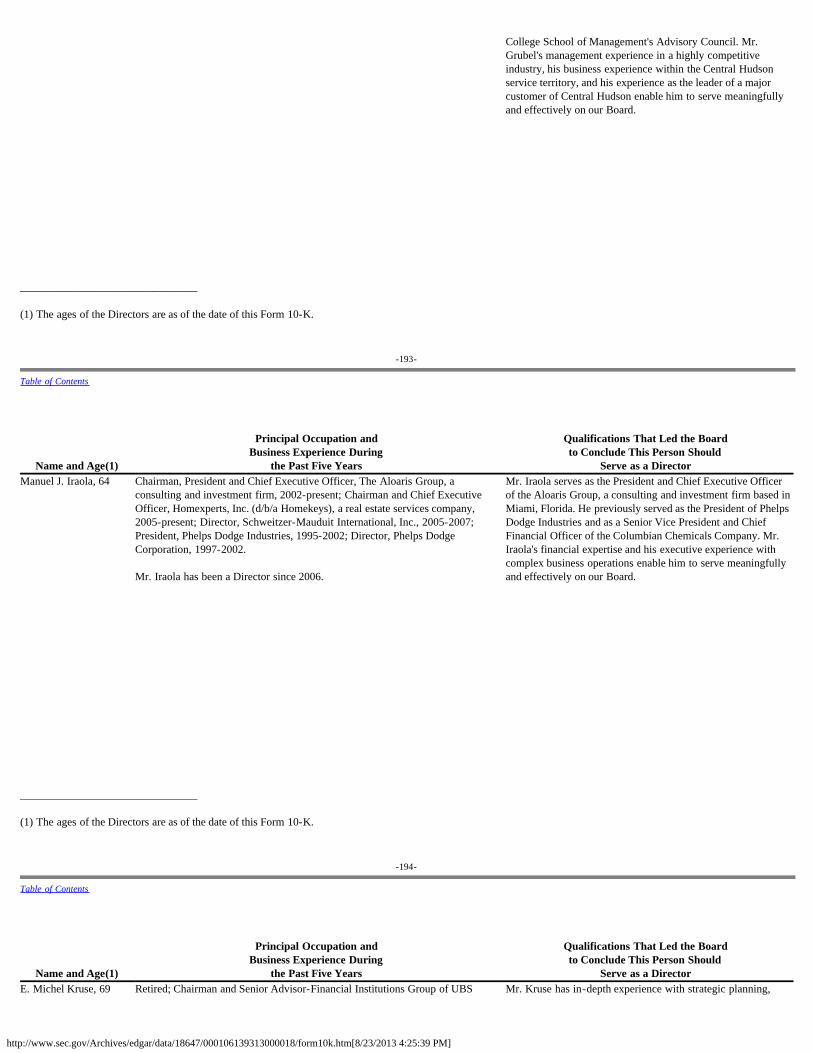
http://www.sec.gov/Archives/edgar/data/18647/000106139313000018/form10k.htm[8/23/2013 4:25:39 PM]
College School of Management's Advisory Council. Mr.Grubel's management experience in a highly competitiveindustry, his business experience within the Central Hudsonservice territory, and his experience as the leader of a majorcustomer of Central Hudson enable him to serve meaningfullyand effectively on our Board.
________________________________
(1) The ages of the Directors are as of the date of this Form 10-K.
-193-
Table of Contents
Name and Age(1)
Principal Occupation andBusiness Experience During
the Past Five Years
Qualifications That Led the Boardto Conclude This Person Should
Serve as a DirectorManuel J. Iraola, 64
Chairman, President and Chief Executive Officer, The Aloaris Group, aconsulting and investment firm, 2002-present; Chairman and Chief ExecutiveOfficer, Homexperts, Inc. (d/b/a Homekeys), a real estate services company,2005-present; Director, Schweitzer-Mauduit International, Inc., 2005-2007;President, Phelps Dodge Industries, 1995-2002; Director, Phelps DodgeCorporation, 1997-2002. Mr. Iraola has been a Director since 2006.
Mr. Iraola serves as the President and Chief Executive Officerof the Aloaris Group, a consulting and investment firm based inMiami, Florida. He previously served as the President of PhelpsDodge Industries and as a Senior Vice President and ChiefFinancial Officer of the Columbian Chemicals Company. Mr.Iraola's financial expertise and his executive experience withcomplex business operations enable him to serve meaningfullyand effectively on our Board.
________________________________
(1) The ages of the Directors are as of the date of this Form 10-K.
-194-
Table of Contents
Name and Age(1)
Principal Occupation andBusiness Experience During
the Past Five Years
Qualifications That Led the Boardto Conclude This Person Should
Serve as a DirectorE. Michel Kruse, 69 Retired; Chairman and Senior Advisor-Financial Institutions Group of UBS Mr. Kruse has in-depth experience with strategic planning,
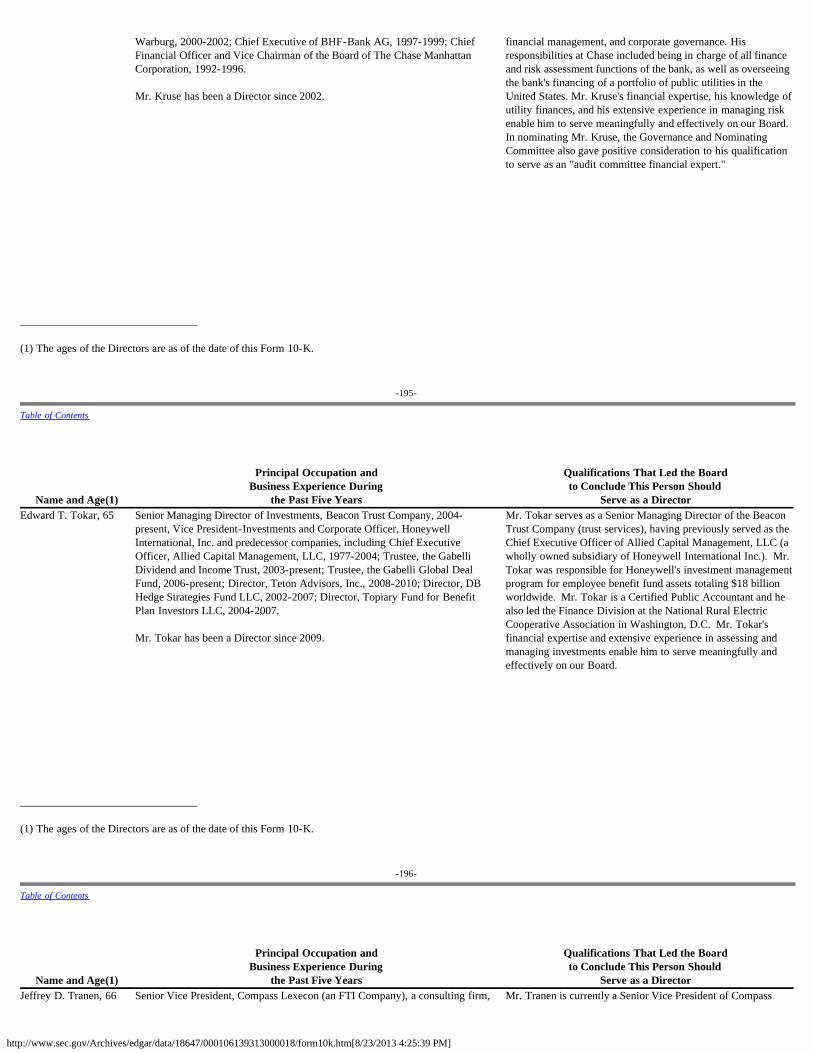
http://www.sec.gov/Archives/edgar/data/18647/000106139313000018/form10k.htm[8/23/2013 4:25:39 PM]
Warburg, 2000-2002; Chief Executive of BHF-Bank AG, 1997-1999; ChiefFinancial Officer and Vice Chairman of the Board of The Chase ManhattanCorporation, 1992-1996. Mr. Kruse has been a Director since 2002.
financial management, and corporate governance. Hisresponsibilities at Chase included being in charge of all financeand risk assessment functions of the bank, as well as overseeingthe bank's financing of a portfolio of public utilities in theUnited States. Mr. Kruse's financial expertise, his knowledge ofutility finances, and his extensive experience in managing riskenable him to serve meaningfully and effectively on our Board.In nominating Mr. Kruse, the Governance and NominatingCommittee also gave positive consideration to his qualificationto serve as an "audit committee financial expert."
________________________________
(1) The ages of the Directors are as of the date of this Form 10-K.
-195-
Table of Contents
Name and Age(1)
Principal Occupation andBusiness Experience During
the Past Five Years
Qualifications That Led the Boardto Conclude This Person Should
Serve as a DirectorEdward T. Tokar, 65
Senior Managing Director of Investments, Beacon Trust Company, 2004-present, Vice President-Investments and Corporate Officer, HoneywellInternational, Inc. and predecessor companies, including Chief ExecutiveOfficer, Allied Capital Management, LLC, 1977-2004; Trustee, the GabelliDividend and Income Trust, 2003-present; Trustee, the Gabelli Global DealFund, 2006-present; Director, Teton Advisors, Inc., 2008-2010; Director, DBHedge Strategies Fund LLC, 2002-2007; Director, Topiary Fund for BenefitPlan Investors LLC, 2004-2007. Mr. Tokar has been a Director since 2009.
Mr. Tokar serves as a Senior Managing Director of the BeaconTrust Company (trust services), having previously served as theChief Executive Officer of Allied Capital Management, LLC (awholly owned subsidiary of Honeywell International Inc.). Mr.Tokar was responsible for Honeywell's investment managementprogram for employee benefit fund assets totaling $18 billionworldwide. Mr. Tokar is a Certified Public Accountant and healso led the Finance Division at the National Rural ElectricCooperative Association in Washington, D.C. Mr. Tokar'sfinancial expertise and extensive experience in assessing andmanaging investments enable him to serve meaningfully andeffectively on our Board.
________________________________
(1) The ages of the Directors are as of the date of this Form 10-K.
-196-
Table of Contents
Name and Age(1)
Principal Occupation andBusiness Experience During
the Past Five Years
Qualifications That Led the Boardto Conclude This Person Should
Serve as a DirectorJeffrey D. Tranen, 66 Senior Vice President, Compass Lexecon (an FTI Company), a consulting firm, Mr. Tranen is currently a Senior Vice President of Compass
http://www.sec.gov/Archives/edgar/data/18647/000106139313000018/form10k.htm[8/23/2013 4:25:39 PM]
2000-present; Director, Doble Engineering Company, 1998-2007; Director,Oglethorpe Power Corporation, 2000-2004; Director, Earthfirst TechnologiesIncorporated, 2001-2002; President and Chief Operating Officer, SitheNortheast Inc., 1999-2000; President and Chief Executive Officer, CaliforniaIndependent System Operator, 1997-1999; President, New England PowerCompany, 1993-1997. Mr. Tranen has been a Director since 2004.
Lexecon (a consulting firm), having previously served asPresident of the New England Power Company, President andChief Executive Officer of the California Independent SystemOperator, and as President and Chief Operating Officer of SitheNortheast, Inc., where he was responsible for acquiring andoverseeing generating assets totaling 8000 megawatts. Mr.Tranen's extensive operating and management experience in theregulated and unregulated energy industries enable him to servemeaningfully and effectively on our Board.
________________________________
(1) The ages of the Directors are as of the date of this Form 10-K.
-197-
Table of Contents
Name and Age(1)
Principal Occupation andBusiness Experience During
the Past Five Years
Qualifications That Led the Boardto Conclude This Person Should
Serve as a DirectorErnest R. Verebelyi, 65
Retired; Non-executive Chairman, 2005-present, and Director, 2003-present,Columbus McKinnon Corporation, an industrial manufacturing company;President-Americas, Terex Corporation, 2001-2002; President-Americas andMining, Terex Corporation, 2001. Mr. Verebelyi has been a Director since 2006.
Mr. Verebelyi currently serves as the Non-executive Chairmanof Columbus McKinnon Corporation, an international publiclyowned manufacturer of industrial equipment based in Amherst,N.Y. and listed on NASDAQ. Mr. Verebelyi previously servedas President – Americas of the Terex Corporation, as ExecutiveVice President of Operations, General Signal Corporation, andas Executive Vice President – Special Products Division of theEmerson Electric Company. Mr. Verebelyi's involvement in thegovernance of a public company and his executive experiencewith complex business operations enable him to servemeaningfully and effectively on our Board.
________________________________
(1) The ages of the Directors are as of the date of this Form 10-K.
-198-
Table of Contents
The information on the executive officers of CH Energy Group required hereunder is incorporated by reference to Item 1 - "Business" of this 10-K Annual Report under thecaption "Executive Officers of CH Energy Group."
Since the filing by CH Energy Group of its definitive proxy statement for its 2012 Annual Meeting ("Proxy Statement"), which was filed with the SEC on March 21, 2012,there have been no material changes to the procedures by which security holders may recommend nominees to CH Energy Group's Board of Directors.
http://www.sec.gov/Archives/edgar/data/18647/000106139313000018/form10k.htm[8/23/2013 4:25:39 PM]
AUDIT COMMITTEE
CH Energy Group has a standing Audit Committee established in accordance with section 3(a)(58)(A) of the Exchange Act. The members of the Audit Committee areMargarita K. Dilley, Steven M. Fetter, Stanley J. Grubel, and E. Michel Kruse. Ms. Dilley is the Chair of the Audit Committee.
The Board of Directors has determined that each of these Committee members meets the NYSE listing standards and CH Energy Group's categorical standards forindependence. The Board of Directors has also determined that each of the Committee members are financially literate in accordance with the NYSE listing standards.
The Board of Directors has determined that Ms. Dilley meets the SEC criteria for an "audit committee financial expert" and the NYSE standard of having accounting orrelated financial management expertise. Ms. Dilley's extensive background and experience includes having served as the Chief Financial Officer of Astrolink InternationalLLC.
CODE OF BUSINESS CONDUCT AND ETHICS
CH Energy Group has adopted a Code of Business Conduct and Ethics ("Code"). Section II of the Code, in accordance with Section 406 of the Sarbanes-Oxley Act andItem 406 of Regulation S-K, constitutes CH Energy Group's Code of Ethics for Senior Financial Officers. This section, in conjunction with the remainder of the Code, isintended to promote honest and ethical conduct, full and accurate reporting, and compliance with laws as well as other matters. A copy of the Code is available on CHEnergy Group's Internet website at www.CHEnergyGroup.com.
If CH Energy Group's Board of Directors materially amends or grants any waivers to Section II of the Code relating to issues concerning the need to resolve ethically anyactual or apparent conflicts of interest, and to comply with all generally accepted accounting principles, laws and regulations designed to produce full, fair, accurate, timely,and understandable disclosure in CH Energy Group's periodic reports filed with the SEC, CH Energy Group will post such information on its Internet website atwww.CHEnergyGroup.com.
-199-
Table of Contents
CH Energy Group's governance guidelines and the charters of its Audit, Compensation, Governance and Nominating, and Strategy and Finance Committees are available onCH Energy Group's Internet website at www.CHEnergyGroup.com.
The governance guidelines, the Code, and the charters may also be obtained by writing to the Corporate Secretary, CH Energy Group, Inc., 284 South Avenue,Poughkeepsie, New York 12601-4839. SECTION 16(A) BENEFICIAL OWNERSHIP REPORTING COMPLIANCE
Section 16(a) of the Securities Exchange Act of 1934, as amended, requires CH Energy Group's Directors and executive officers, and any person who owns more than 10%of a registered class of CH Energy Group's equity securities (collectively "Reporting Persons"), to file initial reports of ownership and reports of changes in ownership withthe SEC.
These Reporting Persons are required by SEC regulations to furnish CH Energy Group with copies of all Section 16(a) forms they file.
Based solely on a review of the copies of these forms furnished to CH Energy Group and written representations from CH Energy Group's Directors and executive officers,CH Energy Group believes that all Section 16(a) filing requirements were complied with during the fiscal year ended December 31, 2012.
-200-
Table of Contents
ITEM 11 - Executive Compensation COMPENSATION DISCUSSION AND ANALYSIS
This Compensation Discussion and Analysis explains our compensation program for the Chief Executive Officer, the Chief Financial Officer, and our other three mosthighly compensated executive officers. These individuals are referred to collectively in this section as our "Named Executive Officers." Our Named Executive Officers for2012 were: (i) Steven V. Lant, Chairman of the Board, President and Chief Executive Officer of CH Energy Group; (ii) Christopher M. Capone, Executive Vice Presidentand Chief Financial Officer of CH Energy Group; (iii) James P. Laurito, Executive Vice President of CH Energy Group and President of Central Hudson; (iv) John E.Gould, Executive Vice President and General Counsel of CH Energy Group; and (v) W. Randolph Groft, President and Chief Operating Officer of Griffith Energy Services,Inc. ("Griffith").
EXECUTIVE SUMMARY
Our executive compensation program is designed to achieve the following objectives:
•Attract and retain experienced, talented, and performance-driven executives by offering compensation opportunities that are competitive with opportunities offered by
http://www.sec.gov/Archives/edgar/data/18647/000106139313000018/form10k.htm[8/23/2013 4:25:39 PM]
comparable companies in the markets in which we compete for executive talent; and
•Align the interests of our executive officers and shareholders by motivating executive officers to maximize our shareholders' return on investment, to minimize risksover the long-term and to achieve high levels of customer satisfaction, and by rewarding executive officers for performance related to the creation of sustainable value.
Our core program consists of base salary, short-term and long-term incentives and retirement benefits, each of which is geared to be close to market median levels.
•We allocate a significant portion of the core program to variable compensation elements that are tied to CH Energy Group's key performance objectives.
•We maintain stock ownership requirements for our executives.
•We maintain a Compensation Recovery Policy (commonly referred to as a clawback policy), which allows us to recover certain incentive compensation paid to anexecutive officer if the payment was based on financial results that the Corporation must subsequently restate as a result of that officer's fraud or misconduct.
•We provide only limited perquisites or fringe benefits to our executives, and those perquisites and fringe benefits are directly aligned to our business interests.
•We closed our defined benefit retirement plans to new management employees as of January 1, 2008.
-201-
Table of Contents
ADVISORY VOTE ON EXECUTIVE COMPENSATION
At our 2012 Annual Meeting, our shareholders supported our executive compensation program by approving the compensation of our Named Executive Officers by a vote ofapproximately 91% of the shares represented by person or by proxy at the meeting. The Compensation Committee views this result as confirmation that our compensationprogram, with its emphasis on pay-for-performance, is reasonable and that it achieves the compensation objectives outlined in this Compensation Discussion and Analysis. As a result, we have not made any material changes to the compensation program for the Named Executive Officers.
USE OF MARKET COMPENSATION DATA
We believe that each element of the compensation program should remain competitive to attract and retain key executive talent. To help determine the competitive market,the Compensation Committee retained Pay Governance, an independent consulting firm, to advise it on the form and amounts of Director and executive compensation. PayGovernance reported directly to the Compensation Committee and served at the sole pleasure of the Committee. Pay Governance provided no services to CH Energy Groupother than services that were requested by the Committee. The Compensation Committee has assessed the independence of Pay Governance pursuant to SEC rules andconcluded that no conflict of interest exists that would prevent the consulting firm from independently advising the Compensation Committee.
For 2012, the Compensation Committee asked Pay Governance to provide information about whether the compensation packages of our executive officers were competitivewith the market in which we compete for executive talent. Pay Governance also was asked to determine the range of market levels for the following components of ourexecutives' compensation: base salary, short-term incentive compensation, total cash compensation (base salary plus short-term incentive compensation), long-termincentive awards, and total direct compensation (total cash compensation plus long-term incentive awards). In doing this work, Pay Governance compiled compensationinformation about companies in two separate groups ("comparator groups").
-202-
Table of Contents
Utility Industry Database
The primary comparator group included 62 investor-owned utilities from Towers Watson's 2011 Energy Services Executive Compensation Database. These companies hadrevenue between approximately $353 million to $18.9 billion. The comparator group was comprised of companies with a wide range of revenues and includedorganizations that were significantly larger that CH Energy Group. As a result, the market data for each position was size-adjusted using regression analysis to account forthe differences in company revenues. The companies in the utility industry database included (in alphabetical order):
AGL Resources Inc. MidAmerican HoldingsALLETE, Inc. NextEra Energy, Inc.Alliant Energy Corporation Nicor Inc.Ameren Corporation Northeast UtilitiesAmerican Electric Power Co., Inc. Northwestern CorporationAvista Corp. NRG Energy, Inc.Black Hills Corporation NSTARCalpine Corp. NV Energy, Inc.CenterPoint Energy, Inc. Northwest Natural Gas CompanyCleco Corporation OGE Energy Corp.CMS Energy Corp. PG&E Corp.Consolidated Edison Inc. Pepco Holdings, Inc.Constellation Energy Group, Inc. Pinnacle West Capital Corporation
http://www.sec.gov/Archives/edgar/data/18647/000106139313000018/form10k.htm[8/23/2013 4:25:39 PM]
Dominion Resources, Inc. PNM Resources, Inc.DPL Inc. Portland General Electric CompanyDTE Energy Company PPL CorporationDuke Energy Corporation Progress Energy Inc.Edison International Public Service Enterprise Group Inc.El Paso Electric Co. Puget EnergyEnergen Corp. SCANA Corp.Energy Future Holdings Sempra EnergyEntergy Corporation Southern CompanyEQT Corporation TECO Energy, Inc.Exelon Corporation TennesseeValley AuthorityFirstEnergy Corp. UIL Holdings CorporationGenOn Energy, Inc. UniSource EnergyHawaiian Electric Industries Inc. Unitil Corp.IdaCorp, Inc. Vectren CorporationIntegrys Energy Group, Inc. Westar Energy, Inc.MDU Resources Group Inc. Wisconsin Energy Corp.MGE Energy Inc. Xcel Energy Inc.
General Industry Reference
The Compensation Committee also used a secondary comparator group to evaluate compensation levels, which was based on a total sample of Towers Watson's 2011General Industry Executive Compensation Database and included over 400 companies across a range of industries. As with the utility industry comparator group, the datawas sized-adjusted using regression analysis to correspond with each officer's approximate scope of responsibilities (based on revenues).
-203-
Table of Contents
Coordination of Sources
Due to his utility-specific position, the utility industry comparator group was used as the reference point for the competitive review of Mr. Laurito's position. The generalindustry comparator group was used as the primary reference point for Mr. Groft because, upon the recommendation of Pay Governance, the Compensation Committeeconcluded that his responsibilities involve numerous functions, including the management of an unregulated business, that are more comparable to positions in the broadergeneral industry group. The utility industry comparator group was used as the primary source of data to evaluate the compensation levels for Messrs. Lant, Capone andGould.
PAY COMPETITIVELY WITHIN THE RELEVANT MARKET FOR EXECUTIVE TALENT
Each year, the Compensation Committee reviews and establishes the base salary, annual short-term incentives and long-term incentives for the Named Executive Officers. The Committee also monitors the competitiveness of the retirement, severance, and personal benefits programs; however, these benefits programs generally do not changefrom year to year. The Committee generally strives to structure each element of compensation in the competitive range of the market data for each position (e.g., within15%, plus or minus, of the market median). The Committee retains the flexibility to make adjustments to specific compensation elements to respond to market conditions,promotions, new hires, individual performance, or other circumstances. The Committee believes that offering competitive compensation opportunities to the executives isnecessary to attract, retain, and motivate qualified executives.
ROLE OF CEO IN THE COMPENSATION PROCESS
In addition to considering the competitive data from the comparator groups when establishing the compensation program for the Named Executive Officers, the Committeealso considers input and recommendations from Mr. Lant, who attends the non-executive session portions of the Compensation Committee meetings. Specifically, Mr. Lantconsidered corporate and individual performances and made recommendations to the Committee on base salary, short-term incentive and long-term incentive compensationfor the other Named Executive Officers. The Compensation Committee reviewed, discussed and modified as appropriate these compensation recommendations. In the caseof Mr. Lant, the Compensation Committee met in executive session to conduct his performance review and establish his base salary and short-term and long-term incentiveopportunities for 2012.
-204-
Table of Contents
DESCRIPTION OF THE KEY ELEMENTS OF OUR COMPENSATION PROGRAM
A brief summary of the components of the base salary, short-term incentive opportunities and long-term incentive opportunities for the Named Executive Officers is set forthbelow.
Base Salary
We provide competitive base salaries to attract and retain key executive talent. Base salaries also form the basis for calculating other compensation opportunities for theNamed Executive Officers, such as their short-term and long-term incentive opportunities, retirement benefits, and severance benefits.
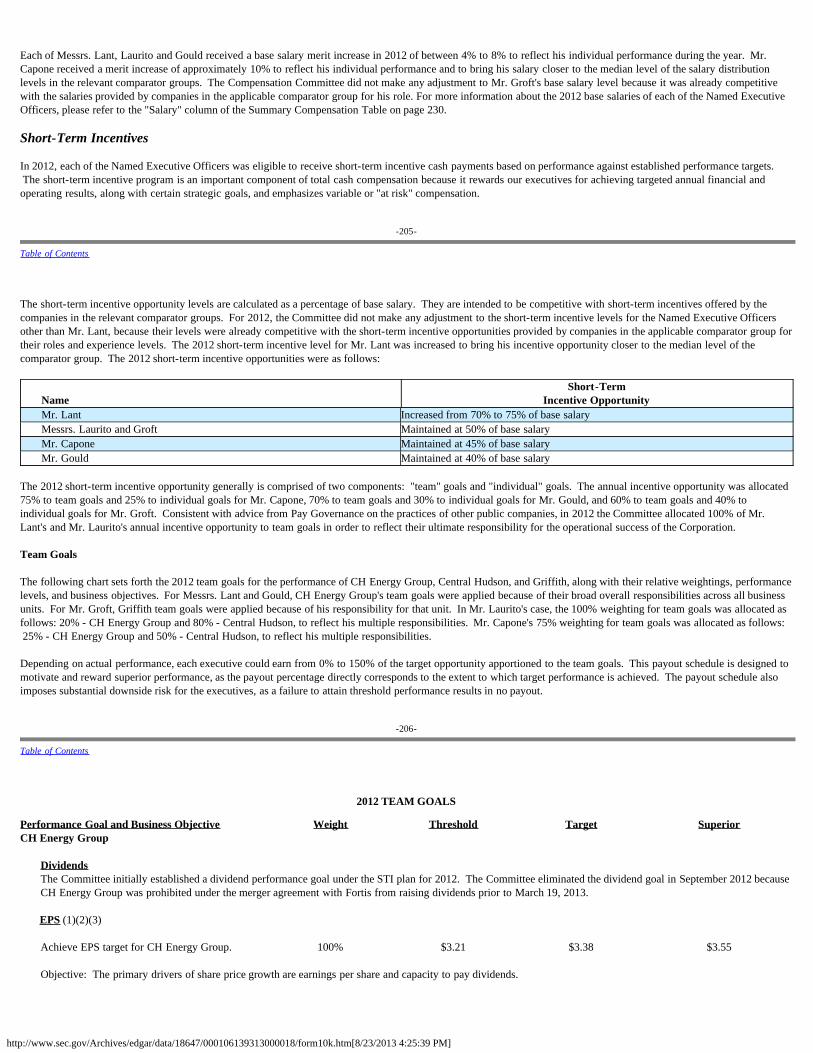
http://www.sec.gov/Archives/edgar/data/18647/000106139313000018/form10k.htm[8/23/2013 4:25:39 PM]
Each of Messrs. Lant, Laurito and Gould received a base salary merit increase in 2012 of between 4% to 8% to reflect his individual performance during the year. Mr.Capone received a merit increase of approximately 10% to reflect his individual performance and to bring his salary closer to the median level of the salary distributionlevels in the relevant comparator groups. The Compensation Committee did not make any adjustment to Mr. Groft's base salary level because it was already competitivewith the salaries provided by companies in the applicable comparator group for his role. For more information about the 2012 base salaries of each of the Named ExecutiveOfficers, please refer to the "Salary" column of the Summary Compensation Table on page 230.
Short-Term Incentives
In 2012, each of the Named Executive Officers was eligible to receive short-term incentive cash payments based on performance against established performance targets. The short-term incentive program is an important component of total cash compensation because it rewards our executives for achieving targeted annual financial andoperating results, along with certain strategic goals, and emphasizes variable or "at risk" compensation.
-205-
Table of Contents
The short-term incentive opportunity levels are calculated as a percentage of base salary. They are intended to be competitive with short-term incentives offered by thecompanies in the relevant comparator groups. For 2012, the Committee did not make any adjustment to the short-term incentive levels for the Named Executive Officersother than Mr. Lant, because their levels were already competitive with the short-term incentive opportunities provided by companies in the applicable comparator group fortheir roles and experience levels. The 2012 short-term incentive level for Mr. Lant was increased to bring his incentive opportunity closer to the median level of thecomparator group. The 2012 short-term incentive opportunities were as follows:
Name
Short-TermIncentive Opportunity
Mr. Lant Increased from 70% to 75% of base salaryMessrs. Laurito and Groft Maintained at 50% of base salaryMr. Capone Maintained at 45% of base salaryMr. Gould Maintained at 40% of base salary
The 2012 short-term incentive opportunity generally is comprised of two components: "team" goals and "individual" goals. The annual incentive opportunity was allocated75% to team goals and 25% to individual goals for Mr. Capone, 70% to team goals and 30% to individual goals for Mr. Gould, and 60% to team goals and 40% toindividual goals for Mr. Groft. Consistent with advice from Pay Governance on the practices of other public companies, in 2012 the Committee allocated 100% of Mr.Lant's and Mr. Laurito's annual incentive opportunity to team goals in order to reflect their ultimate responsibility for the operational success of the Corporation.
Team Goals The following chart sets forth the 2012 team goals for the performance of CH Energy Group, Central Hudson, and Griffith, along with their relative weightings, performancelevels, and business objectives. For Messrs. Lant and Gould, CH Energy Group's team goals were applied because of their broad overall responsibilities across all businessunits. For Mr. Groft, Griffith team goals were applied because of his responsibility for that unit. In Mr. Laurito's case, the 100% weighting for team goals was allocated asfollows: 20% - CH Energy Group and 80% - Central Hudson, to reflect his multiple responsibilities. Mr. Capone's 75% weighting for team goals was allocated as follows: 25% - CH Energy Group and 50% - Central Hudson, to reflect his multiple responsibilities.
Depending on actual performance, each executive could earn from 0% to 150% of the target opportunity apportioned to the team goals. This payout schedule is designed tomotivate and reward superior performance, as the payout percentage directly corresponds to the extent to which target performance is achieved. The payout schedule alsoimposes substantial downside risk for the executives, as a failure to attain threshold performance results in no payout.
-206-
Table of Contents
2012 TEAM GOALS
Performance Goal and Business Objective Weight Threshold Target SuperiorCH Energy Group
Dividends The Committee initially established a dividend performance goal under the STI plan for 2012. The Committee eliminated the dividend goal in September 2012 becauseCH Energy Group was prohibited under the merger agreement with Fortis from raising dividends prior to March 19, 2013.
EPS (1)(2)(3)
Achieve EPS target for CH Energy Group. 100% $3.21 $3.38 $3.55
Objective: The primary drivers of share price growth are earnings per share and capacity to pay dividends.
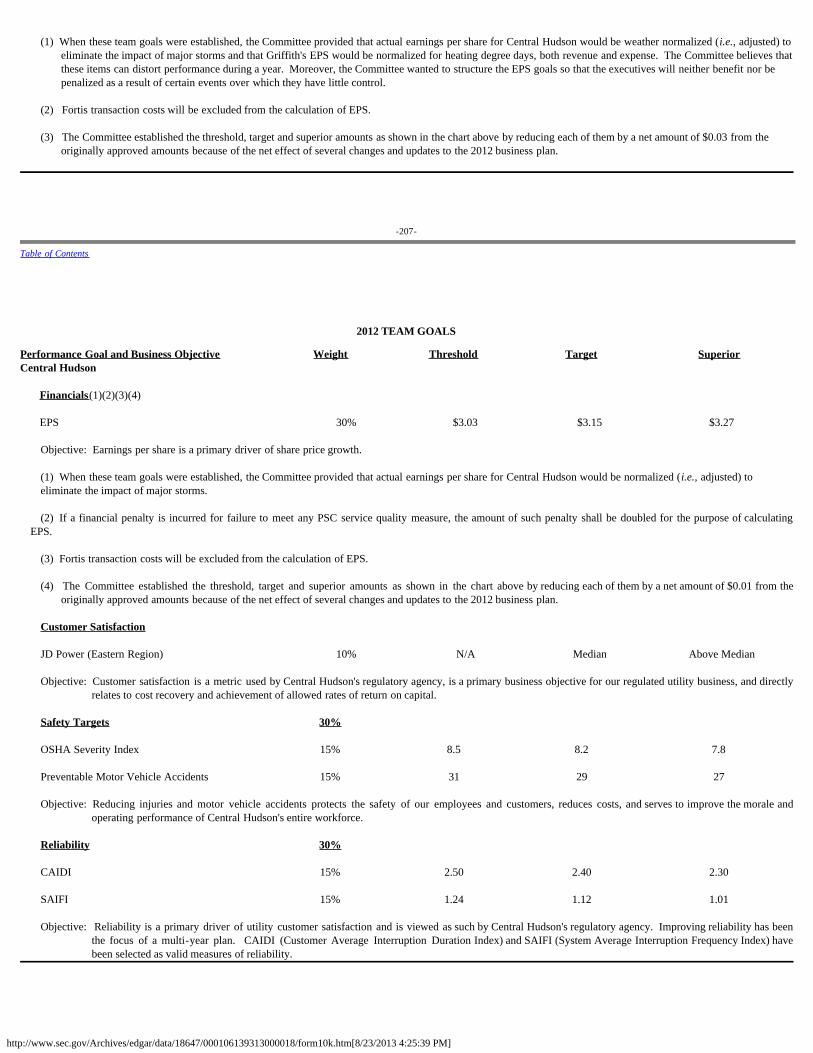
http://www.sec.gov/Archives/edgar/data/18647/000106139313000018/form10k.htm[8/23/2013 4:25:39 PM]
(1) When these team goals were established, the Committee provided that actual earnings per share for Central Hudson would be weather normalized (i.e., adjusted) toeliminate the impact of major storms and that Griffith's EPS would be normalized for heating degree days, both revenue and expense. The Committee believes thatthese items can distort performance during a year. Moreover, the Committee wanted to structure the EPS goals so that the executives will neither benefit nor bepenalized as a result of certain events over which they have little control.
(2) Fortis transaction costs will be excluded from the calculation of EPS.
(3) The Committee established the threshold, target and superior amounts as shown in the chart above by reducing each of them by a net amount of $0.03 from the
originally approved amounts because of the net effect of several changes and updates to the 2012 business plan.
-207-
Table of Contents
2012 TEAM GOALS
Performance Goal and Business Objective Weight Threshold Target SuperiorCentral Hudson
Financials(1)(2)(3)(4)
EPS 30% $3.03 $3.15 $3.27
Objective: Earnings per share is a primary driver of share price growth.
(1) When these team goals were established, the Committee provided that actual earnings per share for Central Hudson would be normalized (i.e., adjusted) toeliminate the impact of major storms.
(2) If a financial penalty is incurred for failure to meet any PSC service quality measure, the amount of such penalty shall be doubled for the purpose of calculating
EPS.
(3) Fortis transaction costs will be excluded from the calculation of EPS.
(4) The Committee established the threshold, target and superior amounts as shown in the chart above by reducing each of them by a net amount of $0.01 from theoriginally approved amounts because of the net effect of several changes and updates to the 2012 business plan.
Customer Satisfaction
JD Power (Eastern Region) 10% N/A Median Above Median
Objective: Customer satisfaction is a metric used by Central Hudson's regulatory agency, is a primary business objective for our regulated utility business, and directly
relates to cost recovery and achievement of allowed rates of return on capital.
Safety Targets 30%
OSHA Severity Index 15% 8.5 8.2 7.8
Preventable Motor Vehicle Accidents 15% 31 29 27
Objective: Reducing injuries and motor vehicle accidents protects the safety of our employees and customers, reduces costs, and serves to improve the morale andoperating performance of Central Hudson's entire workforce.
Reliability 30%
CAIDI
SAIFI
15%
15%
2.50
1.24
2.40
1.12
2.30
1.01
Objective: Reliability is a primary driver of utility customer satisfaction and is viewed as such by Central Hudson's regulatory agency. Improving reliability has beenthe focus of a multi-year plan. CAIDI (Customer Average Interruption Duration Index) and SAIFI (System Average Interruption Frequency Index) havebeen selected as valid measures of reliability.
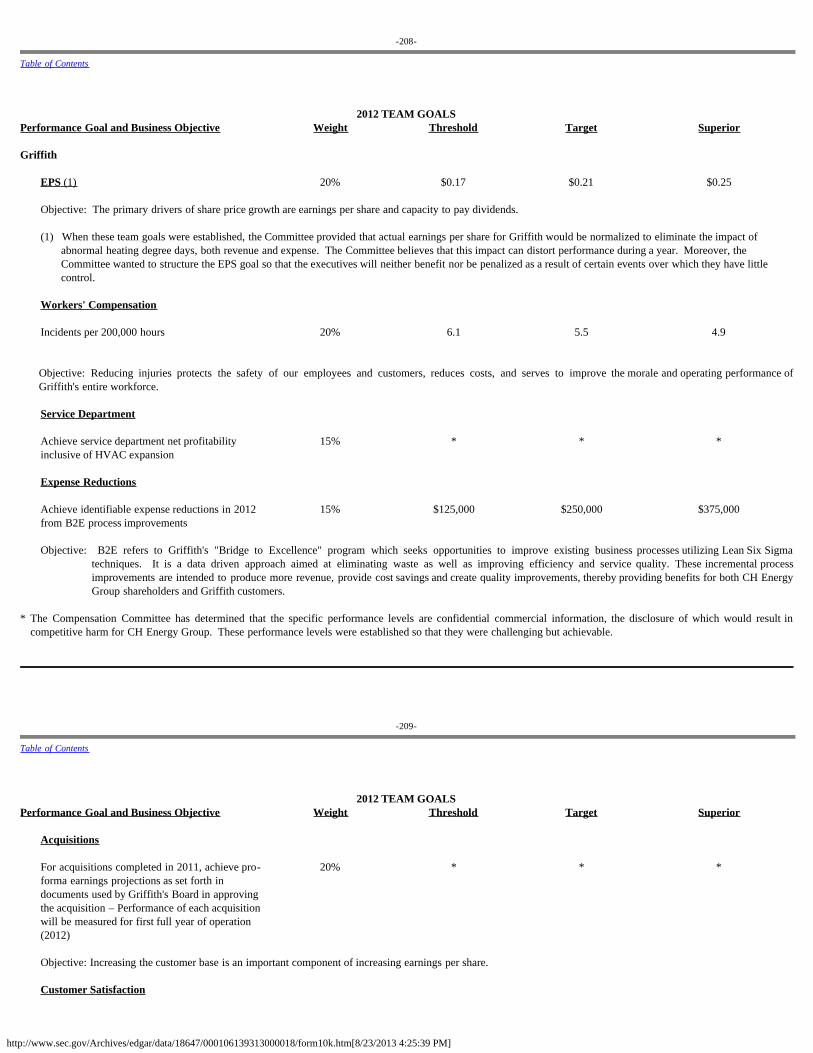
http://www.sec.gov/Archives/edgar/data/18647/000106139313000018/form10k.htm[8/23/2013 4:25:39 PM]
-208-
Table of Contents
2012 TEAM GOALSPerformance Goal and Business Objective Weight Threshold Target Superior Griffith
EPS (1) 20% $0.17 $0.21 $0.25
Objective: The primary drivers of share price growth are earnings per share and capacity to pay dividends.
(1) When these team goals were established, the Committee provided that actual earnings per share for Griffith would be normalized to eliminate the impact ofabnormal heating degree days, both revenue and expense. The Committee believes that this impact can distort performance during a year. Moreover, theCommittee wanted to structure the EPS goal so that the executives will neither benefit nor be penalized as a result of certain events over which they have littlecontrol.
Workers' Compensation
Incidents per 200,000 hours 20%
6.1 5.5 4.9
Objective: Reducing injuries protects the safety of our employees and customers, reduces costs, and serves to improve the morale and operating performance ofGriffith's entire workforce.
Service Department
Achieve service department net profitabilityinclusive of HVAC expansion
15% * * *
Expense Reductions
Achieve identifiable expense reductions in 2012from B2E process improvements
15%
$125,000 $250,000 $375,000
Objective: B2E refers to Griffith's "Bridge to Excellence" program which seeks opportunities to improve existing business processes utilizing Lean Six Sigma
techniques. It is a data driven approach aimed at eliminating waste as well as improving efficiency and service quality. These incremental processimprovements are intended to produce more revenue, provide cost savings and create quality improvements, thereby providing benefits for both CH EnergyGroup shareholders and Griffith customers.
* The Compensation Committee has determined that the specific performance levels are confidential commercial information, the disclosure of which would result in
competitive harm for CH Energy Group. These performance levels were established so that they were challenging but achievable.
-209-
Table of Contents
2012 TEAM GOALSPerformance Goal and Business Objective Weight Threshold Target Superior
Acquisitions
For acquisitions completed in 2011, achieve pro-forma earnings projections as set forth indocuments used by Griffith's Board in approvingthe acquisition – Performance of each acquisitionwill be measured for first full year of operation(2012)
20% * * *
Objective: Increasing the customer base is an important component of increasing earnings per share.
Customer Satisfaction
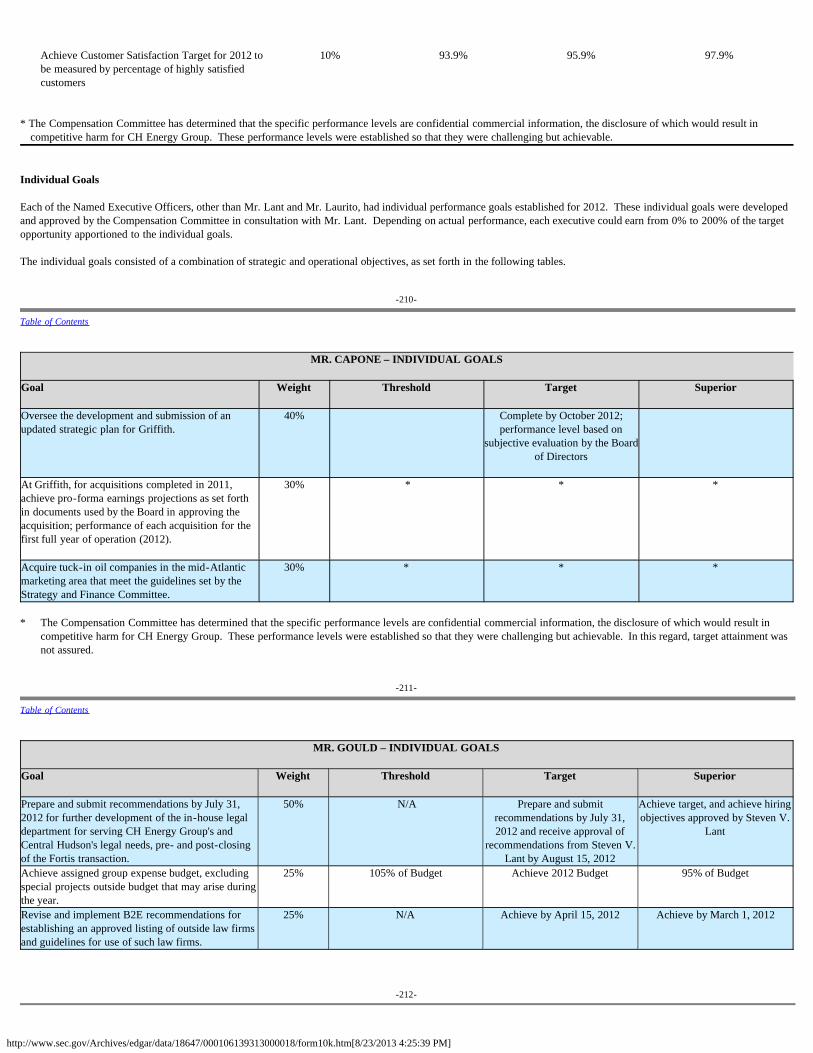
http://www.sec.gov/Archives/edgar/data/18647/000106139313000018/form10k.htm[8/23/2013 4:25:39 PM]
Achieve Customer Satisfaction Target for 2012 tobe measured by percentage of highly satisfiedcustomers
10%
93.9% 95.9% 97.9%
* The Compensation Committee has determined that the specific performance levels are confidential commercial information, the disclosure of which would result in
competitive harm for CH Energy Group. These performance levels were established so that they were challenging but achievable. Individual Goals Each of the Named Executive Officers, other than Mr. Lant and Mr. Laurito, had individual performance goals established for 2012. These individual goals were developedand approved by the Compensation Committee in consultation with Mr. Lant. Depending on actual performance, each executive could earn from 0% to 200% of the targetopportunity apportioned to the individual goals.
The individual goals consisted of a combination of strategic and operational objectives, as set forth in the following tables.
-210-
Table of Contents
MR. CAPONE – INDIVIDUAL GOALS
Goal
Weight Threshold Target Superior
Oversee the development and submission of anupdated strategic plan for Griffith.
40% Complete by October 2012;performance level based on
subjective evaluation by the Boardof Directors
At Griffith, for acquisitions completed in 2011,achieve pro-forma earnings projections as set forthin documents used by the Board in approving theacquisition; performance of each acquisition for thefirst full year of operation (2012).
30% * * *
Acquire tuck-in oil companies in the mid-Atlanticmarketing area that meet the guidelines set by theStrategy and Finance Committee.
30% * * *
* The Compensation Committee has determined that the specific performance levels are confidential commercial information, the disclosure of which would result incompetitive harm for CH Energy Group. These performance levels were established so that they were challenging but achievable. In this regard, target attainment wasnot assured.
-211-
Table of Contents
MR. GOULD – INDIVIDUAL GOALS
Goal
Weight Threshold Target Superior
Prepare and submit recommendations by July 31,2012 for further development of the in-house legaldepartment for serving CH Energy Group's andCentral Hudson's legal needs, pre- and post-closingof the Fortis transaction.
50% N/A Prepare and submitrecommendations by July 31,2012 and receive approval of
recommendations from Steven V.Lant by August 15, 2012
Achieve target, and achieve hiringobjectives approved by Steven V.
Lant
Achieve assigned group expense budget, excludingspecial projects outside budget that may arise duringthe year.
25% 105% of Budget Achieve 2012 Budget 95% of Budget
Revise and implement B2E recommendations forestablishing an approved listing of outside law firmsand guidelines for use of such law firms.
25% N/A Achieve by April 15, 2012 Achieve by March 1, 2012
-212-
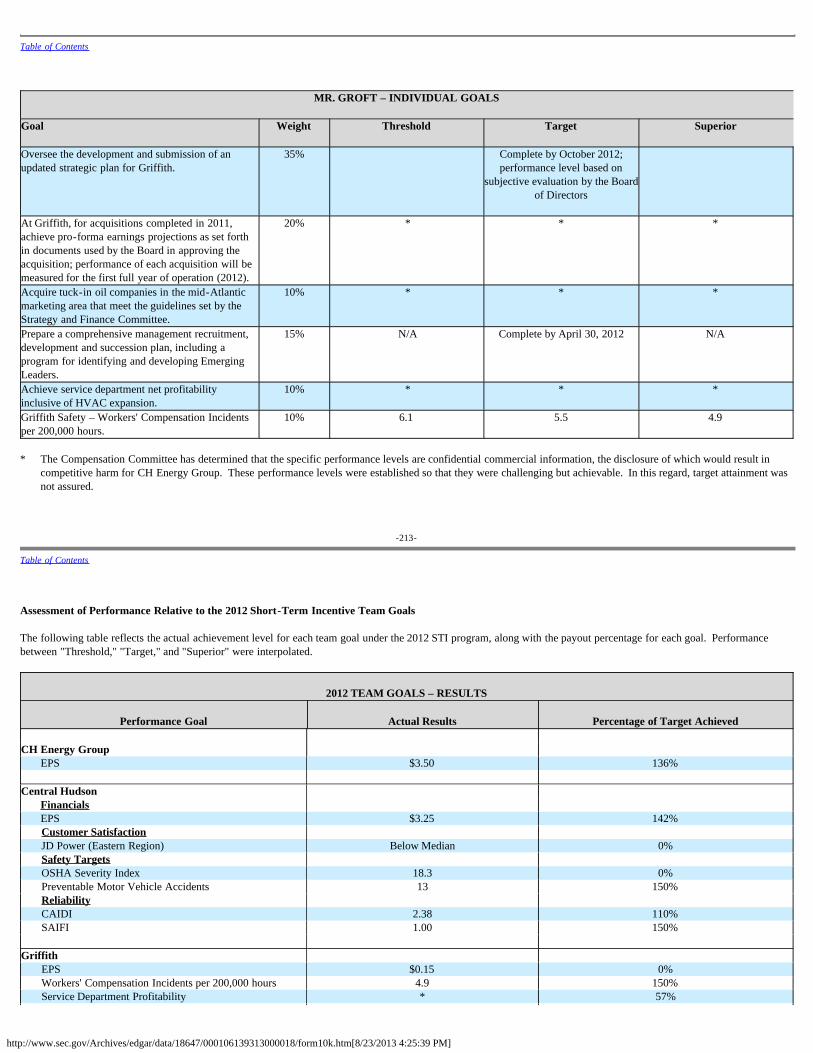
http://www.sec.gov/Archives/edgar/data/18647/000106139313000018/form10k.htm[8/23/2013 4:25:39 PM]
Table of Contents
MR. GROFT – INDIVIDUAL GOALS
Goal
Weight Threshold Target Superior
Oversee the development and submission of anupdated strategic plan for Griffith.
35% Complete by October 2012;performance level based on
subjective evaluation by the Boardof Directors
At Griffith, for acquisitions completed in 2011,achieve pro-forma earnings projections as set forthin documents used by the Board in approving theacquisition; performance of each acquisition will bemeasured for the first full year of operation (2012).
20% * * *
Acquire tuck-in oil companies in the mid-Atlanticmarketing area that meet the guidelines set by theStrategy and Finance Committee.
10% * * *
Prepare a comprehensive management recruitment,development and succession plan, including aprogram for identifying and developing EmergingLeaders.
15% N/A Complete by April 30, 2012 N/A
Achieve service department net profitabilityinclusive of HVAC expansion.
10% * * *
Griffith Safety – Workers' Compensation Incidentsper 200,000 hours.
10% 6.1 5.5 4.9
* The Compensation Committee has determined that the specific performance levels are confidential commercial information, the disclosure of which would result incompetitive harm for CH Energy Group. These performance levels were established so that they were challenging but achievable. In this regard, target attainment wasnot assured.
-213-
Table of Contents
Assessment of Performance Relative to the 2012 Short-Term Incentive Team Goals
The following table reflects the actual achievement level for each team goal under the 2012 STI program, along with the payout percentage for each goal. Performancebetween "Threshold," "Target," and "Superior" were interpolated.
2012 TEAM GOALS – RESULTS
Performance Goal Actual Results Percentage of Target Achieved
CH Energy Group
EPS $3.50 136% Central Hudson
Financials EPS $3.25 142%Customer Satisfaction JD Power (Eastern Region) Below Median 0%Safety Targets OSHA Severity Index 18.3 0%Preventable Motor Vehicle Accidents 13 150%Reliability CAIDI 2.38 110%SAIFI 1.00 150%
Griffith
EPS $0.15 0%Workers' Compensation Incidents per 200,000 hours 4.9 150%Service Department Profitability * 57%
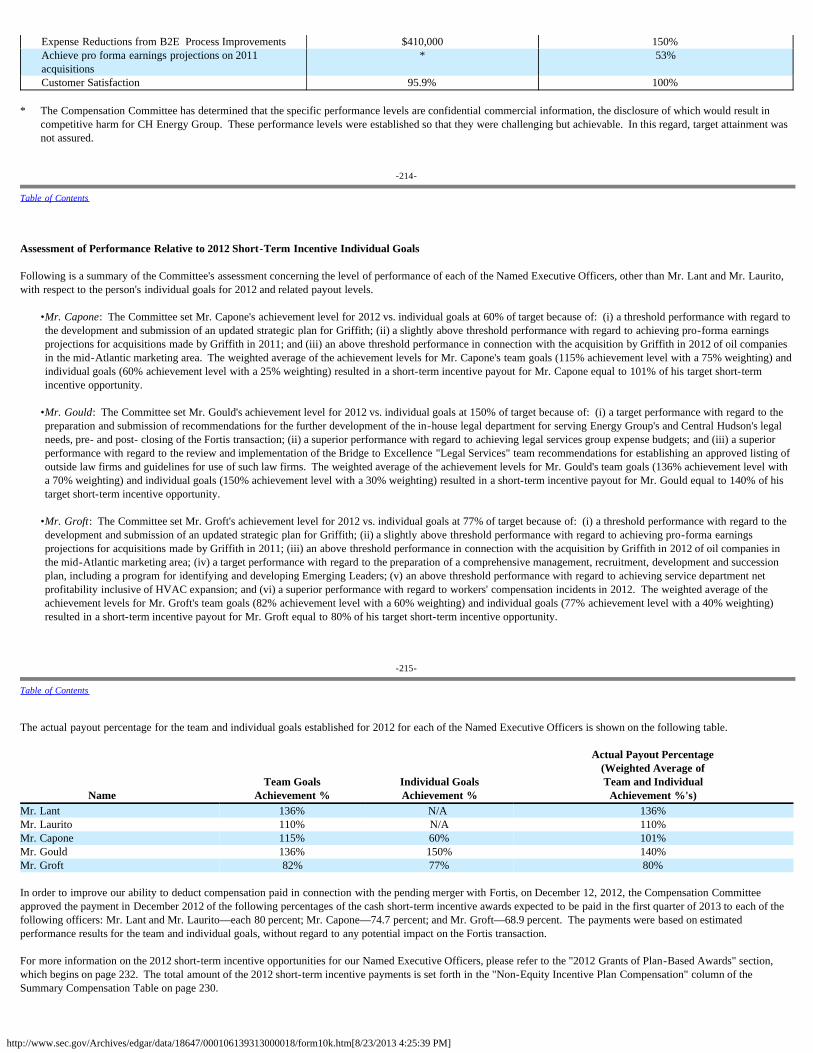
http://www.sec.gov/Archives/edgar/data/18647/000106139313000018/form10k.htm[8/23/2013 4:25:39 PM]
Expense Reductions from B2E Process Improvements $410,000 150%Achieve pro forma earnings projections on 2011acquisitions
* 53%
Customer Satisfaction 95.9% 100%
* The Compensation Committee has determined that the specific performance levels are confidential commercial information, the disclosure of which would result incompetitive harm for CH Energy Group. These performance levels were established so that they were challenging but achievable. In this regard, target attainment wasnot assured.
-214-
Table of Contents
Assessment of Performance Relative to 2012 Short-Term Incentive Individual Goals
Following is a summary of the Committee's assessment concerning the level of performance of each of the Named Executive Officers, other than Mr. Lant and Mr. Laurito,with respect to the person's individual goals for 2012 and related payout levels.
•Mr. Capone: The Committee set Mr. Capone's achievement level for 2012 vs. individual goals at 60% of target because of: (i) a threshold performance with regard tothe development and submission of an updated strategic plan for Griffith; (ii) a slightly above threshold performance with regard to achieving pro-forma earningsprojections for acquisitions made by Griffith in 2011; and (iii) an above threshold performance in connection with the acquisition by Griffith in 2012 of oil companiesin the mid-Atlantic marketing area. The weighted average of the achievement levels for Mr. Capone's team goals (115% achievement level with a 75% weighting) andindividual goals (60% achievement level with a 25% weighting) resulted in a short-term incentive payout for Mr. Capone equal to 101% of his target short-termincentive opportunity.
•Mr. Gould: The Committee set Mr. Gould's achievement level for 2012 vs. individual goals at 150% of target because of: (i) a target performance with regard to thepreparation and submission of recommendations for the further development of the in-house legal department for serving Energy Group's and Central Hudson's legalneeds, pre- and post- closing of the Fortis transaction; (ii) a superior performance with regard to achieving legal services group expense budgets; and (iii) a superiorperformance with regard to the review and implementation of the Bridge to Excellence "Legal Services" team recommendations for establishing an approved listing ofoutside law firms and guidelines for use of such law firms. The weighted average of the achievement levels for Mr. Gould's team goals (136% achievement level witha 70% weighting) and individual goals (150% achievement level with a 30% weighting) resulted in a short-term incentive payout for Mr. Gould equal to 140% of histarget short-term incentive opportunity.
•Mr. Groft: The Committee set Mr. Groft's achievement level for 2012 vs. individual goals at 77% of target because of: (i) a threshold performance with regard to thedevelopment and submission of an updated strategic plan for Griffith; (ii) a slightly above threshold performance with regard to achieving pro-forma earningsprojections for acquisitions made by Griffith in 2011; (iii) an above threshold performance in connection with the acquisition by Griffith in 2012 of oil companies inthe mid-Atlantic marketing area; (iv) a target performance with regard to the preparation of a comprehensive management, recruitment, development and successionplan, including a program for identifying and developing Emerging Leaders; (v) an above threshold performance with regard to achieving service department netprofitability inclusive of HVAC expansion; and (vi) a superior performance with regard to workers' compensation incidents in 2012. The weighted average of theachievement levels for Mr. Groft's team goals (82% achievement level with a 60% weighting) and individual goals (77% achievement level with a 40% weighting)resulted in a short-term incentive payout for Mr. Groft equal to 80% of his target short-term incentive opportunity.
-215-
Table of Contents
The actual payout percentage for the team and individual goals established for 2012 for each of the Named Executive Officers is shown on the following table.
NameTeam Goals
Achievement %Individual GoalsAchievement %
Actual Payout Percentage(Weighted Average ofTeam and Individual
Achievement %'s)Mr. Lant 136% N/A 136%Mr. Laurito 110% N/A 110%Mr. Capone 115% 60% 101%Mr. Gould 136% 150% 140%Mr. Groft 82% 77% 80%
In order to improve our ability to deduct compensation paid in connection with the pending merger with Fortis, on December 12, 2012, the Compensation Committeeapproved the payment in December 2012 of the following percentages of the cash short-term incentive awards expected to be paid in the first quarter of 2013 to each of thefollowing officers: Mr. Lant and Mr. Laurito—each 80 percent; Mr. Capone—74.7 percent; and Mr. Groft—68.9 percent. The payments were based on estimatedperformance results for the team and individual goals, without regard to any potential impact on the Fortis transaction.
For more information on the 2012 short-term incentive opportunities for our Named Executive Officers, please refer to the "2012 Grants of Plan-Based Awards" section,which begins on page 232. The total amount of the 2012 short-term incentive payments is set forth in the "Non-Equity Incentive Plan Compensation" column of theSummary Compensation Table on page 230.
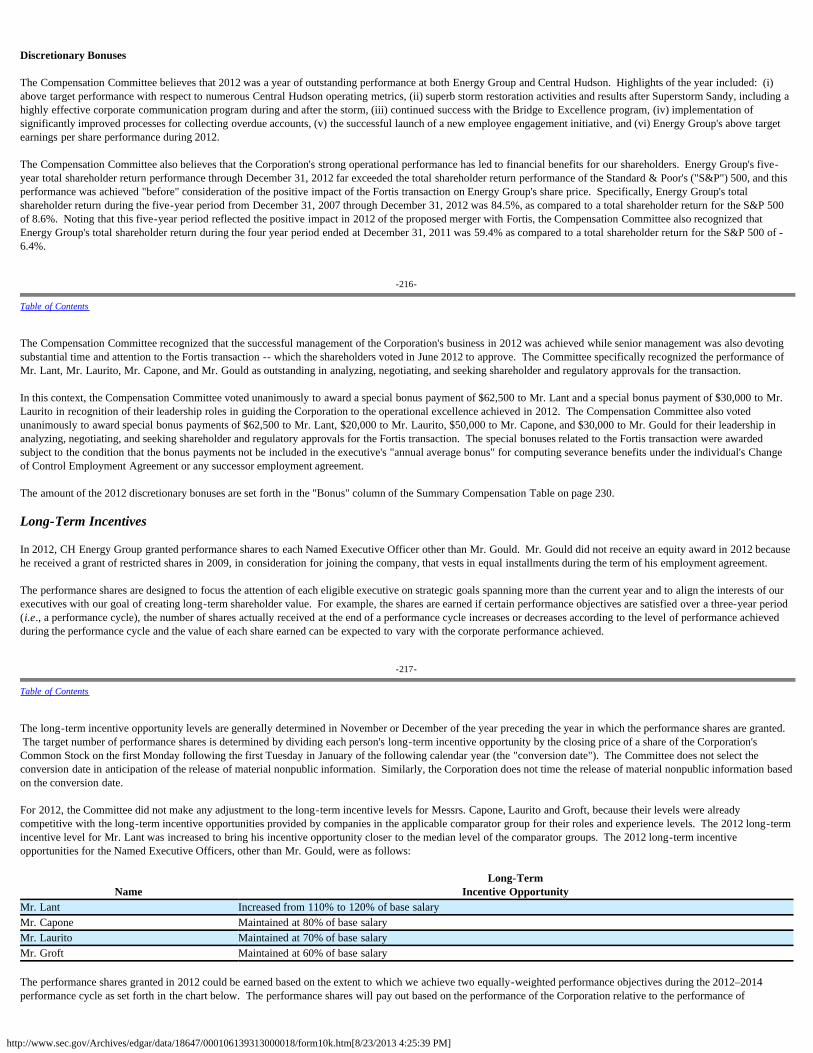
http://www.sec.gov/Archives/edgar/data/18647/000106139313000018/form10k.htm[8/23/2013 4:25:39 PM]
Discretionary Bonuses
The Compensation Committee believes that 2012 was a year of outstanding performance at both Energy Group and Central Hudson. Highlights of the year included: (i)above target performance with respect to numerous Central Hudson operating metrics, (ii) superb storm restoration activities and results after Superstorm Sandy, including ahighly effective corporate communication program during and after the storm, (iii) continued success with the Bridge to Excellence program, (iv) implementation ofsignificantly improved processes for collecting overdue accounts, (v) the successful launch of a new employee engagement initiative, and (vi) Energy Group's above targetearnings per share performance during 2012.
The Compensation Committee also believes that the Corporation's strong operational performance has led to financial benefits for our shareholders. Energy Group's five-year total shareholder return performance through December 31, 2012 far exceeded the total shareholder return performance of the Standard & Poor's ("S&P") 500, and thisperformance was achieved "before" consideration of the positive impact of the Fortis transaction on Energy Group's share price. Specifically, Energy Group's totalshareholder return during the five-year period from December 31, 2007 through December 31, 2012 was 84.5%, as compared to a total shareholder return for the S&P 500of 8.6%. Noting that this five-year period reflected the positive impact in 2012 of the proposed merger with Fortis, the Compensation Committee also recognized thatEnergy Group's total shareholder return during the four year period ended at December 31, 2011 was 59.4% as compared to a total shareholder return for the S&P 500 of -6.4%.
-216-
Table of Contents
The Compensation Committee recognized that the successful management of the Corporation's business in 2012 was achieved while senior management was also devotingsubstantial time and attention to the Fortis transaction -- which the shareholders voted in June 2012 to approve. The Committee specifically recognized the performance ofMr. Lant, Mr. Laurito, Mr. Capone, and Mr. Gould as outstanding in analyzing, negotiating, and seeking shareholder and regulatory approvals for the transaction.
In this context, the Compensation Committee voted unanimously to award a special bonus payment of $62,500 to Mr. Lant and a special bonus payment of $30,000 to Mr.Laurito in recognition of their leadership roles in guiding the Corporation to the operational excellence achieved in 2012. The Compensation Committee also votedunanimously to award special bonus payments of $62,500 to Mr. Lant, $20,000 to Mr. Laurito, $50,000 to Mr. Capone, and $30,000 to Mr. Gould for their leadership inanalyzing, negotiating, and seeking shareholder and regulatory approvals for the Fortis transaction. The special bonuses related to the Fortis transaction were awardedsubject to the condition that the bonus payments not be included in the executive's "annual average bonus" for computing severance benefits under the individual's Changeof Control Employment Agreement or any successor employment agreement.
The amount of the 2012 discretionary bonuses are set forth in the "Bonus" column of the Summary Compensation Table on page 230.
Long-Term Incentives
In 2012, CH Energy Group granted performance shares to each Named Executive Officer other than Mr. Gould. Mr. Gould did not receive an equity award in 2012 becausehe received a grant of restricted shares in 2009, in consideration for joining the company, that vests in equal installments during the term of his employment agreement.
The performance shares are designed to focus the attention of each eligible executive on strategic goals spanning more than the current year and to align the interests of ourexecutives with our goal of creating long-term shareholder value. For example, the shares are earned if certain performance objectives are satisfied over a three-year period(i.e., a performance cycle), the number of shares actually received at the end of a performance cycle increases or decreases according to the level of performance achievedduring the performance cycle and the value of each share earned can be expected to vary with the corporate performance achieved.
-217-
Table of Contents
The long-term incentive opportunity levels are generally determined in November or December of the year preceding the year in which the performance shares are granted. The target number of performance shares is determined by dividing each person's long-term incentive opportunity by the closing price of a share of the Corporation'sCommon Stock on the first Monday following the first Tuesday in January of the following calendar year (the "conversion date"). The Committee does not select theconversion date in anticipation of the release of material nonpublic information. Similarly, the Corporation does not time the release of material nonpublic information basedon the conversion date.
For 2012, the Committee did not make any adjustment to the long-term incentive levels for Messrs. Capone, Laurito and Groft, because their levels were alreadycompetitive with the long-term incentive opportunities provided by companies in the applicable comparator group for their roles and experience levels. The 2012 long-termincentive level for Mr. Lant was increased to bring his incentive opportunity closer to the median level of the comparator groups. The 2012 long-term incentiveopportunities for the Named Executive Officers, other than Mr. Gould, were as follows:
Name
Long-TermIncentive Opportunity
Mr. Lant Increased from 110% to 120% of base salaryMr. Capone Maintained at 80% of base salaryMr. Laurito Maintained at 70% of base salaryMr. Groft Maintained at 60% of base salary
The performance shares granted in 2012 could be earned based on the extent to which we achieve two equally-weighted performance objectives during the 2012–2014performance cycle as set forth in the chart below. The performance shares will pay out based on the performance of the Corporation relative to the performance of
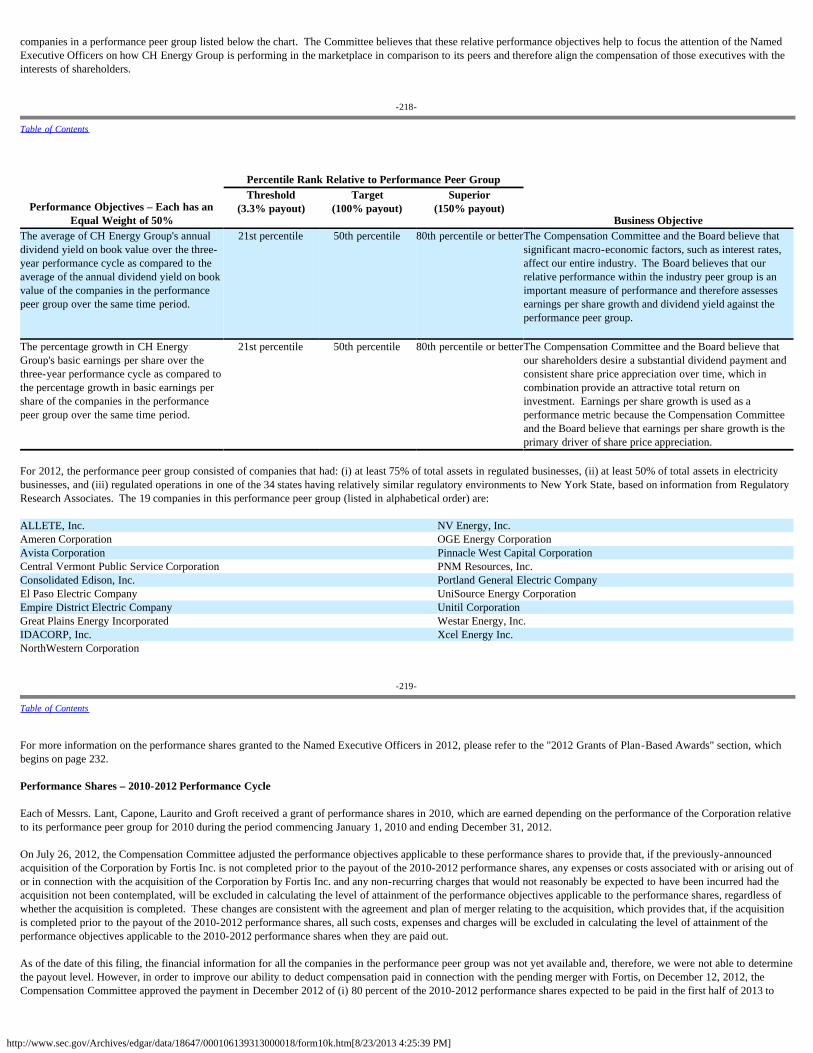
http://www.sec.gov/Archives/edgar/data/18647/000106139313000018/form10k.htm[8/23/2013 4:25:39 PM]
companies in a performance peer group listed below the chart. The Committee believes that these relative performance objectives help to focus the attention of the NamedExecutive Officers on how CH Energy Group is performing in the marketplace in comparison to its peers and therefore align the compensation of those executives with theinterests of shareholders.
-218-
Table of Contents
Performance Objectives – Each has anEqual Weight of 50%
Percentile Rank Relative to Performance Peer Group
Business Objective
Threshold(3.3% payout)
Target(100% payout)
Superior(150% payout)
The average of CH Energy Group's annualdividend yield on book value over the three-year performance cycle as compared to theaverage of the annual dividend yield on bookvalue of the companies in the performancepeer group over the same time period.
21st percentile 50th percentile 80th percentile or betterThe Compensation Committee and the Board believe thatsignificant macro-economic factors, such as interest rates,affect our entire industry. The Board believes that ourrelative performance within the industry peer group is animportant measure of performance and therefore assessesearnings per share growth and dividend yield against theperformance peer group.
The percentage growth in CH EnergyGroup's basic earnings per share over thethree-year performance cycle as compared tothe percentage growth in basic earnings pershare of the companies in the performancepeer group over the same time period.
21st percentile 50th percentile 80th percentile or betterThe Compensation Committee and the Board believe thatour shareholders desire a substantial dividend payment andconsistent share price appreciation over time, which incombination provide an attractive total return oninvestment. Earnings per share growth is used as aperformance metric because the Compensation Committeeand the Board believe that earnings per share growth is theprimary driver of share price appreciation.
For 2012, the performance peer group consisted of companies that had: (i) at least 75% of total assets in regulated businesses, (ii) at least 50% of total assets in electricitybusinesses, and (iii) regulated operations in one of the 34 states having relatively similar regulatory environments to New York State, based on information from RegulatoryResearch Associates. The 19 companies in this performance peer group (listed in alphabetical order) are:
ALLETE, Inc. NV Energy, Inc.Ameren Corporation OGE Energy CorporationAvista Corporation Pinnacle West Capital CorporationCentral Vermont Public Service Corporation PNM Resources, Inc.Consolidated Edison, Inc. Portland General Electric CompanyEl Paso Electric Company UniSource Energy CorporationEmpire District Electric Company Unitil CorporationGreat Plains Energy Incorporated Westar Energy, Inc.IDACORP, Inc. Xcel Energy Inc.NorthWestern Corporation
-219-
Table of Contents
For more information on the performance shares granted to the Named Executive Officers in 2012, please refer to the "2012 Grants of Plan-Based Awards" section, whichbegins on page 232.
Performance Shares – 2010-2012 Performance Cycle
Each of Messrs. Lant, Capone, Laurito and Groft received a grant of performance shares in 2010, which are earned depending on the performance of the Corporation relativeto its performance peer group for 2010 during the period commencing January 1, 2010 and ending December 31, 2012.
On July 26, 2012, the Compensation Committee adjusted the performance objectives applicable to these performance shares to provide that, if the previously-announcedacquisition of the Corporation by Fortis Inc. is not completed prior to the payout of the 2010-2012 performance shares, any expenses or costs associated with or arising out ofor in connection with the acquisition of the Corporation by Fortis Inc. and any non-recurring charges that would not reasonably be expected to have been incurred had theacquisition not been contemplated, will be excluded in calculating the level of attainment of the performance objectives applicable to the performance shares, regardless ofwhether the acquisition is completed. These changes are consistent with the agreement and plan of merger relating to the acquisition, which provides that, if the acquisitionis completed prior to the payout of the 2010-2012 performance shares, all such costs, expenses and charges will be excluded in calculating the level of attainment of theperformance objectives applicable to the 2010-2012 performance shares when they are paid out.
As of the date of this filing, the financial information for all the companies in the performance peer group was not yet available and, therefore, we were not able to determinethe payout level. However, in order to improve our ability to deduct compensation paid in connection with the pending merger with Fortis, on December 12, 2012, theCompensation Committee approved the payment in December 2012 of (i) 80 percent of the 2010-2012 performance shares expected to be paid in the first half of 2013 to
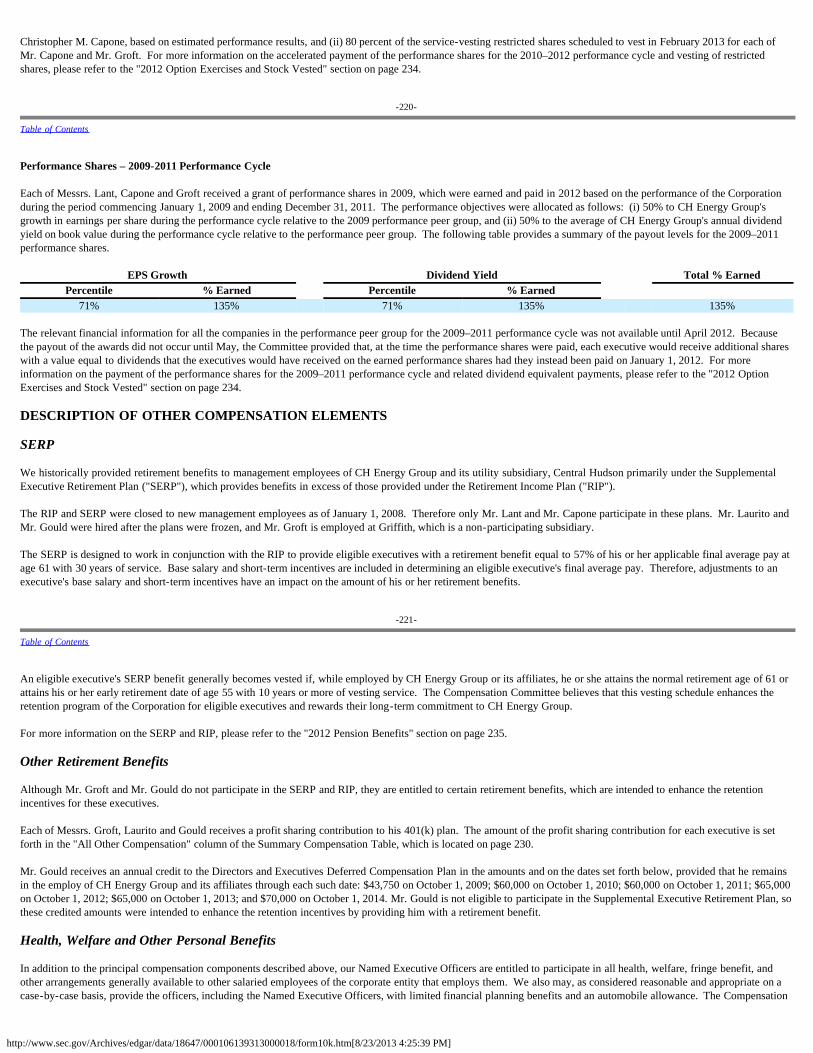
http://www.sec.gov/Archives/edgar/data/18647/000106139313000018/form10k.htm[8/23/2013 4:25:39 PM]
Christopher M. Capone, based on estimated performance results, and (ii) 80 percent of the service-vesting restricted shares scheduled to vest in February 2013 for each ofMr. Capone and Mr. Groft. For more information on the accelerated payment of the performance shares for the 2010–2012 performance cycle and vesting of restrictedshares, please refer to the "2012 Option Exercises and Stock Vested" section on page 234.
-220-
Table of Contents
Performance Shares – 2009-2011 Performance Cycle
Each of Messrs. Lant, Capone and Groft received a grant of performance shares in 2009, which were earned and paid in 2012 based on the performance of the Corporationduring the period commencing January 1, 2009 and ending December 31, 2011. The performance objectives were allocated as follows: (i) 50% to CH Energy Group'sgrowth in earnings per share during the performance cycle relative to the 2009 performance peer group, and (ii) 50% to the average of CH Energy Group's annual dividendyield on book value during the performance cycle relative to the performance peer group. The following table provides a summary of the payout levels for the 2009–2011performance shares.
EPS Growth Dividend Yield Total % EarnedPercentile % Earned Percentile % Earned
71% 135% 71% 135% 135%
The relevant financial information for all the companies in the performance peer group for the 2009–2011 performance cycle was not available until April 2012. Becausethe payout of the awards did not occur until May, the Committee provided that, at the time the performance shares were paid, each executive would receive additional shareswith a value equal to dividends that the executives would have received on the earned performance shares had they instead been paid on January 1, 2012. For moreinformation on the payment of the performance shares for the 2009–2011 performance cycle and related dividend equivalent payments, please refer to the "2012 OptionExercises and Stock Vested" section on page 234.
DESCRIPTION OF OTHER COMPENSATION ELEMENTS
SERP
We historically provided retirement benefits to management employees of CH Energy Group and its utility subsidiary, Central Hudson primarily under the SupplementalExecutive Retirement Plan ("SERP"), which provides benefits in excess of those provided under the Retirement Income Plan ("RIP").
The RIP and SERP were closed to new management employees as of January 1, 2008. Therefore only Mr. Lant and Mr. Capone participate in these plans. Mr. Laurito andMr. Gould were hired after the plans were frozen, and Mr. Groft is employed at Griffith, which is a non-participating subsidiary.
The SERP is designed to work in conjunction with the RIP to provide eligible executives with a retirement benefit equal to 57% of his or her applicable final average pay atage 61 with 30 years of service. Base salary and short-term incentives are included in determining an eligible executive's final average pay. Therefore, adjustments to anexecutive's base salary and short-term incentives have an impact on the amount of his or her retirement benefits.
-221-
Table of Contents
An eligible executive's SERP benefit generally becomes vested if, while employed by CH Energy Group or its affiliates, he or she attains the normal retirement age of 61 orattains his or her early retirement date of age 55 with 10 years or more of vesting service. The Compensation Committee believes that this vesting schedule enhances theretention program of the Corporation for eligible executives and rewards their long-term commitment to CH Energy Group.
For more information on the SERP and RIP, please refer to the "2012 Pension Benefits" section on page 235.
Other Retirement Benefits
Although Mr. Groft and Mr. Gould do not participate in the SERP and RIP, they are entitled to certain retirement benefits, which are intended to enhance the retentionincentives for these executives.
Each of Messrs. Groft, Laurito and Gould receives a profit sharing contribution to his 401(k) plan. The amount of the profit sharing contribution for each executive is setforth in the "All Other Compensation" column of the Summary Compensation Table, which is located on page 230.
Mr. Gould receives an annual credit to the Directors and Executives Deferred Compensation Plan in the amounts and on the dates set forth below, provided that he remainsin the employ of CH Energy Group and its affiliates through each such date: $43,750 on October 1, 2009; $60,000 on October 1, 2010; $60,000 on October 1, 2011; $65,000on October 1, 2012; $65,000 on October 1, 2013; and $70,000 on October 1, 2014. Mr. Gould is not eligible to participate in the Supplemental Executive Retirement Plan, sothese credited amounts were intended to enhance the retention incentives by providing him with a retirement benefit.
Health, Welfare and Other Personal Benefits
In addition to the principal compensation components described above, our Named Executive Officers are entitled to participate in all health, welfare, fringe benefit, andother arrangements generally available to other salaried employees of the corporate entity that employs them. We also may, as considered reasonable and appropriate on acase-by-case basis, provide the officers, including the Named Executive Officers, with limited financial planning benefits and an automobile allowance. The Compensation
http://www.sec.gov/Archives/edgar/data/18647/000106139313000018/form10k.htm[8/23/2013 4:25:39 PM]
Committee believes that these health, welfare, and other personal benefits are reasonable and consistent with the practices of the companies in the relevant comparatorgroups. The Compensation Committee also believes that these benefits assist CH Energy Group in attracting and retaining key executives.
-222-
Table of Contents
Severance Arrangements
The Corporation maintains the following severance arrangements with its Named Executive Officers:
Change in Control Agreements
The Corporation has entered into change in control agreements with the Named Executive Officers, other than Mr. Gould. Under the change in control agreements, each ofthe covered Named Executive Officers would be entitled to certain payments and benefits if a change in control were to occur and CH Energy Group or its affiliatesterminated the executive's employment without "cause" or the executive terminated his employment with CH Energy Group or its affiliates for "good reason" within a three-year period (a two-year period with respect to Mr. Groft) following such change in control. Benefits are also provided if the executive is terminated in anticipation of achange in control.
The benefit levels under the change in control agreements generally include a multiple of base salary and short-term incentive, along with continued welfare benefits, andare described in more detail under the "Potential Payments Upon Termination or Change in Control" section.
The agreements are designed to encourage the covered executive's full attention and dedication to CH Energy Group currently and in the event of any threatened or pendingchange in control. As described above, the agreements only provide benefits on a "double trigger," meaning that the benefits are due only if the executives incur a qualifyingtermination in connection with a change in control. This approach strikes an appropriate balance between providing incentives for the executives to build long-termshareholder value, while providing a potential acquirer the flexibility to retain executive talent after a transaction.
The Compensation Committee believes that the protections afforded by the change in control agreements are a valuable incentive for attracting and retaining key executivesand are competitive with those of other corporations. Based on information provided by Pay Governance, change in control arrangements are used by a vast majority of thecompanies in our comparator groups, and the Compensation Committee intends the terms of the change in control agreements to be consistent with prevailing marketpractices. In this regard, the terms and benefit levels for the senior executive officers were established by the Committee in 2005 after consultation with the Hay Group (theCommittee's consultant at that time) and a review of benefit levels provided to senior executives in the comparator groups. The executives did not have an opportunity tonegotiate the severance benefits provided under these agreements.
In 2005, the Compensation Committee eliminated the excise tax gross-up provisions with respect to change in control payments and benefits for all executive officers otherthan Mr. Lant. In November 2009, the Committee agreed to make a one-time exception to this policy and provide an excise tax gross-up provision in Mr. Laurito's changein control agreement. The Committee determined that offering this benefit was important in persuading Mr. Laurito to join CH Energy Group. On February 10, 2010, theBoard of Directors, acting in accordance with the recommendation of the Compensation Committee, determined that CH Energy Group will not enter into any new ormaterially amended agreements with executive officers that include excise tax gross-up provisions.
-223-
Table of Contents
Employment Agreement for Mr. Gould
In May 2009, we entered into an employment agreement with Mr. Gould in connection with his employment with CH Energy Group. The Committee believed that anemployment agreement, which provided for a fixed term of employment, was necessary in order to induce Mr. Gould to join us as Executive Vice President and GeneralCounsel.
Under his employment agreement, Mr. Gould would be entitled to certain payments and benefits if the Corporation or its affiliates terminated his employment without"cause" or he terminated his employment with the Corporation or its affiliates for "good reason" prior to December 31, 2014. The benefit levels are described under the"Potential Payments Upon Termination or Change in Control" section on page 240.
Because Mr. Gould is subject to an employment agreement, it was not necessary to provide the additional cash severance protections of the change in control agreementsdescribed above. As a result, Mr. Gould receives the same severance benefits regardless of whether his qualifying termination occurs before, after, or in connection with, achange in control.
Equity Awards
All time based restricted shares and restricted stock units held by the Named Executive Officers would immediately vest upon a change in control, and performance shareswould vest based on the extent to which the applicable performance goals had been achieved through the full fiscal quarters completed prior to the change in control. Unlikethe cash severance described above, the vesting is not contingent upon a qualifying termination within a certain period following a change in control. This "single trigger" isappropriate because the Compensation Committee wants the Named Executive Officers to have the opportunity to fully recognize the value of equity awards at the time of achange in control to the same extent as the other shareholders.
-224-
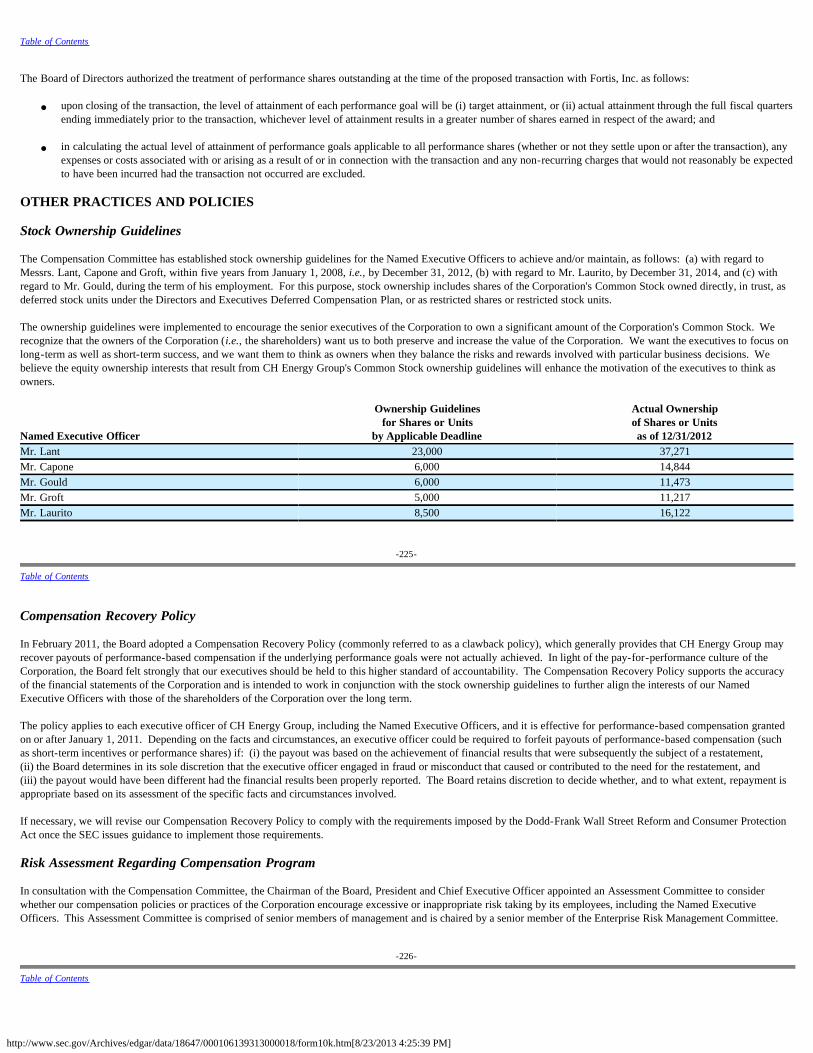
http://www.sec.gov/Archives/edgar/data/18647/000106139313000018/form10k.htm[8/23/2013 4:25:39 PM]
Table of Contents
The Board of Directors authorized the treatment of performance shares outstanding at the time of the proposed transaction with Fortis, Inc. as follows:
· upon closing of the transaction, the level of attainment of each performance goal will be (i) target attainment, or (ii) actual attainment through the full fiscal quartersending immediately prior to the transaction, whichever level of attainment results in a greater number of shares earned in respect of the award; and
· in calculating the actual level of attainment of performance goals applicable to all performance shares (whether or not they settle upon or after the transaction), anyexpenses or costs associated with or arising as a result of or in connection with the transaction and any non-recurring charges that would not reasonably be expectedto have been incurred had the transaction not occurred are excluded.
OTHER PRACTICES AND POLICIES
Stock Ownership Guidelines
The Compensation Committee has established stock ownership guidelines for the Named Executive Officers to achieve and/or maintain, as follows: (a) with regard toMessrs. Lant, Capone and Groft, within five years from January 1, 2008, i.e., by December 31, 2012, (b) with regard to Mr. Laurito, by December 31, 2014, and (c) withregard to Mr. Gould, during the term of his employment. For this purpose, stock ownership includes shares of the Corporation's Common Stock owned directly, in trust, asdeferred stock units under the Directors and Executives Deferred Compensation Plan, or as restricted shares or restricted stock units.
The ownership guidelines were implemented to encourage the senior executives of the Corporation to own a significant amount of the Corporation's Common Stock. Werecognize that the owners of the Corporation (i.e., the shareholders) want us to both preserve and increase the value of the Corporation. We want the executives to focus onlong-term as well as short-term success, and we want them to think as owners when they balance the risks and rewards involved with particular business decisions. Webelieve the equity ownership interests that result from CH Energy Group's Common Stock ownership guidelines will enhance the motivation of the executives to think asowners.
Named Executive Officer
Ownership Guidelinesfor Shares or Units
by Applicable Deadline
Actual Ownershipof Shares or Unitsas of 12/31/2012
Mr. Lant 23,000 37,271Mr. Capone 6,000 14,844Mr. Gould 6,000 11,473Mr. Groft 5,000 11,217Mr. Laurito 8,500 16,122
-225-
Table of Contents
Compensation Recovery Policy
In February 2011, the Board adopted a Compensation Recovery Policy (commonly referred to as a clawback policy), which generally provides that CH Energy Group mayrecover payouts of performance-based compensation if the underlying performance goals were not actually achieved. In light of the pay-for-performance culture of theCorporation, the Board felt strongly that our executives should be held to this higher standard of accountability. The Compensation Recovery Policy supports the accuracyof the financial statements of the Corporation and is intended to work in conjunction with the stock ownership guidelines to further align the interests of our NamedExecutive Officers with those of the shareholders of the Corporation over the long term.
The policy applies to each executive officer of CH Energy Group, including the Named Executive Officers, and it is effective for performance-based compensation grantedon or after January 1, 2011. Depending on the facts and circumstances, an executive officer could be required to forfeit payouts of performance-based compensation (suchas short-term incentives or performance shares) if: (i) the payout was based on the achievement of financial results that were subsequently the subject of a restatement,(ii) the Board determines in its sole discretion that the executive officer engaged in fraud or misconduct that caused or contributed to the need for the restatement, and(iii) the payout would have been different had the financial results been properly reported. The Board retains discretion to decide whether, and to what extent, repayment isappropriate based on its assessment of the specific facts and circumstances involved.
If necessary, we will revise our Compensation Recovery Policy to comply with the requirements imposed by the Dodd-Frank Wall Street Reform and Consumer ProtectionAct once the SEC issues guidance to implement those requirements.
Risk Assessment Regarding Compensation Program
In consultation with the Compensation Committee, the Chairman of the Board, President and Chief Executive Officer appointed an Assessment Committee to considerwhether our compensation policies or practices of the Corporation encourage excessive or inappropriate risk taking by its employees, including the Named ExecutiveOfficers. This Assessment Committee is comprised of senior members of management and is chaired by a senior member of the Enterprise Risk Management Committee.
-226-
Table of Contents
http://www.sec.gov/Archives/edgar/data/18647/000106139313000018/form10k.htm[8/23/2013 4:25:39 PM]
The Assessment Committee reviewed compensation policies and practices of the Corporation with particular focus on the relationship between the key business risks and theSTI program, the LTI program and the policies and practices of Central Hudson and Griffith. The Assessment Committee reported its findings to the CompensationCommittee that the Corporation's compensation policies and practices do not encourage decisions that would likely have a material adverse effect on the business of theCorporation. After review and discussion, the Compensation Committee members agreed with those findings. Recognizing that a significant portion of the executivecompensation program is performance-based, the committees concluded that our program does not encourage excessive or inappropriate risk-taking for the followingreasons:
•The executive compensation program of the Corporation reflects an appropriate mix of compensation elements and balances current and long-term performanceobjectives, cash and equity compensation, and risks and rewards associated with executive roles.
•We use a variety of corporate and individual performance metrics that are consistent with the business objectives of the Corporation and correlate to long-term value. The performance goals are set at levels that we believe are reasonable in light of past performance and market conditions.
•We do not use highly-leveraged performance goals; instead, incentive opportunities are based on balanced performance metrics that promote disciplined progresstoward long-term goals and all payouts are capped at a pre-established percentage of the target payment opportunity.
•We retain discretion to adjust compensation levels based on the quality of company and individual performance and adherence to the Corporation's ethics andcompliance programs, among other things.
•The long-term incentive opportunities generally vest over a period of three years to focus the executives of the Corporation on long-term performance and to enhanceretention. The performance shares are granted annually and have overlapping three-year performance periods, so any risks taken to increase the payout under oneaward could jeopardize the potential payouts under other awards.
•We regularly evaluate the compensation programs and levels of our compensation comparator groups to confirm that our compensation programs are consistent withmarket practice.
•As described above, we have adopted several risk mitigating strategies, such as stock ownership guidelines and a "clawback policy."
-227-
Table of Contents
FEDERAL INCOME TAX CONSIDERATIONS
The performance shares granted to the Named Executive Officers are intended to be fully deductible for federal income tax purposes under the performance-basedcompensation exception to Section 162(m) of the Internal Revenue Code.
The Committee, however, has not adopted a policy that requires all compensation to be deductible under Section 162(m) because the Committee wants to preserve theability to award compensation that is not deductible if it is in our shareholders' best interests. For example, the short-term incentives do not qualify for the performance-based compensation exception to Section 162(m) of the Internal Revenue Code because the Committee wants to retain the flexibility to base the short-term incentive payoutsin part on its assessment of individual performance of each executive.
The Committee anticipates that, in general, the short-term incentive paid to each named executive officer, other than Mr. Lant, will be fully deductible for federal incometax purposes because the short-term incentives, if any, earned by each such executive, when added to his other non-exempt compensation such as base salary, are highlyunlikely to exceed $1 million in any one year. Approximately $230,862 of Mr. Lant's 2012 short-term incentive was subject to the deduction limit imposed by Section162(m) and was not deductible for federal income tax purposes in 2012, because the aggregate of his base salary and short-term incentive for the year exceeded $1 million.
-228-
Table of Contents
COMPENSATION COMMITTEE REPORT
The Compensation Committee reviewed and discussed the Compensation Discussion and Analysis with the management of CH Energy Group and, based on such reviewand discussion, the Compensation Committee recommended to the Board of Directors that the Compensation Discussion and Analysis be included in this Annual Report onForm 10-K for the fiscal year ended December 31, 2012.
TheCompensationCommittee:
Stanley J.Grubel,ChairManuel J.Iraola
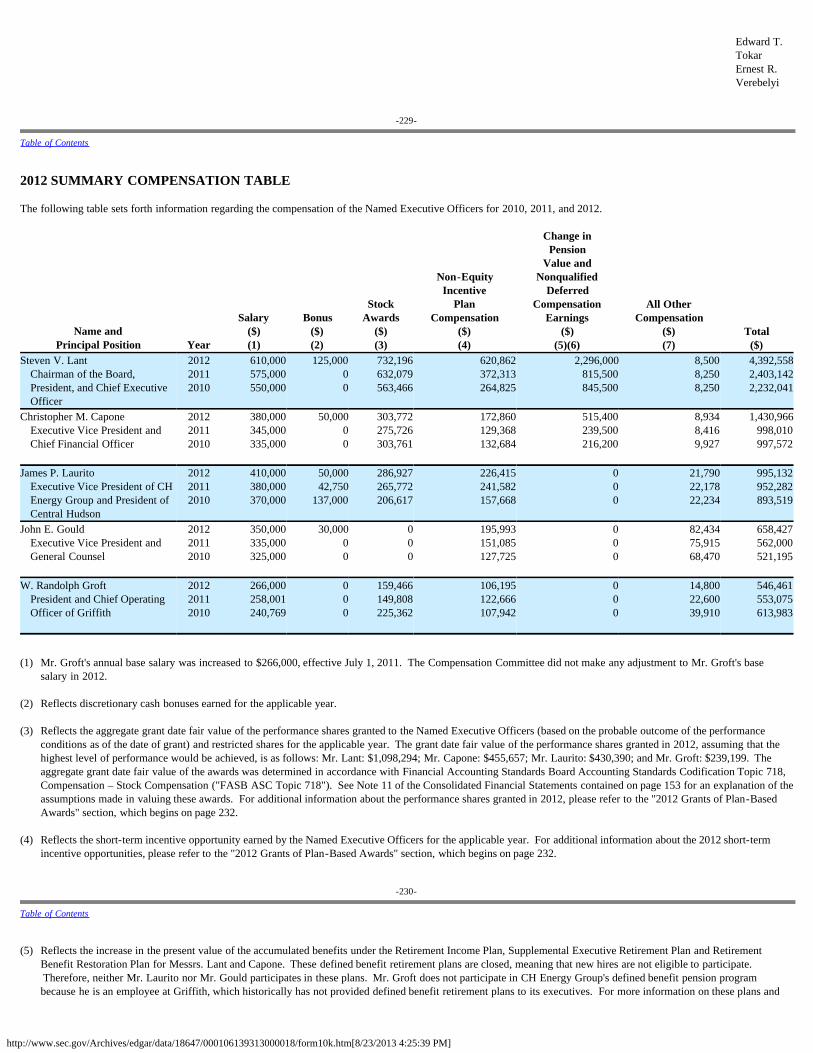
http://www.sec.gov/Archives/edgar/data/18647/000106139313000018/form10k.htm[8/23/2013 4:25:39 PM]
Edward T.TokarErnest R.Verebelyi
-229-
Table of Contents
2012 SUMMARY COMPENSATION TABLE
The following table sets forth information regarding the compensation of the Named Executive Officers for 2010, 2011, and 2012.
Name andPrincipal Position
Year
Salary($)(1)
Bonus($)(2)
StockAwards
($)(3)
Non-EquityIncentive
PlanCompensation
($)(4)
Change inPension
Value andNonqualified
DeferredCompensation
Earnings($)
(5)(6)
All OtherCompensation
($)(7)
Total($)
Steven V. LantChairman of the Board,President, and Chief ExecutiveOfficer
201220112010
610,000575,000550,000
125,00000
732,196632,079563,466
620,862372,313264,825
2,296,000815,500845,500
8,5008,2508,250
4,392,5582,403,1422,232,041
Christopher M. CaponeExecutive Vice President andChief Financial Officer
201220112010
380,000345,000335,000
50,00000
303,772275,726303,761
172,860129,368132,684
515,400239,500216,200
8,9348,4169,927
1,430,966998,010997,572
James P. LauritoExecutive Vice President of CHEnergy Group and President ofCentral Hudson
201220112010
410,000380,000370,000
50,00042,750
137,000
286,927265,772206,617
226,415241,582157,668
000
21,79022,17822,234
995,132952,282893,519
John E. Gould
Executive Vice President andGeneral Counsel
201220112010
350,000335,000325,000
30,00000
000
195,993151,085127,725
000
82,43475,91568,470
658,427562,000521,195
W. Randolph Groft
President and Chief OperatingOfficer of Griffith
201220112010
266,000258,001240,769
000
159,466149,808225,362
106,195122,666107,942
000
14,80022,60039,910
546,461553,075613,983
(1) Mr. Groft's annual base salary was increased to $266,000, effective July 1, 2011. The Compensation Committee did not make any adjustment to Mr. Groft's base
salary in 2012.
(2) Reflects discretionary cash bonuses earned for the applicable year.
(3) Reflects the aggregate grant date fair value of the performance shares granted to the Named Executive Officers (based on the probable outcome of the performanceconditions as of the date of grant) and restricted shares for the applicable year. The grant date fair value of the performance shares granted in 2012, assuming that thehighest level of performance would be achieved, is as follows: Mr. Lant: $1,098,294; Mr. Capone: $455,657; Mr. Laurito: $430,390; and Mr. Groft: $239,199. Theaggregate grant date fair value of the awards was determined in accordance with Financial Accounting Standards Board Accounting Standards Codification Topic 718,Compensation – Stock Compensation ("FASB ASC Topic 718"). See Note 11 of the Consolidated Financial Statements contained on page 153 for an explanation of theassumptions made in valuing these awards. For additional information about the performance shares granted in 2012, please refer to the "2012 Grants of Plan-BasedAwards" section, which begins on page 232.
(4) Reflects the short-term incentive opportunity earned by the Named Executive Officers for the applicable year. For additional information about the 2012 short-termincentive opportunities, please refer to the "2012 Grants of Plan-Based Awards" section, which begins on page 232.
-230-
Table of Contents
(5) Reflects the increase in the present value of the accumulated benefits under the Retirement Income Plan, Supplemental Executive Retirement Plan and Retirement
Benefit Restoration Plan for Messrs. Lant and Capone. These defined benefit retirement plans are closed, meaning that new hires are not eligible to participate. Therefore, neither Mr. Laurito nor Mr. Gould participates in these plans. Mr. Groft does not participate in CH Energy Group's defined benefit pension programbecause he is an employee at Griffith, which historically has not provided defined benefit retirement plans to its executives. For more information on these plans and
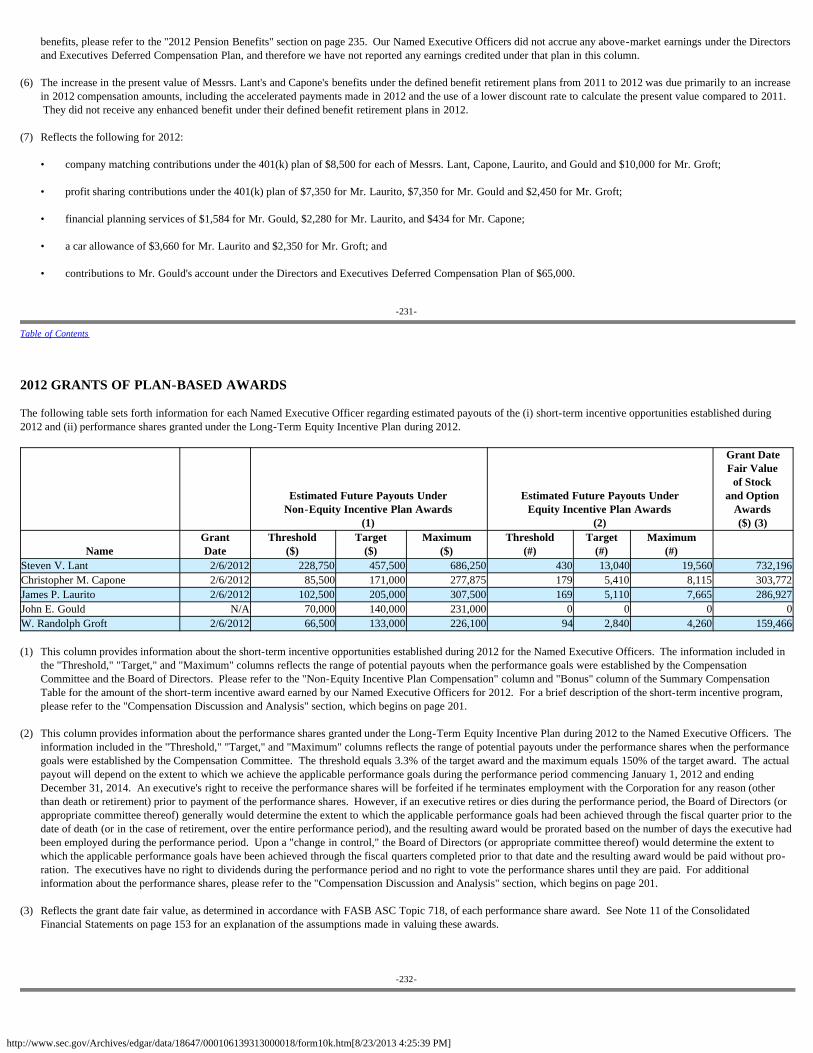
http://www.sec.gov/Archives/edgar/data/18647/000106139313000018/form10k.htm[8/23/2013 4:25:39 PM]
benefits, please refer to the "2012 Pension Benefits" section on page 235. Our Named Executive Officers did not accrue any above-market earnings under the Directorsand Executives Deferred Compensation Plan, and therefore we have not reported any earnings credited under that plan in this column.
(6) The increase in the present value of Messrs. Lant's and Capone's benefits under the defined benefit retirement plans from 2011 to 2012 was due primarily to an increasein 2012 compensation amounts, including the accelerated payments made in 2012 and the use of a lower discount rate to calculate the present value compared to 2011. They did not receive any enhanced benefit under their defined benefit retirement plans in 2012.
(7) Reflects the following for 2012:
• company matching contributions under the 401(k) plan of $8,500 for each of Messrs. Lant, Capone, Laurito, and Gould and $10,000 for Mr. Groft;
• profit sharing contributions under the 401(k) plan of $7,350 for Mr. Laurito, $7,350 for Mr. Gould and $2,450 for Mr. Groft;
• financial planning services of $1,584 for Mr. Gould, $2,280 for Mr. Laurito, and $434 for Mr. Capone;
• a car allowance of $3,660 for Mr. Laurito and $2,350 for Mr. Groft; and
• contributions to Mr. Gould's account under the Directors and Executives Deferred Compensation Plan of $65,000.
-231-
Table of Contents
2012 GRANTS OF PLAN-BASED AWARDS
The following table sets forth information for each Named Executive Officer regarding estimated payouts of the (i) short-term incentive opportunities established during2012 and (ii) performance shares granted under the Long-Term Equity Incentive Plan during 2012.
Estimated Future Payouts UnderNon-Equity Incentive Plan Awards
(1)
Estimated Future Payouts Under
Equity Incentive Plan Awards(2)
Grant DateFair Value
of Stockand Option
Awards($) (3)
NameGrantDate
Threshold($)
Target($)
Maximum($)
Threshold(#)
Target(#)
Maximum(#)
Steven V. Lant 2/6/2012 228,750 457,500 686,250 430 13,040 19,560 732,196Christopher M. Capone 2/6/2012 85,500 171,000 277,875 179 5,410 8,115 303,772James P. Laurito 2/6/2012 102,500 205,000 307,500 169 5,110 7,665 286,927John E. Gould N/A 70,000 140,000 231,000 0 0 0 0W. Randolph Groft 2/6/2012 66,500 133,000 226,100 94 2,840 4,260 159,466
(1) This column provides information about the short-term incentive opportunities established during 2012 for the Named Executive Officers. The information included inthe "Threshold," "Target," and "Maximum" columns reflects the range of potential payouts when the performance goals were established by the CompensationCommittee and the Board of Directors. Please refer to the "Non-Equity Incentive Plan Compensation" column and "Bonus" column of the Summary CompensationTable for the amount of the short-term incentive award earned by our Named Executive Officers for 2012. For a brief description of the short-term incentive program,please refer to the "Compensation Discussion and Analysis" section, which begins on page 201.
(2) This column provides information about the performance shares granted under the Long-Term Equity Incentive Plan during 2012 to the Named Executive Officers. Theinformation included in the "Threshold," "Target," and "Maximum" columns reflects the range of potential payouts under the performance shares when the performancegoals were established by the Compensation Committee. The threshold equals 3.3% of the target award and the maximum equals 150% of the target award. The actualpayout will depend on the extent to which we achieve the applicable performance goals during the performance period commencing January 1, 2012 and endingDecember 31, 2014. An executive's right to receive the performance shares will be forfeited if he terminates employment with the Corporation for any reason (otherthan death or retirement) prior to payment of the performance shares. However, if an executive retires or dies during the performance period, the Board of Directors (orappropriate committee thereof) generally would determine the extent to which the applicable performance goals had been achieved through the fiscal quarter prior to thedate of death (or in the case of retirement, over the entire performance period), and the resulting award would be prorated based on the number of days the executive hadbeen employed during the performance period. Upon a "change in control," the Board of Directors (or appropriate committee thereof) would determine the extent towhich the applicable performance goals have been achieved through the fiscal quarters completed prior to that date and the resulting award would be paid without pro-ration. The executives have no right to dividends during the performance period and no right to vote the performance shares until they are paid. For additionalinformation about the performance shares, please refer to the "Compensation Discussion and Analysis" section, which begins on page 201.
(3) Reflects the grant date fair value, as determined in accordance with FASB ASC Topic 718, of each performance share award. See Note 11 of the ConsolidatedFinancial Statements on page 153 for an explanation of the assumptions made in valuing these awards.
-232-
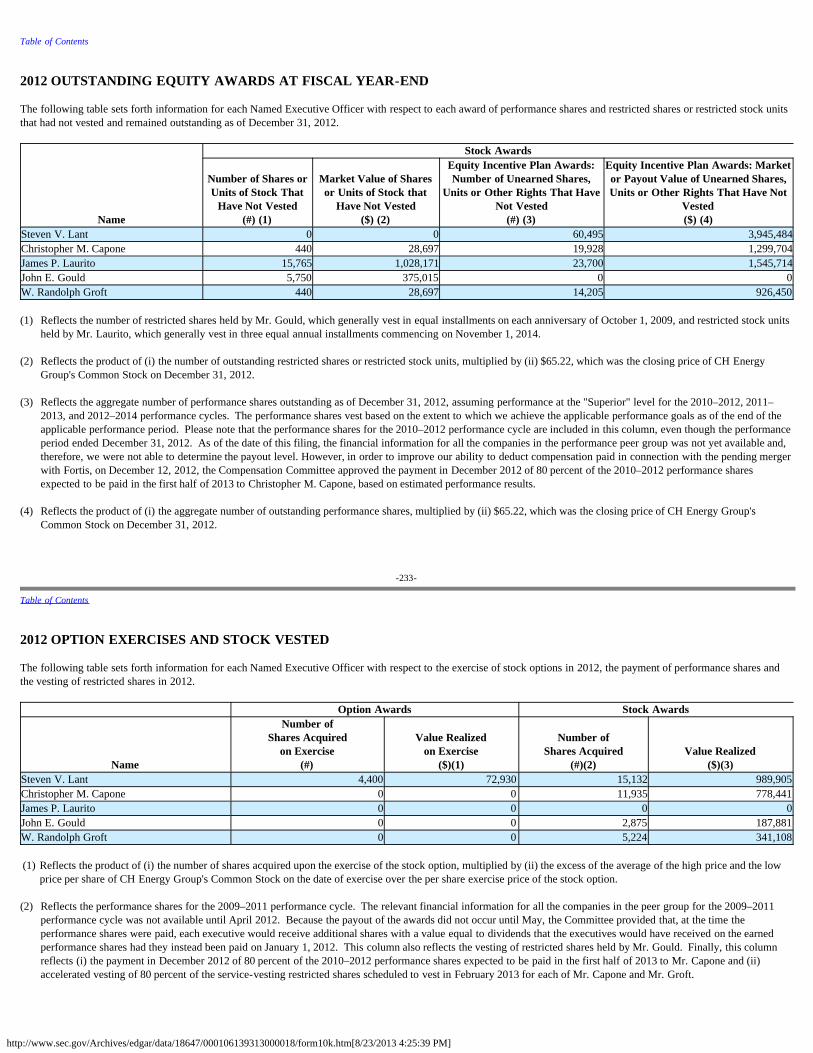
http://www.sec.gov/Archives/edgar/data/18647/000106139313000018/form10k.htm[8/23/2013 4:25:39 PM]
Table of Contents
2012 OUTSTANDING EQUITY AWARDS AT FISCAL YEAR-END
The following table sets forth information for each Named Executive Officer with respect to each award of performance shares and restricted shares or restricted stock unitsthat had not vested and remained outstanding as of December 31, 2012.
Name
Stock Awards
Number of Shares orUnits of Stock That
Have Not Vested(#) (1)
Market Value of Sharesor Units of Stock that
Have Not Vested($) (2)
Equity Incentive Plan Awards:Number of Unearned Shares,
Units or Other Rights That HaveNot Vested
(#) (3)
Equity Incentive Plan Awards: Marketor Payout Value of Unearned Shares,Units or Other Rights That Have Not
Vested($) (4)
Steven V. Lant 0 0 60,495 3,945,484Christopher M. Capone 440 28,697 19,928 1,299,704James P. Laurito 15,765 1,028,171 23,700 1,545,714John E. Gould 5,750 375,015 0 0W. Randolph Groft 440 28,697 14,205 926,450
(1) Reflects the number of restricted shares held by Mr. Gould, which generally vest in equal installments on each anniversary of October 1, 2009, and restricted stock unitsheld by Mr. Laurito, which generally vest in three equal annual installments commencing on November 1, 2014.
(2) Reflects the product of (i) the number of outstanding restricted shares or restricted stock units, multiplied by (ii) $65.22, which was the closing price of CH EnergyGroup's Common Stock on December 31, 2012.
(3) Reflects the aggregate number of performance shares outstanding as of December 31, 2012, assuming performance at the "Superior" level for the 2010–2012, 2011–2013, and 2012–2014 performance cycles. The performance shares vest based on the extent to which we achieve the applicable performance goals as of the end of theapplicable performance period. Please note that the performance shares for the 2010–2012 performance cycle are included in this column, even though the performanceperiod ended December 31, 2012. As of the date of this filing, the financial information for all the companies in the performance peer group was not yet available and,therefore, we were not able to determine the payout level. However, in order to improve our ability to deduct compensation paid in connection with the pending mergerwith Fortis, on December 12, 2012, the Compensation Committee approved the payment in December 2012 of 80 percent of the 2010–2012 performance sharesexpected to be paid in the first half of 2013 to Christopher M. Capone, based on estimated performance results.
(4) Reflects the product of (i) the aggregate number of outstanding performance shares, multiplied by (ii) $65.22, which was the closing price of CH Energy Group'sCommon Stock on December 31, 2012.
-233-
Table of Contents
2012 OPTION EXERCISES AND STOCK VESTED The following table sets forth information for each Named Executive Officer with respect to the exercise of stock options in 2012, the payment of performance shares andthe vesting of restricted shares in 2012. Option Awards Stock Awards
Name
Number ofShares Acquired
on Exercise(#)
Value Realizedon Exercise
($)(1)
Number ofShares Acquired
(#)(2)Value Realized
($)(3)Steven V. Lant 4,400 72,930 15,132 989,905Christopher M. Capone 0 0 11,935 778,441James P. Laurito 0 0 0 0John E. Gould 0 0 2,875 187,881W. Randolph Groft 0 0 5,224 341,108 (1) Reflects the product of (i) the number of shares acquired upon the exercise of the stock option, multiplied by (ii) the excess of the average of the high price and the low
price per share of CH Energy Group's Common Stock on the date of exercise over the per share exercise price of the stock option.
(2) Reflects the performance shares for the 2009–2011 performance cycle. The relevant financial information for all the companies in the peer group for the 2009–2011performance cycle was not available until April 2012. Because the payout of the awards did not occur until May, the Committee provided that, at the time theperformance shares were paid, each executive would receive additional shares with a value equal to dividends that the executives would have received on the earnedperformance shares had they instead been paid on January 1, 2012. This column also reflects the vesting of restricted shares held by Mr. Gould. Finally, this columnreflects (i) the payment in December 2012 of 80 percent of the 2010–2012 performance shares expected to be paid in the first half of 2013 to Mr. Capone and (ii)accelerated vesting of 80 percent of the service-vesting restricted shares scheduled to vest in February 2013 for each of Mr. Capone and Mr. Groft.
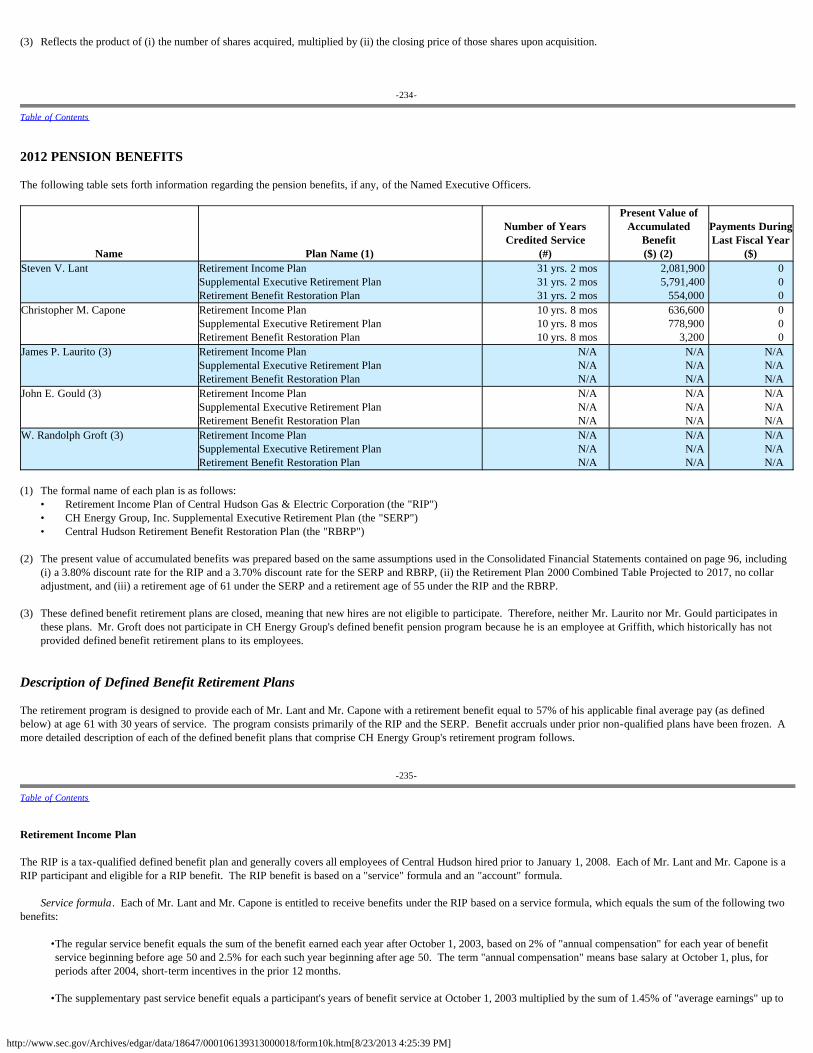
http://www.sec.gov/Archives/edgar/data/18647/000106139313000018/form10k.htm[8/23/2013 4:25:39 PM]
(3) Reflects the product of (i) the number of shares acquired, multiplied by (ii) the closing price of those shares upon acquisition.
-234-
Table of Contents
2012 PENSION BENEFITS
The following table sets forth information regarding the pension benefits, if any, of the Named Executive Officers.
Name Plan Name (1)
Number of YearsCredited Service
(#)
Present Value ofAccumulated
Benefit($) (2)
Payments DuringLast Fiscal Year
($)Steven V. Lant Retirement Income Plan
Supplemental Executive Retirement PlanRetirement Benefit Restoration Plan
31 yrs. 2 mos31 yrs. 2 mos31 yrs. 2 mos
2,081,9005,791,400
554,000
000
Christopher M. Capone Retirement Income PlanSupplemental Executive Retirement PlanRetirement Benefit Restoration Plan
10 yrs. 8 mos10 yrs. 8 mos10 yrs. 8 mos
636,600778,900
3,200
000
James P. Laurito (3) Retirement Income PlanSupplemental Executive Retirement PlanRetirement Benefit Restoration Plan
N/AN/AN/A
N/AN/AN/A
N/AN/AN/A
John E. Gould (3) Retirement Income PlanSupplemental Executive Retirement PlanRetirement Benefit Restoration Plan
N/AN/AN/A
N/AN/AN/A
N/AN/AN/A
W. Randolph Groft (3) Retirement Income PlanSupplemental Executive Retirement PlanRetirement Benefit Restoration Plan
N/AN/AN/A
N/AN/AN/A
N/AN/AN/A
(1) The formal name of each plan is as follows:• Retirement Income Plan of Central Hudson Gas & Electric Corporation (the "RIP")• CH Energy Group, Inc. Supplemental Executive Retirement Plan (the "SERP")• Central Hudson Retirement Benefit Restoration Plan (the "RBRP")
(2) The present value of accumulated benefits was prepared based on the same assumptions used in the Consolidated Financial Statements contained on page 96, including(i) a 3.80% discount rate for the RIP and a 3.70% discount rate for the SERP and RBRP, (ii) the Retirement Plan 2000 Combined Table Projected to 2017, no collaradjustment, and (iii) a retirement age of 61 under the SERP and a retirement age of 55 under the RIP and the RBRP.
(3) These defined benefit retirement plans are closed, meaning that new hires are not eligible to participate. Therefore, neither Mr. Laurito nor Mr. Gould participates inthese plans. Mr. Groft does not participate in CH Energy Group's defined benefit pension program because he is an employee at Griffith, which historically has notprovided defined benefit retirement plans to its employees.
Description of Defined Benefit Retirement Plans The retirement program is designed to provide each of Mr. Lant and Mr. Capone with a retirement benefit equal to 57% of his applicable final average pay (as definedbelow) at age 61 with 30 years of service. The program consists primarily of the RIP and the SERP. Benefit accruals under prior non-qualified plans have been frozen. Amore detailed description of each of the defined benefit plans that comprise CH Energy Group's retirement program follows.
-235-
Table of Contents
Retirement Income Plan
The RIP is a tax-qualified defined benefit plan and generally covers all employees of Central Hudson hired prior to January 1, 2008. Each of Mr. Lant and Mr. Capone is aRIP participant and eligible for a RIP benefit. The RIP benefit is based on a "service" formula and an "account" formula.
Service formula. Each of Mr. Lant and Mr. Capone is entitled to receive benefits under the RIP based on a service formula, which equals the sum of the following twobenefits:
•The regular service benefit equals the sum of the benefit earned each year after October 1, 2003, based on 2% of "annual compensation" for each year of benefitservice beginning before age 50 and 2.5% for each such year beginning after age 50. The term "annual compensation" means base salary at October 1, plus, forperiods after 2004, short-term incentives in the prior 12 months.
•The supplementary past service benefit equals a participant's years of benefit service at October 1, 2003 multiplied by the sum of 1.45% of "average earnings" up to
http://www.sec.gov/Archives/edgar/data/18647/000106139313000018/form10k.htm[8/23/2013 4:25:39 PM]
$37,500 and 1.75% of average earnings in excess of $37,500. If larger, a participant will receive the prior regular service benefit at September 30, 2003. The term"average earnings" means the average of 100% of base salary at October 1, 2001 and 2002 and 50% of base salary at October 1, 2000 and 2003.
However, the sum of the two benefits described above may not exceed the maximum service benefit, which equals the product of (i) 57% of a participant's highestconsecutive three-year average of base salary and short-term incentive during the ten-year period that precedes the participant's termination of employment, multiplied by(ii) a fraction, the numerator of which is the participant's years of benefit service (not to exceed 30) and the denominator of which is 30. The benefit is reduced by 0.333%for each full month the benefit begins before age 61.
The service formula benefit is payable as a monthly life annuity following normal retirement at age 65. The monthly benefit (unreduced for early commencement) is alsopayable following early retirement at or after age 55 with at least 10 years of service. Participants who retire on or after attaining age 58 receive a supplemental SocialSecurity retirement benefit that commences on the later of the participant's retirement date or age 59. This supplemental retirement benefit ceases once the participant hasattained Social Security retirement age (or after twenty-four monthly payments, if earlier). The supplemental benefit is equal to 80% of the estimated value of theparticipant's primary monthly Social Security benefit. The service formula benefit may also be paid in certain joint and survivor annuity forms that provide a reducedmonthly amount for the participant's life and, following the participant's death, payment for a named beneficiary's life. The RIP generally provides pre-retirement deathbenefits to a participant's surviving spouse.
-236-
Table of Contents
Account formula. Mr. Lant also has a hypothetical account balance under the RIP that is credited with the aggregate of the following amounts:
• For participants on January 1, 1987, 10% of the participant's base salary on that date.
• For participants on September 30, 1991, 5% of the participant's base salary on that date.
• For participants on September 30, 1997, 5% of the participant's base salary on that date.
• For participants on September 30, 1999, 5% of the participant's base salary on that date.
• Annual interest, generally based on the yield for 30-year Treasury Bonds.
Following termination of employment, a participant may receive the hypothetical account balance as a lump sum. Certain annuity forms of payment, which are the actuarialequivalent of the account balance, are also available. If the participant dies before payment begins, the account balance is payable in a lump sum to the participant'sbeneficiary (or, if the beneficiary is the participant's spouse, as a lump sum or an annuity).
Supplemental Executive Retirement Plan
Each of Mr. Lant and Mr. Capone participates in the SERP. The SERP is an unfunded, unsecured pension benefit plan for a select group of highly compensated employees. A participant's SERP benefit becomes vested if, while employed by CH Energy Group or its affiliates, he or she attains the normal retirement age of 61 or his or her earlyretirement date of age 55 with 10 years or more of vesting service, or a change in control occurs. A participant will forfeit his or her SERP benefit (whether or not vested atthe time) if his or her employment with CH Energy Group is terminated for "cause."
The SERP retirement benefit of a participant equals the excess, if any, of the (i) participant's normal retirement benefit or early retirement benefit described below, over(ii) the actuarial equivalent of the participant's cumulative benefits under the RIP (excluding the account benefit component) and RBRP (excluding the account benefitcomponent), each calculated as though paid in the form of a single life annuity as the normal retirement benefit becomes payable under the SERP.
-237-
Table of Contents
•Normal Retirement Benefit. If a participant terminates employment on or after the date he or she attains age 61, he or she will be entitled to a normal retirementbenefit. The annualized normal retirement benefit is equal to (i) 57% of the participant's highest consecutive three-year average of base salary and short-term incentiveduring the ten-year period that precedes the participant's termination of employment, multiplied by (ii) a fraction, the numerator of which is the participant's years ofbenefit service under the RIP (not to exceed 30) and the denominator of which is 30.
•Early Retirement Benefit. Upon the participant's vested termination of employment before the date he or she attains age 61, the participant will be entitled to an earlyretirement benefit equal to the normal retirement benefit (described above) reduced by 0.333% for each full month by which his or her benefit commencement dateprecedes the date the participant attains age 61.
The SERP retirement benefit commences on the first day of the seventh month following the participant's vested termination of employment and is paid monthly in the formof a life annuity elected by the participant, except that a participant who is vested solely as a result of a change in control shall commence receiving payment on the later ofthe first day of the seventh month following his or her termination of employment or age 55. The normal form of benefit under the SERP is a single life annuity for singleparticipants and a joint and 100% survivor annuity for married participants. However, participants may select a single life annuity or a 30%, 40%, 50%, 75%, or 100% jointand survivor annuity (or other annuity permitted by CH Energy Group). If elected by the participant, upon the death of the participant's spouse the surviving participant'smonthly annuity may be converted to the single life annuity the participant would have received, had he or she elected a single life annuity at retirement.
A SERP benefit is also payable if a participant is vested in his or her benefit at the time of his or her death or disability. A participant's compensation and years of additional
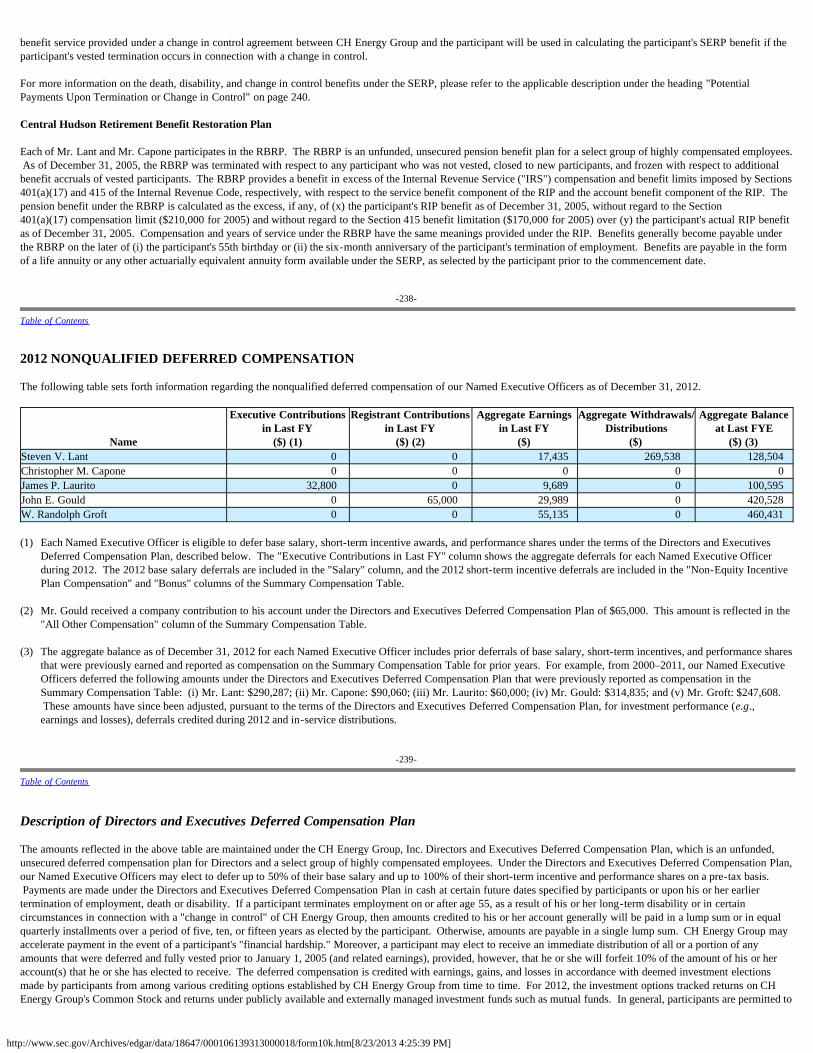
http://www.sec.gov/Archives/edgar/data/18647/000106139313000018/form10k.htm[8/23/2013 4:25:39 PM]
benefit service provided under a change in control agreement between CH Energy Group and the participant will be used in calculating the participant's SERP benefit if theparticipant's vested termination occurs in connection with a change in control.
For more information on the death, disability, and change in control benefits under the SERP, please refer to the applicable description under the heading "PotentialPayments Upon Termination or Change in Control" on page 240.
Central Hudson Retirement Benefit Restoration Plan
Each of Mr. Lant and Mr. Capone participates in the RBRP. The RBRP is an unfunded, unsecured pension benefit plan for a select group of highly compensated employees. As of December 31, 2005, the RBRP was terminated with respect to any participant who was not vested, closed to new participants, and frozen with respect to additionalbenefit accruals of vested participants. The RBRP provides a benefit in excess of the Internal Revenue Service ("IRS") compensation and benefit limits imposed by Sections401(a)(17) and 415 of the Internal Revenue Code, respectively, with respect to the service benefit component of the RIP and the account benefit component of the RIP. Thepension benefit under the RBRP is calculated as the excess, if any, of (x) the participant's RIP benefit as of December 31, 2005, without regard to the Section401(a)(17) compensation limit ($210,000 for 2005) and without regard to the Section 415 benefit limitation ($170,000 for 2005) over (y) the participant's actual RIP benefitas of December 31, 2005. Compensation and years of service under the RBRP have the same meanings provided under the RIP. Benefits generally become payable underthe RBRP on the later of (i) the participant's 55th birthday or (ii) the six-month anniversary of the participant's termination of employment. Benefits are payable in the formof a life annuity or any other actuarially equivalent annuity form available under the SERP, as selected by the participant prior to the commencement date.
-238-
Table of Contents
2012 NONQUALIFIED DEFERRED COMPENSATION
The following table sets forth information regarding the nonqualified deferred compensation of our Named Executive Officers as of December 31, 2012.
Name
Executive Contributionsin Last FY
($) (1)
Registrant Contributionsin Last FY
($) (2)
Aggregate Earningsin Last FY
($)
Aggregate Withdrawals/Distributions
($)
Aggregate Balanceat Last FYE
($) (3)Steven V. Lant 0 0 17,435 269,538 128,504Christopher M. Capone 0 0 0 0 0James P. Laurito 32,800 0 9,689 0 100,595John E. Gould 0 65,000 29,989 0 420,528W. Randolph Groft 0 0 55,135 0 460,431
(1) Each Named Executive Officer is eligible to defer base salary, short-term incentive awards, and performance shares under the terms of the Directors and ExecutivesDeferred Compensation Plan, described below. The "Executive Contributions in Last FY" column shows the aggregate deferrals for each Named Executive Officerduring 2012. The 2012 base salary deferrals are included in the "Salary" column, and the 2012 short-term incentive deferrals are included in the "Non-Equity IncentivePlan Compensation" and "Bonus" columns of the Summary Compensation Table.
(2) Mr. Gould received a company contribution to his account under the Directors and Executives Deferred Compensation Plan of $65,000. This amount is reflected in the"All Other Compensation" column of the Summary Compensation Table.
(3) The aggregate balance as of December 31, 2012 for each Named Executive Officer includes prior deferrals of base salary, short-term incentives, and performance sharesthat were previously earned and reported as compensation on the Summary Compensation Table for prior years. For example, from 2000–2011, our Named ExecutiveOfficers deferred the following amounts under the Directors and Executives Deferred Compensation Plan that were previously reported as compensation in theSummary Compensation Table: (i) Mr. Lant: $290,287; (ii) Mr. Capone: $90,060; (iii) Mr. Laurito: $60,000; (iv) Mr. Gould: $314,835; and (v) Mr. Groft: $247,608. These amounts have since been adjusted, pursuant to the terms of the Directors and Executives Deferred Compensation Plan, for investment performance (e.g.,earnings and losses), deferrals credited during 2012 and in-service distributions.
-239-
Table of Contents
Description of Directors and Executives Deferred Compensation Plan
The amounts reflected in the above table are maintained under the CH Energy Group, Inc. Directors and Executives Deferred Compensation Plan, which is an unfunded,unsecured deferred compensation plan for Directors and a select group of highly compensated employees. Under the Directors and Executives Deferred Compensation Plan,our Named Executive Officers may elect to defer up to 50% of their base salary and up to 100% of their short-term incentive and performance shares on a pre-tax basis. Payments are made under the Directors and Executives Deferred Compensation Plan in cash at certain future dates specified by participants or upon his or her earliertermination of employment, death or disability. If a participant terminates employment on or after age 55, as a result of his or her long-term disability or in certaincircumstances in connection with a "change in control" of CH Energy Group, then amounts credited to his or her account generally will be paid in a lump sum or in equalquarterly installments over a period of five, ten, or fifteen years as elected by the participant. Otherwise, amounts are payable in a single lump sum. CH Energy Group mayaccelerate payment in the event of a participant's "financial hardship." Moreover, a participant may elect to receive an immediate distribution of all or a portion of anyamounts that were deferred and fully vested prior to January 1, 2005 (and related earnings), provided, however, that he or she will forfeit 10% of the amount of his or heraccount(s) that he or she has elected to receive. The deferred compensation is credited with earnings, gains, and losses in accordance with deemed investment electionsmade by participants from among various crediting options established by CH Energy Group from time to time. For 2012, the investment options tracked returns on CHEnergy Group's Common Stock and returns under publicly available and externally managed investment funds such as mutual funds. In general, participants are permitted to
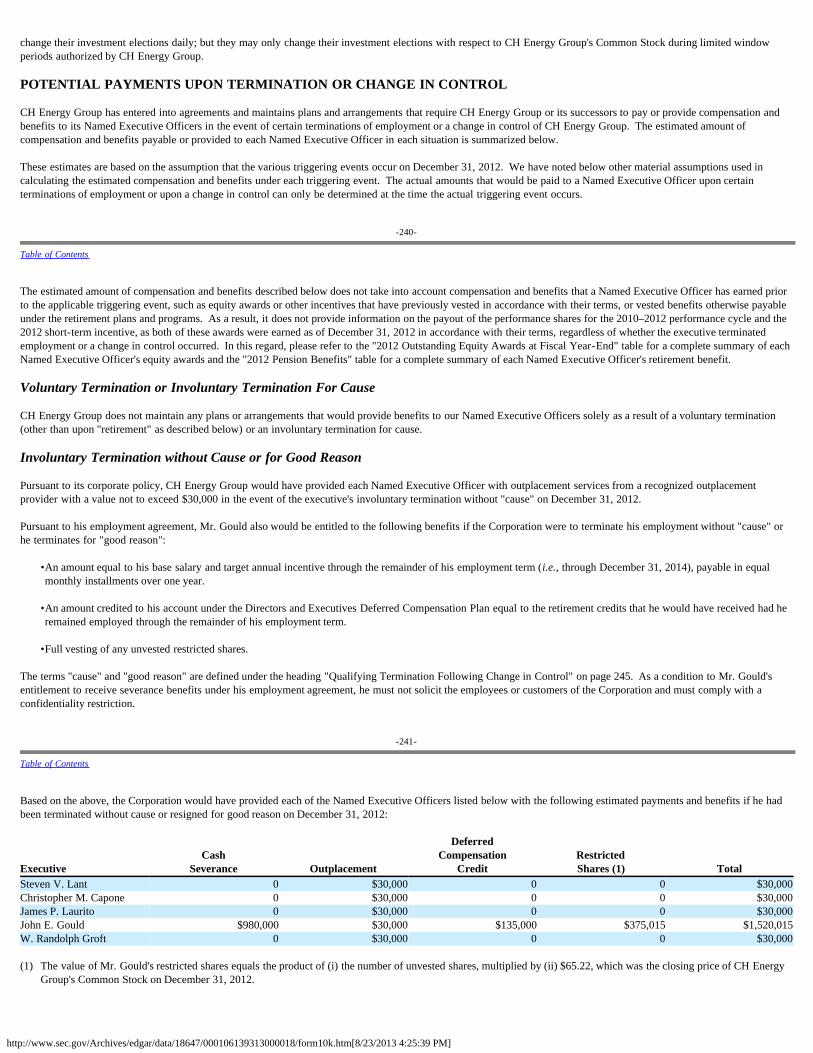
http://www.sec.gov/Archives/edgar/data/18647/000106139313000018/form10k.htm[8/23/2013 4:25:39 PM]
change their investment elections daily; but they may only change their investment elections with respect to CH Energy Group's Common Stock during limited windowperiods authorized by CH Energy Group.
POTENTIAL PAYMENTS UPON TERMINATION OR CHANGE IN CONTROL
CH Energy Group has entered into agreements and maintains plans and arrangements that require CH Energy Group or its successors to pay or provide compensation andbenefits to its Named Executive Officers in the event of certain terminations of employment or a change in control of CH Energy Group. The estimated amount ofcompensation and benefits payable or provided to each Named Executive Officer in each situation is summarized below.
These estimates are based on the assumption that the various triggering events occur on December 31, 2012. We have noted below other material assumptions used incalculating the estimated compensation and benefits under each triggering event. The actual amounts that would be paid to a Named Executive Officer upon certainterminations of employment or upon a change in control can only be determined at the time the actual triggering event occurs.
-240-
Table of Contents
The estimated amount of compensation and benefits described below does not take into account compensation and benefits that a Named Executive Officer has earned priorto the applicable triggering event, such as equity awards or other incentives that have previously vested in accordance with their terms, or vested benefits otherwise payableunder the retirement plans and programs. As a result, it does not provide information on the payout of the performance shares for the 2010–2012 performance cycle and the2012 short-term incentive, as both of these awards were earned as of December 31, 2012 in accordance with their terms, regardless of whether the executive terminatedemployment or a change in control occurred. In this regard, please refer to the "2012 Outstanding Equity Awards at Fiscal Year-End" table for a complete summary of eachNamed Executive Officer's equity awards and the "2012 Pension Benefits" table for a complete summary of each Named Executive Officer's retirement benefit.
Voluntary Termination or Involuntary Termination For Cause
CH Energy Group does not maintain any plans or arrangements that would provide benefits to our Named Executive Officers solely as a result of a voluntary termination(other than upon "retirement" as described below) or an involuntary termination for cause.
Involuntary Termination without Cause or for Good Reason
Pursuant to its corporate policy, CH Energy Group would have provided each Named Executive Officer with outplacement services from a recognized outplacementprovider with a value not to exceed $30,000 in the event of the executive's involuntary termination without "cause" on December 31, 2012.
Pursuant to his employment agreement, Mr. Gould also would be entitled to the following benefits if the Corporation were to terminate his employment without "cause" orhe terminates for "good reason":
•An amount equal to his base salary and target annual incentive through the remainder of his employment term (i.e., through December 31, 2014), payable in equalmonthly installments over one year.
•An amount credited to his account under the Directors and Executives Deferred Compensation Plan equal to the retirement credits that he would have received had heremained employed through the remainder of his employment term.
•Full vesting of any unvested restricted shares.
The terms "cause" and "good reason" are defined under the heading "Qualifying Termination Following Change in Control" on page 245. As a condition to Mr. Gould'sentitlement to receive severance benefits under his employment agreement, he must not solicit the employees or customers of the Corporation and must comply with aconfidentiality restriction.
-241-
Table of Contents
Based on the above, the Corporation would have provided each of the Named Executive Officers listed below with the following estimated payments and benefits if he hadbeen terminated without cause or resigned for good reason on December 31, 2012:
ExecutiveCash
Severance Outplacement
DeferredCompensation
CreditRestrictedShares (1) Total
Steven V. Lant 0 $30,000 0 0 $30,000Christopher M. Capone 0 $30,000 0 0 $30,000James P. Laurito 0 $30,000 0 0 $30,000John E. Gould $980,000 $30,000 $135,000 $375,015 $1,520,015W. Randolph Groft 0 $30,000 0 0 $30,000
(1) The value of Mr. Gould's restricted shares equals the product of (i) the number of unvested shares, multiplied by (ii) $65.22, which was the closing price of CH EnergyGroup's Common Stock on December 31, 2012.
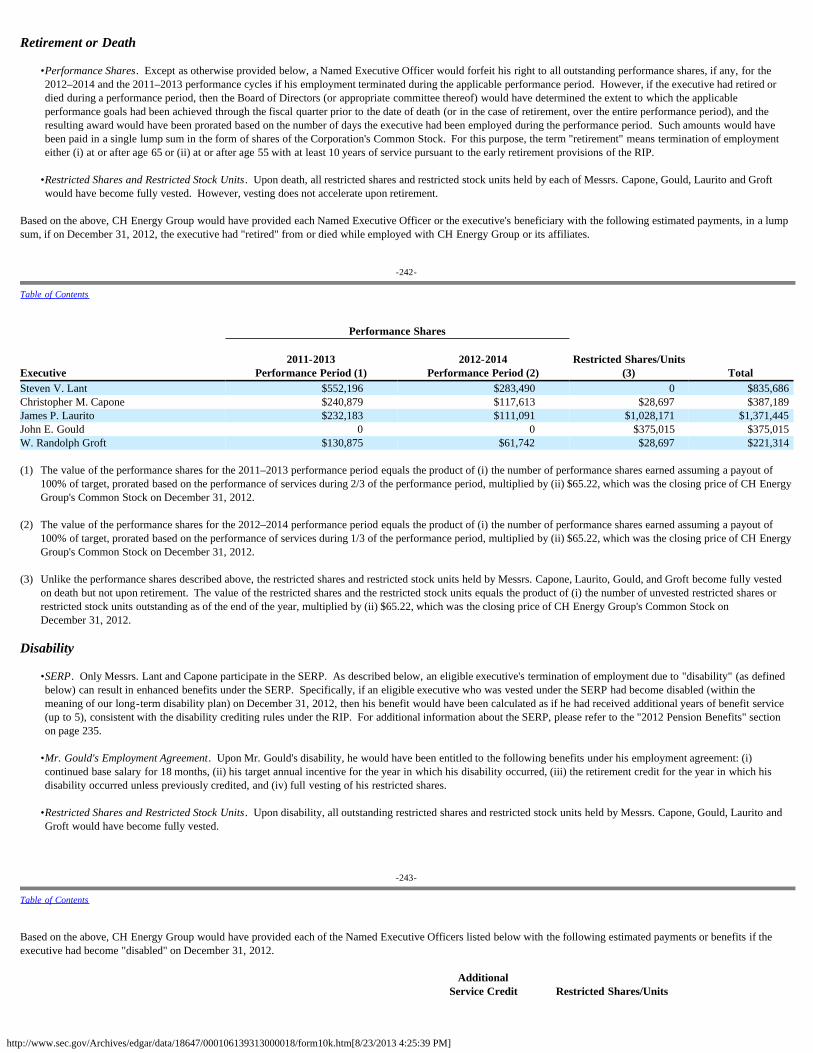
http://www.sec.gov/Archives/edgar/data/18647/000106139313000018/form10k.htm[8/23/2013 4:25:39 PM]
Retirement or Death
•Performance Shares. Except as otherwise provided below, a Named Executive Officer would forfeit his right to all outstanding performance shares, if any, for the2012–2014 and the 2011–2013 performance cycles if his employment terminated during the applicable performance period. However, if the executive had retired ordied during a performance period, then the Board of Directors (or appropriate committee thereof) would have determined the extent to which the applicableperformance goals had been achieved through the fiscal quarter prior to the date of death (or in the case of retirement, over the entire performance period), and theresulting award would have been prorated based on the number of days the executive had been employed during the performance period. Such amounts would havebeen paid in a single lump sum in the form of shares of the Corporation's Common Stock. For this purpose, the term "retirement" means termination of employmenteither (i) at or after age 65 or (ii) at or after age 55 with at least 10 years of service pursuant to the early retirement provisions of the RIP.
•Restricted Shares and Restricted Stock Units. Upon death, all restricted shares and restricted stock units held by each of Messrs. Capone, Gould, Laurito and Groftwould have become fully vested. However, vesting does not accelerate upon retirement.
Based on the above, CH Energy Group would have provided each Named Executive Officer or the executive's beneficiary with the following estimated payments, in a lumpsum, if on December 31, 2012, the executive had "retired" from or died while employed with CH Energy Group or its affiliates.
-242-
Table of Contents
Performance Shares
Executive2011-2013
Performance Period (1)2012-2014
Performance Period (2)Restricted Shares/Units
(3)
TotalSteven V. Lant $552,196 $283,490 0 $835,686Christopher M. Capone $240,879 $117,613 $28,697 $387,189James P. Laurito $232,183 $111,091 $1,028,171 $1,371,445John E. Gould 0 0 $375,015 $375,015W. Randolph Groft $130,875 $61,742 $28,697 $221,314
(1) The value of the performance shares for the 2011–2013 performance period equals the product of (i) the number of performance shares earned assuming a payout of100% of target, prorated based on the performance of services during 2/3 of the performance period, multiplied by (ii) $65.22, which was the closing price of CH EnergyGroup's Common Stock on December 31, 2012.
(2) The value of the performance shares for the 2012–2014 performance period equals the product of (i) the number of performance shares earned assuming a payout of100% of target, prorated based on the performance of services during 1/3 of the performance period, multiplied by (ii) $65.22, which was the closing price of CH EnergyGroup's Common Stock on December 31, 2012.
(3) Unlike the performance shares described above, the restricted shares and restricted stock units held by Messrs. Capone, Laurito, Gould, and Groft become fully vestedon death but not upon retirement. The value of the restricted shares and the restricted stock units equals the product of (i) the number of unvested restricted shares orrestricted stock units outstanding as of the end of the year, multiplied by (ii) $65.22, which was the closing price of CH Energy Group's Common Stock onDecember 31, 2012.
Disability
•SERP. Only Messrs. Lant and Capone participate in the SERP. As described below, an eligible executive's termination of employment due to "disability" (as definedbelow) can result in enhanced benefits under the SERP. Specifically, if an eligible executive who was vested under the SERP had become disabled (within themeaning of our long-term disability plan) on December 31, 2012, then his benefit would have been calculated as if he had received additional years of benefit service(up to 5), consistent with the disability crediting rules under the RIP. For additional information about the SERP, please refer to the "2012 Pension Benefits" sectionon page 235.
•Mr. Gould's Employment Agreement. Upon Mr. Gould's disability, he would have been entitled to the following benefits under his employment agreement: (i)continued base salary for 18 months, (ii) his target annual incentive for the year in which his disability occurred, (iii) the retirement credit for the year in which hisdisability occurred unless previously credited, and (iv) full vesting of his restricted shares.
•Restricted Shares and Restricted Stock Units. Upon disability, all outstanding restricted shares and restricted stock units held by Messrs. Capone, Gould, Laurito andGroft would have become fully vested.
-243-
Table of Contents
Based on the above, CH Energy Group would have provided each of the Named Executive Officers listed below with the following estimated payments or benefits if theexecutive had become "disabled" on December 31, 2012.
AdditionalService Credit Restricted Shares/Units
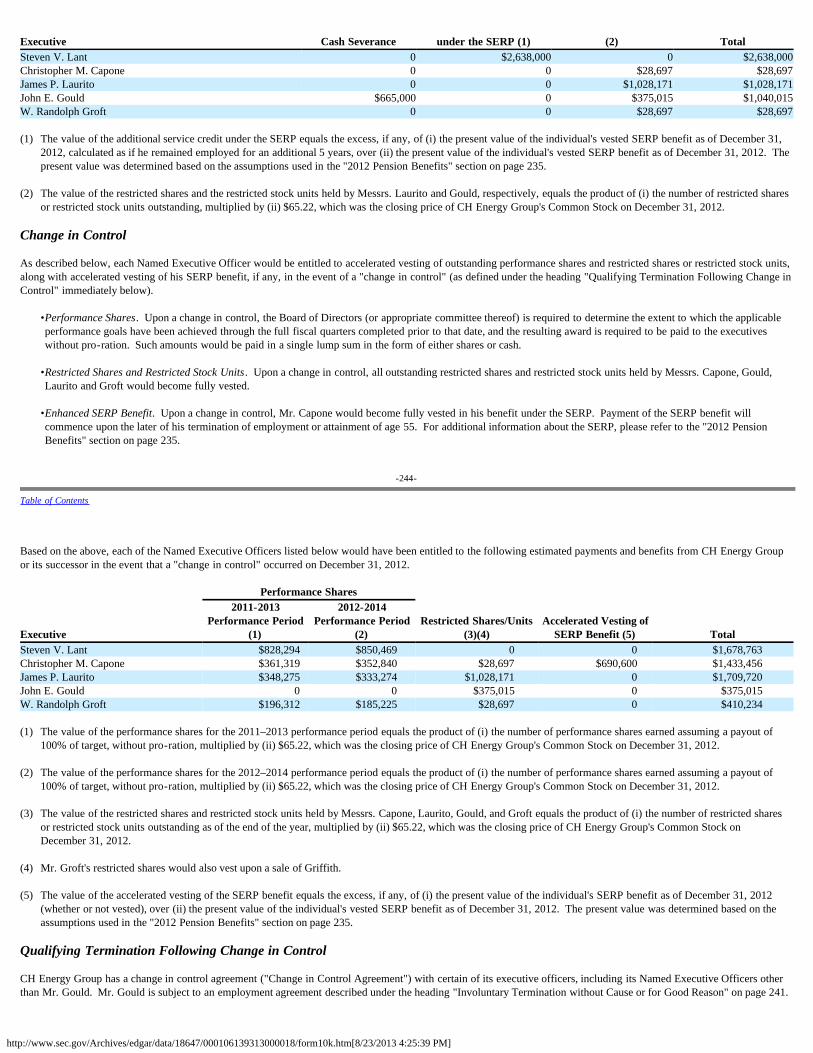
http://www.sec.gov/Archives/edgar/data/18647/000106139313000018/form10k.htm[8/23/2013 4:25:39 PM]
Executive Cash Severance under the SERP (1) (2) TotalSteven V. Lant 0 $2,638,000 0 $2,638,000Christopher M. Capone 0 0 $28,697 $28,697James P. Laurito 0 0 $1,028,171 $1,028,171John E. Gould $665,000 0 $375,015 $1,040,015W. Randolph Groft 0 0 $28,697 $28,697
(1) The value of the additional service credit under the SERP equals the excess, if any, of (i) the present value of the individual's vested SERP benefit as of December 31,2012, calculated as if he remained employed for an additional 5 years, over (ii) the present value of the individual's vested SERP benefit as of December 31, 2012. Thepresent value was determined based on the assumptions used in the "2012 Pension Benefits" section on page 235.
(2) The value of the restricted shares and the restricted stock units held by Messrs. Laurito and Gould, respectively, equals the product of (i) the number of restricted sharesor restricted stock units outstanding, multiplied by (ii) $65.22, which was the closing price of CH Energy Group's Common Stock on December 31, 2012.
Change in Control
As described below, each Named Executive Officer would be entitled to accelerated vesting of outstanding performance shares and restricted shares or restricted stock units,along with accelerated vesting of his SERP benefit, if any, in the event of a "change in control" (as defined under the heading "Qualifying Termination Following Change inControl" immediately below).
•Performance Shares. Upon a change in control, the Board of Directors (or appropriate committee thereof) is required to determine the extent to which the applicableperformance goals have been achieved through the full fiscal quarters completed prior to that date, and the resulting award is required to be paid to the executiveswithout pro-ration. Such amounts would be paid in a single lump sum in the form of either shares or cash.
•Restricted Shares and Restricted Stock Units. Upon a change in control, all outstanding restricted shares and restricted stock units held by Messrs. Capone, Gould,Laurito and Groft would become fully vested.
•Enhanced SERP Benefit. Upon a change in control, Mr. Capone would become fully vested in his benefit under the SERP. Payment of the SERP benefit willcommence upon the later of his termination of employment or attainment of age 55. For additional information about the SERP, please refer to the "2012 PensionBenefits" section on page 235.
-244-
Table of Contents
Based on the above, each of the Named Executive Officers listed below would have been entitled to the following estimated payments and benefits from CH Energy Groupor its successor in the event that a "change in control" occurred on December 31, 2012.
Performance Shares
Executive
2011-2013Performance Period
(1)
2012-2014Performance Period
(2)Restricted Shares/Units
(3)(4)Accelerated Vesting of
SERP Benefit (5) TotalSteven V. Lant $828,294 $850,469 0 0 $1,678,763Christopher M. Capone $361,319 $352,840 $28,697 $690,600 $1,433,456James P. Laurito $348,275 $333,274 $1,028,171 0 $1,709,720John E. Gould 0 0 $375,015 0 $375,015W. Randolph Groft $196,312 $185,225 $28,697 0 $410,234
(1) The value of the performance shares for the 2011–2013 performance period equals the product of (i) the number of performance shares earned assuming a payout of100% of target, without pro-ration, multiplied by (ii) $65.22, which was the closing price of CH Energy Group's Common Stock on December 31, 2012.
(2) The value of the performance shares for the 2012–2014 performance period equals the product of (i) the number of performance shares earned assuming a payout of100% of target, without pro-ration, multiplied by (ii) $65.22, which was the closing price of CH Energy Group's Common Stock on December 31, 2012.
(3) The value of the restricted shares and restricted stock units held by Messrs. Capone, Laurito, Gould, and Groft equals the product of (i) the number of restricted sharesor restricted stock units outstanding as of the end of the year, multiplied by (ii) $65.22, which was the closing price of CH Energy Group's Common Stock onDecember 31, 2012.
(4) Mr. Groft's restricted shares would also vest upon a sale of Griffith.
(5) The value of the accelerated vesting of the SERP benefit equals the excess, if any, of (i) the present value of the individual's SERP benefit as of December 31, 2012(whether or not vested), over (ii) the present value of the individual's vested SERP benefit as of December 31, 2012. The present value was determined based on theassumptions used in the "2012 Pension Benefits" section on page 235.
Qualifying Termination Following Change in Control
CH Energy Group has a change in control agreement ("Change in Control Agreement") with certain of its executive officers, including its Named Executive Officers otherthan Mr. Gould. Mr. Gould is subject to an employment agreement described under the heading "Involuntary Termination without Cause or for Good Reason" on page 241.
http://www.sec.gov/Archives/edgar/data/18647/000106139313000018/form10k.htm[8/23/2013 4:25:39 PM]
-245-
Table of Contents
The Change in Control Agreements generally become effective only upon a change in control of CH Energy Group (as defined below), or if a covered executive isterminated in anticipation of a change in control, and provide certain benefits and protections to the covered executives during the three-year period (a two-year period forMr. Groft) following a change in control. For example, the Change in Control Agreements generally provide that an executive's terms and conditions of employment(including duties, location, base salary, short-term incentive, and benefits) would not be adversely changed during the three-year period (a two-year period forMr. Groft) following a change in control. Moreover, the Change in Control Agreements provide that the executive would be entitled to certain severance benefits if, duringthe three-year period (a two-year period for Mr. Groft) following a change in control, the executive's employment were terminated without "cause" or the executiveterminated his employment for "good reason." In general, the executive would be entitled to receive:
•A prorated short-term incentive based on the average of the executive's last three pre-change in control short-term incentives ("Average Annual Incentive"), paid in alump sum.
•An amount equal to three times (or two times for Mr. Groft) the sum of the executive's base salary and Average Annual Incentive, payable in 12 equal monthlyinstallments.
•Outplacement services from a recognized outplacement provider, with a value not to exceed $30,000.
•Continued welfare benefits (including health care benefits) for a period of three years (a two-year period for Mr. Groft) following termination, subject to mitigationupon receiving similar benefits from another employer.
•For each of Messrs. Lant and Laurito only, a "conditional gross-up" for excise and related taxes in the event the severance compensation and other payments ordistributions to him, whether pursuant to the change in control agreement, performance share or otherwise would constitute "excess parachute payments," as defined inSection 280G of the Internal Revenue Code. The tax gross-up will be provided if the aggregate parachute value of all severance and other change in control paymentsexceeds 110% of the maximum amount that may be paid under Section 280G of the Internal Revenue Code without imposition of an excise tax. If the parachute valueof the payments does not exceed the 110% threshold, the executive's payments will be reduced to the extent necessary to avoid imposition of the excise tax on "excessparachute payments." In contrast, the other Named Executive Officers (i.e., Messrs. Capone and Groft) would be responsible for paying the applicable excise taxesunder Section 280G imposed on any payments under the Change in Control Agreement, employment agreement or otherwise, but any payments subject to the excisetax would be reduced if such reduction provides a larger after-tax benefit than if the excise tax applied.
•Reimbursement for all legal fees and expenses reasonably incurred in asserting his rights under the Agreements, regardless of the outcome of the dispute (unless atribunal determines that the executive's position was frivolous or maintained in bad faith). For purposes of the above calculations, we have assumed that the executivewill not incur legal fees to enforce his rights under the Change in Control Agreement.
-246-
Table of Contents
Definitions
For purposes of the Change in Control Agreement, the following words have the meanings set forth below.
•Change in control. A change in control generally means any of the following: (i) an acquisition of 20% or more of CH Energy Group's Common Stock; (ii) a changein the membership of our Board of Directors, such that the current incumbents and their approved successors no longer constitute a majority; (iii) a businesscombination in which any one of the following is true: our former shareholders do not hold at least 60% of the combined enterprise; there is a 20%-or-more shareholderof the combined enterprise (other than as a result of conversion of the shareholder's pre-combination interest in CH Energy Group); or the members of our Board ofDirectors (immediately before the combination) do not make up a majority of the board of the combined enterprise; or (iv) shareholder approval of a completeliquidation.
•Cause. The term "cause" generally means: (i) the willful and continued failure of the executive to perform his or her duties; (ii) the willful engaging by the executive inillegal conduct or gross misconduct; (iii) the repeated use of alcohol by the executive that materially interferes with his or her duties, use of illegal drugs by theexecutive, or a violation of our drug or alcohol policies; (iv) a conviction, guilty plea, or plea of nolo contendere of the executive for any crime involving moralturpitude or for any felony; (v) a breach by the executive of his or her fiduciary duties of loyalty or care or a material violation of the Code of Business Conduct andEthics, or similar policies; or (vi) the breach by the executive of the confidentiality provision of the applicable agreement.
•Good Reason. The term "good reason" generally means: (i) any material reduction in the executive's authority, duties, or responsibilities; (ii) any failure by CH EnergyGroup to maintain the executive's base salary, short-term incentive, and benefits levels; (iii) any required relocation of the executive's office of 50 miles or more;(iv) any purported termination of the executive's employment otherwise than as expressly permitted by the applicable agreement; or (v) any failure by CH EnergyGroup to require a successor to assume the applicable agreement.
-247-
Table of Contents
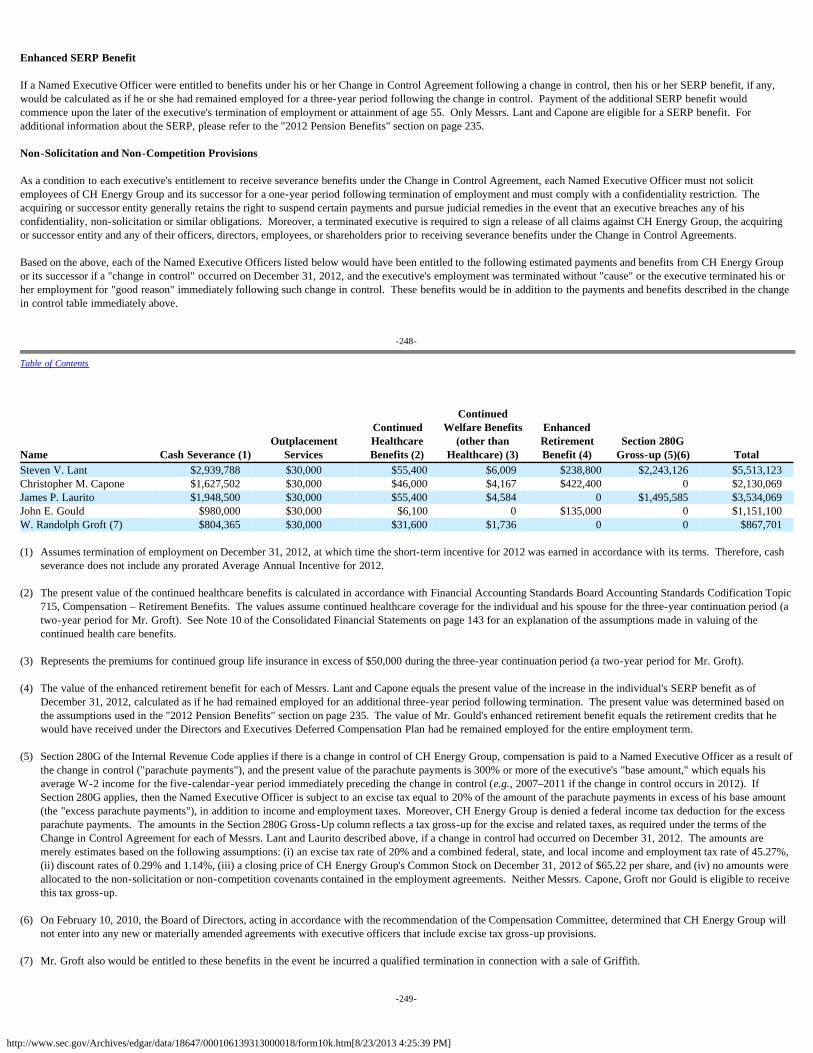
http://www.sec.gov/Archives/edgar/data/18647/000106139313000018/form10k.htm[8/23/2013 4:25:39 PM]
Enhanced SERP Benefit
If a Named Executive Officer were entitled to benefits under his or her Change in Control Agreement following a change in control, then his or her SERP benefit, if any,would be calculated as if he or she had remained employed for a three-year period following the change in control. Payment of the additional SERP benefit wouldcommence upon the later of the executive's termination of employment or attainment of age 55. Only Messrs. Lant and Capone are eligible for a SERP benefit. Foradditional information about the SERP, please refer to the "2012 Pension Benefits" section on page 235.
Non-Solicitation and Non-Competition Provisions
As a condition to each executive's entitlement to receive severance benefits under the Change in Control Agreement, each Named Executive Officer must not solicitemployees of CH Energy Group and its successor for a one-year period following termination of employment and must comply with a confidentiality restriction. Theacquiring or successor entity generally retains the right to suspend certain payments and pursue judicial remedies in the event that an executive breaches any of hisconfidentiality, non-solicitation or similar obligations. Moreover, a terminated executive is required to sign a release of all claims against CH Energy Group, the acquiringor successor entity and any of their officers, directors, employees, or shareholders prior to receiving severance benefits under the Change in Control Agreements.
Based on the above, each of the Named Executive Officers listed below would have been entitled to the following estimated payments and benefits from CH Energy Groupor its successor if a "change in control" occurred on December 31, 2012, and the executive's employment was terminated without "cause" or the executive terminated his orher employment for "good reason" immediately following such change in control. These benefits would be in addition to the payments and benefits described in the changein control table immediately above.
-248-
Table of Contents
Name Cash Severance (1)Outplacement
Services
ContinuedHealthcareBenefits (2)
ContinuedWelfare Benefits
(other thanHealthcare) (3)
EnhancedRetirementBenefit (4)
Section 280GGross-up (5)(6) Total
Steven V. Lant $2,939,788 $30,000 $55,400 $6,009 $238,800 $2,243,126 $5,513,123Christopher M. Capone $1,627,502 $30,000 $46,000 $4,167 $422,400 0 $2,130,069James P. Laurito $1,948,500 $30,000 $55,400 $4,584 0 $1,495,585 $3,534,069John E. Gould $980,000 $30,000 $6,100 0 $135,000 0 $1,151,100W. Randolph Groft (7) $804,365 $30,000 $31,600 $1,736 0 0 $867,701
(1) Assumes termination of employment on December 31, 2012, at which time the short-term incentive for 2012 was earned in accordance with its terms. Therefore, cashseverance does not include any prorated Average Annual Incentive for 2012.
(2) The present value of the continued healthcare benefits is calculated in accordance with Financial Accounting Standards Board Accounting Standards Codification Topic715, Compensation – Retirement Benefits. The values assume continued healthcare coverage for the individual and his spouse for the three-year continuation period (atwo-year period for Mr. Groft). See Note 10 of the Consolidated Financial Statements on page 143 for an explanation of the assumptions made in valuing of thecontinued health care benefits.
(3) Represents the premiums for continued group life insurance in excess of $50,000 during the three-year continuation period (a two-year period for Mr. Groft).
(4) The value of the enhanced retirement benefit for each of Messrs. Lant and Capone equals the present value of the increase in the individual's SERP benefit as ofDecember 31, 2012, calculated as if he had remained employed for an additional three-year period following termination. The present value was determined based onthe assumptions used in the "2012 Pension Benefits" section on page 235. The value of Mr. Gould's enhanced retirement benefit equals the retirement credits that hewould have received under the Directors and Executives Deferred Compensation Plan had he remained employed for the entire employment term.
(5) Section 280G of the Internal Revenue Code applies if there is a change in control of CH Energy Group, compensation is paid to a Named Executive Officer as a result ofthe change in control ("parachute payments"), and the present value of the parachute payments is 300% or more of the executive's "base amount," which equals hisaverage W-2 income for the five-calendar-year period immediately preceding the change in control (e.g., 2007–2011 if the change in control occurs in 2012). IfSection 280G applies, then the Named Executive Officer is subject to an excise tax equal to 20% of the amount of the parachute payments in excess of his base amount(the "excess parachute payments"), in addition to income and employment taxes. Moreover, CH Energy Group is denied a federal income tax deduction for the excessparachute payments. The amounts in the Section 280G Gross-Up column reflects a tax gross-up for the excise and related taxes, as required under the terms of theChange in Control Agreement for each of Messrs. Lant and Laurito described above, if a change in control had occurred on December 31, 2012. The amounts aremerely estimates based on the following assumptions: (i) an excise tax rate of 20% and a combined federal, state, and local income and employment tax rate of 45.27%,(ii) discount rates of 0.29% and 1.14%, (iii) a closing price of CH Energy Group's Common Stock on December 31, 2012 of $65.22 per share, and (iv) no amounts wereallocated to the non-solicitation or non-competition covenants contained in the employment agreements. Neither Messrs. Capone, Groft nor Gould is eligible to receivethis tax gross-up.
(6) On February 10, 2010, the Board of Directors, acting in accordance with the recommendation of the Compensation Committee, determined that CH Energy Group willnot enter into any new or materially amended agreements with executive officers that include excise tax gross-up provisions.
(7) Mr. Groft also would be entitled to these benefits in the event he incurred a qualified termination in connection with a sale of Griffith.
-249-
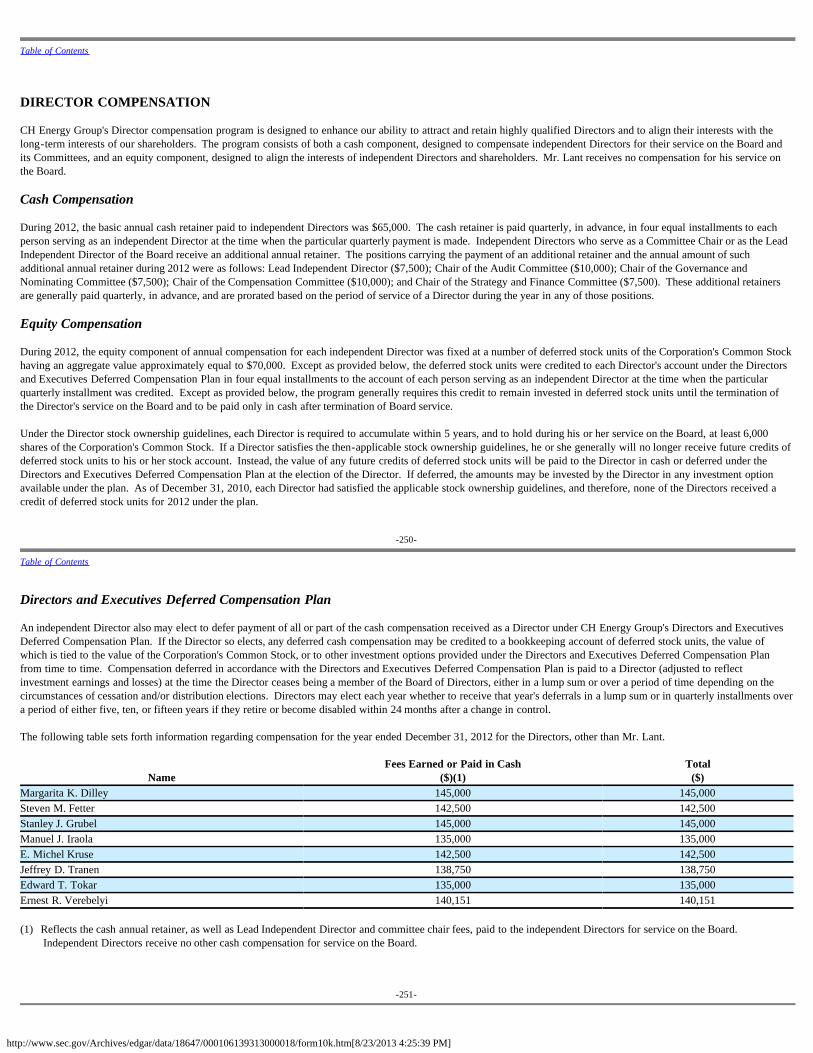
http://www.sec.gov/Archives/edgar/data/18647/000106139313000018/form10k.htm[8/23/2013 4:25:39 PM]
Table of Contents
DIRECTOR COMPENSATION
CH Energy Group's Director compensation program is designed to enhance our ability to attract and retain highly qualified Directors and to align their interests with thelong-term interests of our shareholders. The program consists of both a cash component, designed to compensate independent Directors for their service on the Board andits Committees, and an equity component, designed to align the interests of independent Directors and shareholders. Mr. Lant receives no compensation for his service onthe Board.
Cash Compensation
During 2012, the basic annual cash retainer paid to independent Directors was $65,000. The cash retainer is paid quarterly, in advance, in four equal installments to eachperson serving as an independent Director at the time when the particular quarterly payment is made. Independent Directors who serve as a Committee Chair or as the LeadIndependent Director of the Board receive an additional annual retainer. The positions carrying the payment of an additional retainer and the annual amount of suchadditional annual retainer during 2012 were as follows: Lead Independent Director ($7,500); Chair of the Audit Committee ($10,000); Chair of the Governance andNominating Committee ($7,500); Chair of the Compensation Committee ($10,000); and Chair of the Strategy and Finance Committee ($7,500). These additional retainersare generally paid quarterly, in advance, and are prorated based on the period of service of a Director during the year in any of those positions.
Equity Compensation
During 2012, the equity component of annual compensation for each independent Director was fixed at a number of deferred stock units of the Corporation's Common Stockhaving an aggregate value approximately equal to $70,000. Except as provided below, the deferred stock units were credited to each Director's account under the Directorsand Executives Deferred Compensation Plan in four equal installments to the account of each person serving as an independent Director at the time when the particularquarterly installment was credited. Except as provided below, the program generally requires this credit to remain invested in deferred stock units until the termination ofthe Director's service on the Board and to be paid only in cash after termination of Board service.
Under the Director stock ownership guidelines, each Director is required to accumulate within 5 years, and to hold during his or her service on the Board, at least 6,000shares of the Corporation's Common Stock. If a Director satisfies the then-applicable stock ownership guidelines, he or she generally will no longer receive future credits ofdeferred stock units to his or her stock account. Instead, the value of any future credits of deferred stock units will be paid to the Director in cash or deferred under theDirectors and Executives Deferred Compensation Plan at the election of the Director. If deferred, the amounts may be invested by the Director in any investment optionavailable under the plan. As of December 31, 2010, each Director had satisfied the applicable stock ownership guidelines, and therefore, none of the Directors received acredit of deferred stock units for 2012 under the plan.
-250-
Table of Contents
Directors and Executives Deferred Compensation Plan
An independent Director also may elect to defer payment of all or part of the cash compensation received as a Director under CH Energy Group's Directors and ExecutivesDeferred Compensation Plan. If the Director so elects, any deferred cash compensation may be credited to a bookkeeping account of deferred stock units, the value ofwhich is tied to the value of the Corporation's Common Stock, or to other investment options provided under the Directors and Executives Deferred Compensation Planfrom time to time. Compensation deferred in accordance with the Directors and Executives Deferred Compensation Plan is paid to a Director (adjusted to reflectinvestment earnings and losses) at the time the Director ceases being a member of the Board of Directors, either in a lump sum or over a period of time depending on thecircumstances of cessation and/or distribution elections. Directors may elect each year whether to receive that year's deferrals in a lump sum or in quarterly installments overa period of either five, ten, or fifteen years if they retire or become disabled within 24 months after a change in control.
The following table sets forth information regarding compensation for the year ended December 31, 2012 for the Directors, other than Mr. Lant.
NameFees Earned or Paid in Cash
($)(1)Total
($)Margarita K. Dilley 145,000 145,000Steven M. Fetter 142,500 142,500Stanley J. Grubel 145,000 145,000Manuel J. Iraola 135,000 135,000E. Michel Kruse 142,500 142,500Jeffrey D. Tranen 138,750 138,750Edward T. Tokar 135,000 135,000Ernest R. Verebelyi 140,151 140,151
(1) Reflects the cash annual retainer, as well as Lead Independent Director and committee chair fees, paid to the independent Directors for service on the Board. Independent Directors receive no other cash compensation for service on the Board.
-251-
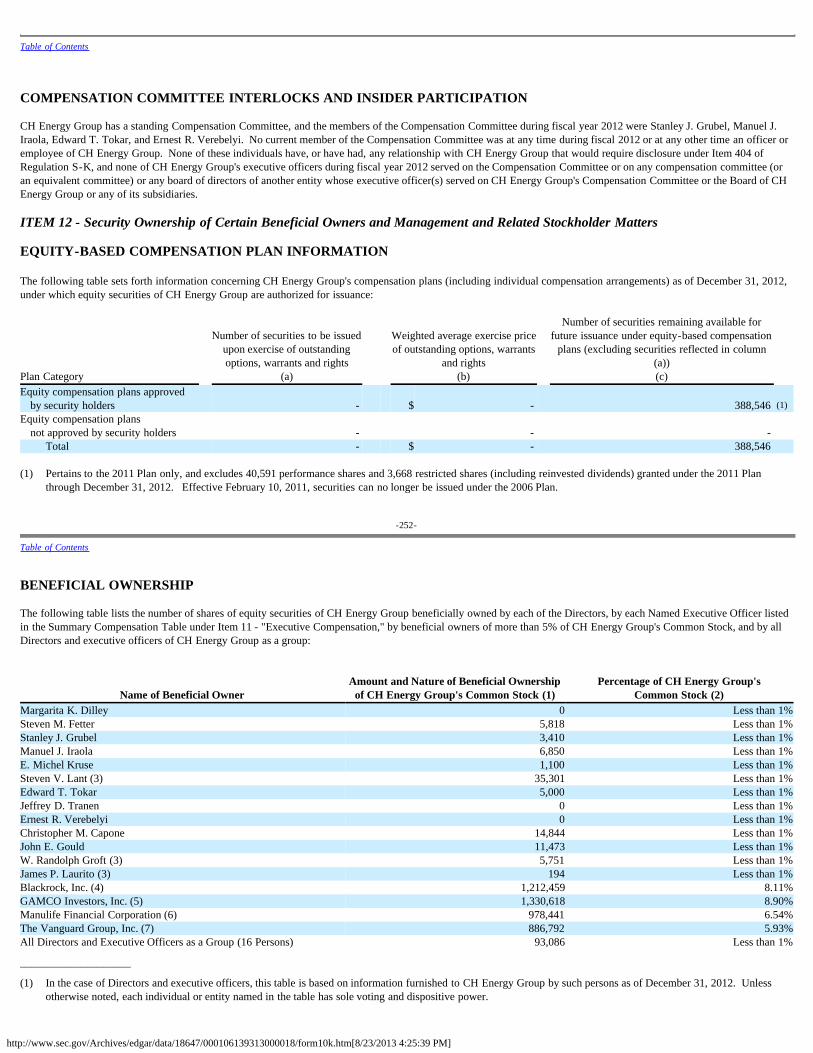
http://www.sec.gov/Archives/edgar/data/18647/000106139313000018/form10k.htm[8/23/2013 4:25:39 PM]
Table of Contents
COMPENSATION COMMITTEE INTERLOCKS AND INSIDER PARTICIPATION
CH Energy Group has a standing Compensation Committee, and the members of the Compensation Committee during fiscal year 2012 were Stanley J. Grubel, Manuel J.Iraola, Edward T. Tokar, and Ernest R. Verebelyi. No current member of the Compensation Committee was at any time during fiscal 2012 or at any other time an officer oremployee of CH Energy Group. None of these individuals have, or have had, any relationship with CH Energy Group that would require disclosure under Item 404 ofRegulation S-K, and none of CH Energy Group's executive officers during fiscal year 2012 served on the Compensation Committee or on any compensation committee (oran equivalent committee) or any board of directors of another entity whose executive officer(s) served on CH Energy Group's Compensation Committee or the Board of CHEnergy Group or any of its subsidiaries. ITEM 12 - Security Ownership of Certain Beneficial Owners and Management and Related Stockholder Matters EQUITY-BASED COMPENSATION PLAN INFORMATION The following table sets forth information concerning CH Energy Group's compensation plans (including individual compensation arrangements) as of December 31, 2012,under which equity securities of CH Energy Group are authorized for issuance:
Plan Category
Number of securities to be issuedupon exercise of outstandingoptions, warrants and rights
(a)
Weighted average exercise priceof outstanding options, warrants
and rights(b)
Number of securities remaining available forfuture issuance under equity-based compensation
plans (excluding securities reflected in column(a))(c)
Equity compensation plans approvedby security holders - $ - 388,546 (1)
Equity compensation plansnot approved by security holders 1 - 1 - -
Total - $ - 388,546 (1) Pertains to the 2011 Plan only, and excludes 40,591 performance shares and 3,668 restricted shares (including reinvested dividends) granted under the 2011 Plan
through December 31, 2012. Effective February 10, 2011, securities can no longer be issued under the 2006 Plan.
-252-
Table of Contents
BENEFICIAL OWNERSHIP
The following table lists the number of shares of equity securities of CH Energy Group beneficially owned by each of the Directors, by each Named Executive Officer listedin the Summary Compensation Table under Item 11 - "Executive Compensation," by beneficial owners of more than 5% of CH Energy Group's Common Stock, and by allDirectors and executive officers of CH Energy Group as a group:
Name of Beneficial Owner
Amount and Nature of Beneficial Ownershipof CH Energy Group's Common Stock (1)
Percentage of CH Energy Group'sCommon Stock (2)
Margarita K. Dilley 0 Less than 1%Steven M. Fetter 5,818 Less than 1%Stanley J. Grubel 3,410 Less than 1%Manuel J. Iraola 6,850 Less than 1%E. Michel Kruse 1,100 Less than 1%Steven V. Lant (3) 35,301 Less than 1%Edward T. Tokar 5,000 Less than 1%Jeffrey D. Tranen 0 Less than 1%Ernest R. Verebelyi 0 Less than 1%Christopher M. Capone 14,844 Less than 1%John E. Gould 11,473 Less than 1%W. Randolph Groft (3) 5,751 Less than 1%James P. Laurito (3) 194 Less than 1%Blackrock, Inc. (4) 1,212,459 8.11%GAMCO Investors, Inc. (5) 1,330,618 8.90%Manulife Financial Corporation (6) 978,441 6.54%The Vanguard Group, Inc. (7) 886,792 5.93%All Directors and Executive Officers as a Group (16 Persons) 93,086 Less than 1%
____________________
(1) In the case of Directors and executive officers, this table is based on information furnished to CH Energy Group by such persons as of December 31, 2012. Unlessotherwise noted, each individual or entity named in the table has sole voting and dispositive power.
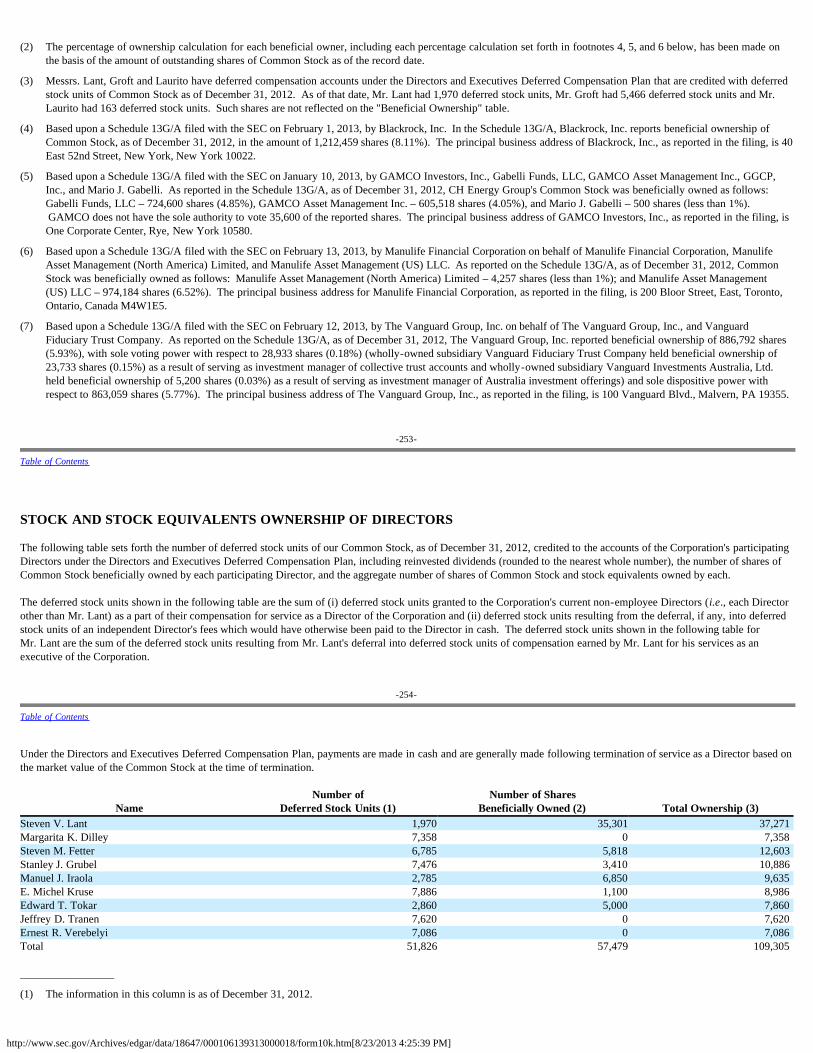
http://www.sec.gov/Archives/edgar/data/18647/000106139313000018/form10k.htm[8/23/2013 4:25:39 PM]
(2) The percentage of ownership calculation for each beneficial owner, including each percentage calculation set forth in footnotes 4, 5, and 6 below, has been made onthe basis of the amount of outstanding shares of Common Stock as of the record date.
(3) Messrs. Lant, Groft and Laurito have deferred compensation accounts under the Directors and Executives Deferred Compensation Plan that are credited with deferredstock units of Common Stock as of December 31, 2012. As of that date, Mr. Lant had 1,970 deferred stock units, Mr. Groft had 5,466 deferred stock units and Mr.Laurito had 163 deferred stock units. Such shares are not reflected on the "Beneficial Ownership" table.
(4) Based upon a Schedule 13G/A filed with the SEC on February 1, 2013, by Blackrock, Inc. In the Schedule 13G/A, Blackrock, Inc. reports beneficial ownership ofCommon Stock, as of December 31, 2012, in the amount of 1,212,459 shares (8.11%). The principal business address of Blackrock, Inc., as reported in the filing, is 40East 52nd Street, New York, New York 10022.
(5) Based upon a Schedule 13G/A filed with the SEC on January 10, 2013, by GAMCO Investors, Inc., Gabelli Funds, LLC, GAMCO Asset Management Inc., GGCP,Inc., and Mario J. Gabelli. As reported in the Schedule 13G/A, as of December 31, 2012, CH Energy Group's Common Stock was beneficially owned as follows:Gabelli Funds, LLC – 724,600 shares (4.85%), GAMCO Asset Management Inc. – 605,518 shares (4.05%), and Mario J. Gabelli – 500 shares (less than 1%). GAMCO does not have the sole authority to vote 35,600 of the reported shares. The principal business address of GAMCO Investors, Inc., as reported in the filing, isOne Corporate Center, Rye, New York 10580.
(6) Based upon a Schedule 13G/A filed with the SEC on February 13, 2013, by Manulife Financial Corporation on behalf of Manulife Financial Corporation, ManulifeAsset Management (North America) Limited, and Manulife Asset Management (US) LLC. As reported on the Schedule 13G/A, as of December 31, 2012, CommonStock was beneficially owned as follows: Manulife Asset Management (North America) Limited – 4,257 shares (less than 1%); and Manulife Asset Management(US) LLC – 974,184 shares (6.52%). The principal business address for Manulife Financial Corporation, as reported in the filing, is 200 Bloor Street, East, Toronto,Ontario, Canada M4W1E5.
(7) Based upon a Schedule 13G/A filed with the SEC on February 12, 2013, by The Vanguard Group, Inc. on behalf of The Vanguard Group, Inc., and VanguardFiduciary Trust Company. As reported on the Schedule 13G/A, as of December 31, 2012, The Vanguard Group, Inc. reported beneficial ownership of 886,792 shares(5.93%), with sole voting power with respect to 28,933 shares (0.18%) (wholly-owned subsidiary Vanguard Fiduciary Trust Company held beneficial ownership of23,733 shares (0.15%) as a result of serving as investment manager of collective trust accounts and wholly-owned subsidiary Vanguard Investments Australia, Ltd.held beneficial ownership of 5,200 shares (0.03%) as a result of serving as investment manager of Australia investment offerings) and sole dispositive power withrespect to 863,059 shares (5.77%). The principal business address of The Vanguard Group, Inc., as reported in the filing, is 100 Vanguard Blvd., Malvern, PA 19355.
-253-
Table of Contents
STOCK AND STOCK EQUIVALENTS OWNERSHIP OF DIRECTORS
The following table sets forth the number of deferred stock units of our Common Stock, as of December 31, 2012, credited to the accounts of the Corporation's participatingDirectors under the Directors and Executives Deferred Compensation Plan, including reinvested dividends (rounded to the nearest whole number), the number of shares ofCommon Stock beneficially owned by each participating Director, and the aggregate number of shares of Common Stock and stock equivalents owned by each.
The deferred stock units shown in the following table are the sum of (i) deferred stock units granted to the Corporation's current non-employee Directors (i.e., each Directorother than Mr. Lant) as a part of their compensation for service as a Director of the Corporation and (ii) deferred stock units resulting from the deferral, if any, into deferredstock units of an independent Director's fees which would have otherwise been paid to the Director in cash. The deferred stock units shown in the following table forMr. Lant are the sum of the deferred stock units resulting from Mr. Lant's deferral into deferred stock units of compensation earned by Mr. Lant for his services as anexecutive of the Corporation.
-254-
Table of Contents
Under the Directors and Executives Deferred Compensation Plan, payments are made in cash and are generally made following termination of service as a Director based onthe market value of the Common Stock at the time of termination.
NameNumber of
Deferred Stock Units (1)Number of Shares
Beneficially Owned (2)
Total Ownership (3)Steven V. Lant 1,970 35,301 37,271Margarita K. Dilley 7,358 0 7,358Steven M. Fetter 6,785 5,818 12,603Stanley J. Grubel 7,476 3,410 10,886Manuel J. Iraola 2,785 6,850 9,635E. Michel Kruse 7,886 1,100 8,986Edward T. Tokar 2,860 5,000 7,860Jeffrey D. Tranen 7,620 0 7,620Ernest R. Verebelyi 7,086 0 7,086Total 51,826 57,479 109,305 _________________
(1) The information in this column is as of December 31, 2012.
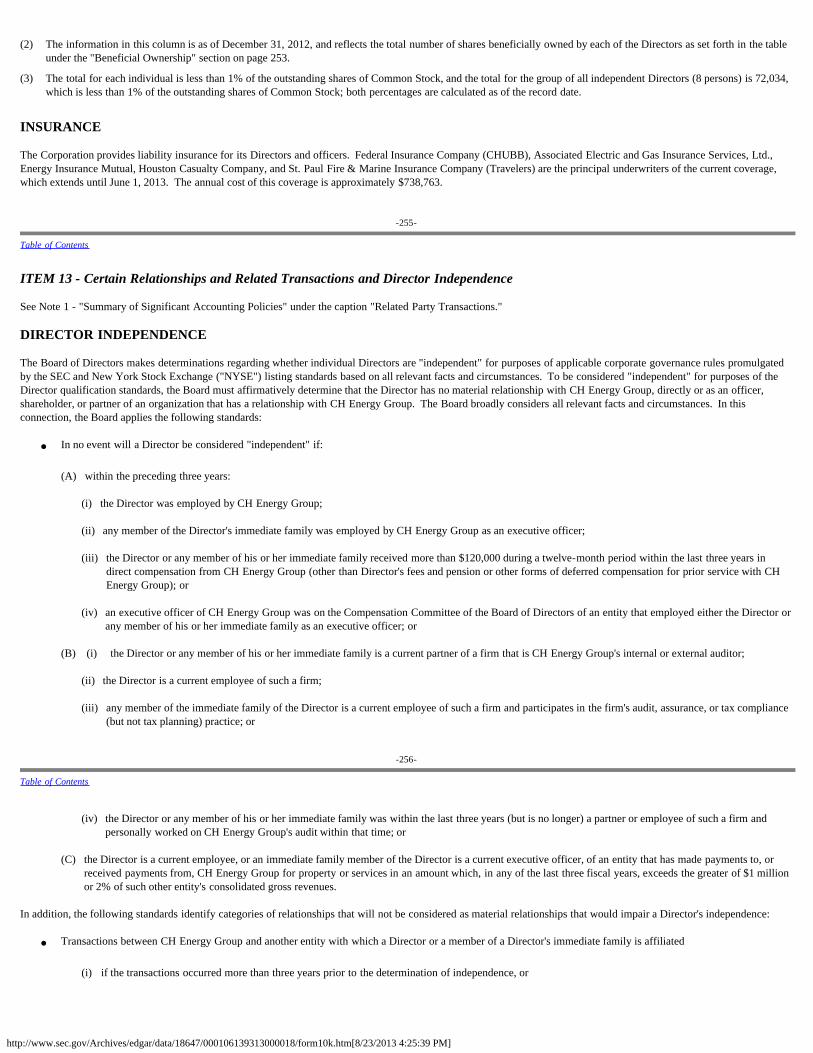
http://www.sec.gov/Archives/edgar/data/18647/000106139313000018/form10k.htm[8/23/2013 4:25:39 PM]
(2) The information in this column is as of December 31, 2012, and reflects the total number of shares beneficially owned by each of the Directors as set forth in the tableunder the "Beneficial Ownership" section on page 253.
(3) The total for each individual is less than 1% of the outstanding shares of Common Stock, and the total for the group of all independent Directors (8 persons) is 72,034,which is less than 1% of the outstanding shares of Common Stock; both percentages are calculated as of the record date.
INSURANCE
The Corporation provides liability insurance for its Directors and officers. Federal Insurance Company (CHUBB), Associated Electric and Gas Insurance Services, Ltd.,Energy Insurance Mutual, Houston Casualty Company, and St. Paul Fire & Marine Insurance Company (Travelers) are the principal underwriters of the current coverage,which extends until June 1, 2013. The annual cost of this coverage is approximately $738,763.
-255-
Table of Contents
ITEM 13 - Certain Relationships and Related Transactions and Director Independence See Note 1 - "Summary of Significant Accounting Policies" under the caption "Related Party Transactions." DIRECTOR INDEPENDENCE
The Board of Directors makes determinations regarding whether individual Directors are "independent" for purposes of applicable corporate governance rules promulgatedby the SEC and New York Stock Exchange ("NYSE") listing standards based on all relevant facts and circumstances. To be considered "independent" for purposes of theDirector qualification standards, the Board must affirmatively determine that the Director has no material relationship with CH Energy Group, directly or as an officer,shareholder, or partner of an organization that has a relationship with CH Energy Group. The Board broadly considers all relevant facts and circumstances. In thisconnection, the Board applies the following standards:
· In no event will a Director be considered "independent" if:
(A) within the preceding three years:
(i) the Director was employed by CH Energy Group;
(ii) any member of the Director's immediate family was employed by CH Energy Group as an executive officer;
(iii) the Director or any member of his or her immediate family received more than $120,000 during a twelve-month period within the last three years indirect compensation from CH Energy Group (other than Director's fees and pension or other forms of deferred compensation for prior service with CHEnergy Group); or
(iv) an executive officer of CH Energy Group was on the Compensation Committee of the Board of Directors of an entity that employed either the Director or
any member of his or her immediate family as an executive officer; or
(B) (i) the Director or any member of his or her immediate family is a current partner of a firm that is CH Energy Group's internal or external auditor;
(ii) the Director is a current employee of such a firm;
(iii) any member of the immediate family of the Director is a current employee of such a firm and participates in the firm's audit, assurance, or tax compliance(but not tax planning) practice; or
-256-
Table of Contents
(iv) the Director or any member of his or her immediate family was within the last three years (but is no longer) a partner or employee of such a firm and
personally worked on CH Energy Group's audit within that time; or
(C) the Director is a current employee, or an immediate family member of the Director is a current executive officer, of an entity that has made payments to, orreceived payments from, CH Energy Group for property or services in an amount which, in any of the last three fiscal years, exceeds the greater of $1 millionor 2% of such other entity's consolidated gross revenues.
In addition, the following standards identify categories of relationships that will not be considered as material relationships that would impair a Director's independence:
· Transactions between CH Energy Group and another entity with which a Director or a member of a Director's immediate family is affiliated
(i) if the transactions occurred more than three years prior to the determination of independence, or
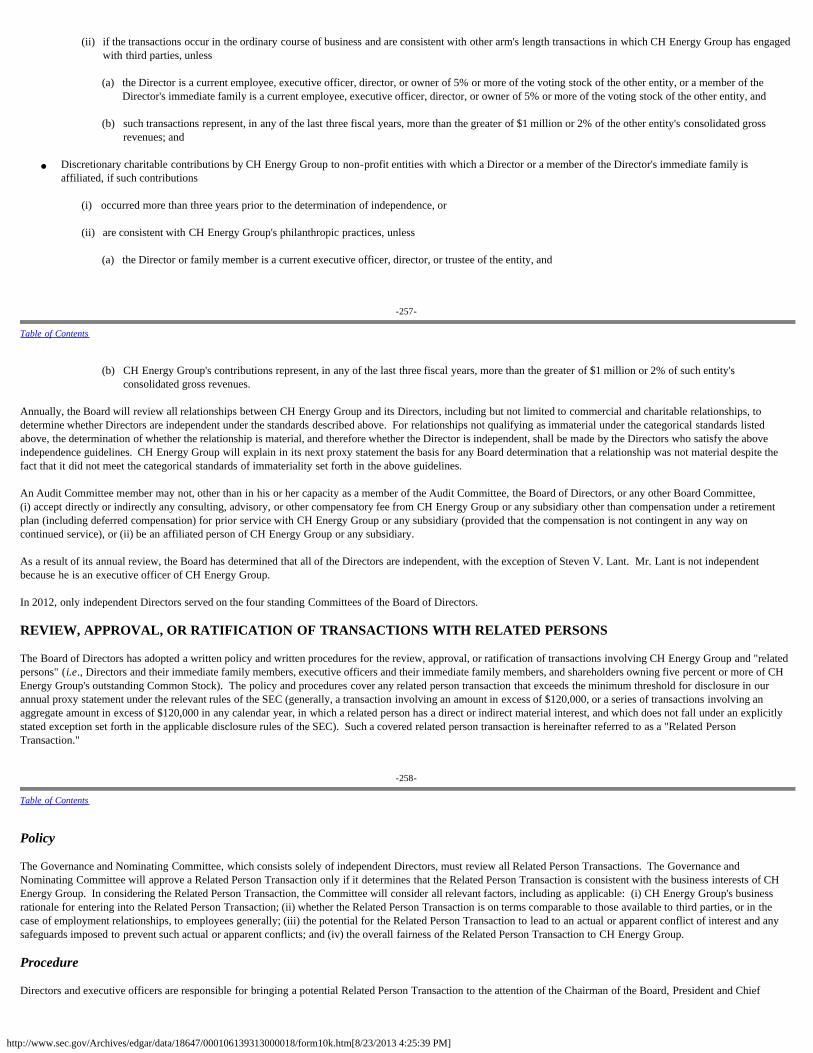
http://www.sec.gov/Archives/edgar/data/18647/000106139313000018/form10k.htm[8/23/2013 4:25:39 PM]
(ii) if the transactions occur in the ordinary course of business and are consistent with other arm's length transactions in which CH Energy Group has engagedwith third parties, unless
(a) the Director is a current employee, executive officer, director, or owner of 5% or more of the voting stock of the other entity, or a member of the
Director's immediate family is a current employee, executive officer, director, or owner of 5% or more of the voting stock of the other entity, and
(b) such transactions represent, in any of the last three fiscal years, more than the greater of $1 million or 2% of the other entity's consolidated grossrevenues; and
· Discretionary charitable contributions by CH Energy Group to non-profit entities with which a Director or a member of the Director's immediate family is
affiliated, if such contributions
(i) occurred more than three years prior to the determination of independence, or
(ii) are consistent with CH Energy Group's philanthropic practices, unless
(a) the Director or family member is a current executive officer, director, or trustee of the entity, and
-257-
Table of Contents
(b) CH Energy Group's contributions represent, in any of the last three fiscal years, more than the greater of $1 million or 2% of such entity's
consolidated gross revenues. Annually, the Board will review all relationships between CH Energy Group and its Directors, including but not limited to commercial and charitable relationships, todetermine whether Directors are independent under the standards described above. For relationships not qualifying as immaterial under the categorical standards listedabove, the determination of whether the relationship is material, and therefore whether the Director is independent, shall be made by the Directors who satisfy the aboveindependence guidelines. CH Energy Group will explain in its next proxy statement the basis for any Board determination that a relationship was not material despite thefact that it did not meet the categorical standards of immateriality set forth in the above guidelines. An Audit Committee member may not, other than in his or her capacity as a member of the Audit Committee, the Board of Directors, or any other Board Committee,(i) accept directly or indirectly any consulting, advisory, or other compensatory fee from CH Energy Group or any subsidiary other than compensation under a retirementplan (including deferred compensation) for prior service with CH Energy Group or any subsidiary (provided that the compensation is not contingent in any way oncontinued service), or (ii) be an affiliated person of CH Energy Group or any subsidiary.
As a result of its annual review, the Board has determined that all of the Directors are independent, with the exception of Steven V. Lant. Mr. Lant is not independentbecause he is an executive officer of CH Energy Group.
In 2012, only independent Directors served on the four standing Committees of the Board of Directors.
REVIEW, APPROVAL, OR RATIFICATION OF TRANSACTIONS WITH RELATED PERSONS
The Board of Directors has adopted a written policy and written procedures for the review, approval, or ratification of transactions involving CH Energy Group and "relatedpersons" (i.e., Directors and their immediate family members, executive officers and their immediate family members, and shareholders owning five percent or more of CHEnergy Group's outstanding Common Stock). The policy and procedures cover any related person transaction that exceeds the minimum threshold for disclosure in ourannual proxy statement under the relevant rules of the SEC (generally, a transaction involving an amount in excess of $120,000, or a series of transactions involving anaggregate amount in excess of $120,000 in any calendar year, in which a related person has a direct or indirect material interest, and which does not fall under an explicitlystated exception set forth in the applicable disclosure rules of the SEC). Such a covered related person transaction is hereinafter referred to as a "Related PersonTransaction."
-258-
Table of Contents
Policy
The Governance and Nominating Committee, which consists solely of independent Directors, must review all Related Person Transactions. The Governance andNominating Committee will approve a Related Person Transaction only if it determines that the Related Person Transaction is consistent with the business interests of CHEnergy Group. In considering the Related Person Transaction, the Committee will consider all relevant factors, including as applicable: (i) CH Energy Group's businessrationale for entering into the Related Person Transaction; (ii) whether the Related Person Transaction is on terms comparable to those available to third parties, or in thecase of employment relationships, to employees generally; (iii) the potential for the Related Person Transaction to lead to an actual or apparent conflict of interest and anysafeguards imposed to prevent such actual or apparent conflicts; and (iv) the overall fairness of the Related Person Transaction to CH Energy Group.
Procedure
Directors and executive officers are responsible for bringing a potential Related Person Transaction to the attention of the Chairman of the Board, President and Chief
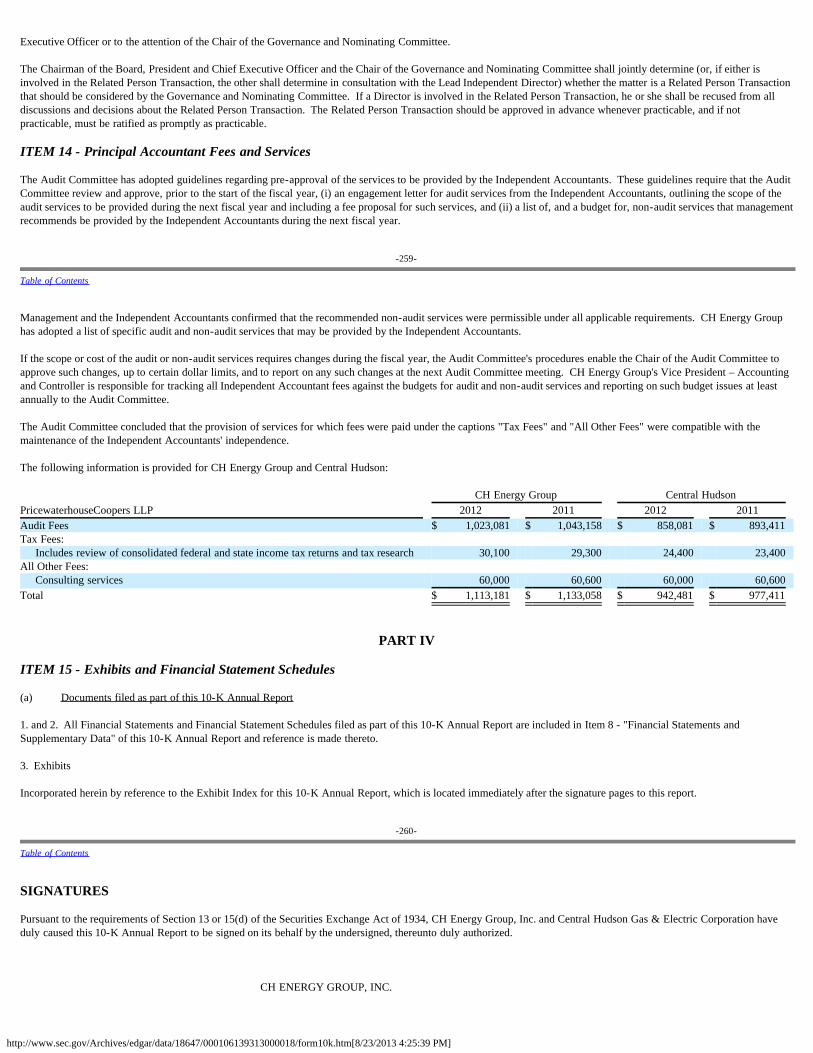
http://www.sec.gov/Archives/edgar/data/18647/000106139313000018/form10k.htm[8/23/2013 4:25:39 PM]
Executive Officer or to the attention of the Chair of the Governance and Nominating Committee.
The Chairman of the Board, President and Chief Executive Officer and the Chair of the Governance and Nominating Committee shall jointly determine (or, if either isinvolved in the Related Person Transaction, the other shall determine in consultation with the Lead Independent Director) whether the matter is a Related Person Transactionthat should be considered by the Governance and Nominating Committee. If a Director is involved in the Related Person Transaction, he or she shall be recused from alldiscussions and decisions about the Related Person Transaction. The Related Person Transaction should be approved in advance whenever practicable, and if notpracticable, must be ratified as promptly as practicable. ITEM 14 - Principal Accountant Fees and Services
The Audit Committee has adopted guidelines regarding pre-approval of the services to be provided by the Independent Accountants. These guidelines require that the AuditCommittee review and approve, prior to the start of the fiscal year, (i) an engagement letter for audit services from the Independent Accountants, outlining the scope of theaudit services to be provided during the next fiscal year and including a fee proposal for such services, and (ii) a list of, and a budget for, non-audit services that managementrecommends be provided by the Independent Accountants during the next fiscal year.
-259-
Table of Contents
Management and the Independent Accountants confirmed that the recommended non-audit services were permissible under all applicable requirements. CH Energy Grouphas adopted a list of specific audit and non-audit services that may be provided by the Independent Accountants.
If the scope or cost of the audit or non-audit services requires changes during the fiscal year, the Audit Committee's procedures enable the Chair of the Audit Committee toapprove such changes, up to certain dollar limits, and to report on any such changes at the next Audit Committee meeting. CH Energy Group's Vice President – Accountingand Controller is responsible for tracking all Independent Accountant fees against the budgets for audit and non-audit services and reporting on such budget issues at leastannually to the Audit Committee.
The Audit Committee concluded that the provision of services for which fees were paid under the captions "Tax Fees" and "All Other Fees" were compatible with themaintenance of the Independent Accountants' independence. The following information is provided for CH Energy Group and Central Hudson: CH Energy Group Central Hudson PricewaterhouseCoopers LLP 2012 2011 2012 2011 Audit Fees $ 1,023,081 $ 1,043,158 $ 858,081 $ 893,411 Tax Fees:
Includes review of consolidated federal and state income tax returns and tax research 30,100 29,300 24,400 23,400 All Other Fees:
Consulting services 60,000 60,600 60,000 60,600 Total $ 1,113,181 $ 1,133,058 $ 942,481 $ 977,411
PART IV
ITEM 15 - Exhibits and Financial Statement Schedules
(a) Documents filed as part of this 10-K Annual Report
1. and 2. All Financial Statements and Financial Statement Schedules filed as part of this 10-K Annual Report are included in Item 8 - "Financial Statements andSupplementary Data" of this 10-K Annual Report and reference is made thereto.
3. Exhibits
Incorporated herein by reference to the Exhibit Index for this 10-K Annual Report, which is located immediately after the signature pages to this report.
-260-
Table of Contents
SIGNATURES
Pursuant to the requirements of Section 13 or 15(d) of the Securities Exchange Act of 1934, CH Energy Group, Inc. and Central Hudson Gas & Electric Corporation haveduly caused this 10-K Annual Report to be signed on its behalf by the undersigned, thereunto duly authorized.
CH ENERGY GROUP, INC.
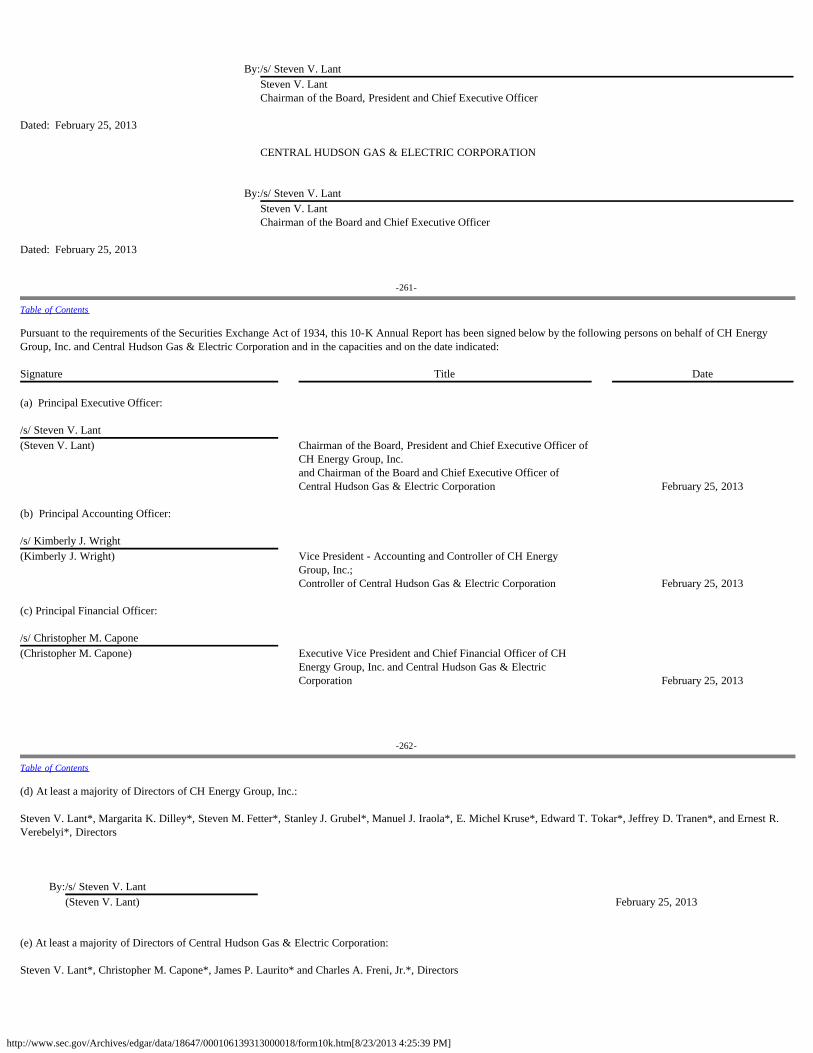
http://www.sec.gov/Archives/edgar/data/18647/000106139313000018/form10k.htm[8/23/2013 4:25:39 PM]
By:/s/ Steven V. Lant Steven V. Lant
Chairman of the Board, President and Chief Executive Officer
Dated: February 25, 2013
CENTRAL HUDSON GAS & ELECTRIC CORPORATION By:/s/ Steven V. Lant Steven V. Lant
Chairman of the Board and Chief Executive Officer
Dated: February 25, 2013
-261-
Table of Contents
Pursuant to the requirements of the Securities Exchange Act of 1934, this 10-K Annual Report has been signed below by the following persons on behalf of CH EnergyGroup, Inc. and Central Hudson Gas & Electric Corporation and in the capacities and on the date indicated: Signature Title Date (a) Principal Executive Officer: /s/ Steven V. Lant (Steven V. Lant) Chairman of the Board, President and Chief Executive Officer of
CH Energy Group, Inc.and Chairman of the Board and Chief Executive Officer ofCentral Hudson Gas & Electric Corporation
February 25, 2013 (b) Principal Accounting Officer: /s/ Kimberly J. Wright (Kimberly J. Wright) Vice President - Accounting and Controller of CH Energy
Group, Inc.;Controller of Central Hudson Gas & Electric Corporation
February 25, 2013 (c) Principal Financial Officer: /s/ Christopher M. Capone (Christopher M. Capone) Executive Vice President and Chief Financial Officer of CH
Energy Group, Inc. and Central Hudson Gas & ElectricCorporation
February 25, 2013
-262-
Table of Contents
(d) At least a majority of Directors of CH Energy Group, Inc.:
Steven V. Lant*, Margarita K. Dilley*, Steven M. Fetter*, Stanley J. Grubel*, Manuel J. Iraola*, E. Michel Kruse*, Edward T. Tokar*, Jeffrey D. Tranen*, and Ernest R.Verebelyi*, Directors
By:/s/ Steven V. Lant (Steven V. Lant) February 25, 2013
(e) At least a majority of Directors of Central Hudson Gas & Electric Corporation:
Steven V. Lant*, Christopher M. Capone*, James P. Laurito* and Charles A. Freni, Jr.*, Directors
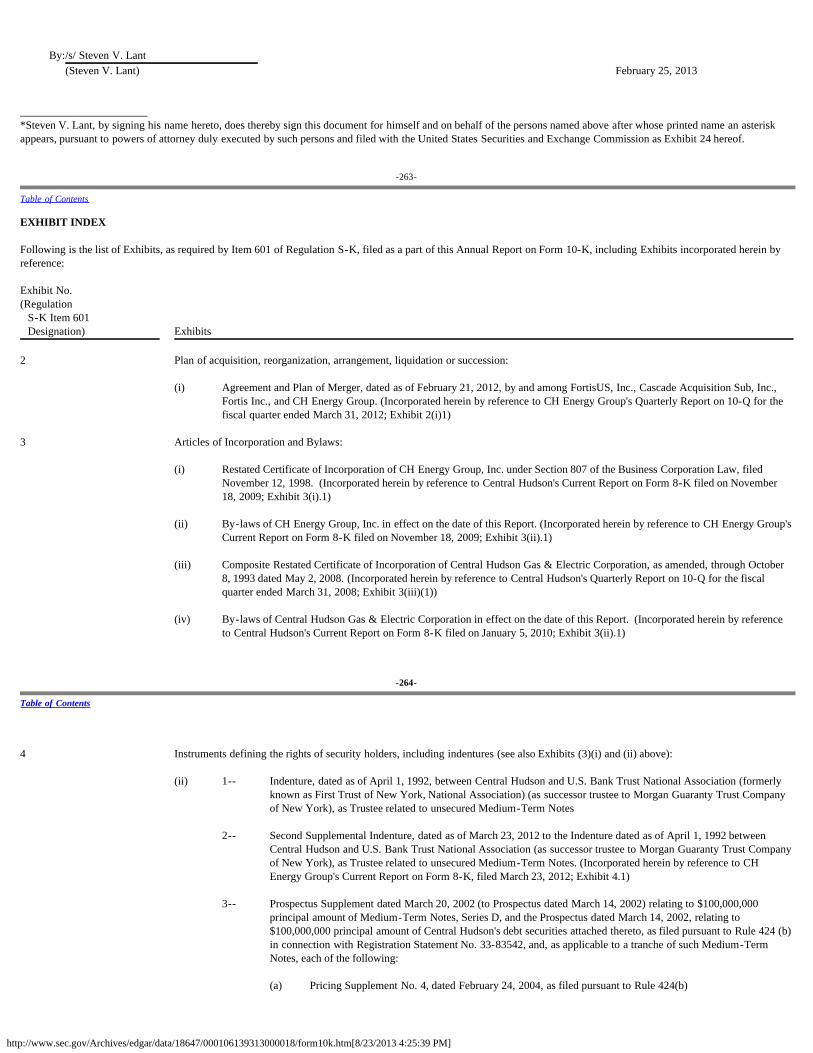
http://www.sec.gov/Archives/edgar/data/18647/000106139313000018/form10k.htm[8/23/2013 4:25:39 PM]
By:/s/ Steven V. Lant (Steven V. Lant) February 25, 2013
_______________________*Steven V. Lant, by signing his name hereto, does thereby sign this document for himself and on behalf of the persons named above after whose printed name an asteriskappears, pursuant to powers of attorney duly executed by such persons and filed with the United States Securities and Exchange Commission as Exhibit 24 hereof.
-263-
Table of Contents
EXHIBIT INDEX Following is the list of Exhibits, as required by Item 601 of Regulation S-K, filed as a part of this Annual Report on Form 10-K, including Exhibits incorporated herein byreference: Exhibit No. (Regulation S-K Item 601 Designation) Exhibits 2 Plan of acquisition, reorganization, arrangement, liquidation or succession:
(i) Agreement and Plan of Merger, dated as of February 21, 2012, by and among FortisUS, Inc., Cascade Acquisition Sub, Inc.,Fortis Inc., and CH Energy Group. (Incorporated herein by reference to CH Energy Group's Quarterly Report on 10-Q for thefiscal quarter ended March 31, 2012; Exhibit 2(i)1)
3 Articles of Incorporation and Bylaws: (i) Restated Certificate of Incorporation of CH Energy Group, Inc. under Section 807 of the Business Corporation Law, filed
November 12, 1998. (Incorporated herein by reference to Central Hudson's Current Report on Form 8-K filed on November18, 2009; Exhibit 3(i).1)
(ii) By-laws of CH Energy Group, Inc. in effect on the date of this Report. (Incorporated herein by reference to CH Energy Group's
Current Report on Form 8-K filed on November 18, 2009; Exhibit 3(ii).1) (iii) Composite Restated Certificate of Incorporation of Central Hudson Gas & Electric Corporation, as amended, through October
8, 1993 dated May 2, 2008. (Incorporated herein by reference to Central Hudson's Quarterly Report on 10-Q for the fiscalquarter ended March 31, 2008; Exhibit 3(iii)(1))
(iv) By-laws of Central Hudson Gas & Electric Corporation in effect on the date of this Report. (Incorporated herein by reference
to Central Hudson's Current Report on Form 8-K filed on January 5, 2010; Exhibit 3(ii).1)
-264-
Table of Contents
4 Instruments defining the rights of security holders, including indentures (see also Exhibits (3)(i) and (ii) above): (ii) 1-- Indenture, dated as of April 1, 1992, between Central Hudson and U.S. Bank Trust National Association (formerly
known as First Trust of New York, National Association) (as successor trustee to Morgan Guaranty Trust Companyof New York), as Trustee related to unsecured Medium-Term Notes
2-- Second Supplemental Indenture, dated as of March 23, 2012 to the Indenture dated as of April 1, 1992 between
Central Hudson and U.S. Bank Trust National Association (as successor trustee to Morgan Guaranty Trust Companyof New York), as Trustee related to unsecured Medium-Term Notes. (Incorporated herein by reference to CHEnergy Group's Current Report on Form 8-K, filed March 23, 2012; Exhibit 4.1)
3-- Prospectus Supplement dated March 20, 2002 (to Prospectus dated March 14, 2002) relating to $100,000,000
principal amount of Medium-Term Notes, Series D, and the Prospectus dated March 14, 2002, relating to$100,000,000 principal amount of Central Hudson's debt securities attached thereto, as filed pursuant to Rule 424 (b)in connection with Registration Statement No. 33-83542, and, as applicable to a tranche of such Medium-TermNotes, each of the following:
(a) Pricing Supplement No. 4, dated February 24, 2004, as filed pursuant to Rule 424(b)
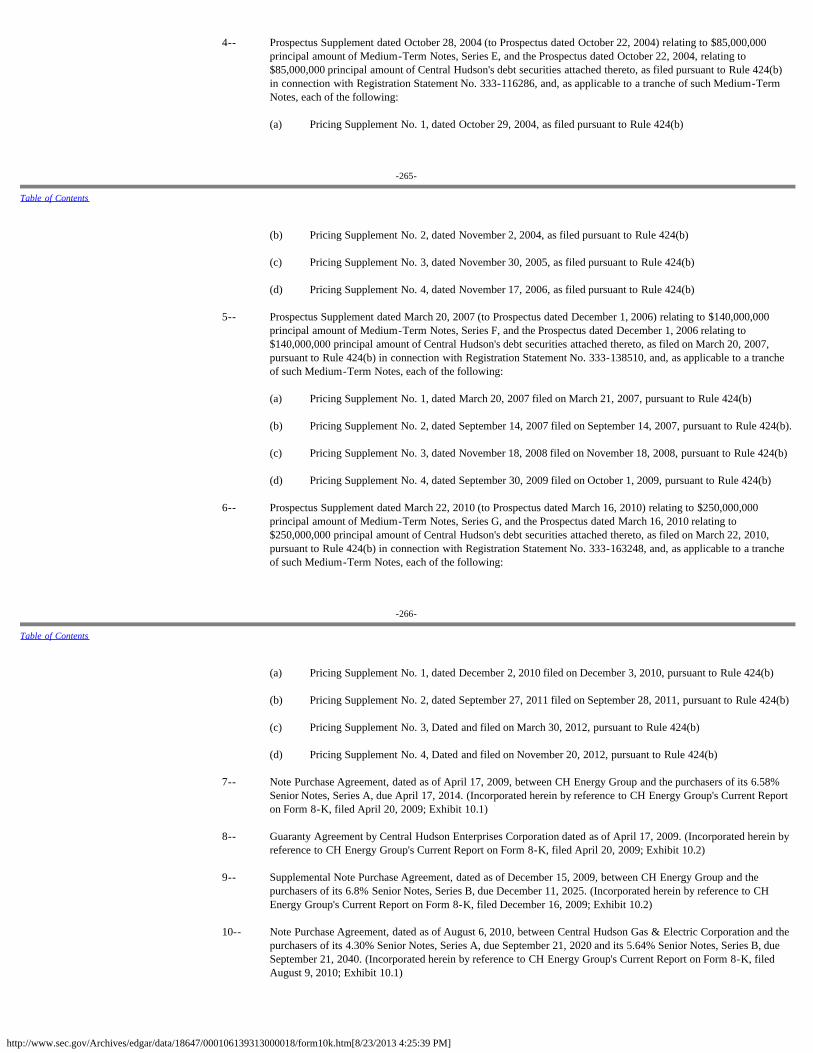
http://www.sec.gov/Archives/edgar/data/18647/000106139313000018/form10k.htm[8/23/2013 4:25:39 PM]
4-- Prospectus Supplement dated October 28, 2004 (to Prospectus dated October 22, 2004) relating to $85,000,000principal amount of Medium-Term Notes, Series E, and the Prospectus dated October 22, 2004, relating to$85,000,000 principal amount of Central Hudson's debt securities attached thereto, as filed pursuant to Rule 424(b)in connection with Registration Statement No. 333-116286, and, as applicable to a tranche of such Medium-TermNotes, each of the following:
(a) Pricing Supplement No. 1, dated October 29, 2004, as filed pursuant to Rule 424(b)
-265-
Table of Contents
(b) Pricing Supplement No. 2, dated November 2, 2004, as filed pursuant to Rule 424(b) (c) Pricing Supplement No. 3, dated November 30, 2005, as filed pursuant to Rule 424(b) (d) Pricing Supplement No. 4, dated November 17, 2006, as filed pursuant to Rule 424(b) 5-- Prospectus Supplement dated March 20, 2007 (to Prospectus dated December 1, 2006) relating to $140,000,000
principal amount of Medium-Term Notes, Series F, and the Prospectus dated December 1, 2006 relating to$140,000,000 principal amount of Central Hudson's debt securities attached thereto, as filed on March 20, 2007,pursuant to Rule 424(b) in connection with Registration Statement No. 333-138510, and, as applicable to a trancheof such Medium-Term Notes, each of the following:
(a) Pricing Supplement No. 1, dated March 20, 2007 filed on March 21, 2007, pursuant to Rule 424(b) (b) Pricing Supplement No. 2, dated September 14, 2007 filed on September 14, 2007, pursuant to Rule 424(b). (c) Pricing Supplement No. 3, dated November 18, 2008 filed on November 18, 2008, pursuant to Rule 424(b) (d) Pricing Supplement No. 4, dated September 30, 2009 filed on October 1, 2009, pursuant to Rule 424(b) 6-- Prospectus Supplement dated March 22, 2010 (to Prospectus dated March 16, 2010) relating to $250,000,000
principal amount of Medium-Term Notes, Series G, and the Prospectus dated March 16, 2010 relating to$250,000,000 principal amount of Central Hudson's debt securities attached thereto, as filed on March 22, 2010,pursuant to Rule 424(b) in connection with Registration Statement No. 333-163248, and, as applicable to a trancheof such Medium-Term Notes, each of the following:
-266-
Table of Contents
(a) Pricing Supplement No. 1, dated December 2, 2010 filed on December 3, 2010, pursuant to Rule 424(b) (b) Pricing Supplement No. 2, dated September 27, 2011 filed on September 28, 2011, pursuant to Rule 424(b) (c) Pricing Supplement No. 3, Dated and filed on March 30, 2012, pursuant to Rule 424(b) (d) Pricing Supplement No. 4, Dated and filed on November 20, 2012, pursuant to Rule 424(b) 7-- Note Purchase Agreement, dated as of April 17, 2009, between CH Energy Group and the purchasers of its 6.58%
Senior Notes, Series A, due April 17, 2014. (Incorporated herein by reference to CH Energy Group's Current Reporton Form 8-K, filed April 20, 2009; Exhibit 10.1)
8-- Guaranty Agreement by Central Hudson Enterprises Corporation dated as of April 17, 2009. (Incorporated herein by
reference to CH Energy Group's Current Report on Form 8-K, filed April 20, 2009; Exhibit 10.2) 9-- Supplemental Note Purchase Agreement, dated as of December 15, 2009, between CH Energy Group and the
purchasers of its 6.8% Senior Notes, Series B, due December 11, 2025. (Incorporated herein by reference to CHEnergy Group's Current Report on Form 8-K, filed December 16, 2009; Exhibit 10.2)
10-- Note Purchase Agreement, dated as of August 6, 2010, between Central Hudson Gas & Electric Corporation and the
purchasers of its 4.30% Senior Notes, Series A, due September 21, 2020 and its 5.64% Senior Notes, Series B, dueSeptember 21, 2040. (Incorporated herein by reference to CH Energy Group's Current Report on Form 8-K, filedAugust 9, 2010; Exhibit 10.1)
http://www.sec.gov/Archives/edgar/data/18647/000106139313000018/form10k.htm[8/23/2013 4:25:39 PM]
-267-
Table of Contents
11-- Central Hudson and another subsidiary of CH Energy Group have entered into certain other instruments with respect
to long-term debt. No such instrument relates to securities authorized thereunder which exceed 10% of the totalassets of CH Energy Group and its other subsidiaries or Central Hudson, as the case may be, each on a consolidatedbasis. CH Energy Group and Central Hudson agree to provide the Commission, upon request, copies of anyinstruments defining the rights of holders of long-term debt of Central Hudson and such other subsidiary
10 Material contracts: (i) 1-- General Joint Use Pole Agreement between Central Hudson and the New York Telephone Company effective
January 1, 1986 (not including the Administrative and Operating Practices provisions thereof). (Incorporated hereinby reference to Central Hudson's Annual Report on Form 10-K/A for the fiscal year ended December 31, 1992;Exhibit (10)(i)37)
2-- Amended and Restated Credit Agreement effective as of October 19, 2011 among Central Hudson, certain lenders
described therein and JPMorgan Chase Bank, N.A., as arranger and administrative agent. (Incorporated herein byreference to Central Hudson's Current Report on Form 8-K filed on October 24, 2011; Exhibit 10.1)
3-- Amended No. 1 dated as of September 25, 2012 to Credit Agreement dated as of October 19, 2011. (Incorporated
herein by reference to CH Energy Group's Quarterly Report on Form 10-Q for the quarter ended September 30,2012; Exhibit 10.1)
4-- Second Amended and Restated Credit Agreement effective as of October 19, 2012 among CH Energy Group, Inc.,
certain lenders described therein and KeyBank National Association, as arranger and administrative agent. (Incorporated herein by reference to CH Energy Group's Current Report on Form 8-K filed on October 24, 2012;Exhibit 10.1)
-268-
Table of Contents
5-- Promissory Note of Central Hudson Gas & Electric Corporation, dated March 31, 2010, payable to the order of RBS
Citizens Bank, N.A. (Incorporated herein by reference to CH Energy Group's Annual Report on Form 10-K for theyear ended December 31, 2011; Exhibit (10)(i)5)
6-- Promissory Note of Central Hudson Gas & Electric Corporation, dated June 25, 2012, payable to the order of
JPMorgan Chase Bank, N.A. (Incorporated herein by reference to CH Energy Group's Annual Report on Form 10-Kfor the year ended December 31, 2012; Exhibit (10)(i)6)
7-- Promissory Note of Central Hudson Gas & Electric Corporation, dated June 29, 2012, payable to the order of Bank
of America, N.A. (Incorporated herein by reference to CH Energy Group's Annual Report on Form 10-K for theyear ended December 31, 2012; Exhibit (10)(i)7)
(iii)(1) 1-- Trust and Agency Agreement, dated December 15, 1999 and effective January 1, 2000, between the Corporation and
First America Trust Company for the Corporation's Directors and Executives Deferred Compensation Plan. (Incorporated herein by reference to Energy Group's Annual Report on Form 10-K for the fiscal year endedDecember 31, 1999; Exhibit (10)(iii)26)
2-- Amendment to CH Energy Group, Inc. Directors and Executives Deferred Compensation Plan Trust Agreement.
(Incorporated herein by reference to Energy Group's Annual Report on Form 10-K for the fiscal year endedDecember 31, 2003; Exhibit (10)(iii)29)
3-- Amendment to CH Energy Group, Inc. Directors and Executives Deferred Compensation Plan Trust Agreement.
(Incorporated herein by reference to Energy Group's Annual Report on Form 10-K for the fiscal year endedDecember 31, 2011; Exhibit (10)(iii)3)
(1) Exhibits in Part (iii) of this Section 10 are management contracts and compensatory plans and arrangements.
-269-
http://www.sec.gov/Archives/edgar/data/18647/000106139313000018/form10k.htm[8/23/2013 4:25:39 PM]
Table of Contents
4-- Amended and Restated CH Energy Group, Inc. Directors and Executives Deferred Compensation Plan (Part One),
Effective September 26, 2003. (Incorporated herein by reference to Energy Group's Form S-8 filed on October 30,2003; Exhibit (10)(iii)26)
5-- Amendment to CH Energy Group, Inc. Directors and Executives Deferred Compensation Plan. (Incorporated herein
by reference to Energy Group's Current Report on Form 8-K filed on June 1, 2006; Exhibit (10)(iii)44) 6-- Amended and Restated CH Energy Group, Inc. Directors and Executives Deferred Compensation Plan (Part Two),
effective as of January 1, 2008 (dated December 31, 2007). (Incorporated herein by reference to Energy Group'sAnnual Report on Form 10-K for the year ended December 31, 2007; Exhibit (10)(iii)31)
7-- Amended and Restated CH Energy Group, Inc. Directors and Executives Deferred Compensation Plan, effective as
of January 1, 2012 (dated January 6, 2012). (Incorporated herein by reference to Energy Group's Annual Report onForm 10-K for the year ended December 31, 2011; Exhibit (10)(iii)7)
8-- Amendment and Restatement of Central Hudson Gas & Electric Corporation Retirement Benefit Restoration Plan
(Part One) effective June 22, 2001. (Incorporated herein by reference to Energy Group's Annual Report on Form 10-K, for the fiscal year ended December 31, 2001; Exhibit (10)(iii)24)
9-- Amendment to Central Hudson Gas & Electric Corporation Retirement Benefit Restoration Plan. (Incorporated
herein by reference to Energy Group's Current Report on Form 8-K filed on December 21, 2005; Exhibit (10)(iii)42) 10-- Amended and Restated Central Hudson Gas & Electric Corporation Retirement Benefit Restoration Plan (Part Two)
effective as of January 1, 2008. (Incorporated herein by reference to Energy Group's Annual Report on Form 10-Kfor the year ended December 31, 2007; Exhibit (10)(iii)39)
-270-
Table of Contents
11-- Amended and Restated CH Energy Group, Inc. Supplemental Executive Retirement Plan effective as of January 1,
2008. (Incorporated herein by reference to Energy Group's Annual Report on Form 10-K for the year endedDecember 31, 2007; Exhibit (10)(iii)37)
12-- Amendment to CH Energy Group, Inc. Supplemental Executive Retirement Plan. (Incorporated herein by reference
to CH Energy Group's Quarterly Report on Form 10-Q for the fiscal quarter ended June 30, 2008; Exhibit (10)(iii)1) 13-- Second Amendment to CH Energy Group, Inc. Supplemental Executive Retirement Plan. (Incorporated herein by
reference to CH Energy Group's Current Report on Form 8-K filed on November 16, 2012; Exhibit 10.1) 14-- CH Energy Group, Inc. Long-Term Equity Incentive Plan, effective as of April 25, 2006. (Incorporated herein by
reference to Appendix A to Energy Group's proxy statement filed on March 10, 2006; Appendix A) 15-- Amendment to CH Energy Group, Inc. Long-Term Performance-Based Incentive Plan effective as of December 31,
2007. (Incorporated herein by reference to Energy Group's Annual Report on Form 10-K for the year endedDecember 31, 2007; Exhibit (10)(iii)35)
16-- Amendment to CH Energy Group, Inc. Long-Term Equity Incentive Plan effective as of April 26, 2011.
(Incorporated herein by reference to CH Energy Group's Current Report on Form 8-K filed on April 28, 2011;Exhibit 10.1)
17-- Amendment to CH Energy Group, Inc. Long-Term Equity Incentive Plan effective as of December 31, 2007.
(Incorporated herein by reference to Energy Group's Annual Report on Form 10-K for the year ended December 31,2007; Exhibit (10)(iii)36)
18-- CH Energy Group, Inc. Long-Term Equity Incentive Plan, effective as of January 1, 2011. (Incorporated herein by
reference from Appendix A to the Proxy Statement of CH Energy Group, Inc,, filed with the SEC on March 17,2011)
-271-
Table of Contents
19-- Form of CH Energy Group, Inc. Performance Shares Agreement. (Incorporated herein by reference to CH Energy
http://www.sec.gov/Archives/edgar/data/18647/000106139313000018/form10k.htm[8/23/2013 4:25:39 PM]
Group's Current Report on Form 8-K filed on January 26, 2009; Exhibit 10.1) 20-- Form of CH Energy Group, Inc. Performance Shares Agreement. (Incorporated herein by reference to CH Energy
Group's Current Report on Form 8-K filed on February 8, 2010; Exhibit 10.1) 21-- Form of CH Energy Group, Inc. Performance Shares Agreement. (Incorporated herein by reference to CH Energy
Group's Annual Report on Form 10-K for the year ended December 31, 2010; Exhibit (10)(iii)22) 22-- Form of CH Energy Group, Inc. Performance Shares Agreement. (Incorporated herein by reference to CH Energy
Group's Current Report on Form 8-K filed on February 10, 2012; Exhibit 10.1) 23-- Form of CH Energy Group, Inc. Restricted Shares Agreement (for officers of Central Hudson Enterprises
Corporation). (Incorporated herein by reference to CH Energy Group's Quarterly Report on Form 10-Q for the fiscalquarter ended March 31, 2008; Exhibit (10)(iii)4)
24-- Form of CH Energy Group, Inc. Restricted Shares Agreement. (Incorporated herein by reference to CH Energy
Group's Current Report on Form 8-K filed on February 8, 2010; Exhibit 10.2) 25-- Form of CH Energy Group, Inc. Restricted Shares Agreement. (Incorporated herein by reference to CH Energy
Group's Current Report on Form 8-K filed on February 10, 2012; Exhibit 10.2) 26-- Form of CH Energy Group, Inc. Restricted Stock Unit Agreement (Long-Term Equity Incentive Plan). (Incorporated
herein by reference to CH Energy Group's Current Report on Form 8-K filed on November 17, 2009; Exhibit 10.1)
-272-
Table of Contents
27-- Amended and Restated Employment Agreement between CH Energy Group, Inc. and the Chief Executive Officer
effective as of January 1, 2008. (Incorporated herein by reference to Energy Group's Annual Report on Form 10-Kfor the year ended December 31, 2007; Exhibit (10)(iii)32)
28-- Amended and Restated Employment Agreement between CH Energy Group, Inc. and the three most senior
executives (after Chief Executive Officer) effective as of January 1, 2008. (Incorporated herein by reference toEnergy Group's Annual Report on Form 10-K for the year ended December 31, 2007; Exhibit (10)(iii)33)
29-- Amended and Restated Employment Agreement between CH Energy Group, Inc. and the other executive officers
effective as of January 1, 2008. (Incorporated herein by reference to Energy Group's Annual Report on Form 10-Kfor the year ended December 31, 2007; Exhibit (10)(iii)34)
30-- Amended and Restated Employment Agreement between CH Energy Group, Inc. and Griffith Energy Services, Inc.
executive officer effective as of January 1, 2008. (Incorporated herein by reference to CH Energy Group's AnnualReport on Form 10-K for the year ended December 31, 2007; Exhibit (10)(iii)42)
31-- Employment Agreement between CH Energy Group, Inc. and James P. Laurito, dated as of November 16, 2009.
(Incorporated herein by reference to CH Energy Group's Annual Report on Form 10-K for the year ended December31, 2009; Exhibit (10)(iii)28)
32-- Form of Amendment to Employment Agreement with executive officers, effective December 31, 2008.
(Incorporated herein by reference to CH Energy Group's Annual Report on Form 10-K for the year ended December31, 2008; Exhibit (10)(iii)28)
33-- Employment Agreement, dated October 1, 2009, between CH Energy Group, Inc. and John E. Gould. (Incorporated
herein by reference to CH Energy Group's Quarterly Report on Form 10-Q for the fiscal quarter ended September30, 2009; Exhibit (10)(iii)1)
-273-
Table of Contents
34-- Amended and Restated CH Energy Group, Inc. Short-Term Incentive Plan. (Incorporated herein by reference to CH
Energy Group's Current Report on Form 8-K filed on May 27, 2009; Exhibit 10.1) 35-- Form of CH Energy Group, Inc. Indemnification Agreement (for officers of CH Energy Group, Inc.). (Incorporated
herein by reference to CH Energy Group's Quarterly Report on Form 10-Q for the fiscal quarter ended March 31,2009; Exhibit (10)(iii)1)
http://www.sec.gov/Archives/edgar/data/18647/000106139313000018/form10k.htm[8/23/2013 4:25:39 PM]
36-- Form of Central Hudson Gas & Electric Corporation Indemnification Agreement (for officers of Central Hudson Gas& Electric Corporation). (Incorporated herein by reference to CH Energy Group's Quarterly Report on Form 10-Qfor the fiscal quarter ended March 31, 2009; Exhibit (10)(iii)2)
37-- Form of Central Hudson Enterprises Corporation Indemnification Agreement (for officers of Central Hudson
Enterprises Corporation). (Incorporated herein by reference to CH Energy Group's Quarterly Report on Form 10-Qfor the fiscal quarter ended March 31, 2009; Exhibit (10)(iii)3)
38-- Agreement, dated as of April 27, 2009, by and between CH Energy Group, Inc. and GAMCO Asset Management
Inc. (Incorporated herein by reference to CH Energy Group's Current Report on Form 8-K, filed April 29, 2009;Exhibit 10.1)
12.1 CH Energy Group Statement showing the computation of the ratio of earnings to fixed charges 12.2 Central Hudson Statement showing the computation of the ratio of earnings to fixed charges and ratio of earnings to fixed charges and
preferred dividends 21 Subsidiaries of CH Energy Group, Inc. as of December 31, 2012 23.1 Consents of Independent Registered Public Accounting Firm for incorporation by reference of CH Energy Group Inc.'s Registration
Statements on Form S-8
-274-
Table of Contents
24 Powers of Attorney: (i) 1-- Powers of Attorney for each of the directors comprising a majority of the Board of Directors of CH Energy Group,
Inc. authorizing execution and filing of this Annual Report on Form 10-K by Steven V. Lant 2-- Powers of Attorney for each of the directors comprising a majority of the Board of Directors of Central Hudson
authorizing execution and filing of this Annual Report on Form 10-K by Steven V. Lant 31.1.1 Rule 13a-14(a)/15d-14(a) Certification by Mr. Lant 31.1.2 Rule 13a-14(a)/15d-14(a) Certification by Mr. Capone 31.2.1 Rule 13a-14(a)/15d-14(a) Certification by Mr. Lant 31.2.2 Rule 13a-14(a)/15d-14(a) Certification by Mr. Capone 32.1.1 Section 1350 Certification by Mr. Lant 32.1.2 Section 1350 Certification by Mr. Capone 32.2.1 Section 1350 Certification by Mr. Lant 32.2.2 Section 1350 Certification by Mr. Capone 99 Additional Exhibits: (i) 1-- Order on Consent signed on behalf of the New York State Department of Environmental Conservation and Central
Hudson relating to Central Hudson's former manufactured gas site located in Newburgh, New York. (Incorporatedherein by reference to Central Hudson's Quarterly Report on Form 10-Q for the fiscal quarter ended September 30,1995; Exhibit (99)(i)5)
-275-
Table of Contents
2-- Summary of principal terms of the Amended and Restated Settlement Agreement, dated January 2, 1998, among
Central Hudson, the Staff of the Public Service Commission of the State of New York and the New York StateDepartment of Economic Development. (Incorporated herein by reference to Central Hudson's Current Report onForm 8-K, dated January 7, 1998; Exhibit (99)2)
http://www.sec.gov/Archives/edgar/data/18647/000106139313000018/form10k.htm[8/23/2013 4:25:39 PM]
3-- Order of the Public Service Commission of the State of New York, issued and effective February 19, 1998, adoptingthe terms of Central Hudson's Amended Settlement Agreement, subject to certain modifications and conditions. (Incorporated herein by reference to Central Hudson's Current Report on Form 8-K, dated February 10, 1998;Exhibit (10)1)
4-- Order of the Public Service Commission of the State of New York, issued and effective June 30, 1998, explaining in
greater detail and reaffirming its Abbreviated Order, issued and effective February 19, 1998, which February 19,1998 Order modified, and as modified, approved the Amended and Restated Settlement Agreement, dated January 2,1998, entered into among Central Hudson, the PSC Staff and others as part of the PSC's "Competitive Opportunities"proceeding (ii) the Order, dated June 24, 1998, of the Federal Energy Regulatory Commission conditionallyauthorizing the establishment of an Independent System Operator by the member systems of the New York PowerPool and (iii) disclosing, effective August 1, 1998, Paul J. Ganci's appointment by Central Hudson's Board ofDirectors as President and Chief Executive Officer and John E. Mack III's formerly Chairman of the Board and ChiefExecutive Officer) continuation as Chairman of the Board. (Incorporated herein by reference to Central Hudson'sCurrent Report on Form 8-K, dated July 24, 1998; Exhibit (10)1)
5-- Order of the Public Service Commission of the State of New York, issued and effective October 3, 2002, authorizing
the implementation of the Economic Development Program. (Incorporated herein by reference to CH EnergyGroup's Annual Report on Form 10-K, for the fiscal year ended December 31, 2002; Exhibit (99)(i)10)
-276-
Table of Contents
6-- Order of the Public Service Commission of the State of New York, issued and effective October 25, 2002,
authorizing the establishment of a deferred accounting plan for site identification and remediation costs relating toCentral Hudson's seven former manufactured gas plants. (Incorporated herein by reference to CH Energy Group'sAnnual Report on Form 10-K, for the fiscal year ended December 31, 2002; Exhibit (99)(i)11)
101.INS XBRL Instance Document 101.SCH XBRL Taxonomy Extension Schema 101.CAL XBRL Taxonomy Extension Calculation Linkbase 101.DEF XBRL Taxonomy Extension Definition Linkbase 101.LAB XBRL Taxonomy Extension Label Linkbase 101.PRE XBRL Taxonomy Extension Presentation Linkbase
-277-


![FORM 10-K - SEC · 2017. 10. 3. · united states securities and exchange commission washington, d.c. 20549 form 10-k [ x ] annual report pursuant to section 13 or 15(d) of the securities](https://img.pdfslide.us/doc/110x75/603caa168a0a2c2b6463fef1/form-10-k-sec-2017-10-3-united-states-securities-and-exchange-commission.jpg)

![FORM 10-K - SEC...UNITED STATES SECURITIES AND EXCHANGE COMMISSION Washington, D.C. 20549 FORM 10-K (Mark One) [X] ANNUAL REPORT PURSUANT TO SECTION 13 …](https://img.pdfslide.us/doc/110x75/60a124c22b927254aa28b1cf/form-10-k-sec-united-states-securities-and-exchange-commission-washington.jpg)