Embed Size (px)
Citation preview

Forgive but not forget: the behaviour of relationship bankswhen firms are in distress
Larissa Schafer
SummaryThis paper studies whether relationship banks help firms in financial distress. Combining a new and direct measure of rela-tionship lending with unique credit registry data, I examine the effect of relationship lending on ex-post loan performance. Myfindings demonstrate that the same firm is more likely to become temporary delinquent on a relationship-based loan relative to atransaction-based loan. Consistent with theory, relationship banks tolerate temporary bad results, yet extract rents in the long run,that is, they forgive but do not forget. When firms are in distress, relationship banks adjust contract terms and allow drawdownson credit lines and overdrafts but do not inefficiently roll over loans. Moreover, relationship banks are more likely to continueto lend to firms after past non-performance. Overall, the paper uncovers a new channel of how relationship lending serves as aliquidity insurance for firms in distress.
Keywords: bank financing, relationship lending, loan performance, firm distress, liquidity insurance
JEL Classification: G21, G30.
Contact details: Larissa Schafer, Frankfurt School of Finance & Management, Sonnemannstr. 9-11, 60314 Frankfurt am Main,Germany; email: [email protected]; phone: +49 69 154008-763.
Larissa Schafer is an Assistant Professor at the Frankfurt School of Finance & Management.
I would like to thank Lieven Baele, Thorsten Beck, Vicente Bermejo, Tobias Berg, Patrick Bolton, Fabio Braggion, Emily Breza, CharlesCalomiris, Geraldo Cerqueiro, Nicola Cetorelli, Frank De Jong, Ralph de Haas, Hans Degryse, Linda Goldberg, Benjamin Guin, AndrewHertzberg, Vasso Ioannidou, Elisabeth Kempf, Michael Koetter, Mauricio Larrain, Alberto Manconi, Jose-Luis Peydro, Steven Ongena,Enrichetta Ravina, Jonah Rockoff, Joao Santos, Philipp Schnabl, Sascha Steffen, Frederic Vinas and Daniel Wolfenzon as well as seminarparticipants at Tilburg University, Norwegian Business School, KU Leuven, ESMT Berlin, Bocconi University, ECB, Frankfurt School ofFinance & Management, BIS, Stockholm School of Economics, Copenhagen Business School, Kelley School of Business and Rotman School ofManagement for fruitful discussions and comments. Special thanks go to employees of the Central Bank of Armenia and ACRA for kindlyproviding me with the data and to the Development Facility of the European Fund for Southeast Europe (EFSE) for making this cooperationpossible. All errors are my own.
Working Paper No. 186 Prepared in March 2016

1 Introduction
Relationship lending constitutes one of the most important comparative advantages of bank lending tofirms. When engaging in relationship lending, banks gather propriety information about their customersthrough repeated interactions (Boot, 2000). Some theories suggest that banks use their superior knowledgeto extend loans at favourable contract terms and provide firms with better access to finance (Boot andThakor, 1994; Petersen and Rajan, 1995). In contrast, alternative theories point out that relationshiplending is associated with possible “hold-up” problems and extraction of rents from firms (Sharpe, 1990;Rajan, 1992). While the empirical literature has mostly focused on contract terms and credit availability,far less is known about bank behaviour when firms are in financial distress. This paper fills the gap byexamining the effect of relationship lending on ex-post loan performance.
Understanding bank behaviour when firms are hit by idiosyncratic liquidity shocks is important for practi-tioners and academics alike. Firms and their sources of funding when faced with liquidity shocks are vitalfor the economy as a whole. Moreover, insights into banks’ reactions to idiosyncratic shocks to firms willhelp design policies to foster financial stability. While the theoretical literature has shown that informedbanks provide financial flexibility when firms are in need, the empirical literature is still lagging behind.This paper uncovers a new channel of how relationship lending serves as a liquidity insurance for firms indistress.
Studies on relationship lending face several empirical challenges. First, a bank’s use of relationship lendingis not observable to the econometrician. Empirical studies often use the length, strength, and depth of abank-firm relationship or the geographical distance between firms and banks as measures of relationshiplending.1 These measures could, however, be endogenous to firm decisions. Second, the use of relationshiplending is likely correlated with firm and bank characteristics. Relationship lending centres around theacquisition of “soft” information which plays a more important role when small and decentralised bankslend to small and opaque firms (Stein, 2002). Ideally, one would like to observe variation in the use ofrelationship lending within banks and firms in order to eliminate biases coming from confounding effectsof bank and firm characteristics. Third, one needs some randomisation in the use of relationship lendingacross banks and firms to avoid selection and composition biases.
Combining survey data on banks’ lending policies with unique credit registry data from Armenia allowsme to address identification challenges and provide new insights into bank behaviour when firms are indistress. First, I use survey answers of banks that provide a new and direct measure of relationship lending,defined as the importance of the knowledge of a client for the lending process. Relative to previousmeasures in the literature, this measure is not endogenous to firm decisions and not a firm characteristic.Second, the use of relationship lending varies across banks. Firms can thus receive both relationship-basedand transaction-based loans from different banks. Third, a bank rule helps me assign whether a loan of afirm is based on relationship or transactional lending. Since the banks indicate the rule in the survey that isnot publicly available, a firm is unlikely to know and thus influence the rule, creating exogenous variation(from a firm’s perspective) in the use of lending techniques within a firm across banks.2 Lastly, detailedcredit registry data allow me to evaluate the effect of relationship lending within firms over time.
1See, among others, Petersen and Rajan (1994), Berger and Udell (1995), Harhoff and Korting (1998), Machauer and Weber(1998), Degryse and Ongena (2005), Agarwal and Hauswald (2010) and Bharath, Dahiya, Saunders, and Srinivasan (2011). Elsasand Krahnen (1998) are one of the few to rely on self-evaluations of credit managers on the house bank status of a bank for aparticular client.
2In Appendix B I find that some manipulation is present, probably by loan officers. However, in Section 4.4.1 I show thatidentification comes from loans further away from the threshold for which the main results continue to hold.
1

For the analysis, I use a bank rule to link the relationship lending measure to each loan from the privatecredit registry of Armenia for the period between January 2009 and June 2013. The credit registry datacovers virtually all loans to firms during the sample period, containing detailed data on every loan such asdate of origination, maturity date, contract terms and loan performance as well as data on firm character-istics such as legal status, industry, location, and banking relationships. Armenia provides an ideal settingto examine the effects of relationship lending on loan performance. By 2004, Armenia was completelyprivatised, leaving no government banks and only few government firms that should not distort the ana-lysis.3 The credit market is still at a developing stage with banks dominating the financial system.4 Sincefew outside financing options exist and bank lending is of high importance, outside financing options donot contaminate the analysis. While 97.7 per cent of all registered legal entities in 2009 were small andmedium-sized enterprises (SMEs), even large firms in Armenia are rather comparable to SMEs (WorldBank, 2014).5 Most importantly, I show that stylised facts from other banking markets also hold for Ar-menia such as the reliance of relationship banks on “soft” information and a contract menu of high interestrates, fewer collateral requirements and longer maturities compared with more transaction-based banks.
To evaluate the effect of relationship lending, I rely on survey answers of banks on the importance oflending techniques. I distinguish between “Relationship Banks” that state to always rely on relationshiplending, meaning to highly value the knowledge of a client, and “Transactional Banks” that employ trans-actional lending based on firm fundamentals and collateral for most of their loans. Since banks directlystate the importance of relationship lending, the measure captures the actual reliance on relationship lend-ing by banks and is not driven by firm decisions. Now, imagine a firm that receives a relationship-basedloan from a relationship bank and a transaction-based loan from a transactional bank. First, I examinedifferences in temporary delinquencies of such a firm. This test reveals which bank offers financial flexib-ility, allowing the firm to become temporary delinquent when the firm experiences liquidity shortages. Incontrast, when a firm receives two relationship-based loans from the two banks, differences in delinquen-cies should disappear if lending techniques drive bank behaviour. Second, I evaluate long-term effects ofrelationship lending and, lastly, bank behaviour when firms are in financial distress.
The effect of relationship lending on ex-post loan performance is ambiguous. Theories on financial inter-mediation advocate that banks mitigate asymmetric information problems by acquiring propriety inform-ation through screening and monitoring of clients in repeated interactions (see, for example, Diamond,1984; Ramakrishnan and Thakor, 1984; Allen, 1990). If relationship lending results in more efficientscreening and monitoring, better ex-post loan performance, less delinquencies, should be the outcome. Ifbanks use their knowledge to be more lenient towards a client, they might allow the client to temporarilybecome delinquent when the client is in financial distress. Von Thadden (1995) suggests that banks mighttolerate short-term bad results as long as they can extract long-term rents. The reasoning for this is thatbanks learn the firm’s quality through monitoring, and hence will not interpret short-term bad results assigns of bad quality and prematurely terminate good projects. Similarly, Rajan (1992) suggests that in-formed banks offer financial flexibility to firms at the cost of a share in their profits. This paper bringsthese theories to the data, examining short-term loan performance and long-term effects of relationshiplending.
My findings demonstrate that the same firm is 50 per cent more likely to become temporary delinquent
3In particular, firms with private domestic ownership make up 89.9 per cent of all firms, followed by firms with private foreignownership (7.7 per cent) and with state ownership (0.7 per cent) (World Bank, 2011).
4The loans-to-GDP ratio was around 40 per cent in 2013 compared with 96 per cent and 198 per cent in developed marketssuch as Germany and the United States. According to a report by CBA (2014), banks were holding almost 90 per cent of financialassets in 2013 and earned most of their income from lending.
5Relative to the European Union and the United States, Armenian SMEs are much smaller, with employee numbers below100 compared with 250 and 500 employees (SME DNC, 2010).
2
on a relationship-based loan relative to a transaction-based loan, indicating that relationship banks tolerateshort-term bad results. When both banks rely on relationship lending, differences in loan performancedisappear. The result continues to hold when I control for loan characteristics, bank characteristics, loanorigination and firm×time fixed effects. The result is not driven by sample selection, the size of theoverdue amounts, the definition of relationship lending or by relationship variables used in the previousliterature.
Next, I examine the long-term effects of relationship lending. Results reveal that, while delinquency ratesare higher, relationship banks do not experience higher defaults or lower recovery rates when loans maturerelative to transactional banks. Relationship banks, however, earn higher returns on loans, even conditionalon short-term delinquencies. In line with theory, relationship banks tolerate temporarily bad results as longas they can secure long-term rents. The findings uncover a new channel of how relationship banks provideliquidity insurance for firms that face temporary problems.
What do relationship banks do differently relative to transactional banks that enables them to offer liquid-ity insurance? Empirical tests show that relationship banks acquire information about their clients throughmonitoring. Not having an ex-ante riskier customer base, relationship banks continue to lend to customersthat have been delinquent with them, knowing their inherent quality better than transactional banks. Re-lationship banks also allow firms to compensate temporary delinquencies with drawdowns on their creditlines or overdrafts and by adjusting interest rates and maturities. Relationship banks do not, however,inefficiently roll over loans more often than transactional banks. Overall, the results give an indication ofhow relationship banks help their clients when they experience liquidity shortages.
The paper is related to an extensive literature on relationship lending.6 Some authors advocate that re-lationship lending provides better access to finance and favourable contract terms in the form of lowerinterest rates and fewer collateral requirements (see, for example, Petersen and Rajan, 1994; Berger andUdell, 1995), the more so in crisis times (see Bolton et al., 2013; Beck et al., 2014a). Others, however,indicate that banks might lock in borrowers and raise interest rates when borrowers face transportationcosts and low bank competition (Degryse and Ongena, 2005) or informational hold-up and switchingcosts (Ioannidou and Ongena, 2010). While previous literature mostly uses approximations of relation-ship lending and focuses on contract terms and credit availability, this paper combines a new and directmeasure of relationship lending with credit registry data to test bank behaviour when firms are in distress.A related paper by Elsas and Krahnen (1998) shows that relationship banks increase their credit volumewhen firms experience small rating deteriorations. This paper draws a more complete picture by revealingthat relationship banks allow temporary delinquencies yet require long-term rents in return.
The paper also contributes to the literature on the effects of relationship lending and use of soft informationon loan performance. Literature on consumer credit markets shows that relationship lending leads to lowerdefault risk because of better screening and monitoring by banks (Puri et al., 2013). In mortgage markets,securitisation may adversely affect screening standards of banks and result in higher default rates (Keys,Mukherjee, Seru, and Vig (2010)), while the involvement of risk managers alongside loan officers reducesdefault rates (Berg, 2015). Other papers show that hierarchical and physical distances decrease the useof soft information and make loan defaults more likely (Liberti and Mian, 2009; Agarwal and Hauswald,2010; Skrastins and Vig, 2014). This paper shows that relationship banks treat firms differently thanconsumers, allowing for temporary delinquencies with future rents in sight. Some papers also exploredefaults of firms but focus rather on strategic choices of firms to default on lenders with which they havepersonal interactions and long relationships or that are geographically and culturally close to them (Baeleet al., 2014; Morales, 2014; Schoar, 2014). Berlin and Mester (1999) show that banks provide insurance
6For a more detailed review, see Degryse, Kim, and Ongena (2009) and Kysucky and Norden (2015).
3

against credit shocks through loan rate smoothing, especially when banks rely on core deposits as a fundingsource. A recent paper by Li, Lu, and Srinivasan (2013) investigates contract terms during firm distress,showing that relationship banks offer similar interest rates to outside banks but keep collateral requirementslow after firm distress. This paper, in contrast, exploits the time series of each loan and examines bankbehaviour when firms experience temporary repayment problems, revealing that relationship banks provideliquidity insurance through financial flexibility and better access to finance.
The paper is structured as follows. Section 2 describes the data and provides summary statistics. Section 3introduces the empirical methodology. Section 4 presents results and robustness tests. Section 5 validatesthe relationship lending measure. Section 6 concludes.
4

2 Data
2.1 Bank survey data
The first data source is the Banking Environment and Performance Survey (BEPS) II that provides in-formation on banks’ internal lending policies and organisational structures in central and eastern Europe,Central Asia and North Africa as of 2011. Since I have only credit registry data from Armenia, I focus onArmenian banks.7 The survey data allows me to construct a direct measure of relationship lending, relyingon the answers to questions Q6 and Q10 from 17 Armenian banks. In these answers, banks indicate theimportance (frequency of use) of four lending technologies on a five-point Likert scale for SME and cor-porate loans separately (ranging from 1 “very unimportant” to 5 “very important”): relationship lending(knowledge of the client), fundamental/cash flow analysis (financial information), collateral (personal as-sets pledged by entrepreneur), and collateral (business assets). Additionally, in questions Q4 and Q8 banksreport the number of layers that need to be passed for loan approval if the bank grants an SME or corpor-ate loan. In a follow-up questionnaire banks report the loan amount threshold at which they differentiatebetween an SME and a corporate loan.
For the main empirical analysis, I use survey answers on the absolute importance of relationship lending.In Section 4.4, I also experiment with an alternative measure of the importance of relationship lendingrelative to other lending technologies. In contrast to previous literature, I do not approximate relationshiplending with the strength, length, depth or distance of bank-firm relationships, which are more endogenousto firm decisions, but directly observe the self-reported importance of relationship lending of each bank fortwo loan types.8 The survey specifies relationship lending as knowledge of the client, which is similar toBoot (2000)’s definition of relationship lending as the acquisition of propriety information over multipleinteractions with a customer. Although banks report their lending technologies for 2011 only, it should notpose a problem, since Fahlenbrach et al. (2012) confirm that bank business models stay relatively constantover time. Still, I show that the relationship lending measure captures the use of “soft” information whenpricing loans in Section 5 and that results hold after 2011 in Section 4.4.1. Moreover, Beck, Degryse,De Haas, and van Horen (2014a) provide cross-country evidence for the validity of the relationship lendingmeasure.
Based on banks’ survey answers I define nine “Relationship Banks” that report relationship lending (know-ledge of the client) to be “very important” for both SME and corporate loans, and six “TransactionalBanks” that rely on fundamental/cash flow analysis and collateral for SME loans but find relationshiplending “very important” for corporate loans. Since 95 per cent of the loans are SME loans, I can assumethat transactional banks mostly rely on transactional lending. However, I exploit the variation of lendingtechnologies across and within banks for identification. Chart 1 shows the two bank types, loan types andthe corresponding lending techniques.9 It might seem surprising that transactional banks rely on transac-tional lending for SMEs. Survey evidence by De la Torre et al. (2010), however, shows that banks offerstandardised products, sometimes combined with tailor-made features, to a group of SMEs with similar
7The BEPS II survey was jointly undertaken by the European Bank for Reconstruction and Development (EBRD) andEuropean Banking Center (EBC) at Tilburg University in 2011. CEOs of 611 banks in central and eastern Europe, CentralAsia and North Africa were interviewed by a specialised team of senior financial consultants with considerable banking experi-ence on topics such as activities, funding and risk management, lending technologies, competitive environment, the influence offoreign parent banks and perceptions of legal and regulatory systems.
8Based on the same survey, Beck et al. (2014a) construct the share of relationship banks in the vicinity of firms and test howit affects access to finance for these firms over the business cycle.
9Two banks drop from the sample because one bank grants SME loans only and the other one never considers relationshiplending as “very important” for both loan types.
5

needs such as adjusting the credit line to the business cycle of a specific industry. Average loan amountsin the sample are relatively small, making standardisation of the lending process more likely since not allbanks want to invest in costly relationship lending.
The other important information that I exploit is the bank-specific definition criteria for SME and corporatecustomers. Most banks base the customer type on the loan amount.10 Using the loan amount threshold,I can assign a loan to be an SME or corporate loan and then the corresponding lending technique thebank uses for the loan type (see Chart 1). The loan amount thresholds differ in size and currency acrossbanks and are not publicly available, making manipulation for firms more difficult. Therefore, I canassume that at least from the firm’ perspective exogenous variation in the assignment of a loan to differentloan types and hence to the corresponding lending technique exists.11 Such bank policies can still besubject to manipulation by loan officers. In Appendix B I additionally test whether manipulation aroundthe threshold is present. I find that some manipulation is present which disappears once I exclude loansexactly at the threshold. Manipulation is not of a concern since the main analysis compares relationship-based and transactions-based loans across banks within the same firm, which do not need to be close tothe threshold. In Section 4.4.1, I additionally confirm that results continue to hold for loans further awayfrom the threshold.
2.2 Credit registry data
The second unique dataset is the Armenian private credit registry from the Armenian Credit ReportingAgency (ACRA) that allows me to assess the effect of relationship lending on loan outcomes.12 Foundedin 2004, the credit registry covers all loans to firms (without a loan amount restriction) from 21 Armenianbanks between January 2009 and June 2013 on a semiannual basis.13 For each loan, I have information onthe origination and maturity dates, contract terms, ex-post loan performance, location of the loan issue andthe economic sector of the loan. For each firm, I have information on the legal status, industry, physicallocation, and banking relationships. The private credit registry is used by the Central Bank of Armenia(CBA) for the analysis of the banking sector as well as for supervision purposes. Since all banks aremembers of the private credit registry and have paid a flat rate membership fee, they mostly rely on datafrom the private credit registry, which is more complete, for screening and monitoring firms. In almost99 per cent of cases banks asked for information in a standardised format that included details of a firm’scurrent and past loans dating back five years without revealing the other bank’s identity.14
10Although there is a law on “State Support to SMEs” that specifies annual assets and turnover as well as the number of em-ployees for different firm categories, banks use their own rules of thumb to classify a firm as SME or corporate firm. Discussionswith bank employees, ACRA and CBA employees, confirmed that banks classify firms mostly by loan amount. An IFC surveyalso shows that the loan amount is a good proxy for firm size (IFC, 2013).
11Liberti and Mian (2009) also use 19 bank rule variables that determine the hierarchical level to which a firm is sent in orderto investigate the effect of hierarchical distance on information production.
12Armenia also has a public credit registry managed by the Central Bank of Armenia (CBA), which, however, covers only largeloans above 1.5 million Armenian drams (US$ 3,704 as of December 2013) that do not receive the highest credit rating, whilethe private credit registry covers virtually all loans to firms. Based on the law “Procedure for Creation of Information System ofCreditworthiness of Customers of Banks, Credit Organizations, Branches of Foreign Banks operating in the Republic of Armenia,that is of Credit Registry, and Procedure for Participation in Credit Registry”, banks are obliged to report to all credit registriesabout all their loans within three business days. Discussions with ACRA and CBA staff confirm that banks report on their loanportfolio almost on a daily basis.
13I received access to the credit registry by way of a collaboration of the CBA, the EFSE Development Facility and TilburgUniversity.
14Typical information includes contract terms, ex-post loan performance, firm characteristics and some information onborrower-affiliated parties. Information in a non-standardised format additionally covers details on firm owners, participants,and guarantors but requires additional consent from involved parties and is only available against a much higher fee than the
6

The CBA has merged the BEPS II survey data with the credit registry data, keeping the bank and firmnames anonymous. Using the loan amount thresholds, I assign each loan of a firm to be SME or corporate.Therefore, I convert data on bank level to loan level. The final sample consists of 15 banks that reportthe importance of use of the relationship lending, and account, on average, for 84 per cent (87 per cent)of all banks’ credit contracts in terms of value (number). The credit registry covers different contracttypes such as loans, credit lines, factoring, leasing, guarantees, letters of credit, overdrafts, repurchaseagreements, and swaps. I focus on loans and refer to them as “standard credit contracts” to have a morehomogenous and most representative set of loans.15 These contracts account for 73 per cent (70 per cent)of all credit contracts in terms of value (number). Most loans are issued either in Armenian drams (AMD)or US dollars (49 per cent and 48 per cent, respectively) with only few loans in euros, British pounds andRussian roubles. I convert all loan amounts into US dollars based on the monthly exchange rate of theArmenian Central Bank.16 To ensure the use of timely information, I only study “new loans” that wereissued between January 2009 and June 2013.17 The few loans that are not rated or have a written-offstatus at the date of loan issue and loans that have a zero interest rate (but possibly have non-zero fees) aredropped. The resulting data set consists of 53,780 loan-time observations of 19,332 loans to 6,649 firmswith an average loan maturity of almost three years.
Differences in firm composition might influence the effect of relationship lending on loan performance. Forexample, high-risk firms might self-select themselves to relationship banks, expecting that these banks willgrant them more freedom to become delinquent on their loans. Therefore, I focus on firms that receivedloans from both banks – relationship and transactional – and saturate the regressions with firm fixed effectsto account for time-invariant unobserved firm heterogeneity and loan demand effects. The sub-sampleconsists of 10,656 loan-time observations of 4,441 loans to 621 firms which constitutes nearly 40 per centof the total lending amount of the entire sample. To account for time-varying firm characteristics, I alsoexperiment with a sample of 3,790 loan-time observations of 1,952 loans to 318 firms that received loansfrom both bank types in the same six-month period. Although I constrain the analysis to a subsample forcleaner identification, main results continue to hold for the total sample as well as the sample of firms thatexclusively borrow from relationship or transactional banks (see Section 4.4.1).
2.3 Descriptive statistics
In order to gain some insights into banks’ survey responses as well as other characteristics of Armenianbanks, Table 1 reports bank types (relationship versus transactional banks), survey responses on the im-portance of relationship lending and the average number of hierarchical layers for loan approval by loantype as well as bank level summary statistics on the average loan amount threshold in US dollars, the mar-ket share in terms of loan number and loan value, the average borrower size based on the total borrowingamount across all banks in US dollars, bank size based on total assets as of 2009 and foreign ownershipthat equals one if more that 50 per cent of equity is foreign-owned. Since bank names remain anonymous,I rely on bank characteristics from the BEPS II survey and reported by the CBA. A first look reveals thatbank characteristics vary across the two bank types – transactional and relationship. Unreported resultssuggest that no specific bank characteristic is correlated with the importance of relationship lending inArmenia, confirming that the two bank types are not driven by other bank characteristics. The only dif-
usual membership fee and is therefore only rarely requested.15I use other credit contracts to calculate the exposure of firms to banks as well as relationship characteristics.16Note that base interest rates might differ across loans of different currencies. Since I focus on loan performance in Section
4.1 and the variation in interest rates in Section 5, it should not affect the results. Still, I control for differences in currencies andconduct robustness tests for loans of different currencies.
17I exclude loans that were originated before January 2009 but stayed in the system because of past default.
7

ference between the two groups is generally lower loan amount thresholds for relationship banks.18 Thedifferences in loan amount thresholds rather facilitate the analysis as it allows for more variation in loantypes within one firm across the two bank types.
Table 2 shows ex-post loan performance measures, loan characteristics, relationship characteristics, andfirm characteristics by bank type for the total sample of 19,332 loans to 6,649 firms and for the sub-sampleof 4,441 loans to 621 firms that borrow from both bank types. Definitions of the variables can be foundin Table A.1 of Appendix A. To capture temporary loan delinquencies, I mainly rely on performancemeasures “Non-Performance 0-90 days” that is equal to one if a loan goes overdue for less than 90 daysand zero otherwise, as well as “Non-Performance 90 days” that is equal to one if a loan goes overdue formore than 90 days and zero otherwise. Other measures of loan performance indicate if a loan has anyoverdue principal or interest payments (Non-Performance), goes overdue for more than 180 days (Non-Performance 180 days), or is completely written off/lost (Default).
Descriptive statistics and graphical analysis on loan performance offer first evidence that relationship bankstemporarily experience higher delinquency rates without more loan defaults. For the total sample, loandelinquencies are significantly higher by 0.8 per cent to 2.6 per cent for relationship banks compared withtransactional banks. For the sub-sample, the differences in loan delinquencies for less and over 90 or 180days increase, while the differences in loan defaults vanish. Chart 2 shows average delinquency rates over90 days over time for the sub-sample by bank type (relationship versus transactional banks) and loan type(Chart 2a for SME loans and Chart 2b for corporate loans). Delinquency rates over 90 days are alwayshigher for relationship banks compared with transactional banks for SME loans (Chart 2a), the case whenrelationship banks rely on relationship lending and transactional banks on transaction-based lending. Incase of corporate loans (Chart 2b), when both employ relationship lending, no consistent differences indelinquency rates are present. The charts confirm that relationship lending leads to temporarily higherdelinquencies independent of time.
Apart from firm compositional and selection biases, differences in contract terms between relationship andtransactional banks might influence loan performance. For the total sample, relationship banks give outsmaller loans (US$181,000 versus US$225,000) at slightly higher interest rates (15.4 per cent versus 15.1per cent) that are less likely to be collateralised (82 per cent versus 88 per cent) or guaranteed (5 per centversus 10 per cent) but are granted with maturities of almost three months longer (36 months versus 33months) without differences in credit ratings compared with transactional banks. The findings are consist-ent with Beck, Ioannidou, and Schaefer (2014b) who show that domestic banks are more likely to giveout unsecured loans at higher interest rates and longer maturities than foreign banks. Except for collateraland guarantees, most of the differences in contract terms disappear for the sub-sample, suggesting thatdifferences in loan characteristics should not be driving differences in loan performance.
If contract terms do not significantly differ across bank types within the same firm, then I can isolate the ef-fect of relationship lending on loan performance. Keys, Mukherjee, Seru, and Vig (2010) claim that whena firm applies for a loan, banks collect “hard” information (for example, credit rating) and “soft” informa-tion (for example, knowledge of the client or future repayment ability). When studying loan performancearound a FICO score threshold, they assume that after controlling for hard information any differences indefault rates on either side of the threshold should be coming from the effect of securitisation on the use ofsoft information. Similarly, the results above show that there are no significant differences in loan charac-teristics for the sub-sample. Still, in the main analysis, I control for observable hard information variables(loan characteristics) and unobservable soft information (firm and firm×time fixed effects). The relation-
18In unreported regression results of the determinants of loan amount thresholds, I find that larger banks are more likely tohave higher loan amount thresholds.
8

ship lending measure thus should capture some of the unobservable soft information “extracted” fromthe firm or firm×time fixed effects and the residual. In Section 5 I show more formally that relationshiplending is indeed associated with higher use of soft information.
Differences in other loan characteristics (location, industry and currency), relationship characteristics(bank-firm relationship in months, scope, primary bank, number of relationships) and other firm char-acteristics (firm location, industry, legal type) do not completely disappear for the total sample comparedwith the sub-sample. Since the main analysis focuses on variation within a firm, most of these differenceswill not play a role. Moreover, I control for these characteristics in different specifications of the modeland in robustness tests.
9

3 Empirical methodology
In order to identify the effect of relationship lending on ex-post loan performance, I distinguish between“Relationship Banks” that always rely on relationship lending and “Transactional Banks” that value re-lationship lending only for corporate loans and employ transactional lending based on firm fundamentalsand collateral for SME loans. Chart 1 illustrates the idea, presenting bank types, loan types and corres-ponding lending techniques. SME loans from transactional banks are the reference group since only in thiscase banks rely on transactional lending. I compare their performance with SME loans from relationshipbanks, the main treatment group, as well as with corporate loans from transactional and relationship banks.Using the loan amount threshold, I assign SME and corporate loan types to each loan. The loan type thendetermines the lending technique for each loan.
Now, imagine a firm that receives a transaction-based loan loan from a transactional bank and a relationship-based loan from a relationship bank (SME loans from a transactional and relationship bank). Controllingfor loan characteristics, I examine differences in loan performance of such a firm when lending techniquesdiffer (left arrow in Chart 1). In contrast, if the firm receives two relationship-based loans from a rela-tionship and transactional bank (corporate loans from transactional and relationship banks), I expect nodifferences in loan performance (right arrow in Chart 1). Empirically, I estimate the following model:
LoanPerformancei jkt = β1CorporateLoani jk
+β2RelationshipBankk
+β3CorporateLoani jk×RelationshipBankk
+θ’Controlsi jk +α j + γt + εi jkt , (1)
where i, j, k, t index loans, firms, banks, and time (semiannually). Notice that regressions are on loan-time level, that is t stands for each period a loan is observed. LoanPerformancei jkt equals 1 if a loanbecomes delinquent for less than 90 days (or for more than 90 days) in a given half year and zerootherwise. CorporateLoani jk equals one if a firm receives a corporate loan from a transactional bank.RelationshipBankk equals one if a firm receives an SME loan from a relationship bank. CorporateLoani jk×RelationshipBankk equals one if a firm receives a corporate loan from a relationship bank. All these loansare based on relationship lending. The reference group are SME loans from transactional banks that arebased on transactional lending.
The coefficient β2 is the main coefficient of interest that gauges the differences in performance betweenrelationship-based and transaction-based loans (SME loans from relationship and transactional banks). Apositive coefficient implies that relationship-based loans have higher delinquencies than transaction-basedloans. This would be in line with theoretical predictions that relationship banks allow for temporary de-linquencies of their customers. The coefficient β1 indicates whether there are more or fewer delinquenciesfor relationship-based (corporate loans) relative to transaction-based loans (SME loans) of transactionalbanks. A positive coefficient would imply that even for transactional banks, relationship lending leadsto more temporary delinquencies. The coefficient β3 measures the difference in performance when bothbanks employ relationship lending (corporate loans from transactional versus relationship banks). No dif-ference here would imply that once both banks rely on relationship lending, differences in performancedisappear.
Controlsi jk consists of loan, firm and bank characteristics. Loan characteristics include contract termssuch as the credit rating at loan initiation (CreditRatingi jk), loan interest rate (InterestRatei jk), the naturallogarithm of one plus the loan amount (LoanAmounti jk), two dummy variables that indicate whetherthe loan is collateralised (Collaterali jk) or has a guarantee (Guaranteei jk), and the natural logarithm of
10
one plus the loan maturity in months (LoanMaturityi jk). Although results in Section 2.3 show that mostcontract terms do not differ across relationship and transactional banks, I still control for them in theregressions. I assume that contract terms are hard information variables that explain the performance ofa loan. Controlling for hard information variables within the same firm ensures that the effect on loanperformance is coming from differences in the importance of relationship lending and thus the use ofunobservable soft information (see, e.g., Keys et al., 2010).19 If an omitted variable bias is driving theresults it will affect relationship and transactional banks in the same way since contract terms do not differacross the two bank types.
To account for observable firm characteristics, I include dummy variables that indicate whether a firm islocated in the capital Yerevan, whether it is associated with the trade or other fields of service industriesand whether the firm is a private firm. Since bank characteristics might also influence bank behaviour,I use indicators of bank size, ownership and average hierarchy for loan approval. Finally, I also includedummy variables that indicate loan location, industry and currency. Definitions of the variables can befound in Table A.1 of Appendix A.
Firm fixed effects, α j, eliminate firm heterogeneity and compositional biases, comparing differences inloan performance within the same firm across different banks. Time of loan origination fixed effects, γt ,are included to control for the timing of loan origination. In some specifications, I also use firm×time fixedeffects (α jt), where time stands for the current period, to account for changes in firm characteristics overtime. Standard errors are always clustered at firm level to control for possible correlations in the residualsacross observations of the same firm.20 In the main regressions, I rely on a linear probability model sincelogit models with a large number of fixed effects suffer from the “incidental parameter problem”.21 Still,in Section 4.4.1 I confirm the main results using a logit model.
19In Section 5 I confirm that relationship lending is indeed associated with higher use of soft information in loan pricing.20In Section 4.4.1 I show that results survive clusters at bank level and double clustering at bank×time and firm levels.21Because of the large number of fixed effects in the model relative to the smaller number of periods for which a borrower
is observed, a non-linear model could give inconsistent estimates; this is known as the “incidental parameter problem” (see, forexample, discussion in Cameron and Trivedi, 2005, pp. 726-727).
11

4 Relationship lending and loan performance
In this section I first show that relationship lending results in temporarily higher delinquencies. Second,I reveal that, given previous delinquencies, relationship banks are not worse off in the long run, are ableto extract rents and continue to lend to firms afterwards. Third, I examine the behaviour of relationshipbanks that enables them to offer liquidity insurance. Lastly, I present several alternative explanations androbustness tests.
4.1 Relationship lending and loan delinquencies
In Chart 2 we have already observed that firms are more likely to become delinquent on relationship-basedrelative to transaction-based loans. Tables 3 and 4 document more formally that temporary delinquen-cies are more likely for relationship-based relative to transactions-based loans (coefficient of “Relation-ship Bank”). Table 3 uses delinquencies for less than 90 days and Table 4 delinquencies over 90 daysas dependent variables for the sub-sample of 621 firms that receive 4,441 loans from both relationshipand transactional banks. Columns (2) of both tables suggest that the same firm is 2.5 (1.6) percentagepoints more likely to become delinquent for less (more) than 90 days on a relationship-based relative toa transaction-based loan. Given an average delinquency rate for less (more) than 90 days of 4.9 per cent(3 per cent) for the sub-sample, the results imply that a firm is around 50 per cent more likely to becometemporary delinquent on a relationship-based loan, an economically meaningful effect.22
In all specifications, I control for loan contract characteristics to isolate the effect of relationship lendingon loan performance from observable hard information variables that explain loan performance.23 To showthe consistency of results, I run a pooled regression with firm characteristics in column (1) to control forhard information variables on borrower level; in columns (2)-(5) I use firm fixed effects to account for anyunobservable firm characteristics and in column (6), I add firm×time fixed effects to additionally controlfor changes in firm characteristics over time. In columns (3)-(5), apart from firm fixed effects, I add loanorigination fixed effects, bank characteristics and other loan characteristics.
Comparing columns (1) and (2) in Tables 3 and 4, it becomes evident that adding firm fixed effects doesnot alter the main coefficient β2, suggesting that the effect is not driven by differences in firm characterist-ics but rather differences in lending technologies (transactional lending versus relationship lending). Evenwhen firm×time fixed effects are added in column (6), the main effect remains significant for delinquen-cies below 90 days but loses its significance for delinquencies above 90 days.24 While loan originationfixed effects in column (3) and other loan characteristics in column (5) do not change the magnitude of themain coefficient, adding bank characteristics in column (4) increases the effect to 3.2 (1.9) in Table 3 (4).Overall, the main coefficient remains statistically significant and similar in size throughout all specifica-tions.
The coefficient of “Corporate Loan” is mostly positive and often significant at the 5 per cent significantlevel. This result indicates that even for transactional banks, delinquencies are more likely for relationship-based loans (corporate loans) relative to transaction-based loans (SME loans). The interaction term “Cor-porate Loan× Relationship Bank” is never significant, implying that there is no difference in performance
22Results continue to hold for a logit model with similar magnitudes of the odds ratios of the main effect (see Section 4.4.1and Table 10).
23Note that results also hold if I exclude endogenous loan characteristics.24For the logit model, however, the effect is significant for both delinquency measures.
12

between corporate loans from transactional versus relationship banks (both relationship-based loans).
Turning to loan characteristics, I find that initial credit ratings have the highest economic effect, being anatural predictor of future loan performance. A one-unit increase in the credit rating is associated with a 18to 39 percentage points lower delinquency rate. Loans that have high interest rates, are collateralised andhave longer maturities are more likely to become delinquent. Higher loan amounts are generally associatedwith higher delinquency rates over 90 days but seem to lead to fewer delinquencies for loans within thesame firm. To consume space, I do not report the coefficients of other control variables. Unreportedresults reveal that most of them are insignificant, except that more hierarchal levels for loan approval havea slightly significant positive effect on delinquencies for less than 90 days, while loans in other serviceindustries experience lower delinquency rates.
All in all, results indicate that relationship lending leads to temporarily higher delinquencies. Von Thadden(1995) and Rajan (1992) suggest that banks might tolerate short-term bad results and thus offer financialflexibility as long as they can extract long-term rents. Banks learn a firm’s quality through monitoring andtherefore do not consider bad short-term results as a sign of bad quality and prematurely terminate goodprojects. In the next section, I explore what happens in the long run.
4.2 Relationship lending and long-term effects
In this section, I examine long-term effects by looking at defaults, recovery rates and losses, as well asreturn on loans when loans mature. If Von Thadden (1995)’s and Rajan (1992)’s theories hold, I shouldnot find differences in loan performance when loans mature, despite temporary higher delinquencies forrelationship-based loans. Knowing the quality of the firms, relationship banks will allow temporary delaysin loan repayment for firms that are not likely to default when loans mature. Still, relationship banks mightextract higher rents through, for example, higher returns on loans in order to be compensated for suchtemporary delinquencies.
Descriptive statistics in Table 2 have already shown that, for the sub-sample, relationship banks havesignificantly higher delinquency rates but not higher default rates (in loss/written-off status) comparedwith transactional banks. In Table 5 I examine only SME loans from relationship and transactional banks,the case when one relies on relationship lending and the other on transactional lending. To account forright-censoring, I select SME loans that are observed until maturity and condition them to have beendelinquent during the loan spell. Since many observations are lost, I present results for both the total andthe sub-sample, also because the effect of higher delinquencies of relationship banks continues to holdfor the total sample (see Section 4.4.1). To measure long-term performance, I calculate loan defaults thatequal one if a loan is in loss or written-off status at maturity, recovery rates that equal one if a loan has hadoverdue payments during the loan spell but did not default at maturity and losses defined as written-offamounts relative to the contract amount. As I do not have a direct measure of written-off amounts, I usethe overdue principal (plus interest rate amount) given delinquencies. Since I am interested in lookingat long-term effects for the two lending technologies, I focus on cross-sectional tests for differences inlong-term performance.
Panel A of Table 5 reports univariate tests of default rates, recovery rates, and losses at the end of theloan spell for SME loans that have been delinquent for less than 90 days. Although SME loans fromrelationship banks seem to default more often after delinquencies for the total sample, the differenceis not highly statistically significant and disappears for the sub-sample. Recovery rates always remaininsignificant for the total sample and sub-sample. Interestingly, the losses in percentage of the contract
13
amount are smaller for relationship than transactional banks, indicating that despite higher delinquencyrates relationship banks are not losing more on average.
Panel B repeats the analysis for SME loans that have been delinquent for more than 90 days. While loandefaults are higher and recovery rates lower for the total sample at 10 per cent significance level only,differences again disappear for the sub-sample. Losses given delinquencies over 90 days do not differ forboth samples. However, the amounts lost are much higher for delinquencies over 90 days than for short-term delinquencies below 90 days, since the former are more likely to turn into actual defaults. Overall,the results indicate that relationship lending does not lead to worse long-term performance at the end of theloan spell, despite higher temporary delinquencies. In unreported regression results, I confirm that resultscontinue to hold when I use regression analysis.
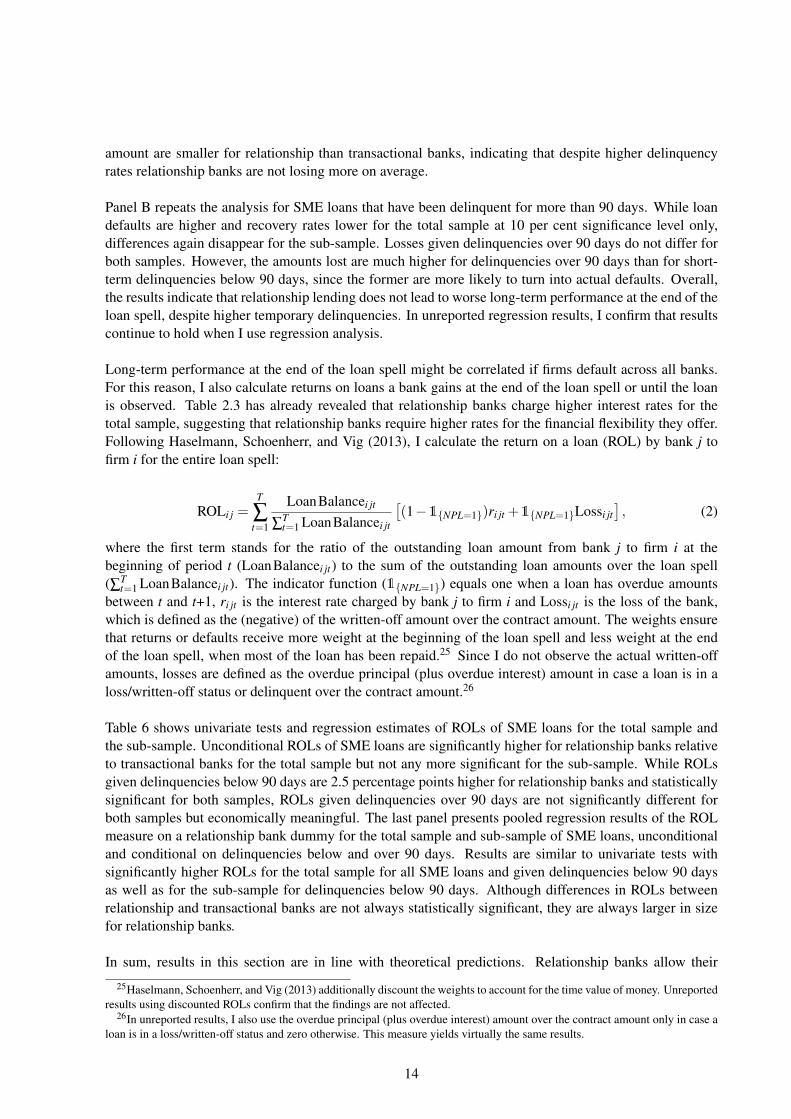
Long-term performance at the end of the loan spell might be correlated if firms default across all banks.For this reason, I also calculate returns on loans a bank gains at the end of the loan spell or until the loanis observed. Table 2.3 has already revealed that relationship banks charge higher interest rates for thetotal sample, suggesting that relationship banks require higher rates for the financial flexibility they offer.Following Haselmann, Schoenherr, and Vig (2013), I calculate the return on a loan (ROL) by bank j tofirm i for the entire loan spell:
ROLi j =T
∑t=1
LoanBalancei jt
∑Tt=1 LoanBalancei jt
[(1−1{NPL=1})ri jt +1{NPL=1}Lossi jt
], (2)
where the first term stands for the ratio of the outstanding loan amount from bank j to firm i at thebeginning of period t (LoanBalancei jt) to the sum of the outstanding loan amounts over the loan spell(∑T
t=1 LoanBalancei jt). The indicator function (1{NPL=1}) equals one when a loan has overdue amountsbetween t and t+1, ri jt is the interest rate charged by bank j to firm i and Lossi jt is the loss of the bank,which is defined as the (negative) of the written-off amount over the contract amount. The weights ensurethat returns or defaults receive more weight at the beginning of the loan spell and less weight at the endof the loan spell, when most of the loan has been repaid.25 Since I do not observe the actual written-offamounts, losses are defined as the overdue principal (plus overdue interest) amount in case a loan is in aloss/written-off status or delinquent over the contract amount.26
Table 6 shows univariate tests and regression estimates of ROLs of SME loans for the total sample andthe sub-sample. Unconditional ROLs of SME loans are significantly higher for relationship banks relativeto transactional banks for the total sample but not any more significant for the sub-sample. While ROLsgiven delinquencies below 90 days are 2.5 percentage points higher for relationship banks and statisticallysignificant for both samples, ROLs given delinquencies over 90 days are not significantly different forboth samples but economically meaningful. The last panel presents pooled regression results of the ROLmeasure on a relationship bank dummy for the total sample and sub-sample of SME loans, unconditionaland conditional on delinquencies below and over 90 days. Results are similar to univariate tests withsignificantly higher ROLs for the total sample for all SME loans and given delinquencies below 90 daysas well as for the sub-sample for delinquencies below 90 days. Although differences in ROLs betweenrelationship and transactional banks are not always statistically significant, they are always larger in sizefor relationship banks.
In sum, results in this section are in line with theoretical predictions. Relationship banks allow their
25Haselmann, Schoenherr, and Vig (2013) additionally discount the weights to account for the time value of money. Unreportedresults using discounted ROLs confirm that the findings are not affected.
26In unreported results, I also use the overdue principal (plus overdue interest) amount over the contract amount only in case aloan is in a loss/written-off status and zero otherwise. This measure yields virtually the same results.
14
customers to become temporarily delinquent yet are able to extract long-term rents, not facing higherdefaults or losses but extracting higher return on loans at maturity. These findings imply that relationshiplending provides a liquidity insurance for firms in distress, offering greater financial flexibility withoutincurring higher losses and earning higher rents. Relationship banks are thus forgiving when it comes totemporary delinquencies but not forgetting, requiring higher rents.
4.3 Relationship lending and bank behaviour
Results in the previous sections suggest that relationship banks must have some superior technology thatallows them to be more flexible and forgiving to their customers. What do relationship banks do differ-ently relative to transactional banks that enables them to offer liquidity insurance? This section tries toanswer this question by examining the distribution of borrowers’ ex-ante riskiness, loan rescheduling anddrawdowns on credit lines and overdrafts as well as the monitoring behaviour of banks.
Differences in borrowers’ ex-ante riskiness might drive the behaviour of relationship banks when firmsare in distress. Relationship banks might be able to offer liquidity insurance to customers simply becausethey have an overall better customer base than transactional banks. In turn, relationship banks mightalso have a worse customer base that makes them adjust their lending behaviour. Therefore, panel A ofTable 7 compares ex-ante non-performance with the bank a firm borrows from (Past NPL Bank), with anybank (Past NPL Any Bank) including the former, and with other banks (Past NPL Other Banks) betweenrelationship and transactional banks on bank-borrower-time and bank-borrower level for the total sampleof firms. Results reveal that customers of relationship banks have a worse performance history with theirrelationship bank relative to customers of transactional banks with their transactional bank. This indicatesthat relationship banks are more likely to continue to lend to firms despite past non-performance, whichis another proof for the insurance function of relationship lending. There are, however, no statisticallysignificant differences in ex-ante loan performance with any bank or other banks for the customer base ofboth bank types. This implies that relationship banks must have some additional unobservable informationabout their clients that allows them to be more lenient and not make losses long term.
Another way to explore the behaviour of relationship banks is to look at loan rescheduling and renegoti-ations. Are relationship banks more likely to roll over loans and renegotiate contract terms when firms arein trouble? Panels B and C of Table 7 show the average percentage of rollover loans within one-month,two-month and three-month windows around the maturity of a loan with less or more than 90-day de-linquencies.27 Rollovers occur, in general, in 1.2 per cent to 2.7 per cent of the cases for both samplesbut there are no highly significant differences between relationship and transactional banks despite higherdelinquencies among SME loans from relationship banks. This suggests that relationship banks do notevade defaults by issuing new loans.
Panels B and C also report the average percentage of increases and decreases in the interest rate, loanamount and loan maturity for the total sample and sub-sample given delinquencies below or above 90days, respectively. In particular, changes in contract terms are measured on loan-time level at the periodand up to three periods after delinquencies and then collapsed to loan level. Relationship banks are morelikely to increase maturities upon delinquencies than transactional banks for both samples. Althoughlengthening maturities might suggest that relationship banks avoid delinquencies, Table 7 also shows thatthey shorten maturities almost as often. They are also more likely to increase or decrease interest rates
27As I do not know for sure whether a loan has been rolled over, I declare a loan to a firm to be a rollover loan if the loan hasbeen non-performing and a new loan has been issued within one, two, or three months before or after the the non-performing loanwith the same bank.
15

for the total sample. This indicates that relationship banks are in general more active in adjusting contractterms upon delinquencies which might help them alleviate the liquidity shortages of firms.
Since firms often have other contracts such as credit lines and overdrafts with banks, relationship banksmight allow firms to draw down on them once in distress, mitigating future defaults. Panel D of Table 7reports whether firms with SME loans and credit lines or overdrafts with the same bank draw down on themupon delinquencies or up to three periods later on loan-time level and then collapsed to loan level. Sincethese restrictions reduce the sample size, I only look at the total sample of SME loans and additionallyreport drawdowns given both delinquency types (less or more than 90 days). Clients of relationship banksdraw down on credit lines or overdrafts in around 37 to 42 per cent of delinquency cases of over or/andbelow 90 days, while clients of transactional banks only in around 23 to 32 per cent of delinquency cases.The differences are large in magnitude but not that significant due to the low number of observations.Conditioning on any overdue payments or overdue days in the last row yields more observations and asimilar difference of 10 per cent that is highly significant. Confirming Von Thadden (1995)’s predictions,relationship banks seem to combine normal contracts with credit lines and overdrafts to allow firms todraw down on them in distressed times.
Since relationship banks do not have an ex-ante different customer base, they must be screening or mon-itoring firms to acquire superior knowledge about their clients. Although I do not directly observe thebehaviour of banks, I have data on the use of the credit registry by banks to request information on firmsfor loan granting and loan monitoring purposes between June 2012 and June 2013. Since the data offerjust the numbers of enquiries on firm level, I focus on firms that received loans either only from relation-ship or transactional banks to be able to disentangle the effect for these two bank types. Table 8 reportsregression results for the number of enquiries for loan monitoring in columns (1)-(3) and loan grantingpurposes in columns (4)-(6) for a sample of 2,737 firms that exclusively borrow either from relationship ortransactional banks and for which data on banks’ use of the credit registry exists. The main independentvariable is the “Relationship Bank Firm” dummy that tests for differences in the use of credit registrybetween the firms that received loans just from relationship relative to transactional banks. To control forfirm heterogeneity, I add firm size measured as the average total outstanding firm debt across banks, pastnon-performance measures with the same bank, any bank and other banks as presented above as well asfirm location, industry and ownership fixed effects. The coefficient of “Relationship Bank Firm” is positiveand significant in columns (1)-(3), suggesting that relationship banks are around 26 to 33 percentage pointsmore likely to inquire the credit registry to monitor firms. For enquiries to the credit registry regardingloan granting, the “Relationship Bank Firm” dummy is never significant and small in size. These resultssuggest that relationship banks are more likely to monitor firms but do not request additional informationwhen granting loans.
In line with Von Thadden (1995)’s theoretical predictions, relationship banks seem to acquire informationabout their clients through monitoring. Not having an ex-ante riskier customer base, relationship bankscontinue to lend to customers that have been delinquent only with them, knowing their inherent qualitybetter than transactional banks. Relationship banks also allow firms to compensate for delinquencies withdrawdowns on credit lines or overdrafts and by adjusting interest rates and maturities but not rolling overloans more often than transactional banks. Overall, results give an indication of how relationship banksbehave differently to transactional banks which constitutes the difference in lending technologies. Section5 additionally confirms that relationship lending is based on the use of soft information about clients.
16
4.4 Alternative explanations
So far, we have established that relationship banks allow their customers to temporarily become delinquentbut do not suffer from higher defaults, and often enjoy higher returns when loans mature. In this sectionI explore whether the effect of relationship lending on delinquencies below 90 days survives alternativeexplanations.28 For all tests in Tables 9 and 10, I use specifications of Table 3 in columns (1) and (2)with firm characteristics and with firm fixed effects. To consume space, Table 10 reports only the maincoefficient of “Relationship Bank” that measures delinquencies of relationship-based versus transaction-based loans as well as its standard error and the number of observations.
First, I investigate whether firms are more likely to delay repayments with relationship banks because thedelayed repayments are small in size. To this extent, I create three ratios that capture the relative sizeof delayed repayments: all measures use the overdue principal and interest rate amount in the numeratorand set it relative to the total loan amount (NPL Amount over Contract Amount), the total outstandingfirm debt with the particular bank in a period (NPL Amount over Bank Exposure) or the total outstandingfirm debt with all banks in a period (NPL Amount over Total Exposure). For each dependent variable, Iuse firm characteristics or firm fixed effects to control for unobserved firm heterogeneity and restrict thesample to loans that have been delinquent for less than 90 days. Results in Table 9 show that there isnever a statistically significant difference of relative overdue amounts for SME loans from transactionaland relationship banks, even within the same firm. This result confirms that higher delinquencies withrelationship banks cannot be explained by smaller delayed repayment amounts.
Second, relationship lending might not be the most important lending technology for a bank such that a 5for “very important” (in the survey) might mean different things to different banks. Therefore, I constructa measure of the importance of relationship lending relative to the importance of other lending technolo-gies (fundamental, private and business collateral) by loan type. For all transactional banks the relativeimportance of relationship lending is always higher for corporate than for SME loans. The importance ofrelationship lending stays constant across loan types for only four out of nine relationship banks and isalways higher compared with transactional banks. Row “Alternative relationship lending” in Table 10 re-veals that for the reduced sample of banks the main result continues to hold, although somewhat reduced inmagnitude and significance. Still, the relationship lending measure might simply capture relationship vari-ables used in the previous literature. In row “Relationship variables” I therefore add relationship variablesto the main regressions such as the natural logarithm of one plus the bank-firm relationship in months, adummy variable that equals one if a firm has more than 50 per cent of its outstanding debt with a bank,and a dummy variable that equals one if a firm has other products with the bank (for example, credit lines,factoring, guarantees). Although, in unreported results, the dummy variable for the main bank of a firmsignificantly lowers delinquencies below 90 days, the positive effect of relationship lending on loan per-formance is not affected. This finding confirms that the relationship lending measure captures somethingbeyond typical relationship lending proxies, most likely the use of firms’ unobserved soft information.
Third, the main results in Tables 3 and 4 rely on a sub-sample of firms that receive loans from bothrelationship and transactional banks. Since results might suffer from a selection bias, in row “Full/OppositeSample” in Table 10 I estimate specification (1) of Table 3 with firm characteristics for the full sampleof 6,649 firms and 19,332 loans in column “Table 3, specification (1)” and for the opposite sample of6,028 firms that receive 14,891 loans from either relationship or transactional banks only in “Table 3,specification (2)”. The effect is smaller in magnitude (2.0 and 1.6 percentage points for the full andopposite sample) but remains highly statistically significant, suggesting that the main result is not restricted
28In unreported results, I confirm that alternative explanations also hold when I use logit models instead or delinquencies over90 days as the dependent variable.
17

to the sub-sample.
4.4.1 Additional robustness tests
Apart from alternative explanations, I also explore a battery of additional robustness tests in Table 10.29
Panel B of Table 10 reports results for alternative non-performance measures, namely “Non-Performance”that equals one if a loan has any overdue payments or overdue days and zero otherwise as well as “Non-Performance 180” that equals one if a loan becomes delinquent for more than 180 days and zero otherwise.While there is no systematically significant effect of relationship lending on loan performance with firmcharacteristics, I find statistically significant effects with firm fixed effects that are similar in magnituderelative to their average values. The same firm is around 40 per cent and 56 per cent more likely to becomedelinquent on any payments and for more than 180 days on a relationship-based loan, respectively.
In panel C of Table 10, I test for different loan characteristics. When splitting loans into local currency andUS dollar loans in rows “Local currency loans” and “US dollar loans” the effect becomes stronger for USdollars and loses significance and magnitude for local currency loans. This suggests that either relationshipbanks offer more flexibility in US dollars based on their dollar-denominated funding structure or that firmshave more problems repaying US dollar denominated loans, having less income in US dollars. Whensplitting loans issued before and after 2011 in rows “Loans between January 2009-2011” and “Loans afterJanuary 2011”, the effect remains significant for loans after 2011, but is somewhat reduced in significancefor loans between January 2009-2011. This might be due to the reduced number of observations and thusless statistical power.
In row “W/o loans 50%” of panel C, I exclude loans outside a range of 50 per cent around the loan amountthreshold that determines SME and corporate loans. I assume that, for transactional banks, the change fromtransaction-based to relationship lending does not switch from one to the other exactly at the threshold buthappens gradually with larger loan amounts. This implies that differences in lending techniques betweenrelationship and transactional banks should be stronger further away from the threshold. As expected, themain effect continues to hold.
Panel D of Table 10 investigates different firm characteristics. In particular, I examine whether relation-ship banks are particularly helpful for firms in more opaque industries. Therefore, I distinguish betweenthe main industries in Armenia such as trade, manufacturing and construction as well as other fields ofservices and other industries. While the positive effect of relationship-based lending on delinquenciesdisappears for more transparent industries in rows “Trade, manufacturing, construction” and “Other in-dustries”, the effect increases to 3.3 and 3.6 percentage points in row “Other fields of services”, a moreopaque industry. In rows “New customers” and “Old customers”, I distinguish between loans to new cus-tomers of a bank and customers with which a bank has had a previous relationship. Relationship banksare more likely to know these old customers better and thus be more lenient towards them. In line withthis prediction, the main effect increases to 2.7 percentage points for old customers but becomes almostcompletely insignificant for new customers.
The last panel E of Table 10 compares different estimation techniques. In row “Logit model”, I estimate alogit model instead of a linear probability model for the benchmark specifications and confirm that resultshold. In row “Matching on firm and loan amount”, I rely on a matching technique similar to Ioannidou
29In unreported results, I confirm that robustness tests also hold when I use logit models instead or delinquencies over 90 daysas the dependent variable.
18

and Ongena (2010) and Beck et al. (2014b). Since matching is a nonparametric estimation technique,it does not impose a functional form on the relationship between matching variables and the dependentvariable. In particular, I match SME loans from relationship and transactional banks to the same firm fromthe sub-sample of 4,441 loans and 10,656 loan-time observations. Then I match on differences in loanamounts between SME loans from relationship and transactional banks, conditioning them to be in 0.5or 0.25 standard deviations of the average loan amount of SME loans from the two bank types. In row“Matching on firm and loan char.”, I additionally match on differences in interest rates, maturity and creditratings in the same way and exact matching of collateralised and non-collateralised loans. Specifications(1) and (2) in Table 10 correspond to a 0.5 and 0.25 standard deviation radius for each of the matchingvariables. While matching on firm and loan amounts yields similar results as for the main regressionwith a 2.6 percentage points effect, matching on more variables increases the positive effect to 4.3 and6.2 percentage points, yet only significant in the former case which might be due to the small number ofobservations in the latter case. In the last two rows of Table 10, I implement clusters at bank level anddouble clustering at bank×time and firm level to account for the fact that observations within a bank andtime period might be correlated. Although standard errors increase, the main effect remains significant.
19

5 Relationship lending and information use
Since the measure of relationship lending is new to the literature and relies on survey responses, thissection shows that it captures the use of soft information when pricing loans. Similar to Rajan, Seru, andVig (2014) and Skrastins and Vig (2014), I assume that in a state with just hard information and no softinformation available, hard information variables will perfectly predict the loan interest rate. In a statewith additional soft information, hard information variables will not be able to completely explain interestrates and the unexplained part becomes a measure of soft information.
For the analysis, I use a regression model with multiplicative heteroskcedasticity introduced by Harvey(1976) and applied to banking by Cerqueiro, Degryse, and Ongena (2011). The model estimates meaneffects on the interest rate and the determinants of the residual variance in interest rates. The modelconsists of an equation for the mean of interest rates, and a second one for the residual variance of interestrates:30
LoanSpreadi jk = θ’Controlsi jk +α j + εi jk, (3)
Log(σv2i jk) = α0 +δ1CorporateLoani jk
+δ2RelationshipBankk
+δ3CorporateLoani jk×RelationshipBankk, (4)
where i, j, k index loans, firms, and banks. Note that different from equation (1) I only use informationat loan initiation such that each loan appears only once in the data set. The LoanSpreadi jk equals theloan interest rate minus the refinancing rate of the Armenian banks with the Armenian Central Bank.Log(σv2i jk) stands for the natural logarithm of the residual variance of the loan spread. The other variablesare defined as in equation (1). By including loan contract terms as well as firm fixed effects, I control forall hard information variables that explain the variation in interest rates for the same firm. The remainingunexplained variation should capture the use of soft information. A positive effect on the variance ofthe unexplained part means that the variance increases, hard information variables are less predictive ofinterest rates and more soft information is used and vice versa for a negative effect. The coefficient δ2estimates the effect of relationship lending on the variation in interest rates (soft information use) relativeto transactional lending (SME loans from relationship versus transactional banks).
Since I am interested in the effect of relationship lending on the variation in interest rates, Table 11 onlyshows estimation results of the variance equation (4), where the columns correspond to the specificationsof the columns in Table 3. Results on mean equation (3) are available upon request. All specificationsin 11 reveal a positive effect of relationship lending on the variation in interest rates (SME loans fromrelationship banks). Relationship lending increases the unexplained part of interest rates and leads to moreuse of soft information relative to transactional lending.
30A more detailed description of the methodology can be found in the Appendix A.
20

6 Conclusions
Although the empirical literature on relationship lending is quite extensive, little is known about the beha-viour of banks when firms are in distress. Combining survey data on banks’ lending policies with uniquecredit registry data, this paper fills this gap by examining the effect of relationship lending on ex-post loanperformance. In line with Von Thadden (1995) and Rajan (1992), I find that relationship banks toleratetemporary delinquencies without facing higher defaults and earning higher rents in the long run. Whenfirms are in distress, relationship banks adjust contract terms and offer drawdowns on credit lines andoverdrafts but do not inefficiently roll over loans. Moreover, relationship banks are more likely to continueto lend to firms after past non-performance. The paper presents a new channel of how relationship lendingserves as a liquidity insurance for firms in distress, offering greater financial flexibility and better accessto finance.
The findings of the paper have several broader implications. Relying on soft information, relationshiplending constitutes a critical tool to target SMEs which are the backbone of most economies.31 Thispaper shows that relationship lending is especially beneficial when firms experience liquidity shortages.In the long run, firms will thus have longer investment horizons which should lead to more investments,employment and economic growth. From a financial stability perspective, relationship lending appears tobe an efficient lending technique to help firms in need without incurring higher losses for banks. Finally,the results might also be useful for other markets such as the labour market or insurance market in whichclose relationships help reduce existing information asymmetries.
31According to the website of the Global Alliance of SMEs, SMEs have provided nearly 50 per cent of jobs in most countries(53 per cent in the United States and 78 per cent in Germany) and account for 75 per cent and 39 per cent of GDP in Germanyand the United States (Global Alliance of SMEs, 2014).
21

References
S. Agarwal and R. Hauswald (2010), “Distance and private information in lending”, Review of FinancialStudies, 23(7), 2757–2788.
F. Allen (1990), “The market for information and the origin of financial intermediation”, Journal of Fin-ancial Intermediation, 1(1), 3–30.
L. Baele, M. Farooq, and S. Ongena (2014), “Of religion and redemption: Evidence from default onIslamic loans”, Journal of Banking & Finance, 44, 141–159.
T. Beck, H. Degryse, R. De Haas, and N. van Horen (2014a), “When arm’s length is too far. Relationshipbanking over the business cycle”, EBRD Working Paper No. 169.
T. Beck, V. Ioannidou, and L. Schaefer (2014b), “Foreigners vs. Natives: Bank lending technologies andloan pricing”, Working Paper Series Cass Business School No. 28.
T. Berg (2015), “Playing the devil’s advocate: The causal effect of risk management on loan quality”,Review of Financial Studies, forthcoming.
A. N. Berger and G. F. Udell (1995), “Relationship lending and lines of credit in small firm finance”,Journal of Business, 68(3), 351–381.
M. Berlin and L. J. Mester (1999), “Deposits and relationship lending”, Review of Financial Studies, 12(3),579–607.
S. T. Bharath, S. Dahiya, A. Saunders, and A. Srinivasan (2011), “Lending relationships and loan contractterms”, Review of Financial Studies, 24(4), 1141–1203.
P. Bolton, X. Freixas, L. Gambacorta, and P. E. Mistrulli (2013), “Relationship and transaction lending ina crisis”, NBER Working Paper 19467.
A. W. Boot (2000), “Relationship banking: What do we know?”, Journal of Financial Intermediation,9(1), 7–25.
A. W. Boot and A. V. Thakor (1994), “Moral hazard and secured lending in an infinitely repeated creditmarket game”, International Economic Review, 35(4), 899–920.
A. C. Cameron and P. K. Trivedi (2005), Microeconometrics: methods and applications, Cambridge Uni-versity Press.
CBA (2014), “Financial Stability Report 2013”, Tech. rep., Central Bank of The Republic of Armenia.
G. Cerqueiro, H. Degryse, and S. Ongena (2011), “Rules versus discretion in loan rate setting”, Journal ofFinancial Intermediation, 20(4), 503–529.
A. De la Torre, M. S. Martınez Perıa, and S. L. Schmukler (2010), “Bank involvement with SMEs: Beyondrelationship lending”, Journal of Banking & Finance, 34(9), 2280–2293.
H. Degryse, M. Kim, and S. Ongena (2009), Microeconometrics of banking: Methods, applications, andresults, Oxford University Press.
H. Degryse and S. Ongena (2005), “Distance, lending relationships, and competition”, Journal of Finance,60(1), 231–266.
D. W. Diamond (1984), “Financial intermediation and delegated monitoring”, Review of Economic Studies,51(3), 393–414.
J. DiNardo and D. S. Lee (2004), “Economic impacts of unionization on private sector employers: 1984-2001”, Tech. rep., National Bureau of Economic Research.
22

R. Elsas and J. P. Krahnen (1998), “Is relationship lending special? Evidence from credit-file data inGermany”, Journal of Banking & Finance, 22(10), 1283–1316.
R. Fahlenbrach, R. Prilmeier, and R. M. Stulz (2012), “This time is the same: Using bank performancein 1998 to explain bank performance during the recent financial crisis”, Journal of Finance, 67(6),2139–2185.
M. J. Garmaise and G. Natividad (2015), “Spillovers in local banking markets”, Working Paper New YorkUniversity.
G. Global Alliance of SMEs (2014), “Four global experience to support SME development, available athttp://www.globalsmes.org”.
D. Harhoff and T. Korting (1998), “Lending relationships in Germany – Empirical evidence from surveydata”, Journal of Banking & Finance, 22(10), 1317–1353.
A. C. Harvey (1976), “Estimating regression models with multiplicative heteroscedasticity”, Economet-rica: Journal of the Econometric Society, 44(3), 461–465.
R. Haselmann, D. Schoenherr, and V. Vig (2013), “Lending in social networks”, Working Paper LondonBusiness School.
IFC (2013), “Verifying accuracy of IFC’s SME measurement”, World Bank and International FinanceCorporation.
V. Ioannidou and S. Ongena (2010), “Time for a change: Loan conditions and bank behavior when firmsswitch banks”, Journal of Finance, 65(5), 1847–1877.
B. J. Keys, T. K. Mukherjee, A. Seru, and V. Vig (2010), “Did securitization lead to lax screening? Evid-ence from subprime loans”, Quarterly Journal of Economics, 125(1), 307–362.
V. Kysucky and L. Norden (2015), “The benefits of relationship lending in a cross-country context: Ameta-analysis”, Management Science, articles in advance.
D. S. Lee (2008), “Randomized experiments from non-random selection in US House elections”, Journalof Econometrics, 142(2), 675–697.
Y. Li, R. Lu, and A. Srinivasan (2013), “Relationship bank behavior during borrower distress”, WorkingPaper, Available at SSRN: http://ssrn.com/abstract=1773069.
J. M. Liberti and A. R. Mian (2009), “Estimating the effect of hierarchies on information use”, Review ofFinancial Studies, 22(10), 4057–4090.
A. Machauer and M. Weber (1998), “Bank behavior based on internal credit ratings of borrowers”, Journalof Banking & Finance, 22(10), 1355–1383.
J. McCrary (2008), “Manipulation of the running variable in the regression discontinuity design: A densitytest”, Journal of Econometrics, 142(2), 698–714.
P. Morales (2014), “Strategic choice of delinquencies under firm liquidity constraints”, Working Paper,Tilburg University.
M. A. Petersen and R. G. Rajan (1994), “The benefits of lending relationships: Evidence from smallbusiness data”, Journal of Finance, 49(1), 3–37.
M. A. Petersen and R. G. Rajan (1995), “The effect of credit market competition on lending relationships”,Quarterly Journal of Economics, 407–443.
M. Puri, J. Rocholl, and S. Steffen (2013), “What kinds of bank-client relationships matter in reducingloan defaults and why?”, Working Paper, Available at SSRN: http://ssrn.com/abstract=1572673.
23

R. G. Rajan (1992), “Insiders and outsiders: The choice between informed and arm’s-length debt”, Journalof Finance, 47(4), 1367–1400.
U. Rajan, A. Seru, and V. Vig (2014), “The failure of models that predict failure: Distance, incentives anddefaults”, Journal of Financial Economics, forthcoming.
R. T. Ramakrishnan and A. V. Thakor (1984), “Information reliability and a theory of financial intermedi-ation”, Review of Economic Studies, 51(3), 415–432.
A. Schoar (2014), “The personal side of relationship banking”, Working Paper MIT.
S. A. Sharpe (1990), “Asymmetric information, bank lending, and implicit contracts: A stylized model ofcustomer relationships”, Journal of Finance, 45(4), 1069–1087.
J. Skrastins and V. Vig (2014), “How organizational hierarchy affects information production”, WorkingPaper London Business School.
SME DNC (2010), “Reference Book: Small and Medium Entrepreneurship Sector in Armenia 2007-2009”, Small and Medium Entrepreneurship Development National Center of Armenia.
J. C. Stein (2002), “Information production and capital allocation: Decentralized versus hierarchicalfirms”, The Journal of Finance, 57(5), 1891–1921.
W. van der Klaauw (2002), “Estimating the effect of financial aid offers on college enrollment: Aregression-discontinuity approach”, International Economic Review, 43(4), 1249–1287.
E.-L. Von Thadden (1995), “Long-term contracts, short-term investment and monitoring”, Review of Eco-nomic Studies, 62(4), 557–575.
World Bank (2011), “Armenia: Country Profile, Enterprise Survey: Running a business in Armenia”,World Bank and International Finance Corporation, Rev. 7.
World Bank (2014), “Country Program Snapshot”, World Bank and IFC.
24

Tabl
e1:
Ban
kle
veld
escr
iptiv
est
atis
tics
Ban
kID
Ban
kTy
peR
elat
ions
hip
Len
ding
Ave
rage
Hie
rarc
hy
Rel
atio
nshi
p
Len
ding
Ave
rage
Hie
rarc
hy
Ave
rage
Thr
esho
ld(U
S$)
Shar
ein
Num
bero
f
Loa
ns(%
)
Shar
ein
Val
ueof
Loa
ns(%
)
Bor
row
er
Size
Ban
kSi
zeFo
reig
n
Cor
pora
teL
oan
Loa
nSM
EL
oans
Cor
pora
teL
oans
Cor
pora
teL
oan
Cor
pora
teL
oan
38Tr
ansa
ctio
nal
32
52
2,75
1,48
60.
027
0.02
91,
727,
395
Smal
l0
59Tr
ansa
ctio
nal
42
52
1,50
0,00
00.
065
0.21
63,
033,
712
Big
0
70R
elat
ions
hip
51
51
518,
444
0.06
10.
041
1,06
79,6
9M
ediu
m0
219
Tran
sact
iona
l4
35
116
6,63
90.
076
0.03
252
9,07
8M
ediu
m0
274
Rel
atio
nshi
p5
25
383
7,30
10.
054
0.03
646
6,30
9M
ediu
m1
457
Tran
sact
iona
l4
25
32,
751,
486
0.08
90.
136
2,13
3,70
1B
ig0
470
Tran
sact
iona
l4
35
350
0,00
00.
169
0.06
772
1,98
4M
ediu
m0
520
Rel
atio
nshi
p5
25
11,
000,
000
0.03
70.
108
3,75
6,65
5B
ig0
523
Rel
atio
nshi
p5
25
21,
355,
530.
025
0.01
71,
211,
437
Med
ium
0
662
Rel
atio
nshi
p5
15
250
0,00
00.
137
0.06
831
3,30
1B
ig0
702
Rel
atio
nshi
p5
15
127
1,10
60.
122
0.05
579
0,89
9M
ediu
m0
772
Tran
sact
iona
l4
15
366
1,56
80.
026
0.02
41,
833,
290
Smal
l0
776
Rel
atio
nshi
p5
35
330
0,00
00.
040
0.02
81,
748,
996
Smal
l1
798
Rel
atio
nshi
p5
25
220
0,00
00.
037
0.02
91,
319,
247
Smal
l0
995
Rel
atio
nshi
p5
55
550
0,00
00.
035
0.11
22,
471,
792
Big
1
Not
e:T
heTa
ble
repo
rts
bank
leve
lsum
mar
yst
atis
tics
for1
5A
rmen
ian
bank
son
the
impo
rtan
ceof
rela
tions
hip
lend
ing
and
the
aver
age
num
bero
fhie
rarc
hica
llay
ers
forl
oan
appr
oval
bylo
anty
pe,t
heav
erag
elo
anam
ount
thre
shol
din
US$
,the
mar
kets
hare
inte
rms
oflo
annu
mbe
ran
dlo
anva
lue,
the
aver
age
borr
ower
size
base
don
the
tota
lbor
row
ing
amou
ntac
ross
allb
anks
inU
S$be
twee
nJa
nuar
y20
09an
dJu
ne20
13as
wel
las
bank
size
base
don
tota
lass
ets
asof
2009
and
fore
ign
owne
rshi
pth
ateq
uals
one
ifm
ore
that
50pe
rcen
tofe
quity
isfo
reig
n-ow
ned.
25
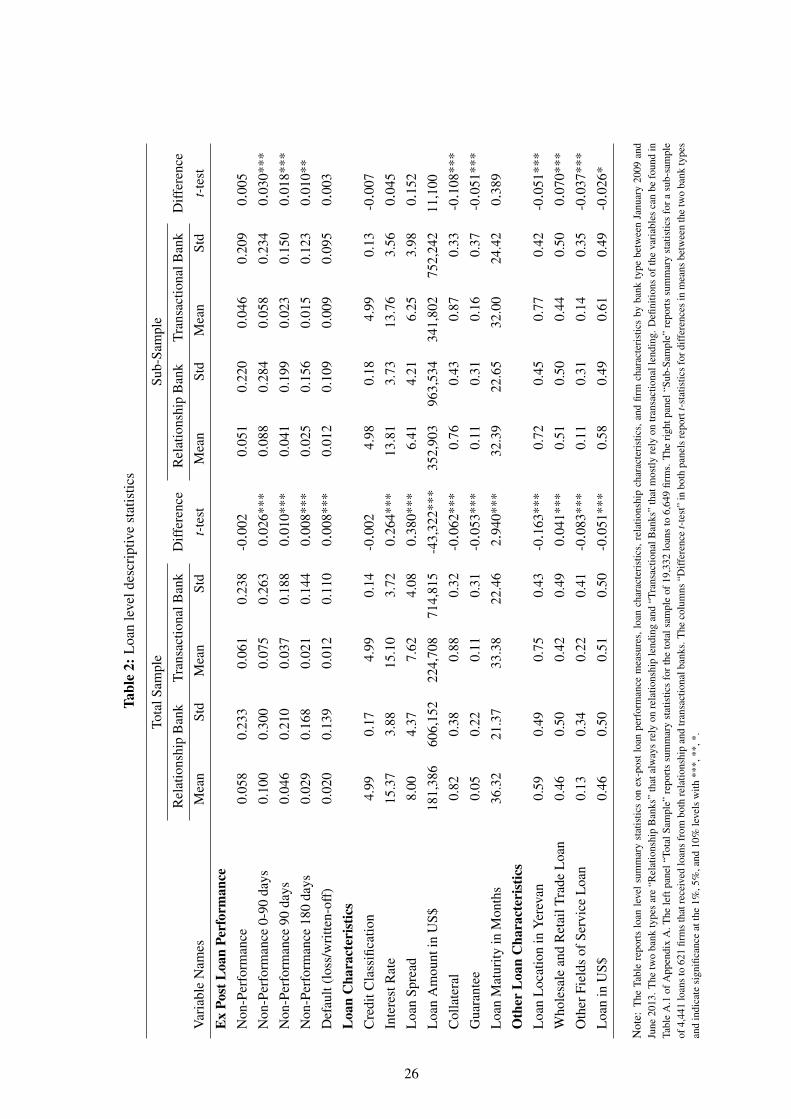
Tabl
e2:
Loa
nle
veld
escr
iptiv
est
atis
tics
Cor
pora
teL
oan
Tota
lSam
ple
Sub-
Sam
ple
Cor
pora
teL
oan
Rel
atio
nshi
pB
ank
Tran
sact
iona
lBan
kD
iffer
ence
Rel
atio
nshi
pB
ank
Tran
sact
iona
lBan
kD
iffer
ence
Var
iabl
eN
ames
Mea
nSt
dM
ean
Std
t-te
stM
ean
Std
Mea
nSt
dt-
test
Ex
Post
Loa
nPe
rfor
man
ceN
on-P
erfo
rman
ce0.
058
0.23
30.
061
0.23
8-0
.002
0.05
10.
220
0.04
60.
209
0.00
5
Non
-Per
form
ance
0-90
days
0.10
00.
300
0.07
50.
263
0.02
6***
0.08
80.
284
0.05
80.
234
0.03
0***
Non
-Per
form
ance
90da
ys0.
046
0.21
00.
037
0.18
80.
010*
**0.
041
0.19
90.
023
0.15
00.
018*
**
Non
-Per
form
ance
180
days
0.02
90.
168
0.02
10.
144
0.00
8***
0.02
50.
156
0.01
50.
123
0.01
0**
Def
ault
(los
s/w
ritte
n-of
f)0.
020
0.13
90.
012
0.11
00.
008*
**0.
012
0.10
90.
009
0.09
50.
003
Loa
nC
hara
cter
istic
sC
redi
tCla
ssifi
catio
n4.
990.
174.
990.
14-0
.002
4.98
0.18
4.99
0.13
-0.0
07
Inte
rest
Rat
e15
.37
3.88
15.1
03.
720.
264*
**13
.81
3.73
13.7
63.
560.
045
Loa
nSp
read
8.00
4.37
7.62
4.08
0.38
0***
6.41
4.21
6.25
3.98
0.15
2
Loa
nA
mou
ntin
US$
181,
386
606,
152
224,
708
714,
815
-43,
322*
**35
2,90
396
3,53
434
1,80
275
2,24
211
,100
***
Col
late
ral
0.82
0.38
0.88
0.32
-0.0
62**
*0.
760.
430.
870.
33-0
.108
***
Gua
rant
ee0.
050.
220.
110.
31-0
.053
***
0.11
0.31
0.16
0.37
-0.0
51**
*
Loa
nM
atur
ityin
Mon
ths
36.3
221
.37
33.3
822
.46
2.94
0***
32.3
922
.65
32.0
024
.42
0.38
9
Oth
erL
oan
Cha
ract
eris
tics
Loa
nL
ocat
ion
inY
erev
an0.
590.
490.
750.
43-0
.163
***
0.72
0.45
0.77
0.42
-0.0
51**
*
Who
lesa
lean
dR
etai
lTra
deL
oan
0.46
0.50
0.42
0.49
0.04
1***
0.51
0.50
0.44
0.50
0.07
0***
Oth
erFi
elds
ofSe
rvic
eL
oan
0.13
0.34
0.22
0.41
-0.0
83**
*0.
110.
310.
140.
35-0
.037
***
Loa
nin
US$
0.46
0.50
0.51
0.50
-0.0
51**
*0.
580.
490.
610.
49-0
.026
*
Not
e:T
heTa
ble
repo
rts
loan
leve
lsum
mar
yst
atis
tics
onex
-pos
tloa
npe
rfor
man
cem
easu
res,
loan
char
acte
rist
ics,
rela
tions
hip
char
acte
rist
ics,
and
firm
char
acte
rist
ics
byba
nkty
pebe
twee
nJa
nuar
y20
09an
dJu
ne20
13.T
hetw
oba
nkty
pes
are
“Rel
atio
nshi
pB
anks
”th
atal
way
sre
lyon
rela
tions
hip
lend
ing
and
“Tra
nsac
tiona
lBan
ks”
that
mos
tlyre
lyon
tran
sact
iona
llen
ding
.Defi
nitio
nsof
the
vari
able
sca
nbe
foun
din
Tabl
eA
.1of
App
endi
xA
.The
left
pane
l“To
talS
ampl
e”re
port
ssu
mm
ary
stat
istic
sfo
rthe
tota
lsam
ple
of19
,332
loan
sto
6,64
9fir
ms.
The
righ
tpan
el“S
ub-S
ampl
e”re
port
ssu
mm
ary
stat
istic
sfo
rasu
b-sa
mpl
eof
4,44
1lo
ans
to62
1fir
ms
that
rece
ived
loan
sfr
ombo
thre
latio
nshi
pan
dtr
ansa
ctio
nalb
anks
.The
colu
mns
“Diff
eren
cet-
test
”in
both
pane
lsre
port
t-st
atis
tics
ford
iffer
ence
sin
mea
nsbe
twee
nth
etw
oba
nkty
pes
and
indi
cate
sign
ifica
nce
atth
e1%
,5%
,and
10%
leve
lsw
ith**
*,**
,*.
26

Tabl
e2
(con
tinue
d):L
oan
leve
ldes
crip
tive
stat
istic
s
Thi
sTa
ble
repo
rts
loan
leve
lsum
mar
yst
atis
tics
onex
-pos
tloa
npe
rfor
man
cem
easu
res,
loan
char
acte
rist
ics,
rela
tions
hip
char
acte
rist
ics,
and
borr
ower
char
acte
rist
ics
byba
nkty
pebe
twee
nJa
nuar
y20
09an
dJu
ne20
13.
Cor
pora
teL
oan
Tota
lSam
ple
Sub-
Sam
ple
Cor
pora
teL
oan
Rel
atio
nshi
pB
ank
Tran
sact
iona
lBan
kD
iffer
ence
Rel
atio
nshi
pB
ank
Tran
sact
iona
lBan
kD
iffer
ence
Var
iabl
eN
ames
Mea
nSt
dM
ean
Std
t-te
stM
ean
Std
Mea
nSt
dt-
test
Rel
atio
nshi
pC
hara
cter
istic
sR
elat
ions
hip
inM
onth
s15
.63
18.1
615
.92
17.6
5-0
.291
17.4
319
.27
16.2
217
.27
1.21
1**
Scop
e0.
180.
380.
240.
43-0
.062
***
0.30
0.46
0.31
0.46
-0.0
12
Prim
ary
Ban
k0.
930.
260.
900.
300.
032*
**0.
790.
410.
740.
440.
049*
**
Num
bero
fRel
atio
nshi
ps1.
931.
391.
941.
47-0
.012
3.41
2.08
3.24
2.01
0.17
6***
Mul
tiple
Rel
atio
nshi
ps0.
530.
500.
510.
500.
025*
**1
01
00
Firm
Cha
ract
eris
tics
Firm
Loc
atio
nin
Yer
evan
0.59
0.49
0.75
0.43
-0.1
63**
*0.
720.
450.
770.
42-0
.051
***
Who
lesa
leR
etai
lTra
deIn
dust
ry
Firm
0.23
0.42
0.16
0.36
0.07
5***
0.24
0.43
0.18
0.39
0.05
7***
Oth
erFi
elds
ofSe
rvic
eIn
dust
ry
Firm
0.54
0.50
0.63
0.48
-0.0
87**
*0.
540.
500.
600.
49-0
.057
***
Priv
ate
Firm
0.54
0.50
0.65
0.48
-0.1
04**
*0.
530.
500.
610.
49-0
.076
***
Obs
erva
tions
10,5
988,
734
19,3
322,
151
2,29
04,
441
27

Table 3: Relationship lending and loan performance (NPL 0-90 days)
Corporate Loan (1) (2) (3) (4) (5) (6)
Bank Lending TechnologiesCorporate Loan 0.014 0.029** 0.026* 0.029** 0.029** 0.019
Corporate Loan (0.016) (0.013) (0.013) (0.013) (0.013) (0.019)
Relationship Bank 0.025*** 0.025*** 0.025*** 0.032*** 0.024*** 0.027**
Corporate Loan (0.009) (0.008) (0.008) (0.012) (0.009) (0.013)
Corporate Loan × Relationship Bank 0.021 -0.004 -0.001 -0.009 -0.004 0.001
Corporate Loan (0.021) (0.017) (0.017) (0.017) (0.017) (0.020)
Loan CharacteristicsCredit Rating -0.191*** -0.178*** -0.178*** -0.175*** -0.182*** -0.091
Corporate Loan (0.061) (0.062) (0.062) (0.062) (0.062) (0.154)
Credit Interest Rate 0.005*** 0.002 0.003* 0.001 0.003 0.008*
Corporate Loan (0.002) (0.002) (0.002) (0.002) (0.002) (0.004)
Loan Amount 0.004 -0.002 -0.001 -0.003 -0.003 0.008
Corporate Loan (0.004) (0.004) (0.004) (0.004) (0.004) (0.006)
Collateral 0.029*** 0.015 0.012 0.015 0.018* -0.001
Corporate Loan (0.009) (0.010) (0.012) (0.011) (0.010) (0.023)
Guarantee 0.006 0.001 -0.001 -0.001 0.003 -0.036
Corporate Loan (0.017) (0.025) (0.025) (0.026) (0.025) (0.023)
Maturity 0.016*** 0.013** 0.015** 0.013** 0.012** 0.002
Corporate Loan (0.006) (0.006) (0.006) (0.006) (0.006) (0.007)
Firm Characteristics Yes No No No No No
Bank Characteristics No No No Yes No No
Other Loan Characteristics No No No No Yes No
Firm Fixed Effects No Yes Yes Yes Yes No
Loan Origination Fixed Effects No No Yes No No No
Firm×Time Fixed Effects No No No No No Yes
Constant 0.786** 0.866*** 0.812*** 0.844*** 0.865*** 0.292
Corporate Loan (0.316) (0.320) (0.313) (0.320) (0.322) (0.797)
R2 0.044 0.293 0.294 0.293 0.294 0.633
Observations (Loan-Time Level) 10,656 10,656 10,656 10,656 10,656 3,790
Note: The Table reports regression results from a linear probability model for a sub-sample of 10,656 loan-time observations of 4,441 loans to621 firms that received loans from both relationship and transactional banks between January 2009 and June 2013. The dependent variable isLoanPerformancei jkt that equals one when a loan is delinquent for less than 90 days. The main independent variable is “Relationship Bank” whichmeasures the performance of relationship-based relative to transaction-based loans, that is, SME loans from relationship versus transactional banks(the reference group). “Corporate Loan” measures the differences between SME and corporate loans from transactional banks (transactions-based versus relationship-based loans), while “Corporate Loan × Relationship Bank” measures the differences between corporate loans fromtransactional and relationship banks (when both rely on relationship lending). Column (1) reports results with loan characteristics and firmcharacteristics. In columns (2)-(5) firm fixed effects are added. Column (3) adds loan origination fixed effects, column (4) bank characteristics,and column (5) other loan characteristics. Column (6) introduces firm×time fixed effect. The sample reduces to 3,790 loan-time observations of1,952 loans to 318 firm that received loans from both bank types in each six-month period. Definitions of the variables can be found in Table A.1of Appendix A. Standard errors are clustered at firm level and presented in parenthesis. ***, **, and * indicate significance at the 1%, 5%, and10%.
28

Table 4: Relationship lending and loan performance (NPL 90 days)
Corporate Loan Corporate Loan (1) (2) (3) (4) (5) (6)
Bank Lending TechnologiesCorporate Loan 0.016 0.022** 0.021** 0.020** 0.022** -0.001
Corporate Loan (0.017) (0.010) (0.009) (0.010) (0.010) (0.009)
Relationship Bank 0.016*** 0.016*** 0.016*** 0.019*** 0.015*** 0.012
Corporate Loan (0.006) (0.005) (0.005) (0.007) (0.005) (0.007)
Corporate Loan × Relationship Bank -0.012 -0.021* -0.021* -0.022* -0.020* 0.000
Corporate Loan (0.023) (0.011) (0.011) (0.012) (0.011) (0.013)
Loan CharacteristicsCredit Rating -0.388*** -0.206*** -0.208*** -0.206*** -0.209*** -0.146***
Corporate Loan (0.037) (0.044) (0.044) (0.044) (0.045) (0.039)
Credit Interest Rate 0.004*** -0.000 0.001 0.000 0.001 0.002
Corporate Loan (0.001) (0.001) (0.001) (0.001) (0.001) (0.002)
Loan Amount 0.007** -0.003* -0.003* -0.003 -0.003** 0.000
Corporate Loan (0.003) (0.002) (0.002) (0.002) (0.002) (0.001)
Collateral 0.021** 0.019** 0.018*** 0.020*** 0.020*** 0.016
Corporate Loan (0.009) (0.007) (0.006) (0.007) (0.008) (0.013)
Guarantee -0.002 0.003 0.003 0.004 0.004 -0.007
Corporate Loan (0.008) (0.008) (0.008) (0.008) (0.008) (0.011)
Maturity 0.002 0.005* 0.005* 0.006** 0.005 0.003
Corporate Loan (0.005) (0.003) (0.003) (0.003) (0.003) (0.005)
Firm Characteristics Yes No No No No No
Bank Characteristics No No No Yes No No
Other Loan Characteristics No No No No Yes No
Firm Fixed Effects No Yes Yes Yes Yes No
Loan Origination Fixed Effects No No Yes No No No
Firm×Time Fixed Effects No No No No No Yes
Constant 1.784*** 1.053*** 1.045*** 1.039*** 1.057*** 0.708***
Corporate Loan (0.185) (0.214) (0.220) (0.211) (0.215) (0.193)
R2 0.186 0.480 0.482 0.480 0.481 0.847
Observations (Loan-Time Level) 10,656 10,656 10,656 10,656 10,656 3,790
Note: The Table reports regression results from a linear probability model for a sub-sample of 10,656 loan-time observations of 4,441 loansto 621 firms that received loans from both relationship and transactional banks between January 2009 and June 2013. The dependent variableis LoanPerformancei jkt that equals one when a loan is delinquent for more than 90 days. The main independent variable is “RelationshipBank” which measures the performance of relationship-based relative to transaction-based loans, that is, SME loans from relationship versustransactional banks (the reference group). “Corporate Loan” measures the differences between SME and corporate loans from transactional banks(transactions-based versus relationship-based loans), while “Corporate Loan × Relationship Bank” measures the differences between corporateloans from transactional and relationship banks (when both rely on relationship lending). Column (1) reports results with loan characteristicsand firm characteristics. In columns (2)-(5) firm fixed effects are added. Column (3) adds loan origination fixed effects, column (4) bankcharacteristics, and column (5) other loan characteristics. Column (6) introduces firm×time fixed effect. The sample reduces to 3,790 loan-timeobservations of 1,952 loans to 318 firm that received loans from both bank types in each six-month period. Definitions of the variables can befound in Table A.1 of Appendix A. Standard errors are clustered at firm level and presented in parenthesis. ***, **, and * indicate significance atthe 1%, 5%, and 10%.
29

Tabl
e5:
Rel
atio
nshi
ple
ndin
gan
dlo
ng-t
erm
perf
orm
ance
Pane
lA:D
efau
lts,r
ecov
ery
rate
s,an
dlo
sses
for
SME
loan
sifN
PL0-
90da
ysC
orpo
rate
Loa
n
Cor
pora
teL
oan
Tota
lSam
ple:
SME
Loa
nsSu
b-Sa
mpl
e:SM
EL
oans
Cor
pora
teL
oan
Rel
atio
nshi
pB
ank
Tran
sact
iona
lBan
kD
iffer
ence
Rel
atio
nshi
pB
ank
Tran
sact
iona
lBan
kD
iffer
ence
Var
iabl
eN
ames
Mea
nSt
dM
ean
Std
t-te
stM
ean
Std
Mea
nSt
dt-
test
Loa
nD
efau
lt(l
oss/
wri
tten-
off)
0.24
90.
433
0.19
80.
399
0.05
1*0.
169
0.37
70.
212
0.41
2-0
.043
Rec
over
yR
ate
0.12
70.
333
0.15
80.
366
-0.0
310.
156
0.36
50.
173
0.38
2-0
.017
%of
loan
and
inte
rest
amou
ntno
trep
aid
intim
e0.
047
0.12
70.
104
0.22
9-0
.057
***
0.06
40.
185
0.11
10.
240
-0.0
47
%of
lost
/wri
tten-
offl
oan
and
inte
rest
amou
nt0.
256
0.85
80.
181
0.55
10.
075
0.14
50.
675
0.14
70.
374
-0.0
02
Obs
erva
tions
(Loa
nL
evel
)54
330
384
677
5212
9
Cor
pora
teL
oan
Pane
lB:D
efau
lts,r
ecov
ery
rate
s,an
dlo
sses
for
SME
loan
sifN
PL90
days
Cor
pora
teL
oan
Tota
lSam
ple:
SME
Loa
nsSu
b-Sa
mpl
e:SM
EL
oans
Cor
pora
teL
oan
Rel
atio
nshi
pB
ank
Tran
sact
iona
lBan
kD
iffer
ence
Rel
atio
nshi
pB
ank
Tran
sact
iona
lBan
kD
iffer
ence
Var
iabl
eN
ames
Mea
nSt
dM
ean
Std
t-te
stM
ean
Std
Mea
nSt
dt-
test
Loa
nD
efau
lt(l
oss/
inw
ritte
n-of
fsta
tus)
0.60
80.
489
0.52
20.
501
0.08
7*0.
512
0.50
60.
600
0.49
8-0
.088
Rec
over
yR
ate
0.22
60.
419
0.29
60.
458
-0.0
70*
0.22
00.
419
0.33
30.
479
-0.1
14
%of
loan
and
inte
rest
amou
ntno
trep
aid
intim
e0.
849
1.40
70.
931
1.13
7-0
.082
0.90
71.
834
0.60
80.
619
0.29
9
%of
lost
/wri
tten-
offl
oan
and
inte
rest
amou
nt0.
672
1.32
80.
559
0.93
80.
113
0.66
11.
688
0.34
00.
453
0.32
1
Obs
erva
tions
(Loa
nL
evel
)30
118
648
741
3071
Not
e:T
heTa
ble
repo
rts
perf
orm
ance
stat
istic
sof
SME
loan
sse
lect
edfr
omth
eto
tals
ampl
eof
19,3
32lo
ans
to6,
649
firm
san
dth
esu
b-sa
mpl
eof
4,44
1lo
ans
to62
1fir
ms
that
rece
ived
loan
sfr
ombo
thre
latio
nshi
pan
dtr
ansa
ctio
nalb
anks
betw
een
Janu
ary
2009
and
June
2013
.Fo
rSM
Elo
ans
rela
tions
hip
bank
sre
lyon
rela
tions
hip
lend
ing
and
tran
sact
iona
lban
kson
tran
sact
iona
llen
ding
.B
oth
pane
lssh
owlo
ande
faul
ts(l
oss/
wri
tten-
off)
,rec
over
yra
tes,
the
perc
enta
geof
the
loan
and
inte
rest
amou
ntno
trep
aid
intim
eor
lost
/wri
tten-
off
for
SME
loan
sth
atar
eob
serv
edun
tilm
atur
ity.
Loa
nde
faul
tequ
als
one
ifa
loan
isin
loss
orw
ritte
n-of
fst
atus
atth
een
dof
the
loan
spel
land
zero
othe
rwis
e.R
ecov
ery
rate
equa
lson
eif
alo
anha
sbe
ende
linqu
entd
urin
gth
elo
ansp
ellb
utdi
dno
tdef
ault
atth
een
dof
the
loan
spel
l.T
hepe
rcen
tage
oflo
anan
din
tere
stam
ount
notr
epai
din
time
(los
t/wri
tten-
off)
stan
dsfo
rth
era
tioof
the
prin
cipa
land
inte
rest
rate
amou
ntov
erth
eto
talc
ontr
acta
mou
ntin
case
ofde
linqu
enci
esbe
low
/ove
r90
days
orde
faul
t,co
nditi
onal
onno
n-pe
rfor
man
ceat
the
end
ofth
elo
ansp
ell.
Whi
lepa
nelA
cond
ition
slo
ans
toha
vebe
ende
linqu
entf
orle
ssth
an90
days
duri
ngth
elo
ansp
ell,
pane
lBco
nditi
ons
loan
sto
have
been
delin
quen
tov
er90
days
duri
ngth
elo
ansp
ell.
For
allp
anel
s,th
eco
lum
n“D
iffer
ence
t-te
st”
repo
rts
t-st
atis
tics
for
diff
eren
ces
inm
eans
betw
een
the
two
bank
type
san
din
dica
tes
sign
ifica
nce
atth
e1%
,5%
,and
10%
leve
lsw
ith**
*,**
,*.
30

Tabl
e6:
Rel
atio
nshi
ple
ndin
gan
dlo
ng-t
erm
rent
s
Cor
pora
teL
oan
Tota
lSam
ple:
SME
Loa
nsSu
b-sa
mpl
e:SM
EL
oans
Cor
pora
teL
oan
Rel
atio
nshi
pB
ank
Tran
sact
iona
lBan
kD
iffer
ence
Rel
atio
nshi
pB
ank
Tran
sact
iona
lBan
kD
iffer
ence
Var
iabl
eN
ames
Mea
nSt
dM
ean
Std
t-te
stM
ean
Std
Mea
nSt
dt-
test
Ret
urn
onlo
ans
Ret
urn
onL
oans
15.0
84.
514
14.7
4.46
0.38
5***
13.7
54.
421
13.5
34.
201
0.22
1
Obs
erva
tions
(Loa
n-L
evel
)9,
630
8,28
917
,919
1,77
02,
091
3,86
9
Ret
urn
onlo
ansg
iven
NPL
0-90
days
Ret
urn
onL
oans
13.2
25.
955
10.6
86.
127
2.54
4***
11.9
55.
495
9.52
16.
048
2.44
3***
Obs
erva
tions
(Loa
n-L
evel
)95
062
01,
570
138
117
255
Ret
urn
onlo
ansg
iven
NPL
90da
ysR
etur
non
Loa
ns7.
819
5.13
77.
265
4.87
70.
554
7.63
5.08
66.
368
4.41
91.
262
Obs
erva
tions
(Loa
n-L
evel
)42
129
471
567
4311
0
Reg
ress
ions
onre
turn
onlo
ans
Cor
pora
teL
oan
Tota
lSam
ple:
SME
Loa
nsSu
b-sa
mpl
e:SM
EL
oans
Cor
pora
teL
oan
All
Loa
nsN
PL0-
90=1
NPL
90=1
All
Loa
nsN
PL0-
90=1
NPL
90=1
Rel
atio
nshi
pB
ank
0.38
5**
2.54
4***
0.55
40.
221
2.44
3**
1.26
2
(0.1
59)
(0.5
05)
(0.5
01)
(0.3
56)
(1.2
09)
(1.1
79)
Con
stan
t14
.696
***
10.6
76**
*7.
265*
**13
.525
***
9.51
2***
6.36
8***
(0.1
27)
(0.4
53)
(0.4
26)
(0.2
90)
(1.1
50)
(1.1
14)
R2
0.00
20.
041
0.00
30.
001
0.04
30.
016
Obs
erva
tions
(Loa
n-L
evel
)17
,919
1,57
071
53,
861
255
110
Not
e:T
heTa
ble
repo
rts
sum
mar
yst
atis
tics
and
regr
essi
onre
sults
ofre
turn
son
loan
sfo
rSM
Elo
ans
sele
cted
from
the
tota
lsam
ple
of19
,332
loan
sto
6,64
9fir
ms
and
the
sub-
sam
ple
of4,
441
loan
sto
621
firm
sth
atre
ceiv
edlo
ans
from
both
rela
tions
hip
and
tran
sact
iona
lban
ksbe
twee
nJa
nuar
y20
09an
dJu
ne20
13.
For
SME
loan
sre
latio
nshi
pba
nks
rely
onre
latio
nshi
ple
ndin
gan
dtr
ansa
ctio
nalb
anks
ontr
ansa
ctio
nal
lend
ing.
Ret
urns
onlo
ans
are
defin
edin
equa
tion
2as
the
valu
e-w
eigh
ted
inte
rest
rate
and
loss
ofa
bank
inca
seof
non-
perf
orm
ance
.The
loss
ofa
bank
isde
fined
asth
eov
erdu
epr
inci
palp
lus
inte
rest
rate
amou
ntov
erth
eco
ntra
ctam
ount
.T
hefir
stpa
nels
how
sth
ere
turn
onSM
Elo
ans
onlo
anle
velf
orth
eto
tals
ampl
ean
dth
esu
b-sa
mpl
eby
bank
type
.T
hese
cond
and
thir
dpa
nels
show
the
retu
rnon
SME
loan
sth
atha
vebe
ende
linqu
entf
orle
ssth
an90
days
and
over
90da
ys.
Fora
llpa
nels
,the
colu
mn
“Diff
eren
cet-
test
”re
port
st-
stat
istic
sfo
rdiff
eren
ces
inm
eans
betw
een
the
two
bank
type
san
din
dica
tes
sign
ifica
nce
atth
e1%
,5%
,and
10%
leve
lsw
ith**
*,**
,*.T
hela
stpa
nels
how
sre
sults
from
are
gres
sion
sof
retu
rnon
loan
son
a“R
elat
ions
hip
Ban
k”du
mm
yw
ithou
tfirm
fixed
effe
cts
fora
llSM
Elo
ans
(“A
llL
oans
”),f
orSM
Elo
ans
notd
elin
quen
tfor
less
than
90da
ys(“
NPL
0-90
=0”)
,for
SME
loan
sde
linqu
entf
orle
ssth
an90
days
(“N
PL0-
90=1
”),f
orSM
Elo
ans
notd
elin
quen
tove
r90
days
(“N
PL90
=0”)
,and
for
SME
loan
sde
linqu
ent
over
90da
ys(“
NPL
90=1
”).
31

Tabl
e7:
Rel
atio
nshi
ple
ndin
gan
dba
nkbe
havi
our
Pane
lA:D
istr
ibut
ion
ofex
-ant
ebo
rrow
erri
sks
Cor
pora
teL
oan
Cor
pora
teL
oan
Tota
lSam
ple:
Ban
k-Fi
rm-T
ime
Lev
elTo
talS
ampl
e:B
ank-
Firm
Lev
el
Cor
pora
teL
oan
Rel
atio
nshi
pB
ank
Tran
sact
iona
lBan
kD
iffer
ence
Rel
atio
nshi
pB
ank
Tran
sact
iona
lBan
kD
iffer
ence
Var
iabl
eN
ames
Mea
nSt
dM
ean
Std
t-te
stM
ean
Std
Mea
nSt
dt-
test
Past
NPL
with
Ban
k0.
016
0.12
60.
011
0.10
30.
005*
**0.
013
0.10
40.
008
0.08
00.
005*
*
Past
NPL
with
Any
Ban
k0.
017
0.12
80.
018
0.13
2-0
.001
0.01
40.
116
0.01
70.
124
-0.0
02
Past
NPL
with
Oth
erB
anks
0.01
50.
119
0.01
60.
124
-0.0
010.
013
0.11
00.
015
0.12
1-0
.002
Obs
erva
tions
7,87
46,
322
14,1
964,
531
3,35
27,
883
Cor
pora
teL
oan
Cor
pora
teL
oan
Pane
lB:R
ollo
ver
loan
sand
rene
gotia
tions
ofco
ntra
ctte
rmsg
iven
NPL
0-90
days
Cor
pora
teL
oan
Tota
lSam
ple:
SME
Loa
nsSu
b-Sa
mpl
e:SM
EL
oans
Cor
pora
teL
oan
Rel
atio
nshi
pB
ank
Tran
sact
iona
lBan
kD
iffer
ence
Rel
atio
nshi
pB
ank
Tran
sact
iona
lBan
kD
iffer
ence
Var
iabl
eN
ames
Mea
nSt
dM
ean
Std
t-te
stM
ean
Std
Mea
nSt
dt-
test
Rol
love
rloa
ns(-\+
1m
onth
s)0.
005
0.07
20.
005
0.06
90.
000
0.00
70.
085
0.00
90.
093
-0.0
01
Rol
love
rloa
ns(-\+
2m
onth
s)0.
008
0.09
10.
008
0.09
00.
000
0.02
20.
146
0.00
90.
093
0.01
3
Rol
love
rloa
ns(-\+
3m
onth
s)0.
012
0.10
70.
015
0.12
0-0
.003
0.02
20.
146
0.01
70.
130
0.00
5
Incr
ease
inIn
tere
stR
ate
0.05
30.
223
0.03
20.
177
0.02
0*0.
044
0.20
50.
051
0.22
2-0
.008
Incr
ease
inA
mou
nt0.
004
0.06
50.
008
0.09
0-0
.004
0.01
50.
120
0.00
90.
093
0.00
6
Incr
ease
inM
atur
ity0.
041
0.19
90.
015
0.12
00.
0267
***
0.04
40.
205
0.00
00.
000
0.04
35**
Dec
reas
ein
Inte
rest
Rat
e0.
053
0.22
30.
027
0.16
30.
025*
*0.
051
0.22
00.
026
0.15
90.
025
Dec
reas
ein
Am
ount
0.00
50.
072
0.00
80.
090
-0.0
030.
015
0.12
00.
000
0.00
00.
015
Dec
reas
ein
Mat
urity
0.02
80.
166
0.01
10.
106
0.01
7**
0.02
20.
146
0.00
00.
000
0.02
2
Obs
erva
tions
(Loa
nL
evel
)95
062
01,
570
138
117
255
Not
e:T
heTa
ble
repo
rts
sum
mar
yst
atis
tics
loan
sse
lect
edfr
omth
eto
tals
ampl
eof
19,3
32lo
ans
to6,
649
firm
san
dth
esu
b-sa
mpl
eof
4,44
1lo
ans
to62
1fir
ms
that
rece
ived
loan
sfr
ombo
thre
latio
nshi
pan
dtr
ansa
ctio
nalb
anks
betw
een
Janu
ary
2009
and
June
2013
.Pan
elA
repo
rts
sum
mar
yst
atis
tics
onpa
stno
n-pe
rfor
man
ceof
any
kind
with
the
pres
entb
ank
ofth
efir
m,w
ithan
yba
nkin
clud
ing
the
form
eran
dw
ithot
herb
anks
ofth
efir
mco
llaps
edto
bank
-firm
-tim
ean
dba
nk-fi
rmle
vel.
Pane
lBre
port
ssu
mm
ary
stat
istic
son
rollo
verl
oans
asw
ella
sin
crea
ses
and
decr
ease
sin
the
inte
rest
rate
,loa
nam
ount
and
mat
urity
duri
ngth
elo
ansp
ellf
orth
eto
tals
ampl
ean
dsu
b-sa
mpl
eof
SME
loan
sgi
ven
delin
quen
cies
belo
w90
days
.In
part
icul
ar,I
decl
are
alo
anof
afir
mto
bea
rollo
ver
loan
ifth
elo
anha
sbe
enno
n-pe
rfor
min
gan
da
new
loan
has
been
issu
edw
ithin
one,
two,
orth
ree
mon
ths
befo
reor
afte
rthe
non-
perf
orm
ing
loan
with
the
sam
eba
nk.C
hang
esin
cont
ract
term
sar
em
easu
red
atth
epe
riod
and
upto
thre
epe
riod
saf
terd
elin
quen
cies
belo
w90
days
onlo
an-t
ime
leve
land
then
colla
psed
tolo
anle
vel.
Pane
lCre
peat
sth
esa
me
anal
ysis
give
nde
linqu
enci
esov
er90
days
.Pa
nelD
repo
rts
whe
ther
firm
sth
atha
vecr
edit
lines
orov
erdr
afts
with
the
sam
eba
nkdr
awdo
wn
onth
emin
peri
ods
ofde
linqu
enci
esan
dup
toth
ree
peri
ods
late
ron
loan
-tim
ele
vela
ndth
enco
llaps
edto
loan
leve
lfor
the
tota
lsam
ple
ofSM
Elo
ans.
For
SME
loan
sre
latio
nshi
pba
nks
rely
onre
latio
nshi
ple
ndin
gan
dtr
ansa
ctio
nalb
anks
ontr
ansa
ctio
nall
endi
ng.
For
allp
anel
s,th
eco
lum
n“D
iffer
ence
t-te
st”
repo
rts
t-st
atis
tics
for
diff
eren
ces
inm
eans
betw
een
the
two
bank
type
san
din
dica
tes
sign
ifica
nce
atth
e1%
,5%
,and
10%
leve
lsw
ith**
*,**
,*.
32

Tabl
e7
(con
tinue
d):R
elat
ions
hip
lend
ing
and
bank
beha
viou
r
Pane
lC:R
ollo
ver
loan
sand
rene
gotia
tions
ofco
ntra
ctte
rmsg
iven
NPL
0-90
days
Cor
pora
teL
oan
Tota
lSam
ple:
SME
Loa
nsSu
b-Sa
mpl
e:SM
EL
oans
Cor
pora
teL
oan
Rel
atio
nshi
pB
ank
Tran
sact
iona
lBan
kD
iffer
ence
Rel
atio
nshi
pB
ank
Tran
sact
iona
lBan
kD
iffer
ence
Var
iabl
eN
ames
Mea
nSt
dM
ean
Std
t-te
stM
ean
Std
Mea
nSt
dt-
test
Rol
love
rloa
ns(-\+
1m
onth
s)0.
005
0.06
90.
003
0.05
80.
001
0.00
00.
000
0.00
00.
000
0.00
0
Rol
love
rloa
ns(-\+
2m
onth
s)0.
012
0.10
80.
003
0.05
80.
008
0.03
00.
171
0.00
00.
000
0.03
0
Rol
love
rloa
ns(-\+
3m
onth
s)0.
012
0.10
80.
014
0.11
6-0
.002
0.03
00.
171
0.04
70.
213
-0.0
17
Incr
ease
inIn
tere
stR
ate
0.09
70.
297
0.02
40.
153
0.07
4***
0.10
40.
308
0.04
70.
213
0.05
8
Incr
ease
inA
mou
nt0.
007
0.08
40.
007
0.08
20.
000
0.01
50.
122
0.00
00.
000
0.01
5
Incr
ease
inM
atur
ity0.
052
0.22
30.
020
0.14
20.
032*
*0.
060
0.23
90.
000
0.00
00.
060
Dec
reas
ein
Inte
rest
Rat
e0.
105
0.30
60.
027
0.16
30.
077*
**0.
104
0.30
80.
023
0.15
20.
081
Dec
reas
ein
Am
ount
0.01
00.
097
0.01
00.
101
-0.0
000.
030
0.17
10.
000
0.00
00.
030
Dec
reas
ein
Mat
urity
0.04
50.
208
0.00
70.
082
0.03
8***
0.04
50.
208
0.00
00.
000
0.04
5
Obs
erva
tions
(Loa
nL
evel
)42
129
471
567
4311
0
Cor
pora
teL
oan
Cor
pora
teL
oan
Pane
lD:D
raw
dow
non
cred
itlin
esan
dov
erdr
afts
give
nno
n-pe
rfor
man
ceC
orpo
rate
Loa
nC
orpo
rate
Loa
n
Cor
pora
teL
oan
Tota
lSam
ple:
SME
loan
sC
orpo
rate
Loa
n
Cor
pora
teL
oan
Rel
atio
nshi
pB
ank
Tran
sact
iona
lBan
kD
iffer
ence
Cor
pora
teL
oan
Cor
pora
teL
oan
Mea
nSt
dM
ean
Std
t-te
stC
orpo
rate
Loa
n
Dra
wdo
wn
onC
redi
tLin
es/O
verd
raft
sgi
ven
NPL
0-90
days
0.39
80.
491
0.27
80.
451
0.11
9*C
orpo
rate
Loa
n
Obs
erva
tions
(Loa
nL
evel
)16
679
245
Cor
pora
teL
oan
Dra
wdo
wn
onC
redi
tLin
es/O
verd
raft
sgi
ven
NPL
90da
ys0.
368
0.48
60.
231
0.43
0.13
7C
orpo
rate
Loa
n
Obs
erva
tions
(Loa
nL
evel
)68
2694
Cor
pora
teL
oan
Dra
wdo
wn
onC
redi
tLin
es/O
verd
raft
sgi
ven
NPL
0-90
or90
days
0.42
20.
495
0.31
50.
467
0.10
8*C
orpo
rate
Loa
n
Obs
erva
tions
(Loa
nL
evel
)18
789
276
Cor
pora
teL
oan
Dra
wdo
wn
onC
redi
tLin
es/O
verd
raft
sgi
ven
NPL
0.18
0.38
40.
076
0.26
50.
104*
**C
orpo
rate
Loa
n
Obs
erva
tions
(Loa
nL
evel
)38
421
159
5C
orpo
rate
Loa
n
33

Table 8: Use of credit registry for loan monitoring and granting purposes
Corporate Loan # of Loan Monitoring Enquiries # of Loan Granting Enquiries
Corporate Loan (1) (2) (3) (4) (5) (6)
Relationship Bank Firm 0.334*** 0.257** 0.263** 0.037 -0.006 -0.004
Corporate Loan (0.109) (0.109) (0.119) (0.062) (0.061) (0.065)
Firm Size 0.303*** 0.319*** 0.146*** 0.154***
Corporate Loan (0.034) (0.037) (0.018) (0.019)
Past NPL with Bank -0.182 -0.229 -0.143 -0.153
Corporate Loan (0.259) (0.286) (0.186) (0.196)
Past NPL with Any Bank 0.207 0.280 0.274 0.260
Corporate Loan (0.773) (0.816) (0.602) (0.619)
Past NPL with Other Banks 1.176 1.033 0.210 0.272
Corporate Loan (1.112) (1.198) (0.654) (0.658)
Firm Location Fixed Effects No No Yes No No Yes
Firm Industry Fixed Effects No No Yes No No Yes
Firm Ownership Fixed Effects No No Yes No No Yes
Constant 1.871*** -1.597*** -2.360*** 2.005*** 0.445** 0.345
Corporate Loan (0.090) (0.358) (0.783) (0.049) (0.186) (0.535)
R2 0.008 0.122 0.160 0.000 0.041 0.078
Observations 1,295 1,295 1,295 2,245 2,245 2,245
Note: The Table reports regression results for a sample of 2,737 firms that exclusively received loans either from relationship or transactionalbanks and for which data on banks’ use of the credit registry for loan monitoring and granting purposes exists from June 2012 until June 2013.The dependent variables are either “Monitoring” or “Granting”, indicating the number of bank enquiries of firm information for loan monitoringor granting purposes. The main independent variable is “Relationship Bank Firm” which measures whether a firm that received loans onlyfrom relationship banks was inquired through the credit registry for loan monitoring or granting purposes. The reference group comprises firmsthat received loans only from transactional banks. To control for differences in firm characteristics, I add firm size based on the average totaloutstanding debt across banks and past non-performance measures with their bank, any bank and all banks in columns (2) and (4) as well as firmlocation, industry and ownership fixed effects in columns (3) and (4). Standard errors are robust and presented in parenthesis. ***, **, and *indicate significance at the 1%, 5%, and 10%.
34

Table 9: Overdue loan repayments
Corporate Loan NPL Amount over NPL Amount over NPL Amount over
Corporate Loan Contract Amount Bank Exposure Total Exposure
Corporate Loan (1) (2) (3) (4) (5) (6)
Bank Lending TechnologiesCorporate Loan -0.026 -0.010 0.106 0.280 -0.020* -0.006
Corporate Loan (0.028) (0.013) (0.133) (0.270) (0.012) (0.016)
Relationship Bank -0.015 0.007 0.234 0.854 -0.011 -0.019
Corporate Loan (0.023) (0.015) (0.234) (0.836) (0.013) (0.019)
Corporate Loan × Relationship Bank 0.013 0.003 -0.310 -0.927 0.007 0.004
Corporate Loan (0.032) (0.012) (0.316) (0.936) (0.014) (0.013)
Firm CharacteristicsFirm Location Yerevan -0.002 -0.235 -0.013
Corporate Loan (0.022) (0.195) (0.011)
Wholesale Retail Trade Firm 0.018 0.382 0.006
Corporate Loan (0.041) (0.306) (0.017)
Other Fields of Service Firm -0.018 -0.121 -0.005
Corporate Loan (0.024) (0.104) (0.010)
Private Firm -0.012 0.197 -0.007
Corporate Loan (0.022) (0.176) (0.009)
Firm Fixed Effects No Yes No Yes No Yes
Constant 0.076** 0.044*** 0.039 -0.317 0.046*** 0.034**
Corporate Loan Corporate Loan (0.036) (0.009) (0.071) (0.414) (0.015) (0.014)
R2 0.018 0.446 0.036 0.164 0.018 0.291
Observations 1,193 1,193 1,193 1,193 1,193 1,193
Note: The Table reports regression results for a sub-sample of 1,193 loan-time observations of 323 loans to 126 firms that received loans fromboth relationship and transactional banks between January 2009 and June 2013 and had overdue principal and interest rate repayments for lessthan 90 days. In the first two columns the dependent variable is the overdue principal and interest rate amount over the contract amount, thefollowing two columns use the same numerator but set it relative to the total outstanding debt of the firm with the respective bank in a period andthe last two columns use the total outstanding debt of a firm in a period. The main independent variable is “Relationship Bank” which measures theoverdue exposure of relationship-based relative to transaction-based loans, for example, SME loans from relationship versus transactional banks(the reference group). For each dependent variable, I use firm characteristics or firm fixed effects to control for firm heterogeneity. Standarderrors are robust and presented in parenthesis. ***, **, and * indicate significance at the 1%, 5%, and 10%.
35

Table 10: Robustness tests of relationship lending and loan performance
Corporate Loan Table 3, Specification (1) Table 3, Specification (2)
Variable Names Coeff. Std. Error Obs. Coeff. Std. Error Obs.
Panel A: Alternative ExplanationsAlternative relationship lending 0.023** (0.010) 5,898 0.017* (0.010) 5,898
Relationship variables 0.026*** (0.009) 10,656 0.026*** (0.008) 10,656
Full/Opposite sample 0.020*** (0.004) 53,780 0.016*** (0.005) 43,124
Panel B: Loan PerformanceNon-Performance 0.005 (0.007) 10,656 0.013** (0.005) 10,656
Non-Performance 180 days 0.007 (0.005) 10,656 0.009** (0.004) 10,656
Panel C: Loan Characteristics
Local currency loans 0.021* (0.012) 5,946 0.010 (0.010) 5,946
US dollar loans 0.033*** (0.011) 4,710 0.040*** (0.014) 4,710
Loans between January 2009–2011 0.027** (0.011) 2,881 -0.020 (0.015) 2,881
Loans after January 2011 0.025** (0.011) 7,775 0.022** (0.011) 7,775
W/o loans 50% around threshold 0.026*** (0.010) 9,161 0.025*** (0.009) 9,161
Panel D: Firm Characteristics
Trade, manufacturing, construction 0.007 (0.017) 3,367 0.014 (0.013) 3,367
Other fields of services 0.036*** (0.012) 5,715 0.033*** (0.012) 5,715
Other industries 0.022 (0.017) 1,574 0.020 (0.016) 1,574
New customers 0.020 (0.014) 3,389 0.025* (0.014) 3,389
Old customers 0.027** (0.011) 7,267 0.027*** (0.010) 7,267
Panel E: Alternative Estimation
Logit model 0.565** (0.225) 10,656 0.812*** (0.236) 2,459
Matching on firm and loan amount 0.026** (0.010) 19,207 0.026** (0.013) 13,615
Matching on firm and loan char. 0.043** (0.020) 2,064 0.062 (0.041) 404
Bank clusters 0.025 (0.018) 10,656 0.025** (0.012) 10,656
Bank×time and firm clusters 0.025*** (0.008) 10,656 0.025*** (0.009) 10,656
36

Table 10 (continued): Robustness tests of relationship lending and loan performance
Note: The Table reports robustness regression results for a sub-sample (or selection thereof) of 10,656 loan-time observations of 4,441 loansto 621 firms that received loans from both relationship and transactional banks between January 2009 and June 2013. The dependent variableis LoanPerformancei jkt that equals one when a loan is in arrears for more than 90 days unless otherwise noted. For each robustness test, Ire-run specifications of Table 3 in columns (1) and (2) with firm characteristics or with firm fixed effects. To consume space, I only reportthe coefficient of “Relationship Bank” which measures the performance of relative relationship-based to transaction-based loans, that is, SMEloans from relationship versus transactional banks (the reference group), as well as its standard error and the number of observations. Panel Areports regression results for alternative explanations of the main results: “Alternative relationship lending” defines the importance of relationshiplending relative to the importance of other lending technologies and reduces the sample to relationship banks for which the relative importanceof relationship lending stays constant for SME and corporate loans (4 out of 9 relationship banks) and transactional banks for which the relativeimportance of relationship lending is higher for corporate loans compared with SME loans (all 5 transactional banks), and “Relationship variables”adds relationship variables such as length of the bank-firm relationship, a dummy variable that equals one if a firm has other products with thebank and a dummy variable that equals one if a firm’s debt exposure to a bank is above 50% and zero otherwise; “Full/Opposite sample” estimatesSpecification (1) of Table 3 with just loan and firm characteristics for the full sample of 6,649 firms and 19,332 loans in the column “Table 3,Specification (1)” and for opposite sample of 6,028 firms that receive 14,891 loans from either relationship or transactional banks only in thecolumn “Table 3, Specification (2)”. Panel B presents alternative non-performance measures: “Non-Performance” that equals one if a loanhas any overdue payments on the principal amount and interest rate and zero otherwise and “Non-Performance 180 days” that equals one if aloan is delinquent for more than 180 days and zero otherwise. Panel C reports results for different loan characteristics. “Local currency loans”and “US dollar loans” uses only loans denominated in local currency or US dollars; “Loans after January 2011” uses only loans after January2011; “W/o loans 50% around threshold” excludes loans 50% around the threshold. Panel D investigates different firm characteristics: “Trade,manufacturing, construction” uses only observations of firms from the trade, manufacturing or construction industries, while “Other fields ofservices” and “Other industries” uses only observations of firms either from other fields of service industries or remaining other industries; “NewCustomers” and “Old Customers” splits the benchmark regression into first time customers and repeated customers of a bank. Panel D examinesdifferent firm characteristics. Panel E relies on different estimation methods of the benchmark regressions. Row “Logit model” uses a logit modelinstead of a linear probability model for the benchmark specifications and reports odds ratios; “Matching on firm and loan amount” estimatesthe average differences in delinquencies for less than 90 days between SME loans from relationship and transactional banks using a sub-sampleof loans to the same firm with similar loan amounts: “Matching on firm and loan char.” additionally matches on collateral, interest rate andrating. Specifications (2) and (3) correspond to a 0.5 and 0.25 standard deviation radius for each of the matching variables; the last two rows“Bank clusters” and “Bank×time and firm clusters” cluster standard errors at bank level only and use double clusters at bank-time and firm level,respectively. Definitions of the variables can be found in Table A.1 of Appendix A. If not otherwise noted, standard errors are clustered at firmlevel and presented in parenthesis. ***, **, and * indicate significance at the 1%, 5%, and 10%.
37
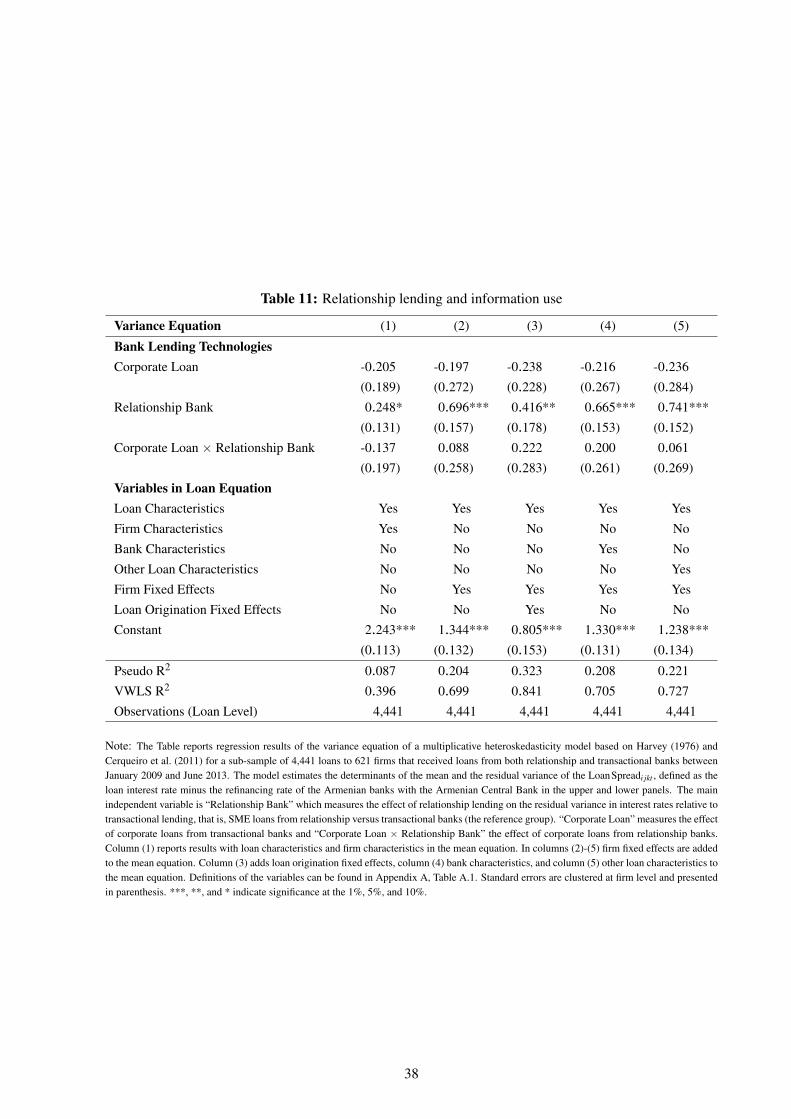
Table 11: Relationship lending and information use
Variance Equation (1) (2) (3) (4) (5)
Bank Lending TechnologiesCorporate Loan -0.205 -0.197 -0.238 -0.216 -0.236
Corporate Loan (0.189) (0.272) (0.228) (0.267) (0.284)
Relationship Bank 0.248* 0.696*** 0.416** 0.665*** 0.741***
Corporate Loan (0.131) (0.157) (0.178) (0.153) (0.152)
Corporate Loan × Relationship Bank -0.137 0.088 0.222 0.200 0.061
Corporate Loan (0.197) (0.258) (0.283) (0.261) (0.269)
Variables in Loan EquationLoan Characteristics Yes Yes Yes Yes Yes
Firm Characteristics Yes No No No No
Bank Characteristics No No No Yes No
Other Loan Characteristics No No No No Yes
Firm Fixed Effects No Yes Yes Yes Yes
Loan Origination Fixed Effects No No Yes No No
Constant 2.243*** 1.344*** 0.805*** 1.330*** 1.238***
Corporate Loan (0.113) (0.132) (0.153) (0.131) (0.134)
Pseudo R2 0.087 0.204 0.323 0.208 0.221
VWLS R2 0.396 0.699 0.841 0.705 0.727
Observations (Loan Level) 4,441 4,441 4,441 4,441 4,441
Note: The Table reports regression results of the variance equation of a multiplicative heteroskedasticity model based on Harvey (1976) andCerqueiro et al. (2011) for a sub-sample of 4,441 loans to 621 firms that received loans from both relationship and transactional banks betweenJanuary 2009 and June 2013. The model estimates the determinants of the mean and the residual variance of the LoanSpreadi jkt , defined as theloan interest rate minus the refinancing rate of the Armenian banks with the Armenian Central Bank in the upper and lower panels. The mainindependent variable is “Relationship Bank” which measures the effect of relationship lending on the residual variance in interest rates relative totransactional lending, that is, SME loans from relationship versus transactional banks (the reference group). “Corporate Loan” measures the effectof corporate loans from transactional banks and “Corporate Loan × Relationship Bank” the effect of corporate loans from relationship banks.Column (1) reports results with loan characteristics and firm characteristics in the mean equation. In columns (2)-(5) firm fixed effects are addedto the mean equation. Column (3) adds loan origination fixed effects, column (4) bank characteristics, and column (5) other loan characteristics tothe mean equation. Definitions of the variables can be found in Appendix A, Table A.1. Standard errors are clustered at firm level and presentedin parenthesis. ***, **, and * indicate significance at the 1%, 5%, and 10%.
38

Chart 1: Identification strategy
Note: The Chart illustrates the identification strategy for the main analysis, presenting bank types, loan types and corresponding lending tech-niques. The two bank types are relationship banks (treatment group) and transactional banks (control group). Each bank reports the importanceof relationship lending by SME and corporate loans separately. Relationship banks rely on relationship lending for both loan types, while transac-tional banks use relationship lending only for corporate loans and transactional lending (based on fundamental/cash flow analysis and collateral)for SME loans. The arrows indicate that loan performance of the same firm is compared for SME loans from the two bank types, when lendingtechniques differ (relationship versus transactional lending), and for corporate loans, when both rely on relationship lending.
39

Chart 2: Loan performance over time for sub-sample
(a) SME loans (relationship versus transactional lending)
0.00
0.02
0.04
0.06
0.08
0.10
2009.1 2009.2 2010.1 2010.2 2011.1 2011.2 2012.1 2012.2 2013.1
Relationship Banks Transactional Banks
(b) Corporate loans (relationship versus relationship lending)
0.00
0.05
0.10
0.15
2009.1 2009.2 2010.1 2010.2 2011.1 2011.2 2012.1 2012.2 2013.1
Relationship Banks Transactional Banks
Note: The Chart shows average loan delinquencies over 90 days for a sub-sample of 4,441 loans to 621 firms that received loans from bothrelationship and transactional banks between January 2009 and June 2013. The upper chart shows average non-performance over time forSME loans for both relationship and transactional banks (relationship versus transactional lending), while the lower chart shows average non-performance for corporate loans for both bank types (both relationship lending).
40
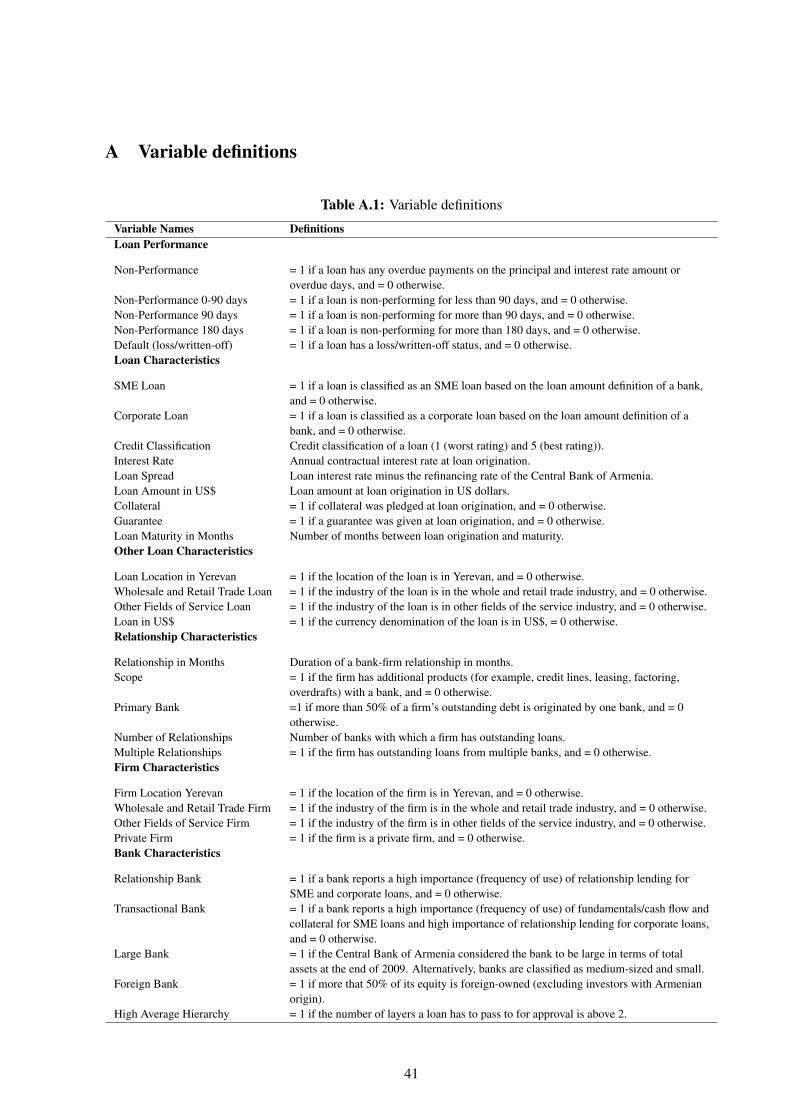
A Variable definitions
Table A.1: Variable definitions
Variable Names DefinitionsLoan Performance
Non-Performance = 1 if a loan has any overdue payments on the principal and interest rate amount oroverdue days, and = 0 otherwise.
Non-Performance 0-90 days = 1 if a loan is non-performing for less than 90 days, and = 0 otherwise.Non-Performance 90 days = 1 if a loan is non-performing for more than 90 days, and = 0 otherwise.Non-Performance 180 days = 1 if a loan is non-performing for more than 180 days, and = 0 otherwise.Default (loss/written-off) = 1 if a loan has a loss/written-off status, and = 0 otherwise.Loan Characteristics
SME Loan = 1 if a loan is classified as an SME loan based on the loan amount definition of a bank,and = 0 otherwise.
Corporate Loan = 1 if a loan is classified as a corporate loan based on the loan amount definition of abank, and = 0 otherwise.
Credit Classification Credit classification of a loan (1 (worst rating) and 5 (best rating)).Interest Rate Annual contractual interest rate at loan origination.Loan Spread Loan interest rate minus the refinancing rate of the Central Bank of Armenia.Loan Amount in US$ Loan amount at loan origination in US dollars.Collateral = 1 if collateral was pledged at loan origination, and = 0 otherwise.Guarantee = 1 if a guarantee was given at loan origination, and = 0 otherwise.Loan Maturity in Months Number of months between loan origination and maturity.Other Loan Characteristics
Loan Location in Yerevan = 1 if the location of the loan is in Yerevan, and = 0 otherwise.Wholesale and Retail Trade Loan = 1 if the industry of the loan is in the whole and retail trade industry, and = 0 otherwise.Other Fields of Service Loan = 1 if the industry of the loan is in other fields of the service industry, and = 0 otherwise.Loan in US$ = 1 if the currency denomination of the loan is in US$, = 0 otherwise.Relationship Characteristics
Relationship in Months Duration of a bank-firm relationship in months.Scope = 1 if the firm has additional products (for example, credit lines, leasing, factoring,
overdrafts) with a bank, and = 0 otherwise.Primary Bank =1 if more than 50% of a firm’s outstanding debt is originated by one bank, and = 0
otherwise.Number of Relationships Number of banks with which a firm has outstanding loans.Multiple Relationships = 1 if the firm has outstanding loans from multiple banks, and = 0 otherwise.Firm Characteristics
Firm Location Yerevan = 1 if the location of the firm is in Yerevan, and = 0 otherwise.Wholesale and Retail Trade Firm = 1 if the industry of the firm is in the whole and retail trade industry, and = 0 otherwise.Other Fields of Service Firm = 1 if the industry of the firm is in other fields of the service industry, and = 0 otherwise.Private Firm = 1 if the firm is a private firm, and = 0 otherwise.Bank Characteristics
Relationship Bank = 1 if a bank reports a high importance (frequency of use) of relationship lending forSME and corporate loans, and = 0 otherwise.
Transactional Bank = 1 if a bank reports a high importance (frequency of use) of fundamentals/cash flow andcollateral for SME loans and high importance of relationship lending for corporate loans,and = 0 otherwise.
Large Bank = 1 if the Central Bank of Armenia considered the bank to be large in terms of totalassets at the end of 2009. Alternatively, banks are classified as medium-sized and small.
Foreign Bank = 1 if more that 50% of its equity is foreign-owned (excluding investors with Armenianorigin).
High Average Hierarchy = 1 if the number of layers a loan has to pass to for approval is above 2.
41

B Test for discontinuity at the threshold
In this section, I examine the distribution of loans around the threshold that determines a loan to be anSME or corporate loan. A natural question that arises is whether banks or firms are manipulating loanamounts in order to give out or receive either SME or corporate loans. Transactional banks, for example,could intentionally give out loans with loan amounts just below the threshold in order to avoid givingout a corporate loan that might be associated with higher costs since relationship lending becomes moreimportant. Likewise, firms could apply for loans just below the threshold in order to circumvent possiblyhigher screening and monitoring activities of banks.
In general, only complete manipulation but not partial manipulation results in identification problems.While complete manipulation assumes that the assignment rule is under complete control of agents, partialmanipulation occurs when agents can only partially influence the assignment rule and the rest remainsidiosyncratic (McCrary (2008, p. 700)).32 In the present case, threshold definitions are not publiclyknown and differ across banks in amount and currency. Half of the banks set thresholds in US dollars,while the rest sets it in Armenian dram. At the same time, loans are issued in different currencies. Forfirms, it is more difficult to manipulate their loan amounts, as they are less likely to know the exactthresholds for each bank. In banks, loan officers might be able to manipulate loan amounts. Exchange ratefluctuations might, however, still add an idiosyncratic component (see Garmaise and Natividad (2015) forsimilar ideas), suggesting partial manipulation.
Even if complete manipulation occurs, it should not influence the main results, since the identificationcomes from loans further away from the threshold and not around the threshold. Most likely, for transac-tional banks lending techniques do not just switch from transactional to relationship lending once a loanpasses the loan amount threshold; rather they become less transaction-based and more relationship-basedwith the loan size. Therefore, the further away a loan is from the threshold the more prominent the differ-ence in lending techniques will be for transactional banks across loan types and for SME loans betweenrelationship and transactional banks. In unreported results, I confirm that leaving out loans exactly at oraround the threshold does not alter the main results.
In order to formally check for manipulation around the threshold, I rely on a methodology developedby McCrary (2008) that tests for the discontinuity at the threshold in the density function of the runningvariable (loan amount threshold). The upper panel of Chart A.1 plots the density functions of loan amountswith the threshold normalised to zero and a range of 50% around the threshold for the total sample and thesub-sample. Both charts reveal a discontinuous jump at the threshold which is confirmed by coefficientsof -1.06 (-1.46) and standard errors of 0.14 (0.28). Errors in the assignment of loans to SME and corporateloans might occur since banks do no explicitly specify whether the threshold is an upper or lower boundor might give approximate amounts. The lower panel of Chart A.1 plots the same density functions asabove, leaving out loans exactly at the threshold. The discontinuous jump disappears with coefficients of0.02 (-0.11) and standard errors of 0.14 (0.30).
32van der Klaauw (2002), DiNardo and Lee (2004) and Lee (2008) present some examples of plausible partial manipulationsthat do not influence results.
42
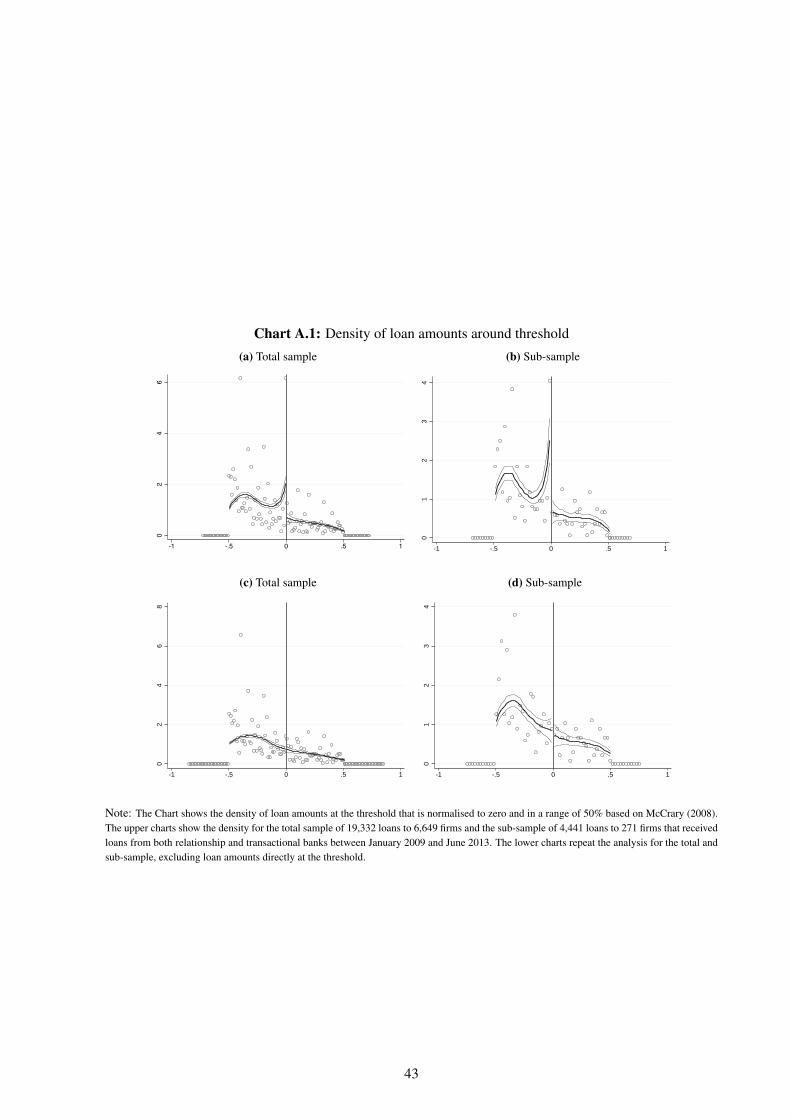
Chart A.1: Density of loan amounts around threshold
(a) Total sample
02
46
-1 -.5 0 .5 1
(b) Sub-sample
01
23
4
-1 -.5 0 .5 1
(c) Total sample
02
46
8
-1 -.5 0 .5 1
(d) Sub-sample
01
23
4
-1 -.5 0 .5 1
Note: The Chart shows the density of loan amounts at the threshold that is normalised to zero and in a range of 50% based on McCrary (2008).The upper charts show the density for the total sample of 19,332 loans to 6,649 firms and the sub-sample of 4,441 loans to 271 firms that receivedloans from both relationship and transactional banks between January 2009 and June 2013. The lower charts repeat the analysis for the total andsub-sample, excluding loan amounts directly at the threshold.
43

C Regression model with multiplicative heteroskedasticity
The regression model with multiplicative heteroskedasticity based on Harvey (1976) is defined as:
yi = β′Xi +ui, (A.1)
Log(σ2i ) = γ
′Zi, (A.2)
where (1) is the mean equation and (2) the variance equation. The identifying assumptions for the modelare:
E(ui|Xi) = 0, (A.3)
E2(ui|Zi)≡ σ2i = exp(γ′Zi), (A.4)
where yi is the depending variable, Xia vector of explanatory variables in the mean equation, ui is a dis-turbance term, σ2
i the residual variance, and Zi a vector of explanatory variables in the variance equation.
Under the normality assumption, the conditional distribution of yi is given by:
yi|Xi,Zid−→N(β
′Xi,exp(γ
′Zi)), (A.5)
The heteroskedastic regression model is estimated with Maximum-Likelihood (MLE) by maximising thefollowing log-likelihood with respect to β and γ:
LogL =n2
log(2π)− 12
n
∑i=1
γ′Zi−
12
n
∑i=1
exp(−γ′Zi)(yi−β
′Xi)2 (A.6)
Harvey (1976) shows that this approach is analogous to estimating the mean Eq. (1), and taking thesquared-residuals as the raw estimates of the individual variances, which are subsequently used to estimateEq. (2). This two-step approach leads to a substantial loss of efficiency vis-a-vis the MLE.
44