Embed Size (px)
DESCRIPTION
Forging a Public Agenda for Higher Education in the New Legislative Session. AASCU Higher Education Government Relations Conference December 1, 2010. West Virginia Higher Education Policy Commission. Public Policy Issues Facing Higher Education in 2009-10 ( AGB ). The Recession - PowerPoint PPT Presentation
Citation preview
Forging a Public Agenda for Higher Education in the New Legislative
Session
AASCU Higher Education Government Relations ConferenceDecember 1, 2010
• The Recession
• Heightened Scrutiny of Nonprofit Organizations
• The New GI Bill
• Accountability
• K-12 Education
• Global Competitiveness, Changing Demographics, and the Workforce
• Federal Research Support
• Higher Education Governance
Public Policy Issues Facing Higher Education in 2009-10 (AGB)
West Virginia Higher Education Policy Commission
• According to a recent survey by the National Governors Association, the recession has resulted in budget gaps totaling $297 billion across the states between FY 2009 and FY 2012. State general fund spending declined in both FY 2009 and FY 2010, the first-ever back-to-back annual declines.
• The NGA/NASBO Fiscal Survey of the States (2010) indicates that FY 2010 presented the most difficult challenge for states since the Great Depression, and FY 2011 is expected to present similar challenges.
• The size of state government has been downsized. Nationally, nearly 50,000 fewer state government jobs exist (excluding teachers) than in 2008, according to NASBO. In FY 2010, 26 states laid off employees, 22 utilized furlough programs and 12 reduced salaries.
• At the collegiate level, institutions have adopted layoffs and furloughs, eliminated academic programs and student support services, closed colleges, limited course offerings, increased class sizes, and capped enrollment to offset budget reductions and minimize tuition and fee increases.
The Recession: The National Context
West Virginia Higher Education Policy Commission
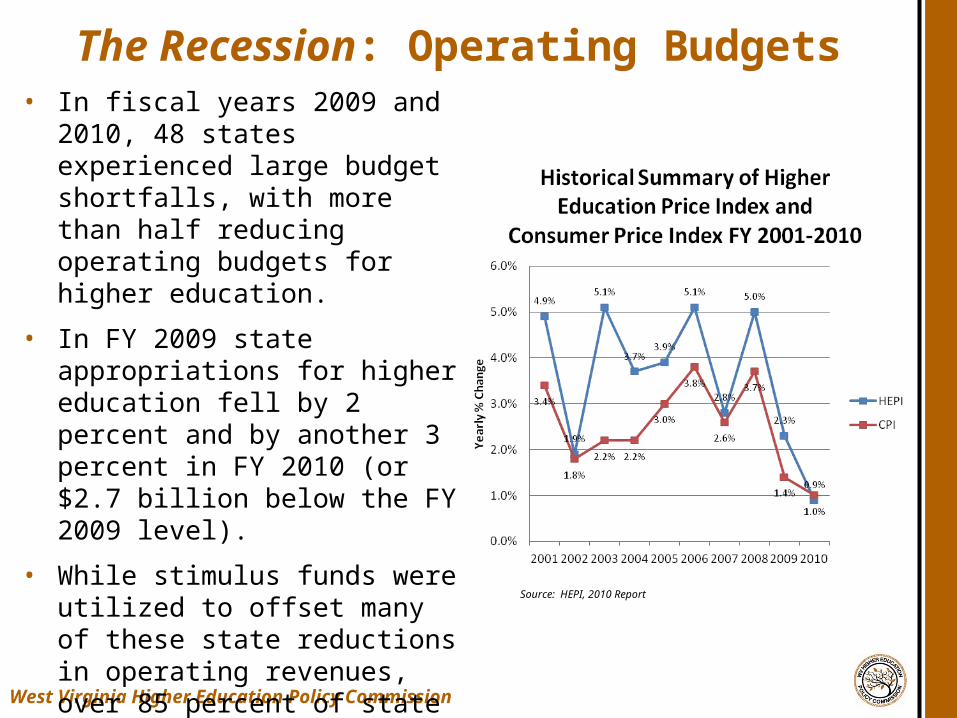
The Recession: Operating Budgets
West Virginia Higher Education Policy Commission
• In fiscal years 2009 and 2010, 48 states experienced large budget shortfalls, with more than half reducing operating budgets for higher education.
• In FY 2009 state appropriations for higher education fell by 2 percent and by another 3 percent in FY 2010 (or $2.7 billion below the FY 2009 level).
• While stimulus funds were utilized to offset many of these state reductions in operating revenues, over 85 percent of state stimulus aid was exhausted in FY 2009 and 2010.
Source: AASCU, Fiscal and State Policy Issues Affecting Postsecondary Education: State Outlook, 2010; AGB, 2010).
Source: HEPI, 2010 Report
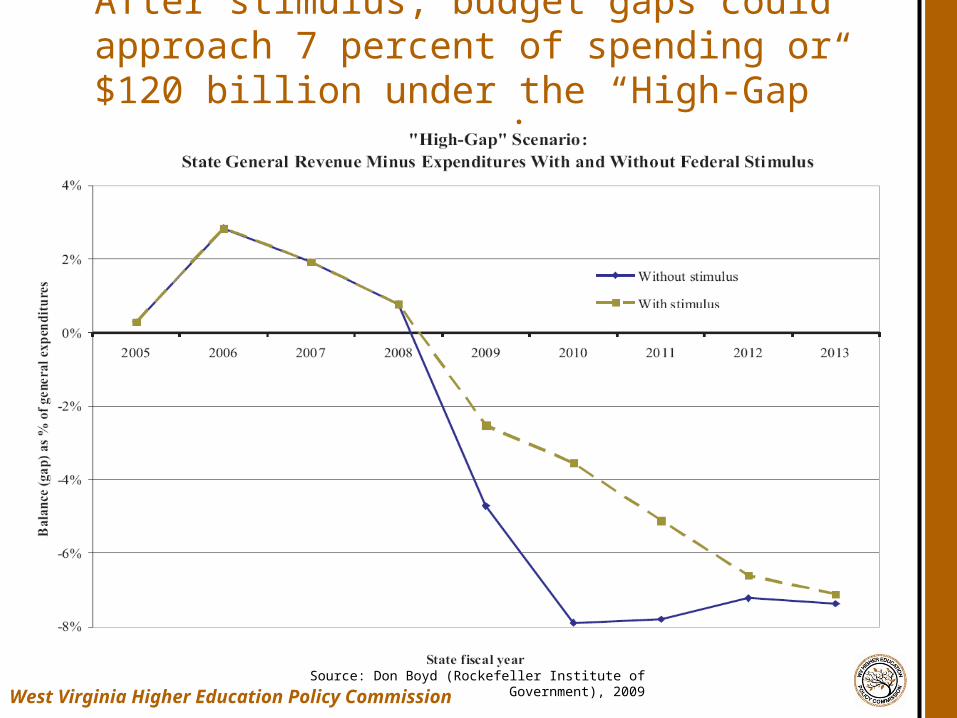
After stimulus, budget gaps could approach 7 percent of spending or $120 billion under the “High-Gap” scenario
Source: Don Boyd (Rockefeller Institute of Government), 2009
West Virginia Higher Education Policy Commission
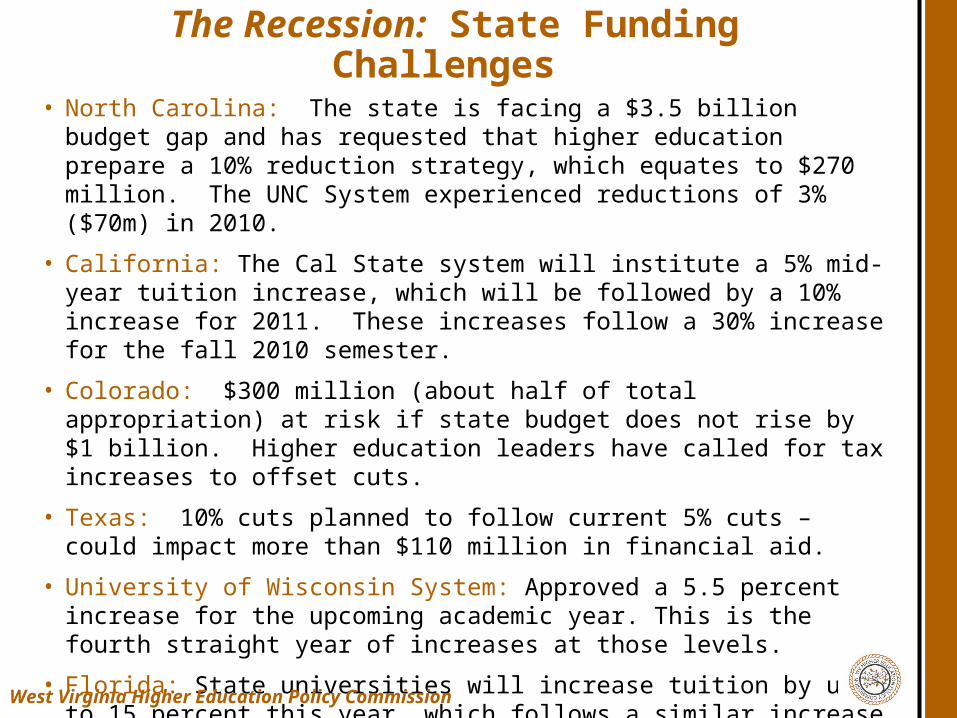
• North Carolina: The state is facing a $3.5 billion budget gap and has requested that higher education prepare a 10% reduction strategy, which equates to $270 million. The UNC System experienced reductions of 3% ($70m) in 2010.
• California: The Cal State system will institute a 5% mid-year tuition increase, which will be followed by a 10% increase for 2011. These increases follow a 30% increase for the fall 2010 semester.
• Colorado: $300 million (about half of total appropriation) at risk if state budget does not rise by $1 billion. Higher education leaders have called for tax increases to offset cuts.
• Texas: 10% cuts planned to follow current 5% cuts – could impact more than $110 million in financial aid.
• University of Wisconsin System: Approved a 5.5 percent increase for the upcoming academic year. This is the fourth straight year of increases at those levels.
• Florida: State universities will increase tuition by up to 15 percent this year, which follows a similar increase for the prior academic year.
• Northeastern University: Eliminated the football program to offset declining revenues.
The Recession: State Funding Challenges
West Virginia Higher Education Policy Commission
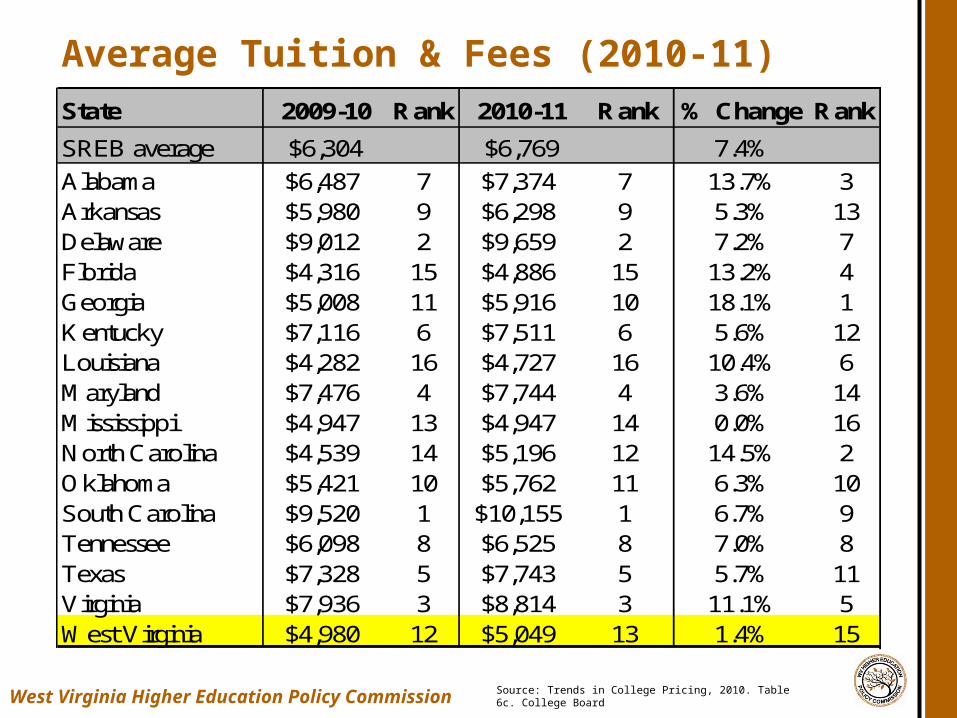
Average Tuition & Fees (2010-11)
Source: Trends in College Pricing, 2010. Table 6c. College BoardWest Virginia Higher Education Policy Commission
State 2009-10 Rank 2010-11 Rank % Change Rank
SREB average $6,304 $6,769 7.4%
Alabama $6,487 7 $7,374 7 13.7% 3Arkansas $5,980 9 $6,298 9 5.3% 13Delaware $9,012 2 $9,659 2 7.2% 7Florida $4,316 15 $4,886 15 13.2% 4Georgia $5,008 11 $5,916 10 18.1% 1Kentucky $7,116 6 $7,511 6 5.6% 12Louisiana $4,282 16 $4,727 16 10.4% 6Maryland $7,476 4 $7,744 4 3.6% 14Mississippi $4,947 13 $4,947 14 0.0% 16North Carolina $4,539 14 $5,196 12 14.5% 2Oklahoma $5,421 10 $5,762 11 6.3% 10South Carolina $9,520 1 $10,155 1 6.7% 9Tennessee $6,098 8 $6,525 8 7.0% 8Texas $7,328 5 $7,743 5 5.7% 11Virginia $7,936 3 $8,814 3 11.1% 5West Virginia $4,980 12 $5,049 13 1.4% 15
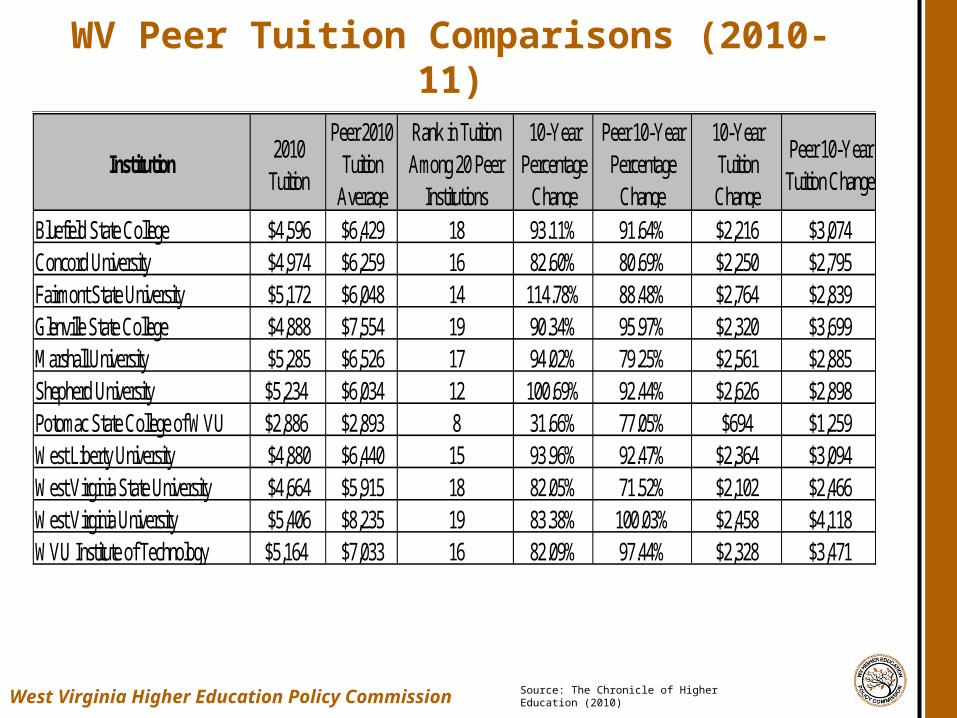
WV Peer Tuition Comparisons (2010-11)
Source: The Chronicle of Higher Education (2010)West Virginia Higher Education Policy Commission
Institution2010
Tuition
Peer 2010 Tuition
Average
Rank in Tuition Among 20 Peer
Institutions
10-Year Percentage
Change
Peer 10-Year Percentage
Change
10-Year Tuition Change
Peer 10-Year Tuition Change
Bluefield State College $4,596 $6,429 18 93.11% 91.64% $2,216 $3,074Concord University $4,974 $6,259 16 82.60% 80.69% $2,250 $2,795Fairmont State University $5,172 $6,048 14 114.78% 88.48% $2,764 $2,839Glenville State College $4,888 $7,554 19 90.34% 95.97% $2,320 $3,699Marshall University $5,285 $6,526 17 94.02% 79.25% $2,561 $2,885Shepherd University $5,234 $6,034 12 100.69% 92.44% $2,626 $2,898Potomac State College of WVU $2,886 $2,893 8 31.66% 77.05% $694 $1,259West Liberty University $4,880 $6,440 15 93.96% 92.47% $2,364 $3,094West Virginia State University $4,664 $5,915 18 82.05% 71.52% $2,102 $2,466West Virginia University $5,406 $8,235 19 83.38% 100.03% $2,458 $4,118WVU Institute of Technology $5,164 $7,033 16 82.09% 97.44% $2,328 $3,471
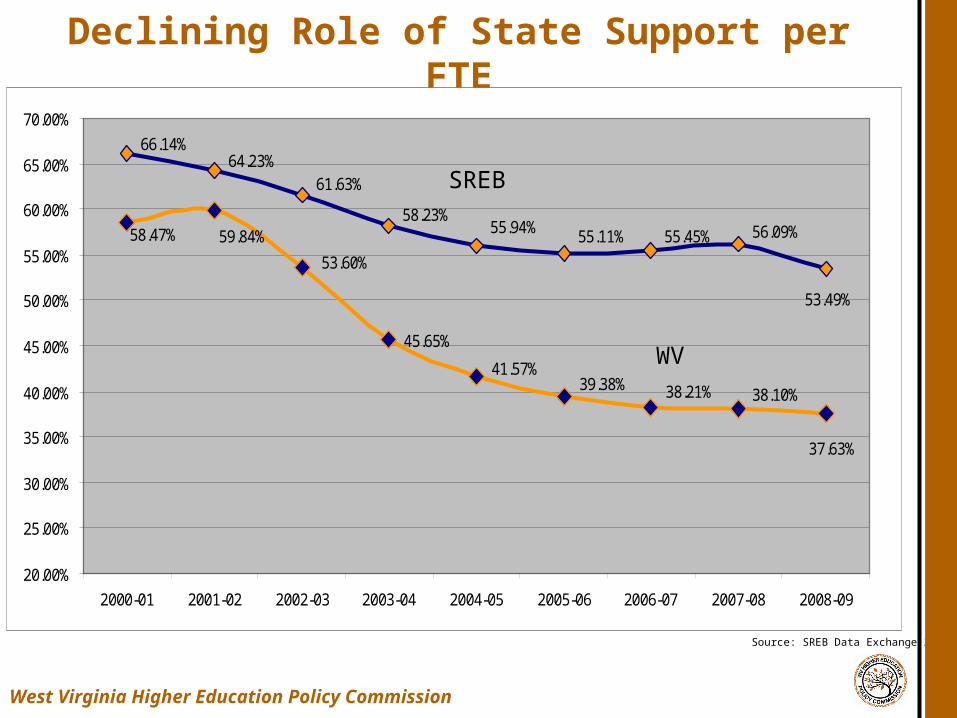
Declining Role of State Support per FTE
Source: SREB Data Exchange 2009
West Virginia Higher Education Policy Commission
45.65%
66.14%64.23%
61.63%
58.23%55.94% 55.11% 55.45% 56.09%
53.49%
41.57%39.38% 38.21% 38.10%
37.63%
53.60%
59.84%58.47%
20.00%
25.00%
30.00%
35.00%
40.00%
45.00%
50.00%
55.00%
60.00%
65.00%
70.00%
2000-01 2001-02 2002-03 2003-04 2004-05 2005-06 2006-07 2007-08 2008-09
SREB
WV
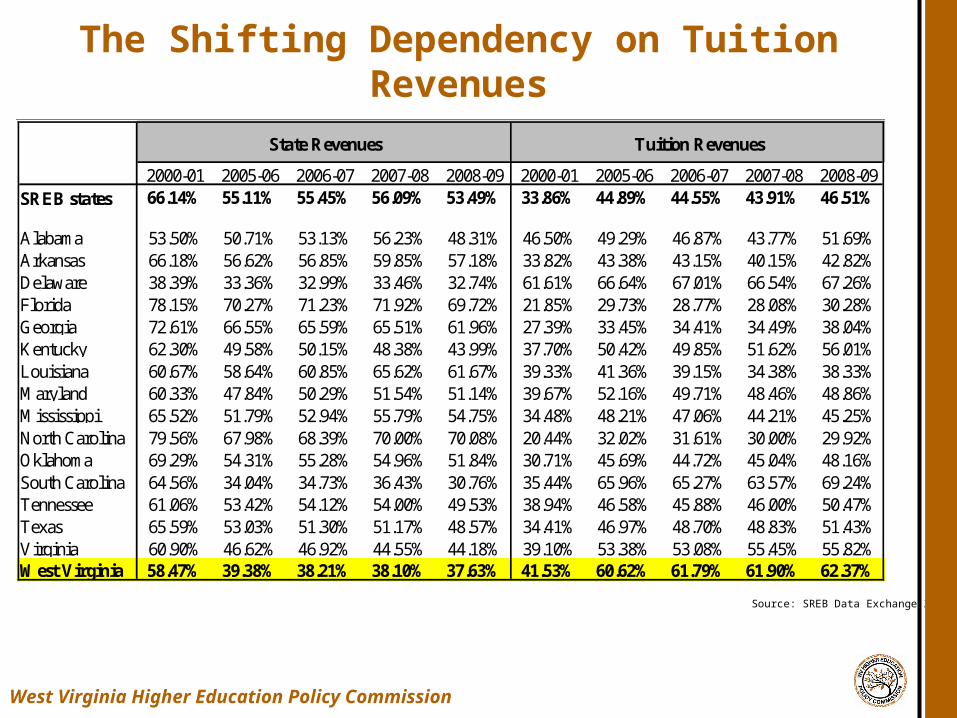
The Shifting Dependency on Tuition Revenues
Source: SREB Data Exchange 2009
West Virginia Higher Education Policy Commission
2000-01 2005-06 2006-07 2007-08 2008-09 2000-01 2005-06 2006-07 2007-08 2008-09SREB states 66.14% 55.11% 55.45% 56.09% 53.49% 33.86% 44.89% 44.55% 43.91% 46.51%
Alabama 53.50% 50.71% 53.13% 56.23% 48.31% 46.50% 49.29% 46.87% 43.77% 51.69%Arkansas 66.18% 56.62% 56.85% 59.85% 57.18% 33.82% 43.38% 43.15% 40.15% 42.82%Delaware 38.39% 33.36% 32.99% 33.46% 32.74% 61.61% 66.64% 67.01% 66.54% 67.26%Florida 78.15% 70.27% 71.23% 71.92% 69.72% 21.85% 29.73% 28.77% 28.08% 30.28%Georgia 72.61% 66.55% 65.59% 65.51% 61.96% 27.39% 33.45% 34.41% 34.49% 38.04%Kentucky 62.30% 49.58% 50.15% 48.38% 43.99% 37.70% 50.42% 49.85% 51.62% 56.01%Louisiana 60.67% 58.64% 60.85% 65.62% 61.67% 39.33% 41.36% 39.15% 34.38% 38.33%Maryland 60.33% 47.84% 50.29% 51.54% 51.14% 39.67% 52.16% 49.71% 48.46% 48.86%Mississippi 65.52% 51.79% 52.94% 55.79% 54.75% 34.48% 48.21% 47.06% 44.21% 45.25%North Carolina 79.56% 67.98% 68.39% 70.00% 70.08% 20.44% 32.02% 31.61% 30.00% 29.92%Oklahoma 69.29% 54.31% 55.28% 54.96% 51.84% 30.71% 45.69% 44.72% 45.04% 48.16%South Carolina 64.56% 34.04% 34.73% 36.43% 30.76% 35.44% 65.96% 65.27% 63.57% 69.24%Tennessee 61.06% 53.42% 54.12% 54.00% 49.53% 38.94% 46.58% 45.88% 46.00% 50.47%Texas 65.59% 53.03% 51.30% 51.17% 48.57% 34.41% 46.97% 48.70% 48.83% 51.43%Virginia 60.90% 46.62% 46.92% 44.55% 44.18% 39.10% 53.38% 53.08% 55.45% 55.82%West Virginia 58.47% 39.38% 38.21% 38.10% 37.63% 41.53% 60.62% 61.79% 61.90% 62.37%
State Revenues Tuition Revenues
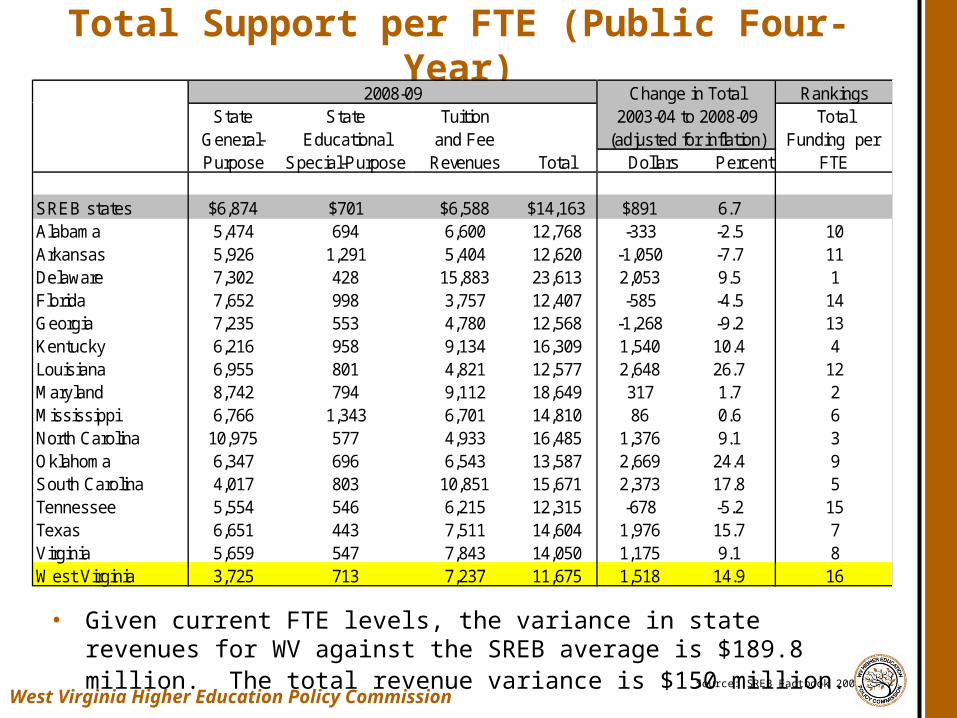
Total Support per FTE (Public Four-Year)
Source: SREB Factbook 2009
West Virginia Higher Education Policy Commission
2008-09 Change in Total RankingsState State Tuition 2003-04 to 2008-09 Total
General- Educational and Fee (adjusted for inflation) Funding per Purpose Special-Purpose Revenues Total Dollars Percent FTE
SREB states $6,874 $701 $6,588 $14,163 $891 6.7Alabama 5,474 694 6,600 12,768 -333 -2.5 10Arkansas 5,926 1,291 5,404 12,620 -1,050 -7.7 11Delaware 7,302 428 15,883 23,613 2,053 9.5 1Florida 7,652 998 3,757 12,407 -585 -4.5 14Georgia 7,235 553 4,780 12,568 -1,268 -9.2 13Kentucky 6,216 958 9,134 16,309 1,540 10.4 4Louisiana 6,955 801 4,821 12,577 2,648 26.7 12Maryland 8,742 794 9,112 18,649 317 1.7 2Mississippi 6,766 1,343 6,701 14,810 86 0.6 6North Carolina 10,975 577 4,933 16,485 1,376 9.1 3Oklahoma 6,347 696 6,543 13,587 2,669 24.4 9South Carolina 4,017 803 10,851 15,671 2,373 17.8 5Tennessee 5,554 546 6,215 12,315 -678 -5.2 15Texas 6,651 443 7,511 14,604 1,976 15.7 7Virginia 5,659 547 7,843 14,050 1,175 9.1 8West Virginia 3,725 713 7,237 11,675 1,518 14.9 16
• Given current FTE levels, the variance in state revenues for WV against the SREB average is $189.8 million. The total revenue variance is $150 million.
• Indiana, Pennsylvania, Tennessee, Ohio, Louisiana, and West Virginia have all made changes to their funding formulas to reward completion, not just enrollment.
• Many states have attempted to use such formulae to distribute budget reductions.
• The state of Washington has begun providing performance based funding to their community and technical colleges based on intermediate markers of students success (momentum points) such as developing basic skills, first year retention, and completing college level math.
• Lumina Making Opportunity efforts are focused upon such initiatives are should be looked to for emerging best practices.
Policy Strategies: Change Funding Structures
West Virginia Higher Education Policy Commission
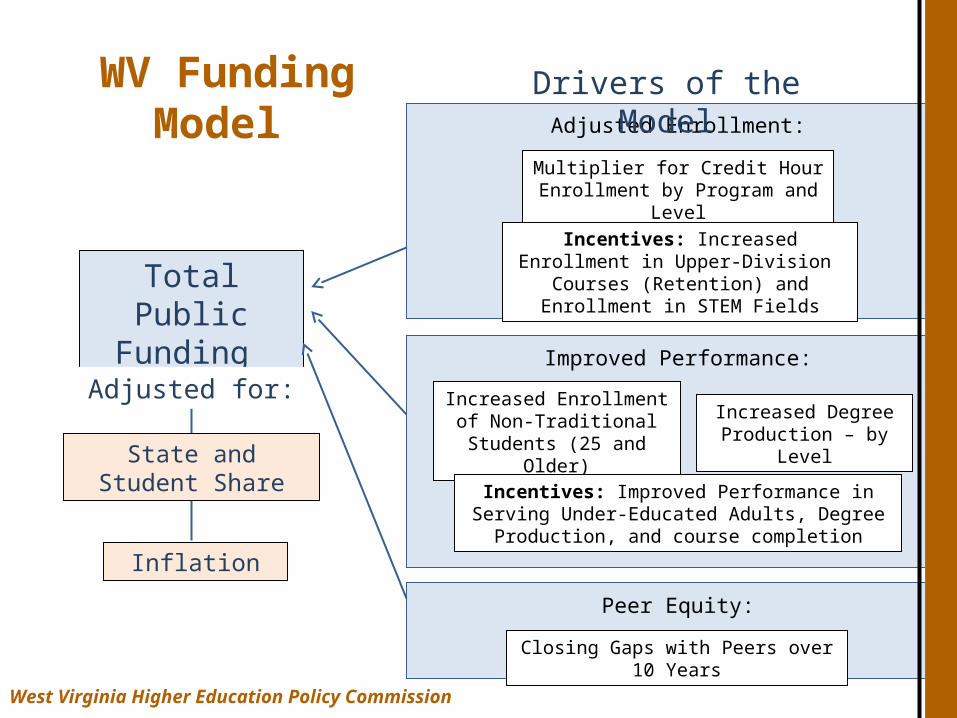
WV Funding Model
Total Public Funding
Multiplier for Credit Hour Enrollment by Program and Level
Adjusted Enrollment:
Incentives: Increased Enrollment in Upper-Division Courses (Retention) and
Enrollment in STEM Fields
Improved Performance:
Increased Enrollment of Non-Traditional Students (25 and
Older)
Increased Degree Production – by Level
Incentives: Improved Performance in Serving Under-Educated Adults, Degree Production, and course
completion
Drivers of the Model
State and Student Share
Inflation
Adjusted for:
Closing Gaps with Peers over 10 Years
Peer Equity:
West Virginia Higher Education Policy Commission
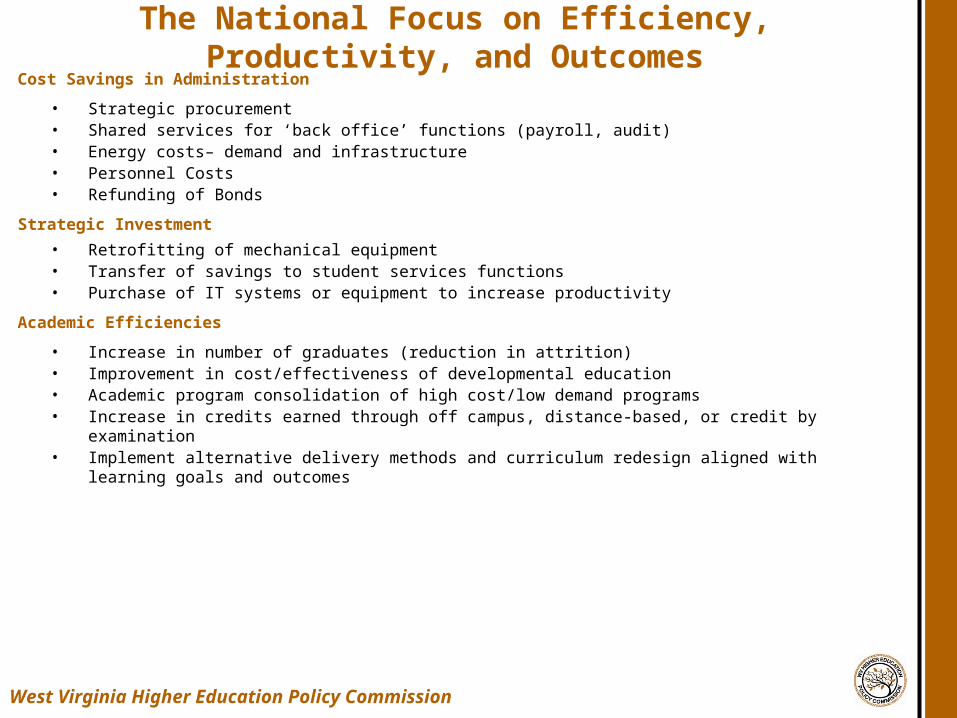
The National Focus on Efficiency, Productivity, and OutcomesCost Savings in Administration
• Strategic procurement• Shared services for ‘back office’ functions (payroll, audit) • Energy costs– demand and infrastructure• Personnel Costs• Refunding of Bonds
Strategic Investment
• Retrofitting of mechanical equipment• Transfer of savings to student services functions• Purchase of IT systems or equipment to increase productivity
Academic Efficiencies
• Increase in number of graduates (reduction in attrition) • Improvement in cost/effectiveness of developmental education• Academic program consolidation of high cost/low demand programs• Increase in credits earned through off campus, distance-based, or credit by examination• Implement alternative delivery methods and curriculum redesign aligned with learning goals and outcomes
West Virginia Higher Education Policy Commission
• Sustained pressure to increase the number of college degrees awarded so that increased educational attainment levels can lead to state-wide economic improvement and expanded civic engagement.
• Increase the number of degrees awarded in STEM fields by expanding coursework offerings and academic programs in science, math, and technology fields.
• Pressures to protect the state’s investment in human capital and our students’ investment of personal capital by increasing graduation and retention rates.
• Pressure to protect and subsequently measure quality through the assessment of learning and educational activity (CLA and NSSE).
Accountability: The National Accent on Performance
West Virginia Higher Education Policy Commission
• National and regional policy organizations have made the topic of completion the national agenda. This work is heavily supported by foundation efforts.
• Complete College America: Alliance of 24 states focused on taking bold actions to significantly increase the number of students successfully completing college and achieving degrees and credentials with value in the labor market. Participating states have pledged efforts to close attainment gaps for traditionally underrepresented populations.
• The College Board: A ten-part action plan called the College Completion Agenda Developed with the goal of 55 percent of 25- to 34-year-olds earning an associate’s degree or higher by 2025.
Accountability: The Focus on College Completion
West Virginia Higher Education Policy Commission
• National Governors Association: Complete to Compete initiative aimed at significantly enhancing degree attainment through better data collection and increased higher education productivity.
• Completion metrics are in two categories: Outcomes (graduation and transfer rates, number of degrees awarded and the average amount of time and number of credits it takes to get a degree) and Progress (enrollment and success rates for remedial education, success rates in first-year courses, retention rates, and the number of credits finished in the first year.)
• These measures should be collected and reported at the campus, system, and state levels, and should be broken out by race, income (measured by whether or not a student receives a Pell Grant), age, and full-time/part-time status.
• Productivity metrics are being developed.
Accountability: The Focus on College Completion
West Virginia Higher Education Policy Commission
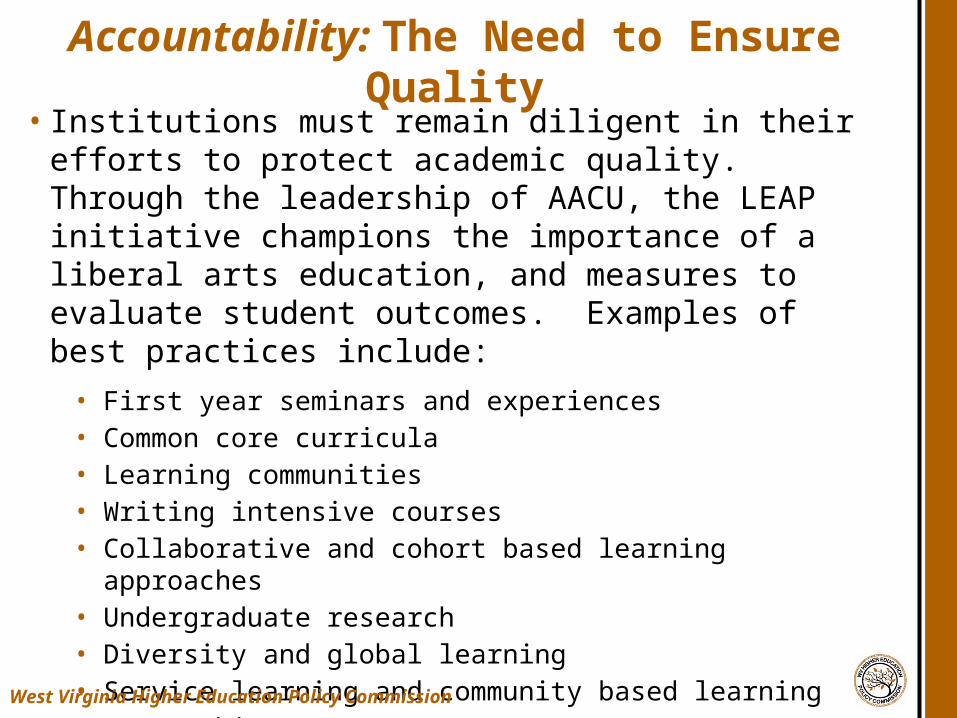
• Institutions must remain diligent in their efforts to protect academic quality. Through the leadership of AACU, the LEAP initiative champions the importance of a liberal arts education, and measures to evaluate student outcomes. Examples of best practices include:
• First year seminars and experiences• Common core curricula• Learning communities• Writing intensive courses• Collaborative and cohort based learning approaches• Undergraduate research• Diversity and global learning• Service learning and community based learning• Internships• Capstone Courses
Accountability: The Need to Ensure Quality
West Virginia Higher Education Policy Commission
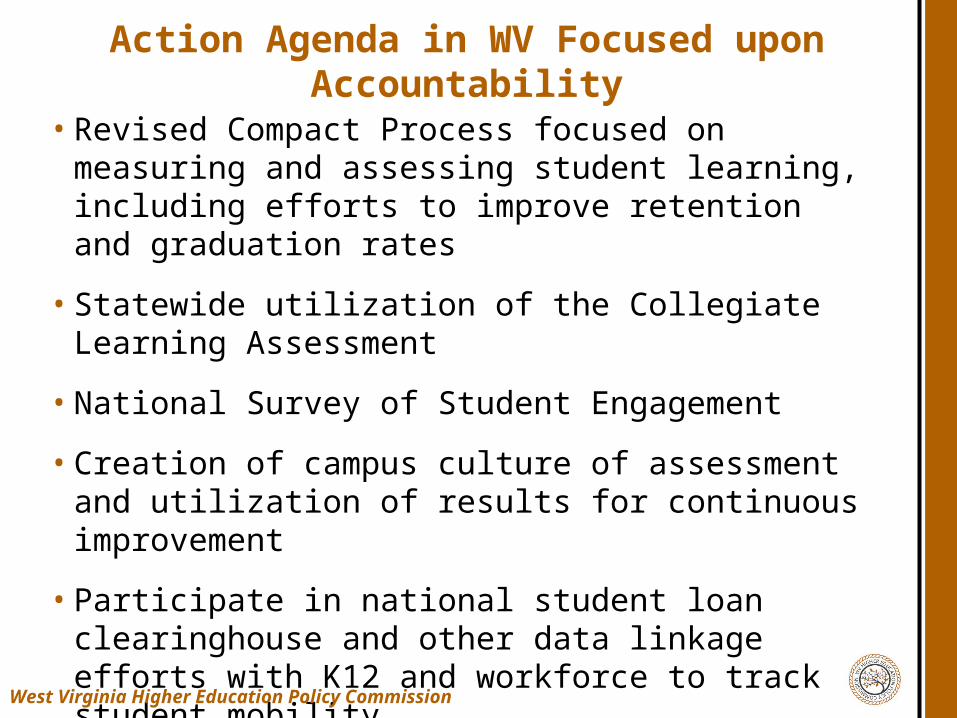
• Revised Compact Process focused on measuring and assessing student learning, including efforts to improve retention and graduation rates
• Statewide utilization of the Collegiate Learning Assessment
• National Survey of Student Engagement
• Creation of campus culture of assessment and utilization of results for continuous improvement
• Participate in national student loan clearinghouse and other data linkage efforts with K12 and workforce to track student mobility
• Movement to incentive funding to accentuate public agenda goals
Action Agenda in WV Focused upon Accountability
West Virginia Higher Education Policy Commission
Inputs (Population Projections)
Input Rates Throughput Rates
Assessed Outcomes
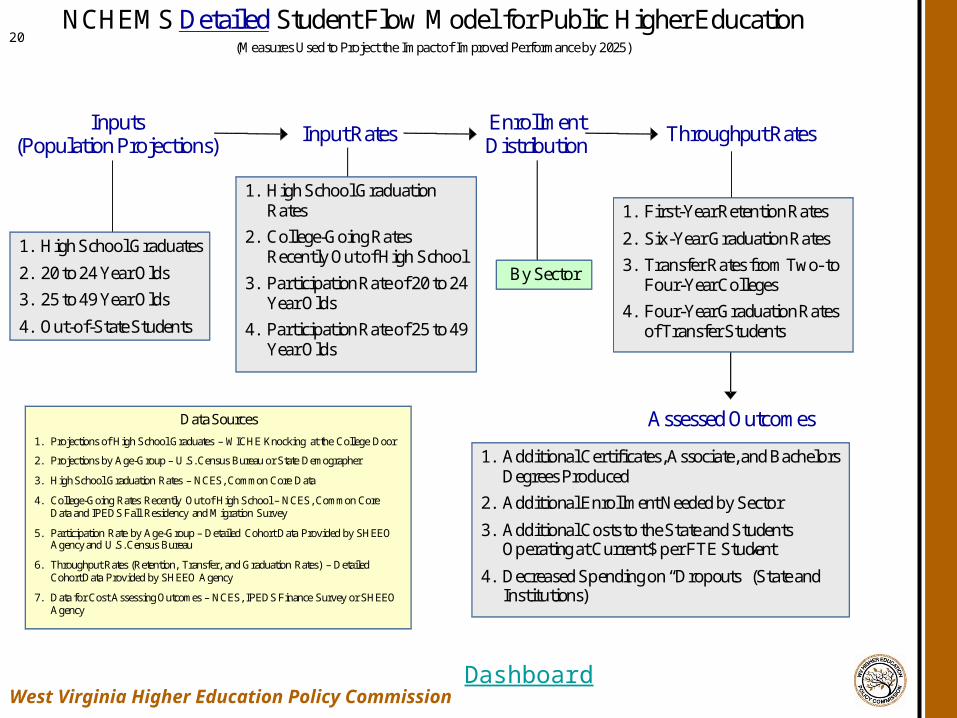
NCHEMS Detailed Student Flow Model for Public Higher Education(Measures Used to Project the Impact of Improved Performance by 2025)
1. High School Graduates
2. 20 to 24 Year Olds
3. 25 to 49 Year Olds
4. Out-of-State Students
1. High School Graduation Rates
2. College-Going Rates Recently Out of High School
3. Participation Rate of 20 to 24 Year Olds
4. Participation Rate of 25 to 49 Year Olds
1. First-Year Retention Rates
2. Six-Year Graduation Rates
3. Transfer Rates from Two- to Four-Year Colleges
4. Four-Year Graduation Rates of Transfer Students
By Sector
1. Additional Certificates, Associate, and Bachelors Degrees Produced
2. Additional Enrollment Needed by Sector
3. Additional Costs to the State and Students Operating at Current $ per FTE Student
4. Decreased Spending on “Dropouts” (State and Institutions)
Enrollment Distribution
Data Sources
1. Projections of High School Graduates – WICHE Knocking at the College Door
2. Projections by Age-Group – U.S. Census Bureau or State Demographer
3. High School Graduation Rates – NCES, Common Core Data
4. College-Going Rates Recently Out of High School – NCES, Common Core Data and IPEDS Fall Residency and Migration Survey
5. Participation Rate by Age-Group – Detailed Cohort Data Provided by SHEEO Agency and U.S. Census Bureau
6. Throughput Rates (Retention, Transfer, and Graduation Rates) – Detailed Cohort Data Provided by SHEEO Agency
7. Data for Cost Assessing Outcomes – NCES, IPEDS Finance Survey or SHEEO Agency
20
DashboardWest Virginia Higher Education Policy Commission
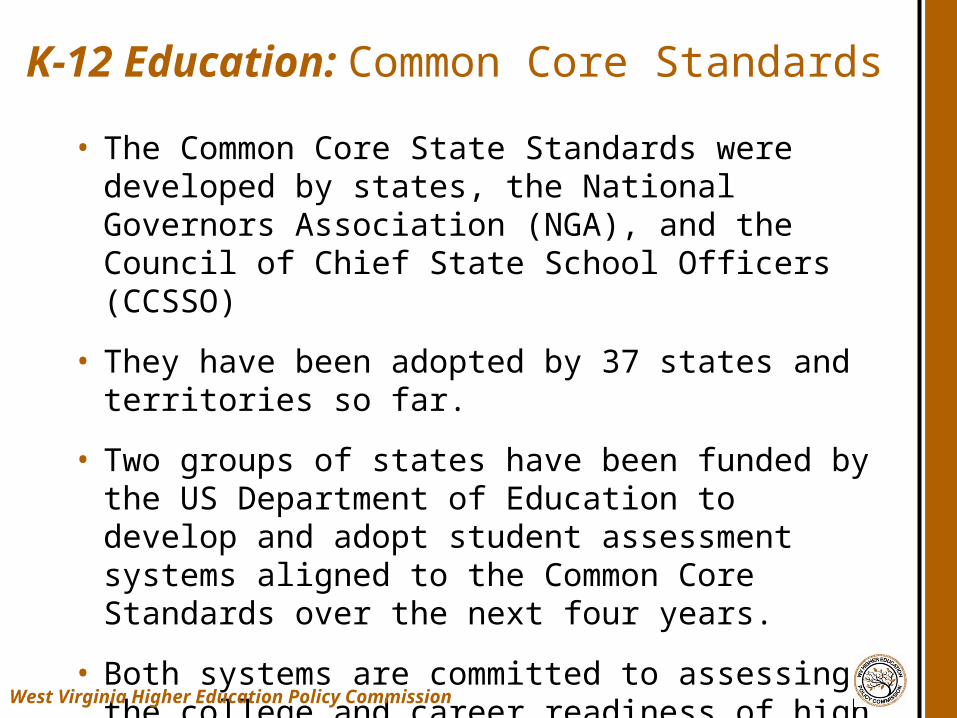
• The Common Core State Standards were developed by states, the National Governors Association (NGA), and the Council of Chief State School Officers (CCSSO)
• They have been adopted by 37 states and territories so far.
• Two groups of states have been funded by the US Department of Education to develop and adopt student assessment systems aligned to the Common Core Standards over the next four years.
• Both systems are committed to assessing the college and career readiness of high school students and are intended to facilitate alignment between K-12 and higher education standards.
K-12 Education: Common Core Standards
West Virginia Higher Education Policy Commission
• Approximately 40 percent of all students enrolled in education enroll in at least one remedial course at an estimated to cost states of $1 billion per year.
• Aligning expectations for student learning outcomes between K-12 and higher education can facilitate a decrease in the need for remediation as well as provide a basis for increased use of dual enrollment.
• Related efforts focus on common assessments of readiness and early remediation, an initiative championed by SREB.
• National Center for Academic Transformation (NCAT) has helped hundreds of colleges use technology to increase student performance and decrease costs. Tennessee, Maryland, and Arizona all have multi-institution course redesigns taking place.
• Recent reforms in Tennessee deserve review and consideration for states considering such policy change.
Course Alignment and Remediation
West Virginia Higher Education Policy Commission
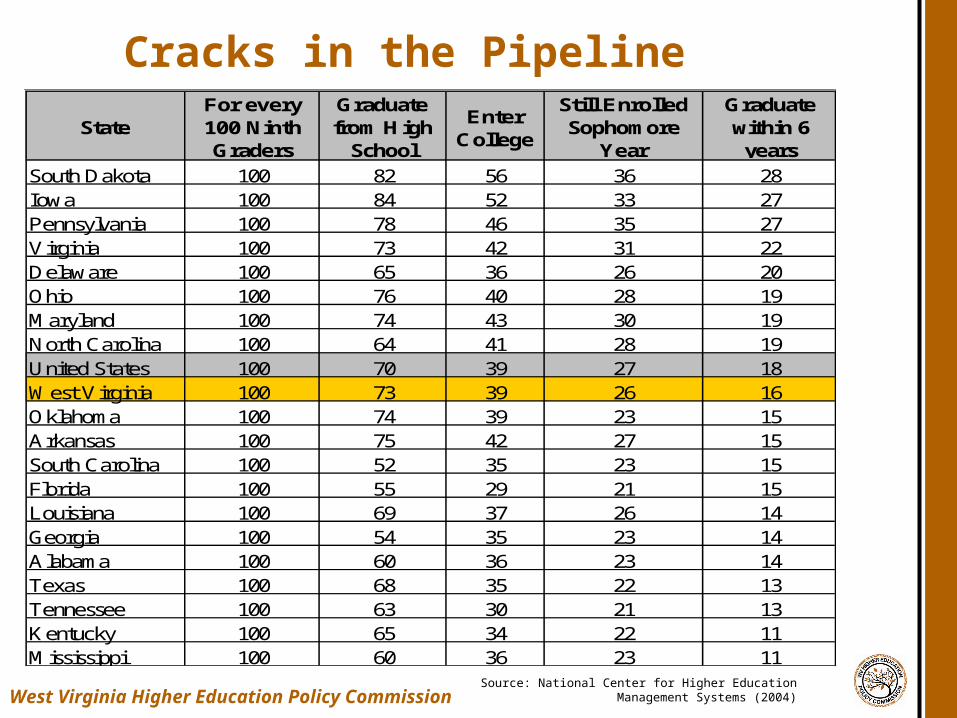
Cracks in the Pipeline
Source: National Center for Higher Education Management Systems (2004)
StateFor every 100 Ninth Graders
Graduate from High
School
Enter College
Still Enrolled Sophomore
Year
Graduate within 6
years
South Dakota 100 82 56 36 28Iowa 100 84 52 33 27Pennsylvania 100 78 46 35 27Virginia 100 73 42 31 22Delaware 100 65 36 26 20Ohio 100 76 40 28 19Maryland 100 74 43 30 19North Carolina 100 64 41 28 19United States 100 70 39 27 18West Virginia 100 73 39 26 16Oklahoma 100 74 39 23 15Arkansas 100 75 42 27 15South Carolina 100 52 35 23 15Florida 100 55 29 21 15Louisiana 100 69 37 26 14Georgia 100 54 35 23 14Alabama 100 60 36 23 14Texas 100 68 35 22 13Tennessee 100 63 30 21 13Kentucky 100 65 34 22 11Mississippi 100 60 36 23 11
West Virginia Higher Education Policy Commission
• Western Governors University – Indiana is an innovative model for offering competency based online bachelor and master’s degrees at a low-cost as part of a state system.
• Arizona has expanded partnerships between the state’s public universities and community colleges to provide more affordable options for students. This partnership includes joint admission, seamless transfer, and low-cost tuition guarantees.
• States such as Louisiana, Oklahoma, and West Virginia have developed targeted adult degree completion programs to drive adults with some college, but no degree, back to post-secondary education.
Policy Strategies: Expand non-traditional learning and focus on adults
West Virginia Higher Education Policy Commission
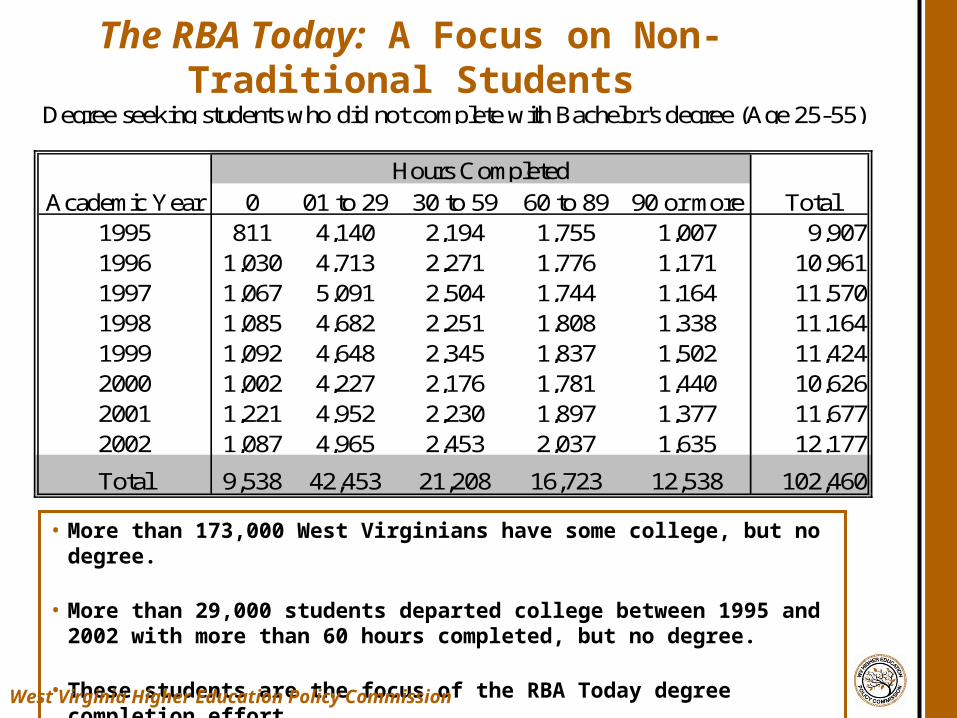
The RBA Today: A Focus on Non-Traditional Students
• More than 173,000 West Virginians have some college, but no degree.
• More than 29,000 students departed college between 1995 and 2002 with more than 60 hours completed, but no degree.
• These students are the focus of the RBA Today degree completion effort.
West Virginia Higher Education Policy Commission
0 01 to 29 30 to 59 60 to 89 90 or more Total1995 811 4,140 2,194 1,755 1,007 9,9071996 1,030 4,713 2,271 1,776 1,171 10,9611997 1,067 5,091 2,504 1,744 1,164 11,5701998 1,085 4,682 2,251 1,808 1,338 11,1641999 1,092 4,648 2,345 1,837 1,502 11,4242000 1,002 4,227 2,176 1,781 1,440 10,6262001 1,221 4,952 2,230 1,897 1,377 11,6772002 1,087 4,965 2,453 2,037 1,635 12,177
Total 9,538 42,453 21,208 16,723 12,538 102,460
Degree seeking students who did not complete with Bachelor's degree (Age 25-55)
Academic YearHours Completed
Global Competitiveness
• Once first in the world, America now ranks 10th in the percentage of young adults with a college degree.
• To lead the world again, we will need 60 percent of Americans to have a college degree. Our current attainment rate is 41 percent. Korea leads developed countries with 58 percent.
• For the first time in our history, the current generation of college-age Americans will be less educated than their parents’ generation.
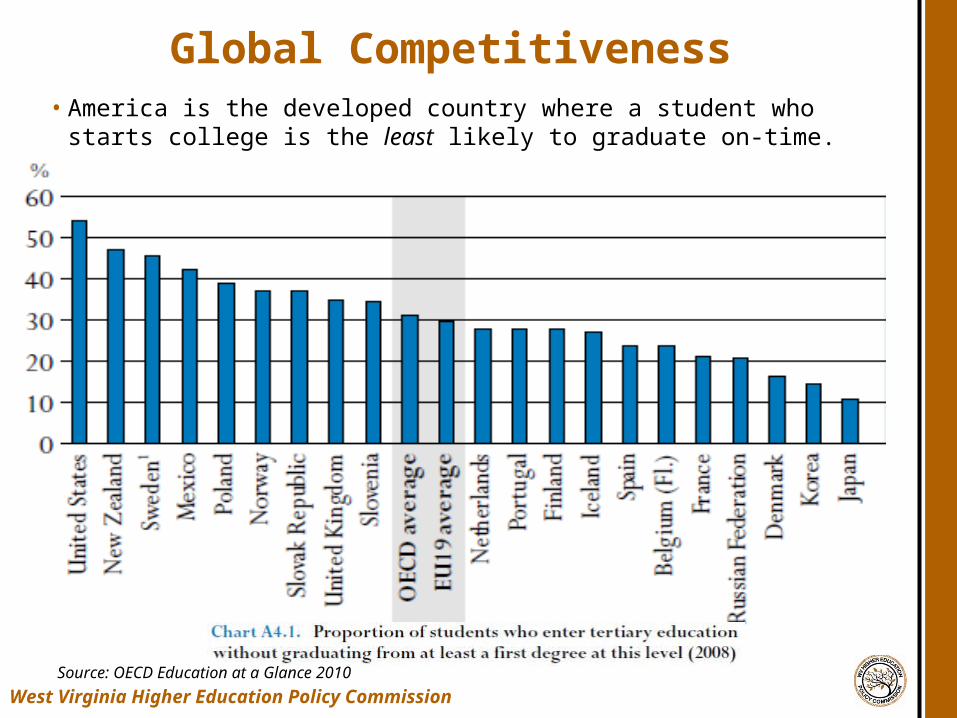
• America is the developed country where a student who starts college is the least likely to graduate on-time.
West Virginia Higher Education Policy Commission
Source: OECD Education at a Glance 2010
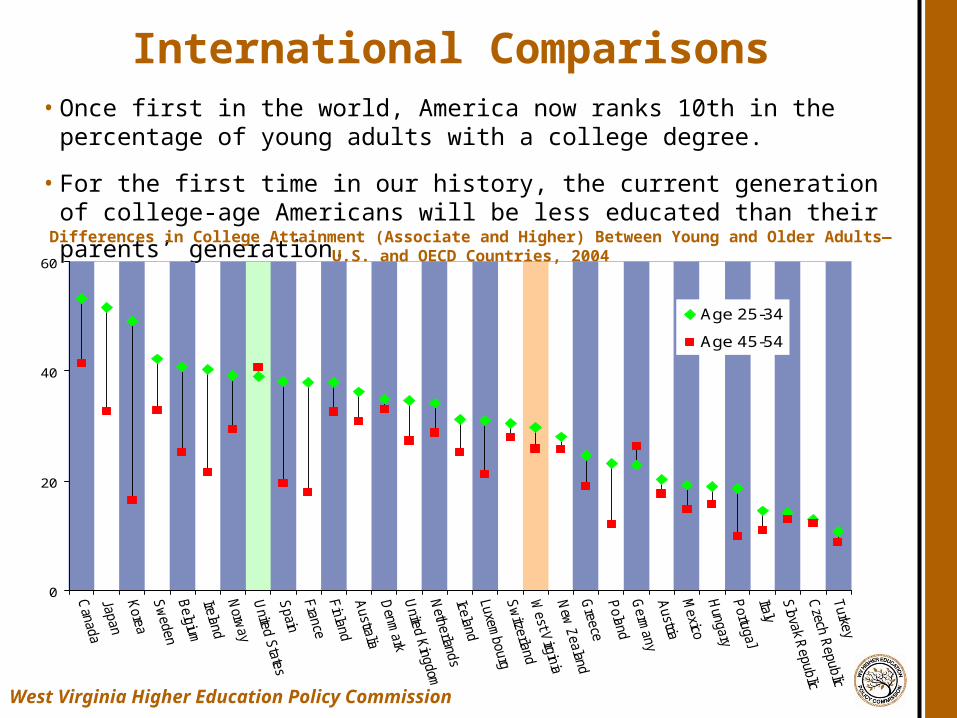
International Comparisons• Once first in the world, America now ranks 10th in the percentage of young adults
with a college degree.
• For the first time in our history, the current generation of college-age Americans will
be less educated than their parents’ generation.
West Virginia Higher Education Policy Commission
0
20
40
60
Age 25-34
Age 45-54
Differences in College Attainment (Associate and Higher) Between Young and Older Adults—U.S. and OECD Countries, 2004
Global Competitiveness
West Virginia Higher Education Policy CommissionSource: OECD Education at a Glance 2010
• America is the developed country where a student who starts college is the least likely to graduate on-time.
Changing Demographics
• U.S. Census Bureau data show that in 2005, 31 percent of white adults age 25 and older held at least a bachelor’s degree. For black adults it was 18 percent, and for Hispanic adults, 12 percent.
• Completion rates also differ significantly, with 59 percent of white students completing a bachelor’s degree in 6 years, but only 47 percent of Hispanic students and 41 percent of blacks do so.
• Without addressing the achievement gaps that exist between students from different racial, ethnic, and socioeconomic groups, the states and institutions will not be able to dramatically increase their college completion rates.
West Virginia Higher Education Policy Commission
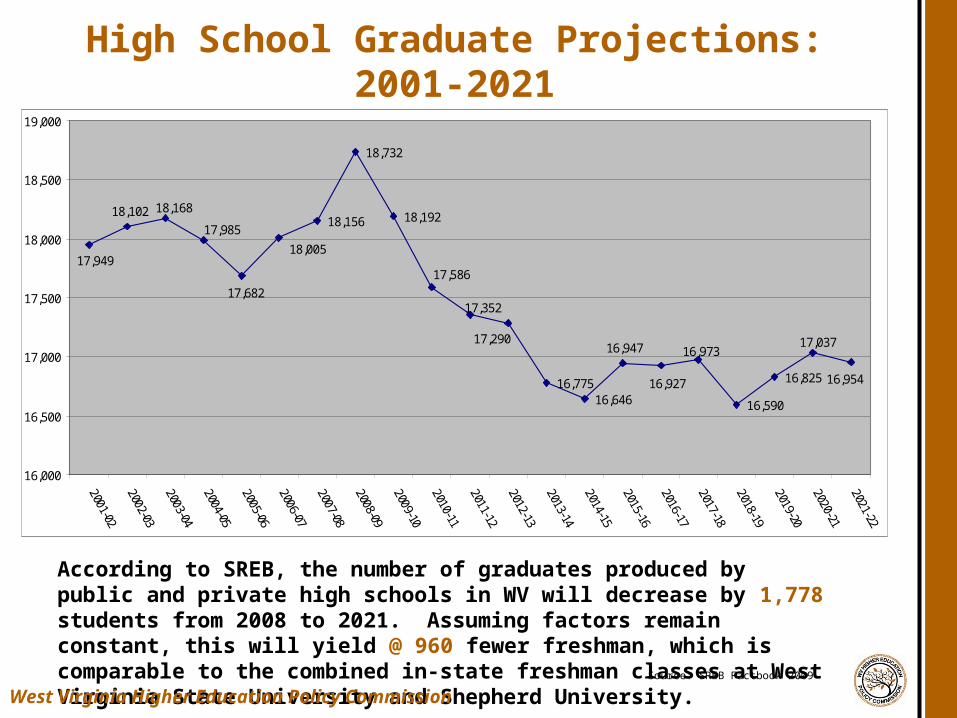
High School Graduate Projections: 2001-2021
According to SREB, the number of graduates produced by public and private high schools in WV will decrease by 1,778 students from 2008 to 2021. Assuming factors remain constant, this will yield @ 960 fewer freshman, which is comparable to the combined in-state freshman classes at West Virginia State University and Shepherd University. Source: SREB Factbook 2009
West Virginia Higher Education Policy Commission
18,156
18,732
18,192
16,77516,646 16,590
16,82516,927
16,947 16,973
16,954
17,037
18,102 18,168
17,985
18,005
17,682
17,949
17,352
17,586
17,290
16,000
16,500
17,000
17,500
18,000
18,500
19,000
1990 1995 2000 2005 2007 % Change
United States 20.3% 23.0% 24.4% 27.2% 27.5% 7.2%
SREB States 18.6% 19.9% 22.4% 23.8% 24.0% 5.4%
Alabama 15.7% 17.3% 19.0% 21.4% 21.4% 5.7%
Arkansas 13.3% 14.2% 16.7% 18.9% 19.3% 6.0%
Delaware 21.4% 22.9% 25.0% 27.6% 26.1% 4.7%
Florida 18.3% 22.1% 22.3% 25.8% 25.1% 6.8%
Georgia 19.6% 22.7% 24.3% 27.1% 27.1% 7.5%
Kentucky 13.6% 19.3% 17.1% 19.3% 20.0% 6.4%
Louisiana 16.1% 20.1% 18.7% 20.6% 20.4% 4.3%
Maryland 26.5% 26.4% 31.4% 34.5% 35.2% 8.7%
Mississippi 14.7% 17.6% 16.9% 18.7% 18.9% 4.2%
North Carolina 17.4% 20.6% 22.5% 25.1% 25.6% 8.2%
O klahoma 17.8% 19.1% 20.3% 22.4% 22.8% 5.0%
South Carolina 16.6% 18.2% 20.4% 23.0% 23.5% 6.9%
Tennessee 16.0% 17.8% 19.6% 21.8% 21.8% 5.8%
Texas 20.3% 22.0% 23.2% 25.1% 25.2% 4.9%
Virginia 24.5% 26.0% 29.5% 33.2% 33.6% 9.1%
West Virginia 12.3% 12.7% 14.8% 16.9% 17.3% 5.0%
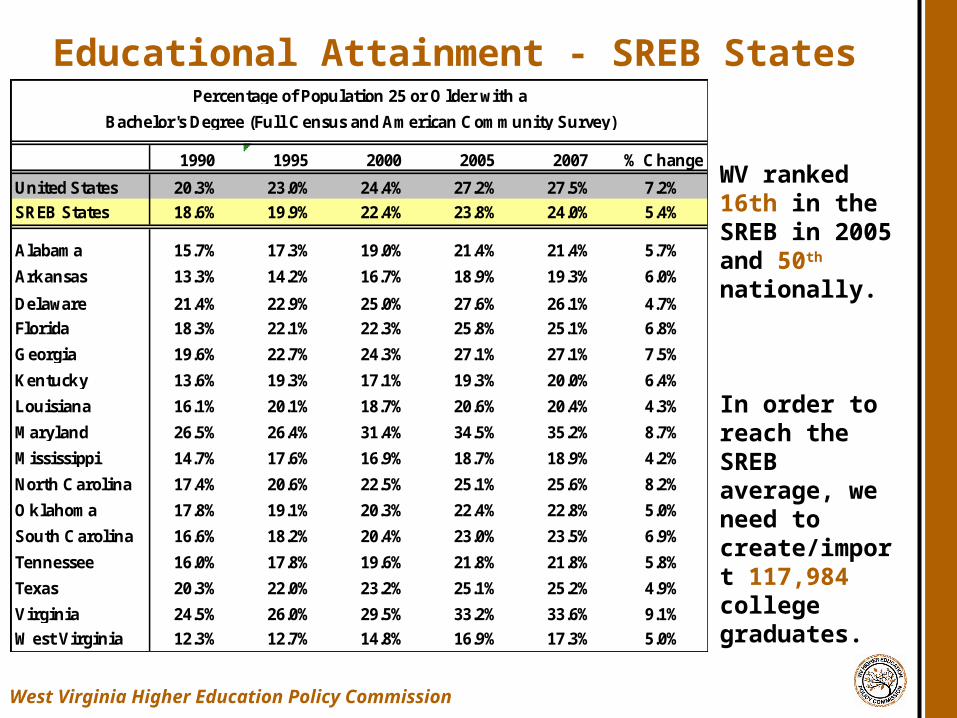
Percentage of Population 25 or O lder with a
Bachelor's Degree (Full Census and American Community Survey)
WV ranked 16th in the SREB in 2005 and 50th nationally.
In order to reach the SREB average, we need to create/import 117,984 college graduates.
Educational Attainment - SREB States
West Virginia Higher Education Policy Commission
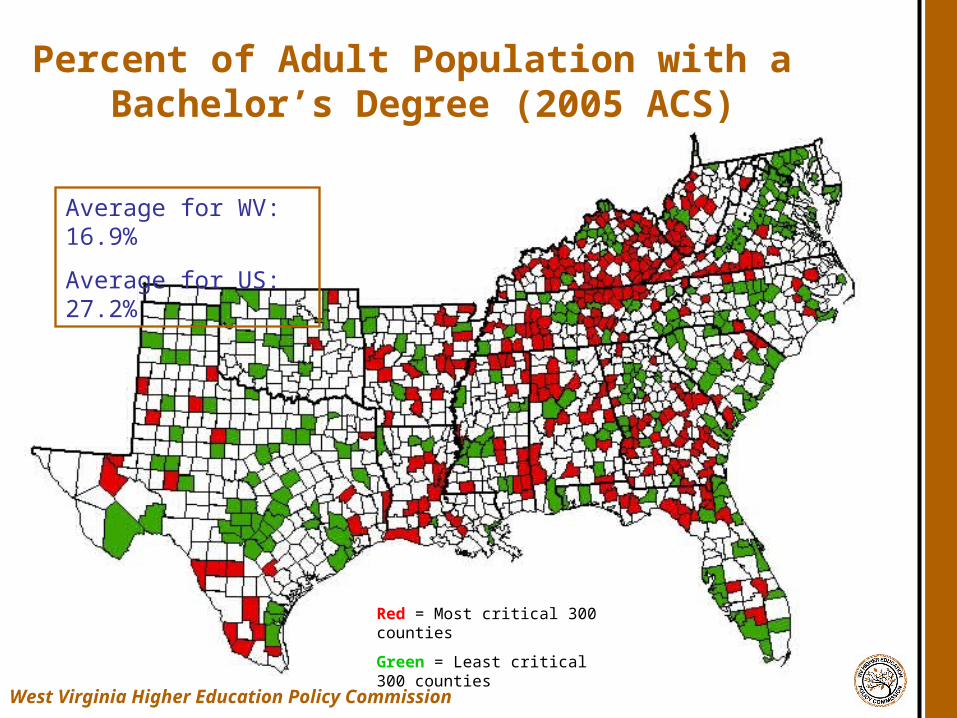
Percent of Adult Population with a Bachelor’s Degree (2005 ACS)
Red = Most critical 300 counties
Green = Least critical 300 counties
Average for WV: 16.9%
Average for US: 27.2%
West Virginia Higher Education Policy Commission
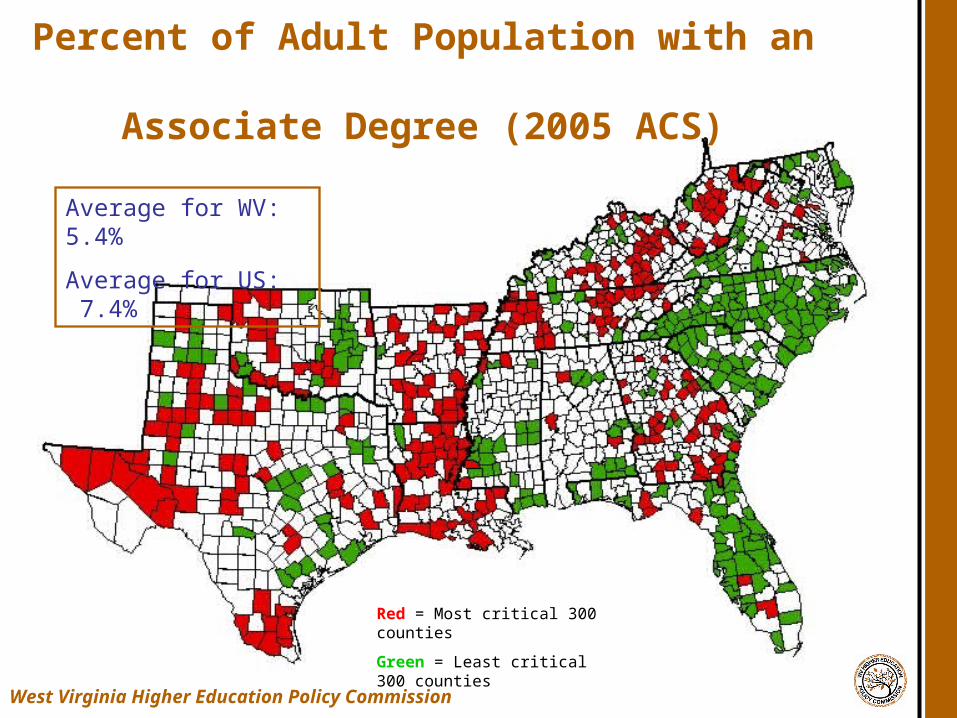
Percent of Adult Population with an Associate Degree (2005 ACS)
Red = Most critical 300 counties
Green = Least critical 300 counties
Average for WV: 5.4%
Average for US: 7.4%
West Virginia Higher Education Policy Commission
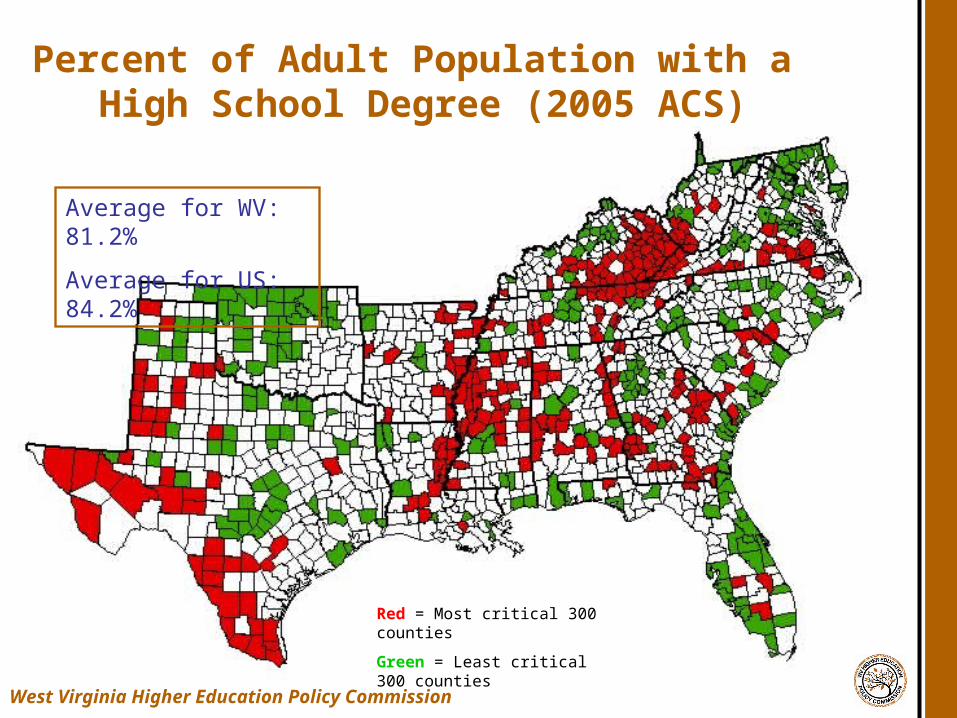
Percent of Adult Population with a High School Degree (2005 ACS)
Red = Most critical 300 counties
Green = Least critical 300 counties
Average for WV: 81.2%
Average for US: 84.2%
West Virginia Higher Education Policy Commission

Median Family Income (2005 ACS)
Red = Most critical 300 counties
Green = Least critical 300 counties
Average for WV: $38,568
Average for US: $54,273
West Virginia Higher Education Policy Commission
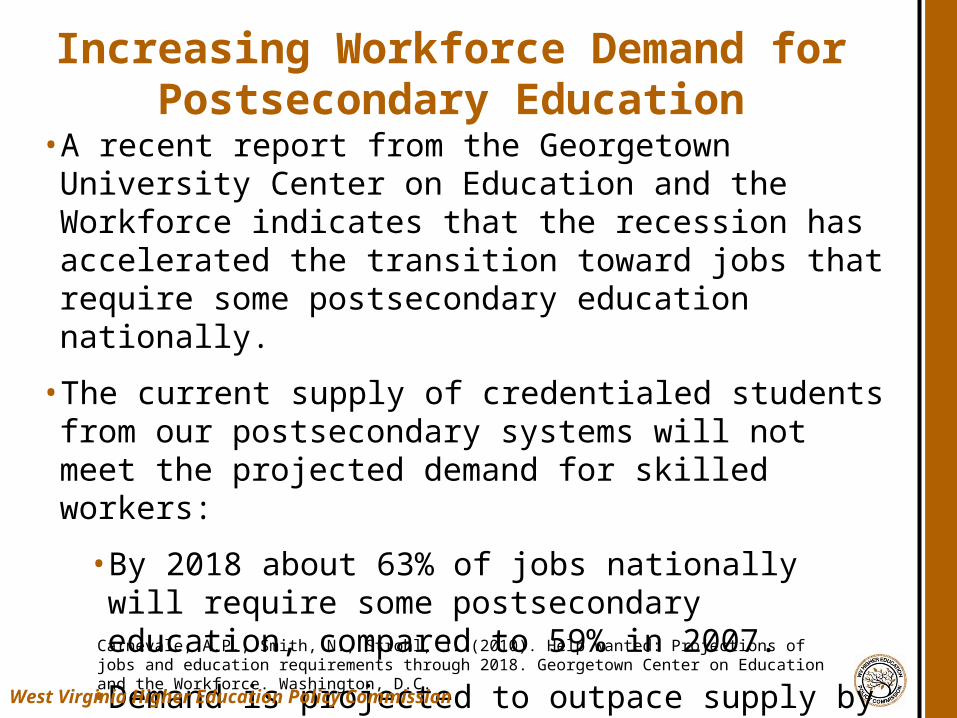
Increasing Workforce Demand for Postsecondary Education
• A recent report from the Georgetown University Center on Education and the Workforce indicates that the recession has accelerated the transition toward jobs that require some postsecondary education nationally.
• The current supply of credentialed students from our postsecondary systems will not meet the projected demand for skilled workers:
• By 2018 about 63% of jobs nationally will require some postsecondary education, compared to 59% in 2007.
• Demand is projected to outpace supply by about 300,000 college educated workers per year, creating a shortfall of about 3 million workers by 2018.
Carnevale, A.P., Smith, N., Strohl, J. (2010). Help wanted: Projections of jobs and education requirements through 2018. Georgetown Center on Education and the Workforce. Washington, D.C.
West Virginia Higher Education Policy Commission

40.541.642.943.146.747.7
50.852.455.758.1
1996-1997
1997-1998
1998-1999
1999-2000
2000-2001
2001-2002
2002-2003
2003-2004
2004-2005
2005-20060
20
40
60
80
100
Graduation Year
Pe
rce
nt
Figure 2Percent Of Graduates From W.Va.
Public Higher Education Institutions Working In The State In 2007
Source: author calculations
West Virginia Higher Education Policy Commission
1996-1997
1997-1998
1998-1999
1999-2000
2000-2001
2001-2002
2002-2003
2003-2004
2004-2005
2005-20060
20
40
60
80
100
In-StateOut-of-StateOther
Graduation Year
Pe
rce
nt
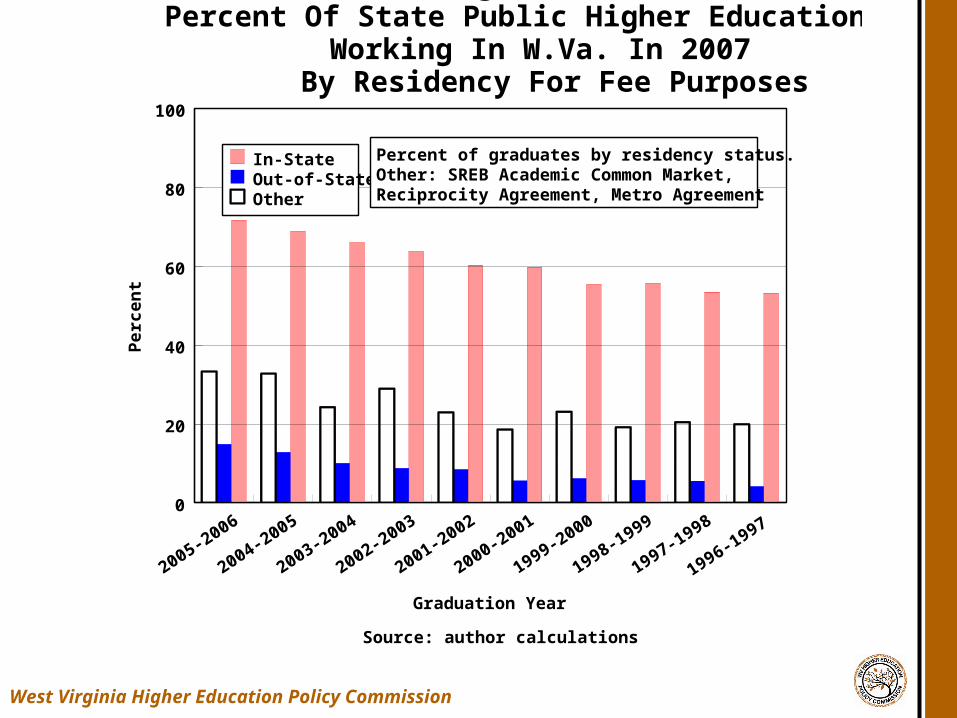
Figure 4Percent Of State Public Higher Education Graduates
Working In W.Va. In 2007By Residency For Fee Purposes
Source: author calculations
Percent of graduates by residency status.Other: SREB Academic Common Market,Reciprocity Agreement, Metro Agreement
West Virginia Higher Education Policy Commission
West Virginia Higher Education Policy Commission
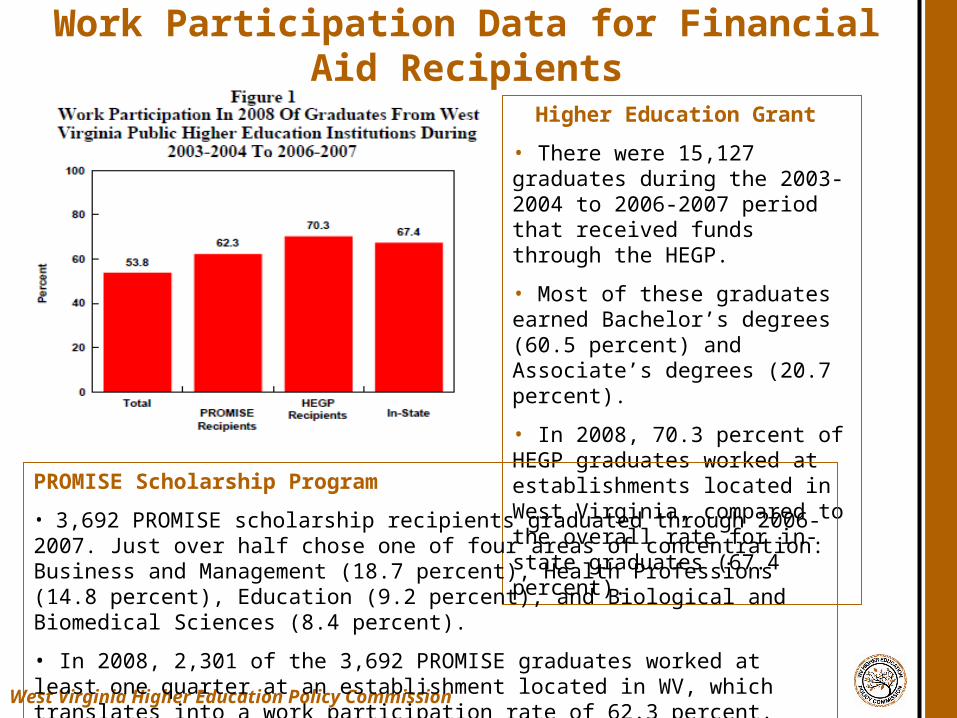
Work Participation Data for Financial Aid Recipients
Higher Education Grant
• There were 15,127 graduates during the 2003-2004 to 2006-2007 period that received funds through the HEGP.
• Most of these graduates earned Bachelor’s degrees (60.5 percent) and Associate’s degrees (20.7 percent).
• In 2008, 70.3 percent of HEGP graduates worked at establishments located in West Virginia, compared to the overall rate for in-state graduates (67.4 percent).
PROMISE Scholarship Program
• 3,692 PROMISE scholarship recipients graduated through 2006-2007. Just over half chose one of four areas of concentration: Business and Management (18.7 percent), Health Professions (14.8 percent), Education (9.2 percent), and Biological and Biomedical Sciences (8.4 percent).
• In 2008, 2,301 of the 3,692 PROMISE graduates worked at least one quarter at an establishment located in WV, which translates into a work participation rate of 62.3 percent.
• Issues of governance structure have moved to the forefront of the policy debate as a result of the economic downturn
• Institutional flexibility and the Virginia experiment
• Oregon discussions on privatization
• Legislative – gubernatorial tensions
• Coordination v. Governance
• Accountability v. Autonomy
• Challenges of lay board governance and the need for professional development
• Responsibilities for more effective nonprofit governance
Governance Issues Facing Higher Education
West Virginia Higher Education Policy Commission
Considerations for Governing Boards
• To what extent do you utilize a Council of Presidents and Board Chairs for advocacy?
• Do you bring boards together for annual policy summits?
• Do you work to develop a process of professional development for board members?
• Do the institutional governing boards have clear and transparent accountability metrics for results that are consistent with state and campus goals?
• Is performance considered in the resource allocation process at the board level – are resources targeted to priorities/highest payoff relative to goal achievement?
• Are presidential reviews and contracts tied to state-wide objectives?
West Virginia Higher Education Policy Commission
West Virginia Higher Education Policy Commission
Members
David K. Hendrickson, Chairman Dr. Bruce Berry, Vice Chairman
Kathy Eddy, Secretary Jenny AllenBob BrownJohn Estep
Kay H. GoodwinDr. John Leon
Dr. Steven L. PaineDavid R. Tyson
West Virginia Higher Education Policy Commission1018 Kanawha Blvd E Ste 700
Charleston WV 25301-2800voice 304.558.2101
fax 304.558.5719