Embed Size (px)
Citation preview

SAN ANDRES ISLAND
REPORT ON REGIONAL ECONONOMIC CIRCUMSTANCES 1
ICER EDITOR’S NOTE
SAN ANDRES ISLAND REPORT ON REGIONAL ECONONOMIC CIRCUMSTANCES
Institutional Agreement Nº 111 dated April, 2000 Banco de la Republica (Central Bank) Governor Miguel Urrutia Montoya National Administrative Statistics Department (DANE) Director César Augusto Caballero Reinoso Economic Studies Deputy Manger Hernando Vargas Herrera Deputy Director DANE Henry Rodríguez Sosa National Board of Directors Banco de la Republica’s Technical and Economic Planning Unit Director: Carlos Julio Varela Barrios DANE’s Technical Regulations, Planning, Standardization and Normalization Director: Eduardo Efraín Freire Delgado Banco de la Republica’s Regional Economical Studies Coordinator: Sandra Patricia González Serna Operational Coordination DIRPEN - DANE: Hernando Flórez Alvarez-Coordinator Ximena Pardo Peña David Rodríguez Mejía Regional Board of Directors Banco de la Republica’s Branch Manager Mirta Yaneth Díaz V. DANE’s Regional Director Ezequiel Quiroz Narváez
Participants in the drafting of this document Economic Studies Analyst Emilia Hernández Chávarro DANE – North Territorial Directorate Elvira Ortiz Osorio Edna Margarita Valle Cabrera Cover Sheet Design and Printing: Publications, Marketing and Statistics Culture Directorate - DANE Photography San Andres Island September, 2004
FOREWORD The report on Regional Economic Conditions analyzes the main regional social and economic indicators, which allow guilds, public entities, and economic researchers in general, to know the evolution of different socio-economic phenomena, in a clear and truthful manner, through half-yearly statistical data, guaranteeing updated information. From DANE’s and Banco de la Republica’s viewpoint, it is highly important to submit this document to the economic community of our country, in order to provide a means for supporting territorial planning, assessment and decision making. The Regional Editorial Committee acknowledges the effort and cooperation supplied by regional entities such as DIAN, the Chamber of Commerce of San Andres, Civil Aeronautics Authorities, The San Andres Governor’s Office, the banking sector, Port Authorities, Archipelago’s Power & Light, Telecom, National Police and other entities which provided information and made possible to achieve the goal of publishing this relevant statistical document in a timely, appropriate and reliable manner, available for user consultation. The authors are fully responsible for all opinions and any possible errors expressed herein, keeping the Banco de la Republica and its Board of Directors free and clear from any responsibility.

CONTENTS Page EDITOR’S NOTE FOREWORD 1. NATIONAL ECONOMIC INDICATORS 10 1.1 PRICES 10 1.2 INTEREST RATES 10 1.3 PRODUCTION, SALARIES AND EMPLOYMENT 10 1.4 MONETARY AND CREDIT AGGREGATES 10 2.4 ACTIVITY OF CORPORATIONS 11 2.4.1 Corporations Organized 11 2.4.2 Corporations Amended 12 2.4.3 Corporations Dissolved 12 2.4.4 Net Investment 13 2.5 FOREIGN SECTOR 14 2.5.1 Exports 14 2.5.2 Imports 15 2.6 FINANCIAL ACTIVITY 17 2.6.1 Placements 17 2.6.2 Funding 18 2.7 FISCAL POSITION 19 2.7.1 Fiscal Position of the Departmental Government of San
Andres 19
2.7.2 Collection of National Taxes 20 2.8. DEMOGRAPHY AND SOCIAL SECTOR 21 2.8.4 Utilities 21 2.8.4.1 Electric Power 21 2.8.4.5 Telecommunications 22 2.8.5 Police Activity 23 2.9 PRODUCTIVE SECTOR 24 2.9.2 Fishing 24 2.9.7 Construction Sector 26 2.9.7.1 Housing Stock 26 2.9.7.7 Housing Financing 27 2.9.11 Tourism 29 2.9.11.1 Passengers Activity 29 2.9.11.2 Hotel Occupation 30 EXHIBIT 30 Bank Notes and Coins – Value and Art. 31
Note: Items that do not appear in the publication by the Department of San Andres
Island, correspond to unavailable information or items that do not apply therein.

SAN ANDRES ISLAND
REPORT ON REGIONAL ECONONOMIC CIRCUMSTANCES 3
LIST OF TABLES, CHARTS, FIGURES AND
EXHIBITS Page
TABLES 1 NATIONAL ECONOMIC INDICATORS 10 CHARTS 2.4.1.1 Corporations Organized According to Economic Activity 11 2.4.2.1 Corporations Amended According to Economic Activity 12 2.4.3.1 Corporations Dissolved According to Economic Activity 12 2.4.4.1 Net Investment, According to Economic Activity 13 2.5.1.1 Exports According to CIIU Classification. 15 2.5.2.1 Imports 16 2.6.1.1 Financial System Placements 17 2.6.2.1 Financial System Funding 19 2.7.1.1 Fiscal Position of the departmental Government 19 2.7.2.1 National Tax Collection 21 2.8.4.1.1 Power Activity K.W.H 21 2.8.4.5.1 Telephone Utilities Subscribers 22 2.8.5.1 Crimes With Higher Social Impact 23 2.9.2.1 Fishing Products 25 2.9.7.1.1 Total Housing Stock, by Main Towns, Remainder, and
by Tenancy Type 27
2.9.7.7.1 Amount of Individual Credits for Housing Purchases 28 2.9.11.1.1 National and International Passenger Activity 29 2.9.11.2.1 Hotel Occupation Percentage 29 GRAPHS 2.4.1.1 Corporations Organized According to Economic Activity 11 2.5.1.1 Exports, According to Ciiu Classification. 14 2.5.2.1 Imports 16 2.6.1.1 Financial System Placements 17 2.8.4.1.1 Power Activity K.W.H 22 2.8.4.5.1 Telephone Utilities Subscribers 23 2.8.5.1 Crimes with Higher Social Impact 24 2.9.2.1. Fishing Products 25 2.9.7.1 1 Housing Stock by Tenancy Type 26 2.9.7.7.1 Amount of Credits for Housing Purchases 28 2.9.11.1.1 National and International Passenger Activity 29 2.9.11.2.1 Hotel Occupation Percentage 30

SAN ANDRES ISLAND
REPORT ON REGIONAL ECONONOMIC CIRCUMSTANCES 4
LEGEND
DANE: National Administrative Statistics Department DIAN: National Directorate of Taxes and Customs. CIIU: Uniform Industrial International Classification CPI: Consumer Price Index PPI: Producer Price Index SHCs: Savings and Housing Corporations CB: Commercial Banks CFC: Commercial Financing Companies FCs: Financial Corporations FDC: Fixed term Deposit Certificates HCCI Housing Construction Cost Index ----- No figures available (---) Calculations are not possible SOS: Sons Of the Soil. KWH: Kilo-Watts Hour

SAN ANDRES ISLAND
REPORT ON REGIONAL ECONONOMIC CIRCUMSTANCES 5
2004 FIRST SEMESTER MACROECONOMIC CONTEXT 1. ECONOMIC ACTIVITY
According to the results of the past four quarters, the trend of low growth rates present
during the years following the great demand contraction of 1998-1999, shows a
reversion.
During the first semester of 2004, Colombian economy continues to show the good
performance registered as of the third quarter of 2003, with growth rates greater than
4%. Rigorously, in accordance with the figures supplied by DANE (National
Administrative Statistics Department) for the first two quarters of 2004, between
January and June, the annual growth was 4.0% [I] and 4.25% [II]. GDP growth was
4.12% greater than the growth recorded for the same period in 2003 [3.19%], and
greater than the growth recorded for the first semester of 2002 [1.24%]. In fact, the
trend presented during the years following the great demand contraction of 1998 and
1999 seems to show a reversion, wherein the economy seemed to have acquired
stability with low growth rates, and everything points out to the fact that the
production gap is closing slowly.
Evolution of the Colmbian GDP Annual Variation
0,00
1,00
2,00
3,00
4,00
5,00
I II III IV I II III IV I II 2002 2003 2004
Periods
P e r c e n t a g e s
(%)

SAN ANDRES ISLAND
REPORT ON REGIONAL ECONONOMIC CIRCUMSTANCES 6
At the sectorial level, economic growth during the first semester was highly positive for
the following sectors: construction (10.29%), manufacturing industry (5.15%),
commerce, restaurants and hotels (5.39%) and transport, storage and communications
(5.14%). An increase of 3.97% was observed with respect to mining activity, with a
reduction of the growth rate, since during the first semester of 2003 a growth of 9.62%
had been present. The financial sector showed a growth rate of 2.91%, less than the
4.88% rate of same period of the previous year.
Similarly, the report of the monthly manufacturing sample shows that production as
well as the real sales of the industrial sector, without including coffee threshing,
suffered inter-annual variations of 11.72% and 12.36% respectively, as of June 2003.
Recovery of demand is linked to the improvement of indicators of the financial sector
as of June 2004, such as profits, profitability, perception of credit risk, quality of loan
portfolio and liquidity. With respect to credit dynamics, the following are highlighted: a
deceleration of the commercial portfolio, an increase in consumption portfolio and a
contraction of the mortgage portfolio.
The following internal and external factors explain an acceptable performance of the
economy:
� Internal demand, specially private investment has experienced a thrust due to
better expectations of economic agents, low levels of real interest rates, flow of
remittances and an improvement of the exchange terms. A recovery of household
consumption as from the third quarter of 2003 is highlighted.
� External demand growth, deriving from the acceptable rhythm of world economy,
from an excellent recovery of external sales to Venezuela and due to high prices of
basic products (oil, coal, ferronickel).
� Monetary policy established by the Board of Directors of the Banco de la Republica
(Central Bank) based on the position of low intervention interest rates, coherent with
the phase of the poor economic growth cycle occurred during the last years. Success
of this policy is also associated with the lack of evidence of some of the credit market
supply and demand factors that were present during the period 1999 – 2002, which
made the monetary transmission mechanism inefficacious.
SAN ANDRES ISLAND
REPORT ON REGIONAL ECONONOMIC CIRCUMSTANCES 7
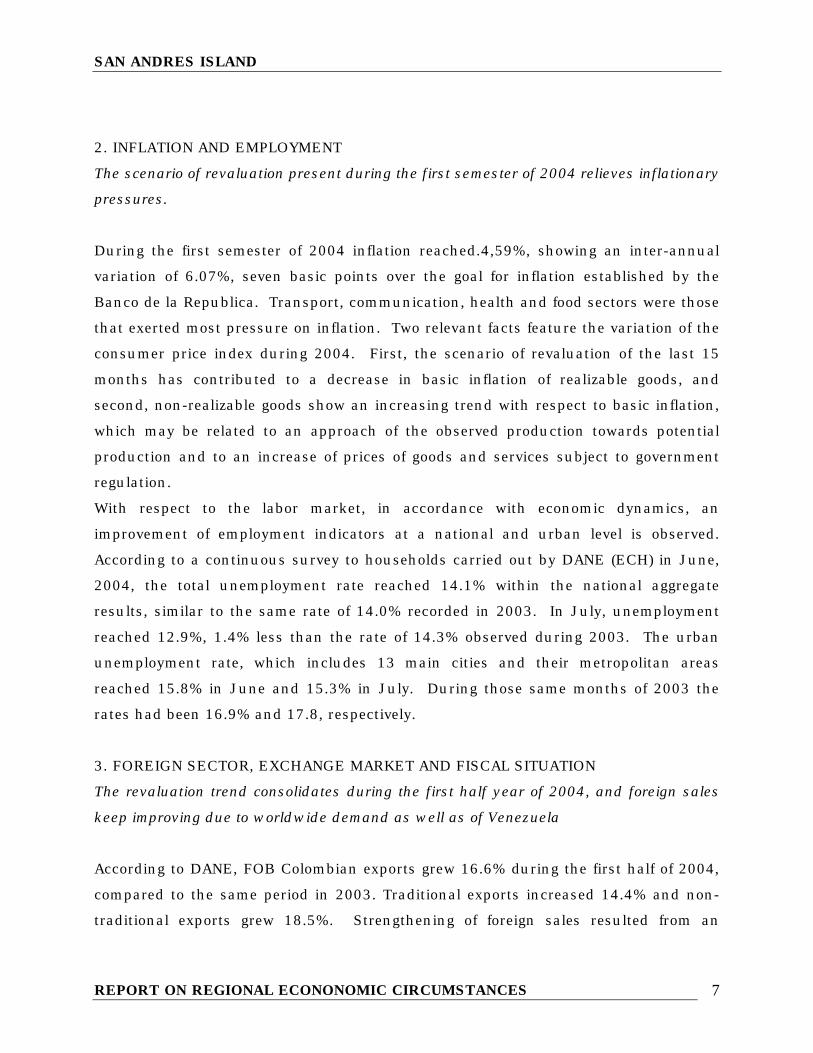
2. INFLATION AND EMPLOYMENT
The scenario of revaluation present during the first semester of 2004 relieves inflationary
pressures.
During the first semester of 2004 inflation reached.4,59%, showing an inter-annual
variation of 6.07%, seven basic points over the goal for inflation established by the
Banco de la Republica. Transport, communication, health and food sectors were those
that exerted most pressure on inflation. Two relevant facts feature the variation of the
consumer price index during 2004. First, the scenario of revaluation of the last 15
months has contributed to a decrease in basic inflation of realizable goods, and
second, non-realizable goods show an increasing trend with respect to basic inflation,
which may be related to an approach of the observed production towards potential
production and to an increase of prices of goods and services subject to government
regulation.
With respect to the labor market, in accordance with economic dynamics, an
improvement of employment indicators at a national and urban level is observed.
According to a continuous survey to households carried out by DANE (ECH) in June,
2004, the total unemployment rate reached 14.1% within the national aggregate
results, similar to the same rate of 14.0% recorded in 2003. In July, unemployment
reached 12.9%, 1.4% less than the rate of 14.3% observed during 2003. The urban
unemployment rate, which includes 13 main cities and their metropolitan areas
reached 15.8% in June and 15.3% in July. During those same months of 2003 the
rates had been 16.9% and 17.8, respectively.
3. FOREIGN SECTOR, EXCHANGE MARKET AND FISCAL SITUATION
The revaluation trend consolidates during the first half year of 2004, and foreign sales
keep improving due to worldwide demand as well as of Venezuela
According to DANE, FOB Colombian exports grew 16.6% during the first half of 2004,
compared to the same period in 2003. Traditional exports increased 14.4% and non-
traditional exports grew 18.5%. Strengthening of foreign sales resulted from an

SAN ANDRES ISLAND
REPORT ON REGIONAL ECONONOMIC CIRCUMSTANCES 8
increase in demand of commerce worldwide, from the sustained commodities price
increase and from the recovery of exports to Venezuela. Imports recorded an increase
of 15.8% during the period mentioned, due to higher purchases of raw materials and
intermediate goods. All in all, Colombian commercial balance showed a superavit of
FOB US$154.1 million as of June, resulting from exports value of US$7.323.1 million
and imports value of US$7.169 million.
During 2004 the revaluation trend has consolidated within the exchange market, being
a phenomenon common to most of Latin-American economies. Macroeconomic
conditions determining an increase of foreign currency supply prevail, such as of a
favorable behavior of current account components, exchange rate, parity rate, which
continues to encourage capital inflow, as well as low levels of risk premiums of
sovereign bonds. The intervention by the Banco de la Republica purchasing nearly 1.4
billion during this year, has not been able to stop appreciation of the peso, fact that
confirms that the level of the exchange rate is determined by the pillars of the
economy.
Lastly, with regards to the fiscal situation, notwithstanding the fact that the fiscal
figures are tuned with what had been foreseen in the agreement with the International
Monetary Fund, Government spokesmen guild analysts, consulting entities and the
Banco de la Republica coincide in the opinion that it is necessary to deepen the
structural amendments, specially those relating to pensions and transferences, in
order to attain a radical correction of the fiscal unbalance and to improve the public
debt profile.

SAN ANDRES ISLAND
REPORT ON REGIONAL ECONONOMIC CIRCUMSTANCES 9
1. NATIONAL ECONOMIC INDICATORS
I II III IV I II III IVPrices CPI (Annual Var. %) 7.6 7.21 7.11 6.49 6.2 6.1 CPI (Agg. Var. % ) 3.37 5.01 5.42 6.49 3.1 4.6 PPI (Annual Var. % 11.48 10.95 6.87 5.72 4.57 5.88 PPI (Agg. Var. %) 3.33 4.3 4.66 5.72 2.2 4.45Interest Rates Passive nominal interest rate (annual eff. %l) 7.7 7.8 7.8 7.9 8.0 7.8 Active nominal interest rate Banco República (annual eff. %) 1/ 15.0 15.2 15.2 15.4 15.1 15.2ProductionSalaries&Employment (p) (p) (p) GDP Growth (Accrued agg. annual variation real %) 4.24 3.34 3.64 3.95 4.08 n.d. Industrial Manufacturing Real Production Index 1/ National Total with coffee threshing (Acc. agg. annual real var.%) 8.34 4.13 3.81 3.60 4.33 5.06 National Total without coffee threshing (Acc. agg annual real var %) 8.61 4.22 3.88 3.78 4.15 5.10 Industrial Manufacturing Real Salaries Index 1/ National Total with coffee threshing (Acc. agg. annual real var.%) 0.53 -0.37 -0.43 -0.07 1.15 1.25 National Total without coffee threshing (Acc. agg annual real var %) 0.53 -0.37 -0.42 -0.06 1.15 1.25 Employment Rate seven metropolitan areas (%) 3/ 52.8 53.4 54.4 56.2 53.3 52.6 Unemployment Rate seven metropolitan areas (%) 3/ 17.5 17.0 17.0 14.6 16.9 15.5Monetary & Credit Aggregates Monetary base(annual var %) 15.34 14.13 13.10 16.55 23.25 24.20 M3 (annual variation%l) 10.85 13.02 11.42 12.07 12.44 13.03 Net portfolio in legal currency (annual var %) 7.39 10.15 9.88 9.84 7.61 9.76 Net portfolio in foreign currency (annual var %) 7.56 -15.03 -28.21 -30.48 -19.94 13.84 Indice de la Bolsa de Bogotá - IBB General Index Colombian Stock Market - IGBC 1,588.59 2,075.77 2,101.92 2,333.70 Foreign Sector Bal. of Payments Current account (US$ million) -626 -21 -333 -476 -722 Current account (% GDP) 4/ -3.4 -0.1 -1.7 -2.3 -3.3 Capital & financial account (US$ million) 329 -210 598 164 946 Capital & financial account (% GDP) 4/ 1.8 -1.1 3.0 0.8 4.3 Foreign Trade Goods & Services Exports, goods and services (US$ million) 3,553 3,964 3,962 3,896 3,812 Exports goods & services (annual variation %) 7.5 6.9 10.4 8.9 7.3 Imports, goods and services (US$ million) 3,963 3,947 4,284 4,407 4267 Imports, goods and services (annual variation %)) 17.1 -0.5 7.7 8.0 7.7 Exchange Rate Nominal (Monthly average $ per dollar) 2,959.01 2,826.95 2,840.08 2,807.20 2,670.80 2,716.56 Nominal Devaluation (annual%) 30.82 17.45 2.17 -3.02 -9.47 -4.18 Real (1994=100 averg. ) End of quarter 139.69 134.34 134.99 135.59 127.81 128.74 Real devaluation (annual%) 25.48 18.71 6.35 3.70 -8.51 -4.17Public Finances 5/ National Central Government Income (% GDP) 18.0 16.3 15.9 13.3 16.2 National Central Government Payments (% GDP) 21.6 20.4 18.6 22.3 20.0 National Central Government Deficit(-)/Superavit(+) (% GDP) -3.6 -4.1 -2.8 -8.9 -3.8 Non Financial Public Sector Income (% GDP) 37.2 34.6 35.7 36.9 n.d Non Financial Public Sector Payments (% GDP) 36.5 37.6 38.3 42.4 n.d Non Financial Public Sector Deficit (-)/Superavit(+) (% GDP) 0.7 -3.0 -2.6 -5.5 n.d National Central Government Debt Balance (% GDP) 48.0 48.2 50.4 51.2 n.d (pr) Preliminary. (p) Provisional. 1/ Calculated as the weighted average of the amount of consumption, preferential, ordinary and treasury credit rates. Established a s one fifth of the dayly disbursement.
2/ As from the first quarter 2002 calculations done by BR based on the indexes of the New Monthly Manufacturing Sample Base 2001=100.
3/ During 2000 DANE carried out a review process of the methodology for the National Poll of Homes (NPH), currently called Continuous Poll of Homes (CPH),
Including new concepts for measuring variables occupied people vs unoccupied among other. As from January 2001 the population data published in NPH (occupied, unoccupied
& inactive) is obtained from the demographic projections of the Population with Age apt for Working (PAW), estimated based on the results of the del census of 1993, instead of the projections of the Total Population (TP) . Thus, as from the same date, the figures are not comparable, and the data corresponding to the four and seven metropolitan areas are calculated by
The Banco de la República. 4/ Calculated with quarterly GDP in million current pesos, source DANE. 5/ The figures from SPNF are net of transferences. The flows are calculated with the quarterly GDP and the debt balances with the annual GDP.
Source: Banco de la Republica, DANE, Ministry of Public Finance, CONFIS- General Directorate of Public Credit, Banking Superintendency, Colombian Stock Market.
20042003Economic Indicators

SAN ANDRES ISLAND
REPORT ON REGIONAL ECONONOMIC CIRCUMSTANCES 10
2.4 ACTIVITY OF CORPORATIONS 1.4 MOVIMITO DE SOCIEDADES. 2.4.1 Corporations Organized During the first semester of 2004, 40 corporations were organized, 19 belonging to the commercial sector with an investment of $393.2 million and 11 belonging to the services sector with a capital contribution of $1.307 billion; from this total, $1.2 billion were destined to the hotel industry. Chart 2.4.1.1 San Andres Island. Corporations organized according to economic
activity 2003-2004 (Semester)
Graph 2.4.1.1 San Andres Island. Corporations organized according to economic activity
2003-2004 (S)
Economic Activity
No. Amount No. Amount No. Amount
Total 46 1,190,500,000 40 1,809,900,000 -13.0 52.0
Agricultural & Livestock 1 10,000,000 1 2,000,000 0.0 -80.0
Mining Exploitation 0 (---) 0 (---) 0.0 (---)
Industry 1 50,000,000 0 0 -100.0 -100.0
Electricity, gas & water 0 (---) 0 (---) 0.0 (---)
Construction 2 8,000,000 0 0 -100.0 -100.0
Trade 18 423,000,000 19 393,200,000 5.6 -7.0
Transport 8 335,000,000 7 75,000,000 -12.5 -77.6
Insurance & Finance 0 2 39,000,000 (---) (---)
Services 16 364,500,000 11 1,300,700,000 -31.3 256.8
Source: Chamber of Commerce
Variation %
Aggregate
2003 2004
Agriculture & Livestock19%
Trade2%
Transport18%
Services 61%

SAN ANDRES ISLAND
REPORT ON REGIONAL ECONONOMIC CIRCUMSTANCES 11
The transport sector contributed with 7 new corporations organized representing an amount of $75 million and 2 corporations were directed towards the financial sector with a capital of $39 million. With respect to employment, the organization of new corporations generated 25 new job opportunities in the trade sector, 25 in the services sector, the transport sector included 5 new people, and insurance and financial enterprises included 4 new employees. 2.4.2 Corporations amended Four corporations were amended: two belonging to the transport sector and one of which is a limited liability company with an invested capital of $31.5 million and two other belong to the services sector, one of which is a personal company and the other a corporation by shares with a capital of $620 million, belonging to the area of services. These corporations generated 8 job opportunities.
Chart 2.4.2.1 San Andres Island. Corporations amended according to Economic activity 2003-2004 (Semester)
2.4.3 Corporations dissolved During the period between January and June 2004, twelve corporations were dissolved and liquidated, from which six correspond to the services sector and five to the trade sector; the detached capital was $41.500.000.oo
Economic Activity
No. Amount No. Amount No. Amount Total 3 758,358,740 4 692,500,000 33.3 -8.7
Agricultural and Livestock 0 (---) 0 2,000,000 0.0 0.0
Mining Exploration 0 (---) 0 (---) 0.0 (---)
Industry 0 (---) 0 0 (---) (---)
Electricity, gas & water 0 (---) 0 (---) 0.0 (---)
Construction 0 (---) 0 0 (---) (---)
Trade 1 96,136,034 0 0 -100.0 -100.0
Transport 1 657,222,706 2 31,500,000 100.0 -95.2
Insurance and Finance 0 (---) 0 39,000,000 (---) (---)
Services 1 5,000,000 2 620,000,000 100.0 12300.0
Source: Chamber of Commerce
Aggregate
2003 2004 Variation %

SAN ANDRES ISLAND
REPORT ON REGIONAL ECONONOMIC CIRCUMSTANCES 12
During this same term, twelve corporations were dissolved and liquidated, from which six correspond to the services sector, five to the trade sector, one to the industrial sector; the detached capital was $41.5 million.
Chart 2.4.3.1 San Andres Island. Corporations dissolved according to economic activity
2003-2004 (Semester)
2.4.4 Net Investment During the first semester of 2004 net investment in San Andres reached $2.419.9 million representing an increase of 32.8% compared to the same period of year 2003. According to economic activity, the area relating to tourism services channeled the highest investment, for an amount of $1.913.7 million, representing 79.08%, followed by trade and by the transport sector. Chart 2.4.4.1 San Andres Island. Net Investment in accordance with economic activity 2003-2004 (Semester)
Economic Activity
No. Amount No. Amount No. Amount Total 11 126,867,644 12 43,500,000 9.1 -65.7 Agriculture & Livestock 0 (---) 0 2,000,000 0.0 0.0 Industry 0 (---) 1 500,000 (---) (---) Trade 6 80,759,000 5 34,000,000 -16.7 -57.9 Transport 2 42,608,644 0 0 0.0 0.0 Insurance & Finance 1 1,000,000 0 0 (---) (---) Services 2 2,500,000 6 7,000,000 200.0 180.0 Source: Chamber of Commerce
Variation % Aggregate
2003 2004
Variation
Economic Activity 2003 2004 % Amount Amount
Total 1,821,991,096 2,419,900,000 32.8 Agriculture & Li t k
10,000,000 2,000,000 -80.0 Mining Exploitation 0 0 (---) Industry 50,000,000 -500,000 -101.0 Electricity, gas & water 0 0 (---) Construction 8,000,000 0 -100.0 Trade 438,377,034 359,200,000 -18.1 Transport 949,614,062 106,500,000 -88.8 Insurance & Finances -1,000,000 39,000,000 -4000.0 Services 367,000,000 1,913,700,000 421.4 Source: Chamber of Commerce
Aggregate

SAN ANDRES ISLAND
REPORT ON REGIONAL ECONONOMIC CIRCUMSTANCES 13
2.5 FOREIGN SECTOR 2.5.1. Exports The FOB amount of the Department of San Andres Island exports reflected decreases of 10.79% and 41.80% during the first and second quarters of 2004 with respect to these same periods in 2003.
Graph 2.5.1.1 San Andres Island. Exports according to CIIU classification 2004 (January - March)
Sector agropecuario, silvicultura, caza y
pesca5,51%
Servicios comunales, sociales y personales
0,01%
Prod. Alimentos, bebidas y tabaco
93,67%
Minerales no metálicos
0,04%
Maquinaria y equipos0,02%
Textiles, prendas de vestir0,73%
Fabricación sustancias químicas
0,02%
Sector Industrial94,48%
According to CIIU, the predominant sector in San Andres is the industrial sector, showing the highest participation during the first quarter of 2004 (94.48%), which reached 76.25% during the second quarter (Graph 2.5.1.1). The industrial sub-sector showing the highest sales abroad was food products, reaching an amount of US$1.11 million during the second quarter of 2004, with a decrease of -19.64% with respect to the same quarter in 2003 and -14.77% with respect to the period January – March 2004.According to country of destination, exports were directed mainly to the United Sates of America (78.98%) and Japan 21.02% . (Chart 2.5.1.1).

SAN ANDRES ISLAND
REPORT ON REGIONAL ECONONOMIC CIRCUMSTANCES 14
With respect to the tariffs position as of June 2004, frozen lobsters (palinuros ssp, panulirus ssp and jasus ssp) constitute the first line within total exports during the semester subject of this report.
Chart 2.5.1.1 San Andres Island. Exports according to Uniform Industrial International Classification 2004 (January - March)
Destination Net FON Amount Participation
Kilograms Dollars %
Total 55.140 1.379.149 100,00
United States 55.093 1.312.080 95,14
Japan 47 67.069 4,86
Viet Nam 873 6.200 0,45
Spain 6.240 2.746 0,20
France 29 450 0,03
Panama 60 240 0,02
Source: DANE
2.5.2 Imports During the first half year, January - June 2004, imports into San Andres Island reached US$10.5 million, figure 35.97% less than the figure of the corresponding period during 2003, when imports reached US$16.4 million. During the first semester 2004, perishable foodstuff constituted the highest imports reaching an amount of US$1.5 million, followed by toiletries with the same amount, “other articles” representing US$1.2 million and miscellaneous clothing with the same amount. The month showing the highest purchases from abroad was June reaching US$2.4 million, standing out toiletry articles as those most imported reaching US$432,000.

SAN ANDRES ISLAND
REPORT ON REGIONAL ECONONOMIC CIRCUMSTANCES 15
Chart 2.5.2.1 San Andres Island. Imports 2004 (Semester)
US$
Thousands
Product Description Total January February March April May June
Total 10.511 1.307 1.625 1.933 1.914 1.345 2.388
Animal foodstuff 26 4 0 6 2 0 13
Entertainment & sports articles 0 0 0 0 5 1 9
Toiletry articles 1.473 146 265 202 231 198 432
Home & kitchen articles 200 25 29 61 14 16 54
Hardware and construction articles 357 0 7 1 58 163 128
Articles for hotels 0 0 0 0 0 0 0
Fishing articles 4 0 0 1 1 1 2
Bijouterie 20 0 0 1 3 2 14
Miscellaneous shoe wear 329 23 48 96 82 43 38
Photography cameras and accessories 6 0 0 0 0 1 5
Frozen meats (perishable) 1.494 484 335 314 154 52 156
Cigarettes & tobacco 55 6 1 21 2 5 20
Edibles (canned, groceries) 893 87 16 36 260 162 332
Miscellaneous clothing 1.171 118 227 189 145 289 204
Electric-appliances and spare parts 573 41 103 99 58 65 207
Telecommunication equipment 63 4 15 12 11 4 17
Medical equipment and accessories 80 26 21 12 3 3 15
Fruits & vegetables (perishable) 153 4 20 3 35 39 52
Glasses, spectacles and frames 71 0 0 0 30 1 41
Liquor & beverages 482 17 19 24 75 67 280
Machinery and spare parts 679 82 89 232 128 49 100
Other items 1.237 119 277 483 113 103 143
Dairy products (perishable) 155 26 44 30 13 11 31
Vehicles, parts and spare parts 974 96 108 111 491 71 97
Source: DIAN.
SAN ANDRES ISLAND
REPORT ON REGIONAL ECONONOMIC CIRCUMSTANCES 16
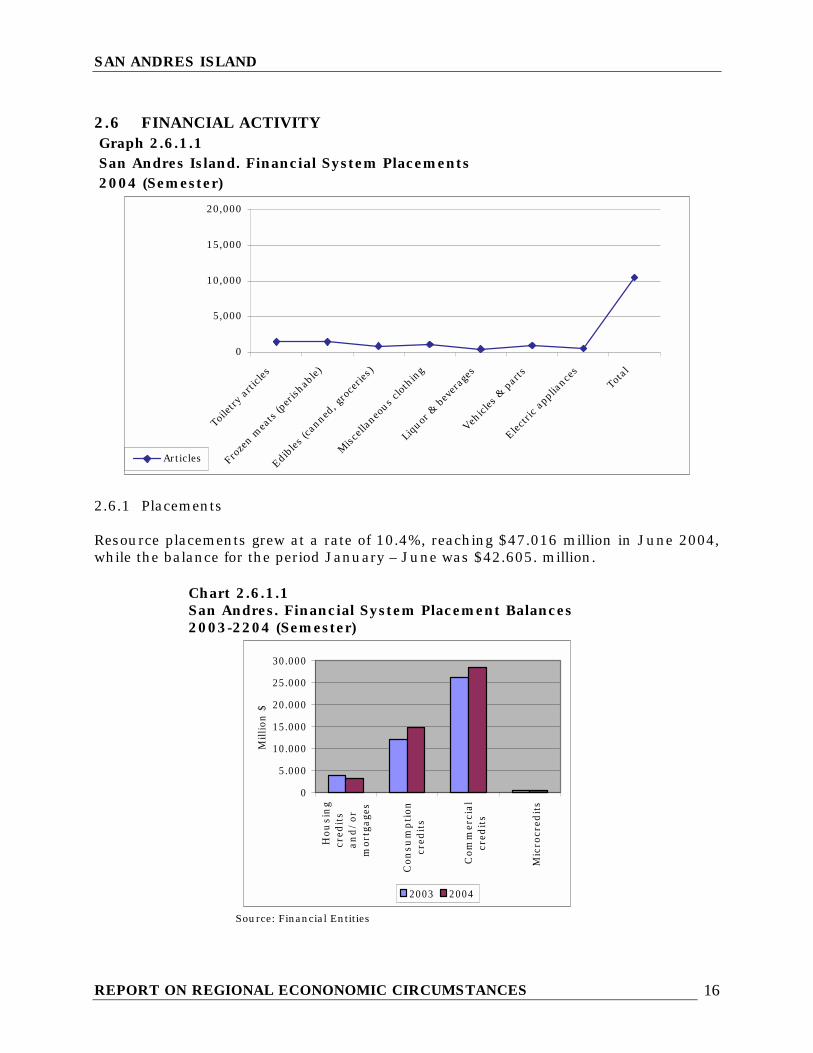
2.6 FINANCIAL ACTIVITY Graph 2.6.1.1 San Andres Island. Financial System Placements 2004 (Semester)
0
5,000
10,000
15,000
20,000
Toile
try ar
ticles
Froz
en m
eats (p
erisha
ble)
Edibl
es (c
anne
d, gro
cerie
s)
Misce
llane
ous clot
hing
Liqu
or &
bev
erag
es
Vehicles & p
arts
Electric
app
lianc
esTo
tal
Articles
2.6.1 Placements Resource placements grew at a rate of 10.4%, reaching $47.016 million in June 2004, while the balance for the period January – June was $42.605. million.
Chart 2.6.1.1 San Andres. Financial System Placement Balances 2003-2204 (Semester)
0
5.000
10.000
15.000
20.000
25.000
30.000
Hou
sin
gcr
edit
san
d/
orm
ortg
age
s
Con
sum
pti
oncr
edit
s
Com
mer
cial
cred
its
Mic
rocr
edit
s
Milli
on $
2003 2004 Source: Financial Entities

SAN ANDRES ISLAND
REPORT ON REGIONAL ECONONOMIC CIRCUMSTANCES 17
Chart 2.6.1.1 San Andres. Financial System Placements Balance 2003-2004 (Semester) Million pesos
Variations Variables
June-03 June-04 % TOTAL 42.605 47.016 10,4 Commercial Banks 42.605 47.016 10,4 Housing Credits and/or mortgages 3.932 3.252 -17,3 Consumption credit 12.066 14.828 22,9 Commercial Credit 26.130 28.409 8,7 Micro credits 477 527 10,5 Source: Financial Entities
The commercial sector is the main beneficiary of credits with $28.409 million, nevertheless this period the greatest growth (22.9) occurred in consumption credits with $14.828 million. Housing credit or mortgages decreased in 17.3% while micro credits reached $527 million during the period of analysis. The total amount of resources placements represents only 42.1% from the total of the cash deposited in the local financial system. 2.6.2 Funding As of June 2004, the financial system in the island recorded funding of resources of $111.737 million, 6.6% greater than the figure recorded during June, 2003, which reached $104.801 million. During this semester, deposits of current accounts increased 12.1%, growing from $32.726 million in June, 2003 to $36.688 million in June 2004. The savings deposits showed a similar behavior, reaching an amount of $48.583 million compared to $43.998 million deposited the previous year, with an increase of 10.4%. The opposite occurred with fixed term deposit certificates, whose balance showed a decrease of 5.9% from $27.909 million in June 2003 to $26.270 million in June, 2004.

SAN ANDRES ISLAND
REPORT ON REGIONAL ECONONOMIC CIRCUMSTANCES 18
Chart 2.6.2.1 San Andres. Financial System Funding Balances 2003 - 2004 (Semester) Million pesos
Balances as of June Annual Variables
2003 2004 Var. %
TOTAL 104.801 111.737 6,6
Commercial Banks 104.801 111.737 6,6
Bank current account deposits 32.726 36.688 12,1
Fixed term deposit certificates 27.909 26.270 -5,9
Savings deposits 43.998 48.583 10,4
Other 168 196 16,7
Source: Financial Entities 2.7 FISCAL POSITION 2.7.1 Fiscal Position of the Departmental Government of San Andres Public finances of the department showed a growth of 13.4% obtaining income for $35.035 million during the first semester, compared to the $30.892.2 million collected during the period January – June, 2003.
Chart 2.7.1.1 San Andres. Fiscal Position of the Departmental Government 2003-2004 (Semester) Million pesos Amount Variation % Description June-03 June-04 A. Current income 30.892,2 35.035,0 13,4 B. Current expenses 24.409,0 33.233,6 36,2 C. Deficit or current savings 6.483,2 1.801,5 -72,2 D. Capital income 64,4 0,0 -100,0 E. Capital expenses 701,4 1.992,9 184,1 F.Net Loans -19,2 0,0 -100,0 G. Total deficit or superavit 5.865,3 -191,4 -103,3 H. Financing -5.865,3 191,4 -103,3 Source: Governor’s Office

SAN ANDRES ISLAND
REPORT ON REGIONAL ECONONOMIC CIRCUMSTANCES 19
Fiscal income increased 40.1% growing from $8.522.8 million in June 2003 to $11.937.4 million in June 2004, highlighting the tax on beer which grew 316.9%; the tax on cigarettes that grew 171.3%, fuel surcharge increasing 95.7% and the tax on alcoholic beverages increasing 28.5%. On the contrary, income due to land taxes and supplementary, decreased in 9.8%. Non-fiscal income grew at a rate of 7.95% while transferences increased 2.3% recording an amount of $17.142.6 million; growth of transferences from the nation of 107.6% is highlighted, from $8.231.2 million to $17.084.5 million during the period January-June 2004. An analysis of the current expenses shows an increase of 36.2%, namely 2.7 times the current income. In these expenses, we find an increase of 41.5% in operation expenses, mainly due to purchases of consumption goods and services, which increased in 57.1% and expenses of the health regime with subsidies that grew 116.5% Expenses due to transferences also increased 13.2%; to be highlighted, municipal transferences reaching an amount of $4.856.7 million, which represents an increase of 15.1%. Capital expenditures recorded $1.992.9 million, thus generating a deficit of $191.4 million in departmental finances during the period January-June 2004. 2.7.2 Collection of National Taxes The national Directorate of Taxes and Customs (Dirección de Impuestos y Aduanas Nacionales -DIAN) reported a growth of 9.46% with regards to the tax collection within this locality. The total amount received during the semester January – June/04 reaches $8.539 million, compared to $7.801 million collected during the same period of the previous year. According to tax type, the tax withheld at source increased 23.53% and income tax increased 22.01%. The collection originated due to imports reached $1.714 million, 22.34% less than the $2.207 million collected the previous year. Through an analysis of collections made at the north zone by the DIAN, we find that the San Andres Island shows a very low participation with respect to the total; income tax collection represents el 1.7%, sales, 0.02%, withholdings, 0.76%, and imports 0.12%.

SAN ANDRES ISLAND
REPORT ON REGIONAL ECONONOMIC CIRCUMSTANCES 20
Chart 2.7.2.1 San Andres. National Tax Collection 2003-2004 (Semester) Million Pesos Taxes 2003 2004 Variation %
A. INTERNAL 5.594,00 6.825,00 22,01
1. Income taxes 2.815,00 3.397,00 20,67
2. Sales taxes 38,00 42,00 10,53
3. Withholding at source 2.741,00 3.386,00 23,53
B: EXTERNAL
1. Imports* 2.207,00 1.714,00 (22,34)
Total Taxes 7.801,00 8.539,00 9,46
Source; DIAN North Regional Office
2.8 DEMOGRAPHY AND SOCIAL SECTOR 2.8.4 Utilities 2.8.4.1 Electric power During the period between January and June 2004, the Electric Power Company registered invoicing for 54.1 million K.W.H, figure slightly greater than the 53.6 million K.W.H invoiced during the same semester in 2003, thus with an increase of 0.91%.
Chart 2.8.4.1.1 San Andres Island. Energy activity in K.W.H. 2003-2004 (Semester)
Thousands
Description K.W.H. Invoiced Variation %
2003 2004
Total 53.607 54.094 0,91
Residential 19.004 18.913 -0,48
Industrial 14.878 15.253 2,52
Commercial 11.005 11.465 4,18
Official** 6.465 6.652 2,90
A. Public 2.256 1.810 -19,77
Source: Archipelago's Power and Light
** Official, Special and Provisional.
The sector that grew the most with regard to consumption was the commercial sector with 4.18% while the public lights system showed a meaningful decrease of 19.77%.

SAN ANDRES ISLAND
REPORT ON REGIONAL ECONONOMIC CIRCUMSTANCES 21
Graphic 2.8.4.1.1 San Andres Island. Energy activity K.W.H. 2003-2004 (Semester)
02.0004.000
6.000
8.00010.000
12.000
14.00016.00018.000
20.000
K.W
.H.
Resid
entia
l
Indu
stria
l
Comm
ercial
Officia
l**
Publ
ic li
ghts
2003 2004
2.8.4.5 Telecommunications The number of subscribers of the telephone service in San Andres Island increased 6.69% during the first semester of 2004 compared to the same period during the previous year. The Island of Providencia showed a similar behavior, where the increase was 6.63%.
Chart 2.8.4.5.1 San Andres Island. Telephone service subscribers 2003-2004 (Semester)
Description 2003 2004 Variation %
TOTAL 11.082 11.823 6,69
Residential 7.199 7.968 10,68
Commercial 3.146 3.222 2,42
Telecom** 314 207 -34,08
Official 423 426 0,71
Source: Telecom.
**Public Telephones, Caps, Administrative & Other.
San Andres has 11.823 users from which 7.968 are residential and 3.222 commercial. Residential users showed a greater increase between January - June 2004 with 10.68%. The number of pay phones in charge of the Telecommunication Company decreased in 34.08%. Providencia has 1.030 subscribers, from which 807 are residential and 134 commercial. Opposite to what happened in San Andres, the telephones in charge of the

SAN ANDRES ISLAND
REPORT ON REGIONAL ECONONOMIC CIRCUMSTANCES 22
new Telecom increased in 83.33%, growing from 24 to 44 during the period subject of analysis.
Graphic 2.8.4.5.1 San Andres Island. Telephone service subscribers
2003-2004 (Semester)
0
2,000
4,000
6,000
8,000
Nu
mber
Res
iden
tial
Com
mer
cial
Tel
ecom
**
Offic
ial
Subscribers2003 2004
2.8.5 Police activity During the period January – June 2004, a significant decrease of 40.23% was observed in the number of crimes in the Island; in 2003, 440 crimes were registered compared to 263 crimes registered in 2004.
Chart 2.8.5.1 San Andres Island. Crimes with highest social impact 2003-2004 (Semester)
Year Aggregate
Type 2003 2004 Variation %
Total 440 263 -40,23
A. Ordinary Homicide 4 4 0,00
B. Homicide A/TT 2 7 250,00
Ordinary Injuries 102 27 -73,53
Injuries A/TT 18 3 -83,33
Theft - Commerce 69 62 -10,14
Theft - Persons 107 64 -40,19
Theft – Residential 110 70 -36,36
Theft - Motorcycles 28 26 -7,14
Source: National Police The only kind of crime that showed an increase was homicides due to traffic accidents; 2 during the first semester of 2003, and 7 during the first period 2004.

SAN ANDRES ISLAND
REPORT ON REGIONAL ECONONOMIC CIRCUMSTANCES 23
In contrast, injuries due to traffic accidents and ordinary injuries decreased 83.3% and 73.5% respectively; thefts to persons and residential thefts behaved in a similar manner, decreasing 40.19% and 36.36% respectively. The number of homicides registered remained unchanged, 4 as in the previous semester. Chart 2.8.5.1 San Andres Island. Crimes with the highest social impact 2003-2004(Semester)
Fuente: Policía Nacional
0
50
100
150
200A
. O
rdin
ary
Hom
icid
es
B.
Hom
icid
esA
/TT
Ord
inary
inju
ries
Inju
ries
A/TT
Th
eft
-C
omm
erce
Th
eft
- Per
son
s
Th
eft
-R
esid
ence
s
Th
eft
Mot
orcy
cles
Crimes
Nu
nm
ber
of cr
imes
2003 2004
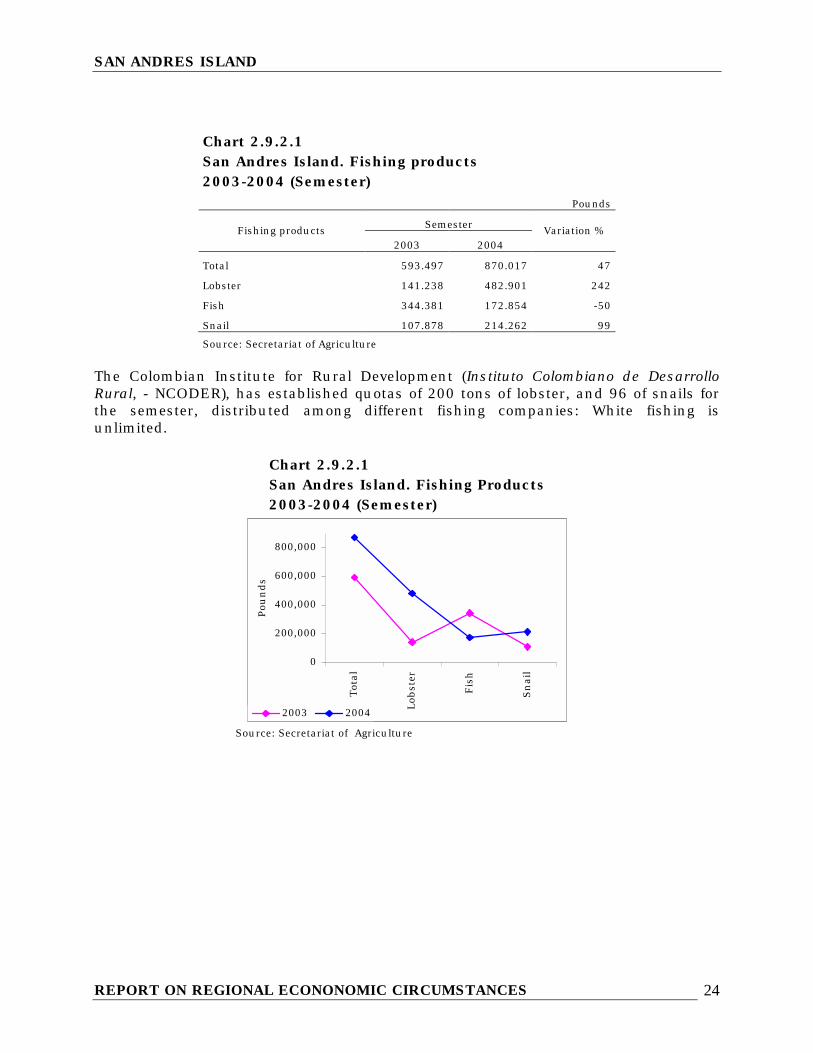
2.9 PRODUCTIVE SECTOR 2.9.2 Fishing During the period January – June 2004 fishing products arriving to the Island reached 870.017 pounds, recording an increase of 47% with respect to the first semester of 2003, when the total had been 593.497 pounds. The following products were responsible for such increase: lobster, growing from 141.238 pounds to 482.901, which represented an increase of 242% while snails increased 99% growing from 107.878 pounds to 214.262 pounds. On its part fish showed a decrease of 50%, reaching 172.854 pounds compared to 344.381 recorded during 2003.
SAN ANDRES ISLAND
REPORT ON REGIONAL ECONONOMIC CIRCUMSTANCES 24
Chart 2.9.2.1 San Andres Island. Fishing products 2003-2004 (Semester) Pounds
Semester Fishing products
2003 2004 Variation %
Total 593.497 870.017 47
Lobster 141.238 482.901 242
Fish 344.381 172.854 -50
Snail 107.878 214.262 99
Source: Secretariat of Agriculture
The Colombian Institute for Rural Development (Instituto Colombiano de Desarrollo Rural, - NCODER), has established quotas of 200 tons of lobster, and 96 of snails for the semester, distributed among different fishing companies: White fishing is unlimited.
Chart 2.9.2.1 San Andres Island. Fishing Products2003-2004 (Semester)
0
200,000
400,000
600,000
800,000
Tot
al
Lob
ster
Fis
h
Sn
ail
Pou
nds
2003 2004
Source: Secretariat of Agriculture

SAN ANDRES ISLAND
REPORT ON REGIONAL ECONONOMIC CIRCUMSTANCES 25
2.9.7 Construction Sector 2.9.7.1 Housing Stock As of June 2004, the housing stock in the Department of San Andres Island presented 20.559 houses, 3.13% greater than 19.934, figure recorded for the same period during 2003. According to the tenancy type, 59.90% of the total housing was rented and 38.03% were owned (Graph 2.9.7.1.1).
Graph 2.9.7.1.1 San Andres Island. Housing Stock according to type of tenancy. 2004 (April – June)
Other2.07%
Rented59.90%
Owned38.03%
Source: DANE
The 58.43% of the total housing is located at main towns, from which 71.00% are rented; the opposite behavior occurs in the remainder where 55.19% are owned. The other types of tenancy both in the main town as well as in the remainder show a low participation of 3.18% and 0.50 respectively. See chart 2.9.7.1.1.

SAN ANDRES ISLAND
REPORT ON REGIONAL ECONONOMIC CIRCUMSTANCES 26
Chart 2.9.7.1.1 San Andres Island. Total housing stock, in main towns and the remainder and by type of tenancy 2003 – 2004
Tenancy Type Housing Stock
Main Town Remainder Periods
Total Main Town Remainder Rented Owned Other Rented Owned Other
2003
April – June 19.934 12.013 7.921 8.529 3.101 383 3.509 4.372 40October – December
20.241 12.013 8.228 8.529 3.101 383 3.645 4.541 42
2004
April – June 20.559 12.013 8.546 8.529 3.101 383 3.786 4.717 43
Source: DANE 2.9.7.7 Housing Financing Individual credits for housing purchases in San Andres decreased -86.03%, changing from $179 million to $25 million in 2004. Total financing refers to used housing (Graph 2.9.7.7.1).
Graph 2.9.7.7.1 San Andres. Amount of credits for housing purchases 2003 - 2004 (Semester)
25
179
256
0
50
100
150
200
250
300
IS - 03 IIS - 03 IS - 04
Quarters
Million
CO
P
Source: DANE (p) provisional

SAN ANDRES ISLAND
REPORT ON REGIONAL ECONONOMIC CIRCUMSTANCES 27
Housing presented its best behavior during the second semester of 2003 reaching an amount of $256 million, and dropped during January –June to $25 million, figures that are lower than the both semesters of 2003. (Chart 2.9.7.7.1).
Chart 2.9.7.7.1 San Andres. Amount of individual credits for housing purchases by housing type 2003 - 2004 (Semesters) Million pesos
Housing type and period 2.003 2004(p) Variation % 1) New housing and parcels with utilities 0 0 (...)
First 0 0 (...)
Second 0 (...)
2) Used housing 435 25 (---)
First 179 25 -86,0
Second 256 (...)
Source: DANE (p) provisional
2.9.11 Tourism 2.9.11.1 Passenger activity The number of passengers arriving in the Island during the first semester of 2004 was 166.849, from which 144.531 came from Colombia and 22.318 from abroad. The foregoing shows a decrease of 3% in the number of national passengers and an increase of 22.9% in international passengers, since during the same period of 2003, 148.985 national passengers arrived as well as 18.154 passengers from abroad. Chart 2.9.11.1.1 San Andres Island. National and International Passenger Activity. 2003-2004 (Semester)
National International Passengers
2003 2004 Variation %
2003 2004 Variation %
Arrivals 148.985 144.531 -3,0 18.154 22.318 22,9
Departures 151.204 148.642 -1,7 17.156 23.275 35,7
Number of Flights 1.770 1.616 -8,7 328 472 43,9
Source: Aerocivil.

SAN ANDRES ISLAND
REPORT ON REGIONAL ECONONOMIC CIRCUMSTANCES 28
The same behavior was present with regard to flight arrivals; national arrivals decreased from 1770 during the semester January – June 2003 to 1.616 during the period under analysis, while arrivals from abroad increased from 328 to 472.
Graph 2.9.11.1.1 San Andres Island. National and International Passenger Activity. 2003-2004 (Semester)
0
100,000
200,000
2003 2004 2003 2004
National InternationalArrivals Departures
Source: Aerocivil.
2.9.11.2 Hotel Occupation During the period January – June 2004 the percentage of hotel occupation reflected an increase of 6.5%, reaching an average of 50.96% compared to 47.85% registered during the first semester of 2003.
Chart 2.9.11.2.1 San Andres Island. Hotel occupation percentage 2003-2004 (Semester)
Months
2003 2004 Variation %
Total 47,85 50,96 6,50
January 61,26 71,21 16,24
February 45,21 52,13 15,31
March 38,49 35,34 -8,18
April 44,57 47,01 5,47
May 37,74 42,09 11,53
June 59,84 57,99 -3,09
Source: Ashotel. The month of highest occupation was January with 71.21% followed by June with 57.99%, both classified as high season; as a contrast, March presented an occupation percentage of 35.34%, constituting the lowest occupation figure during the semester.

SAN ANDRES ISLAND
REPORT ON REGIONAL ECONONOMIC CIRCUMSTANCES 29
Graph 2.9.11.2.1 San Andres Island. Hotel occupation percentage 2003-2004 (Semester)
0.00
10.00
20.00
30.00
40.00
50.00
60.00
70.00
80.00Per
cen
tage
s
January February March April May June
2003 2004 Source: Ashotel.

SAN ANDRES ISLAND
REPORT ON REGIONAL ECONONOMIC CIRCUMSTANCES 30
BANK NOTES AND COINS: VALUE AND ART
Bank notes and coins represent identity symbols of our country, of its economy, history and culture. In addition to the monetary value and the purchasing power they provide, each of the notes and coins used daily comprise a relevant artistic, historic and cultural meaning, since each one uplifts a notable historic personality, the humanistic area in which they stood out, and they symbolize our national culture. The $1,000 Coin pays a homage to the Sinú culture, one of the mostly known precolombian cultures in our country, utilizing filigree earrings to illustrate one of their faces. The design was performed by the architect called Dicken Castro. A raintree (Saman) appears on high relief at the center of one of the faces of the $500 coin, whose motif is oriented to acknowledge the efforts carried out at the municipality of Guacarí, Valle del Cauca, in order to preserver the typical tree. It was designed by David Manzur, , a renowned Colombian artist, and highlights the importance of the issues relating to ecology and conservation environment. The One Thousand Pesos Note ($1.000) pays a homage to the liberal caudillo Jorge Eliécer Gaitán, one of the most important Colombian political leaders of the Twentieth century, who participated actively almost without interruption as a member of parliament and as a public officer between 1921 and 1948. The main motif appearing on the obverse corresponds to a portrait of Mr. Jorge Eliécer Gaitán, based on a photography taken on the terrace of Hotel Nutibara in the city of Medellín. An artistic representation of a partial image of a crowd listening to the words of the popular caudillo constitutes the background. Overleaf, an engraved artistic interpretation of the caudillo image addressing the crowd on the day in which he was proclaimed as a presidential candidate overlays to the representation of a multitudinous public meeting. The design was performed by the widely known artist called José Antonio Suárez. The Two Thousand Pesos Note ($2,000) honors the memory of General Francisco de Paula Santander (1792-1840), founder father of the nation, known as the “Man of the Laws” due to his conviction that the exercise of government should be based upon the law. He was President of the Republic twice. The obverse shows an engraving of the General’s portrait based on a sketch by the painter named José María Espinosa (1796-1883), while the founder father of the nation was alive. A landscape of an area of the “Llanos Orientales” is shown on the central section, region that represents the scenario where Liberating Army was formed during the Independence days. An illustration of the Mint appears overleaf. The designer of this note was the architect José Pablo Sanint. The Five Thousand Pesos Note ($5,000) praises de memory of a poet José Asunción Silva (1865-1896), one of the greatest and renowned poest in Colombia. One of his poems, “Nocturno” written in 1892, forms part of the cultural values of the Spanish

SAN ANDRES ISLAND
REPORT ON REGIONAL ECONONOMIC CIRCUMSTANCES 31
speaking world. An engraved portrait of the Poet José Asunción Silva appears at the right hand side of the note obverse, based on an interpretation of a photograph of said poet, dated 1894, two years before his tragic death when he was 29 years old. A glowworm lies settled on flagstones, its presence alludes to the evolution performed by the poet in his “Nocturno” poem. On the left hand side, a frog is shown over leaves, referring to a portion of the poem. The frog is also an animal that was widely represented within the art present in the indigenous Chibcha culture. Both at the obverse as overleaf, as background, different color hues are displayed as well as the iridescence. The predominant colors at the obverse are dark brown, ocher and green. The main motif overleaf is an engraving of a vignette alluding to the “Nocturno” poem by Silva. The scene shows a young woman walking through a poplar cove under a full moon as the main figure. A fragment of the poem appears in micro print on a pedestal of a footed vase. The design includes spangles distributed throughout the right and left ends of the note’s obverse, whose color changes depending on the angle of view. At the lower left end, inside the rosette there is a latent image displaying de letters “BRC”. The author of the design of the main motifs of this monetary sign was master Juan Cárdenas, a renowned Colombian artist. The Ten Thousand Pesos Note ($10,000) pays a homage to the 100th anniversary of the birth of Policarpa Salavarrieta (1795-1817), independence heroine who informed the patriots about the activities of the Spaniards. Her figure on the obverse of the note, was painted based on a portrait by José María Espinosa in 1855. Overleaf, the town called “Guaduas” birthplace of the heroine appears based on a watercolor painting by the diplomat and folkloric English painter Edward Walhouse Mark (1817-1895) performed in 1847. The Twenty Thousand Pesos Note ($20.000) pays a homage to the Colombian scientist Julio Garavito (1865-1920). He was a mathematician, engineer, philosopher and astronomer, Director of the National Observatory, and in 1970 the International Astronomy union granted him the honor of naming after him a set of lunar selenite craters located at the dark side of the moon. Mr. Garavito participated in monetary matters when, around 1885 acted as assayer of the Mint, and later, between 1902 and 1912 he worked on topics relating to political economics. The obverse shows an engraving of the scientist along with a representation of the moon at the center. Overleaf, the note includes an engraving of the earth observed from the moon. These illustrations were based on photographs taken by space ships at the end of the 70’s. The artist Juan Cárdenas who was in charge of the general design of the note is also acknowledged. As general characteristics of the note we find at the obverse a predominant blue color, an embossed portrait of Dr. Garavito, the moons representation, a watermark with the portrait of the scientist, three diamonds for identification by blind people, and the fluorescent numbering of the note The Fifty Thousand Pesos Note ($50,000) pays a homage to Jorge Isaacs, author of the novel titled “Maria”, literary work that has influenced several generations of men and women within the Hispanic world. Isaacs was more than a literary author. His agitated life synthesizes nineteenth Century spirit, full of passions and curiosities: having been a construction inspector, soldier, combatant, politician, journalist,

SAN ANDRES ISLAND
REPORT ON REGIONAL ECONONOMIC CIRCUMSTANCES 32
diplomat, founder of schools, ethnographer, president of the State of Antioquia and miner, his life reflects accurately those principles which became art through his immortal literary work “Maria”. The main motif in the obverse is a portrait of the writer Jorge Isaacs, based on several photographs. It also includes a representation of Maria, Main character of the homonymous novel, with the backdrop representing the scenery of the Department of Valle del Cauca with its main river. Overleaf, the other face of the scenery of the Department of the Valle del Cauca appears as a main embossed motif showing the mountains at which hillside the Hacienda del Paraíso is located, which is the scenario where most of the novel occurs, and place where Jorge Isaacs lived for mang years. At the forefront a characteristic tree of the region called “Saman” outstands as a frame to the house of the Hacienda el Paraíso. At the back front the palms called “Palmas de Cera del Quindío” are shown, being species of a national tree and the central mountain range is displayed in relief. Oscar Muñoz is the author of the design. Over 60% of the cost of the notes is associated with the security features included in the paper, made 100% from cotton, fact that provides a unique characteristic to the sense of touch, high resistance and durability, and 20% of the costs correspond to exclusive inks, contributing to an additional security level, being chemical agents resistant to water and heat among other. Many security features are common in all the notes. Taking the Fifty Thousand Note as an example we find the following:
1. Watermarks: tri-dimensional effect caused by a difference in paper width. It is not a printing with ink. When viewed against the light, the image of the writer Jorge Isaacs can be seen. The legend “50 MIL” appears lighter at the left hand side.
2. Security threads: The note contains two security threads: one of them is opaque and it is seen as a dark stripe. The other thread, seen in the obverse, stands out from the paper surface in five silver colored segments, and when the note is seen through light the following text may be read “ “50 MIL PESOS COLOMBIA”.
3. Color changing ink: A frontal view of the note by the obverse shows the number “50” in gold, changing to green when the note is seen from a slant view.
4. Relief Prints: Sensitive to touch, they correspond to areas with strong hues, whose images can be seen clearly even in notes that have been heavily used, showing firm colors and made from fine lines, conforming well defined outlines..
5. Perfect Registry: Both sides of the note show an image with blank areas. When observed held up to the light, said areas become fully colored, coinciding perfectly in shape with the corresponding areas appearing exactly at the other side of the note.
6. Micro Printing: The legend “BANCO DE LA REPUBLICA COLOMBIA” may be read repeatedly with the aid of a magnifying glass on the obverse. Similarly, the text “50 MIL PESOS” may be seen forming a rectangle adjacent to the upper number of the note series. The text “50 MIL BRC” is seen from in a front of the

SAN ANDRES ISLAND
REPORT ON REGIONAL ECONONOMIC CIRCUMSTANCES 33
portrait, at the area of the lower number of the note series. The text “BRC” printed in relief is seen overleaf, forming the complete design of the tree.
It is a duty of every citizen to keep the notes in good condition. Thus, it is not recommendable or advisable to neither write on them, fold or wrinkle them unnecessarily, nor get them dirty, torn, punctured, sealed, stapled, or marked by any means that may cause their deterioration. In addition, the notes should not be stored in places with excess of humidity or heat. Similarly, the coins should be taken care of, avoiding scratches, scrapings, flattening, crushing, puncturing, or any type of alteration of their shape and design. Bad use of coins and notes renders difficulty for observing the authenticity characteristics, drastically decreasing their life for circulation, fact that reflects greater costs for the national economy. The Banco de la Republica, as well as the commercial banks change worn out notes, provided they are authentic, with the adequate printing on the obverse and overleaf, and as long as they maintain at least three fifths of their total surface continuous as a whole and showing the complete numbering.
If you receive a forged note, you should report it to the authorities. Circulating or producing false notes constitutes a crime.
You may protect yourself against forged notes by observing them at the moment
of receipt.