Embed Size (px)
Citation preview
Forestry Poverty Linkage Model for India
D r. G op inath P radhan
D r. S ubrata M andal
Dr. M an ish G up ta
This report form s a part o f the Integrated Natural Resource Development and Poverty Reduction Project in Haryana
October 2004
National Institute of Public Finance and Policy New Delhi
P r e fa c e
The policy for using forest resource base for poverty reduction has been a focal point o f a
number o f studies. The present study analyses the nexus between forestry and poverty
alleviation by em ploying a village level Social Accounting M atrix (SAM) framework for
two contrasting ecological zones in India located in the Shivalik region o f the Himalayas
and the arid region o f the Aravalli dunes in the state o f Haryana. It takes into account the
flow o f inputs and outputs, including monetised values o f environmental goods and
services and the accrual o f income, consumption and savings for different income classes
o f the village. The accounting framework also includes externalities like soil erosion and
human health cost due to indoor air pollution. The study then derives accounting, fixed
price and mixed multipliers to capture the linkages between forestry sector and poverty.
The study finally suggests policy recommendations for poverty alleviation through
forestry programmes.
This important study was sponsored by the Japan Bank for International Cooperation.
The research was conducted in about seven months period by a team o f researchers. The
principal authors o f the study are Gopinath Pradhan, Subrata M andal and M anish Gupta.
This is the first study in the literature to use a social accounting matrix to explore the
nexus between forest resource use and poverty and I hope, this important contribution
will evoke more research in this area.
Although the study was conducted at NIPFP, the authors take full responsibility for the
views expressed. The Governing Body o f the NIPFP does not assume responsibility for
the findings o f the study or the recommendations contained in it.
October 2004 M. Govinda Rao
Director

Acknowledgement
We are thankful to the people of Pauti and Damdama-Bhogpur for their co-operation and
help without which it would have been difficult for us to carry out the survey in these two
villages. Thanks are also due the officials of Haryana Forest Department for their cooperation.
We would like to acknowledge Government of Haryana for providing us secondary data required
for the present study.
The cooperation extended by the School Administration in Pauti for carrying out the
household survey in the village helped us a great deal. Last but not the least we would like to
record our appreciation for the sincere efforts put in by our team members comprising Research
Assistants, Field Investigators, Computer Operators and Multipurpose Office Executives in
completing the project on time.
Authors

List o f Research Staff
1. Principal Authors:
2. Research Team:
Dr. Gopinath Pradhan
Dr. Subrata Mandal
Dr. Manish Gupta
Dr. Shekhar Mallick
Dr. Ravindra Gavali
Mr. Surendra Prasad Kushwaha
Mr. Sunil Kumar
Mr. Ramesh Chand
Mr. Sandeep Sharma
Mr. Soumendra Nath Banerjee
Ms. Neelam Yadav
Mr. Devender Prasad
Ms. Rajni
3. Office/Computer Assistants: Mr. Jivesh Thakur
Mr. Manjit Singh

Contents
Executive SummaryList o f Abbreviations1. Introduction
1.1 Forestry Poverty Link1.2 Village Level Poverty Alleviation Studies1.3 Objective of the study
2. State of Forestry in Haryana and Policy Intervention2.1 Introduction2.2 Forest of Haryana2.3 Joint Forest Management (JFM) in Haryana
3. Description of Study Area3.1 Rewari District3.2 Panchkula District3.3 Description of Two Villages Covered for the Study3.3.1 Village Pauti3.3.2 Village Damdama-Bhogpur:
4. Methodology of SAM4.1 Introduction4.2 Framework of SAM4.3 SAM Multiplier Analysis4.4 Multiplier Decomposition for Distributional and Interdependency Effects4.4.1 Distributional Effects4.4.2 Interdependency Effects4.5 Database
5. Village SAMs 41-625.1 SAM for Pauti5.2 SAM for Damdama-Bhogpur
6. Multiplier-based Analysis 63 - 836.1 Accounting Multipliers (Pauti)6.2 Income Generation Impact on the Village Economies
7. Policy Implications of the Study 84- 89
8. Summary and Conclusion 90 - 928.1 Limitations of the study
Select Reference 93 - 96
Annexure 1: Methodology for Estimation of Soil Erosion 97-98Annexure 2: Methodology for Estimating Annual Carbon Sequestration by the Forests 99 -100Annexure 3: Questionnaire canvassed for Household Survey in the villages, Pauti and 101-119
Damdama-BhogpurAppendix 1: Map of India showing the location of Haryana 120Appendix 2: Map of Haryana showing the location of the districts of Rewari and Panchkula 121Appendix 3: Map of village Pauti 122Appendix 4: Map of village Damdama 123
Page No.1 - x23 -7
8 - 12
13-28
29-40

Executive Summary
1. Introduction
Policy for using the forest resource base for poverty reduction has been a focal point among a
number of developmental agencies. The nature of their intervention is, however, diverse.
Forest-poverty link is often evaluated through the benefits derived from the forest by the rural
communities. The major categories of forest resources considered are non-timber forest products
(NTFPs), timber and environmental services. Fuelwood and fodder also are important forest resources
in most of the developing countries. Due to overexploitation and habitat destruction, NTFPs including
fuelwood, fodder and other extractive forest products face declining yield. Thus, maintaining their
supply to retain the role of safety-net is a challenging task.
The rural households are a heterogeneous group having a differentiated demand for forest
resources. Therefore any plan for intervention in the forest sector for the purpose of poverty reduction
has to be seen in the context of local peculiarities and the action plan may have to be drawn on a case by
case basis.
Incorporating forest as a resource sector of a village level economic set up, the interrelationship
among structure of production, the factorial income distribution, and the income distribution by
socioeconomic household groups are to be examined for forestry-poverty related issues.
A major task of the present study is to construct social accounting matrices (SAM) for two
villages - one located in the Aravalli Range in the southern part and the other in the Shivalik Ranges in
the northern part of Haryana. A total of 305 households and 13 shops have been covered which has
formed the basis of preparing the village SAMs. The major considerations for selecting the villages
were the prevalance of poverty conditions and existence of forest areas in their fringes.
2. State of Forestry in Haryana and Policy Intervention
The forests in India in general are experiencing rapid degradation. As a majority of the rural
people depend on forest products for their survival, sustenance of their livelihood needs to be
considered. While the programme of Joint Forest Management is trying to restore the degraded forests
to some extent overexploitation of the resources for fuelwood and timber, shifting cultivation, and
fodder remain major factors for continued degradation of forest.
3. Description of Study Area
The population of Haryana is 21.08 million of which 71% live in rural area. The state is divided
into two natural zones, the Shivaliks and the Aravallis hills and the Indo-Gangetic plains. It has a
recorded forest area of 175,400 ha which is 3.96% of its total geographic area.
Two villages selected for the construction of the SAM belong to Rewari and Panchkula districts
of Haryana.

Rewari district is located in the southwestern part of Haryana in the east of Aravalli hills,
bordering the arid regions of Rajasthan. The geographic area of the district is approximately 1559 sq.
km. As per the latest Census carried out in 2001, the total population of the district is 765,351 out of
which 629,177 is rural. The Scheduled Caste (SC) population in the district is mostly landless and do
not have permanent source of employment. The number of SCs in rural area is 121,789 in the district,
which is 19.35 % of the total rural population.
The area under forest cover in Rewari district was 40.0 sq. km, in 1992-93, which decreased to
30.0 sq. km, in the year 1995-96.
The soils of the district are highly deficient in organic matter and require heavy doses of manure
for improving the fertility. Wind erosion is most the common feature in the district.
The major kharif crops of the district are bajra (Spiked Millet, Pennisetum glaucum), jowar
(sorghum bicolor), groundnut and gwara (fodder crop) while the important rabi crops are mustard and
wheat.
The gross cropped area of the district was 196000 hectares in the year 1995-96. The fertilizer
consumption in the district was 93.32 kg/hectare. The main crops under irrigation are wheat and
mustard. The district is fairly rich in livestock, which include cattle, buffaloes, sheep, goats, pigs and
camels.
The other district for the purpose of the study, Panchkula, is in the Shivalik range which lies
in a different climatic zone than that of Rewari.
Despite a large number of streams passing through the district, the area suffers from severe
water scarcity. The present water level in the village Damdama - Bhogpur of the area was found to
occur at a depth of 157 mts. (525 ft).
The population of the district is 469210 according to 2001 census. The number of SCs in rural
area, who are landless, is 49911 in the district, which is 19.19 % of the rural population. The number of
rural agricultural labourer is 10,435, which is 9.57 % of total rural workers. 30 % of the population of
the district is below the poverty line (BPL)
The forest types occurring in these areas are “ Northern tropical dry deciduous forest” and the
“Sub tropical forest”. The forest contains a number o f miscellaneous hard wood species like Chal
(Annogensus latifolius), Khair (Acacia catechu), Jhingan (Lannea coromandelicd) and Amaltas (Cassia
fistula).
Paddy and Maize are the two major kharif crops while wheat is the principal rabi crop of the
district. In most of the villages the dairy is supplemented with the agricultural produce for earning a
livelihood.

Description o f the study Villages:
Pauti village is located in Rewari district in the periphery of Aravalli region. The vegetation is
predominantly of dry deciduous scrub. The forest cover of the village is 136 hactares The village has
143 households and a population of 955 of which 9.2% are below the poverty line.
The major activities of the village in relation to livelihood are agriculture and animal husbandry.
Important crops grown in the village are wheat, mustard, and millet. Some of the households sell milk to
the local co-operative dairy. The landless households earn their livelihood by working either as farm
labourers or wage earners in road construction/repair activities. There are around 32 landless households
in this village
The forest around the village is located in the dry Sahibi riverbed and consists predominantly of
bushes and scrubs. The villagers utilise the forest for grazing, collection of fodder and fuelwood. The
village livestock mainly consists of buffaloes and camels, which graze in the forest area.
The other village covered for the study, Damdama-Bhogpur, is located in the foothills of the
Shivalik range and has the forest cover of 437 hectares. It has a population of 869 consisting of 163
households. The village has a sizeable Schedule Caste population and a large number of households
have Yellow and Pink Cards, which are issued by the Government to the poorest group below the
poverty line. It is found that 17.1% of the village population are below the poverty line.
The major sources of livelihood for the village are agriculture and animal husbandry. The main
crops grown are maize, rice, wheat and pulses. The village livestock constitutes mainly of buffaloes and
goats. The SC community, which is landless, is mostly dependent on the forest for its livelihood.
The forest area under the village panchayat used for grazing is degraded. The village is
therefore, more dependent on the protected forest for fodder, fuelwood and NTFPs. The major
vegetation of the forest comprises Acacia katechu. Acacia nilotica, Anogysis latifolia, Cassia fistula,
Dalbergia sisso, Linea grandis, Dendrocalamus stictus, Gililiopsis biloteata.
4. Methodology of SAM
In order to bring out the interrelations among different sub-sectors of the village economic
system and to project its production and distribution channels, the study uses the technique of social
accounting matrix (SAM). SAM is based on the principle that for every income there is a corresponding
outlay or expenditure and is presented in the form of a square matrix. It records all the transactions that
take place among various production and consumption sectors. Besides providing a consistent data
framework for a village level analysis, the SAM captures the interrelationships between forest resource
use, the structure of production, distribution of income and ultimately poverty alleviation.
SAM has been widely used to analyze the direct and indirect impacts of diverse policy issues
and village level studies have been undertaken to assess the distributional impact of income generation.

An examination of poverty reduction impact through such a technique, therefore, is likely provide better
insight. The present study develops a modified SAM, which integrates environmental concerns at the
village level and analyses the forestry-poverty link.
The SAM records the transactions that take place among various production and consumption
sectors during a year. The inputs used in carrying out the production activities in a sector are given by
the columns in the matrix, while the rows indicate the distribution of the output of a particular sector to
be used as inputs by different sectors and final demand for consumption by the households.
For the villages under consideration the study covers four broad production viz., agricultural
commodities, non-agricultural commodities, forest products and services.
Four commodity accounts comprising agricultural items, non-agricultural items, forest products
and services in SAM indicate the amount of income spent on the purchase of different commodities and
services.
The factor account gives the inputs used in the production process and includes hired and family
labor, seed, fertilizer, manure, pesticides, tractors and other machineries, draught animals, electricity
and water charges, and rent of agricultural land.
The capital account of the SAM includes stock of natural capital along with cash savings and
investment. Natural capital includes land and forests whereas finance capital consists of institutional
savings and investment.
There is an external cost account, which accounts for the loss of natural capital base along with
loss of soil due to agricultural activity. This account also includes health cost incurred due to indoor air
pollution caused by use of biofuels.
The institution account of the SAM includes household and the government.
Based on the rate of daily wages which is taken as a benchmark by the local government for
identifying poors in the village household with a monthly income of Rs 2000 is categorized as poor;
those in the income category of Rs. 5000 to Rs. 2000 per month are also poor though not as poor as the
above category. They are classified in the study as low-income group; the middle-income group and the
high-income group of the villages have incomes ranging between Rs. 5000 to Rs. 10,000 and above
Rs. 10,000 respectively.
The final accounts in the SAM table pertain to rest of the villages and rest of the world. The
trade of the village with the region and rest of India are analyzed here.
An inclusion of forest sector into the village SAM helps capture the sector’s linkages with the
village economic system. Forests resources enter into the village SAM as activity, commodity, factors
of production and capital including natural capital accounts.

To analyse the effects of exogenous change on the village economic system, the transactions
between the sectors in the SAM are classified as endogenous and exogenous. In the present study
production activity, commodities, factors of production, forest, environment and households are
considered endogenous to the system while the remaining accounts viz., government, rest of villages,
rest of the world and financial savings are exogenous.
Using the SAM multipliers, the study captures the strength of linkages among different sectors
of the village economy. The linkages are shown in the form of change in the incomes of different
accounts due to an injection of a rupee in any one account.
The study considers three sets of multipliers, accounting, fixed price and mixed, to assess the
impact of exogenous changes on the village economy. Accounting multipliers assume that the average
expenditure behaviour prevails in the margin whereas other two consider the propensities to be
different.
The fixed price multipliers are based on the assumption that there exists excess capacity in the
endogenous sectors. Thus as long as the excess capacity prevails any exogenous change in demand can
be satisfied through a corresponding increase in output without having any effect on prices. However,
this assumption is unrealistic when applied to agriculture and forest sector. In such a situation, the fixed
price multipliers will provide output and income multiplier estimates that are unrealistically high
owning to overtly optimistic expectations regarding supply response. So it is posited that supply of the
agricultural and forestry output is inelastic.To address such concerns mixed multipliers are estimated.
An important task of the present study is to assess the impact that different production activities
have on poverty alleviation. Fixed price multipliers are decomposed into interdependency and
distributional effects in order to estimate the contribution that different production activities make
towards poverty alleviation.
The distributional effects include incomes received by a given household group from factors
such as labour and land provided by that group and used as primary inputs in the production of the
commodity under consideration. It also includes the indirect factor incomes received by the same group
from the intermediate inputs required in the production of that commodity and incomes accruing to that
group from transfers and remittances from other socio-economic household groups. The
interdependency effects capture the indirect spending and re-spending effects by the groups that
benefited, income-wise, from an initial increase in output.
Household survey was carried out in two selected villages to get the requisite data to construct
the SAMs. Transaction matrix is then constructed separately for the two villages, Pauti and Damdama-
Bhogpur.
5. Village SAMs
The transaction matrix of Pauti shows that the village is predominantly agriculture-based.
Cultivation of mustard, wheat and cotton is the most important agricultural activity. The village also
cultivates oilseeds and pulses, vegetables and fodder. A substantial portion of the expenditure on inputs
is incurred on account of land preparation and fertilizer. The livestock and poultry sector also
contributes to income of the village. The services sector generates more income as compared to forest
and non-agricultural sectors.
The commodity account gives the consumption pattern of different income classes of the
village. It is seen in Pauti that the poor households are relatively more dependent on forest products.
The capital account, which includes land and forest, captures the impact on the environment due
to soil erosion caused by agricultural activity of the village. It also includes the savings and investment
of different groups of households. More than 75% of the savings of the village comes from the high-
income group while the poorest group saves only 1.4% of the total.
The health cost associated with indoor air pollution caused by fuelwood used for cooking, has
been accounted with the forest product as an external cost. The total health cost due to indoor air
pollution of the whole village works out to be Rs. 0.18 million of which 20 % is incurred by the high
income households, 8.5 % by the middle income, 57 % by the low income and 13 % by the poor. The
cost of soil erosion amounts to Rs.0.64 million.
The government provides water, electricity, education and infrastructure service to the village.
Moreover, it is also the owner of village forests and hence gains in natural capital stock are recorded as
its income. Revenue from commodity taxation in the village constitutes a major source of receipt for the
government whereas subsidies on account of fertilizer, water charges, kerosene and LPG are major
expenditures borne by it.
Transaction of the village with rest of the villages and rest of the world indicates that rice and
nonagricultural goods are the main imports of the village while agricultural commodities and labour are
the major exports.
In Pauti the higher-income classes draw most from the forest as compared to the poor.
In Damdama-Bhogpur cultivation of wheat, maize and paddy are the most important
agricultural activities. The village also cultivates oilseeds and pulses, vegetables and fodder. A
substantial portion of the expenditure on inputs is incurred on account of manure and fertilizer in the
cultivation of wheat, maize and vegetables. Among the agricultural crops, value addition is high in
wheat, maize, paddy and cultivated fodder. Paddy, maize and vegetables are the main export crops of
the village.
The consumption pattern o f different household groups shows that the poor households are
relatively more dependent on the forest products.
The health cost associated with indoor air pollution caused by fuelwood is more than Rs.0.29
million.
The capital account, which includes land and forest, captures the impact on the environment due
to soil erosion caused by agricultural activities. More than 54% of the savings comes from the high-
income group while only 1% comes from the poorest group.
The government provides water, electricity, education and infrastructure service to the village.
It also taxes commodities and gives subsidy to fertilizer, water charges, kerosene and LPG.
Rice is the main export of the village while wheat and vegetables are the main imports. It was
found that the village is highly dependent on forest for its consumption of fuelwood and fodder.
6. Multiplier Based Analysis
In Pauti, compared to agricultural production forest sector activity generates a higher production
multiplier. The household income multiplier for forest products is also the highest in the village.
Although the poor household groups also benefit from such increased income, most of the benefits
accrue to the richest group in the village. The transfer of income to low-income group in the villages
induces the highest production and income multipliers. Thus any social transfer programme and
intervention will have the strongest effect on inducing local production and incomes if directed to the
low-income group which consumes more of locally produced goods as its income increases.
In Damdama-Bhogpur the total production multiplier is the highest in case of mustard. Next to
agricultural production the forest sector activity generates a high production multiplier. Like Pauti, here
also the household income multiplier is the highest for forest products. Although the poor household
group benefits from such a transfer, most of the benefits accrue to the middle- and high-income classes.
In addition to the accounting multipliers, fixed price and mixed multipliers are calculated for
both the villages of Pauti and Damdama-Bhogpur to examine the intersectoral linkages and to analyse
the income generation impacts of production and expenditure. From the multiplier analysis it is seen that
in both the villages the forest sector has the highest value added generation potential.
In Pauti the poor household groups (comprising low and poor income classes) has the most
desirable expenditure pattern in generating economic growth of the village. But the pattern changes in
case of Damdama-Bhogpur where the rich households comprising the high and middle-income classes
hold the key for a greater growth potential.
In both the villages the induced effects of consumption linkages explain only a very small
portion of the value of the income multiplier. When the exogenous effect is eliminated from the total
effects, the explanatory capacity of consumption linkages improves.

In Damdama-Bhogpur the total multiplier effect originating from the retail trade is the highest
followed by paddy, mustard and forest products. Such a finding indicates that these activities make
relatively higher contributions towards poverty alleviation in the village.
In Pauti the total multipliers originating from forest and village services are the highest
implying their higher contribution towards poverty alleviation in the village.
The distributional effect of forest as compared to other activities on the poor household groups is higher
in both the villages. Thus there is a considerable potential of the forest for poverty alleviation.
Both for Pauti and Damdama-Bhogpur the multiplier analysis establishes the linkages between
the forest sector and the village economy. Although the poor in the village do benefit from increased
household incomes, the major share of it accrues to the richest household groups.
The injection of resources in the forest sector also results in an increase in fuelwood collection
activity. Burning of fuelwood for cooking, which is one of the major sources of indoor air pollution, has
an increased adverse effect on the health of the households.
7. Policy Implications of the Study
Two forms of exogenous interventions in the forestry sector can be made for the benefit of the
poorer sections:
a) Intervention of social forestry type, where the forests are grown over panchayat lands and the stock
of trees remain the property of the village panchayat. Consequently the income from such a scheme
accrues to the village panchayat. Benefits of this scheme are reaped by the villagers indirectly.
b) Direct intervention to increase the forest resources. This route includes increase of forest resources
regeneration of degraded forests.
In view of the supply constrains faced by the poor households with respect to fuelwood, fodder
and non timber forest product consumption, an afforestation program should be helpful to augment the
quantity of forest resources that would be required to ease the supply constraints.
The villages depend on forest mostly for meeting their fuel requirements although dung cakes
also constitute an important alternative source. The cattle dung being a good fertilizer and a bad fuel can
therefore be recommended for replacement by fuelwood.
For Rewari the total fuelwood demand is estimated to be 298,200.8 tons per year and the
sustainable supply from the forest in the district is estimated to be 50,906 tons. To meet the demand, an
additional 14,088 hectares of land needs to be brought under forests.
In Rewari the estimated annual fodder consumption by the total livestock amounts to 2,015,334
tons. To meet this demand it would require 18,791 hectares of forestland.

The district has 19,000 hectares of available fallow and wasteland which can be utilized for
plantation of fuelwood and fodder species.
For Panchkula the total fuelwood demand of the district is estimated to be 159770.7 tons per
year while the sustainable annual supply is estimated to be 103,094 tons. Thus there is a shortfall of
149,461.3 tons. To meet the deficit an additional 1,044 hectares of forestland would be required.
In Panchkula the estimated total yearly consumption of fodder by the livestocks in the district
amounts to 159,770 tons and it would require 913 hactares of forestland to supply the fodder leaves.
The available fallow and wasteland in the district, estimate of which are not available at present,
may have to be brought under forest cover. In case the augmented forestland fails to provide the above
requirement of fuelwood and fodder, the option of increasing the density of forest will have to be
exercised.
Taking into account the ground realities of the two districts the study suggests for an increased
supply of fuelwood from the forests could only be a short-term solution.
8. Summary and Conclusion
Intervention in the forest sector with the objective of poverty reduction has been a focal point of
many developmental agencies.
Poverty-forestry link remains controversial issue. While poor people’s role in forest degradation
due to over-exploitation of its resources does not enjoy consensus, the poverty reduction potential of
forest products on which the poor depend most is not yet established. The intervention strategy of most
of the practitioners therefore is based on case specific micro-level analysis.
As the dependence of rural poor on each category of forest resource differs, the correspondence
between resource-type and category of rural poor is to be examined through a framework capable of
comprehensively capturing the interdependence between forest and the economy functioning in its
fringe area. A social accounting matrix (SAM) framework seems appropriate for analyzing such micro
level inter sectoral linkages.
The present study generates a set of empirical results on the extent and nature of economic
linkages between the village economy and forest resources in two villages of the state of Haryana, India.
The analysis is based on the income generating multipliers derived from a village level social
accounting matrix framework.
Making use of the SAM technique, an attempt is made to capture both indirect and direct effects
of exogenous policy-induced changes on forest resources. Findings of the study can be used as the basis
for intervention in the forest sector for poverty reduction. By selecting two villages located in different
climatic zones, the study enlarges the scope of extending the results to other villages of the state with
similar economic conditions.
ix

The framework developed in the exercise is based on an extended SAM and incorporates the
effects of forest related environmental services like soil degradation, carbon sequestration and biofuel
use. Thus the impact of income generation by households when resource degradation process is resorted
to is addressed.
The study aims at assessing (a) the potential of forest based production activities in the generation
value addition, (b) the inducement provided by various household groups’ expenditure patterns in
increasing the village income, (c) the strength of forest production and consumption linkages in
stimulating the overall income growth of the village and (d) the poverty reduction features of production
activities in the forest through generation of distributive effects. Two sets of exercises assuming non
constraint and constraint supply capacities of forest and agriculture sectors have been undertaken.
When an assumption of supply constraints in the forestry sector is brought in, the magnitude of
the impact due to an exogenous shock transmitted through various production activities or household
groups diminishes. If complete excess capacity in the village forest is assumed, stimulating demand is
sufficient to encourage increases in output and income. Under such an assumption, the agricultural
sector, which is also supply constrained does not increase output production. So policy has to intervene
from the supply side.
The present analysis finds that forest activities have an advantage over agricultural ones in
generating income. However, the extent of income augmentation from forest activities is likely to be
affected by supply elasticities of its products. Value-added multiplier under assumptions of perfectly
inelastic supply in forest is only 44% of the level under assumptions of perfectly elastic supply.
At the household level, forest based activities perform better than agricultural activities in
income generation. Relatively richer categories of households gain more than the poorer group from
such a process.
Without the imposition of supply constraints among sectors of the village economy, the
expenditure of two poorer households inducing a higher income growth can be projected.
Results of the study indicate the relative strength of production over consumption linkages in
generating village economy’s growth.
On the basis of results obtained from multiplier analysis the study proposes two forms of
exogenous intervention in the forestry sector for the benefit of the poorer sections.
Notwithstanding the findings some of the important limitations of SAM from the underlying
assumptions of linear, fixed proportion technology cannot be overlooked. The fixed price multipliers are
based on demand driven system. The presence of market imperfections is likely to cause prices not to be
exogenous and constant. Moreover, the substitution responses, which may emerge from production and
consumption sides, have remained beyond the purview of the analysis.
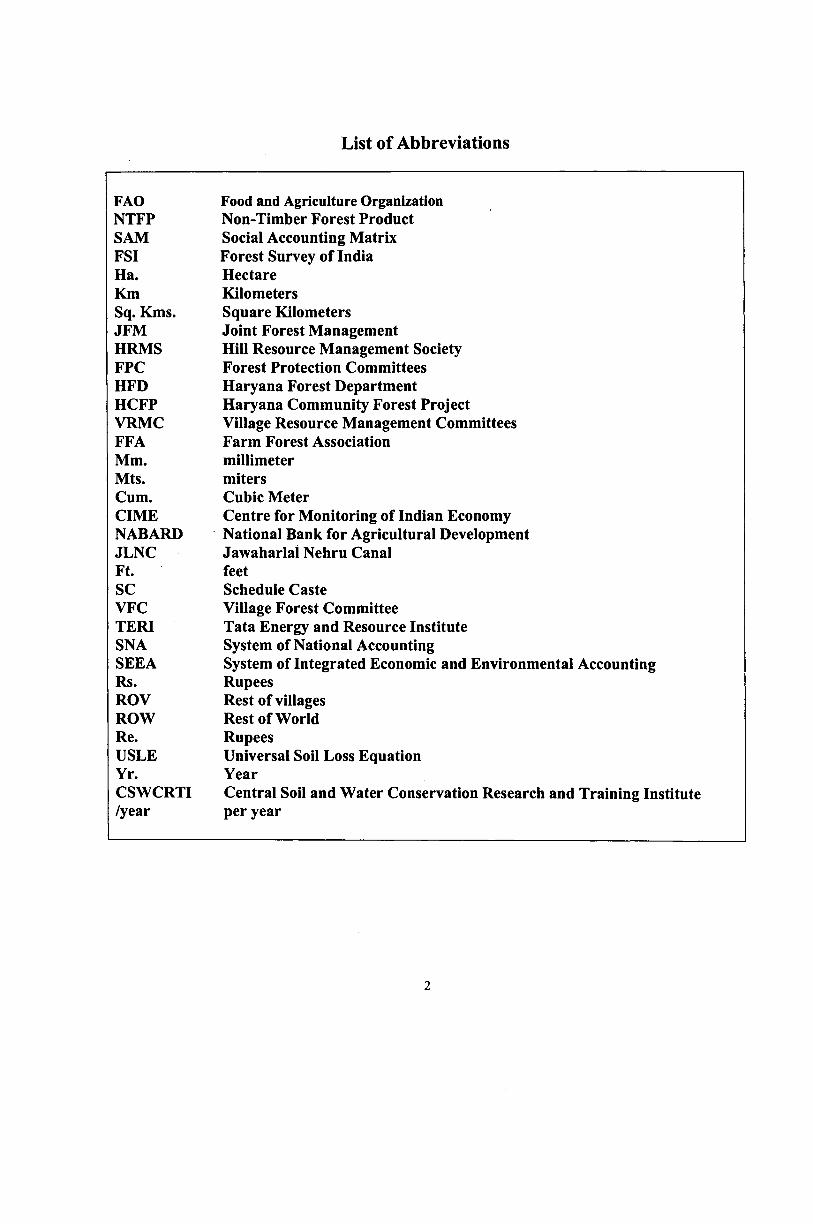
List of Abbreviations
FAO Food and Agriculture OrganizationNTFP Non-Timber Forest ProductSAM Social Accounting MatrixFSI Forest Survey of IndiaHa. HectareKm KilometersSq. Kms. Square KilometersJFM Joint Forest ManagementHRMS Hill Resource Management SocietyFPC Forest Protection CommitteesHFD Haryana Forest DepartmentHCFP Haryana Community Forest ProjectVRMC Village Resource Management CommitteesFFA Farm Forest AssociationMm. millimeterMts. mitersCum. Cubic MeterCIME Centre for Monitoring of Indian EconomyNABARD National Bank for Agricultural DevelopmentJLNC Jawaharlal Nehru CanalFt. feetSC Schedule CasteVFC Village Forest CommitteeTERI Tata Energy and Resource InstituteSNA System of National AccountingSEEA System of Integrated Economic and Environmental AccountingRs. RupeesROV Rest of villagesROW Rest of WorldRe. RupeesUSLE Universal Soil Loss EquationYr. YearCSWCRTI Central Soil and Water Conservation Research and Training Institute/year per year
2

1. Introduction
Notwithstanding the recent finding on the impact of sectoral pattern of growth on poverty
alleviation (see, for example, Lipton and Ravallion, 1993), specific basic needs programmes remain
important options for many government and international intervention through organisations. Therefore,
working in selective sector such as forest, that has the features of externality and implications for
sustainability clause, is not uncommon (see World Bank 2001; FAO 2001) and policy for using the forest
resource base for poverty reduction has been a focal point among a number of developmental agencies.
1.1 Forestry Poverty Link
Forest-poverty link is often evaluated through the benefits derived from the forest by the rural
poor (see, Kaimowitz, 2002; FAO 2001; Oksanen and Mersmann, 2002; Campbell, 2002). For that
purpose, the major categories of forest resources considered are non-timber forest products (NTFPs),
timber and environmental services. Some of the important insights offered by such analyses are noted in
the following:
Non-Timber Forest Products:
• the poorest segments of the societies around the world are engaged in NTFP extraction and these
products serve as safety net or perform gap filling functions in their livelihood strategies,
• NTFPs used by poor, in general, have lower economic returns and usually offer poor potential for
value generation.
Due to overexploitation and habitat destruction, NTFPs and other extractive forest products face
declining yield. In specific cases important resources such as fuelwood and fodder are also becoming
scarce which has a serious ramification for the rural population in many developing nations. Thus,
maintaining their supply to retain the role of safety net is a challenging task. Pro-poor institutions, skills,
marketing channels and reduction of middlemen profits are pointed out as important factors for retaining
the existing level o f supply (Arnold 2001).
Timber:
Timber extraction benefits poor, albeit indirectly, through employment opportunities. However,
seen in terms of a broader definition of forest where trees outside the traditionally defined forest are
included, other benefits accruing to the poor may also be considered. In such a scenario, some of the pro
poor characteristics of timber are flexible harvesting time, a form of on-farm savings and multiple use.
So local access to and management of natural forest is suggested as an option for poverty reduction
3

(World Bank 2001). In such a context, it is pointed out that the emerging trends in markets, technologies
and institutions hold good potential for raising small scale timber production, both from natural forests,
small scale plantations and a multitude of intermediate systems producing tress.
Ecological Services:
Forest dwellers role in the perspective of benefits emanating from carbon storage and
sequestration, biodiversity conservation, hydrological services and tourism have gained global
acceptance. Therefore, introduction of payments by the beneficiaries i.e., the non-forest dwellers to forest
dwellers as incentive to conserve forests remains an important international agenda. Despite the problems
of land tenure associated with forest dwellers, transaction costs of making agreement with them, the
emerging markets for forest services are expected to provide new opportunities for poor forest stewards
(for example, see Smith and Scherr, 2002 for carbon sequestration and storage schemes; Pagiola, 2001 for
benefits from hydrological services; and Gurung and Coursey, 1994, The Zimbabwe Trust et al, 1994, for
benefits to local population from tourism operations).
While the link from forest to poverty alleviation is tried to be understood better recently and areas
of intervention in NTFPs, timber and ecological services have been demarcated, it is necessary to point
out that the rural poor, even the poorest households, are a heterogeneous group. Consequently, they have
a differentiated demand for forest resources. Therefore any plan for intervention in the forest sector for
the purpose of poverty reduction have to be seen in the context local peculiarities and the action plan may
have to be drawn on a case by case basis.
Since the forest-poverty link remains a controversial issue - one strand of thought holding
poverty responsible for forest loss (WCED, 1987) while another de-emphasizing its general validity
(Wunder, 2001) - the recent programmes attempt to define the role of forestry in poverty alleviation. It is
usually assumed that the causality runs from forest to rural poverty and to operationalise the intervention
programmes the definitions adopted for poverty and forest are broadened. Thus, forest comes to
encompass sources of forest products outside as well as inside forests which poor people draw upon
(Arnold, 2001) whereas the concept of poverty includes, along with the traditional definition of lack of
income and material possessions, aspects of human well being such as health, education, nutrition and
empowerment (Angelsen and Wunder, 2003).
Seen from the practitioners’ perspective the forest-poverty link is better evaluated by identifying
the poverty-reducing role of forest resources such as non-timber forest products (NTFPs), timber and
ecological services. As the dependence of rural poor on each category of these varies, it is imperative to
consider the correspondence between resource-type and category of rural poor such as landless labour and
4
smallholder. So the platform from which above-mentioned link may be properly examined is a
disaggregated analysis.
A major problem with the forest-poverty relationship concerned with the identification of
effective intervention channels is the absence of inputs provided by a conceptual framework capable of
comprehensively capturing the interdependence and intra- and intersectoral linkages prevailing in a given
project area. In particular, incorporating forest as a resource sector o f a village level economic set up, the
interrelationship among structure of production, the factorial income distribution, and the income
distribution by socioeconomic household groups are not examined by the experts working in forestry-
poverty related issues.
It may be useful to point out that in a typical village of India, the main activity, agriculture,
functions by generating a series of sub-sectors like labour market, material input and agricultural-
implement-supply. Each sub-sector gets linked to the others so as to function as an integrated whole
where production and distribution flows circulate giving it a self-sustaining character. In such a system,
the forest resources perform the role of capital as well as consumption goods. Hence their poverty
reduction features can be evaluated better only when this sector is considered as an integral part of the
economic system o f surrounding area. While taking their production and consumption decisions the
participants of the system must endogenise the forest sector and realize the distributional impact of
changes in demand and supply of forest products.
1.2 Village Level Poverty Alleviation Studies
The above studies have dealt with forestry poverty linkages, i.e., how forest sector contributes to
the reduction of poverty. However, the quantification of poverty reduction has not been taken up by these
as a focal point. There are studies, which have looked at the issue of poverty by taking into account the
distribution of income among the poorer sections of the village economy. These studies are Parikh and
Thorbecke (1996), Subramanian and Sadoulet (1990), and Adelman and others (1989). An important
aspect of these studies is an examination of the structural linkages between production, consumption,
trade and income distribution at the village level by adopting the framework of Social Accounting Matrix
(SAM).
The study by Adelman, Taylor and Vogel (1989) has used the SAM model to analyze the
economic structure of a village in Central Mexico. Their analysis indicates that migration helps in poverty
reduction in a significant way. The landless, whose average per capita income including migration
remittances just meet their subsistence needs, would starve if all migration possibilities were cut off. This
highlights the vulnerability of the landless to external shocks and the relatively small trickle down effect
5
to this group resulting from several income generating policies. At the same time the policy experiments
indicate that policies targeted at landless would generate the highest production and income multipliers in
the village, induce the maximum growth in the rest of Mexico, lead to greatest reduction in poverty and
have most egalitarian distributional consequences. Subramanian and Sadoulet (1990) have on the other
hand studied an Indian village to see how technical change, output fluctuations and government policy
affect income distribution and poverty. Their study demarcates the village economy from its surroundings
and separates internal and external linkages. The internal linkages show how secondary effects like the
effects of increased agricultural production or increased consumption expenditure influence income
distribution, whereas, the external linkages show how changes in external flows such as transfers and
wages affect the distribution of income in the village economy. They observed that the yearly variations
in agricultural output have a major impact on income distribution, especially among the small and
marginal farmers and landless labourers. The study by Parikh and Thorbecke (1996) analyses the impact
of rural industrialization on village life and economy. In order to do so the authors compare two relatively
similar Indian villages, one close to a factory and another located in a remote area. They observed that in
the village, which was located in the vicinity of the factory, the incomes of the poorest household group
(i.e., the landless) are most favourably affected by the changes in hired labour’s account. In other words
the provision of non-farm work for the casual labourers has improved the incomes of the landless
considerably.
It may be noted from the above discussion that there are two broad groups of studies, which have
addressed the issue of poverty reduction. One group looks into the forest-poverty link by postulating that
the causation runs from forest resources to poverty alleviation. However, the limitation of such studies is
that they fail to capture the intricate process of distributional mechanism, which percolates through the
intersectoral linkages to benefit the poor. The second group of studies, on the other hand, captures the
quantum of direct and indirect gains accruing to the poorer sections of the economy due to an exogenous
or policy intervention. While such a framework seems to be useful to analyze the differentiated impacts of
exogenous intervention in the village economy, it has not yet been employed to assess the impact of forest
resources on poverty reduction. Keeping in view such a gap, the present study will proceed by adopting a
SAM framework that will incorporate the forest as a distinct sector in the village economic system and
will trace its distributional impact on poorer sections.
1.3 Objective of the study
The major task of the present study is to construct village level social accounting matrices (SAM)
by taking two villages - one located in the Aravalli Range in the southern part and another in the Shivalik
Ranges in the northern part of Haryana. A total of 305 households and 13 shops have been covered which
6

has formed the basis of preparing the village SAMs. The study analyzes the impact on poverty reduction
and environmental improvement through the intervention of forestry sector and also takes into
consideration the effects o f external factors like policy changes which would assist in the process of
implementation of the JBIC project on integrated natural resource development and poverty reduction.
7

2. State of Forestry in Haryana and Policy Intervention
2.1 Introduction
The situation of forests in India is precarious. As per an assessment of the Government of India,
67.55 million ha constituting 20.55% of the geographic area of the country has forest. Out of this 41.68
million ha (12.688%) is dense forest, 25.87 million ha (7.87%) open forest and 0.45 million ha (0.14%)
mangroves. As against the world average of 0.64 hectare of forests per human, an Indian has only 0.06 ha.
Such a per capita forest figure stands out to be less than that of the Europeans (1.3 ha) and the Chinese
(0.1 ha). In India, a whopping 147 million people live in 170,000 villages in the proximity of forest areas.
A majority of these being poor, their survival depends on forest produce. They need fuelwood and fodder
from the forest at the very minimum. Often they also look for marketable forest produce to meet their
cash needs. In spite of the enormous pressure exerted by a large population, there has been a net increase
in the forest cover by 3,896 sq.km between the forest area assessment held in 1997 and 1999 and a further
increase of 38,245 sq.km. between 1999 and 2001. The dense forest has increased by 10,098 sq.km,
between 1997 and 1999 assessment and 34580 sq.km. between 1999 and 2001. It is to be noted that the
period during which the change in forest cover has occurred is not uniform in all the states but varies
between 2-5 years. The main reasons for gains in forest cover are the inclusion of established large block
plantations, improvement in the density of forest due to Joint Forest Management and natural
regeneration. On the contrary the major reasons for losses are shifting cultivation, encroachment and tree
felling (FSI, 2001,1999).
2.2 Forests of Haryana
Haryana, an agriculture rich state, lying in the northwest part of the country (refer to the map in
Appendix 1), has a geographic area of 44,212 sq.km. which is 1.3% of the country’s geographic area. The
population of the State is 21.08 million (2.1% of India’s) of which 71% live in rural area. There is no
tribal population in the state and its average population density is 477 persons per sq.km. Known for its
high quality cattle, especially buffaloes, the state has a livestock population of 9.14 million (1.9% of
India’s). The state, which ranks 7th among all the Indian states and UTs in respect of percentage of
geographic area under tree cover, is divided into two natural zones, the Shivaliks and the Aravallis hills
and the Indo-Gangetic plains. Two rivers, Yamuna and Ghaggar, are the lifeline of the state. It is an
intensively cultivated state and is deficient in natural forests. It has a recorded forest area of 175,400 ha
which is 3.96% of its total geographic area. The coverage o f dense forest in the state is 1,139 sq.km. (2.57
%) and that of open forest is 615 sq.km. (1.39 %). Forests are mainly distributed in the northeastern and
southeastern districts of state. There are three forest types, the Tropical Dry Deciduous in the eastern part,
8

Tropical Dry Deciduous in the Shivalik region and Tropical Thom Forests in the western part of the state.
The number of villages in the state is 6759 of which 90% use forest for cultivable land. In these villages,
7,967 ha are classified as forest. Population inhabiting in these villages is 0.13 million. The villages
having less than 100 ha, between 100-500 ha and more than 500 ha forest area in each, constitute 79%,
17% and 4% of the total villages, respectively. District wise distribution o f dense forest, open forest and
scrubs are given in Table 2.1.
Table 2.1: District-wise Forest Cover in HaryanaForest Cover
District GeographicArea
DenseForest
OpenForest
Total Percent Scrub
Ambala 1,574 46 2 48 3.05 0Bhiwani 4,778 90 66 156 3.26 8Faridabad 2,151 19 46 65 3.02 16Fathehabad 2,538 46 5 51 2.01 0Gurgaon 2,766 21 173 194 7.01 31Hisar 3,983 64 2 66 1.66 0Jind 2,702 8 5 13 0.48 0Jhhajjar 1,834 11 5 16 0.87 0Karnal 2,520 63 18 81 3.21 0Kaithal 2,317 80 7 87 3.75 1Kurukshetra 1,530 109 1 110 7.19 0Mahendragarh 1,859 22 40 62 3.34 14Panipat 1,268 170 152 322 25.39 16Panchkula 898 15 4 19 2.12 0Rohtak 1,745 11 15 26 1.49 0Rewari 1,582 19 10 29 1.83 0Sirsa 4,277 178 2 180 4.21 0Sonipat 2,122 3 2 5 0.24 1Yamunanagar 1,768 164 60 224 12.67 1Total 44,212 1,139 615 1,754 3.97 88
Source: Forest Survey of India, 20C 1
2.3 Joint Forest Management (JFM) in Haryana
Indian response to the problem of sustainable use forest is the programme of joint forest
management. Its major emphasis is on the involvement of stakeholders in the maintenance and use of
forest. Since the nature of dependence on forest of the people residing in its fringe area differs from place
to place, the operational strategy of implementing JFM programme varies among the states of Indian
Union and there are instances of its success in achieving its major objective of regenerating degraded
forests (see Damodaran, 2003). The framework of JFM has been evolved with the help of a series of
legislative measures like Forest Conservation Act, 1980, National Forest Policy, 1988, Joint Forest
Management resolution 1990 and Joint forest Management Guidelines, 2000 and 2002. To understand the
9

niceties involved we briefly touch upon the JFM implementation process in the state of Haryana and point
out the important issues that need to be tackled for improving the efficiency of the programme.
In Haryana, JFM was started as early as 1972 though a Government notification in this regard
was issued, in 1990. It may be worthwhile to note that the joint management policy received a big boost as
a result of successful experiments in the 1970s in Haryana (Sukhomajri) along with that of West Bengal
(Arabari). Being a pioneer role model, the JFM in Haryana has also come to be implemented in a larger
segment of its land resources including the non-degraded forests and a number of policy measures in
addition to the legislation of federal government have been introduced. Thus the introduction of Haryana
Joint Forest Management Policy, 1990, Haryana Joint Management of Forest Areas Executive
Instructions, 1998 and Ch. Devi Lai Social Forestry Scheme, 2002 provide the basic features of the
operational schemes of JFM in the state.
The basic philosophy of JFM programme of Haryana seems to be improvement of the economic
interests of villagers living in fringe areas of the forests as well as to increase land under forest cover. The
agricultural communities get water, fodder and related biomass at a concessional rate from the
regenerated forest areas with the Hill Resource Management Society (HRMS) participating in the
planning process. Moreover, the Forest Protection Committees (FPCs) in the state are empowered with
the functions of punishment, imposition of fines, framing of rules and distribution of benefits. There are,
at present, 350 Hill Resource Management Societies (HRMSs), managing 60,734 ha of forestland. The
net income is to be apportioned between the Government and the HRMS as 25% and 75% respectively.
The HRMS shall contribute 30% of its share towards plough back fund for further improvement of
management area and another 10% towards Kalyan Kosh (Welfare Fund).
In the light of the experiences gained in various JFM-related projects, some of the issues
identified by the JBIC report (2003) for a closer look are:
1. Provisions of benefit sharing from timber management of responsibilities
2. Village institution building including financial sustainability
3. Benefit sharing system of bhabbar, fodder grass, bamboo and other NTFPs
4. Linkages between village Sarpanch (headman of the panchayat, which is the local self government of
the village) and the forest committees
5. Guidelines on the roles of the stakeholders
In its attempt to improve the forest resource base, Haryana Forest Department (HFD)
implemented the Aravalli Project during 1990-1999 and also the Haryana Community Forest Project
(HCFP) in 1998.
10

Overall objectives of these projects are to:
a) improve the natural environment,
b) preserve land fertility,
c) achieve sustainable management of natural resources.
Large-scale plantations were carried out under Aravalli Project since 1992. Plantations have been
raised mostly on panchayat lands, along the roads, canals, railway lines, water courses, on the available
institutional land and on the farm lands. The area of plantation for different species is given in Table 2.2.
below.
Table 2.2: Species-wise Plantations upto 1998
Species Area in '000 ha
Percentage
Acacia nilotica 125.68 22.0Eucalyptus spp. 119.96 21.0Prosopis cineraria 85.69 15.0Dalbergia sissoo 68.55 12.0Salvadora spp. 17.14 3.0Populus spp. 11.43 2.0Acacia tortilis 11.43 2.0Azadirachta indica 11.43 2.0Mangifera indica 11.43 2.0Others 108.54 19.0Total 571.28 100.0
Source: FSI Estimate
It can be seen from the table that plantations of Prosopis juliflora, Acacia nilotica, Acacia tortilis,
Ailanthus spp., Euphorbia spp., Dalbergia sissoo, Acacia catechu etc. have been raised.
JBIC under took a field survey of these projects to (a) assess the effectiveness in terms of the
economic, social, environmental and institutional impact and (b) suggest strategies to ensure the
institutional and financial sustainability of the project and alleviate poverty.
Two villages o f Aravalli and five of HCFP have been covered by the survey indicate that
agriculture and animal husbandry are major sources of income. Some of the important findings of the
exercise in the post-intervention phase are:
• poor and deprived sections of the village are better equipped to participate in the decision making
processes concerning development activities,
• village organisations such as Village Resource Management Committees (VRMCs) and Farm
Foresting Associations (FFAs) are constituted to enable sustainable management of village/rural
11

forest resources, improvement in regeneration of degraded forest and increased forest resources for
community use.
It is not difficult to see that finding of JBIC survey point to the requirement of strengthening the
benefit sharing provisions and institutional building capacity of the village communities for an effective
operation of the JFM. Pending the resolution of such problems, the working o f JFM often seems to be
conditioned upon exogenous interventions.
12

3. Description of Study Area
Two villages selected for the construction of the SAM belong to Rewari and Panchkula districts
of Haryana (see the map in Appendix 2). The geographic and socio-economic profiles of these districts
are discussed in the following before describing economic characteristics of the villages under study.
3.1 Rewari District
The present district of Rewari was part of Gurgaon district. In 1972 areas of Rewari tehsil
(subdivision) comprising of 305 villages and two towns, Rewari and Bawal, were transferred to
Mahendragarh district from that of Gurgaon. In 1989 the district of Rewari was created carving out a
portion from Mahendragarh district. In 1997 a new tehsil of Bawal was created from the Rewari tehsil.
Presently the district comprises three tehsils, namely, Kosli, Rewari and Bawal. It is located in the
southwestern part o f Haryana, bordering the arid regions of Rajasthan. The geographic area of the district
is approximately 1559 sq.km.
Population: As per the latest Census carried out in 2001, the total population o f the district is 765,351 out
of which 629,177 is rural and 136,174 urban (refer to Table 3.1). The district has a population density of
400-persons per sq.km.
Table 3.1: Population of Scheduled Caste (SC) in Rewari District in 2001Total Rural Urban % of Rural SC to the
total rural populationTotal Population 765351 629177 136174
SC Population 144452 121789 22663 19.35
Source: Census of ndia-2001, "inal Populationr'otals
Poverty: As there is no explicit data available pertaining to the number of poor people in the district, some
social aspects may be taken into account as an indicator of the number of poor in the district. The
Scheduled Caste1 (SC) population in the district are mostly landless and does not have permanent
employment. The number of SC in rural area is 121,789 in the district, which is 19.35 % of the total rural
population (see Table 3.1). Another indicator of poverty is the number of agricultural labourers.
Agriculture works require large number of labourers in sowing and harvesting seasons only. These
labourers remain unemployed rest of the year. The number of agricultural labourers in the district is
42,995 accounting for about 14.68 % of the total rural workers (refer to Table 3.2 below).
13
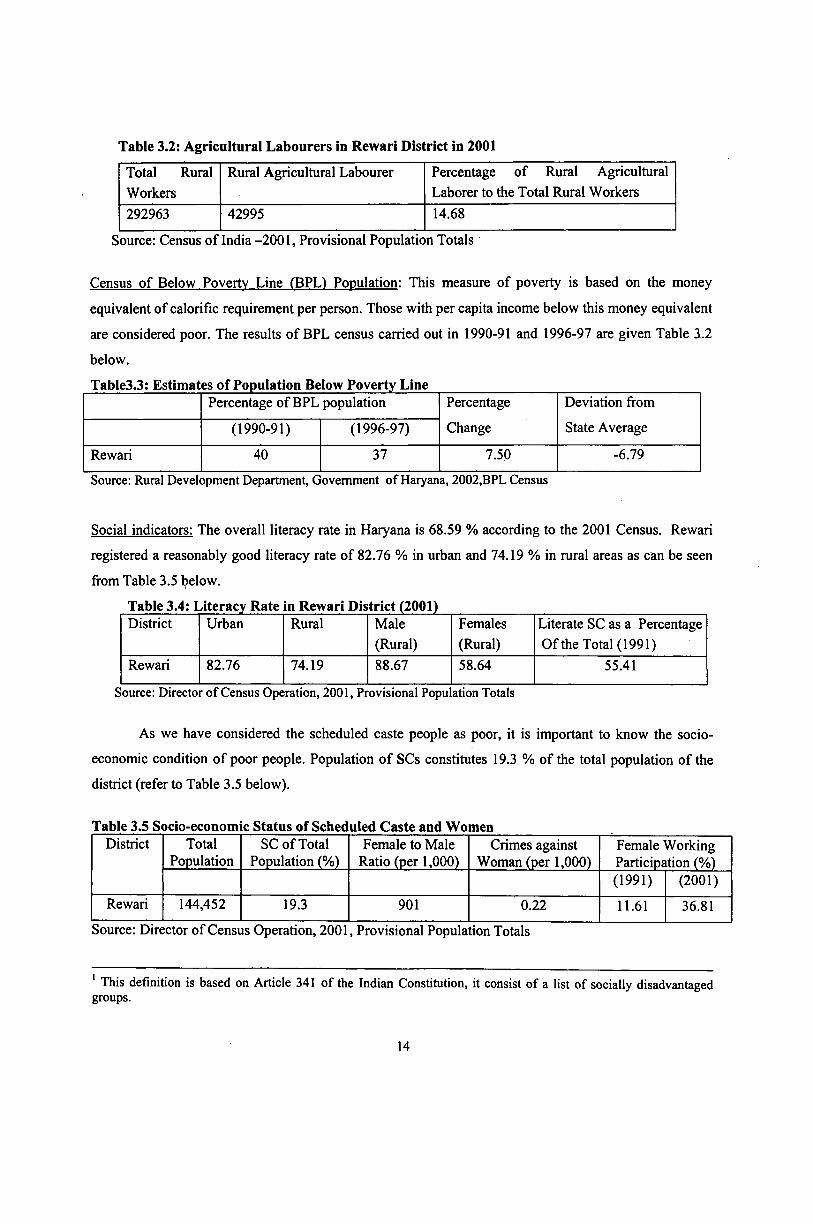
Table 3.2: Agricultural Labourers in Rewari District in 2001
Total Rural Workers
Rural Agricultural Labourer Percentage of Rural Agricultural Laborer to the Total Rural Workers
292963 42995 14.68
Source: Census of India-2001, Provisional Population Totals
Census of Below Poverty Line (BPL) Population: This measure of poverty is based on the money
equivalent of calorific requirement per person. Those with per capita income below this money equivalent
are considered poor. The results of BPL census carried out in 1990-91 and 1996-97 are given Table 3.2
below.
Table3.3: Estimates of Population Below Poverty LinePercentage of BPL population Percentage
Change
Deviation from
State Average(1990-91) (1996-97)
Rewari 40 37 7.50 -6.79
Source: Rural Development Department, Government of Haryana, 2002,BPL Census
Social indicators: The overall literacy rate in Haryana is 68.59 % according to the 2001 Census. Rewari
registered a reasonably good literacy rate of 82.76 % in urban and 74.19 % in rural areas as can be seen
from Table 3.5 below.
District Urban Rural Male(Rural)
Females(Rural)
Literate SC as a Percentage O f the Total (1991)
Rewari 82.76 74.19 88.67 58.64 55.41
Source: Director of Census Operation, 2001, Provisional Popu ation Totals
As we have considered the scheduled caste people as poor, it is important to know the socio
economic condition of poor people. Population of SCs constitutes 19.3 % of the total population of the
district (refer to Table 3.5 below).
Table 3.5 Socio-economic Status of Scheduled Caste and WomenDistrict Total
PopulationSC of Total
Population (%)Female to Male
Ratio (per 1,000)Crimes against
Woman (per 1,000)Female Working Participation (%)(1991) (2001)
Rewari 144,452 19.3 901 0.22 11.61 36.81
Source: Director of Census Operation, 2001, Provisional Population Totals
This definition is based on Article 341 of the Indian Constitution, it consist of a list of socially disadvantaged groups.
14

Climate: The climate of the area is mostly hot and dry except, during the winters, which is cold. The
region has four distinct seasons viz., summer, monsoon (rainy), post monsoon (autumn) and winter.
Average nominal rainfall o f the district was 454.6 mm in 1991. The rainfall in the district increases from
west to east and about 76% of the annual rainfall is received during the southwest monsoon months, July
to September. The variation in the annual rainfall from year to year is appreciable in a 50-year period
(1950 - 2000), the highest rainfall was 693.7mm in 1970, while the minimum was 393.0mm in 1985
(Government o f Haryana 1997). On an average there are 32 rainy days in Rewari.
Day temperature begins to rise from the month of March. May and June are the hottest months
when the mean daily temperature is about 41°C and the mean minimum temperature is about 27°C. While
days are a little hotter in May than in June, nights are warmer in June than in May. From April onwards
hot, scorching and dust laden winds blow and these add to discomfort. With the onset of the monsoon by
the end of June, there is an appreciable drop in the day temperature. After October, there is a decrease in
both day and night temperatures, the decrease being more rapid after the middle of November. January is
the coldest month in the region, the mean daily maximum temperature being about 22°C.
Winds: The district is subjected to high velocity o f winds from March to August. Such winds are
responsible for serious wind erosion as well as formation of Aeolian deposits. The period from April to
June has the highest incidence of dust storms and thunderstorms. The mean wind velocity varies from 0.2
km/hour to 8.1 km/hour.
Topography: The district is bordering Rajasthan and represents dry land topography throughout. Presence
of inland streams, sandy plains, shifting sand dunes devoid of vegetation, fixed or fossil dunes, dissected
upland tract and often barren, denuded rocky hill ranges and their outcrop provide an ensemble of terrain
features truly associated with semi arid to arid environment.
The major portion of Rewari district is located in the east of Aravalli hills. The region is
impregnated with sand dunes of variable dimensions. Fixed dunes reach up to 3-6 meters from the ground
level. It may be inferred that the sand composing the plain was probably transported across the low relief
of Aravalli ranges or through the gaps in the hills where it settled due to loss of wind speed. The area of
shifting sand is locally known as bagar. The discontinuous and worn-down ridge flanks give the
impression o f a huge U-shaped dune or depression. Area within the dunal tract possesses good potential
for ground water utilization.
The hills are long and wide, forming roughly parallel series of ridges. They constitute the
outliners of scattered older rocks occurring in newer formations or sedimentary deposits. Geologically,
15

these rocky outcrops in the district consist of two distinct series. The purana rock in Rewari belong to
Ajabgarh series of the Delhi systems. They are upper pre-cambrian in age. The hillocks and discontinuous
ranges are locally called khols and the outliners are locally called as tillas. The khols and tillas are
continuation of the Aravalli systems o f Rajasthan. They abruptly rise from the surrounding undulatory
terrain and traverse as discontinuous long linear ridges and are elliptical, semicircular to circular mounds
of generally bare rocky outcrops. Khols are prominent features west of Rewari town. The numerous
isolated, but roughly parallel ranges maintaining a northeast to southwest alignment, rise abruptly from
the level land at about 190 meters above mean sea level. Hills vary in height from about 345 to 470 mts.
A notable feature of the khols is a higher degree of dissection by short, very steep gullies and seasonal
torrents on the west facing slopes than the east facing slopes, which probably are in the rain shadow of the
south west monsoon winds. The tillas likewise run in parallel series o f discontinuous and isolated rock
outcrops.
Natural Drainage: There is no perennial river in this region. The most important seasonal river in Rewari
district is Sahibi, which originates in the Jaipur district of Rajsthan and passes through the Rewari district.
The riverbed near the village Pauti (which is one of the villages selected for carrying out the household
survey) is about 1 km wide. The river, which once had the flowing water, has now dried up. High rate of
evaporation and excessive percolation in sandy soil structure may have been responsible for the
disappearance of the water steam.
Ground water: The streams in the district are non-perennial and carry water during the southwest
monsoon period only. The water moves along a gradient from southwest to northeast. In the district, 87 %
of the area is having fresh to marginal quality of ground water. According to an assessment approved by
NABARD, the total useable recharge rate of ground water was 370 m.cu.m in 1978. However, the same
assessment pointed out, the rate of withdrawal was much higher at 451.78 m.cu.m. Since the streams in
the district have all dried up in the last decade, the water level continues shrink further down. It is
reported that in the Bawal tehsil of the Rewari district the ground water level which in 1998 was 9.21 -
9.6 mts has gone down to 12 - 13.5 mts in 2002. The drilling depth for pumpset or handpump is 60 mts at
present as against 24 - 30 mts in 1998 and 54 mts in 2002 in Bawal tehsil (from a discussion with experts
in Haryana Agricultural University, Bawal).
Geology: The Rewari district has not been geologically investigated. However, the rocks exposed in the
earlier district of Mahendergarh have been broadly divided into Alwar and Ajabgarh group. The Alwar
group of rock constitutes predominantly o f arenaceous sediments and is represented by massive quartzite,
usually felspatic in nature, micacious quartzite with subordinate bands of mica schist and carbonaceous
16
phyllite. In the Ajabgarh group, the area is characterized predominantly by argillaceous sediments, which
include shale, slate, phyllite, crystalline and impure limestone, marble and calcschist with intercalations
of quartzite. Both these groups of rocks are intruded by amphibolite granite, aplite, pegmatite, calcite and
vein quartz. Alkaline earth occurs as efflorescence on the surface and contains predominantly carbonate
and bicarbonate of sodium. Their presence on the surface makes the land infertile. On the other hand,
these can be economical source for sodium carbonate when the concentration o f each salt is high.
Forest: The area under the forest in Rewari district was 40.0 sq.km. i.e., 4000 hectares in 1992-93 (CMIE,
1993) and it decreased to 30.0 sq.km. i.e., 3000 hectares in the year 1995-96 (Government of Haryana,
1997). The area under forest is classified according to the ownership i.e., private and state. Forest owned
by corporate bodies and private individuals are included under the first category. The state's forests are
categorized as reserved, protected and unclassified. Most of the forest areas are situated along the railway
lines, canals, roads and bunds in the form of linear strips. These strips mainly pass through agricultural
fields or wastelands and were created upon acquired land through plantations. Therefore, these strips are
devoid of natural vegetation. Prior to the ownership of forest department over these strips, respective
departments owning the patches had planted shade-giving trees such as shisham, neem, siris etc. After the
management of the strips was taken over by the forest department, it raised plantations of more useful
species over the years. At present most o f these constitute a part of forest plantations and have trees like
Kikar (Acacia nilotica), Safeda (Eucalyptus sp) Sisham (Dalbergia sissoo) Israeli kikar (Acacia tortolis),
Vilayati Kikar (Prosopis juliflora) Siris (Albizia procera) Neem (Azadarachta indica) and Bakain (Melia
azadarach).
An area of about 4,000 hectares in the district is affected by active sand dunes in the district. The
advancement of accumulated sand renders the cultivated lands infertile. Containment of these sand dunes
in the district is one of the main activities of the forest department, which is being tackled by the
plantation of Kana (Saccharum munja) and Israeli Kikar (Acacia tortilis). Plants are also raised under
farm forestry scheme on the southwestern boundaries of cultivated fields to create winds breaks so that
the crops are protected from desiccating winds. Pasture restoration is also an effort to manage the
wasteland and barren lands in drought prone areas to meet the acute shortage of fodder during the lean
season. Wasteland where course and unpalatable grasses were growing, are proposed by the Forest
department to be converted into good quality pasture lands of nutritious and palatable grasses such as
Anjan (Anchrus setigarls). Forest produce is divided into two categories i.e., major and minor. Major
forest produce includes timber and fuelwood such as jand (Prosopis cineraria) Shisham (Dalbergia
sissoo), Kikar (Acacia nilotica), Israeli kikar (Acacia tortolis), Siris (Albizia lebek), Neem (Azadarachta
indica), Bahain (Melia azadarach) and Vilayati Kikar (Prosopis juliflora). The minor forest produce
17

consists of Sarkanda or Kana (Saccharum munja), which is used for making “muddha” (a kind of sitting
stool made up of stick of kana).
Soil: The soil of the district can be subdivided into sandy, loamy-sand, sandy-loam and light loam and are
highly deficient in organic matter requireing heavy doses of manure for improving the fertility. But such a
method of farming is not possible without abundant supply of water, which is not available. Wind erosion
is most the common feature in the district. At many places the soil is embedded with lime, kankar stone
and other rocks. In the eastern and western part of Rewari, low fertility sandy soil is predominant and is
locally known as “bhur”. A big block of sandy loam with a tendency towards the light loam locally
known as “Magda” is found in the center of the district.
Agriculture: Crops grown in the district are divided into two main categories viz., Kharif and Rabi locally
called “Sawani” and “Sadhi”. The former is sown at the onset of the rainy season while the latter is sown
in winter. Any crop which does not strictly fall in timing within these two harvests is known as zaid
crops, and their harvest is called zaid rabi and zaid kharif. Toria, an oilseed, is cultivated as zaid kharif
Major kharif crop of the district is bajra (Spiked Millet, Pennisetum glaucum), which occupies about 28.2
% of the total cropped area along with jowar {sorghum bicolor), groundnut and gwara (fodder crop). The
major rabi crops are mustard and wheat which occupy about 33.86 % and 22.2 % of the total cropped
area respectively. Other rabi crops are gram, barley, and vegetables. Bajra (Pennisetum glaucum), gwara
(fodder crop) and pulses (during kharif season) are comparatively drought resistant crops and grow well
in light soil of the district.
The gross cropped area of the district was 196000 hectares in the year 1995-96, with a net
irrigated area of 101000 hectares (Government of Haryana 1997). Fertilizer consumption in the district
was 93.32 kg/hectare (Government of Haryana 1997), while the average consumption at the national level
was at a tons level of 74.37 kg/hectare during the year 1995-96. There has been a considerable decline in
the bajra (Pennisetum glaucum) cultivation from 1977-78 to 1995-96 presumably due to a shift in
cropping pattern when increased area of the district was brought under irrigation. The total area under
bajra (Pennisetum glaucum) crop, which in 1978 was 50 % of the gross cropped area, declined to 28.2 %
in 1995-96. The cropped area under wheat and mustard, which have better yield potentials has increased
significantly. The main fodder crop is jowar (sorghum bicolor), which is grown during the kharif season.
Presently farmers also grow kasni (Cichorium intybus) as green fodder. The main crops under irrigation
are wheat and mustard. With the availability of irrigation facilities the area under vegetables is also
increasing in the district.
18

Irrigation: A huge area o f land in the district bordering Rajasthan is almost completely arid. The rainfall
in this desert like portion is irregular and uncertain both in time and space. In some parts of the district
agriculture is dependent upon the mercy of nature. But areas like Rewari and Bawal tehsil where
agriculture with irrigation is widespread, is mainly dependent on ground water which is available at a
much lower depth as compared to the rest of the district. On account of the peculiar topography i.e., rise
in the country’s slope from north towards south, the district could not be included in the network of canals
before 1975-76. The government has introduced the schemes of lift irrigation for this area. As a part of
the above scheme the work on the Jawaharlal Nehru Canal (JLN) was started in 1974-75. These channels
have not become functional due to non-availability of water from the Satluj-Yamuna link canal.
Livestock: The district is fairly rich in livestock, which include cattle, buffaloes, sheep, goats, pigs and
camels. It has been a practice of the past that in the bad rainfall years, cattle being mobile, were taken to
areas, which were rich in fodder. According to the quinical livestock census 1997 conducted by the
Director of Land Records, Haryana, there were about 28,000 cows, 87,000 buffaloes, 4000 horses and
ponies, 28,000 sheep, 39,000 goats, 5000 camels, 8000 pigs and 20,000 other animals in the district.
Rewari district and some parts of Mahendergarh district are known for the Murrah breed of buffalo2 and
Haryana breed of cow. Haryana cow was reared generally for its male produce, the bullock, which fetches
a premium price. The Murrah buffalo is famous for high yield of milk and is the main milch animal of the
district.
3.2 Panchkula District
The present study area of the village Damdama-Bhogpur village belongs to the Panchkula district.
In 1995 Panchkula became separate, after being carved out from the district of Ambala. The Shivalik
range of Solan and Sirmaur district of Himachal Pradesh bound it in the north and northeast. The district
consists of two tehsils, namely, Kalka and Panchkula, and has a population of 469210 persons (2001
Census).
The Panchkula district can be divided into three physiographic units namely,
a) the outer Himalayan hill tract,
b) the Shiwalik hill tract, and
c) the Pinjore Doon
2 Murrah breed of buffalo is a local breed of buffalo
19

Physiography:
The Outer Himalayan Hill Tract: It encompasses the northern most tahsil and is divided into three distinct
physiographic units, viz.,
(i) Parallel strips running in the north-west, south-east directions
(ii) The central strip which is structural valley bounded by the narrow strips of hilly tracts.
(iii) A narrow valley of Ghagghar river which separates the tract from the Momi hill tracts in the south.
The highest point in the extreme south on this ridge is only 884 meters above mean sea level.
The Chandigarh Shivalik Hill Tract: This tract is a narrow strip in the Shivalik hills north of Chandigarh
and flanks the southern side of Pinjore in Kalka tehsil. The strip, which is only 2-5 km wide, encloses the
northern slopes. The Shiwalik range north of Chandigarh represents typical Shivalik hill topography.
There are hogback ridges, formed on gently dipping alternating beds of clay, silt, loam and gravel. The
tract is badly dissected and gives the appearance of bad land topography. Numerous rills, gullies and
choes are continuously transforming the face of the area at a very fast rate. Due to unconsolidated nature
of the bed rocks, the rate o f landslides and mass wasting is high. The highest point in this ridge is Kala
Tiba, which is 625 meters above mean sea level.
Momi Hill Tract: The continuity of the Shivalik range further east is broken by the trans current fault
north of Panchkula township. Due to this fault a narrow water gap has been created through which river
Ghagghar finds its way to the Punjab plains. This narrow water gap, which has a wall like vertical eastern
banks and terraced western banks, separates the Chandigarh Shivalik range tract in the west from the
Momi hill tract.
Pinjore Doon: It is a structural valley, of about 5-8 km wide, sandwiched between the outer Himalayas in
the north and the Shivalik range in the south. It extends from the river Ghagghar in the south east to Badli
river, a distance of about 25 km. This zone is flanked in the north by alluvial fans at its contact zone with
the Himalayas and the seasonal streams in the south along the Shivalik hills. The major slope of the area
is from the northeast to southwest with an average gradient of about 40-50 m per kilometer. The minor
slope of the area, which is perpendicular to the major slope, divides the area into three different segments.
Two segments east and west of the Koshallia river, which flows from north to south, dips inwards
towards the river. The third segment, west of the imaginary line joining the village of Khera at the foot of
the Shivalik range with the Tagra Kaliram in the northeast near Kalka station dips towards northwest.
Drainage: The drainage density of the area is very high as a number of seasonal streams descend from the
ridges and spurs, flanking to the northern side of the valley. The drainage lines form very closely spaced
sub-parallel drainage pattern. The streams flow from north-east to south-west direction across the entire
20
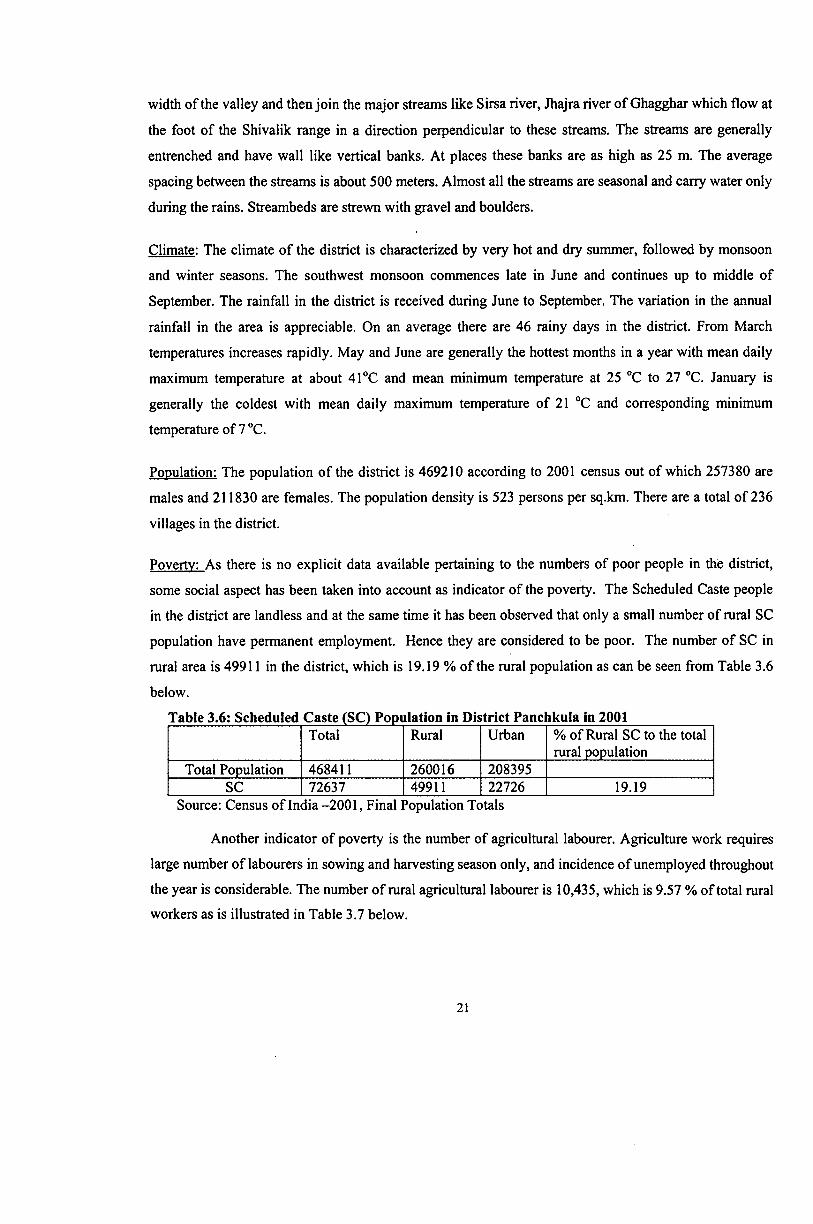
width of the valley and then join the major streams like Sirsa river, Jhajra river of Ghagghar which flow at
the foot of the Shivalik range in a direction perpendicular to these streams. The streams are generally
entrenched and have wall like vertical banks. At places these banks are as high as 25 m. The average
spacing between the streams is about 500 meters. Almost all the streams are seasonal and carry water only
during the rains. Streambeds are strewn with gravel and boulders.
Climate: The climate of the district is characterized by very hot and dry summer, followed by monsoon
and winter seasons. The southwest monsoon commences late in June and continues up to middle of
September. The rainfall in the district is received during June to September. The variation in the annual
rainfall in the area is appreciable. On an average there are 46 rainy days in the district. From March
temperatures increases rapidly. May and June are generally the hottest months in a year with mean daily
maximum temperature at about 41°C and mean minimum temperature at 25 °C to 27 °C. January is
generally the coldest with mean daily maximum temperature of 21 °C and corresponding minimum
temperature of 7 °C.
Population: The population of the district is 469210 according to 2001 census out of which 257380 are
males and 211830 are females. The population density is 523 persons per sq.km. There are a total of 236
villages in the district.
Poverty: As there is no explicit data available pertaining to the numbers of poor people in the district,
some social aspect has been taken into account as indicator of the poverty. The Scheduled Caste people
in the district are landless and at the same time it has been observed that only a small number of rural SC
population have permanent employment. Hence they are considered to be poor. The number of SC in
rural area is 49911 in the district, which is 19.19 % of the rural population as can be seen from Table 3.6
below.
Table 3.6: Scheduled Caste (SC) Population in District Panchkula in 2001Total Rural Urban % of Rural SC to the total
rural populationTotal Population 468411 260016 208395
SC 72637 49911 22726 19.19Source: Census of India-2001, Final ’opulation Totals
Another indicator of poverty is the number of agricultural labourer. Agriculture work requires
large number of labourers in sowing and harvesting season only, and incidence of unemployed throughout
the year is considerable. The number of rural agricultural labourer is 10,435, which is 9.57 % of total rural
workers as is illustrated in Table 3.7 below.
21
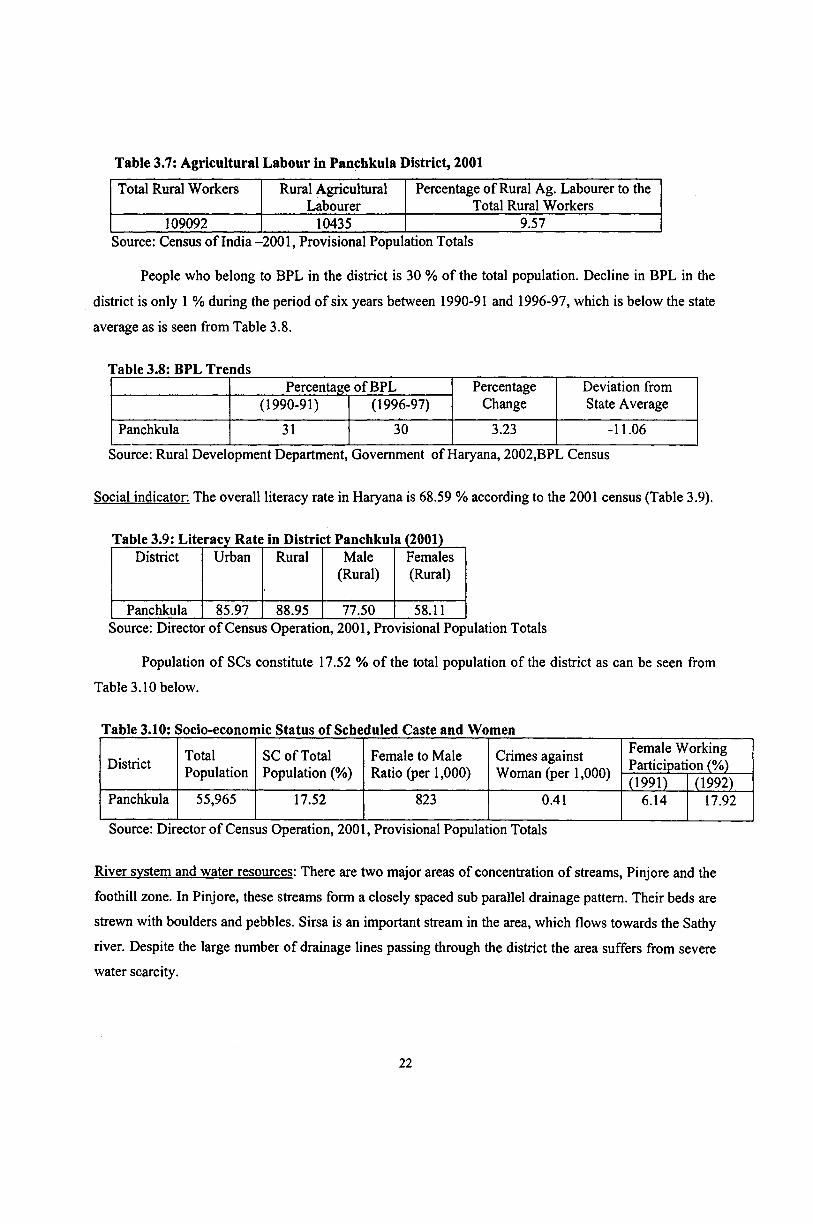
Table 3.7: Agricultural Labour in Panchkula District, 2001
Total Rural Workers Rural Agricultural Labourer
Percentage of Rural Ag. Labourer to the Total Rural Workers
109092 10435 9.57Source: Census o f India -2001, Provisional Population Totals
People who belong to BPL in the district is 30 % of the total population. Decline in BPL in the
district is only 1 % during the period of six years between 1990-91 and 1996-97, which is below the state
average as is seen from Table 3.8.
Table 3.8: BPL TrendsPercentage of BPL Percentage Deviation from
(1990-91) (1996-97) Change State Average
Panchkula 31 30 3.23 -11.06
Source: Rural Development Department, Government of Haryana, 2002,BP Census
Social indicator: The overall literacy rate in Haryana is 68.59 % according to the 2001 census (Table 3.9).
Table 3.9: Literacy Rate in District Panchkula (2001)District Urban Rural Male
(Rural)Females(Rural)
Panchkula 85.97 88.95 77.50 58.11Source: Director of Census Operation, 2001, Provisional Population Totals
Population of SCs constitute 17.52 % of the total population of the district as can be seen from
Table 3.10 below.
Table 3.10: Socio-economic Status of Scheduled Caste and Women
District TotalPopulation
SC of Total Population (%)
Female to Male Ratio (per 1,000)
Crimes against Woman (per 1,000)
Female Working Participation (%)(1991) (1992)
Panchkula 55,965 17.52 823 0.41 6.14 17.92
Source: Director of Census Operation, 200 , Provisional Population Totals
River system and water resources: There are two major areas of concentration of streams, Pinjore and the
foothill zone. In Pinjore, these streams form a closely spaced sub parallel drainage pattern. Their beds are
strewn with boulders and pebbles. Sirsa is an important stream in the area, which flows towards the Sathy
river. Despite the large number of drainage lines passing through the district the area suffers from severe
water scarcity.
22

Geology: The northern part o f the district constitutes tertiary rocks, including limestone, sandstone shale,
and boulder conglomerates and these form low lying hilly ranges known as Shivalik foothills.
Shivalik formations in Pinjore range'. Soft sandstone with clay, the pretertiaty tundspathar series of rocks
crop out in the Momi Hills extending from Malla to Sherla and form an important limestone bearing
horizon with cement grade limestone occurring as tentoid bodies, having thickness between 6-30 meters.
Massive sandstone in Kasaul occurring near Kalka is a good source of building material and also for
manufacture of stone bowls. Some good quality potters clay has been reported from Pinjore. Red clay
bands, measuring in thickness from 1 to 5 meters, are exposed in the lower horizon o f Pinjore stage of
Kalka tehsil.
Ground water: The groundwater level in the district, immediately to the south of Shivalik Hills, occurs
under confined and semi-confined conditions and varies greatly. The District Gazetteer of Ambala (1984)
mentions that groundwater in Pinjore used to occur at a depth ranging between 2-47 meters during that
period. The depth was more towards the hilly region. The water level in the area further south ranged
between 1.5 and 12 meters, but generally it varied between 4-8 meters during the early eighties. Over the
years the water level of the area has drastically fallen down. The present water level in the year 2004 at
the village Damdama-Bhogpur as found in a recently dug tubewell is at a depth of 157 mts (525 ft).
Forest: The forest types occurring in these areas are “Northern tropical dry Deciduous forest” and the
“Sub tropical forest”. The forests in the Momi Pinjore division can be broadly divided into three
categories, viz.,
(a) Block forest with a total area of 11028.33 hectares.
(b) Strip forest along the various roads passing the area with a total area of 874.82 hectares.
(c) Block forest o f Raipur rani range of 80.94 hectares.
Out of the total area o f the block forest, reserved forest is 8523.3 ha, demarcated protected forest is
2140.3 ha and protected forest of 364.73 ha.
The forest contains a number of miscellaneous hard wood species like Chal (Annogensus
latifolius), Khair (Acacia catechu), Jhingan (Lannea coromandelica) and Amaltas (Cassia fistula) and is
serai in character. They constitute the proclimax stage. The progress of plant succession has been checked
by the interference o f natural factors such as excessive soil erosion, landslips and biotic factors such as
excessive grazing, lopping and fires. These species have maintained a stable stage by the interference of
the regressing factors. On the outer hills where the incidence of grazing and biotic interference is
considerable, the dry deciduous type degenerates into scrubland. Except bamboo, none of the species of
these forests fulfil the characteristic of the climate.
23
Agriculture: Total area of the district Ambala in 1993 (before the separation of district Panchkula) was
2385.0 sq.km. out o f which cultivated land was 1390 sq.km., forest area 420 sq.km., and uncultivated
land 90,062 hectares.
The Kharif Crop: Paddy and Maize are the two major Kharif crop. In 1950-51 the area under paddy
cultivation was 26,000 hectares which rose to 52,000 hectares in 1977-78. Popular varieties of rice are IP-
8, IR-106, Pusa-2-21 and Jaya. Maize was grown in 16600 hectares in 1950-51 which rose to 44000
hectares in 1977-78 (i.e., 166.7 % increase)
Rabi crop: The principal rabi crop is wheat. The area under wheat cultivation in 1950-51 was 51,000
hectares, which rose to 54,000 hectares in 1965-66 and to 97,000 hectares in 1977-78. The chief varieties
of wheat cultivated are Kalyan, Sona and Sonalika.
Irrigation: The average annual rainfall in the district is 985.1mm. The depth of the ground water in Kalka
tehsil varies from 100 ft (30.48 mts) in areas just below the hills to 30 ft (9.14m) in others. In 1923-24 the
total irrigated area in Ambala district was insignificant (1%). The source of irrigation was limited to
masonry or temporary kucha wells and to some occational irrigation from kutcha tanks, Kuhls or ducts in
Momi hill portion. Due to construction of Bhakra canal system there have been considerable increase in
irrigated areas of plains regions of Ambala district. However, the irrigation is locally dependent on the
rains in the hilly areas of Panchkula district.
Kuhl or duct Irrigation: Kuhl irrigation is prevalent in hilly areas of the district. The sources of water
supply to the kuhls are perennial and non-perennial springs and small streams. In 1977-78, 2421 hectares
of land was under Kuhl irrigation in Ambala district. The foodgrain production which was only 169,000
tonnes in 1966-67 increased to 385000 tonnes in 1977-78 (128%) increase.
Animal Husbandry: Livestock contributes significantly in the village economy in terms of products and
services. In most of the villages dairy is supplemented with the agricultural produce for the livelihood.
With intensive agriculture practiced in the area, tractors have taken place of bullocks for ploughing and
cart pulling but in some poor families the traditional practice is still prevalent. The livestock population in
the district has increased sharply and so has the products. According to 1997 census, there were 35,000
cows, 34,000 buffaloes, 1000 horses and ponies, 5000 sheep, 19,000 goats, 5000 pigs and 9000 other
animals. The total quantity of milk produced daily was estimated to be 5,057.22 quintals in 1977 as
compared to 2733.17 in 1966.
24

The main activities of the districts as apparent from the above discussion are agriculture, animal
husbandry and forestry. While agriculture is the most preferred occupation forestry enters as a
supplementary option for many people. Such a scenario emerges because o f low value added potential
inherent in the forest resources available in the district. It is however important to note that these activities
are interrelated as inputs from forest are required by both agriculture and animal husbandry in the form of
satisfaction o f fuelwood and fodder demand. Thus any poverty reduction programme has to take into
account such interdependencies between these sectors.
3.3 Description of Two Villages Covered for the Study
In order to capture the forest poverty relationship the selection of the villages was undertaken
after carefully looking into the economic conditions of the area. Major emphasis was put to assess the
extent of poverty and peoples dependence on forest resources for their livelihood. As the SC population is
usually landless and often identified by the government as the poorest group in the villages the present
study attached greater weightage to their composition in the village. The ultimate choice of selection of
the village, therefore, was based on the percentage of SC population, landless households along with a
minimum 10 hectares of forest coverage of the village.
3.3.1 Village Pauti
This village is located in the periphery of Aravalli region in the southern part of Haryana and has
vegetation, which is predominantly of dry deciduous scrub. The village has 143 households and a
population of 955. Some of the important locational attributes of the village are:
District/Block TotalHouseholds
SCHouseholds
SC % in total
Population
YellowCards*
PinkCards*3
PanchayatForest
Rewari/Bawal 143 18 14% 7 2 136 ha
* The government issues these cards to the poorest groups who are below the poverty line.
The major activities in the village in relation to livelihood are agriculture and animal husbandry.
The important crops grown are wheat, mustard, and millet. Most of the agricultural output is consumed by
the villagers themselves and only a handful of household who have a surplus of wheat and mustard sell
these in the market. Some of the households also sell milk to the local co-operative dairy. Many people in
3 Pink and Yellow Cards are issued by the government to those households who are below the poverty line (BPL). Yellow Cards are issued to households who do not have any fixed source of income while the Pink Cards are issued to those who have some source of income but are below the poverty line. The holders of these cards are entitled to double the amount of ration vis-a-vis the other cardholders from the Fair Price Shop. They also get priority in some of the employment generation schemes of the government.
25

the village migrate to nearby towns to earn their livelihood. The landless households work either as farm
labourers or wage earners in road construction/repair activities. There are around 32 landless households
in this village, which became the criteria for selecting it for the study even though there are only 14 % SC
population.
The forest around the village is located in the dry riverbed (Sahibi River) and consists
predominantly of bushes and scrubs (refer to Appendix 3 for the village map). However, plantation by the
Forest Department in the early 1980s and thereafter, under the Social Forestry Scheme has also helped to
establish a plantation of Acacia sp and Prosopis julifera. This forest ranges from 0.5 - 1.0 km in breadth
and stretches from Rajasthan to Haryana. The soil in this forest is sandy and not suitable for agriculture.
The villagers utilise the forest for grazing, collection of fodder and fuelwood. The timber from
the forest is of low quality and is predominantly used by the poor for fuelwood and construction of their
huts. Being a degraded scrub and plantation based forest, not much variety of NTFPs is available to the
villagers from it. However to meet the basic needs such as fuelwood and fodder the poorer section of the
village rely on such a forest. Especially the women of the village have the tradition of collecting these
products. The village livestock mainly consists of buffaloes and camels, which grazes in the forest area.
This forest has also become a habitat for the traditional variety of cows abandoned by the villagers in
1980s, which compete with the village livestock for fodder. Some of the villagers earn their livelihood by
making ropes and baskets.
Villaee Forest Committee. Pauti
In accordance with the provisions of JFM, Haryana, Pauti has a village forest committee (VFC).
Being formed recently, it is yet to become functional. Since the whole forest land o f the village belongs to
the Panchayat, its management is done by the panchayat office with the help of the forest department.
Income generated through auctioning of forest products accrues to it. For auctioning the products (mainly
timber and fuelwood), the Panchayat seeks permission of the forest department and requests the Block
Development Officer (BDO) to publish a notification about the auction. In 2003 the Panchayat earned Rs.
375000 from forest product auction.
At present, access to the forest has been granted to the village people for collection of fodder and
dried up fuelwoods only. People can also take branches from the forest for the purpose o f fencing their
agricultural fields by taking permission of the Panchayat.
3.3.2 Village Damdama-Bhogpur
It is situated at a distance of about 5 km from the Pinjore town, along a seasonal river Kaushalya
and at the foothills of the Shivalik range. The village Damdama-Bhogpur comprises twin villages
26
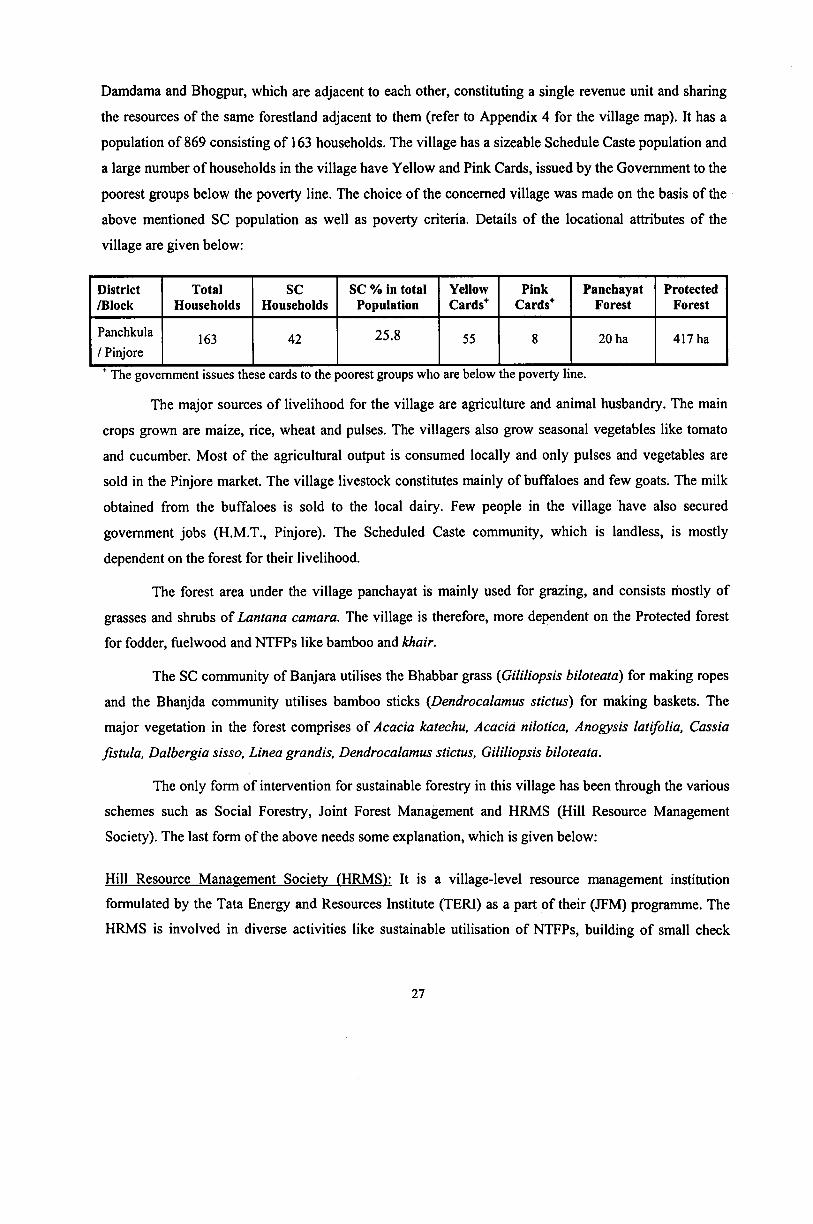
Damdama and Bhogpur, which are adjacent to each other, constituting a single revenue unit and sharing
the resources of the same forestland adjacent to them (refer to Appendix 4 for the village map). It has a
population of 869 consisting of 163 households. The village has a sizeable Schedule Caste population and
a large number of households in the village have Yellow and Pink Cards, issued by the Government to the
poorest groups below the poverty line. The choice of the concerned village was made on the basis of the
above mentioned SC population as well as poverty criteria. Details of the locational attributes of the
village are given below:
District/Block
TotalHouseholds
SCHouseholds
SC % in total Population
YellowCards*
PinkCards*
PanchayatForest
ProtectedForest
Panchkula / Pinjore
163 42 25.8 55 8 20 ha 417 ha
+ The government issues these cards to the poorest groups who are below the poverty line.
The major sources of livelihood for the village are agriculture and animal husbandry. The main
crops grown are maize, rice, wheat and pulses. The villagers also grow seasonal vegetables like tomato
and cucumber. Most of the agricultural output is consumed locally and only pulses and vegetables are
sold in the Pinjore market. The village livestock constitutes mainly of buffaloes and few goats. The milk
obtained from the buffaloes is sold to the local dairy. Few people in the village have also secured
government jobs (H.M.T., Pinjore). The Scheduled Caste community, which is landless, is mostly
dependent on the forest for their livelihood.
The forest area under the village panchayat is mainly used for grazing, and consists mostly of
grasses and shrubs of Lantana camara. The village is therefore, more dependent on the Protected forest
for fodder, fuelwood and NTFPs like bamboo and khair.
The SC community of Banjara utilises the Bhabbar grass (Gililiopsis biloteata) for making ropes
and the Bhanjda community utilises bamboo sticks (Dendrocalamus stictus) for making baskets. The
major vegetation in the forest comprises of Acacia Icatechu, Acacia nilotica, Anogysis latifolia, Cassia
fistula, Dalbergia sisso, Linea grandis, Dendrocalamus stictus, Gililiopsis biloteata.
The only form of intervention for sustainable forestry in this village has been through the various
schemes such as Social Forestry, Joint Forest Management and HRMS (Hill Resource Management
Society). The last form of the above needs some explanation, which is given below:
Hill Resource Management Society (HRMS): It is a village-level resource management institution
formulated by the Tata Energy and Resources Institute (TERI) as a part of their (JFM) programme. The
HRMS is involved in diverse activities like sustainable utilisation of NTFPs, building of small check
27

dams, water harvesting, providing small loans to the poor and marginal sections of village population,
training and mobilising the people. It was formed by TERI in July 1990 in collaboration with the Haryana
Forest Department (HFD) and with the financial support from the Ford Foundation. For the smooth
functioning of the HRMS, three separate working groups at the range, division, and state levels have been
set up, chaired by the Range Forest Officer, Divisional Forest Officer and Principal Chief Conservator of
forest respectively. While the range and divisional level groups facilitate and monitor the programme, the
state level group is the apex body that primarily recommends and proposes policy guidelines for the JFM
programme. Elections are conducted in each village to elect the HRMS Pradhan and its members by the
HFD. Till July 2000, there were 55 villages in which HRMS was formed and this number has increased
now with its success and popularity in the region.
The HRMS bridges the gap between people living near the forest and HFD. It also helps in
getting permits of forest products to the poor and marginal communities at concessional and affordable
rates, which were earlier, issued to contractors for commercial purpose. At present the HRMS is a self
funding body and mobilises its resources and is at present not financially supported by TERI or any other
organisation.
From the above discussion it is seen that people of both the villages, Pauti and Damdama-
Bhogpur, depend on forest resources for their livelihood. Fuelwood and fodder collections are the two
important forest resources that satisfy the basic requirements of the villagers.
As the poorer sections of the villages depend more on such forest products, their increased supply
is likely to result in a reduction of collection time which can be used for other income earning like casual
labour. A differentiated wage rate between male and female workers is not a common feature in the
villages under study. Only in case of paddy cultivation in Damdama-Bhogpur female workers are given
less than the males. Thus poverty reduction potential for female workers can be expected from an
improved supply of forest resources as these activities are undertaken by womenfolk of the village.
Moreover, it is important to note that the prevailing social norms in these villages demarcate the category
of activities, which are forbidden for the female workers. For example, ploughing fields for cultivation of
any crop is done by the male members only. Such a cultural setting of the village is responsible for
limited options for women in the process of earning a livelihood in agriculture.
28
4. Methodology of SAM
4.1 Introduction
A major task before the present exercise is to bring out the interrelations among the sub-sectors of
the village economic system with a view to project its production and distribution channels when a
sustainable forest sector is included as its integral part. For that purpose the study draws upon the insight
offered by the technique of social accounting matrix (SAM). The technique of SAM rests on the
underlying principle that for every income there is a corresponding outlay or expenditure. It is presented
in the form of a square matrix and records the transactions that take place among various production and
consumption sectors. The sectors of the economy are identically ordered in the rows and columns. The
inputs used in carrying out the production activities in a sector are given by the columns in the matrix. On
the other hand, the rows indicate the distribution o f the output of a particular sector to be used as inputs
by different sectors and final demand for consumption by the households.
Besides providing consistent data framework for a village level analysis, the SAM would capture
the interrelationships between pattern forest resource use, the structure of production, distribution of
income and ultimately poverty alleviation, and would establish the actual as well as potential links among
them.
It may be useful to note that this technique has been widely used to analyze the direct and indirect
impacts of diverse policy issues (see, for example, Adelman and Robinson 1978; Ahluwalia and Lysy
1979; Pyatt arid Rounds 1985; Pyatt et. al. 1972; Thorbecke and Sengupta 1972). Particularly, the inter
relationship among sub-sectors in a village economy has been used in analyzing the problems of poverty
alleviation (Subramanian and Sadoulet 1990), rural industrialisation (Parikh and Thorbecke 1996),
migration (Taylor and Adelman 1996), and district level planning (Lewis and Thorbecke 1992). Although
attempts have been made to bring in environmental accounting into the system of national accounting
(SNA) framework (Markandya and Costanza 1993), village level studies that include such concerns are
yet to come up presumably because of the demanding data requirements.
It is not difficult to see that SAM helps delineate the
• interactions among different sectors,
• structure and level of production in each sector,
• distribution o f sectoral value added among household groups,
• distribution of factorial income among households according the latter’s resource base, and
• demand for production activities given the consumption pattern o f households.
29

In order to understand the linkage between the village economic system and the forest sector, the
present study considers the functioning of the former before bringing in the relationship with the latter.
For that purpose the exercise develops a modified SAM, which integrates environmental concerns at the
village level.
4.2 Framework of SAM
Description o f the village economic system:
The production activity account is fundamental to the construction of a village SAM. The study
considers four broad production activities within the village economy viz., agricultural commodities, non-
agricultural commodities, forest products and services. These production activities are outlined in the
activities account of Table 5.1 A for Pauti and Table 5.2A for Damdama-Bhogpur. The agricultural sector
is further disaggregated in Tables 5.1 and 5.2 for the villages of Pauti and Damdama-Bhogpur
respectively into its constituent sectors like wheat, mustard, cotton, maize, paddy, pulses, fruits and
vegetables and cultivated fodder livestock and poultry products (milk, egg and meat). Manure and dung
cakes, which have been accounted as separate livestock activities in the disaggregated format are also
included with agriculture in the aggregate format. The non-agricultural sector has been disaggregated into
village production (rural industries like basket making). Forest products include collection of timber,
fuelwood, leaves and grass and other non-timber forest products. The forest account is disaggregated into
fuelwood, timber, fodder leaf, bamboo and other non-timber forest products. The services account has
been disaggregated into retail trade, village services (like hair cutting), education, health and
infrastructure.
Households own some of these factors and derive income by their utilization. Moreover, the
households spend their income on goods and services produced within the economy or on imported items
and thus generate demand for goods and services. The commodity account indicates the amount of
income spent on the purchase of different commodities. The agricultural commodities in this account in
Tables 5.1A and 5.2A have been disaggregated into their constituents, to include cereals, pulses and
oilseeds, fruits, vegetables, cultivated fodder and agricultural residues. The aggregate commodity account
for agriculture also includes livestock products. Non agricultural items in the commodity sector include
food and non-food items along with industrial/imported goods. Forest products include timber, fuelwood,
fodder and non-timber forest products. Services, like travelling etc., too have been included in the
commodity account.
30

The factor account gives the inputs used in the production process. The inputs are classified as
land, labor and “other factors”. Of these, labor is divided into two sub-categories, hired and family labor.
The ‘other factors’ in the agricultural production process would include seed, fertilizer, manure,
pesticides, tractors and other machineries, draught animals, electricity and water charges and rent of
agricultural land. The factor account for livestock includes inputs like fodder and family labour.
Construction materials (like cement, etc.) are used as inputs in building village infrastructure such as
roads and buildings. Cost incurred in transporting construction material has been recorded as
“transportation cost” in the factor account. Stationaries used in schools have been categorized as input in
the education activities. The aggregated factor account is given in Table 5.1 A and 5.2A for the two
villages, while the more disaggregated figures are outlined in Tables 5.1 and 5.2.
The capital account includes stock of natural capital along with cash savings and investment.
Natural capital includes land and forests whereas finance capital would be constituted of institutional
savings and investment. It is important to note that activity of the village economy draws the services of
natural capital leading to the shrinkage of its base. To account for such an eventuality the study considers
the state of natural capital stock and estimates the addition or depletion of the carbon stock in the forests
to evaluate the base of natural capital in both the villages. Cost imposed on the natural capital stock by
soil erosion due to agricultural activity, which reduces natural fertility of the soil, has been accounted as
external cost. The other component of external cost is the health cost incurred due to indoor air pollution
caused by use of biofuels.
The institution account of the SAM table includes households (by income categories) and the
government. The present study does not distinguish between layers of government and takes it as a single
entity in order to simplify the linkages.
In order to arrive at a classification structure that would focus on the income distribution and
consequently on the poorer group of the villagers, we divide all the households on the basis of net
monthly income from all production activities that he/she may be engaged in as either hired labour or
family labour during the year. Since family labour does not receive wages the net income or profit from
the activity has been accounted as payment to family labour.
The rate of daily wages is taken as a benchmark by the local government for identifying poors in
the village who would qualify for certain food subsidies, others who are not engaged as daily wage
earning laborers but earn as much are also considered for receiving food subsidies. A daily wage earners
income would work out to Rs. 2000 per month if he is engaged for 25 days a month at an average. Thus, a
monthly income of Rs. 2000 is taken as the benchmark for categorizing the poors. However, those in the
31

income category o f Rs. 5000 to Rs. 2000 per month are also poor though not as poor as the above
category. This group has been classified as low-income group. The middle income group in the context of
the villages surveyed would constitute the monthly income range of Rs. 5000 to Rs. 10,000 and those
earning above Rs. 10,000 have been categorized as the rich income group in the relative context of the
villages. The household classification scheme according to monthly income makes space for four
categories viz., high income (Rs. 10,000 and above), middle income (Rs. 10,000 to Rs. 5,000), low
income (Rs. 5,000 to Rs. 2,000) and poors (less than Rs. 2,000). It is expected that the last two categories
in this classificatory scheme would form the bulk of poor people. It should be noted that the landless
households and the marginal farmers in the village fall under poor and low-income class, while the large
and medium landowners belong to the middle and high-income class. While the high-income class
invariably owns large tracts of land the poorer group are landless. Since agriculture remains the major
activity for majority of these people the process of development emanating from such an activity is
expected to have a significant role in poverty alleviation. However, many of the villagers also depend on
other activities such as forest, retail trade, livestock, accrual of income from which also contributes to
poverty alleviation. These activities are, therefore, essential components of providing the supplementary
role to the main activity of agriculture in reducing poverty.
The final accounts in the SAM table pertain to rest of the villages and rest of the world. The trade
of the village with the region and rest o f India are analyzed here.
It is not difficult to see that the major accounts of SAM include forest sectors resources that
would help capture its interaction with the household groups. In the activity account the linkages of the
forest resources like fodder, fuelwood, timber and non-timber forest product with other activities of the
village (agriculture, non-agriculture and services) will be explicitly established. Similarly, inclusion of
forest goods in the commodity account will initiate the process of linkages through income generation and
income distribution along with other commodities.
Forest sector and its linkages:
An attempt is made to list the important forest resources that enter into the production activities of
agriculture, non agriculture and service sectors of the village. Making use of the extended asset boundary
offered by SEEA (UN 1993), the SAM is developed to account for (i) non-produced natural economic
assets (e.g., mineral extraction and timber harvest etc.) and (ii) non-produced natural non-economic assets
(e.g., firewood collection, fodder collection, logs and timber and non-timber minor forest products
including those of medicinal plants) while establishing the linkage between forest sector and village
economic system in the context of production activities. The forest sector is taken to cater two broad types
32
of demand, viz., i) non-produced natural economic assets such as mineral extraction, timber harvest (sold
by auction) etc., undertaken by the government. These activities are apportioned in the capital account of
the government; and ii) non-produced natural other economic assets such firewood, fodder, logs and non
timber forest products, collected by the households4 have been accounted as forest products in the
commodity account o f the forestry sector. Inputs from the forests to village industries are accounted in the
factor account as forest resources. The capital account of the forest sector captures the value of net annual
change in the stock of carbon and earnings from the sale / auctioning of timber. Since the government is
the owner of the forest and receives income from the sale o f timber, the change in the value of annual net
carbon stock has been apportioned to it.
The resultant relationship to be captured through the SAM schema is given below and the basic
interdependent links of the village economy are envisaged to run as follows:
Production activities -> Factorial income distribution —> Household income distribution —» Household
expenditure on goods and services —> Household expenditures on commodities and final demand —>
Production activities.
Essentially the approach helps in deriving the income distribution and expenditure pattern by
socioeconomic groups following, say, a change in structure of production resulting from either a
developmental agency or a government actions by distinguishing between the determination of primary
and secondary income distribution. It may be seen that the primary income distribution is determined
through the triangular interrelationship linking production activities, factors and households. The value
added by production accounts is translated into incomes of different types of households and other
institutions. On the other hand, consumption patterns of different socioeconomic groups reveal the value
of commodities consumed by these groups and help provide the information of living standards of various
groups and the extent to which they are able to satisfy their basic needs.
4.3 SAM Multiplier Analysis
To analyse the effects of exogenous change on the economic system, the transactions between
sectors in the core SAM (Table 5.1 and 5.2) are put in two groups, viz., endogenous and exogenous. In
the present study production activity, commodities, factors of production, forest, environment and
households are considered endogenous to the system while the remaining accounts viz., government, rest
4 It is presumed that forest resources used by the production sector and rest of world are purchased from the households, which encroach into forest.
33
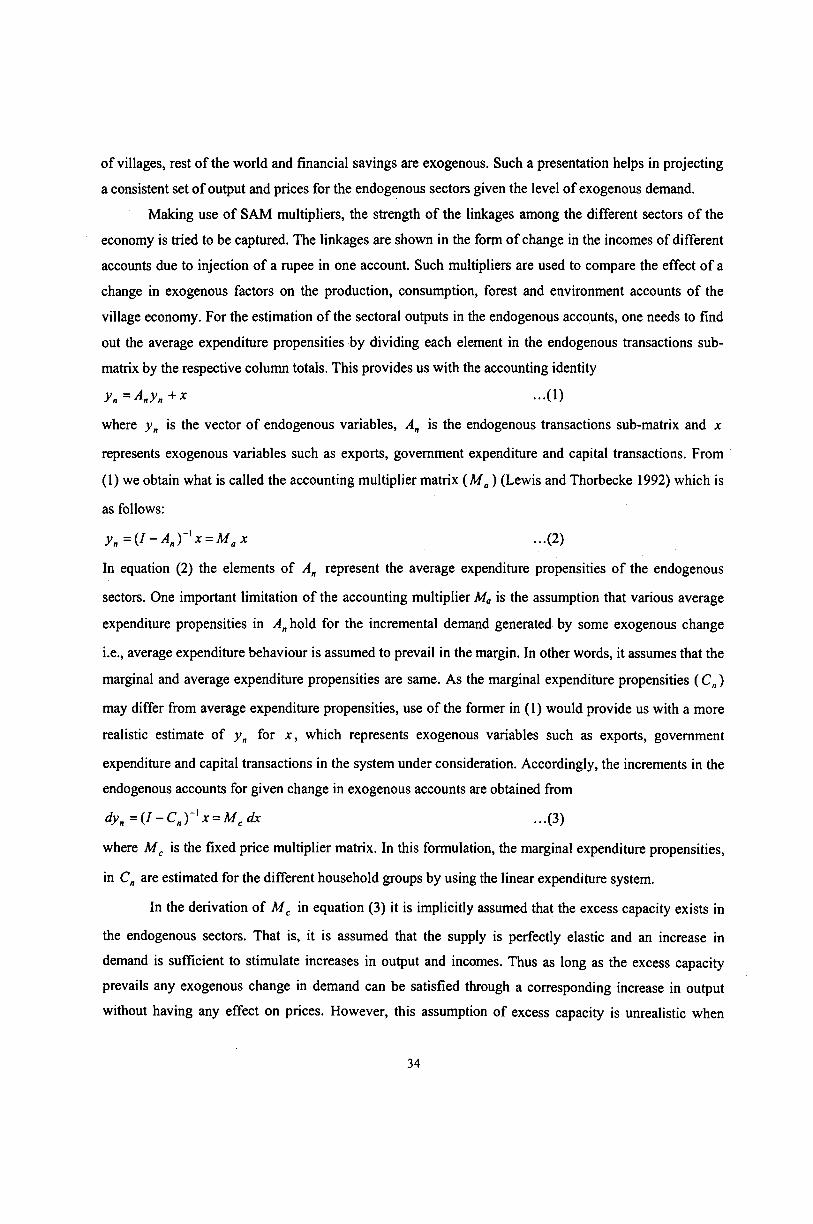
of villages, rest of the world and financial savings are exogenous. Such a presentation helps in projecting
a consistent set of output and prices for the endogenous sectors given the level of exogenous demand.
Making use of SAM multipliers, the strength o f the linkages among the different sectors o f the
economy is tried to be captured. The linkages are shown in the form o f change in the incomes of different
accounts due to injection of a rupee in one account. Such multipliers are used to compare the effect of a
change in exogenous factors on the production, consumption, forest and environment accounts of the
village economy. For the estimation of the sectoral outputs in the endogenous accounts, one needs to find
out the average expenditure propensities by dividing each element in the endogenous transactions sub
matrix by the respective column totals. This provides us with the accounting identity
y n = ^nyn+ X ...(1)
where y n is the vector of endogenous variables, An is the endogenous transactions sub-matrix and x
represents exogenous variables such as exports, government expenditure and capital transactions. From
(1) we obtain what is called the accounting multiplier matrix ( M a ) (Lewis and Thorbecke 1992) which is
as follows:
y n = ( I - A ny ' x = M a x ...(2)
In equation (2) the elements of An represent the average expenditure propensities of the endogenous
sectors. One important limitation of the accounting multiplier Ma is the assumption that various average
expenditure propensities in An hold for the incremental demand generated by some exogenous change
i.e., average expenditure behaviour is assumed to prevail in the margin. In other words, it assumes that the
marginal and average expenditure propensities are same. As the marginal expenditure propensities ( C„)
may differ from average expenditure propensities, use of the former in (1) would provide us with a more
realistic estimate of y n for x , which represents exogenous variables such as exports, government
expenditure and capital transactions in the system under consideration. Accordingly, the increments in the
endogenous accounts for given change in exogenous accounts are obtained from
dyn = ( I - C „ y 'x = M c dx ...(3)
where M c is the fixed price multiplier matrix. In this formulation, the marginal expenditure propensities,
in C„ are estimated for the different household groups by using the linear expenditure system.
In the derivation of M c in equation (3) it is implicitly assumed that the excess capacity exists in
the endogenous sectors. That is, it is assumed that the supply is perfectly elastic and an increase in
demand is sufficient to stimulate increases in output and incomes. Thus as long as the excess capacity
prevails any exogenous change in demand can be satisfied through a corresponding increase in output
without having any effect on prices. However, this assumption of excess capacity is unrealistic when
34
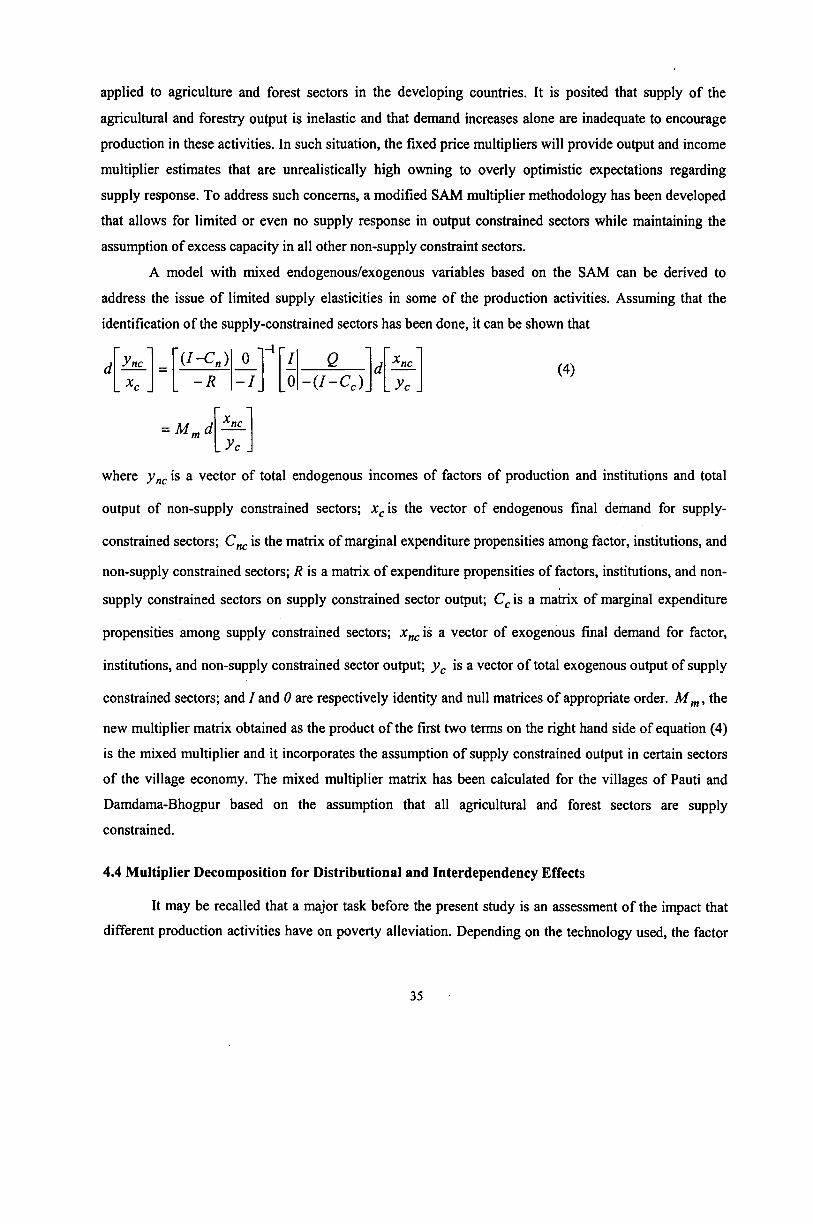
applied to agriculture and forest sectors in the developing countries. It is posited that supply of the
agricultural and forestry output is inelastic and that demand increases alone are inadequate to encourage
production in these activities. In such situation, the fixed price multipliers will provide output and income
multiplier estimates that are unrealistically high owning to overly optimistic expectations regarding
supply response. To address such concerns, a modified SAM multiplier methodology has been developed
that allows for limited or even no supply response in output constrained sectors while maintaining the
assumption of excess capacity in all other non-supply constraint sectors.
A model with mixed endogenous/exogenous variables based on the SAM can be derived to
address the issue of limited supply elasticities in some o f the production activities. Assuming that the
identification of the supply-constrained sectors has been done, it can be shown that
(4)ync \ V - C n ) 0 '-1
' I Q
Xc . ~ R - I 0 - ( i - c c ) yc
= M m dyc
where y nc is a vector of total endogenous incomes of factors of production and institutions and total
output of non-supply constrained sectors; ;tc is the vector of endogenous final demand for supply-
constrained sectors; C nc is the matrix of marginal expenditure propensities among factor, institutions, and
non-supply constrained sectors; R is a matrix of expenditure propensities of factors, institutions, and non
supply constrained sectors on supply constrained sector output; Cc is a matrix of marginal expenditure
propensities among supply constrained sectors; *„c is a vector of exogenous final demand for factor,
institutions, and non-supply constrained sector output; y c is a vector of total exogenous output of supply
constrained sectors; and I and 0 are respectively identity and null matrices of appropriate order. M m, the
new multiplier matrix obtained as the product o f the first two terms on the right hand side of equation (4)
is the mixed multiplier and it incorporates the assumption of supply constrained output in certain sectors
of the village economy. The mixed multiplier matrix has been calculated for the villages of Pauti and
Damdama-Bhogpur based on the assumption that all agricultural and forest sectors are supply
constrained.
4.4 Multiplier Decomposition for Distributional and Interdependency Effects
It may be recalled that a major task before the present study is an assessment of the impact that
different production activities have on poverty alleviation. Depending on the technology used, the factor
35

endowment of the poor socioeconomic household groups and the extent of inter-linkages on the demand
and supply sides (i.e., the degree of integration o f the economy), certain production activities contribute
more to poverty alleviation than others. So following Thorbecke and Jung (1996), we define the fixed
price multiplier matrix ( M c ) as
dyn = c„dyn + dx
=(I-CnY ldx
=MC dx
where, C„ is the matrix of marginal expenditure propensities and Mc is the fixed price multiplier matrix. In
order to decompose the fixed price multiplier into interdependency and distributional effects the C„ matrix
is partitioned as
0 0 < vc 21 C 22 0 (2)
0 C 32 C 33
Our objective is to estimate the contribution that different production activities make towards poverty
alleviation. Thus starting with an exogenous change in demand for a given production activity
(d c3 above) we want to know the ultimate impact on the incomes of the different household groups
(idy2 above). More specifically, the impact on the additional incomes accruing to the poor household
groups (a subset of the vector d y2) is tried to be seen. Thus, we would concentrate on that part of the
fixed price multiplier matrix that links production activities to household groups (i.e., M C23). Let m - be
an element of this matrix. It shows the total direct and indirect effects of an increase of one unit in the
demand for (and the output of) production activity j on the incremental incomes received by
socioeconomic household group i.
We now decompose Mcn into two different matrices, which represent what we call the
distributional (D) and interdependency (R) effects. Thus,
M cll = RD (3)
where the dimensions of the matrices M C23, R and D are (household groups x production activities),
(household groups x household groups) and (household groups x production activities), respectively.
Our purpose is to compare the impacts of different production activities on household groups,
especially the poor households, which requires identification of each effect by each production activity
36

and each household group. Fixed price multipliers and distributional effects corresponding to each pair of
production activity and household group can be obtained directly from the matrices Mc23 and D. The
interdependency effects rtj of production activity j on household group i can be derived as
ru ~ mu I ij
where, nty is an element of M cli and d tJ is a corresponding element of D. The distributional effects
( d tJ) represent the initial effects of a change in output o f a production activity on the income of a
socioeconomic group. The strength of the distributional effects depends mainly on the technology in use
(e.g., how labor intensive it is, how much it relies on the factors of production possessed by the household
groups), and the factor endowment of the households (e.g., how much unskilled labor and land they
possess). In turn, the interdependency effects ( rtJ) capture the direct and indirect effects of spending and
re-spending by the particular household group under consideration and other groups that benefited,
income-wise, from the exogenous output injection. The interdependency effect reflects the extent of
integration within the economy on both the demand and supply sides. The more consumers spend on
domestic goods and services, the more diversified is their consumption pattern, the larger these effects.
Likewise, the greater the intersectoral linkages on the production side, the higher is the interdependency
effects. Next we define and discuss in greater details distributional and interdependency effects.
4.4.1 Distributional Effects:
Distributional effects originate with an exogenous change in the output of a given production
activity (dx3). In order to produce an additional unit of output, intermediate inputs are required. Such
input effects are captured by the matrix ( / - C3 3 . In addition to the intermediate inputs, primary factor
inputs such as labor, land, and capital are needed. The demand for such factors of production is given by
matrix C l3. In turn, additional income generated from the production activity will flow to the household
groups depending on their factor endowment. This transformation is represented by C 21. When factors
owned mostly by a poor household group are used intensively by a specific production activity, the
distributional effects will be large. Finally, income transfers that occur between and among different
socioeconomic groups are captured by ( / - C22 )_l.
Thus, the total distributional effect (D) is derived as
D = ( / — C22) C21C I3( / - C 33) (4)
37
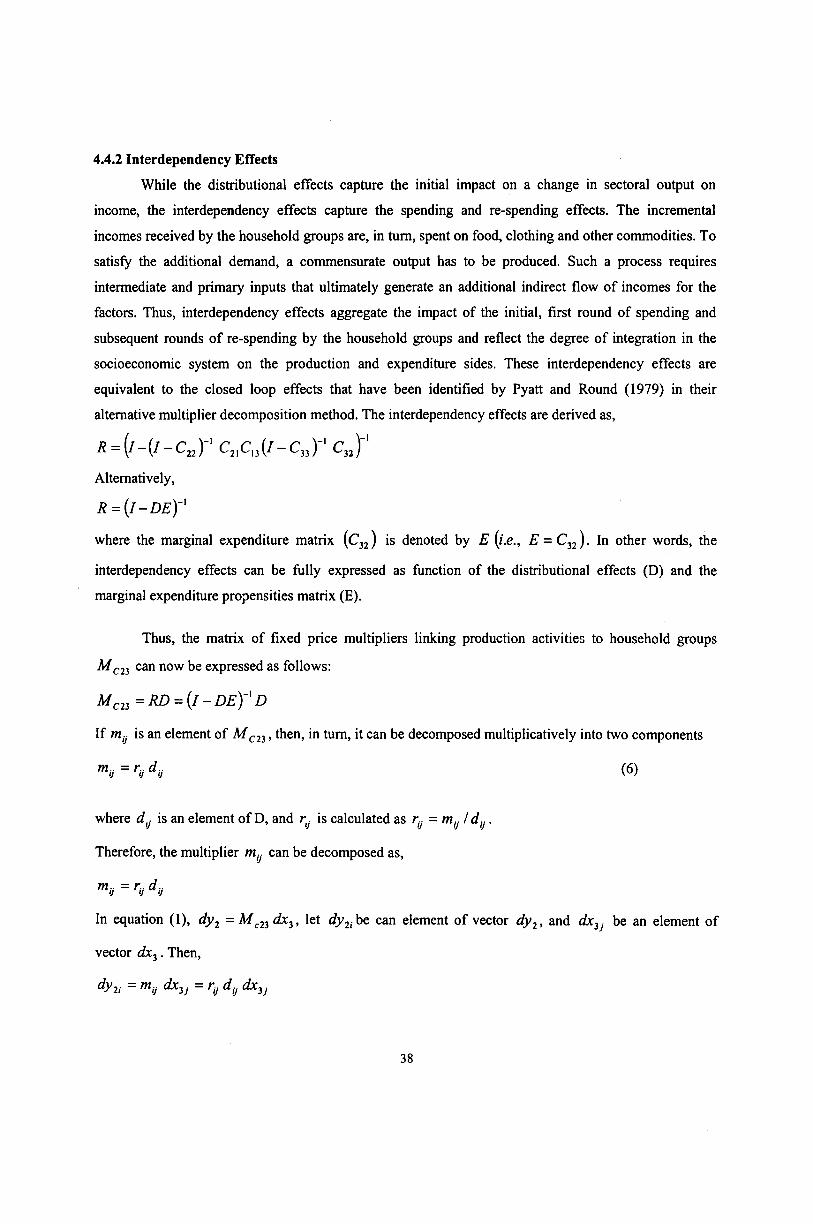
4.4.2 Interdependency EffectsWhile the distributional effects capture the initial impact on a change in sectoral output on
income, the interdependency effects capture the spending and re-spending effects. The incremental
incomes received by the household groups are, in turn, spent on food, clothing and other commodities. To
satisfy the additional demand, a commensurate output has to be produced. Such a process requires
intermediate and primary inputs that ultimately generate an additional indirect flow of incomes for the
factors. Thus, interdependency effects aggregate the impact of the initial, first round of spending and
subsequent rounds of re-spending by the household groups and reflect the degree of integration in the
socioeconomic system on the production and expenditure sides. These interdependency effects are
equivalent to the closed loop effects that have been identified by Pyatt and Round (1979) in their
alternative multiplier decomposition method. The interdependency effects are derived as,
fl = (/-(/-c22)-' c2lcn(i-c„)-' c„YAlternatively,
r = {i - d e )~]
where the marginal expenditure matrix (C32) is denoted by E (i.e., E = C32). In other words, the
interdependency effects can be fully expressed as function of the distributional effects (D) and the
marginal expenditure propensities matrix (E).
Thus, the matrix of fixed price multipliers linking production activities to household groups
M C23 can now be expressed as follows:
M C23 = RD = ( / - DE)~' D
If is an element of M c n , then, in turn, it can be decomposed multiplicatively into two components
ma = rij d a (6)
where d tj is an element of D, and ry. is calculated as ry = m,. / d tj.
Therefore, the multiplier m(y can be decomposed as,
mu = ru dy
In equation (1), dy2 = M c2idx3, let dy2i be can element of vector dy2, and dx3j be an element of
vector dxi . Then,
dy2/ = m0 dx3J = rv d v dx3j
38
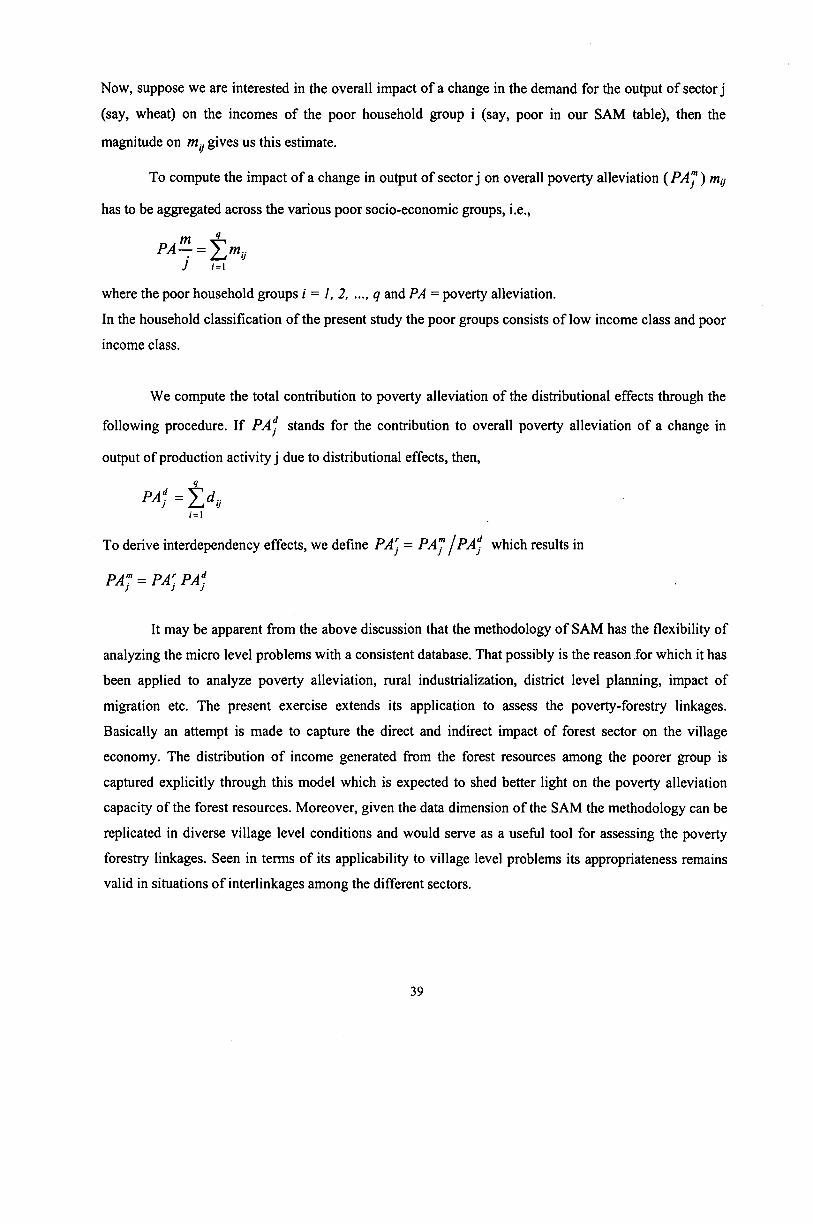
Now, suppose we are interested in the overall impact of a change in the demand for the output of sector j
(say, wheat) on the incomes of the poor household group i (say, poor in our SAM table), then the
magnitude on mtj gives us this estimate.
To compute the impact of a change in output of sector j on overall poverty alleviation (P A J ) my
has to be aggregated across the various poor socio-economic groups, i.e.,
where the poor household groups i = 1, 2, ..., q and PA = poverty alleviation.
In the household classification of the present study the poor groups consists of low income class and poor
income class.
We compute the total contribution to poverty alleviation of the distributional effects through the
following procedure. If PAj stands for the contribution to overall poverty alleviation of a change in
output of production activity j due to distributional effects, then,
= i x/=i
To derive interdependency effects, we define P A ' = PAJ j PA* which results in
PAJ = PA] PAj
It may be apparent from the above discussion that the methodology of SAM has the flexibility of
analyzing the micro level problems with a consistent database. That possibly is the reason for which it has
been applied to analyze poverty alleviation, rural industrialization, district level planning, impact of
migration etc. The present exercise extends its application to assess the poverty-forestry linkages.
Basically an attempt is made to capture the direct and indirect impact of forest sector on the village
economy. The distribution o f income generated from the forest resources among the poorer group is
captured explicitly through this model which is expected to shed better light on the poverty alleviation
capacity of the forest resources. Moreover, given the data dimension of the SAM the methodology can be
replicated in diverse village level conditions and would serve as a useful tool for assessing the poverty
forestry linkages. Seen in terms of its applicability to village level problems its appropriateness remains
valid in situations of interlinkages among the different sectors.
39
4.5 DatabaseThe data requirement for estimation of a village level SAM is elaborate and demanding as it
encompasses all economic transactions. Specifically, the variables to be included in the analysis are on
the following aspects:
• members of households and their employment status
• ownership of land and other assets such as machinery, draught animal, etc.
• factor input, output and revenue from production activities related to livestock forestry and village
services.
• annual sale and expenditure of traded goods and the retail market
• household earnings - factor income, transfers and subsidies
• household expenditure composition including expenditure on health
• other economic transactions- savings, investment, construction activities, etc.
• location, slope, rainfall and farming practices coefficients associated with every plot of land for
calculation of external cost associated with soil erosion. A more detailed methodology has been
incorporated in the Annexure (see Annexure 1)
• mapping of forest resources in accordance with SNA classification of economic and non-economic
non-produced natural assets including net change in annual carbon stock. This required mapping
forest resource by species, their annual increment / yield, density and prices of relevant products. A
more detailed methodology has been incorporated in the Annexure. (see Annexure 2)
• disease profile and treatment cost to identify relevant diseases associated with indoor air pollution
• income and expenditure in the public accounts of the villages, this would include the sources of
earnings like tax and non tax revenue and item of expenditure in the health, education, infrastructure,
subsidy of food, fuel, and electricity
• record of spatial attributes of transaction in inputs and outputs, wherever relevant, according to source
and destination which may be local ie within the village, or may involve rest of the villages / rest of
the world
As village level data on the above aspects are not published, the study undertook a survey (refer
to the Questionnaire attached in Annexure 3). Keeping in view forest degradation as the central problem,
two villages in the state of Haryana (one located in the Aravalli and another in Shivalik forest areas) are
selected that form the sample of the study. A total of 305 households and 13 business establishments are
covered that has formed the basis of preparing village SAMs. The selection of the village is on the basis
of (i) population of poor household in a proportion which is representative of the region (ii) presence of
forests which are used as a source of livelihood.
40

5. Village SAMs
Tables 5.1 and 5.2 give the disaggregated transaction matrix constructed for the villages of Pauti
and Damdama-Bhogpur while Tables 5.1A and 5.2A provide aggregated transaction matrix for the two
villages respectively. Following the usual convention, the cell ij in the table depicts payment from
account j to account *. A reading o f the tables indicate the following features of the village economies
under study.
5.1 SAM for Pauti
Cultivation of mustard, wheat and cotton are the most important agricultural activities in Pauti.
The village also cultivates oilseeds and pulses, vegetables and fodder. Vegetable is cultivated entirely
from family labour, while the other crops use both family and hired labour. A substantial portion of the
expenditure on inputs is incurred on account of land preparation and fertilizer. Among the agricultural
crop value addition is the highest in mustard which is the main export crop of the village. The village is
predominantly agriculture dependent whose contribution to the domestic product of the village is the
highest. The livestock and poultry sector also contribute significantly to the income of the village. The
services sector generates more income as compared to the forest and non-agricultural sector. This is
mainly due to government expenditure on education and infrastructure.
The commodity account gives the relative consumption pattern of the different income classes of
the village. The high-income class consisting of 33 households i.e., 23% of the total household in the
village consumes 38% of the commodities in value term. The middle income group consisting of 32
households or 22% of the total households consumes 24% of total consumption of the village while the
low income group consisting of 56 households or 39% of the total households consumes 31% of total
commodities consumed in the villages. The last group i.e., the poor households, numbering 22 and
comprising 15% of the total households consumes only 6% of the commodities. The consumption of
forest products by high-income group is 24%, that of the middle income is 27 % and low-income group is
33%. In contrast to these, the poorest group of the village consumes only 17% of the total forest product.
Comparing the consumption patterns of the different household groups, it can be seen that the poor
households are relatively more dependent on forest products as compared to relative consumption of all
commodities by different household groups. The health cost associated with indoor air pollution caused
by fuelwood used for cooking, has been accounted with the forest product as external cost.
41

The capital account, which includes land and forest, tries to capture the impact on the
environment due to soil erosion caused by agricultural activity of the village. This enters as an external
cost associated with agricultural land in the capital account. Thus the two items of external cost are health
cost associated with fuelwood use (in the commodity account) and the cost associated with soil erosion
from agricultural land (in the capital account). The net addition to the carbon stock valued to be Rs. 1.06
million due to sequestering has been accounted to the Government in the forest sector. (Details of
computation of soil erosion and carbon sequestration are given in Annexure 2). The capital account also
includes the savings and investment of different groups of households. More than 75% of the savings of
the village comes from the high-income group. The middle income gioup contributes 13% and the low-
income group 10% of the savings. In contrast to these, the poorest group’s share is only 1.4% in the total
savings of the village.
It may be noted that the external cost from fuelwood use has entered as negative entry associated
with forest products. Thus the net impact of fuelwood use causes a net outflow of money from all groups
of household and also reduces net output of the village by Rs.36, 955. The total health cost due to indoor
air pollution of the whole village works out to be Rs. 0.18 million of which 20 % is incurred by the high
income households, 8.5 % by the middle income, 57 % by the low income and 13 % by the poor
households.
The negative entries associated with soil erosion amount to Rs.0.64 million. The total external
cost of the village amounts to Rs. 0.83 million.
The government plays a very important role in the village as it provides water, electricity,
education and infrastructure services. Moreover, it is also the owner of village forests and hence gains in
natural capital stock are recorded as its income. The government rents out land under its ownership and
has earned Rs. 77.21 during 2003. Revenue from commodity taxation in the village constitutes the major
sources of receipt for the government whereas subsidies on account of fertilizer, water charges, kerosene
and LPG are major expenditures borne by it. Other spending activities of the government in the village
comprise the fund allocated to it under various developmental schemes on education and infrastructure.
Transaction of the village with rest of the villages and rest of the world are recorded in the SAM
table under ROV and ROW. Rice and nonagricultural goods are the main imports of the village. Payment
to teachers in the village schools has been recorded as an import of services. The village exports
agricultural commodities and labour. The institutional savings and investment are done in financial
institutions located outside the village and hence gets recorded as export of savings and investment.
42
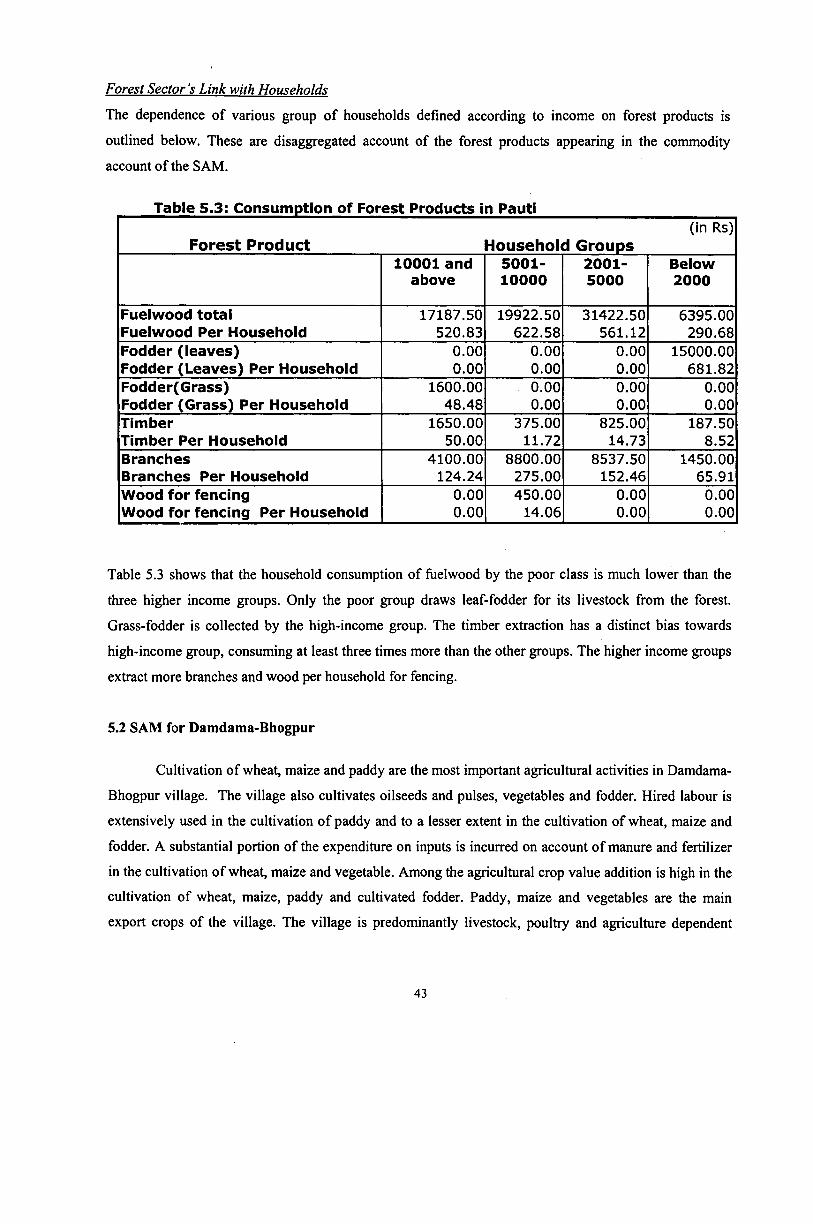
Forest Sector's Link with Households
The dependence of various group o f households defined according to income on forest products is
outlined below. These are disaggregated account of the forest products appearing in the commodity
account of the SAM.
Table 5.3: Consumption of Forest Products in Pauti
Forest Product Household Groups(in Rs)
10001 and above
5001-10000
2001-5000
Below2000
Fuelwood total 17187.50 19922.50 31422.50 6395.00Fuelwood Per Household 520.83 622.58 561.12 290.68Fodder (leaves) 0.00 0.00 0.00 15000.00Fodder (Leaves) Per Household 0.00 0.00 0.00 681.82Fodder(Grass) 1600.00 0.00 0.00 0.00Fodder (Grass) Per Household 48.48 0.00 0.00 0.00Timber 1650.00 375.00 825.00 187.50Timber Per Household 50.00 11.72 14.73 8.52Branches 4100.00 8800.00 8537.50 1450.00Branches Per Household 124.24 275.00 152.46 65.91Wood for fencing 0.00 450.00 0.00 0.00Wood for fencing Per Household 0.00 14.06 0.00 0.00
Table 5.3 shows that the household consumption of fuelwood by the poor class is much lower than the
three higher income groups. Only the poor group draws leaf-fodder for its livestock from the forest.
Grass-fodder is collected by the high-income group. The timber extraction has a distinct bias towards
high-income group, consuming at least three times more than the other groups. The higher income groups
extract more branches and wood per household for fencing.
5.2 SAM for Damdama-Bhogpur
Cultivation of wheat, maize and paddy are the most important agricultural activities in Damdama-
Bhogpur village. The village also cultivates oilseeds and pulses, vegetables and fodder. Hired labour is
extensively used in the cultivation of paddy and to a lesser extent in the cultivation of wheat, maize and
fodder. A substantial portion of the expenditure on inputs is incurred on account of manure and fertilizer
in the cultivation o f wheat, maize and vegetable. Among the agricultural crop value addition is high in the
cultivation of wheat, maize, paddy and cultivated fodder. Paddy, maize and vegetables are the main
export crops of the village. The village is predominantly livestock, poultry and agriculture dependent
43

which make significant contribution to the village domestic product. The services sector generates more
income as compared to the forest and non-agricultural sector. This is mainly due to government
expenditure on health, education and infrastructure.
The commodity account gives the relative consumption pattern of the different income class of
the village. The high-income class consisting of 16 households i.e., 10 % of the total households consume
18 % of the commodities in value term, the middle income group consisting of 44 households or 27 % of
the total households and consumes 39% of total consumption of the village. The low-income group
consisting of 67 households or 41% of the total households consumes 32% of total commodities
consumed in the villages and the poor households, numbering 36 i.e., 22 % of the total households
consume only 12%. The consumption of forest products by high income group is 25 %, that of the
middle income 32 %, the low income group 29 % and the poor is 14%. Comparing the consumption
pattern of the different household groups, it can be seen the poor households are relatively more
dependent on forest products as compared to relative consumption of all commodities by different
household groups.
The health cost associated with indoor air pollution caused by fuelwood, a commonly used
product has been accounted with the forest product as external cost. The village incurs a cost of more than
Rs.0.29 million on account of indoor air pollution from fuelwood use.
The capital account, which includes land and forest, tries to capture the impact on the
environment due to soil erosion caused by agricultural activity. It works out to be more that Rs.0.30
million for the whole village. This enters as an external cost associated with agricultural land in the
capital account. Thus the two items of external cost are health cost associated fuelwood use (in the
commodity account) and the cost associated with soil erosion from agricultural land (in the capital
account). The net addition to the carbon stock, Rs. 12.29 million, due to sequestering has been accounted
to the Government in the forest sector. (Details of computation of soil erosion and carbon sequestration
are given in the Appendix). The capital account also includes the savings and investment of different
groups of households. More than 54 % of the savings come from the high-income group, while the middle
income group contributes 36 %, the low income group 8 % and the poorest group saves only 1 % of the
total savings of the village. The total savings of the village works out to Rs.1.65 million
It may be noted that the external cost from fuelwood use has entered as negative entries
associated with forest products. Thus the impact of fuelwood use causes a outflow of money from all
groups of household and also reduces net output of the village. The total value of forest products
consumed by the village amounts to Rs.715176. The total health cost due to indoor air pollution of the
whole village caused by fuelwood burning works put to Rs. 296524 of which 3 % is incurred by the high
44
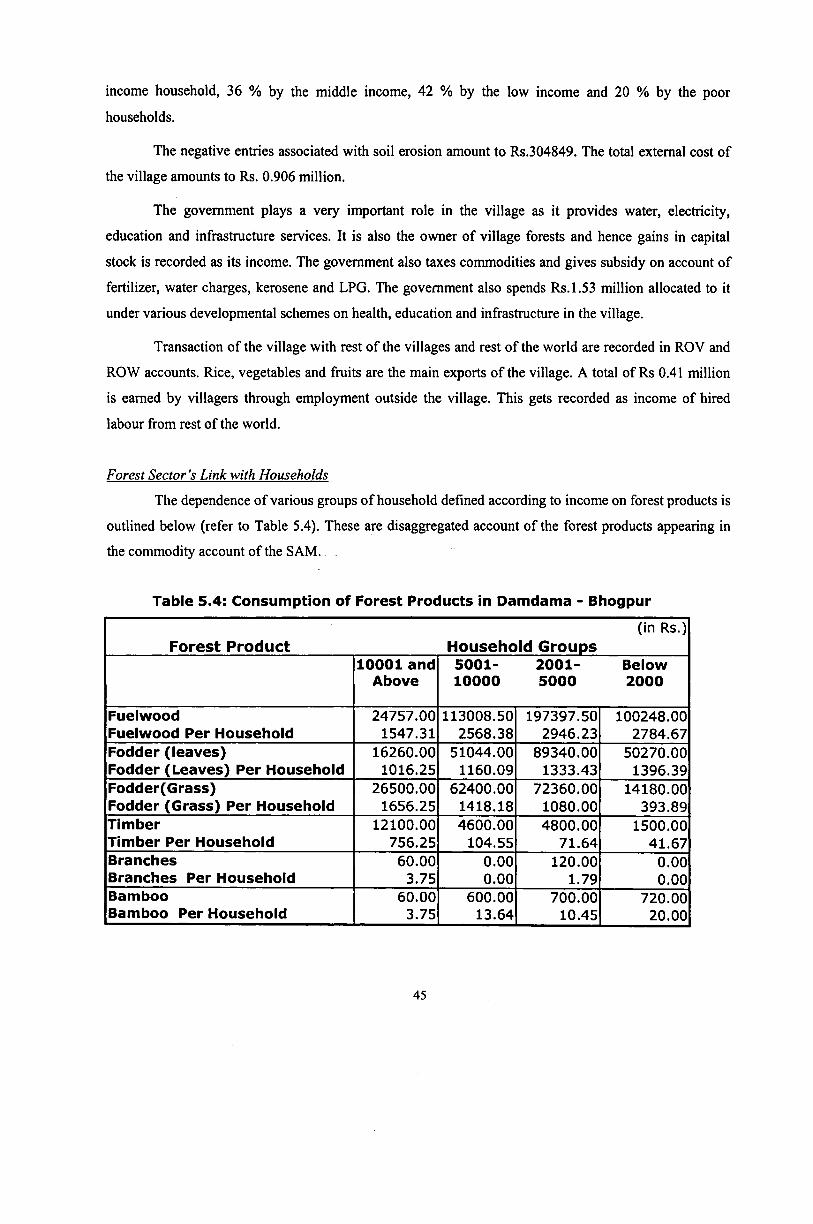
income household, 36 % by the middle income, 42 % by the low income and 20 % by the poor
households.
The negative entries associated with soil erosion amount to Rs.304849. The total external cost of
the village amounts to Rs. 0.906 million.
The government plays a very important role in the village as it provides water, electricity,
education and infrastructure services. It is also the owner of village forests and hence gains in capital
stock is recorded as its income. The government also taxes commodities and gives subsidy on account of
fertilizer, water charges, kerosene and LPG. The government also spends Rs.1.53 million allocated to it
under various developmental schemes on health, education and infrastructure in the village.
Transaction of the village with rest of the villages and rest of the world are recorded in ROV and
ROW accounts. Rice, vegetables and fruits are the main exports of the village. A total of Rs 0.41 million
is earned by villagers through employment outside the village. This gets recorded as income of hired
labour from rest of the world.
Forest Sector's Link with Households
The dependence of various groups of household defined according to income on forest products is
outlined below (refer to Table 5.4). These are disaggregated account of the forest products appearing in
the commodity account of the SAM. .
Table 5.4: Consumption of Forest Products in Damdama - Bhogpur
Forest Product Household Groups(in Rs.)
10001 and Above
5001-10000
2001-5000
Below2000
FuelwoodFuelwood Per Household
24757.001547.31
113008.502568.38
197397.502946.23
100248.002784.67
Fodder (leaves)Fodder (Leaves) Per Household
16260.001016.25
51044.001160.09
89340.001333.43
50270.001396.39
Fodder(Grass)Fodder (Grass) Per Household
26500.001656.25
62400.001418.18
72360.001080.00
14180.00393.89
TimberTimber Per Household
12100.00756.25
4600.00104.55
4800.0071.64
1500.0041.67
BranchesBranches Per Household
60.003.75
0.000.00
120.001.79
0.000.00
BambooBamboo Per Household
60.003.75
600.0013.64
700.0010.45
720.0020.00
45
The above Table 5.4 shows that the household consumption of fuelwood by the middle income,
low income and poor groups is high. The consumption of the high-income group is lower than the other
groups. Hence, not only the poor but also the relatively well off in this village are dependent on fuelwood
for cooking and heating. The high-income group, which has only 16 households, may be using non-bio
fuels (kerosene, LPG) for cooking. Being a colder region, located in the Shivalik foothills of the
Himalayas the consumption of fuelwood is relatively high per household in this village. The village is
highly dependent on the forest for supply of fodder across income groups. The timber extraction has a
distinct bias towards high-income group, consuming at least twenty times more than the poor group. The
higher income groups extract more branches and wood per household for fencing. The bamboo collection
is more for poorer households of the village.
The SAM of both the villages shows that their economic structure is such that its is largely
dominated by the agricultural activities. Animal husbandry is another important activity in these villages.
Forest sector plays a supplementary role to the above activities in both the villages. The main differences
in the economic structure however, can be noticed in terms of the degree of openness of the villages. Pauti
is more integrated to the outside world and a greater proportion of its income comes from outside the
village in the form of salary and wages. However, Damdama-Bhogpur has an advantage over Pauti in
having a more favourable climatic condition which generates higher income through a wider variety of
forest resources.
Despite the above differences notices in the economic structure of the villages it should be noted
that agriculture remains the main activity. Therefore, any strategy of poverty reduction through
intervention in the forestry has to take into account the supplementary character of the sector in income
augmentation.
46
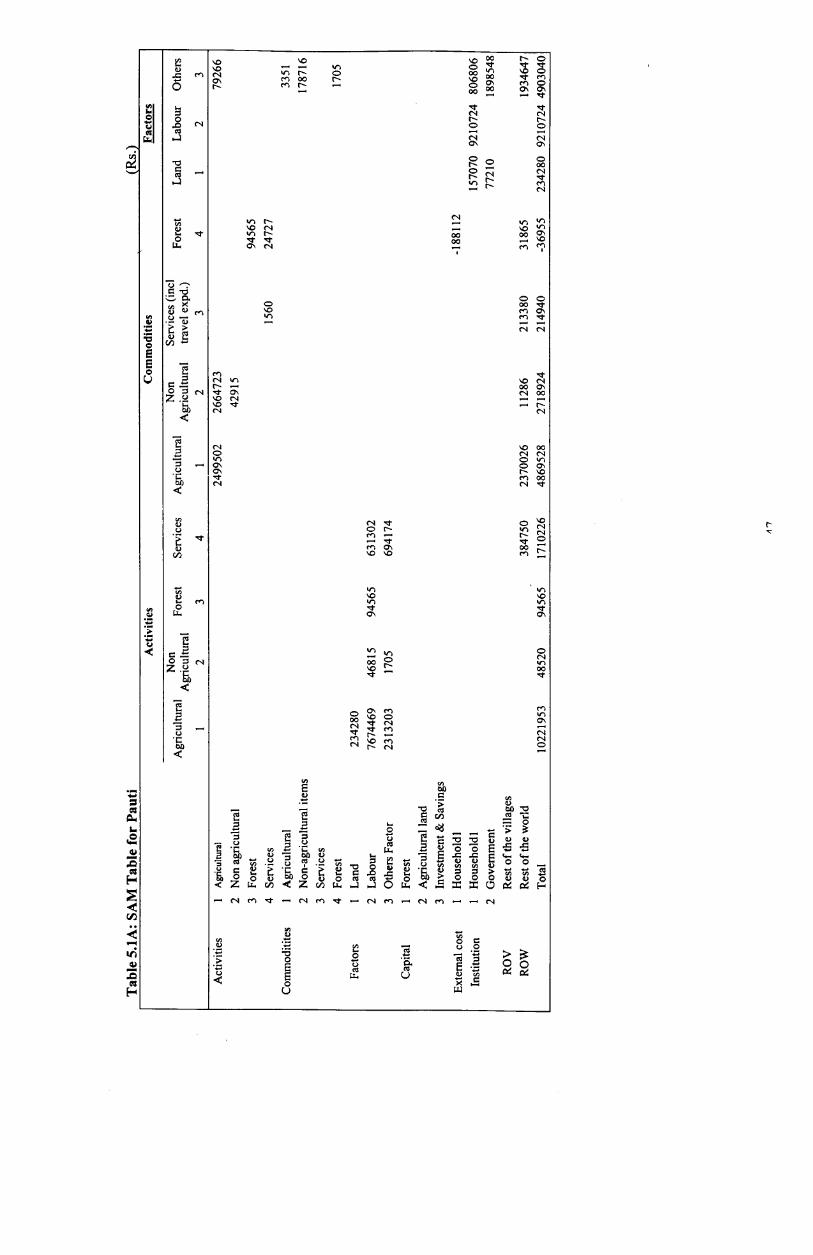
Tabl
e 5.
1A: S
AM
Tab
le fo
r Pau
ti___
____
____
____
____
____
____
____
____
____
____
____
____
____
____
____
____
„___
____
__(R
s.)A
ctiv
ities
Com
mod
ities
---c--
------
---Fa
ctor
s
Agr
icul
tura
lN
onA
gric
ultu
ral
Fore
stSe
rvic
esA
gric
ultu
ral
Non
Agr
icul
tura
lSe
rvic
es (i
ncl
trave
l exp
d.)
Fore
stLa
ndLa
bour
Oth
ers
12
34
12
34
12
3A
ctiv
ities
1 2 3 4
Agr
icul
tura
l
Non
agr
icul
tura
l Fo
rest
Serv
ices
2499
502
2664
723
4291
5
1560
9456
524
727
7926
6
Com
mod
itite
s1 2 3 4
Agr
icul
tura
l N
on-a
gric
ultu
ral i
tem
s Se
rvic
es
Fore
st
3351
1787
16
1705
Fact
ors
1 2 3
Land
La
bour
O
ther
s Fa
ctor
2342
8076
7446
923
1320
346
815
1705
9456
563
1302
6941
74Ca
pita
l1 2 3
Fore
stA
gric
ultu
ral l
and
Inve
stm
ent &
Sav
ings
Exte
rnal
cos
t1
Hou
seho
ld 1
-188
112
Insti
tutio
n1 2
Hou
seho
ld 1
Gov
ernm
ent
1570
7077
210
9210
724
8068
0618
9854
8RO
VR
est o
f the
vill
ages
ROW
Res
t of t
he w
orld
3847
5023
7002
611
286
2133
8031
865
1934
647
Tota
l10
2219
5348
520
9456
517
1022
648
6952
827
1892
421
4940
-369
5523
4280
9210
724
4903
040

Tabl
e 5.
1A: S
AM
Tab
le fo
r Pau
ti (C
ontd
.)C
apita
lEx
t. co
sts
Inst
itutio
nR
OV
RO
WT
otal
Fore
st1
Land 2
Savi
ng 3H
ouse
hold
s1
Hou
seho
lds
1G
over
nmen
t2
Res
t of t
he
villa
ges
Res
t of t
he
wor
ldA
ctiv
ities
1A
gric
ultu
ral
1839
4447
9451
710
2219
522
Non
agric
ultra
l56
0548
520
3Fo
rest
9456
54
Serv
ices
1683
939
1710
226
Com
mod
ities
1A
gric
ultu
ral
4622
692
2434
8548
6952
82
Non
-agr
icul
tura
l ite
ms
6239
9411
286
1904
929
2718
924
3Se
rvic
es11
9262
9567
821
4940
4Fo
rest
-188
112
1494
52-3
6955
Fact
ors
1La
nd23
4280
2La
bour
7635
7392
1072
43
Oth
ers F
acto
r18
9395
849
0304
0C
apita
l1
Fore
st10
6461
410
6461
42
Agr
icul
tura
l lan
d-6
4294
7-6
4294
73
Inve
stmen
t & S
avin
gs23
2215
612
0802
835
3018
4Ex
tern
al C
ost
1H
ouse
hold
10
-642
947
-831
058
Inst
itutio
n1
Hou
seho
ld 1
00
3530
184
2413
896
4291
978
2041
0659
2G
over
nmen
t10
6461
410
9237
3097
6037
0400
271
6337
2R
OV
Rest
of th
e vi
llage
s0
4993
0949
9309
RO
WRe
st of
the
wor
ld0
1196
4556
1691
0511
Tota
l10
6461
4-6
4294
735
3018
4-8
3105
820
4106
5871
6337
249
9309
1691
0512
48

Tabl
e 5.
2A: S
AM
Tab
le fo
r Dam
dam
a-Bh
ogpu
rA
ctiv
itie
sC
omm
odit
ies
Fact
or
Non
Non
Agr
icul
ture
Agr
icul
ture
Fo
rest
Serv
ices
Agr
icul
tura
l A
gric
ultu
re
Serv
ices
Fore
stLa
ndLa
bour
Oth
er F
acto
r1
2 3
41
2 3
41
23
Act
iviti
esl
Agr
icul
tura
l67
7022
1977
556
1228
0025
038
2N
on-a
gric
ultu
ral
400
3Fo
rest
3022
424
Serv
ices
1544
5Co
mm
oditi
es1
Agr
icul
tura
l2
Non
-agr
icul
tura
l ite
ms
4582
9Se
rvic
es (i
ncl t
rave
l3
expd
. etc
.)4
Fore
stFa
ctor
1La
nd25
8196
4314
02
Labo
ur25
1387
010
400
3022
4276
3045
3O
ther
Fac
tor
1832
9637
8896
Capi
tal
1Fo
rest
2A
gric
ultu
ral l
and
3In
vest
men
t & S
avin
gsEx
tern
al c
ost
1H
ouse
hold
s-2
9652
4In
stitu
tion
1H
ouse
hold
s.
4220
2581
9638
2662
036
523
2G
over
nmen
tRO
VR
est o
f the
vill
ages
4314
056
953
ROW
Res
t of t
he w
orld
1083
233
8149
6780
2264
63
6081
2901
3518
1200
4302
44
Tota
l29
5536
210
400
3022
4222
8797
914
9198
927
8022
0 63
6081
4186
5230
1336
4007
820
5945
86
49

Tabl
e 5.
2A: S
AM
Tab
le fo
r Dam
dam
a-Bh
ogpu
r (Co
ntd.
)C
apit
alE
xter
nal
Cos
tIn
stit
utio
nR
OV
RO
WT
otal
Fore
st
1
Agr
icul
tura
lla
nd 2
Inve
stm
ent &
Sa
ving
s 3
Hou
seho
lds
1
Hou
seho
lds
1
Gov
ernm
ent
2
Res
t of t
he
villa
ges
Res
t of t
he
wor
ld
Act
iviti
es1
Agr
icul
tura
l27
750
1251
9629
5536
22
Non
-agr
icul
tura
l10
000
1040
03
Fore
st30
2242
4Se
rvic
es15
2110
675
1428
2287
979
Com
mod
ities
1A
gric
ultu
ral
1491
989
1491
989
2N
on-a
gric
ultu
ral i
tem
s27
0891
525
476
2780
220
Serv
ices
(inc
l tra
vel
3ex
pd. e
tc.)
4510
7018
5011
6360
814
Fore
st-2
9652
471
5176
4186
52Fa
ctor
1La
nd30
1336
2La
bour
4182
6440
0782
03
Oth
er F
acto
r32
394
5945
86Ca
pita
l1
Fore
st12
2922
4812
2922
482
Agr
icul
tura
l lan
d-3
0484
9-3
0484
93
Inve
stmen
t & S
avin
gs16
5663
316
5663
3Ex
tern
al C
ost
1H
ouse
hold
s-3
0484
9-6
0137
4In
stitu
tion
1H
ouse
hold
s16
5663
315
6033
643
5850
711
7010
362
Gov
ernm
ent
1229
2248
1869
1511
0137
520
3603
315
6165
71RO
VR
est o
f the
vill
ages
1029
032
1129
125
ROW
Rest
of th
e w
orld
3461
305
7699
429
Tota
l12
2922
48-3
0484
916
5663
3-6
0137
411
7010
3615
6165
7111
2912
576
9942
9
50
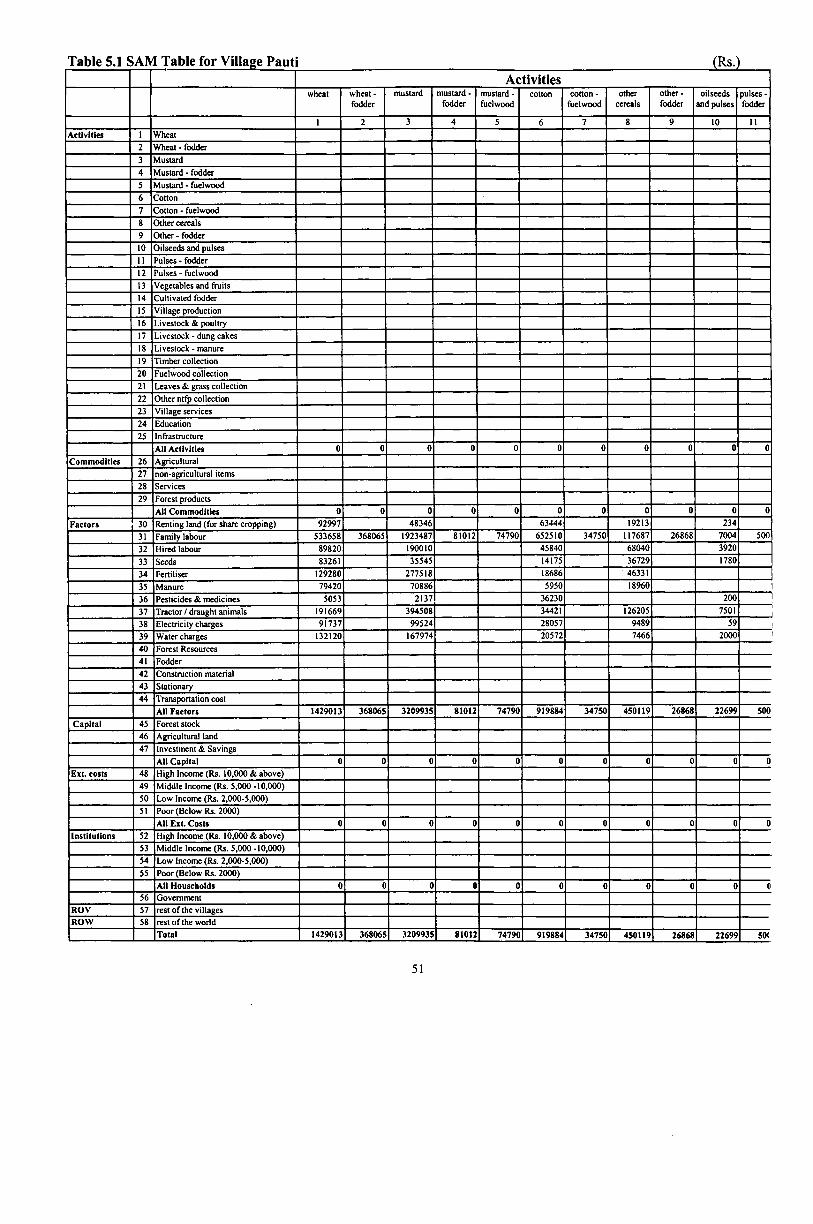
Table 5.1 SAM Table for Village Pauti_______________________________ ___________________________ (Rs.)Activities
wheat wheat - fodder
mustard mustard - fodder
mustard - fuelwood
cotton cotton - fuelwood
othercereals
other - fodder
oilseeds and pulses
pulses - fodder
1 2 3 4 5 6 7 8 9 10 11Activities 1 Wheat
2 Wheat * fodder3 Mustard4 Mustard - fodder5 Mustard - fuelwood6 Cotton7 Cotton - fuelwood8 Other cereals9 Other - fodder10 Oilseeds and pulses11 Pulses - fodder12 Pulses - fuelwood13 Vegetables and fruits14 Cultivated fodder15 Village production16 Livestock & poultry17 Livestock • dung cakes18 Livestock - manure19 Timber collection20 Fuelwood collection21 Leaves & grass collection22 Other ntfp collection23 Village services24 Education25 Infrastructure
All Activities 0 0 0 0 0 0 0 0 0 0 0Commodities 26 Agricultural
27 non-agricultural items28 Services29 Forest products
All Commodities 0 0 0 0 0 0 0 0 0 0 0Factors 30 Renting land (for share cropping) 92997 48346 63444 19213 234
31 Family labour 533658 368065 1923487 81012 74790 652510 34750 117687 26868 7004 50032 Hired labour 89820 190010 45840 68040 392033 Seeds 83261 35545 14175 36729 178034 Fertiliser 129280 277518 18686 4633135 Manure 79420 70886 5950 1896036 Pesticides & medicines 5053 2137 36230 20037 Tractor / draught animals 191669 394508 34421 126205 750138 Electricity charges 91737 99524 28057 9489 5939 Water charges 132120 167974 20572 7466 200040 Forest Resources41 Fodder42 Construction material43 Stationary44 Transportation cost
All Factors 1429013 368065 3209935 81012 74790 919884 34750 450119 26868 22699 500Capital 45 Forest stock
46 Agricultural land47 Investment & Savings
All Capital 0 0 0 0 0 0 0 0 0 0 0Ext. costs 48 High Income (Rs. 10,000 & above)
49 Middle Income (Rs. 5,000 -10,000)50 Low Income (Rs. 2,000-5,000)51 Poor (Below Rs. 2000)
All Ext. Costs 0 0 0 0 0 0 0 0 0 0 0Institutions 52 High Income (Rs. 10,000 & above)
53 Middle Income (Rs. 5,000 -10,000)54 Low Income (Rs. 2,000-5,000)55 Poor (Below Rs. 2000)
All Households 0 0 0 0 0 0 0 0 0 0 056 Government
ROV 57 rest of the villagesROW 58 rest of the world
Total 1429013 368065 3209935 81012 74790 919884 34750 450119 26868 22699 50(
51
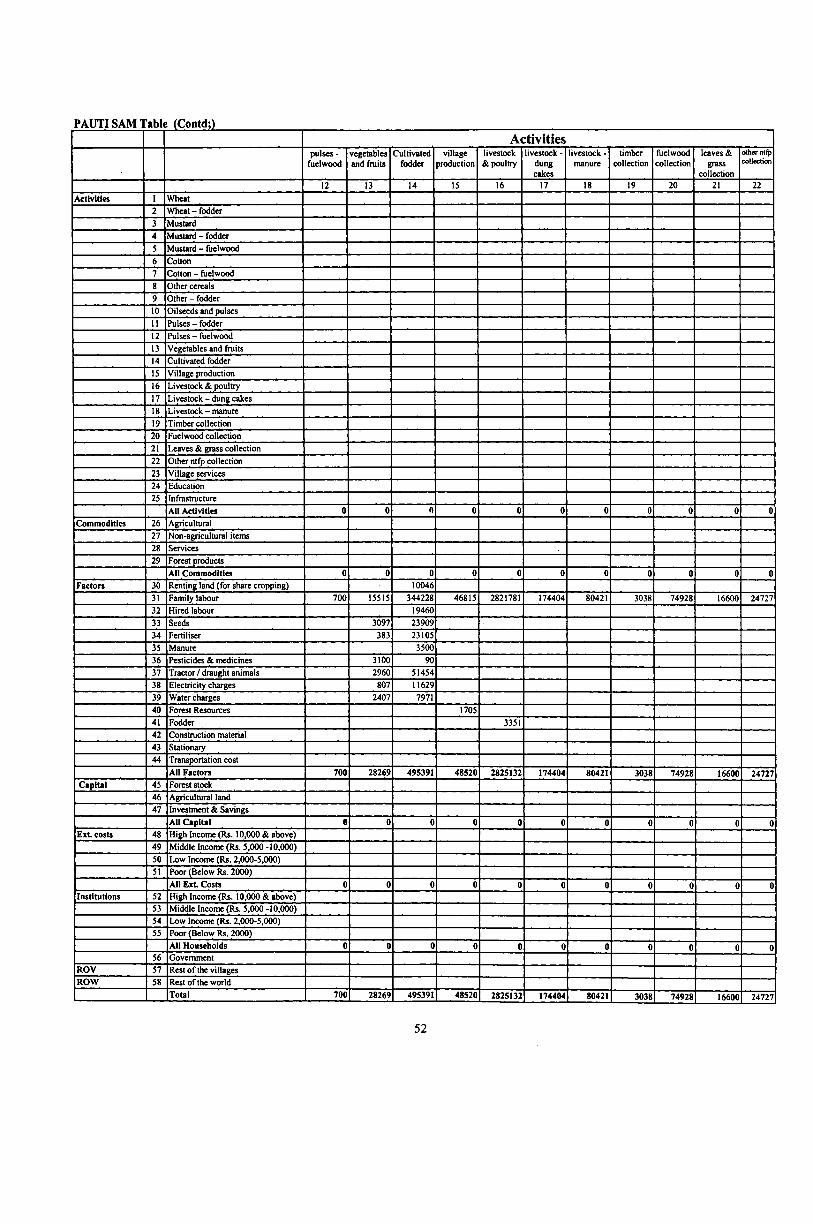
PAUTI SAM Table (Contd;)Activities
pulses - fuelwood
vegetables and fruits
Cultivatedfodder
villageproduction
livestock & poultry
livestock - dung cakes
livestock - manure
timbercollection
fuelwoodcollection
leaves & grass
collection
other ntfp collection
12 13 14 15 16 17 18 19 20 21 22Activities I Wheat
2 Wheat - fodder3 Mustard4 Mustard - fodder5 Mustard - fuelwood6 Cotton7 Cotton - fuelwood8 Other cereals9 Other - fodderto Oilseeds and pulses11 Pulses - fodder12 Pulses - fuelwood13 Vegetables and fruits14 Cultivated fodder15 Village production16 Livestock & poultry17 Livestock - dung cakes18 Livestock - manure19 Timber collection20 Fuelwood collection21 Leaves & grass collection22 Other ntfp collection23 Village services24 Education25 Infrastructure
All Activities 0 0 0 0 0 0 0 0 0 0 0Commodities 26 Agricultural
27 Non-agricultural items28 Services29 Forest products
All Commodities 0 0 0 0 0 0 0 0 0 0 0Factors 30 Renting land (for share cropping) 10046
31 Family labour 700 15515 344228 46815 2821781 174404 80421 3038 74928 16600 2472732 Hired labour 1946033 Seeds 3097 2390934 Fertiliser 383 2310535 Manure 350036 Pesticides & medicines 3100 9037 Tractor / draught animals 2960 5145438 Electricity charges 807 1162939 Water charges 2407 797140 Forest Resources 170541 Fodder 335142 Construction material43 Stationary44 Transportation cost
All Factors 700 28269 495391 48520 2825132 174404 80421 3038 74928 16600 24727Capital 45 Forest stock
46 Agricultural land47 Investment & Savings
All Capital 0 0 0 0 0 0 0 0 0 0 0Ext. costs 48 High Income (Rs. 10,000 & above)
49 Middle Income (Rs. 5,000 -10,000)50 Low Incomc (Rs. 2,000-5,000)51 Poor (Below Rs. 2000)
All E x t Costs 0 0 0 0 0 0 0 0 0 0 0Institutions 52 High Income (Rs. 10,000 & above)
53 Middle Income (Rs. 5,000 -10,000)54 Low Income (Rs. 2,000-5,000)55 Poor (Below Rs. 2000)
All Households 0 0 0 0 0 0 0 0 0 0 056 Government
ROV 57 Rest of the villagesROW 58 Rest of the world
Total 700 28269 495391 48520 2825132 174404 80421 3038 74928 16600 24727
52
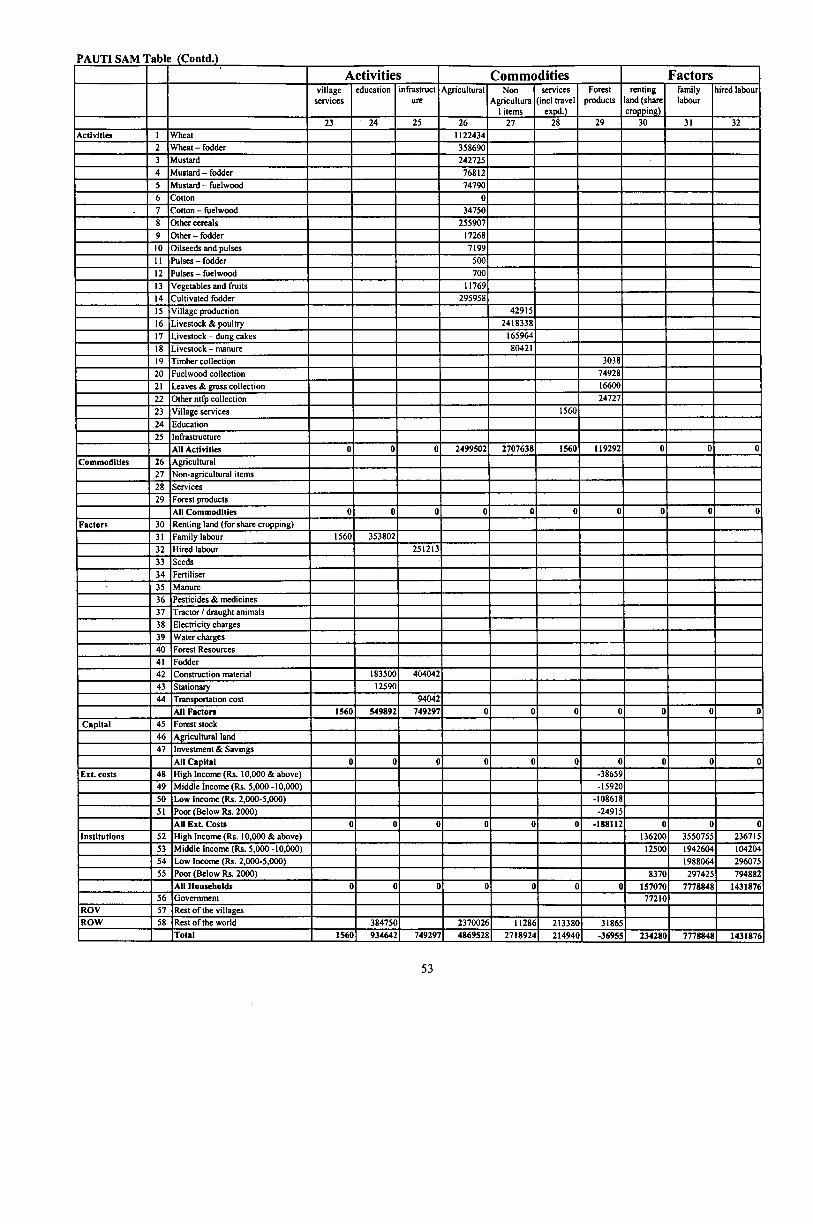
PAUTI SAM Table (Contd.)’ Activities Commodities Factors
villageservices
education infrastructure
Agricultural Non Agriculture
1 items
services (incl travel
expd.)
Forestproducts
renting land (share cropping)
familylabour
lired labour
23 24 25 26 27 28 29 30 31 32Activities 1 Wheat 1122434
2 Wheat - fodder 3586903 Mustard 2427254 Mustard - fodder 768125 Mustard - fuelwood 747906 Cotton 07 Cotton - fuelwood 347508 Other cereals 2559079 Other - fodder 1726810 Oilseeds and pulses 719911 Pulses - fodder 50012 Pulses - fuelwood 70013 Vegetables and fruits 1176914 Cultivated fodder 29595815 Village production 4291516 Livestock & poultry 241833817 Livestock - dung cakes 16596418 Livestock - manure 8042119 Timber collection 303820 Fuelwood collection 7492821 Leaves & grass collection 1660022 Other ntfp collection 2472723 Village services 156024 Education25 Infrastructure
All Activities 0 0 0 2499502 2707638 1560 U9292 0 0 0Commodities 26 Agricultural
27 Non-agricultural items28 Services29 Forest products
AU Commodities 0 0 0 0 0 0 0 0 0 0Factors 30 Renting land (for share cropping)
31 Family labour 1560 35380232 Hired labour 25121333 Seeds34 Fertiliser35 Manure36 Pesticides & medicines37 Tractor / draught animals38 Electricity charges39 Water charges40 Forest Resources41 Fodder42 Construction material 183500 40404243 Stationary 1259044 Transportation cost 94042
All Factors 1560 549892 749297 0 0 0 0 0 0 0Capital 45 Forest stock
46 Agricultural land47 Investment & Savings
All Capital 0 0 0 0 0 0 0 0 0 0Ext. costs 48 High Income (Rs. 10,000 & above) -38659
49 Middle Income (Rs. 5,000 -10,000) -1592050 Low Income (Rs. 2,000-5,000) -10861851 Poor (Below Rs. 2000) -24915
All Ext. Costs 0 0 0 0 0 0 -188112 0 0 0Institutions 52 High Income (Rs. 10,000 & above) 136200 3550755 236715
53 Middle Income (Rs. 5,000 -10,000) 12500 1942604 10420454 Low Income (Rs. 2,000-5,000) 1988064 29607555 Poor (Below Rs. 2000) 8370 297425 794882
All Households 0 0 0 0 0 0 0 157070 7778848 143187656 Government 77210
ROV 57 Rest o f the villagesROW 58 Rest o f the world 384750 2370026 11286 213380 31865
Total 1560 934642 749297 4869S28 2718924 214940 -36955 234280 7778848 1431876
53
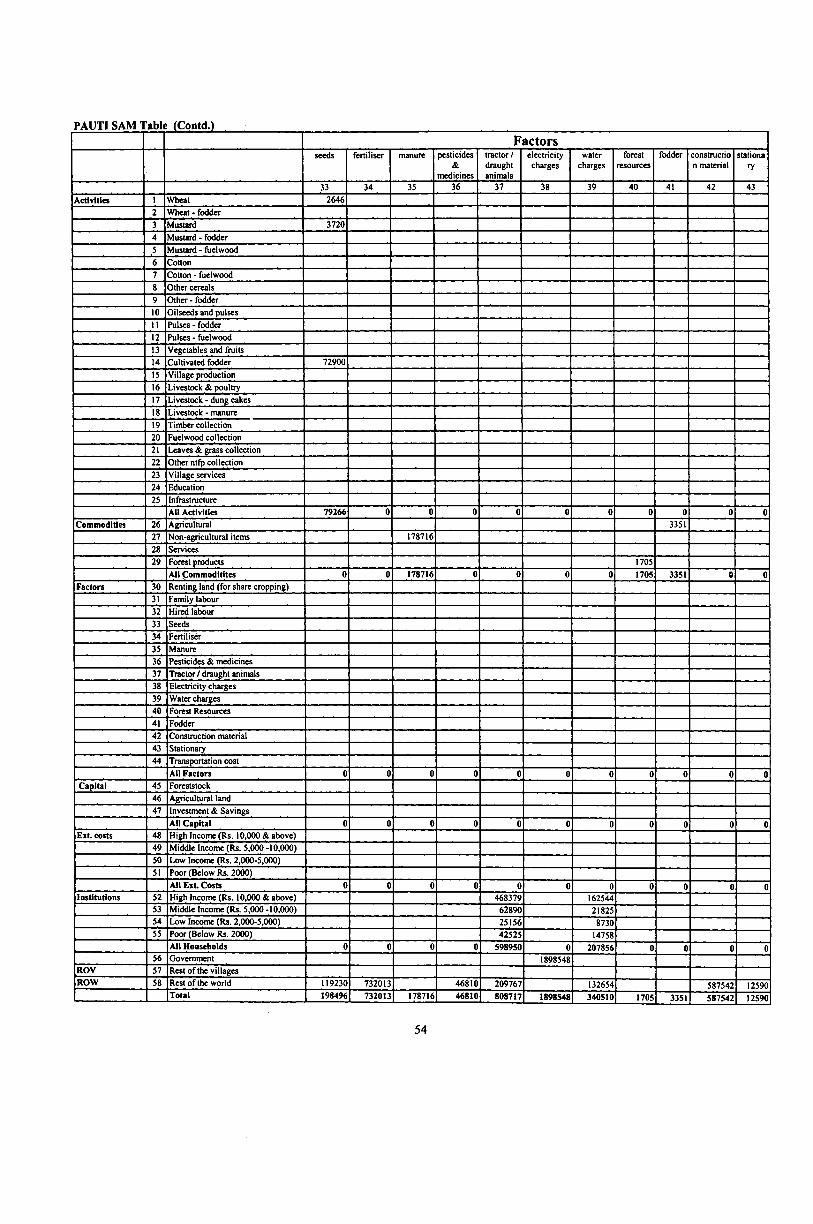
PAUTI SAM Table (Contd.)Factors
seeds fertiliser manure pesticides&
medicines
tractor / draught animals
electricitycharges
watercharges
forestresources
fodder constructio n material
stationsty
33 34 35 36 37 38 39 40 41 42 43Activities 1 Wheat 2646
2 Wheat - fodder3 Mustard 37204 Mustard - fodder5 Mustard - fuelwood6 Colton7 Cotton - fuelwood8 Other cereals9 Other - fodder10 Oilseeds and pulses11 Pulses - fodder12 Pulses - fuelwood13 Vegetables and fruits14 Cultivated fodder 7290015 Village production16 Livestock & poultry17 Livestock - dung cakes18 Livestock - manure19 Timber collection20 Fuelwood collection21 Leaves & grass collection22 Other ntfp collection23 Village services24 Education25 Infrastructure
All Activities 79266 0 0 0 0 0 0 0 0 0 0Commodities 26 Agricultural 3351
27 Non-agricultural items 17871628 Services29 Forest products 1705
All Commoditites 0 0 178716 0 0 0 0 1705 3351 0 0Factors 30 Renting land (for share cropping)
31 Family labour32 Hired labour33 Seeds34 Fertiliser35 Manure36 Pesticides & medicines37 Tractor / draught animals38 Electricity charges39 Water charges40 Forest Resources41 Fodder42 Construction material43 Stationary44 Transportation cost
All Factors 0 0 0 0 0 0 0 0 0 0 0Capital 45 Foreststock
46 Agricultural land47 Investment & Savings
All Capital 0 0 0 0 0 0 0 0 0 0 0Ext. costs 48 High Income (Rs. 10,000 & above)
49 Middle Income (Rs. 5,000 -10,000)50 Low Income (Rs. 2,000-5,000)51 Poor (Below Rs. 2000)
All E x t Costs 0 0 0 0 0 0 0 0 0 0 0Institutions 52 High Income (Rs. 10,000 & above) 468379 162544
53 Middle Income (Rs. 5,000 -10,000) 62890 2182554 Low Income (Rs. 2,000-5,000) 25156 873055 Poor (Below Rs. 2000) 42525 14758
All Households 0 0 0 0 598950 0 207856 0 0 0 056 Government 1898548
ROV 57 Rest of the villagesROW 58 Rest o f the world 119230 732013 46810 209767 132654 587542 12590
Total 198496 732013 178716 46810 808717 1898548 340510 1705 3351 587542 12590
54

PAUTI SAM Table (Contd.), Factors Capita External Costs Institutions
transportatio n cost
Forest stock agriculture 1 land
Investment & Savings
HighIncome
MiddleIncome
LowIncome
Poor HighIncome
MiddleIncome
44 45 46 47 48 49 50 51 52 53Activities 1 Wheat
2 Wheat - fodder3 Mustard4 Mustard - fodder5 Mustard - fuelwood6 Cotton7 Cotton - fuelwood8 Other cereals9 Other - fodder10 Oilseeds and pulsesII Pulses - fodder12 Pulses - fuelwood13 Vegetables and fruits14 Cultivated fodder15 Village production16 Livestock & poultry17 Livestock - dung cakesIS Livestock - manure19 Timber collection20 Fuelwood collection21 Leaves & grass collection22 Other ntfp collection23 Village services24 Education25 Infrastructure
All Activities 0 0 0 0 0 0 0 0 0 0Commodities 26 Agricultural 1707976 1202639
27 Non-agricultural items 328449 897342S Services 24692 3540029 Forest products -38659 -15920 -108618 -24915 35338 39733
All Commodities 0 0 0 0 -38659 -15920 •108618 •24915 2096455 1367505Factors 30 Renting land (for share cropping)
31 Fr.mily labour32 Hired labour33 Seeds34 Fertiliser35 Manure36 Pesticides & medicines37 Tractor/ draught animals38 Electricity charges39 Water charges40 Forest Resources41 Fodder42 Construction material43 Stationary44 Transportation cost
All Factors 0 0 0 0 0 0 0 0 0 0Capital 45 Forest stock
46 Agricultural land -340814 -129407 -144771 -2795447 Investment & Savings 1753829 297300
All Capital 0 0 0 0 -340814 -129407 -144771 -27954 1753829 297300Ext. costs 48 High Income (Rs. 10,000 & above) -340814
49 Middle Income (Rs. 5,000 -10,000) -12940750 Low Income (Rs. 2,000-5,000) -14477151 Poor (Below Rs. 2000) -27954
All Ext. Costs 0 0 -642947 0 0 0 0 0 0 0Institutions 52 High Income (Rs. 10,000 & above) 2161767
53 Middle Income (Rs. 5,000 -10,000) 61273054 Low Income (Rs. 2,000-5,000) 41874755 Poor (Below Rs. 2000) 336940
All Households 0 0 0 3530184 0 0 0 0 0 056 Government 1064614 69905 18187
ROV 57 Rest o f the villages 300080 62937ROW 58 Rest o f the world 94042 5440939 2170743
Total 94042 1064614 -642947 3530184 -379473 -145327 -253389 -52869 9661208 3916673
55
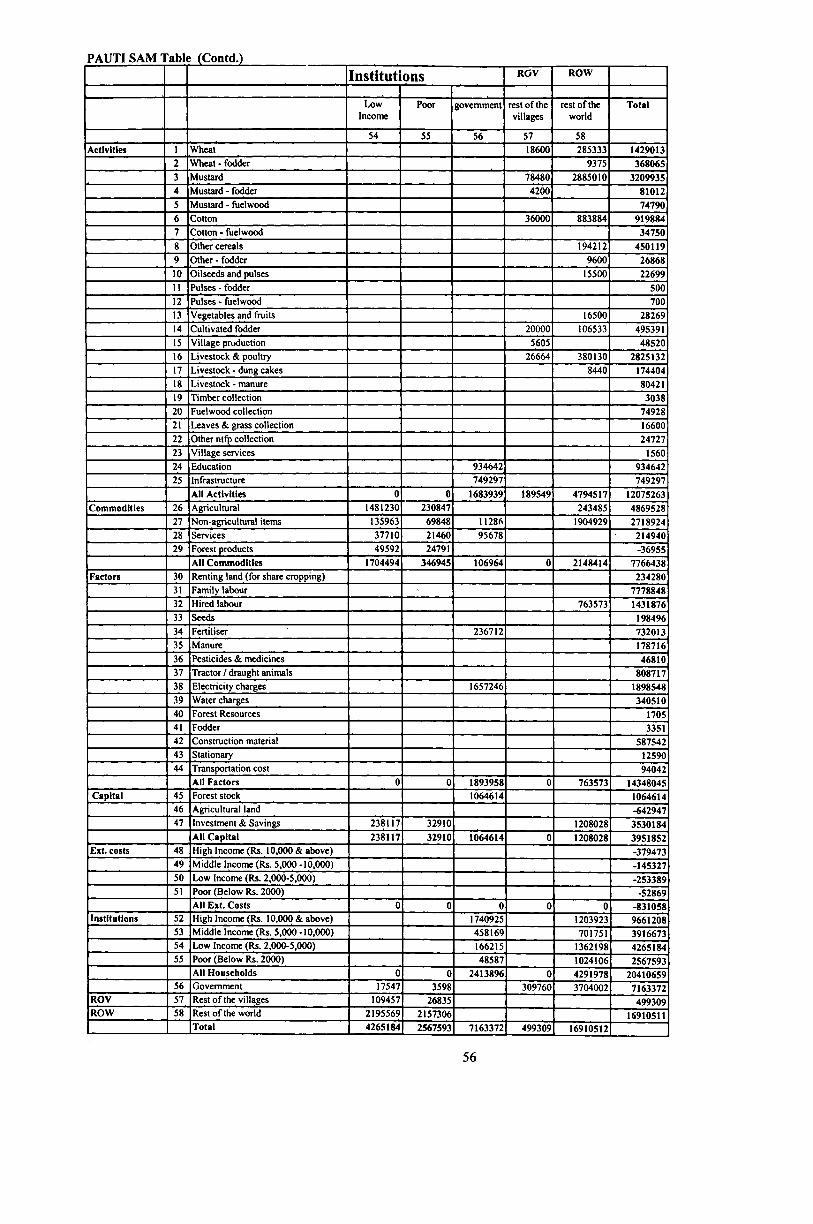
PAUTI SAM Table (Contd.)
Institutions ROV RO W
LowIncome
Poor government rest o f the villages
rest o f the world
T otal
54 55 56 57 58Activities 1 Wheat 18600 285333 1429013
2 W heat - fodder 9375 3680653 M ustard 78480 2885010 32099354 M ustard - fodder 4200 810125 M ustard - fuelwood 747906 Cotton 36000 883884 9198847 Cotton - fuelwood 347508 Other cereals 194212 4501199 Other - fodder 9600 2686810 Oilseeds and pulses 15500 2269911 Pulses - fodder 50012 Pulses - fuelwood 70013 Vegetables and fruits 16500 2826914 Cultivated fodder 20000 106533 49539115 Village production 5605 4852016 Livestock & poultry 26664 380130 282513217 Livestock - dung cakes 8440 17440418 Livestock - manure 8042119 Timber collection 303820 Fuelwood collection 7492821 Leaves & grass collection 1660022 Other ntfp collection 2472723 Village services 156024 Education 934642 93464225 Infrastructure 749297 749297
All Activities 0 0 1683939 189549 4794517 12075263C om m odities 26 Agricultural 1481230 230847 243485 4869528
27 Non-agricultural items 135963 69848 11286 1904929 271892428 Services 37710 21460 95678 21494029 Forest products 49592 24791 -36955
All C om m odities 1704494 346945 106964 0 2148414 7766438Factors 30 Renting land (for share cropping) 234280
31 Family labour 777884832 Hired labour 763573 143187633 Seeds 19849634 Fertiliser 236712 73201335 Manure 17871636 Pesticides & medicines 4681037 Tractor / draught animals 80871738 Electricity charges 1657246 189854839 Water charges 34051040 Forest Resources 170541 Fodder 335142 Construction material 58754243 Stationary 1259044 Transportation cost 94042
All Facto rs 0 0 1893958 0 763573 14348045C apital 45 Forest stock 1064614 1064614
46 Agricultural land -64294747 Investment & Savings 238117 32910 1208028 3530184
All C ap ita l 238117 32910 1064614 0 1208028 3951852Ext. costs 48 High Income (Rs. 10,000 & above) -379473
49 Middle Income (Rs. 5,000 -10,000) -14532750 Low Income (Rs. 2,000-5,000) -25338951 Poor (Below Rs. 2000) -52869
All Ext. Costs 0 0 0 0 0 -831058Institu tions 52 High Income (Rs. 10,000 & above) 1740925 1203923 9661208
53 M iddle Income (Rs. 5 ,000-10,000) 458169 701751 391667354 Low Income (Rs. 2,000-5,000) 166215 1362198 426518455 Poor (Below Rs. 2000) 48587 1024106 2567593
All H ouseholds 0 0 2413896 0 4291978 2041065956 Government 17547 3598 309760 3704002 7163372
ROV 57 Rest o f the villages 109457 26835 499309ROW 58 Rest o f the world 2195569 2157306 16910511
T otal 4265184 2567593 7163372 499309 16910512
56
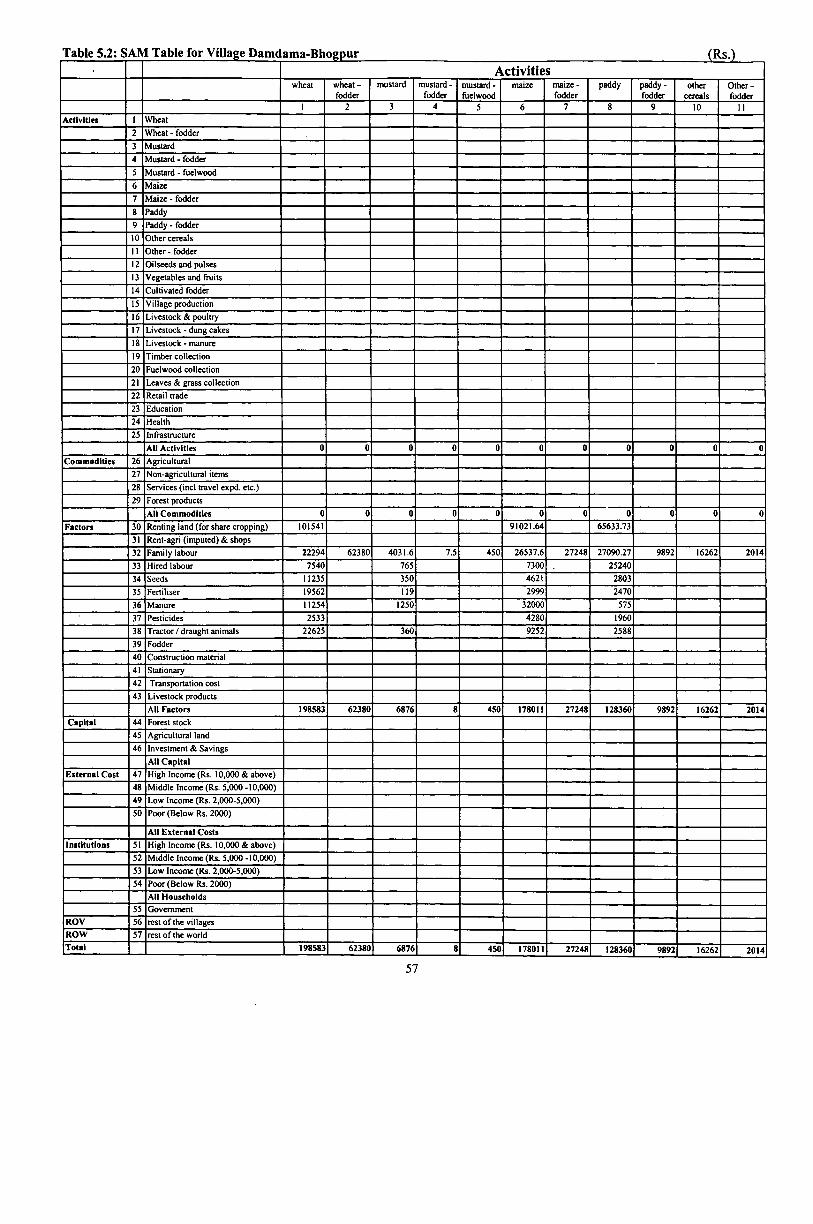
Table 5.2: SAM Table for Village Damdama-Bhogpur_____________________________________________________________(Rs.)' Activities
wheat wheat - fodder
mustard mustard • fodder
mustard - fuelwood
maize maize - fodder
paddy paddy - fodder
othercereals
Other - fodder
1 2 3 4 5 6 7 8 9 10 11Activities I Wheat
2 Wheat - fodder3 Mustard4 Mustard - fodder5 Mustard - fuelwood6 Maize7 Maize - fodder8 Paddy9 Paddy - fodder10 Other cereals11 Other - fodder12 Oilseeds and pulses13 Vegetables and fruits14 Cultivated fodder15 Village production16 Livestock & poultry17 Livestock - dung cakes18 Livestock - manure19 Timber collection20 Fuelwood collection21 Leaves & grass collection22 Retail trade23 Education24 Health25 Infrastructure
Ail Activities 0 0 0 0 0 0 0 0 0 0 0Commodities 26 Agricultural
27 Non-agricultural items28 Services (incl travel expd. etc.)29 Forest products
All Commodities 0 0 0 0 0 0 0 0 0 0 0Factors 30 Renting land (for share cropping) 101541 91021.64 65633.73
31 Rent-agri (imputed) & shops32 Family labour 22294 62380 4031.6 7.5 450 26537.6 27248 27090.27 9892 16262 201433 Hired labour 7540 765 7300 2524034 Seeds 11235 350 4621 280335 Fertiliser 19562 119 2999 247036 Manure 11254 1250 32000 57537 Pesticides 2533 4280 196038 Tractor/ draught animals 22625 360 9252 258839 Fodder40 Construction material41 Stationary42 Transportation cost43 Livestock products
All Factors 198583 62380 6876 8 450 178011 27248 128360 9892 16262 2014Capital 44 Forest stock
45 Agricultural land46 Investment & Savings
All CapitalExternal Cost 47 High Income (Rs. 10,000 & above)
48 Middle Income (Rs. 5,000 -10,000)49 Low Income (Rs. 2,000-5,000)50 Poor (Below Rs. 2000)
AH External CostsInstitutions 51 High Income (Rs. 10,000 & above)
52 Middle Income (Rs. 5,000 -10,000)53 Low Income (Rs. 2,000-5,000)54 Poor (Below Rs. 2000)
All Households55 Government
ROV 56 rest of the villagesROW 57 rest of the worldTotal 198583 62380 6876 8 450 178011 27248 128360 9892 16262 2014
57
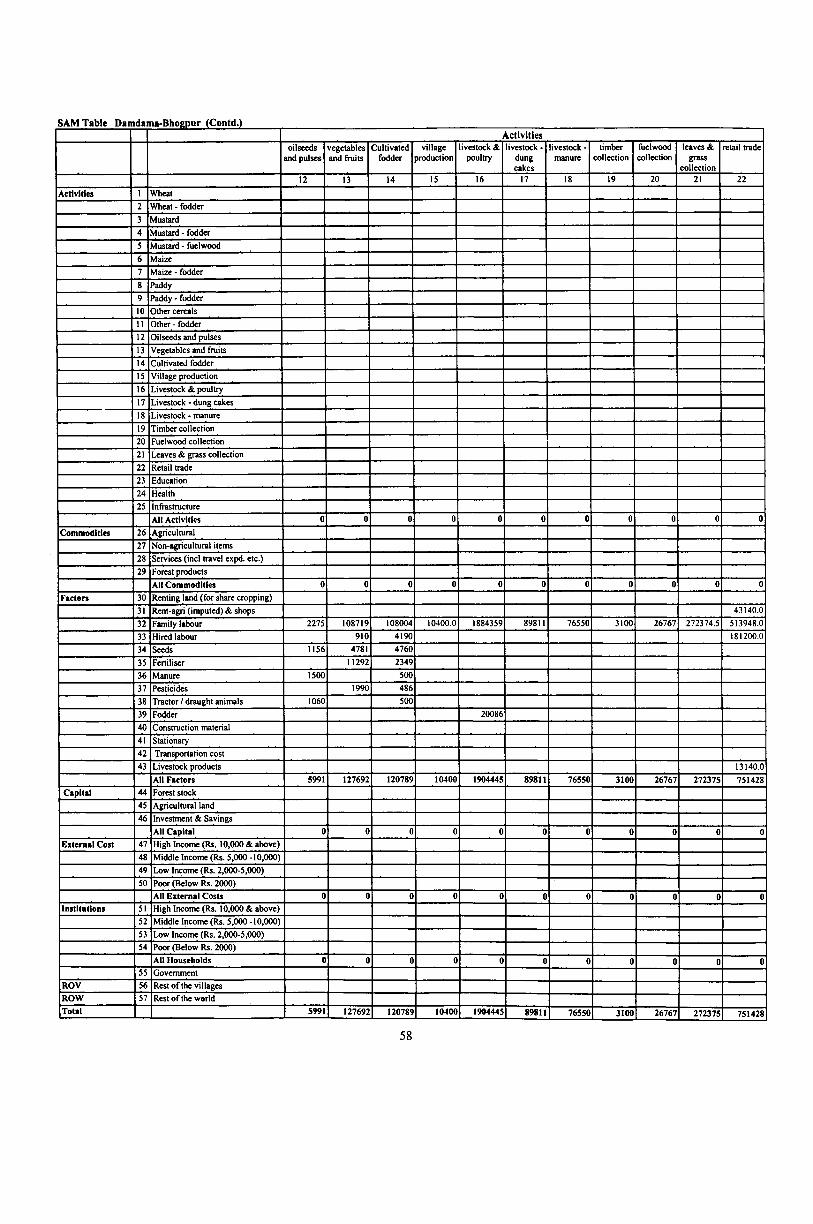
SAM Table Damdama-Bhogpur (Contd.)Activities
oilseeds and pulses
vegetables and fruits
Cultivatedfodder
villageproduction
livestock & poultry
livestock - dung cakes
livestock - manure
timbercollection
fuelwoodcollection
leaves & grass
collection
retail trade
12 13 14 15 16 17 18 19 20 21 22
Activities 1 Wheat2 Wheat - fodder3 Mustard4 Mustard - fodder5 Mustard - fuelwood6 Maize7 Maize • fodder8 Paddy9 Paddy - fodder10 Other cereals11 Other - fodder12 Oilseeds and pulses13 Vegetables and fruits14 Cultivated fodder15 Village production16 Livestock & poultry17 Livestock - dung cakes18 Livestock - manure19 Timber collection20 Fuelwood collection21 Leaves & grass collection22 Retail trade23 Education24 Health25 Infrastructure
All Activities 0 0 0 0 0 0 0 0 0 0 0
Commodities 26 Agricultural27 Non-agricultural items28 Services (incl travel expd. etc.)29 Forest products
All Commodities 0 0 0 0 0 0 0 0 0 0 0Factors 30 Renting land (for share cropping)
31 Rent-agri (imputed) & shops 43140.032 Family labour 2275 108719 108004 10400.0 1884359 89811 76550 3100 26767 272374.5 513948.033 Hired labour 910 4190 181200.034 Seeds 1156 4781 476035 Fertiliser 11292 234936 Manure 1500 50037 Pesticides 1990 48638 Tractor / draught animals 1060 50039 Fodder 2008640 Construction material41 Stationary42 Transportation cost43 Livestock products 13140.0
All Factors 5991 127692 120789 10400 1904445 89811 76550 3100 26767 272375 751428Capital 44 Forest stock
45 Agricultural land46 Investment & Savings
All Capital 0 0 0 0 0 0 0 0 0 0 0External Cost 47 High Income (Rs. 10,000 & above)
48 Middle Income (Rs. 5,000 -10,000)49 Low Income (Rs. 2,000-5,000)50 Poor (Below Rs. 2000)
All External Costs 0 0 0 0 0 0 0 0 0 0 0Institutions 51 High Income (Rs. 10,000 & above)
52 Middle Income (Rs. 5,000 -10,000)53 Low Income (Rs. 2,000-5,000)54 Poor (Below Rs. 2000)
All Households 0 0 0 0 0 0 0 0 0 0 055 Government
ROV 56 Rest of the villagesROW 57 Rest of the worldTotal 5991 127692 120789 10400 1904445 89811 76550 3100 26767 272375 751428
58
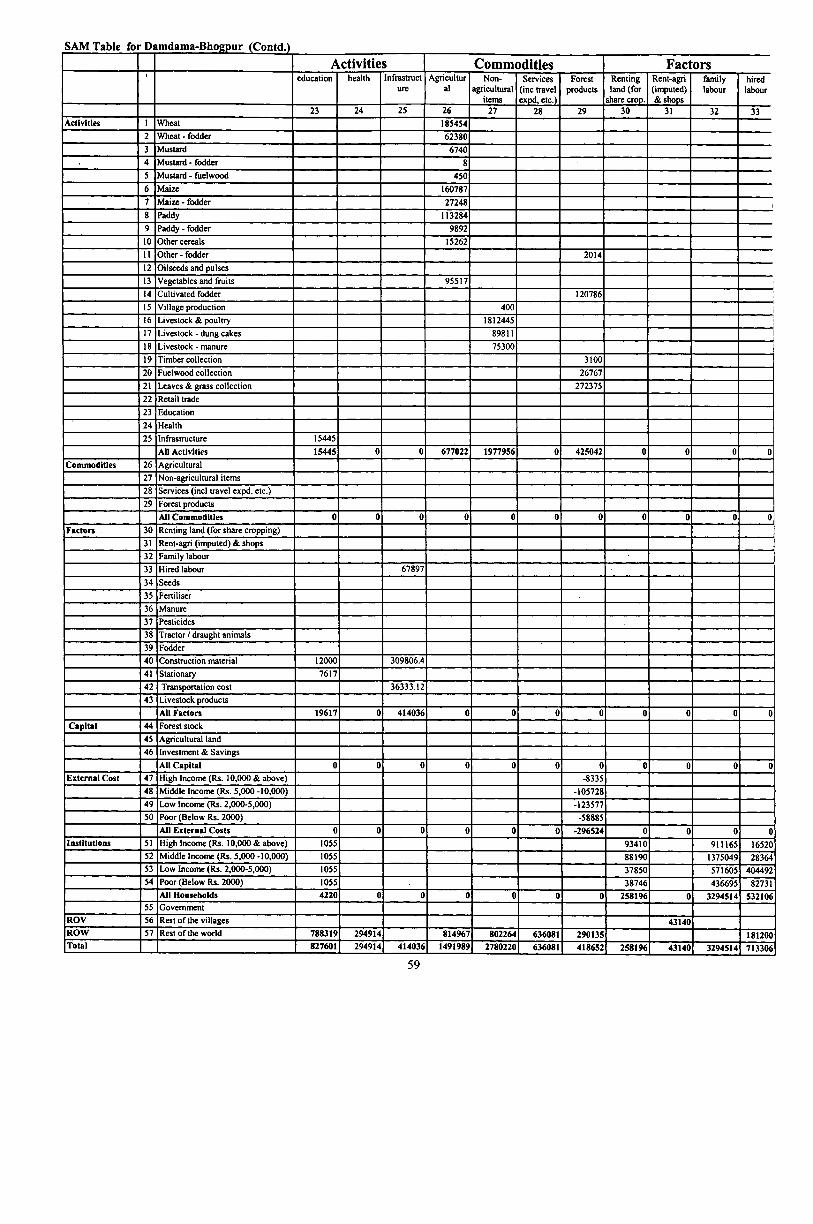
SAM Table for Damdama-Bhogpur (Contd.)Activities Commodities Factors
education health Infrastructure
Agricultural
Non-agricultural
items
Services (inc travel expd, etc.)
Forestproducts
Renting land (for
share crop.
Rent-agri (imputed) & shops
familylabour
hiredlabour
23 24 25 26 27 28 29 30 31 32 33Activities 1 Wheat 185454
2 Wheat - fodder 623803 Mustard 67404 Mustard - fodder 85 Mustard - fuelwood 4506 Maize 1607877 Maize - fodder 27248 i8 Paddy 1132849 Paddy - fodder 989210 Other cereals 1526211 Other - fodder 201412 Oilseeds and pulses13 Vegetables and fruits 9551714 Cultivated fodder 120786 i15 Village production 40016 Livestock & poultry 181244517 Livestock - dung cakes 8981118 Livestock - manure 7530019 Timber collection 310020 Fuelwood collection 2676721 Leaves & grass collection 27237522 Retail trade23 Education24 Health25 Infrastructure 15445
All Activities 15445 0 0 677022 1977956 0 425042 0 0 0 0Commodities 26 Agricultural
27 Non-agricultural items28 Services (incl travel expd. etc.)29 Forest products
All Commodities 0 0 0 0 0 0 0 0 0 0 0Factors 30 Renting land (for share cropping)
31 Rent-agri (imputed) & shops32 Family labour33 Hired labour 6789734 Seeds35 Fertiliser36 Manure37 Pesticides38 Tractor / draught animals39 Fodder40 Construction material 12000 309806.441 Stationary 761742 Transportation cost 36333.1243 Livestock products
All Factors 19617 0 414036 0 0 0 0 0 0 0 0Capital 44 Forest stock
45 Agricultural land46 Investment & Savings
All Capital 0 0 0 0 0 0 0 0 0 0 0External Cost 47 High Income (Rs. 10,000 & above) -8335
48 Middle Income (Rs. 5,000 -10,000) -10572849 Low Income (Rs. 2,000-5,000) -12357750 Poor (Below Rs. 2000) -58885
All External Costs 0 0 0 0 0 0 -296524 0 0 0 0Institutions 51 High Income (Rs. 10,000 & above) 1055 93410 911165 16520
52 Middle Income (Rs. 5,000 -10,000) 1055 88190 1375049 2836453 Low Income (Rs. 2,000-5,000) 1055 37850 571605 40449254 Poor (Below Rs. 2000) 1055 38746 436695 82731
All Households 4220 0 0 0 0 0 0 258196 0 3294514 53210655 Government
ROV 56 Rest o f the villages 43140ROW 57 Rest o f the world 788319 294914 814967 802264 636081 290135 181200Total 827601 294914 414036 1491989 2780220 636081 418652 258196 43140 3294514 713306
59

SAM Table for Damdama-Bhogpur (Contd.)Factors Capital
seeds fertiliser manure pesticides tractor/draughtanimals
Fodder construction
material
stationary transportat ion cost
LivestockProducts
Forest stock
34 35 36 37 38 39 40 41 42 43 44Activities 1 Wheat 13129
2 Wheat - fodder3 Mustard 1364 Mustard - fodder5 Mustard - fuelwood6 Maize 73447 Maize - fodder8 Paddy 10769 Paddy - fodder10 Other cereals 100011 Other - fodder12 Oilseeds and pulses13 Vegetables and fruits 110014 Cultivated fodder 315 Village production16 Livestock & poultry17 Livestock - dung cakes18 Livestock * manure 125019 Timber collection20 Fuelwood collection21 Leaves & grass collection22 Retail trade23 Education24 Health25 Infrastructure
All Activities 23788 0 1250 0 0 0 0 0 0 0 0Commodities 26 Agricultural
27 Non-agricultural items 4582928 Services (incl travel expd. etc.)29 Forest products
All Commodities 0 0 45829 0 0 0 0 0 0 0 0Factors 30 Renting land (for share cropping)
31 Rent-agri (imputed) & shops32 Family labour33 Hired labour34 Seeds35 Fertiliser36 Manure37 Pesticides38 Tractor / draught animals39 Fodder40 Construction material41 Stationary42 Transportation cost43 Livestock products
All Factors 0 0 0 0 0 0 0 0 0 0 0Capital 44 Forest stock
45 Agricultural land46 Investment & Savings
All Capital 0 0 0 0 0 0 0 0 0 0 0External Cost 47 High Income (Rs. 10,000 & above)
48 Middle Income (Rs. 5,000 -10,000)49 Low Income (Rs. 2,000-5,000)50 Poor (Below Rs. 2000)
All External Costs 0 0 0 0 0 0 0 0 0 0 0Institutions 51 High Income (Rs. 10,000 & above) 15620
52 Middle Income (Rs. 5,000 -10,000) 1300 300053 Low Income (Rs. 2,000-5,000) 6463 110054 Poor (Below Rs. 2000) 9040
All Households 0 0 0 0 23383 0 0 0 0 13140 055 Government 12292248
ROV 56 Rest of the villages 13003 7617 36333ROW 57 Rest of the world 5918 71185 11249 20086 321806Total 29706 71185 47079 11249 36385 20086 321806 7617 36333 13140 12292248
60

SAM Table for Damdama-Bhogpur (Contd.)Ca jital External Cost Institutions
agriculture 1 land
Investment & Savings
HighIncome
MiddleIncome
LowIncome
Poor HighIncome
MiddleIncome
Low Income Poor
45 46 47 48 49 50 51 52 53 54Activities 1 Wheat
2 Wheat - fodder3 Mustard4 Mustard • fodder5 Mustard - fuelwood6 Maize7 Maize - fodder8 Paddy9 Paddy • fodder10 Other cerealsU Other - fodder12 Oilseeds and pulses13 Vegetables and fruits14 Cultivated fodder15 Village production16 Livestock & poultry17 Livestock • dung cakes18 Livestock • manure19 Timber collection20 Fuelwood collection21 Leaves & grass collection22 Retail trade23 Education24 Health25 Infrastructure
All Activities 0 0 0 0 0 0 0 0 0 0Commodities 26 Agricultural 263101.5 602302.5 508515.1 118069.6
27 Non-agricultural items 427627.2 1115104.7 836736.94 329446.628 Services (incl travel expd. etc.) 78800 132707 172123 6744029 Forest products -8334.97 -105728 -123577 -58884.7 178758 227803.04 205023.85 103591.4
All Commodities 0 0 -8335 -105728 -123577 -58885 948287 2077917 1722399 618548
Factors 30 Renting land (for share cropping)31 Rent-agri (imputed) & shops32 Family labour33 Hired labour34 Seeds35 Fertiliser36 Manure37 Pesticides38 Tractor / draught animals39 Fodder40 Construction material41 Stationary42 Transportation cost43 Livestock products
All Factors 0 0 0 0 0 0 0 0 0 0Capital 44 Forest stock
45 Agricultural land -49678 -118753 -97788 -3862946 Investment & Savings 900031 602966 132979 20657
All Capital 0 0 -49678 -118753 -97788 -38629 900031 602966 132979 20657External Cost 47 High Income (Rs. 10,000 & above) -49678
48 Middle Income (Rs. 5,000 -10,000) -11875349 Low Income (Rs. 2,000-5,000) -9778850 Poor (Below Rs. 2000) -38629
All External Costs •304849 0 0 0 0 0 0 0 0 0Institutions 51 High Income (Rs. 10,000 & above) 900031
52 Middle Income (Rs. 5,000 -10,000) 60296653 Low Income (Rs. 2,000-5,000) 13297954 Poor (Below Rs. 2000) 20657
All Households 0 1656633 0 0 0 0 0 0 0 055 Government 108820 34835 31391 11869
ROV 56 Rest of the villages 283828 243400 372999 128805ROW 57 Rest of the world 1558935 558942 892218 451210Total -304849 1656633 -58013 -224481 -221365 -97514 3799901 3518060 3151986 1231089
61
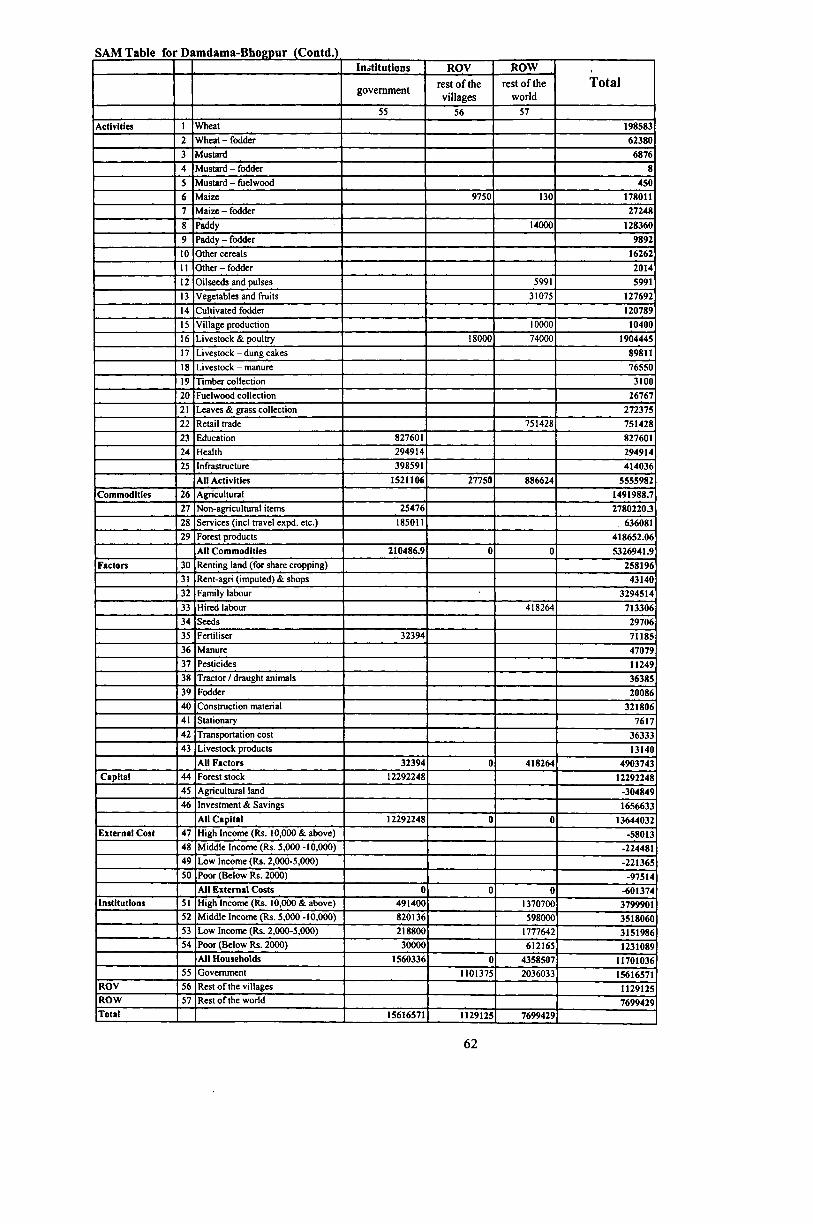
SAM Table for Damdama-Bhogpur (Contd.)In stitu tio n s R O V R O W
Totalg o v e rn m e n t
re s t o f the v illag e s
re s t o f the w orld
55 56 57Activities 1 Wheat 198583
2 Wheat - fodder 623803 Mustard 68764 Mustard - fodder 85 Mustard - fuelwood 4506 Maize 9750 130 1780117 Maize - fodder 272488 Paddy 14000 1283609 Paddy - fodder 989210 Other cereals 16262U Other - fodder 201412 Oilseeds and pulses 5991 599113 Vegetables and fruits 31075 12769214 Cultivated fodder 12078915 Village production 10000 1040016 Livestock & poultry 18000 74000 190444517 Livestock - dung cakes 8981118 Livestock - manure 7655019 Timber collection 310020 Fuelwood collection 2676721 Leaves & grass collection 27237522 Retail trade 751428 75142823 Education 827601 82760124 Health 294914 29491425 Infrastructure 398591 414036
All Activities 1521106 27750 886624 5555982Commodities 26 Agricultural 1491988.7
27 Non-agricultural items 25476 2780220-528 Services (incl travel expd. etc.) 185011 63608129 Forest products 418652.06
All Com m odities 210486.9 0 0 5326941.9Factors 30 Renting land (for share cropping) 258196
31 Rent-agri (imputed) & shops 4314032 Family labour 329451433 Hired labour 418264 71330634 Seeds 2970635 Fertiliser 32394 7118536 Manure 4707937 Pesticides 1124938 Tractor / draught animals 3638539 Fodder 2008640 Construction material 32180641 Stationary 761742 Transportation cost 3633343 Livestock products 13140
All Factors 32394 0 418264 4903743Capital 44 Forest stock 12292248 12292248
45 Agricultural land -30484946 Investment & Savings 1656633
All C apital 12292248 0 0 13644032External Cost 47 High Income (Rs. 10,000 & above) -58013
48 Middle Income (Rs. 5,000 -10,000) -22448149 Low Income (Rs. 2,000-5,000) -22136550 Poor (Below Rs. 2000) -97514
All E x ternal Costs 0 0 0 -601374Institutions 51 High Income (Rs. 10,000 & above) 491400 1370700 3799901
52 Middle Income (Rs. 5,000 -10,000) 820136 598000 351806053 Low Income (Rs. 2,000-5,000) 218800 1777642 315198654 Poor (Below Rs. 2000) 30000 612165 1231089
All H ouseholds 1560336 0 4358507 1170103655 Government 1101375 2036033 15616571
ROV 56 Rest o f the villages 1129125ROW 57 Rest o f the world 7699429Total 15616571 1129125 7699429
62

6. Multiplier-based Analysis
The transaction matrices o f estimated SAMs for the two villages o f Pauti and Damdama-Bhogpur
presented in the previous chapter give the structure of the village economy. These transaction matrices are
used to examine the intersectoral linkages in the village economy in terms of multipliers that will be
generated from a flow of resources into each o f the endogenous elements of the SAM. It may be recalled
that the multiplier gives the total direct and indirect effects of any exogenous injections on the
endogenous accounts of the SAM.
6.1 Accounting Multipliers:
The accounting multipliers are an indicator of the income generating capacity, i.e., they give the
change in income in other sectors of the economy due to a unit injection in a given sector. Thus, the
multipliers are a good measure of linkages of a sector with the rest of the economy. For deriving the
accounting multipliers the transaction matrix is converted into a matrix of average expenditure
propensities by dividing each element in the endogenous transaction sub-matrix by its respective column
total. The accounting multiplier thus calculated assumes that the various average expenditure propensities
hold for incremental increases in demand generated by some exogenous change. That is, it assumes that
the average expenditure behaviour will prevail at the margin and consequently all household income and
expenditure elasticities of demand for goods are identical and equal to one5. Tables 6.1 and 6.2 give a
shortened version of the accounting multipliers derived from the transaction matrices for the two villages
Pauti and Damdama-Bhogpur respectively.
The multipliers recorded in the wheat column in Table 6.1, for Pauti, indicate that an injection of
one unit of resource to the sector (i.e., the what sector) generates 1.044 units in the sector itself, 0.035 in
cultivated fodder sector and 0.075 in livestock & poultry sector. This one unit injection in the wheat
sector also results in an increase in 0.003 units of output of fuelwood collection sector. The entire village
production registers an increase of 1.209 units due to one unit resource injection in the wheat sector. This
transfer also generates household income of 0.817 units, but most of this increase in income accrues to the
High-Income class. Thus the richest group of household comprising high-income class and middle-
income class benefits the most from wheat production. The own sector multiplier of wheat sector is the
highest (1.044) among the activities of the village.
5 The income elasticity of demand of socio-economic group h for product i ( E hi) is equal to the ratio of
corresponding marginal expenditure propensity (MEPhi) to the corresponding average expenditure propensity
( AEPhi). That is, E hi=MEPhi / AEPhi and therefore E hi= 1 if MEPhi= AEPhi.
63

Compared to many agricultural production activities of the village, forest sector activity generates
a higher production multiplier of 1.197 in the village economy. Despite having a lower own multiplier,
the forest sector’s linkage with the other activities of the village is high as compared to most of the
agricultural activities.
In Pauti we see (refer to Table 6.1) that the household income multipliers are lower for
agricultural activities ranging between 0.817 (for wheat) and 0.992 (for cultivated fodder). But for
activities like village production, village services, forest products and livestock & poultry the household
multipliers are relatively higher vis-a-vis those for agricultural activities. In fact for forest products and
village services they are the highest in the village (1.161 for both these activities). Thus a transfer of one
unit in the forest product sector generates household income of 1.161 units. Although the poor household
groups also benefit from such an increased income, most of the benefits accrue to the richest group in the
village.
Considering the income linkages generated from the transfer of resources to each of the
household groups in the village we see from Table 6.1 that the transfer to low-income group in the
villages induces the highest production and income multipliers in the village economy. This is mainly due
to the structure of demand among the household groups in the village. The low-income group spends a
large part of its income on locally produced agricultural goods as compared to the other three household
groups in the village which spend a relatively higher proportion of their income on non-agricultural goods
with higher import content. This is indicative of the fact that any social transfer programme and
intervention will have the strongest effect on inducing local production and incomes if directed to the
low-income group which consume more of locally produced goods as their income increases.
The accounting multiplier for Damdama-Bhogpur village is given in Table 6.2. From the table it
is evident that the total production multiplier is the highest in case of mustard (1.497). Thus an injection
of one unit of resource to this sector generates 1.497 units in the entire village production of which 1.001
unit is generated in the mustard sector itself while the remaining 0.496 units are generated in other
sectors. Despite having a very low own sector multiplier, mustard cultivation activity has the highest total
production multiplier because of its high linkages with other sectors. Even maize which is one of the
major crops in the village has a high total production multiplier along with a similar own sector
multiplier. Its linkage with the other village activities is also high (0.438). One unit injection in the maize
production will generate household income of 1.164 units, but most of the increase in income will accrue
to the high-income class and middle-income class in the village. Thus the richest two household groups,
high-income class and middle-income class, will benefit the most from maize cultivation, although the
poorer two groups will also have their incomes increased due to this injection into the maize activity.
64
As compared to agricultural production activities exception being maize and mustard production
of the village, forest sector activity generates a higher production multiplier o f 1.372. Despite having the
lowest own sector multiplier, the forest sector’s linkage with the other activities of the village is also quite
high.
Just as in Pauti, the household income multipliers in Damdama-Bhogpur as can be seen from
Table 6.2 are lower for agricultural activities ranging between 1.069 (for wheat) and 1.289 (for cultivated
fodder). The exception to such a feature is the other cereals group which has the highest household
income multiplier. Other village activities such as village production, forest products and livestock &
poultry have household income multipliers that are relativeiy higher vis-a-vis those for agricultural
activities. In fact for forest products, village production and other cereals the household income
multipliers are the highest in the village (1.354 for these three activities). Thus a transfer o f one unit in the
forest product sector generates household income of 1.354 units. Although the poor household group do
benefit from this transfer, most of the benefits accrue to the middle-income and high-income class in this
village.
While considering the income linkages generated from the transfer of resources to each of the
household groups in the village it is evident from Table 6.2 that any transfer to the middle and low-
income groups in the village would induce high production and income multipliers in the village
economy. This is mainly due to the structure of demand among the household groups in the village. The
middle and low-income groups spend a large part of their incomes on locally produced agricultural goods
as compared to the other two household groups in the village. Such a result indicates that any social
transfer programmes and interventions will have the strongest effect on inducing local production and
incomes if directed to the middle and low-income groups which consume more of locally produced goods
as their income increases.
65
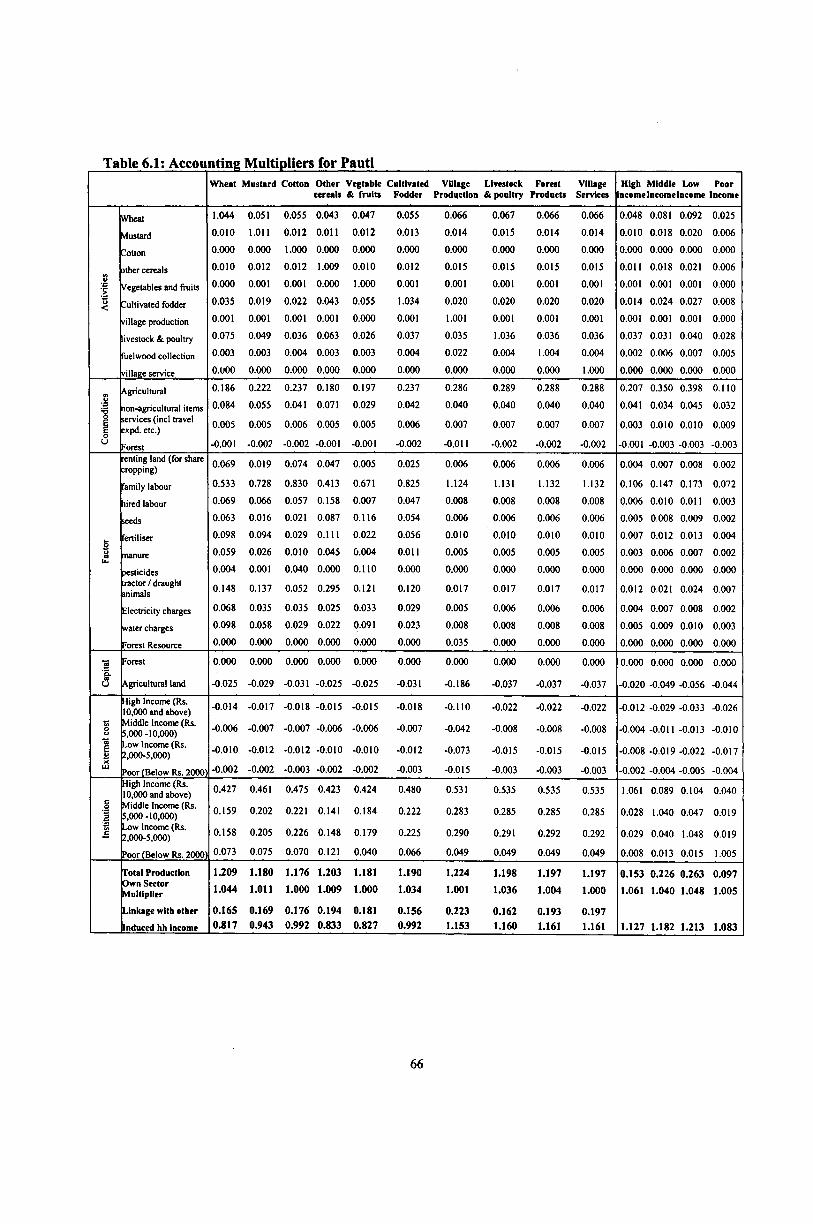
Table 6.1: Accounting Multipliers for PautiW heat M ustard Cotton O ther Vegtable Cultivated
cereals & fruits FodderVillage Livestock
Production & poultryForest
ProductsVillage
ServicesHigh M iddle Low Poor
Income Income Income Income
Wheat 1.044 0.051 0.055 0.043 0.047 0.055 0.066 0.067 0.066 0.066 0.048 0.081 0.092 0.025
Mustard 0.010 1.011 0.012 0.011 0.012 0.013 0.014 0.015 0.014 0.014 0.010 0.018 0.020 0.006
Cotton 0.000 0.000 1.000 0.000 0.000 0.000 0.000 0.000 0.000 0.000 0.000 0.000 0.000 0.000
other cereals 0.010 0.012 0.012 1.009 0.010 0.012 0.015 0.015 0.015 0.015 0.011 0.018 0.021 0.006u'C Vegetables and fruits 0.000 0.001 0.001 0.000 1.000 0.001 0.001 0.001 0.001 0.001 0.001 0.001 0.001 0.000
u< Cultivated fodder 0.035 0.019 0.022 0.043 0.055 1.034 0.020 0.020 0.020 0.020 0.014 0.024 0.027 0.008
village production 0.001 0.001 0.001 0.001 0.000 0.001 1.001 0.001 0.001 0.001 0.001 0.001 0.001 0.000
livestock & poultry 0.075 0.049 0.036 0.063 0.026 0.037 0.035 1.036 0.036 0.036 0.037 0.031 0.040 0.028
fuelwood collection 0.003 0.003 0.004 0.003 0.003 0.004 0.022 0.004 1.004 0.004 0.002 0.006 0.007 0.005
village service O.UOO 0.000 0.000 0.000 0.000 0.000 0.000 0.000 0.000 1.000 0.000 0.000 0.000 0.000
vt Agricultural 0.186 0.222 0.237 0.180 0.197 0.237 0.286 0.289 0.288 0.288 0.207 0.350 0.398 0.110V
■G non-agricultural items 0.084 0.055 0.041 0.071 0.029 0.042 0.040 0.040 0.040 0.040 0.041 0.034 0.045 0.032
u
services (incl travel cxpd. etc.)
Forest
0.005
-0.001
0.005
-0.002
0.006
-0.002
0.005
-0.001
0.005
-0.001
0.006
-0.002
0.007
-0.011
0.007
-0.002
0.007
-0.002
0.007
-0.002
0.003
-0.001
0.010
-0.003
0.010
-0.003
0.009
-0.003renting land (for share :ropping) 0.069 0.019 0.074 0.047 0.005 0.025 0.006 0.006 0.006 0.006 0.004 0.007 0.008 0.002
family labour 0.533 0.728 0.830 0.413 0.671 0.825 1.124 1.131 1.132 1.132 0.106 0.147 0.173 0.072
hired labour 0.069 0.066 0.057 0.158 0.007 0.047 0.008 0.008 0.008 0.008 0.006 0.010 0.011 0.003
seeds 0.063 0.016 0.021 0.087 0.116 0.054 0.006 0.006 0.006 0.006 0.005 0.008 0.009 0.002
t fertiliser 0.098 0.094 0.029 0.111 0.022 0.056 0.010 0.010 0.010 0.010 0.007 0.012 0.013 0.0040| manure 0.059 0.026 0.010 0.045 0.004 0.011 0.005 0.005 0.005 0.005 0.003 0.006 0.007 0.002
pesticides 0.004 0.001 0.040 0.000 0.110 0.000 0.000 0.000 0.000 0.000 0.000 0.000 0.000 0.000tractor / draught animals 0.148 0.137 0.052 0.295 0.121 0.120 0.017 0.017 0.017 0.017 0.012 0.021 0.024 0.007
Electricity charges 0.068 0.035 0.035 0.025 0.033 0.029 0.005 0.006 0.006 0.006 0.004 0.007 0.008 0.002
water charges 0.098 0.058 0.029 0.022 0.091 0.023 0.008 0.008 0.008 0.008 0.005 0.009 0.010 0.003
Forest Resource 0.000 0.000 0.000 0.000 0.000 0.000 0.035 0.000 0.000 0.000 0.000 0.000 0.000 0.000
1Forest 0.000 0.000 0.000 0.000 0.000 0.000 0.000 0.000 0.000 0.000 0.000 0.000 0.000 0.000
«CJ Agricultural land -0.025 -0.029 -0.031 -0.025 -0.025 -0.031 -0.186 -0.037 -0.037 -0.037 -0.020 -0.049 -0.056 -0.044
ou*5|
High Income (Rs. 10,000 and above) Middle Income (Rs.5.000-10,000)Low Income (Rs.2.000-5,000)
-0.014
-0.006
-0.010
-0.017
-0.007
-0.012
-0.018
-0.007
-0.012
-0.015
-0.006
-0.010
-0.015
-0.006
-0.010
-0.018
-0.007
-0.012
-0.110
-0.042
-0.073
-0.022
-0.008
-0.015
-0.022
-0.008
-0.015
-0.022
-0.008
-0.015
-0.012 -0.029
-0.004 -0.011
-0.008 -0.019
-0.033
-0.013
-0.022
-0.026
-0.010
-0.017
UiPoor (Below Rs. 2000) -0.002 -0.002 -0.003 -0.002 -0.002 -0.003 -0.015 -0.003 -0.003 -0.003 -0.002 -0.004 -0.005 -0.004
Inst
itutio
n
High Income (Rs. 10,000 and above) Middle Income (Rs.5.000-10,000)Low Income (Rs.2.000-5,000)
0.427
0.159
0.158
0.461
0.202
0.205
0.475
0.221
0.226
0.423
0.141
0.148
0.424
0.184
0.179
0.480
0.222
0.225
0.531
0.283
0.290
0.535
0.285
0.291
0.535
0.285
0.292
0.535
0.285
0.292
1.061
0.028
0.029
0.089
1.040
0.040
0.104
0.047
1.048
0.040
0.019
0.019
Poor (Below Rs. 2000! 0.073 0.075 0.070 0.121 0.040 0.066 0.049 0.049 0.049 0.049 0.008 0.013 0.015 1.005
Total Production 1.209 1.180 1.176 1.203 1.181 1.190 1.224 1.198 1.197 1.197 0.153 0.226 0.263 0.097Own Sector Multiplier 1.044 1.011 1.000 1.009 1.000 1.034 1.001 1.036 1.004 1.000 1.061 1.040 1.048 1.005
Linkage with other 0 .165 0.169 0.176 0.194 0.181 0.156 0.223 0.162 0.193 0.197
Induced hh Income 0.817 0.943 0.992 0.833 0.827 0.992 1.153 1.160 1.161 1.161 1.127 1.182 1.213 1.083
66

Table 6.2: Accounting Multipliers for Damdama-BhogpurWheat mustard Maize paddy Other vegetable Cultivated Village Livestock Forest High Middle Low Poor
Cereals fodder Production poultry Products Income Income Income Income
Wheat 1.043 0.044 0.031 0.031 0.023 0.038 0.040 0.023 0.023 0.023 0.012 0.030 0.028 0.019
vlustard 0.001 1.001 0.001 0.001 0.001 0.001 0.001 0.001 0.001 0.001 0.000 0.001 0.001 0.001
4aize 0.029 0.030 1.023 0.023 0.020 0.027 0.029 0.020 0.020 0.020 0.010 0.026 0.024 0.016
CO4)Paddy 0.012 0.014 0.012 1.013 0.014 0.013 0.014 0.014 0.013 0.014 0.007 0.018 0.016 0.011
other cereals 0.003 0.003 0.002 0.002 1.002 0.003 0.003 0.002 0.002 0.002 0.001 0.002 0.002 0.002
o Vegetables and fruits 0.011 0.012 0.010 0.011 0.011 1.012 0.012 0.011 0.011 0.011 0.006 0.015 0.014 0.009< Cultivated fodder 0.011 0.012 0.012 0.013 0.014 0.013 1.014 0.014 0.014 0.014 0.010 0.016 0.015 0.018
Village production 0.000 0.000 0.000 0.000 0.000 0.000 0.000 1.000 0.000 0.000 0.000 0.000 0.000 0.000
livestock & poultry 0.202 0.306 0.296 0.195 0.219 0.195 0.213 0.219 1.217 0.219 0.104 0.281 0.239 0.236
Fuelwood collection 0.002 0.003 0.003 0.003 0.003 0.003 0.003 0.003 0.003 1.003 0.002 0.003 0.003 0.004
V) Agricultural 0.133 0.154 0.147 0.156 0.177 0.156 0.169 0.177 0.176 0.177 0.093 0.229 0.212 0.145
•6 non-agricultural items 0.310 0.470 0.455 0.299 0.336 0.299 0.327 0.336 0.332 0.336 0.159 0.432 0.367 0.363o
o
services (incl travel expd. etc.) 0.040 0.046 0.044 0.047 0.052 0.046 0.050 0.052 0.051 0.052 0.028 0.055 0.070 0.069
U Forest 0.038 0.043 0.042 0.044 0.049 0.044 0.047 0.049 0.049 0.049 0.034 0.054 0.052 0.063renting land (for share cropping) 0.555 0.045 0.545 0.545 0.029 0.040 0.043 0.029 0.029 0.029 0.015 0.038 0.035 0.024
vr r O/Rent (Agri land & shops)
0.000 0.000 0.000 0.000 0.000 0.000 0.000 0.000 0.000 0.000 0.000 0.000 0.000 0.000
family labour 0.404 1.001 0.547 0.498 1.318 1.140 1.209 1.318 1.304 1.318 0.163 0.400 0.349 0.344
o hired labour 0.044 0.117 0.046 0.202 0.005 0.013 0.041 0.005 0.005 0.005 0.003 0.006 0.006 0.004oC3 Seeds 0.061 0.055 0.030 0.025 0.003 0.042 0.044 0.003 0.003 0.003 0.002 0.004 0.004 0.003
Fertilizer 0.105 0.024 0.022 0.024 0.004 0.094 0.026 0.004 0.004 0.004 0.002 0.005 0.005 0.004
Manure 0.065 0.190 0.186 0.011 0.005 0.007 0.012 0.005 0.005 0.005 0.003 0.007 0.006 0.004
Pesticides 0.014 0.002 0.025 0.017 0.001 0.017 0.006 0.001 0.001 0.001 0.001 0.002 0.001 0.001
tractor / draught animals 0.121 0.059 0.057 0.025 0.004 0.006 0.011 0.004 0.004 0.004 0.002 0.005 0.005 0.003
IForest 0.000 0.000 0.000 0.000 0.000 0.000 0.000 0.000 0.000 0.000 0.000 0.000 0.000 0.000
«"u Agricultural land -0.028 -0.031 -0.031 -0.032 -0.036 -0.032 -0.034 -0.036 -0.036 -0.036 -0.025 -0.039 -0.038 -0.046
(Ao
High Income (Rs. 10,000 and above) -0.005 -0.006 -0.006 -0.006 -0.007 -0.006 -0.007 -0.007 -0.007 -0.007 -0.005 -0.008 -0.007 -0.009
O13e
Middle Income (Rs. 5,000-10,000)
-0.021 -0.023 -0.023 -0.024 -0.027 -0.023 -0.025 -0.027 -0.026 -0.027 -0.018 -0.029 -0.028 -0.034c0)£
Low Income (Rs. 2,000- 5,000) -0.020 -0.023 -0.022 -0.023 -0.026 -0.023 -0.025 -0.026 -0.026 -0.026 -0.018 -0.029 -0.028 -0.033
w Poor (Below Rs. 2000) -0.009 -0.010 -0.010 -0.010 -0.012 -0.010 -0.011 -0.012 -0.011 -0.012 -0.008 -0.013 -0.012 -0.015
cHigh Income (Rs. 10,000 and above) 0.365 0.321 0.374 0.350 0.377 0.333 0.355 0.377 0.373 0.377 1.052 0.127 0.111 0.105
0
1Middle Income (Rs. 5,000-10,000)
0.364 0.440 0.418 0.403 0.560 0.490 0.521 0.560 0.555 0.560 0.073 1.180 0.158 0.152
tsj s
Low Income (Rs. 2,000- 5,000) 0.198 0.257 0.211 0.285 0.237 0.212 0.241 0.237 0.234 0.237 0.032 0.079 1.070 0.066
Poor (Below Rs. 2000) 0.142 0.153 0.160 0.171 0.180 0.159 0.171 0.180 0.178 0.180 0.024 0.059 0.052 1.050
T o ta l P ro d u c tio n 1.370 1.497 1.461 1.349 1.372 1.361 1.392 1.372 1.369 1.372 0.192 0.470 0.413 0.390O w n sec to r m u ltip lie r
1.043 1.001 1.023 1.013 1.002 1.012 1.014 1.000 1.217 1.000 1.032 1.180 1.070 1.050
L in k ag e w ith o th e r 0.327 0.496 0.438 0.336 0.370 0.349 0.378 0.372 0.152 037 2
In d u c e d h h in c o m e 1.069 1.172 1.164 1.210 1.354 1.194 1.289 1 J 5 4 1339 1.354 1.182 1.446 1.391 1373
67

The accounting multipliers discussed above assume that various expenditure propensities hold for
incremental demand generated by exogenous change. In other words, it is assumed that the average
expenditure propensity is equal to the one at the margin. This implies that all household income and
expenditure elasticities for goods are identical and equal to one. Such an assumption may not hold in most
cases and there is a need for incorporating marginal expenditure propensities into the analysis. The fixed
price multipliers generated after such replacement is taken into account for assessing their impact on the
village economy. The marginal expenditure propensities obtained for the villages of Pauti and Damdama-
Bhogpur through an estimation of linear expenditure system (LES) are presented in Tables 6.3 and 6.4
below along with the average expenditure propensities.
It may be noted that in Pauti, the marginal expenditure propensities of low-income class and poor
have been treated as equal in the study. The number poor income class households in the village is small
and estimation of the expenditure propensity for this group produced perverse results. An estimation of
the LES was, therefore, carried out by merging the group with low-income class households.
Table 6.3: Average and Marginal Expenditure Propensities for Pauti
Commodity Households Groups
Group High Income Class Middle Income Class Low Income Class PoorAEP MEP AEP MEP AEP MEP AEP MEP
Agriculture 0.17679 0.03676 0.30706 0.36097 0.34728 0.34434 0.08991 0.34434
Non-agriculture 0.03400 0.38520 0.02291 0.58329 0.03188 0.55731 0.02720 0.55731
Services 0.00256 0.01157 0.00904 0.00122 0.00884 0.00165 0.00836 0.00165
Forest 0.00366 0.00057 0.01014 0.00034 0.01163 0.00107 0.00966 0.00107
Savings 0.18153 0.18973 0.07591 0.00937 0.05583 0.00941 0.01282 0.00941
Rest of Villages 0.03106 0.13707 0.01607 0.00142 0.02566 0.00074 0.01045 0.00074
Rest of World 0.56317 0.23910 0.55423 0.04340 0.51477 0.08548 0.84021 0.08548Note: (i) The marginal propensities are estimated from a linear expenditure system equations, (ii) the AEP and MEP in the table stand for average expenditure propensity and marginal expenditure propensity.
68

Table 6.4: Average and Marginal Expenditure Propensities for Damdama-BhogpurCommodity ____________________________Households Groups
High Income Class Middle Income Class Low Income Class PoorAEP MEP AEP MEP AEP MEP AEP MEP
Agriculture 0.06924 0.00938 0.17120 0.08896 0.16133 0.37195 0.09591 0.07503
Non-agriculture 0.11254 0.32214 0.31697 0.12411 0.26546 0.12986 0.26761 0.04530
Services 0.02074 0.00090 0.03772 0.00272 0.05461 0.00906 0.05478 0.02877
Forest 0.04704 0.01094 0.06475 0.00448 0.06505 0.14262 0.08415 0.19560
Savings 0.23686 0.20037 0.17139 0.64254 0.04219 0.05581 0.01678 0.03191
Rest of Villages 0.07469 0.00924 0.06919 0.04247 0.11834 0.09479 0.10463 0.02457
Rest of World 0.41026 0.44702 0.15888 0.09472 0.28307 0.19591 0.36651 0.59882
Note: (i) the marginal propensities are estimated from a linear expenditure system equations, (ii) the AEP and MEP in the table stand for average expenditure propensity and marginal expenditure propensity.
It may be useful to point out that the fixed price multipliers are derived on the assumption of
excess capacity prevailing in all the sectors of the village economy. Such an assumption is unrealistic
when applied to agriculture and forest sectors. So the present analysis assumes that the agriculture and
forest sectors are supply constrained while excess capacity prevails in the remaining sectors of the village
economy. Incorporating supply constraints in agriculture and forest sectors we derive mixed multipliers.
Tables 6.5 through 6.8 give the fixed price and mixed multipliers for the two villages of Pauti and
Damdama-Bhogpur in Haryana.
From Table 6.5 we see for Pauti, that a Re. 1 increase in the production of forest products results
in Rs. 2.379 increase in the total production in the village of which its own production increases by Rs.
1.001 while the output of other sectors increases by only Rs. 1.378. The corresponding increase in the
production of forest product results in Rs. 2.317 increase in household income. Existence of excess
capacity in the agriculture and forest sectors activities being unrealistic, a unit increase in the demand for
their product will not be met as these sectors are supply constrained and the matching increase in output
will not take place. The increased demand for their products have to be met by sources outside the village
thereby resulting in leakage of resources from the village economy. As can be seen from Table 6.6, a Re.
1 increase in the supply of forest products will result in Rs. 0.420 increase in total village production of
which the sector’s own production would increase by Rs. 1.000, while the output of other sectors would
increase by Rs. -0.580, i.e., there is a decline o f the induced output production. As compared to the fixed
price multiplier where the household income increases by Rs. 2.317, the mixed multiplier household
income increases by Rs. 1.007 in response to Re. 1 increase in the supply of forest products. Thus we see
69

that as a result of imposition of supply constraints on the forest sector the resultant increase in village
output will be less vis-a-vis the scenario observed in the existence of excess capacity.
Table 6.5: Fixed Price Multipliers for PautiW heat M ustard Cotton O ther Vegtables Cultivated Village Livestock Forest Village High M iddle Low Poor
cereals & fruits Fodder production & poultry Products Services Income income income Income
wheat 1.074 0.088 0.093 0.077 0.076 0.093 0.110 0.111 0.111 0.111 0.053 0.164 0.156 0.156
mustard 0.017 1.019 0.021 0.018 0.018 0.021 0.024 0.024 0.024 0.024 0.011 0.036 0.034 0.034
Cotton 0.000 0.000 1.000 0.000 0.000 0.000 0.000 0.000 0.000 0.000 0.000 0.000 0.000 0.000
other cereals 0.017 0.020 0.021 1.017 0.017 0.021 0.025 0.025 0.025 0.025 0.012 0.037 0.036 0.036
vegetables and fruits 0.001 0.001 0.001 0.001 1.001 0.001 0.001 0.001 0.001 0.001 0.001 0.002 0.002 0.002
Cultivated fodder 0.044 0.030 0.034 0.053 0.063 1.046 0.033 0.033 0.033 0.033 0.016 0.049 0.047 0.047
village production 0.013 0.015 0.015 0.013 0.012 0.015 1.018 0.018 0.018 0.018 0.013 0.022 0.021 0.021
livestock & poultry 0.739 0.828 0.860 0.749 0.699 0.858 0.998 2.005 1.006 1.006 0.744 1.255 1.200 1.200
fuelwood collection 0.001 0.001 0.001 0.001 0.001 0.001 0.018 0.001 1.001 0.001 0.001 0.001 0.001 0.001
village service 0.000 0.000 0.000 0.000 0.000 0.000 0.000 0.000 0.000 1.000 0.000 0.000 0.000 0.000
Agricultural 0.318 0.380 0.404 0.331 0.324 0.401 0.477 0.482 0.481 0.481 0.229 0.710 0.678 0.678
non-agricultural items 0.831 0.930 0.966 0.842 0.786 0.964 1.122 1.130 1.131 1.131 0.837 1.411 1.349 1.349services (incl travel expd. etc.) 0.010 0.012 0.012 0.011 0.010 0.012 0.014 0.014 0.014 0.014 0.017 0.012 0.012 0.012
Forest 0.000 0.000 0.000 0.000 0.000 0.000 -0.009 -0.001 -0.001 -0.001 0.000 -0.001 -0.001 -0.001
'enting land (for share :ropping) 0.072 0.023 0.077 0.050 0.007 0.029 0.009 0.009 0.009 0.009 0.004 0.014 0.013 0.013
family labour 1.311 1.641 1.795 1.220 1.458 1.787 2.251 2.266 2.268 2.268 0.901 1.615 1.544 1.544
hired labour 0.073 0.070 0.062 0.162 0.011 0.051 0.014 0.014 0.014 0.014 0.006 0.020 0.019 0.019
seeds 0.066 0.020 0.025 0.090 0.119 0.058 0.010 0.011 0.011 0.011 0.005 0.016 0.015 0.015
fertiliser 0.102 0.100 0.034 0.116 0.027 0.061 0.016 0.016 0.016 0.016 0.008 0.024 0.023 0.023
manure 0.061 0.028 0.013 0.048 0.006 0.014 0.008 0.008 0.008 0.008 0.004 0.012 0.011 0.011
pesticides 0.004 0.001 0.040 0.000 0.110 0.001 0.001 0.001 0.001 0.001 0.000 0.001 0.001 0.001
tractor / draught animals 0.156 0.146 0.062 0.304 0.129 0.130 0.029 0.029 0.029 0.029 0.014 0.042 0.040 0.040
Electricity charges 0.071 0.038 0.038 0.028 0.036 0.032 0.009 0.009 0.009 0.009 0.004 0.014 0.013 0.013
water charges0.101 0.062 0.033 0.026 0.095 0.027 0.013 0.013 0.013 0.013 0.006 0.019 0.018 0.018
Forest Resource0.000 0.001 0.001 0.000 0.000 0.001 0.036 0.001 0.001 0.001 0.000 0.001 0.001 0.001
Forest 0.000 0.000 0.000 0.000 0.000 0.000 0.000 0.000 0.000 0.000 0.000 0.000 0.000 0.000
Agricultural land-0.006 -0.007 -0.008 -0.007 -0.006 -0.008 -0.159 -0.009 -0.009 -0.009 -0.007 -0.010 -0.012 -0.012
High Income (Rs. 10,000 and above) -0.004 -0.004 -0.005 -0.004 -0.004 -0.005 -0.094 -0.005 -0.005 -0.005 -0.004 -0.006 -0.007 -0.007
Middle Income (Rs. 5,000-10,000) -0.001 -0.002 -0.002 -0.002 -0.001 -0.002 -0.036 -0.002 -0.002 -0.002 -0.002 -0.002 -0.003 -0.003
Low Income (Rs. 2,000- 5,000) -0.003 -0.003 -0.003 -0.003 -0.003 -0.003 -0.062 -0.004 -0.004 -0.004 -0.003 -0.004 -0.005 -0.005
Poor (Below Rs. 2000) -0.001 -0.001 -0.001 -0.001 -0.001 -0.001 -0.013 -0.001 -0.001 -0.001 -0.001 -0.001 -0.001 -0.001High Income (Rs. 10,000 and above) 0.790 0.888 0.926 0.801 0.791 0.929 1.058 1.065 1.066 1.066 1.426 0.782 0.747 0.747
Middle Income (Rs. 5,000-10,000) 0.355 0.431 0.464 0.344 0.381 0.463 0.567 0.570 0.571 0.571 0.227 1.410 0.392 0.392Low Income (Rs. 2,000- 5,000) 0.357 0.440 0.474 0.355 0.381 0.472 0.579 0.583 0.584 0.584 0.232 0.419 1.400 0.400
Poor (Below Rs. 2000) 0.106 0.113 0.110 0.155 0.073 0.106 0.096 0.097 0.097 0.097 0.039 0.076 0.073 1.073
Total Production 2.018 2.131 2.181 2.046 1.998 2.191 2.396 2.378 2.379 2.379 0.954 1.778 1.699 1.699
Own Sector M ultiplier 1.074 1.019 1.000 1.017 1.001 1.046 1.018 2.005 1.001 1.000 1.426 1.410 1.400 1.073
Linkage w ith other 0.944 1.112 1.181 1.029 0.997 1.145 1.378 0.373 1.378 1.379
Induced hh Income 1.609 1.872 1.975 1.656 1.627 1.970 2.300 2.315 2.317 2.317 1.924 2.687 2.612 2.612
O<
OO
SCl.«U
70

Table 6.6: Mixed Multipliers for PautiW heat M uita rd Cotton O ther Vegtable Cultivated
Cereali & fruits fodder
Village Livestock Forest
production & poultry Products
Village
Services
High M iddle Low Poor
income income income Income
w heat 0.972 -0.036 -0.040 -0.030 -0.031 -0.039 -0.047 -0.049 -0.048 -0.048 -0.009 -0.084 -0.080 -0.080
m u sta rd -0.007 0.992 -0.009 -0.008 -0.008 -0.009 -0.010 -0.010 -0.010 -0.010 -0.002 -0.018 -0.017 -0.017
co tton 0.000 0.000 1.000 0.000 0.000 0.000 0.000 0.000 0.000 0.000 0.000 0.000 0.000 0.000
o th e r c e re a ls -0.006 -0.008 -0.009 0.993 -0.007 -0.009 -0.011 -0.011 -0.011 -0.011 -0.002 -0.019 -0.018 -0.018(0
v e g e tab le s an d ru lts 0.000 0.000 0.000 0.000 1.000 0.000 0.000 -0.001 -0.001 -0.001 0.000 -0.001 -0.001 -0.001
o< C ultivated fo d d e r -0.029 -0.014 -0.016 -0.038 -0.048 0.972 -0.012 -0.013 -0.013 -0.013 -0.002 -0.022 -0.021 -0.021
village p ro d u c tio n 0.006 0.006 0.007 0.006 0.005 0.006 1.007 0.008 0.008 0.008 0.006 0.009 0.009 0.009
iv e sto ck & pou ltry -0.318 -0.359 -0.371 -0.317 -0.288 -0.365 -0.420 0.566 -0.435 -0.435 -0.345 -0.523 -0.499 -0.499
fuelw ood co llection 0.000 0.000 0.000 0.000 0.000 0.000 -0.018 0.000 1.000 0.000 0.000 0.000 -0.001 -0.001
village s e rv ic e s 0.000 0.000 0.000 0.000 0.000 0.000 0.000 0.000 0.000 1.000 0.000 0.000 0.000 0.000
i/i A gricultural 0.117 0.157 0.172 0.125 0.129 0.168 0.202 0.211 0.210 0.210 0.038 0.363 0.346 0.346u
■5o
non -ag ricu ltu ra lte rn s 0.357 0.404 0.417 0.356 0.324 0.411 0.472 0.488 0.489 0.489 0.388 0.588 0.561 0.561
§ S e rv ic e s 0.004 0.005 0.005 0.004 0.005 0.005 0.006 0.006 0.006 0.006 0.012 0.001 0.002 0.002oU Forest 0.000 0.000 0.000 0.000 0.000 0.000 -0.009 0.000 0.000 0.000 0.000 0.000 0.000 0.000
renting land (for sh a re c ro p p in g ) 0.065 0.015 0.069 0.043 0.000 0.020 0.000 0.000 0.000 0.000 0.000 0.000 0.000 0.000
Family lab o u r 0.379 0.605 0.716 0.267 0.554 0.701 0.972 1.006 1.007 1.007 0.006 0.009 0.009 0.009
hired lab o u r 0.063 0.059 0.050 0.151 0.000 0.039 0.000 0.000 0.000 0.000 0.000 0.000 0.000 0.000
s e e d s 0.058 0.011 0.015 0.082 0.110 0.048 0.000 0.000 0.000 0.000 0.000 0.000 0.000 0.000
Fertiliser 0.090 0.086 0.020 0.103 0.014 0.047 0.000 0.000 0.000 0.000 0.000 0.000 0.000 0.000lm2u m anure 0.056 0.022 0.006 0.042 0.000 0.007 0.000 0.000 0.000 0.000 0.000 0.000 0.000 0.000(0fcu p e s tic id e s &
m ed ic ines 0.004 0.001 0.039 0.000 0.110 0.000 0.000 0.000 0.000 0.000 0.000 0.000 0.000 0.000
tra c to r / d ra u g h t an im als
0.134 0.123 0.037 0.280 0.105 0.104 0.000 0.000 0.000 0.000 0.000 0.000 0.000 0.000
Blectriclty c h a rg e s 0.064 0.031 0.031 0.021 0.029 0.023 0.000 0.000 0.000 0.000 0.000 0.000 0.000 0.000
M ater c h a rg e s 0.092 0.052 0.022 0.017 0.085 0.016 0.000 0.000 0.000 0.000 0.000 0.000 0.000 0.000
F o res t R e s o u rc e s 0.000 0.000 0.000 0.000 0.000 0.000 0.035 0.000 0.000 0.000 0.000 0.000 0.000 0.000
IForest 0.000 0.000 0.000 0.000 0.000 0.000 0.000 0.000 0.000 0.000 0.000 0.000 0.000 0.000
E.Magricu ltu ra l land -0.003 -0.003 -0.003 -0.003 -0.003 -0.003 -0.153 -0.004 -0.004 -0.004 -0.003 -0.003 -0.006 -0.006
Ext
erna
l co
sts
H ighncom e(R s.10,0 DO & above)M iddle Incom e (R s.5,000-10,000) Lowlncom e(R s.2 ,000-5,000)
-0.002
-0.001
-0.001
-0.002
-0.001
-0.001
-0.002
-0.001
-0.001
-0.002
-0.001
-0.001
-0.002
-0.001
-0.001
-0.002
-0.001
-0.001
-0.090
-0.035
-0.060
-0.002
-0.001
-0.002
-0.002
-0.001
-0.002
-0.002
-0.001
-0.002
-0.002
-0.001
-0.001
-0.002
-0.001
-0.001
-0.003
-0.001
-0.002
-0.003
-0.001
-0.002
P oor(B elowRs.2000) 0.000 0.000 0.000 0.000 0.000 0.000 -0.013 0.000 0.000 0.000 0.000 0.000 0.000 0.000
Inst
itut
ion
H lgh lncom e(R s.10, D00 & above) M idd lelncom e(R s.5 ,000-10,000) L ow lncom e (R s.2,000-5,000)
0.343
0.119
0.116
0.391
0.169
0.172
0.407
0.190
0.195
0.342
0.103
0.109
0.354
0.152
0.147
0.406
0.188
0.191
0.444
0.243
0.248
0.459
0.251
0.257
0.460
0.252
0.257
0.460
0.252
0.257
1.003
0.001
0.002
0.004
1.002
0.002
0.004
0.002
1.002
0.004
0.002
0.002
P oor(B elow .2000) 0.063 0.065 0.060 0.111 0.030 0.055 0.037 0.038 0.039 0.039 0.000 0.000 0.000 1.000
ro ta l Production 0.572 0.525 0.503 0.559 0.577 0.498 0.413 0.420 0.420 0.420 -0 3 9 4 -0.753 -0.720 -0.720
OwnSectorMultiers 0.972 0.992 1.000 0.993 1.000 0.972 1.007 0.566 1.000 1.000 1.003 1.002 1.002 1.000
Linkage with o ther -0.400 -0.467 -0.497 -0.434 -0.423 -0.474 -0.594 -0.146 -0.580 -0.580
Induced hh income 0.641 0.798 0.853 0.664 0.683 0.841 0.972 1.006 1.007 1.007 1.006 1.009 1.009 1.009
71
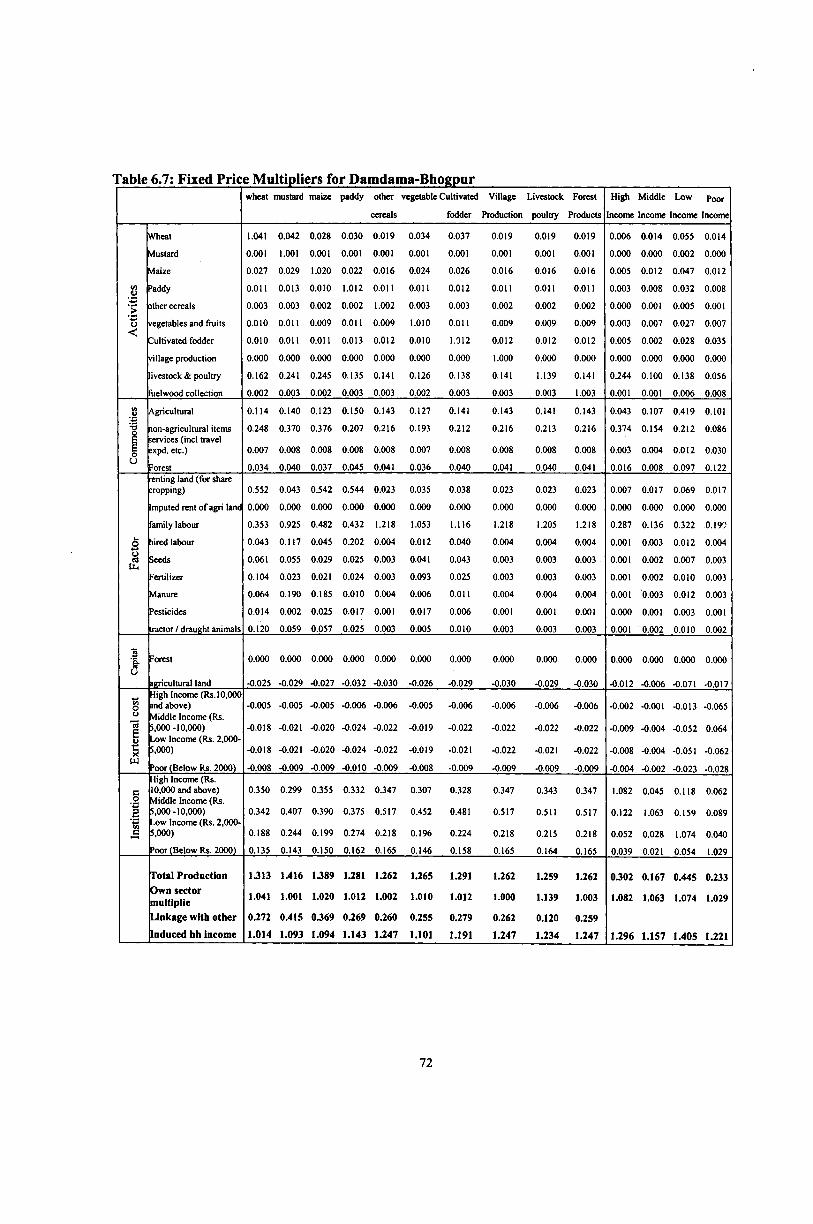
Table 6.7: Fixed Price Multipliers for Damdama-Bhogpurwheat mustard maize paddy other
cereals
vegetable Cultivated
fodder
Village
Production
Livestock
poultry
Forest
Products
High
Income
Middle Low Poor
Income Income Income
Act
iviti
es
Wheat
Mustard
vlaizc
’addy
other cereals
vegetables and fruits
Cultivated fodder
village production
ivestock & poultry
fuelwood collection
1.041
0.001
0.027
0.011
0.003
0.010
0.010
0.000
0.162
0.002
0.042
1.001
0.029
0.013
0.003
0.011
0.011
0.000
0.241
0.003
0.028
0.001
1.020
0.010
0.002
0.009
0.011
0.000
0.245
0.002
0.030
0.001
0.022
1.012
0.002
0.011
0.013
0.000
0.135
0.003
0.019
0.001
0.016
0.011
1.002
0.009
0.012
0.000
0.141
0.003
0.034
0.001
0.024
0.011
0.003
1.010
0.010
0.000
0.126
0.002
0.037
0.001
0.026
0.012
0.003
0.011
1.012
0.000
0.138
0.003
0.019
0.001
0.016
0.011
0.002
0.009
0.012
1.000
0.141
0.003
0.019
0.001
0.016
0.011
0.002
0.009
0.012
0.000
1.139
0.003
0.019
0.001
0.016
0.011
0.002
0.009
0.012
0.000
0.141
1.003
0.006
0.000
0.005
0.003
0.000
0.003
0.005
0.000
0.244
0.001
0.014
0.000
0.012
0.008
0.001
0.007
0.002
0.000
0.100
0.001
0.055
0.002
0.047
0.032
0.005
0.027
0.028
0.000
0.138
0.006
0.014
0.000
0.012
0.008
0.001
0.007
0.035
0.000
0.056
0.008tfl« Agricultural 0.114 0.140 0.123 0.150 0.143 0.127 0.141 0.143 0.141 0.143 0.043 0.107 0.419 0.101
•5 non-agricultural items 0.248 0.370 0.376 0.207 0.216 0.193 0.212 0.216 0.213 0.216 0.374 0.154 0.212 0.086
o
services (incl travel :xpd. etc.) 0.007 0.008 0.008 0.008 0.008 0.007 0.008 0.008 0.008 0.008 0.003 0.004 0.012 0.030
(JForest 0.034 0.040 0.037 0.045 0.041 0.036 0.040 0.041 0.040 0.041 0.016 0.008 0.097 0.122-enting land (for share cropping) 0.552 0.043 0.542 0.544 0.023 0.035 0.038 0.023 0.023 0.023 0.007 0.017 0.069 0.017
Imputed rent o f agri land 0.000 0.000 0.000 0.000 0.000 0.000 0.000 0.000 0.000 0.000 0.000 0.000 0.000 0.000
family labour 0.353 0.925 0.482 0.432 1.218 1.053 1.116 1.218 1.205 1.218 0.287 0.136 0.322 0.199
2 hired labour 0.043 0.117 0.045 0.202 0.004 0.012 0.040 0.004 0.004 0.004 0.001 0.003 0.012 0.004
£(14
Seeds 0.061 0.055 0.029 0.025 0.003 0.041 0.043 0.003 0.003 0.003 0.001 0.002 0.007 0.003
Fertilizer 0.104 0.023 0.021 0.024 0.003 0.093 0.025 0.003 0.003 0.003 0.001 0.002 0.010 0.003
Manure 0.064 0.190 0.185 0.010 0.004 0.006 0.011 0.004 0.004 0.004 0.001 0.003 0.012 0.003
Pesticides 0.014 0.002 0.025 0.017 0.001 0.017 0.006 0.001 0.001 0.001 0.000 0.001 0.003 0.001
tractor / draught animals 0.120 0.059 0.057 0.025 0.003 0.005 0.010 0.003 0.003 0.003 0.001 0.002 0.010 0.002
2'1 Forest 0.000 0.000 0.000 0.000 0.000 0.000 0.000 0.000 0.000 0.000 0.000 0.000 0.000 0.000
agricultural land -0.025 -0.029 -0.027 -0.032 -0.030 -0.026 -0.029 -0.030 -0.029 -0.030 -0.012 -0.006 -0.071 -0.017
toOHigh Income (Rs. 10,000 and above) -0.005 -0.005 -0.005 -0.006 -0.006 -0.005 -0.006 -0.006 -0.006 -0.006 -0.002 -0.001 -0.013 -0.065CJ
7315
Middle Income (Rs. 5,000-10,000) -0.018 -0.021 -0.020 -0.024 -0.022 -0.019 -0.022 -0.022 -0.022 -0.022 -0.009 -0.004 -0.052 0.064Low Income (Rs. 2,000- 5,000) -0.018 -0.021 -0.020 -0.024 -0.022 -0.019 -0.021 -0.022 -0.021 -0.022 -0.008 -0.004 -0.051 -0.062
wPoor (Below Rs. 2000) -0.008 -0.009 -0.009 -0.010 -0.009 -0.008 -0.009 -0.009 -0.009 -0.009 -0.004 -0.002 -0.023 -0.028
cHigh Income (Rs. 10,000 and above) 0.350 0.299 0.355 0.332 0.347 0.307 0.328 0.347 0.343 0.347 1.082 0.045 0.118 0.062
oR
Middle Income (Rs. 5,000-10,000) 0.342 0.407 0.390 0.375 0.517 0.452 0.481 0.517 0.511 0.517 0.122 1.063 0.159 0.089
toJSLow Income (Rs. 2,000- 5,000) 0.188 0.244 0.199 0.274 0.218 0.196 0.224 0.218 0.215 0.218 0.052 0.028 1.074 0.040
Poor (Below Rs. 2000) 0.135 0.143 0.150 0.162 0.165 0.146 0.158 0.165 0.164 0.165 0.039 0.021 0.054 1.029
Total Production 1.313 1.416 1.389 1.281 1.262 1.265 1.291 1.262 1.259 1.262 0.302 0.167 0.445 0.233Own sector multiplie 1.041 1.001 1.020 1.012 1.002 1.010 1.012 1.000 1.139 1.003 1.082 1.063 1.074 1.029
Linkage with other
Induced hh income
0.272
1.014
0.415
1.093
0.369
1.094
0.269
1.143
0.260
1.247
0.255
1.101
0.279
1.191
0.262
1.247
0.120
1.234
0.259
1.247 1.296 1.157 1.405 1.221
72
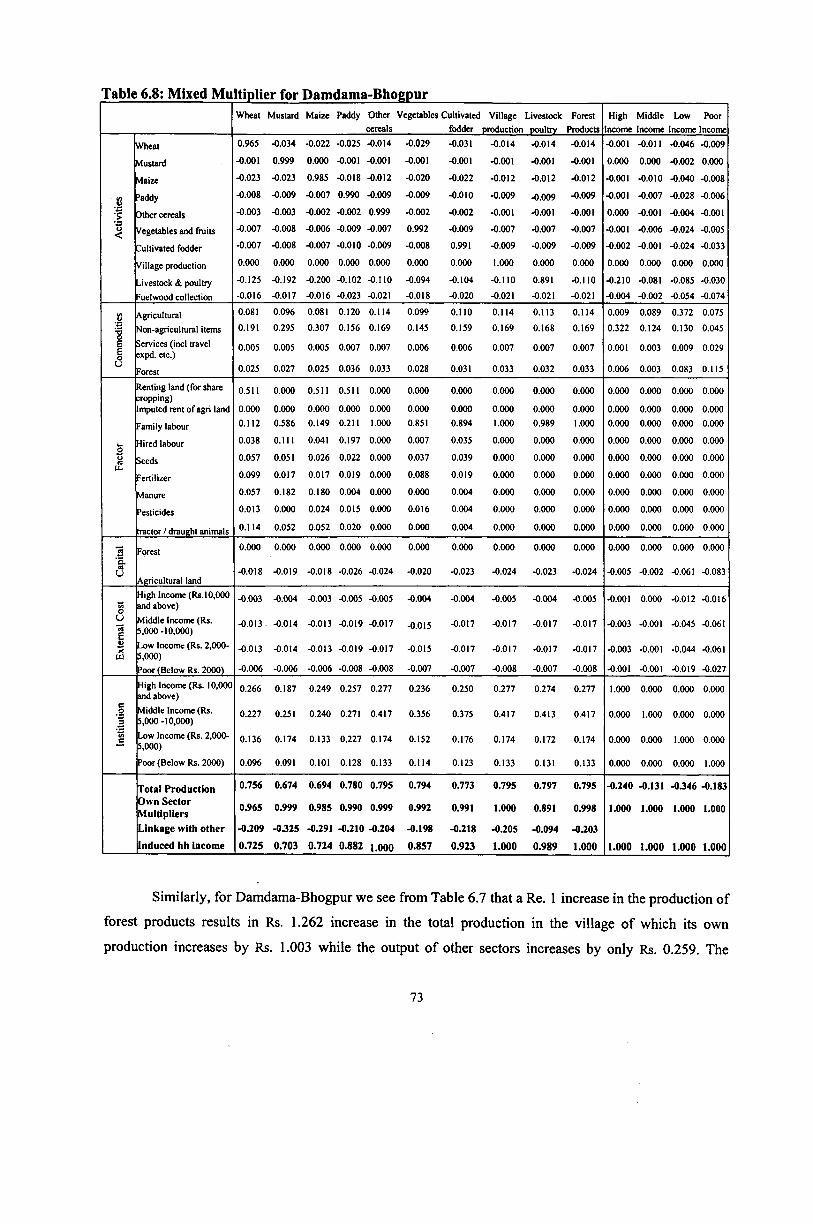
Table 6.8: Mixed Multiplier for Damdama-BhogpurWheat Mustard Maize Paddy Other Vegetables Cultivated Village Livestock Forest High Middle Low Poor
cereals fodder production poultry Products Income Income Income Income
Wheat 0.965 -0.034 -0.022 -0.025 -0.014 -0.029 -0.031 -0.014 -0.014 -0.014 -0 .0 0 1 -0 .0 1 1 -0.046 -0.009
bustard -0 .0 0 1 0.999 0 .0 0 0 -0 .0 0 1 -0 .0 0 1 -0.001 -0 .0 0 1 -0 .0 0 1 -0 .0 0 1 -0 .0 0 1 0 .0 0 0 0 .0 0 0 -0.002 0 .0 0 0
Maize -0.023 -0.023 0.985 -0.018 -0.012 -0.020 -0.022 -0.012 -0.012 -0.012 -0 .0 0 1 -0.010 -0.040 -0.008
8 Jaddy -0.008 -0.009 -0.007 0.990 -0.009 -0.009 -0.010 -0.009 -0.009 -0.009 -0 .0 0 1 -0.007 -0.028 -0.006
'> Other cereals -0.003 -0.003 -0.002 -0.002 0.999 -0.002 -0.002 -0 .0 0 1 -0 .0 0 1 -0 .0 0 1 0 .0 0 0 -0 .0 0 1 -0.004 -0 .0 0 1
t s< Vegetables and fruits -0.007 -0.008 -0.006 -0.009 -0.007 0.992 -0.009 -0.007 -0.007 -0.007 -0 .0 0 1 -0.006 -0.024 -0.005
Cultivated fodder -0.007 -0.008 -0.007 -0.010 -0.009 -0.008 0.991 -0.009 -0.009 -0.009 -0.002 -0 .0 0 1 -0.024 -0.033
Village production 0 .0 0 0 0 .0 0 0 0 .0 0 0 0 .0 0 0 0 .0 0 0 0 .0 0 0 0 .0 0 0 1 .0 0 0 0 .0 0 0 0 .0 0 0 0 .0 0 0 0 .0 0 0 0 .0 0 0 0 .0 0 0
livestock & poultry -0.125 -0.192 -0.200 -0.102 -0 .1 1 0 -0.094 -0.104 -0.110 0.891 -0.110 -0.210 -0.081 -0.085 -0.030
-uelwood collection -0.016 -0.017 -0.016 -0.023 -0.021 -0.018 -0.020 -0.021 -0.021 -0.021 -0.004 -0.002 -0.054 -0.074
Agricultural 0.081 0.096 0.081 0.120 0.114 0.099 0.110 0.114 0.113 0.114 0.009 0.089 0.372 0.075
!E©
Non-agricultural items 0.191 0.295 0.307 0.156 0.169 0.145 0.159 0.169 0.168 0.169 0.322 0.124 0.130 0.045
Services (incl travel expd. etc.)
0.005 0.005 0.005 0.007 0.007 0.006 0.006 0.007 0.007 0.007 0 .0 0 1 0.003 0.009 0.029
UForest 0.025 0.027 0.025 0.036 0.033 0.028 0.031 0.033 0.032 0.033 0.006 0.003 0.083 0.115
Renting land (for share ;ropping)Imputed rent o f agri land
0.511 0 .0 0 0 0.511 0.511 0 .0 0 0 0 .0 0 0 0 .0 0 0 0 .0 0 0 0 .0 0 0 0 .0 0 0 0 .0 0 0 0 .0 0 0 0 .0 0 0 0 .0 0 0
0 .0 0 0 0 .0 0 0 0 .0 0 0 0 .0 0 0 0 .0 0 0 0 .0 0 0 0 .0 0 0 0 .0 0 0 0 .0 0 0 0 .0 0 0 0 .0 0 0 0 .0 0 0 0 .0 0 0 0 .0 0 0
Family labour 0.112 0.586 0.149 0.211 1 .0 0 0 0.851 0.894 1 .0 0 0 0.989 1 .0 0 0 0 .0 0 0 0 .0 0 0 0 .0 0 0 0 .0 0 0
w Hired labour 0.038 0 .1 1 1 0.041 0.197 0 .0 0 0 0.007 0.035 0 .0 0 0 0 .0 0 0 0 .0 0 0 0 .0 0 0 0 .0 0 0 0 .0 0 0 0 .0 0 0ooa Seeds 0.057 0.051 0.026 0.022 0 .0 0 0 0.037 0.039 0 .0 0 0 0 .0 0 0 0 .0 0 0 0 .0 0 0 0 .0 0 0 0 .0 0 0 0 .0 0 0
u .Fertilizer 0.099 0.017 0.017 0.019 0 .0 0 0 0.088 0.019 0 .0 0 0 0 .0 0 0 0 .0 0 0 0 .0 0 0 0 .0 0 0 0 .0 0 0 0 .0 0 0
Manure 0.057 0.182 0.180 0.004 0 .0 0 0 0 .0 0 0 0.004 0 .0 0 0 0 .0 0 0 0 .0 0 0 0 .0 0 0 0 .0 0 0 0 .0 0 0 0 .0 0 0
Pesticides 0.013 0 .0 0 0 0.024 0.015 0 .0 0 0 0.016 0.004 0 .0 0 0 0 .0 0 0 0 .0 0 0 0 .0 0 0 0 .0 0 0 0 .0 0 0 0 .0 0 0
tractor / draught animals 0.114 0.052 0.052 0.020 0 .0 0 0 0 .0 0 0 0.004 0 .0 0 0 0 .0 0 0 0 .0 0 0 0 .0 0 0 0 .0 0 0 0 .0 0 0 0 .0 0 0
I Forest 0 .0 0 0 0 .0 0 0 0 .0 0 0 0 .0 0 0 0 .0 0 0 0 .0 0 0 0 .0 0 0 0 .0 0 0 0 .0 0 0 0 .0 0 0 0 .0 0 0 0 .0 0 0 0 .0 0 0 0 .0 0 0
'5 .co
UAgricultural land
-0.018 -0.019 -0.018 -0.026 -0.024 -0.020 -0.023 -0.024 -0.023 -0.024 -0.005 -0.002 -0.061 -0.083
TSo
High Income (Rs. 10,000 and above)
-0.003 -0.004 -0.003 -0.005 -0.005 -0.004 -0.004 -0.005 -0.004 -0.005 -0 .0 0 1 0 .0 0 0 -0.012 -0.016
O
E
Middle Income (Rs. 5,000-10,000)
-0.013 -0.014 -0.013 -0.019 -0.017 -0.015 -0.017 -0.017 -0.017 -0.017 -0.003 -0 .0 0 1 -0.045 -0.061
Xu i
Low Income (Rs. 2,000- 5,000)
-0.013 -0.014 -0.013 -0.019 -0.017 -0.015 -0.017 -0.017 -0.017 -0.017 -0.003 -0 .0 0 1 -0.044 -0.061
Poor (Below Rs. 2000) -0.006 -0.006 -0.006 -0.008 -0.008 -0.007 -0.007 -0.008 -0.007 -0.008 -0 .0 0 1 -0 .0 0 1 -0.019 -0.027
High Income (Rs. 10,000 and above)
0.266 0.187 0.249 0.257 0.277 0.236 0.250 0.277 0.274 0.277 1 .0 0 0 0 .0 0 0 0 .0 0 0 0 .0 0 0
c, o
1
Middle Income (Rs. 5,000-10,000)
0.227 0.251 0.240 0.271 0.417 0.356 0.375 0.417 0.413 0.417 0 .0 0 0 1 .0 0 0 0 .0 0 0 0 .0 0 0
(/)c
Low Income (Rs. 2,000- 5,000)
0.136 0.174 0.133 0.227 0.174 0.152 0.176 0.174 0.172 0.174 0 .0 0 0 0 .0 0 0 1 .0 0 0 0 .0 0 0
Poor (Below Rs. 2000) 0.096 0.091 0.101 0.128 0.133 0.114 0.123 0.133 0.131 0.133 0 .0 0 0 0 .0 0 0 0 .0 0 0 1 .0 0 0
T o ta l P ro d u c tio n 0.756 0.674 0.694 0.780 0.795 0.794 0.773 0.795 0.797 0.795 -0.240 -0.131 -0.346 -0.183
O w n S e c to r M u ltip lie rs
0.965 0.999 0.985 0.990 0.999 0.992 0.991 1 .0 0 0 0.891 0.998 1.000 1 .0 0 0 1 .0 0 0 1 .0 0 0
L in k ag e w ith o th e r -0.209 -0.325 -0.291 -0.210 -0.204 -0.198 -0.218 -0.205 •0.094 -0.203
In d u c e d h h incom e 0.725 0.703 0.724 0.882 1 . 0 0 0 0.857 0.923 1.000 0 .989 1 . 0 0 0 1 . 0 0 0 1.000 1.000 1 . 0 0 0
Similarly, for Damdama-Bhogpur we see from Table 6.7 that a Re. 1 increase in the production of
forest products results in Rs. 1.262 increase in the total production in the village of which its own
production increases by Rs. 1.003 while the output of other sectors increases by only Rs. 0.259. The
73
corresponding increase in the production o f forest product results in Rs. 1.247 increase in household
income. As mentioned earlier increased demand for the products of sectors that are supply constrained
have to be met by sources outside the village thereby resulting in leakage of resources from the village
economy. As can be seen from Table 6.8 a Re. 1 increase in the supply of forest products will result in Rs.
0.795 increase in total village production of which the sector’s own production would increase by Rs.
0.998 while the output of other sectors would increase by Rs. -0.203, i.e., there is a fall in the output of
other sectors. As compared to the fixed multiplier case where the household income increases by Rs.
1.247, the mixed multiplier household income remains the same in response to Re. 1 increase in the
supply of forest products. Thus we see that in Damdama-Bhogpur also the expected result holds. That is,
as a result of imposition of supply constraints on the forest sector the resultant increase in village output
will be less vis-a-vis the scenario observed in the case of existence of excess capacity.
6.2 Income Generation Impact on the Village Economies:
The fixed price and mixed multipliers are used to analyse income generation impacts of
production and expenditure in the two villages selected in the study. We start with the economic impact of
sectoral production where various village activities, especially those related to the forest considered in the
SAM table, are evaluated in accordance with their respective abilities to generate value added in the
village economic system. The relative impact of different household groups’ expenditure on the value
added in the village economy is also considered. The multipliers along with their decomposition are also
used to test the relative strength of production and consumption linkages in generating village level
income.
(i) Production linkages and village level value added:
Tables 6.9 and 6.10 below give the value-added multipliers (both the fixed price and mixed
multipliers) for the major production activities in the villages of Pauti and Damdama-Bhogpur. The mixed
multipliers are derived under the assumption of excess capacity in all but agriculture and forest related
activities. Consider the fixed price multipliers for both the villages. From Tables 6.9 and 6.10 it can be
seen that the forest sector has the highest value added generation in both the villages vis-a-vis the other
major sectors of the village economy, the forest sector value added multiplier being 2.291 and 1.246
respectively for Pauti and Damdama-Bhogpur. The agricultural activities have multiplier in the range of
1.432 to 1.867 in Pauti and 0.948 to 1.848 in Damdama. In both the villages, in addition to the forest
sector others having a high value added generation are village services, livestock and poultry, and village
production in case of Pauti and village production, livestock & poultry and retail trade in Damdama-
Bhogpur (refer to Tables 6.9 and 6.10). As pointed out above the fixed price multipliers are calculated
74

assuming perfectly elastic supply in all the sectors of production. But such an assumption is unrealistic.
So when we impose supply constraints in agriculture and forest related sectors the values of the
multipliers change. It is evident from the mixed multipliers given in Tables 6.9 and 6.10 below.
Table 6.9: Value-added Multipliers for Pauti Village Production Activities
Production Activities Fixed price Multipliers
Mixed price Multipliers MMF/FPM Mixed Multipliers
Ranking
Forest 1 .Forest products 2.291 1.007# 0.440 1Agriculture 1. Wheat 1.455 0.507 # 0.348 8
2. Mustard 1.734 0.680 # 0.392 63. Cotton 1.934 0.835 # 0.432 44. Other cereals 1.432 0.461 # 0.322 105. Oil seeds and pulses 1.527 0.497 # 0.326 96. Vegetables & fruits 1.476 0.554 # 0.375 77. Cultivated fodder 1.867 0.761 # 0.407 58. Livestock & Poultry 2.289 1.006# 0.440 2
Others 1. Village Production 2.274 0.972 0.427 32. Village Services 2.291 1.007 0.440 1
Note: # Denotes that the multiplier is supply driven. That is, the multiplier gives the amount by which value added would increase given a Re. 1 increase in the supply of sectoral output. All other multipliers are demand driven.
Table 6.10: Value-added Multipliers for Damdama-Bhogpur Village Production Activities
Production Activities Fixed price Multipliers
Mixed price MMF/FPM Multipliers
Mixed Multipliers Ranking
Forest 1. Forest products 1.246 1.000# 0.803 1Agriculture 1. Wheat 0.948 0.662# 0.698 9
2. Mustard 1.848 0.698 # 0.377 83. Maize 1.069 0.701 # 0.656 74. Paddy 1.178 0.919# 0.780 65. Other cereals 1.246 1.000# 0.803 16. Vegetables & fruits 1.100 0.859 # 0.780 47. Cultivated fodder 1.194 0.929 # 0.778 58. Livestock & poultry 1.233 0.989 # 0.803 2
Others 1. Village Production 1.246 1.000 0.803 12. Retail trade 1.219 0.983 0.806 3
Note: # Denotes that the multiplier is supply driven. That is, the multiplier gives the amount by which value added would increase given a Re. 1 increase in the supply of sectoral output. All other multipliers are demand driven.
The observation that the forest sector has the highest value added generation may not be
sustainable if the supply is not perfectly elastic. So the mixed multipliers are presented which assume that
the supply of agriculture and forest related activities are inelastic. From Tables 6.9 and 6.10 it is evident
that the value-added multiplier of the forest sector falls to 1.007 from 2.291 for Pauti (i.e., 44 % of its
fixed price level) and to 1.000 from 1.246 for Damdama-Bhogpur (i.e., 80 % of its fixed price level). The
75

value-added multipliers for the other sectors are also smaller, a result which follows directly from the
assumption of supply constraints in agriculture and forest related activities. Even with the presence of
supply constraints, it is evident from Tables 6.9 and 6.10 that in both the villages the forest sector has the
highest value added generation potential, albeit much less as compared to fixed multiplier level. The
observed variation in the magnitude of fixed price and mixed multipliers presented in Tables 6.9 and 6.10
could be due to the assumption of perfect elastic and perfect inelastic supply conditions in agriculture and
forestry sectors. The ‘true’ multiplier value for a particular sector is most likely lie somewhere between
these two extremes.
(ii) Household expenditure linkages:
In addition to determining the aggregate village level effects of sectoral production increases, it is
also important to assess the relative economic impact of growth in household expenditure that would
result from expanded earnings.
Table 6.11: Value-added Multipliers for Households in Pauti Village
Household type Fixed price Multipliers
MixedMultipliers MMF/FPM Mixed Multipliers
Ranking
Rich Household Poor Household
2.5603.152
0.0150.017
0.0120.011
21
Table 6.12: Value-added Multipliers for Households in Damdama-Bhogpur Village
Household type Fixed price Multipliers
MixedMultipliers MMF/FPM Mixed Multipliers
Ranking
Rich Household Poor Household
0.45160.6221
0.0000620.000025
0.000260.00007
12
Fixed price and mixed value added multipliers for the different household groups modelled in the
SAM are presented in Tables 6.11 and 6.12 above for Pauti and Damdama-Bhogpur villages. Such
multipliers show that an increase in village value added for Re. 1 increases the household expenditure
under the assumption of excess capacity in all the sectors (in case of fixed multipliers) and inelastic
supply in agriculture and forest related sectors (in case mixed multipliers). From Table 6.11, we see that
in Pauti in case of fixed price multipliers the poor household group (comprising o f low income class and
poor income class) has the most desirable expenditure pattern in terms of generating economic growth in
the village. The pattern remains unchanged in case of mixed multiplier although the values substantially.
In case of Damdama-Bhogpur village also (refer to Table 6.12) it is the poor household group comprising
the poorest two income groups, poor and low income class, have a greater economic growth generating
potential vis-a-vis the rich sections of the village. The results however, change in case of mixed multiplier
76

in this village. The rich household comprising the high and middle income class have the greater
economic potential. Note that the multipliers become significantly small for all the households in both the
villages in case of mixed multipliers. Such a feature may be observed because of the fact that these
households devote a relatively larger share o f their budget to supply constrained agricultural and forest
output. If the farm output fails to expand to meet the increased demand, then import of agricultural and
forest products will increase thereby resulting in a greater leakage from the village economy.
(iii) Production versus consumption linkages:
We have decomposed both the fixed price and mixed multiplier into direct, indirect and induced
effects to test for the relative strength of production and consumption linkages for the two villages
considered in the study. The induced effect shows the result of including household income and
expenditure linkages in multiplier estimation and can therefore be considered as a measure of the strength
of consumption linkages. It may be shown that the direct effect is simply the value added per unit of
output while the indirect effect is the residual. Tables 6.13 and 6.14 below provide results for both the
demand driven and supply constrained sectors for the villages of Pauti and Damdama-Bhogpur
respectively. The first column in each panel of both the tables provides the total value added multiplier
taken directly from the fixed price and mixed multipliers for the sectors listed in the left. Columns 2-4
decompose the multipliers into direct, indirect and induced effects, while column 5 gives induced effect
as a percentage of total multiplier. From the tables it can be seen that, under the assumption of complete
excess capacity, the consumption linkages account for about 54-55 % of the total value added in case of
Pauti and about 20-22 % in case of Damdama-Bhogpur. When the supply constraint restriction is imposed
on the agriculture and forest related activities, the consumption linkages account for approximately 0.7-1
% of the total value added in case of Pauti and about 0.003 % in case of Damdama-Bhogpur. The
implications of such features are that the consumption linkages are not at all strong as was conventionally
thought to be. The results o f the present study, therefore, run similar to the findings of Lewis and
Thorbecke (1992).
77
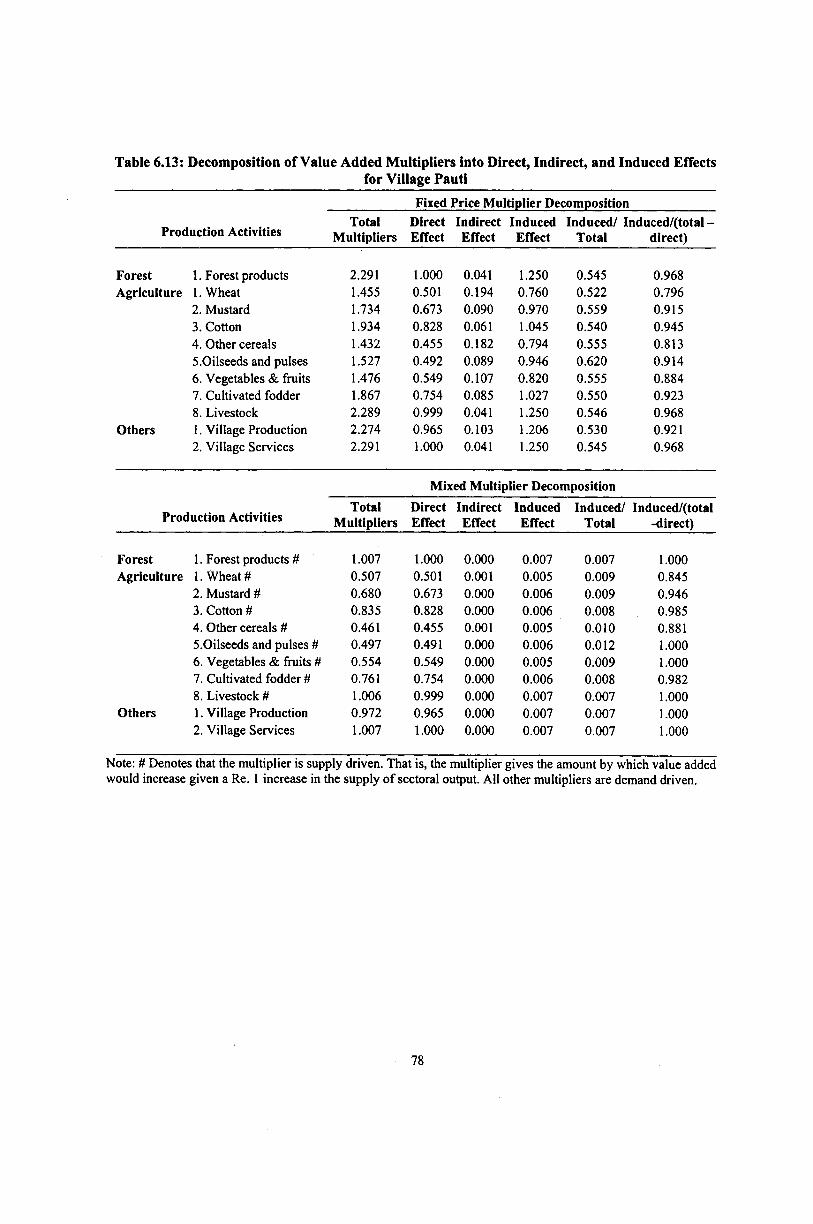
Table 6.13: Decomposition of Value Added Multipliers into Direct, Indirect, and Induced Effectsfor Village Pauti
Fixed Price Multiplier Decomposition
Production ActivitiesTotal
MultipliersDirectEffect
IndirectEffect
InducedEffect
Induced/ Induced/(total - Total direct)
Forest 1. Forest products 2.291 1.000 0.041 1.250 0.545 0.968Agriculture 1. Wheat 1.455 0.501 0.194 0.760 0.522 0.796
2. Mustard 1.734 0.673 0.090 0.970 0.559 0.9153. Cotton 1.934 0.828 0.061 1.045 0.540 0.9454. Other cereals 1.432 0.455 0.182 0.794 0.555 0.8135.Oilseeds and pulses 1.527 0.492 0.089 0.946 0.620 0.9146. Vegetables & fruits 1.476 0.549 0.107 0.820 0.555 0.8847. Cultivated fodder 1.867 0.754 0.085 1.027 0.550 0.9238. Livestock 2.289 0.999 0.041 1.250 0.546 0.968
Others 1. Village Production 2.274 0.965 0.103 1.206 0.530 0.9212. Village Services 2.291 1.000 0.041 1.250 0.545 0.968
Mixed Multiplier Decomposition
Production ActivitiesTotal
MultipliersDirectEffect
IndirectEffect
InducedEffect
Induced/ Induced/(total Total -direct)
Forest 1. Forest products # 1.007 1.000 0.000 0.007 0.007 1.000Agriculture 1. Wheat # 0.507 0.501 0.001 0.005 0.009 0.845
2. Mustard # 0.680 0.673 0.000 0.006 0.009 0.9463. Cotton # 0.835 0.828 0.000 0.006 0.008 0.9854. Other cereals # 0.461 0.455 0.001 0.005 0.010 0.8815.Oilseeds and pulses # 0.497 0.491 0.000 0.006 0.012 1.0006. Vegetables & fruits # 0.554 0.549 0.000 0.005 0.009 1.0001. Cultivated fodder # 0.761 0.754 0.000 0.006 0.008 0.9828. Livestock # 1.006 0.999 0.000 0.007 0.007 1.000
Others 1. Village Production 0.972 0.965 0.000 0.007 0.007 1.0002. Village Services 1.007 1.000 0.000 0.007 0.007 1.000
Note: # Denotes that the multiplier is supply driven. That is, the multiplier gives the amount by which value added would increase given a Re. 1 increase in the supply of sectoral output. All other multipliers are demand driven.
78

Fixed Price Multiplier Decomposition
Table 6.14: Decomposition of Value Added Multipliers into Direct, Indirect, and Induced Effectsfor Village Damdama-Bhogpur
Production ActivitiesTotal
MultipliersDirectEffect
IndirectEffect
InducedEffect
Induced/T Induced/(total otal -direct)
Forest 1. Forest products 1.246 1.000 -0.031 0.277 0.222 1.126Agriculture 1. Wheat 0.948 0.662 0.072 0.214 0.225 0.747
2. Mustard 1.848 0.698 0.941 0.209 0.113 0.1823. Maize 1.069 0.701 0.157 0.211 0.197 0.5744. Paddy 1.178 0.919 -0.012 0.271 0.230 1.0455. Other cereals 1.246 1.000 -0.031 0.277 0.222 1.1266. Vegetables & fruits 1.100 0.859 0.004 0.238 0.216 0.9857. Cultivated fodder 1.194 0.929 0.006 0.259 0.217 0.9778. Livestock & poultry 1.233 0.989 -0.031 0.274 0.222 1.126
Others 1. Village Production 1.246 1.000 -0.031 0.277 0.222 1.1262. Retail trade 1.219 0.983 -0.036 0.272 0.223 1.151
Mixed Multiplier Decomposition
Production Activities Total Direct Indirect Induced Induced Induced/(totMultipliers Effect Effect Effect /Total al -direct)
Forest 1. Forest products # 1.00002 1.00000 0.00000 0.00003 0.00003 1.12500Agriculture 1. Wheat# 0.66159 0.66156 0.00001 0.00002 0.00003 0.66667
2. Mustard # 0.69766 0.69762 0.00002 0.00002 0.00003 0.524393. Maize # 0.70146 0.70142 0.00002 0.00002 0.00003 0.437214. Paddy # 0.91903 0.91901 0.00000 0.00002 0.00002 0.954555. Other cereals # 1.00002 1.00000 0.00000 0.00002 0.00002 1.004176. Vegetables & fruits # 0.85857 0.85855 0.00000 0.00002 0.00003 1.155007. Cultivated fodder # 0.92886 0.92884 0.00000 0.00002 0.00003 1.122738. Livestock & poultry # 0.98947 0.98945 0.00000 0.00003 0.00003 1.16087
Others 1. Village Production 1.00002 1.00000 0.00000 0.00002 0.00003 1.000002. Retail trade 0.98280 0.98251 0.00027 0.00002 0.00002 0.07655
Note: # Denotes that the multiplier is supply driven. That is, the multiplier gives the amount by which value added would increase given a Re. 1 increase in the supply of sectoral output. All other multipliers are demand driven.
Inclusion of direct effects, which are exogenously determined in this framework and which can
be attributed neither to production nor to consumption linkages, in the denominator in column 5 of the
Tables 6.13 and 6.14 results in an underestimation of the consumption linkages. Hence, in the last column
in the tables we present the induced effect as a percent of total multiplier minus the direct effects. The
results show that the consumption linkages explain a much larger portion o f the value of the income
multiplier when the direct effects are excluded.
On the basis of the above analysis, it can be said that when we consider induced effects as a
percent of total multipliers the consumption linkages explain only a very small portion of the value of the
79

income multiplier in both the villages. But when we remove the exogenous effects from the total effects,
the consumption linkages explain a large portion of the value of the income multiplier. Under the
assumption of supply constrained agriculture and forest sectors, the consumption linkage account for an
even greater portion of the value added multipliers (excluding direct effects). In case of the forest
products the consumption linkages are very strong in explaining the total value added multipliers vis-a-vis
the other sectors.
(iv) Distributional Impact o f Income Generation:
An interesting issue before the policy formulation engaged in poverty alleviation exercise is the
contribution of different production activities, directly or indirectly, to the incomes accruing to the poor
socio-economic household groups. The overall contribution of an increase in the output of an activity is
measured by the fixed price multiplier originating with that particular production activity and destined to
the specific poor household group under consideration. As pointed out earlier the multiplier can be
decomposed into two multiplicative effects, the distributional effects and the interdependency effect.
The distributional effects include incomes received by a given household group from factors such
as labour and land provided by that group and used as primary inputs in the production of the commodity
under consideration. It also includes the indirect factor incomes received by the same group from the
intermediate inputs required in the production of that commodity and incomes accruing to that group from
transfers and remittances from other socio-economic household groups.
The interdependency effects capture the indirect spending and re-spending effects by the groups
that benefited, income-wise, from the initial increase in output. This effect reflects the extent of
integration within an economy, on both the consumption and production sides. The more the consumers
spend on domestic goods and services, the more diversified are their consumption patterns, the larger will
be the interdependency effect.
Tables 6.15 and 6.16 give the decomposition of multipliers from production activities to incomes
received by the poor socio-economic groups (i.e., the poor income class and low-income class) in the
villages of Damdama-Bhogopur and Pauti respectively. It may be recalled that the present analysis
classified the households into four groups namely, the rich-income class having a monthly income which
is above Rs 10,000, the middle-income class having a monthly income which lies between Rs 10,000 -
5,000, low-income class with monthly income lying in the range Rs. 5,000 - 2,000, and finally the poor
income class having monthly income below Rs 2,000. The last two groups of household i.e., the low and
poor income class are considered to constitute ‘the poor’ in the village. The landless and the marginal
farmers, as mentioned earlier belong to the poor and low-income class, while the large and medium
landowners fall under the category of high and middle-income class.
80
From Table 6.15 it is evident that the total multipliers originating from the retail trade is the
highest followed by paddy, mustard, and forest products in case o f Damdama-Bhogpur village. Such a
result indicates that these activities make relatively high contributions towards poverty allevialtion in the
village (0.4620, 0.4360, 0.3862 and 0.3832 respectively). The main reason for these high values as
compared to those in the other sectors appears to be the high magnitude of their distributional effect. In
other words, income of the poorer section of the village would increase by respectively 0.3875, 0.3542,
0.2468, and 0.3061 for one unit increase in the output o f retail trade, paddy, mustard, and forest products.
An examination of Table 6.16 for village Pauti would reveal that the total multipliers originating
from forest and village services is the highest (0.6803 for both the sectors). The main reason for this
appears to be high distributional effect, which is 0.2938 for both the activities. This means that Re. 1
increase in the output of these two sectors would result in a Rs. 0.2938 increase in income of the two poor
household groups. As is evident from the table, the distributional effects of agricultural activity like
wheat, vegetables and fruits, and other cereals on the poor group o f households is low as compared to
activities related to forest.
On the basis of the above results, it can be said that in both the villages the distributional effect of
forest as compared to the other activities on the poor household groups is higher. Thus one can conclude
that the forest sector has the potential to contribute significantly towards alleviating poverty in both the
villages
81

Tabl
e 6.
15: D
ecom
posit
ion
of M
ultip
liers
from
Pro
duct
ion
Act
iviti
es to
Pov
erty
Gro
ups f
or th
e vi
llage
Dam
dam
a-B
hogp
urD
istr
ibut
iona
l Eff
ects
(PA
*j )
Whe
atM
usta
rdM
aize
Padd
yO
ther
cere
als
Oils
eeds
V
eget
able
s C
ultiv
ated
&
pul
ses
and
frui
ts
fodd
erV
illag
epr
oduc
tion
Liv
esto
ck
& p
oultr
yFo
rest
Prod
ucts
Ret
ail
trad
e
Pove
rty0.
2322
0.26
480.
2346
0.35
420.
3061
0.14
770.
2655
0.29
810.
3061
0.30
280.
3061
0.38
75Lo
w In
com
e (R
s. 2,
000-
5,00
0)0.
1362
0.17
410.
1333
0.22
670.
1735
0.09
730.
1518
0.17
550.
1735
0.17
170.
1735
0.25
69Po
or In
com
e (B
elow
Rs.
2000
)0.
0960
0.09
060.
1013
0.12
750.
1326
0.05
030.
1137
0.12
250.
1326
0.13
120.
1326
0.13
07
Inte
rdep
ende
ncy
Effe
cts
(PA
r )
whe
at
Mus
tard
M
aize
Padd
yO
ther
O
ilsee
ds
Veg
etab
les
Cul
tivat
ed
Vill
age
Liv
esto
ck
Fore
st
Ret
ail
cere
als
& p
ulse
s an
d fr
uits
fo
dder
pr
oduc
tion
& p
oultr
y Pr
oduc
ts
trad
e
Pove
rty
Low
Inco
me
(Rs.
2,00
0-5,
000)
Poor
Inco
me
(Bel
ow R
s. 20
00)
1.389
1 1.4
588
1.380
2 1.3
992
1.401
6 1.5
735
1.489
31.4
918
1.48
60
1.230
91.2
071
1.273
2
1.252
0 2.
0931
1.2
548
1.950
8 1.2
484
2.36
83
1.288
01.2
892
1.286
4
1.281
91.2
748
1.292
0
1.25
201.2
548
1.248
4
1.25
201.2
547
1.24
84
1.25
20
1.192
1 1.2
548
1.166
4 1.
2484
1.2
426
Fixe
d M
ultip
lier (
PA
")
Whe
atM
usta
rdM
aize
Padd
yO
ther
cere
als
Oils
eeds
V
eget
able
s C
ultiv
ated
&
pul
ses
and
frui
ts
fodd
erV
illag
epr
oduc
tion
Liv
esto
ck
& p
oultr
yFo
rest
Prod
ucts
Ret
ail
trad
e
Pove
rty
0.32
260.
3862
0.34
930.
4360
0.38
320.
3090
0.34
190.3
821
0.38
320.
3791
0.38
320.
4620
Low
Inc
ome
(Rs.
2,00
0-5,
000)
0.18
800.
2436
0.19
890.
2736
0.21
770.
1898
0.19
570.
2238
0.21
770.
2154
0.21
770.
2996
Poor
Inco
me
(Bel
ow R
s. 20
00)
0.13
460.
1426
0.15
050.
1624
0.16
550.
1192
0.14
630.
1583
0.16
550.
1637
0.16
550.
1624

Tabl
e 6.
16: D
ecom
posit
ion
of M
ultip
liers
from
Pro
duct
ion
Act
iviti
es to
Pov
erty
Gro
ups
for t
he V
illag
e Pa
uti
Dis
trib
utio
nal
Eff
ects
(P
A*)
W
heat
M
usta
rd
Cotto
n °
the5
O
ilsee
ds V
eget
able
s Cu
ltiva
ted
Vill
age
Live
stock
Fo
rest
Vill
age
J ce
real
s &
pul
ses
& fr
uits
fodd
er
prod
uctio
n &
pou
ltry
Prod
ucts
serv
ices
Pove
rty
0.17
75
0.23
56
0.25
35
0.21
81
0.25
63
0.17
59
0.24
46
0.28
35
0.29
35
0.29
38
0.29
38Lo
w In
com
e (R
s. 2,
000-
5,00
0)
0.11
50
0.17
06
0.19
33
0.10
72
0.12
71
0.14
57
0.18
94
0.24
66
0.25
53
0.25
56
0.25
56Po
or In
com
e (B
elow
Rs.
2000
) 0.
0626
0.
0650
0.
0602
0.
1109
0.
1292
0.
0302
0.
0553
0.
0369
0.
0382
0.
0382
0.
0382
Inte
rdep
ende
ncy
Effe
cts
(PA
?)
Whe
at
Mus
tard
C
otto
n 0t
her
0ils
eeds
Veg
etab
les
Cul
tivat
ed
Vill
age
Live
stoc
k Fo
rest
Vill
age
____
____
__
____
__v
' ’
wne
al
MUS
taro
^on
on
cere
als
& p
ulse
s &
frui
ts fo
dder
pr
oduc
tion
& p
oultr
y Pr
oduc
ts se
rvic
es
Pove
rty
2.60
88 2
.346
9 2.
3059
2.
3421
2.
2107
2.
5825
2.
3629
2.
3821
2.
3167
2.
3155
2.
3155
Low
Inc
ome
(Rs.
2,00
0-5,
000)
3.
1089
2.
5801
2.
4535
3.
3150
3.
0689
2.
6166
2.
4930
2.
3493
2.
2847
2.
2837
2.
2837
Poor
Inco
me
(Bel
ow R
s. 20
00)
1.68
95
1.73
55
1.83
21
1.40
13
1.36
65
2.41
82
1.91
69
2.60
13
2.53
03
2.52
86
2.52
86
Fixe
d M
ultip
lier (
PA
”)
Whe
at
Mus
tard
C
otto
n 0t
her
0ils
eeds
Veg
etab
les
Cul
tivat
ed
Vill
age
Live
stoc
k Fo
rest
Vill
age
cere
als
& p
ulse
s &
frui
ts fo
dder
pr
oduc
tion
& p
oultr
y Pr
oduc
ts se
rvic
es
Pove
rty
Low
Inc
ome
(Rs.
2,00
0-5,
000)
Poor
Inco
me
(Bel
ow R
s. 20
00)
0.46
32
0.55
29 0
.584
6 0.
5109
0.
5667
0.
4542
0.
5780
0.
6753
0.
6799
0.
6803
0.
6803
0.35
75
0.44
00 0
.474
3 0.
3555
0.
3901
0.
3813
0.
4721
0.
5793
0.
5832
0.
5837
0.
5837
0.10
57
0.11
29 0
.110
3 0.
1554
0.
1766
0.
0730
0.
1059
0.
0960
0.
0966
0.
0967
0.
0967

7. Policy Implications of the Study
The foregoing analysis on two villages of Haryana examines the linkages prevailing between the
forest sector and the village economy adopting a SAM framework. An attempt is made to assess the
economic structure of the villages and the scope of making use of forest resources in production,
consumption and income generation processes. Based on the multiplier analysis of the village SAM some
policy suggestions are made for strengthening the village-forestry relationship keeping in view the accrual
of benefit to the village population in general and poorer sections in particular.
Pauti:It has been observed above that the multiplier analysis established the linkages between the forest
sector and the village economy. For example, Rs. 1000 injection of resources in the forest sector results in
an increase of forest sector production by Rs. 1004 and total village production activities by Rs. 1197.
Such an injection of resources in the forest sector also has an impact on the factors of production, which
are engaged in the production activities. The total value added of the forest sector increases by Rs. 1152.
The increase in total village production activities including the forest sector and an increase in factors of
production also results in an increase of induced household incomes by Rs. 1161. Consequently the
poorer section in the village receive Rs. 341 while the remaining Rs. 820 accrues to the rich in the village.
Thus we see that although the poor do benefit from an increased household income the major share of it
accrues to the richest household groups in the village.
The injection of resources in the forest sector also results in an increase in fuelwood collection
activity by Rs. 1004, implying an increase in fuelwood consumption by the households. Burning of
fuelwood for cooking, which is one of the major sources of indoor air pollution, has an adverse effect on
the health of the household. The medical expenditure incurred by the household to treat diseases related to
indoor air pollution is expected to increase by Rs. 48.
The direct and indirect income receipts of the household from different forest activities indicate
the distributional effect of these activities. We see in Pauti, due to Rs. 1000 injection in the forest sector
the poor group receives Rs. 294 in the form of direct and indirect income. From this income the share of
low and poor income class being Rs. 256 and Rs. 38 respectively.
Damdama-Bhogpur:
From the multiplier analysis for the village Damdama-Bhogpur we see the linkages between the
forest sector and the village economy. For example, Rs. 1000 injection of resources in the forest sector
84

results in an increase of forest sector production by Rs. 1000 and total village production activities by Rs.
1372. Such an injection of resources in the forest sector also has an impact on the factors of production,
which are engaged in the production activities. The total value added of the forest sector increases by Rs.
1352. The increase in total village production activities including that of the forest sector and consequent
employment of factors of production result in induced household incomes of Rs. 1354. Of this increase in
household income the poorer section in the village receive only Rs. 417 while the remaining Rs. 937
accrue to the rich in the village. Thus we see that although the poor do benefit from an increased
household income the major share of it accrues to the richest household groups.
The injection of resources in the forest sector also results in an increase in fuelwood collection
activity by Rs. 1003. Burning of additional quantity if fuelwood for cooking, which is one of the major
sources of indoor air pollution, has an adverse effect on the health of the household. The medical
expenditure incurred by the household to treat diseases related to indoor air pollution is expected to
increase by Rs. 72.
The direct and indirect income receipts of the households from different forest activities indicate
their distributional effect. In Damdama-Bhogpur due to Rs. 1000 injection in the forest sector the poor
group receives Rs. 306 in the form of direct and indirect income receipts. From such an income, the
shares of low and poor income class are Rs. 173 and Rs. 133 respectively.
On the basis of the above findings it can be said that exogenous interventions in forestry sector
can be made for the benefit of the poorer sections. Such interventions may take two forms:
a) Intervention of social forestry type, where the forests are grown over panchayat lands and the stock of
trees remain the property of the village panchayat. Consequently the income generation from such a
scheme accrues to the village panchayat. Benefits of this scheme is reaped by the villagers indirectly
as the income earned through auctioning of forest grown under this scheme is utilised by the
panchayat for improving the infrastructure of the village. Poorer sections of the village, therefore,
benefit indirectly from the improved infrastructural facilities and directly from the increased
availability of forest products like fuelwood, fodder and other non-timber forest products. Under this
option the benefits accruing to individual households is difficult to quantify.
b) Direct intervention to increase the forest resources. This route includes increase of forest resource
regeneration of degraded forests, bringing the scrublands under forests, bringing tracts of lands under
plantation forest in the village wherever available. Details of village specific feasible plantation in this
respect are discussed elaborately subsequently.
85

Recommendation for Afforestation programme:
In view of the supply constraints faced by the poor households with respect to fuelwood, fodder
and non timber forest products, an afforestation program should be able to specify the amount of forest
area that would be required to ease the supply constraint and recommend species of plants that will be
suitable for producing the required varieties of forest products. The afforestation program should be able
to take into account the available area that may be utilised for such activities. In the given context of
Rewari and Panchkula districts in Haryana the shortage of fuelwood and fodder affects the basic
livelihood and subsistence aspect and therefore maybe assigned primary importance. Timber and non
timber forest products are important in so far as they become complementary resources for enhancement
of income generation.
Afforestation for Fuelwood and Fodder Supply in Rewari and Panchkula Districts
The villages, which are adjacent to the forest, obtain most of their fuelwood from forests.
However, a substantial amount of cattle dung cakes are also used as a fuel, in both the districts, with
Rewari being higher as there is relatively less forest than the district Panchkula. The cattle dung being a
good fertilizer and a bad fuel it is therefore recommended that over time it should be replaced by
fuelwood. In a situation where all the cattle dung is replaced by the forest wood, the total fuelwood
demand of the district will increase. Including such possibilities we have estimated the forest land
requirement in each of the two districts under consideration. Details are given in the following:
Rewari
Fuelwood: Estimate of fuelwood consumption for the district has been made with a consumption
rate of 1.3 kg/person/day. According to this estimate fuelwood demand for the entire district would
amount to 298,200.8 tons per year. Taking into consideration the mean annual increment of the
existing forest area of 2900 hectares for the Rewari district, the sustainable fuelwood supply would
be 50,906 tons. This would require an additional 14,088 hectares of land to be brought under
forests.
Fodder: The total estimated annual fodder consumption by the total livestock of the district
amounts to 2,015,334 tons. In this the forest leaves contribute to the to the tune of 58,225 tons.
According to our calculation (based on mean annual increment), it would require 18,791 hectares
of forestland to supply the required fodder for the whole district.
86

The district has 19,000 hectares of available fallow and wasteland, which can be brought
under forest plantation. After making a judicious use of this land for fuelwood and fodder
plantation any deficiency in demand can be met by conscious attempt to increase the density of the
forest. Rewari being an arid region and adjacent to the desert only xerophytic plants can grow. The
following species of plants may be considered for extensive plantation in the additional area that
may be brought under the afforestation programme.
List of Fuelwood varieties of trees
Kikar (Acacia nilctica Var.Indica)
Vilayati kikar (Prosopis juliflora)
Safeda ( Eucalyptus)
Jal (Salvadora oleoides)
Khejri (prosopis cineraria)
List of Fodder Species
Bad-Ber (Zizyphus mauretania)
Kikar (Acacia nilctica Var.Indica)
Peepal (Ficus religiosa)
Dub-grass (Cyanodon dactylori)
Khejri (prosopis cineraria)
Dab (Desmostachya bipinnata)
Anjan (Cenchrus ciliaris)
Non-Timber Forest Product
Arand (icinus communis)
Khajur (Phoenix sylvestis)
Dhak ( Butea monosperma)
Kair (Caparis desidua)
Jal (Salvadora oleoides)
Koomta (Acacia Senegal)
Papri ( Holoptelea integrifolia)
Bakain (Melia azedarach)
87
Panchkula
Fuelwood: Estimate of the total fuelwood consumption for the district has been made with a
consumption rate of 1.68 kg/day/person. According to this estimate, the fuelwood demand for the
whole district would be 159770.7 tons. Taking into consideration the mean annual increment of
wood of the forest, the total supply would be 103,094 tons per year. This would imply shortfall
149,461.3 tons. To meet this deficit an additional 1,044 hectares of forestland would be required.
Fodder: The estimated total yearly consumption of fodder by the livestock in the district amounts to
159,770 tons, in which the forest leaves constitute 126,552 tons (the rest being agricultural
residues). According to our calculation, it would require 913 hectares of forestland to supply leaves
towards fodder for the whole district of Panchkula.
The district has 1900 hectares o f forest land. However, as an estimate of available fallow
and wasteland in the district are not available it is difficult to recommend whether the land
comprising of forest, fallow and waste would be sufficient to meet the additional demand for
fuelwood and fodder. Perhaps it would be prudent to utilize the available surplus degraded land for
fuelwood and fodder plantation to start with. If such an attempt fails to meet the requisite demand
the option of increasing the density of the forest has to be exercised. In view of the deficit of fodder
availability in the state of Haryana, its cultivation may also be a useful source o f income generation
for the poor households in the rural areas. The present study therefore suggests the following
varieties of fuelwood and fodder species to be considered for plantation.
List of the Fuelwood species.
Bakli (Anogeissus latifolia)
Bamboo (Dendrosalamus stristus)
Kikar (Acacia nilotica)
Jhingan (Lannea coromandelica)
List of Fodder Species
Grasses
Cenchrus ciliaris
Cenchrus setigerus
Panicum antitodale
Crysopogon fulvus
88

Dichanthuim annulum
Congo-signal grass
Legumes
Stylosanthes hamata
Stylosanthes scabra
Stylosanthes guianensis
Trees
Bauhinia variegata
Albizzia lebbeck
Leucaena lucocephala
Morns alba (Mulberry)
Grewia optiva.
Taking into account the ground realities of the two districts we have suggested for an increased
supply of fuelwood from the forests as a useful resource base. However, such a measure is intended to be
a short-term solution. Associated health costs because of indoor air pollution, we have noticed in course
of our analysis, would compel us to keep the option open for substitution of fuelwood with cleaner fuels
in the long run. Such a possibility is likely to emerge as the level of income improves and better
technological solutions are initiated.
89
8. Summary and Conclusion
Intervention in the forest sector with the objective of poverty reduction has been a focal point of
many developmental agencies. Benefits derived by the rural poor from the forest the resources like
timber, non-timber forest products and environmental services are often taken into account while
assessing the options for effective intervention.
Poverty-forestry link, however, remains controversial issue. While poor people’s role in forest
degradation due to over exploitation of its resources does not enjoy consensus, the poverty reduction
potential of forest products on which the poor depend most is not yet resolved. The intervention strategy
of most of the practitioners therefore is based on case specific micro-level analysis.
As the dependence of rural poor on each category of forest resource differs, the correspondence
between resource-type and category o f rural poor is to be examined through a framework capable of
comprehensively capturing the interdependence between forest and the economy functioning in its fringe
area. A social accounting matrix (SAM) framework seems appropriate for analyzing such micro-level
inter sectoral linkages.
The present study generates a set of empirical results on the extent and the nature of economic
linkages between the village economy and forest resources in two villages of the state of Haryana, India.
The analysis is based on the income generating multipliers derived from a village level social accounting
matrix framework.
Making use of the SAM technique, an attempt is made to capture both indirect and direct effects of
exogenous policy-induced changes on forest resources. Findings of the study can be used as a basis for
intervention in the forest sector for poverty reduction. By selecting two villages located in different
climatic zones, the study enlarges the scope of extending the results to other villages of the state with
similar economic conditions.
The framework developed in the exercise is based on an extended SAM and incorporates the
effects of forest related environmental services like soil degradation, carbon sequestration and bio-fuel
use on health. Thus the impact of income generation by households when resource degradation process is
resorted to is addressed.
The study aims at assessing (a) the potential of forest based production activities in the generation
value addition, (b) the inducement provided by various household groups’ expenditure patterns in
increasing village income, (c) the strength of forest production and consumption linkages in stimulating
the overall income growth of the village and (d) the poverty reduction features o f production activities in
forest through generation o f distributive effects. Two sets of exercises assuming non-constraint and
constraint supply capacities of forest and agriculture sectors have been undertaken.
90

When an assumption of supply constraints in the forestry sector is brought in, the magnitude of the
impact due to an exogenous shock transmitted through the various production activities or household
groups diminishes. If complete excess capacity in the village forest is assumed, stimulating demand is
sufficient to encourage increases in output and income. Under such an assumption, the agricultural sector,
which is also supply constrained does not increase output production. So policy has to intervene from the
supply side. The relative impact o f different production activities on household groups changes under
assumptions of capacity constraints in the economy.
The present analysis finds that forest activities have an advantage over agricultural ones in
generating income. Both demand driven and supply-constrained formulations of the analysis point out
that forest products have higher value addition capability. However, the extent of income augmentation
from forest activities is likely to be affected by supply elasticities of its products. Value-added multiplier
under assumptions of perfectly inelastic supply in forest is only 44% of the level under assumptions of
perfectly elastic supply.
At the household level, forest based activities perform better than agriculture income generation.
Relatively richer categories of households gain more than the poorer groups from such a process. This
finding therefore shows that the distribution of income is difficult to change by stimulating the increments
in forest output only.
Without the imposition of supply constraints among sectors of the village economy, expenditure
of the two poorer household groups inducing a higher income growth can be projected. However, if the
forestry sector has an inelastic supply response, richer households of the village would stimulate income
growth most through their expenditure. The exogenous intervention in the forestry sector therefore, may
have to focus on the reduction of its supply-constrained segments.
Results of the study indicate the relative strength of production over consumption linkages in the
generating village economy’s growth. However, when a supply-constrained forest sector exists,
consumption linkages may account for an even greater portion of the value of income multipliers
(excluding direct effects).
On the basis of the results obtained from the multiplier analysis two forms of exogenous
interventions in forestry sector are proposed for the benefit of the poorer sections:
a) intervention of social forestry type, where the forests are grown over panchayat lands and the stock of
trees remain the property of the village panchayat, and
b) direct intervention to increase the forest resources.
91

Notwithstanding the above findings some of the important limitations of the SAM multipliers
cannot be overlooked. Although the SAM model captures the economic linkages among agricultural
production-forestry as well as households-forestry, it suffers from the underlying assumptions of linear,
fixed proportion technology. The fixed price multipliers are based on demand driven system. The
presence of market imperfections is likely to cause prices not to be exogenous and constant. Moreover,
resource constraints will make the prevalence of unchanged price untenable. Introduction of supply
constraints in agriculture and forest activities in the present study and adoption of fixed multipliers may
have produced better results but the substitution responses which may emerge from production and
consumption sides have remained beyond the purview of the analysis.
8.1 Limitations of the Study:
92
Select References
Adelman, I. and S. Robinson (1978), Income Distribution Policy in Developing Countries: A Case Study
of Korea, Stanford University Press.
Adelman, I., J.E. Taylor and S. Vogel (1989), “Life in a Mexican Village: A SAM Perspective” The
Journal o f Development Studies, pp. 5-24.
Aggarwal, R.K., R.P. Yadav and Pawan Sharma (2000) Integrated Nutrient supply Systems for
sustainable Production in rainfed Shivalik - A review. In “Fifty years of Research in Sustainable
Resource Managemant In Shivaliks” (Eds) S.P. Mittal, R.K.Aggarwal and J.S.Samra. Published
by, Central Soil and Water Conservation Research and Training Institute Research Centre,
Chandigarh-160019
Ahluwalia, M. and F. Lysy (1979), “Welfare Effects of Demand Management Policies: Impact
Multipliers under Alternative Model Structures”, Journal o f Policy Modeling, Vol.l, No. 3, pp.
317-42.
Angelsen, A and S. Wunder (2003), “Exploring the Forest-Poverty Link: Key Concepts, Issues and
Research Implications”, CIFOR Occasional Paper No. 40.
Arnold, J.E.M. (2001), Forestry Poverty and Aid, CIFOR Occasional Paper No.33 quoted in Angelsen
and Wunder, (2003)
Census of India (2001), Final population total, Indian Administrative Service, Registrar General &
Census Commissioner India.
Campbell, B.M. et al, (2002), Household Livelihoods in Semi-arid region: Options and Constraints,
CIFOR, Indonesia.
Census of India (1991), District Census Handbook, District Ambala, Director of Census Operation,
Haryana. Govt, o f Haryana (1993)
Census of India (2001), Haryana. Provisional Population Totals, Director of Census operations Haryana.
Govt, of Haryana
Centre for Monitoring of Indian Economy (1993), District Profile, CMIE, Mumbai.
Damodaran, A. (2003), Joint Forest Management in India: Assessment of Performance and Evaluation of
Impacts, Indian Institute of Plantation Management, Bangalore.
FAO (2001), How Forests Can Reduce Poverty. Policy Brief, November
93

Forest Survey of India (1999), State o f Forest Report, Forest Survey of India, Dehradun.
Forest Survey of India (2001), State of Forest Report. Forest Survey of India, Dehradun
Government of Haryana (1997), Statistical Abstract 1995-96, Economic and Statistical Organisation
Planning Department, Government of Haryana.
Government of Haryana (1995), District Census Handbook - Rewari (1995-96), Director of Census
operations, Haryana. The Government of Haryana.
Government of India, (1999), Compendium of Environment Statistics, Central Statistical Organisation,
Ministry of Statistics and Programme implementation, Government of India, New Delhi.
Gurung, C.P., and M.D. Coursey (1994), Nepal: Pioneering Sustainable Tourism. The Annapurna Area
Conservation Project: An Applied Experiment in Integrated Conservation and Development, The
Rural Extension Bulletin 5, University of Reading, UK.
Haryana District Gazetteer, Mahindergarh (1988), Government of Haryana, Chandigarh.
Haryana District Gazetter, Ambala District (1984), Government of Haryana, Chandigarh.
JBIC report (2003), Special Assistance for Project Formation (SAPROF) for Integrated Natural Resource
Development and Poverty Reduction Project (Draft Final Report)
Joshi, M.M. (IFS) Dy. Conservator of Forests-cum-working plan officer, Mahendergarh. Working plan
for the Mahendergarh forest division (1999-2000 to 2008-2009). Forest Department, Haryana.
Kaimowitz, D. (2002), Not by Head Alone. Forests and Rural Livelihoods in Sub-Saharan Africa,
CIFOR, Indonesia.
Lewis, B. D. and E. Thorbecke (1992), District-Level Economic Linkages in Kenya: Evidence Based on a
Small Regional Social Accounting Matrix, World Development, vol. 20, no. 6, pp. 881-97.
Lipton and Ravallion (1993), Poverty and Policy, Working paper WPS 1130 (World Bank, Washington,
D.C.)
Markandya, A. and C. Costanza (eds.) (1993), Environmental Accounting: A Review of the Current
Debate', Environmental Economics Series Paper no. 8, UNEP.
Mishri V. Regional Research Centre. IGFRI, Himachal Pradesh Krishi Vishwa Vidyalaya, Palmpur
(H.M.)
94

Oksanen, T. and C. Mersmann, (2002), Forests in Poverty Reduction Strategies: An Assessment of the
PRSP Process in Sub-Saharan Africa, Paper presented at the International Workshop - Forests in
Poverty Reduction Strategies: Capturing the Potentials, Helsinki, Finland, October.
Pagiola, S. (2001), “Paying for Water Services”, Forests Trends Workshop on New Markets for a Green
Economy, Brazil, http://www.forests-trends.org
Parikh, A. and E. Thorbecke, (1996), 'Impact of Rural Industrialisation on Village Life and Economy: A
Social Accounting Approach', Economic Development and Cultural Change, vol. 44, no. 2, pp.
351-77.
Pradhan, B. K. and A. Sahoo, (1996), 'Social Accounting Matrix and Its Multipliers for India', Margin,
vol. 28, no. 2, pp. 153-69.
Pyatt, G. and J. I. Round (eds.), (1985), Social Accounting Matrices: A Basis for Planning, Washington
D.C., World Bank.
Pyatt, G. and others, (1972), Employment and Income Policies for Iran: Methodology for Macroeconomic
Projections, ILO, Geneva.
Singh, T.P. (IFS) Dy. Conservator of Forest, Working Plan for the Forest of Panchkula and Pinjore
Ranges of Momi-Pinjore division (2001-2002 to 2015-16) Working Plan Division . Ambala.
Forest Department, Haryana.
Singh,G., Ram Babu and S. Chandra (1981) Soil loss Prediction Research in India. Central Soil and
Water Conservation Research and training Research and Training Institute, Dehradun. ICAR
Bulletin No. T-12/D-9
Smith, J. and S. J. Scherr (2002), Forest Carbon and Local Livelihoods: Assessment of Opportunities and
Policy Recommendations, CIFOR Occasional Papers No. 37, CIFOR, Indonesia.
Subramanian, S. and E. Sadoulet, (1990), 'The Transmission of Production Fluctuations and Technical
Change in a Village Economy: A Social Accounting Approach', Economic Development and
Cultural Change, vol. 39, no. 1, pp. 131-73.
Taylor, J. E. and I. Adelman, (1996), Village Economies: The Design, Estimation, and Use of Village
wide Economic Models, Cambridge University Press.
The Zimbabwe Trust, The Department of National Parks and Wildlife Management and the Campfire
Association (1994), Zimbabwe: Tourism, People, and Wildlife, The Rural Extension Bulletin 5,
University of Reading, UK.
Thorbecke, E. and Hong-Sang, Jung (1996), A multiplier decomposition method to analyse povety
alleviation. Journal o f Developmental Economics. Vol. 48:279-300.
Thorbecke, E. and J. Sengupta, (1972), A Consistency Framework for Employment, Output and Income
Distribution Projections Applied to Colombia, mimeo, Development Research Center, World
Bank.
United Nations, (1993), System of National Accounts 1993, New York.
WCED (1987), Our common future, World Commission on Environment and development, Oxford:
Oxford University Press
World Bank (2001), A Revised Forrest Strategy for the World bank Group. Draft 30 July 2001, WB,
Washington, DC.
Wunder, S. (2001), Poverty Alleviation and Tropical Forests- What Scope for Synergies? World
Development, Vol. 29, NO. 11.
96

A nnexure-1
M ethodology fo r E stim ation o f Soil E rosion
The soil erosion was estimated employing the Universal soil loss equation (USLE) by assuming it
to be a function of various factors such as rainfall, compactness of the soil, slope and the slope length,
vegetation cover and erosion control practice factor. The soil loss from the village agricultural land was
estimated using the USLE. For estimating the soil loss, the village was divided into various slopes where
agriculture is being carried out on the village map obtained from the land revenue department. Five such
slopes were identified. The slopes of the individual pockets were measured using dumpy levels and
theodolite. Individual land holding of each landowner in each slope was calculated from the recorded
landholding records (Jamabandi) of the land revenue department (Patwari, Pinjore) and verification of the
same from the landowner himself. Once the share of arable land of each landowner in each single slope
had been ascertained, the annual soil loss was estimated using the USLE. The Universal soil loss equation
is a product of six coefficients as described below:
E = R x K x L x S x C x P
where, E is soil loss (tons/ha/yr), R is rainfall erodivity factor, K is soil erodivity factor, L is slope length
factor, S is slope steepness factor, C is cover and management factor, P is erosion control practice factor.
Most of the factors were obtained from the Central Soil and Water Conservation Research and Training
Institute (CSWCRTI), Dehradun, except the rainfall and the slope value. The values for the various
factors are given in Table A l.
Damdama-Bhogpur
Table A l: Soil Erosion Factors for Damdama-Bhogpur
SINo
Name of the slope
Rainfallfactor
(R)
Soil erodivity factor (K)
Slopefactor(LS)
Cover and management
factor (C)
Erosion control practice factor
(P)1 Slope 1 569 0.35 0.481 0.61 0.38
2 Slope 2 569 0.35 0.32 0.61 0.38
3 Slope 3 569 0.35 0.61 0.61 0.38
4 Slope 4 569 0.35 0.75 0.61 0.38
5 Slope 5 569 0.35 0.51 0.61 0.38
6 Slope 6 569 0.35 0.35 0.61 0.38
97

The values for LS were calculated separately for the six different slopes using the slope value for
Damdama-Bhogpur. The rainfall data was obtained from the tehsil office Kalka and the slope was
calculated by measuring it manually using dumpee level and theodolite. By multiplying all these factors
the total soil annual erosion from various slopes was calculated, then further the loss of soil for each
person annually was calculated having in the six slopes. These figures in tons per hectare were summed
up for to obtain the total soil loss of each landowner.
Pauti
In Pauti village the same methodology as outlined above for Damdama-Bhogpur was adopted. In
this terrain only two slopes were identified and the arable amount of land for each landowner in each
slope was identified using the same methodology as described above. The rainfall data was collected from
the district collector’s office and rest other coefficients were obtained from the CSWCRTI, Dehradun.
The factors obtained for Pauti are described in Table A2.
Table A2: Soil Erosion Factors for Pauti
SI No Name of the slope
Rainfall factor (R)
Soil erodivity factor (K)
Slopefactor(LS)
Cover and management
factor (C)
Erosion control practice factor
(P)1 Slope 1 569 0.35 0.35 0.61 0.75
2 Slope 2 569 0.35 0.32 0.61 0.75
These factors were multiplied to calculate the soil loss from each slope. The total soil loss for
each landowner was also estimated and then summed up to obtain soil loss for each individual. The total
loss for each individual was then summed up to obtain the total soil loss of the village.
98

Annexure-2
Methodology for Estimating Annual Carbon Sequestration by the Forests
Damdama-Bhogpur
The amount of carbon sequestered in the forests of Damdama-Bhogpur has been calculated from
the annual increment of the growing stock. The forest area adjoining the village is 273.7, 132.0 and 12
hectares and the dominant tree species in the forest area are Khair (Acacia catechu), Chaal (Annogeissus
latifolia) and Jinghan (Lannea coromandelica). There are certain factors for efflux of carbon from the
system such as logging of timber, extraction of the fuelwood by the villagers, leaves as fodder, which
have been separately calculated and deducted from the annual carbon sequestration in the forests.
Growing stock of the forest resources has been estimated by measuring the tree diameter at breast
height (DBH) for all the tree species in a circular area of 15m. radius (404.14 sq.m.). Trees of all species
from ten such circles were recorded from forest area adjoining the village, with a separation of at least
100 mts distance between the circles. The trees were then grouped according to their species and further
sub-grouped according to their girth size within the species. Few trees of ornamental and medicinal
varieties, such as Cassia fistula, Zizypus sp. which were found occasionally, were clubbed under
miscellaneous. The volume of the trees in cubic meters was found out with the help of local volume tables
of different dominant species given in the working plan for the forest of Panchkula and Pinjore ranges of
Momi-Pinjore forest division (2001-02 to 2015-16).
The annual increment or the yield was estimated by Von mantel’s formula, also adopted by the
forest department, which is,
Y= 2 x GS/R
where Y is the yield, GS is growing stock and R is rotation of years. The rotation of years varies from tree
to tree. R is between 15-20 years for most of the species growing in this area. The total annual increment
from the ten circles was summed up. The total area of the ten circles were also summed up and converted
into hectare by dividing it with 100,00. Using these figures of total annual increment and total area the
annual increment per hectare was worked out. Using the estimate of annual increment per hectare, the
annual increment for the entire forest area adjoining the village was calculated from where the
representative circles were taken. The annual increment was converted to biomass in tones by multiplying
it with 0.95, which was further converted to carbon in tonnes by multiplying it with 0.45 (IPCC, 1995).
It is assumed that the growing stock dose not include small branches and the leaves. Therefore,
these have been separately calculated. It is assumed that a specific fraction (volume in cum) of the
99

growing stock is the volume of leaves, and this volume of leaves for different species annually added, as
the leaves of the trees fall of during winters and re-grow during spring. The amount of carbon stored in
the leaves (tonnes) was also calculated similarly and added with the total annual increment of carbon of
the forest.
Similarly the total logging by forest department in the forest area, collection of fuelwood by the
villagers and the collection of leaves for fodder were estimated and converted into carbon by the
conversion factors adopted above and deducted from the total annual carbon sequestered in the forest.
The net carbon sequestration by the forest was estimated by adding the annual increment of carbon (in
tones) with the carbon sequestered in the leaves (in tones) and deducting the efflux of carbon such as
logging of timber, fuelwood extraction and leaves by the villagers (in tones).
Pauti
The total forest area adjoining the village Pauti is 132 hectares. The forest is dominated by
species such as Kikar (Acacia nilotica), Ulloo neem (Alanthus excelsa), Safeda (Eucalyptus), Jand jandi
(Prosopis cineraria), Babool (Acacia jacquemontii). To estimate the growing stock of this forest a
separate exercise of recording tree diameter at breast height in small circles has not been carried out. The
number of trees classified according to their girth diameter provided in the working plan of the forest of
Mahendergarh forest division (1999-2000 to 2008-09) has been relied upon. Table for conversion of girth
size to volume was used as provided in the working plan of forest to calculate the growing stock in cubic
meters. The conversion tables adopted here are broadly of two types one for the Eucalyptus sp. and
another for rest of the species. From the growing stock annual increment was calculated adopting the Von
mantel’s formula as described above. The incremental leaf of the forest was also calculated as described
earlier. Thereafter the components, which were responsible for efflux of the carbon from the system,
such as yearly logging by forest department, removal of fuelwood and leaves for fodder by the villagers,
were calculated adopting same methodology as described above.
The volume was converted to biomass (in tonnes) and thereafter to carbon by adopting the
conversion coefficient provided by the IPCC, 1995 guidelines.
The net carbon sequestration by the forest was calculated by adding the carbon sequestered by the
leaves of the forest with the annual increment o f carbon of the forest and deducting the transport of
carbon in terms of the removal of forest products such as yearly timber logging, removal of fuelwood and
leaves.
100

Annexure 3 - Questionnaire canvassed for Household Survey in the villages, Pauti
and Damdama-Bhogpur
1. Household Particulars
1.1 Name of the Head of the Household
1.2 Does the house have electric connection? Yes / No
1.3 Source of Drinking water(i) Water Supply (tap) (ii) Open well(iii) Tubewell (iv) River(v) Pond (vi) Others, specify
1.4 Mode of fuel used for cooking:(i) firewood (ii) cow dung(iii) LPG (iv) kerosene(v) Dry mustard sticks (vi) Others, specify
1.5 Type of House: 1.6 Number of Rooms in the house:(i) Pucca(ii) Kutcha 1.7 Expected Rent of the House:(iii) Mixed
\oi

Section 2: Land ownership and Utilization
Area (in acre) Area (in acre)2.1 Land Owned2.2 Cultivable Land2.3 Homestead Land2.4 Fallow / Uncultivated Land
(Encroached land etc.)2.5 Cultivable Waste Land (2.7 + 2.8 + 2.10)2.6 Orchard
2.7 Own land under cultivation2.8 Land leased in2.9 Land leased out2.10 Land operated otherwise
2.11 Operational land holding

Section 3: Financial Position of the HouseholdTransactions Amount Sources
1 2 33.1 Amount Borrowed
3.2 Amount Repaid
3.3 Interest Paid
3.4 Savings
3.5 Investments
\C i'2>

£Oa.£
13o
£
#
c<u£oQ-£w(L>
SP
C32"50 *C 00 <1co£
S3
bfl<
t
05£>>o.£<D<UC/3 I
Os | ^ '
c.2CJCl3
b.2!§*0JD300
0O__ >>C33 ’>v: *■0— ■' <
'O
•o
>h a. s < &
X u.& s
rv ~ ^ •? ° O52 Is *S— (U c/5
. 2 2 - 3 £ ^ o f £ £ « ~ oC£ £ J3
_c£
y:
VO A
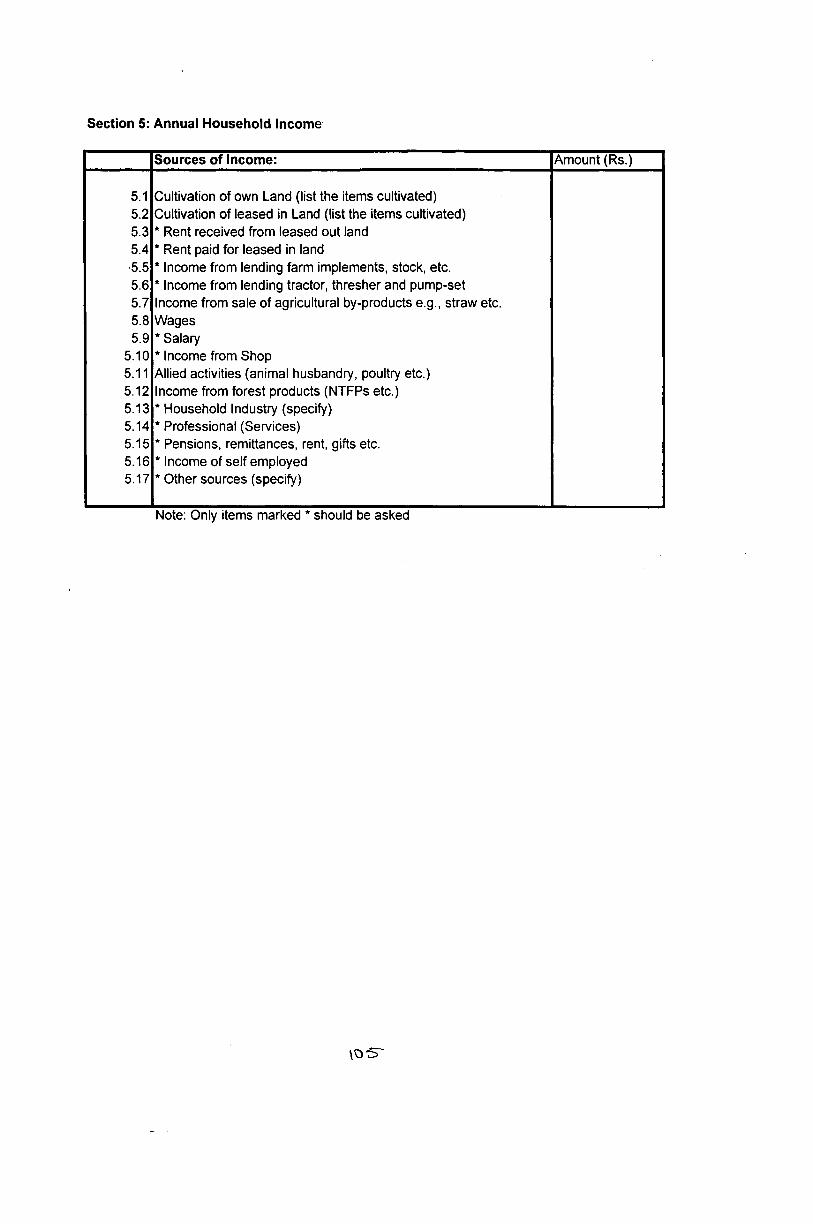
Section 5: Annual Household Income
Sources of Income: Amount (Rs.)
5.1 Cultivation of own Land (list the items cultivated)5.2 Cultivation of leased in Land (list the items cultivated)5.3 * Rent received from leased out land5.4 * Rent paid for leased in land•5.5 * Income from lending farm implements, stock, etc.5.6 * Income from lending tractor, thresher and pump-set5.7 Income from sale of agricultural by-products e.g., straw etc.5.8 Wages5.9 * Salary
5.10 * Income from Shop5.11 Allied activities (animal husbandry, poultry etc.)5.12 Income from forest products (NTFPs etc.)5.13 * Household Industry (specify)5.14 * Professional (Services)5.15 * Pensions, remittances, rent, gifts etc.5.16 * Income of self employed5.17 * Other sources (specify)
Note: Only items marked * should be asked
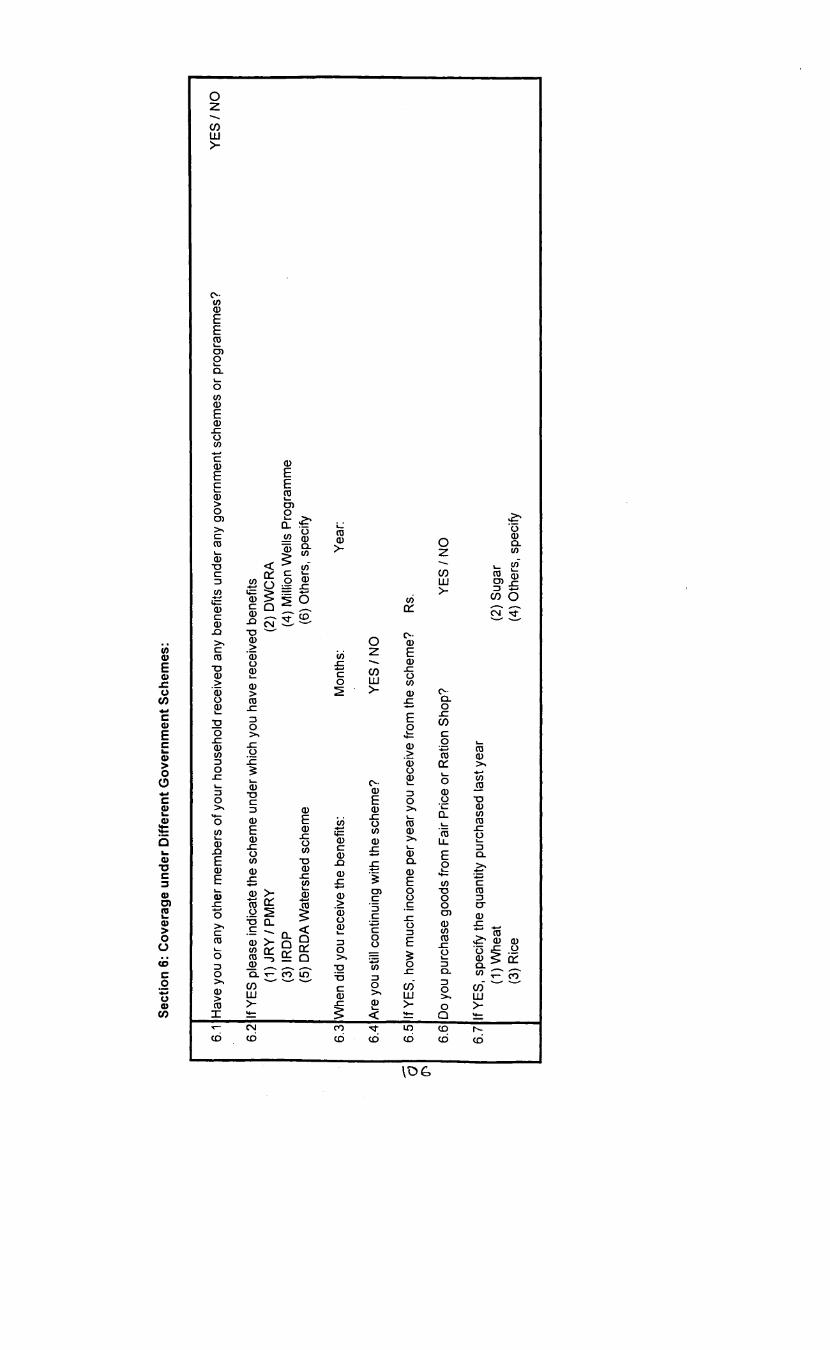
Sect
ion
6: C
over
age
unde
r D
iffe
rent
Go
vern
men
t S
chem
es:
6.1Ha
ve y
ou o
r any
oth
er m
embe
rs o
f you
r hou
seho
ld rec
eive
d an
y be
nefit
s un
der a
ny g
over
nmen
t sch
emes
or p
rogr
amm
es?
YES
/ NO
6.2
If YE
S pl
ease
indi
cate
the
sche
me
unde
r whi
ch y
ou h
ave
rece
ived
ben
efits
(1
) JR
Y / P
MRY
(2
) DW
CRA
(3) I
RDP
(4) M
illion
Wel
ls Pr
ogra
mm
e (5
) DRD
A W
ater
shed
sch
eme
(6) O
ther
s, s
pecif
y
6.3
Whe
n did
you
rece
ive
the
bene
fits:
Mon
ths:
Ye
ar:
6.4
Are
you
still
cont
inui
ng w
ith th
e sc
hem
e?YE
S/N
O
6.5
If YE
S, h
ow m
uch
inco
me
per y
ear y
ou r
ecei
ve fr
om th
e sc
hem
e?
Rs.
6.6
Do y
ou p
urch
ase
good
s fro
m F
air P
rice
or R
atio
n Sh
op?
YES
/ NO
6.7
If YE
S, s
pecif
y th
e qu
antit
y pu
rcha
sed
last
yea
r (1
) Whe
at
(3) R
ice(2
) Sug
ar(4
) Oth
ers,
spe
cify
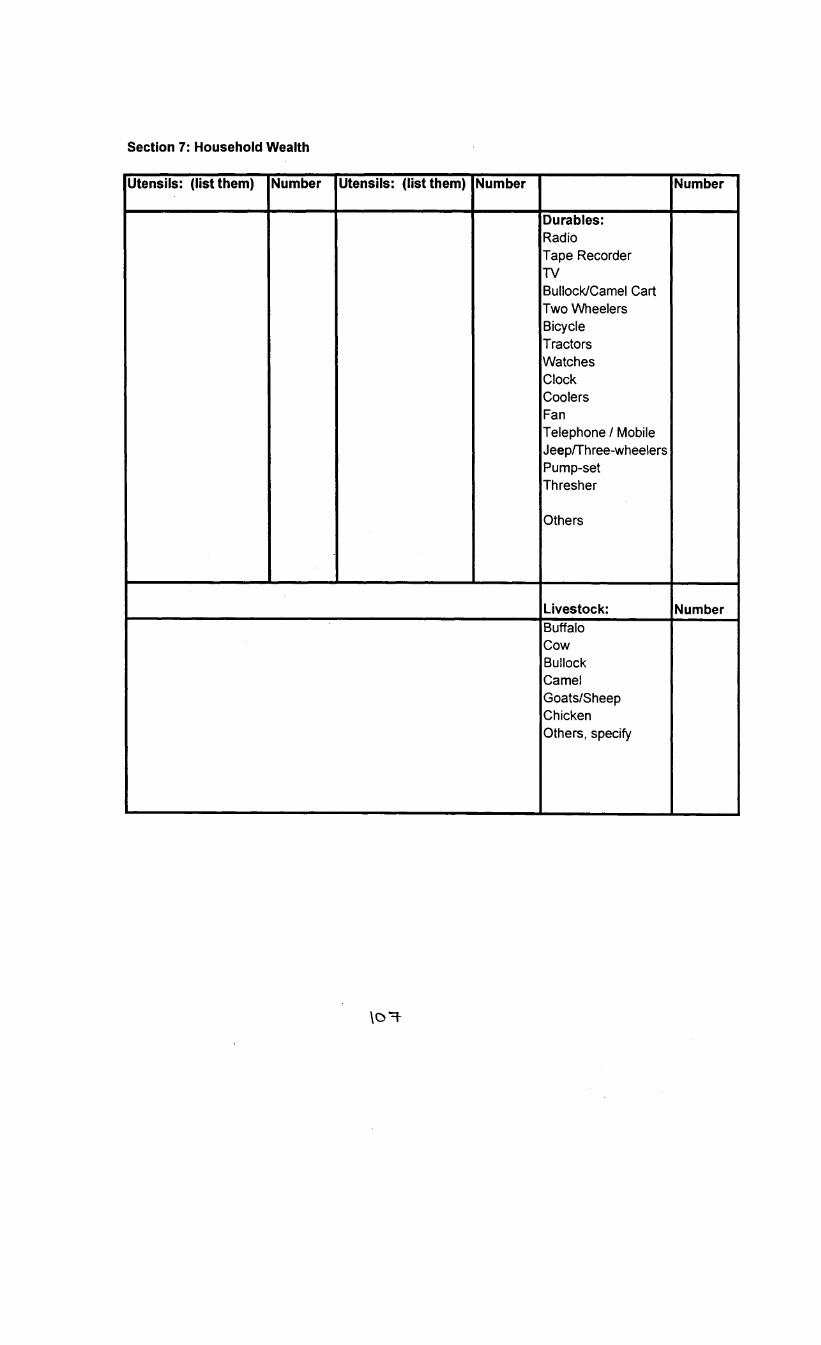
Section 7: Household Wealth
Utensils: (list them) Number Utensils: (list them) Number Number
Durables:RadioTape Recorder TVBullock/Camel CartTwo WheelersBicycleTractorsWatchesClockCoolersFanTelephone / Mobile Jeep/Th ree-wheelers Pump-set Thresher
Others
Livestock: NumberBuffaloCowBullockCamelGoats/Sheep Chicken Others, specify
\o^
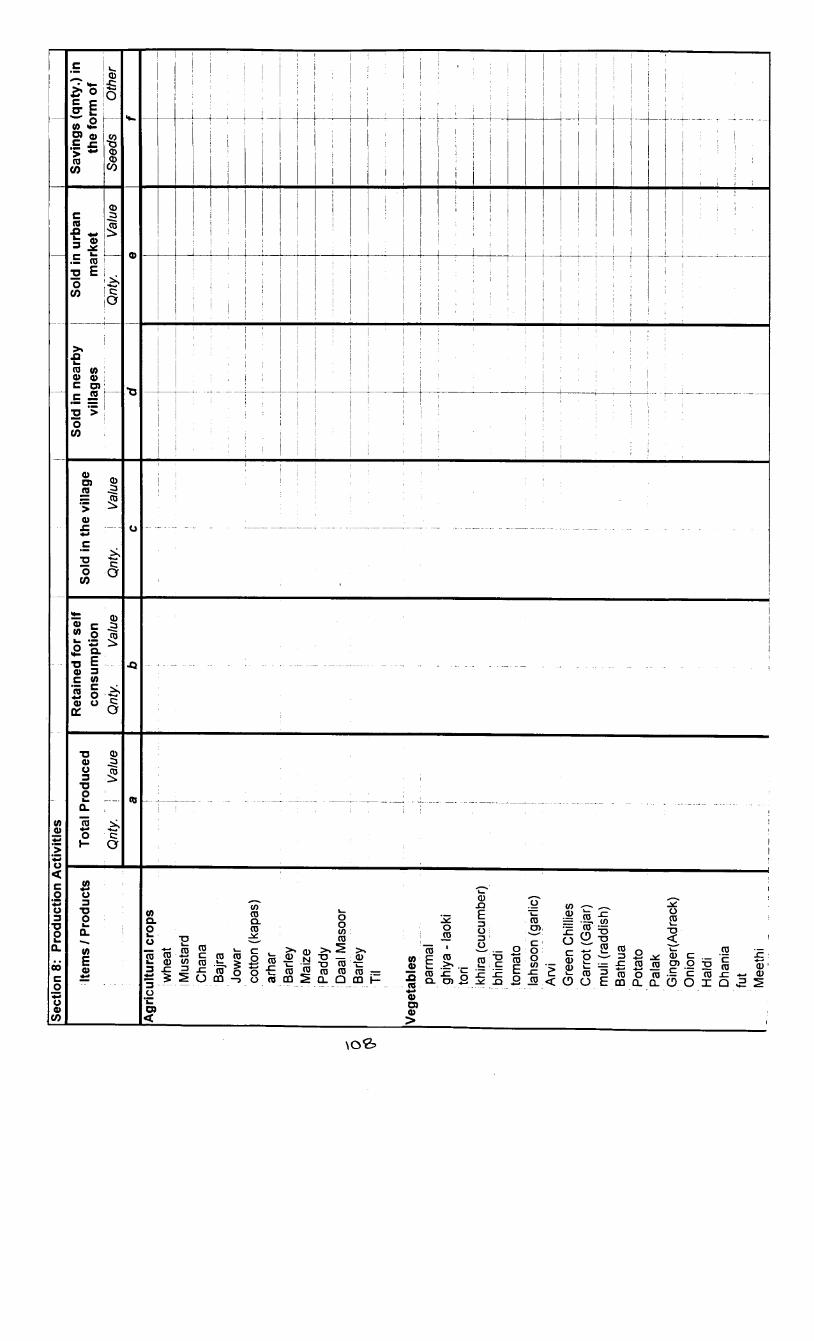
<&o\
Sect
ion
8: P
rodu
ctio
n Ac
tiviti
es1
item
s / P
rodu
cts
Tota
l Pro
duce
dRe
tain
ed fo
r sel
f co
nsum
ptio
nSo
ld in
the
villa
geSo
ld in
nea
rby
villa
ges
Sold
in u
rban
m
arke
tSa
ving
s (q
nty.
) in
th
e fo
rm o
fQnt
y.Va
lue
Qnt
y.
Valu
eQnt
y.j
Valu
e]
Qnt
y.Va
lue
See
dsO
ther
ab
cd
ef
Agric
ultu
ral c
rops
1■
i! w
heat
i1
1 Mus
tard
j . . 1 1
Chan
ai
jBa
jraJo
war
'-
—--
----
----
----
----
-
cotto
n (k
apas
) ar
har
;I i
—.....-
---
----
----
----
----
--
i Bar
ley
iM
aize
1 Pad
dy
j Daa
l Mas
oor
I! | i
i !-.
....
..-
----
----
......
....
....
; Bar
ley
Tii
1 I
.. __
__....
....
——
........
Vege
tabl
es|
parm
alj
"j'..
.'....
~gh
iya -
laok
i to
rikh
ira (cu
cum
ber)
; bhi
ndi
! i.i
i■
:E
----
----
--
tom
ato
!I
j ....
. ....
..la
hsoo
n (g
arlic
)Ar
vii
iGr
een
Chilli
esj
iCa
rrot
(Gaj
ar)
jm
uli (
radd
ish)
1Ba
thua
•Po
tato
Pala
ki
Ging
er(A
drac
k)......
■""" H
....
. i!
Onio
nHa
ldi
Dhan
iafu
tM
eeth
i
1t i j i t
....
j i ■ i......
.....!
.. ......
_ .. .
... ...
j i

£>o\
Item
s / P
rodu
cts
Tota
l Pro
duce
dRe
tain
ed fo
r sel
f co
nsum
ptio
nSo
ld in
the
villa
geSo
ld in
nea
rby
villa
ges
Sold
in u
rban
m
arke
tSa
ving
s (q
nty.
) in
th
e fo
rm o
fQ
nty.
Va
lue
Qnt
y.
Valu
eQnt
y.
Valu
eQnt
y.Va
lue
See
ds
[~ O
ther
1
i--
----
------
---
----
----
----
----
---
-...
;i
Fodd
er■j..
....
..-..
-
gwar
i '
~i k
achr
ii
: kas
nii
......
iba
rsee
n!
-
jai
i iHa
richa
rii
fruits
!|
. .
i i--
-...
......
......
......
.........
—.
- -....-
- -
khar
buja
shat
oot
Ipa
pita
guav
aan
arta
rboo
jM
ango
1
i___
___
jh.......
....
i !
milk
chick
enie
ggs
imea
tfis
h
i 1 1i i
.. --
----
-_
-..-..
1
Agrl
residu
esbh
usa
- cha
na1
;
bhus
a - w
heat
ha
ri ch
ari
kadb
ico
tton
fuelwoo
d ar
har f
uelw
ood
......
......
......
......
......
......
......
...-
—...
i----
----
--
------
------
-----
----
----
--

Item
s 1 P
rodu
cts
Tota
l Pro
duce
dRe
tain
ed fo
r sel
f co
nsum
ptio
nSo
ld in
the
villa
geSo
ld in
nea
rby
villa
ges
Sold
in u
rban
m
arke
tSa
ving
s (q
nty.
) in
th
e fo
rm o
fQ
nty.
Val
ueQ
nty.
Va
lue
Qnt
y.
j Va
lue
Qnt
y.Val
ueSee
dsO
ther
sars
on fu
elwoo
d M
aize
Bhu
sa•
------
------
---
i Rice
Bhu
saTu
di1
’m
isc
,
! ear
then
war
ei
woo
den
item
s[
...
! leat
her i
tem
s Co
w D
ung
Cake
s■
1 ....."
■
Cow
Dun
g M
anur
e
i
serv
ices
■ j
j ........
earth
enwar
ewoo
den
item
sI
i leat
her i
tem
s1
ji
! bar
ber
ii
was
herm
an,
I
tailo
ri
wat
er sup
plie
ri i
blac
ksm
ithte
achi
ngdo
ctor
shop
si
i---
------
----
-- —
- ■ ■
- -
...
hote
lssm
all t
rade
- ■
!:
..
.
1 _ !
------
------
------
------
--
—---
------
-----
----.
.........-
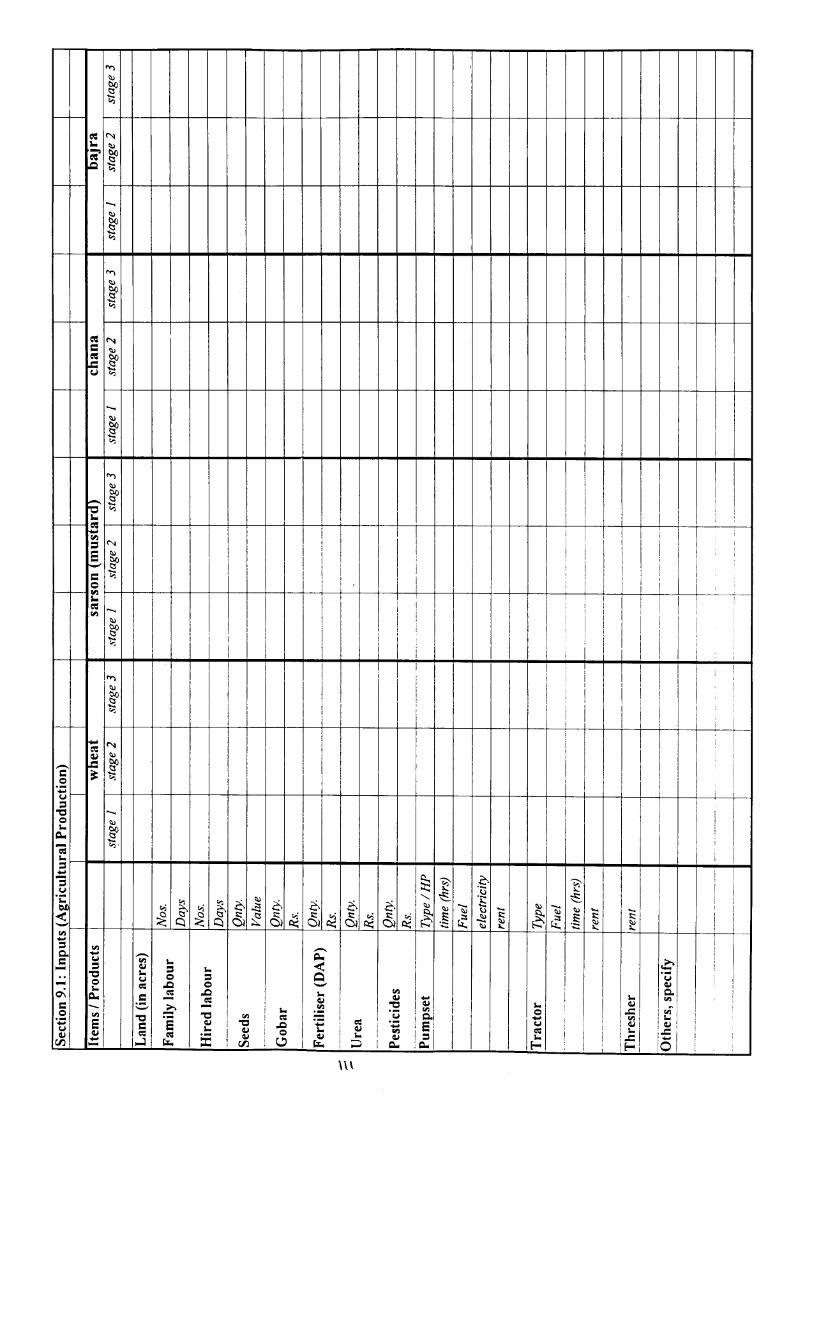
Sect
ion
9.1:
Inp
uts
(Agr
icul
tura
l Pro
duct
ion)
|Ite
ms /
Pro
duct
sw
heat
sars
on (
mus
tard
)ch
ana
bajr
ast
age
1st
age
2st
age
3st
age
Jst
age
2st
age
3st
age
1st
age
2st
age
3st
age
1st
age
2st
age
3
Land
(in
acre
s)
Fam
ily la
bour
Nos
.D
ays
Hire
d la
bour
Nos
.D
ays
Seed
sQ
nty.
Valu
e
Gob
arQ
nty.
Rs.
Ferti
liser
(DA
P)Q
nty.
Rs.
Ure
aQ
nty.
.Rs
.
Pest
icid
esQ
nty.
Rs.
Pum
pset
Type
/HP
time
(hrs
)F
uel
elec
tric
ityre
nt
Tra
ctor
Type
Fuel
------
------
------
time
(hrs
)re
nt
Thr
eshe
rre
nt
Oth
ers,
spe
cify
—..-
----
----
--..
......
...
--.
-....
...-.-
----
-....
......
......
.
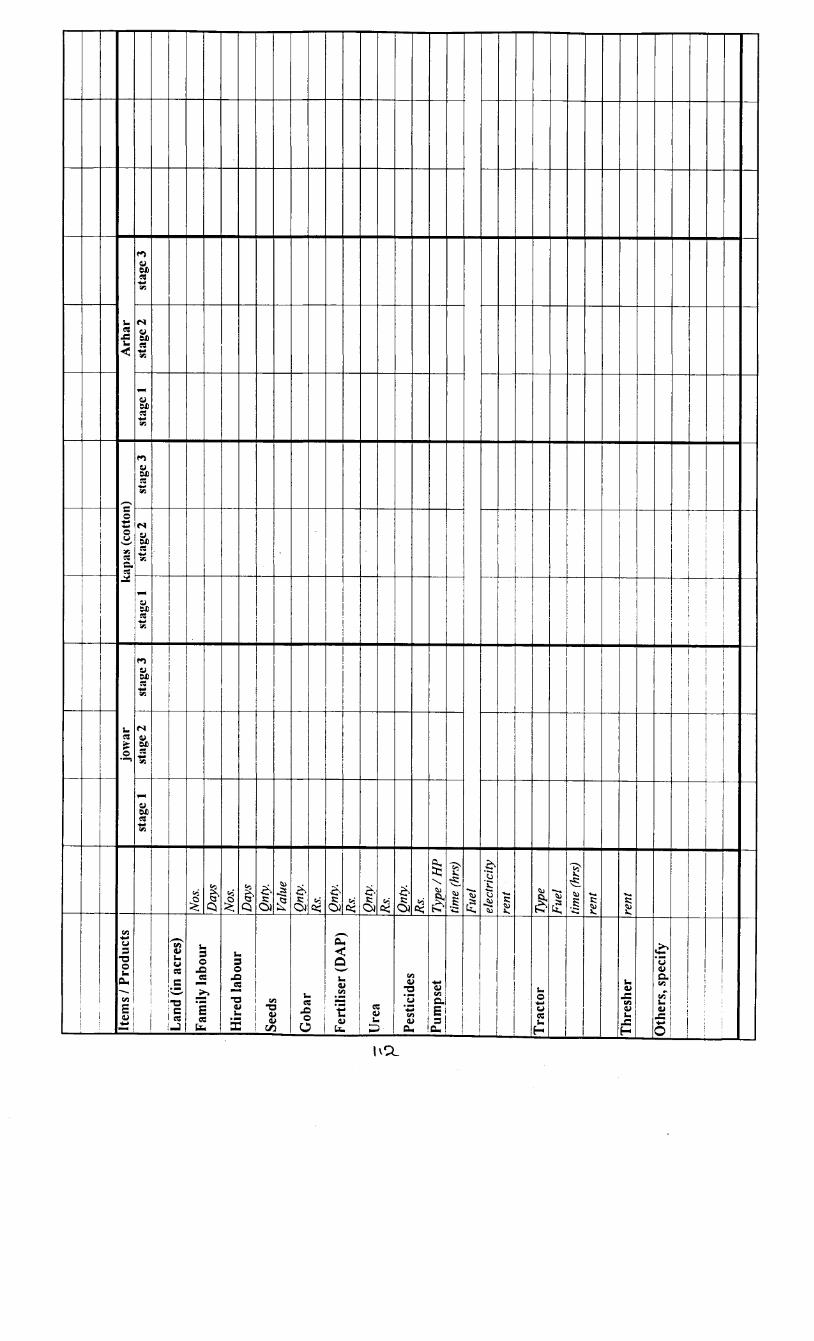
~tS'l
Item
s / P
rodu
cts
jow
arka
pas
(cot
ton)
Arh
arst
age
1st
age
2st
age
3st
age
1st
age
2st
age
3st
age
1st
age
2st
age
3
Land
(in
acre
s)
Fam
ily la
bour
Nos
.D
ays
Hire
d la
bour
Nos
.D
ays
Seed
sQn
ty-Va
lue
Gob
arQ
nty.
Rs.
Ferti
liser
(DA
P)Q
nty.
Rs.
Ure
aQ
nty.
Rs.
Pest
icid
esQ
nty.
Rs.
Pum
pset
Typ
e/H
Ptim
e (h
rs)
Fuel
elec
tric
ityre
nt
Tra
ctor
Type
Fue
ltim
e (h
rs)
rent
Thre
sher
rent
Oth
ers,
spe
cify
------
------
-----


Item
s / P
rodu
cts
Land
(in
ac
res)
Labo
ur E
mpl
oyed
1Se
eds
Fert
ilize
rs (
qnty
/ Rs)
Pest
icid
es
: |
Fam
ily L
abou
r;
Hired
Lan
our
; Qnt
y.Va
lue
Org
anic
Inor
gani
cN
os.
j da
ysN
os.
days
Ii
i|
, i
! 1
j j
i i
:j
; :
!!
: !
\j
, .. j
,!
i ;
Im
isc
■1
1 *
iea
rthen
war
e i'
!w
oode
n ite
ms
j |
! j
; leat
her i
tem
sj
ij
1j i
1 i
•1-
! i
' i
i; ;
Ii
: 1
1 !
j '
!
' 1
; !
: j
I j.
- ....-
..-.
......
[............
j,
: !
; j
- ...
...
, j
i __
__
.__
_j..
..........!
. .1.
.. . i
1 . .
1i
j [
: I
: ....
........
...."
i:
I j
! !
f |
| j
. .j
........
i . i
11
| j
. j•
- i
1;
! I
.
; ■ ■
t i
• i
Ii
i j
i!
; 1
------
------
------
: '
“ :
; .
...
- ..
.. ..
. .
J .
ji
; !
j .....I
__
! 1
! '
i 1
11
1
' :
i i
iI
| i
,i
1 !
i ;
i '
.
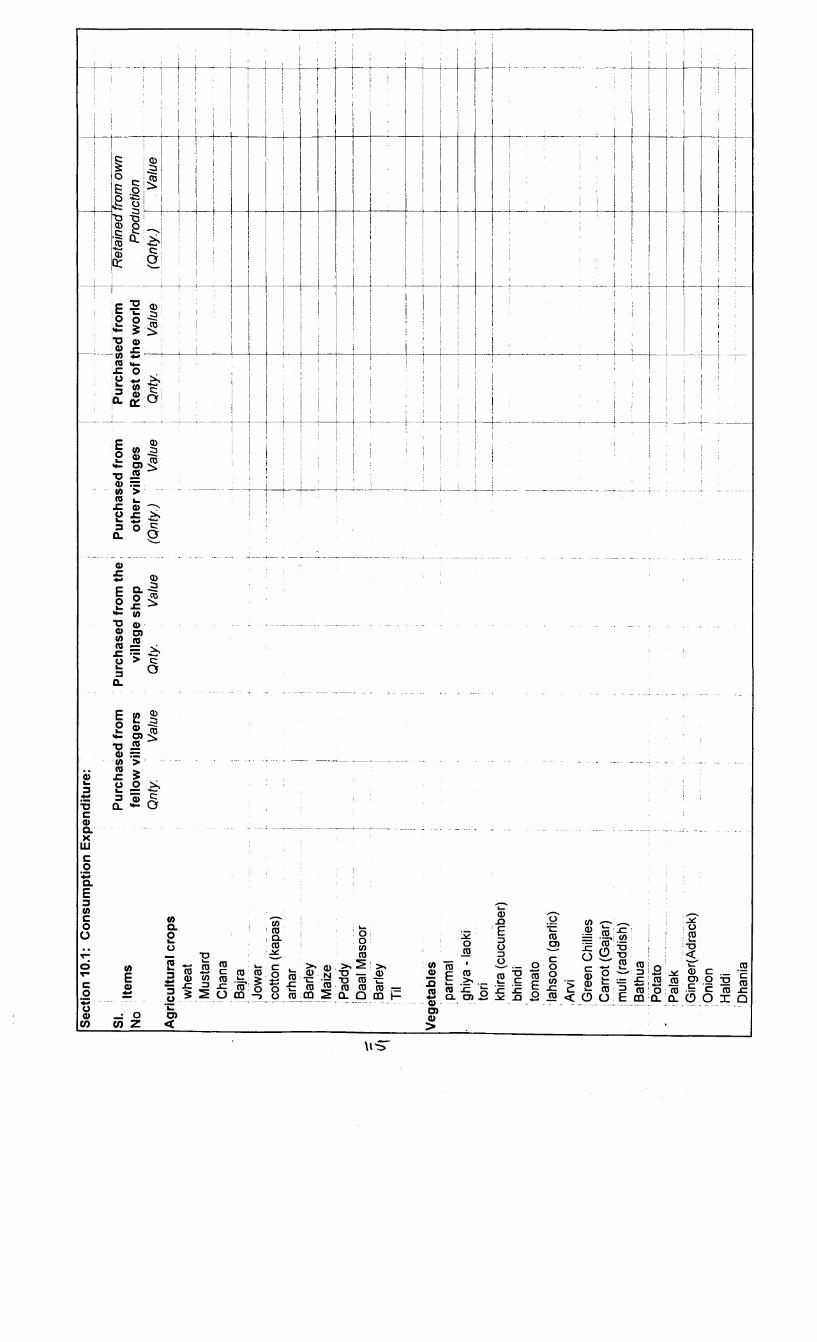
Sect
ion
10.1
: Co
nsum
ptio
n Ex
pend
iture
:i
!|
j1
: !
iSI
.I It
ems
Purc
hase
d fro
mPu
rcha
sed
from
the
Purc
hase
d fro
mPu
rcha
sed
from
Ret
aine
d fr
om o
wn
Nofe
llow
villag
ers
villa
ge s
hop
othe
r villag
esRe
st o
f the
wor
ldPr
oduc
tion
Qnt
y.Va
lue
Qnt
y.Va
lue
(Qnt
y.)
Valu
eQnt
y.Va
lue
(Qnt
y.)
Valu
eAg
ricul
tura
l cro
pswhe
ati .
ij M
usta
rdj
i |
ICha
na;
iBa
jrai
; !
Jow
ar:
! :
cotto
n (k
apas
)I
arha
r..
....
..i
' ■ ■
■ !
....
....
...
;..
....
.”"T
Barle
yM
aize
Padd
yi D
aal M
asoo
r..........
: Bar
ley
Til
....
, .. .
j .
. ..
.
i i
) t
|!
' 1
- -..
....
..-
iI
I |
LVe
geta
bles
i par
mal
1 :
, I
jghi
ya -
laok
ito
ri '
: |
khira
(cu
cum
ber)
1bh
indi
!to
mat
o'
lahs
oon
(gar
lic)
t
Arvi
: ;
1 i
t
Gree
n Ch
illies
I I
j ;
j :
jCa
rrot
(Gaj
ar)
muli (
radd
ish)
| I
i i
!Ba
thua
1 1
1 i
t...
....
....
| ;
: j
!Po
tato
|
: 1
; :
i! P
alak
j
; i
: :
IGi
nger
(Adr
ack)
|
| :
: i
i ...
.....
i ......
i
i i
j.I O
nion
j
1 ;
; j .
....
....
Hald
iDh
ania
i '
' !
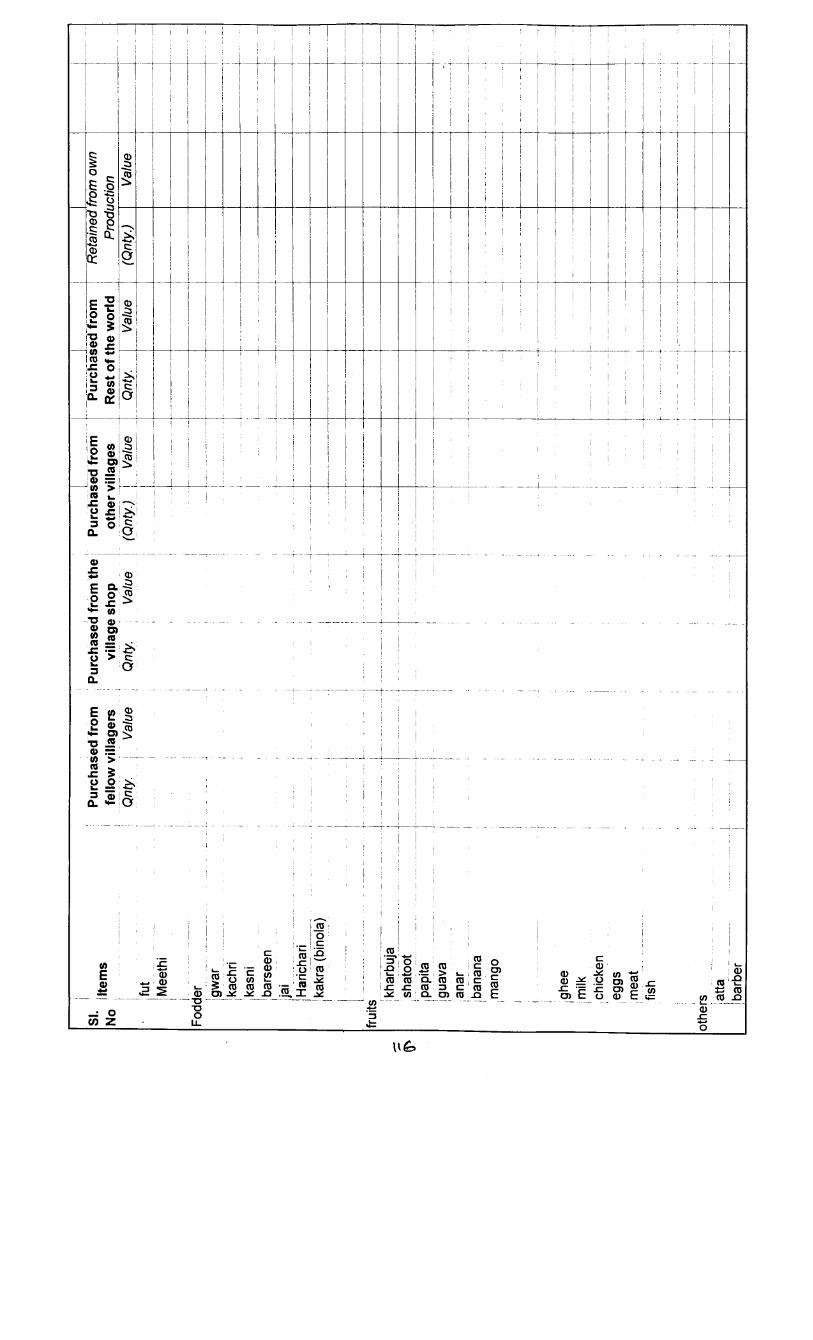
; ;
: ;
!|
|SI
.Ite
ms
Purc
hase
d fro
mPu
rcha
sed
from
the
Purc
hase
d fro
mPu
rcha
sed
from
Ret
aine
d fr
om o
wn
Nofe
llow
villag
ers
villa
ge s
hop
othe
r villag
esRe
st o
f the
wor
ldPr
oduc
tion
Qnt
y.Va
lue
Qnt
y.Va
lue
(Qnt
y.)..
Valu
eQnt
y.Val
ue(Q
nty.
)Va
lue
fut
|j
iM
eeth
ii
i.
| , i
Fodc
er...
......
.. I
i :
i i
gwar
i i
kach
rika
sni
bars
een
■ja
i;
j1
Haric
hari
kakr
a (b
inola)
fruits
khar
buja
shat
oot
t 1pap
ita|
"t 1gua
va-
|ana
r'
I1
: :
; ;
!|b
anan
ai i
Iman
go
||
1 ii
i j
i1
1 !
1 !
! i
! i
' '
"i 1
!|g
hee
ji
i i
imilk
i i
i i
}chick
enI
j !
:
!egg
s!
i ;
!m
eat
: !
fish
J '
; 1
I i
i i
- -
i...
........
!. ..
..
j ;
1i
othe
rs!
jatta
■ .......
■ • j -
- -1
• ......
| . ..
.
[bar
ber
! i
: t-

-k"
i 1I
SI.
Item
sP
urch
ased
fro
mP
urch
ased
fro
m t
heP
urch
ased
fro
mP
urch
ased
fro
mRet
aine
d fr
om o
wn
No
fello
w v
illag
ers
villa
ge s
hop
othe
r vi
llage
sR
est
of th
e w
orld
Prod
uctio
ni
Qnt
y.Va
lue
Qnt
y.|
Valu
eI
(Qnt
y.)
Valu
eQnt
y.Va
lue
(Qnt
y)Va
lue
jBar
ley(
Jhon
)'
batte
ry...
......
| ~
" "
|........
'\..
........
.1
Bese
n|
s1 j
Biri
i|..
...
blac
ksm
ithi
iBl
ade
i
! boo
ksI
bulb
s &
elec
tric
gadg
ets
ij
Bura
Cand
leCh
ura
(chu
ri)clo
thes
cook
ing
oil
! Jco
smet
ics!
1! d
iese
l & p
etro
li
| ..
.!
(doc
tor
;'ear
then
war
eelec
tricit
y\
elec
tricit
y1
!!
Gud
......
..
jt
■ -
■ t - - -
! 1ho
tels
1ke
rose
nekh
alleat
her i
tem
sj
LPG
ij m
edec
ines
Milk
pow
der
mus
tard
oil
I I
New
s Pa
per
i
pan
toba
cco&
intro
xica
nti
....-
......
Plas
tic W
are
-ric
esa
ltSh
akke
r !
shoe
s& c
happ
als
i

i i1
\ '
r...
......
....
......
......
....
i
SI.
NoIte
ms
Purc
hase
d fro
m
fello
w v
illag
ers
Purc
hase
d fro
m th
e vi
llage
sho
p|
Purc
hase
d fro
m
othe
r villag
esPu
rcha
sed
from
Re
st o
f the
wor
ldR
etai
ned
from
ow
n Pr
oduc
tion
Qnt
y.Va
lue
Qnt
y.!
Valu
e!
(Q
nt
y)
Valu
eQ
nty.
Valu
e(Q
nty.
)Va
lue
small t
rade
Soya
bin
Chun
ksp
ices
suga
rSu
gar(
Red)
swee
tsta
ilor
j...
......
......
...---
- --
------
------
------
------
------
------
-----—
......
......
.....
......
......
.....
-
tea
! 1
! .
..
..
..
...
.!
1 !
j
teac
hing
Tele
phon
e Bi
ll(PC
O)
Telp
hone
(bill)
i'
!...
......
......
......
......
......
...j
i---
------
------
------
------
------
---, -
......
......
....-
-
toile
terries
& co
smet
icsj.
......
......
. _
. j
trave
lling
expd
was
herm
an
i I!
!
j
1 •
- -
......
......
......
......
...-.
..-
- - .
......
....-
.....
—
wat
er sup
plie
ri w
oode
n ite
ms
I ! | i ji
;i j
------
------
------
------
----
■i
i.,-■
- -
------
------
---- -
------
------
----
------
------
------
------
------
------
--
i ii
i j !
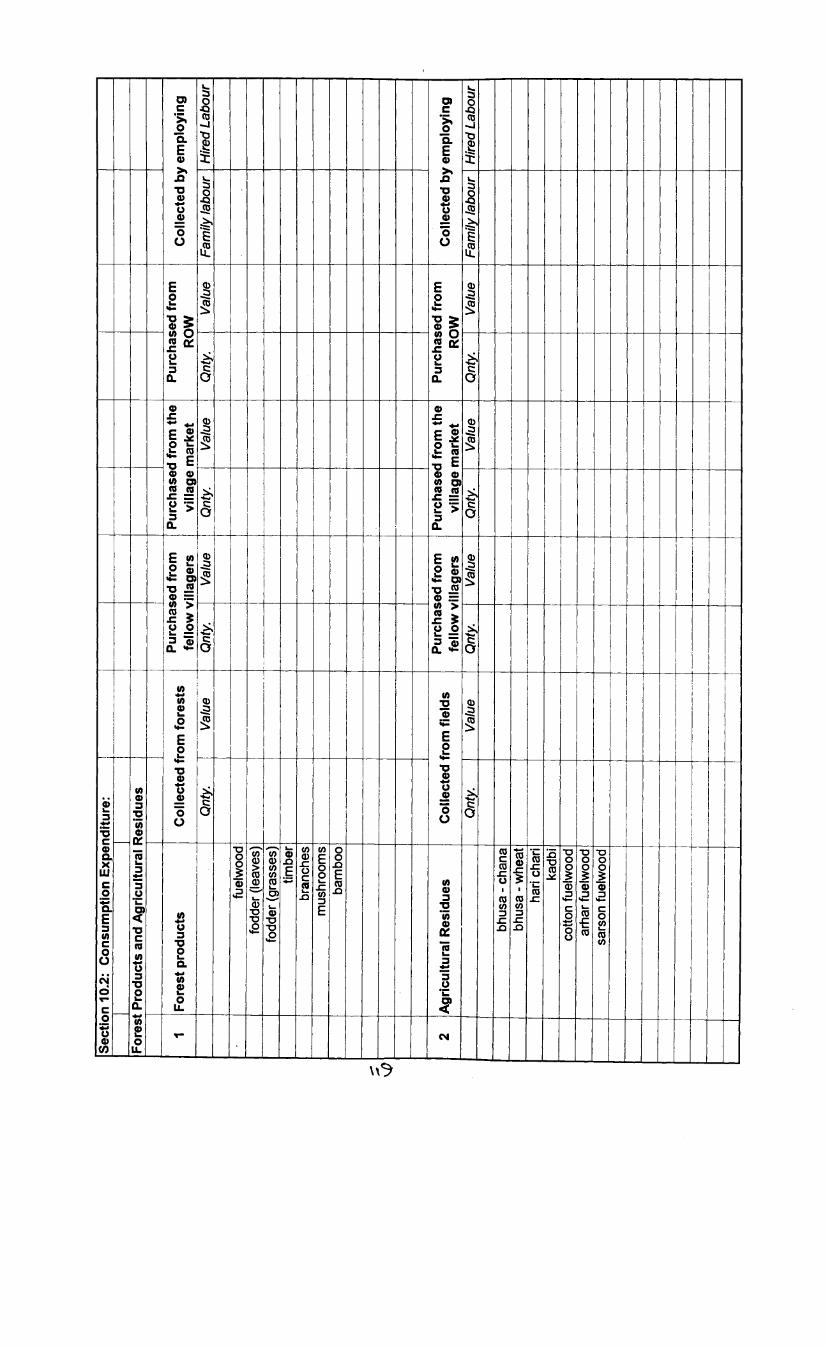
Sect
ion
10.2
: C
onsu
mpt
ion
Expe
ndit
ure:
Fore
st P
rodu
cts
and
Agr
icul
tura
l R
esid
ues
1Fo
rest
pro
duct
sC
olle
cted
fro
m f
ores
tsP
urch
ased
fro
m
fello
w v
illag
ers
Pur
chas
ed f
rom
the
vi
llage
mar
ket
Pur
chas
ed f
rom
R
OW
Col
lect
ed b
y em
plo
ying
Qnt
y.Va
lue
Qnt
y.Val
ueQ
nty.
Valu
eQ
nty.
Valu
eFa
mily
labo
urH
ired
Lab
our
fuel
woo
dfo
dder
(lea
ves)
fodd
er (g
rass
es)
timbe
rbr
anch
esm
ushr
oom
sba
mbo
o
>
2A
gric
ultu
ral
Res
idue
sC
olle
cted
fro
m f
ield
sP
urch
ased
fro
m
fello
w v
illag
ers
Pur
chas
ed f
rom
the
vi
llage
mar
ket
Pur
chas
ed f
rom
R
OW
Col
lect
ed b
y em
ploy
ing
Qnt
y.Va
lue
Qnt
y.Va
lue
Qnt
y.Va
lue
Qnt
y.Val
ueFa
mily
labo
urH
ired
Lab
our
bhus
a - c
hana
bhus
a - w
heat
hari
char
ika
dbi
cott
on f
uelw
ood
arha
r fue
lwoo
dsa
rson
fue
lwoo
d
I
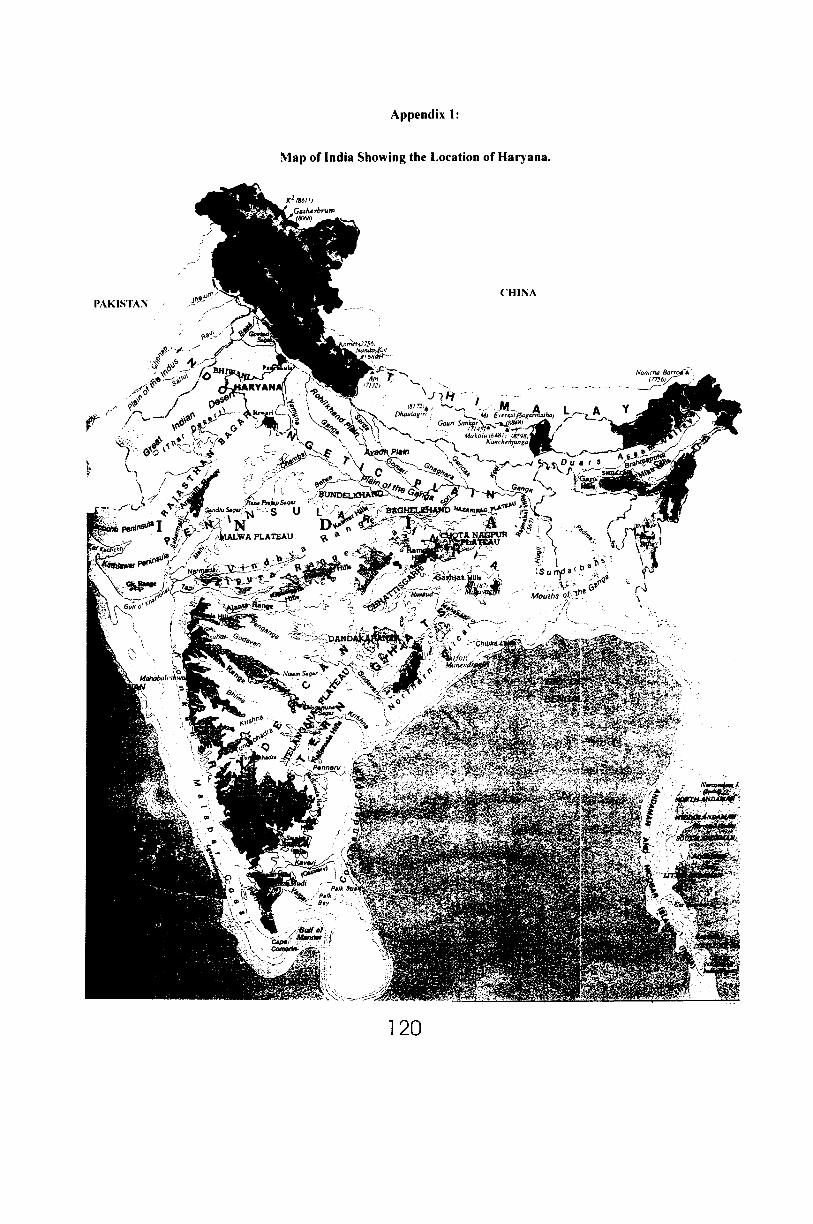
A ppendix 1:
Map of India Showing the Location of Haryana.
PAKISTAN
120
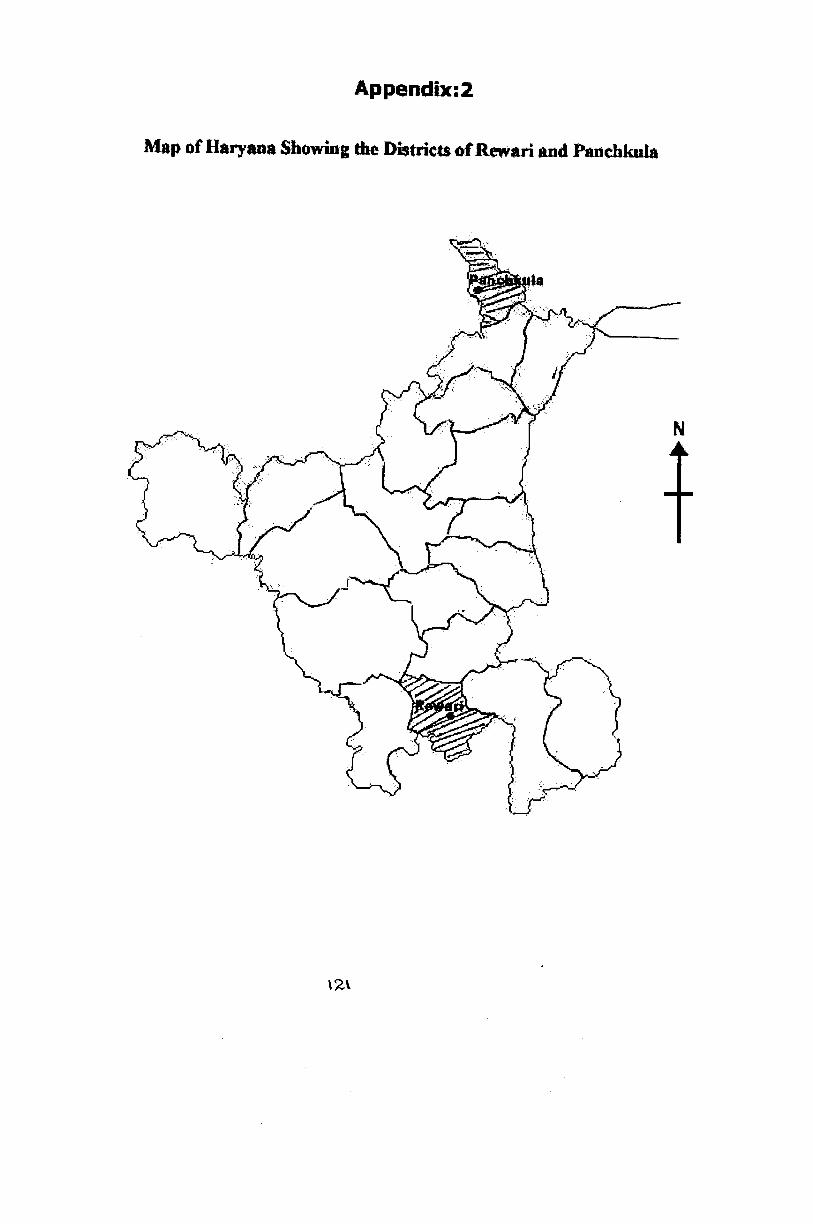
Appendix:!
Map of Haryana Showing the Districts o f Rewari and Panchkula

Appendix 3:Map of village Pauti
Map not to Scale
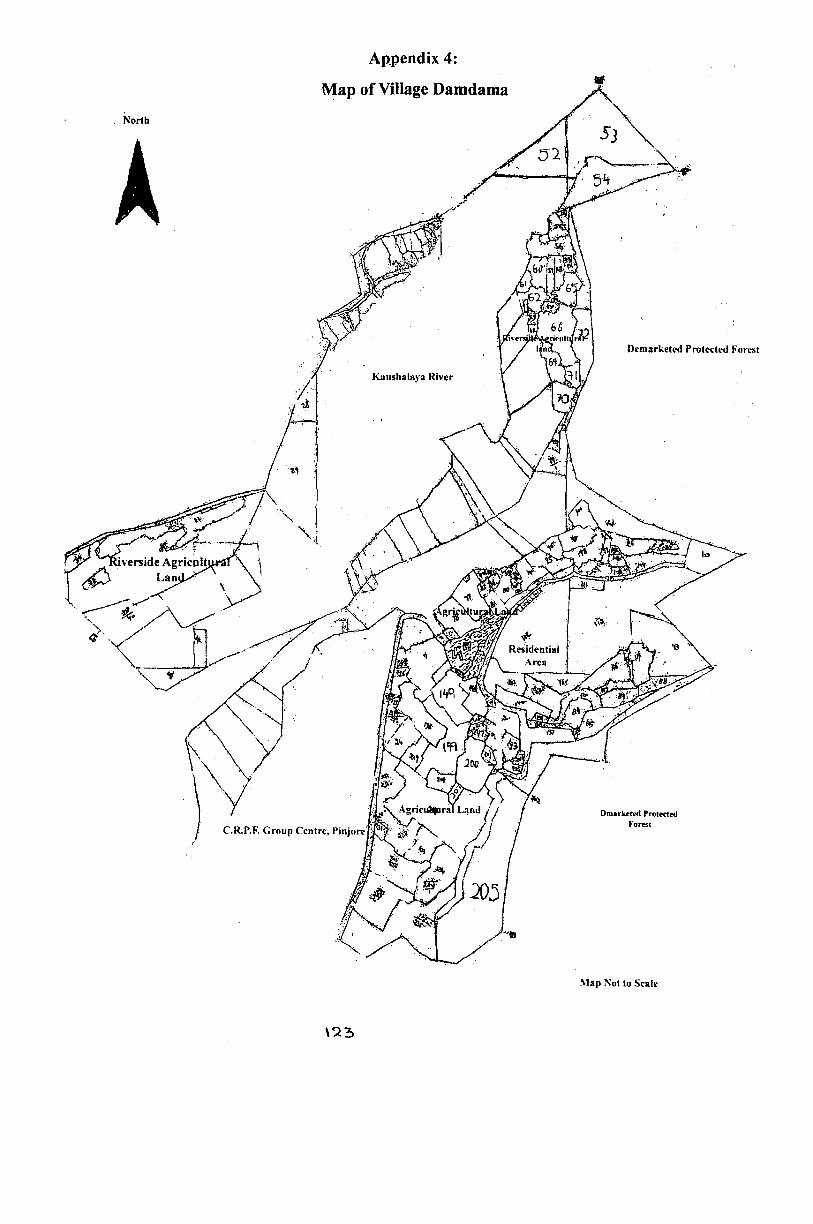
Appendix 4:
Map of Village Damdama
North
Demarketed Protected Forest
Dmarketed Protected Forest
Map Not to Scale
\23