Embed Size (px)
Citation preview

Questionnaire
FOREST PRODUCTS CONVERSION FACTORS
Please list the name of your country here
If these data are only representative of a particular segment of a country, please specify
Correspondents name, institute
Deadline: 15 September 2016
Note: The data on conversion factors are to be filled in directly in the data tables (blue text) for the eight
categories of factors. The black text is the explanatory text taken from the last UNECE/FAO Forest Products
Conversion Factors publication (ECE/TIM/DP/491).There are eight sections of this questionnaire, each with a
table for entering your conversion factors. The most important factors are in rows marked in green on the left,
please prioritise these. Correspondents are encouraged to read the explanatory text prior to entering factors in
each section. The questionnaire is pre-filled with the data from ECE/TIM/DP/49. If data on your country from
this study is already present, please feel free to overwrite the old figures for your country with any updated
figures and to fill in any fields which were previously blank. The questionnaire was developed by the
UNECE/FAO Conversion Factors Task Force in 2008 and every attempt was made to include factors that the
Task Force thought were important, however, if something important is missing, please feel free to write it
into the questionnaire in the relevant section.
Please feel free to contact the project coordinator (Matt Fonseca) at the UNECE/FAO Forestry and Timber
Section if you have any questions or need assistance with interpreting questions:
Email: [email protected]
Phone: +41.22.917.1846
1 ECE/TIM/DP/49, Forest Products Conversion Factors for the UNECE Region can be downloaded at:
http://www.unece.org/fileadmin/DAM/timber/publications/DP-49.pdf


ii ____________________________________________________________Forest products conversion factors questionnaire 2016
C O N T E N T S
(Questionnaire tables are highlighted in yellow)
Page List of Abreviations .......................................................................................................................................................... iii
INTRODUCTION .......................................................................................................................................................... 1
1. ROUNDWOOD .......................................................................................................................................................... 3 1.1 Volumetric measurement .................................................................................................................... 3
1.1.1 Cubic volume ................................................................................................................................... 3 1.1.2 Board foot log rules .......................................................................................................................... 4
1.2 Weight and physical properties .......................................................................................................... 5 1.2.1 Wood density .................................................................................................................................... 5 1.2.2 Moisture content ............................................................................................................................... 5 1.2.3 Bark and other unmeasured volume ............................................................................................... 6
1.3 Roundwood (please update or enter new data in yellow column) ...................................................... 7 2. WOOD PARTICLES .......................................................................................................................................................... 8 2.1 Volumetric measurement .................................................................................................................... 8 2.2 Weight ....................................................................................................................................... 8 2.3 Wood particles (please update or enter new data in yellow column) ................................................. 9 3. SAWNWOOD ........................................................................................................................................................ 10 3.1 Volumetric measurement .................................................................................................................. 10
3.1.1 Cubic volume ................................................................................................................................. 10 3.1.2 Board foot volume.......................................................................................................................... 11
3.2 Weight ..................................................................................................................................... 11 3.3 Material balance ............................................................................................................................... 11 3.4 Sawnwood (please update or enter new data in yellow column) ...................................................... 12 4. VENEER AND PLYWOOD ............................................................................................................................................ 13 4.1 Volumetric and surface measurement ............................................................................................... 13 4.2 Weight ..................................................................................................................................... 13 4.3 Material balance ............................................................................................................................... 13 4.4 Plywood (please update or enter new data in yellow column).......................................................... 14 5. PANELS MADE OF WOOD PARTICLES ................................................................................................................... 15 5.1 Volumetric and surface measurement ............................................................................................... 15 5.2 Weight ..................................................................................................................................... 15 5.3 Panels made from wood particles (please update or enter new data in yellow column) ................... 16 6. WOOD PULP AND PAPER ............................................................................................................................................. 17 6.1 Weight ..................................................................................................................................... 17 6.2 Wood pulp and paper (please update or enter new data in yellow column) ..................................... 18 7. ROUND AND SPLIT WOOD PRODUCTS .................................................................................................................. 19 7.1 Volumetric and surface measurement ............................................................................................... 19 7.2 Weight ..................................................................................................................................... 19 7.3 Material balance ............................................................................................................................... 20 7.4 Round and split wood products (please update or enter new data in yellow column) ...................... 20 8. ENERGY WOOD PRODUCTS AND PROPERTIES ................................................................................................. 21 8.1 Volumetric measurement .................................................................................................................. 21 8.2 Weight ..................................................................................................................................... 21 8.3 Energy values ................................................................................................................................... 21 8.4 Energy wood products and properties (please update or enter new data in yellow column) ............ 22 ANNEX ........................................................................................................................................................ 23
Forest products conversion factors questionnaire 2016 ___________________________________________________________ iii
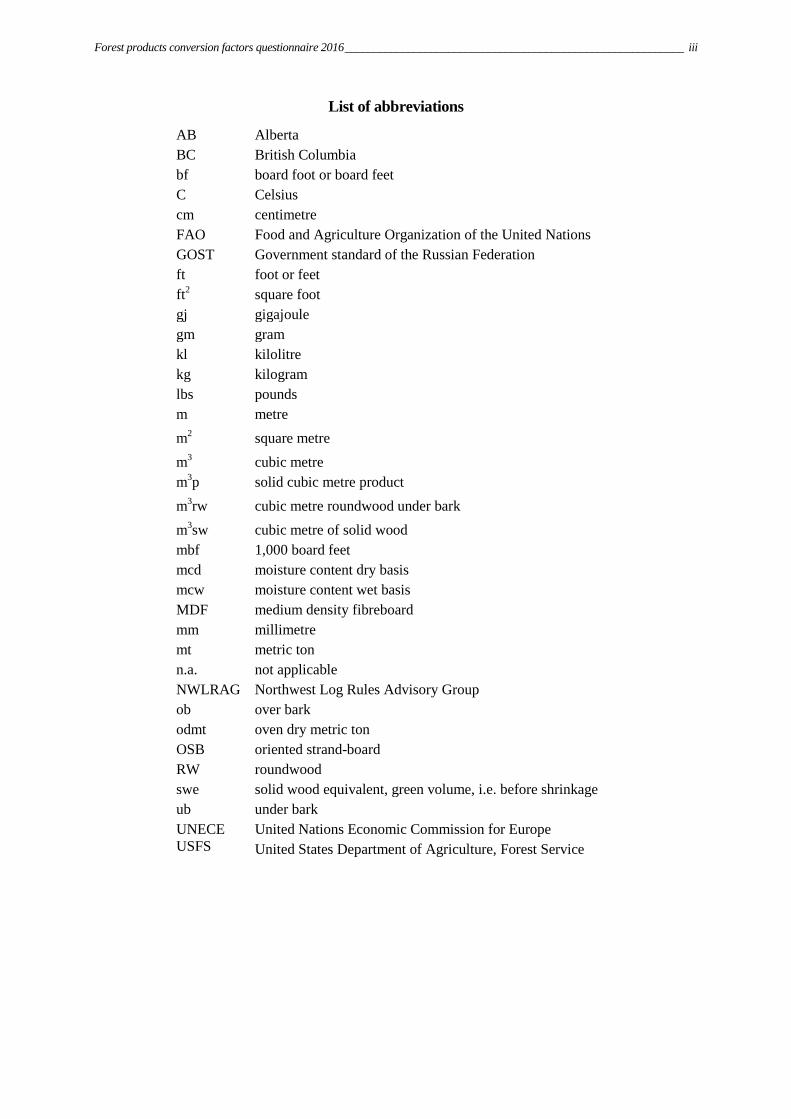
List of abbreviations
AB Alberta
BC British Columbia
bf board foot or board feet
C Celsius
cm centimetre
FAO Food and Agriculture Organization of the United Nations
GOST Government standard of the Russian Federation
ft foot or feet
ft2 square foot
gj gigajoule
gm gram
kl kilolitre
kg kilogram
lbs pounds
m metre
m2 square metre
m3 cubic metre
m3p solid cubic metre product
m3rw cubic metre roundwood under bark
m3sw cubic metre of solid wood
mbf 1,000 board feet
mcd moisture content dry basis
mcw moisture content wet basis
MDF medium density fibreboard
mm millimetre
mt metric ton
n.a. not applicable
NWLRAG Northwest Log Rules Advisory Group
ob over bark
odmt oven dry metric ton
OSB oriented strand-board
RW roundwood
swe solid wood equivalent, green volume, i.e. before shrinkage
ub under bark
UNECE United Nations Economic Commission for Europe
USFS United States Department of Agriculture, Forest Service

Forest products conversion factors questionnaire 2016 ____________________________________________________________ 1
INTRODUCTION
The term “forest products conversion factors” is used to cover a broad spectrum of ratios utilized in the wood-
based forest resource, manufacturing, and energy sectors. For the purpose of this publication, conversion factor is
defined as using a known figure to determine or estimate an unknown figure via a ratio. Often these ratios are
exact, for example converting cubic feet to cubic metres (there is exactly 35.315 cubic feet in a cubic metre).
Annex table 1 is a listing of some of the exact conversion factors (equivalents) relevant to forest products.
Often ratios are not exact, but rather a good average; for example, a cubic metre (under bark volume) of
freshly felled Norway spruce sawlogs may average 860 kg of which 80 kg is bark and 780 kg is wood (with
both bark and wood containing a certain amount of moisture), but might vary as a result of wood density,
moisture content, the presence or lack of bark, etc.
In other instances, conversion factors may have little meaning unless some of the parameters of the
numerator and the denominator of the ratio are known. For example: a cubic metre of logs with an average
small end diameter of 15 cm might make 0.41 m3 of sawnwood, while a cubic metre of logs with an
average small-end diameter of 60 cm might make 0.63 m3 (50% more), given the same level of processing
efficiency in a sawmill. That is not to say that a single factor to convert roundwood to sawnwood cannot be
used; it can be done with an accurate factor and when looking at a large population in the aggregate. When
looking at a lower level, however, factors that account for various parameters are better suited (e.g. a mill or
a subregion that only processes small logs).
Related to forest product conversion factors, is the use of the “material balance” The sawnwood example
above could lead to the incorrect assumption that only 41% of the wood fibre in the 15 cm sawlog and 63%
of the 60 cm sawlog were utilized. In fact, almost 100% of the wood in each of these logs may have been
utilized. The remaining non-sawnwood volume went to several wood residues having other and often
distinct uses. For example: a cubic metre of 15 cm sawlogs could have a material balance of 41%
sawnwood, 43% chips (raw material for paper, panels, wood energy, etc.), 9% sawdust (for making energy
pellets, particleboard, MDF, etc.) and finally 7% shavings (particle board, MDF, animal bedding and wood
energy, etc.). The components balance with 100%. Although not part of the material balance, as the log
volume was represented as under bark, one might also apply a conversion factor to this scenario to estimate
that 80 kg of bark (with moisture) are potentially available from each cubic metre of roundwood (measured
under bark) for energy or other uses. Note that material balances are used at a manufacturing plant level, a
sector level, or can be constructed to account for the cascading uses of wood raw material in a country,
subregion, or region
Logs and their subsequent products have a predisposition towards inexact conversion factors, as a result of the
wide range of shape and form, the variability of physical properties (density, moisture content and shrinkage),
and other natural variables that affect conversion factors, such as species, size, defects or provenance. Wood
fibre is also hygroscopic, thus its volume and weight change once dried in a kiln or exposed to the atmosphere.
In addition, there are external biases that also have to be accounted for, such as differences in measurement
procedures which often reflect a unit volume differently than another standard does. Finally, there are differences
that occur as a result of product-manufacturing efficiency levels and utilization practices.
Conversion factors general use
Conversion factors have long been utilized by the forest sector as a tool for analysing forests and forest
products manufacturing facilities. Virtually every aspect of forecasting and analysis in the forest sector is
somehow touched by conversion factors. Silvicultural growth models, biomass calculations, carbon
sequestered in the forest, timber sale appraisals, to name just a few, are all dependent on conversion factors.
A practical example of this would be a timber sale appraisal that a sawmill is conducting to determine a bid
price. The stand volume may be reported in cubic metres over bark but the purchaser may need to convert
these volumes into inside bark volumes, weight or board feet2 to match their units of measure. To
2 A board foot is ostensibly the equivalent volume of a board that is 1 inch thick x 1 foot wide x 1 foot long (0.00236 m3).
2 ____________________________________________________________Forest products conversion factors questionnaire 2016
determine the value of the timber, the purchaser will need to know the cost of getting the timber from the
stump to the mill site, thus weight to volume ratios are likely to be an important parameter for determining
weight-based transport costs. Primary product recovery will need to be estimated using conversion factors
from roundwood to the primary product, e.g., 2 m3 roundwood will produce 1 m
3 sawnwood. A material
balance will be used to determine the quantity and thus value of the residual products made, and finally,
ratios may be used to estimate the quantity of unmeasured products from the timber sale such as bark and
logging residue (top-wood, limbs, foliage) which may be profitable to utilize for energy or other purposes.
Conversion factors covering the input of raw material to output of forest products are a good indication of
efficiency levels and thus are often used to benchmark a manufacturing facility’s effectiveness at
converting raw materials into finished or semi-finished products.
International data providers often use conversion factors for converting from one unit to another, e.g., using
trade statistics based on weight to convert to volume in m3. It is also common to use conversion factors for
estimating the unknown quantities of a forest product from known quantities. An example of this would be
using conversion factors for determining the raw materials needed to produce the reported pulp production
and subtracting the net apparent consumption of chips to estimate pulp log production when this
component was not reported.
At a higher level, policy analysts and policymakers may utilize conversion factors to determine the
sequestered carbon in the forests of their country.
Finally, outlook studies on long-term wood availability depend on conversion factors to predict needed raw
materials to match the forecasted demand of wood and paper products.
Forest products conversion factors questionnaire 2016 ____________________________________________________________ 3
1. ROUNDWOOD
The conversion factors requested in this questionnaire relate to two areas: 1. physical properties; and
2. national method of measuring roundwood as it relates to the “true volume”. Note that true volume of
roundwood for the purposes of this questionnaire and for UNECE/FAO/ITTO statistics on roundwood
volume always means under bark volume and assumes the use of a logical cubic formula (one that
approximates the volume of the log form) and unbiased rounding logic. Conversion factors for roundwood
are often used to convert from one unit of measure to another, e.g., from weight to volume. Additionally,
conversion factors within the same units are also quite common, e.g. a cubic metre of roundwood measured
by the national standard in one country may be different if measured by the national standard of another
country.
1.1 Volumetric measurement
1.1.1 Cubic volume
Assessing the volume of roundwood is typically referred to as log scaling. In general, log scales attempt to
either predict the displaced volume of the log (cubic log scale), or as is the case in the United States and
some regions of Canada, in units of predicted output of sawnwood (board foot log rule).
One of the questions asked in the questionnaire is: “what is the ratio of volume as determined by your
national standard to a m3 of true volume?” As mentioned above, “true volume” is defined as the volume as
determined using a logical cubic formula (one that approximates the volume of the log form) and unbiased
rounding logic. There are a number of different cubic formulas, e.g. Smalian, Huber, Newton, centroid, or
two-end conic, most with potential strengths and weaknesses which are dependent on log dimensions and
form. All of the aforementioned cubic formulas will give similar results most of the time when
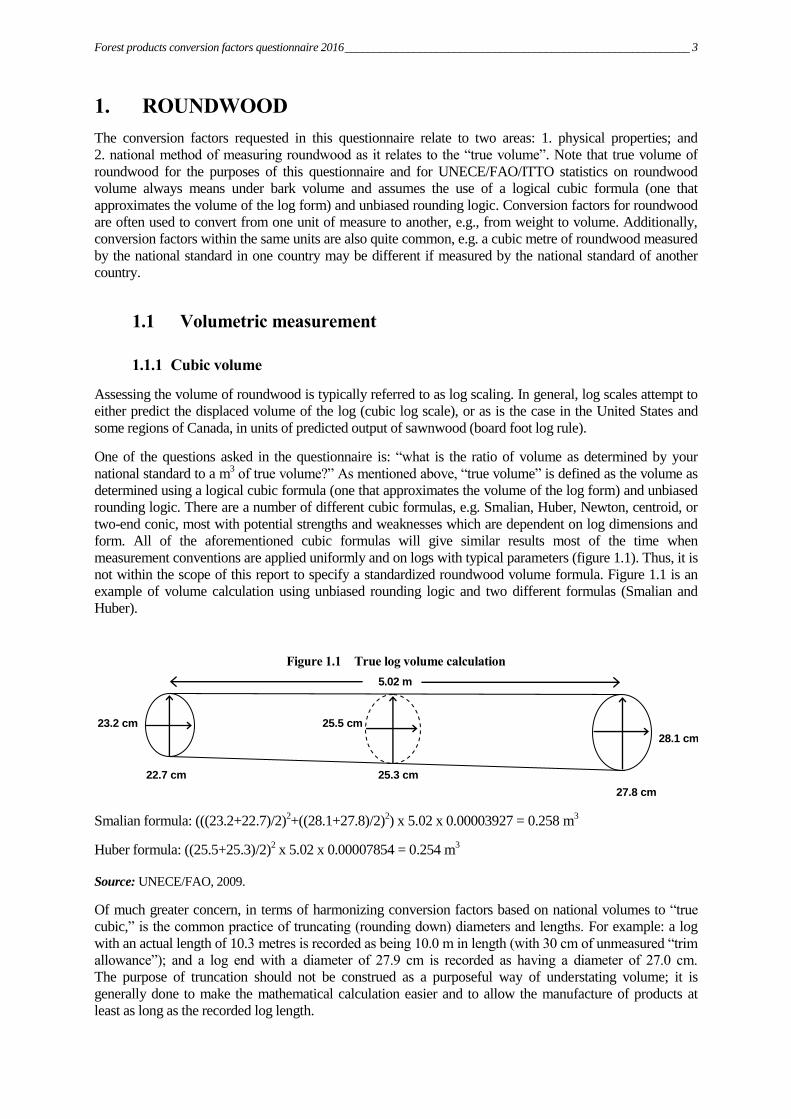
measurement conventions are applied uniformly and on logs with typical parameters (figure 1.1). Thus, it is
not within the scope of this report to specify a standardized roundwood volume formula. Figure 1.1 is an
example of volume calculation using unbiased rounding logic and two different formulas (Smalian and
Huber).
Figure 1.1 True log volume calculation
23.2 cm 25.5 cm
28.1 cm
22.7 cm 25.3 cm
27.8 cm
Smalian formula: (((23.2+22.7)/2)2+((28.1+27.8)/2)
2) x 5.02 x 0.00003927 = 0.258 m
3
Huber formula: ((25.5+25.3)/2)2 x 5.02 x 0.00007854 = 0.254 m
3
Source: UNECE/FAO, 2009.
Of much greater concern, in terms of harmonizing conversion factors based on national volumes to “true
cubic,” is the common practice of truncating (rounding down) diameters and lengths. For example: a log
with an actual length of 10.3 metres is recorded as being 10.0 m in length (with 30 cm of unmeasured “trim
allowance”); and a log end with a diameter of 27.9 cm is recorded as having a diameter of 27.0 cm.
The purpose of truncation should not be construed as a purposeful way of understating volume; it is
generally done to make the mathematical calculation easier and to allow the manufacture of products at
least as long as the recorded log length.
5.02 m
4 ____________________________________________________________Forest products conversion factors questionnaire 2016
There are other areas that also create discrepancies between log scales, such as the reduction of volumes for
defects vs. not accounting for defect with a volume reduction, but rather using a value reducing mechanism
such as log grade. Additionally, some national and subregional log scaling standards treat the log as a
cylinder with a diameter of the small-end of the log; assume the log form is a cylinder with the diameter
that exists in the middle of the log length; or use assumed taper rates to establish diameters other than the
small-end. Additionally, some national standards calculate the over bark volume. All of these differences
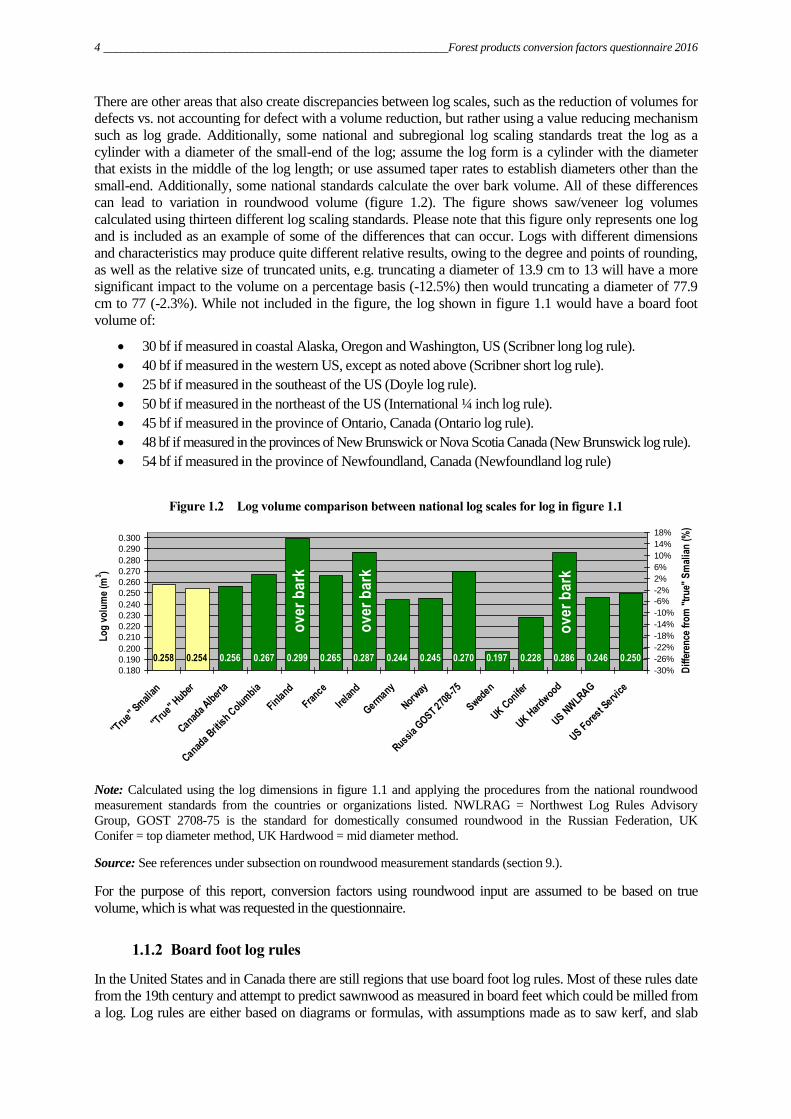
can lead to variation in roundwood volume (figure 1.2). The figure shows saw/veneer log volumes
calculated using thirteen different log scaling standards. Please note that this figure only represents one log
and is included as an example of some of the differences that can occur. Logs with different dimensions
and characteristics may produce quite different relative results, owing to the degree and points of rounding,
as well as the relative size of truncated units, e.g. truncating a diameter of 13.9 cm to 13 will have a more
significant impact to the volume on a percentage basis (-12.5%) then would truncating a diameter of 77.9
cm to 77 (-2.3%). While not included in the figure, the log shown in figure 1.1 would have a board foot
volume of:
30 bf if measured in coastal Alaska, Oregon and Washington, US (Scribner long log rule).
40 bf if measured in the western US, except as noted above (Scribner short log rule).
25 bf if measured in the southeast of the US (Doyle log rule).
50 bf if measured in the northeast of the US (International ¼ inch log rule).
45 bf if measured in the province of Ontario, Canada (Ontario log rule).
48 bf if measured in the provinces of New Brunswick or Nova Scotia Canada (New Brunswick log rule).
54 bf if measured in the province of Newfoundland, Canada (Newfoundland log rule)
Figure 1.2 Log volume comparison between national log scales for log in figure 1.1
0.256 0.267 0.299 0.265 0.287 0.244 0.245 0.270 0.197 0.228 0.286 0.246 0.2500.258 0.254
0.180
0.190
0.200
0.210
0.220
0.230
0.240
0.250
0.260
0.270
0.280
0.290
0.300
"Tru
e" Sm
alia
n
"Tru
e" Huber
Canada
Alber
ta
Canada
Britis
h Colu
mbia
Finla
nd
France
Irela
nd
Germany
Norway
Russia
GOST 270
8-75
Sweden
UK Conife
r
UK Har
dwood
US NW
LRAG
US Fore
st Serv
ice
Lo
g v
olu
me
(m3 )
-30%
-26%
-22%
-18%
-14%
-10%
-6%
-2%
2%
6%
10%
14%
18%
Dif
fere
nce
fro
m "
tru
e" S
mal
ian
(%
)
Note: Calculated using the log dimensions in figure 1.1 and applying the procedures from the national roundwood
measurement standards from the countries or organizations listed. NWLRAG = Northwest Log Rules Advisory
Group, GOST 2708-75 is the standard for domestically consumed roundwood in the Russian Federation, UK
Conifer = top diameter method, UK Hardwood = mid diameter method.
Source: See references under subsection on roundwood measurement standards (section 9.).
For the purpose of this report, conversion factors using roundwood input are assumed to be based on true
volume, which is what was requested in the questionnaire.
1.1.2 Board foot log rules
In the United States and in Canada there are still regions that use board foot log rules. Most of these rules date
from the 19th century and attempt to predict sawnwood as measured in board feet which could be milled from
a log. Log rules are either based on diagrams or formulas, with assumptions made as to saw kerf, and slab
ov
er
ba
rk
ov
er
ba
rk
ov
er
ba
rk
Forest products conversion factors questionnaire 2016 ____________________________________________________________ 5
loss. Except for the International ¼” rule, log segments were considered to be a cylinder having no taper. A
US study used a population of 175 logs to model the conversion factors of various board foot rules used in
North America and found that the board foot per cubic metre3, for just the Scribner rules (of which there are
three subregional variants), ranged, on average, from as little as 108 (9.26 m3/1,000 board feet [mbf]) for logs
with a small-end diameter of 4.5 to 7.49 inches to as much as 246 (4.06 m3/mbf) for logs with a small-end
diameter over 15.5 inches (Fonseca, 2005).
1.2 Weight and physical properties
The weight of roundwood generally correlates well with the volume. In many areas of the world,
roundwood is bought and sold via weight. Usually weight is used in conjunction with sample volume
measurement in order to establish the relationship. The presence of drive-on weight scales along many
transportation routes, national ports of entry, and at many industries that consume roundwood, make this
data readily available and inexpensive to ascertain relative to taking measurements on all logs. There are a
number of factors which determine the weight of a given amount of roundwood volume.
1.2.1 Wood density
Wood is structured with cell walls and void spaces. Wood cell walls all have about the same basic density,
regardless of species, approximately 1,560 kg per m3, (Van Vuuran, et al. 1978). What varies is the amount
of wood material to cell cavity area.
Wood density is typically measured as a ratio of the weight of oven dry fibre per m3 (basic density), or in the
unitless measure of specific gravity, which is an index of the relationship of said material to the same volume
of water (water weighs 1,000 kg/m3). For example, a cubic metre of wood (volume measured when green),
without any water weighs 400 kg; it has a basic density of 400 kg/m3 and a specific gravity of 0.40. In the
UNECE region basic density (green volume and oven dry weight) will vary from approximately 290 kg/m3 to
540 kg/m3 for coniferous wood, while non-coniferous will vary from about 320 kg/m
3 to 800 kg/m
3 (USDA
Forest Service, Forest Products Laboratory, 1999) and (Austrian Energy Agency, 2009).
When using published averages for calculating the basic density or specific gravity of a species, be careful
to note whether the volume was established in the green state (prior to shrinkage) or in the dry state (after
shrinkage), as wood volume in the UNECE region will shrink approximately 10% for coniferous species
and about 15% for hardwood species when taken from green to a fully dry state. The exact amount of
shrinkage will vary from one species to another and even from one sample of the same species to another.
Basic density (specific gravity x 1,000) based on green volume and oven dry weight (0% moisture) is the
standard for this questionnaire. This has the advantage of being applicable to standing tree volume and
roundwood without having to know or estimate volumetric shrinkage.
1.2.2 Moisture content
Freshly cut wood (also referred to as “green”) contains large amounts of water, both in the cell cavities
(free water) and within the cell walls themselves (bound water). Normally the moisture content is measured
in terms of the weight of the moisture relative to the weight of the dry wood fibre. For example, if wood
weighs 812 kg/m3 in the green state, and 400 kg m
3 in the oven dry state (devoid of moisture), it is said to
have 103% moisture content “dry basis” (mcd). In this example the wood had 400 kg of wood and 412 kg
of moisture. Therefore, dividing the weight of the moisture by the weight of the dry wood gives the
moisture content. Note that freshly cut wood can vary from 30% mcd to more than 200%.
Moisture content can also be reflected via the ratio of moisture weight to the total weight of the wood fibre
plus moisture content, which is referred to as moisture content “wet basis” (mcw). This is typically used for
measuring the moisture content of wood particles, wood for energy, and pulp and paper, which will be
3 The roundwood measurement standard of the province of British Columbia, Canada (B.C. Firmwood) was chosen as the index
because it has unbiased rounding logic and uniform application of formulas and measurements.
6 ____________________________________________________________Forest products conversion factors questionnaire 2016
elaborated upon further in sections 2 and 6. This method is not normally used for solid wood, as the
numerator is made up partly by the denominator.
It is also important to note that the moisture content of the wood and bark of many species has distinct seasonal
variation while others may have little if any differences.
Finally, the heartwood of many species, particularly coniferous trees, often have less moisture than the
sapwood. Thus, older (generally larger) trees often have a lower weight to volume ratio than that of
younger trees (generally smaller) by virtue of the age related increase in the ratio of heartwood to sapwood.
Related to this, many species have a higher ratio of bark when young and small vs. old and large, thereby
magnifying this trend.
1.2.3 Bark and other unmeasured volume
Bark, like wood, typically contains large amounts of water when fresh. In general, the bark of most species
has weight to volume characteristics similar to the wood of the same species. The bark of conifers and non-
coniferous species can typically range from as little as 4% of the total over bark volume (and weight) to as
much as 30%. Roundwood weight is normally reported with bark present; however, roundwood volume for
UNECE/FAO/ITTO purposes and many national roundwood measurement standards is reported for wood
only, meaning that bark increases the weight to volume ratio of roundwood (in this situation, bark has
substantial recorded weight but no recorded volume). Bark is an important source of forest-based energy, as
well as having other uses such as decorative ground cover and soil treatment (mulch). Knowing the ratio of
bark to roundwood volume is useful in terms of understanding weight ratios, but also for potential energy
and other products that can be produced from bark. It is important to note, however, that bark volume
typically decreases during handling from forest to mill, so the potential volume as reflected in over bark to
under bark volumes are seldom available and highly variable depending on log handling practices and
season (bark loss from handling is generally higher during the spring of the year). Over bark volumes also
often don’t account for voids which occur as a result of ridges and fissures which are characteristic of many
species.
Defects in roundwood, such as unsound fibre (decay), fractures, splits, crooked portions, etc., have weight,
but often no volume, when the scaling method calls for a deduction, thus increasing the ratio of weight to
volume for roundwood.
Forest products conversion factors questionnaire 2016 ____________________________________________________________ 7
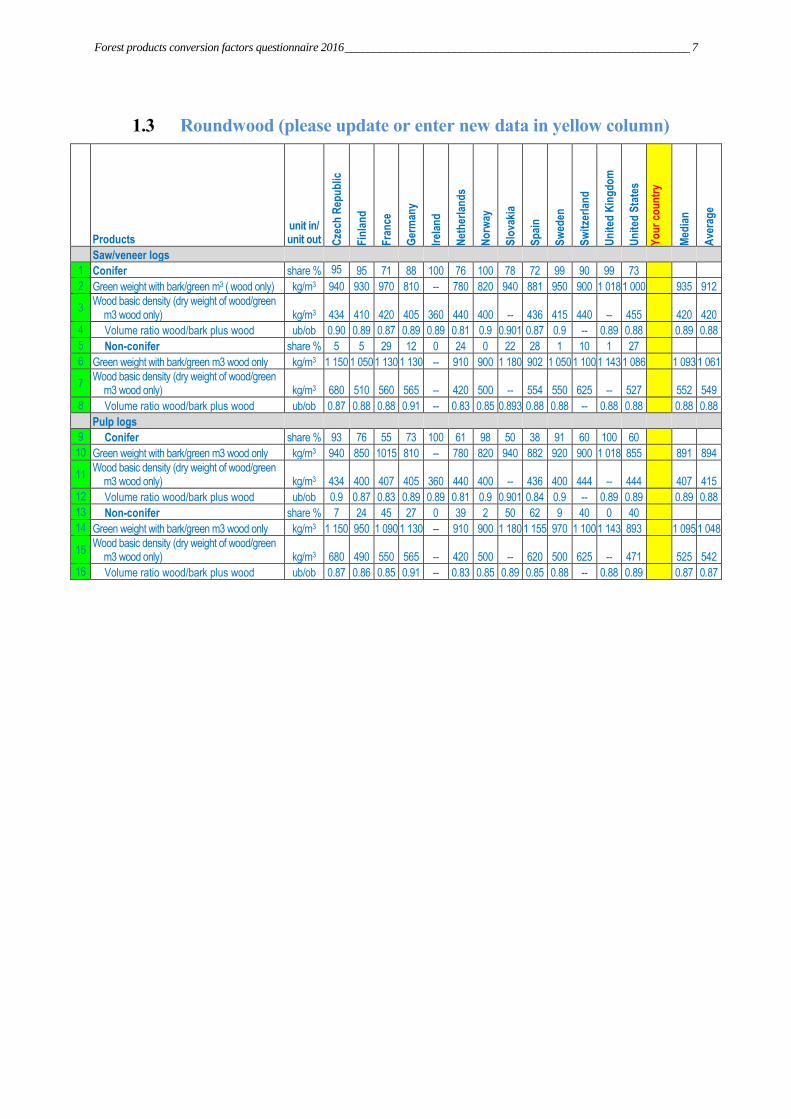
1.3 Roundwood (please update or enter new data in yellow column)
Products unit in/ unit out C
zech
Rep
ub
lic
Fin
lan
d
Fra
nce
Ger
man
y
Irel
and
Net
her
lan
ds
No
rway
Slo
vaki
a
Sp
ain
Sw
eden
Sw
itze
rlan
d
Un
ited
Kin
gd
om
Un
ited
Sta
tes
Yo
ur
cou
ntr
y
Med
ian
Ave
rag
e
Saw/veneer logs
1 Conifer share % 95 95 71 88 100 76 100 78 72 99 90 99 73
2 Green weight with bark/green m3 ( wood only) kg/m3 940 930 970 810 -- 780 820 940 881 950 900 1 018 1 000 935 912
3 Wood basic density (dry weight of wood/green
m3 wood only) kg/m3 434 410 420 405 360 440 400 -- 436 415 440 -- 455
420 420
4 Volume ratio wood/bark plus wood ub/ob 0.90 0.89 0.87 0.89 0.89 0.81 0.9 0.901 0.87 0.9 -- 0.89 0.88 0.89 0.88
5 Non-conifer share % 5 5 29 12 0 24 0 22 28 1 10 1 27
6 Green weight with bark/green m3 wood only kg/m3 1 150 1 050 1 130 1 130 -- 910 900 1 180 902 1 050 1 100 1 143 1 086 1 093 1 061
7 Wood basic density (dry weight of wood/green
m3 wood only) kg/m3 680 510 560 565 -- 420 500 -- 554 550 625 -- 527
552 549
8 Volume ratio wood/bark plus wood ub/ob 0.87 0.88 0.88 0.91 -- 0.83 0.85 0.893 0.88 0.88 -- 0.88 0.88 0.88 0.88
Pulp logs
9 Conifer share % 93 76 55 73 100 61 98 50 38 91 60 100 60
10 Green weight with bark/green m3 wood only kg/m3 940 850 1015 810 -- 780 820 940 882 920 900 1 018 855 891 894
11 Wood basic density (dry weight of wood/green
m3 wood only) kg/m3 434 400 407 405 360 440 400 -- 436 400 444 -- 444
407 415
12 Volume ratio wood/bark plus wood ub/ob 0.9 0.87 0.83 0.89 0.89 0.81 0.9 0.901 0.84 0.9 -- 0.89 0.89 0.89 0.88
13 Non-conifer share % 7 24 45 27 0 39 2 50 62 9 40 0 40
14 Green weight with bark/green m3 wood only kg/m3 1 150 950 1 090 1 130 -- 910 900 1 180 1 155 970 1 100 1 143 893 1 095 1 048
15 Wood basic density (dry weight of wood/green
m3 wood only) kg/m3 680 490 550 565 -- 420 500 -- 620 500 625 -- 471
525 542
16 Volume ratio wood/bark plus wood ub/ob 0.87 0.86 0.85 0.91 -- 0.83 0.85 0.89 0.85 0.88 -- 0.88 0.89 0.87 0.87
8 ____________________________________________________________Forest products conversion factors questionnaire 2016
2. WOOD PARTICLES
Wood particles (chips, sawdust, flakes and shavings), can be measured by volume or by weight (both in the
dry state and “as delivered”). All of these products start out as solid wood from logs of varying density, are
broken down into somewhat irregular shaped particles, and often contain varied amounts of moisture and
void space between the particles.
Conversion factors for wood particles are determined by wood density, moisture content and compaction.
In general, large enterprises that produce and use wood particles obtained from many sources, utilize oven
dry weight as the unit of choice for measuring wood particles. Enterprises that work with wood particles
obtained from fewer and more homogeneous sources might favour the use of volume or weight as
delivered. Ultimately, the yield of most manufacturing processes using wood particles as a raw material is
driven by the quantity of fibre excluding moisture and void.
2.1 Volumetric measurement
Procedures for establishing the volume of particles is straightforward. Volumes contained in truck-loads,
ship-hulls and bins can be easily calculated. Even huge irregularly shaped stockpiles at manufacturing
facilities can be measured with surveying equipment to establish volume.
Solid wood equivalent is more complicated, however, as a result of the variation in void space. Wood
particles in containers or piles will settle over time and the heavier the particles (due to density or moisture
content) and the greater the depth (thus increasing weight), the more compaction will occur.
In Conversion Factors for the Pacific Northwest Forest Industry (Hartman et al, 1981), the following are
listed as typical ratios of m3 loose to m
3 solid for wood particles:
pulp chips (compacted) 2.50
pulp chips (un-compacted) 2.86
sawdust 2.50
planer shavings 4.00
2.2 Weight
The weight of wood particles is generally reflected “as delivered” or as an oven dry weight (all moisture
removed). The “as delivered” weight can have substantial variability as a result of the moisture content. For
example: chips from a sawmill may have 50% mcw (50% of the weight is water and 50% is dry fibre),
while a veneer plant, using identical logs for raw material as the sawmill, may produce chips where only
6% (mcw) of the weight is moisture. In this example, the sawmill chips were green, while the veneer chips
would have been produced from dried veneer.
The normal procedure for establishing oven dry weight of wood particles is via a sampling system. For
example:
if the net weight of a truck load of chips is 32,200 kg;
a sample of “as delivered” chips is taken, which weighs 922 gm;
the sample is placed in a vented oven at approximately 103° C for 24 hours, until the weight
stabilizes at 497 gm (devoid of moisture);
the oven dried weight of the sample is divided by the “as delivered” weight and this ratio is
multiplied by the “as delivered” net weight of the truck load of chips;
(497 ÷ 922) x 32,200 = 17,356 kg or 17.356 oven dried metric tons (ODMT)
Forest products conversion factors questionnaire 2016 ____________________________________________________________ 9
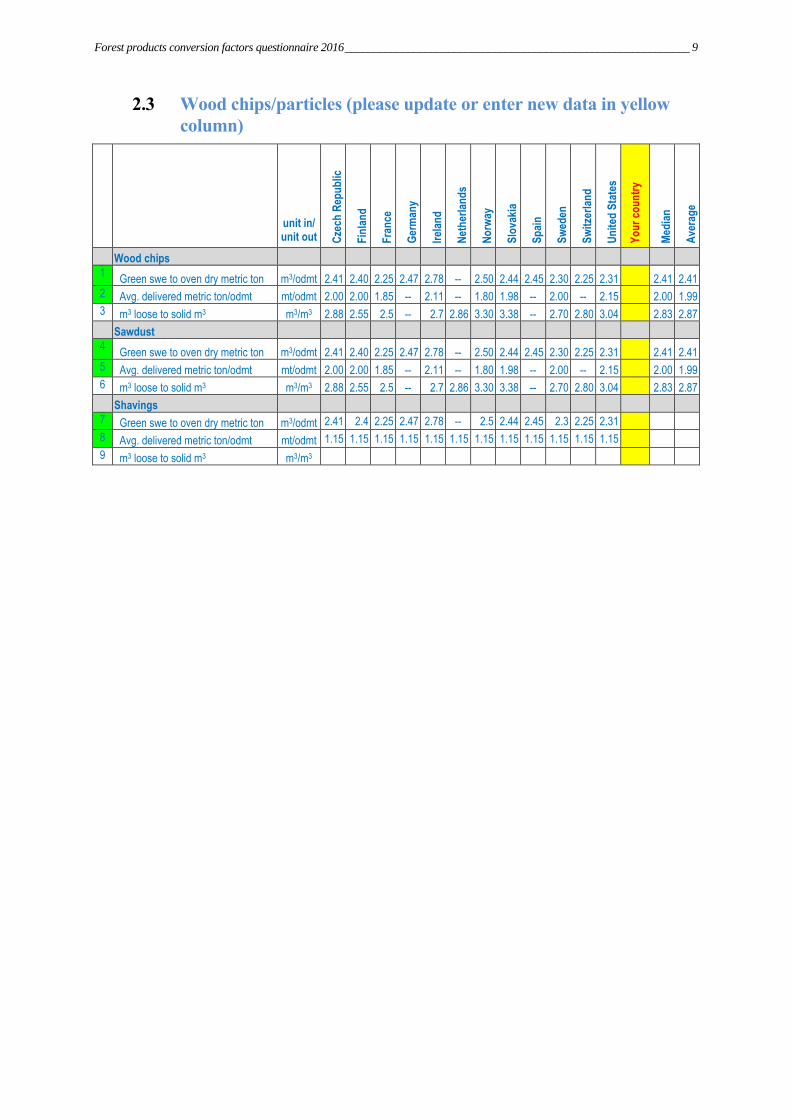
2.3 Wood chips/particles (please update or enter new data in yellow
column)
unit in/ unit out C
zech
Rep
ub
lic
Fin
lan
d
Fra
nce
Ger
man
y
Irel
and
Net
her
lan
ds
No
rway
Slo
vaki
a
Sp
ain
Sw
eden
Sw
itze
rlan
d
Un
ited
Sta
tes
Yo
ur
cou
ntr
y
Med
ian
Ave
rag
e
Wood chips
1 Green swe to oven dry metric ton m3/odmt 2.41 2.40 2.25 2.47 2.78 -- 2.50 2.44 2.45 2.30 2.25 2.31
2.41 2.41
2 Avg. delivered metric ton/odmt mt/odmt 2.00 2.00 1.85 -- 2.11 -- 1.80 1.98 -- 2.00 -- 2.15 2.00 1.99
3 m3 loose to solid m3 m3/m3 2.88 2.55 2.5 -- 2.7 2.86 3.30 3.38 -- 2.70 2.80 3.04 2.83 2.87
Sawdust
4 Green swe to oven dry metric ton m3/odmt 2.41 2.40 2.25 2.47 2.78 -- 2.50 2.44 2.45 2.30 2.25 2.31
2.41 2.41
5 Avg. delivered metric ton/odmt mt/odmt 2.00 2.00 1.85 -- 2.11 -- 1.80 1.98 -- 2.00 -- 2.15 2.00 1.99
6 m3 loose to solid m3 m3/m3 2.88 2.55 2.5 -- 2.7 2.86 3.30 3.38 -- 2.70 2.80 3.04 2.83 2.87
Shavings
7 Green swe to oven dry metric ton m3/odmt 2.41 2.4 2.25 2.47 2.78 -- 2.5 2.44 2.45 2.3 2.25 2.31
8 Avg. delivered metric ton/odmt mt/odmt 1.15 1.15 1.15 1.15 1.15 1.15 1.15 1.15 1.15 1.15 1.15 1.15
9 m3 loose to solid m3 m3/m3
10 ___________________________________________________________Forest products conversion factors questionnaire 2016
3. SAWNWOOD
Sawnwood covers a large spectrum: from semi-processed cants4, boules and flitches
5, which are often still green;
to fully edged, dried, trimmed, and planed sawnwood. The state of manufacture, such as boules/flitches vs. dried
and planed sawnwood, will have a large impact on the conversion factor, e.g. a cubic metre of roundwood might
produce 0.8 cubic metres of green boules and flitches but only half that amount (0.4 m3) of fully dried, edged,
grade-trimmed and surfaced (planed) sawnwood. As a result, countries are asked to provide conversion factors
for sub-categories of sawnwood products in order to understand why national conversion factors vary so much.
For example, according to the results of the 2008 questionnaire on conversion factors, Germany reported that the
conversion factor for coniferous sawnwood is 1.67 m3 of roundwood per m
3 of sawnwood vs. 2.04 for the
United States. On face value, this might lead one to believe that the sawmills in the US are much less efficient
than sawmills in Germany (this number indicates that United States mills require 22% more roundwood volume
to make the same quantity of sawnwood). Upon further analysis of the sub-categories of sawnwood, however, it
is seen that roundwood to sawnwood conversion factors for the sub-product categories such as rough green and
surfaced dry are similar between the two countries.
Several countries report that sawnwood production in their countries is measured in the rough green state in
order to avoid “double counting” volume, which may be dried, grade trimmed or planed at a separate, off-site
facility. This contrasts with the Nordic region and North America, where sawnwood volume is more often tallied
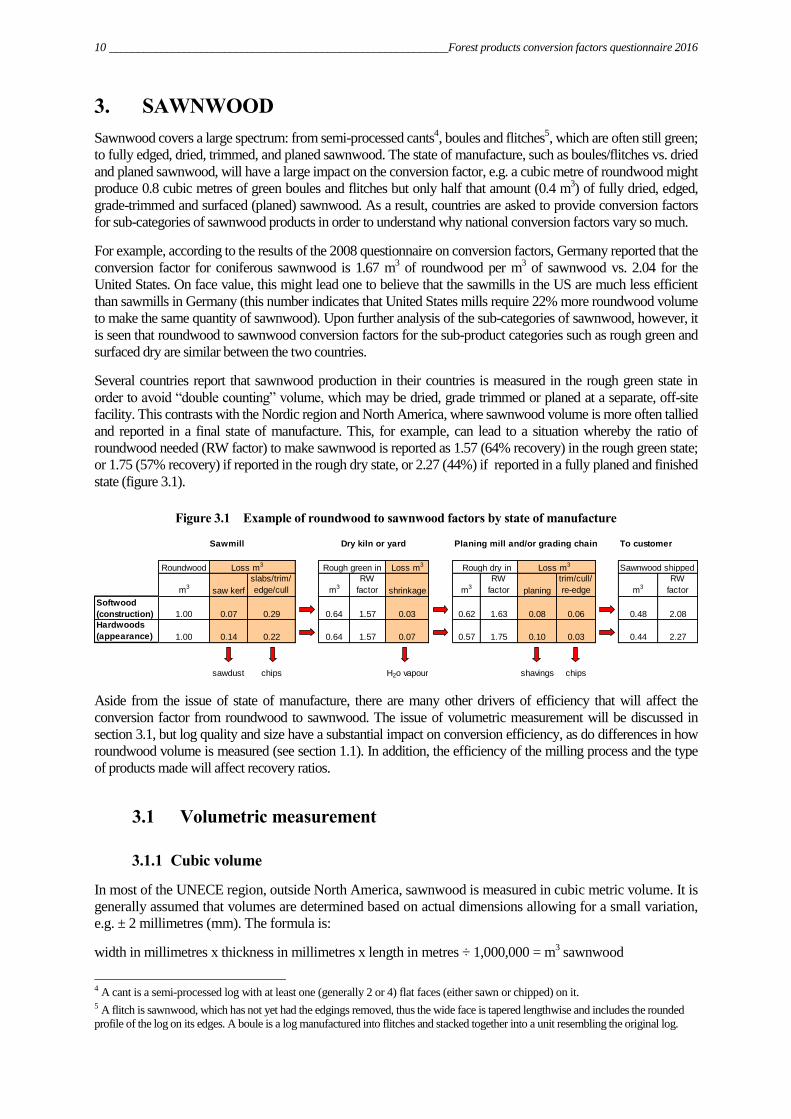
and reported in a final state of manufacture. This, for example, can lead to a situation whereby the ratio of
roundwood needed (RW factor) to make sawnwood is reported as 1.57 (64% recovery) in the rough green state;
or 1.75 (57% recovery) if reported in the rough dry state, or 2.27 (44%) if reported in a fully planed and finished
state (figure 3.1).
Figure 3.1 Example of roundwood to sawnwood factors by state of manufacture
Sawmill Dry kiln or yard Planing mill and/or grading chain To customer
Roundwood Loss m3 Rough green in Loss m3 Rough dry in Loss m3 Sawnwood shipped
m3saw kerf
slabs/trim/
edge/cull m3
RW
factor shrinkage m3
RW
factor planing
trim/cull/
re-edge m3
RW
factor
Softwood
(construction) 1.00 0.07 0.29 0.64 1.57 0.03 0.62 1.63 0.08 0.06 0.48 2.08
Hardwoods
(appearance) 1.00 0.14 0.22 0.64 1.57 0.07 0.57 1.75 0.10 0.03 0.44 2.27
sawdust chips H2o vapour shavings chips
Aside from the issue of state of manufacture, there are many other drivers of efficiency that will affect the
conversion factor from roundwood to sawnwood. The issue of volumetric measurement will be discussed in
section 3.1, but log quality and size have a substantial impact on conversion efficiency, as do differences in how
roundwood volume is measured (see section 1.1). In addition, the efficiency of the milling process and the type
of products made will affect recovery ratios.
3.1 Volumetric measurement
3.1.1 Cubic volume
In most of the UNECE region, outside North America, sawnwood is measured in cubic metric volume. It is
generally assumed that volumes are determined based on actual dimensions allowing for a small variation,
e.g. ± 2 millimetres (mm). The formula is:
width in millimetres x thickness in millimetres x length in metres ÷ 1,000,000 = m3 sawnwood
4 A cant is a semi-processed log with at least one (generally 2 or 4) flat faces (either sawn or chipped) on it. 5 A flitch is sawnwood, which has not yet had the edgings removed, thus the wide face is tapered lengthwise and includes the rounded
profile of the log on its edges. A boule is a log manufactured into flitches and stacked together into a unit resembling the original log.
Forest products conversion factors questionnaire 2016 ___________________________________________________________ 11
It is known that sawnwood is sold in the retail market based on volumes determined by nominal sizes in
some areas of Europe. For example: dried and planed lumber that is 45 mm x 95 mm, which might have
started out at 50 mm x 100 mm prior to planning, will have its volume reported based on the latter
dimensions. Where the ratio of actual to nominal volume is known, e.g. in North America for sawn
softwood, production statistics and conversion factors are adjusted to reflect actual volume, however,
where they are not known, no adjustments are made.
3.1.2 Board foot volume
In North America sawnwood is usually measured in terms of “board feet”, with a board foot defined as a
board one inch (2.54 cm) thick and one foot square (30.48 cm x 30.48 cm), equivalent to 0.00236 m3.
Therefore one cubic metre of sawnwood ostensibly equals 424 board feet (bf). This measure arose when
sawnwood was commonly sold in a rough, green form. Today, sawn softwood is typically dried and
surfaced before sale. To accommodate this, a set of standards allows wood of smaller dimensions to be sold
on a nominal basis ignoring the shrinkage and material removed during surfacing. For example dried and
planed sawnwood may have the volume calculated based on the nominal dimensions of 2 inches in
thickness x 4 inches in width x 96 inches in length (0.0126 m3), while its actual dimensions may be 1.5
inches in thickness x 3.5 inches in width x 92.625 inches in length (0.008 m3).
The formula for determining board feet is:
Nominal width in inches x nominal thickness in inches x nominal length in feet ÷ 12 = board feet.
Thus a board that is nominally 2 inches x 4 inches x 8 feet would have 5.333 bf.
When measuring the volume of sawn softwood, the width, thickness and, to a smaller degree, length have
nominal measurement allowances. In other words, what nominally is represented as having 1 m3 is often as
little as 0.66 m3. Since this is known, it is adjusted for in the conversion factors and the UNECE/FAO
Timber Database. Sawn softwood was reported to have an average actualization factor of 0.72, which is
589 bf per m3.
3.2 Weight
The relationship between weight and volume of sawnwood varies as a result of the basic density, moisture
content and shrinkage (see sections 1.2.1 - 1.2.3). The relationship is useful, however, for estimating
shipping weight from known volumes, or volumes from known shipping weights. It is also common to
estimate this ratio by using the following formula (Briggs, 1994):
(basic density ÷ (1-shrinkage percentage reflected as a decimal)) x (1 + moisture content)
For example, to estimate the kilograms per m3 of Scots pine sawnwood coming from a region where it has
an average basic density of 400 kg/m3 (volume measured prior to shrinkage), volumetric shrinkage will be
about 7.5%, assuming that the sawnwood will be dried to 15% mcd:
(400 ÷ (1-0.075)) x (1 + 0.15) = 497.3 kg/m3
3.3 Material balance
The sawnwood component only accounts for roughly half of the roundwood volume that is input to the
sawmilling process, thus it is also important to understand the residual products that later become the raw
material for other wood products. These include chips and slabs, sawdust and shavings..
12 ___________________________________________________________Forest products conversion factors questionnaire 2016
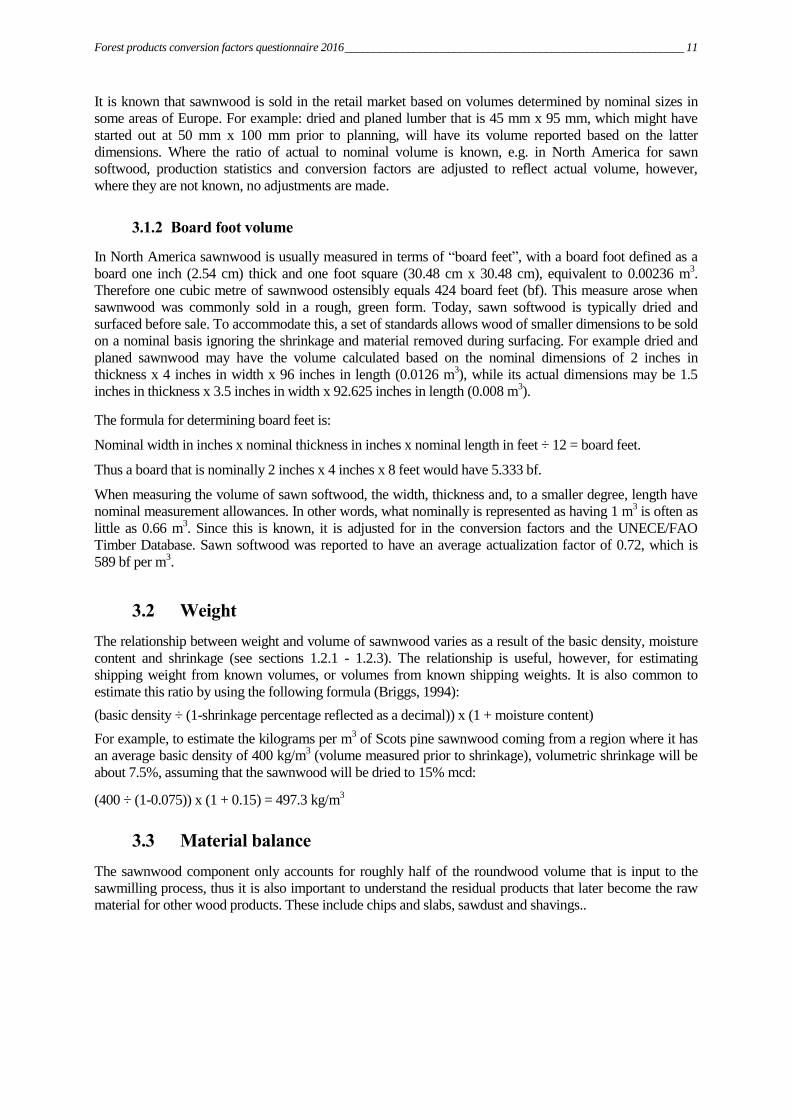
3.4 Sawnwood (please update or enter new data in yellow column)
unit in/ unit out A
ust
ria
Can
ada
Cze
ch R
epu
blic
Fin
lan
d
Fra
nce
Ger
man
y
Irel
and
Lit
hu
ania
Net
her
lan
ds
No
rway
Slo
vaki
a
Sp
ain
Sw
eden
Un
ited
Kin
gd
om
Un
ited
Sta
tes
Yo
ur
cou
ntr
y
Med
ian
Ave
rag
e
1 Conifer Share % 98 97 95 99 81 94 100 58 65 99 73 73 99 98 68
2 Sawnwood all m3rw/m3p 1.64 2.22 1.67 2.00 1.61 1.67 1.89 2.00 1.67 2.00 1.72 1.69 2.04 2.00 2.04 1.89 1.86
3 Sawnwood green rough m3rw/m3p -- -- -- 1.65 1.66 1.89 -- 1.67 1.75 1.54 1.69 -- -- 1.62 1.67 1.68
4 Sawnwood green planed m3rw/m3p -- -- -- -- -- -- -- -- -- -- -- -- -- 2.00 2.00 2.00
5 Sawnwood dry rough m3rw/m3p -- -- 2.00 1.88 -- 1.99 -- -- 2.00 1.72 1.90 2.04 2.00 1.69 1.99 1.91
6 Sawnwood dry planed m3rw/m3p -- -- -- 2.35 1.97 2.13 -- -- 2.50 -- -- -- -- 2.08 2.13 2.21
7 Flitches and boules (green rough) m3rw/m3p -- -- -- 1.18 -- -- -- -- -- 1.33 -- -- -- -- 1.26 1.26
8 Flitches and boules (dry rough) m3rw/m3p -- -- -- -- -- -- -- -- -- 1.49 -- -- -- -- 1.49 1.49
Material balance
9 Sawnwood % 61% 45% 60% 50% 62% 60% 53% 50% 60% 50% 58% 59% 49% 50% 49% 53% 54%
10 Chips/slabs % -- 38% 30% 34% 24% 25% 35% -- -- 34% 19% 22% 32% -- 27% 30% 29%
11 Sawdust % -- 8% 10% 11% 14% 13% 11% -- -- 10% 11% 12% 12% -- 10% 11% 11%
12 Shavings % -- 5% -- -- -- 1% -- -- -- -- -- -- 2% -- 10% 0% 2%
13 Shrinkage loss % -- 4% -- 5% -- 1% 1% -- -- 6% 12% 7% 5% -- 4% 5% 5%
14 Average sawnwood shipping weight kg/m3 -- -- -- -- -- -- 415 -- -- 440 600 -- -- 549 581 549 517
15 Actual volume/nominal volume reported % 72 72
16 Non-conifer Share % 2 3 5 1 19 6 0 42 35 1 27 37 1 2 32
17 m3rw/m3p -- 1.96 1.56 1.85 2.13 1.54 1.89 2.10 1.67 2.00 1.52 1.89 1.90 2.50 1.85 1.89 1.88
18 Sawnwood green rough m3rw/m3p -- -- -- -- 2.20 1.53 1.89 -- 1.82 2.00 1.54 1.90 -- -- 1.79 1.86 1.83
19 Sawnwood green planed m3rw/m3p -- -- -- -- -- -- -- -- -- -- -- -- -- -- --
20 Sawnwood dry rough m3rw/m3p -- -- -- 1.85 2.59 -- -- -- -- 2.20 1.72 2.10 1.90 2.50 1.92 2.01 2.10
21 Sawnwood dry planed m3rw/m3p -- -- -- -- 3.23 -- -- -- -- -- -- -- -- -- 2.38 2.81 2.81
22 Flitches and boules (rough green) m3rw/m3p -- -- -- -- -- -- -- -- -- 1.40 1.33 -- -- -- -- 1.37 1.37
23 Flitches and boules (rough dry) m3rw/m3p -- -- -- -- -- -- -- -- -- 1.70 1.49 -- -- -- -- 1.60 1.60
Material balance
24 Sawnwood % -- 51% 64% 54% 47% 65% 53% 48% 60% 50% 66% 53% 53% 40% 54% 53% 55%
25 Chips/slabs % -- 33% -- -- 39% 12% 35% -- -- 34% 17% 27% -- -- 30% 32% 28%
26 Sawdust % -- 12% -- -- 14% 13% 11% -- -- 8% 9% 14% -- -- 13% 13% 12%
27 Shavings % -- 0% -- -- -- 8% -- -- -- -- -- -- -- -- 1% 0% 1%
28 Shrinkage loss % -- 4% -- -- -- 2% 1% -- -- 8% 8% 6% -- -- 2% 3% 4%
29 Average sawnwood shipping weight kg/m3 -- -- -- -- -- -- -- -- -- 550 790 -- -- 699 -- 699 680
30 Actual volume/nominal volume reported % 100 100
Forest products conversion factors questionnaire 2016 ___________________________________________________________ 13
4. VENEER AND PLYWOOD
Veneer is produced either by means of a lathe (the log is chucked and rotated against a stationary knife), or
sliced, whereby a log is halved or quartered into flitches (sometimes referred to as cants) with a saw; with
the flitch then pressed against and moved across a knife. Rotary peeled veneer is often used for producing
thicker veneers for structural applications, and sliced veneer is used for producing thinner veneers having
decorative uses; however, there are exceptions to this generalization.
Plywood is a composite product manufactured from veneer. It is produced by laminating sheets of veneer
together into a panel.
The determiners of veneer and plywood recovery ratios are similar to sawnwood, in that log size and
characteristics, product specifications, and milling efficiency have a strong influence.
4.1 Volumetric and surface measurement
Veneer and plywood are normally measured via two systems: surface measure, which strictly measures the
surface area and does not account for volume (because thickness is not accounted for); and volumetric.
Volumetric measure has two variations: straight cubic volume (e.g. thickness x width x length) and surface
measure on a thickness basis.
In Europe, veneer and plywood can be measured in square metres 1 mm basis; and in North America,
veneer and plywood are often measured in square feet 3/8 inch basis. In other words a sheet of plywood
that measures 1.22 m x 2.44 m x 12 mm has 35.72 m2, 1 mm basis, which is easily converted to m
3 by
dividing by 1,000 (.03572 m3). In North America, this sheet would be measured in imperial measure and
would be 4 feet x 8 feet x 0.472 inches which has 40.37 ft2 3/8 inch basis (4 x 8 x [0.472 ÷ 0.375] = 40.37).
Typically, shrinkage has a significant effect on veneer and plywood because of the low moisture content
(<6%) that is often required.
4.2 Weight
Data on conversion factors for weight to volume was limited. Like sawnwood, a theoretical approach can
be used to calculating the weight of veneer (see section 3.2). This approach will work for plywood as well;
however, an allowance may be made for the weight of the glue line between the veneer plies. A glue
weight of 122 gm per m2 of glue-line surface area should be approximate (United States Department of
Agriculture, Forest Service, 1956).
4.3 Material balance
The material balance for the production of plywood and veneer is interesting in that to varying degrees,
other solid wood products are also made during the production of veneer, i.e., sawnwood in the production
of sliced veneer and peeler cores6 in the production of rotary peeled veneer. When producing flitches for
slicing, sawnwood is often a co-product made from sections of the log that are not suitable for veneer, but
are, however, suitable for sawnwood.
Peeler cores, which are a co-product from the manufacture of rotary peeled veneer, are often sold as round
wood product e.g. posts for fencing, landscaping, etc.; or they may be chipped. In addition, some peeler
cores are large enough to make into sawnwood.
6 When a log is rotary peeled, it is often held and pivoted by lathe-chucks. In this situation, the minimum diameter limit of the log at
which veneer can no longer be peeled is usually controlled by the diameter of the chucks. Thus a lathe chuck which is 8 cm in
diameter will result in a peeler core, which is slightly larger in diameter (e.g. 8.5 cm) in order to prevent the veneer knife from
coming into contact with the lathe-chucks.
14 ___________________________________________________________Forest products conversion factors questionnaire 2016
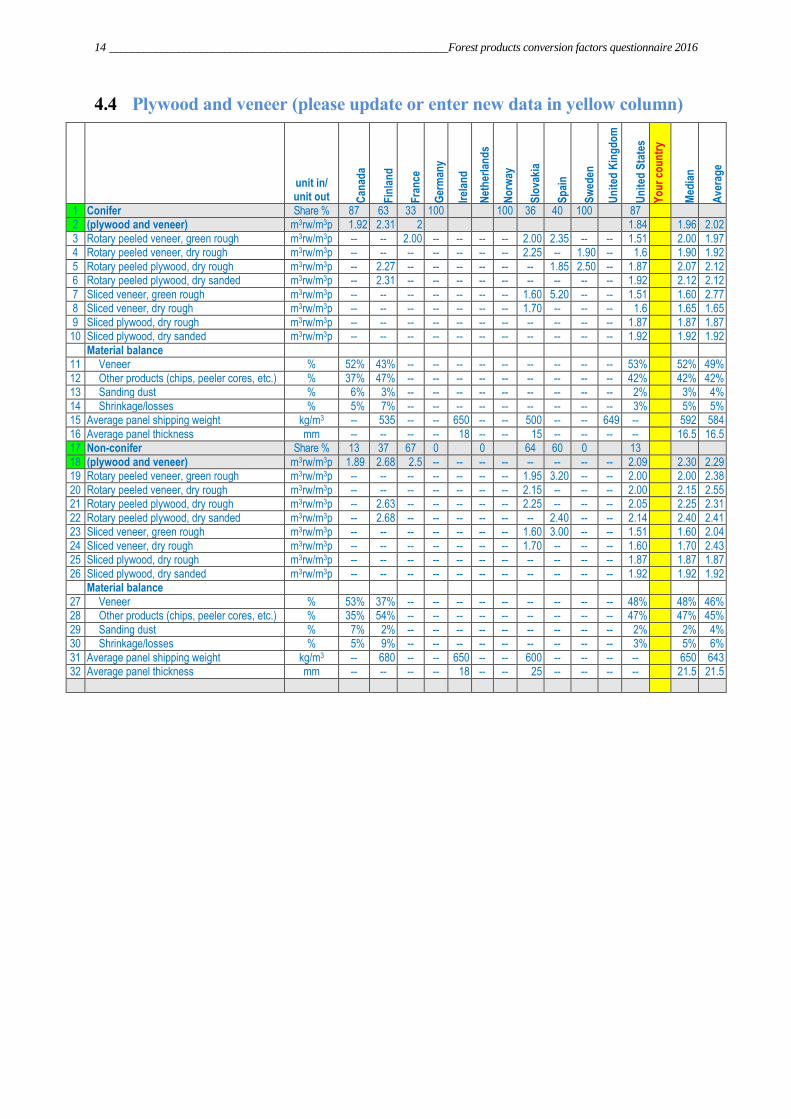
4.4 Plywood and veneer (please update or enter new data in yellow column)
unit in/ unit out C
anad
a
Fin
lan
d
Fra
nce
Ger
man
y
Irel
and
Net
her
lan
ds
No
rway
Slo
vaki
a
Sp
ain
Sw
eden
Un
ited
Kin
gd
om
Un
ited
Sta
tes
Yo
ur
cou
ntr
y
Med
ian
Ave
rag
e
1 Conifer Share % 87 63 33 100 100 36 40 100 87 2 (plywood and veneer) m3rw/m3p 1.92 2.31 2 1.84 1.96 2.02
3 Rotary peeled veneer, green rough m3rw/m3p -- -- 2.00 -- -- -- -- 2.00 2.35 -- -- 1.51 2.00 1.97 4 Rotary peeled veneer, dry rough m3rw/m3p -- -- -- -- -- -- -- 2.25 -- 1.90 -- 1.6 1.90 1.92
5 Rotary peeled plywood, dry rough m3rw/m3p -- 2.27 -- -- -- -- -- -- 1.85 2.50 -- 1.87 2.07 2.12 6 Rotary peeled plywood, dry sanded m3rw/m3p -- 2.31 -- -- -- -- -- -- -- -- -- 1.92 2.12 2.12
7 Sliced veneer, green rough m3rw/m3p -- -- -- -- -- -- -- 1.60 5.20 -- -- 1.51 1.60 2.77 8 Sliced veneer, dry rough m3rw/m3p -- -- -- -- -- -- -- 1.70 -- -- -- 1.6 1.65 1.65
9 Sliced plywood, dry rough m3rw/m3p -- -- -- -- -- -- -- -- -- -- -- 1.87 1.87 1.87 10 Sliced plywood, dry sanded m3rw/m3p -- -- -- -- -- -- -- -- -- -- -- 1.92 1.92 1.92
Material balance 11 Veneer % 52% 43% -- -- -- -- -- -- -- -- -- 53% 52% 49%
12 Other products (chips, peeler cores, etc.) % 37% 47% -- -- -- -- -- -- -- -- -- 42% 42% 42% 13 Sanding dust % 6% 3% -- -- -- -- -- -- -- -- -- 2% 3% 4%
14 Shrinkage/losses % 5% 7% -- -- -- -- -- -- -- -- -- 3% 5% 5% 15 Average panel shipping weight kg/m3 -- 535 -- -- 650 -- -- 500 -- -- 649 -- 592 584
16 Average panel thickness mm -- -- -- -- 18 -- -- 15 -- -- -- -- 16.5 16.5 17 Non-conifer Share % 13 37 67 0 0 64 60 0 13
18 (plywood and veneer) m3rw/m3p 1.89 2.68 2.5 -- -- -- -- -- -- -- -- 2.09 2.30 2.29 19 Rotary peeled veneer, green rough m3rw/m3p -- -- -- -- -- -- -- 1.95 3.20 -- -- 2.00 2.00 2.38
20 Rotary peeled veneer, dry rough m3rw/m3p -- -- -- -- -- -- -- 2.15 -- -- -- 2.00 2.15 2.55 21 Rotary peeled plywood, dry rough m3rw/m3p -- 2.63 -- -- -- -- -- 2.25 -- -- -- 2.05 2.25 2.31
22 Rotary peeled plywood, dry sanded m3rw/m3p -- 2.68 -- -- -- -- -- -- 2.40 -- -- 2.14 2.40 2.41 23 Sliced veneer, green rough m3rw/m3p -- -- -- -- -- -- -- 1.60 3.00 -- -- 1.51 1.60 2.04
24 Sliced veneer, dry rough m3rw/m3p -- -- -- -- -- -- -- 1.70 -- -- -- 1.60 1.70 2.43 25 Sliced plywood, dry rough m3rw/m3p -- -- -- -- -- -- -- -- -- -- -- 1.87 1.87 1.87
26 Sliced plywood, dry sanded m3rw/m3p -- -- -- -- -- -- -- -- -- -- -- 1.92 1.92 1.92 Material balance
27 Veneer % 53% 37% -- -- -- -- -- -- -- -- -- 48% 48% 46% 28 Other products (chips, peeler cores, etc.) % 35% 54% -- -- -- -- -- -- -- -- -- 47% 47% 45%
29 Sanding dust % 7% 2% -- -- -- -- -- -- -- -- -- 2% 2% 4% 30 Shrinkage/losses % 5% 9% -- -- -- -- -- -- -- -- -- 3% 5% 6%
31 Average panel shipping weight kg/m3 -- 680 -- -- 650 -- -- 600 -- -- -- -- 650 643 32 Average panel thickness mm -- -- -- -- 18 -- -- 25 -- -- -- -- 21.5 21.5
Forest products conversion factors questionnaire 2016 ___________________________________________________________ 15
5. PANELS MADE OF WOOD PARTICLES
Unlike panels made of veneer, panels made of wood particles (e.g. particle board, OSB, fibreboard) can
have significantly different properties depending on the source wood from which they were produced.
Wood particles can be pressed into panels that are denser or less dense than the parent wood, so cubic
metre of product will seldom equal a cubic metre of solid wood equivalent (swe). In addition there are non-
wood components introduced that add to the bulk and weight, such as binders and fillers. In some countries
a significant percentage of bark volume can be part of the raw material for non-structural panels.
It is important to note that most producers of panels made of wood particles use oven dry weight of raw
material, rather than the volume of solid wood input, to track the raw material to product conversion
efficiency. Less volume of raw materials from dense species is needed to make a given quantity of panels
made of wood particles vs. what would be required from low-density species. For example, when using
Norway spruce with a basic density of 380 kg/m3 as a raw material for MDF which will be pressed to a
basic density of 760 kg/m3, it will require 2 m
3 of solid wood equivalent raw material per m
3 of MDF panel.
However, if Siberian larch with a basic density of 460 kg/m3 is used, only 1.65 m
3 would be needed
(discounting the small effects of binders and fillers).
5.1 Volumetric and surface measurement
As in plywood and veneer, panels made of wood particles are typically measured via cubic volume, surface
measure, and surface measure on a thickness basis. In Europe, as with veneer and plywood, surface
measure on a thickness basis is 1 mm. In North America panels made from wood particles and measured
on a thickness basis have different thickness basis standards dependent on the product. These are as
follows:
OSB and waferboard 3/8 inch (0.375 inch)
Particleboard and MDF 3/4 inch (0.75 inch)
Hardboard 1/8 inch (0.125 inch)
Insulation board 1/2 inch (0.5 inch)
5.2 Weight
The weight of panels made from wood particles will vary dependent on the density of the parent wood, the
density at which the wood fibre is pressed into the panel, the moisture content, which is typically about 6-
8%, and finally the weight of binders and fillers.
16 ___________________________________________________________Forest products conversion factors questionnaire 2016
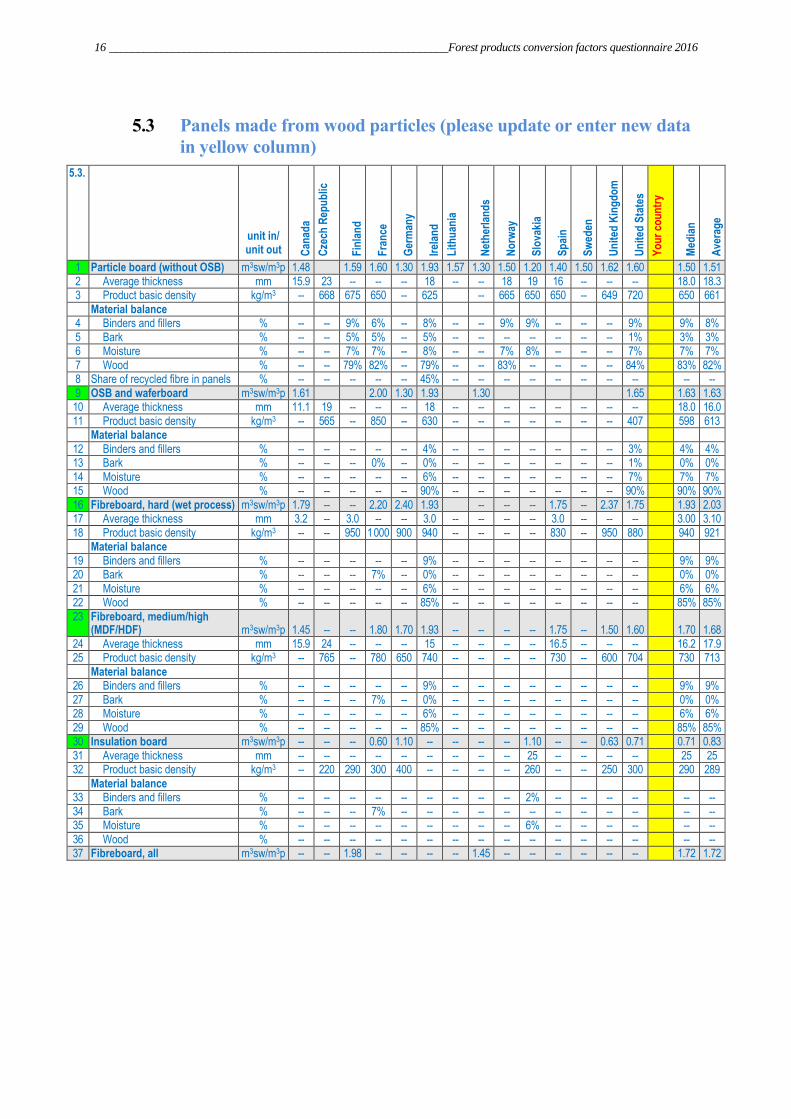
5.3 Panels made from wood particles (please update or enter new data
in yellow column)
5.3.
unit in/ unit out C
anad
a
Cze
ch R
epu
blic
Fin
lan
d
Fra
nce
Ger
man
y
Irel
and
Lit
hu
ania
Net
her
lan
ds
No
rway
Slo
vaki
a
Sp
ain
Sw
eden
Un
ited
Kin
gd
om
Un
ited
Sta
tes
Yo
ur
cou
ntr
y
Med
ian
Ave
rag
e
1 Particle board (without OSB) m3sw/m3p 1.48 1.59 1.60 1.30 1.93 1.57 1.30 1.50 1.20 1.40 1.50 1.62 1.60 1.50 1.51
2 Average thickness mm 15.9 23 -- -- -- 18 -- -- 18 19 16 -- -- -- 18.0 18.3 3 Product basic density kg/m3 -- 668 675 650 -- 625 -- 665 650 650 -- 649 720 650 661
Material balance 4 Binders and fillers % -- -- 9% 6% -- 8% -- -- 9% 9% -- -- -- 9% 9% 8%
5 Bark % -- -- 5% 5% -- 5% -- -- -- -- -- -- -- 1% 3% 3% 6 Moisture % -- -- 7% 7% -- 8% -- -- 7% 8% -- -- -- 7% 7% 7%
7 Wood % -- -- 79% 82% -- 79% -- -- 83% -- -- -- -- 84% 83% 82% 8 Share of recycled fibre in panels % -- -- -- -- -- 45% -- -- -- -- -- -- -- -- -- --
9 OSB and waferboard m3sw/m3p 1.61 2.00 1.30 1.93 1.30 1.65 1.63 1.63 10 Average thickness mm 11.1 19 -- -- -- 18 -- -- -- -- -- -- -- -- 18.0 16.0
11 Product basic density kg/m3 -- 565 -- 850 -- 630 -- -- -- -- -- -- -- 407 598 613 Material balance
12 Binders and fillers % -- -- -- -- -- 4% -- -- -- -- -- -- -- 3% 4% 4% 13 Bark % -- -- -- 0% -- 0% -- -- -- -- -- -- -- 1% 0% 0%
14 Moisture % -- -- -- -- -- 6% -- -- -- -- -- -- -- 7% 7% 7% 15 Wood % -- -- -- -- -- 90% -- -- -- -- -- -- -- 90% 90% 90%
16 Fibreboard, hard (wet process) m3sw/m3p 1.79 -- -- 2.20 2.40 1.93 -- -- -- 1.75 -- 2.37 1.75 1.93 2.03 17 Average thickness mm 3.2 -- 3.0 -- -- 3.0 -- -- -- -- 3.0 -- -- -- 3.00 3.10
18 Product basic density kg/m3 -- -- 950 1 000 900 940 -- -- -- -- 830 -- 950 880 940 921 Material balance
19 Binders and fillers % -- -- -- -- -- 9% -- -- -- -- -- -- -- -- 9% 9% 20 Bark % -- -- -- 7% -- 0% -- -- -- -- -- -- -- -- 0% 0%
21 Moisture % -- -- -- -- -- 6% -- -- -- -- -- -- -- -- 6% 6% 22 Wood % -- -- -- -- -- 85% -- -- -- -- -- -- -- -- 85% 85%
23 Fibreboard, medium/high (MDF/HDF) m3sw/m3p 1.45 -- -- 1.80 1.70 1.93 -- -- -- -- 1.75 -- 1.50 1.60
1.70 1.68
24 Average thickness mm 15.9 24 -- -- -- 15 -- -- -- -- 16.5 -- -- -- 16.2 17.9 25 Product basic density kg/m3 -- 765 -- 780 650 740 -- -- -- -- 730 -- 600 704 730 713
Material balance 26 Binders and fillers % -- -- -- -- -- 9% -- -- -- -- -- -- -- -- 9% 9%
27 Bark % -- -- -- 7% -- 0% -- -- -- -- -- -- -- -- 0% 0% 28 Moisture % -- -- -- -- -- 6% -- -- -- -- -- -- -- -- 6% 6%
29 Wood % -- -- -- -- -- 85% -- -- -- -- -- -- -- -- 85% 85% 30 Insulation board m3sw/m3p -- -- -- 0.60 1.10 -- -- -- -- 1.10 -- -- 0.63 0.71 0.71 0.83
31 Average thickness mm -- -- -- -- -- -- -- -- -- 25 -- -- -- -- 25 25 32 Product basic density kg/m3 -- 220 290 300 400 -- -- -- -- 260 -- -- 250 300 290 289
Material balance 33 Binders and fillers % -- -- -- -- -- -- -- -- -- 2% -- -- -- -- -- --
34 Bark % -- -- -- 7% -- -- -- -- -- -- -- -- -- -- -- -- 35 Moisture % -- -- -- -- -- -- -- -- -- 6% -- -- -- -- -- --
36 Wood % -- -- -- -- -- -- -- -- -- -- -- -- -- -- -- -- 37 Fibreboard, all m3sw/m3p -- -- 1.98 -- -- -- -- 1.45 -- -- -- -- -- -- 1.72 1.72
Forest products conversion factors questionnaire 2016 ___________________________________________________________ 17
6. WOOD PULP AND PAPER
Pulp is the raw material for paper and paperboard (cardboard). The manufacturing process involves
separating the wood fibres by means of mechanical or chemical processes, or a combination of these.
Mechanical pulp is produced via a grinding action applied to wood, typically wood particles. As a result of
the grinding process, the wood fibres tend to be short and thus lack strength compared to chemically
produced pulp. However, the yield is high because little of the original components of the wood is lost. One
oven dry metric ton of wood input will yield approximately 0.95 metric tons of oven dry pulp (i.e. 95%
yield).
Chemical pulping involves using chemicals and heat to dissolve the lignin, leaving behind long wood
fibres, which are strong, but at the price of lower yield, as much of the original wood is dissolved and
suspended in the chemical treatment. There are several different chemical processes, with use dependent on
species of wood and the desired characteristics of the paper. Bleached pulp results in white paper but at a
lower yield in comparison to the non-bleached pulp. Chemical pulping generally results in yields in the 40-
50% range (measured as oven dry input to oven dry output) (Briggs 1994).
Pulp is also produced using mechanical grinding in conjunction with chemical processes. There are a
number of variations of this process and yield will generally be slightly less than that of strictly mechanical
processes.
6.1 Weight
Pulp and paper measurement is usually handled via weight. Generally, an unspecified metric ton or an “air
dried metric ton” is assumed to be 10% mcw. Note that pulp and paper moisture content is reflected on a
“wet basis” (mcw), i.e. one air-dried metric ton of pulp is assumed to be 900 kg of oven dry fibre and
100 kg of contained water. Pulp and paper can also be measured on an oven dry basis. For the purposes of
the conversion factor questionnaire, all pulp and paper is assumed to be an air-dried tonne (10% mcw).
18 ___________________________________________________________Forest products conversion factors questionnaire 2016
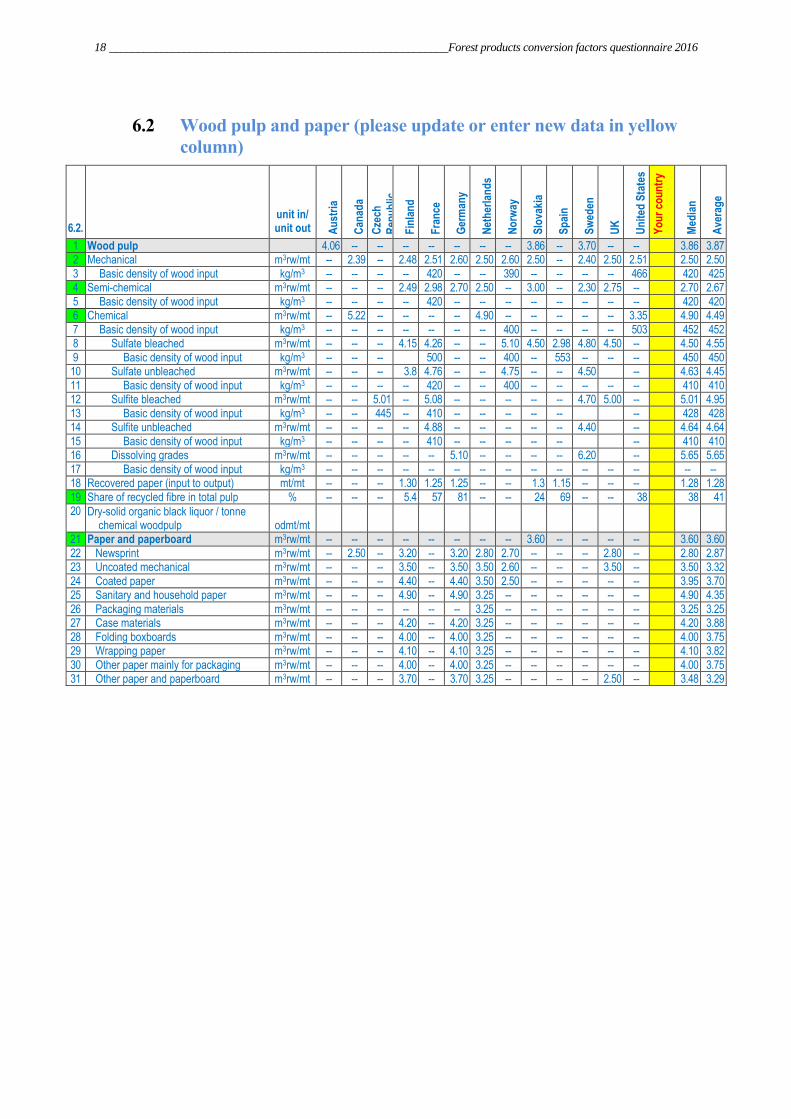
6.2 Wood pulp and paper (please update or enter new data in yellow
column)
6.2. unit in/ unit out A
ust
ria
Can
ada
Cze
ch
Rep
ub
lic
Fin
lan
d
Fra
nce
Ger
man
y
Net
her
lan
ds
No
rway
Slo
vaki
a
Sp
ain
Sw
eden
UK
Un
ited
Sta
tes
Yo
ur
cou
ntr
y
Med
ian
Ave
rag
e
1 Wood pulp 4.06 -- -- -- -- -- -- -- 3.86 -- 3.70 -- -- 3.86 3.87 2 Mechanical m3rw/mt -- 2.39 -- 2.48 2.51 2.60 2.50 2.60 2.50 -- 2.40 2.50 2.51 2.50 2.50
3 Basic density of wood input kg/m3 -- -- -- -- 420 -- -- 390 -- -- -- -- 466 420 425 4 Semi-chemical m3rw/mt -- -- -- 2.49 2.98 2.70 2.50 -- 3.00 -- 2.30 2.75 -- 2.70 2.67
5 Basic density of wood input kg/m3 -- -- -- -- 420 -- -- -- -- -- -- -- -- 420 420 6 Chemical m3rw/mt -- 5.22 -- -- -- -- 4.90 -- -- -- -- -- 3.35 4.90 4.49
7 Basic density of wood input kg/m3 -- -- -- -- -- -- -- 400 -- -- -- -- 503 452 452 8 Sulfate bleached m3rw/mt -- -- -- 4.15 4.26 -- -- 5.10 4.50 2.98 4.80 4.50 -- 4.50 4.55
9 Basic density of wood input kg/m3 -- -- -- 500 -- -- 400 -- 553 -- -- -- 450 450 10 Sulfate unbleached m3rw/mt -- -- -- 3.8 4.76 -- -- 4.75 -- -- 4.50 -- 4.63 4.45
11 Basic density of wood input kg/m3 -- -- -- -- 420 -- -- 400 -- -- -- -- -- 410 410 12 Sulfite bleached m3rw/mt -- -- 5.01 -- 5.08 -- -- -- -- -- 4.70 5.00 -- 5.01 4.95
13 Basic density of wood input kg/m3 -- -- 445 -- 410 -- -- -- -- -- -- 428 428 14 Sulfite unbleached m3rw/mt -- -- -- -- 4.88 -- -- -- -- -- 4.40 -- 4.64 4.64
15 Basic density of wood input kg/m3 -- -- -- -- 410 -- -- -- -- -- -- 410 410 16 Dissolving grades m3rw/mt -- -- -- -- -- 5.10 -- -- -- -- 6.20 -- 5.65 5.65
17 Basic density of wood input kg/m3 -- -- -- -- -- -- -- -- -- -- -- -- -- -- -- 18 Recovered paper (input to output) mt/mt -- -- -- 1.30 1.25 1.25 -- -- 1.3 1.15 -- -- -- 1.28 1.28
19 Share of recycled fibre in total pulp % -- -- -- 5.4 57 81 -- -- 24 69 -- -- 38 38 41 20 Dry-solid organic black liquor / tonne
chemical woodpulp odmt/mt
21 Paper and paperboard m3rw/mt -- -- -- -- -- -- -- -- 3.60 -- -- -- -- 3.60 3.60
22 Newsprint m3rw/mt -- 2.50 -- 3.20 -- 3.20 2.80 2.70 -- -- -- 2.80 -- 2.80 2.87 23 Uncoated mechanical m3rw/mt -- -- -- 3.50 -- 3.50 3.50 2.60 -- -- -- 3.50 -- 3.50 3.32
24 Coated paper m3rw/mt -- -- -- 4.40 -- 4.40 3.50 2.50 -- -- -- -- -- 3.95 3.70 25 Sanitary and household paper m3rw/mt -- -- -- 4.90 -- 4.90 3.25 -- -- -- -- -- -- 4.90 4.35
26 Packaging materials m3rw/mt -- -- -- -- -- -- 3.25 -- -- -- -- -- -- 3.25 3.25 27 Case materials m3rw/mt -- -- -- 4.20 -- 4.20 3.25 -- -- -- -- -- -- 4.20 3.88
28 Folding boxboards m3rw/mt -- -- -- 4.00 -- 4.00 3.25 -- -- -- -- -- -- 4.00 3.75 29 Wrapping paper m3rw/mt -- -- -- 4.10 -- 4.10 3.25 -- -- -- -- -- -- 4.10 3.82
30 Other paper mainly for packaging m3rw/mt -- -- -- 4.00 -- 4.00 3.25 -- -- -- -- -- -- 4.00 3.75 31 Other paper and paperboard m3rw/mt -- -- -- 3.70 -- 3.70 3.25 -- -- -- -- 2.50 -- 3.48 3.29
Forest products conversion factors questionnaire 2016 ___________________________________________________________ 19
7. ROUND AND SPLIT WOOD PRODUCTS
For the purpose of this report, this category of forest products includes: barrel staves, utility poles, posts,
pilings, house logs (manufactured round wood for constructing log buildings) and shakes and shingles.
While shingles are a sawed product rather than a split product, they are generally manufactured along with
shakes, which are split and thus are included in this grouping. Similar to this, barrel staves are both split and
sawn, depending on the characteristics of the wood species used.
As these are relatively minor products in terms of volume, information on these products is limited. Where
no country data were reported, as was the case for shakes and shingles, information from previously
published sources is provided.
This category of products is not as technology driven as many of the other forest products, thus this aspect
does not appear to be such a strong contributor of product recovery. Some of the significant controllers of
product recovery by product are listed below.
The yield of barrel staves (used in the cooperage industry) is determined, to a great degree, by the process
used to produce staves. Some species used for wine barrels (notably European oaks), need to be split in
order to prevent the staves from being overly porous (caused by vessels that run parallel to the grain of the
wood), while white oak of central and eastern North America does not have the same problems with
porosity and thus can be sawn. The yield of sawn staves is significantly higher than for staves that are split.
Staves generally have exacting standards in terms of quality, reducing yield according to the presence of
knots or blemishes in the raw material used to produce them.
Utility poles, posts, pilings and house log yield is affected by the peeling process which is done to remove
bumps and protrusions, as well as to round the profile. In addition, a portion of these products is peeled in
order to remove taper, thereby creating a loss of roughly 10-40% dependent on the diameter and length of
the product, with smaller diameter and longer products at the upper end of this range and larger, diameter,
shorter products at the bottom of the range.
Shakes and shingles are generally used for roofing or siding. Shakes are split on one or both faces, while
shingles are always sawn, thus losing a substantial volume to sawdust. Weatherization is an important factor,
and quality standards tend to be exacting in terms of knots or other permeations which could allow water
seepage, so a substantial percentage of the original log volume is often not usable and ends up as residue.
7.1 Volumetric and surface measurement
As staves, poles, posts, pilings and house logs tend to be manufactured to exacting specifications; it is fairly
straightforward to convert from the piece, of a given standard, to volume.
This is not the case with shakes and shingles, which are typically measured on a basis of the surface
measurement of coverage. In North America the unit is the “square”, which is the proper amount of shakes
or shingles to cover 100 square feet (10.764 m3). In Europe the unit is m
2 of coverage. Converting shakes
and shingles from surface (coverage) measure to solid wood equivalent volume is not as straightforward, as
there are many combinations, by product classification, of thickness, taper, widths, length and overlap.
Additionally there is the irregularity of shake thickness as a result of the splitting process.
7.2 Weight
Like all other wood products, the weight to volume ratio will be driven by the basic density, moisture
content and shrinkage of the wood. Using the methodology outlined in section 3.2 to calculate the
theoretical weights of these products, it is important to consider that many of the round and split wood
products will have treating done to them to prevent fungal decay or attacks by wood-boring insects and
molluscs. Treated poles and pilings may have roughly 160 kg/m3 of additional weight due to wood
treatment added. If one were estimating the weight of the wood component as being 600 kg/m3, a treated
20 ___________________________________________________________Forest products conversion factors questionnaire 2016
pole would be approximately 760 kg/m3. Shakes and shingles are also often treated with decay and fire
retardants, which adds to their weight.
7.3 Material balance
Barrel staves. In addition to chips, sawdust and shavings, sawnwood can be a residual product made during
the manufacturing process of staves. Another interesting point is that some of the wood residue from
producing staves still finds its way into the wine industry in the form of chips or sticks used to flavour wine
in non oak barrels such as stainless steel.
Utility poles, posts, pilings and house logs. Because these products generally cannot have any decay,
crooked portions or overly large knots, the removal of these defects from the logs used as raw materials
will reduce the yield of these products and increase the yield of secondary products such as chips and
energy wood.
Shakes and shingles. A cubic metre of western red cedar logs will yield approximately:
Log quality Shingles Shakes Low grade logs 1.55 squares (14.4 m2 of coverage) NA Medium grade logs 1.65 squares (15.3 m2 of coverage) NA High grade logs 1.70 squares (15.8 m2 of coverage) 1.9 squares (17.7 m2 coverage)
Source: Herring and Massie, 1989
Hartman et al (1981) list the material balance for shingles as being roughly 40% shingles, 27% solid
residue, and 33% sawdust. Briggs (1994) cites an unpublished study showing only 24% recovery of
shingles and 53% for shakes (with the remaining balance of both (76% and 47% respectively) being
classified as “residue”. It is likely that the large difference in these material balances could be a result of the
difference between the use of high grade logs vs. lower grade logs as a raw material, which will change
periodically as a result of availability and competition for logs with other sectors, such as the sawmill
sector.
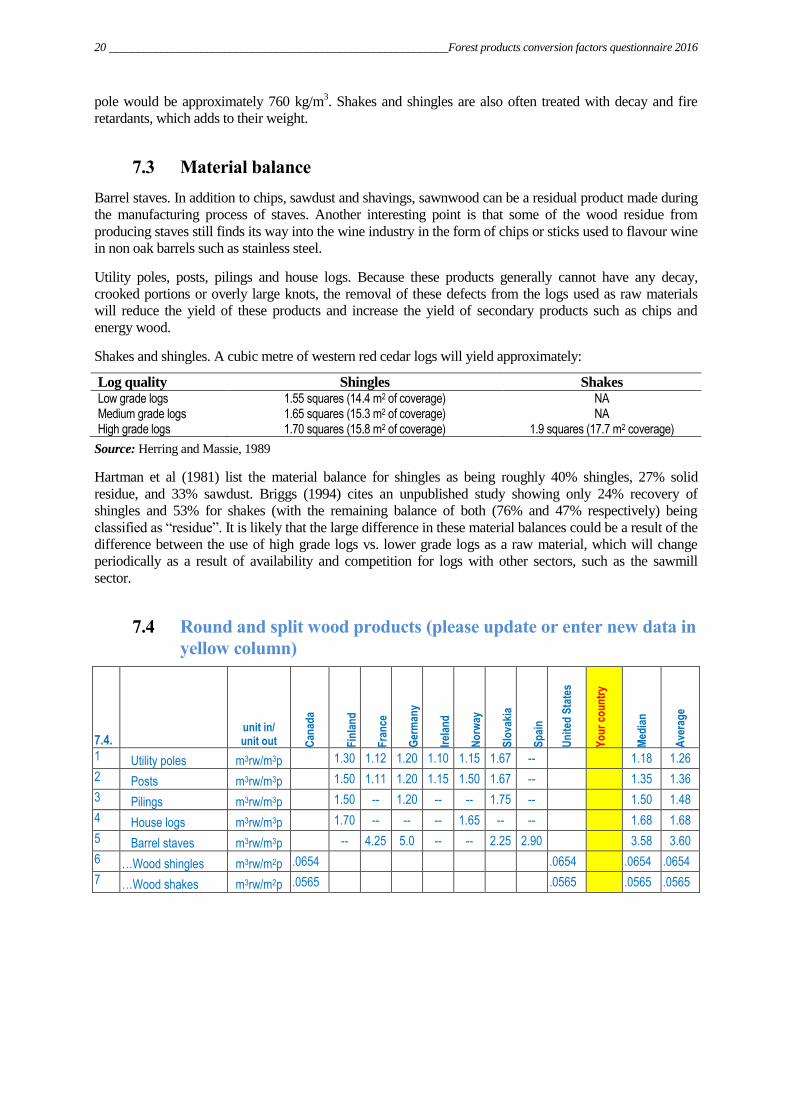
7.4 Round and split wood products (please update or enter new data in
yellow column)
7.4. unit in/ unit out C
anad
a
Fin
lan
d
Fra
nce
Ger
man
y
Irel
and
No
rway
Slo
vaki
a
Sp
ain
Un
ited
Sta
tes
Yo
ur
cou
ntr
y
Med
ian
Ave
rag
e
1 Utility poles m3rw/m3p 1.30 1.12 1.20 1.10 1.15 1.67 -- 1.18 1.26
2 Posts m3rw/m3p 1.50 1.11 1.20 1.15 1.50 1.67 -- 1.35 1.36
3 Pilings m3rw/m3p 1.50 -- 1.20 -- -- 1.75 -- 1.50 1.48
4 House logs m3rw/m3p 1.70 -- -- -- 1.65 -- -- 1.68 1.68
5 Barrel staves m3rw/m3p -- 4.25 5.0 -- -- 2.25 2.90 3.58 3.60
6 …Wood shingles m3rw/m2p .0654 .0654 .0654 .0654
7 …Wood shakes m3rw/m2p .0565 .0565 .0565 .0565
Forest products conversion factors questionnaire 2016 ___________________________________________________________ 21
8. ENERGY WOOD PRODUCTS AND PROPERTIES
This category includes fuelwood, bark and chipped wood fuel, as well as manufactured products such as
pellets and briquettes, charcoal, and wood-based ethanol. Sections 1 and 2 include information that is
applicable to analysing conversion factors for wood, wood residue and bark for energy.
8.1 Volumetric measurement
These products can be measured in solid m3 or in a loose m
3 (bulk m
3). In the case of fuelwood, a loose m
3 is often
differentiated from “stacked m3”, with the difference being that loose m
3 would be randomly placed vs. the neatly
fit together structure of stacked measure.
8.2 Weight
When moisture content is accounted for, the weight of energy products is likely the most reliable unit for
understanding energy generating potential of a given quantity of wood. Moisture not only displaces the potential
weight of combustible material, but also consumes some of the energy potential to vaporize the water when
combusted.
8.3 Energy values
The energy content of wood can be reflected in many different measures and with assumptions made as to
how much of the energy content can realistically be utilized, as no process of utilizing wood for energy is
100% efficient. For the purpose of the questionnaire, the joule was the basis, and the energy values were
requested in “higher heating values,” knowing that while these are unachievable, it is a consistent basis to
which the user could apply their own assumptions regarding thermal efficiency.
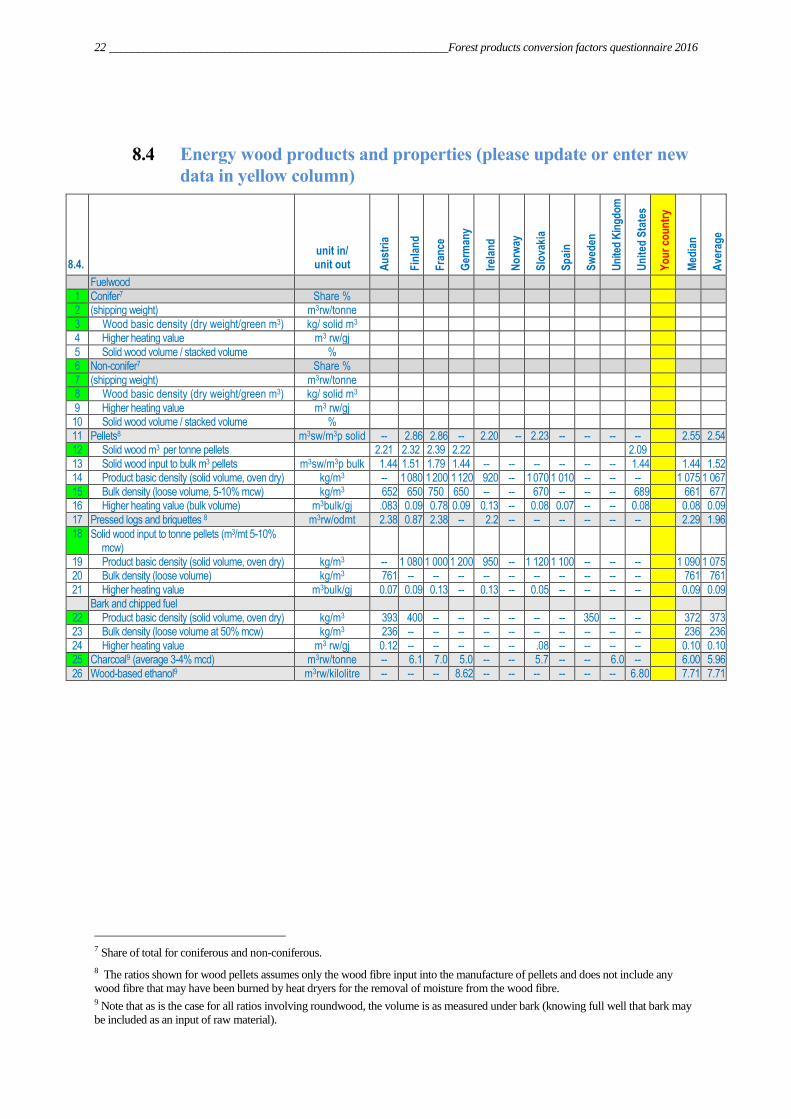
22 ___________________________________________________________Forest products conversion factors questionnaire 2016
8.4 Energy wood products and properties (please update or enter new
data in yellow column)
8.4. unit in/ unit out A
ust
ria
Fin
lan
d
Fra
nce
Ger
man
y
Irel
and
No
rway
Slo
vaki
a
Sp
ain
Sw
eden
Un
ited
Kin
gd
om
Un
ited
Sta
tes
Yo
ur
cou
ntr
y
Med
ian
Ave
rag
e
Fuelwood
1 Conifer7 Share % 2 (shipping weight) m3rw/tonne
3 Wood basic density (dry weight/green m3) kg/ solid m3 4 Higher heating value m3 rw/gj
5 Solid wood volume / stacked volume % 6 Non-conifer7 Share %
7 (shipping weight) m3rw/tonne 8 Wood basic density (dry weight/green m3) kg/ solid m3
9 Higher heating value m3 rw/gj 10 Solid wood volume / stacked volume %
11 Pellets8 m3sw/m3p solid -- 2.86 2.86 -- 2.20 -- 2.23 -- -- -- -- 2.55 2.54 12 Solid wood m3 per tonne pellets 2.21 2.32 2.39 2.22 2.09
13 Solid wood input to bulk m3 pellets m3sw/m3p bulk 1.44 1.51 1.79 1.44 -- -- -- -- -- -- 1.44 1.44 1.52 14 Product basic density (solid volume, oven dry) kg/m3 -- 1 080 1 200 1 120 920 -- 1 070 1 010 -- -- -- 1 075 1 067
15 Bulk density (loose volume, 5-10% mcw) kg/m3 652 650 750 650 -- -- 670 -- -- -- 689 661 677 16 Higher heating value (bulk volume) m3bulk/gj .083 0.09 0.78 0.09 0.13 -- 0.08 0.07 -- -- 0.08 0.08 0.09
17 Pressed logs and briquettes 8 m3rw/odmt 2.38 0.87 2.38 -- 2.2 -- -- -- -- -- -- 2.29 1.96 18 Solid wood input to tonne pellets (m3/mt 5-10%
mcw)
19 Product basic density (solid volume, oven dry) kg/m3 -- 1 080 1 000 1 200 950 -- 1 120 1 100 -- -- -- 1 090 1 075 20 Bulk density (loose volume) kg/m3 761 -- -- -- -- -- -- -- -- -- -- 761 761
21 Higher heating value m3bulk/gj 0.07 0.09 0.13 -- 0.13 -- 0.05 -- -- -- -- 0.09 0.09 Bark and chipped fuel
22 Product basic density (solid volume, oven dry) kg/m3 393 400 -- -- -- -- -- -- 350 -- -- 372 373 23 Bulk density (loose volume at 50% mcw) kg/m3 236 -- -- -- -- -- -- -- -- -- -- 236 236
24 Higher heating value m3 rw/gj 0.12 -- -- -- -- -- .08 -- -- -- -- 0.10 0.10 25 Charcoal9 (average 3-4% mcd) m3rw/tonne -- 6.1 7.0 5.0 -- -- 5.7 -- -- 6.0 -- 6.00 5.96
26 Wood-based ethanol9 m3rw/kilolitre -- -- -- 8.62 -- -- -- -- -- -- 6.80 7.71 7.71
7 Share of total for coniferous and non-coniferous.
8 The ratios shown for wood pellets assumes only the wood fibre input into the manufacture of pellets and does not include any
wood fibre that may have been burned by heat dryers for the removal of moisture from the wood fibre. 9 Note that as is the case for all ratios involving roundwood, the volume is as measured under bark (knowing full well that bark may
be included as an input of raw material).
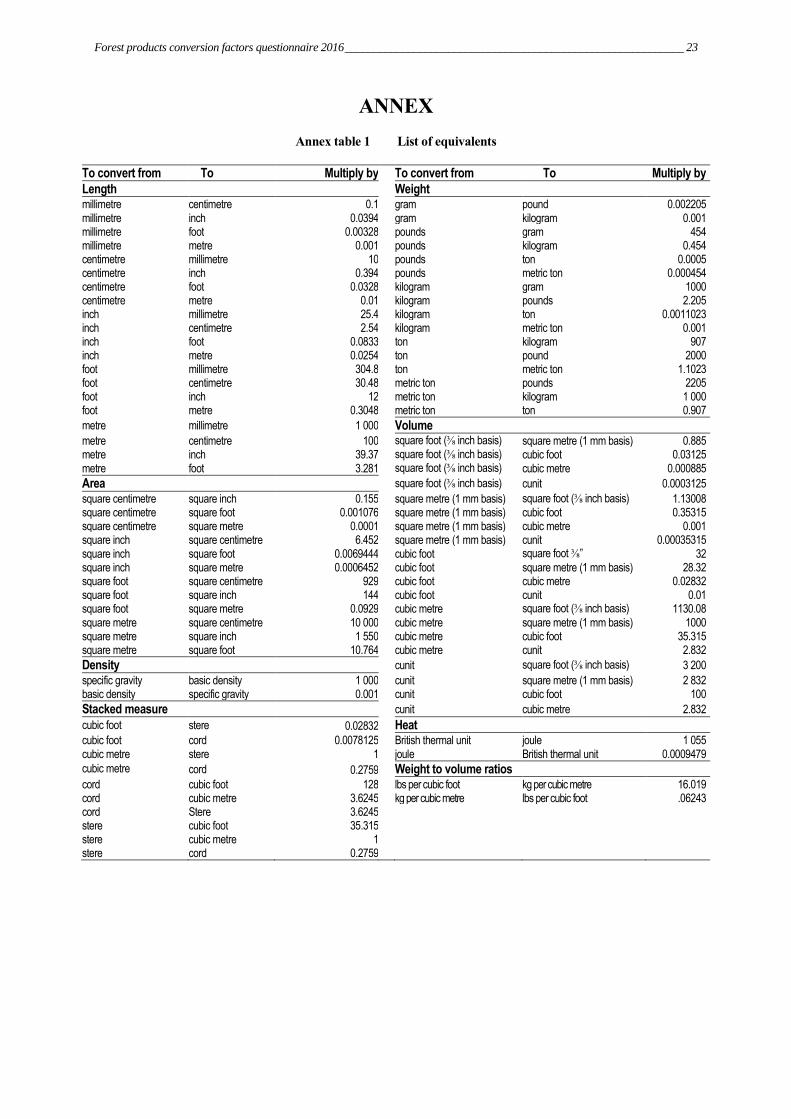
Forest products conversion factors questionnaire 2016 ___________________________________________________________ 23
ANNEX
Annex table 1 List of equivalents
To convert from To Multiply by To convert from To Multiply by
Length Weight millimetre centimetre 0.1 gram pound 0.002205 millimetre inch 0.0394 gram kilogram 0.001 millimetre foot 0.00328 pounds gram 454 millimetre metre 0.001 pounds kilogram 0.454 centimetre millimetre 10 pounds ton 0.0005 centimetre inch 0.394 pounds metric ton 0.000454 centimetre foot 0.0328 kilogram gram 1000 centimetre metre 0.01 kilogram pounds 2.205 inch millimetre 25.4 kilogram ton 0.0011023 inch centimetre 2.54 kilogram metric ton 0.001 inch foot 0.0833 ton kilogram 907 inch metre 0.0254 ton pound 2000 foot millimetre 304.8 ton metric ton 1.1023 foot centimetre 30.48 metric ton pounds 2205 foot inch 12 metric ton kilogram 1 000 foot metre 0.3048 metric ton ton 0.907
metre millimetre 1 000 Volume metre centimetre 100 square foot (⅜ inch basis) square metre (1 mm basis) 0.885 metre inch 39.37 square foot (⅜ inch basis) cubic foot 0.03125 metre foot 3.281 square foot (⅜ inch basis) cubic metre 0.000885
Area square foot (⅜ inch basis) cunit 0.0003125
square centimetre square inch 0.155 square metre (1 mm basis) square foot (⅜ inch basis) 1.13008 square centimetre square foot 0.001076 square metre (1 mm basis) cubic foot 0.35315 square centimetre square metre 0.0001 square metre (1 mm basis) cubic metre 0.001 square inch square centimetre 6.452 square metre (1 mm basis) cunit 0.00035315 square inch square foot 0.0069444 cubic foot square foot ⅜” 32 square inch square metre 0.0006452 cubic foot square metre (1 mm basis) 28.32 square foot square centimetre 929 cubic foot cubic metre 0.02832 square foot square inch 144 cubic foot cunit 0.01 square foot square metre 0.0929 cubic metre square foot (⅜ inch basis) 1130.08 square metre square centimetre 10 000 cubic metre square metre (1 mm basis) 1000 square metre square inch 1 550 cubic metre cubic foot 35.315 square metre square foot 10.764 cubic metre cunit 2.832
Density cunit square foot (⅜ inch basis) 3 200
specific gravity basic density 1 000 cunit square metre (1 mm basis) 2 832 basic density specific gravity 0.001 cunit cubic foot 100
Stacked measure cunit cubic metre 2.832
cubic foot stere 0.02832 Heat cubic foot cord 0.0078125 British thermal unit joule 1 055 cubic metre stere 1 joule British thermal unit 0.0009479
cubic metre cord 0.2759 Weight to volume ratios
cord cubic foot 128 lbs per cubic foot kg per cubic metre 16.019 cord cubic metre 3.6245 kg per cubic metre lbs per cubic foot .06243 cord Stere 3.6245 stere cubic foot 35.315 stere cubic metre 1 stere cord 0.2759