Embed Size (px)
Citation preview
Forest Practices Board November 13 & 14, 2018, Draft Meeting Minutes 1
FOREST PRACTICES BOARD 1 Special Board Meeting (Field Tour) – November 13, 2018 2
Natural Resources Building, Room 172, Olympia, WA 3 4 Members Present 5 Stephen Bernath, Chair, Department of Natural Resources 6 Bob Guenther, General Public Member/Small Forest Landowner 7 Carmen Smith, General Public Member/Independent Logging Contractor 8 Dave Herrera, General Public Member 9 Ben Serr, Designee for Director, Department of Commerce 10 Jeff Davis, Designee for Director, Department of Fish and Wildlife 11 Lisa Janicki, Elected County Official 12 Patrick Capper, Designee for Director, Department of Agriculture 13 Paula Swedeen, General Public Member 14 Tom Laurie, Designee for Director, Department of Ecology 15 Tom Nelson, General Public Member 16 17 Members Absent 18 Brent Davies, General Public Member 19 Noel Willet, Timber Products Union Representative 20 21 Staff 22 Joe Shramek, Forest Practices Division Manager 23 Marc Engel, Forest Practices Assistant Division Manager 24 Patricia Anderson, Rules Coordinator 25 Phil Ferester, Senior Counsel 26 27 WELCOME AND INTRODUCTIONS 28 Chair Bernath called the Forest Practices Board (Board) meeting to order at 12:35 p.m. 29 Introductions of Board members and staff were made. 30 31 DESCRIPTION OF AN ALTERNATE PLAN AND AN ALTERNATE PLAN TEMPLATE 32 Marc Ratcliff, DNR, presented a brief overview of the alternate plan process in the forest practices 33 rules and the two alternate plan templates in Board Manual Section 21, Guidelines for Alternate 34 Plans. He shared how alternate plans are a tool used to landowners to address a variety of 35 situations including ways to enhance riparian objectives or to address unique site conditions. The 36 standard for evaluation requires the plan to provide protection to public resources at least equal in 37 overall effectiveness as provided by the rules. The rules require a review by an interdisciplinary 38 team before DNR can approve or condition (if necessary) a Forest Practices Application (FPA) 39 containing an alternate plan. 40 41 Ratcliff covered how Board Manual Section 21 provides guidance for proposing alternate plan 42 prescriptions to enhance riparian forests. Each alternate plan within a riparian management zone 43 (RMZ) must include how the proposed management prescriptions will address the five riparian 44 functions: stream shading, sediment filtering, streambank stability, recruitment of down wood and 45 nutrients and leaf litter fall. Section 21 also contains two alternate plan templates available for 46
Forest Practices Board November 13 & 14, 2018, Draft Meeting Minutes 2
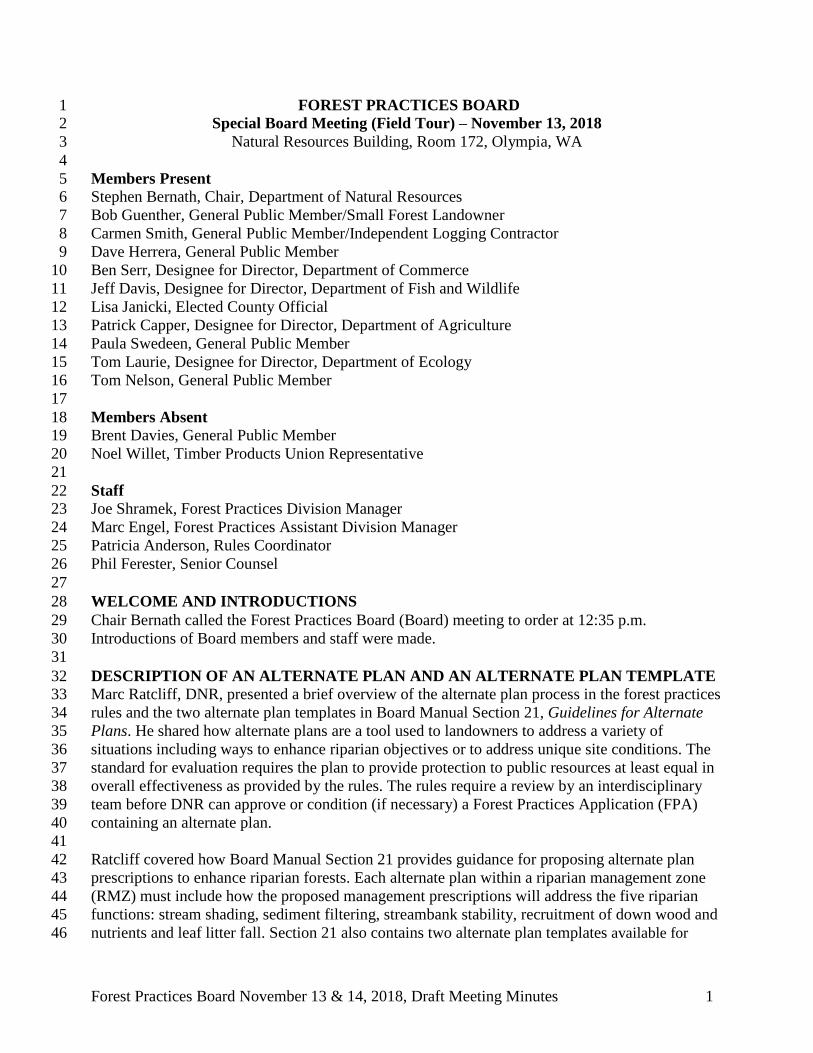
small forest landowners to use when harvesting adjacent to Type S and F waters. One is for conducting 1 thinning strategies in overstocked stands and the other template is for implementing fixed width 2 riparian management zones. He said the benefits to using a template allows landowners to assess 3 stand eligibility and set up the RMZ relatively quickly. In most cases, applying a template 4 decreases the need for DNR to convene an interdisciplinary team review. 5 6 UPDATE ON TFW POLICY COMMITTEE’S WORK 7 Marc Engel, DNR, provided an update on the Timber, Fish and Wildlife (TFW) Policy Committee 8 (Policy) Board-requested review for: the Proposal Initiation for a small forest landowner western 9 Washington Alternate Plan Template; and the review of two draft alternate plan templates for 10 conifer restoration and conifer thinning within riparian management zones. Both reviews must 11 determine how well the proposed template prescriptions meet or exceed the five riparian functions 12 required in all alternate plans. 13 14 When Policy accepted the Adaptive Management Program Administrator (AMPA) Proposal 15 Initiation recommendations, they formed a workgroup for the review of the small forest 16 landowner’s proposed alternate plan template. Policy has approved a charter for the workgroup 17 outlining the steps for review and the response to be delivered to Policy. The review involves three 18 steps: (1) a determination whether the proposal meets the criteria of a template; (2) conduct a 19 literature syntheses of the science used to support the proposed template prescriptions; and (3) 20 provide a written response with recommendations to the Board. 21 22 Engel said the workgroup determined the proposal, as a whole, does not meet the criteria for a 23 template (consensus was not reached on that determination). He said the literature synthesis report 24 is complete and is going through an independent science peer review. He said as a result of a 25 request by the small forest landowner caucus, Policy requested the alternate plan template 26 workgroup to continue discussions on which prescriptions within the proposed template and the 27 existing draft templates could be incorporated into an applicable template(s) for small forest 28 landowners. Policy has asked the workgroup to provide recommendations for template 29 prescriptions by February 2019. Policy is also committed to present recommendations for the 30 western Washington Low Impact Template Proposal Initiation, and the conifer restoration and 31 conifer thinning templates at the Board’s May 2019 meeting. 32 33 DESCRIPTION OF SITE DEMONSTRATION 34 Ken Miller, Washington Farm Forestry Association (WFFA) thanked the Board for scheduling a 35 site visit to his tree farm. He said the visit will give Board members a visual representation for 36 how the proposed prescriptions within the western Washington Low Impact Template are 37 designed to be applied adjacent to Type F and N streams. 38 39 Meeting adjourned at 1:20. The Board departed the Natural Resources Building to visit the 40 proposed alternative plan template demonstration at the Miller’s tree farm. 41
Forest Practices Board November 13 & 14, 2018, Draft Meeting Minutes 3
FOREST PRACTICES BOARD 1 Regular Board Meeting – November 14, 2018 2
Natural Resources Building, Room 172, Olympia, WA 3 4 Members Present 5 Stephen Bernath, Chair, Department of Natural Resources 6 Bob Guenther, General Public Member/Small Forest Landowner 7 Carmen Smith, General Public Member/Independent Logging Contractor 8 Dave Herrera, General Public Member 9 Ben Serr, Designee for Director, Department of Commerce 10 Jeff Davis, Designee for Director, Department of Fish and Wildlife 11 Lisa Janicki, Elected County Official 12 Patrick Capper, Designee for Director, Department of Agriculture 13 Paula Swedeen, General Public Member 14 Tom Laurie, Designee for Director, Department of Ecology 15 Tom Nelson, General Public Member 16 17 Members Absent 18 Brent Davies, General Public Member 19 Noel Willet, Timber Products Union Representative 20 21 Staff 22 Joe Shramek, Forest Practices Division Manager 23 Marc Engel, Forest Practices Assistant Division Manager 24 Patricia Anderson, Rules Coordinator 25 Phil Ferester, Senior Counsel 26 27 WELCOME AND INTRODUCTIONS 28 Chair Bernath called the Forest Practices Board (Board) meeting to order at 9:00 a.m. 29 Introductions of Board members and staff were made. 30 31 REPORT FROM CHAIR 32 Chair Stephen Bernath reported that a tribal cultural resources meeting occurred earlier in 33 November to discuss potential solutions to ongoing issues and a letter identifying next steps will 34 be distributed in the near future. DNR is working with active participants to determine if proposed 35 legislation regarding cultural resource protections will be presented to the legislature during the 36 2019 session. 37 38 DNR’s three large budget packages are: wildfire and forest health; rural communities and trust 39 health; and environmental resilience. DNR is asking for additional funding for staff in the Small 40 Forest Landowner Office and is asking for $20 million for the Family Forest Fish Passage 41 Program and for $17.3 million for the Forest Riparian Easement Program. 42 43 He thanked Karen Terwilleger for her work as a policy representative within the TFW Policy 44 Committee and welcomed her replacement Darin Cramer. 45 46
Forest Practices Board November 13 & 14, 2018, Draft Meeting Minutes 4
He stated DNR is still waiting to see if the State Auditor’s office will be able to conduct an 1 Adaptive Management Program performance audit in 2019. DNR is currently unable to complete a 2 fiscal audit because the internal auditor has left the department and DNR is looking to fill that 3 position. 4
5 PUBLIC COMMENT (AM) 6 Jim Peters, Northwest Indian Fisheries Commission (NWIFC), provided a document to the Board 7 titled “Teaching of our Ancestors, Tribal Habitat Strategy”. He said the Commission has been 8 working on this strategy for the past couple of years and is proud to share it with the Board. 9 10 APPROVAL OF MINUTES 11 MOTION: Lisa Janicki moved the Forest Practices Board approve the August 8 meeting 12
minutes. 13 14 SECONDED: Dave Herrera 15 16 ACTION: Motion passed unanimously. 17 18 PUBLIC COMMENT ON FIELD TOUR 19 Elaine Oneil, Washington Farm Forestry Association (WFFA), provided Board members with 20 copies of additional visual pictures of a live stream to augment the field tour yesterday. She noted 21 the lack of a live stream at the field tour site created difficulty in imagining the adequacy of a 25-22 foot wide buffer on a less than five foot wide stream. 23 24 Vic Musselman, WFFA, thanked the Board for the tour to visually witness the proposed thinning 25 template. He said the prescriptions for different stream widths addresses water resource protection 26 while offering small landowners options for smaller stream buffer widths and increased ability for 27 timber harvest. 28 29 Ken Miller, WFFA, provided additional information related to the tour. He said WFFA would 30 prefer the western Washington alternate plan template prescription be in rule, but WFFA is open 31 to alternative harvest pathways. He offered to meet with individual Board members to address any 32 concerns in order to arrive at a ‘yes’ in support of WFFA’s template. 33 34 Peter Goldman, Washington Forest Law Center, said the conservation caucus recognizes the small 35 forest landowner community as part of the larger picture and is aware of the issues they face. He 36 said their concern is for forest practices regulatory rollbacks for an alternate plan template that 37 may deviate from the rules. They believe site specific alternate plans are a better tool. 38 39 FIELD TOUR DEBRIEF 40 Marc Engel, DNR, provided general statistics in response to a question posed during the prior 41 day’s Board discussion regarding the number of alternate plans submitted by landowners. He said 42 from 2009 to 2015 there were a total of 9,714 small forest landowner Forest Practices 43 Applications (FPAs) submitted. Of these, 533 contained alternate plans, which was roughly five 44 percent of all small forest landowner FPAs. Of the 533 alternate plans, roughly three quarters 45 utilized an alternate plan template. 46
Forest Practices Board November 13 & 14, 2018, Draft Meeting Minutes 5
Board member Bob Guenther said he saw an opportunity for the proposed alternate plan template 1 to maintain riparian functions and provide some harvest within a riparian management zone 2 (RMZ). 3 4 Board member Tom Nelson said the approval standard in rule is a hang up. He said the benefit of 5 keeping small forest landowners in forest management by providing flexibility for thinnings 6 outweighs the impacts in the difference from a 50-foot to a 100-foot RMZ buffer. 7 8 Board member Jeff Davis wondered if it would be helpful to understand the scale between forest 9 landowners actively managing their land, landowners who may harvest only once and landowners 10 using their land for non-forestry purposes. The data may help the Board understand the impact of 11 the small forest landowner template. 12 13 Board member Paula Swedeen said she was impressed with the effort that has gone into the 14 development of the template. She encouraged the Board and technical group to be open to change 15 and creative thinking to produce a workable template. 16 17 Board member Carmen Smith provided reflection from her experience of landowner choices for 18 converting or remaining in forestry. She hopes a template could be developed so small forest 19 landowners wouldn’t be inclined to sell their land. 20 21 Board member Lisa Janicki said that complicated rules do create a risk for small forest landowners 22 who want to sell their land for development. She suggested aggressive pathways for funding to 23 support small forest landowners. 24 25 Board member Tom Laurie thought the larger discussion on small forest landowner options and 26 impacts would be beneficial. 27 28 Board member Dave Herrera appreciated the creativity of the proposal to address riparian 29 functions. He said he didn’t want the Board to lose sight of the decline in salmon and how fewer 30 salmon impacts tribal fisheries and the tribal way of life. He said he hopes the Board can be 31 creative by ensuring riparian functions are addressed and make it work for small forest 32 landowners. 33 34 Board member Ben Serr thanked the Millers for hosting the tour. He appreciated the discussion to 35 lessen the potential for small forest landowners to convert their land. 36 37 Chair Bernath acknowledged that Policy will be wrapping up the discussions on templates by May 38 2019. He suggested a work session for understanding small forest landownership data and current 39 land use. He said the Commissioner of Public Lands is committed to looking at ways to lessen 40 conversions of forest lands on the landscape. 41 42 NORTHERN SPOTTED OWL CONSERVATION ADVISORY GROUP 43 Marc Engel, DNR, reminded the Board of the yearly obligation to evaluate the need to maintain 44 the Northern Spotted Owl Conservation Advisory group. This group would be convened to 45 evaluate the need to maintain northern spotted owl habitat within spotted owl special emphasis 46
Forest Practices Board November 13 & 14, 2018, Draft Meeting Minutes 6
areas when a Washington Department of Fish and Wildlife (WDFW) approved survey notes the 1 absence of northern spotted owls within suitable habitat. Historically the Board has approved 2 maintaining this group even though the group has never been convened. 3 4 He said the northern spotted owl survey has been increased to a five year protocol and noted there 5 were no WDFW approved absence surveys this year. He recommended the Board maintain the 6 advisory group. 7 8 PUBLIC COMMENT ON NORTHERN SPOTTED OWL CONSERVATION ADVISORY 9 GROUP 10 None 11 12 NORTHERN SPOTTED OWL CONSERVATION ADVISORY GROUP 13 MOTION: Tom Laurie moved the Forest Practices Board maintain the Northern Spotted Owl 14
Conservation Advisory Group. 15 16 SECONDED: Carmen Smith 17 18 ACTION: Motion passed unanimously. 19 20 WATER TYPING SYSTEM RULE UPDATE 21 Marc Engel, DNR, provided an update on the completion and availability of the DNR GIS data 22 used for the potential habitat break (PHB) spatial analysis. He said DNR has created a ‘Box’ site, 23 available to the public, which contains the data and methodology for the spatial analysis of the 24 PHB options under review for the water typing system rule. The site link address has been sent to 25 the Board and Policy members with a brief description of the content in the Box. 26 27 He presented the DNR GIS data analysis for the three PHB alternatives: 28 • For alternative A, the Type F/N break moves upstream 305 feet for western Washington. 29 • For alternative B, the Type F/N break moves upstream 9 feet for western Washington and 30
downstream 318 feet for eastern Washington. 31 • For alternative C, the Type F/N break moves upstream 86 feet for western Washington and 32
downstream 260 feet for eastern Washington. 33 34 He said the draft water typing system rule should be completed in December 2018 and the 35 associated Board Manual development would resume after the draft rule has been finalized. 36 37 Board member Nelson asked if a workshop could be provided to help folks understand all the 38 information in the Box. 39
Engel said DNR is planning a presentation for Policy members on the GIS analysis and 40 accompanying information and that it could be expanded to include Board members. 41
Board member Swedeen asked if the average stream distances include Type F/N breaks within 42 tributaries segments or just main stem stream segments. 43
Engel said the PHB spatial analysis includes both main stem and tributary reaches. 44
Forest Practices Board November 13 & 14, 2018, Draft Meeting Minutes 7
Chair Bernath confirmed that DNR could conduct a presentation to discuss the GIS data in 1 preparation for February’s meeting. 2
Engel said DNR awarded a contract to Industrial Economics, Incorporated to conduct the cost 3 benefit analysis (CBA) and if needed, a small business economic impact statement (SBEIS). 4 Industrial Economics, Incorporated are preparing a description of their proposed methods and data 5 sources for the CBA and SBEIS. DNR will present the proposed methods to the economist 6 advisory committee for their comments. Engel shared that economists in the workgroup include 7 David Chertudi (DNR), Kristoff Larson (DNR), John Ehrenreich (Washington Forest Protection 8 Association) Paula Swedeen (conservation caucus), and Kasia Patora (Department of Ecology). 9 Other participating stakeholders include Jim Peters, Vic Musselman, Karen Terwilleger and Darin 10 Cramer. 11
He concluded by providing a status and estimated completion dates for the rule making package: 12 the environmental analysis has been started, the DNR GIS spatial data will be used to perform an 13 evaluation of environmental impacts, with the initial threshold determination for the SEPA 14 environmental analysis expected to be issued in April 2019; preparation of the draft rule language 15 will be completed in December; and the preliminary CBA/SBEIS is expected to be completed in 16 March 2019. 17 18 POTENTIAL HABITAT BREAK PILOT STUDY RESULTS 19 Hans Berge, AMPA and Phil Roni, science panel member, provided an update on the pilot study. 20 Berge reminded the Board that the Board requested the science panel to provide the Board with 21 the results of the pilot study by November 2018. 22 23 Roni said the goal of the pilot was to test their survey methodologies across sites in eastern and 24 western Washington to determine if the PHBs could be identified reliably to inform the validation 25 study. The goal was to select sites where end-of-fish points had previously been established. He 26 said they identified 13 sites in western Washington and 14 sites in eastern Washington. The 27 methods included locating the end of fish for each stream, surveying longitudinal profiles up and 28 downstream from the end of fish, and identifying PHBs within that stream reach. 29 30 Roni provided a slide showing an example of a stream profile with gradient and spatial profiles. 31 Due to time involved to conduct the survey, he said they chose to survey 100 meters up and 32 downstream instead of the intended distance of 200 meters. He provided a few slides showing how 33 the three PHB alternatives fall spatially within a stream profile. He said that the protocol 34 successfully identifies PHBs in eastern and western Washington. Due to what they found in the 35 pilot, Roni said they figure it will take one to two days to survey each site and in order to be 36 consistent during the validation study, the group recognized the need to develop a field manual for 37 the crews performing the work. 38 39 Board member Nelson asked why data from the northwest part of the state was not used in the 40 pilot and if that would jeopardized their findings. 41 42 Roni said the group felt that the lack of additional data from northwest Washington was not 43 needed for conducting the pilot. He confirmed that the validation study will include all forested 44 ecoregions including northwest. 45
Forest Practices Board November 13 & 14, 2018, Draft Meeting Minutes 8
1 Board member Davis asked if biological aspects and fish populations were considered in the 2 development of the pilot study. 3 4 Roni said the validation study will include a range of time periods to address seasonality. He said 5 most of the end of fish points are within headwater streams and contain resident trout so 6 seasonality should not be a problem. 7 8 POTENTIAL HABITAT BREAK VALIDATION STUDY DESIGN AND BUDGET 9 Hans Berge (AMPA) and Phil Roni, Pete Bisson, and Jeff Kershner (science team members), 10 presented the independent science peer review (ISPR) - approved PHB validation study design. 11 Berge briefly explained the history of how the validation study was conceptualized and originally 12 requested by the Board. He stated the study design received stakeholder review and was found to 13 be acceptable through ISPR. He reminded the Board that several components of the study design 14 including quality assurance-quality control to test repeatability of PHB identification across the 15 state, testing across years and seasons for a complete picture and inclusion of an eDNA element in 16 the second year are necessary. 17 18 Berge reminded the Board that stakeholders had opportunities to review drafts of the study design 19 in May and August 2018. Many important and constructive comments were incorporated into the 20 study design and if a comment was not included, the science team provided the reasons why the 21 comment was not incorporated. The science team felt the stakeholder review process was 22 transparent. He said every comment was entered into a matrix and the team’s response was then 23 shared with stakeholders. 24 25 Berge clarified the intent of the study is to validate what PHBs are in streams across the State for 26 the Board to review and select to use as part of the FHAM to determine the Type F/N break. In 27 order to accomplish the needed level of accuracy, the study is designed to take stream 28 measurements at a much finer detail, this will allow the Board the ability to consider changing the 29 PHBs as adopted in the rule. 30 31 Board member Davis expressed concerns with the additional costs of the validation study. 32 33 Berge said the science team attempted to refine the costs as best they could. Their goal was to 34 develop a study design with high accuracy in consideration of costs for arriving at the most 35 efficient method to test PHBs. The pilot study helped to provide certainty to the costs from the 36 original estimates. He also reminded the Board that the PHB study has been in the Cooperative 37 Monitoring, Evaluation, and Research Committee (CMER) Master Project Schedule for over a 38 year, although the total cost has increased by roughly 25% from the original estimate. In order to 39 reduce the estimated costs, tradeoffs would be needed with the study design and those changes 40 would likely require an additional check-in with the ISPR team. 41 42 Bisson said the group spent a lot of time discussing the appropriate sample size to inform the 43 study. He said the sample size they arrived at is their best conclusion for a consistent and precise 44 validation study given the financial resources they had to work within. The number of sites was 45
Forest Practices Board November 13 & 14, 2018, Draft Meeting Minutes 9
actually reduced from the original estimate based on the pilot study. He suggested that cutting 1 back on the sample size might save costs, but would compromise the rigor to test PHBs. 2 3 Roni agreed that the monetary value is high, but eliminating certain sample seasons or reducing 4 the number of ecoregions would reduce the rigor of the study design. 5 6 Board member Janicki asked how the 35 points will be selected within each ecoregion. 7 8 Roni said they will take a random sample of approximately 100 sites from each ecoregion to begin 9 with and from that, 35 logically adequate sites will be selected for the study. He said the intent is 10 for crews to screen 100 sites to find the most efficient and useful sites. 11 12 Board member Swedeen asked if ending the sample by December 31 would accurately account for 13 winter high flows. 14 15 Berge said December is the target, but it may need to be adjusted for reasons relating to sampling 16 procedures, crew safety, site specific hydrology or fish populations. He said the goal is to test 17 seasonality for low and high flow conditions and sampling into December may be an accurate way 18 to find fish and test PHBs in some settings, but may not work for others. The actual date for high 19 flow conditions will be determined for each site ultimately selected for the study. He said sites will 20 not be excluded from the study based on being a tributary or a main stem reach. 21 22 Board member Swedeen asked if the cost to conduct this study would bump other studies or 23 priorities on the CMER Master Project Schedule. 24 25 Berge said that with finite budget and staffing capacity in the Adaptive Management Program, the 26 implementation of this study does mean other projects will be delayed. He said it is the same 27 problem with each large project and the Board needs to consider implementation of each study in 28 the context of priorities. 29 30 Board member Laurie asked about the eDNA cost contained in the second year of the study. 31 32 Berge explained how the dollar amount for eDNA is broken out in the proposed budget—roughly 33 $50,000 for field kits, $60,000 for the lab analysis in the same year and $120,000 for finishing the 34 lab analysis and writing up the findings. 35 36 PUBLIC COMMENT ON POTENTIAL HABITAT BREAK VALIDATION STUDY 37 DESIGN AND BUDGET 38 Darin Cramer, WFPA, said they are generally supportive of the validation study. Their concerns 39 include better documentation on the purpose of the study and the cost of the study. He said they 40 believe the eDNA element is not necessary for this study. He said the process is lacking the formal 41 CMER buy off and would like to see a CMER vote and a timeline to get that accomplished. 42 43 Scott Swanson, Washington State Association of Counties, reminded the Board that the Board 44 elected to take the work being done on the water typing system from Policy to expedite the 45 process. He said it is important, although now in the hands of the Board, to get stakeholder buy in. 46
Forest Practices Board November 13 & 14, 2018, Draft Meeting Minutes 10
Steve Barnowe-Meyer, WFFA, said WFFA has several major concerns regarding the validation 1 study design and would like to see revisions prior to the Board’s acceptance. He said the detailed 2 analytical plan needs to be developed further. He said they would like the additional information 3 provided by Brian Fransen in his supporting science document dated October 22, 2018 included in 4 the study design and believe a detailed assessment of the anadromous zone is needed. He said 5 CMER needs to be brought into the development of the study design for transparency reasons. He 6 concluded by saying they strongly recommend the findings from the study inform the need for and 7 development of revisions to the current default physical criteria. 8 9 PUBLIC COMMENT (PM) 10 Elaine Oneil, WFFA, provided comments concerning the scale and scope of small forest 11 landowner impacts to fish, water and habitat from timber harvesting in western Washington. She 12 recommended the Board keep in mind land use decisions and the options to convert as they 13 consider those impacts to small forest landowners. 14 15 Ken Miller, WFFA, provided some cumulative impact statistics from a previous developed 16 template in 2007. He indicated that he did not believe the data has changed much since then. He 17 said of the 91% of small forest landowners that own more than five acres have 1250 feet or less of 18 stream reach; 18% of fish stream reaches in Washington are owned by small landowners and not 19 all are managed for timber. 20 21 Darin Cramer, Washington Forest Protection Association (WFPA), said the Board needs to 22 consider the criteria they will use to select the appropriate PHB alternative. He also said that 23 WFPA had hoped to provide comments on the 2019 fish presence survey protocol and that it was 24 unfortunate that the principals meeting was canceled and hoped the momentum will not be lost. 25 26 Karen Terwilleger, WFPA, thanked the Board for their service and commitment to protect public 27 resources. She also said she appreciates the kind words spoken of her earlier in the day. She 28 indicated her thorough enjoyment in working with the Board and her Policy colleagues over the 29 last several years. 30 31 PUBLIC COMMENT ON PHB 32 Ash Roorbach, Northwest Indian Fisheries Commission, said he supports giving CMER the ability 33 to comment on the validation study and supports CMER having oversight of the study. 34 35 Debbie Kay, Suquamish Tribe, said she supports moving the validation study through the 36 Adaptive Management Program. She hopes that site selection for the study encompasses low 37 gradient watersheds. 38 39 Marc Gauthier, Upper Columbia United Tribes, said he believes sight selection will be difficult. 40 He hopes the Board could accept the study design and have CMER staff help to find suitable 41 sights. He suggested CMER could provide comments without holding up the implementation of 42 the study. 43 44 POTENTIAL HABITAT BREAK VALIDATION STUDY DESIGN 45 Chair Bernath asked if any Board member had a motion to present. 46
Forest Practices Board November 13 & 14, 2018, Draft Meeting Minutes 11
MOTION: Tom Nelson moved that the Forest Practices Board accepts the draft study design 1 and directs CMER to: 2 1. Review and confer with the study design authors and the AMPA to accomplish 3
any necessary clarifications, and approve as satisfactory to successfully 4 implement the study; and 5
2. Complete this work as expeditiously as possible. 6 7
SECONDED: Carmen Smith 8 9 Board Discussion: 10 Board member Davis said he would like to see a discussion about the fiscal impacts if the 11 validation study is accepted. He said he is struggling with how clean water assurance studies will 12 be impacted if the study goes forward and questioned the urgency of this study. 13 14 Board member Laurie acknowledged the importance of current studies and thought having a 15 discussion regarding the impact to the budget is a good idea. He questioned the timing for a 16 CMER interaction. 17 18 Chair Bernath clarified that the Board has not considered postponing the rule making at this time. 19 20 Board member Davis acknowledged that some priorities will have to fall off if the study is 21 accepted. 22 23 Berge said he has been meeting with the Instream Scientific Advisory Group to discuss a potential 24 CMER acceptance of the validation study. He said a phased approach could be done to make 25 progress, such as getting permits or selecting sites. He said there are several non-clean water 26 assurance studies on the Master Project Schedule. 27 28 Board member Herrera said he is concerned with the ‘approved CMER’ language in the motion. 29 He is doubtful CMER would reach consensus on the study design. 30 31 Board member Nelson felt that the formal process from CMER may not be warranted, but input 32 from CMER might help arrive at consensus by the scientists who worked on the study. 33 34 Chair Bernath said he is not aware of a non-consensus outcome on the study design. He clarified 35 that consensus was not reached on the use of tributaries as it relates to fish habitat. 36 37 Board member Serr said he would like to see a discussion on the budget impacts resulting from the 38 additional cost in order to make an informed decision on the validation study. 39 40 Berge said they always envisioned this study impacting other priorities on the budget. He 41 confirmed that accepting the validation study will impact other priorities on the Master Project 42 Schedule. 43 44 Chair Bernath summarized the direction Board members are leaning. He said he believes the 45 Board is comfortable in accepting the study design, and the need to include a step for CMER to 46
Forest Practices Board November 13 & 14, 2018, Draft Meeting Minutes 12
comment on the study design as well as see a benefit to implementing a phased approach. He 1 suggested addressing potential budget impacts as a result of adding the validation study to occur at 2 the February 2019 meeting. 3 4 Board member Nelson said he would like to withdraw his original motion and replace it with an 5 alternative motion. 6 7 ACTION: Motion withdrawn. 8 9 MOTION: Tom Nelson moved that the Forest Practices Board accepts the draft study design 10
and directs CMER to review and comment on the study design and send comments 11 to the AMPA for consideration. 12
13 He further moved that CMER work with AMPA to create an implementation plan 14 that employs a phased approach to include hiring staff and site selection within this 15 fiscal year. 16
17 SECONDED: Carmen Smith 18 19 Board Discussion: 20 Board member Laurie suggested clarifying the motion to include language on what will occur with 21 the comments from CMER. The motion was changed to add “send comments to the AMPA for 22 consideration”. 23 24 ACTION: Motion passed unanimously. 25 26 ADDENDUM TO JANUARY 2018 SCIENCE PANEL REPORT LISTING SCIENCE 27 USED FOR PHB RECOMMENDATIONS ON TRIBUTARY STREAMS 28 Hans Berge, AMPA, Phil Roni, Pete Bisson and Brian Fransen, science panel members, provided 29 a brief overview of the Board’s request for the science panel to provide an addendum to their PHB 30 report. Berge reminded the Board that in August 2018, the Board directed the AMPA to convene 31 the authors of the PHB science report to update the report to reflect all perspectives and supporting 32 science regarding tributaries. 33 34 Berge said the addendum is specific to how the literature addresses tributaries in relation to fish 35 habitat. He said consensus was not reached within the group and as a result, two documents were 36 prepared for the Board explaining the thought behind the two opposing viewpoints. The two 37 documents show the majority and minority opinions. 38 39 Board member Swedeen said that scientific professionals often disagree and it is not a failure to 40 have different science opinions rather than consensus. 41 42 UPDATE ON RECOMMENDATIONS FOR 2019 STREAM SURVEY PROTOCOL 43 Board member Davis said a first draft has been sent to DNR to establish if it is within the 44 sideboards of the existing rule and Board Manual guidance. After DNR has provided its response 45 it will then be provided to other stakeholders for feedback. 46
Forest Practices Board November 13 & 14, 2018, Draft Meeting Minutes 13
1 UPDATE OF BOARD COMMITTEE ON EFFICIENCY AND EFFECTIVENESS 2 IMPROVEMENTS FOR THE ADAPTIVE MANAGEMENT PROGRAM 3 Board member Janicki stated that for a variety of reasons the committee is not on the right path at 4 the right time to address efficiency and effectiveness improvements for the adaptive management 5 program. This means the “principals plus” meeting has been delayed and the facilitation contract 6 has been cancelled. 7 8 She noted that although the committee is on pause, DNR will be working to keep the motivation 9 going by considering scheduling a meeting with the appropriate people who understand the issues 10 and a vested interest after the conclusion of the 2019 legislation session. At that time, the group 11 would hire a facilitator with foundational knowledge. 12 13 Chair Bernath said DNR is working to make these things happen as soon as possible. 14 15 Board member Janicki thanked the committee for their work and thanked the 62 individuals who 16 were interviewed. Several Board members also thanked the committee members for their hard 17 work thus far. 18 19 COMPLIANCE MONITORING 2016-2017 BIENNIAL REPORT 20 Chris Briggs and Donelle Mahan, DNR, provided the results of the 2016-2017 Compliance 21 Monitoring Biennial Report. Briggs said the program asks the question, “Are forest practices 22 being conducted in compliance with the rules.” They test the various prescriptions within the rule 23 for compliance. From that, he said the program is able to determine compliance rates for various 24 forest practices activities. The prescriptions sampled include the various Type F and N RMZ 25 prescriptions, wetlands typing and road compliance. 26 27 He said they sampled 135 FPAs with 198 prescriptions during the 2016-2017 season. The report 28 also had an unstable slope component; in the pilot year they sampled nine FPAs and during the 29 2017 season, they sampled 43 FPAs. 30 31 He provided the results for water typing compliance and an explanation for how the program rates 32 compliance. The presentation showed that of 183 water sites sampled, 29 sites involved some 33 disparity, 14 waters were under classified, 12 waters where over classified and three water typing 34 determinations were indeterminate. The compliance results for standard rules include 92-96% 35 compliance for desired future condition options, 95% compliance for no inner zone harvest, 87% 36 compliance for Type Np waters, 100% compliance for Type Ns waters, 92% compliance for 37 wetlands and 95% compliance for forest roads. He said haul route assessments resulted in an 38 average of 92% compliance. 39 40 He said the unstable slopes component involved looking at rule-identified landforms (RIL) in and 41 around the FPA activity footprint. Field reviews and compliance determinations were conducted 42 by DNR qualified experts and individuals from Ecology’s forestry unit. He said compliance 43 determinations were based on FPA compliance only. He showed that two deviations occurred 44 where mitigation was not applied for RILs within an FPA footprint, four deviations were observed 45 where harvest occurred within a mitigation area associated with a potentially unstable RIL and no 46
Forest Practices Board November 13 & 14, 2018, Draft Meeting Minutes 14
deviations were observed where the qualified expert’s report/recommendations were submitted 1 with the FPA. 2 3 He concluded by suggesting the results show high compliance rates on rule implementation since 4 their findings showed compliance rates at or above 90%. Over the last several years, the trends for 5 all prescriptions show improvement. 6 7 Mahan described how DNR is using the results and lessons learned from the Compliance 8 Monitoring Program to continue to make the program better. Some examples include clarifying 9 various FPA form instructions and protocol processes, conducting trainings throughout the year 10 and seeking educational opportunities. 11 12 She said education to the regulated landowner community to achieve voluntary compliance with 13 rules is key. Training for forest practices staff to support a consistent understanding of the rules 14 and Board Manual guidance and how they are implemented is the greatest need in relation to risk 15 management. She said the operations section communicates the trends and results at region TFW 16 meetings so landowners are aware of the deviations being discovered. These meetings involve 17 staff from WDFW, Ecology, tribal biologists and landowners as well as other interested parties 18 where they can discuss a variety of topics of interest in a particular DNR region. She concluded by 19 saying DNR will continue this outreach and information sharing approach in order to work 20 towards consistent and effective implementation of the Forest Practices Rules. 21 22 STAFF REPORTS 23 No questions on the following reports: 24 • Adaptive Management 25 • Compliance Monitoring 26 • Small Forest Landowner Office 27 • Upland Wildlife Update 28 29 2019 WORK PLANNING 30 Marc Engel, DNR, reviewed the 2018 completed work. He then presented staff recommendations 31 for the Board’s 2019 work plan priorities. The work plan was amended to include a work session 32 on small forest landowner data, the PHB study design budget, water typing data and rule making 33 elements. 34
35 MOTION: Dave Herrera moved the Forest Practices Board approve the 2019 Proposed Work 36
Plan as amended. 37 38 SECONDED: Ben Serr 39 40 ACTION: Motion passed unanimously. 41 42 EXECUTIVE SESSION 43 Executive session occurred from 4:05 p.m. - 4:25 p.m. 44 45 Meeting adjourned at 4:25p.m. 46
ES-1
EXECUTIVE SUMMARY
Headwater streams, which comprise approximately 65% of the total stream length on forestlands in western Washington, are largely understudied relative to their frequency in the landscape. We evaluated the effectiveness of riparian forest management prescriptions for small non-fish-bearing (Type N) headwater stream basins in western Washington by comparing current prescriptions to alternatives with longer riparian leave-tree buffers and no buffers. We looked at the magnitude, direction (positive or negative), and duration of change for riparian-related inputs and response of instream and downstream components (see Chapter 1 – Introduction and Background). The focus of the study was on Forests and Fish-designated species of stream-associated amphibians. We also evaluated riparian processes affecting in-channel wood recruitment and loading, stream temperature and shade, discharge, nutrient export, suspended sediment export (SSE), channel characteristics, litterfall input and detritus export, biofilm and periphyton, macroinvertebrate export, and downstream fish density and population structure (see Supplement 1 for a complete list of response variables). The results of this study will inform the efficacy of current Forest Practices rules, including how landowners can continue harvesting wood resources while protecting important headwater habitats and associated species.
We used a Before-After Control-Impact (BACI) study design with blocking to examine how harvest treatments influenced resource response. We collected pre-harvest data from 2006 through 2008 and post-harvest data from 2009 into 2011 (see Chapter 2 – Study Design). Study sites included 17 Type N stream basins located in managed second-growth conifer forests across western Washington. Sites were restricted to Type N basins less than 54 ha (133 ac) in size with relatively competent lithologies. We evaluated four experimental treatments, including an unharvested Reference (i.e., in the harvest rotation but withheld from harvest; n = 6) and three alternative riparian buffer treatments involving clearcut harvest of the entire basin. Riparian buffer treatments included the following: 100% treatment (a two-sided 50-ft [15.2-m] riparian leave-tree buffer along the entire riparian management zone [RMZ; n = 4]); FP treatment (a two-sided 50-ft [15.2-m] riparian buffer along at least 50% of the RMZ, consistent with the current Forest Practices buffer prescription for Type N streams [n = 3]); and 0% treatment (clearcut harvest throughout the entire RMZ [n = 4]). The buffer treatments were implemented between October 2008 and August 2009 (see Chapter 3 – Management Prescriptions). Results presented in this summary include those that had statistically significant pre- to post-harvest changes that differed between treatments (alpha of 0.05 or 0.1, depending on the response and clarified in each chapter).
We found that harvest of timber in and adjacent to streamside riparian forests directly affected tree mortality, tree fall rates, and large wood recruitment to streams. The highest mortality rates and greatest reductions in density and basal area occurred in the FP treatment RMZ buffers and the buffers surrounding the uppermost points of perennial flow (PIPs; see Chapter 5 – Stand Structure and Tree Mortality Rates in Riparian Buffers). Mortality and tree fall rates in FP treatment RMZs were significantly greater than in either the 100% treatment or reference RMZs. Tree mortality and tree fall were significantly greater in both the 100% and FP treatment PIPs relative to reference rates. Windthrow-associated tree fall in riparian buffers increased large
Effectiveness of Experimental Riparian Buffers on Perennial Non-fish-bearing Streams on Competent Lithologies in Western Washington
TYPE N BUFFER EFFECTIVENESS ON HARD ROCK LITHOLOGIES
ES-2
wood (≥10 cm [4 in] diameter) recruitment to channels in the 100% and FP treatments (see Chapter 6 – Wood Recruitment and Loading). However, the vast majority of recruited trees were completely suspended above the active stream channel. We observed a significant post-harvest increase in small wood (<10 cm [4 in] diameter) in the channel in the 0% treatment relative to the FP and 100% treatments, and an increase in in-channel large wood in all three buffer treatments relative to the reference. Increases in in-channel wood loading in treated sites may have been responsible for the changes we saw in stream channel characteristics. We observed a significant post-harvest increase in stream pool length in all three riparian buffer treatments (see Chapter 11 – Stream Channel Characteristics). The pre- to post-harvest change in stream bankfull and wetted widths, and the proportion of the stream channel rise attributed to steps, was significantly less in the 0% treatment than in any other treatment including the reference.
Shade decreased and water temperature increased in all buffer treatments, with the greatest change in temperature occurring during the July–August period (see Chapter 7 – Stream Temperature and Cover). Both maximum and minimum daily temperatures increased significantly in all buffer treatments over some part of the year. The maximum daily temperature showed signs of recovery toward pre-harvest conditions downstream from the harvest unit (i.e., within 100 m downstream of the harvest boundary); however, stream temperature remained above pre-harvest levels at five of the six sites where downstream recovery could be assessed. While we observed post-harvest reductions in canopy across all riparian buffer treatments, that reduction did not result in differences in biofilm ash-free dry mass (AFDM) or chlorophyll a by treatment following harvest (see Chapter 13 - Biofilm and Periphyton).
We measured discharge, SSE and nutrient export in eight study sites, four each in the Olympic and Willapa Hill ecoregions. Annual runoff increased in all buffer treatment sites as a result of harvest, but the magnitude of change varied by season and return interval (see Chapter 8 – Discharge). As expected, total water yield increased as a function of the proportion of the total area of each basin harvested, which was 88% and 94% in the two FP treatments and 45% and 89% in the two 100% treatments. We saw very little change in the 100% treatment site, where only 45% of the basin was harvested. All sites exhibited changes in discharge, and mean discharge increased in the FP and 0% treatment, but not in the 100% treatment. Baseflows decreased in the 100%, were largely unchanged in the FP, and increased in the 0% treatment.
The sites monitored for SSE appeared to be supply limited (i.e., sediment transport was limited by the sediment delivered to the stream from the adjacent uplands) both before and after harvest (see Chapter 10 – Sediment Processes). Most of the sediment export occurred during late fall or early winter storm events, and the relative magnitude of export was stochastic across sites and treatments. In four of the six buffer treatment sites, SSE was greater during clearcut harvest implementation or in the two year post-harvest period, but spikes in sediment export were of similar magnitude to those observed in one of the two reference sites during the same periods.
Mean total nitrogen (N) and nitrate-N concentrations increased in all buffer treatments. The estimated change was greatest in the 0%, intermediate in the FP, and lowest in the 100% treatment, consistent with an increase in the proportion of the watershed harvested, but only the 0% differed statistically from the other buffer treatments (see Chapter 9 – Nutrient Export).
EXECUTIVE SUMMARY: MCINTYRE AND COLLEAGUES
ES-3
Overall, total litterfall input was slightly higher after harvest in the 100% treatment, lower in the FP treatment and lowest in the 0% treatment; however, we observed statistical differences only for deciduous inputs between the 0% treatment and the other treatments (see Chapter 12 – Litterfall Input and Detritus Export). Total detritus export decreased in the 0% treatment relative to the reference, and in the FP and 0% treatments relative to the 100% treatment.
We observed some changes in macroinvertebrate export after harvest, but did not detect any major reductions in macroinvertebrate export or major shifts in functional feeding groups (see Chapter 14 – Macroinvertebrate Export). Collector-gatherer export in biomass per day decreased in the 0% treatment relative to the FP treatment, but increased in the FP treatment relative to the reference and the 100% treatment.
Treatment effects for stream-associated amphibians (Coastal Tailed Frog [Ascaphus truei], and torrent [Rhyacotriton] and giant [Dicamptodon] salamanders) were variable among genera and, for tailed frogs, life stage (see Chapter 15 – Stream-associated Amphibians). We found statistical support for a negative effect of buffer treatment on the density of giant salamanders in the FP treatment. We found that larval Coastal Tailed Frog density increased significantly in the 100% and FP treatments relative to the reference and 0% treatment. Post-metamorphic Coastal Tailed Frog density also increased, but only in the 0% treatment. We lacked evidence of a treatment response for torrent salamanders, except when stream reaches that were visibly obstructed by dense matrices of logging slash in the form of downed wood, litter and fines were included in the analysis; here, torrent salamander density increased significantly in the 0% treatment.
Based on results from six study sites, we found that cutthroat trout (Oncorhynchus clarkii) density and population structure downstream of study sites were highly variable across sites, months and years (see Chapter 16 – Downstream Fish). Variability in total fish abundance was not correlated with physical stream habitat metrics such as gradient and percent pool area. Consistently low recapture rates for passive integrated transponder (PIT)-tagged fish over the course of the study provided evidence of a high level of fish emigration from, and/or mortality within, study reaches.
During the two years post-harvest, the 100% buffer treatment was the most effective in maintaining pre-harvest conditions, the FP was intermediate, and the 0% treatment was least effective compared to reference sites (see Chapter 17 – Summary and Discussion). The collective effects of timber harvest, both in terms of statistical significance and magnitude, were most apparent in the 0% treatment. The direction and magnitude of changes for the 100% and FP treatments did not differ statistically for some metrics, including large wood recruitment, wood cover and loading, water temperature, discharge and channel unit metrics, and Coastal Tailed Frog density. However, some differences existed between the 100% and FP treatments, including for tree mortality and stand structure, riparian cover, detritus and macroinvertebrate export and giant salamander density. While post-harvest differences in the response of treatments were readily apparent across a suite of variables, we noted no consistent negative impacts for stream-associated amphibians.
1 | P a g e T y p e N p P r o p o s e d A c t i o n A l t e r n a t i v e
Timber, Fish and Wildlife Policy Committee Forest Practices Board PO BOX 47012, Olympia, WA 98504-4712
Policy Co-Chairs: Curt Veldhuisen, Skagit River System Cooperative Terra Rentz, Department of Fish & Wildlife
January 18, 2019
TO: Forest Practices Board
FROM: Terra Rentz, Co-Chair, Timber, Fish, and Wildlife Policy Committee Curt Veldhuisen, Co-Chair, Timber, Fish, and Wildlife Policy Committee
SUBJECT: Consensus proposal in response to study results of Type Np streams in Westside basalt lithology
On 12 July 2018 TFW Policy formally accepted the Findings Report and associated materials of the study entitled Effectiveness of Experimental Riparian Buffers on Perennial Non-fish-bearing Streams on Competent Lithologies in Western Washington (hereafter: Type N Hardrock Study). This action put into motion a 180-day timeline specified in Board Manual Section 22 that directs policy to (i) review and evaluate the findings, (ii) determine if the findings warrant action, and (iii) develop, and select by consensus, alternative actions for consideration by the Board. More specifically, Policy took action according to the following timeline:
A. 12 July 2018 – Findings report and associated materials formally accepted (consensus) B. 26 August 2018 – Policy determined that the findings warrant action and approves the formation of a
Workgroup to develop action alternatives for consideration (consensus) C. 25 October 2018 – Workgroup delivers action alternatives to Policy for consideration (no action) D. 6 December 2018 – Policy formally accepts an action alternative for Board consideration (consensus) E. 3 January 2019 – Policy approves a functioning Charter for the Technical Type Np Prescriptions
Workgroup as a supplemental element of the action alternative (consensus)
After review of the findings, Policy affirms that the Type N Hardrock study indicates a temperature increase associated with the buffer treatments tested. Therefore, Policy agrees action is warranted. The following consensus proposal outlines an alternative action process including creation of a Technical Workgroup charged to develop for Policy’s consideration proposed Riparian Management Zone (RMZ) buffer prescriptions for Type Np streams in Western Washington. The associated workgroup charter is the product of the collaborative TFW Policy process with input from all caucuses. The purpose of the Charter is to guide workgroup operations, timeline, and outcomes and was approved by full consensus.
Policy requests that the Board accept the consensus proposal and associated Charter.
TIMBER FISH & WILDLIFE
2 | P a g e T y p e N p P r o p o s e d A c t i o n A l t e r n a t i v e
TFW Policy Consensus Proposal to the Board on a response to study results of the Effectiveness of Experimental Riparian Buffers on Perennial Non-fish-
bearing Streams on Competent Lithologies in Western Washington
Approved v. 12-6-18 The Effectiveness of Experimental Riparian Buffers on Perennial Non-fish-bearing Streams on Competent Lithologies in Western Washington study (hereafter: Type Np Hardrock) indicates there is a temperature increase associated with the buffer treatments tested. Therefore, Policy agrees action is warranted. Policy recommends the following components:
1. Formation of a technical workgroup. a. This workgroup shall be governed by a charter. The charter will be drafted by Policy
member(s) and approved by Policy.
b. For efficient decision-making, the composition of the workgroup will include no more than 10 members:
i. Two representatives of Policy caucuses, one of whom will chair the process. The primary role of Policy members will be to manage the process. The policy members are non-voting in the workgroup.
ii. Up to eight people balanced among the following areas of expertise: biological and physical stream processes, and silviculture/field forestry.
iii. Additional experts can be added on a temporary, ad-hoc basis as needed per the direction of the workgroup.
iv. The caucuses and AMPA will put together a list of names for Policy to approve. Policy will choose potential members by least objectionable. In the event of a tie, there will be a random draw.
v. This workgroup will be staffed by a project manager from the AMP.
c. Expectations of the workgroup: i. Meet on a regular and timely schedule
ii. Adhere to a timeline [established by the Board] iii. Report regularly to Policy
d. The deliverable of the workgroup is a set of proposed Type Np Riparian Management
Zone (RMZ) prescriptions that meet the following objectives. i. Protect water temperature to meet the rule (WAC 173-201A-200, -300-320) ii. Are repeatable and enforceable iii. Are operationally feasible iv. Provide wood to the stream over time v. Account for windthrow vi. Consider options that allow for management in the RMZ vii. Minimize additional economic impact
2. The workgroup shall utilize all relevant information to inform proposed RMZ prescriptions for Np
streams, including available literature and data while adhering to the timeline.
3. Additional Type N projects currently in the CMER process shall also inform the workgroup, upon receipt of approved findings reports from CMER. Policy agrees to support timely completion of these projects, including regular status reports at Policy meetings. The projects include: a. Buffer-Shade Amphibian Response (anticipated Feb ’19) b. Buffer Characteristics, Integrity and Function (BCIF) (anticipated Spring ’19)
3 | P a g e T y p e N p P r o p o s e d A c t i o n A l t e r n a t i v e
c. Type N Experimental Buffer Treatment in Hard Rock Lithologies- Extended (anticipated September ’19)
d. Type N Experimental Buffer Treatment Project in Soft Rock Lithology (anticipated December ’19)
4. Policy agrees the Riparian Characteristics and Shade study should be funded and initiated as soon
as possible. This study does not necessarily need to be completed for decision-making by the workgroup (see below), but it is expected that the study can inform the workgroup and vice-versa. It is anticipated that rulemaking will be needed to implement prescriptions that result from Policy’s recommended actions.
5. The workgroup process is expected to run concurrently with the CMER process associated with the remaining Type N projects, and conclude within 6 months of receipt of the final Type N study. A final Policy recommendation to the FPB is anticipated in mid to late 2020.
6. By the January 2019 Policy meeting, Policy will consider a draft charter for the technical
workgroup reflective of the elements described in this proposal and that clearly articulates the manner in which the workgroup will conduct their analysis and their deliverables to Policy.
4 | P a g e T y p e N p P r o p o s e d A c t i o n A l t e r n a t i v e
CHARTER: TECHNICAL TYPE NP PRESCRIPTIONS
WORKGROUP
I. Date: March 7, 2019
II. Project Duration: March 7, 2019 through completion. Completion is to occur six months after receipt of final affiliated report, estimated June 19, 2020
III. Introduction This charter is intended to guide the formation and efforts of a Technical Type Np Prescriptions Workgroup (hereafter: Workgroup), which is a sub-group of the Timber, Fish and Wildlife (TFW) Policy Committee (hereafter: Policy). The Workgroup will be formed as an outcome of alternative actions proposed by Policy in response to the study entitled Effectiveness of Experimental Riparian Buffers on Perennial Non-fish-bearing Streams on Competent Lithologies in Western Washington (hereafter: Hard Rock Study). The purpose of the workgroup is to develop proposed Riparian Management Zone (RMZ) buffer prescriptions for Type Np streams in western Washington for Policy’s consideration. Based on the scope of the Hard Rock Study, the initial focus is on western Washington streams in areas of hard rock lithology, to achieve temperature protection objectives. However, this scope may be expanded per the direction of Policy as more information becomes available. Policy affirmed, through consensus, that the Hard Rock Study indicated there was a temperature increase associated with the buffer treatments tested. Therefore, Policy agreed the findings warrant action and proposed the following process components:
1. Formation of a technical workgroup, governed by a charter, to develop and deliver a set of proposed RMZ buffer prescriptions for Type Np streams that meet a suite of resource protection, feasibility, and economic objectives.
2. The workgroup will utilize all relevant information to inform proposed RMZ buffer prescriptions for Np streams, including available literature and data while adhering to the timeline.
3. Inclusion of additional Type N related projects currently in the CMER process including the Buffer Integrity – Shade Effectiveness (Amphibian) project, Westside Type N Buffer Characteristics, Integrity and Function (BCIF) study, Type N Experimental Buffer Treatment in Hard Rock Lithology - Phase II Extended Monitoring study, and the Type N Experimental Buffer Treatment in Soft Rock Lithologies study. These products would be available for the workgroup upon delivery to Policy from CMER.
4. Expedited funding and implementation of the Buffer Characteristics and Shade study to both inform, and be informed by, the workgroup
5. Adherence to a timeline that is expected to run concurrently with the CMER process associated with remaining Type N projects and conclude within 6 months of receipt of the final study. At the time of drafting, the Type N Soft Rock study is anticipated to be the final study delivered by CMER in this series.
Policy anticipates that rulemaking will be needed to implement RMZ buffer prescriptions for Type Np streams that result from recommended actions.
IV. Workgroup Purpose The purpose of the Workgroup is to develop proposed RMZ buffer prescriptions for perennial, non-fish bearing (Type Np) streams in western Washington that meet the following objectives:
5 | P a g e T y p e N p P r o p o s e d A c t i o n A l t e r n a t i v e
i. Protect water temperatures to meet the rule (WAC 173-201A-200, -300-320); ii. Are repeatable and enforceable;
iii. Are operationally feasible; iv. Provide wood to the stream over time; v. Account for windthrow;
vi. Consider options that allow for management (e.g. selective harvest) in the RMZ; and vii. Minimize additional economic impact.
Although the site specificity of the Hard Rock Study applies to above ground stream components in basalt (hard rock) lithology, Policy may expand the objectives and/or geologic/geographic applicability of proposed prescriptions if findings from subsequent Type N projects warrant action. The workgroup shall understand results of the Hard Rock Study and utilize all available information to inform the development of proposed RMZ buffer prescriptions for Np streams as described above, including best available science and related documents from within the Adaptive Management Program (AMP), and additional final CMER-approved findings reports from Type N projects. These studies include:
A. Buffer Integrity – Shade Effectiveness (Amphibian) Project B. Westside Type N Buffer Characteristics, Integrity and Function (BCIF) C. Type N Experimental Buffer Treatment in Hard Rock Lithology - Phase II Extended Monitoring D. Type N Experimental Buffer Treatment in Soft Rock Lithologies
As each study becomes available, the Workgroup will assess its implications and incorporate the new results into the Workgroup’s ongoing work, per Policy’s direction. These studies and their associated findings are the products of an agreed upon process within WAC 222-12-045. It is not the role of the Workgroup to reanalyze the Hard Rock Study, or the additional Type N projects listed above, to refute the findings produced through the CMER process. Policy expects the Workgroup to understand the findings and full reports of the Hard Rock Study, and subsequent projects and, if needed, solicit additional input from project Principal Investigators (PIs) or outside experts to identify knowledge gaps and gain a better understanding of the CMER research. The Workgroup may employ any necessary information gathering, synthesis, and/or understand cause and effects to inform prescription development. However, Policy expects the Workgroup to adhere to the timeline established in Section VI of the Charter.
V. Deliverables 1. Development of one or more forest practice RMZ prescriptions for perennial, non-fish bearing (Type Np)
streams in western Washington that meet the objectives in Section IV.
2. Estimate the level of effectiveness of proposed Type Np water RMZ buffer prescriptions at meeting resource objectives identified in The Forest Practices Board approved Schedule L1 of the Forest and Fish Report and affirmed in the Forest Practices Habitat Conservation Plan using literature, modelling or other methods.
3. Submission of final report no later than 6 months post-receipt of final Type Np study (estimated June 19,
2020) to Policy that articulates Deliverables 1 and 2, any major process findings, and any areas of non-consensus.
6 | P a g e T y p e N p P r o p o s e d A c t i o n A l t e r n a t i v e
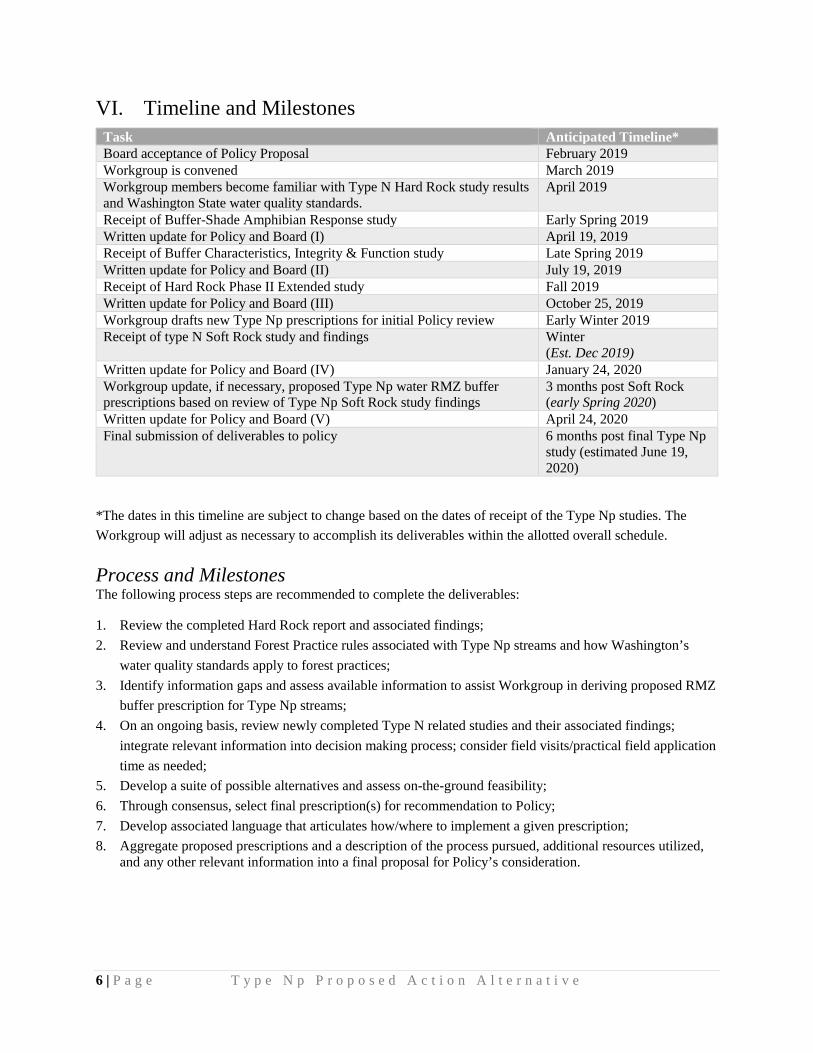
VI. Timeline and Milestones Task Anticipated Timeline* Board acceptance of Policy Proposal February 2019 Workgroup is convened March 2019 Workgroup members become familiar with Type N Hard Rock study results and Washington State water quality standards.
April 2019
Receipt of Buffer-Shade Amphibian Response study Early Spring 2019 Written update for Policy and Board (I) April 19, 2019 Receipt of Buffer Characteristics, Integrity & Function study Late Spring 2019 Written update for Policy and Board (II) July 19, 2019 Receipt of Hard Rock Phase II Extended study Fall 2019 Written update for Policy and Board (III) October 25, 2019 Workgroup drafts new Type Np prescriptions for initial Policy review Early Winter 2019 Receipt of type N Soft Rock study and findings Winter
(Est. Dec 2019) Written update for Policy and Board (IV) January 24, 2020 Workgroup update, if necessary, proposed Type Np water RMZ buffer prescriptions based on review of Type Np Soft Rock study findings
3 months post Soft Rock (early Spring 2020)
Written update for Policy and Board (V) April 24, 2020 Final submission of deliverables to policy 6 months post final Type Np
study (estimated June 19, 2020)
*The dates in this timeline are subject to change based on the dates of receipt of the Type Np studies. The Workgroup will adjust as necessary to accomplish its deliverables within the allotted overall schedule.
Process and Milestones The following process steps are recommended to complete the deliverables:
1. Review the completed Hard Rock report and associated findings; 2. Review and understand Forest Practice rules associated with Type Np streams and how Washington’s
water quality standards apply to forest practices; 3. Identify information gaps and assess available information to assist Workgroup in deriving proposed RMZ
buffer prescription for Type Np streams; 4. On an ongoing basis, review newly completed Type N related studies and their associated findings;
integrate relevant information into decision making process; consider field visits/practical field application time as needed;
5. Develop a suite of possible alternatives and assess on-the-ground feasibility; 6. Through consensus, select final prescription(s) for recommendation to Policy; 7. Develop associated language that articulates how/where to implement a given prescription; 8. Aggregate proposed prescriptions and a description of the process pursued, additional resources utilized,
and any other relevant information into a final proposal for Policy’s consideration.
7 | P a g e T y p e N p P r o p o s e d A c t i o n A l t e r n a t i v e
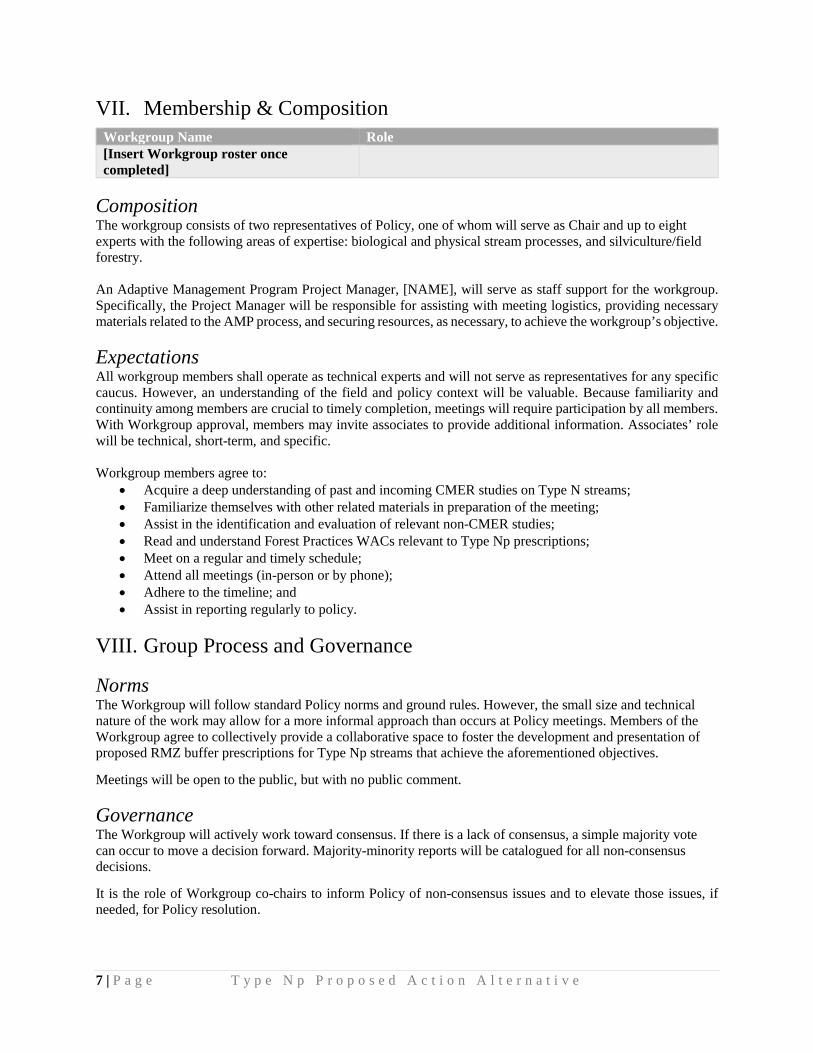
VII. Membership & Composition Workgroup Name Role [Insert Workgroup roster once completed]
Composition The workgroup consists of two representatives of Policy, one of whom will serve as Chair and up to eight experts with the following areas of expertise: biological and physical stream processes, and silviculture/field forestry. An Adaptive Management Program Project Manager, [NAME], will serve as staff support for the workgroup. Specifically, the Project Manager will be responsible for assisting with meeting logistics, providing necessary materials related to the AMP process, and securing resources, as necessary, to achieve the workgroup’s objective.
Expectations All workgroup members shall operate as technical experts and will not serve as representatives for any specific caucus. However, an understanding of the field and policy context will be valuable. Because familiarity and continuity among members are crucial to timely completion, meetings will require participation by all members. With Workgroup approval, members may invite associates to provide additional information. Associates’ role will be technical, short-term, and specific. Workgroup members agree to:
• Acquire a deep understanding of past and incoming CMER studies on Type N streams; • Familiarize themselves with other related materials in preparation of the meeting; • Assist in the identification and evaluation of relevant non-CMER studies; • Read and understand Forest Practices WACs relevant to Type Np prescriptions; • Meet on a regular and timely schedule; • Attend all meetings (in-person or by phone); • Adhere to the timeline; and • Assist in reporting regularly to policy.
VIII. Group Process and Governance
Norms The Workgroup will follow standard Policy norms and ground rules. However, the small size and technical nature of the work may allow for a more informal approach than occurs at Policy meetings. Members of the Workgroup agree to collectively provide a collaborative space to foster the development and presentation of proposed RMZ buffer prescriptions for Type Np streams that achieve the aforementioned objectives.
Meetings will be open to the public, but with no public comment.
Governance The Workgroup will actively work toward consensus. If there is a lack of consensus, a simple majority vote can occur to move a decision forward. Majority-minority reports will be catalogued for all non-consensus decisions.
It is the role of Workgroup co-chairs to inform Policy of non-consensus issues and to elevate those issues, if needed, for Policy resolution.
8 | P a g e T y p e N p P r o p o s e d A c t i o n A l t e r n a t i v e
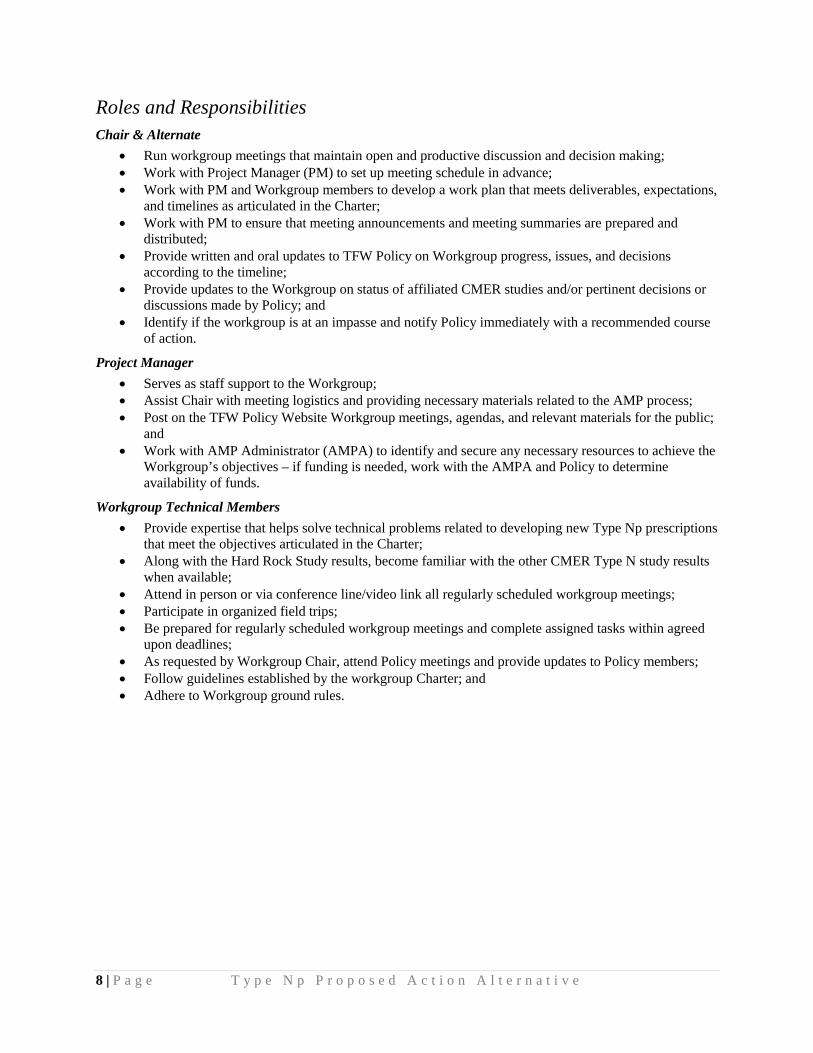
Roles and Responsibilities Chair & Alternate
• Run workgroup meetings that maintain open and productive discussion and decision making; • Work with Project Manager (PM) to set up meeting schedule in advance; • Work with PM and Workgroup members to develop a work plan that meets deliverables, expectations,
and timelines as articulated in the Charter; • Work with PM to ensure that meeting announcements and meeting summaries are prepared and
distributed; • Provide written and oral updates to TFW Policy on Workgroup progress, issues, and decisions
according to the timeline; • Provide updates to the Workgroup on status of affiliated CMER studies and/or pertinent decisions or
discussions made by Policy; and • Identify if the workgroup is at an impasse and notify Policy immediately with a recommended course
of action.
Project Manager • Serves as staff support to the Workgroup; • Assist Chair with meeting logistics and providing necessary materials related to the AMP process; • Post on the TFW Policy Website Workgroup meetings, agendas, and relevant materials for the public;
and • Work with AMP Administrator (AMPA) to identify and secure any necessary resources to achieve the
Workgroup’s objectives – if funding is needed, work with the AMPA and Policy to determine availability of funds.
Workgroup Technical Members • Provide expertise that helps solve technical problems related to developing new Type Np prescriptions
that meet the objectives articulated in the Charter; • Along with the Hard Rock Study results, become familiar with the other CMER Type N study results
when available; • Attend in person or via conference line/video link all regularly scheduled workgroup meetings; • Participate in organized field trips; • Be prepared for regularly scheduled workgroup meetings and complete assigned tasks within agreed
upon deadlines; • As requested by Workgroup Chair, attend Policy meetings and provide updates to Policy members; • Follow guidelines established by the workgroup Charter; and • Adhere to Workgroup ground rules.

DEPARTMENT OF NATURAL RESOURCES
FOREST PRACTICES DIVISION 1111 WASHINGTON ST SE OLYMPIA, WA 98504
360.902.1400 WWW.DNR.WA.GOV
1 | P a g e
April 17, 2019 TO: Forest Practices Board FROM: Marc Engel, Assistant Division Manager, Policy and Services Forest Practices SUBJECT: Water Typing System Rule and Board Manual Development Update Water Typing Rule Since the Board approval of the potential habitat break (PHB) and anadromous fish floor options for inclusion in the draft water typing system rule in February 2018, staff has convened a series of stakeholder meetings to review the draft rule. DNR convened these meetings from April 2018 through January 2019 with TFW Policy Committee (Policy) representatives. The attached draft rule incorporates the Board approved Policy recommendations and elements for the water typing system rule. DNR is also preparing Board Manual Section 23, Guidelines for Field Protocol to Locate Mapped Divisions between Stream Types and Perennial Stream Identification, to provide the guidance for implementing the new rule. As this may be the first time you have seen the draft rule in its entirety, we have provided context describing the new rule structure. The rule is based on the permanent water typing system rule (WAC 222-16-030) with underline strikeout indicating proposed changes. The five anadromous fish floor options and the three potential habitat break (PHB) options are incorporated for comparison. Staff will make necessary revisions based on Board requests and final decisions regarding the anadromous fish floor and PHB options.
1. WAC 222-12-090 Forest practices board manual. Language referencing Board Manual Section 13 is removed since the newly developed Board Manual Section 23 will contain the guidance for determining the water type break between Type F and N waters.
2. WAC 222-16-031 Interim water typing system.
The interim rule will be repealed with the adoption of a permanent rule. 3. WAC 222-24-040 Water crossing structures for all typed waters.
The language acknowledges that existing water crossing structures in Type N waters will be addressed case by case basis.
2 | P a g e
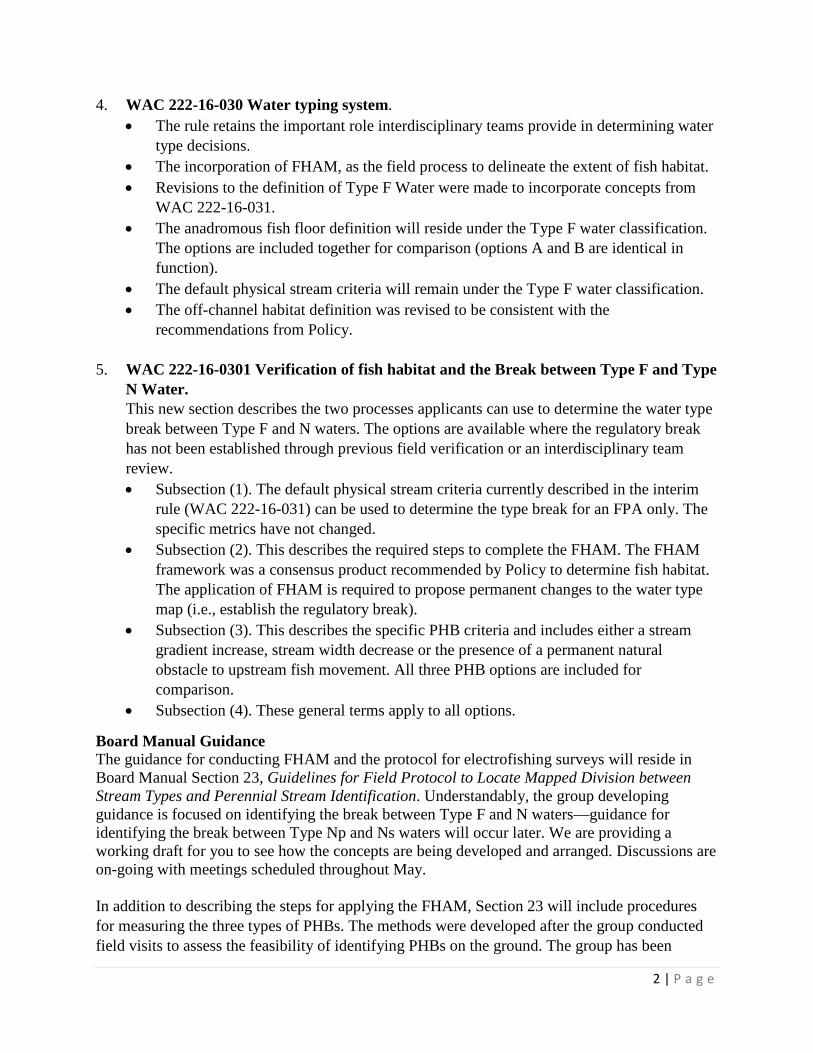
4. WAC 222-16-030 Water typing system. • The rule retains the important role interdisciplinary teams provide in determining water
type decisions. • The incorporation of FHAM, as the field process to delineate the extent of fish habitat. • Revisions to the definition of Type F Water were made to incorporate concepts from
WAC 222-16-031. • The anadromous fish floor definition will reside under the Type F water classification.
The options are included together for comparison (options A and B are identical in function).
• The default physical stream criteria will remain under the Type F water classification. • The off-channel habitat definition was revised to be consistent with the
recommendations from Policy.
5. WAC 222-16-0301 Verification of fish habitat and the Break between Type F and Type N Water. This new section describes the two processes applicants can use to determine the water type break between Type F and N waters. The options are available where the regulatory break has not been established through previous field verification or an interdisciplinary team review. • Subsection (1). The default physical stream criteria currently described in the interim
rule (WAC 222-16-031) can be used to determine the type break for an FPA only. The specific metrics have not changed.
• Subsection (2). This describes the required steps to complete the FHAM. The FHAM framework was a consensus product recommended by Policy to determine fish habitat. The application of FHAM is required to propose permanent changes to the water type map (i.e., establish the regulatory break).
• Subsection (3). This describes the specific PHB criteria and includes either a stream gradient increase, stream width decrease or the presence of a permanent natural obstacle to upstream fish movement. All three PHB options are included for comparison.
• Subsection (4). These general terms apply to all options.
Board Manual Guidance The guidance for conducting FHAM and the protocol for electrofishing surveys will reside in Board Manual Section 23, Guidelines for Field Protocol to Locate Mapped Division between Stream Types and Perennial Stream Identification. Understandably, the group developing guidance is focused on identifying the break between Type F and N waters—guidance for identifying the break between Type Np and Ns waters will occur later. We are providing a working draft for you to see how the concepts are being developed and arranged. Discussions are on-going with meetings scheduled throughout May. In addition to describing the steps for applying the FHAM, Section 23 will include procedures for measuring the three types of PHBs. The methods were developed after the group conducted field visits to assess the feasibility of identifying PHBs on the ground. The group has been
3 | P a g e
focused on incorporating concepts that do not need further direction or clarification. However, some elements cannot be developed until the Board has chosen which anadromous fish floor or which PHB option will be included in the permanent water typing rule.
Section 23 also contains best management practices for conducting a protocol electrofishing survey in conjunction with the FHAM. Relevant guidance from existing Section 13 and recommendations from technical work groups tasked with developing electrofishing considerations provided the framework for developing these guidelines.
The Board accepted Policy’s recommendations for the definition of off-channel habitat. It was agreed that DNR should develop guidance to assist applicants for identifying habitat features based on either bankfull width or ordinary high water line indicators. The language in this version may be more appropriate in another Board Manual section since off-channel habitat is part of Type F Waters.
Final approval of Section 23 will coincide with the adoption of the permanent water typing system rule. Due to the time involved to complete the water typing system rule, no other Board Manual Sections are being worked on at this time.
Should you have any questions please feel free to contact me at 360-902-1390 or [email protected]. ME Attachments

Draft Rule Proposal for a Permanent Water Typing System – 4/22/2019 – Page 1
DRAFT 1 Rule Proposal for a Permanent Water Typing System 2
FOREST PRACTICES BOARD 3 April 2019 4
5 WAC 222-12-090 *Forest practices board manual. 6
. . . 7 (13) Guidelines for determining fish use for the purpose of typing waters under WAC 222-16-8 031Reserved. 9
. . . 10 11 12 REPEAL 13 WAC 222-16-031 Interim water typing system. 14 15
16 WAC 222-24-040 *Water crossing structures for all typed waters. 17 (1) When the water type break between the Type F and Type N Water is adjusted upstream beyond 18
an existing water crossing structure, the structure will not require replacement until the end of 19 the structures functional life when: 20 • The water type change is from an on-site interdisciplinary team or a protocol survey in 21
WAC 222-16-0301(2) and has been approved by the department; 22 • The water crossing structure has been installed under an approved forest practices hydraulic 23
project or a hydraulic project approval by the department of fish and wildlife; and 24 • The structure is functioning with little risk to public resources. 25
(2) Bridges are required for new crossings and reconstructed crossings of any typed waters 26 regularly used for recreational boating. 27
(23) Structures containing concrete must be sufficiently cured prior to contact with water. 28 (34) One end of each new or reconstructed permanent log or wood bridge shall be tied or firmly 29
anchored if any of the bridge structure is within ten vertical feet of the 100-year flood level. 30 (45) Alterations or disturbance of the stream bed, bank or bank vegetation must be limited to that 31
necessary to construct the project. All disturbed areas must be stabilized and restored according 32 to the recommended schedule and procedures found in board manual section 5. This 33 requirement may be modified or waived by the department, in consultation with the department 34 of fish and wildlife, if precluded by engineering or safety factors. 35
(56) When earthen materials are used for bridge surfacing, only clean sorted gravel may be used, a 36 geotextile lining must be installed and curbs of sufficient size shall be installed to a height 37 above the surface material to prevent surface material from falling into the stream bed. 38
(67) Wood removed from the upstream end of culverts and bridges will be placed at the downstream 39 end of such culverts and bridges in such a way as to minimize obstruction of fish passage and 40 to the extent practical, while avoiding significant disturbance of sediment in connection with 41 maintenance activities. 42
(78) Fords. 43 . . . 44
45 46 47 48

Draft Rule Proposal for a Permanent Water Typing System – 4/22/2019 – Page 2
1 222-30-021 *Western Washington riparian management zones 2 . . . 3 *(1)(b)(i)(B) In addition to the conditions set forth above, permitted conversion activities in the inner 4 zone of any harvest unit are limited by the following: 5 • Each continuous conversion area is not more than five hundred feet in length; two conversion 6
areas will be considered "continuous" unless the no-harvest area separating the two conversion 7 areas is at least half the length of the larger of the two conversion areas. 8
• Type S and F (Type 1, 2, or 3) Water: Up to fifty percent of the inner zone area of the harvest unit 9 on one side of the stream may be converted provided that: 10 ♦ The landowner owns the opposite side of the stream and the landowner's riparian area on the 11
opposite bank meets the shade requirements of WAC 222-30-040 or has a seventy-five foot 12 buffer of trees at least forty feet tall or: 13
. . . 14 (2)(b)(v) No timber harvest is permitted within a fifty-six foot radius buffer patch centered on a 15 headwater spring or, in the absence of a headwater spring, on a point at the upper most extent of a 16 Type Np Water as defined in WAC 222-16-030(3) and 222-16-031. 17
18 19 WAC 222-16-030 Water typing system. 20 The forest practices water typing system is constructed to provide a repeatable method of classifying 21 waters within the non-federal, forested areas of the state. The goal of the water typing system is to 22 ensure that riparian buffers are properly placed at each stream, protecting aquatic resources and their 23 respective habitats. It is intended that across the landscape, the water typing system will equally over 24 and under estimate the presence or absence of fish habitat across the landscape. 25 26 Until the fish habitat water type maps described below are adopted by the board, the Interim Water 27 Typing System established in WAC 222-16-031 will continue to be used. The department classifies 28 streams, lakes and ponds in cooperation with the departments of fish and wildlife, and ecology, and in 29 consultation with affected Indian tribes will classify streams, lakes and ponds. To assist forest practices 30 applicants in determining the water type classification, The the department will prepares and updates 31 water type maps showing the location of Type S, F, and N (Np and Ns) Waters within the forested 32 areas of the stateas defined in this section. The maps will be based on a multiparameter, field-verified 33 geographic information system (GIS) logistic regression model. The multiparameter model will be 34 designed to identify fish habitat by using geomorphic parameters such as basin size, gradient, elevation 35 and other indicators. The modeling process shall be designed to achieve a level of statistical accuracy 36 of 95% in separating fish habitat streams and nonfish habitat streams. Furthermore, the demarcation of 37 fish and nonfish habitat waters shall be equally likely to over and under estimate the presence of fish 38 habitat. These maps shall be referred to as "fish habitat water typing maps" and shall, when completed, 39 be available for public inspection at region offices of the department. The location of the water type 40 maps and instructions for use are available on the department’s website. 41 42 Fish habitat water type maps will be updated every five years where necessary to better reflect 43 observed, in-field conditions. Except for these periodic revisions of the maps, on-the-ground 44 observations of fish or habitat characteristics will generally not be used to adjust mapped water types. 45 However, if an on-site interdisciplinary team using nonlethal methods identifies fish, or finds that 46 habitat is not accessible due to naturally occurring conditions and no fish reside above the blockage, 47 then the water type will be immediately changed to reflect the findings of the interdisciplinary team. 48
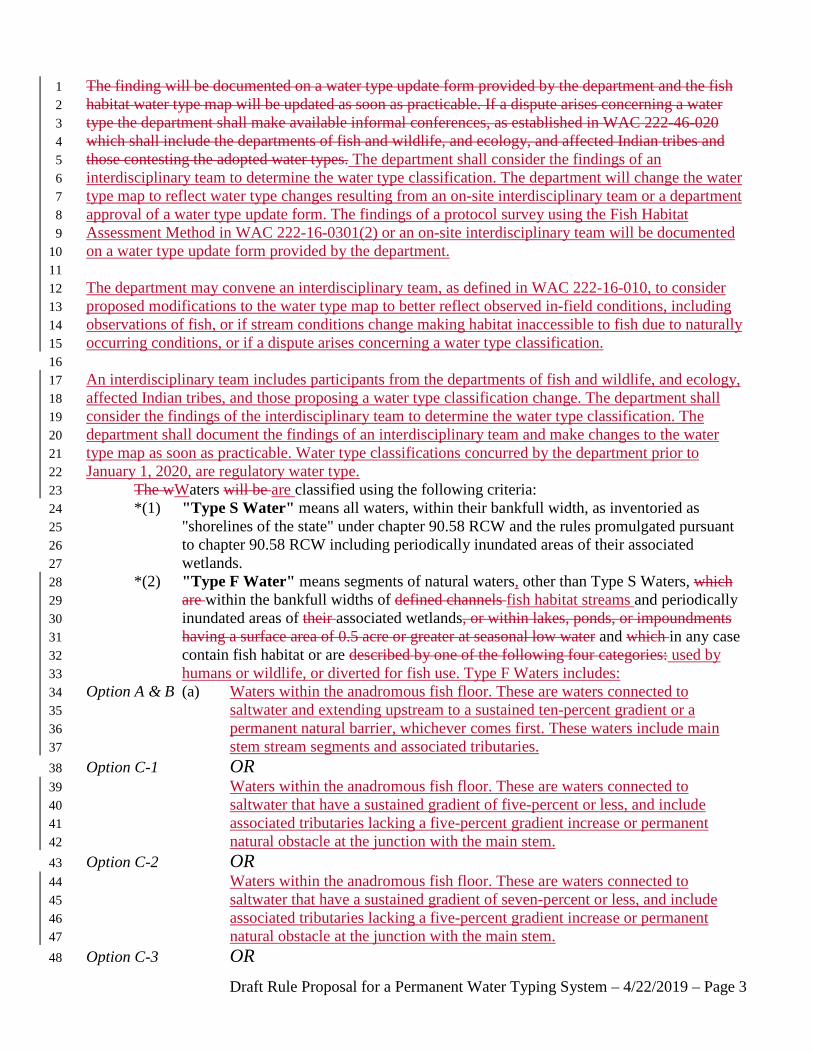
Draft Rule Proposal for a Permanent Water Typing System – 4/22/2019 – Page 3
The finding will be documented on a water type update form provided by the department and the fish 1 habitat water type map will be updated as soon as practicable. If a dispute arises concerning a water 2 type the department shall make available informal conferences, as established in WAC 222-46-020 3 which shall include the departments of fish and wildlife, and ecology, and affected Indian tribes and 4 those contesting the adopted water types. The department shall consider the findings of an 5 interdisciplinary team to determine the water type classification. The department will change the water 6 type map to reflect water type changes resulting from an on-site interdisciplinary team or a department 7 approval of a water type update form. The findings of a protocol survey using the Fish Habitat 8 Assessment Method in WAC 222-16-0301(2) or an on-site interdisciplinary team will be documented 9 on a water type update form provided by the department. 10 11 The department may convene an interdisciplinary team, as defined in WAC 222-16-010, to consider 12 proposed modifications to the water type map to better reflect observed in-field conditions, including 13 observations of fish, or if stream conditions change making habitat inaccessible to fish due to naturally 14 occurring conditions, or if a dispute arises concerning a water type classification. 15 16 An interdisciplinary team includes participants from the departments of fish and wildlife, and ecology, 17 affected Indian tribes, and those proposing a water type classification change. The department shall 18 consider the findings of the interdisciplinary team to determine the water type classification. The 19 department shall document the findings of an interdisciplinary team and make changes to the water 20 type map as soon as practicable. Water type classifications concurred by the department prior to 21 January 1, 2020, are regulatory water type. 22
The wWaters will be are classified using the following criteria: 23 *(1) "Type S Water" means all waters, within their bankfull width, as inventoried as 24
"shorelines of the state" under chapter 90.58 RCW and the rules promulgated pursuant 25 to chapter 90.58 RCW including periodically inundated areas of their associated 26 wetlands. 27
*(2) "Type F Water" means segments of natural waters, other than Type S Waters, which 28 are within the bankfull widths of defined channels fish habitat streams and periodically 29 inundated areas of their associated wetlands, or within lakes, ponds, or impoundments 30 having a surface area of 0.5 acre or greater at seasonal low water and which in any case 31 contain fish habitat or are described by one of the following four categories: used by 32 humans or wildlife, or diverted for fish use. Type F Waters includes: 33
Option A & B (a) Waters within the anadromous fish floor. These are waters connected to 34 saltwater and extending upstream to a sustained ten-percent gradient or a 35 permanent natural barrier, whichever comes first. These waters include main 36 stem stream segments and associated tributaries. 37
Option C-1 OR 38 Waters within the anadromous fish floor. These are waters connected to 39 saltwater that have a sustained gradient of five-percent or less, and include 40 associated tributaries lacking a five-percent gradient increase or permanent 41 natural obstacle at the junction with the main stem. 42
Option C-2 OR 43 Waters within the anadromous fish floor. These are waters connected to 44 saltwater that have a sustained gradient of seven-percent or less, and include 45 associated tributaries lacking a five-percent gradient increase or permanent 46 natural obstacle at the junction with the main stem. 47
Option C-3 OR 48
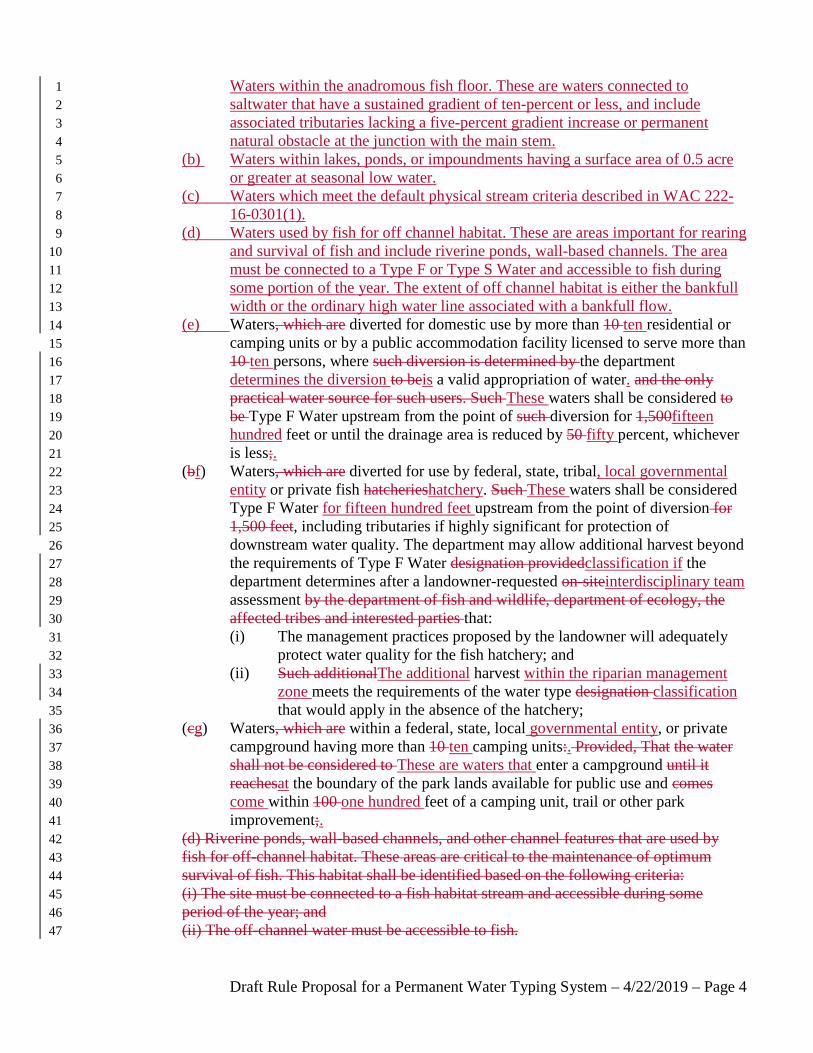
Draft Rule Proposal for a Permanent Water Typing System – 4/22/2019 – Page 4
Waters within the anadromous fish floor. These are waters connected to 1 saltwater that have a sustained gradient of ten-percent or less, and include 2 associated tributaries lacking a five-percent gradient increase or permanent 3 natural obstacle at the junction with the main stem. 4
(b) Waters within lakes, ponds, or impoundments having a surface area of 0.5 acre 5 or greater at seasonal low water. 6
(c) Waters which meet the default physical stream criteria described in WAC 222-7 16-0301(1). 8
(d) Waters used by fish for off channel habitat. These are areas important for rearing 9 and survival of fish and include riverine ponds, wall-based channels. The area 10 must be connected to a Type F or Type S Water and accessible to fish during 11 some portion of the year. The extent of off channel habitat is either the bankfull 12 width or the ordinary high water line associated with a bankfull flow. 13
(e) Waters, which are diverted for domestic use by more than 10 ten residential or 14 camping units or by a public accommodation facility licensed to serve more than 15 10 ten persons, where such diversion is determined by the department 16 determines the diversion to beis a valid appropriation of water. and the only 17 practical water source for such users. Such These waters shall be considered to 18 be Type F Water upstream from the point of such diversion for 1,500fifteen 19 hundred feet or until the drainage area is reduced by 50 fifty percent, whichever 20 is less;. 21
(bf) Waters, which are diverted for use by federal, state, tribal, local governmental 22 entity or private fish hatcherieshatchery. Such These waters shall be considered 23 Type F Water for fifteen hundred feet upstream from the point of diversion for 24 1,500 feet, including tributaries if highly significant for protection of 25 downstream water quality. The department may allow additional harvest beyond 26 the requirements of Type F Water designation providedclassification if the 27 department determines after a landowner-requested on-siteinterdisciplinary team 28 assessment by the department of fish and wildlife, department of ecology, the 29 affected tribes and interested parties that: 30 (i) The management practices proposed by the landowner will adequately 31
protect water quality for the fish hatchery; and 32 (ii) Such additionalThe additional harvest within the riparian management 33
zone meets the requirements of the water type designation classification 34 that would apply in the absence of the hatchery; 35
(cg) Waters, which are within a federal, state, local governmental entity, or private 36 campground having more than 10 ten camping units:. Provided, That the water 37 shall not be considered to These are waters that enter a campground until it 38 reachesat the boundary of the park lands available for public use and comes 39 come within 100 one hundred feet of a camping unit, trail or other park 40 improvement;. 41
(d) Riverine ponds, wall-based channels, and other channel features that are used by 42 fish for off-channel habitat. These areas are critical to the maintenance of optimum 43 survival of fish. This habitat shall be identified based on the following criteria: 44 (i) The site must be connected to a fish habitat stream and accessible during some 45 period of the year; and 46 (ii) The off-channel water must be accessible to fish. 47
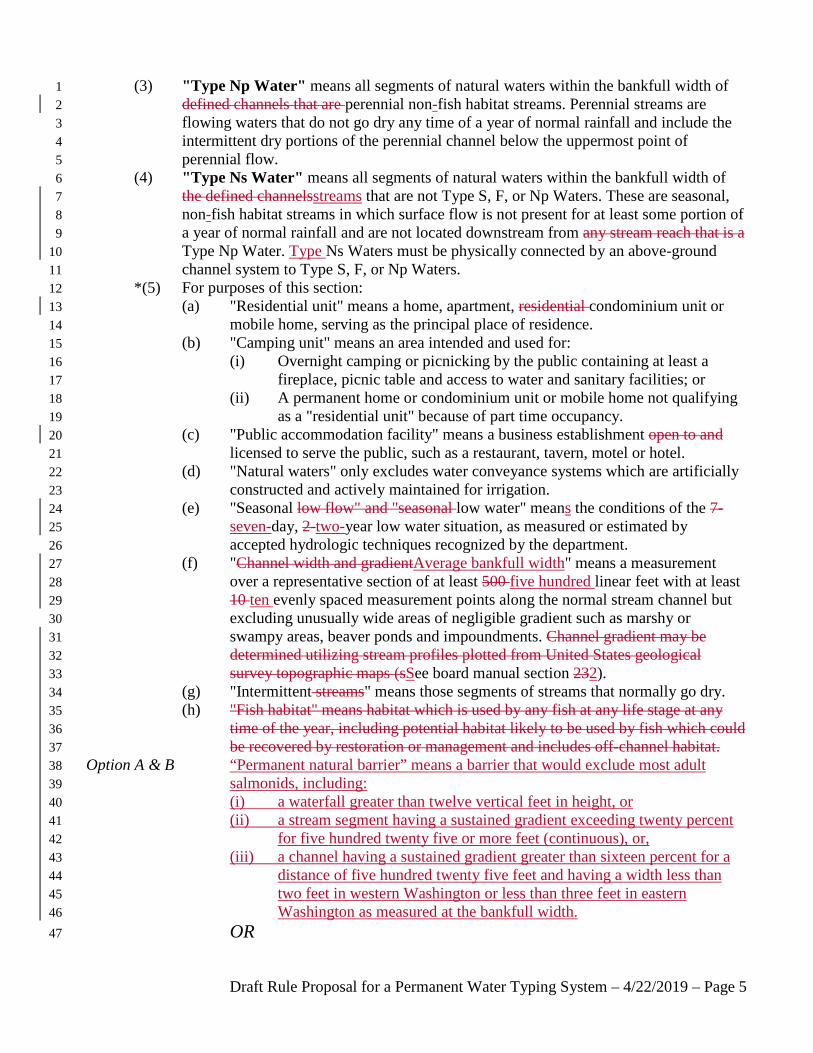
Draft Rule Proposal for a Permanent Water Typing System – 4/22/2019 – Page 5
(3) "Type Np Water" means all segments of natural waters within the bankfull width of 1 defined channels that are perennial non-fish habitat streams. Perennial streams are 2 flowing waters that do not go dry any time of a year of normal rainfall and include the 3 intermittent dry portions of the perennial channel below the uppermost point of 4 perennial flow. 5
(4) "Type Ns Water" means all segments of natural waters within the bankfull width of 6 the defined channelsstreams that are not Type S, F, or Np Waters. These are seasonal, 7 non-fish habitat streams in which surface flow is not present for at least some portion of 8 a year of normal rainfall and are not located downstream from any stream reach that is a 9 Type Np Water. Type Ns Waters must be physically connected by an above-ground 10 channel system to Type S, F, or Np Waters. 11
*(5) For purposes of this section: 12 (a) "Residential unit" means a home, apartment, residential condominium unit or 13
mobile home, serving as the principal place of residence. 14 (b) "Camping unit" means an area intended and used for: 15
(i) Overnight camping or picnicking by the public containing at least a 16 fireplace, picnic table and access to water and sanitary facilities; or 17
(ii) A permanent home or condominium unit or mobile home not qualifying 18 as a "residential unit" because of part time occupancy. 19
(c) "Public accommodation facility" means a business establishment open to and 20 licensed to serve the public, such as a restaurant, tavern, motel or hotel. 21
(d) "Natural waters" only excludes water conveyance systems which are artificially 22 constructed and actively maintained for irrigation. 23
(e) "Seasonal low flow" and "seasonal low water" means the conditions of the 7-24 seven-day, 2-two-year low water situation, as measured or estimated by 25 accepted hydrologic techniques recognized by the department. 26
(f) "Channel width and gradientAverage bankfull width" means a measurement 27 over a representative section of at least 500 five hundred linear feet with at least 28 10 ten evenly spaced measurement points along the normal stream channel but 29 excluding unusually wide areas of negligible gradient such as marshy or 30 swampy areas, beaver ponds and impoundments. Channel gradient may be 31 determined utilizing stream profiles plotted from United States geological 32 survey topographic maps (sSee board manual section 232). 33
(g) "Intermittent streams" means those segments of streams that normally go dry. 34 (h) "Fish habitat" means habitat which is used by any fish at any life stage at any 35
time of the year, including potential habitat likely to be used by fish which could 36 be recovered by restoration or management and includes off-channel habitat. 37
Option A & B “Permanent natural barrier” means a barrier that would exclude most adult 38 salmonids, including: 39 (i) a waterfall greater than twelve vertical feet in height, or 40 (ii) a stream segment having a sustained gradient exceeding twenty percent 41
for five hundred twenty five or more feet (continuous), or, 42 (iii) a channel having a sustained gradient greater than sixteen percent for a 43
distance of five hundred twenty five feet and having a width less than 44 two feet in western Washington or less than three feet in eastern 45 Washington as measured at the bankfull width. 46
OR 47
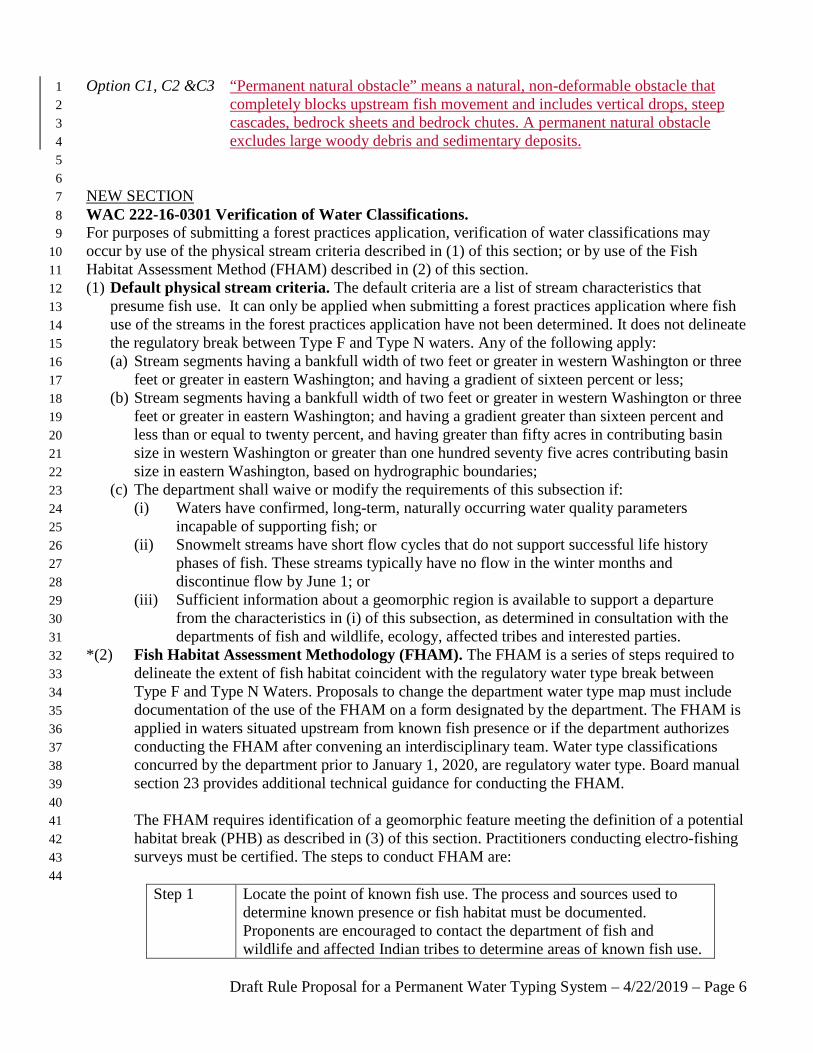
Draft Rule Proposal for a Permanent Water Typing System – 4/22/2019 – Page 6
Option C1, C2 &C3 “Permanent natural obstacle” means a natural, non-deformable obstacle that 1 completely blocks upstream fish movement and includes vertical drops, steep 2 cascades, bedrock sheets and bedrock chutes. A permanent natural obstacle 3 excludes large woody debris and sedimentary deposits. 4
5 6 NEW SECTION 7 WAC 222-16-0301 Verification of Water Classifications. 8 For purposes of submitting a forest practices application, verification of water classifications may 9 occur by use of the physical stream criteria described in (1) of this section; or by use of the Fish 10 Habitat Assessment Method (FHAM) described in (2) of this section. 11 (1) Default physical stream criteria. The default criteria are a list of stream characteristics that 12
presume fish use. It can only be applied when submitting a forest practices application where fish 13 use of the streams in the forest practices application have not been determined. It does not delineate 14 the regulatory break between Type F and Type N waters. Any of the following apply: 15 (a) Stream segments having a bankfull width of two feet or greater in western Washington or three 16
feet or greater in eastern Washington; and having a gradient of sixteen percent or less; 17 (b) Stream segments having a bankfull width of two feet or greater in western Washington or three 18
feet or greater in eastern Washington; and having a gradient greater than sixteen percent and 19 less than or equal to twenty percent, and having greater than fifty acres in contributing basin 20 size in western Washington or greater than one hundred seventy five acres contributing basin 21 size in eastern Washington, based on hydrographic boundaries; 22
(c) The department shall waive or modify the requirements of this subsection if: 23 (i) Waters have confirmed, long-term, naturally occurring water quality parameters 24
incapable of supporting fish; or 25 (ii) Snowmelt streams have short flow cycles that do not support successful life history 26
phases of fish. These streams typically have no flow in the winter months and 27 discontinue flow by June 1; or 28
(iii) Sufficient information about a geomorphic region is available to support a departure 29 from the characteristics in (i) of this subsection, as determined in consultation with the 30 departments of fish and wildlife, ecology, affected tribes and interested parties. 31
*(2) Fish Habitat Assessment Methodology (FHAM). The FHAM is a series of steps required to 32 delineate the extent of fish habitat coincident with the regulatory water type break between 33 Type F and Type N Waters. Proposals to change the department water type map must include 34 documentation of the use of the FHAM on a form designated by the department. The FHAM is 35 applied in waters situated upstream from known fish presence or if the department authorizes 36 conducting the FHAM after convening an interdisciplinary team. Water type classifications 37 concurred by the department prior to January 1, 2020, are regulatory water type. Board manual 38 section 23 provides additional technical guidance for conducting the FHAM. 39
40 The FHAM requires identification of a geomorphic feature meeting the definition of a potential 41 habitat break (PHB) as described in (3) of this section. Practitioners conducting electro-fishing 42 surveys must be certified. The steps to conduct FHAM are: 43
44 Step 1 Locate the point of known fish use. The process and sources used to
determine known presence or fish habitat must be documented. Proponents are encouraged to contact the department of fish and wildlife and affected Indian tribes to determine areas of known fish use.
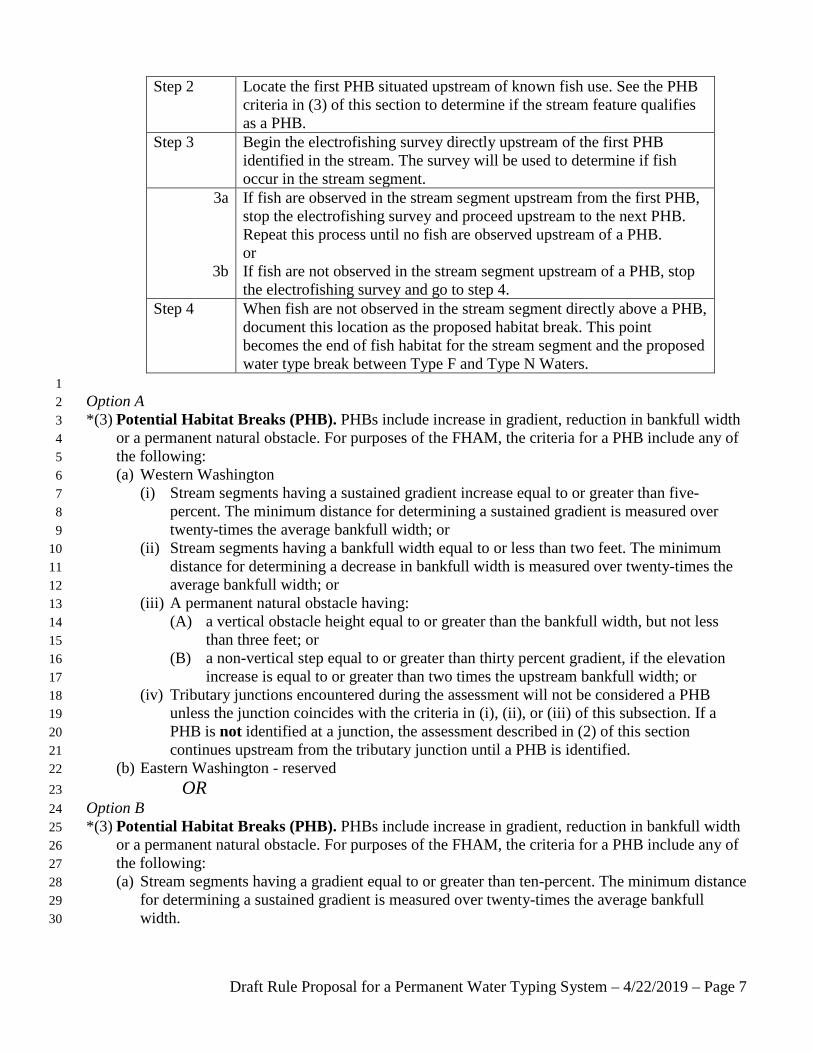
Draft Rule Proposal for a Permanent Water Typing System – 4/22/2019 – Page 7
Step 2 Locate the first PHB situated upstream of known fish use. See the PHB criteria in (3) of this section to determine if the stream feature qualifies as a PHB.
Step 3 Begin the electrofishing survey directly upstream of the first PHB identified in the stream. The survey will be used to determine if fish occur in the stream segment.
3a
3b
If fish are observed in the stream segment upstream from the first PHB, stop the electrofishing survey and proceed upstream to the next PHB. Repeat this process until no fish are observed upstream of a PHB. or If fish are not observed in the stream segment upstream of a PHB, stop the electrofishing survey and go to step 4.
Step 4 When fish are not observed in the stream segment directly above a PHB, document this location as the proposed habitat break. This point becomes the end of fish habitat for the stream segment and the proposed water type break between Type F and Type N Waters.
1 Option A 2 *(3) Potential Habitat Breaks (PHB). PHBs include increase in gradient, reduction in bankfull width 3
or a permanent natural obstacle. For purposes of the FHAM, the criteria for a PHB include any of 4 the following: 5 (a) Western Washington 6
(i) Stream segments having a sustained gradient increase equal to or greater than five-7 percent. The minimum distance for determining a sustained gradient is measured over 8 twenty-times the average bankfull width; or 9
(ii) Stream segments having a bankfull width equal to or less than two feet. The minimum 10 distance for determining a decrease in bankfull width is measured over twenty-times the 11 average bankfull width; or 12
(iii) A permanent natural obstacle having: 13 (A) a vertical obstacle height equal to or greater than the bankfull width, but not less 14
than three feet; or 15 (B) a non-vertical step equal to or greater than thirty percent gradient, if the elevation 16
increase is equal to or greater than two times the upstream bankfull width; or 17 (iv) Tributary junctions encountered during the assessment will not be considered a PHB 18
unless the junction coincides with the criteria in (i), (ii), or (iii) of this subsection. If a 19 PHB is not identified at a junction, the assessment described in (2) of this section 20 continues upstream from the tributary junction until a PHB is identified. 21
(b) Eastern Washington - reserved 22 OR 23
Option B 24 *(3) Potential Habitat Breaks (PHB). PHBs include increase in gradient, reduction in bankfull width 25
or a permanent natural obstacle. For purposes of the FHAM, the criteria for a PHB include any of 26 the following: 27 (a) Stream segments having a gradient equal to or greater than ten-percent. The minimum distance 28
for determining a sustained gradient is measured over twenty-times the average bankfull 29 width. 30
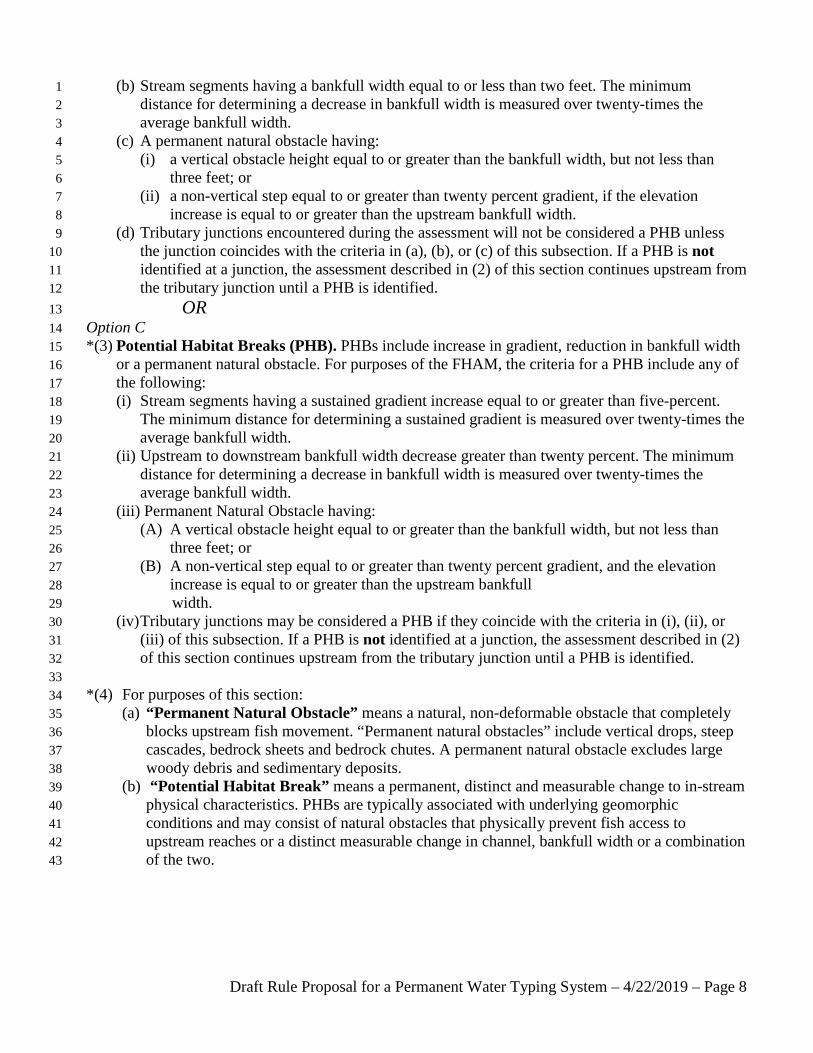
Draft Rule Proposal for a Permanent Water Typing System – 4/22/2019 – Page 8
(b) Stream segments having a bankfull width equal to or less than two feet. The minimum 1 distance for determining a decrease in bankfull width is measured over twenty-times the 2 average bankfull width. 3
(c) A permanent natural obstacle having: 4 (i) a vertical obstacle height equal to or greater than the bankfull width, but not less than 5
three feet; or 6 (ii) a non-vertical step equal to or greater than twenty percent gradient, if the elevation 7
increase is equal to or greater than the upstream bankfull width. 8 (d) Tributary junctions encountered during the assessment will not be considered a PHB unless 9
the junction coincides with the criteria in (a), (b), or (c) of this subsection. If a PHB is not 10 identified at a junction, the assessment described in (2) of this section continues upstream from 11 the tributary junction until a PHB is identified. 12
OR 13 Option C 14 *(3) Potential Habitat Breaks (PHB). PHBs include increase in gradient, reduction in bankfull width 15
or a permanent natural obstacle. For purposes of the FHAM, the criteria for a PHB include any of 16 the following: 17 (i) Stream segments having a sustained gradient increase equal to or greater than five-percent. 18
The minimum distance for determining a sustained gradient is measured over twenty-times the 19 average bankfull width. 20
(ii) Upstream to downstream bankfull width decrease greater than twenty percent. The minimum 21 distance for determining a decrease in bankfull width is measured over twenty-times the 22 average bankfull width. 23
(iii) Permanent Natural Obstacle having: 24 (A) A vertical obstacle height equal to or greater than the bankfull width, but not less than 25
three feet; or 26 (B) A non-vertical step equal to or greater than twenty percent gradient, and the elevation 27
increase is equal to or greater than the upstream bankfull 28 width. 29
(iv) Tributary junctions may be considered a PHB if they coincide with the criteria in (i), (ii), or 30 (iii) of this subsection. If a PHB is not identified at a junction, the assessment described in (2) 31 of this section continues upstream from the tributary junction until a PHB is identified. 32 33
*(4) For purposes of this section: 34 (a) “Permanent Natural Obstacle” means a natural, non-deformable obstacle that completely 35
blocks upstream fish movement. “Permanent natural obstacles” include vertical drops, steep 36 cascades, bedrock sheets and bedrock chutes. A permanent natural obstacle excludes large 37 woody debris and sedimentary deposits. 38
(b) “Potential Habitat Break” means a permanent, distinct and measurable change to in-stream 39 physical characteristics. PHBs are typically associated with underlying geomorphic 40 conditions and may consist of natural obstacles that physically prevent fish access to 41 upstream reaches or a distinct measurable change in channel, bankfull width or a combination 42 of the two. 43
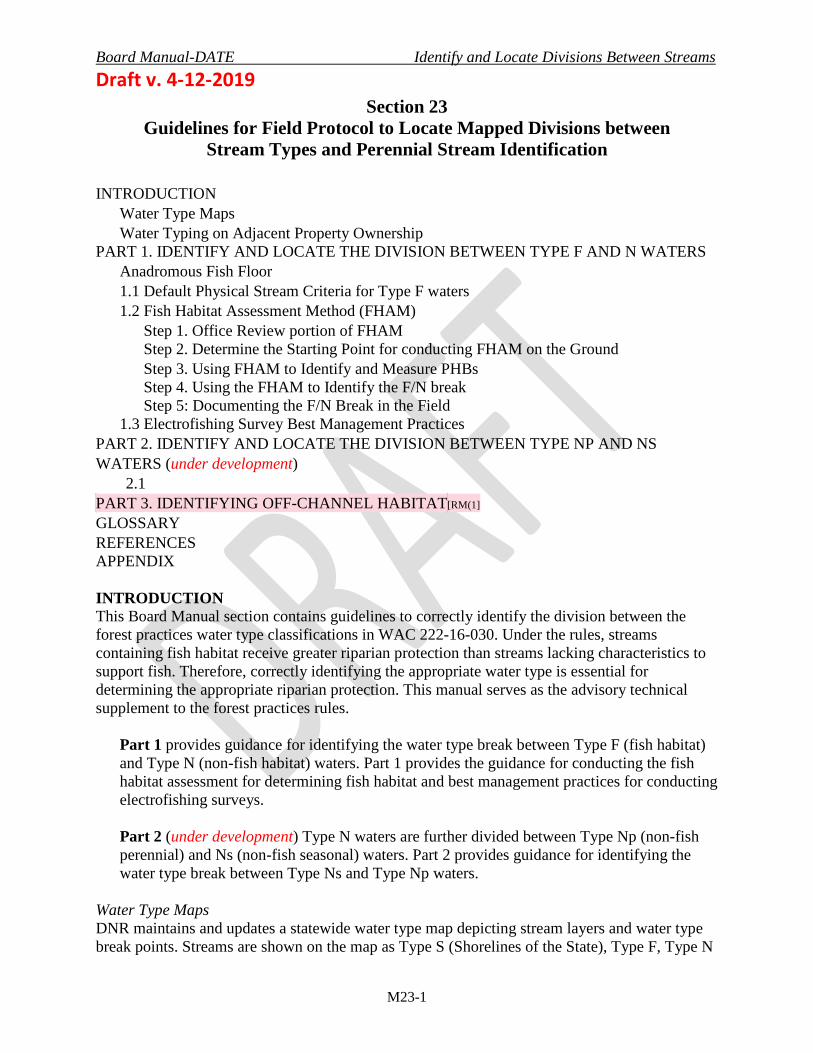
Board Manual-DATE Identify and Locate Divisions Between Streams Draft v. 4-12-2019
M23-1
Section 23 Guidelines for Field Protocol to Locate Mapped Divisions between
Stream Types and Perennial Stream Identification
INTRODUCTION Water Type Maps Water Typing on Adjacent Property Ownership
PART 1. IDENTIFY AND LOCATE THE DIVISION BETWEEN TYPE F AND N WATERS Anadromous Fish Floor
1.1 Default Physical Stream Criteria for Type F waters 1.2 Fish Habitat Assessment Method (FHAM)
Step 1. Office Review portion of FHAM Step 2. Determine the Starting Point for conducting FHAM on the Ground Step 3. Using FHAM to Identify and Measure PHBs Step 4. Using the FHAM to Identify the F/N break Step 5: Documenting the F/N Break in the Field
1.3 Electrofishing Survey Best Management Practices PART 2. IDENTIFY AND LOCATE THE DIVISION BETWEEN TYPE NP AND NS WATERS (under development) 2.1 PART 3. IDENTIFYING OFF-CHANNEL HABITAT[RM(1] GLOSSARY REFERENCES APPENDIX INTRODUCTION This Board Manual section contains guidelines to correctly identify the division between the forest practices water type classifications in WAC 222-16-030. Under the rules, streams containing fish habitat receive greater riparian protection than streams lacking characteristics to support fish. Therefore, correctly identifying the appropriate water type is essential for determining the appropriate riparian protection. This manual serves as the advisory technical supplement to the forest practices rules.
Part 1 provides guidance for identifying the water type break between Type F (fish habitat) and Type N (non-fish habitat) waters. Part 1 provides the guidance for conducting the fish habitat assessment for determining fish habitat and best management practices for conducting electrofishing surveys. Part 2 (under development) Type N waters are further divided between Type Np (non-fish perennial) and Ns (non-fish seasonal) waters. Part 2 provides guidance for identifying the water type break between Type Ns and Type Np waters.
Water Type Maps DNR maintains and updates a statewide water type map depicting stream layers and water type break points. Streams are shown on the map as Type S (Shorelines of the State), Type F, Type N
Board Manual-DATE Identify and Locate Divisions Between Streams Draft v. 4-12-2019
M23-2
or Type U (unknown), with asterisks (*) indicating the point of change from one type to another. The points on the map are derived from a GIS-based model or were digitized onto the map after a DNR concurred review. The map provides as a starting point to help identify streams types and locations. The Forest Practices Activity Mapping Tool and the instructions for finding the area of interest can be accessed on the Forest Practices Application Review System website: https://www.dnr.wa.gov/programs-and-services/forest-practices/forest-practices-application-review-system-fpars Landowners are required to verify whether the stream location and the associated water type break depicted on the water type map is correct prior to conducting forest practices activities. In most cases, no additional assessment is necessary for streams where a previous field survey or an interdisciplinary team (ID team) has determined the appropriate water type. Part 1 provides information regarding how to view which streams are ‘regulatory’ points, as well as access information about previously field-verified streams. The Water Type Classification Worksheet in the FPA instructions is a useful tool for determining stream types. Proposed changes to the water type map require submitting a Water Type Modification Form and are subject to a review process involving Department of Natural Resources (DNR), Department of Fish and Wildlife (WDFW) and Ecology, as well as affected tribes and other interested parties. All applicable forms and instructions can be found at: https://www.dnr.wa.gov/programs-and-services/forest-practices/review-applications-fpars/forest-practices-forms-and Landowners are encouraged to contact DNR regional forest practices staff, WDFW and tribal biologists who may have local knowledge and expertise before starting the assessment to determine water type breaks. DNR Small Forest Landowner Office is also available to provide technical assistance for water typing or assist with habitat evaluations. Water Typing on Adjacent Property Ownership. Water typing may occur when a stream flows across adjoining property lines, preventing access to evaluate the stream’s full reach. However, every reasonable effort should be made to gain access to the entire stream reach. If access cannot be attained in order to perform a thorough fish habitat stream assessment, it may not be possible to establish the permanent F/N break. In these situations, the applicable water type may be determined for the purpose of FPA approval by applying the default physical stream criteria (WAC 222-16-030) or through an ID team meeting. PART 1. IDENTIFY AND LOCATE THE DIVISION BETWEEN TYPE F AND N WATERS Anadromous Fish Floor [RM(2] (to be developed when the Board decides on the AFF metrics)
• Describe purpose • Describe procedure • Provide criteria
Delineating the water type break between Type F and Type N waters (F/N break) can be accomplished in the following ways:
Board Manual-DATE Identify and Locate Divisions Between Streams Draft v. 4-12-2019
M23-3
• Apply the default physical stream criteria (WAC 222-16-030) for the purposes of submitting an FPA. Permanent changes to the water type map will not be made using the default physical stream criteria, but can be applied for a single FPA.
• Apply the fish habitat assessment methodology (FHAM) to establish the upstream extent of fish habitat that serves as the proposed F/N break. The assessment is used for proposing permanent changes to the water type map. If the proposed water type update is concurred by DNR, these points become the ‘regulatory’ water type break’[RM(3]
• Interdisciplinary teams can be used to provide expertise to determine fish habitat or establish plans for conducting surveys in unique situations. The results of an ID team can be used to make permanent changes to the water type map.
Part 1.1 Default Physical Stream Criteria The default physical stream criteria described in WAC 222-16-030 are used to identify stream width and gradient characteristics presumed to contain fish habitat. The rules differ slightly depending on which side of the Washington Cascade Mountain crest the activity is planned. Streams with the following characteristics are presumed fish habitat and are classified as Type F waters: Western Washington
• stream segments having a bankfull width of 2 feet or greater and having a gradient of 16% of less; or
• stream segments having a bankfull width of 2 feet or greater and having a gradient greater than 16% and less than or equal to 20%, and having greater than 50 acres in contributing basin size based on hydrographic boundaries.
Eastern Washington
• stream segments having a bankfull width of 3 feet or greater and having a gradient of 16 % or less; or
• stream segments having a bankfull width of 3 feet or greater and having a gradient greater than 16% and less than or equal to 20%, and having greater than 175 acres contributing basin size based on hydrographic boundaries.
Part 1.2 Fish Habitat Assessment Methodology The fish habitat assessment method (FHAM) is a process used to assess the stream channel to determine the upstream extent of fish habitat for a given stream segment. In rule, fish habitat means ‘those areas used by fish at any life stage at any time of the year including potential habitat likely to be used by fish, which could be recovered by restoration or management and includes off-channel habitat’ (WAC 222-16-010). The FHAM guides stream surveyors in using potential habitat breaks (PHBs) in conjunction with protocol electrofishing survey in areas above known fish or documented fish presence for determining the regulatory F/N break. Potential habitat breaks (PHB) are defined as:
A permanent, distinct and measurable change to in-stream physical characteristics. PHBs are typically associated with underlying geomorphic conditions and may consist of
• natural obstacle (i.e., steep bedrock chute, vertical waterfall) that physically prevent fish access to upstream reaches, or
Board Manual-DATE Identify and Locate Divisions Between Streams Draft v. 4-12-2019
M23-4
• a distinct and measurable change in channel gradient, bankfull width, or a combination of the two.
Step 1. Office Review portion of FHAM[RM(4] Pre-survey planning ensures the assessment is based on the best data and information available and helps identify potential fish locations for determining the appropriate starting point for the field assessment. Surveyors may request information from DNR, WDFW, and/or tribal biologists on known fish barriers, known fish distributions, preferred survey timing or to review documentation expectations.
• WDFW and tribal fisheries databases provide information and GIS products on fish populations (see Appendix A for a list of resources)
• Fish passage barrier information (see Appendix B for a list of resources) • Programmatic reviews with agency staff or tribal biologists prior to conducting protocol
surveys are helpful to address a variety of situations encountered in the field. Begin by determining if the stream in question is identified on the water type map. Streams and water type breaks are represented in two ways:
• Streams depicted by a GIS-based model. These modeled streams are a “best approximation” and must be field verified. In some cases, streams are shown in the wrong location or depicted in an area where streams do not exist. Some streams may not be depicted on the map at all.
• Streams digitized by DNR. These streams have been field-verified or received concurrence by a review process. These points are considered the regulatory water type break.
Once a water type modification has been concurred by DNR, the stream and water type is digitized onto the map and assigned a unique identifier (i.e., PC 27-YY-0276, NE-59-14-0074). This identifier refers to the Water Type Modification Form (WTMF) information and the data corresponding to the survey. Streams previously field-verified and represented by an identifier are the regulatory F/N break and no further assessment is necessary (see Step[WJ5] 4). In situations where fish are observed upstream from a previously established F/N break, the stream type will be corrected to reflect new information. The instructions for viewing and downloading Adobe PDF versions of WTMF information can be accessed at: [CM6]http://file.dnr.wa.gov/publications/fp_form_fpars_wt_data_dic.pdf
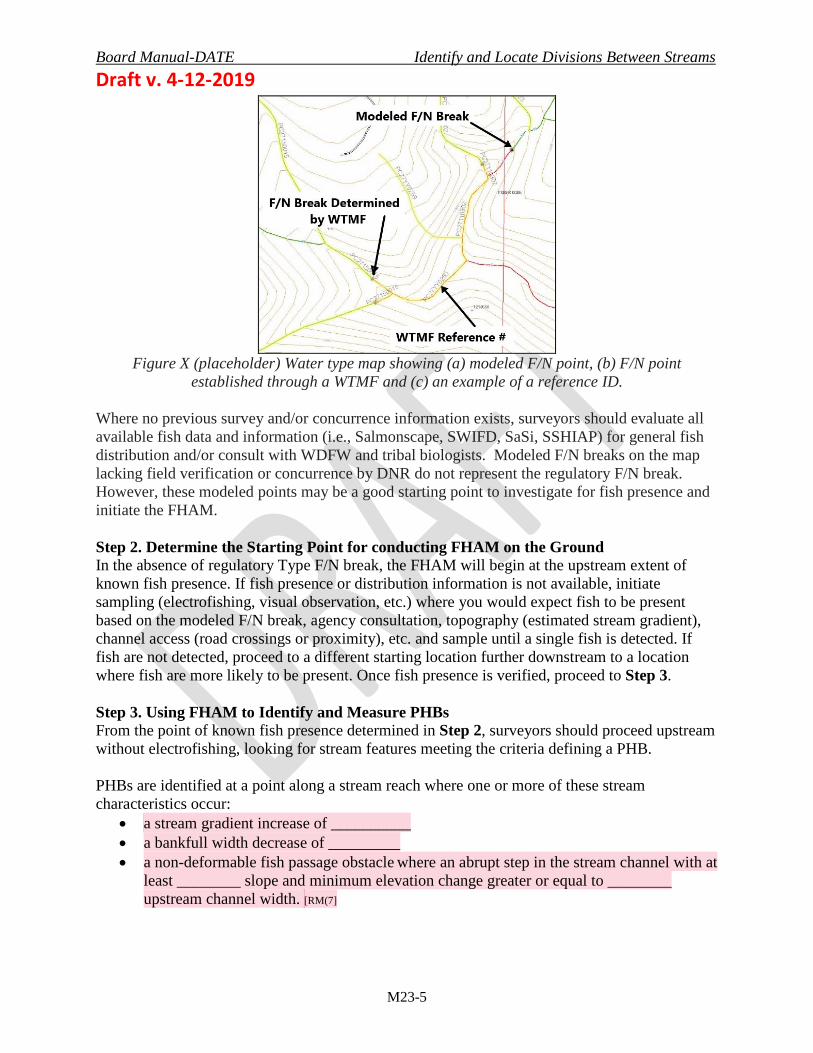
Board Manual-DATE Identify and Locate Divisions Between Streams Draft v. 4-12-2019
M23-5
Figure X (placeholder) Water type map showing (a) modeled F/N point, (b) F/N point
established through a WTMF and (c) an example of a reference ID. Where no previous survey and/or concurrence information exists, surveyors should evaluate all available fish data and information (i.e., Salmonscape, SWIFD, SaSi, SSHIAP) for general fish distribution and/or consult with WDFW and tribal biologists. Modeled F/N breaks on the map lacking field verification or concurrence by DNR do not represent the regulatory F/N break. However, these modeled points may be a good starting point to investigate for fish presence and initiate the FHAM. Step 2. Determine the Starting Point for conducting FHAM on the Ground In the absence of regulatory Type F/N break, the FHAM will begin at the upstream extent of known fish presence. If fish presence or distribution information is not available, initiate sampling (electrofishing, visual observation, etc.) where you would expect fish to be present based on the modeled F/N break, agency consultation, topography (estimated stream gradient), channel access (road crossings or proximity), etc. and sample until a single fish is detected. If fish are not detected, proceed to a different starting location further downstream to a location where fish are more likely to be present. Once fish presence is verified, proceed to Step 3. Step 3. Using FHAM to Identify and Measure PHBs From the point of known fish presence determined in Step 2, surveyors should proceed upstream without electrofishing, looking for stream features meeting the criteria defining a PHB. PHBs are identified at a point along a stream reach where one or more of these stream characteristics occur:
• a stream gradient increase of __________ • a bankfull width decrease of _________ • a non-deformable fish passage obstacle where an abrupt step in the stream channel with at
least ________ slope and minimum elevation change greater or equal to ________ upstream channel width. [RM(7]
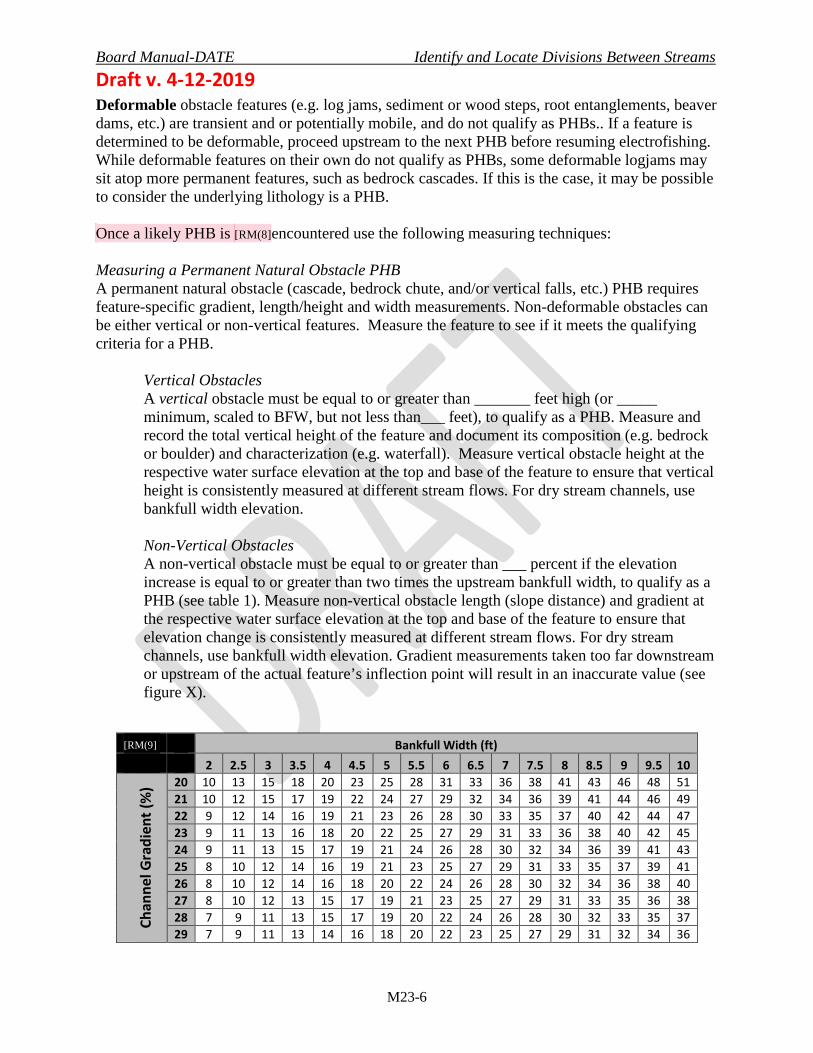
Board Manual-DATE Identify and Locate Divisions Between Streams Draft v. 4-12-2019
M23-6
Deformable obstacle features (e.g. log jams, sediment or wood steps, root entanglements, beaver dams, etc.) are transient and or potentially mobile, and do not qualify as PHBs.. If a feature is determined to be deformable, proceed upstream to the next PHB before resuming electrofishing. While deformable features on their own do not qualify as PHBs, some deformable logjams may sit atop more permanent features, such as bedrock cascades. If this is the case, it may be possible to consider the underlying lithology is a PHB. Once a likely PHB is [RM(8]encountered use the following measuring techniques: Measuring a Permanent Natural Obstacle PHB A permanent natural obstacle (cascade, bedrock chute, and/or vertical falls, etc.) PHB requires feature-specific gradient, length/height and width measurements. Non-deformable obstacles can be either vertical or non-vertical features. Measure the feature to see if it meets the qualifying criteria for a PHB.
Vertical Obstacles A vertical obstacle must be equal to or greater than _______ feet high (or _____ minimum, scaled to BFW, but not less than___ feet), to qualify as a PHB. Measure and record the total vertical height of the feature and document its composition (e.g. bedrock or boulder) and characterization (e.g. waterfall). Measure vertical obstacle height at the respective water surface elevation at the top and base of the feature to ensure that vertical height is consistently measured at different stream flows. For dry stream channels, use bankfull width elevation. Non-Vertical Obstacles A non-vertical obstacle must be equal to or greater than ___ percent if the elevation increase is equal to or greater than two times the upstream bankfull width, to qualify as a PHB (see table 1). Measure non-vertical obstacle length (slope distance) and gradient at the respective water surface elevation at the top and base of the feature to ensure that elevation change is consistently measured at different stream flows. For dry stream channels, use bankfull width elevation. Gradient measurements taken too far downstream or upstream of the actual feature’s inflection point will result in an inaccurate value (see figure X).
[RM(9] Bankfull Width (ft)
2 2.5 3 3.5 4 4.5 5 5.5 6 6.5 7 7.5 8 8.5 9 9.5 10
Chan
nel G
radi
ent (
%) 20 10 13 15 18 20 23 25 28 31 33 36 38 41 43 46 48 51
21 10 12 15 17 19 22 24 27 29 32 34 36 39 41 44 46 49 22 9 12 14 16 19 21 23 26 28 30 33 35 37 40 42 44 47 23 9 11 13 16 18 20 22 25 27 29 31 33 36 38 40 42 45 24 9 11 13 15 17 19 21 24 26 28 30 32 34 36 39 41 43 25 8 10 12 14 16 19 21 23 25 27 29 31 33 35 37 39 41 26 8 10 12 14 16 18 20 22 24 26 28 30 32 34 36 38 40 27 8 10 12 13 15 17 19 21 23 25 27 29 31 33 35 36 38 28 7 9 11 13 15 17 19 20 22 24 26 28 30 32 33 35 37 29 7 9 11 13 14 16 18 20 22 23 25 27 29 31 32 34 36
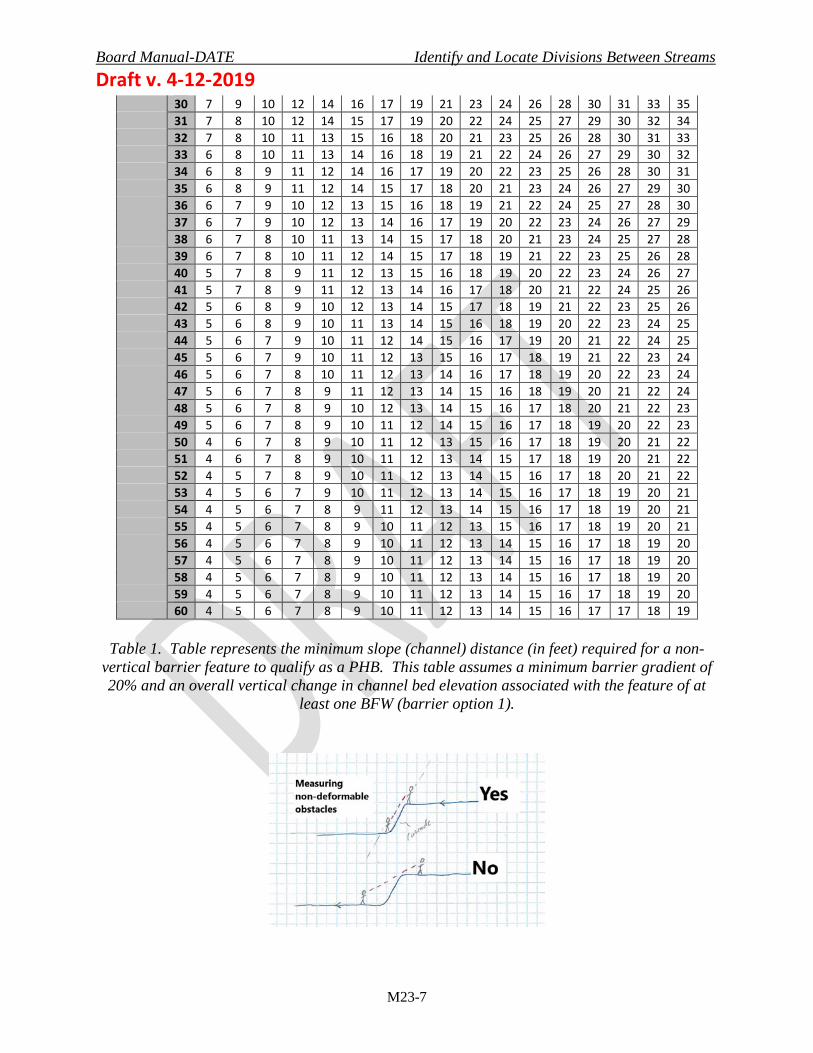
Board Manual-DATE Identify and Locate Divisions Between Streams Draft v. 4-12-2019
M23-7
30 7 9 10 12 14 16 17 19 21 23 24 26 28 30 31 33 35 31 7 8 10 12 14 15 17 19 20 22 24 25 27 29 30 32 34 32 7 8 10 11 13 15 16 18 20 21 23 25 26 28 30 31 33 33 6 8 10 11 13 14 16 18 19 21 22 24 26 27 29 30 32 34 6 8 9 11 12 14 16 17 19 20 22 23 25 26 28 30 31 35 6 8 9 11 12 14 15 17 18 20 21 23 24 26 27 29 30 36 6 7 9 10 12 13 15 16 18 19 21 22 24 25 27 28 30 37 6 7 9 10 12 13 14 16 17 19 20 22 23 24 26 27 29 38 6 7 8 10 11 13 14 15 17 18 20 21 23 24 25 27 28 39 6 7 8 10 11 12 14 15 17 18 19 21 22 23 25 26 28 40 5 7 8 9 11 12 13 15 16 18 19 20 22 23 24 26 27 41 5 7 8 9 11 12 13 14 16 17 18 20 21 22 24 25 26 42 5 6 8 9 10 12 13 14 15 17 18 19 21 22 23 25 26 43 5 6 8 9 10 11 13 14 15 16 18 19 20 22 23 24 25 44 5 6 7 9 10 11 12 14 15 16 17 19 20 21 22 24 25 45 5 6 7 9 10 11 12 13 15 16 17 18 19 21 22 23 24 46 5 6 7 8 10 11 12 13 14 16 17 18 19 20 22 23 24 47 5 6 7 8 9 11 12 13 14 15 16 18 19 20 21 22 24 48 5 6 7 8 9 10 12 13 14 15 16 17 18 20 21 22 23 49 5 6 7 8 9 10 11 12 14 15 16 17 18 19 20 22 23 50 4 6 7 8 9 10 11 12 13 15 16 17 18 19 20 21 22 51 4 6 7 8 9 10 11 12 13 14 15 17 18 19 20 21 22 52 4 5 7 8 9 10 11 12 13 14 15 16 17 18 20 21 22 53 4 5 6 7 9 10 11 12 13 14 15 16 17 18 19 20 21 54 4 5 6 7 8 9 11 12 13 14 15 16 17 18 19 20 21 55 4 5 6 7 8 9 10 11 12 13 15 16 17 18 19 20 21 56 4 5 6 7 8 9 10 11 12 13 14 15 16 17 18 19 20 57 4 5 6 7 8 9 10 11 12 13 14 15 16 17 18 19 20 58 4 5 6 7 8 9 10 11 12 13 14 15 16 17 18 19 20 59 4 5 6 7 8 9 10 11 12 13 14 15 16 17 18 19 20 60 4 5 6 7 8 9 10 11 12 13 14 15 16 17 17 18 19
Table 1. Table represents the minimum slope (channel) distance (in feet) required for a non-
vertical barrier feature to qualify as a PHB. This table assumes a minimum barrier gradient of 20% and an overall vertical change in channel bed elevation associated with the feature of at
least one BFW (barrier option 1).

Board Manual-DATE Identify and Locate Divisions Between Streams Draft v. 4-12-2019
M23-8
Figure X. (placeholder) Measuring non-vertical obstacles Look for potential side channels or alternate flow routes around a vertical or non-vertical feature that might allow temporary upstream fish access at higher flows and render the feature passable and therefore, not meeting the obstacle PHB criteria. Measuring Stream Gradient PHBs Find the inflection point in the stream and “back-shoot” the profile to obtain the downstream reach gradient. From that same location, shoot the upstream gradient to obtain the effective gradient change (does it meet the PHB metric of [5]% difference for gradient change?). Changes in stream gradient need to be sustained and measured over a distance of 20 times the average bankfull width in both upstream and downstream directions (example 4 feet BFW x 20 = 80-feet of measured distance) to qualify as a gradient based PHB. These distances and gradients are typically measured with a laser level/ rangefinder, clinometer and string box, or other device(s) that can accurately measure gradient and/or distance.
Figure X (placeholder) measuring gradient, 20X BFW
The method for measuring underlying channel gradient through a deformable feature uses a different approach than previously discussed for measuring obstacle PHBs. In this case, one should take measurements standing far enough back (i.e., away from) the feature to capture the average underlying channel gradient that would exist in the absence of the deformable portion of the feature. Gradient measurements should be taken from the water surface or BFW elevation above and below the deformable feature at a distance where the underlying gradient is not influenced by the deformable feature.

Board Manual-DATE Identify and Locate Divisions Between Streams Draft v. 4-12-2019
M23-9
Figure X. (placeholder) Measuring through deformable features
Measuring a Bankfull Width PHB[RM(10] Measure bankfull width (BFW) (if tributary junction is encountered) both upstream and downstream in sufficient number of locations (rule-referenced at least 10 evenly spaced?) that best characterize the average reach BFW values with a tape measure or fixed measuring rod Here you must determine over what distance the BFW reduction consistently persists in order to meet the BFW scale reach length requirement. As with gradient segments, changes in BFW should be measured over a distance of 20 times the average bankfull width. The ability to measure the segment’s length and gradient can be affected by channel sinuosity and vegetation. If the channel is not straight or visibility is limited, you will need to take incremental channel measurements of both gradient and distance, and average the gradient change over the total distance to obtain an “accurate” reach gradient that meets the 20XBFW reach distance (example: Ave. BFW of 6 ft. X 20 BFW = 120 ft.).
NEEDS ILLUSTRATION[RM(11]
Step 4. Using the Fish Habitat Assessment Methodology to Identify the F/N break Once the first qualifying g, s, o PHB is encountered upstream from known fish presence identified in Step 2, apply the protocol electrofishing survey directly upstream from that PHB. The first PHB encountered is not necessarily the F/N break, but rather the starting point for conducting a protocol electrofishing survey. Part 1.3 provides best management practices for conducting electrofishing surveys. If a fish is detected upstream from the qualifying PHB, discontinue electrofishing and proceed upstream to the next qualifying PHB. The stream reach between the location of that detected fish and the next qualifying PHB encountered upstream is presumed fish habitat. Repeat this process until fish are no longer detected upstream of a PHB. If fish are not detected upstream from a qualifying PHB when conducting a protocol electrofishing survey, the first PHB upstream of the last detected fish is the F/N break. However, the protocol electrofishing survey must continue:
• for a minimum of a 1/4 mile beyond this PHB or to the next upstream PHB whichever distance is greater, or
• to the point where the stream no longer meets default physical stream criteria (WAC 222-16-030), and those channel characteristic are sustained.

Board Manual-DATE Identify and Locate Divisions Between Streams Draft v. 4-12-2019
M23-10
Alternatively, if fish are detected in a stream reach that exceeds default physical stream criteria are sustained, electrofishing efforts are complete. [RM(12] The F/N break will be located at the PHB directly downstream of the reach where no fish were detected. Additional surveying may be necessary to determine fish absence depending on unique stream habitat conditions, larger stream sizes or substantial stream reaches above natural barriers. Establish the F/N break per the process outlined in Step 4 In order to maximize the potential for detecting fish, protocol electrofishing surveying efforts should include sampling all habitat types including glides, riffles, runs, undercut banks, and pools or anywhere fish can hold or hide. Documentation of stream characteristics is important to demonstrate the survey efforts attempted to capture all potential habitat within the stream segment. .
[RM(13] Figure X (placeholder) Establishing the F/N Break
Step 5: Documenting the F/N Break in the Field[RM(14] Monument the location where the Type F/N break is proposed and ensure the location is recorded. Accurate data collection and stream condition descriptions on the WTMF will describe whether the FHAM is conducted and will assist reviewers when evaluating the proposed break. The documentation of the proposed F/N break should include a description of the identified PHB feature, GPS reference points and pertinent photographs to scale where possible. Photographs can aid reviewers in locating the proposed F/N break. The description of the F/N break location must be sufficient to ensure the point can be re-established on the ground in the event that the monument is lost. Weather resistant material (e.g. plastic or aluminum placards, etc.) is sufficient to remain through multiple years.
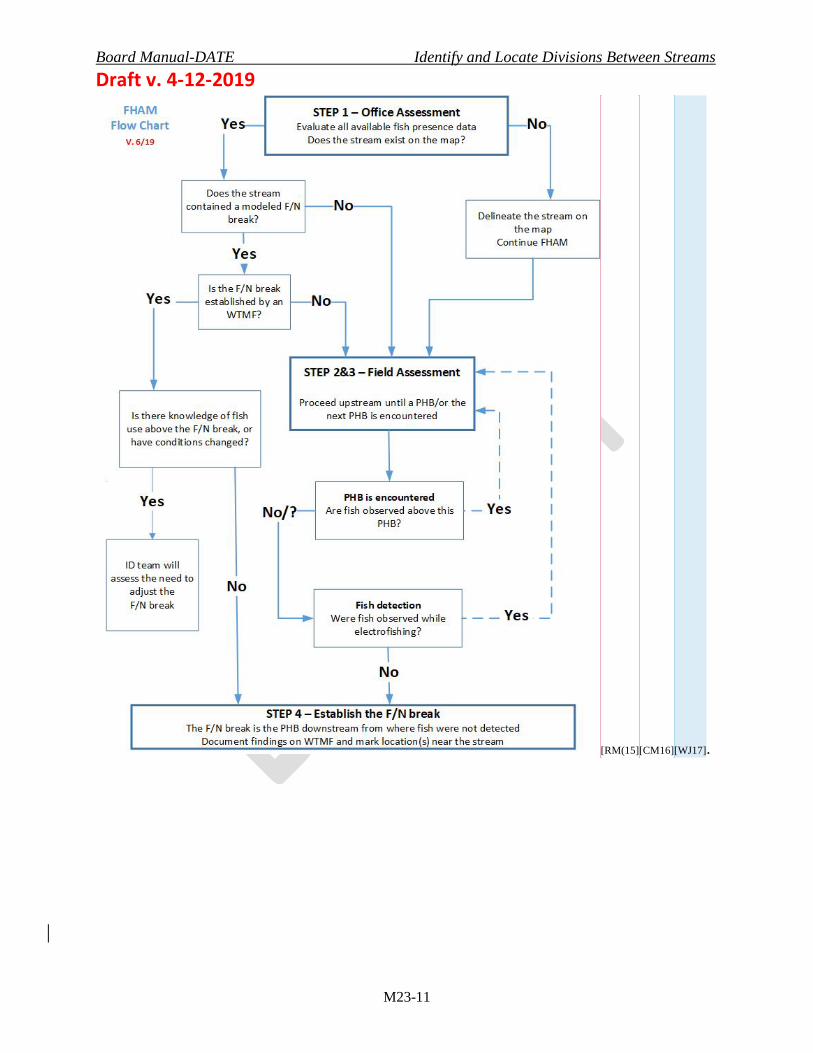
Board Manual-DATE Identify and Locate Divisions Between Streams Draft v. 4-12-2019
M23-11
[RM(15][CM16][WJ17].
Board Manual-DATE Identify and Locate Divisions Between Streams Draft v. 4-12-2019
M23-12
Best management practices[RM(18] 1.4 Conducting Protocol Electrofishing Surveys This guidance is provided for conducting protocol electrofishing surveying using backpack electrofishing equipment upstream of a potential habitat break (PHB) in conjunction with the fish habitat assessment methodology once fish presence has been confirmed.. The survey will determine whether fish are present in the stream segment upstream from the closest PHB from where fish are known to reside.. Careful attention to electrofishing techniques minimizes the risks to individual fish and increases the probability of fish detection in streams being sampled. Accurately documenting the stream’s physical and habitat characteristics and ensuring the information on the WTMF is complete will aid the water type team’s review and increase the likelihood of concurrence with survey results. State and Federal Permits Washington Department of Fish and Wildlife (WDFW) regulations require surveyors obtain a current Scientific Collection Permit (WAC 220-200-150). To ensure the safe capture and handling of fish and wildlife, WDFW requires permit applicants and anyone conducting activities under the permit (sub-permittees) provide a statement of their qualifications and experience with conducting surveys. It is the responsibility of surveyors and trained staff to follow the requirements contained in the permit. Information on WDFW Scientific Collection Permit program can be found at http://wdfw.wa.gov/licensing/scp/. An appropriate federal permit may be necessary for electrofishing in waters containing or may have historically contained ESA-listed species. For proposed surveys and studies that have the potential to affect ESA-listed species, contact the National Marine Fisheries Service at: https://apps.nmfs.noaa.gov/index.cfm. Surveyor Qualifications[RM(19] (to be developed when standards are established and implementable) Consultation[RM(20] Resource professionals from DNR, WDFW or tribal biologists may have local knowledge regarding fish presence and potential habitat. Consultation can help determine appropriate survey efforts or survey timing and maximize efficiency in the review and approval process. Consultation is needed under the following situations:
• Where streams show recent channel disturbances (debris flows, fire events) • When unfamiliar with the stream system or the life history of targeted fish species • Prior to conducting a protocol electrofishing survey above a artifical barrier or where an
artificial barrier has been replaced with fish passage structures and recolonization [RM(21]of fish is unknown.
• To determine appropriate survey timing for anticipating when fish will be seasonally active/present or where man-made barriers have been replaced with fish passage structures and recolonization of fish is unknown
• Prior to conducting a survey during a DNR declared drought.
Board Manual-DATE Identify and Locate Divisions Between Streams Draft v. 4-12-2019
M23-13
Part 1.3 Electrofishing Survey Best Management Practices This guidance is provided for conducting protocol electrofishing surveying using backpack electrofishing equipment in conjunction with the fish habitat assessment methodology (FHAM). The survey will determine whether fish are present in the stream segment upstream from the closest potential habitat break (PHB) from where fish are known to reside. Careful attention to electrofishing techniques minimizes the risks to individual fish and increases the probability of fish detection in streams being sampled. Accurately documenting the stream’s physical and habitat characteristics and ensuring the information on the water type modification form (WTMF) is complete will aid the water type team’s review and increase the likelihood of concurrence with survey result Stream Reconnaissance Prior to Electrofishing Visual methods such as walking the stream bank, snorkeling, or using power bait may help determine fish presence and reduce the need for some electrofishing. Initial reconnaissance will detect if ponds or off-channel habitats exist within the targeted stream reach. Under the right conditions, direct observation can be achieved with practice and improved using polarized glasses. Visual detection in small streams can be especially difficult when fish populations are small, the water is turbulent or turbid or vegetation cover is thick. For bottom-dwelling species such as sculpins or lampreys typically found in upper reaches in western Washington, visual observations may be virtually impossible. While visual observation is an acceptable method to document fish presence, it is not acceptable for documenting fish absence (i.e., concluding that fish are not present when in fact they are). Providing evidence that supports the absence of fish upstream from a PHB must be supported by a protocol electrofishing survey. Surveying in [RM(22]l[RM(23]arger streams[JG24][CM25] The electrofishing protocol in this manual was developed primarily for small size streams. Larger streams may have a higher expectation or presumption of fish use. Larger streams [CM26]have a larger cross-sectional area and typically deeper water column that may require more electrofishing effort in order to increase the probability of detection[WJ27]. Surveyors who wish to survey for fish in larger streams should consult with WDFW area habitat biologists and affected tribes prior to conducting the survey. The purpose of this consultation is to preview survey plans with water type review team members and cooperatively determine if there are parts of the plans that should be modified to improve both the survey quality and likelihood of concurrence. Electrofishing Survey Timing Survey information to determine fish occupancy must be collected during the time when the fish species in question are likely to be present. The spring period through early summer when (trout?) fry are most likely to have emerged from the gravels and moved to rearing areas is typically the most appropriate time. Surveys performed too early will miss post-emergence distribution; those performed too late may underestimate distribution as wetted headwaters
Board Manual-DATE Identify and Locate Divisions Between Streams Draft v. 4-12-2019
M23-14
recede in late spring and early summer. Abnormally dry periods, or conversely, flood events may also alter the extent fish occupy their habitat or access adjacent habitat and low and high flow conditions can alter fish distribution.
• Low flow considerations: Periods of low flow can be an effective time to conduct an electrofishing surveys due to there being more fish per unit channel area and clear water conditions. However, in cases of extreme low flow conditions, survey efforts may be compromised when stream depth is too shallow for full electrode submersion, water temperatures are too high or when seasonally occupied reaches are dry. In these cases, the loss or lack of flow can reduce or eliminate the opportunity to detect fish and thereby impair survey effectiveness.
• High flow considerations: High flow conditions are generally not an optimal time to conduct surveys. Furthermore, there is a high flow threshold where surveys should not be conducted due to potentially difficult (and unsafe) sampling conditions resulting from increased water volume and depth, higher stream velocity, higher stream turbidity and/or reduced fish response to the electrical field. These conditions may result in reduced likelihood of detecting fish, which could result in “false negatives” (e.g., the inability to detect fish when in fact they are present).
In most cases and under normal weather patterns, survey periods extend from March 1 to July 15 when water is most likely to be present in the channel. However, depending upon the stream’s late winter and spring water temperatures and species present, fry may not be out of the gravel in March [NDC(28]or April. To account for the complexities in anticipating when fish are most likely to be seasonally active, deviations from the March 1 to July 15 should occur with consultation with DNR, WDFW and local tribal biologists. Dry Stream Reaches Seasonal weather patterns can create situations where normal flow patterns are disrupted and subsurface flow can be affected by different lithology or local hydrology. Additionally, some stream reaches that are dry during the survey provide important habitat during fall and winter and spring seasons. In these cases late June and July may be too late to conduct a protocol survey due to lack of flowing water[NDC(29]. Assessing fish habitat is necessary regardless of the persistence of flowing water. The absence of flowing water alone is not an indicator of a habitat break and will not solely be used to justify the F/N break. Stream reaches upstream from intermittent flow that meet the default physical stream criteria of presumed fish habitat should be assessed for isolated fish populations and fish habitat[RM(30]. Dry reaches and associated laterals tributaries will be assumed habitat upstream until the channel no longer meets the default physical criteria for presumed fish habitat or dry segments can be resurveyed during sufficient flow[WJ31][NDC(32][r33] Declared Drought Conditions At the beginning of each calendar year, DNR, in consultation with the WDFW, provides information forecasting statewide water abundance for the coming survey season. This information is provided to focus appropriate attention during potential drought conditions.
Board Manual-DATE Identify and Locate Divisions Between Streams Draft v. 4-12-2019
M23-15
If drought conditions exist within the state or portions thereof during the fish survey season, proponents of a water type change are required to provide information explaining how stream flows and fish use determinations were unaffected by drought conditions. The proponent should supply the rationale on why the proposed F/N break is appropriate given stream flow conditions at time of survey. If such information is not provided, or not deemed adequate during the review process, then the proposed water type change may not receive concurrence. The following will help ensure survey results are accepted during declared drought seasons:
• Before conducting a survey in low-flow affected areas, it is important to check the status of the specific basins using the links in Appendix C.
• Electrofishing survey results are less likely to receive concurrence unless the WTMF documents how the distribution of fish or the ability for the survey to detect fish was not affected by drought. Drought-influenced surveys may not represent the upstream extent of fish use as fish distribution retracts lower in the stream system than under normal flows, potentially resulting in under-representation of Type F waters.
The default physical stream criteria for Type F (see WAC 222-16-030) can be applied to stream segments during declared drought conditions. Electrofishing Surveys above Artificial Barriers Artificial fish passage barriers1, such as impassable culverts, can preclude fish access to upstream reaches and limit the distribution of fish. In situations where the presence of an artificial barrier influences fish abundance and/or species composition above the barrier, and where this influence could potentially influence the upstream distribution of fish, electrofishing surveys are[WJ34] not appropriate. The presence of an artificial barrier alone is not sufficient to establish the F/N break. Where habitat conditions and fish composition and abundance are similar between stream reaches upstream and downstream from a barrier, electrofishing surveys may be useful upstream of an artificial barriers. The applicability of electrofishing surveys upstream of barriers determined by the status of the fish populations in the reach upstream from the barrier relative to the population downstream[CM35]. Examples include when barriers are located several miles downstream from the survey reach fish population(s) or when permanent natural barriers exist above a man-made barrier and below the proposed survey reach. Above artificial barriers, default physical stream characteristics (WAC 222-16-030) are used to determine the presumption of fish use unless otherwise approved by DNR in consultation with the WDFW and affected tribes. Consultation will address necessary information and review expectations prior to the survey. The WTMF must provide habitat and fish population conditions above and below the barrier for concurrence consideration. Electrofishing Survey Effort upstream from a Potential Habitat Break Protocol electrofishing efforts must include sampling all accessible habitat up stream of a PHB including glides, riffles, runs, and pools in order to capture where fish can hold or hide. 1 A fish passage barrier means any artificial in-stream structure that impedes the free passage of fish, WAC 222-16-010.
Board Manual-DATE Identify and Locate Divisions Between Streams Draft v. 4-12-2019
M23-16
Documentation of stream characteristics is important to demonstrate the survey efforts attempted to investigate all habitat within the stream segment. The electrofishing survey must continue for a minimum of a 1/4 mile, or to the next PHB whichever is greater. If fish are not detected within 1/4 mile or by the next upstream PHB, the F/N break will be located at the PHB directly downstream of the reach where the electrofishing survey was conducted. Alternatively, if the stream no longer meets the default physical stream criteria (see WAC 222-16-030) and the channel conditions are sustained, and if fish have not been detected since the last PHB, electrofishing efforts are complete[NDC(36]. The F/N break will be located at the PHB directly downstream of the reach where no fish were detected. Additional surveying may be necessary to determine fish absence depending on unique stream habitat conditions, larger stream sizes or substantial stream reaches above natural barriers[WJ37][r38].[RM(39] Surveying in Streams with Recent Disturbances Fish presence and distribution can be affected by stream disturbances such as mass wasting events, channel scouring by debris flows, or fire. Fish populations may be locally or temporarily extirpated from stream channels after an event and it may take years before recovery from disturbances begins. Where recent disturbances have the potential to affect the ability to detect fish or determine the appropriate F/N break, default physical stream criteria (222-16-030) can be used for determining the upper extent of fish habitat. Water type proponents may also request an interdisciplinary team review for determining the appropriate survey protocol. In some cases, stream channel disturbances will not be known until a stream assessmentthe FHAM has begun. If a proponent chooses to conduct FHAM for such streams, Ddocumentation on the WTMF should include:
• A description of the disturbance, including length of stream affected, how the potential habitat has been modified (aggradation, subsurface flows, isolated pools, loss of gravel, increased sediment, scouring to bedrock, etc.)
• How the disturbance factors might affect survey results (utility) • How the disturbance factors might affect the upstream extent of fish distribution or
habitat in the stream reach. Describe the density and/or condition of fish populations downstream of the disturbance, temporary barriers present (exposed bedrock features, temporary wood jams or subsurface flows, etc.), loss of spawning gravels or buried pools
• Documentation on how the proposed F/N break encompasses the full extent of potential or recoverable fish habitat[WJ40][NDC(41].
Surveying in Lentic Habitat[RM(42] Lentic habitat including ponds, lakes, and wetlands can exist in the upper reaches of streams that provide refuge and rearing areas for fish populations. Surveyors should attempt to locate such features and other potential habitats during field reconnaissance[WJ43]. The presence of fish at these locations, or in other upstream reaches indicates downstream fish use. Additionally, electrofishing surveys are not applicable [r44]in off-channel habitats[WJ45] and[NDC(46] under the current rule, ponds larger than a half-acre are considered Type F water. Determining fish use in water bodies such as ponds and wetlands can be difficult. While electrofishing surveys can be effective under some circumstances (small, shallow ponds or larger
Board Manual-DATE Identify and Locate Divisions Between Streams Draft v. 4-12-2019
M23-17
pools with good water clarity) electrofishing surveys in larger water bodies is not an acceptable method for documenting fish absence. Pre-consultation can increase confidence that the survey results will be accepted. Other sampling methods such as minnow trapping, seining, snorkeling, gillnetting, hook and line sampling, environmental DNA, or a combination of sampling techniques are likely to be more appropriate for fish detection in ponds and wetlands. However, there is no single sampling methodology that is appropriate for all lentic environments and survey techniques must be determined on a case-by-case basis in consultation with WDFW area habitat biologists or local tribal staff for proper survey techniques. Additional Best Management Practices Careful attention to electrofishing survey techniques minimizes risks to individual fish and increases the effectiveness of the survey. Carrying out effective surveys using techniques that result in low risk to fish populations and high probability of detection requires careful adherence to the protocols listed in Board Manual guidance. In addition, specific elements of NOAA electrofishing guidelines for ESA-listed fish and WDFW Scientific Collection Permit conditions should be followed. The following surveying techniques will help improve the effectiveness of the survey effort:[RM(47]
• Work in an upstream direction from the initial PHB while minimizing walking in the stream channel[NDC(48][WJ49].[r50]
• If fish are detected upstream of a PHB, caution should be exercised to avoid potential impacts to small isolated populations[NDC(51].
• Sample all accessible habitat (riffles, pools, banks with draped vegetation or undercut, etc.) wherever fish (not just salmonids) can hold or hide.
• In debris jams, undercut banks or around instream structures, insert the uncharged anode into the debris or undercut bank, depress the electrofisher switch and slowly move the anode into open water. Fish will often be pulled from the cover for observation.
• In deep water pools, fish can be difficult to detect. Chase fish into shallow water by sweeping the charged anode across the channel while moving it up and down in the water column in a downstream direction. Fast water can be best sampled by moving the anode downstream at approximately the same velocity the water is flowing.
• Position netters appropriately downstream (usually within about three feet below the anode) for observing fish and minimizing fish egress.
• Except for deep water pools and runs, the anode should be submerged at all times and held just below the water surface to help draw the attracted fish to the anode.
• Surveyors should be cognizant of the cathode at all times to ensure it is submerged and in the proper location relative to the anode to create an effective electrical field.
• If the stream splits into separate channels, each channel needs be individually surveyed. • Include at least one person operating the electrofisher and at least one downstream netter.
Larger streams may require more than one netter.
PART 2. IDENTIFY AND LOCATE THE DIVISION BETWEEN TYPE NP AND NS WATERS (under development)
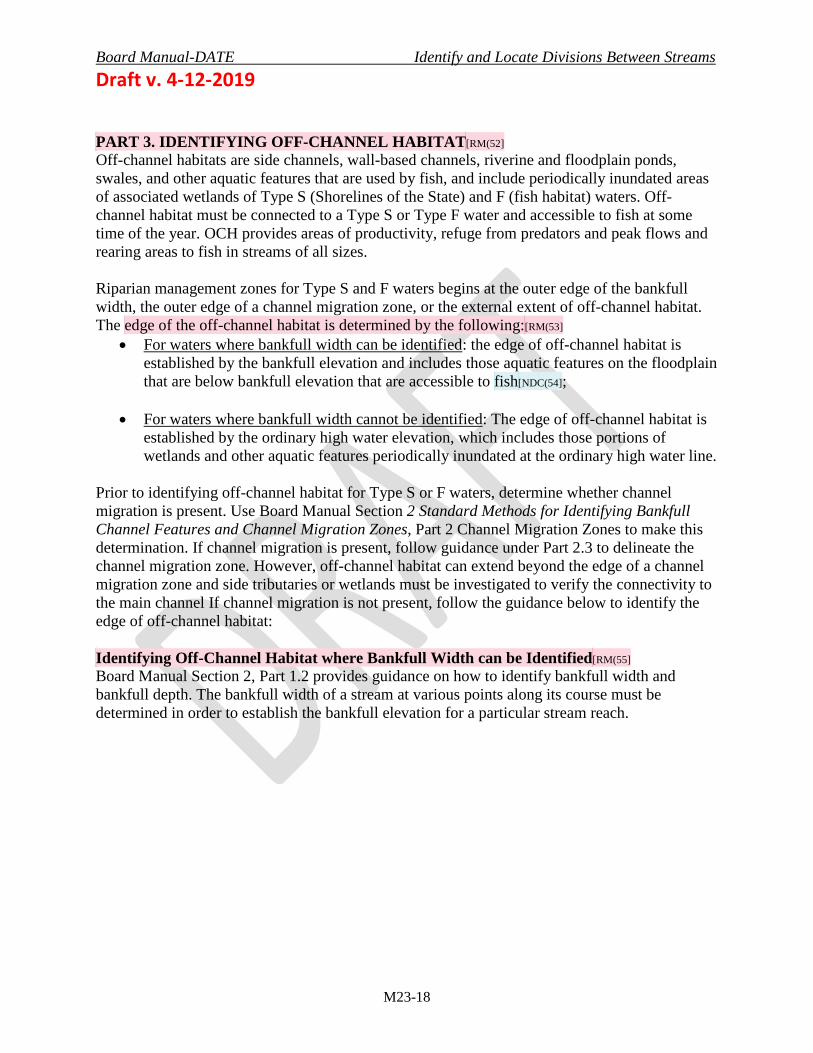
Board Manual-DATE Identify and Locate Divisions Between Streams Draft v. 4-12-2019
M23-18
PART 3. IDENTIFYING OFF-CHANNEL HABITAT[RM(52] Off-channel habitats are side channels, wall-based channels, riverine and floodplain ponds, swales, and other aquatic features that are used by fish, and include periodically inundated areas of associated wetlands of Type S (Shorelines of the State) and F (fish habitat) waters. Off-channel habitat must be connected to a Type S or Type F water and accessible to fish at some time of the year. OCH provides areas of productivity, refuge from predators and peak flows and rearing areas to fish in streams of all sizes. Riparian management zones for Type S and F waters begins at the outer edge of the bankfull width, the outer edge of a channel migration zone, or the external extent of off-channel habitat. The edge of the off-channel habitat is determined by the following:[RM(53]
• For waters where bankfull width can be identified: the edge of off-channel habitat is established by the bankfull elevation and includes those aquatic features on the floodplain that are below bankfull elevation that are accessible to fish[NDC(54];
• For waters where bankfull width cannot be identified: The edge of off-channel habitat is established by the ordinary high water elevation, which includes those portions of wetlands and other aquatic features periodically inundated at the ordinary high water line.
Prior to identifying off-channel habitat for Type S or F waters, determine whether channel migration is present. Use Board Manual Section 2 Standard Methods for Identifying Bankfull Channel Features and Channel Migration Zones, Part 2 Channel Migration Zones to make this determination. If channel migration is present, follow guidance under Part 2.3 to delineate the channel migration zone. However, off-channel habitat can extend beyond the edge of a channel migration zone and side tributaries or wetlands must be investigated to verify the connectivity to the main channel If channel migration is not present, follow the guidance below to identify the edge of off-channel habitat: Identifying Off-Channel Habitat where Bankfull Width can be Identified[RM(55] Board Manual Section 2, Part 1.2 provides guidance on how to identify bankfull width and bankfull depth. The bankfull width of a stream at various points along its course must be determined in order to establish the bankfull elevation for a particular stream reach.
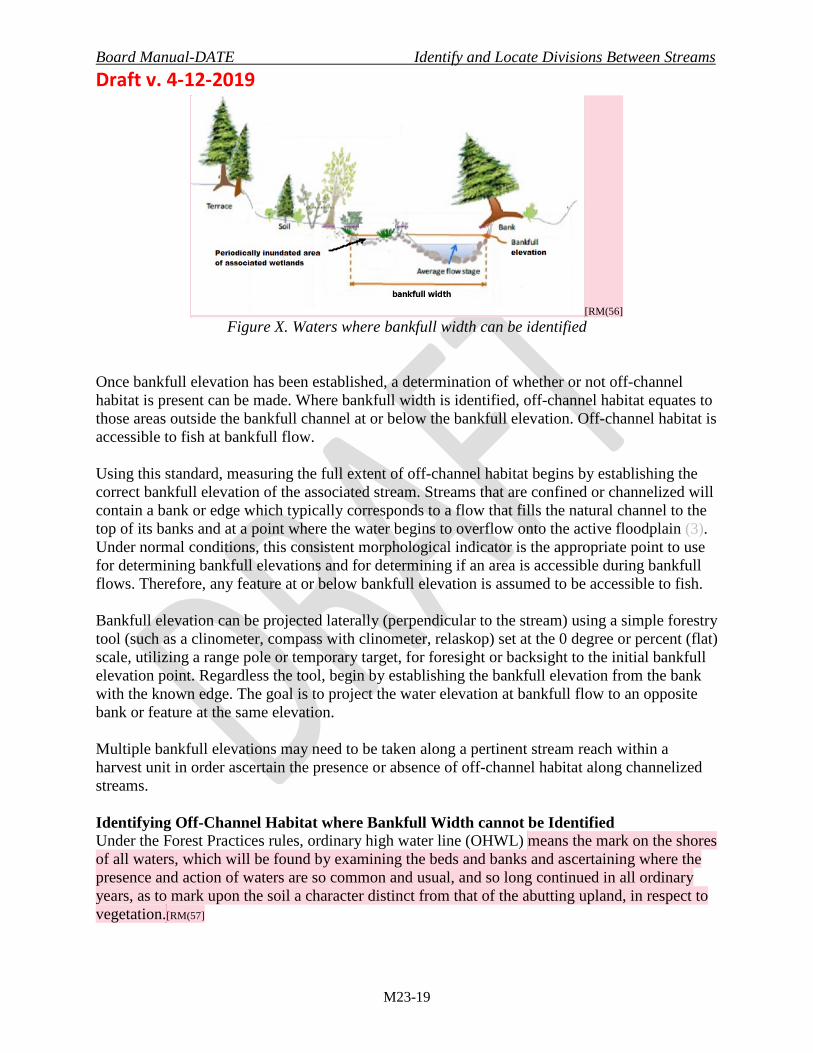
Board Manual-DATE Identify and Locate Divisions Between Streams Draft v. 4-12-2019
M23-19
[RM(56] Figure X. Waters where bankfull width can be identified
Once bankfull elevation has been established, a determination of whether or not off-channel habitat is present can be made. Where bankfull width is identified, off-channel habitat equates to those areas outside the bankfull channel at or below the bankfull elevation. Off-channel habitat is accessible to fish at bankfull flow. Using this standard, measuring the full extent of off-channel habitat begins by establishing the correct bankfull elevation of the associated stream. Streams that are confined or channelized will contain a bank or edge which typically corresponds to a flow that fills the natural channel to the top of its banks and at a point where the water begins to overflow onto the active floodplain (3). Under normal conditions, this consistent morphological indicator is the appropriate point to use for determining bankfull elevations and for determining if an area is accessible during bankfull flows. Therefore, any feature at or below bankfull elevation is assumed to be accessible to fish. Bankfull elevation can be projected laterally (perpendicular to the stream) using a simple forestry tool (such as a clinometer, compass with clinometer, relaskop) set at the 0 degree or percent (flat) scale, utilizing a range pole or temporary target, for foresight or backsight to the initial bankfull elevation point. Regardless the tool, begin by establishing the bankfull elevation from the bank with the known edge. The goal is to project the water elevation at bankfull flow to an opposite bank or feature at the same elevation. Multiple bankfull elevations may need to be taken along a pertinent stream reach within a harvest unit in order ascertain the presence or absence of off-channel habitat along channelized streams. Identifying Off-Channel Habitat where Bankfull Width cannot be Identified Under the Forest Practices rules, ordinary high water line (OHWL) means the mark on the shores of all waters, which will be found by examining the beds and banks and ascertaining where the presence and action of waters are so common and usual, and so long continued in all ordinary years, as to mark upon the soil a character distinct from that of the abutting upland, in respect to vegetation.[RM(57]
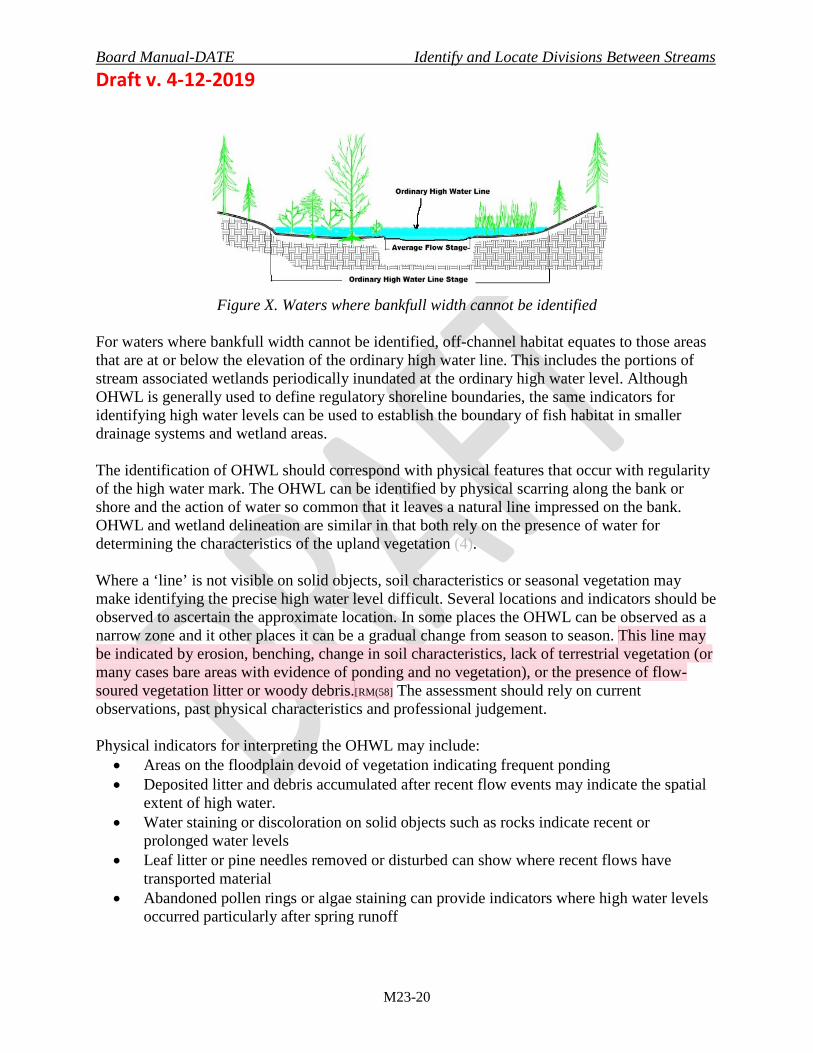
Board Manual-DATE Identify and Locate Divisions Between Streams Draft v. 4-12-2019
M23-20
Figure X. Waters where bankfull width cannot be identified
For waters where bankfull width cannot be identified, off-channel habitat equates to those areas that are at or below the elevation of the ordinary high water line. This includes the portions of stream associated wetlands periodically inundated at the ordinary high water level. Although OHWL is generally used to define regulatory shoreline boundaries, the same indicators for identifying high water levels can be used to establish the boundary of fish habitat in smaller drainage systems and wetland areas. The identification of OHWL should correspond with physical features that occur with regularity of the high water mark. The OHWL can be identified by physical scarring along the bank or shore and the action of water so common that it leaves a natural line impressed on the bank. OHWL and wetland delineation are similar in that both rely on the presence of water for determining the characteristics of the upland vegetation (4). Where a ‘line’ is not visible on solid objects, soil characteristics or seasonal vegetation may make identifying the precise high water level difficult. Several locations and indicators should be observed to ascertain the approximate location. In some places the OHWL can be observed as a narrow zone and it other places it can be a gradual change from season to season. This line may be indicated by erosion, benching, change in soil characteristics, lack of terrestrial vegetation (or many cases bare areas with evidence of ponding and no vegetation), or the presence of flow-soured vegetation litter or woody debris.[RM(58] The assessment should rely on current observations, past physical characteristics and professional judgement.
Physical indicators for interpreting the OHWL may include:
• Areas on the floodplain devoid of vegetation indicating frequent ponding • Deposited litter and debris accumulated after recent flow events may indicate the spatial
extent of high water. • Water staining or discoloration on solid objects such as rocks indicate recent or
prolonged water levels • Leaf litter or pine needles removed or disturbed can show where recent flows have
transported material • Abandoned pollen rings or algae staining can provide indicators where high water levels
occurred particularly after spring runoff
Board Manual-DATE Identify and Locate Divisions Between Streams Draft v. 4-12-2019
M23-21
• Change in plant community transitioning from hydrophytic vegetation (reed grasses, sedges, rushes) to terrestrial vegetation (sword fern, salal)
No single indicator necessarily proves an exact elevation, but a combination of several indicators can help locate where high water levels typically reside[NDC(59][r60].
References 1 - Lichvar, R.W., S McColley. 2008. A Field Guide to the Identification of the Ordinary High Water Mark (OHWM) in the Arid West Region of the Western United States: A Delineation Manual. ERDC/CRREL TR-08-12. Hanover, NH: U.S. Army Engineer 2 - Lichvar, R.W., and J.S. Wakeley, ed. 2004. Review of Ordinary High Water Mark indicators for delineating arid streams in the southwestern United States. ERDC/CRREL TR-04-1. Hanover, NH: U.S. Army Engineer Research and Development Center, Cold Regions Research and Engineering Laboratory. 3 - Rosgen, D. 1996. Applied river morphology. Pagosa Springs, CO: Wildland Hydrology. 4 - Olson, P. and E. Stockdale. 2010. Determining the Ordinary High Water Mark on Streams in Washington State. Second Review Draft. Washington State Department of Ecology, Shorelands & Environmental Assistance Program, Lacey, WA. Ecology Publication # 08-06-001. Cole 2006 was referenced in the e-fish report – which one used for single visit??? Cole, M.B. and J.L. Lempke. 2006. Annual and seasonal variability in the upper limit of fish distribution in Eastern Washington streams. Final report. Prepared for Washington DNR. Cole, M.B., D.M. Price, and B.R. Fransen. 2006. Change in the upper extent of fish distribution in Eastern Washington streams between 2001 and 2002. Transactions of the American Fisheries Society. 135:634-642.
Appendix A - Fish Data Information
Provide short intro…..
Board Manual-DATE Identify and Locate Divisions Between Streams Draft v. 4-12-2019
M23-22
• Kalispel Tribe’s Geo-Spatial Database Management System. A comprehensive database for Kalispel Tribal natural resources data (wildlife, fisheries, habitat, forestry). Contains additional data from WDFW, Colville Tribes, and Spokane Tribe on fish and water quality for tributaries and lakes in the upper Columbia River blocked area in Washington (area above Chief Joseph Dam). http://gis.knrd.org/knrdgisviewer/
• Pacific States Marine Fisheries Commission provides coastal cutthroat trout interactive maps as a range-wide assessment on coastal cutthroat trout observations, data and distribution compiled to date. http://www.coastalcutthroattrout.org/sample-page/cct-interactive-map
• Salmon and Steelhead Habitat Inventory and Assessment Program (SSHIAP): Another joint western Washington Treaty Tribes and WDFW effort that complements both SaSI and SWIFD to provide regional, watershed and stock-level habitat information for comparisons of habitat conditions that is especially useful for prioritizing salmon recovery activities. https://nwifc.org/about-us/habitat/sshiap/
• Salmonscape: A WDFW interactive map providing statewide distribution, stock status, habitats and recovery evaluations for steelhead, bull trout and all individual salmon species. http://apps.wdfw.wa.gov/salmonscape/
• Salmonid Stock Inventory (SaSI) A joint tribal and WDFW collection of documents that include the original 1992 stock inventory for salmon and steelhead along with updated descriptions of life history, stock identification and stock status (by WRIA) for bull trout/Dolly Varden, coastal cutthroat trout and all salmon species. https://wdfw.wa.gov/conservation/fisheries/sasi/
• Statewide Integrated Fish Distribution (SWIFD) is a Northwest Indian Fishery Commission web map that provides a general fish distribution layer for western Washington that is associated with the DNR Water Typing Hydro layer. https://geo.nwifc.org/SWIFD/
• Washington State Department of Fish and Wildlife fish passage barrier maps: A centralized WDFW map application that identifies artifical barriers where a fish passage inventory has been conducted. https://wdfw.wa.gov/conservation/habitat/fish_passage/data_maps.html
• Washington State Department of Fish and Wildlife contact information: Web site providing contact information for WDFW district and area biologists. https://wdfw.wa.gov/about/contact/district_biologists.html
• Wild Fish Conservancy state-funded water type assessment results including georeferenced photos, habitat, and fish data. http://wildfishconservancy.org/resources/publications/wild-fish-runs/introducing-wfcs-barrier-prioritization-mapping-system[JG61]
Appendix B – Road Crossing Information

Board Manual-DATE Identify and Locate Divisions Between Streams Draft v. 4-12-2019
M23-23
• Washington State Department of Fish and Wildlife Fish Passage Map – a centralized database of fish passage and habitat information statewide. https://wdfw.wa.gov/conservation/habitat/fish_passage/data_maps.html
• Washington State Department of Transportation fish passage inventory – an interactive map provides data for corrected and uncorrected barriers statewide. http://www.wsdot.wa.gov/Projects/FishPassage/default.htm
• Department of Natural Resources Forest Practices Activity Mapping Tool – an interactive map showing fish barrier status based on Road Maintenance and Abandonment Plans. https://www.dnr.wa.gov/programs-and-services/forest-practices/forest-practices-application-review-system-fpars
Appendix C – Drought and Stream Flow Information Interested parties can find details regarding drought effects in specific basins by reviewing the following water supply forecast and stream flow resources:
• The Natural Resource Conservation Service, current Water Supply Outlook Report. http://www.nrcs.usda.gov/wps/portal/nrcs/detail/wa/snow/waterproducts/
• The United States Geologic Survey (USGS) provides water data and streamflow
information on Washington’s rivers. While most stream gauges are located on major rivers, the information for the appropriate basin could provide insight into the status of tributary streams. https://www.usgs.gov/centers/wa-water
• For current drought status as well as information about the state drought declaration
process, review Ecology’s 2016 drought web site at: http://www.ecy.wa.gov/drought/index.html
• National Oceanic and Atmospheric Administration (NOAA) Northwest River Forecast
provides flood forecasting and stream flow information for selected basins. The Northwest River Forecast Center “Ensemble Streamflow Prediction (ESP) Water Supply Forecast as Percent of Average”. http://www.nwrfc.noaa.gov/ws/
1
DEPARTMENT OF NATURAL RESOURCES FOREST PRACTICES DIVISION 1111 WASHINGTON ST SE OLYMPIA, WA 98504 360.902.1400 WWW.DNR.WA.GOV
MEMORANDUM April 24, 2019 TO: Forest Practices Board FROM: Howard Haemmerle, Adaptive Management Program Administrator SUBJECT: Transmittal of the PHB Validation Study Design Report The Forest Practices Board (Board) in August 2017 direct the AMPA to identify and work with a science panel with expertise in headwater stream systems to develop a study design to validate geomorphic potential habitat breaks (PHBs) proposed for use in the Fish Habitat Assessment Methodology (FHAM) for water typing. The purpose of this memo is to transmit the final study design to the Board.
Overview
The PHB validation study is to develop criteria for accurately identifying PHBs and to evaluate the utility of PHB criteria selected by the Board for use in the Fish Habitat Assessment methodology (FHAM). The PHB validation study seeks to determine which combination of gradient, channel width, and obstacles features would best be used within the context of the FHAM to locate regulatory division points between fish and non-fish stream segments. The specific geomorphic variables included in the study are those identified in the three alternatives by the Board at its February 13, 2018 meeting.
The approach of the study is to examine the relationship between end of fish points identified through the study and locations of selected nearby geomorphic features across forested EPA level III ecoregions in Washington and seek to identify which combination of geomorphic criteria would best be used in the FHAM. The study includes three years of sampling across three hydrologically and biologically important seasons (March-June, August-October, and November-January) at 35 sites in each of the seven forestedseven-forested ecoregions. The results of the study will inform the Board on PHB criteria that can be easily identified in the field (implementable), are objective measurements (repeatable), and are based upon empirical data (enforceable).
The proposed study design has been provided for review and comment to the stakeholder technical committee, CMER, CMER’s Instream Scientific Advisory Group (ISAG), and to the
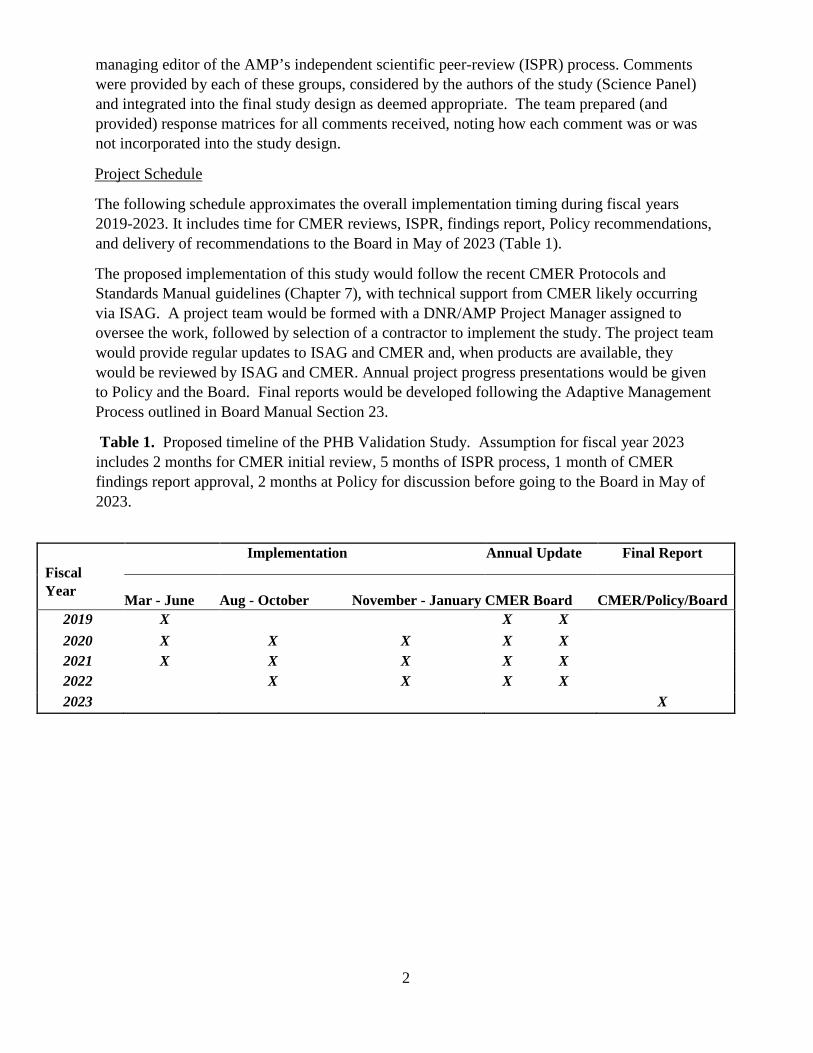
2
managing editor of the AMP’s independent scientific peer-review (ISPR) process. Comments were provided by each of these groups, considered by the authors of the study (Science Panel) and integrated into the final study design as deemed appropriate. The team prepared (and provided) response matrices for all comments received, noting how each comment was or was not incorporated into the study design.
Project Schedule
The following schedule approximates the overall implementation timing during fiscal years 2019-2023. It includes time for CMER reviews, ISPR, findings report, Policy recommendations, and delivery of recommendations to the Board in May of 2023 (Table 1).
The proposed implementation of this study would follow the recent CMER Protocols and Standards Manual guidelines (Chapter 7), with technical support from CMER likely occurring via ISAG. A project team would be formed with a DNR/AMP Project Manager assigned to oversee the work, followed by selection of a contractor to implement the study. The project team would provide regular updates to ISAG and CMER and, when products are available, they would be reviewed by ISAG and CMER. Annual project progress presentations would be given to Policy and the Board. Final reports would be developed following the Adaptive Management Process outlined in Board Manual Section 23.
Table 1. Proposed timeline of the PHB Validation Study. Assumption for fiscal year 2023 includes 2 months for CMER initial review, 5 months of ISPR process, 1 month of CMER findings report approval, 2 months at Policy for discussion before going to the Board in May of 2023.
Fiscal Year
Implementation Annual Update Final Report
Mar - June Aug - October November - January CMER Board CMER/Policy/Board 2019 X X X 2020 X X X X X 2021 X X X X X 2022 X X X X 2023 X
EvaluationofphysicalfeaturesthatdefinefishhabitatinforestedlandscapesacrossWashingtonState
Study plan prepared for the Washington Forest Practices Board
March 20, 2019
Submitted by
PHB Science Panel Phil Roni (Chair) Hans Berge Pete Bisson Jeff Kershner Joe Maroney
Kai Ross Ray Timm Pat Trotter
Potential Habitat Breaks Study Plan
i
Summary
Fish habitat in forested watersheds is influenced by many factors including gradient, channel
condition, nutrients, flow, barriers to migration, history of anthropogenic and natural
disturbance, and fish population size. The Washington Forest Practices Board has selected
criteria to be used in determining potential habitat breaks (PHBs) between fish (Type F) and non‐
fish bearing waters (Type N) across the state. These criteria are based upon data collected during
a single Washington Department of Natural Resources (DNR) protocol electrofishing survey and
include gradient, bankfull width, and vertical and non‐vertical barriers to migration. To evaluate
which physical criteria best define the end of fish (EOF) habitat (the uppermost stream segments
that actually or potentially are inhabited by fish at any time of the year), detailed information is
needed on the uppermost fish location and associated habitat in small streams across
Washington State. While some data on habitat conditions at last detected fish locations are
available (e.g., from existing water type modification forms [WTMFs] submitted to DNR), these
data were found to be insufficient to determine PHBs that defined last detected fish locations
and associated habitat.
The purpose of this study is to develop criteria for accurately identifying PHBs and to evaluate
the utility of PHB criteria selected by the Board for use in the Fish Habitat Assessment
methodology (FHAM) as part of a water typing rule. The study is designed to 1) determine which
combinations of gradient, channel width, barriers to migration, and other physical habitat and
geomorphic conditions of the Board identified PHB criteria best identifies last detected fish
location in an objective and repeatable manner1 as applied in the FHAM and 2) evaluate if a set
or combination of empirically derived criteria are better at identifying the starting point at which
a protocol survey would begin. Additionally, this study is intended to provide insight into how
last detected fish points, EOF habitat, and PHBs proposed by the Washington Forest Practice
Board may vary across ecoregions, seasons, and years. Additionally, this study is intended to
provide insight into how last detected fish points, EOF habitat, and PHBs proposed by the
1 While the study will gather considerable information on fish distribution, it is not a long‐term (>25 years) study on the upper limits of fish distribution per se.

Potential Habitat Breaks Study Plan
ii
Washington Forest Practice Board may vary across ecoregions, seasons, and years. We
recommend the study be conducted across three years and three seasons (spring, summer, and
fall) at 35 sites in each of seven forested EPA Level III ecoregions in Washington State. A total of
245 randomly selected sites from approved water type modification forms on the DNR hydro
layer will be surveyed repeatedly every year for three years. Upstream fish distribution limits (i.e.,
last detected fish locations) will be determined during each season at each site following DNR
protocols for electrofishing surveys. Once the uppermost fish is located during each sampling
event, the last detected fish location will be flagged, GPS coordinates will be recorded, and a
longitudinal profile habitat survey will be conducted to characterize habitat and geomorphic
conditions 100 m downstream and 200 m upstream of the last detected fish location. During each
of the three years, a random sample of one‐third of all sites (82 sites) will be revisited seasonally
and DNR protocol electrofishing surveys repeated to determine how much the last detected fish
location changes intra‐ and inter‐annually. If the last detected fish location changes during any
subsequent survey, a longitudinal profile survey will be conducted to append upstream or
downstream to ensure that there are habitat data 200 m above and 100 m below last detected
fish locations for all seasons and years. Data will be analyzed to determine the combinations of
gradient, channel width, and other geomorphic features that best define last detected fish
locations, PHBs, EOF habitat, and whether these vary by ecoregion and season. The results of this
study will be used to evaluate the effectiveness of PHB criteria in determining the regulatory
break between fish (Type F) and non‐fish bearing (Type N) waters.
Potential Habitat Breaks Study Plan
iii
Table of Contents Summary .......................................................................................................................................... i
List of Acronyms ............................................................................................................................... v
Introduction .................................................................................................................................... 1
Barriers to Migration ................................................................................................................... 3
Gradient ....................................................................................................................................... 5
Flow and Channel Size ................................................................................................................. 7
Food Resources ........................................................................................................................... 9
Fish Habitat Assessment Method ............................................................................................... 9
Study Purpose ........................................................................................................................... 12
Study Questions ........................................................................................................................ 13
Methods ........................................................................................................................................ 13
Study Design .............................................................................................................................. 13
Site Identification ...................................................................................................................... 14
Sampling Frequency and Season ............................................................................................... 16
Protocol Electrofishing and Habitat Surveys ............................................................................. 17
Additional Information Collected (Explanatory Variables) ....................................................... 21
Data Analysis ............................................................................................................................. 21
Potential Challenges ..................................................................................................................... 27
Expected Results and Additional Studies ...................................................................................... 29
Budget ........................................................................................................................................... 32
References .................................................................................................................................... 34
Appendices .................................................................................................................................... 42
Appendix A. Details of sample size estimation. ........................................................................ 42
Potential Habitat Breaks Study Plan
iv
Appendix B. Example of 100 randomly selected sites for Cascades ecoregion including
coordinates, basin name, elevation and land ownership. Ownership includes state, private
and federal, though none of the points initially drawn from Cascades ecoregion were on
federal lands. ............................................................................................................................. 45
Appendix C. Step‐by step instructions for longitudinal thalweg profile used by BPA for
evaluations of barrier removal projects (modified from https://www.monitoringresource).. 49
Potential Habitat Breaks Study Plan
v
List of Acronyms
BFW Bankfull Width
DNR Department of Natural Resources
eDNA Environmental DNA
EOF End of Fish (Last detected fish following a Protocol Survey)
F/N Break Regulatory break between fish and non‐fish bearing waters
FHAM Fish Habitat Assessment Method
GIS Geographic Information System
PHB Potential Habitat Break(s)
Type F Fish Bearing Streams
Type N Non‐Fish Bearing Streams
WTM Water Type Modification
WTMF Water Type Modification Form
Potential Habitat Breaks Study Plan
1
Introduction
Washington State forest practices are regulated by the Forest Practices Act established by the
legislature, with rules established by the Washington Forest Practices Board (Board). The goals
of the rules include protecting public resources (water quality, fish, and wildlife) and maintaining
an economically viable timber industry. Rules pertaining to aquatic and riparian habitats are
specifically included in the Forest Practices Habitat Conservation Plan, which provides coverage
for approximately 9.3 million acres of forestland in Washington (6.1 million acres west of the
Cascade Crest and 3.2 million acres in eastern Washington). Specific prescriptions (rules) are
applied in waters containing fish to protect fish and their habitats.
The Board is responsible for rule‐making and overseeing the implementation of forest practice
rules. The evaluation of the effectiveness of these rules is directed by the Adaptive Management
Program of the Washington Department of Natural Resources. Water typing is an important part
of applying contemporary forest practice rules since prescriptions in riparian areas are based in
part on whether streams are or potentially could be used by fish. Streams identified as having
fish habitat are classified as Type F waters, defined in the interim water typing rule WAC 222‐16‐
031, and have specific riparian buffer prescriptions and fish passage requirements. Fish habitat
is defined in WAC 222‐16‐010 as “…habitat, which is used by fish at any life stage at any time of
the year including potential habitat likely to be used by fish, which could be recovered by
restoration or management and includes off‐channel habitat.” Currently, an interim rule
delineates Type F waters through the use of either default physical criteria (e.g., 2 feet defined
channel within the bankfull width and greater than 20 percent slope) or protocol surveys (e.g.,
electrofishing). DNR provides a map showing where a model has determined fish bearing stream
segments. The Forest Practice Rules require forest land owners to determine, in the field, the
type of any regulated waters as identified within proposed harvest areas prior to submitting a
forest practices application/notification. Landowners may use the physical criteria or the results
from protocol survey electrofishing to identify the regulatory F/N break. Landowners are
encouraged to submit a Water Type Modification Form (WTMF) to the DNR to make permanent
changes to the water type maps. Thousands of WTMF have been submitted to DNR to modify
Potential Habitat Breaks Study Plan
2
water body types and modify the location of the break between Type F and Type N waters. The
process for submitting and getting water type approved is outlined includes the following steps:
1. Proponent conducts a “protocol electrofishing survey”
2. Proponent submits a WTMF
3. DNR and reviewers concur/don’t concur
a. If DNR and reviewers concur, the water type modification is approved
b. If DNR and reviewers don’t concur, a site visit is organized to adjust and determine the
F/N break
The Board is currently in the process of establishing a permanent water typing rule. Ultimately,
the rule must be implementable, repeatable, and enforceable by practitioners and regulators
involved in the water typing system. An important part of the permanent rule will be guidance
on a specific protocol to determine the regulatory break between Type F and Type N waters. The
Board is considering the use of a fish habitat assessment method that incorporates known fish
use with potential habitat breaks (PHBs) to identify features that can be used to locate the
starting location for a survey of fish use and the end point of waters to be protected for fish
habitat. These PHBs are based upon changes in gradient, stream size, and the presence of vertical
and non‐vertical barriers to migration (e.g., obstacles).
Over the past 20 years, protocol electrofishing surveys have been conducted under WAC 222‐16‐
031 with guidance provided by Board Manual Section 13 to determine the upper extent of Type
F waters. These fish presence surveys have incorporated additional stream length (defined in
WAC 222‐16‐010) to capture habitat that was “likely to be used by fish” upstream of the detected
uppermost fish during a protocol survey. Throughout Washington, the uppermost‐fish detected
is most often a salmonid. In over 90% of cases the uppermost fish is a cutthroat trout
Oncorhynchus clarki (D. Collins, Washington Department of Natural Resources, unpublished
data). Other salmonid species that have been recorded at uppermost fish locations across
Washington include rainbow trout O. mykiss, brook trout Salvelinus fontinalis (an introduced
non‐native that has become established in many Washington streams), and (rarely) bull trout S.
confluentus. In headwater reaches that are accessible to anadromous fishes, coho salmon O.
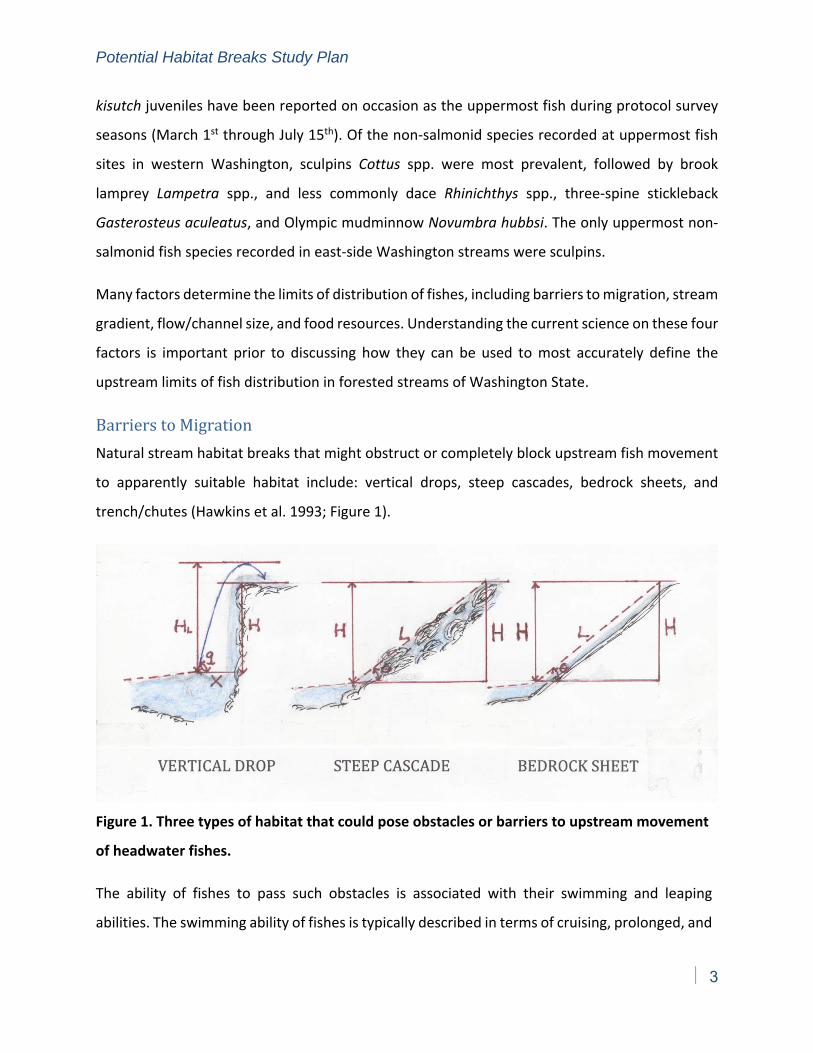
Potential Habitat Breaks Study Plan
3
kisutch juveniles have been reported on occasion as the uppermost fish during protocol survey
seasons (March 1st through July 15th). Of the non‐salmonid species recorded at uppermost fish
sites in western Washington, sculpins Cottus spp. were most prevalent, followed by brook
lamprey Lampetra spp., and less commonly dace Rhinichthys spp., three‐spine stickleback
Gasterosteus aculeatus, and Olympic mudminnow Novumbra hubbsi. The only uppermost non‐
salmonid fish species recorded in east‐side Washington streams were sculpins.
Many factors determine the limits of distribution of fishes, including barriers to migration, stream
gradient, flow/channel size, and food resources. Understanding the current science on these four
factors is important prior to discussing how they can be used to most accurately define the
upstream limits of fish distribution in forested streams of Washington State.
Barriers to Migration
Natural stream habitat breaks that might obstruct or completely block upstream fish movement
to apparently suitable habitat include: vertical drops, steep cascades, bedrock sheets, and
trench/chutes (Hawkins et al. 1993; Figure 1).
Figure 1. Three types of habitat that could pose obstacles or barriers to upstream movement
of headwater fishes.
The ability of fishes to pass such obstacles is associated with their swimming and leaping
abilities. The swimming ability of fishes is typically described in terms of cruising, prolonged, and
Potential Habitat Breaks Study Plan
4
burst speed, which are measured in units of body lengths per second (Watts 1974; Beamish
1978; Webb 1984; Bell 1991; Hammer 1995). Cruising speed is the speed a fish can sustain
essentially indefinitely without fatigue or stress, usually 2–4 body lengths per second. Cruising
speed is used during normal migration or movements through gentle currents or low gradient
reaches. Prolonged speed (also called sustained speed) is the speed a fish can maintain for a
period of several minutes to less than an hour before fatiguing; typically 4–7 body lengths per
second. Prolonged swimming speed is used when a fish is confronted with more robust currents
or moderate gradients. Burst speed is the speed a fish can maintain for only a few seconds
without fatigue, typically 8–12 body lengths per second. Fish typically accelerate to burst speed
when necessary to ascend the short, swiftest, steepest sections of a stream, to leap obstacles,
or avoid predators.
Swimming ability is influenced by environmental factors such as temperature, ontogeny, and
condition. Body form can also affect swimming ability, with more fusiform body shapes being
advantageous for stronger burst speeds in fishes such as cutthroat and rainbow trout (Bisson et al.
1988; Hawkins and Quinn 1996) rather than other fishes.
When leaping obstacles, fish come out of the water at burst velocity and move in a parabolic
trajectory (Powers and Orsborn 1985). Relationships for the height attained in the leap, and the
horizontal distance traversed to the point of maximum height are often used to assess barriers.
Depth at the point of takeoff is important for enabling fish to reach burst velocity. Stuart (1962)
found water depth of at least 1.25 times the height of an obstacle to be required for successful
upstream barrier passage. More recently, however, Kondratieff and Myrick (2006) reported that
small brook trout (size range 100‐150 mm) could jump vertical waterfalls as high as 4.7 times their
body length from plunge pools only 0.78 times the obstacle height, and larger brook trout (size
ranges 150‐200 mm and 200 mm+) could jump waterfalls with heights 3 to 4 times their body length
if the plunge pool depth was at least 0.54 times the obstacle height.
To successfully ascend 4.7 body lengths in height, a back‐calculation from the Powers and Orsborn
(1985) trajectory equation yields a burst speed of 22 body lengths per second (11.7 feet per second)
for the 100‐150 mm body‐length brook trout reported by Kondratieff and Myrick (2006). If it is
Potential Habitat Breaks Study Plan
5
assumed that other salmonids (e.g., cutthroat, rainbow trout or coho salmon) could perform as well
as brook trout in the size range typically found at uppermost fish locations in Washington (Sedell et
al. 1982; Fransen et al. 1998; Liquori 2000; Latterell et al. 2003; Peterson et al. 2013), then a burst
speed of 22 body lengths per second (11.7 feet per second) would allow the largest fishes in the size
range typical of headwater‐dwelling salmonids (160 mm) to leap a vertical obstacle 2.6 feet high,
whereas a vertical obstacle of 3 feet high would be impassable.
When leaping is not required, fishes may ascend steep cascades and other high‐velocity habitat units
(Hawkins et al. 1993) by seeking pockets of slow water interspersed in areas with turbulent flow (e.g.,
boundary layers near rocks or logs). The average water velocity measured in cascade habitat units in
small western Washington streams by Bisson et al. (1988) was only 24.8 ± 3.2 cm/s, or about 0.8 ft/s.
Average water depth in these same cascades was 10.0 ± 1.4 cm, or about 4 inches. It is possible that
fish may ascend streams during periods of elevated flow by moving along the channel margins where
water velocities are reduced relative to mid‐stream and small falls and boulder cascades are partially
or completely submerged.
Although studies examining fish migration through potential non‐vertical obstacles are rare, a small
number of studies have examined brook trout movement through steep cascades and reported fish
ascending cascades of more than 20% gradient (Moore et al. 1985; Adams et al. 2000; Björkelid
2005). For example, Adams et al. (2000) reported that adult brook trout ascended cascades with
slopes of 13% that extended for more than 67 m, and 22% for more than 14 m as well as adult brook
trout ascending a waterfall 1.2m high. Similarly, Björkelid (2005) reported invasive brook trout
colonizing 18 headwater streams in Sweden and found they ascended stream segments of 22%
measured with a clinometer and 31% measured with GIS.
Gradient
In Washington streams, fish (not necessarily the uppermost fish) have been observed in headwater
segments with overall slopes as steep as 31% (S. Conroy, formerly Washington Trout [now Wild Fish
Conservancy], unpublished data), 35% (J. Silver, Hoh Indian Tribe, unpublished data; D. Collins,
Washington Department of Natural Resources, unpublished data), and in reach gradients of 25% and
steeper in Oregon streams (C. Andrus, Oregon Department of Forestry, unpublished data; Connolly
Potential Habitat Breaks Study Plan
6
and Hall 1999). This range of channel steepness is consistent with other observations in western
North America (e.g., Fausch 1989; Ziller 1992; Kruse et al. 1997; Watson and Hillman 1997; Dunham
et al. 1999; Hastings et al. 2005; Bryant et al. 2004, 2007) and Europe (Huet 1959). In the “trout
zones” of European rivers (headwaters), brown trout Salmo trutta predominate and reach gradients
may be 10 to 25% or steeper (Huet 1959; Watson 1993). In Washington, it is important to note that
fish presence in streams steeper than 15% accounted for only 10% of reported occurrences in
forested streams (Cole et al. 2006; J. T. Light, Plum Creek Timber, unpublished data). However, these
observations clearly establish that fish habitat in headwater streams extends into steep step‐pool
and cascade reach types (Montgomery and Buffington 1993).
In steep step‐pool and cascade reaches, habitat use by fishes may be different from the pool‐riffle
reaches further downstream. For example, in streams of low to moderate gradient and well‐
developed pool‐riffle sequences (Montgomery and Buffington 1993; 1997), gravels are usually
relatively abundant. In steep, typically boulder‐bed reaches where the uppermost fish are often
found, pool‐riffle sequences are generally absent, gravels are less abundant, and gravels that are
present are confined to small patches around wood or rock; these patterns are distinctly different
from lower gradient streams (Heede 1972; Kondolf et al. 1991). Often the water surface slopes where
fish occur in step‐pool habitats have much lower local gradients than the overall reach gradient and
may range from only 0.4 to 4%, even where overall reach gradients may be as high as 35% (Kondolf
et al. 1991; Figure 2).
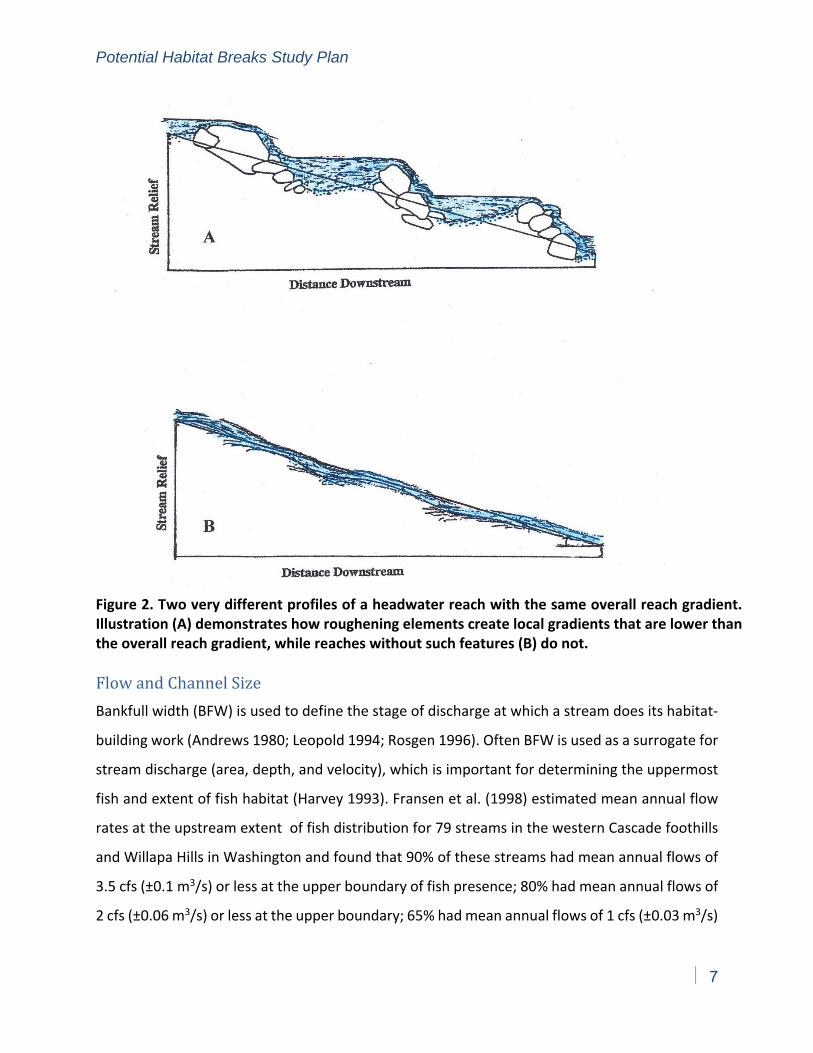
Potential Habitat Breaks Study Plan
7
Figure 2. Two very different profiles of a headwater reach with the same overall reach gradient. Illustration (A) demonstrates how roughening elements create local gradients that are lower than the overall reach gradient, while reaches without such features (B) do not.
Flow and Channel Size
Bankfull width (BFW) is used to define the stage of discharge at which a stream does its habitat‐
building work (Andrews 1980; Leopold 1994; Rosgen 1996). Often BFW is used as a surrogate for
stream discharge (area, depth, and velocity), which is important for determining the uppermost
fish and extent of fish habitat (Harvey 1993). Fransen et al. (1998) estimated mean annual flow
rates at the upstream extent of fish distribution for 79 streams in the western Cascade foothills
and Willapa Hills in Washington and found that 90% of these streams had mean annual flows of
3.5 cfs (±0.1 m3/s) or less at the upper boundary of fish presence; 80% had mean annual flows of
2 cfs (±0.06 m3/s) or less at the upper boundary; 65% had mean annual flows of 1 cfs (±0.03 m3/s)
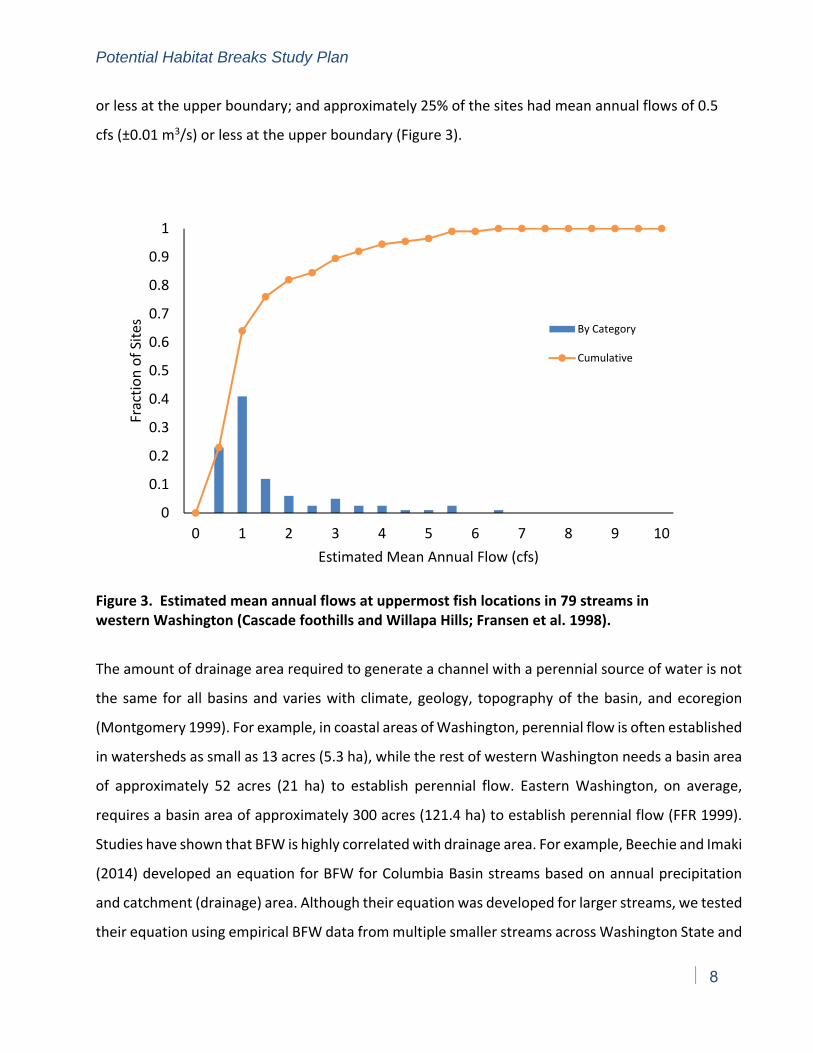
Potential Habitat Breaks Study Plan
8
or less at the upper boundary; and approximately 25% of the sites had mean annual flows of 0.5
cfs (±0.01 m3/s) or less at the upper boundary (Figure 3).
Figure 3. Estimated mean annual flows at uppermost fish locations in 79 streams in western Washington (Cascade foothills and Willapa Hills; Fransen et al. 1998).
The amount of drainage area required to generate a channel with a perennial source of water is not
the same for all basins and varies with climate, geology, topography of the basin, and ecoregion
(Montgomery 1999). For example, in coastal areas of Washington, perennial flow is often established
in watersheds as small as 13 acres (5.3 ha), while the rest of western Washington needs a basin area
of approximately 52 acres (21 ha) to establish perennial flow. Eastern Washington, on average,
requires a basin area of approximately 300 acres (121.4 ha) to establish perennial flow (FFR 1999).
Studies have shown that BFW is highly correlated with drainage area. For example, Beechie and Imaki
(2014) developed an equation for BFW for Columbia Basin streams based on annual precipitation
and catchment (drainage) area. Although their equation was developed for larger streams, we tested
their equation using empirical BFW data from multiple smaller streams across Washington State and
0
0.1
0.2
0.3
0.4
0.5
0.6
0.7
0.8
0.9
1
0 1 2 3 4 5 6 7 8 9 10
Fraction of Sites
Estimated Mean Annual Flow (cfs)
By Category
Cumulative
Potential Habitat Breaks Study Plan
9
found that it accurately predicted BFW in headwater streams. This indicates that BFW serves as a
good proxy for catchment/drainage area.
Food Resources
Many studies, particularly in Pacific Northwest streams, have demonstrated strong food
limitations for fish inhabiting (using) small streams (Warren et al. 1964; Mason 1976; Naiman and
Sedell 1980; Bisson and Bilby 1998). Headwater segments are often characterized by closed
forest canopies, requiring primary energy sources from allochthonous inputs of coarse
particulate organic matter (CPOM). Shredder organisms occur in these reaches and feed on this
CPOM. These aquatic organisms, along with any terrestrial invertebrates that fall into the stream,
comprise the food base for trout and other predators (Vannote et al. 1980; Hawkins and Sedell
1981; Triska et al. 1982; Wipfli 1997). The total production of macroinvertebrate organisms is
substantially lower in small headwater stream reaches than in the larger, lower‐gradient reaches
further downstream (Northcote and Hartmann 1988; Haggerty et al. 2004). As a result, resident
fishes in headwater stream reaches tend to be small bodied, which limits their ability to negotiate
obstacles to upstream movement and migration.
Fish Habitat Assessment Method (FHAM)
Water typing surveyors have used professional judgment to estimate “habitat likely to be used
by fish” when proposing regulatory fish bearing/non‐fish bearing water (F/N) breaks. Stream
segments that are accessible to fish and exhibit the same characteristics to those of fish‐bearing
reaches are typically assumed to be fish habitat, whether or not fish are present at the time of a
survey. Surveyors have assessed barriers and measurable changes in stream size and/or gradient
to estimate the EOF habitat (Cupp 2002; Cole et al. 2006). Although research is somewhat limited,
the upstream extent of fish distribution in forest lands appears to be strongly influenced by
stream size, channel gradient, and access to suitable habitat (Fransen et al. 2006; PHB Science
Panel 2018). In response to these findings, the Board adopted a methodology (FHAM) intended
to be repeatable, implementable, and enforceable. The FHAM describes PHBs that reflect a
change in the reach characteristics to provide a last detected fish point above which a protocol
electrofishing survey would be undertaken (Figure 4).
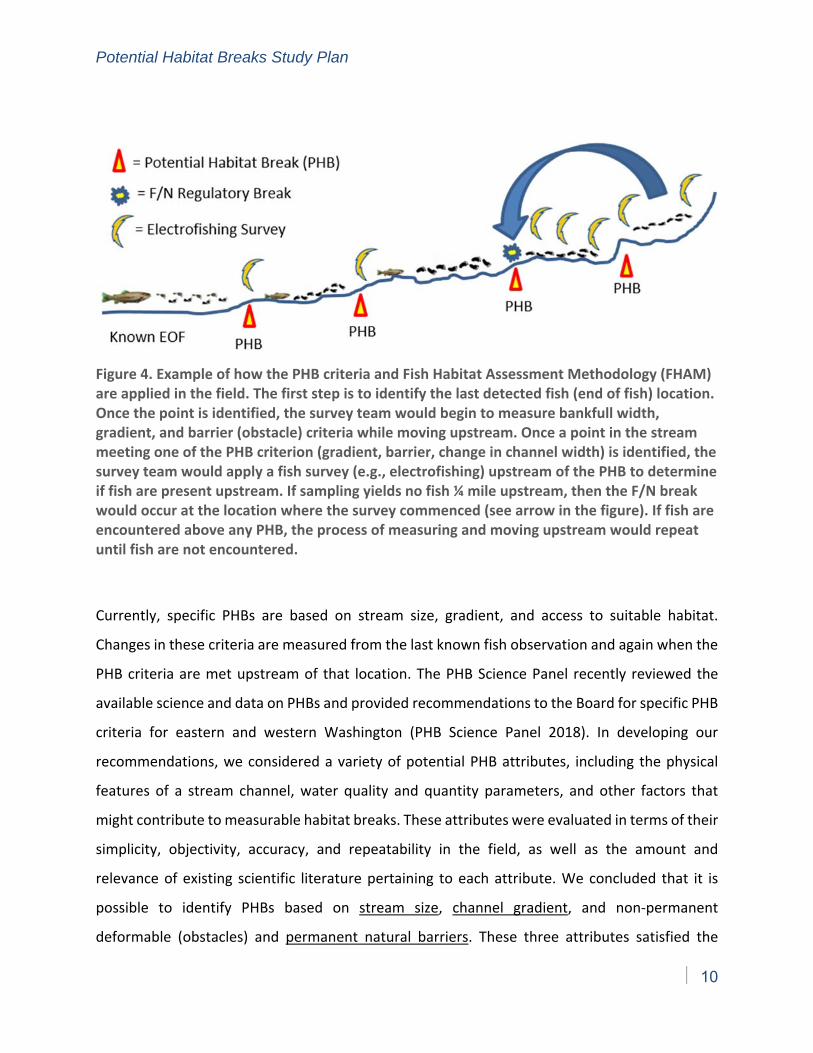
Potential Habitat Breaks Study Plan
10
Figure 4. Example of how the PHB criteria and Fish Habitat Assessment Methodology (FHAM) are applied in the field. The first step is to identify the last detected fish (end of fish) location. Once the point is identified, the survey team would begin to measure bankfull width, gradient, and barrier (obstacle) criteria while moving upstream. Once a point in the stream meeting one of the PHB criterion (gradient, barrier, change in channel width) is identified, the survey team would apply a fish survey (e.g., electrofishing) upstream of the PHB to determine if fish are present upstream. If sampling yields no fish ¼ mile upstream, then the F/N break would occur at the location where the survey commenced (see arrow in the figure). If fish are encountered above any PHB, the process of measuring and moving upstream would repeat until fish are not encountered.
Currently, specific PHBs are based on stream size, gradient, and access to suitable habitat.
Changes in these criteria are measured from the last known fish observation and again when the
PHB criteria are met upstream of that location. The PHB Science Panel recently reviewed the
available science and data on PHBs and provided recommendations to the Board for specific PHB
criteria for eastern and western Washington (PHB Science Panel 2018). In developing our
recommendations, we considered a variety of potential PHB attributes, including the physical
features of a stream channel, water quality and quantity parameters, and other factors that
might contribute to measurable habitat breaks. These attributes were evaluated in terms of their
simplicity, objectivity, accuracy, and repeatability in the field, as well as the amount and
relevance of existing scientific literature pertaining to each attribute. We concluded that it is
possible to identify PHBs based on stream size, channel gradient, and non‐permanent
deformable (obstacles) and permanent natural barriers. These three attributes satisfied the
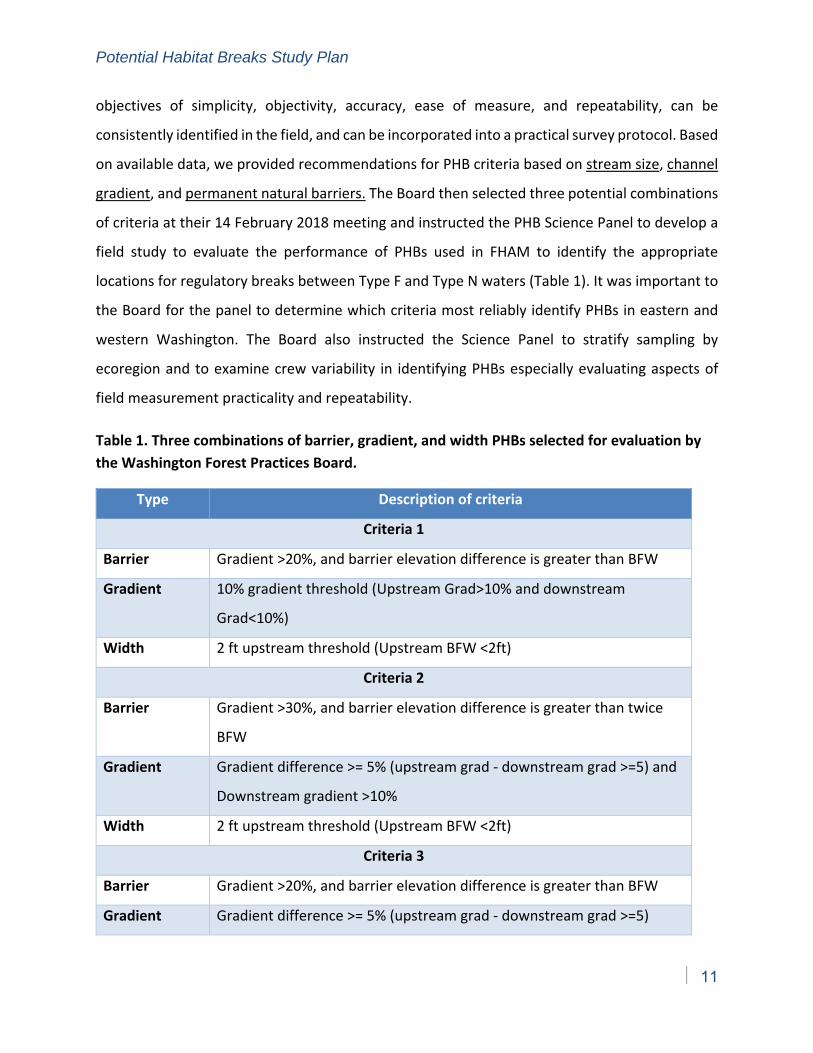
Potential Habitat Breaks Study Plan
11
objectives of simplicity, objectivity, accuracy, ease of measure, and repeatability, can be
consistently identified in the field, and can be incorporated into a practical survey protocol. Based
on available data, we provided recommendations for PHB criteria based on stream size, channel
gradient, and permanent natural barriers. The Board then selected three potential combinations
of criteria at their 14 February 2018 meeting and instructed the PHB Science Panel to develop a
field study to evaluate the performance of PHBs used in FHAM to identify the appropriate
locations for regulatory breaks between Type F and Type N waters (Table 1). It was important to
the Board for the panel to determine which criteria most reliably identify PHBs in eastern and
western Washington. The Board also instructed the Science Panel to stratify sampling by
ecoregion and to examine crew variability in identifying PHBs especially evaluating aspects of
field measurement practicality and repeatability.
Table 1. Three combinations of barrier, gradient, and width PHBs selected for evaluation by
the Washington Forest Practices Board.
Type Description of criteria
Criteria 1
Barrier Gradient >20%, and barrier elevation difference is greater than BFW
Gradient 10% gradient threshold (Upstream Grad>10% and downstream
Grad<10%)
Width 2 ft upstream threshold (Upstream BFW <2ft)
Criteria 2
Barrier Gradient >30%, and barrier elevation difference is greater than twice
BFW
Gradient Gradient difference >= 5% (upstream grad ‐ downstream grad >=5) and
Downstream gradient >10%
Width 2 ft upstream threshold (Upstream BFW <2ft)
Criteria 3
Barrier Gradient >20%, and barrier elevation difference is greater than BFW
Gradient Gradient difference >= 5% (upstream grad ‐ downstream grad >=5)
Potential Habitat Breaks Study Plan
12
Width 20% loss in width. Upstream to downstream width ratio <=.8
Study Purpose
The purpose of this study is to develop criteria for accurately identifying PHBs and to evaluate
the utility of PHB criteria selected by the Board for use in the FHAM as part of a water typing rule.
The study is designed to 1) determine which combinations of gradient, channel width, barriers to
migration, and other physical habitat and geomorphic conditions of the Board identified PHB
criteria best identifies last detected fish location in an objective and repeatable manner2 as
applied in the FHAM and 2) evaluate if a set or combination of empirically derived criteria are
better at identifying the starting point at which a protocol survey would begin. Additionally, this
study is intended to provide insight into how last detected fish points, EOF habitat, and PHBs
proposed by the Washington Forest Practice Board may vary across ecoregions, seasons, and
years. The study will evaluate the PHB criteria selected by the Board to be used in FHAM as part
of a water‐typing rule and explore potentially useful attributes that may help to more accurately
describe PHB (Table 1). It is designed to identify PHB criteria that can be used to identify EOF
habitat in forested streams across Washington and to better understand how PHBs may be
influenced by seasonal and annual variability and by location within Washington State (e.g.,
reduce uncertainty). The overall goal is to test the reliability of PHB criteria as an aid in identifying
EOF habitat in an objective and repeatable manner3
It is important to note that this study is not intended to evaluate the water typing system, the
FHAM, or describe how the regulatory Type F/N break should be determined. Other factors such
as temperature, flow, water quality, and biological interactions are important covariates that
influence the distribution of fishes but do not affect PHBs. Therefore, they are not included in
this study.
2 While the study will gather considerable information on fish distribution, it is not a long‐term (>25 years) study on the upper limits of fish distribution per se. 3 While the study will gather considerable information on fish distribution, it is not a long‐term (>25 years) study on the upper limits of fish distribution per se.
Potential Habitat Breaks Study Plan
13
Study Questions
This study is designed to answer the following questions:
Do the PHB criteria provided by the Washington Forest Practices Board accurately capture
the EOF habitat when applied in the Fish Habitat Assessment Methodology (FHAM)?
Based on data collected, what is the most accurate combination of metrics for
determining PHB by region or ecoregion?
Are there differences in PHB criteria by Environmental Protection Agency (EPA) Level III
ecoregion, eastern vs western Washington, or some other geographic or landscape
strata?
Are there additional variables (e.g., geology, drainage area, valley width, land use, channel
type, and stand age) that could improve the accuracy of existing criteria?
What is the influence of season/timing of survey on PHB identification?
What is the typical inter‐annual variability in last detected fish and PHBs?
Can protocols used to describe PHB be consistently applied among survey crews and be
expected to provide similar results in practice?
Answering these questions requires identifying the last detected fish and surveying habitat above
and below these points in a random representative sample of streams across the state.
Methods
Study Design
We propose to determine the location of last detectable fish at 245 sites in forested watersheds
of EPA Level III ecoregions across Washington State and measure the habitat characteristics
(gradient, channel width, barriers) using a long‐profile survey 200 m above and 100 m below the
last detected fish. These surveys will provide the data necessary to evaluate differences among
PHB criteria across ecoregions. Based on variability in the data examined from existing water type
modification forms (WTMFs) that includes information on gradient, channel width, and barriers,
we estimate that a sample size of 35 sites per ecoregion will be needed to determine if there are
differences among ecoregions. Sample sizes were estimated from data on upstream and
Potential Habitat Breaks Study Plan
14
downstream changes in gradient surrounding end of fish points for the “Coast Range” ecoregion.
We felt these data, which were collected using similar methods, accurately represent the
variability we will encounter during the proposed PHB study. Because the data showed a non‐
parametric distribution, we estimated minimum sample sizes for each ecoregion using three
approaches: power estimates for t‐tests, samples required to estimate the mean, and a
bootstrapping routine to estimate samples for non‐parametric tests (Wilcoxon and Kolmogorov‐
Smirnov). All three methods suggested that a sample size of approximately 35 or more sites was
needed to detect differences among ecoregions (See Appendix A for details). We would expect
that data collected with consistent methods and crews would have lower variability than the
WTMF data we used to estimate sample size. This was supported from data collected under the
pilot study, which had lower variance around gradient and change in gradient seen than the
WTMF data and suggested a sample size of 35 sites per ecoregion was appropriate.
Existing water type modification (WTM) data show geographic differences in the PHB criteria and
F/N breaks for gradient, channel width, and barriers between eastern and western Washington
and in some cases ecoregions. Ecoregions are defined by unique combinations of variables such
as geology, climate, landforms, and vegetation that can be clustered geographically, reflecting
ecosystem conditions (Omernik 1987)4. While there are nine EPA Level III ecoregions in
Washington State, the Columbia Plateau ecoregion has little forest cover and only a small portion
the Willamette ecoregion is in Washington State, leaving seven ecoregions in our proposed study.
Site Identification
The DNR database includes data layers of all modeled F/N breaks for all streams in the state of
Washington as well as more than 28,000 points where a WTMF was submitted to modify the
water type. The modeled F/N breaks include hundreds of thousands of potential breaks across
the landscape. However, it is currently unclear whether these points are accessible or how
accurate they are in terms of above and below end of fish. For our study, this uncertainty creates
4 We considered other finer scale stratification (e.g., geology, channel type, elevation, valley confinement), but these were not logistically feasible and would greatly increase the sample size, cost and time needed to complete the study. The Washington Forest Practices Board also instructed the PHB Science Panel to develop a study plan that specifically included stratification by ecoregion.
Potential Habitat Breaks Study Plan
15
many logistical issues for field crews (e.g., land ownership, access points, roads) that could make
field sampling of these points extremely costly. Moreover, more than a thousand water type
modifications are submitted every year to correct modeled F/N breaks and DNR water type maps.
The DNR’s water typing database contains over 28,000 stream location points that have been
visited over the past 15 years to establish the F/N regulatory break on state, private, and in some
cases, federal lands. We propose to select a stratified random sample of these points to choose
sites for this study. These sites have verified F/N breaks and information that in some cases
includes monumented benchmarks in the field identifying specifically where the last detected
fish was located on a particular date. We propose to revisit these sites annually for three years
to clarify how the location of the last detected fish may change over short (months to 3 years)
and longer (> 3 years) periods and how those locations may change under a variety of physical
disturbances and weather conditions. While the WTMFs will be used to help screen potential
sites, the habitat data in the WTMFs have been shown to be inconsistently collected and not
usable for this study.
Our plan is to sample 35 randomly selected suitable sites annually in each ecoregion over the
course of this 3‐year study (Figure 5). We suspect that many randomly drawn WTM points will
not be suitable for this study for a variety of reasons, including problems associated with access
(e.g., landownership, road failures, etc.), manmade barriers, potential upstream source
populations, or active timber harvest activities near the riparian management zone. We will
randomly select a group of 100 WTM points in each region to be used in a consecutive sampling
frame (See Appendix B).
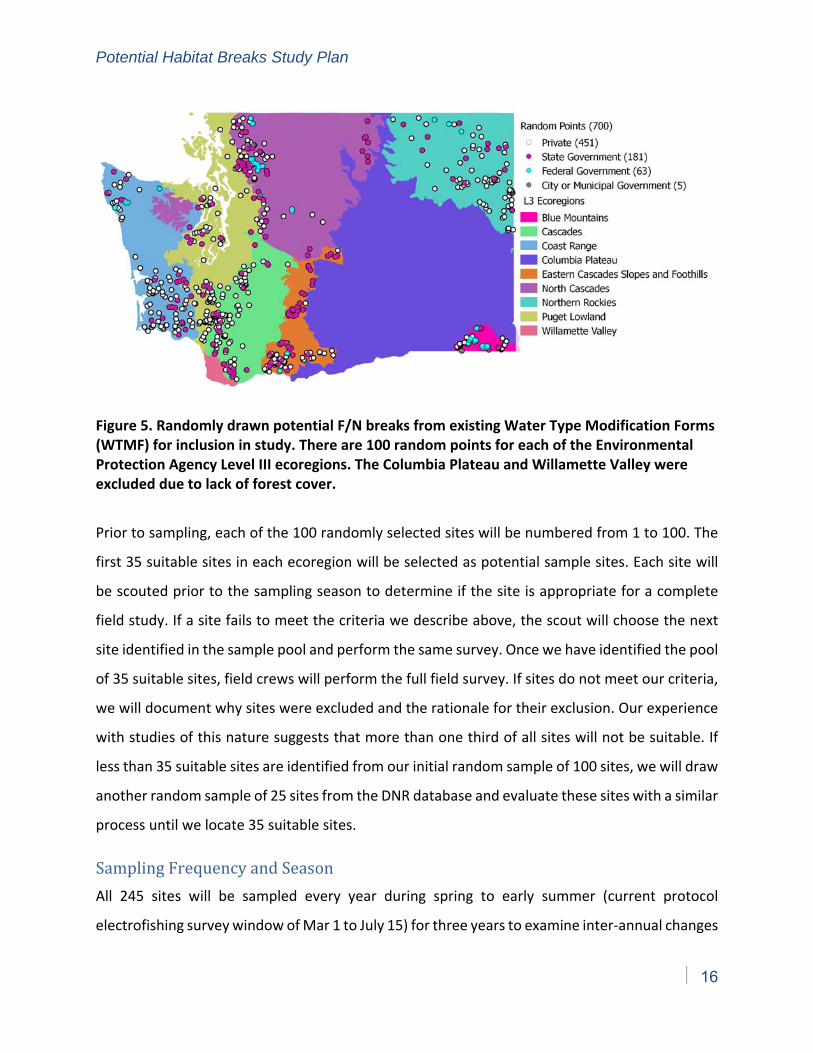
Potential Habitat Breaks Study Plan
16
Figure 5. Randomly drawn potential F/N breaks from existing Water Type Modification Forms (WTMF) for inclusion in study. There are 100 random points for each of the Environmental Protection Agency Level III ecoregions. The Columbia Plateau and Willamette Valley were excluded due to lack of forest cover.
Prior to sampling, each of the 100 randomly selected sites will be numbered from 1 to 100. The
first 35 suitable sites in each ecoregion will be selected as potential sample sites. Each site will
be scouted prior to the sampling season to determine if the site is appropriate for a complete
field study. If a site fails to meet the criteria we describe above, the scout will choose the next
site identified in the sample pool and perform the same survey. Once we have identified the pool
of 35 suitable sites, field crews will perform the full field survey. If sites do not meet our criteria,
we will document why sites were excluded and the rationale for their exclusion. Our experience
with studies of this nature suggests that more than one third of all sites will not be suitable. If
less than 35 suitable sites are identified from our initial random sample of 100 sites, we will draw
another random sample of 25 sites from the DNR database and evaluate these sites with a similar
process until we locate 35 suitable sites.
Sampling Frequency and Season
All 245 sites will be sampled every year during spring to early summer (current protocol
electrofishing survey window of Mar 1 to July 15) for three years to examine inter‐annual changes
Potential Habitat Breaks Study Plan
17
in last detected fish. In addition, one third of all sites will be resampled each year during summer
low flow (July 16 to September 30) and fall to early winter (October 1 to December 31) (Table 2)
to evaluate seasonal changes in last detected fish. A minimum time span of 30 days will lapse
between sampling at the same sampling location. Winter sampling would also be beneficial, but
because of snow and access issues, it will not be feasible at most locations. Seasonal sampling
sites will be randomly selected from the 245 sites for each year across ecoregions. All sites will
receive summer and fall sampling in at least one year. Of the 60 randomly selected sites sampled
seasonally (summer low flow through early winter) in all three years 30 sites will be in ecoregions
east of the cascades and 30 will be west of the cascades ) to allow examination of seasonal
variation through time (Table 2).
Protocol Electrofishing and Habitat Surveys
Prior to sampling a site, crews will review existing information from the WTMF on access,
previous location of last detected fish and habitat data, and obtain landowner permission for
access and sampling. Field crews will use DNR protocol electrofishing surveys to determine last
detected fish (DNR 2002)5 (Figure 6a). The GPS coordinates of each last detected fish location will
be recorded, and the location will be flagged and monumented with a marker including the
survey date on an adjacent tree. The fish species and approximate sizes will be recorded. The
crew will measure 100 m downstream using a tape measure or hip‐chain to determine the
beginning point for the stream habitat survey.
Table 2. Overall sampling schedule by calendar year and season 2018 to 2022. All sites will be
sampled in spring to early summer (March 1 to July 15) with 1/3 of sites each year being
resampled in late summer (July 16 to September 30) and fall to early winter (October 1 to
5 This includes electrofishing ¼ mile above the last known fish location to ensure that no fish are found above this point, as well as confirming there is no “perched habitat” or ponds or lakes containing fish above this point. In many cases, due to the size of these streams, ¼ mile extends to perennial flow initiation and the end of an actual stream channel.
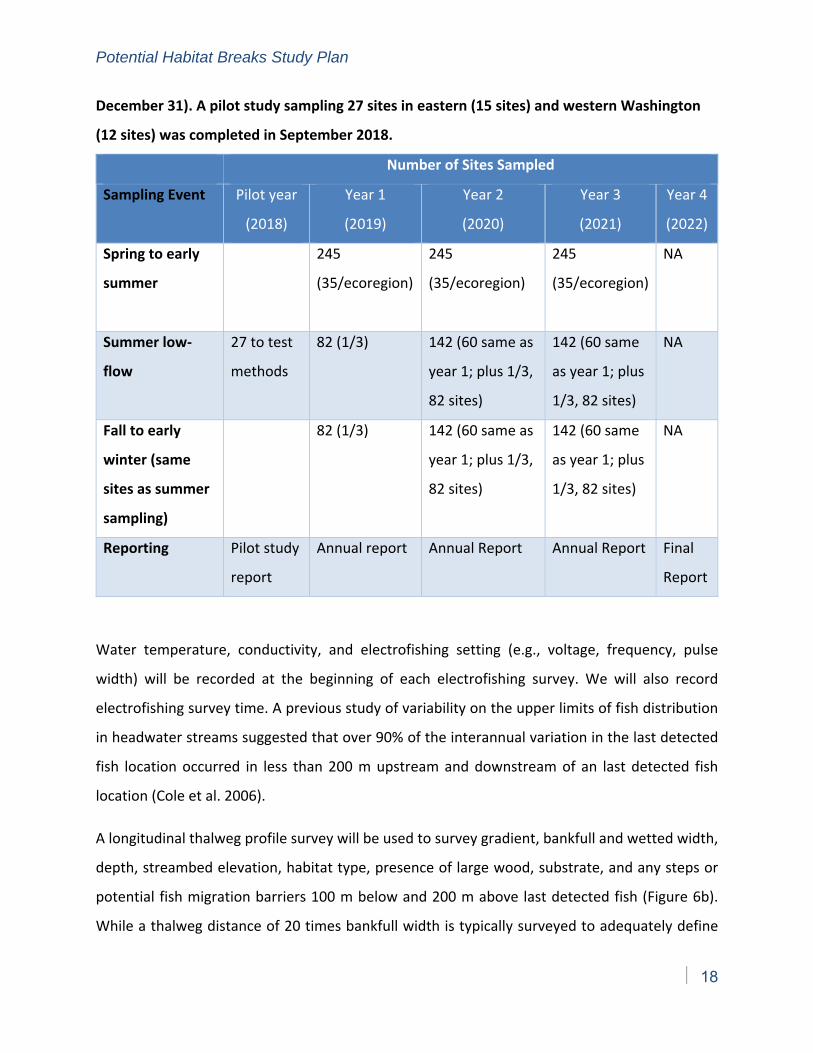
Potential Habitat Breaks Study Plan
18
December 31). A pilot study sampling 27 sites in eastern (15 sites) and western Washington
(12 sites) was completed in September 2018.
Number of Sites Sampled
Sampling Event Pilot year
(2018)
Year 1
(2019)
Year 2
(2020)
Year 3
(2021)
Year 4
(2022)
Spring to early
summer
245
(35/ecoregion)
245
(35/ecoregion)
245
(35/ecoregion)
NA
Summer low‐
flow
27 to test
methods
82 (1/3) 142 (60 same as
year 1; plus 1/3,
82 sites)
142 (60 same
as year 1; plus
1/3, 82 sites)
NA
Fall to early
winter (same
sites as summer
sampling)
82 (1/3) 142 (60 same as
year 1; plus 1/3,
82 sites)
142 (60 same
as year 1; plus
1/3, 82 sites)
NA
Reporting Pilot study
report
Annual report Annual Report Annual Report Final
Report
Water temperature, conductivity, and electrofishing setting (e.g., voltage, frequency, pulse
width) will be recorded at the beginning of each electrofishing survey. We will also record
electrofishing survey time. A previous study of variability on the upper limits of fish distribution
in headwater streams suggested that over 90% of the interannual variation in the last detected
fish location occurred in less than 200 m upstream and downstream of an last detected fish
location (Cole et al. 2006).
A longitudinal thalweg profile survey will be used to survey gradient, bankfull and wetted width,
depth, streambed elevation, habitat type, presence of large wood, substrate, and any steps or
potential fish migration barriers 100 m below and 200 m above last detected fish (Figure 6b).
While a thalweg distance of 20 times bankfull width is typically surveyed to adequately define
Potential Habitat Breaks Study Plan
19
habitat (Harrelson et al. 1994; Rosgen 1994), this may not provide an adequate sample reach in
small streams (<2 m wide). Instead, we will use a distance of 200 m above and 100 m below the
last detected fish. This approach involves surveying the streambed elevation along the deepest
portion of the stream (the thalweg), yielding a two‐dimensional longitudinal profile of streambed
elevations and has been shown to be a reliable and consistent method for measuring change in
stream morphology and fish habitat independent of flow (Mossop and Bradford 2006). The
survey is designed to capture changes in bed topography and habitat types by surveying more
points in reaches that have more variable bed morphology. Rather than fixed distances, inflection
points in topography are surveyed to capture changes in thalweg topography and gradient.
Typically, 40 or more locations along the thalweg will be measured to adequately capture
topographic changes within a 100‐m reach. A laser range finder mounted on a monopod and a
target on a second monopod will be used to collect distance and elevation data. All data will be
entered into a computer tablet in the field. Measurements at each point will include depth,
wetted widths, bankfull width, substrate size (i.e., boulder, cobble, gravel, sand, or less than
sand), and habitat type (i.e., cascade, riffle, glide, or pool). Pools will be defined by minimum size
and residual pool depth criteria (Pleus et al. 1999). All points or inflection points that meet the
PHB criteria determined by the Board will be noted. For steps and potential migration barriers,
the crew will record whether the step is formed by wood, bedrock, or another substrate. The
presence of wood is particularly important because wood‐formed barriers are considered
deformable barriers and are not PHBs. Crews will also note whether flow is continuous or
intermittent, the presence of beaver dams, groundwater inputs, and any other unusual features
that could influence fish distribution. Because sites will generally be in small constrained streams
that are unlikely to change significantly throughout the sampling year, it is likely that the habitat
survey data for each stream will only need to be collected once each year. However, if the last
detected fish point moves significantly (>20 m) from one season to the next, the survey will be
repeated to assure we have a complete survey 200 m above and 100 m below the last detected
fish found during each sampling event (Figure 6c). A similar protocol based on Mossop and
Bradford (2006) has been used to survey barrier removal projects on small streams throughout
the Columbia River Basin (See Appendix C for example of field protocol and data sheet)
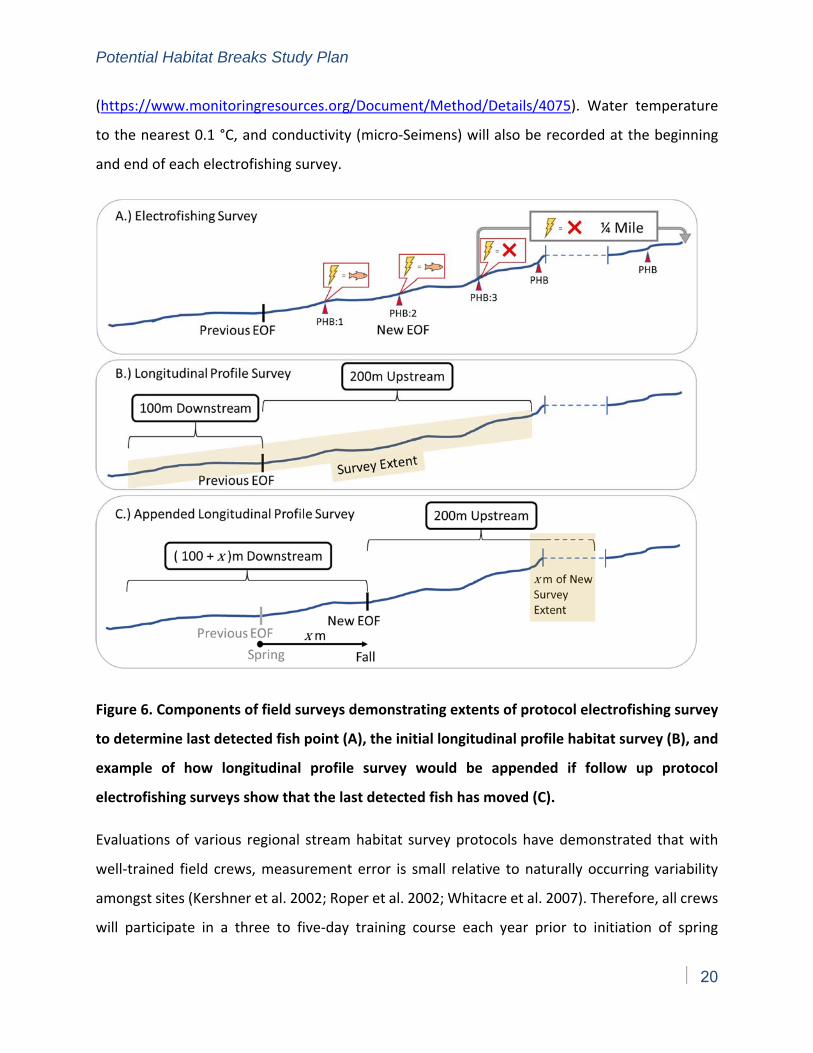
Potential Habitat Breaks Study Plan
20
(https://www.monitoringresources.org/Document/Method/Details/4075). Water temperature
to the nearest 0.1 °C, and conductivity (micro‐Seimens) will also be recorded at the beginning
and end of each electrofishing survey.
Figure 6. Components of field surveys demonstrating extents of protocol electrofishing survey
to determine last detected fish point (A), the initial longitudinal profile habitat survey (B), and
example of how longitudinal profile survey would be appended if follow up protocol
electrofishing surveys show that the last detected fish has moved (C).
Evaluations of various regional stream habitat survey protocols have demonstrated that with
well‐trained field crews, measurement error is small relative to naturally occurring variability
amongst sites (Kershner et al. 2002; Roper et al. 2002; Whitacre et al. 2007). Therefore, all crews
will participate in a three to five‐day training course each year prior to initiation of spring
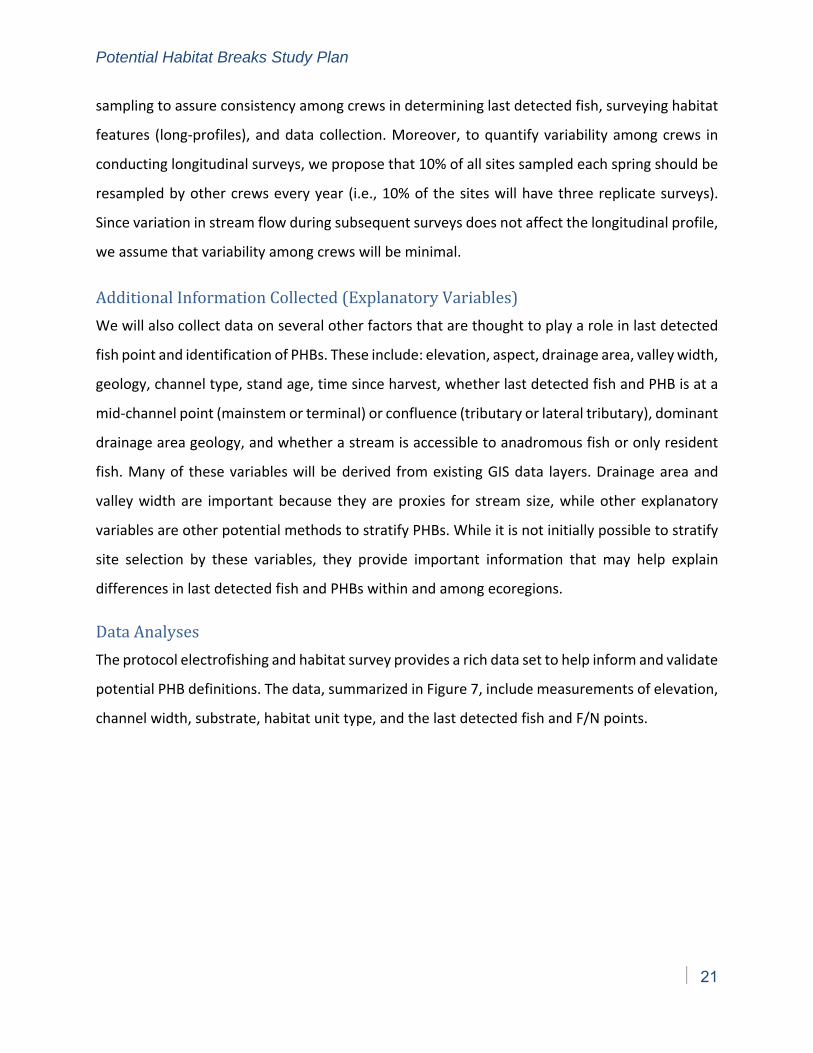
Potential Habitat Breaks Study Plan
21
sampling to assure consistency among crews in determining last detected fish, surveying habitat
features (long‐profiles), and data collection. Moreover, to quantify variability among crews in
conducting longitudinal surveys, we propose that 10% of all sites sampled each spring should be
resampled by other crews every year (i.e., 10% of the sites will have three replicate surveys).
Since variation in stream flow during subsequent surveys does not affect the longitudinal profile,
we assume that variability among crews will be minimal.
Additional Information Collected (Explanatory Variables)
We will also collect data on several other factors that are thought to play a role in last detected
fish point and identification of PHBs. These include: elevation, aspect, drainage area, valley width,
geology, channel type, stand age, time since harvest, whether last detected fish and PHB is at a
mid‐channel point (mainstem or terminal) or confluence (tributary or lateral tributary), dominant
drainage area geology, and whether a stream is accessible to anadromous fish or only resident
fish. Many of these variables will be derived from existing GIS data layers. Drainage area and
valley width are important because they are proxies for stream size, while other explanatory
variables are other potential methods to stratify PHBs. While it is not initially possible to stratify
site selection by these variables, they provide important information that may help explain
differences in last detected fish and PHBs within and among ecoregions.
Data Analyses
The protocol electrofishing and habitat survey provides a rich data set to help inform and validate
potential PHB definitions. The data, summarized in Figure 7, include measurements of elevation,
channel width, substrate, habitat unit type, and the last detected fish and F/N points.

Potential Habitat Breaks Study Plan
22
Figure 7. Example of long‐profile from a western Washington PHB pilot study site showing stream bed elevation, water surface elevation, bankfull width (BFW), and wetted width (lower panel of each figure) along the surveyed stream thalweg. Additional data collected but not shown include substrate, habitat type (pool, riffle/cascade)> For each surveyed point, we will test where the F/N break (first PHB encountered above last
detected fish) would be located under various recommended PHB definitions. We will use the
longitudinal profile from each surveyed reach to evaluate changes in gradient and channel width.
Reach gradient will be calculated using a moving window approach that evaluates gradient over
a specific length such as 20 bankfull channel widths (DNR 2004). In this way, any changes in
physical conditions upstream and downstream of the last detected fish point are scaled to the
size of the channel.
Beginning at the last detected fish point, the moving window will be used to examine the
upstream and downstream gradient and width (as well as other possible factors as determined
by PHB recommendations) to determine if these conditions meet the definition for a PHB
according to various sets of recommendations (Figure 8). For each set of PHB recommendations,
it is important that the first PHB encountered as the window moves upstream is identified under
that set of recommendations.
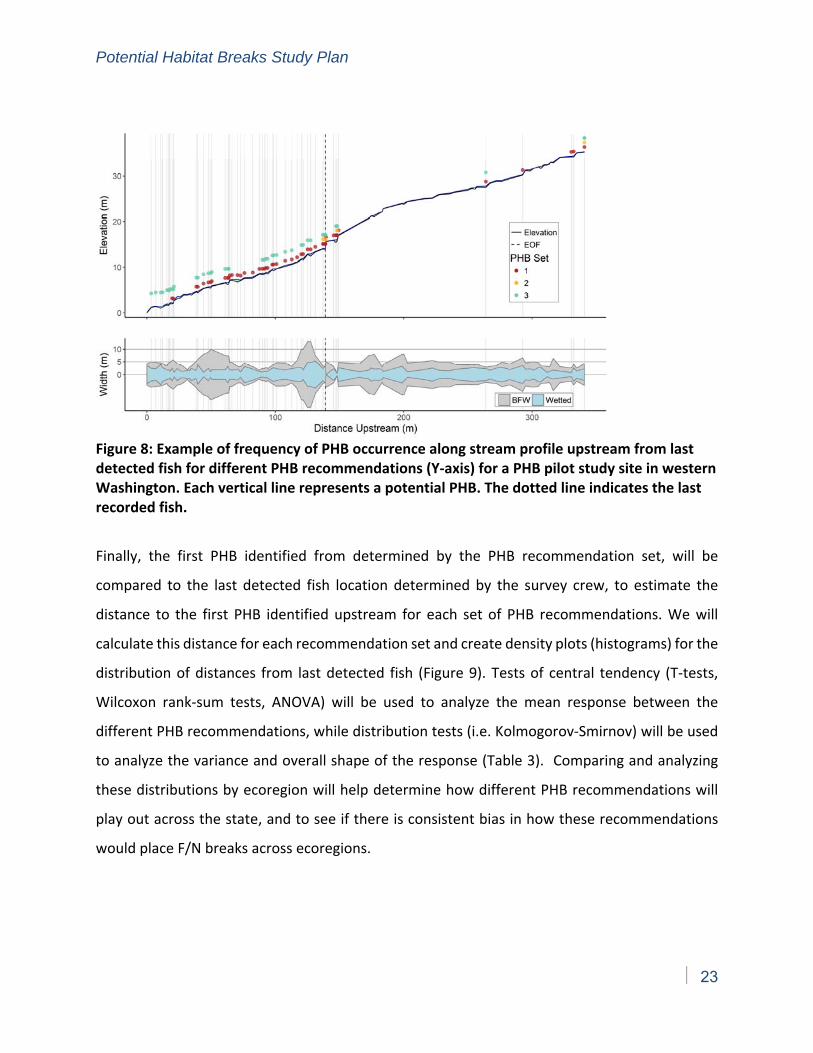
Potential Habitat Breaks Study Plan
23
Figure 8: Example of frequency of PHB occurrence along stream profile upstream from last detected fish for different PHB recommendations (Y‐axis) for a PHB pilot study site in western Washington. Each vertical line represents a potential PHB. The dotted line indicates the last recorded fish.
Finally, the first PHB identified from determined by the PHB recommendation set, will be
compared to the last detected fish location determined by the survey crew, to estimate the
distance to the first PHB identified upstream for each set of PHB recommendations. We will
calculate this distance for each recommendation set and create density plots (histograms) for the
distribution of distances from last detected fish (Figure 9). Tests of central tendency (T‐tests,
Wilcoxon rank‐sum tests, ANOVA) will be used to analyze the mean response between the
different PHB recommendations, while distribution tests (i.e. Kolmogorov‐Smirnov) will be used
to analyze the variance and overall shape of the response (Table 3). Comparing and analyzing
these distributions by ecoregion will help determine how different PHB recommendations will
play out across the state, and to see if there is consistent bias in how these recommendations
would place F/N breaks across ecoregions.
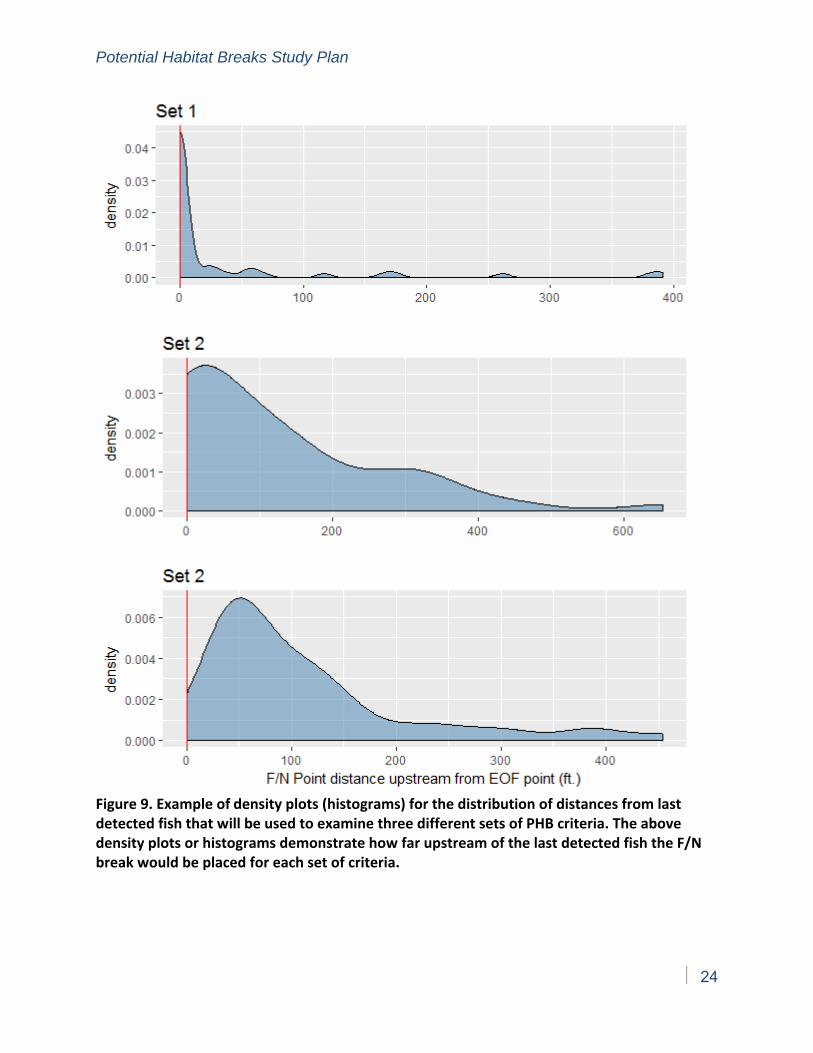
Potential Habitat Breaks Study Plan
24
Figure 9. Example of density plots (histograms) for the distribution of distances from last detected fish that will be used to examine three different sets of PHB criteria. The above density plots or histograms demonstrate how far upstream of the last detected fish the F/N break would be placed for each set of criteria.

Potential Habitat Breaks Study Plan
25
The additional information (e.g., elevation, aspect, drainage area, valley width, geology, channel
type, stand age, time since harvest) collected with surveys will be used to explore whether these
variables enhance the utility of our existing analysis and if so, which variables should be added
to a potential survey protocol. These variables will be analyzed with random forest models using
a suite of these factors in the analysis. Random forests models offer several benefits: they work
with non‐parametric data without transformations, they work well with correlated variables, and
they bin continuous data into discrete categories as part of the analysis, as opposed to arbitrary
bins assigned a priori. Moreover, since most of the explanatory variables are additional strata to
consider and random forests bin data, it is well suited for the suite of explanatory variables we
are examining. Once factors are selected, we will test for significant differences in F/N break
placement similar to the ecoregion analysis. Other exploratory tools like covariate analysis and
biplots will be used to determine whether additional factors should be considered for inclusion
in PHB determinations. This process is iterative, with a new round of analysis occurring for each
set of proposed PHB definitions.
A final objective of the study is to assess crew variability when applying protocol and surveys.
Given sample size and time required to collect data, at least three crews will be needed to collect
data. As noted previously, 10% of sites will be surveyed by all crews. To test crew variability, we
will compare longitudinal profiles collected by the crews to compare among crews the total
number of PHBs identified and the distance of PHBS from last detected fish using an ANOVA or
mixed effects model (Table 3).
Table 3. Description of data analyses procedures and statistical methods that will be used to
analyze data and answer key study questions.
Analysis Framework
Locate PHBs on measured
streams
Moving window determined by BFW to evaluate gradient and width along the collected long profile data.
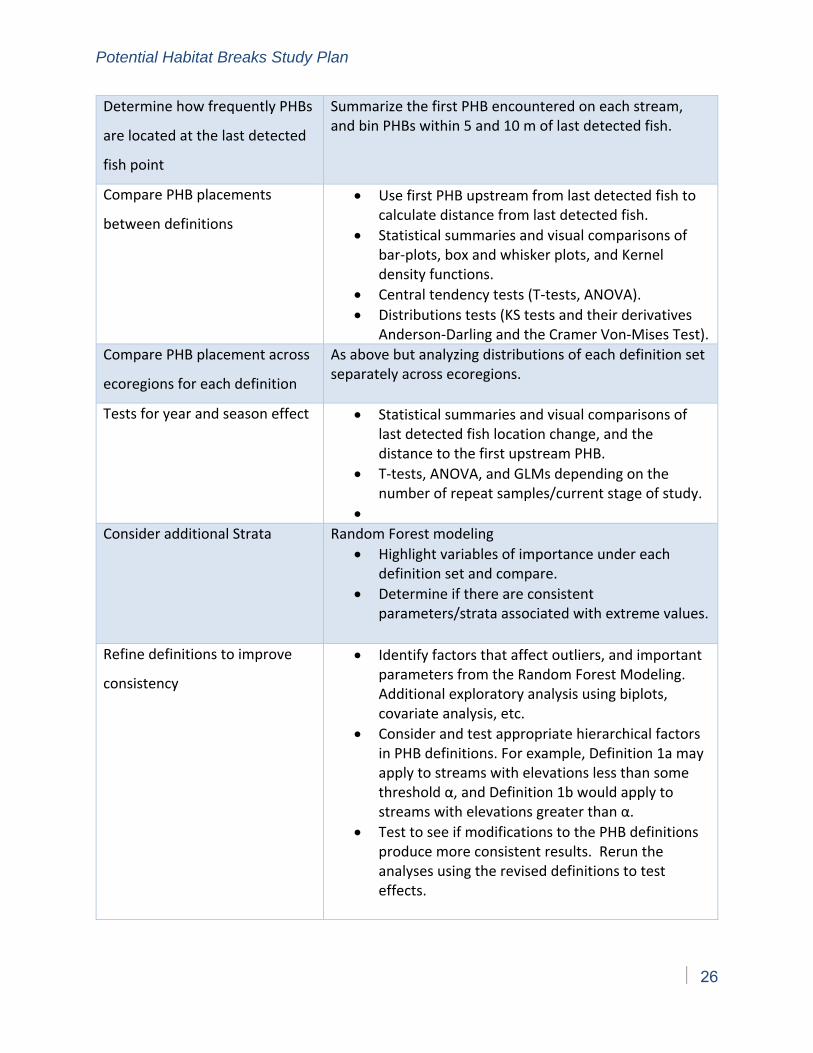
Potential Habitat Breaks Study Plan
26
Determine how frequently PHBs
are located at the last detected
fish point
Summarize the first PHB encountered on each stream, and bin PHBs within 5 and 10 m of last detected fish.
Compare PHB placements
between definitions
Use first PHB upstream from last detected fish to calculate distance from last detected fish.
Statistical summaries and visual comparisons of bar‐plots, box and whisker plots, and Kernel density functions.
Central tendency tests (T‐tests, ANOVA).
Distributions tests (KS tests and their derivatives Anderson‐Darling and the Cramer Von‐Mises Test).
Compare PHB placement across
ecoregions for each definition
As above but analyzing distributions of each definition set separately across ecoregions.
Tests for year and season effect Statistical summaries and visual comparisons of last detected fish location change, and the distance to the first upstream PHB.
T‐tests, ANOVA, and GLMs depending on the number of repeat samples/current stage of study.
Consider additional Strata Random Forest modeling
Highlight variables of importance under each definition set and compare.
Determine if there are consistent parameters/strata associated with extreme values.
Refine definitions to improve
consistency
Identify factors that affect outliers, and important parameters from the Random Forest Modeling. Additional exploratory analysis using biplots, covariate analysis, etc.
Consider and test appropriate hierarchical factors in PHB definitions. For example, Definition 1a may apply to streams with elevations less than some threshold α, and Definition 1b would apply to streams with elevations greater than α.
Test to see if modifications to the PHB definitions produce more consistent results. Rerun the analyses using the revised definitions to test effects.
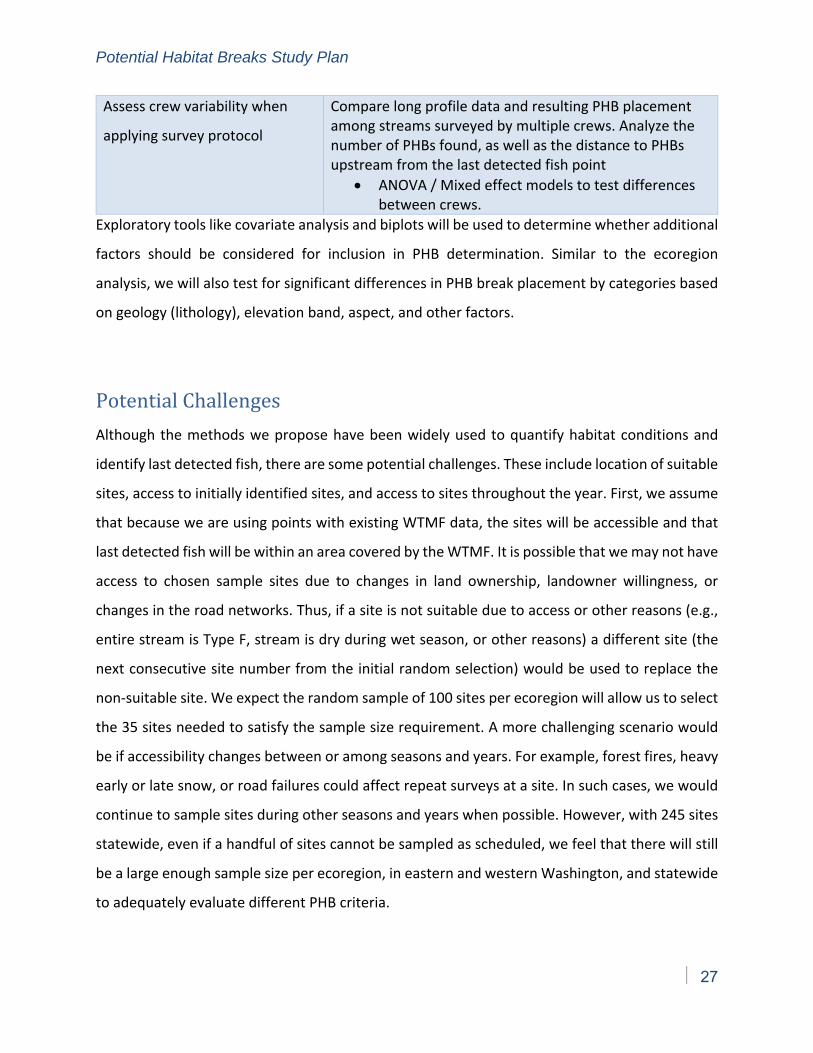
Potential Habitat Breaks Study Plan
27
Assess crew variability when
applying survey protocol
Compare long profile data and resulting PHB placement among streams surveyed by multiple crews. Analyze the number of PHBs found, as well as the distance to PHBs upstream from the last detected fish point
ANOVA / Mixed effect models to test differences between crews.
Exploratory tools like covariate analysis and biplots will be used to determine whether additional
factors should be considered for inclusion in PHB determination. Similar to the ecoregion
analysis, we will also test for significant differences in PHB break placement by categories based
on geology (lithology), elevation band, aspect, and other factors.
Potential Challenges
Although the methods we propose have been widely used to quantify habitat conditions and
identify last detected fish, there are some potential challenges. These include location of suitable
sites, access to initially identified sites, and access to sites throughout the year. First, we assume
that because we are using points with existing WTMF data, the sites will be accessible and that
last detected fish will be within an area covered by the WTMF. It is possible that we may not have
access to chosen sample sites due to changes in land ownership, landowner willingness, or
changes in the road networks. Thus, if a site is not suitable due to access or other reasons (e.g.,
entire stream is Type F, stream is dry during wet season, or other reasons) a different site (the
next consecutive site number from the initial random selection) would be used to replace the
non‐suitable site. We expect the random sample of 100 sites per ecoregion will allow us to select
the 35 sites needed to satisfy the sample size requirement. A more challenging scenario would
be if accessibility changes between or among seasons and years. For example, forest fires, heavy
early or late snow, or road failures could affect repeat surveys at a site. In such cases, we would
continue to sample sites during other seasons and years when possible. However, with 245 sites
statewide, even if a handful of sites cannot be sampled as scheduled, we feel that there will still
be a large enough sample size per ecoregion, in eastern and western Washington, and statewide
to adequately evaluate different PHB criteria.

Potential Habitat Breaks Study Plan
28
The first challenge will be largely financial and could result from underestimating or
overestimated the amount of time and cost needed to adequately sample sites initially and
repeatedly. Similarly, we need to ensure that the data collected will allow us to answer the PHB
study questions. To successfully conduct such a large multi‐year study as this, it is critical to
implement a feasibility study to confirm the time and cost needed to sample each site and to
assess the feasibility and performance of the protocols. To proactively assess these critical
uncertainties, we conducted a pilot (feasibility) study in August of 2018 to test and refine
protocols, confirm the time needed to collect data at a site, and examine the feasibility of
collecting data on bankfull depth, width:depth ratio, large wood, evidence of
hyporheic/groundwater sources, lithology, and other potential explanatory variables related to
instream habitat and stream type. The pilot study included conducting longitudinal thalweg
profile surveys upstream and downstream of known last detected fish points at 27 sites on
private, state, and federal forestlands in western and eastern Washington. The analysis of
longitudinal survey data from the pilot study demonstrated that PHBs based on gradient, BFW,
and obstacles being examined by the Board could be easily determined from the survey data.
The field surveys helped identify several modifications to the initial proposed protocol that are
needed to assure the proposed and other potential PHBs can be easily identified (e.g., spacing of
the survey points, habitat types, minimum habitat length, and substrate categories). It also
provided important information on time needed to conduct surveys, which we have incorporated
into the study plan and estimated cost to conduct the full validation study.
Another challenge is that this study does not address long‐term changes in small streams that
may render them unsuitable for fish occupancy, or conversely, may render previously unsuitable
streams habitable for fish. At any point in time, some headwater streams are not used by fish
during any season of the year due to a blockage to invasion or to unfavorable physical conditions
(e.g., gradient) in the channel itself. Factors that determine whether small streams can be used
by fish are typically related to disturbances such as exceptionally high discharge, landslides,
debris flows, and windstorms. Such episodic disturbances are erratic and can be widely spaced
in time (decades to centuries), but their overall effect in drainage systems is to create a mosaic
of streams suitable for fish occupancy that changes over long intervals (often hundreds of years)
Potential Habitat Breaks Study Plan
29
in response to local disturbance regimes (Penaluna et al. 2018). An important implication of the
notion that the potential use of small tributaries by fish can change over time is that while some
tributaries are not now occupied by fish, there is no guarantee that they may not become suitable
in the future, or that tributary streams which are currently habitable will always remain so. This
study, however, does not address the expansion and contraction of fish habitat over long time
intervals because the methods cannot predict with certainty where and in what form large
disturbances capable of transforming a stream segment’s ability to support fish will occur.
Expected Results and Additional Studies
Highly precise measurements of stream channel conditions both upstream and downstream of
last detected fish locations will provide a nearly continuous dataset of physical features (PHB)
that have the potential to inhibit fish movement. Thus, we will be able to objectively identify the
PHB criteria most closely associated with last detected fish and the next upstream PHB. We
expect that the study will validate the PHB criteria for gradient, channel width, and barriers that
are most frequently associated with the PHB most closely associated with the last detected fish
point. In addition, we are confident the methods will test the different PHB criteria under
consideration by the Board in 2018. Seasonal and inter‐annual sampling will allow us to examine
the variation of last detected fish across years and seasons, which will help identify PHBs that
consistently mark last detected fish across years, seasons, and flow conditions. Because we will
be using sites for which a WTMF exists and last detected fish was potentially identified, examining
longer‐term inter‐annual variation in last detected fish may be possible for a subset of sites where
last detected fish has been previously identified and monumented. In addition, the 245 sites used
in this study could be revisited several years from now to look at longer‐term changes in last
detected fish if desired.
Ultimately, our analysis should provide information to the Board related to the mean distance
from last detected fish for different PHB criteria being examined, how that differs among years
and seasons and whether one set of criteria performs better in terms of consistently identifying
EOF habitat and last detected fish across seasons and years, and whether different PHB criteria
should be applied for different ecoregions or should be stratified by other factors. While the focus
Potential Habitat Breaks Study Plan
30
of the study is to test the three different sets of PHB criteria being examined by the board, we
expect that our analyses will help identify other criteria that might more consistently capture last
detected fish and EOF habitat. Finally, our results should also help inform the protocols for
measuring gradient, bankfull width, and obstacles in the field to minimize variability among field
crews and assure consistent identification of PHBs.
Included in the current budget is a collaborative complementary study with the U.S. Forest
Service to compare environmental DNA (eDNA) and electrofishing to identify fish habitat.
Environmental DNA is a rapidly evolving and promising technique for identifying presence of
species based on presence of their DNA in water sample (Rees et al. 2014; Jane et al. 2015).
Because last detected fish is being identified, a companion study using eDNA techniques will be
conducted to compare electrofishing and eDNA for detecting upper limits of fish distribution.
Filtered water samples will be collected above and below the last detected fish point determined
by electrofishing to examine the accuracy of eDNA at determining last detected fish. Recent
studies have indicated that the number of samples required to accurately determine the
presences of a fish species is dependent upon the volume of flow and drainage area (Goldberg
et al. 2015; Jane et al. 2015). Despite this, eDNA shows promise in determining species presence
or absence, and determining fish distribution. This study will be conducted during the second
year of the overall study at seasonally sampled sites (82 sites) with the assistance of an additional
crew member focused on collecting two eDNA water samples above and below the last detected
fish detected with electrofishing (6 samples per sites x 82 sites x 3 seasons). This is a unique
opportunity to collaborate with the U.S. Forest Service to complete the eDNA study. If the AMP
were to conduct a similar eDNA study on its own, doing so would be more costly.
There are also some modifications or additions to the proposed PHB criteria evaluation study
that could be beneficial and influence cost. First, the main cost of the study is in field data
collection. Potentially identifying ways to reduce the number of sites sampled per ecoregion
would affect the cost of the study. We had initially estimated sample size of 50 sites per ecoregion
might be needed, but further analysis of WTMF data using a slightly less conservative statistical
power (Type II error) coupled with evidence from the pilot study indicated that a sample size of
Potential Habitat Breaks Study Plan
31
30 to 35 would be appropriate. Further, reducing the sample size would reduce the cost of the
study, but reducing the number of samples to less than 35 per ecoregion would prevent us from
examining differences among ecoregions. It should be noted that some costs are fixed (e.g.,
analysis, reporting, permitting) and will change little if the total number of sites sampled changes.
Second, we initially propose to sample all sites in spring, late summer, and fall to early winter
over the course of this study (see Table 2). While mid to late winter sampling (January 1 to March
1) would be helpful, most sites in eastern Washington and sites above 1500 ft in elevation in
western Washington, will be inaccessible during much of the winter due to snow. However,
winter sampling may be possible and could be conducted at some of the randomly selected lower
elevation sites in western Washington ecoregions. This is of particular importance for
anadromous fish like juvenile coho salmon, which may move several kilometers upstream or
downstream in fall in search of overwintering areas or in summer to avoid ephemeral reaches or
to find cold‐water refugia (Skeesick 1970; Peterson 1982; Wiggington et al. 2006). The total cost
of adding this to the study would depend upon the number of sites needed.
Once the main study is completed, a follow‐up analysis will be necessary to examine variability
in survey crews in identifying selected PHBs and whether this varies by ecoregion. Moreover,
focus should be placed on specific protocols used to consistently and accurately identify and
measure PHBs, including gradient, bankfull width, barriers, and any other PHB criteria identified
in this study.
This study is specifically designed to test PHB criteria and explore the potential for other variables
to provide useful information to refine PHB. While we are exploring a number of variables that
have shown potential as co‐variates in other similar types of studies, there is no guarantee that
these variables may provide any additional insight. We will attempt to explore the usefulness of
these variables in our early data analyses to evaluate whether to continue their use, but it may
be difficult to judge until the larger dataset is available. We will use these analyses as one part of
the overall program to make recommendations regarding PHB criteria.
We will also examine seasonal, short‐term, and medium‐term (3 to 10 years) changes in end of
fish at more than 200 headwater streams across the state stratified by ecoregion. While it lays

Potential Habitat Breaks Study Plan
32
the groundwork for continued monitoring of long‐term variability in the upper end of fish
distribution, it is not specifically a long‐term study (>25 years) on variability in the upper end of
fish distribution. We strongly recommend that sites continue to be periodically revisited (every 5
or 10 years) to examine this variability, but doing so is beyond the current scope of this study.
Budget
The total estimate project cost including the pilot study in summer of 2018 (FY2019) is
approximately $3.5 million. The pilot study demonstrated that initial site visits may take 2 full
days to survey due to the time needed to clear necessary vegetation prior to survey. The
proposed budget assumes that it would cost approximately $2400 for initial spring sampling at
each selected site, with follow‐up sampling costs of approximately $1200 per site visit (Table 4).
All 245 sites would be sampled each year during the spring sampling window, whereas late
summer and fall to early winter sampling would be repeated at one third of the sites (82) during
each of the three years of the study (2020, 2021, and 2022). In addition, 60 of the seasonal
sampling sites would be sampled across each year to examine inter‐annual variability in seasonal
sampling. Ten percent of all sites will also be resampled by all field crews in each year to examine
crew variability.
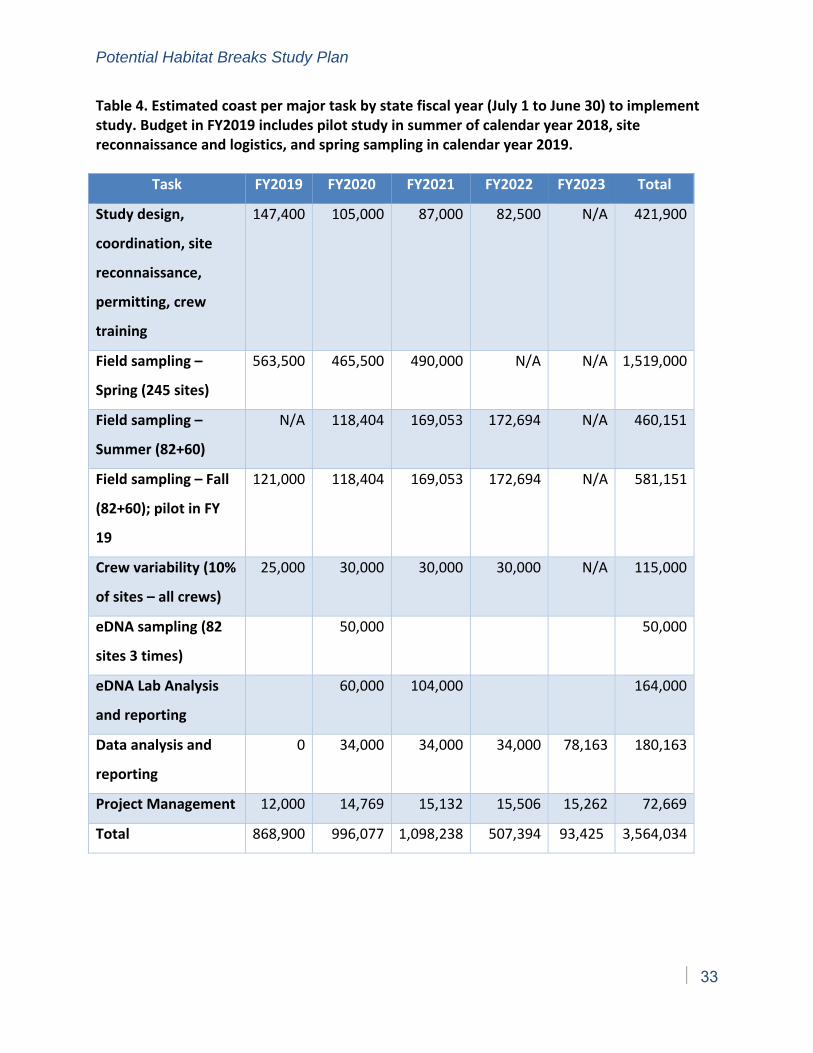
Potential Habitat Breaks Study Plan
33
Table 4. Estimated coast per major task by state fiscal year (July 1 to June 30) to implement study. Budget in FY2019 includes pilot study in summer of calendar year 2018, site reconnaissance and logistics, and spring sampling in calendar year 2019.
Task FY2019 FY2020 FY2021 FY2022 FY2023 Total
Study design,
coordination, site
reconnaissance,
permitting, crew
training
147,400 105,000 87,000 82,500 N/A 421,900
Field sampling –
Spring (245 sites)
563,500 465,500 490,000 N/A N/A 1,519,000
Field sampling –
Summer (82+60)
N/A 118,404 169,053 172,694 N/A 460,151
Field sampling – Fall
(82+60); pilot in FY
19
121,000 118,404 169,053 172,694 N/A 581,151
Crew variability (10%
of sites – all crews)
25,000 30,000 30,000 30,000 N/A 115,000
eDNA sampling (82
sites 3 times)
50,000 50,000
eDNA Lab Analysis
and reporting
60,000 104,000 164,000
Data analysis and
reporting
0 34,000 34,000 34,000 78,163 180,163
Project Management 12,000 14,769 15,132 15,506 15,262 72,669
Total 868,900 996,077 1,098,238 507,394 93,425 3,564,034
Potential Habitat Breaks Study Plan
34
References
Adams, S. A., C. A. Frissell, and B. E. Rieman. 2000. Movements of non‐native brook trout in relation
to stream channel slope. Transactions of the American Fisheries Society 129:623‐638.
Andrews, E. D. 1980. Effective and bankfull discharges of streams in the Yampa River Basin,
Colorado and Wyoming. Journal of Hydrology 46:311‐330.
Beamish, F. H. 1978. Swimming capacity. Pages 101‐187 in W. S. Hoar and D. J. Randall, editors.
Fish physiology, Vol. 7. Academic Press, New York.
Beechie, T., and H. Imaki. 2014. Predicting natural channel patterns based on landscape and
geomorphic controls in the Columbia River basin, USA. Water Resources Research 50 39‐57.
Bell, M. C. 1991. Fisheries handbook of engineering requirements and biological criteria. U.S. Army
Corps of Engineers Office of Chief Engineer, Fish Passage Development and Evaluation
Program, Portland, Oregon.
Bisson, P. A. and R. E. Bilby. 1998. Organic matter and trophic dynamics. Pages 373‐398 in R. J.
Naiman and R. E. Bilby. River ecology and management: lessons from the Pacific coastal
ecoregion. Springer‐Verlag, New York.
Bisson, P. A., K. Sullivan, and J. L. Nielson. 1988. Channel hydraulics, habitat use, and body form of
juvenile Coho Salmon, Steelhead, and Cutthroat Trout in streams. Transactions of the
American Fisheries Society 117:262‐273.
Björkelid, L. 2005. Invasiveness of brook charr (Salvelinus fontinalis) in small boreal headwater
streams. Master’s Thesis. University of Gothenberg, Umeå, Sweden.
Bryant, M. D., T. Gomi and J. Piccolo. 2007. Structures linking physical and biological processes in
headwater streams of the Maybeso watershed, southeast Alaska. Forest Science 53:371‐383.
Bryant, M. D., N. D. Zymonas, and B. E. Wright. 2004. Salmonids on the fringe: abundance, species
composition, and habitat use of salmonids in high‐gradient headwater streams, southeast
Alaska. Transactions of the American Fisheries Society 133:1529‐1538.
Potential Habitat Breaks Study Plan
35
Cole, M. B., D. M. Price, and B. R. Fransen. 2006. Change in the upper extent of fish distribution in
eastern Washington streams between 2001 and 2002. Transactions of the American Fisheries
Society 135:634‐642.
Connolly, P. J., and J. D. Hall. 1999. Biomass of Cutthroat Trout in unlogged and previously clear‐cut
basins in the central coast range of Oregon. Transactions of the American Fisheries Society
128:890‐899.
Cupp, C. E. 2002. Data collection for development of Eastern Washington water typing model.
Cooperative Monitoring Evaluation and Research Report PSC 01‐178. Washington
Department of Natural Resources, Olympia.
DNR (Department of Natural Resources. 2002. Board Manual, Section 13, Guidelines for
determining fish use of the purpose of typing waters. Washington Department of Natural
Resources, Olympia.
DNR (Department of Natural Resources). 2004. Board Manual, Section 2. Standard methods for
identifying bankfull channel features and channel migration zones. Washington
Department of Natural Resources, Olympia.
Dunham, J. B., M. M. Peacock, B. E. Rieman, R. E. Schroeter, and G. L. Vinyard. 1999. Local and
geographic variability in the distribution of stream‐living Lahontan Cutthroat Trout.
Transactions of the American Fisheries Society 128:875‐889.
Fausch, K. D. 1989. Do gradient and temperature affect distributions of, and interactions between,
Brook Charr (Salvelinus fontinalis) and other resident salmonids in streams? Physiological
Ecology (Japan) Special Vol. 1:303‐322.
FFR (Forest and Fish Report). 1999. Forests and Fish Report. Washington State Department of
Natural Resources. Available:http://file.dnr.wa.gov/publications/fp_rules_forestsandfish.pdf.
(August 2018).
Fransen, B. R., R. E. Bilby, S. Needham, and J. K. Walter. 1998. Delineating fish habitat based on
physical characteristics associated with the upper extent of fish distributions. Paper
Potential Habitat Breaks Study Plan
36
presented at the 1998 Annual General Meeting, North Pacific International Chapter American
Fisheries Society, March 18‐20, 1998, Union, Washington.
Fransen, B. R., S. D. Duke, L. D. McWethy, J. K. Walter, and R. E. Bilby. 2006. A logistic regression
model for predicting the upstream extent of fish occurrence based on geographical
information systems data. North American Journal of Fisheries Management 26:960‐975.
Goldberg, C. S., K. M. Strickler, and D. S. Pilliod. 2015. Moving environmental DNA methods
from concept to practice for monitoring aquatic macroorganisms. Biological Conservation
183:1‐3.
Haggerty, S. M., D. P. Batzer, and C. R. Jackson. 2004. Macroinvertebrate response to logging in
coastal headwater streams of Washington, U.S.A. Canadian Journal of Fisheries and
Aquatic Sciences 61:529–537.
Hammer, C. 1995. Fatigue and exercise tests with fish. Comparative Biochemistry and Physiology
112A:1‐20.
Harrelson, C. C., C. L. Rawlins, J. P. Potyondy. 1994. Stream channel reference sites: An illustrated
guide to field technique. General Technical Report RM‐GTR‐245. U.S. Forest Service, Rocky
Mountain Forest and Range Experiment Station, Fort Collins, Colorado.
Harvey, B. C. 1993. Benthic assemblages in Utah headwater streams with and without trout.
Canadian Journal of Zoology 71:896‐900.
Hastings, K., C. A. Frissell, and F. W. Allendorf. 2005. Naturally isolated coastal Cutthroat Trout
populations provide empirical support for the 50‐500 rule. Pages 121‐124 in P. J. Connolly, T.
H. Williams, and R. E. Gresswell, editors. The 2005 Coastal Cutthroat Trout Symposium:
Status, Management, Biology, and Conservation. Port Townsend, Washington. Oregon
Chapter of the American Fisheries Society, Portland.
Hawkins, C. P., J. L. Kershner, P. A. Bisson, M. D. Bryant, L. M. Decker, S. V. Gregory, D. A.
McCullough, C. K. Overton, G. H. Reeves, R. J. Steedman, and M. K. Young. 1993. A
hierarchical approach to classifying stream habitat features. Fisheries 18(6):3‐12.
Potential Habitat Breaks Study Plan
37
Hawkins, C. P., and J. R. Sedell. 1981. Longitudinal and seasonal changes in functional organization
of macroinvertebrate communities in four Oregon streams. Ecology 62:387‐397.
Hawkins, D. K., and T. P. Quinn. 1996. Critical swimming velocity and associated morphology of
juvenile Coastal Cutthroat Trout (Oncorhynchus clarki clarki), Steelhead Trout (Oncorhynchus
mykiss), and their hybrids. Canadian Journal of Fisheries and Aquatic Sciences 53:1487‐1496.
Heede, B. H. 1972. Influence of a forest on the hydraulic geometry of two mountain streams.
Water Resources Bulletin 8:523‐530.
Huet, M. 1959. Profiles in biology of western European streams as related to fish management.
Transactions of the American Fisheries Society 88:155‐163.
Jane, S. F., T. M. Wilcox, K. S. McKelvey, M. K. Young, M. K. Schwartz, W. H. Lowe, B. H. Letcher, and
A. R. Whiteley. 2015. Distance, flow and PCR inhibition: eDNA dynamics in two headwater
streams. Molecular Ecology Resources 15(1):216‐27.
Kershner, J. L., E. Archer, R. C. Henderson, and N. Bouwes. 2002. An evaluation of physical habitat
attributes used to monitor streams. Journal of the American Water Resources
Association38:1‐10.
Kondolf, G. M., G. F. Cada, M. J. Sale, and T. Felando. 1991. Distribution and stability of potential
salmonid spawning gravels in steep boulder‐bed streams of the eastern Sierra Nevada.
Transactions of the American Fisheries Society 120:177‐186.
Kondratieff, M. C. and C. A. Myrick. 2006. How high can Brook Trout jump? A laboratory evaluation
of Brook Trout jumping performance. Transactions of the American Fisheries Society 135:361‐
370.
Kruse, C. G., W. A. Hubert, and F. J. Rahel. 1997. Geomorphic influences on the distribution of
Yellowstone Cutthroat Trout in the Absaroka Mountains, Wyoming. Transactions of the
American Fisheries Society 126:418‐427.
Potential Habitat Breaks Study Plan
38
Latterell, J. J., R. J. Naiman, B. R. Fransen, and P. A. Bisson. 2003. Physical constraints on trout
(Oncorhynchus spp.) distribution in the Cascade Mountains: a comparison of logged and
unlogged streams. Canadian Journal of Fisheries and Aquatic Sciences 60:1007‐1017.
Leopold, L. B. 1994. A view of the river. Harvard University Press, Cambridge, Massachusetts.
Liquori, M. 2000. A preliminary examination of the controls on small headwater channel
morphology and habitat influence in managed forests. Poster presented at 10th Annual
Review, Center for Streamside Studies, University of Washington, Seattle.
Mason, J. C. 1976. Response of underyearling Coho Salmon to supplemental feeding in a natural
stream. Journal of Wildlife Management 40:775‐788.
Montgomery, D. R. 1999. Process domains and the river continuum. Journal of the American Water
Resources Association 35:397‐410.
Montgomery, D. R., and J. M. Buffington. 1993. Channel classification, prediction of channel
response and assessment of channel condition. Washington Department of Natural Resources
Report TFW‐SH10‐93002, Olympia, Washington.
Montgomery, D. R., and J. M. Buffington. 1997. Channel‐reach morphology in mountain drainage
basins. Geological Society of America Bulletin 109:596‐611.
Moore, S. E., G. L. Larson, and B. Ridley. 1985. Dispersal of brook trout in rehabilitated streams
in Great Smoky Mountains National Park. Journal of the Tennessee Academy of Science
60:1–4.
Mossop, B., and M. J. Bradford. 2006. Using thalweg profiling to assess and monitor juvenile
salmon (Oncorhynchus spp.) habitat in small streams. Canadian Journal of Fisheries and
Aquatic Sciences 63:1515–1525.
Naiman, R. J., and J. R. Sedell. 1980. Relationships between metabolic parameters and stream order
in Oregon. Canadian Journal of Fisheries Aquatic Sciences 37:834‐847.
Potential Habitat Breaks Study Plan
39
Northcote, T. G., and G. F. Hartman. 1988. The biology and significance of stream trout populations
(Salmo spp.) living above and below waterfalls. Polish Archives of Hydrobiology 35(3‐4):409‐
442.
Omernik, J. M. 1987. Ecoregions of the conterminous United States. Annals of the Association of
American Geographers 77(1):118‐125.
PHB Science Panel. 2018. Review and recommendations for potential fish habitat breaks to
begin protocol surveys to determine end of fish habitat on state and private forest lands
in Washington State. Report to the Washington Forest Practices Board, January 16, 2018.
Washington Department of Natural Resources, Olympia.
Penaluna, B. E., G. H. Reeves, C. Z. Barnett, P. A. Bisson, J. M. Buffington, C. A. Dolloff, R. L.
Flitcroft, C. H. Luce, K. H. Nislow, J. D. Rothlisberger, M. L. Warren. 2018. Using natural
disturbance and portfolio concepts to guide aquatic–riparian ecosystem management.
Fisheries 43(9):406‐422.
Peterson, N. P. 1982. Immigration of juvenile Coho Salmon (Oncorhynchus kisutch) into riverine
ponds. Canadian Journal of Fisheries and Aquatic Sciences 39(9):1308‐1310.
Peterson, N. P., R. K. Simmons, T. Cardoso, and J. T. Light. 2013. A probabilistic model for
assessing passage performance of coastal cutthroat trout through corrugated metal
culverts. North American Journal of Fisheries Management 33(1):192‐199.
Pleus, A., D. Schuett‐Hames, and L. Bullchild. 1999. Method manual for the habitat unit survey.
Timber, Fish, and Wildlife Monitoring Program. Publication No. TFW‐AM9‐99‐004.,
Olympia, Washington.
Powers, P. D., and J. F. Orsborn. 1985. Analysis of barriers to upstream fish migration. Report
submitted to Bonneville Power Administration, Contract DE‐A179‐82BP36523, Project 82‐14.
Washington State University Department of Civil and Environmental Engineering, Pullman.
Potential Habitat Breaks Study Plan
40
Rees, H. C., B. C. Maddison, D. J. Middleditch, J. R. M. Patmore, K. C. Gough, and E. Crispo. 2014.
REVIEW: The detection of aquatic animal species using environmental DNA ‐ a review of eDNA
as a survey tool in ecology. Journal of Applied Ecology 51(5):1450‐1459.
Roper, B., J. L. Kershner, E. Archer, R. C. Henderson, and N. Bouwes. 2002. An evaluation of physical
habitat attributes used to monitor streams. Journal of the American Water Resources
Association 38:1‐10.
Rosgen, D. L. 1994. A classification of natural rivers. Catena 22:169‐199.
Rosgen, D. L. 1996. Applied river morphology. Wildland Hydrology, Pagosa Springs, Colorado.
Sedell, J. R., P. A. Bisson, J. A. June, and R. W. Speaker. 1982. Ecology and habitat requirements of
fish populations in South Fork Hoh River, Olympic National Park. Pages 35‐42 in E. E. Starkey,
J. F. Franklin, and J. W. Matthews, editors. Ecological research in National Parks of the Pacific
Northwest. Proceedings of the 2nd Conference on Scientific Research in the National Parks.
Oregon State University, Forest Research Laboratory, Corvallis.
Skeesick, D. G. 1970. The fall Immigration of juvenile Coho Salmon (Oncorhynchus kisutch) into a
small tributary. Research Reports of the Fish Commission of Oregon 2:90‐95.
Stuart, T. A. 1962. The leaping behavior of salmon and trout at falls and obstructions. Department
of Agriculture and Fisheries for Scotland, Freshwater and Salmon Fisheries Research Report
28. Edinburgh, U.K.
Triska, F. J., J. R. Sedell, and S. V. Gregory. 1982. Coniferous forest streams. Pages 292‐332 in R. L.
Edmonds, editor. Analysis of coniferous forest ecosystems in the western United States.
Hutchinson Ross, Stroudsburg, Pennsylvania.
Vannote, R. L., G. W. Minshall, K. W. Cummins, J. R. Sedell, and C. E. Cushing. 1980. The river
continuum concept. Canadian Journal of Fisheries and Aquatic Sciences 37:130‐137.
Warren, C. E., J. H. Wales, G. E. Davis, and P. Doudoroff. 1964. Trout production in an experimental
stream enriched with sucrose. Journal of Wildlife Management 28:617‐660.
Potential Habitat Breaks Study Plan
41
Watson, R. 1993. The trout: a fisherman's natural history. Swan Hill Press, Shrewsbury, U.K.
Watson, G., and T. W. Hillman. 1997. Factor affecting the distribution and abundance of Bull Trout:
and investigation at hierarchical scales. North American Journal of Fisheries Management
17:237‐252.
Watts, F. J. 1974. Design of culvert fishways. University of Idaho Water Resources Research
Institute, Project A‐027‐IDA, Moscow, Idaho. [Not seen, cited in Bjornn, T. C., and D. W.
Reiser. 1991. Habitat requirements of salmonids in streams. Pages 83‐138 in W. R. Meehan,
editor. Influence of forest and rangeland management on salmonid fishes and their habitats.
American Fisheries Society Special Publication 19, Bethesda, Maryland.
Webb, P. W. 1984. Body form, locomotion and foraging in aquatic vertebrates. American Zoologist
24:107‐120.
Whitacre, H. W., B. B. Roper, and J. L. Kershner. 2007. A comparison of protocols and observer
precision for measuring stream attributes. Journal of the American Water Resources
Association 43:923‐937.
Wigington Jr., P. J., J. L. Ebersole, M. E. Colvin, S. G. Leibowitz, B. Miller, B. Hansen, H. R. Lavigne, D.
White, J. P. Baker, M. R. Church, J. R. Brooks, M. A. Cairns, and J. E. Compton. 2006. Coho
Salmon dependence on intermittent streams. Frontiers in Ecology and the Environment
4(10):513‐518.
Wipfli, M. S. 1997. Terrestrial invertebrates as salmonid prey and nitrogen sources in streams:
contrasting old‐growth and young‐growth riparian forests in southeastern Alaska, U.S.A.
Canadian Journal of Fisheries Aquatic Science 54:1259‐1269.
Ziller, J. S. 1992. Distribution and relative abundance of Bull Trout in the Sprague River subbasin,
Oregon. Pages 18‐29 in P. J. Howell and D. V. Buchanan, editors. Proceedings of the Gearhart
Mountain Bull Trout workshop. Oregon Chapter, American Fisheries Society, Corvallis.
Potential Habitat Breaks Study Plan
42
Appendices
Appendix A. Details of sample size estimation.
Estimating required sample sizes depends on the population variance, which is generally
unknown. Pilot projects, published values, and data proxies are often used to derive an estimate
of the population variance to use in sample size calculations. Here, we rely on the provided Land
Owner Sample Data set (PHB Science Panel 2018) to get an estimate of variance across an
ecoregion.
The sample data exists across multiple ecoregions and contains habitat measurements
surrounding each End of Fish (last detected fish) point. The data were reduced by only
considering points within the “Coast Range” ecoregion. This level of granularity matches our
proposed sampling strata and should give us insight into the variance of within an individual
ecoregion. Moreover, similar to the proposed PHB study, these data were collected with
consistent methods, while data in other ecoregions were collected with a variety of inconsistent
methods. Of the metrics proposed and analyzed, difference in upstream and downstream
gradient was the most normal and didn’t include suspect channel width data. A square‐root
transformation further normalizes the distribution by pulling in the long right tail, but it still fails
to pass the Shapiro‐Wilks test for normality.
Because the sample data shows a non‐parametric distribution, we estimated samples desired for
each ecoregion in multiple ways including: 1) samples required to estimate the mean 2) power
estimates for t‐tests, and finally, 3) a bootstrapping routine to estimate samples for non‐
parametric tests (Wilcoxon and Kolmogorov‐Smirnov). Power tests and mean estimates were
applied to both the raw distribution, as well as the square‐root transformed version.
First, calculating the number of samples required to estimate a population mean with a stated
margin of error and certainty is accomplished using the following formula:
Potential Habitat Breaks Study Plan
43
Where is the Z‐score corresponding to the desired confidence level , is the estimated
variance, and is the accepted margin of error. This can be stated as “Based on the assumption
of population standard deviation being , we require a sample size of to achieve margin of
error at the 100 % confidence level”. This formulation depends on both a stated confidence
level, and acceptable margin of error.
Second, power estimates for t‐tests have similar requirements to calculating samples required to
estimate a population mean, but rely on , the difference to be detected between the two
samples, instead of a general error term . Additionally, power estimates require desired power
levels to be defined to calculate the number of samples required in each group.
Finally, a bootstrapping routine was used to determine the number of samples required to detect
a given difference in means using non‐parametric tests. The routine can be summarized as
follows:
1.) Shift empirical distribution by , by the desired difference to be detected.
2.) Draw samples from the original and shifted distributions
3.) Test with Wilcoxon and KS tests.
4.) Record if the test successfully detected the shift
5.) Repeat (2‐4) many times (~10,000)
6.) Calculate the percent of replicates that failed to detect the shift.
7.) Repeat (2‐6) for a range of sample sizes .
8.) Repeat (1‐7) for a range of differences .
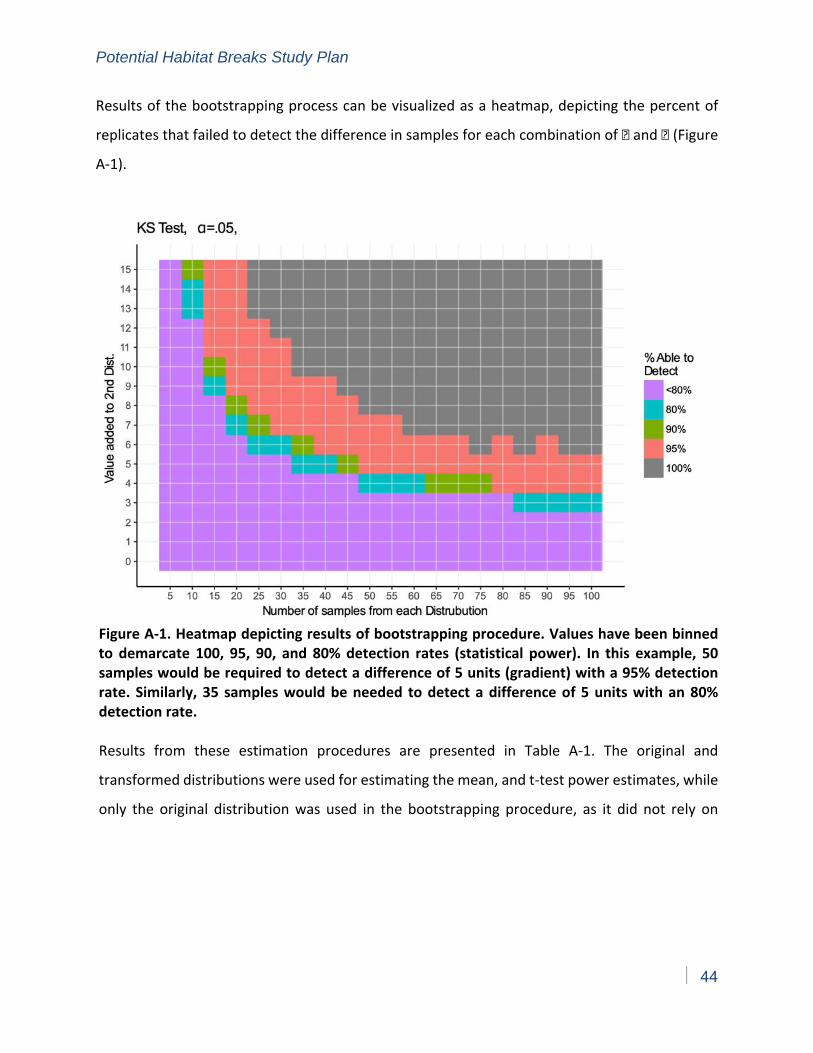
Potential Habitat Breaks Study Plan
44
Results of the bootstrapping process can be visualized as a heatmap, depicting the percent of
replicates that failed to detect the difference in samples for each combination of and (Figure
A‐1).
Figure A‐1. Heatmap depicting results of bootstrapping procedure. Values have been binned to demarcate 100, 95, 90, and 80% detection rates (statistical power). In this example, 50 samples would be required to detect a difference of 5 units (gradient) with a 95% detection rate. Similarly, 35 samples would be needed to detect a difference of 5 units with an 80% detection rate. Results from these estimation procedures are presented in Table A‐1. The original and
transformed distributions were used for estimating the mean, and t‐test power estimates, while
only the original distribution was used in the bootstrapping procedure, as it did not rely on
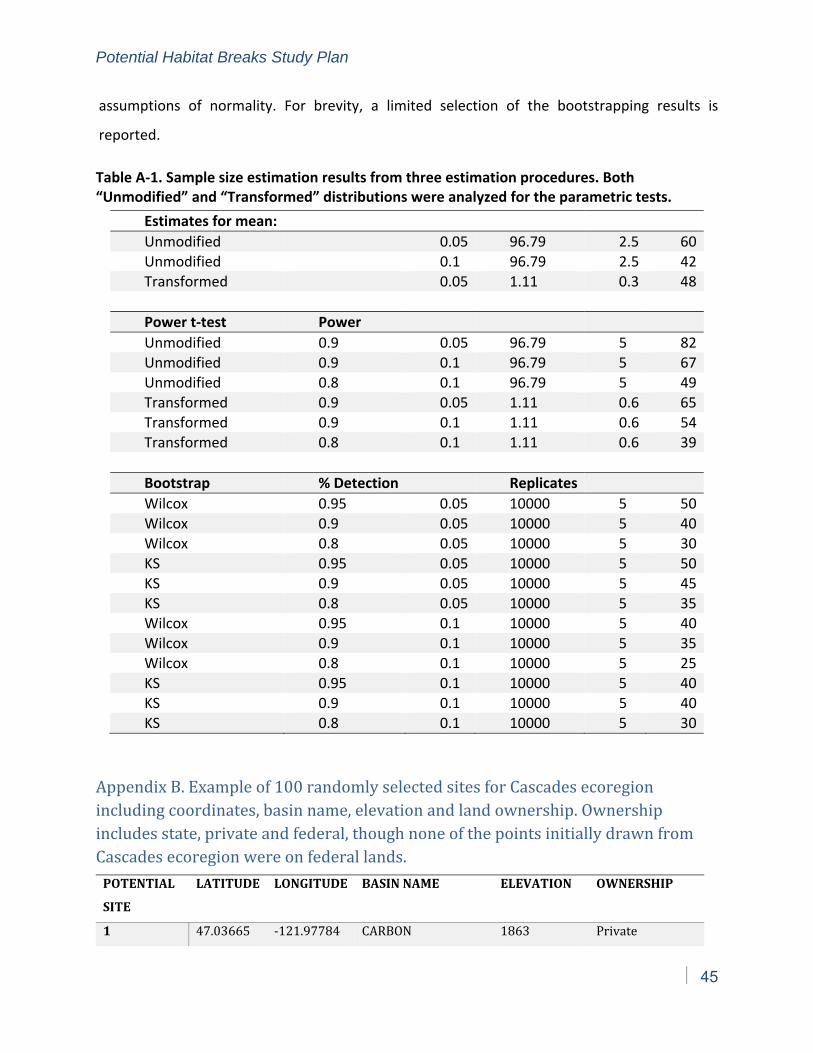
Potential Habitat Breaks Study Plan
45
assumptions of normality. For brevity, a limited selection of the bootstrapping results is
reported.
Table A‐1. Sample size estimation results from three estimation procedures. Both “Unmodified” and “Transformed” distributions were analyzed for the parametric tests.
Estimates for mean:
Unmodified 0.05 96.79 2.5 60 Unmodified 0.1 96.79 2.5 42 Transformed 0.05 1.11 0.3 48
Power t‐test Power
Unmodified 0.9 0.05 96.79 5 82 Unmodified 0.9 0.1 96.79 5 67 Unmodified 0.8 0.1 96.79 5 49
Transformed 0.9 0.05 1.11 0.6 65 Transformed 0.9 0.1 1.11 0.6 54 Transformed 0.8 0.1 1.11 0.6 39
Bootstrap % Detection Replicates
Wilcox 0.95 0.05 10000 5 50 Wilcox 0.9 0.05 10000 5 40 Wilcox 0.8 0.05 10000 5 30 KS 0.95 0.05 10000 5 50 KS 0.9 0.05 10000 5 45 KS 0.8 0.05 10000 5 35 Wilcox 0.95 0.1 10000 5 40 Wilcox 0.9 0.1 10000 5 35 Wilcox 0.8 0.1 10000 5 25 KS 0.95 0.1 10000 5 40 KS 0.9 0.1 10000 5 40 KS 0.8 0.1 10000 5 30
Appendix B. Example of 100 randomly selected sites for Cascades ecoregion including coordinates, basin name, elevation and land ownership. Ownership includes state, private and federal, though none of the points initially drawn from Cascades ecoregion were on federal lands.
POTENTIAL
SITE
LATITUDE LONGITUDE BASINNAME ELEVATION OWNERSHIP
1 47.03665 -121.97784 CARBON 1863 Private
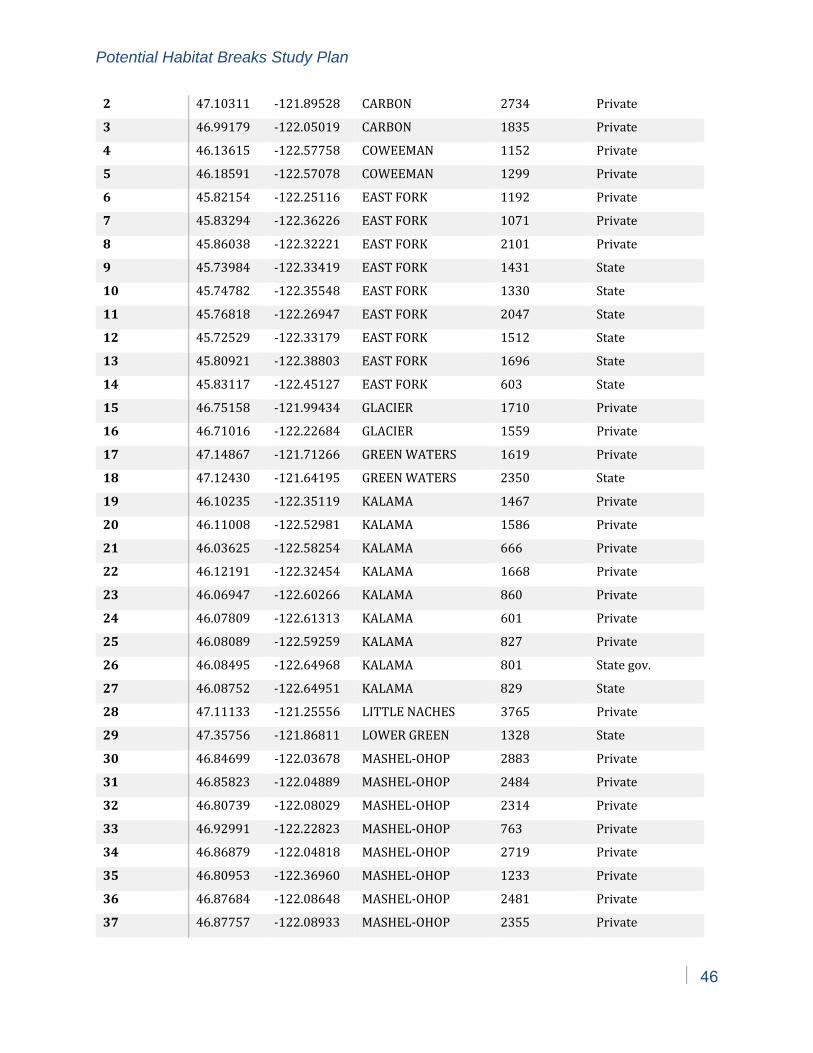
Potential Habitat Breaks Study Plan
46
2 47.10311 -121.89528 CARBON 2734 Private
3 46.99179 -122.05019 CARBON 1835 Private
4 46.13615 -122.57758 COWEEMAN 1152 Private
5 46.18591 -122.57078 COWEEMAN 1299 Private
6 45.82154 -122.25116 EAST FORK 1192 Private
7 45.83294 -122.36226 EAST FORK 1071 Private
8 45.86038 -122.32221 EAST FORK 2101 Private
9 45.73984 -122.33419 EAST FORK 1431 State
10 45.74782 -122.35548 EAST FORK 1330 State
11 45.76818 -122.26947 EAST FORK 2047 State
12 45.72529 -122.33179 EAST FORK 1512 State
13 45.80921 -122.38803 EAST FORK 1696 State
14 45.83117 -122.45127 EAST FORK 603 State
15 46.75158 -121.99434 GLACIER 1710 Private
16 46.71016 -122.22684 GLACIER 1559 Private
17 47.14867 -121.71266 GREEN WATERS 1619 Private
18 47.12430 -121.64195 GREEN WATERS 2350 State
19 46.10235 -122.35119 KALAMA 1467 Private
20 46.11008 -122.52981 KALAMA 1586 Private
21 46.03625 -122.58254 KALAMA 666 Private
22 46.12191 -122.32454 KALAMA 1668 Private
23 46.06947 -122.60266 KALAMA 860 Private
24 46.07809 -122.61313 KALAMA 601 Private
25 46.08089 -122.59259 KALAMA 827 Private
26 46.08495 -122.64968 KALAMA 801 State gov.
27 46.08752 -122.64951 KALAMA 829 State
28 47.11133 -121.25556 LITTLE NACHES 3765 Private
29 47.35756 -121.86811 LOWER GREEN 1328 State
30 46.84699 -122.03678 MASHEL-OHOP 2883 Private
31 46.85823 -122.04889 MASHEL-OHOP 2484 Private
32 46.80739 -122.08029 MASHEL-OHOP 2314 Private
33 46.92991 -122.22823 MASHEL-OHOP 763 Private
34 46.86879 -122.04818 MASHEL-OHOP 2719 Private
35 46.80953 -122.36960 MASHEL-OHOP 1233 Private
36 46.87684 -122.08648 MASHEL-OHOP 2481 Private
37 46.87757 -122.08933 MASHEL-OHOP 2355 Private
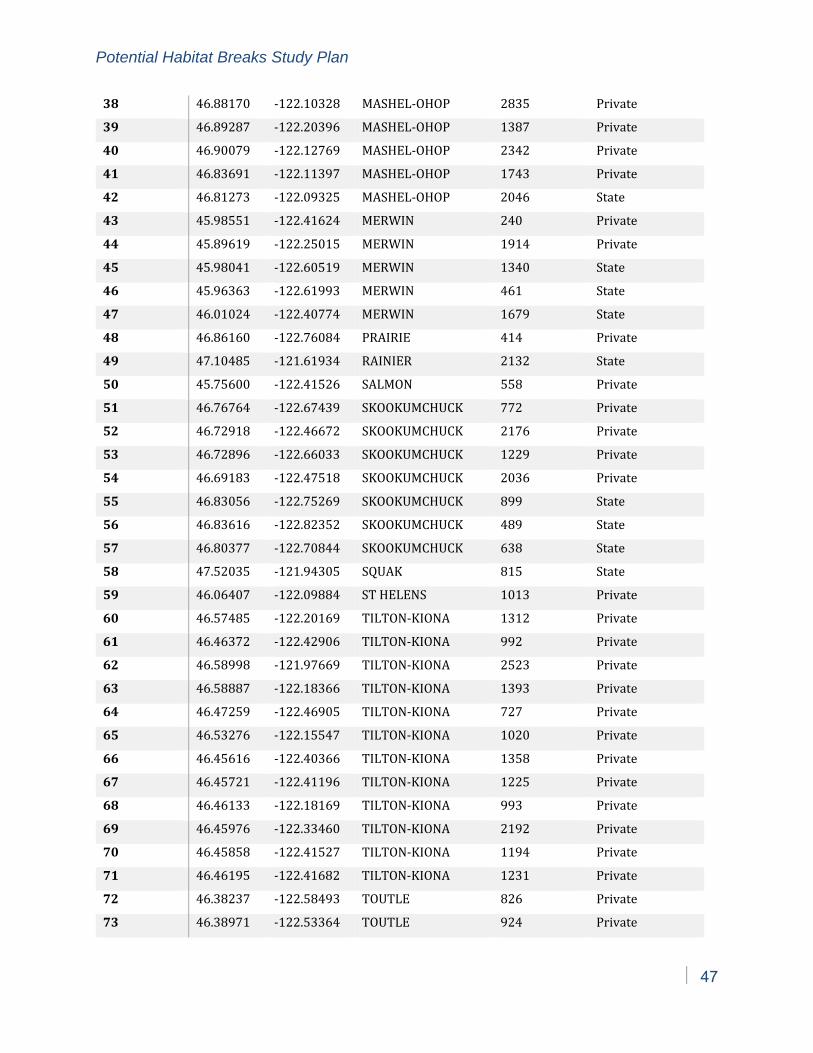
Potential Habitat Breaks Study Plan
47
38 46.88170 -122.10328 MASHEL-OHOP 2835 Private
39 46.89287 -122.20396 MASHEL-OHOP 1387 Private
40 46.90079 -122.12769 MASHEL-OHOP 2342 Private
41 46.83691 -122.11397 MASHEL-OHOP 1743 Private
42 46.81273 -122.09325 MASHEL-OHOP 2046 State
43 45.98551 -122.41624 MERWIN 240 Private
44 45.89619 -122.25015 MERWIN 1914 Private
45 45.98041 -122.60519 MERWIN 1340 State
46 45.96363 -122.61993 MERWIN 461 State
47 46.01024 -122.40774 MERWIN 1679 State
48 46.86160 -122.76084 PRAIRIE 414 Private
49 47.10485 -121.61934 RAINIER 2132 State
50 45.75600 -122.41526 SALMON 558 Private
51 46.76764 -122.67439 SKOOKUMCHUCK 772 Private
52 46.72918 -122.46672 SKOOKUMCHUCK 2176 Private
53 46.72896 -122.66033 SKOOKUMCHUCK 1229 Private
54 46.69183 -122.47518 SKOOKUMCHUCK 2036 Private
55 46.83056 -122.75269 SKOOKUMCHUCK 899 State
56 46.83616 -122.82352 SKOOKUMCHUCK 489 State
57 46.80377 -122.70844 SKOOKUMCHUCK 638 State
58 47.52035 -121.94305 SQUAK 815 State
59 46.06407 -122.09884 ST HELENS 1013 Private
60 46.57485 -122.20169 TILTON-KIONA 1312 Private
61 46.46372 -122.42906 TILTON-KIONA 992 Private
62 46.58998 -121.97669 TILTON-KIONA 2523 Private
63 46.58887 -122.18366 TILTON-KIONA 1393 Private
64 46.47259 -122.46905 TILTON-KIONA 727 Private
65 46.53276 -122.15547 TILTON-KIONA 1020 Private
66 46.45616 -122.40366 TILTON-KIONA 1358 Private
67 46.45721 -122.41196 TILTON-KIONA 1225 Private
68 46.46133 -122.18169 TILTON-KIONA 993 Private
69 46.45976 -122.33460 TILTON-KIONA 2192 Private
70 46.45858 -122.41527 TILTON-KIONA 1194 Private
71 46.46195 -122.41682 TILTON-KIONA 1231 Private
72 46.38237 -122.58493 TOUTLE 826 Private
73 46.38971 -122.53364 TOUTLE 924 Private
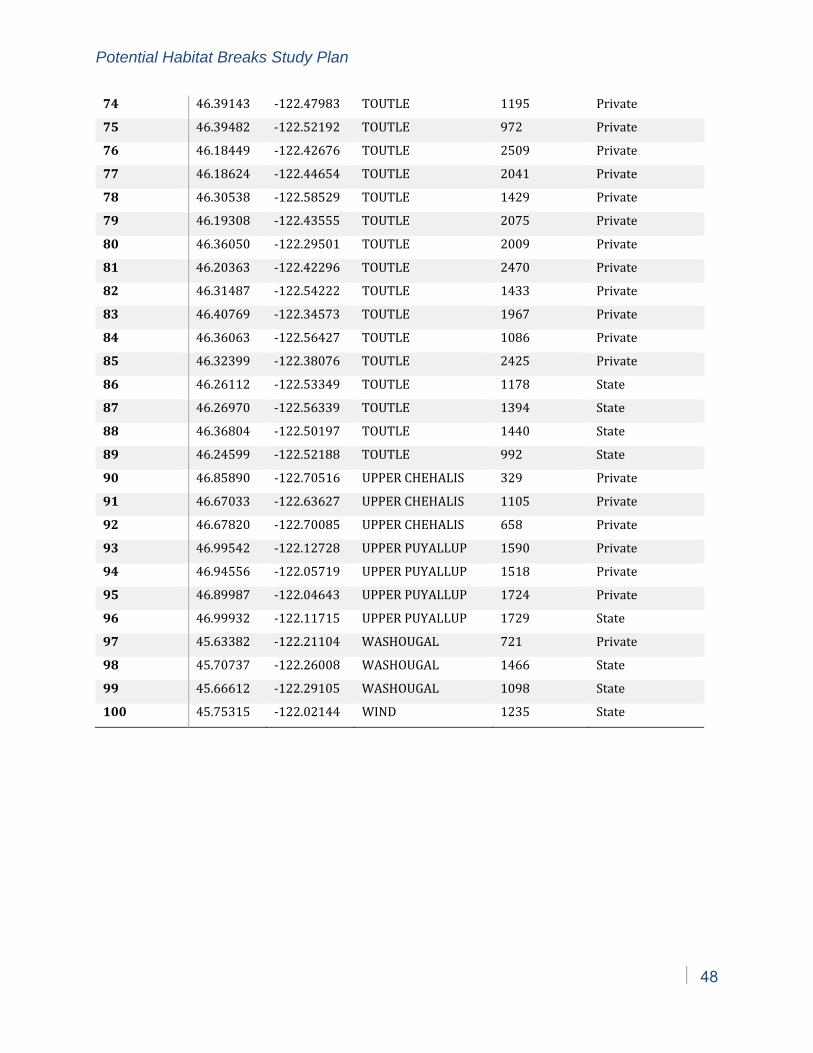
Potential Habitat Breaks Study Plan
48
74 46.39143 -122.47983 TOUTLE 1195 Private
75 46.39482 -122.52192 TOUTLE 972 Private
76 46.18449 -122.42676 TOUTLE 2509 Private
77 46.18624 -122.44654 TOUTLE 2041 Private
78 46.30538 -122.58529 TOUTLE 1429 Private
79 46.19308 -122.43555 TOUTLE 2075 Private
80 46.36050 -122.29501 TOUTLE 2009 Private
81 46.20363 -122.42296 TOUTLE 2470 Private
82 46.31487 -122.54222 TOUTLE 1433 Private
83 46.40769 -122.34573 TOUTLE 1967 Private
84 46.36063 -122.56427 TOUTLE 1086 Private
85 46.32399 -122.38076 TOUTLE 2425 Private
86 46.26112 -122.53349 TOUTLE 1178 State
87 46.26970 -122.56339 TOUTLE 1394 State
88 46.36804 -122.50197 TOUTLE 1440 State
89 46.24599 -122.52188 TOUTLE 992 State
90 46.85890 -122.70516 UPPER CHEHALIS 329 Private
91 46.67033 -122.63627 UPPER CHEHALIS 1105 Private
92 46.67820 -122.70085 UPPER CHEHALIS 658 Private
93 46.99542 -122.12728 UPPER PUYALLUP 1590 Private
94 46.94556 -122.05719 UPPER PUYALLUP 1518 Private
95 46.89987 -122.04643 UPPER PUYALLUP 1724 Private
96 46.99932 -122.11715 UPPER PUYALLUP 1729 State
97 45.63382 -122.21104 WASHOUGAL 721 Private
98 45.70737 -122.26008 WASHOUGAL 1466 State
99 45.66612 -122.29105 WASHOUGAL 1098 State
100 45.75315 -122.02144 WIND 1235 State
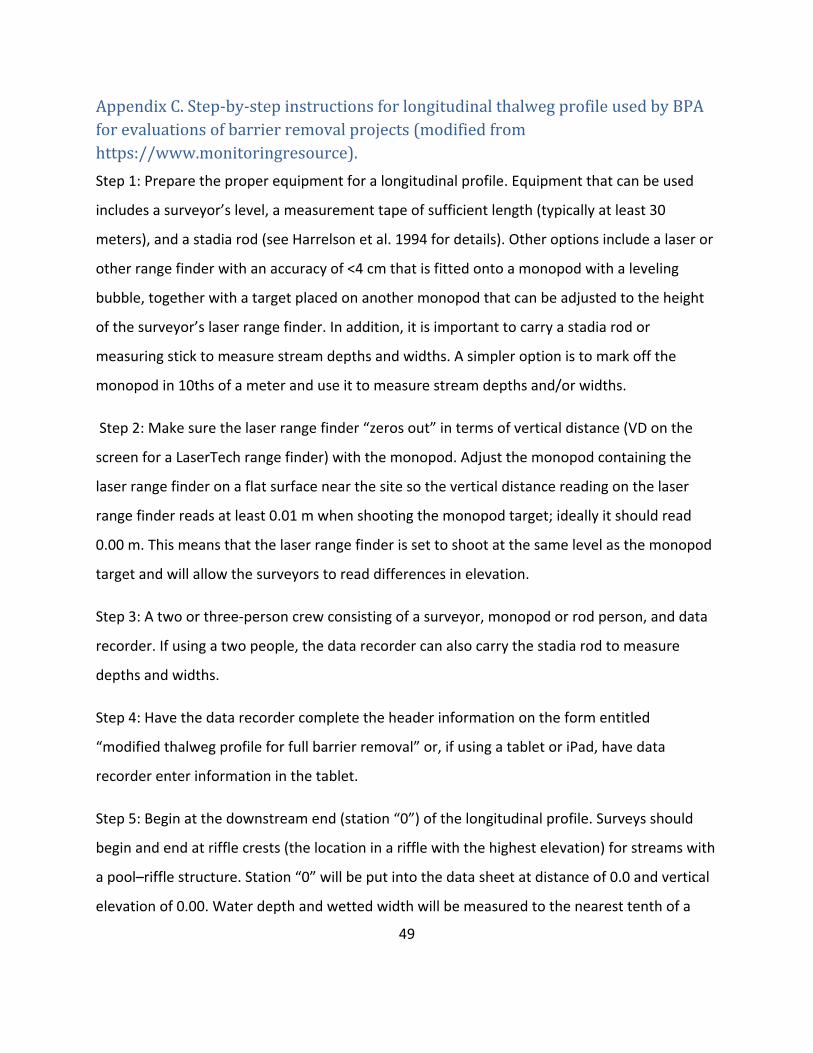
49
Appendix C. Step-by-step instructions for longitudinal thalweg profile used by BPA for evaluations of barrier removal projects (modified from https://www.monitoringresource).
Step 1: Prepare the proper equipment for a longitudinal profile. Equipment that can be used
includes a surveyor’s level, a measurement tape of sufficient length (typically at least 30
meters), and a stadia rod (see Harrelson et al. 1994 for details). Other options include a laser or
other range finder with an accuracy of <4 cm that is fitted onto a monopod with a leveling
bubble, together with a target placed on another monopod that can be adjusted to the height
of the surveyor’s laser range finder. In addition, it is important to carry a stadia rod or
measuring stick to measure stream depths and widths. A simpler option is to mark off the
monopod in 10ths of a meter and use it to measure stream depths and/or widths.
Step 2: Make sure the laser range finder “zeros out” in terms of vertical distance (VD on the
screen for a LaserTech range finder) with the monopod. Adjust the monopod containing the
laser range finder on a flat surface near the site so the vertical distance reading on the laser
range finder reads at least 0.01 m when shooting the monopod target; ideally it should read
0.00 m. This means that the laser range finder is set to shoot at the same level as the monopod
target and will allow the surveyors to read differences in elevation.
Step 3: A two or three‐person crew consisting of a surveyor, monopod or rod person, and data
recorder. If using a two people, the data recorder can also carry the stadia rod to measure
depths and widths.
Step 4: Have the data recorder complete the header information on the form entitled
“modified thalweg profile for full barrier removal” or, if using a tablet or iPad, have data
recorder enter information in the tablet.
Step 5: Begin at the downstream end (station “0”) of the longitudinal profile. Surveys should
begin and end at riffle crests (the location in a riffle with the highest elevation) for streams with
a pool–riffle structure. Station “0” will be put into the data sheet at distance of 0.0 and vertical
elevation of 0.00. Water depth and wetted width will be measured to the nearest tenth of a
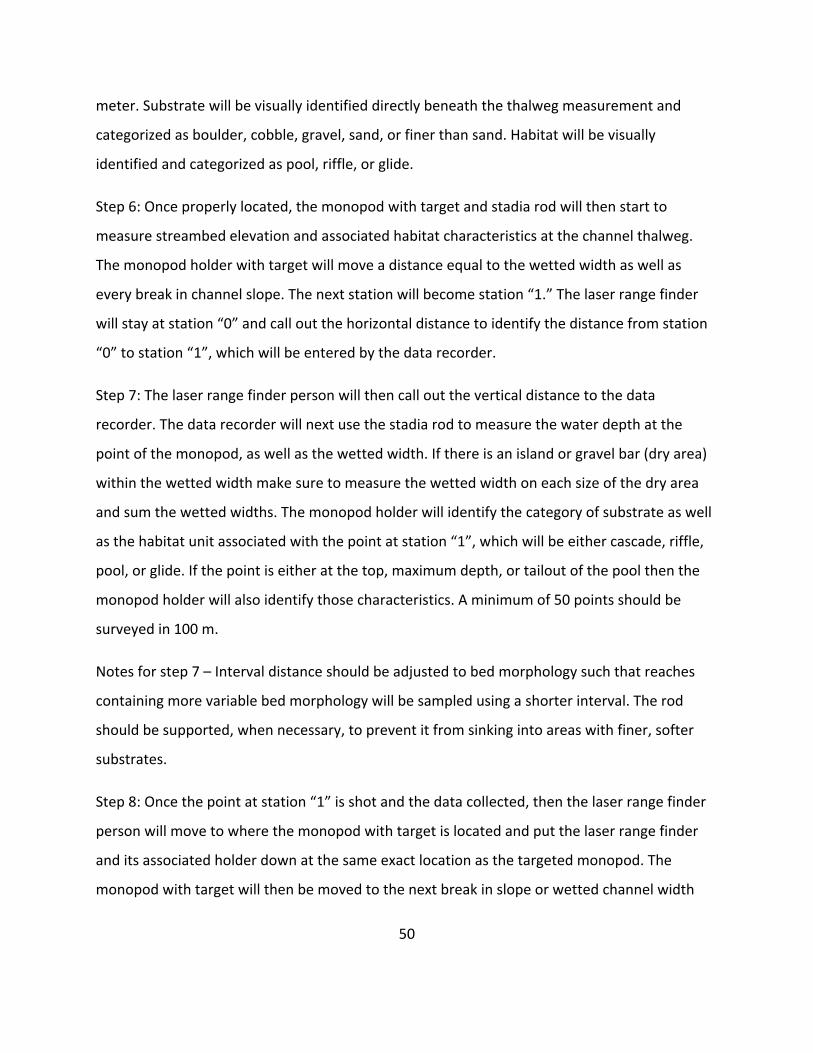
50
meter. Substrate will be visually identified directly beneath the thalweg measurement and
categorized as boulder, cobble, gravel, sand, or finer than sand. Habitat will be visually
identified and categorized as pool, riffle, or glide.
Step 6: Once properly located, the monopod with target and stadia rod will then start to
measure streambed elevation and associated habitat characteristics at the channel thalweg.
The monopod holder with target will move a distance equal to the wetted width as well as
every break in channel slope. The next station will become station “1.” The laser range finder
will stay at station “0” and call out the horizontal distance to identify the distance from station
“0” to station “1”, which will be entered by the data recorder.
Step 7: The laser range finder person will then call out the vertical distance to the data
recorder. The data recorder will next use the stadia rod to measure the water depth at the
point of the monopod, as well as the wetted width. If there is an island or gravel bar (dry area)
within the wetted width make sure to measure the wetted width on each size of the dry area
and sum the wetted widths. The monopod holder will identify the category of substrate as well
as the habitat unit associated with the point at station “1”, which will be either cascade, riffle,
pool, or glide. If the point is either at the top, maximum depth, or tailout of the pool then the
monopod holder will also identify those characteristics. A minimum of 50 points should be
surveyed in 100 m.
Notes for step 7 – Interval distance should be adjusted to bed morphology such that reaches
containing more variable bed morphology will be sampled using a shorter interval. The rod
should be supported, when necessary, to prevent it from sinking into areas with finer, softer
substrates.
Step 8: Once the point at station “1” is shot and the data collected, then the laser range finder
person will move to where the monopod with target is located and put the laser range finder
and its associated holder down at the same exact location as the targeted monopod. The
monopod with target will then be moved to the next break in slope or wetted channel width
51
and identify that as station “2”. Stations will be surveyed until the survey crew get to the upper
terminus of that reach. GPS coordinates will be then checked again against the original GPS
point identified at the terminus to make sure the crew surveyed the entire reach. In general,
the survey should include between 40 to 100 stations.
Table C‐1 below provides an example of data typical collected with above protocol. A key
difference would be that for the DNR PHB study bankfull width would be measured at every
station rather than just every 25 meters.

52
Table C‐1. Example of long‐profiled data collected using the above protocol. Unpublished Bonneville Power Administration data from Corral Creek, Idaho. For the proposed PHB study, bankfull width would be recorded at every station.