Embed Size (px)
Citation preview
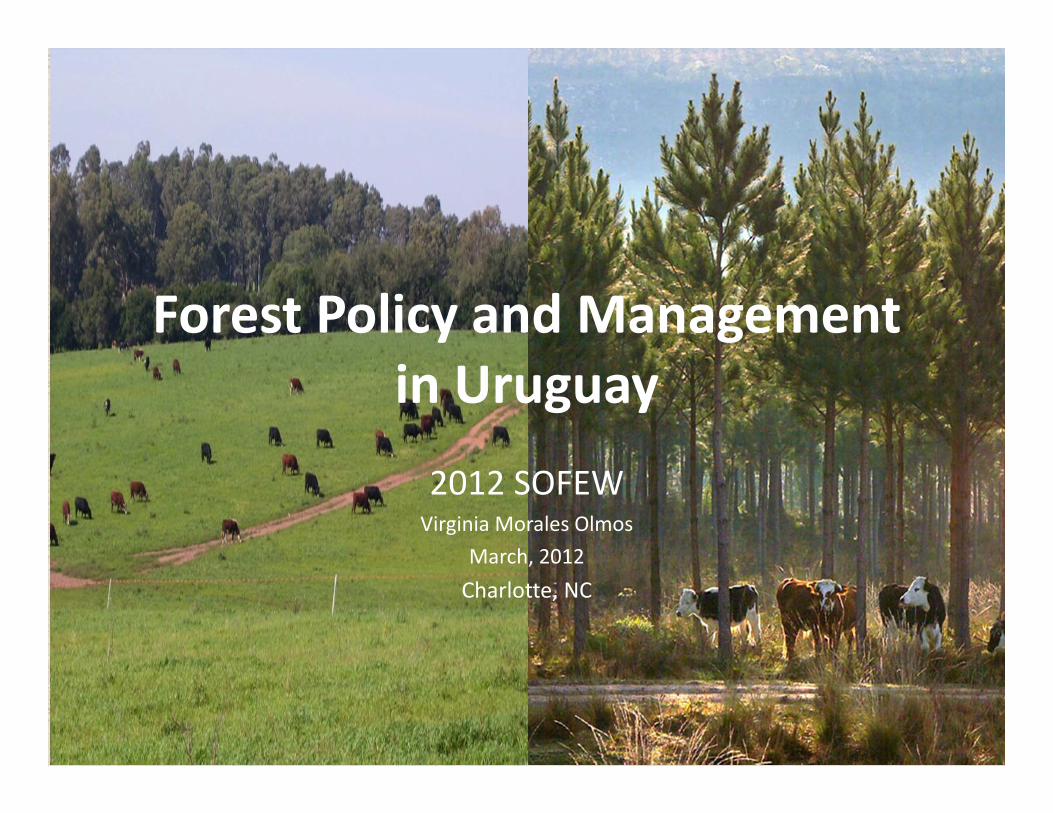
Forest Policy and Management in Uruguay
2012 SOFEWVirginia Morales Olmos
March, 2012Charlotte, NC
Outline• Uruguay: location and key facts
• The forest sector
• Regulation
• Major players
• Cost‐benefit analysis
• Questions?

Uruguay
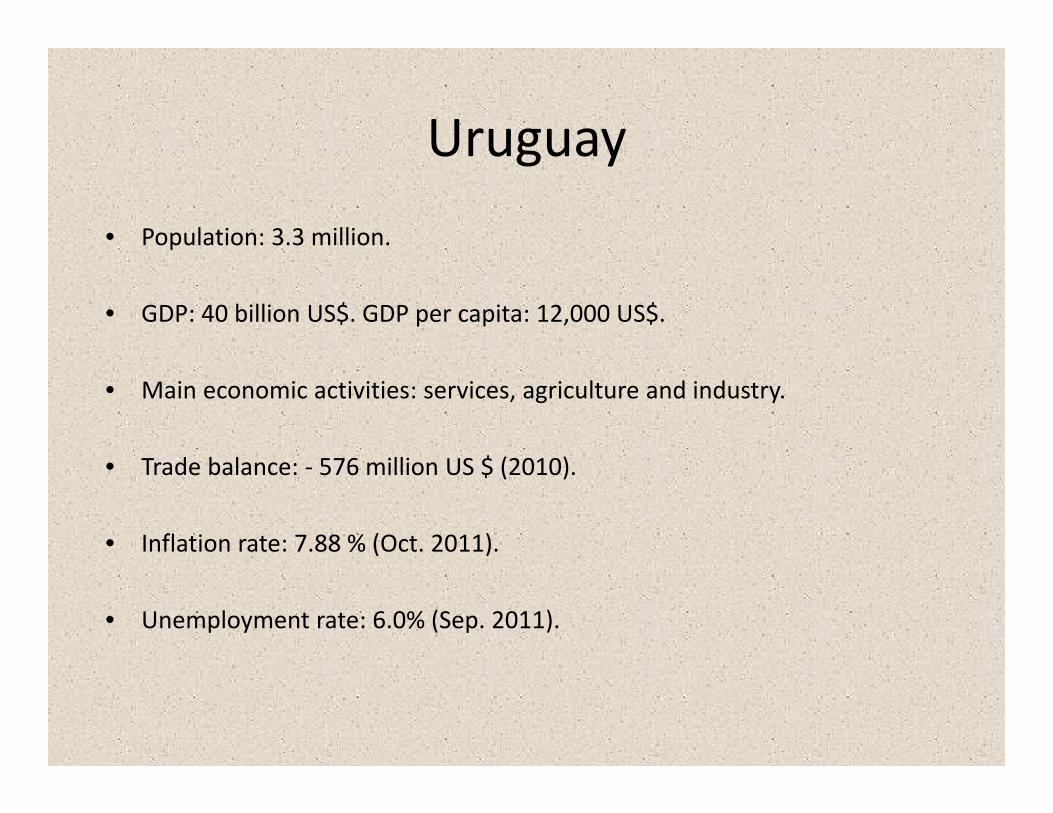
Uruguay• Population: 3.3 million.
• GDP: 40 billion US$. GDP per capita: 12,000 US$.
• Main economic activities: services, agriculture and industry.
• Trade balance: ‐ 576 million US $ (2010).
• Inflation rate: 7.88 % (Oct. 2011).
• Unemployment rate: 6.0% (Sep. 2011).

The forest sector• Total forest area 1.5 million ha (3.7 million acres):
Plantations = 850,000 ha (*)(2.1 million acres)
Native forest = 750,000 ha (1.8 million acres)
• Plantations: exotic. Eucalyptus grandis, Eucalyptus globulus, Loblolly pineand Slash pine.
• Growth rates: Eucalyptus grandis for solid wood, average MAI is 27 to 35 cubic meters/hectare/year (m3/ha/yr); for pulp, average MAI is 22 to 40 m3/ha/yr. Pine, average MAI is 18 to 27 m3/ha/yr.
• Management regimes: rotations are 15‐16 years for eucalyptus grown for sawtimber, with at least one intermediate thinning, and 7‐9 years old for eucalyptus grown for pulp. For pine, rotations are between 22 to 28 years old.
• Land: private ownership. (*)
Estimated 950,000 ha.

Forest Landscape (North)

Area by species
0
100,000
200,000
300,000
400,000
500,000
600,000
700,000
800,000
900,000
1,000,000 1975‐1989
1990
1991
1992
1993
1994
1995
1996
1997
1998
1999
2000
2001
2002
2003
2004
2005
2006
2007
2008
2009
2010
Area
(in ha
)
Year
Pine
Eucalyptus
Source: Uruguay Forest Division, 2011

Harvest
0
2,000
4,000
6,000
8,000
10,000
12,000
14,000
2000 2001 2002 2003 2004 2005 2006 2007 2008 2009 2010
'000
m3
Year
No conifers
Conifers
Source: Uruguay Forest Division, 2011
• Harvest has been increasing since 2000.• The majority of the volume comes from Eucalyptus plantations.• The main products are chips and pulp.
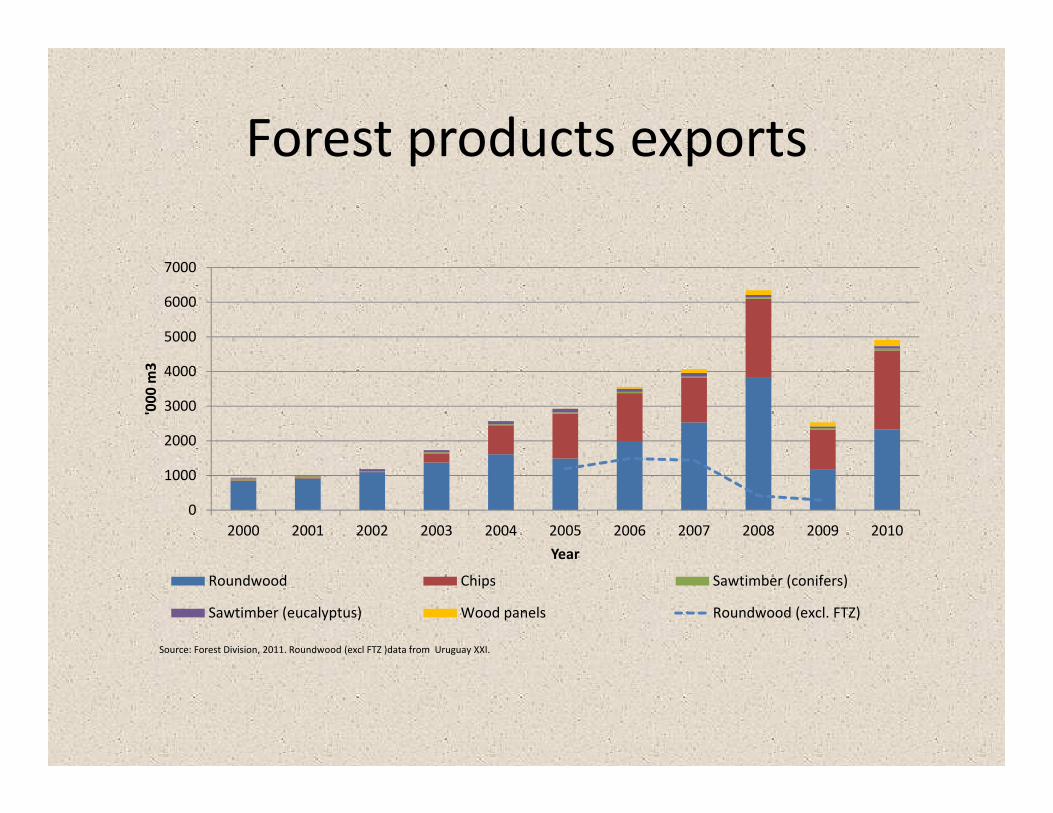
Forest products exports
0
1000
2000
3000
4000
5000
6000
7000
2000 2001 2002 2003 2004 2005 2006 2007 2008 2009 2010
'000
m3
Year
Roundwood Chips Sawtimber (conifers)
Sawtimber (eucalyptus) Wood panels Roundwood (excl. FTZ)
Source: Forest Division, 2011. Roundwood (excl FTZ )data from Uruguay XXI.
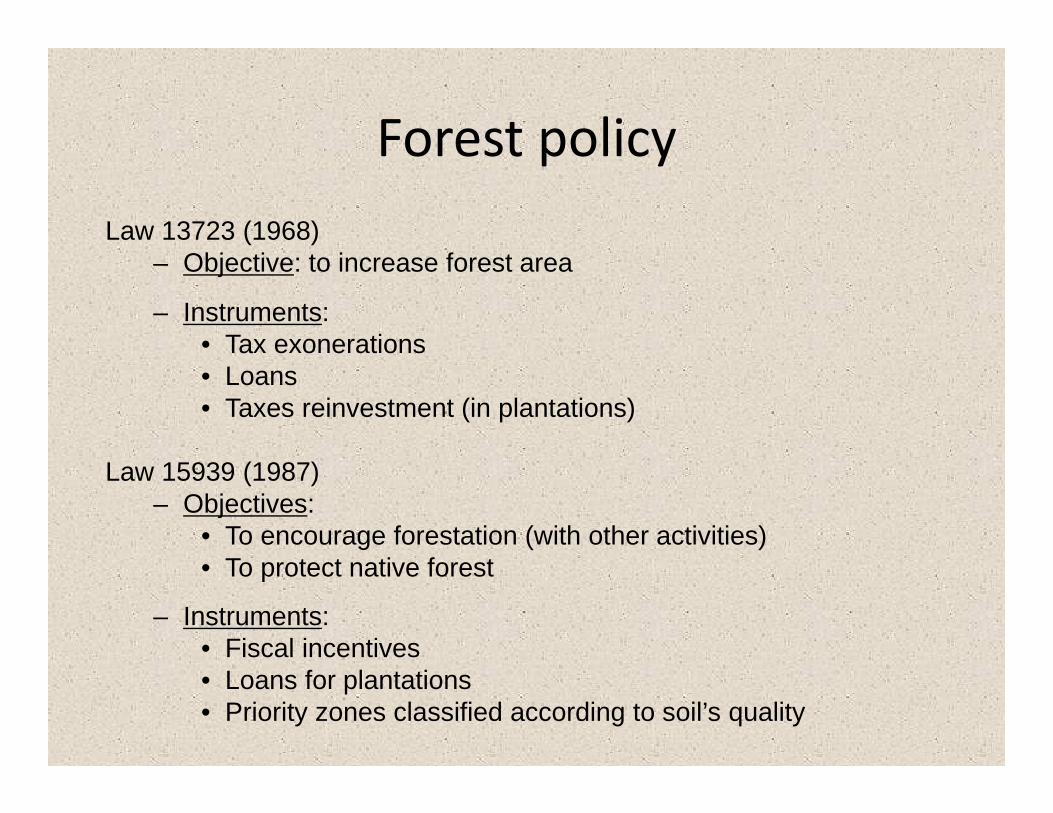
Forest policyLaw 13723 (1968)
– Objective: to increase forest area
– Instruments: • Tax exonerations• Loans• Taxes reinvestment (in plantations)
Law 15939 (1987)– Objectives:
• To encourage forestation (with other activities)• To protect native forest
– Instruments:• Fiscal incentives• Loans for plantations• Priority zones classified according to soil’s quality
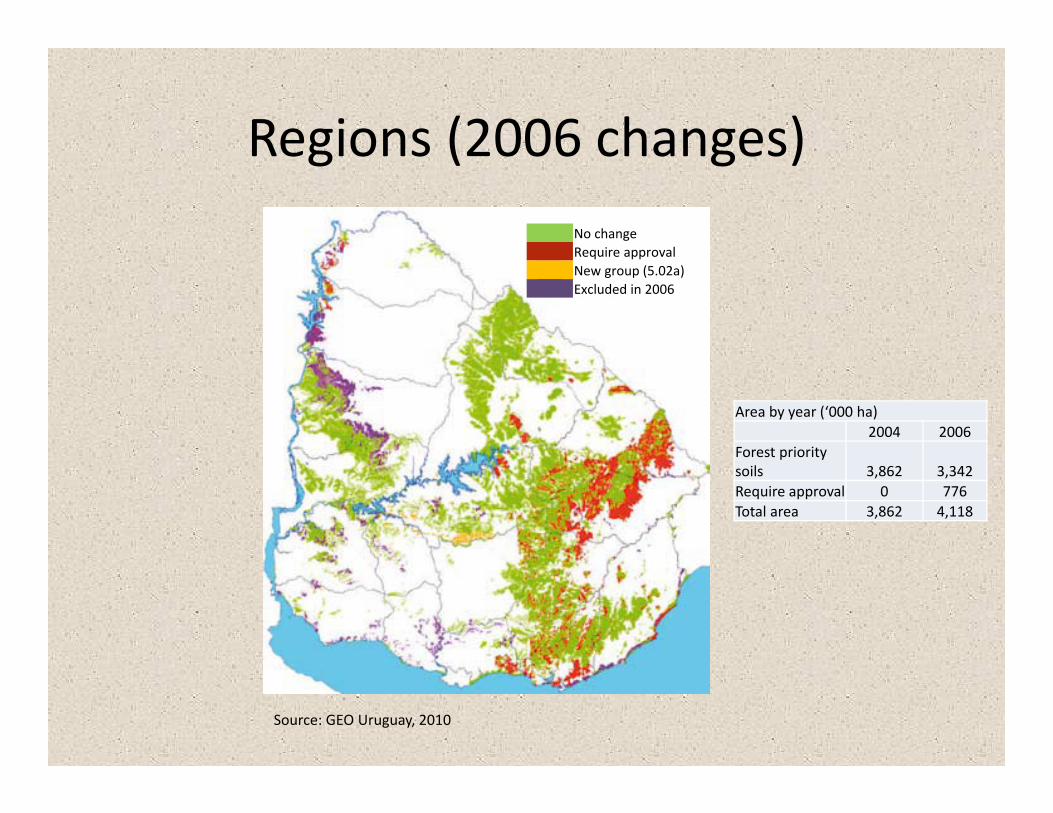
Regions (2006 changes)
Area by year (‘000 ha)2004 2006
Forest priority soils 3,862 3,342Require approval 0 776Total area 3,862 4,118
No changeRequire approvalNew group (5.02a)Excluded in 2006
Source: GEO Uruguay, 2010

Major playersUruguayan Entity
International Entity Capital by origin
Industry Plantations AdministrationUPM Uruguay UPM Forestal Oriental UPM Uruguay UPM Finland
Montes del Plata Montes del Plata (*) Montes del Plata Stora Enso/Arauco Sweden/Finland/ChileWeyerhaeuser (**) Weyerhaeuser Weyerhaeuser Weyerhaeuser USA
Urupanel nc Urupanel ‐ ChileCOFUSA COFUSA COFUSA nc UruguayFymnsa Fymnsa Fymnsa ‐ Uruguay
nc Caja de ProfesionalesUniversitarios
Caja de ProfesionalesUniversitarios nc Uruguay
nc Caja Bancaria Caja Bancaria nc UruguayCaja Notarial Caja Notarial nc Uruguay
nc FAS FAS Harvard USARio Biabo Rio biabo Harvard USA
nc GFP Cambium GFP USAnc GMO GMO GMO USAnc RMK RMK RMK USA
(*) In some cases, they keep the original ownership by company.(**) Weyerhaeuser Productos SA, Weyerhaeuser Uruguay SA, Colonvade, Vandora

Thesis research objective
To evaluate the impact of the new forest sector on the Uruguayan
Economy, by considering costs and benefits associated with the policy
that started with the Forestry Law 15939.
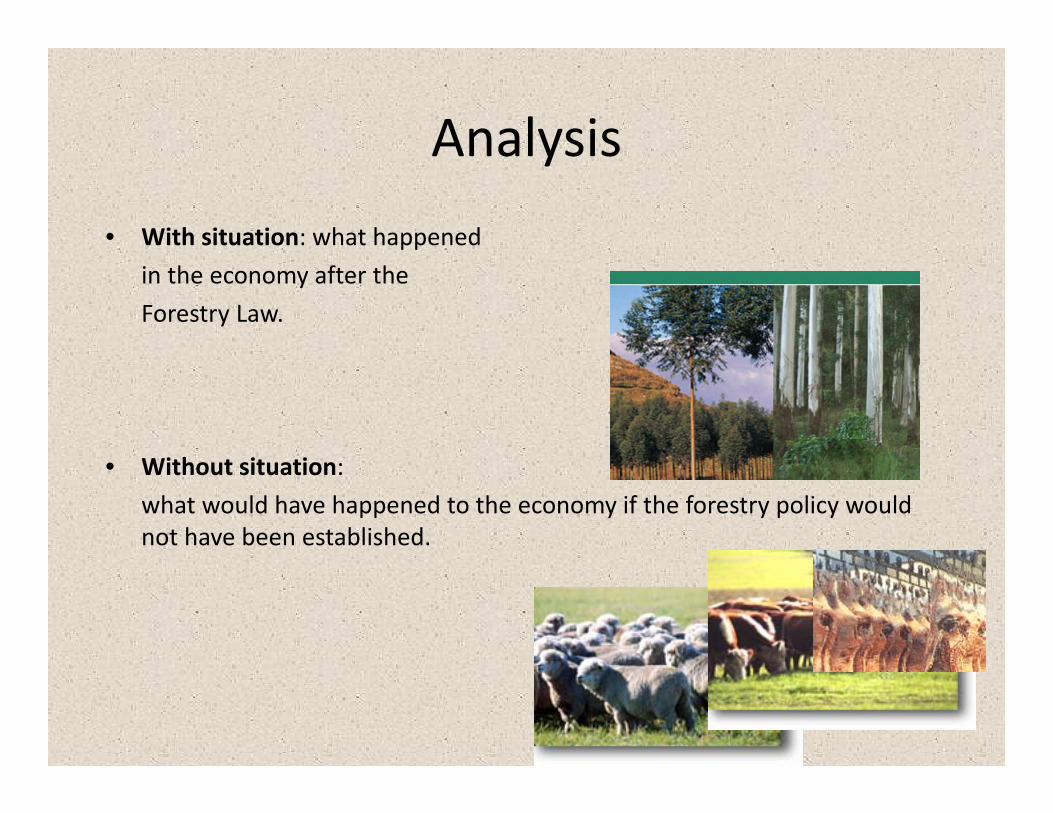
Analysis• With situation: what happened
in the economy after the Forestry Law.
• Without situation: what would have happened to the economy if the forestry policy would not have been established.

The model• Primary and Secondary information.
• Production estimated based on growth rates and management plans.
• Costs: labor and imports of each category considered.
• Benefits: exports according to production estimations. Pulpwood: exported; sawn wood: processed and exported as sawtimber (conversion: 45% of sawn wood).
• Terminal Value: BLV (land), decreasing depreciation (industry).

Results• Positive impact compared with livestock in the period 1989-2005.
IRR = 36.4%NPV 1989 (6%) million US $ = 630.2
• The most important wood industry activity had not yet started.
Sensitivity analysis• Results very sensitive to changes in:
1. Wood prices2. Yields3. Land Prices
• Results not very sensitive to changes in:
1. Management costs2. Transportation costs
Research conclusions• Forestry had a positive impact compared to livestock.
• Increased exports.
• More productive uses for poor quality lands.
• Attract foreign investment, generating income and employment, and providing environmental benefits.
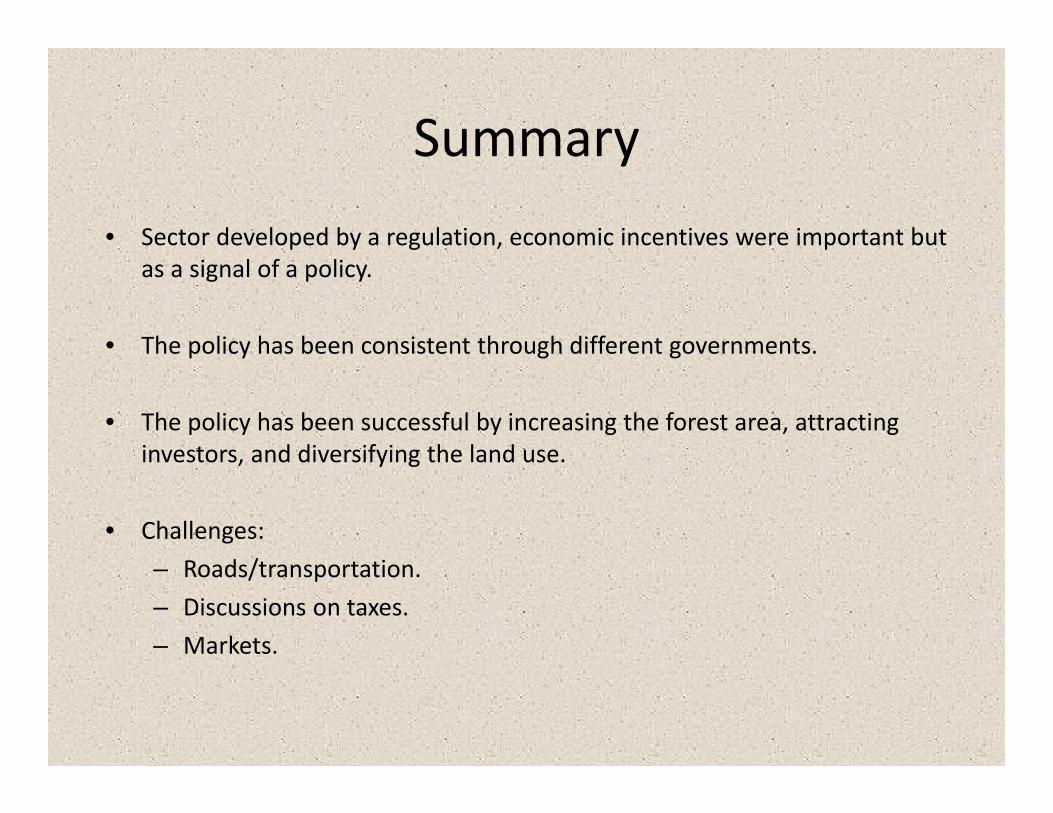
Summary• Sector developed by a regulation, economic incentives were important but
as a signal of a policy.
• The policy has been consistent through different governments.
• The policy has been successful by increasing the forest area, attracting investors, and diversifying the land use.
• Challenges: – Roads/transportation.– Discussions on taxes.– Markets.

Questions?


![Caja parrafo[2]](https://img.pdfslide.us/doc/110x75/55adfd611a28ab353c8b4658/caja-parrafo2.jpg)