Embed Size (px)
Citation preview

WEB CONFERENCEFOREST OPERATIONS PROGRAM 2019-2020
Climate Change Tools for Design Flood CalculationsFebruary 6th 2020
With: MATT KUROWSKI, Researcher, Transportation Group
Notes: • The webinar will start at 13:00 EST / 10:00 PST • All lines are muted during the presentation• Go to slido.com (smartphone or computer) to participate in live polls. code: fpi• Audio connection: 1-844-630-9442; code: 736 173 621

An Overview of Climate Change Tools Applied to Small Watershed Design Flood Calculations
Webinar Series: Understanding Climate Change at a Small Watershed ScaleMatt Kurowski, M.Sc., EIT| Feb 6, 2020
Copie et redistribution interdites. | Copying and redistribution prohibited.

February 27
Rainfall Intensity Duration Frequency Curves for Future Climate
Scenarios: A Publicly Accessible Computer Tool – Dr. Simonovic, Institute
for Catastrophic Loss Reduction, Western University
February 13
Climate tools: What are they good for? Absolutely something… but you
can’t always get what you want – Kari Tyler, Pacific Climate Impacts
Consortium, University of Victoria
February 6
An Overview of Climate Change Tools Applied to Small Watershed Design
Flood Calculations – Matt Kurowski, FPInnovations, Vancouver
Webinar SeriesUnderstanding decision-making about climate change impacts at a small watershed scale
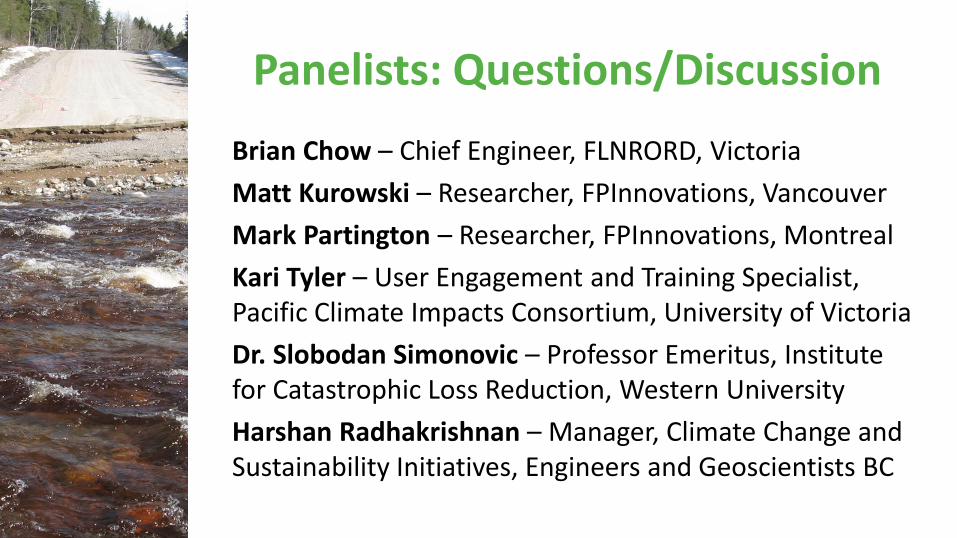
Panelists: Questions/Discussion
Brian Chow – Chief Engineer, FLNRORD, Victoria
Matt Kurowski – Researcher, FPInnovations, Vancouver
Mark Partington – Researcher, FPInnovations, Montreal
Kari Tyler – User Engagement and Training Specialist, Pacific Climate Impacts Consortium, University of Victoria
Dr. Slobodan Simonovic – Professor Emeritus, Institute for Catastrophic Loss Reduction, Western University
Harshan Radhakrishnan – Manager, Climate Change and Sustainability Initiatives, Engineers and Geoscientists BC

Why this webinar series?

Context
– Trends in practices
– Overview: how CC models for BC inform available CC tools
– Limitations: CC models/tools at small watershed scale
Using a CC tool
– 4 CC tools: focus on BC and small watershed flooding
Example location
– Comparing 4 CC tool interfaces and results
Summary
– Some trends for BC from CC tools and overall conclusions
Content of the Presentation

Poll # 2
Do you account for climate change in your resource road crossing designs?

Trends in Practices – 2018 Survey
Precipitation(rational method)
Design Flood
Interviews with 12 crossings designers in private and public sector:
• Field/Flow methods most trusted, rational method normally a check
• Limited modeling done/possible
• Consensus on biggest issue: not enough stream gauge stations - especially in smaller watersheds
• Majority not using CC tools – but are using EGBC guidance: 20%

Trends in Practices – 2019 WorkshopMix of designers, foresters, planners in private and public sector (~50 people):
• Not all private sector had heard of all available CC tools
• Those that have used them previously (mostly private sector) exposed through bigger budget projects
• Most in public sector had not heard of any CC tools
• Clearer guidance on CC needed
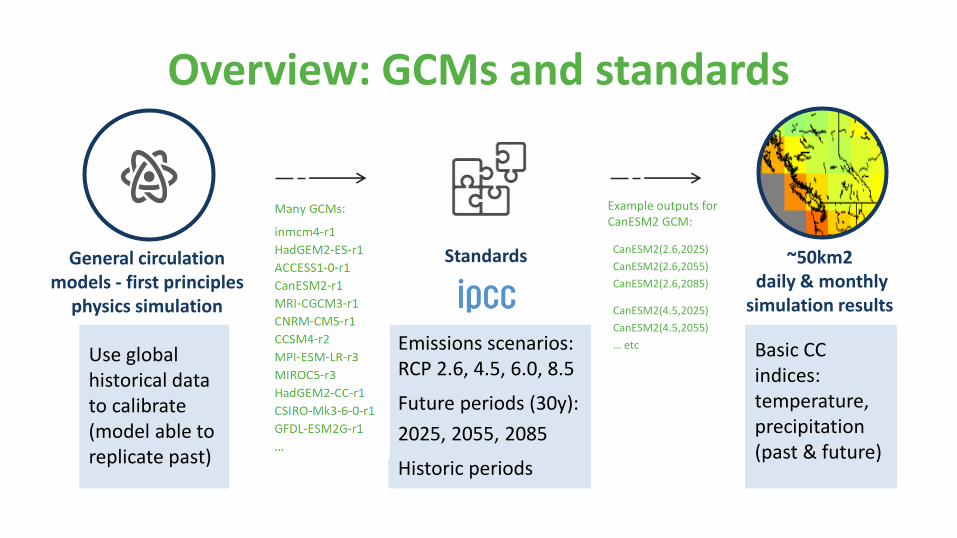
Overview: GCMs and standards
Emissions scenarios: RCP 2.6, 4.5, 6.0, 8.5
Future periods (30y):
2025, 2055, 2085
Historic periods
Use global historical data to calibrate (model able to replicate past)
General circulation models - first principles
physics simulation
Standards
Basic CC indices: temperature, precipitation (past & future)
~50km2daily & monthly
simulation results
Example outputs for CanESM2 GCM:
CanESM2(2.6,2025)
CanESM2(2.6,2055)
CanESM2(2.6,2085)
CanESM2(4.5,2025)
CanESM2(4.5,2055)
… etc

spatial and temporal downscaling
summary statistics of derived CC indices
any size – monthly
~4-10km² daily grid (~1950-2100)
~4-10km²monthly/daily
spatial downscaling –accounting for elevation, aspect
Overview: downscaling in BC
~50-100km²(mostly) monthly simulation results
(Group of ~15 models – focus on RCP 2.6, 4.5, 8.5) downscaling
program/service
~50km2daily & monthly
simulation results

Sub-daily data –precipitation
any size – monthly
temporal downscaling “weather generator”
IDF charts f(CC) at stations, spatial interpolation between
Overview: CC models and resulting CC tools
400 m²
800 m²
Any m²
~10 km²
seasonal
monthly +
monthly +
5-1000 mins
~4-10km²monthly/daily
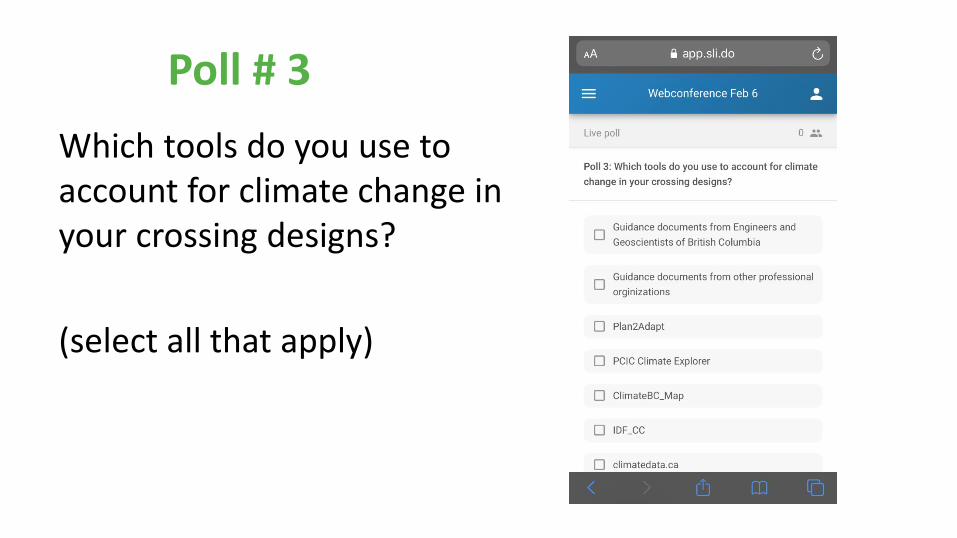
Poll # 3
Which tools do you use to account for climate change in your crossing designs?
(select all that apply)

Limitations: CC tools at small watershed scale
USING PRECIPITATION DATA: Q100 design flood change due to CC (given that rain is dominant flood)
engineers: “need to rely on projections of daily extremes and professional judgement”
Assumption: temporally downscaled sub-daily data will have the same relationship to daily data in the future as in the past

“likely safe to assume”: increases in short storm intensities proportional to magnitude and direction of averages (but consult CC specialist)
Should be “treated with caution” and as an exploratory tool
USING PRECIPITATION DATA: Q100 design flood change due to CC (given that rain is dominant flood)
Limitations: CC tools at small watershed scale

Many “secondary” indices that may be useful for design flood hydrology (DFH) risk considerations…
USING PRECIPITATION DATA: Q100 design flood change due to CC (given that rain is dominant flood)
Limitations: CC tools at small watershed scale

definelocation
GCM(s): CNRM-CM5-r1CanESM-r1
ACCESS-0-r1inmcm4-r1Ensemble
Using 4 CC tools – inputs
Scenario(s): 2.6, 4.5, 6.0, 8.5Time period: 2025, 2055, 2085Baseline reference: 1961-1990
other periods
Pick from list of areasClick map point
Click station pointClick ungauged point
Draw/Import Area
Click map point
define future

Pick from list of areas
use CCindices
For small watershed flood:precipitation (rain and snow)
seasonal, 400m²
Click map point
Using 4 CC tools – available/applicable outputs

Draw/Import area
For small watershed flood:pr – Precipitation
monthly ~ 4km²
rx1dayETCCDI – Max 1-day Precipitationdaily ~ 4km²
use CCindices
Using 4 CC tools – available/applicable outputs

Click map point
use CCindicesFor small
watershed flood:precipitation
monthly, 800 m²
Using 4 CC tools – available/applicable outputs

Click station pointClick ungauged point
use CCindices
For small watershed flood:better to use collection of stations
(especially in mountains)
Using 4 CC tools – available/applicable outputs

Poll # 4
What one component of design flood hydrology is most uncertain for small, remote watersheds?
(leave empty if you do not know enough on the topic)
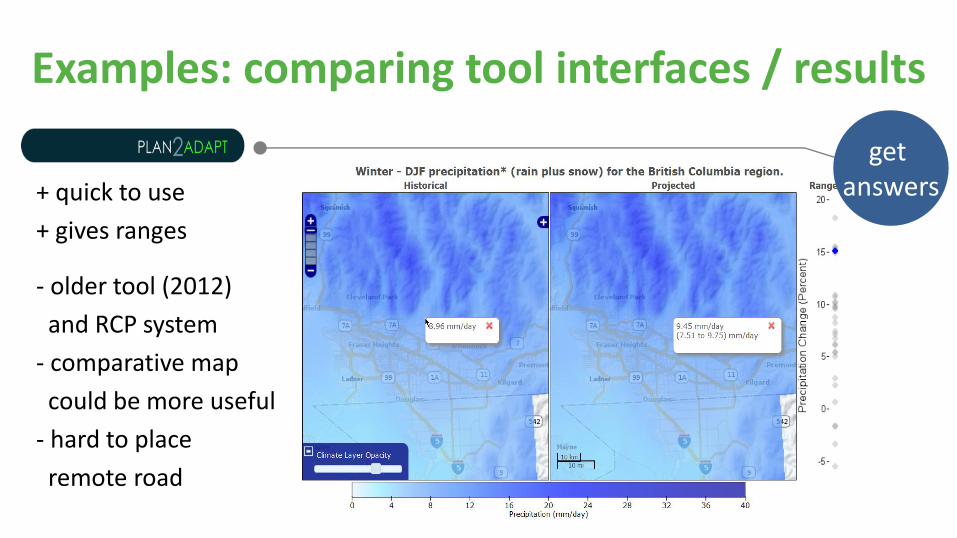
Examples: comparing tool interfaces / results
+ quick to use
+ gives ranges
- older tool (2012)
and RCP system
- comparative map
could be more useful
- hard to place
remote road
get answers

Examples: comparing tool interfaces / results
get answers

Examples: comparing tool interfaces / results
+ new indices
+ has all important
GCMs
+ easy to compare
- no ensembles
- a lot of information
to sift through
get answers
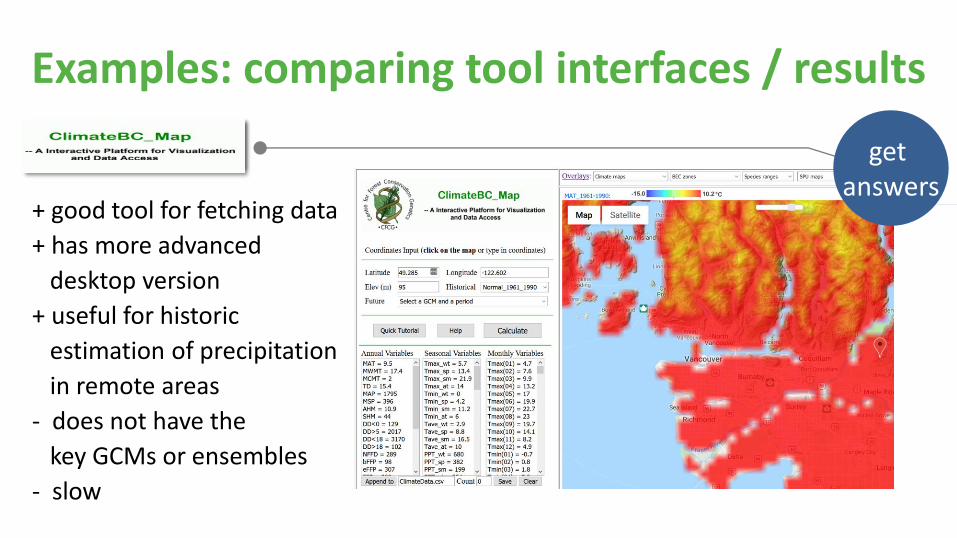
Examples: comparing tool interfaces / results
+ good tool for fetching data
+ has more advanced
desktop version
+ useful for historic
estimation of precipitation
in remote areas
- does not have the
key GCMs or ensembles
- slow
get answers
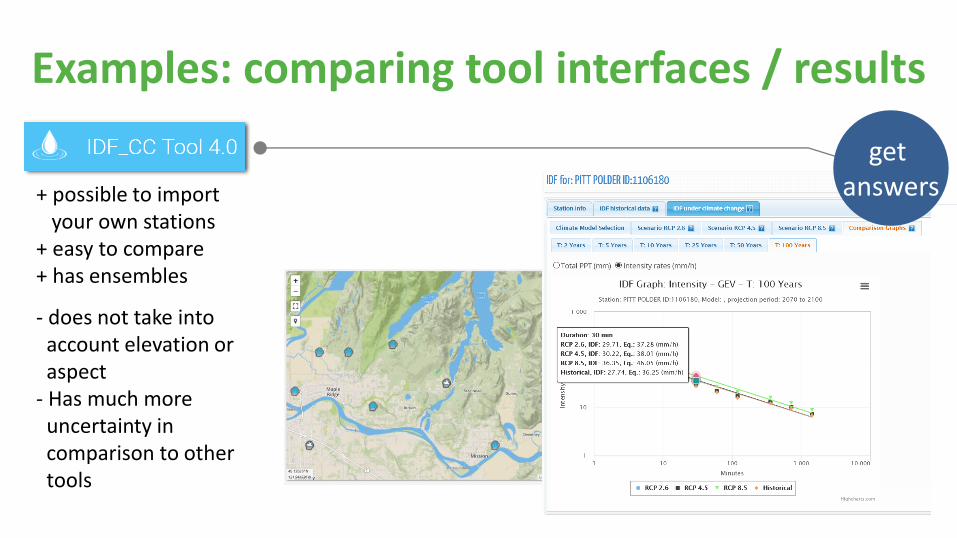
Examples: comparing tool interfaces / results
+ possible to import your own stations
+ easy to compare+ has ensembles
- does not take into account elevation or aspect
- Has much more uncertainty in comparison to other tools
get answers

Examples: comparing tool interfaces / results
Comparing results for UBC forest Percent increase Q100 according to 4 CC tools
Plan2Adapt
PCEX-precip
PCEX rx1-day
ClimateBC_Map
IDF_CC
get answers

Poll # 5
How do you account for floating woody debris in culvert crossing designs?
(select all that apply)
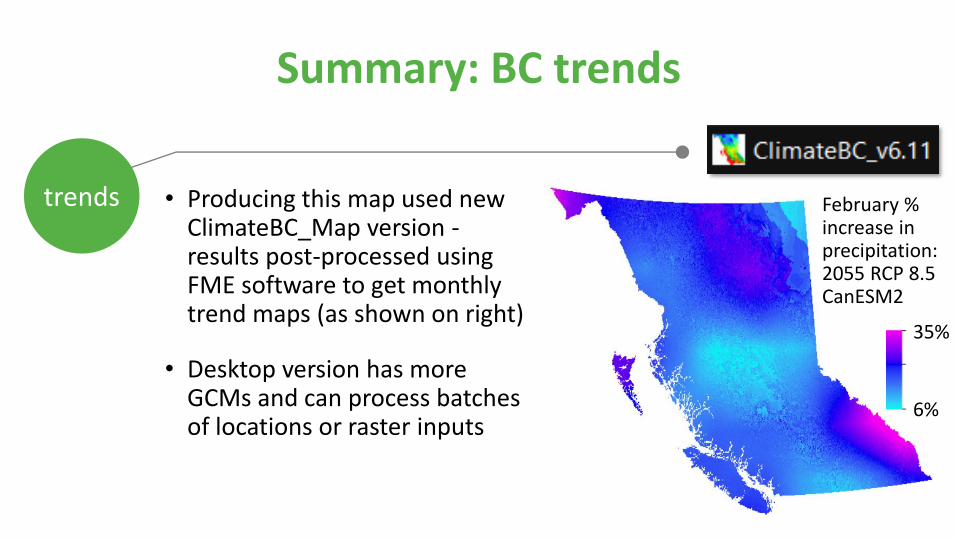
trends • Producing this map used new ClimateBC_Map version -results post-processed using FME software to get monthly trend maps (as shown on right)
• Desktop version has more GCMs and can process batches of locations or raster inputs
February % increase in precipitation: 2055 RCP 8.5 CanESM2
35%
6%
Summary: BC trends

• Analysis for example small watershed area: 10 km2, ToC = 15 mins, C = 0.15
Averages for 2068:• 27% peak flow/precipitation increase• 9% culvert diameter increase
Summary: BC trends
trends
• Incorporated at least 3 IDF stations in each climatic region to calculate increase in precipitation
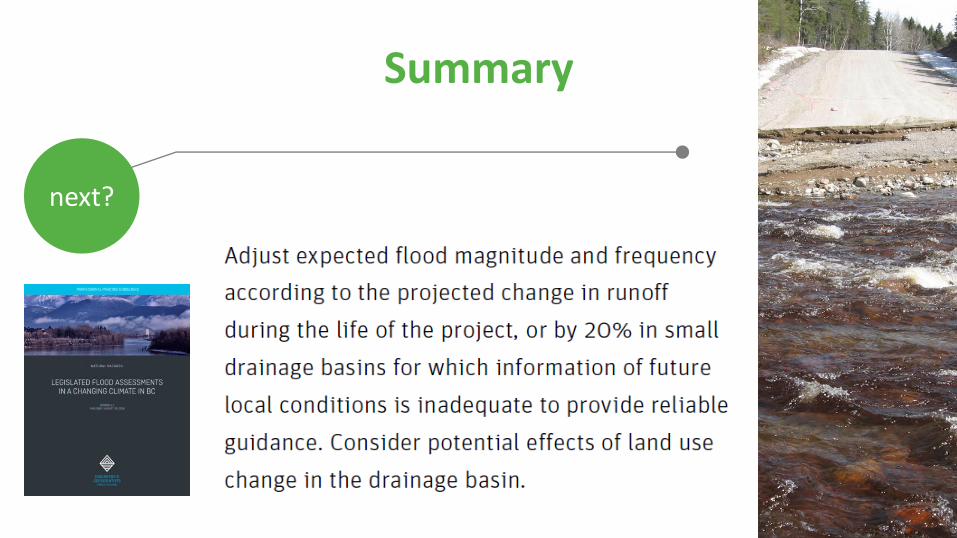
Summary
next?

Summary
next? • Guidelines – will not have a simple answer but clarify limitations and options for designers
• Best to compare answers from CC tools – each has strengths and weaknesses
• Crossings designers need to judge these tools to rationalize CC in crossings designs
• Incorporating debris floods is another tricky task – CC may change this too
• Keep current with CC tool developments

Resource Roads - Climate Change Team

Thank youMatt KurowskiResearcherFPInnovations
Poll # 6
How can climate change tools be improved? (include your email if you would like)

1. Open the participant listat the bottom of the screen to open a new window.
1.
2. At the bottom right of this new window, use the raise hand icon to indicate that you would like to ask a question using audio. over audio line be
unmuted)
Question Period1. s
2. You can also type your question in the Chat Box or the Q&A Box. Both are accessible at the bottom of your screen.
can also type in your question in
the Chat Box or in the Q&A box. The both boxes are at the bottom o
Participant list icon Chat Box Q&A box

Panelists: Questions/Discussion
Brian Chow – Chief Engineer, FLNRORD, Victoria
Matt Kurowski – Researcher, FPInnovations, Vancouver
Mark Partington – Researcher, FPInnovations, Montreal
Kari Tyler – User Engagement and Training Specialist, Pacific Climate Impacts Consortium, University of Victoria
Dr. Slobodan Simonovic – Professor Emeritus, Institute for Catastrophic Loss Reduction, Western University
Harshan Radhakrishnan – Manager, Climate Change and Sustainability Initiatives, Engineers and Geoscientists BC