Embed Size (px)
Citation preview

Forest Lake Elementary Strategic Plan 2018-2023

1
TABLE OF CONTENTS
School Renewal Plan Signature Page 2
Assurances for School Renewal Plan 3
Stakeholders Involvement for School Strategic Plan 6
Mission, Vision, Values, and Beliefs 8
Needs Assessment Data 9
Executive Summary of Needs Assessment Data Findings 18
Performance Goals and Action Plans 21

2
School Strategic Plan Signature Plan School District: Richland School District Two School: Forest Lake Elementary
6801 Brookfield Road Columbia, South Carolina 29206 803-782-0470 www.richland2.org/fle Phone Website
Strategic Plan for 2018-2023 (five years)
Superintendent
Dr. Baron Davis Printed name
Signature
[email protected] Email
April 23, 2018 Date
Principal
Dr. Kappy Steck Printed name
Signature
[email protected] Email
April 23, 2018 Date
Chairperson, School Improvement Council
Mr. Craig Plank Printed name
Signature
[email protected] Email
April 23, 2018 Date
Director of Planning
Mr. Will Simon Printed name
Signature
[email protected] Email
April 23, 2018 Date
School Reading To Succeed Literacy Leadership Team Lead
Mrs. Nan LaFitte Printed name
Signature
[email protected] Email
April 23, 2018 Date

3
The school renewal plan, or annual update, includes elements required by the Early Childhood Development and Academic Assistance Act of 1993 (Act 135) (S.C. Code Ann. §59-139-10 et seq. (Supp. 2004)), the Education Accountability Act of 1998 (EAA) (S.C. Code Ann. §59-18-1300 et seq. (Supp. 2004)), and SBE Regulation 43-261. The signatures of the chairperson of the board of trustees, the superintendent, the principal, and the chairperson of the School Improvement Council, and the School Read to Succeed Literacy Leadership team lead are
affirmation of active participation of key stakeholders and alignment with Act 135 and EAA requirements
ASSURANCES FOR SCHOOL PLANS
Act 135 Assurances Assurances checked and signed by the district superintendent and the principal, attest that the school/district complies with all applicable Act 135 requirements.
__x___ Academic Assistance, Pre K–3 The school/district makes special efforts to assist children in PreK–3 who demonstrate a need for extra or alternative instructional attention (e.g., after-school homework help centers, individual tutoring, and group remediation). Provide a good example of academic assistance services for PreK–3 by referencing strategy # 1 and action step 1.1.7.
__x___ Academic Assistance, Grades 4–12 The school/district makes special efforts to assist children in grades 4–12 who demonstrate a need for extra or alternative instructional attention (e.g., after-school homework help centers, individual tutoring, and group remediation). Provide a good example of academic assistance services for grades 4–12 by referencing strategy #1 and action step 1.4.1
__x___ Parent Involvement The school/district encourages and assists parents in becoming more involved in their children’s education. Some examples of parent involvement initiatives include making special efforts to meet with parents at times more convenient for them, designating space in schools for parents to access educational resource materials, including parent involvement expectations as part of the principal’s and superintendent’s evaluations, and providing parents with information pertaining to expectations held for them by the school system, such as ensuring attendance and punctuality of their children. Provide a good example of parent involvement by referencing strategy # 4 and action step 4.1.1.
___x__ Staff Development The school/district provides staff development training for teachers and administrators in the teaching techniques and strategies needed to implement the school/district plan for the improvement of student academic performance. The staff development program reflects requirements of Act 135, the EAA, and the National Staff Development Council’s revised Standards for Staff Development. Provide a good example of staff development by referencing strategy # 3 and 3.2.3.

4
___x__ Technology The school/district integrates technology into professional development, curriculum development, and classroom instruction to improve teaching and learning. Provide a good example of the use of technology by referencing strategy # 1 and action step 1.3.4(additional technology assurances for districts follow the Act 135 assurances).
__x___ Innovation The school/district uses innovation funds for innovative activities to improve student learning and accelerate the performance of all students. Provide a good example of the use of innovation funds by referencing strategy #1 and 1.3.3.
__x___ Recruitment The school/district makes special efforts to recruit and give priority in parenting and family literacy activities to parents of at-risk 0–5 year olds. The recruitment program is not grade specific, but normally would be most appropriate for parents of children at the primary and elementary school levels and below, and for secondary school students who are parents.
__x___ Collaboration The school/district (regardless of the grades served) collaborates with health and human services agencies (e.g., county health departments, social services departments, mental health departments, First Steps, and the family court system).
__x___ Developmental Screening The school/district ensures that the young child receives all services necessary for growth and development. Instruments are used to assess physical, social, emotional, linguistic, and cognitive developmental levels. This program normally is appropriate at primary and elementary schools, although screening efforts could take place at any location.
__x___ Half-Day Child Development The school/district provides half-day child development programs for four-year-olds (some districts fund full-day programs). The programs usually function at primary and elementary schools, although they may be housed at locations with other grade levels or completely separate from schools.
__x__ Best Practices in Grades K–3 The school/district provides in grades K–3 curricular and instructional approaches that are known to be effective in the K–3 setting.
__x___ Developmentally Appropriate Curriculum for PreK–3 The school/district ensures that the scope and sequence of the curriculum for Pre K–3 are appropriate for the maturation levels of students. Instructional practices accommodate individual differences in maturation level and take into account the student's social and cultural context.
__x___ Parenting and Family Literacy The school/district provides parenting activities and opportunities for parents of at-risk 0–5 year olds to improve their educational level. This program is not grade specific, but generally is most appropriate for parents of children at the primary and elementary school levels and below, and for secondary school students who are
5
parents. Some districts operate the program at various schools, an early childhood development center, or some other location, while other districts operate the program through home visits.
__x___ Coordination of Act 135 Initiatives with Other Federal, State, and District Programs The school/district ensures as much program effectiveness as possible by developing a districtwide/schoolwide coordinated effort among all programs and funding. Act 135 initiatives are coordinated with programs such as Head Start, First Steps, Title I, and programs for students with disabilities.
__x__ The School-to-Work Transition Act of 1994 (STW) The school/district provides required STW programs for grades 6–12, and STW concepts are a part of the developmentally appropriate curriculum for K–12.
Dr. Baron Davis ___________________________________ _______ Superintendent’s Printed Name Superintendent’s Signature Date
(for district and school plans) Dr. Kappy Steck ___________________________________ _______ Principal’s Printed Name Principal’s Signature Date

6
STAKEHOLDER INVOLVEMENT
The following persons were involved in the development of the five (5)-year strategic plan.
1. PRINCIPAL Dr. Kappy Steck
2. TEACHER Denise Duke
3. PARENT/GUARDIAN Torina Wood
4. COMMUNITY MEMBER Ms. Lizzie Padget
5. SCHOOL IMPROVEMENT COUNCIL Latonya Derrick, Chairperson
6. OTHERS* (May include school board members, administrators, School Improvement Council members, students, PTO members, agency representatives, university partners, etc.)
POSITION NAME
RCSD Deputy Tucker
Assistant Principal Maranda Hayward
Parent Ginger Van Vooren
Parent Shealy Reibold
7
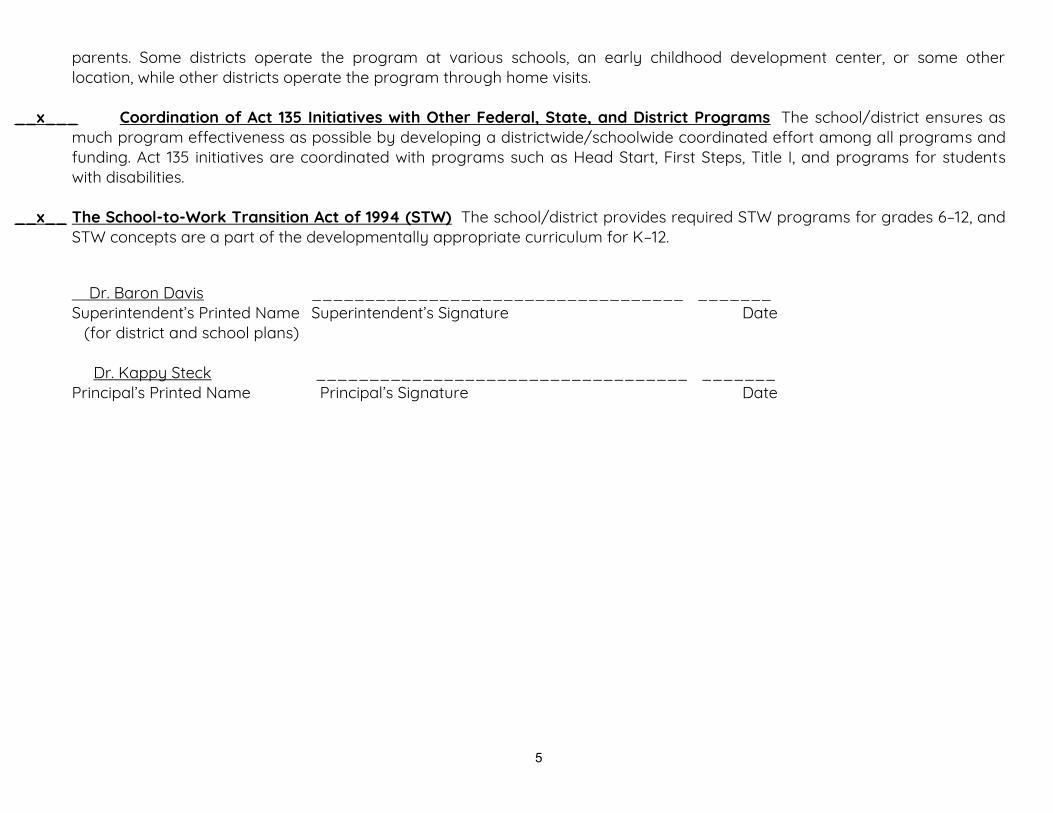
Parent Aimee Stewart
Parent Stacey Jenson
RCSD Troy Haddock
Parent Michelle Betette
Community Member Barbara Gibbons
*REMINDER: If state or federal grant applications require representation by other stakeholder groups, it is appropriate to include additional stakeholders to meet those requirements and to ensure that the plans are aligned.

8
Our School’s Purpose
Mission Statement:
Forest Lake Elementary NASA Explorer School, in partnership with our families and the community, provides through relevant and engaging learning experiences a rigorous literacy infused STEM-G academic program in a safe, nurturing
environment.
Vision Statement:
The Forest Lake Elementary NASA Explorer School administration, faculty, and staff work together to nurture and increase literacy and STEM-G academic achievement of 21st Century learners in order to create tomorrow’s leaders.

9
NEEDS ASSESSMENT DATA
Provide the link to your district’s most recent School Report Card: https://ed.sc.gov/data/report-cards/state-report-cards/2017/view/?y=2017&t=E&d=4002&s=074 Directions: Provide additional district’s needs assessment data including both formative and summative assessments used to gauge student learning. (Charts, graphs, or other formats of data may be used.) Formative Assessment Data Measures of Academic Progress (MAP) Table 1 shows the percent of students who met their reading and math growth target for the 2014-2015 through 2016-2017 school years by subgroup. Table 1: Percent of Students Who Met Their Growth Target on MAP by Subject and Subgroup
Subject and Subgroups 2014-2015 2015-2016 2016-2017
Count Percent Count Percent Count Percent Mathematics All Students 326 26.7% 311 29.9% 323 47.7% Ethnicity American Indian or Alaskan Native 2 -- 1 -- 1 -- Asian 9 -- 11 9.1% 13 76.9% Black or African American 243 23.5% 216 28.7% 216 40.3% Hispanic or Latino 14 35.7% 15 40.0% 20 75.0% Native Hawaiian or Other Pacific Islander
-- -- -- -- -- --
Two or More Races 5 -- 6 -- 11 63.6% White 53 37.7% 62 38.7% 62 54.8% Gender Female 160 23.1% 156 32.7% 172 45.3%

10
Male 166 30.1% 155 27.1% 151 50.3% Reading All Students 325 42.2% 310 47.4% 320 45.6% Ethnicity American Indian or Alaskan Native 2 -- 1 -- 1 -- Asian 9 -- 11 63.6% 13 61.5% Black or African American 241 38.6% 216 44.0% 218 38.5% Hispanic or Latino 14 35.7% 13 46.2% 20 60.0% Native Hawaiian or Other Pacific Islander
-- -- -- -- -- --
Two or More Races 5 -- 6 -- 10 90.0% White 54 57.4% 63 60.3% 58 56.9% Gender Female 160 40.6% 152 44.1% 168 50.6% Male 165 43.6% 158 50.6% 152 40.1% -- Data not reported for subgroups less than 10 students.
Summative Assessment Data South Carolina Kindergarten Readiness Assessment Table 2 shows the percent of students demonstrating overall readiness and readiness in each of the domains on the 2016-2017 South Carolina Kindergarten Readiness Assessment (KRA) by subgroup. Table 2: Percent of students demonstrating readiness by subgroup
Subgroup Count Overall Performance
Language & Literacy
Mathematics Social Foundations
Physical Well-Being and
Motor Development
All 108 47.2% 45.4% 40.7% 57.4% 48.1%
Gender
Female 56 55.4% 48.2% 39.3% 62.5% 55.4%
Male 52 38.5% 42.3% 42.3% 51.9% 40.4%

11
Ethnicity
Asian 7 71.4% 42.9% 42.9% 85.7% 71.4%
Afr. American 61 39.3% 42.6% 32.8% 49.2% 42.6%
Hispanic 7 0.0% 28.6% 14.3% 0.0% 0.0%
White 29 69.0% 55.2% 62.1% 82.8% 65.5%
Other 4 -- -- -- -- --
Lunch Status
Free/Reduced 60 30.0% 31.7% 26.7% 45.0% 35.0%
Pay 48 68.8% 62.5% 58.3% 72.9% 64.6% English
Proficiency
LEP 10 30.0% 30.0% 10.0% 40.0% 20.0%
Non-LEP 98 49.0% 46.9% 43.9% 59.2% 51.0%
IEP Status
Non-Speech IEP 6 0.0% 0.0% 16.7% 0.0% 0.0%
No IEP 102 50.0% 48.0% 42.2% 60.8% 51.0%
Pre-Kindergarten
Head Start 5 -- -- -- -- --
PreK* 66 48.5% 45.5% 42.4% 59.1% 53.0%
None 19 36.8% 36.8% 36.8% 52.6% 26.3%
Unknown 18 61.1% 55.6% 33.3% 66.7% 61.1% -- Data not reported for subgroups less than 10 students.

12
South Carolina READY Tables 3.1 and 3.2 show the percent of students in grades 3 through 5 who scored Meets or Exceeds Expectations on the SC Ready English Language Arts and Mathematics tests for the 2015-2016 and 2016-2017 school years by subgroup. Table 3.1: Percent of Students (3-5) Who Score Meets or Exceeds Expectations on SC Ready ELA by Subgroup
Subgroup 2016 2017
Count Percent Count Percent
All Students 251 27.1% 277 30.0%
Gender
Male 129 22.5% 130 23.8%
Female 122 32.0% 147 35.4%
Ethnicity
Hispanic or Latino 16 0.0% 14 0.0%
American Indian or Alaska Native 1 -- 1 --
Asian 8 0.0% 10 0.0%
Black or African American 176 19.3% 192 19.8% Native Hawaiian or Other Pacific
Islander 0 -- 0 --
White 45 60.0% 50 62.0%
Two or more races 5 0.0% 10 0.0%
Disability
Disabled 49 4.1% 49 6.2%
Not Disabled 202 32.7% 228 35.1%
Migrant Status
Migrant 0 -- 0 --
Non-Migrant 251 27.1% 277 30.0%
English Proficiency
Limited English Proficient 17 0.0% 11 0.0%
13
Non-Limited English Proficient 234 28.2% 266 29.7%
Poverty
Students in Poverty (SIP) 162 16.1% 189 17.5%
Non-Students in Poverty (SIP) 83 49.4% 87 57.5% -- Data not reported for subgroups less than 10 students.

14
Table 3.2: Percent of Students (3-5) Who Scored Meets or Exceeds Expectations on SC Ready Math by Subgroup
Subgroup 2016 2017
Count Percent Count Percent
All Students 250 28.0% 277 35.8%
Gender
Male 129 30.3% 130 35.4%
Female 121 25.6% 147 36.1%
Ethnicity
Hispanic or Latino 16 0.0% 14 0.0%
American Indian or Alaska Native 1 -- 1 --
Asian 8 0.0% 10 0.0%
Black or African American 175 21.1% 192 27.6% Native Hawaiian or Other Pacific
Islander 0 -- 0 --
White 45 60.0% 50 64.0%
Two or more races 5 -- 10 0.0%
Disability
Disabled 48 10.4% 49 14.3%
Not Disabled 202 32.2% 228 40.4%
Migrant Status
Migrant 0 -- 0 --
Non-Migrant 250 28.0% 277 35.8%
English Proficiency
Limited English Proficient 17 0.0% 11 0.0%
Non-Limited English Proficient 233 29.6% 266 36.9%
Poverty
Students in Poverty (SIP) 161 17.4% 189 23.8%
Non-Students in Poverty (SIP) 83 50.6% 87 62.1%

15
SCPASS Table 4.1: Percent of Students (4-5) Who Met or Exceeded Expectations on SCPASS Science by Subgroup
Subgroup 2015 2016 2017
Count Percent Count Percent Count Percent
All Students 177 56.0% 169 49.7% 179 41.4%
Gender
Male 101 52.4% 84 48.8% 90 41.1%
Female 76 60.5% 85 50.6% 89 41.6%
Ethnicity
Hispanic or Latino 6 -- 14 -- 11 --
American Indian or Alaska Native -- -- 1 -- 1 --
Asian 5 -- 5 -- 7 --
Black or African American 131 48.9% 115 43.5% 124 33.1% Native Hawaiian or Other Pacific
Islander -- -- -- -- -- --
White 29 82.8% 31 74.2% 29 72.4%
Two or more races 4 -- 2 -- 7 --
Disability
Disabled 25 8.0% 31 9.7% 34 14.7%
Not Disabled 152 63.8% 138 58.7% 145 47.6%
English Proficiency
Limited English Proficient 9 -- 13 -- 9 --
Non-Limited English Proficient 168 56.6% 156 50.7% 170 42.3%
Poverty
Students in Poverty (SIP) 123 45.6% 107 40.2% 122 30.3%
Non-Students in Poverty (SIP) 54 79.6% 58 69.0% 56 66.1% -- Data not reported for subgroups less than 10 students. Standards and Scale Changed for 2017

16
Table 4.2: Percent of Students (4-5) Who Met or Exceeded Expectations on SCPASS Social Studies by Subgroup
Subgroup 2015 2016 2017
Count Percent Count Percent Count Percent
All Students 177 70.0% 169 75.2% 179 70.4%
Gender
Male 101 68.3% 84 73.8% 90 64.4%
Female 76 72.4% 85 76.5% 89 76.4%
Ethnicity
Hispanic or Latino 6 -- 14 -- 11 --
American Indian or Alaska Native -- -- 1 -- 1 --
Asian 5 -- 5 -- 7 --
Black or African American 131 66.4% 115 72.2% 124 67.7% Native Hawaiian or Other Pacific
Islander -- -- -- -- -- --
White 29 82.8% 31 90.3% 29 86.2%
Two or more races 4 -- 2 -- 7 --
Disability
Disabled 25 8.0% 31 45.2% 34 47.1%
Not Disabled 152 80.3% 138 81.9% 145 75.8%
English Proficiency
Limited English Proficient 9 -- 13 -- 9 --
Non-Limited English Proficient 168 71.4% 156 77.0% 170 71.8%
Poverty
Students in Poverty (SIP) 123 61.8% 107 69.2% 122 63.2%
Non-Students in Poverty (SIP) 54 88.8% 58 87.9% 56 87.5% -- Data not reported for subgroups less than 10 students.

17
School Climate Table 5 shows the percent of teachers, students and parents who indicated they were satisfied learning environment, the social and physical environment, and school-home relations on the 2015 through 2017 South Carolina Department of Education School Climate surveys. Table 5: School Climate Satisfaction by Teacher, Student and Parent groups for 2015-2017
2015 2016 2017
Count Percent Count Percent Count Percent
Satisfied with the Learning Environment
Teacher 73 100.0% 48 93.7% 48 100.0%
Student 75 95.0% 71 98.6% 80 93.8%
Parent 20 95.0% 23 91.3% 14 100.0% Satisfied with the Social and Physical Environment
Teacher 73 100.0% 48 95.8% 48 100.0%
Student 75 91.0% 71 100.0% 80 98.8%
Parent 20 90.0% 23 91.3% 14 92.9%
Satisfied with the School-Home Relations
Teacher 73 97.0% 48 91.7% 48 97.9%
Student 75 93.0% 71 95.8% 80 97.5%
Parent 20 65.0% 23 75.0% 14 100.0%

18
EXECUTIVE SUMMARY OF NEEDS ASSESSMENT DATA FINDINGS Per SBE Regulation 43-261, the annual needs assessment will provide focus for planning teams to set priorities for the plan. The comprehensive needs assessment must identify targeted areas of discrepancy between the desired performance levels and the current status as indicated by available data. Any discrepancies in the following areas identified by the school and district report cards must be included in the plan: (1) achievement, (2) achievement by subgroups, (3) graduation rates, (4) attendance, (5) discipline, (6) teacher/administrator quality and professional growth, and (7) other priority areas. Measurable performance goals, written in five-year increments, shall be developed to address the major areas of discrepancy found in the needs assessment in key areas reported in the district and school report cards. State Report Card for districts and schools data: http://ed.sc.gov/data/report-cards/state-report-cards/
Di Directions: In the appropriate boxes, use district and school data to identify areas in need of improvement. Required areas to be addressed are: Student Achievement, Teacher/Administrator Quality, School Climate, and Gifted and Talented.
Student Achievement, including sub-groups Early Childhood/Primary (PK–2):
∙ Based on the results of the data from our 5K, 1st and 2nd grade assessments, we are looking closely at the preparation level of our early childhood students as well as our curriculum, programs and initiatives to address the needs, especially in the area of reading.
Elementary School (3-5)
∙ Improving elementary level student achievement is one of our greatest challenges. Based on the data, there is a need to reaffirm the district's commitment to literacy and reading intervention, reorganize our curriculum, support personnel to provide level-specific coaching, and establish a guaranteed and viable curriculum for all subjects.
∙ Based on science and social studies assessments in grades 4-5 over several years, the data indicates a need to focus on integrating reading skills in these subject areas. Additional professional development will target specific reading skills in science and social studies.
∙ The Hispanic subgroup and the Limited English Proficiency (LEP) subgroup improved in almost all elementary achievement measures over the last five years. The state’s changes in assessments does not allow for comparisons over the last two years in English Language Arts and mathematics in grades 3-5. However, science and social studies can be compared longitudinally, and

19
the Hispanic subgroup and LEP subgroup performance is improving in science in all elementary grades.
∙ The SC Ready data in Math and ELA is below the district and state average. The administration and teachers are working closely with our district content specialists to ensure that instruction in Math and ELA i fully aligned to the standards specifically in the areas of reading comprehension and base ten
Middle School (6-8) N/A
High School (9-12) N/A
Teacher/Administrator Quality
∙ We have been fortunate to secure properly certified teachers for positions. Making sure that every student has a properly certified teacher from the first day of class and provide ongoing support is one of our highest priorities. ∙ Quality professional development opportunities will address group and school needs in order to maintain an enhanced growth based on student achievement and observations. All employees’ strengths will be maximized and all weaknesses will be addressed thus positively impacting student achievement
School Climate
∙ Perception data is a very important way to gain insight from all stakeholders to understand our climate. Based on our 2017 climate survey data, the following trends were noted: ∙ The percent who were satisfied with home-school relations is up from the prior three years: 97.5% of students and 100% of parents were satisfied. ∙ The percent who were satisfied with the learning environment at our school increased over the last three years: 100% or parents and 100% of teachers were satisfied. Overall, our stakeholders are satisfied with our school climate. We were pleased to see results of 92.9% in the area of social and physical environment of the school.

20
District Priorities Our professional development and all of our practices are aligned to learning, character, community, and joy - our district’s core values.
Gifted and Talented Forest Lake meets the needs of gifted and talented students by delivering curriculum from the College of William and Mary’s Center for Gifted Education. Our district’s gifted program, ALERT, begins serving students in second grade. Forest Lake aligns to our district priorities and framework.

21
Learning Learning is the cornerstone on which all that we do in Richland Two is built. We strive to provide innovative learning environments in which all partners can acquire knowledge and skills through quality instruction and engaging experiences. Character, Community and Joy help to support this key square.
ACHIEVEMENT
GOAL
Using baseline data obtained from 2017 SC Ready ELA and Math scores, Forest Lake will work to ensure students’ academic success by increasing academic achievement in all areas as evidenced by State and District testing: 2018 - 2% Increase 2019 - 4% Increase 2020 - 6% Increase 2021 - 8% Increase 2022 - 10% Increase FLE STUDENT OUTCOME/STRATEGY = Our students will meet or exceed normed scores and will develop academic success on all key measures in ELA and Math. FLE STAFF OUTCOME/STRATEGY = Our staff participate in ongoing, relevant professional learning experiences to support teaching and learning in ELA and Math. FLE COMMUNITY OUTCOME/STRATEGY = We collaborate with our partners and families to provide learning opportunities that support academics and the curriculum taught at FLE .
FLE Student Strategy
Action Steps
Timeline Responsibility Estimated Cost/
Funding Source
Measure Accountability
Develop and implement
2018-2022 Teachers, Administration, Reading Coach, TLC
District funds
Mastery Connect
Number of students/ test scores

22
strategies to increase the percentage of students scoring at met or above level on the state assessments Improve the number of students making growth on district assessments
2018-2022 Teachers, Administration, Reading Coach, TLC
0 MAP, easyCBM, DRA, and Reading A-Z Benchmark level
Teams will meet to analyze assessments and use it to inform instruction
Evaluate and improve curriculum and instruction towards improving state and district assessments
2018-2022 Teachers/Administration 0 Mastery Connect
Classroom observations, lesson plan reviews, professional learning opportunities
Provide data informed interventions for students (academic and behavioral)
2018-2022 Administration, Teachers, Tier 2 Teaching Assistants, Counselor, Interventionists, Reading Coach
0 EasyCBM Progress monitoring
Child Study
FLE Staff Timeline Responsibility Estimated Measure Accountability

23
Strategy Action Steps
Cost/ Funding Source
Provide STEM related school-wide professional learning that is standards based
2018-2022 Implementation Team, Administration
0 Staff Development
Training is held as needed (ex: faculty meetings, collaborative and extended planning)
Provide weekly school-wide professional learning opportunities to increase teacher capacity in the area of STEM instruction and the designing of performance based assessment
2018-2022 Faculty, Administration
0 Meeting Agendas and Minutes
Teacher participation in Collaborative Conferences, extended planning, Project Lead The Way, NASA Lab and Civil Air Patrol curriculum, Administrative walk-thrus, & peer observations
Provide opportunities for teachers to participate in high-quality
2018-2022 Administration 0 Staff Development
Faculty meetings, collaborative conferences, extended planning, district planning days, in-services
24
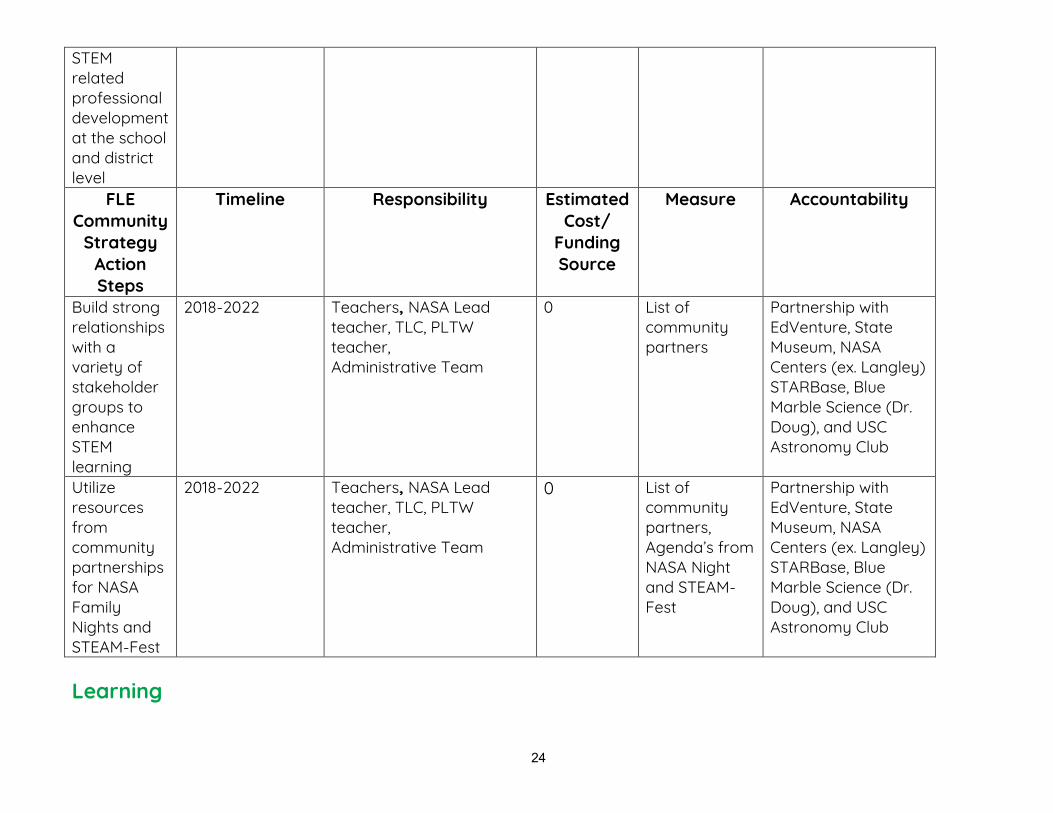
STEM related professional development at the school and district level
FLE Community
Strategy Action Steps
Timeline Responsibility Estimated Cost/
Funding Source
Measure Accountability
Build strong relationships with a variety of stakeholder groups to enhance STEM learning
2018-2022 Teachers, NASA Lead teacher, TLC, PLTW teacher, Administrative Team
0 List of community partners
Partnership with EdVenture, State Museum, NASA Centers (ex. Langley) STARBase, Blue Marble Science (Dr. Doug), and USC Astronomy Club
Utilize resources from community partnerships for NASA Family Nights and STEAM-Fest
2018-2022 Teachers, NASA Lead teacher, TLC, PLTW teacher, Administrative Team
0 List of community partners, Agenda’s from NASA Night and STEAM-Fest
Partnership with EdVenture, State Museum, NASA Centers (ex. Langley) STARBase, Blue Marble Science (Dr. Doug), and USC Astronomy Club
Learning

25
Learning is the cornerstone on which all that we do in Richland Two is built. We strive to provide innovative learning environments in which all partners can acquire knowledge and skills through quality instruction and engaging experiences. Character, Community and Joy help to support this key square.
TALENT
GOAL
Using baseline data from the 2017-18 End-of-the-Year Professional Development Needs survey, Forest Lake staff will increase participation in professional development opportunities as evidenced by school professional development documentation form: 2018 - 2% increase 2019 - 4% increase 2020 - 6% increase 2021 - 8% increase 2022 - 10% increase FLE STUDENT OUTCOME= Our students benefit from multiple opportunities to discover their passions. FLE STAFF OUTCOME= Our staff participate in ongoing professional and personal growth opportunities to develop work skills and knowledge, and to ensure a healthy work/personal-life balance. FLE COMMUNITY OUTCOME = In joyful settings, we offer community members opportunities to share their gifts and talents with Richland Two students and employees.
FLE Student
Strategy Action Steps
Timeline Responsibility Estimated Cost/ Funding Source
Measure Accountability
Plan and provide STEM related activities where students demonstrate
2018-2022 Faculty $6,000-PTO Student presentations and project based activities.
NASA Nights, STEAM-G Fest, STEM Career Day, DLN, LEGO team, LEGO JR. and Hour of Code
26
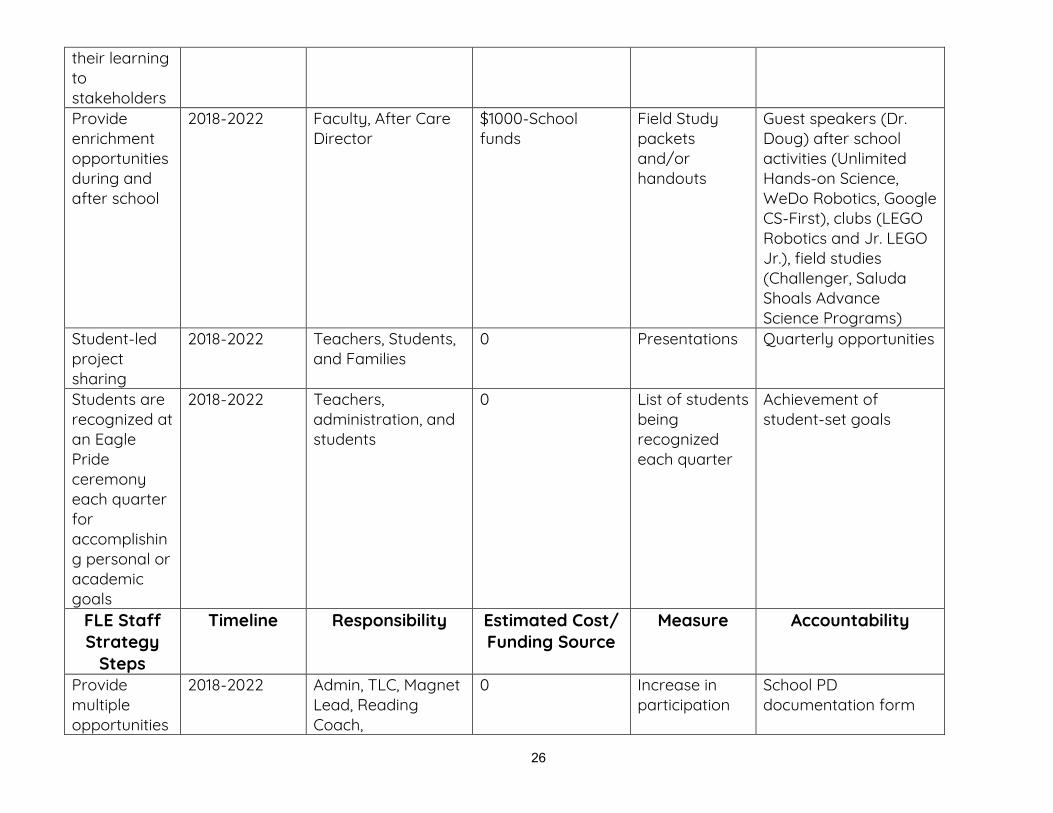
their learning to stakeholders Provide enrichment opportunities during and after school
2018-2022 Faculty, After Care Director
$1000-School funds
Field Study packets and/or handouts
Guest speakers (Dr. Doug) after school activities (Unlimited Hands-on Science, WeDo Robotics, Google CS-First), clubs (LEGO Robotics and Jr. LEGO Jr.), field studies (Challenger, Saluda Shoals Advance Science Programs)
Student-led project sharing
2018-2022 Teachers, Students, and Families
0 Presentations Quarterly opportunities
Students are recognized at an Eagle Pride ceremony each quarter for accomplishing personal or academic goals
2018-2022 Teachers, administration, and students
0 List of students being recognized each quarter
Achievement of student-set goals
FLE Staff Strategy
Steps
Timeline Responsibility Estimated Cost/ Funding Source
Measure Accountability
Provide multiple opportunities
2018-2022 Admin, TLC, Magnet Lead, Reading Coach,
0 Increase in participation
School PD documentation form

27
for faculty participation in requested PD
Interventionist, Teachers,
Provide opportunities for teachers and staff to attend STEM related conferences and workshops
2018-2022 Administration $5000-District, PTO and Education Foundation
Participate in the NSTA Conference, SEEC Conference and school visits.
Opportunities provided regularly and by request
Conduct STEM related professional development surveys
2018-2022 Administration 0 Survey and PD Schedule
Survey data and results used to differentiate PD opportunities appropriately
FLE Community
Strategy Steps
Timeline Responsibility Estimated Cost/ Funding Source
Measure Accountability
Continue to promote involvement of parents in a variety of activities and STEM related instructional expectations
2018-2022 Administrators, Faculty, Staff, PTO, SIC, Foundation
0 Volunteer sign-up sheet
Set goals and establish programs for parent involvement each year and annually evaluate progress
Increase parent involvement
2018-2022 Administration, Parent Representatives,
0 List of parent and community
Invitations for participation begin in April prior to the

28
in such organizations as PTO, SIC and Foundation
Faculty volunteers on sub committees
following school year, host membership drive
Utilize parent volunteers to assist with a variety of fundraising strategies to strengthen school programs
2018-2022 Administrative Team, PTO, SIC, Foundation
0 List of parent and community volunteers
Evaluate fundraising strategies and outcomes and make adjustments, as needed
Continue to promote involvement of parents in a variety of activities and STEM related instructional expectations
2018-2022 Administrators, Faculty, Staff, PTO, SIC, Foundation
0 Volunteer sign-up sheet
Set goals and establish programs for parent involvement each year and annually evaluate progress
CHARACTER & CLIMATE Character is a building block to a great education. Positive character traits are essential to becoming contributing members of society. Without opportunities to develop and strengthen strong character traits, learning is not complete.
ACHIEVEMENT
GOAL
Using baseline data obtained from 2017 SWIS Behavior Data reports and State Climate survey, Forest Lake will encourage our students to demonstrate a high level of ethical character within and outside of the FLE community as measured by maintaining high approval ratings on the State Climate survey

29
and a decrease in discipline referrals and suspensions: 2018 - 2% Decrease 2019 - 4% Decrease 2020 - 6% Decrease 2021 - 8% Decrease 2022 - 10% Decrease FLE STUDENT OUTCOME = Through the use of the 7 Habits and Harmony Character Education program, FLE students develop strong character traits as detailed in the profile of the SC graduate. FLE STAFF OUTCOME = FLE staff use the 7 Habits and Harmony Character Education program consistently to teach and model appropriate behavior and character traits. FLE COMMUNITY OUTCOME = FLE staff work with our community partners to provide opportunities for students and staff to contribute to society.
FLE Student Strategy Action
Steps
Timeline Responsibility Estimated Cost/
Funding Source
Measure Accountability
Participate in daily class community building activities through Morning Meetings
2018-2022 Teacher and students
0 Lesson Plans Daily Agenda and observations
Provide monthly 7 Habits instruction.
2018-2022 Teacher,Administration, Guidance Counselor
0 Lesson Plans Daily Agenda and observations

30
Share Habit of the Month through daily news reports.
2018-2022 News Show Team
0 News Show TEAM Drive SOAR Folder
Forest Lake Today
FLE Staff Strategy Action
Steps
Timeline Responsibility Estimated Cost/
Funding Source
Measure Accountability
Plan monthly and quarterly celebrations to recognize students demonstrating “SOARing” behavior
2018-2022 Administration, PBIS/BAT Team Faculty and staff
$650-PTO SOAR Bucks SOAR Celebration list from teachers
Analyze data monthly
2018-2022 Administrative Team PBIS/BAT Team Faculty and staff
0 SWISS PBIS/BAT Team reviews data monthly to make informed decisions regarding PBIS implementation
Provide daily check in/check out with students behaviorally at-risk
2018-2022 Guidance Counselor and trained staff members
0 Check In/Out Forms - Individual behavior charts developed for students.
Track students referred for success.
Identify behaviorally at-risk students to the Behavioral Assistance Team
2018-2022 Behavioral Assistance Team, Teachers, Guidance Counselor,
0 Individual behavior plans developed for students.
Track students referred for success
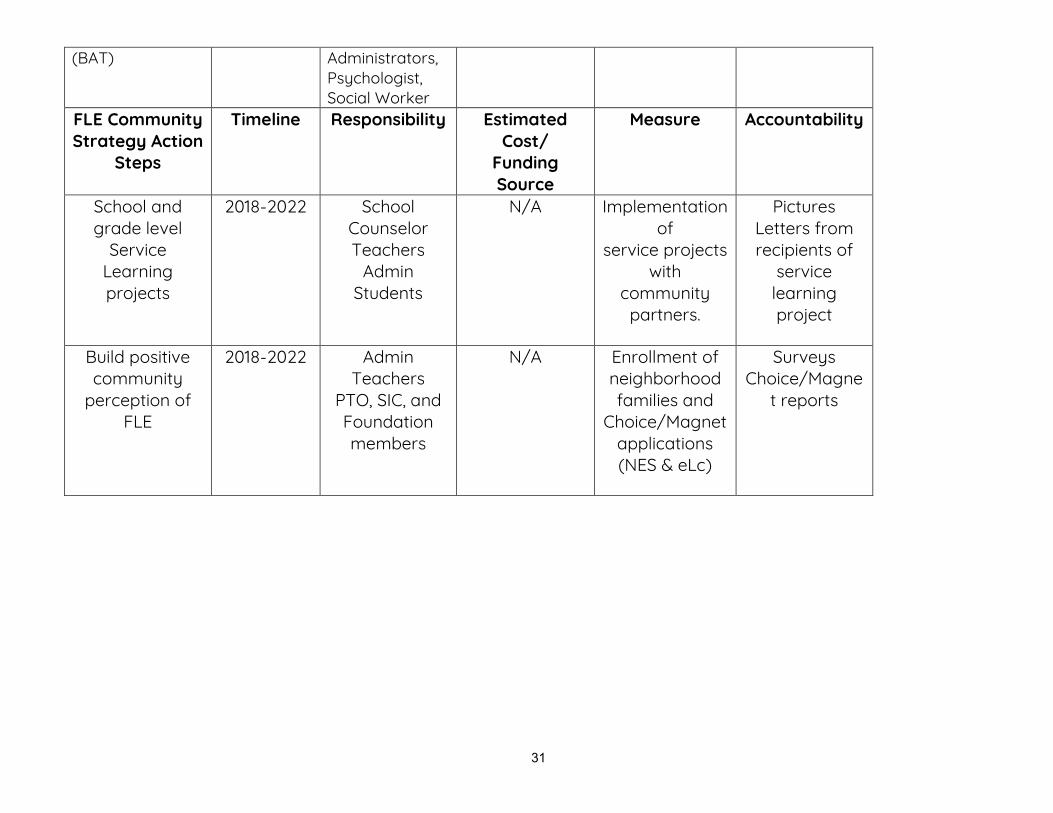
31
(BAT) Administrators, Psychologist, Social Worker
FLE Community Strategy Action
Steps
Timeline Responsibility Estimated Cost/
Funding Source
Measure Accountability
School and grade level
Service Learning projects
2018-2022 School Counselor Teachers
Admin Students
N/A Implementation of
service projects with
community partners.
Pictures Letters from recipients of
service learning project
Build positive community
perception of FLE
2018-2022 Admin Teachers
PTO, SIC, and Foundation members
N/A Enrollment of neighborhood families and
Choice/Magnet applications (NES & eLc)
Surveys Choice/Magne
t reports