Embed Size (px)
Citation preview
FOREST INCOMES AFTER UGANDA’S FOREST SECTOR REFORM Are the Rural Poor Gaining?
Pamela Jagger, Indiana University
CGIAR Systemwide Program on Collective Action and Property Rights (CAPRi) C/- International Food Policy Research Institute, 2033 K Street NW, Washington, DC 20006–1002 USA T +1 202.862.5600 • F +1 202.467.4439 • www.capri.cgiar.org
CAPRi Working Paper No. 92 December 2008
The CGIAR Systemwide Program on Collective Action and Property Rights (CAPRi) is an initiative of the 15 centers of the Consultative Group on International Agricultural Research (CGIAR). The initiative promotes comparative research on the role of property rights and collective action institutions in shaping the efficiency, sustainability, and equity of natural resource systems. CAPRi’s Secretariat is hosted within the Environment and Production Technology Division (EPTD) of the International Food Policy Research Institute (IFPRI). CAPRi receives support from the Governments of Norway, Italy and the World Bank.
CAPRi Working Papers contain preliminary material and research results. They are circulated prior to a full peer review to stimulate discussion and critical comment. It is expected that most working papers will eventually be published in some other form and that their content may also be revised.
Jagger, P. 2008. Forest Incomes after Uganda's Forest Sector Reform: Are the Rural Poor Gaining? CAPRi Working Paper No. 92. International Food Policy Research Institute: Washington, DC. http://dx.doi.org/10.2499/CAPRiWP92.
Copyright © December 2008. International Food Policy Research Institute. All rights reserved. Sections of this material may be reproduced for personal and not-for-profit use without the express written permission of but with acknowledgment to IFPRI. To reproduce the material contained herein for profit or commercial use requires express written permission. To obtain permission to reprint, contact the IFPRI Communications Division at [email protected].
ABSTRACT
Forest sector governance reform is frequently promoted as a policy tool for achieving favorable livelihood outcomes in the low income tropics. However, there is a dearth of empirical evidence to support this claim, particularly at the household level. Drawing on the case of a major forest sector governance reform implemented in Uganda in 2003, this study seeks to fill that gap. The research employs a quasi-experimental research design utilizing pre and post reform income portfolio data for a large sample of households surrounding three major forests in western Uganda; a control group is included in the design.
On private forest land overseen by the decentralized District Forestry Service there has been no significant change in average annual household income from forests, and the share of total income from forests has only slightly increased. For households living adjacent to Budongo Central Forest Reserve, overseen by the parastatal National Forestry Authority, there have been significant gains in average annual household income from forests, as well as the share of total income from forests. However, increases are limited to households in the highest income quartile and are primarily attributed to the sale of illegally harvested timber. The findings from this study challenge the view that governance reforms result in favorable livelihood outcomes for the poorest. Policy makers should carefully consider the incentives facing both forestry officials and local resource users with particular attention to increasing awareness of the value of trees and forests, and facilitating legal opportunities for rural smallholders across all income categories to sustainably engage in forest product harvesting and value addition. Keywords: Uganda, forest sector reform, decentralization, livelihoods
ACKNOWLEDGMENTS
I am grateful to the following organizations for funding this research: the Center for International Forestry Research (CIFOR); the CGIAR Systemwide Program on Collective Action and Property Rights Initiative (CAPRi); the National Science Foundation (NSF, grant number DDIG 0622392); the Social Sciences and Humanities Research Council of Canada (SSHRC); the Social Science Research Council (SSRC); and the Sustainable Agriculture and Natural Resource Management Collaborative Research Support Program (SANREM CRSP, grant number EPP-A-00-04-00013-00). This project would not have been possible without the cooperation and advice of Glenn Bush of the University of Stirling, and Andy Plumptre of the Wildlife Conservation Society, Albertine Rift Program who were willing to share the baseline data used in this study (Bush et al. 2004). At final count 521 households fully participated in this study between October 2006 and August 2007. Their willingness to share information on the challenging and controversial topic of forests and land, host us for numerous hours in their homes, and to stick with us for a full year was critical to the success of this project. The 639 households that participated in the WCS baseline study in 2003 played an equally important role. I am grateful to Arild Angelsen, Laura German, Marty Luckert, and Jerry Shively who have given substantive feedback on this work in progress. I am also grateful to 3 anonymous reviewers. Finally, and most importantly, this research was carried out by an extraordinary team of enthusiastic, hard working, and dedicated research assistants from western Uganda. Arthur Arinaitwe (team leader), Brian Isingoma, Issa Katwesige, Shallon Kihembo, Grace Nyesiga, and Samson Tweheyo worked with me countless hours over the course of 16 months to collect, enter, and clean data. Any errors or omissions are my own.
Table of Contents
Introduction ................................................................................................. 1
Literature Review ......................................................................................... 2
Uganda’s Forest Sector Governance Reform ..................................................... 4
Methods ...................................................................................................... 7
Results ...................................................................................................... 14
Conclusions and Policy Recommendations ...................................................... 25
References ................................................................................................ 28
1
FOREST INCOMES AFTER UGANDA’S FOREST SECTOR REFORM
Are the Rural Poor Gaining?
Pamela Jagger 1
1. INTRODUCTION
Recent estimates suggest that governance reforms transferring rights and responsibilities for natural resource management to local governments or local resource users are currently underway in approximately 60 developing countries (Agrawal 2001; WRI 2003). Reforms are generally motivated by the failure of centralized states to provide basic infrastructure and services, high levels of corruption within centralized systems, and the desire to foster democratic institutions that take into account the needs of a diverse citizenry (Vedeld 2003; Wunsch and Olowu 1990). Improved livelihoods for rural people living in or near forests is one of the most commonly cited expected outcomes of forest sector governance reforms (Agrawal and Gibson 1999; Agrawal and Ostrom 2001; Fisher et al. 2005; WRI et al. 2005; Meinzen-Dick and Knox 2001). However, there is a dearth of empirical data regarding whether and under what conditions favorable livelihood outcomes are achieved (Bardhan 2002; Meinzen-Dick et al. 2004).
This paper explores changes in the role of forest income in rural livelihood portfolios that have resulted from a major forest sector governance reform implemented in Uganda in 2003. The reform involved changes in the ownership and management of 85 percent of Uganda’s forested land. A new forest policy, a strategic forest sector plan, and new legislation were developed during the forest sector review process (Government of Uganda 2001, 2004; MWLE 2002). The centralized Forest Department was dismantled, and the decentralized District Forestry Service (DFS) and the for-profit parastatal National Forestry Authority (NFA) were created. Though significant institutional change has taken place, there is limited empirical evidence to indicate how the benefits associated with forests have been re-oriented to local resource users.
A strong case can be made for choosing Uganda to evaluate the effect of forest sector reforms on rural livelihoods. First, Uganda is ranked second in sub-Saharan Africa (after South Africa) with respect to progress on government wide decentralization initiatives that encompass democratic processes and foundations (Ndegwa 2002). Second, Uganda is a leader in sub-Saharan Africa with respect to forest sector reforms. Major forest sector reforms have been undertaken in Cameroon, Ghana, Malawi, South Africa, and Senegal, and more recently in Kenya, Mali, Tanzania, and Rwanda. Both Kenya and Rwanda have predicated their own forest sector reform processes on the Ugandan experience. Third, forest-based livelihood improvements for the rural poor are a major focus of the new Uganda 1 Corresponding author: [email protected].
2
Forestry Policy as well as the National Forest Plan (Government of Uganda 2001, 2002). Finally, much of the impetus for the forest sector reform was related to the fact that Uganda’s forests are under serious threat (MWLE 2001a). Rapid changes in forest cover and quality pose a significant threat to rural livelihoods.
The research employs a quasi—experimental research design comparing both pre and post reform income portfolio data for a large sample of households surrounding three major forests in western Uganda. Outcomes for two treatment groups are considered. The first group is comprised of households living in or near privately held forests managed by the decentralized District Forestry Service. The second treatment group includes households living adjacent to Budongo Central Forest Reserve that were affected by the transition from the Forest Department to the for-profit parastatal National Forestry Authority. A control group comprised of households living adjacent to Rwenzori Mountains National Park, managed by the centralized Uganda Wildlife Authority, is included in the design.
Empirical results are reported in the fifth section. Finally, the findings of the study are summarized, and policy implications presented.
The paper is organized as follows: in the next section the literature related to governance reform and livelihoods is reviewed. Background information on Uganda’s forest sector reform and a summary of institutional changes and motivations for livelihood outcomes are presented. The fourth section describes the research design, study area, and methods used.
LITERATURE REVIEW
Improvements in livelihoods are a primary rationale for governance reform, particularly those that involve devolution of authority to local governments or local resource users (Meinzen-Dick and Knox 2001). Natural resource focused governance reforms have the potential to affect household assets in two ways: they have the potential to increase household assets and the returns to those assets; and they may increase access to assets not owned by the household (World Bank 2008). Reforms are expected to allow poor people to make their assets more productive via the mechanism of government policies that support local organization and decision—making around forest use, and greater participation of local forest users in markets for forest products. Improved property rights for local resource users to forests, specific forest resources and forest product markets is the most common mechanism through which returns to assets are improved (Ribot 2002; Ribot and Peluso 2003). Having a larger and more diverse portfolio of rights as well as short and long run decision making authority over resources facilitates opportunities to utilize forest resources in a variety of different ways, including: supporting current consumption; use in times of need (as safety nets); and as pathways out of poverty. In particular, the right to access and withdraw high value forest products has the potential to lift households out of poverty (Angelsen and Wunder 2003). Clear and secure rights are a crucial aspect of reform implementation if reforms are to be successful in improving the asset base of rural households. Secure land rights allow households to obtain credit, reduce risk associated with investment, and provide incentives to sustainably manage resources (DFID 2007; FAO 2002; Deininger 2003; SIDA 2007).
3
There is a strong link between the democratic decentralization literature and the community based natural resource management (CBNRM) literature. Often reforms involve the state sharing management or enforcement responsibilities with local communities, or provide new opportunities or incentives for community based initiatives. When CBNRM is successful, it may lead to improved natural resource management (World Bank 2008). When local resource users are involved in the formation of rules regarding the use of forests, they are expected to respect and enforce rules to a higher standard then when they are not involved in rule formulation (Gibson, McKean, and Ostrom 2000). It is also argued that local resource users have a much greater knowledge of local conditions and are therefore better equipped to identify and prioritize environmental problems (Larson 2002). Finally, both the financial and transaction costs of sustainable management, which ensures medium to long run income flows, should be lower when local resource users are integrated into the management of forests (Kaimowitz et al. 1998)
Reforms often alter the organizational or administrative structure that oversees forest management. Organizations and their employees have underlying incentive structures that motivate the way in which policies are implemented. If authorities are unwilling to substantively relinquish property rights or alter power relationships, then reform are at best partial and the opportunities for rural livelihood improvements and sustainable management are limited (Agrawal and Ostrom 2001; Crook and Manor 1998; Ribot 1999).
Bardhan (2002) argues that empirical evidence as to whether or not decentralization reforms lead to significant changes in incomes or other measures of livelihoods are absent from the literature. However, several recent studies consider the linkage between livelihood outcomes and forest sector governance reforms. There is evidence that rural households experience gains in income from forests as a result of reforms. Studies from Malawi (Jumbe and Angelsen 2006) and Ethiopia (Jagger, Pender, and Gebremedhin 2005) found that devolved forest management led to increases in income from forests for rural smallholders. However, both studies found a high degree of variation across communities and households affected by the reform. Studies that examine governance reforms in cases where the communities are involved in the distribution of timber concessions find that communities and households are better off after decentralization reforms (Oyono 2005; Palmer and Engel 2007), though again with a high degree of variation between communities and households. Communities often benefit from in kind payments that support the development of rural infrastructure including schools and health centers, or receive direct cash payments from small scale timber concessions.
Political connectedness emerges as an important variable influencing reform outcomes for the poor. Recent studies from Vietnam (Sikor and Nguyen 2007) and Indonesia (McCarthy 2004) found that while devolution does generate benefits for the local poor, local power relations and the institutions regulating access to higher value forest resources are excluding the very poor from benefiting from these reforms. Crook and Sverrison (2001) in a cross country study on the welfare impacts of decentralization reforms pointed out that central government commitment to pro—poor policies and engagement with local elites to ensure unbiased implementation of reforms are important for livelihood gains. There are numerous examples of local elites, NGOs and other special interests dominating
4
local decision making processes regarding the assignment of rights, which may undermine outcomes for the rural poor (Agrawal 2001; Platteau and Abraham 2002; Ribot 1999). A key finding from the synthesis research on the topic of decentralization is that if reforms are to have welfare enhancing effects at the level of the rural household, attention needs to be paid to the structural inequities that emerge across the various landscapes in which reforms are implemented (Larson et al. 2007; Ribot 2003; WRI et al. 2005).
UGANDA’S FOREST SECTOR GOVERNANCE REFORM
The Forest Sector Umbrella Program (FSUP) initiated in 1999 was the Government of Uganda’s approach to reforming the forest sector. FSUP was a multi—donor program, led by the Government of Uganda through the Ministry of Water, Lands and Environment (MWLE), and coordinated by the Forest Sector Co—ordination Secretariat (now the Forestry Inspection Division within the MWLE). The goals of FSUP were two—fold: to create a positive, effective, and sustainable policy and institutional environment for the forest sector in Uganda, and, through this, to increase economic and environmental benefits from forests and trees, particularly for the poor and vulnerable (MWLE 2004a). Uganda’s forest sector governance reform was part of a larger government—wide restructuring motivated by the 1995 Constitution and the 1997 Local Government Act intended to downsize the public service, rationalize government functions, and improve the effectiveness and efficiency of public service provision (MWLE 2006).
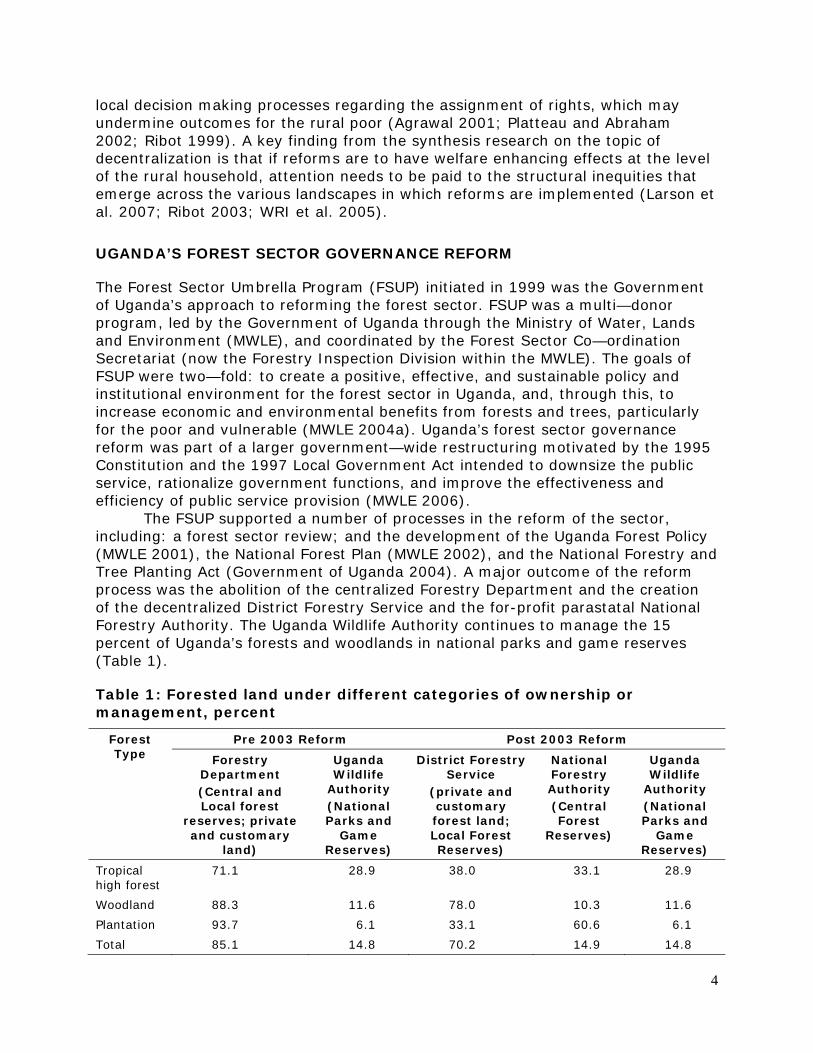
The FSUP supported a number of processes in the reform of the sector, including: a forest sector review; and the development of the Uganda Forest Policy (MWLE 2001), the National Forest Plan (MWLE 2002), and the National Forestry and Tree Planting Act (Government of Uganda 2004). A major outcome of the reform process was the abolition of the centralized Forestry Department and the creation of the decentralized District Forestry Service and the for-profit parastatal National Forestry Authority. The Uganda Wildlife Authority continues to manage the 15 percent of Uganda’s forests and woodlands in national parks and game reserves (Table 1).
Table 1: Forested land under different categories of ownership or management, percent
Forest Type
Pre 2003 Reform Post 2003 Reform
Forestry Department (Central and Local forest
reserves; private and customary
land)
Uganda Wildlife
Authority (National Parks and
Game Reserves)
District Forestry Service
(private and customary forest land; Local Forest Reserves)
National Forestry Authority (Central Forest
Reserves)
Uganda Wildlife
Authority (National Parks and
Game Reserves)
Tropical high forest
71.1 28.9 38.0 33.1 28.9
Woodland 88.3 11.6 78.0 10.3 11.6
Plantation 93.7 6.1 33.1 60.6 6.1
Total 85.1 14.8 70.2 14.9 14.8
5
Notes: Local Forest Reserves account for less than 1percent of the total forest area of Uganda.
Source: Adapted from MWLE (2001), data from National Biomass Survey, 1999.
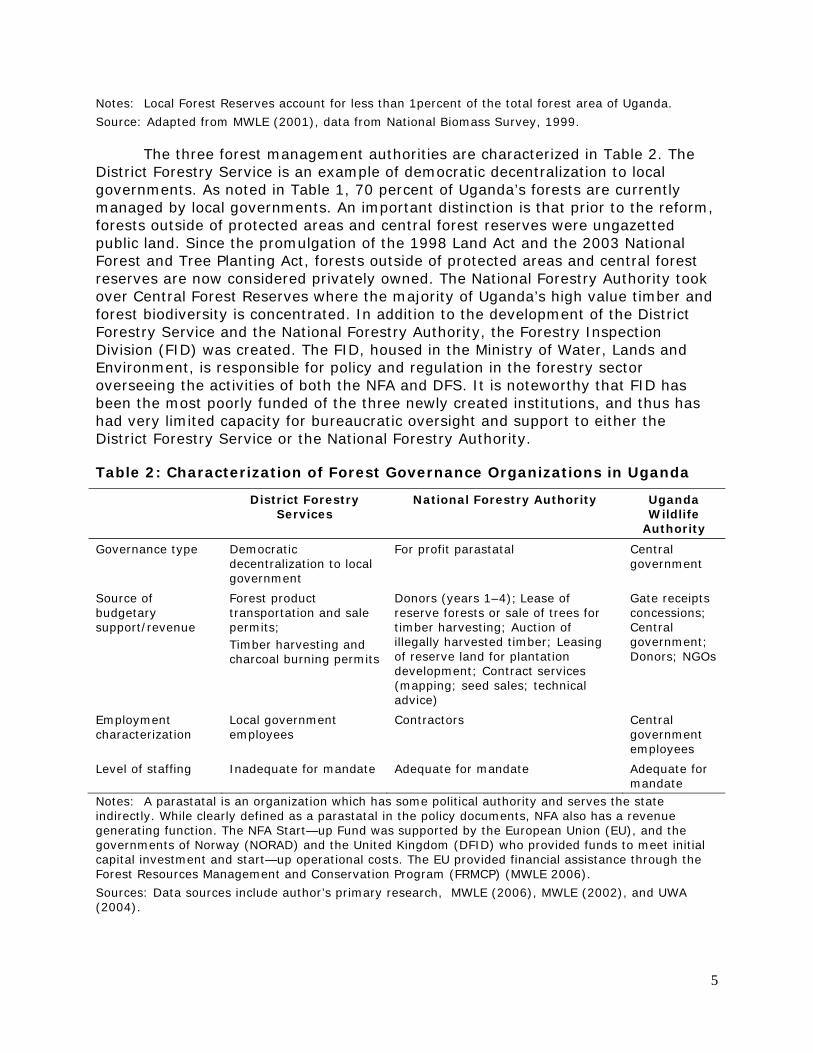
The three forest management authorities are characterized in Table 2. The District Forestry Service is an example of democratic decentralization to local governments. As noted in Table 1, 70 percent of Uganda’s forests are currently managed by local governments. An important distinction is that prior to the reform, forests outside of protected areas and central forest reserves were ungazetted public land. Since the promulgation of the 1998 Land Act and the 2003 National Forest and Tree Planting Act, forests outside of protected areas and central forest reserves are now considered privately owned. The National Forestry Authority took over Central Forest Reserves where the majority of Uganda’s high value timber and forest biodiversity is concentrated. In addition to the development of the District Forestry Service and the National Forestry Authority, the Forestry Inspection Division (FID) was created. The FID, housed in the Ministry of Water, Lands and Environment, is responsible for policy and regulation in the forestry sector overseeing the activities of both the NFA and DFS. It is noteworthy that FID has been the most poorly funded of the three newly created institutions, and thus has had very limited capacity for bureaucratic oversight and support to either the District Forestry Service or the National Forestry Authority.
Table 2: Characterization of Forest Governance Organizations in Uganda
District Forestry Services
National Forestry Authority Uganda Wildlife
Authority
Governance type Democratic decentralization to local government
For profit parastatal Central government
Source of budgetary support/revenue
Forest product transportation and sale permits; Timber harvesting and charcoal burning permits
Donors (years 1–4); Lease of reserve forests or sale of trees for timber harvesting; Auction of illegally harvested timber; Leasing of reserve land for plantation development; Contract services (mapping; seed sales; technical advice)
Gate receipts concessions; Central government; Donors; NGOs
Employment characterization
Local government employees
Contractors Central government employees
Level of staffing Inadequate for mandate Adequate for mandate Adequate for mandate
Notes: A parastatal is an organization which has some political authority and serves the state indirectly. While clearly defined as a parastatal in the policy documents, NFA also has a revenue generating function. The NFA Start—up Fund was supported by the European Union (EU), and the governments of Norway (NORAD) and the United Kingdom (DFID) who provided funds to meet initial capital investment and start—up operational costs. The EU provided financial assistance through the Forest Resources Management and Conservation Program (FRMCP) (MWLE 2006).
Sources: Data sources include author’s primary research, MWLE (2006), MWLE (2002), and UWA (2004).
6
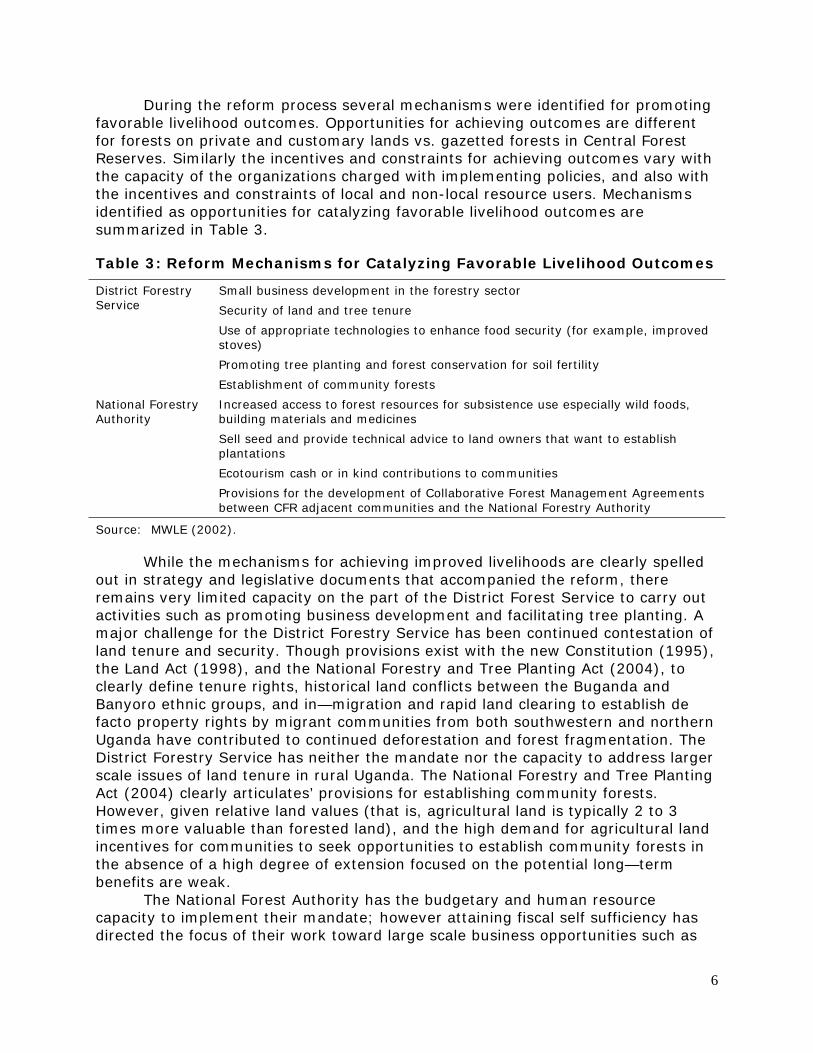
During the reform process several mechanisms were identified for promoting favorable livelihood outcomes. Opportunities for achieving outcomes are different for forests on private and customary lands vs. gazetted forests in Central Forest Reserves. Similarly the incentives and constraints for achieving outcomes vary with the capacity of the organizations charged with implementing policies, and also with the incentives and constraints of local and non-local resource users. Mechanisms identified as opportunities for catalyzing favorable livelihood outcomes are summarized in Table 3.
Table 3: Reform Mechanisms for Catalyzing Favorable Livelihood Outcomes
District Forestry Service
Small business development in the forestry sector
Security of land and tree tenure
Use of appropriate technologies to enhance food security (for example, improved stoves)
Promoting tree planting and forest conservation for soil fertility
Establishment of community forests
National Forestry Authority
Increased access to forest resources for subsistence use especially wild foods, building materials and medicines
Sell seed and provide technical advice to land owners that want to establish plantations
Ecotourism cash or in kind contributions to communities
Provisions for the development of Collaborative Forest Management Agreements between CFR adjacent communities and the National Forestry Authority
Source: MWLE (2002).
While the mechanisms for achieving improved livelihoods are clearly spelled out in strategy and legislative documents that accompanied the reform, there remains very limited capacity on the part of the District Forest Service to carry out activities such as promoting business development and facilitating tree planting. A major challenge for the District Forestry Service has been continued contestation of land tenure and security. Though provisions exist with the new Constitution (1995), the Land Act (1998), and the National Forestry and Tree Planting Act (2004), to clearly define tenure rights, historical land conflicts between the Buganda and Banyoro ethnic groups, and in—migration and rapid land clearing to establish de facto property rights by migrant communities from both southwestern and northern Uganda have contributed to continued deforestation and forest fragmentation. The District Forestry Service has neither the mandate nor the capacity to address larger scale issues of land tenure in rural Uganda. The National Forestry and Tree Planting Act (2004) clearly articulates’ provisions for establishing community forests. However, given relative land values (that is, agricultural land is typically 2 to 3 times more valuable than forested land), and the high demand for agricultural land incentives for communities to seek opportunities to establish community forests in the absence of a high degree of extension focused on the potential long—term benefits are weak.
The National Forest Authority has the budgetary and human resource capacity to implement their mandate; however attaining fiscal self sufficiency has directed the focus of their work toward large scale business opportunities such as
7
plantation establishment, and revenue generating enforcement such as the confiscation of illegally harvested timber. Significant stakeholder engagement and planning went into the development of guidelines for establishing collaborative forest management agreements (CFMAs) between the National Forestry Authority and villages adjacent to Central Forest Reserves (MWLE 2003b). However, the process is complex and bureaucratic, and few NFA employees are effectively trained in initiating and negotiating CFMAs.
METHODS
Research Design
To make claims about causal relationships between governance reforms and various outcomes a quasi—experimental research design is required. To understand how the reform has affected a particular unit of observation, be it a demographic group such as the rural poor or specific forest area, it is necessary to have data from before the reform was implemented to compare with data collected some time after implementation has taken place (Bardhan 2002). In addition, it is necessary to have a counterfactual, or a control group, to account for changes that occur due to other factors. The control group serves as an indicator of what would have happened in the absence of the reform (World Bank 2008). This study employs a quasi—experimental research design called the nonequivalent comparison group design (Shadish, Cook, and Campbell 2002). Households in forest sites affected by the reform (that is, treatment groups) are compared with households in a forest site that was not affected by the reform (control group).2 In this case the pre—reform and post—reform samples are independent. Household level data from the first and second time period are analyzed together as a pooled cross section.
Site and Sample Selection
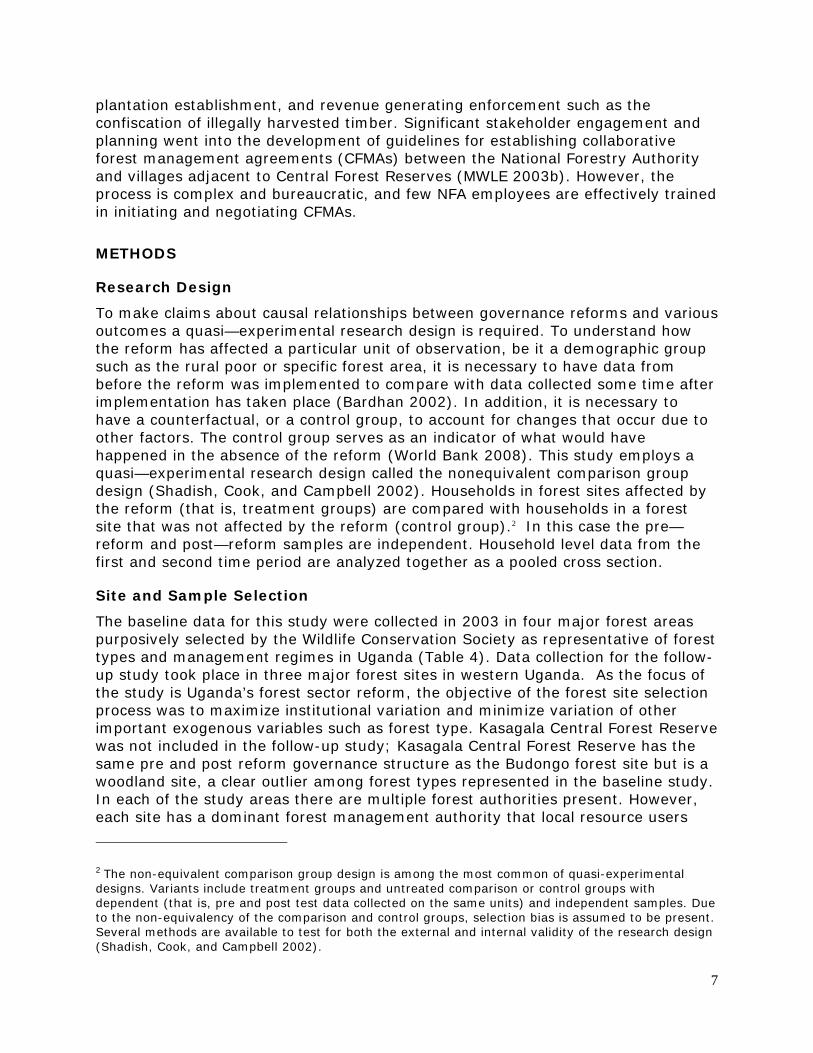
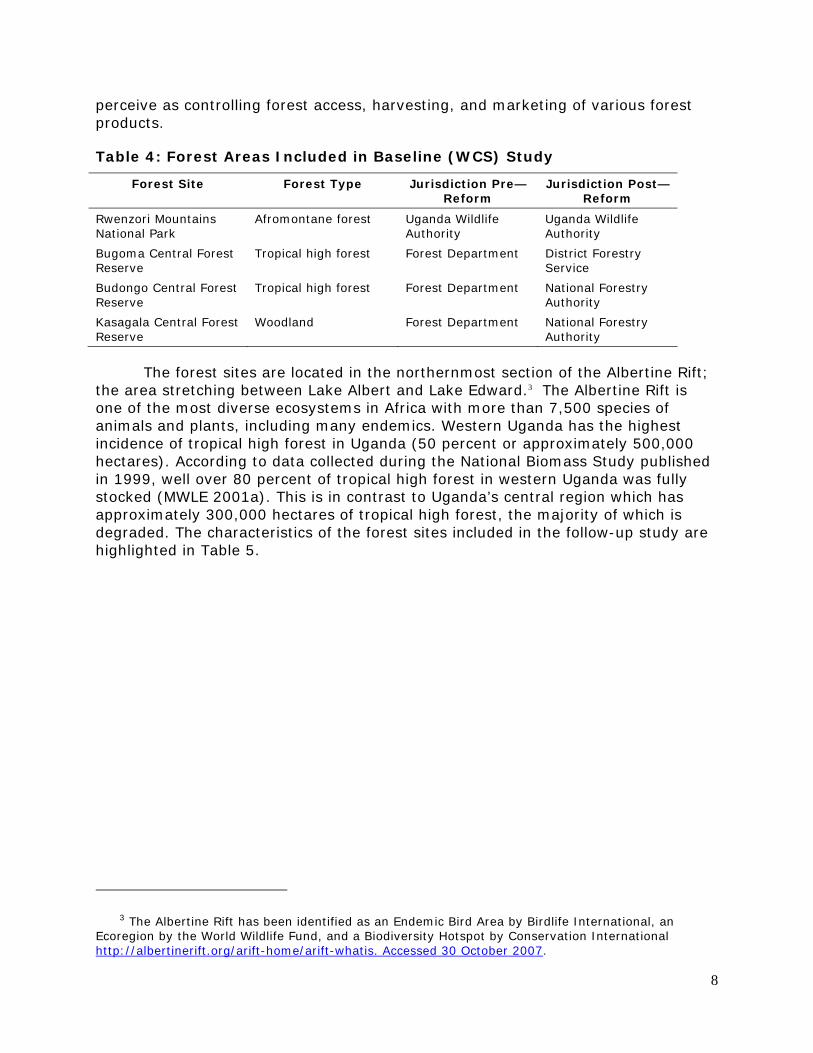
The baseline data for this study were collected in 2003 in four major forest areas purposively selected by the Wildlife Conservation Society as representative of forest types and management regimes in Uganda (Table 4). Data collection for the follow-up study took place in three major forest sites in western Uganda. As the focus of the study is Uganda’s forest sector reform, the objective of the forest site selection process was to maximize institutional variation and minimize variation of other important exogenous variables such as forest type. Kasagala Central Forest Reserve was not included in the follow-up study; Kasagala Central Forest Reserve has the same pre and post reform governance structure as the Budongo forest site but is a woodland site, a clear outlier among forest types represented in the baseline study. In each of the study areas there are multiple forest authorities present. However, each site has a dominant forest management authority that local resource users
2 The non-equivalent comparison group design is among the most common of quasi-experimental designs. Variants include treatment groups and untreated comparison or control groups with dependent (that is, pre and post test data collected on the same units) and independent samples. Due to the non-equivalency of the comparison and control groups, selection bias is assumed to be present. Several methods are available to test for both the external and internal validity of the research design (Shadish, Cook, and Campbell 2002).
8
perceive as controlling forest access, harvesting, and marketing of various forest products.
Table 4: Forest Areas Included in Baseline (WCS) Study
Forest Site Forest Type Jurisdiction Pre— Reform
Jurisdiction Post— Reform
Rwenzori Mountains National Park
Afromontane forest Uganda Wildlife Authority
Uganda Wildlife Authority
Bugoma Central Forest Reserve
Tropical high forest Forest Department District Forestry Service
Budongo Central Forest Reserve
Tropical high forest Forest Department National Forestry Authority
Kasagala Central Forest Reserve
Woodland Forest Department National Forestry Authority
The forest sites are located in the northernmost section of the Albertine Rift; the area stretching between Lake Albert and Lake Edward.3 The Albertine Rift is one of the most diverse ecosystems in Africa with more than 7,500 species of animals and plants, including many endemics. Western Uganda has the highest incidence of tropical high forest in Uganda (50 percent or approximately 500,000 hectares). According to data collected during the National Biomass Study published in 1999, well over 80 percent of tropical high forest in western Uganda was fully stocked (MWLE 2001a). This is in contrast to Uganda’s central region which has approximately 300,000 hectares of tropical high forest, the majority of which is degraded. The characteristics of the forest sites included in the follow-up study are highlighted in Table 5.
3 The Albertine Rift has been identified as an Endemic Bird Area by Birdlife International, an Ecoregion by the World Wildlife Fund, and a Biodiversity Hotspot by Conservation International http://albertinerift.org/arift-home/arift-whatis. Accessed 30 October 2007.
9
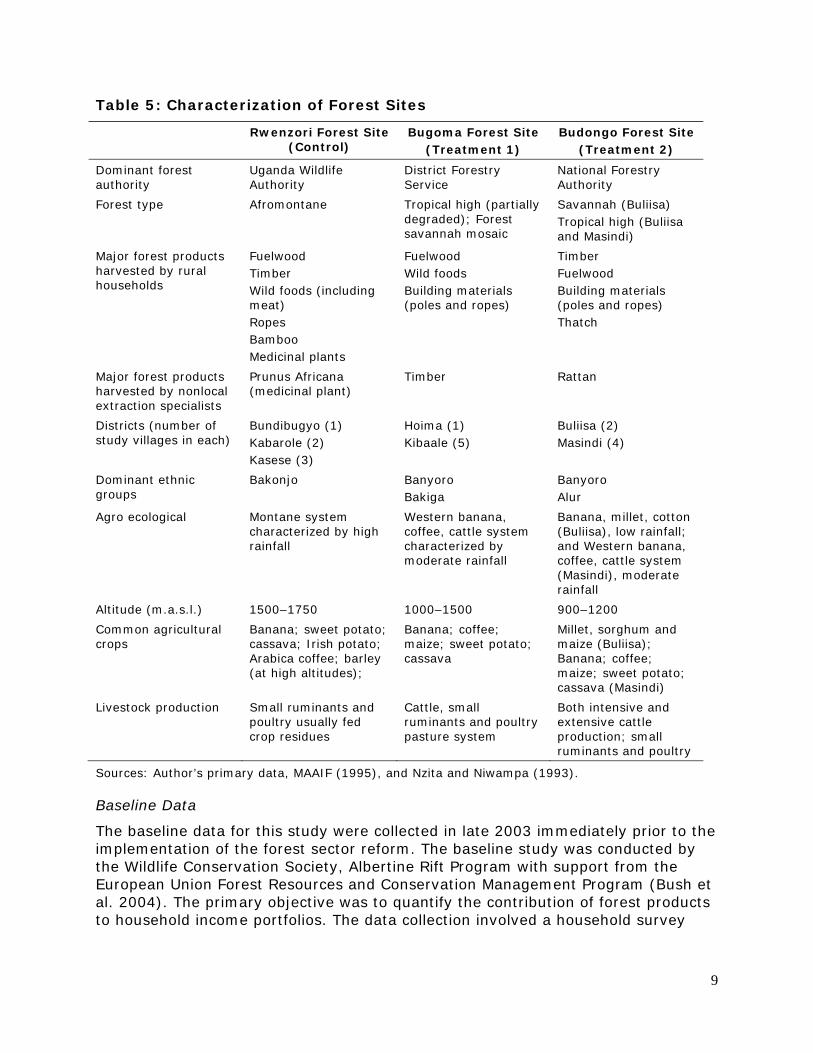
Table 5: Characterization of Forest Sites
Rwenzori Forest Site (Control)
Bugoma Forest Site (Treatment 1)
Budongo Forest Site (Treatment 2)
Dominant forest authority
Uganda Wildlife Authority
District Forestry Service
National Forestry Authority
Forest type Afromontane Tropical high (partially degraded); Forest savannah mosaic
Savannah (Buliisa) Tropical high (Buliisa and Masindi)
Major forest products harvested by rural households
Fuelwood Timber Wild foods (including meat) Ropes Bamboo Medicinal plants
Fuelwood Wild foods Building materials (poles and ropes)
Timber Fuelwood Building materials (poles and ropes) Thatch
Major forest products harvested by nonlocal extraction specialists
Prunus Africana (medicinal plant)
Timber Rattan
Districts (number of study villages in each)
Bundibugyo (1) Kabarole (2) Kasese (3)
Hoima (1) Kibaale (5)
Buliisa (2) Masindi (4)
Dominant ethnic groups
Bakonjo Banyoro Bakiga
Banyoro Alur
Agro ecological Montane system characterized by high rainfall
Western banana, coffee, cattle system characterized by moderate rainfall
Banana, millet, cotton (Buliisa), low rainfall; and Western banana, coffee, cattle system (Masindi), moderate rainfall
Altitude (m.a.s.l.) 1500–1750 1000–1500 900–1200
Common agricultural crops
Banana; sweet potato; cassava; Irish potato; Arabica coffee; barley (at high altitudes);
Banana; coffee; maize; sweet potato; cassava
Millet, sorghum and maize (Buliisa); Banana; coffee; maize; sweet potato; cassava (Masindi)
Livestock production Small ruminants and poultry usually fed crop residues
Cattle, small ruminants and poultry pasture system
Both intensive and extensive cattle production; small ruminants and poultry
Sources: Author’s primary data, MAAIF (1995), and Nzita and Niwampa (1993).
Baseline Data
The baseline data for this study were collected in late 2003 immediately prior to the implementation of the forest sector reform. The baseline study was conducted by the Wildlife Conservation Society, Albertine Rift Program with support from the European Union Forest Resources and Conservation Management Program (Bush et al. 2004). The primary objective was to quantify the contribution of forest products to household income portfolios. The data collection involved a household survey
10
designed to collect information on both subsistence and cash income generating activities.
In each of the four forests WCS visited 11 or 12 villages, for a total sample of 46 villages and roughly 640 households. WCS employed a multiple stage stratified random sampling process to select the villages included in the baseline study. As the focus of the study was communities adjacent to forests, the sampling was constrained to parishes (the second lowest administrative unit in the Ugandan local government structure) immediately adjacent to the forest. In order to get good spatial representation around the perimeter of each forest site, parishes were divided into 12 units with equal number of parishes. From each of the 12 units, one parish was randomly selected. Within each selected parish a list of villages was compiled and one village was randomly selected from each parish. Within each village participatory rural appraisal techniques including a wealth ranking exercise were used to categorize each household within the village as poor, average, or wealthy. From each group five households were randomly selected for the household interview in the baseline study (Bush et al. 2004).4
Follow-up Data
The nested research design of forest sites, villages, and households was limited to the three selected forest sites that were included in the WCS baseline survey. From each forest site the number of villages included in the sample was reduced from 12 to 6, largely due to financial and logistical constraints.5 However, the number of households surveyed in each village was increased to provide a representative sample of households within each village.
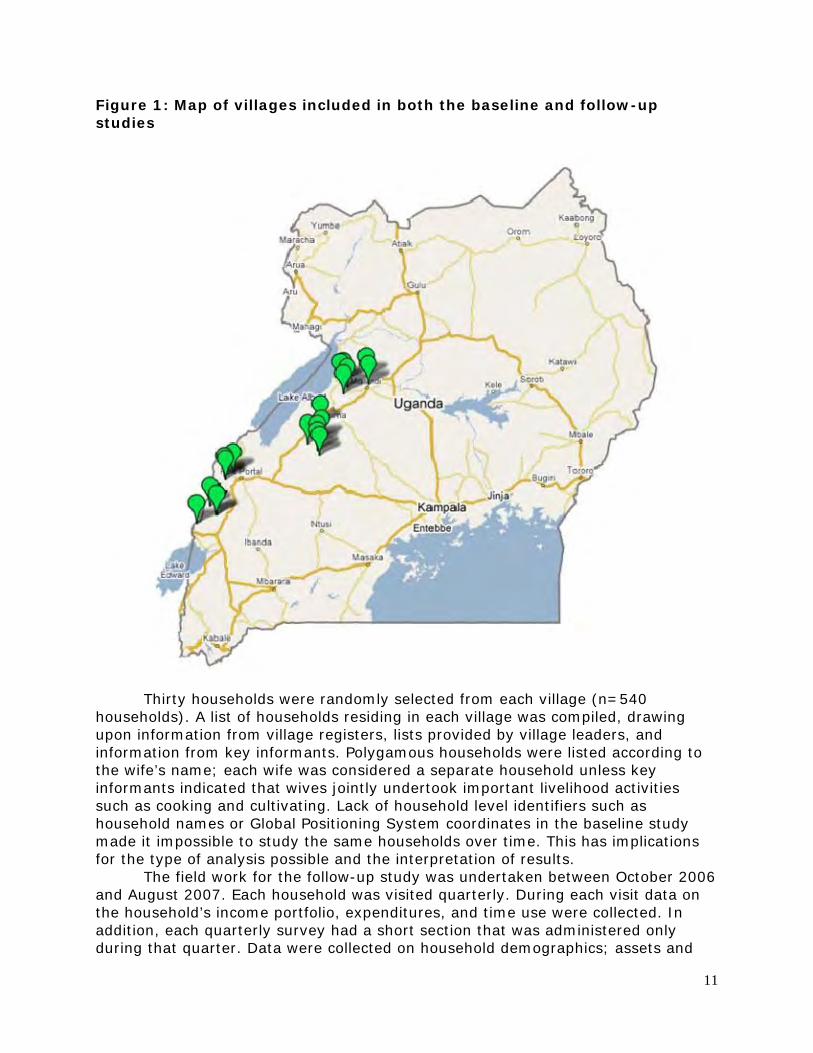
The 6 villages were randomly selected using a stratified random sampling method that took into consideration the distribution of the baseline survey villages by forest site and by district in order to maximize variation across the seven districts in the study (n=18 villages).6 After the random selection was completed the location of the villages was checked to ensure sufficient geographic distribution around each forest site. The random selection process yielded relatively uniform distribution of villages around each of the three forest sites (Figure 1).
4 Household level data for the baseline study are not a random sample of the population of households. Ideally 1/3 of the sample would be drawn from each of the three wealth categories. The distribution of households in the baseline dataset across the three wealth categories is: 28 percent poor; 34 percent average; 38 percent wealthy.
5 Difference-of-means tests were conducted on total average household income, total average forest income, and the share of income from forests to compare the 34 villages included in the WCS study with the 18 villages selected for the follow-up study to ascertain the representativeness of the villages selected. There was no significant difference of means for the variables total household income and share of total income from forests. However, total household income from forests was significantly different for households falling with the larger sample of 34 villages and the sub-sample of 18 villages included in the follow-up study.
6 At the time of the WCS study all of the villages within the Budongo forest site fell within Masindi District. In July 2006 Buliisa District was created. The villages for the Budongo site were not selected proportionally according to the new districting, but rather randomly from among the 12 villages in the Budongo forest site.
11
Figure 1: Map of villages included in both the baseline and follow-up studies
Thirty households were randomly selected from each village (n=540 households). A list of households residing in each village was compiled, drawing upon information from village registers, lists provided by village leaders, and information from key informants. Polygamous households were listed according to the wife’s name; each wife was considered a separate household unless key informants indicated that wives jointly undertook important livelihood activities such as cooking and cultivating. Lack of household level identifiers such as household names or Global Positioning System coordinates in the baseline study made it impossible to study the same households over time. This has implications for the type of analysis possible and the interpretation of results.
The field work for the follow-up study was undertaken between October 2006 and August 2007. Each household was visited quarterly. During each visit data on the household’s income portfolio, expenditures, and time use were collected. In addition, each quarterly survey had a short section that was administered only during that quarter. Data were collected on household demographics; assets and
12
resource use; general household welfare during the past five years; perceptions of access rights to forests; household access to forests, forest products and forest product markets; and perceptions of changes in forest cover and quality during the past five years.
Analysis
The effect of the forest sector reform on rural income portfolios is evaluated using three measures: annual total household income, annual household forest income, and the share of annual household income from forest products.7 While income is an imperfect measure of overall household welfare, it is relatively easy to measure and can be used as a reasonable proxy for welfare (Angelsen and Wunder 2003).
In order to be able to compare incomes across households a standardized unit of measure is required. Interhousehold variations in size and demographic composition are taken into account following Cavendish (2002).8 Equivalence scale adjustments are typically comprised of three components: a time weighting equal to the proportion of the year each household member spends in the household; a nutritional weight allocated according to the age and gender of each household member; and an economy of scale weight (Ibid). Unadjusted estimates of total income were divided by the household size in adjusted annual equivalents to produce total household income per adjusted adult equivalent units.9 Adjusted annual incomes from the baseline data were adjusted to real values by multiplying incomes in 2003 by 6.38 percent which was the average rate of inflation in Uganda during the period 2003 through 2007.10
A major challenge for this study is that we do not have a true panel dataset with the same households both before and after the reform. The regression analysis combines the baseline data with the follow-up data to create a pooled cross section over time.11 This data structure fits with the research design in that it assumes that during each year of data a new random sample is taken from the relevant population. While pooled cross sectional data is treated as a cross sectional dataset
7 The paper follows the standard income definition. Agricultural and forest income, for example, is gross value of products sold or consumed minus input costs. Following this, the value of family labor is not deducted, while the costs of hired labor are.
8 See Cavendish (2002) page 56 for a detailed discussion of adjusting crude income to adult equivalent units.
9 Because the study area does not have a significant proportion of households with migrant laborers we assumed all individuals to be time weighted with 100 percent of their time in the household. 10 Uganda Revenue Authority. 2007. http://www.ugrevenue.com/exchange rates/previous.php?date=January+2008&Submit=Show. Accessed 28 January 2008. 11 Given that this study does not use panel data (that is, tracks the same households over time) – but rather uses pooled cross sectional data from two independent random samples, the potential effect of attrition due to factors including harassment from forest officials, economic opportunity elsewhere etc. cannot be ascertained. Data on the high proportion of households that have been in the village for greater than 10 years provides relative assurance that the sample drawn for the follow-up study is relatively representative of the population of households in the 2003 baseline study conducted by the Wildlife Conservation Society. Approximately 80 percent of household heads in the follow-up sample have lived in their current village for greater than 10 years.
13
for analysis purposes, it is important to include a dummy variable for year to account for aggregate changes over time (Wooldridge 2002).
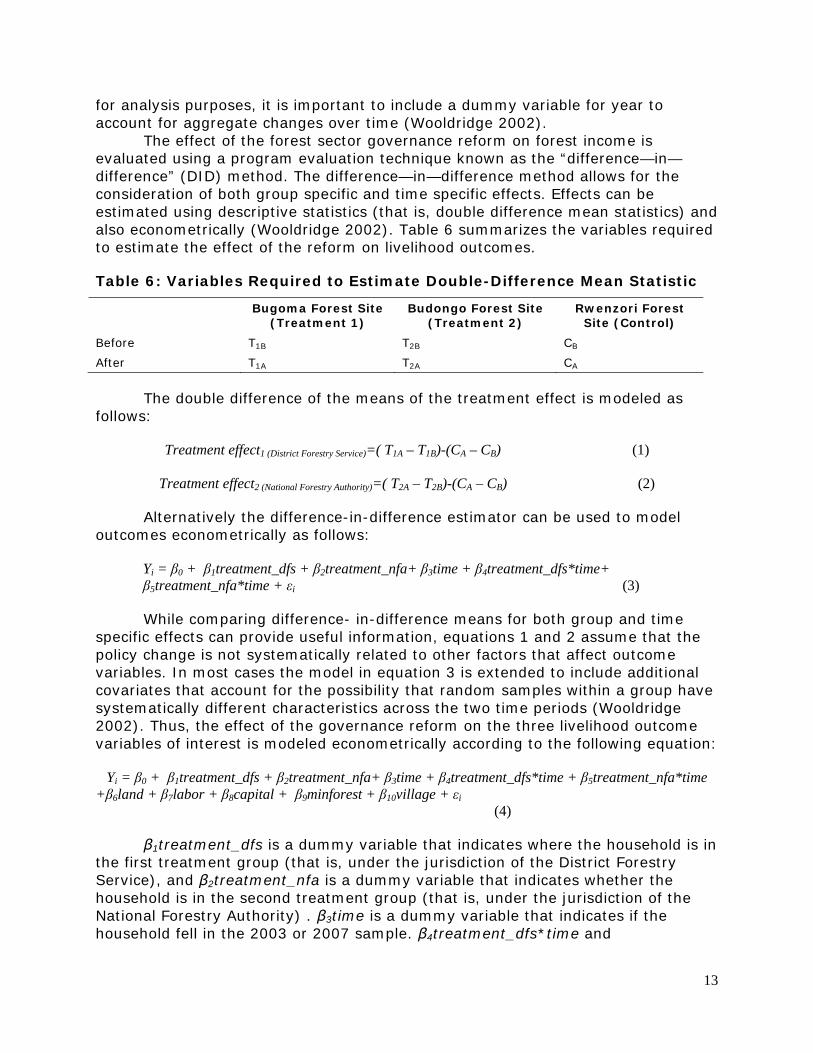
The effect of the forest sector governance reform on forest income is evaluated using a program evaluation technique known as the “difference—in—difference” (DID) method. The difference—in—difference method allows for the consideration of both group specific and time specific effects. Effects can be estimated using descriptive statistics (that is, double difference mean statistics) and also econometrically (Wooldridge 2002). Table 6 summarizes the variables required to estimate the effect of the reform on livelihood outcomes.
Table 6: Variables Required to Estimate Double-Difference Mean Statistic
Bugoma Forest Site (Treatment 1)
Budongo Forest Site (Treatment 2)
Rwenzori Forest Site (Control)
Before T1B T2B CB
After T1A T2A CA
The double difference of the means of the treatment effect is modeled as follows:
Treatment effect1 (District Forestry Service)=( T1A – T1B)-(CA – CB) (1)
Treatment effect2 (National Forestry Authority)=( T2A – T2B)-(CA – CB) (2)
Alternatively the difference-in-difference estimator can be used to model outcomes econometrically as follows:
Yi = β0 + β1treatment_dfs + β2treatment_nfa+ β3time + β4treatment_dfs*time+ β5treatment_nfa*time + εi (3)
While comparing difference- in-difference means for both group and time specific effects can provide useful information, equations 1 and 2 assume that the policy change is not systematically related to other factors that affect outcome variables. In most cases the model in equation 3 is extended to include additional covariates that account for the possibility that random samples within a group have systematically different characteristics across the two time periods (Wooldridge 2002). Thus, the effect of the governance reform on the three livelihood outcome variables of interest is modeled econometrically according to the following equation:
Yi = β0 + β1treatment_dfs + β2treatment_nfa+ β3time + β4treatment_dfs*time + β5treatment_nfa*time
+β6land + β7labor + β8capital + β9minforest + β10village + εi (4)
β1treatment_dfs is a dummy variable that indicates where the household is in the first treatment group (that is, under the jurisdiction of the District Forestry Service), and β2treatment_nfa is a dummy variable that indicates whether the household is in the second treatment group (that is, under the jurisdiction of the National Forestry Authority) . β3time is a dummy variable that indicates if the household fell in the 2003 or 2007 sample. β4treatment_dfs*time and
14
β5treatment_nfa*time are interaction variables that indicate whether the household falls in the treatment group and in the after the reform time period. Coefficients for these interaction variables measure the magnitude of change in the independent variable that can be attributed to the reform. β6land is a vector of variables that indicate the endowment of land for each household. β7labor is a vector of variables that indicate the household’s human capital and over all labor supply. β8capital is a vector of variables that indicate the household’s available capital assets. β9minforest is number of minutes it takes to travel from the household to the nearest forest by the most common means of transportation. β10village is a vector of variables that indicate several of the fixed conditions associated with each village. εi is the error term which accounts for effects that are not captured by other variables.
Models with left censored dependent variables (for example, adjusted annual household income from forests, and share of annual household income portfolio from forests) are estimated using the Tobit regression model which account for the non—linear nature of data with a significant number of zeros (Long 1997).
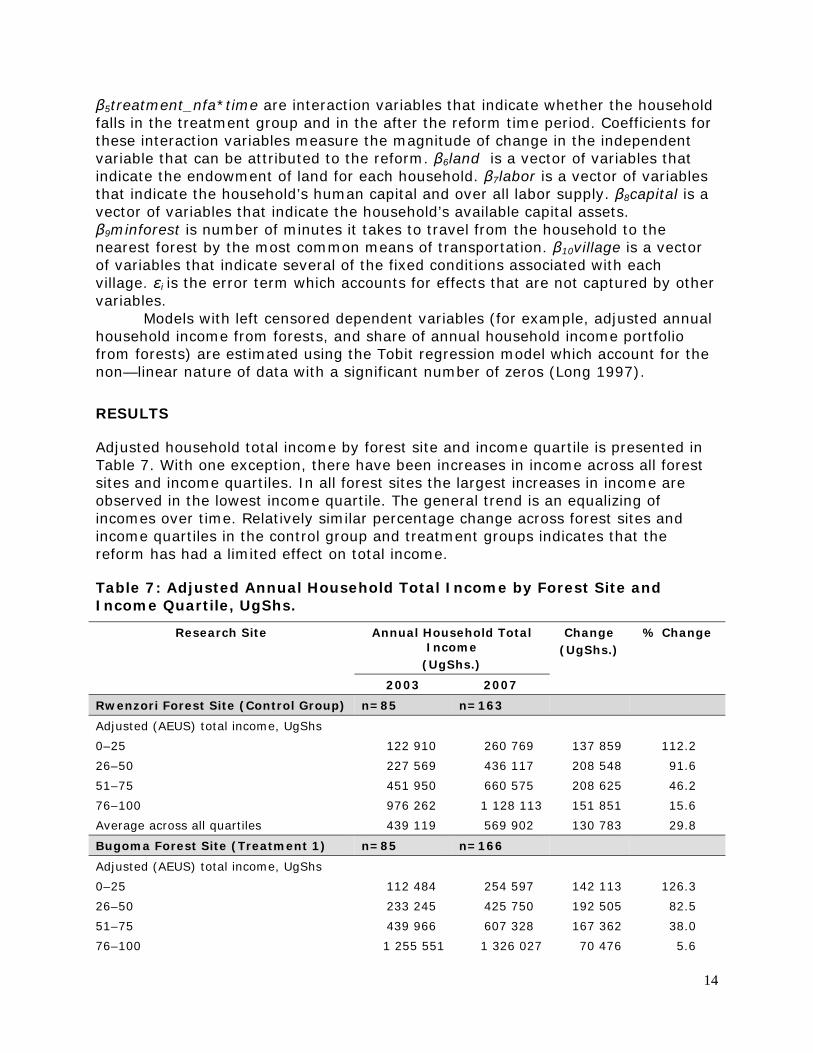
RESULTS
Adjusted household total income by forest site and income quartile is presented in Table 7. With one exception, there have been increases in income across all forest sites and income quartiles. In all forest sites the largest increases in income are observed in the lowest income quartile. The general trend is an equalizing of incomes over time. Relatively similar percentage change across forest sites and income quartiles in the control group and treatment groups indicates that the reform has had a limited effect on total income.
Table 7: Adjusted Annual Household Total Income by Forest Site and Income Quartile, UgShs.
Research Site Annual Household Total Income
(UgShs.)
Change (UgShs.)
% Change
2003 2007
Rwenzori Forest Site (Control Group) n=85 n=163
Adjusted (AEUS) total income, UgShs
0–25 122 910 260 769 137 859 112.2
26–50 227 569 436 117 208 548 91.6
51–75 451 950 660 575 208 625 46.2
76–100 976 262 1 128 113 151 851 15.6
Average across all quartiles 439 119 569 902 130 783 29.8
Bugoma Forest Site (Treatment 1) n=85 n=166
Adjusted (AEUS) total income, UgShs
0–25 112 484 254 597 142 113 126.3
26–50 233 245 425 750 192 505 82.5
51–75 439 966 607 328 167 362 38.0
76–100 1 255 551 1 326 027 70 476 5.6
15
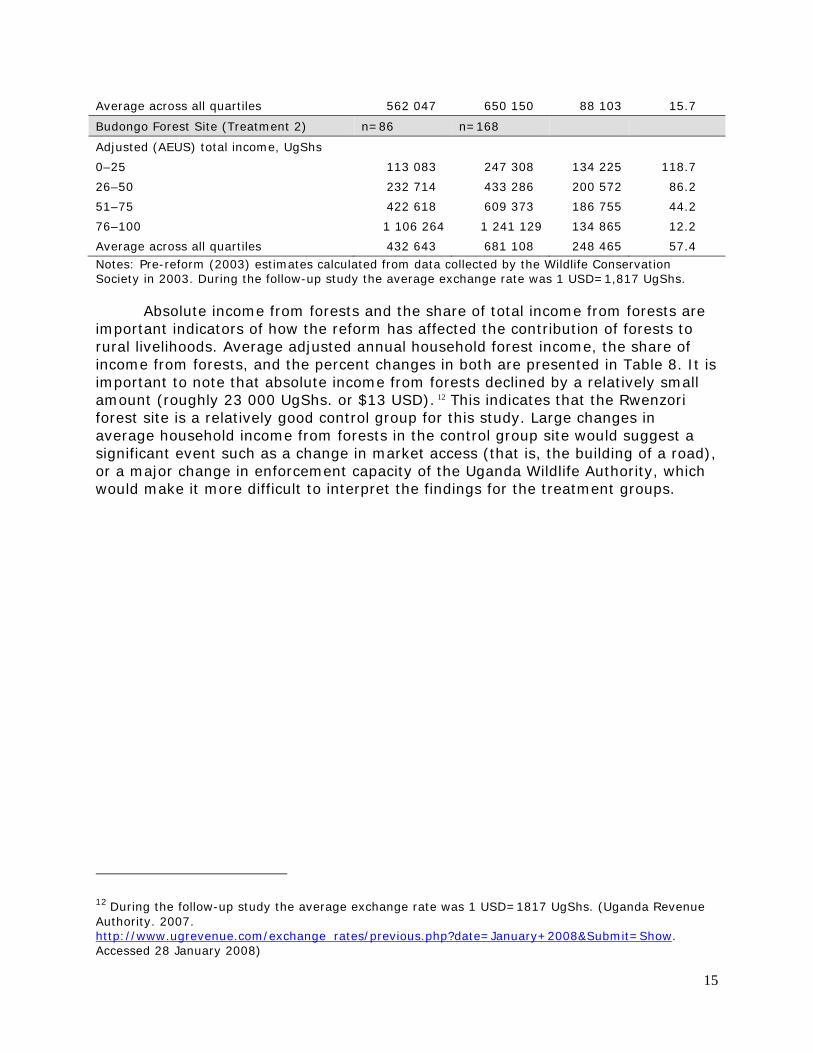
Average across all quartiles 562 047 650 150 88 103 15.7
Budongo Forest Site (Treatment 2) n=86 n=168
Adjusted (AEUS) total income, UgShs
0–25 113 083 247 308 134 225 118.7
26–50 232 714 433 286 200 572 86.2
51–75 422 618 609 373 186 755 44.2
76–100 1 106 264 1 241 129 134 865 12.2
Average across all quartiles 432 643 681 108 248 465 57.4 Notes: Pre-reform (2003) estimates calculated from data collected by the Wildlife Conservation Society in 2003. During the follow-up study the average exchange rate was 1 USD=1,817 UgShs.
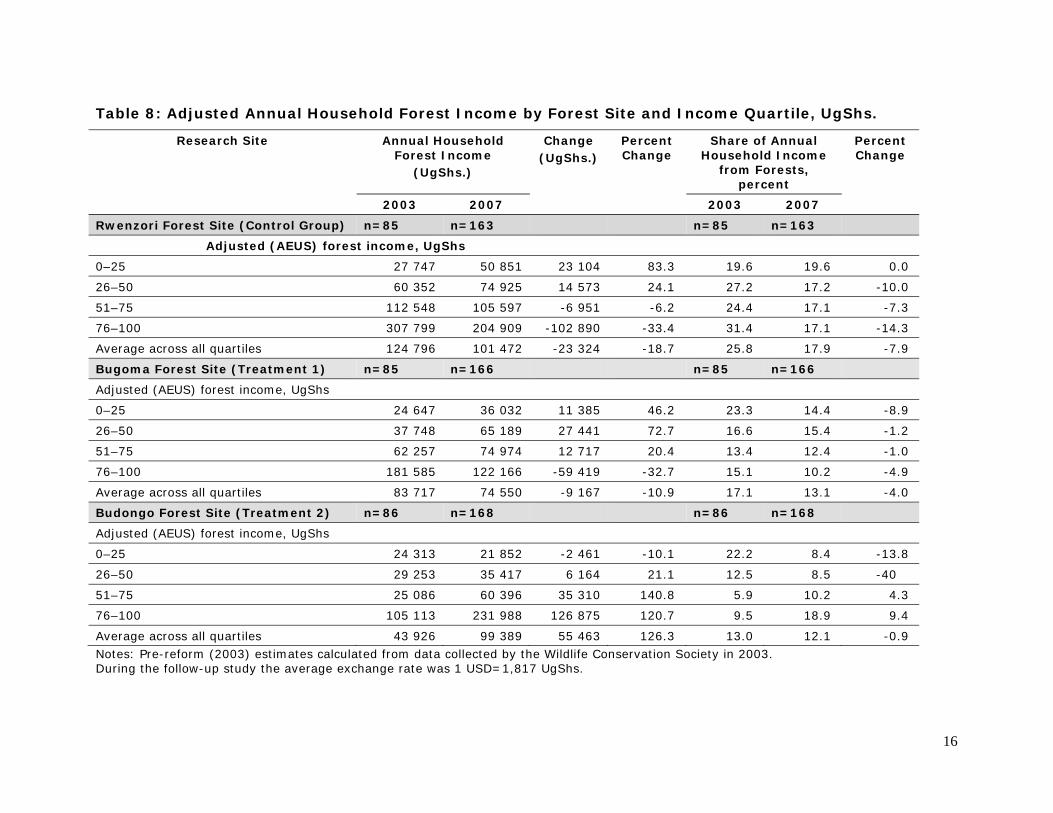
Absolute income from forests and the share of total income from forests are important indicators of how the reform has affected the contribution of forests to rural livelihoods. Average adjusted annual household forest income, the share of income from forests, and the percent changes in both are presented in Table 8. It is important to note that absolute income from forests declined by a relatively small amount (roughly 23 000 UgShs. or $13 USD). 12 This indicates that the Rwenzori forest site is a relatively good control group for this study. Large changes in average household income from forests in the control group site would suggest a significant event such as a change in market access (that is, the building of a road), or a major change in enforcement capacity of the Uganda Wildlife Authority, which would make it more difficult to interpret the findings for the treatment groups.
12 During the follow-up study the average exchange rate was 1 USD=1817 UgShs. (Uganda Revenue Authority. 2007. http://www.ugrevenue.com/exchange rates/previous.php?date=January+2008&Submit=Show. Accessed 28 January 2008)
16
Table 8: Adjusted Annual Household Forest Income by Forest Site and Income Quartile, UgShs.
Research Site Annual Household Forest Income
(UgShs.)
Change (UgShs.)
Percent Change
Share of Annual Household Income
from Forests, percent
Percent Change
2003 2007 2003 2007
Rwenzori Forest Site (Control Group) n=85 n=163 n=85 n=163
Adjusted (AEUS) forest income, UgShs
0–25 27 747 50 851 23 104 83.3 19.6 19.6 0.0
26–50 60 352 74 925 14 573 24.1 27.2 17.2 -10.0
51–75 112 548 105 597 -6 951 -6.2 24.4 17.1 -7.3
76–100 307 799 204 909 -102 890 -33.4 31.4 17.1 -14.3
Average across all quartiles 124 796 101 472 -23 324 -18.7 25.8 17.9 -7.9
Bugoma Forest Site (Treatment 1) n=85 n=166 n=85 n=166
Adjusted (AEUS) forest income, UgShs 0–25 24 647 36 032 11 385 46.2 23.3 14.4 -8.9
26–50 37 748 65 189 27 441 72.7 16.6 15.4 -1.2
51–75 62 257 74 974 12 717 20.4 13.4 12.4 -1.0
76–100 181 585 122 166 -59 419 -32.7 15.1 10.2 -4.9
Average across all quartiles 83 717 74 550 -9 167 -10.9 17.1 13.1 -4.0
Budongo Forest Site (Treatment 2) n=86 n=168 n=86 n=168
Adjusted (AEUS) forest income, UgShs 0–25 24 313 21 852 -2 461 -10.1 22.2 8.4 -13.8
26–50 29 253 35 417 6 164 21.1 12.5 8.5 -40
51–75 25 086 60 396 35 310 140.8 5.9 10.2 4.3
76–100 105 113 231 988 126 875 120.7 9.5 18.9 9.4
Average across all quartiles 43 926 99 389 55 463 126.3 13.0 12.1 -0.9 Notes: Pre-reform (2003) estimates calculated from data collected by the Wildlife Conservation Society in 2003. During the follow-up study the average exchange rate was 1 USD=1,817 UgShs.
17
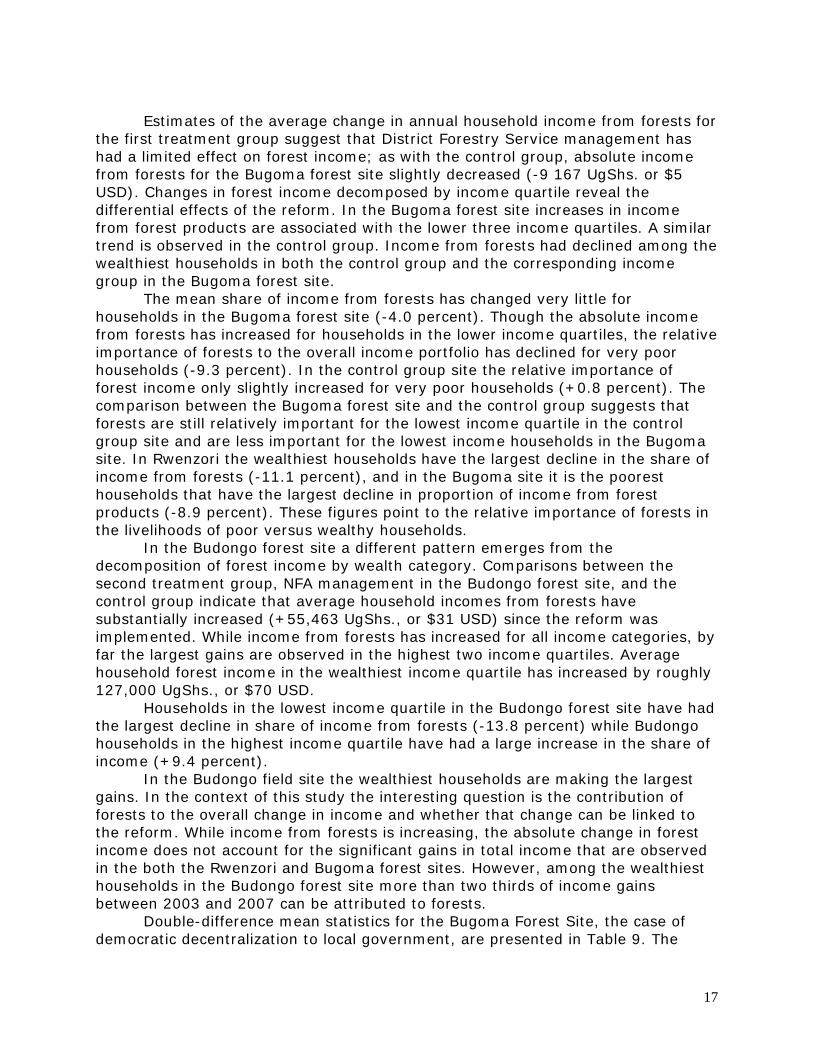
Estimates of the average change in annual household income from forests for the first treatment group suggest that District Forestry Service management has had a limited effect on forest income; as with the control group, absolute income from forests for the Bugoma forest site slightly decreased (-9 167 UgShs. or $5 USD). Changes in forest income decomposed by income quartile reveal the differential effects of the reform. In the Bugoma forest site increases in income from forest products are associated with the lower three income quartiles. A similar trend is observed in the control group. Income from forests had declined among the wealthiest households in both the control group and the corresponding income group in the Bugoma forest site.
The mean share of income from forests has changed very little for households in the Bugoma forest site (-4.0 percent). Though the absolute income from forests has increased for households in the lower income quartiles, the relative importance of forests to the overall income portfolio has declined for very poor households (-9.3 percent). In the control group site the relative importance of forest income only slightly increased for very poor households (+0.8 percent). The comparison between the Bugoma forest site and the control group suggests that forests are still relatively important for the lowest income quartile in the control group site and are less important for the lowest income households in the Bugoma site. In Rwenzori the wealthiest households have the largest decline in the share of income from forests (-11.1 percent), and in the Bugoma site it is the poorest households that have the largest decline in proportion of income from forest products (-8.9 percent). These figures point to the relative importance of forests in the livelihoods of poor versus wealthy households.
In the Budongo forest site a different pattern emerges from the decomposition of forest income by wealth category. Comparisons between the second treatment group, NFA management in the Budongo forest site, and the control group indicate that average household incomes from forests have substantially increased (+55,463 UgShs., or $31 USD) since the reform was implemented. While income from forests has increased for all income categories, by far the largest gains are observed in the highest two income quartiles. Average household forest income in the wealthiest income quartile has increased by roughly 127,000 UgShs., or $70 USD.
Households in the lowest income quartile in the Budongo forest site have had the largest decline in share of income from forests (-13.8 percent) while Budongo households in the highest income quartile have had a large increase in the share of income (+9.4 percent).
In the Budongo field site the wealthiest households are making the largest gains. In the context of this study the interesting question is the contribution of forests to the overall change in income and whether that change can be linked to the reform. While income from forests is increasing, the absolute change in forest income does not account for the significant gains in total income that are observed in the both the Rwenzori and Bugoma forest sites. However, among the wealthiest households in the Budongo forest site more than two thirds of income gains between 2003 and 2007 can be attributed to forests.
Double-difference mean statistics for the Bugoma Forest Site, the case of democratic decentralization to local government, are presented in Table 9. The
18
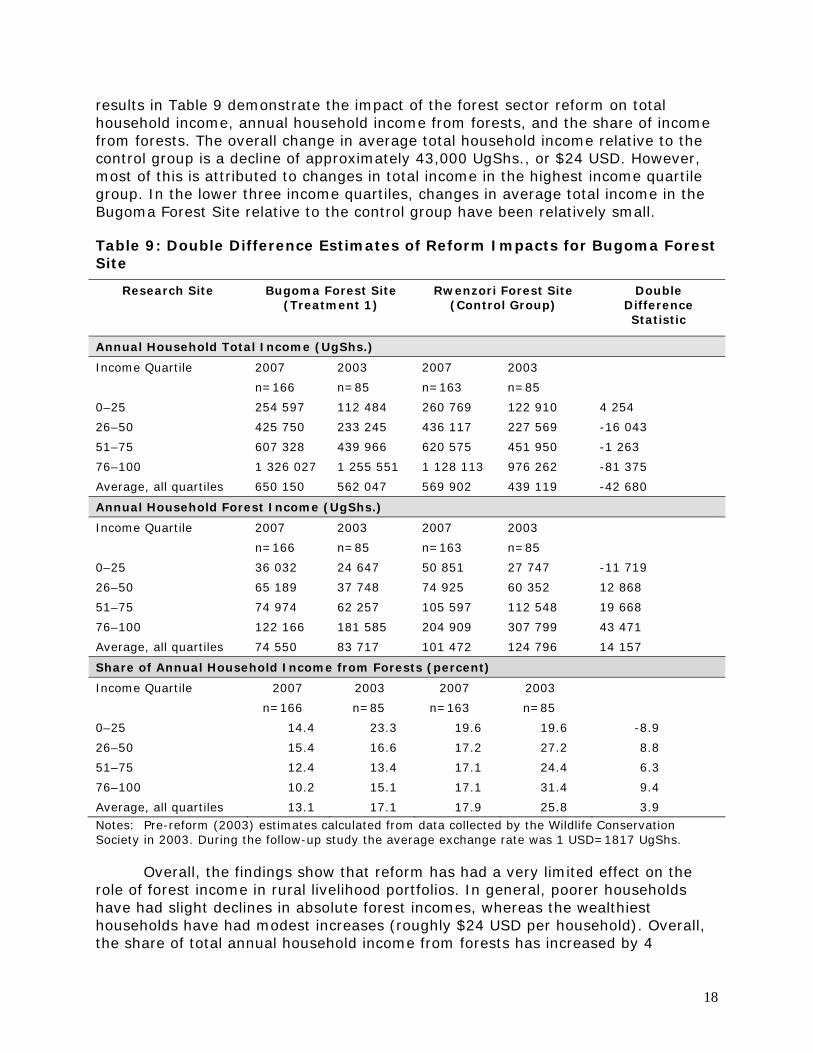
results in Table 9 demonstrate the impact of the forest sector reform on total household income, annual household income from forests, and the share of income from forests. The overall change in average total household income relative to the control group is a decline of approximately 43,000 UgShs., or $24 USD. However, most of this is attributed to changes in total income in the highest income quartile group. In the lower three income quartiles, changes in average total income in the Bugoma Forest Site relative to the control group have been relatively small.
Table 9: Double Difference Estimates of Reform Impacts for Bugoma Forest Site
Research Site Bugoma Forest Site (Treatment 1)
Rwenzori Forest Site (Control Group)
Double Difference Statistic
Annual Household Total Income (UgShs.)
Income Quartile 2007 2003 2007 2003
n=166 n=85 n=163 n=85
0–25 254 597 112 484 260 769 122 910 4 254
26–50 425 750 233 245 436 117 227 569 -16 043
51–75 607 328 439 966 620 575 451 950 -1 263
76–100 1 326 027 1 255 551 1 128 113 976 262 -81 375
Average, all quartiles 650 150 562 047 569 902 439 119 -42 680
Annual Household Forest Income (UgShs.)
Income Quartile 2007 2003 2007 2003
n=166 n=85 n=163 n=85
0–25 36 032 24 647 50 851 27 747 -11 719
26–50 65 189 37 748 74 925 60 352 12 868
51–75 74 974 62 257 105 597 112 548 19 668
76–100 122 166 181 585 204 909 307 799 43 471
Average, all quartiles 74 550 83 717 101 472 124 796 14 157
Share of Annual Household Income from Forests (percent)
Income Quartile 2007 2003 2007 2003
n=166 n=85 n=163 n=85
0–25 14.4 23.3 19.6 19.6 -8.9
26–50 15.4 16.6 17.2 27.2 8.8
51–75 12.4 13.4 17.1 24.4 6.3
76–100 10.2 15.1 17.1 31.4 9.4
Average, all quartiles 13.1 17.1 17.9 25.8 3.9 Notes: Pre-reform (2003) estimates calculated from data collected by the Wildlife Conservation Society in 2003. During the follow-up study the average exchange rate was 1 USD=1817 UgShs.
Overall, the findings show that reform has had a very limited effect on the role of forest income in rural livelihood portfolios. In general, poorer households have had slight declines in absolute forest incomes, whereas the wealthiest households have had modest increases (roughly $24 USD per household). Overall, the share of total annual household income from forests has increased by 4
19
percent. As with changes in absolute forest income, the relative importance of forests to total household income has declined for the poorest households. The share of total household income from forests has modestly increased for the upper three income quartiles.
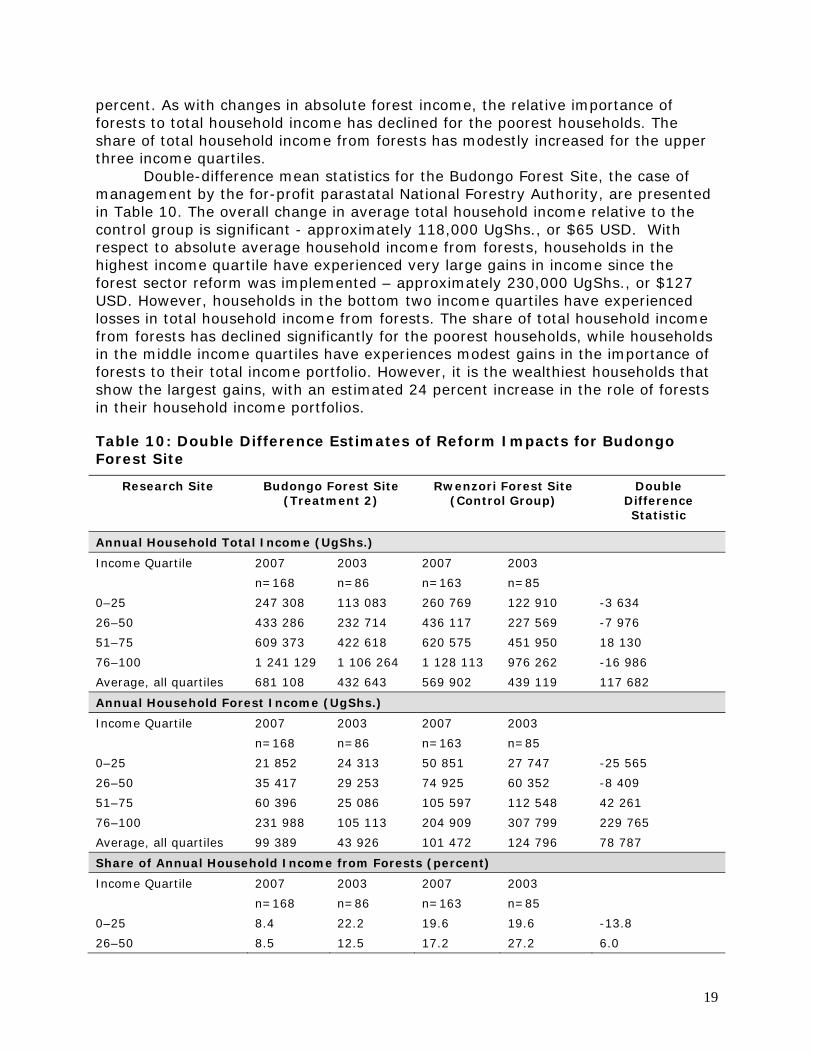
Double-difference mean statistics for the Budongo Forest Site, the case of management by the for-profit parastatal National Forestry Authority, are presented in Table 10. The overall change in average total household income relative to the control group is significant - approximately 118,000 UgShs., or $65 USD. With respect to absolute average household income from forests, households in the highest income quartile have experienced very large gains in income since the forest sector reform was implemented – approximately 230,000 UgShs., or $127 USD. However, households in the bottom two income quartiles have experienced losses in total household income from forests. The share of total household income from forests has declined significantly for the poorest households, while households in the middle income quartiles have experiences modest gains in the importance of forests to their total income portfolio. However, it is the wealthiest households that show the largest gains, with an estimated 24 percent increase in the role of forests in their household income portfolios.
Table 10: Double Difference Estimates of Reform Impacts for Budongo Forest Site
Research Site Budongo Forest Site (Treatment 2)
Rwenzori Forest Site (Control Group)
Double Difference Statistic
Annual Household Total Income (UgShs.)
Income Quartile 2007 2003 2007 2003
n=168 n=86 n=163 n=85
0–25 247 308 113 083 260 769 122 910 -3 634
26–50 433 286 232 714 436 117 227 569 -7 976
51–75 609 373 422 618 620 575 451 950 18 130
76–100 1 241 129 1 106 264 1 128 113 976 262 -16 986
Average, all quartiles 681 108 432 643 569 902 439 119 117 682
Annual Household Forest Income (UgShs.)
Income Quartile 2007 2003 2007 2003
n=168 n=86 n=163 n=85
0–25 21 852 24 313 50 851 27 747 -25 565
26–50 35 417 29 253 74 925 60 352 -8 409
51–75 60 396 25 086 105 597 112 548 42 261
76–100 231 988 105 113 204 909 307 799 229 765
Average, all quartiles 99 389 43 926 101 472 124 796 78 787
Share of Annual Household Income from Forests (percent)
Income Quartile 2007 2003 2007 2003
n=168 n=86 n=163 n=85
0–25 8.4 22.2 19.6 19.6 -13.8
26–50 8.5 12.5 17.2 27.2 6.0
20
51–75 10.2 5.9 17.1 24.4 11.6
76–100 18.9 9.5 17.1 31.4 23.7
Average, all quartiles 12.1 13.0 17.9 25.8 7.0 Notes: Pre-reform (2003) estimates calculated from data collected by the Wildlife Conservation Society in 2003. During the follow-up study the average exchange rate was 1 USD=1817 UgShs.
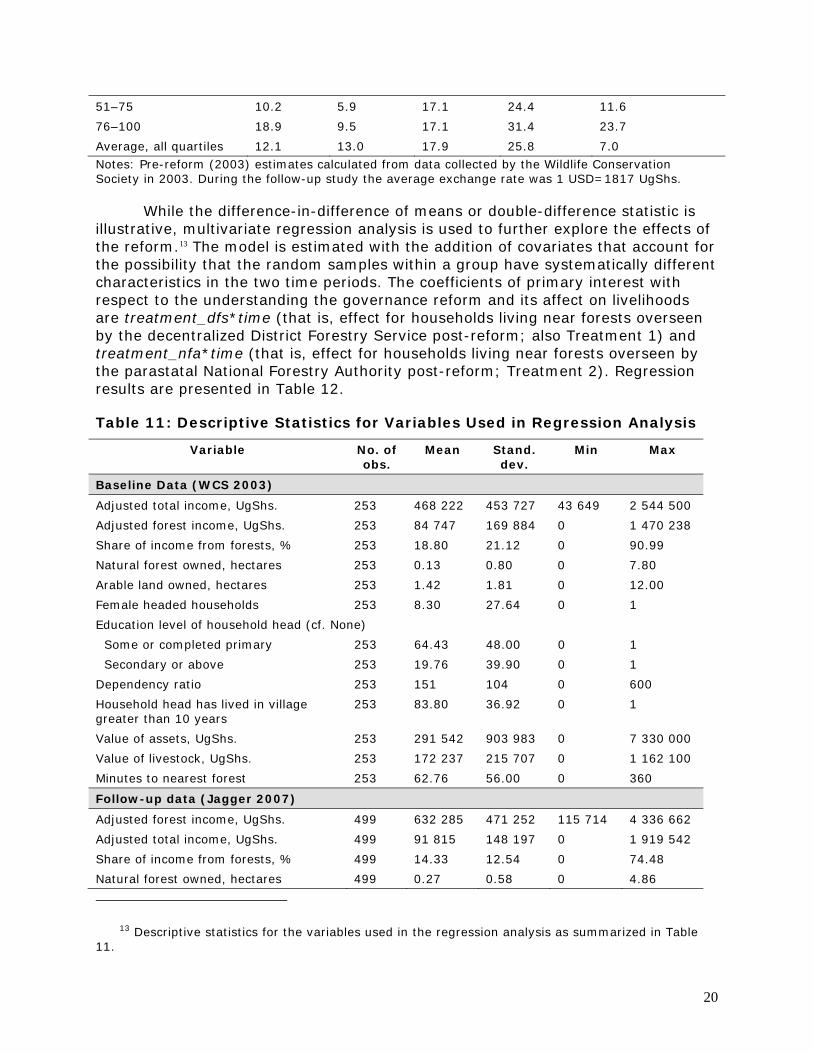
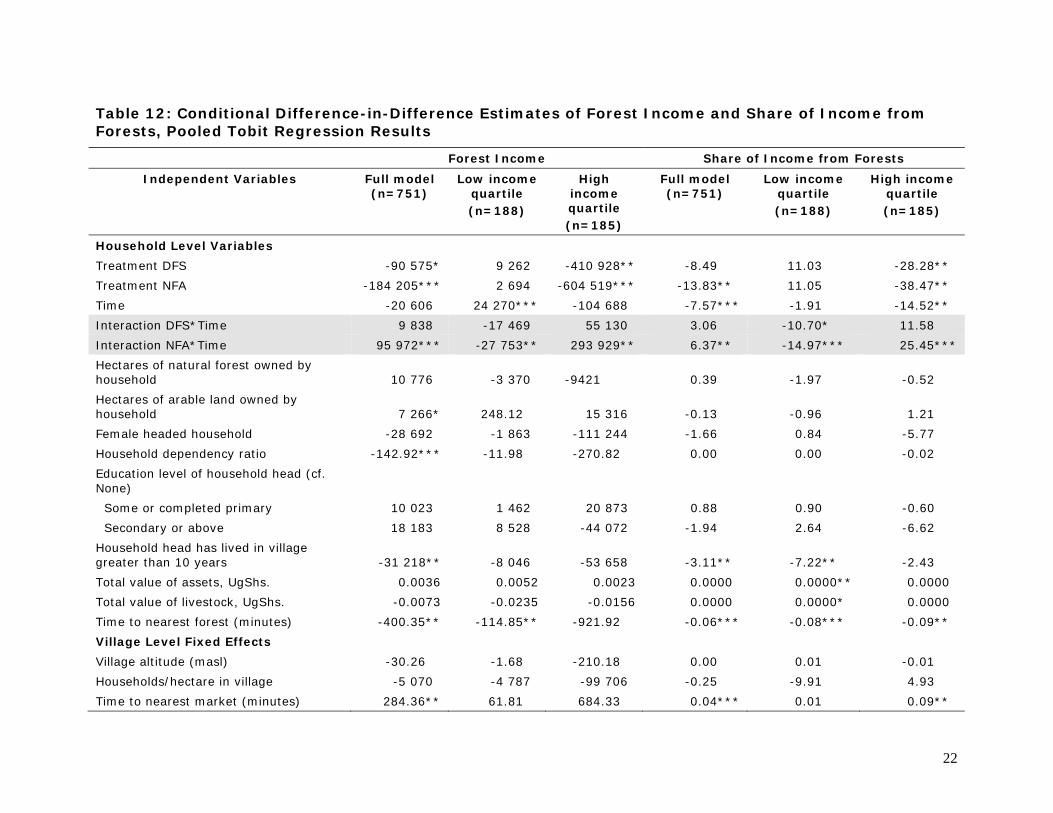
While the difference-in-difference of means or double-difference statistic is illustrative, multivariate regression analysis is used to further explore the effects of the reform.13 The model is estimated with the addition of covariates that account for the possibility that the random samples within a group have systematically different characteristics in the two time periods. The coefficients of primary interest with respect to the understanding the governance reform and its affect on livelihoods are treatment_dfs*time (that is, effect for households living near forests overseen by the decentralized District Forestry Service post-reform; also Treatment 1) and treatment_nfa*time (that is, effect for households living near forests overseen by the parastatal National Forestry Authority post-reform; Treatment 2). Regression results are presented in Table 12.
Table 11: Descriptive Statistics for Variables Used in Regression Analysis
Variable No. of obs.
Mean Stand. dev.
Min Max
Baseline Data (WCS 2003)
Adjusted total income, UgShs. 253 468 222 453 727 43 649 2 544 500
Adjusted forest income, UgShs. 253 84 747 169 884 0 1 470 238
Share of income from forests, % 253 18.80 21.12 0 90.99
Natural forest owned, hectares 253 0.13 0.80 0 7.80
Arable land owned, hectares 253 1.42 1.81 0 12.00
Female headed households 253 8.30 27.64 0 1
Education level of household head (cf. None)
Some or completed primary 253 64.43 48.00 0 1
Secondary or above 253 19.76 39.90 0 1
Dependency ratio 253 151 104 0 600
Household head has lived in village greater than 10 years
253 83.80 36.92 0 1
Value of assets, UgShs. 253 291 542 903 983 0 7 330 000
Value of livestock, UgShs. 253 172 237 215 707 0 1 162 100
Minutes to nearest forest 253 62.76 56.00 0 360
Follow-up data (Jagger 2007)
Adjusted forest income, UgShs. 499 632 285 471 252 115 714 4 336 662
Adjusted total income, UgShs. 499 91 815 148 197 0 1 919 542
Share of income from forests, % 499 14.33 12.54 0 74.48
Natural forest owned, hectares 499 0.27 0.58 0 4.86
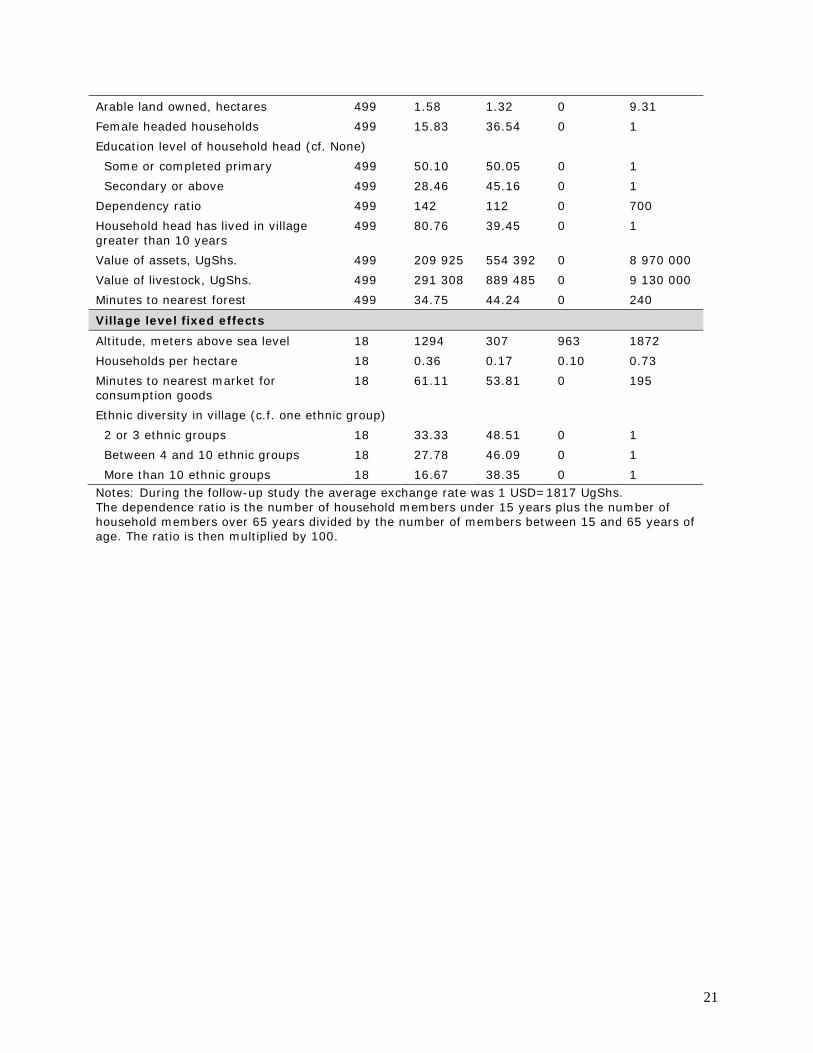
13 Descriptive statistics for the variables used in the regression analysis as summarized in Table 11.
21
Arable land owned, hectares 499 1.58 1.32 0 9.31
Female headed households 499 15.83 36.54 0 1
Education level of household head (cf. None)
Some or completed primary 499 50.10 50.05 0 1
Secondary or above 499 28.46 45.16 0 1
Dependency ratio 499 142 112 0 700
Household head has lived in village greater than 10 years
499 80.76 39.45 0 1
Value of assets, UgShs. 499 209 925 554 392 0 8 970 000
Value of livestock, UgShs. 499 291 308 889 485 0 9 130 000
Minutes to nearest forest 499 34.75 44.24 0 240
Village level fixed effects
Altitude, meters above sea level 18 1294 307 963 1872
Households per hectare 18 0.36 0.17 0.10 0.73
Minutes to nearest market for consumption goods
18 61.11 53.81 0 195
Ethnic diversity in village (c.f. one ethnic group)
2 or 3 ethnic groups 18 33.33 48.51 0 1
Between 4 and 10 ethnic groups 18 27.78 46.09 0 1
More than 10 ethnic groups 18 16.67 38.35 0 1 Notes: During the follow-up study the average exchange rate was 1 USD=1817 UgShs. The dependence ratio is the number of household members under 15 years plus the number of household members over 65 years divided by the number of members between 15 and 65 years of age. The ratio is then multiplied by 100.
22
Table 12: Conditional Difference-in-Difference Estimates of Forest Income and Share of Income from Forests, Pooled Tobit Regression Results
Forest Income Share of Income from Forests
Independent Variables Full model (n=751)
Low income quartile (n=188)
High income quartile (n=185)
Full model (n=751)
Low income quartile (n=188)
High income quartile (n=185)
Household Level Variables
Treatment DFS -90 575* 9 262 -410 928** -8.49 11.03 -28.28**
Treatment NFA -184 205*** 2 694 -604 519*** -13.83** 11.05 -38.47**
Time -20 606 24 270*** -104 688 -7.57*** -1.91 -14.52**
Interaction DFS*Time 9 838 -17 469 55 130 3.06 -10.70* 11.58
Interaction NFA*Time 95 972*** -27 753** 293 929** 6.37** -14.97*** 25.45***
Hectares of natural forest owned by household 10 776 -3 370 -9421 0.39 -1.97 -0.52
Hectares of arable land owned by household 7 266* 248.12 15 316 -0.13 -0.96 1.21
Female headed household -28 692 -1 863 -111 244 -1.66 0.84 -5.77
Household dependency ratio -142.92*** -11.98 -270.82 0.00 0.00 -0.02
Education level of household head (cf. None)
Some or completed primary 10 023 1 462 20 873 0.88 0.90 -0.60
Secondary or above 18 183 8 528 -44 072 -1.94 2.64 -6.62
Household head has lived in village greater than 10 years -31 218** -8 046 -53 658 -3.11** -7.22** -2.43
Total value of assets, UgShs. 0.0036 0.0052 0.0023 0.0000 0.0000** 0.0000
Total value of livestock, UgShs. -0.0073 -0.0235 -0.0156 0.0000 0.0000* 0.0000
Time to nearest forest (minutes) -400.35** -114.85** -921.92 -0.06*** -0.08*** -0.09**
Village Level Fixed Effects
Village altitude (masl) -30.26 -1.68 -210.18 0.00 0.01 -0.01
Households/hectare in village -5 070 -4 787 -99 706 -0.25 -9.91 4.93
Time to nearest market (minutes) 284.36** 61.81 684.33 0.04*** 0.01 0.09**
23
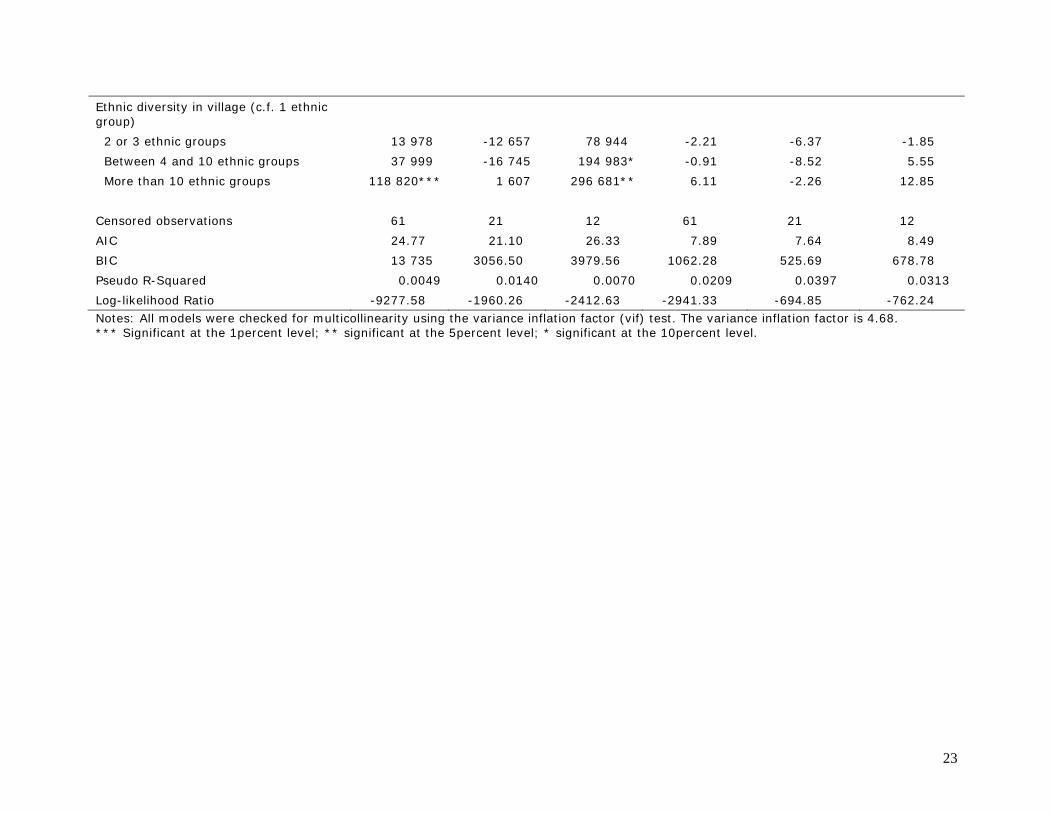
Ethnic diversity in village (c.f. 1 ethnic group)
2 or 3 ethnic groups 13 978 -12 657 78 944 -2.21 -6.37 -1.85
Between 4 and 10 ethnic groups 37 999 -16 745 194 983* -0.91 -8.52 5.55
More than 10 ethnic groups 118 820*** 1 607 296 681** 6.11 -2.26 12.85
Censored observations 61 21 12 61 21 12
AIC 24.77 21.10 26.33 7.89 7.64 8.49
BIC 13 735 3056.50 3979.56 1062.28 525.69 678.78
Pseudo R-Squared 0.0049 0.0140 0.0070 0.0209 0.0397 0.0313
Log-likelihood Ratio -9277.58 -1960.26 -2412.63 -2941.33 -694.85 -762.24 Notes: All models were checked for multicollinearity using the variance inflation factor (vif) test. The variance inflation factor is 4.68. *** Significant at the 1percent level; ** significant at the 5percent level; * significant at the 10percent level.
24
Controlling for household and village level characteristics, the net effect of the reform in the Bugoma forest site (that is, democratic decentralization to local government) is relatively small.
The transition from the Forestry Department to the District Forestry Services appears to have had a negligible effect on average household income from forests (that is, an increase of 9,838 UgShs., or $5 USD). Decomposition by income quartile reveals that the poorest households have lost a modest amount of forest income (17,469 UgShs., or $10 USD); whereas wealthy households have increased income from forests by an average of 55,150 UgShs., or $30 USD. The share of income from forests has increased 3.1 percent for the average household. Regression results decomposed by income quartile indicate that the share of income from forests has declined for the poorest households (10.7 percent) and increased for the wealthiest households (11.6 percent). The decline in the share of income from forests for poor households is statistically significant at the 10 percent level. Though the variable indicating female headed household is not statistically significant it is important to note that approximately 32 percent of households falling within the Bugoma Forest Site sample in the lowest income quartile are female headed. For comparison purposes, 21 percent of households in the highest income quartile are female headed in this study site.
These findings indicate that the transition to local government control over forest management has had a limited effect on livelihoods in the treatment group. Further, forest income for the poorest households has declined, while there have been gains in forest income for the wealthiest households. Limited capacity of District Forest Officers (DFOs) operating in the two Districts that are included in the Bugoma forest site is a possible explanation for the lack of attention to improving rural livelihoods. DFOs in Hoima and Kibaale Districts devote the majority of their time to the collection of district revenues for timber and charcoal transport. Their primary connection with local resource users is via periodic locally broadcast radio programs. The majority of forest income in the Bugoma forest site is for subsistence use; local resource users are generally excluded from accessing markets for high value forest products. In addition, few are aware of the value of the timber that is being harvested on private and customary lands in this area. The desire to clear land for agriculture often means that land owners will invite timber harvesters to cut large trees on their land for no cost, or for a payment far below market value.
Findings for the Budongo forest site (that is, households living adjacent to the Central Forest Reserve managed by the National Forestry Authority) suggest that the reform has had a large and unexpected effect in this area. In the Budongo forest site the average increase in household forest income is 95,972 UgShs., or $53 USD. The differential effect of the reform on forest income for the poorest and wealthiest households is striking; households in the lowest income quartile have lost an average of 27,753 UgShs., or $15 USD per household, while households in the highest income quartile are estimated to have increased forest income by 293,929 UgShs., or $162 USD per year. The share of income from forests has increased 6.4 percent for the average household. Regression results decomposed by income quartile indicate that the share of income from forests has declined for the poorest households (15 percent) and increased for the wealthiest households
25
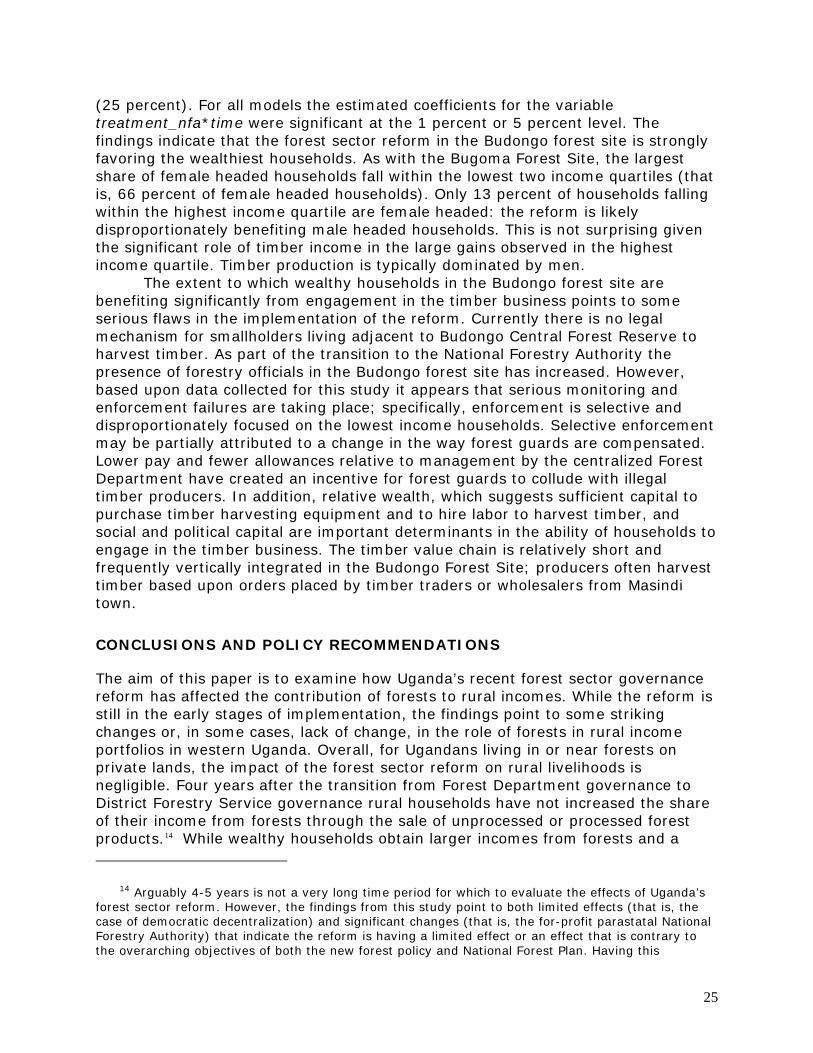
(25 percent). For all models the estimated coefficients for the variable treatment_nfa*time were significant at the 1 percent or 5 percent level. The findings indicate that the forest sector reform in the Budongo forest site is strongly favoring the wealthiest households. As with the Bugoma Forest Site, the largest share of female headed households fall within the lowest two income quartiles (that is, 66 percent of female headed households). Only 13 percent of households falling within the highest income quartile are female headed: the reform is likely disproportionately benefiting male headed households. This is not surprising given the significant role of timber income in the large gains observed in the highest income quartile. Timber production is typically dominated by men.
The extent to which wealthy households in the Budongo forest site are benefiting significantly from engagement in the timber business points to some serious flaws in the implementation of the reform. Currently there is no legal mechanism for smallholders living adjacent to Budongo Central Forest Reserve to harvest timber. As part of the transition to the National Forestry Authority the presence of forestry officials in the Budongo forest site has increased. However, based upon data collected for this study it appears that serious monitoring and enforcement failures are taking place; specifically, enforcement is selective and disproportionately focused on the lowest income households. Selective enforcement may be partially attributed to a change in the way forest guards are compensated. Lower pay and fewer allowances relative to management by the centralized Forest Department have created an incentive for forest guards to collude with illegal timber producers. In addition, relative wealth, which suggests sufficient capital to purchase timber harvesting equipment and to hire labor to harvest timber, and social and political capital are important determinants in the ability of households to engage in the timber business. The timber value chain is relatively short and frequently vertically integrated in the Budongo Forest Site; producers often harvest timber based upon orders placed by timber traders or wholesalers from Masindi town.
CONCLUSIONS AND POLICY RECOMMENDATIONS
The aim of this paper is to examine how Uganda’s recent forest sector governance reform has affected the contribution of forests to rural incomes. While the reform is still in the early stages of implementation, the findings point to some striking changes or, in some cases, lack of change, in the role of forests in rural income portfolios in western Uganda. Overall, for Ugandans living in or near forests on private lands, the impact of the forest sector reform on rural livelihoods is negligible. Four years after the transition from Forest Department governance to District Forestry Service governance rural households have not increased the share of their income from forests through the sale of unprocessed or processed forest products.14 While wealthy households obtain larger incomes from forests and a
14 Arguably 4-5 years is not a very long time period for which to evaluate the effects of Uganda’s forest sector reform. However, the findings from this study point to both limited effects (that is, the case of democratic decentralization) and significant changes (that is, the for-profit parastatal National Forestry Authority) that indicate the reform is having a limited effect or an effect that is contrary to the overarching objectives of both the new forest policy and National Forest Plan. Having this
26
larger share of total income from forests, the values are not large, and are indicative of the subsistence nature of forest product harvesting in this area. These findings indicate that forest sector decentralization to local government in Uganda has not had the desired outcome of increasing the role of forests in rural household income portfolios.
A second story emerges from the analysis of the transition from Forest Department to National Forestry Authority in the Bugondo forest site. We found that relatively wealthy rural households living adjacent to the central forest reserve experienced large gains in income from forests, total income, and the share of income from forests. However, households in the lowest income quartiles experienced moderate losses in forest income and significant losses in the share of income from forests. The majority of forest income in the study area is from sawn wood, which is harvested and sold illegally. In this case livelihoods have been improved, but due to the institutional failure of the National Forestry Authority to regulate and enforce rules regarding timber harvesting. The transfer of responsibilities for central forest reserves to the National Forestry Authority has not had the desired effect. Forests have improved the livelihoods, but only for relatively wealthy households accessing forest products illegally.
The extent of timber harvesting and marketing that is taking place in areas where these activities are known to be illegal is significant. The degree to which these activities are being undertaken by local elites needs to be further explored. These findings are consistent with Agrawal (2001), Platteau and Abraham (2002), and Ribot (1999), who cite numerous examples of local elites, NGOs, and other special interests dominating local decision making processes regarding the de facto assignment of rights, which tend to undermine outcomes for the rural poor.
An important implication of these findings is the differential effect of the reform on relatively wealthy and relatively poor households. The findings highlight the importance of decomposing the data by income quartiles. The findings from this study are consistent with Jumbe and Angelsen (2006); Jagger, Pender and Gebremedhin (2005); and Sikor and Nguyen (2007), who found that reforms have differential effects across households and communities. Important patterns emerge from the analysis that would not be observable if average impacts across the whole sample were the focus of the analysis. Recall that the goals of FSUP were two—fold: to create a positive, effective, and sustainable policy and institutional environment for the forest sector in Uganda, and to increase economic and environmental benefits from forests and trees, particularly for the poor and vulnerable (MWLE 2004a). This research demonstrates that households in different income quartiles are differentially dependent upon forests, and that that reform has affected different income groups in different ways. This finding supports both Larson et al. (2007) and Anderson and Gibson (2006), who point to the importance of monitoring the livelihood portfolios of those living in or near forests during policy implementation to ensure the poorest households are not disproportionately disadvantaged by governance reforms.
information at an early stage of implementation is useful to donors, policy makers, bureaucrats charged with implementing reforms, civil society organizations, and local communities affected by the reform.
27
Several policy recommendations emerge from this research. First, in both the case of the decentralized DFS and the parastatal NFA there are few incentives for forestry officials to ensure that rural smallholders and, in particular the poor, have improved access to high value forest resources. Facilitating legalized engagement of local resource users in the sustainable harvesting of high value forest products and small scale forest enterprise development may increase awareness of the value of trees and forested land, increase income from forests, and reduce the incentive for corrupt officials to extract bribes from illegal producers. Second, the incentives of forestry officials should be carefully evaluated. Currently, there appear to be few incentives for forestry officials to do their jobs as they were envisioned. This includes evaluating hiring practices, performance evaluation, salaries, and so on. Third, in the control group site, collaborative forest management agreements and the sharing of tourism revenues with local communities has a favorable effect on both local livelihoods and forest management. Opportunities for community engagement in forest management should be pursued, with the caveat that successful collaborative forest management initiatives generally take a very long time to negotiate. Finally, the differential effect that the reform is having on the contribution of forests to the poor versus wealthy rural households points to the necessity of collecting data that can be used to monitor the progress of reforms as they are implemented. While Uganda is still in the early stages of implementation, these findings highlight the presence and magnitude of elite capture that has been anecdotally observed in numerous studies on the topic of decentralization and livelihoods.
28
REFERENCES
Agrawal, A. 2001. The Regulatory Community: Decentralization and Environment in the Van Pachayats (Forest Councils) of Kumaon. Mountain Research and Development 21 (3):208-211.
Agrawal, A. and C. Gibson. 1999. Enchantment and Disenchantment: The Role of Community in Natural Resource Conservation. World Development 27 (4):629-649.
Agrawal, A. and E. Ostrom. 2001. Collective Action, Property Rights and Decentralization in Resource Use in India and Nepal. Politics and Society 29 (4):485–514.
Andersson, K. and C. Gibson. 2006. Decentralized Governance and Environmental Change: Local Institutional Moderation of Deforestation in Bolivia. Journal of Policy Analysis and Management 26 (1):99–123.
Angelsen, A. and S. Wunder. 2003. Exploring the Forest—Poverty Link: Key Concepts, Issues and Research Implications. CIFOR Occasion Paper No. 40. Bogor, Indonesia: Center for International Forestry Research.
Bardhan, P. 2002. Decentralization of Governance and Development. Journal of Economic Perspectives 16 (4):185–205.
Bush, G., S. Nampindo, C. Aguti, and A. Plumptre. 2004. The Value of Uganda's Forests: A Livelihoods and Ecosystems Approach. Kampala, Uganda: Wildlife Conservation Society.
Cavendish, W. 2002. Quantitative Methods for Estimating the Economic Value of Resource Use to Rural Households In Uncovering the Hidden Harvest: Valuation Methods for Woodland and Forest Resources, Campbell, B. and M. Luckert, eds. London, UK: Earthscan Publications Ltd.
Crook, R.C. and J. Manor. 1998. Democracy and Decentralization in Southeast Asia and West Africa: Participation, Accountability and Performance. Cambridge, UK: Cambridge University Press.
Crook, R.C. and A. Sverrisson. 2001. Decentralization and Poverty Alleviation in Developing Countries: A Comparative Analysis or is West Bengal Unique? IDS Working Paper No. 120. Sussex, UK: Institute for Development Studies.
Deininger, K. 2003. Land Policies for Growth and Poverty Reduction. Washington, DC: World Bank.
DFID. 2007. Land: Better Access and Secure Tenure for Poor People. London, UK: Department for International Development.
FAO. 2002. Land Tenure and Rural Development. FAO Land Tenure Studies No.3. Rome, Italy: Food and Agriculture Organization of the United Nations.
Fisher, R.J., S. Maginnis, W.J. Jackson, E. Barrow, and S. Jeanrenaud. 2005. Poverty and Conservation: Landscapes, People and Power. Gland Switzerland and Cambridge, UK: IUCN.
Gibson, C., McKean, M., and E. Ostrom. 2000. People and forests: Communities, institutions, and governance. Cambridge, MA: MIT Press.
Government of Uganda. 2001. Uganda Forestry Policy. Kampala, Uganda: Ministry of Water, Lands and Environment.
———. 2002. The National Forest Plan. Kampala, Uganda: Ministry of Water, Lands and Environment.
———. 2004. The National Forestry and Tree Planting Act. Kampala, Uganda: Ministry of Water, Lands and Environment.
Jagger, P., J. Pender, and B. Gebremedhin. 2005. Trading—off Environmental Sustainability for Empowerment and Income: Woodlot Devolution in Northern Ethiopia. World Development 33 (9):1491–1510.
Jumbe, C. and A. Angelsen. 2006. Do the Poor Benefit from Devolution Policies? Evidence from Malawi's Forest Co—Management Program. Land Economics 82 (4):562–581.
29
Kaimowitz, D., Vallejos, C., Pacheco, P. and R. López. 1998. Municipal Governments and Forest Management in Lowland Bolivia. Journal of Environment & Development 7 (1):45–59.
Larson, A. 2002. Natural Resources and Decentralization in Nicaragua: Are Local Governments Up to the Job? World Development 30 (1):17–31.
Larson, A., Pacheco, P.,Toni, F., and M. Vallejo. 2007. The Effects of Forestry Decentralization on Access to Livelihood Assets. Journal of Environment and Development 36 (3):251–268.
Long, J. 1997. Regression Models for Categorical and Limited Dependent Variables. Thousand Oaks, CA: Sage Publications.
MAAIF. 1995. Basic Facts on Agricultural Activities in Uganda. Kampala, Uganda: Ministry of Agriculture, Animal Industry and Fisheries.
McCarthy, J. 2004. Changing to Gray: Decentralization and the Emergence of Volatile Socio—Legal Configurations in Central Kalimantan, Indonesia. World Development 32 (7):1199–1223.
Meinzen-Dick, R., Di Gregorio, M., and N. McCarthy. 2004. Methods for Studying Collective Action in Rural Development. CAPRi Working Paper No. 33. Washington, DC: International Food Policy Research Institute.
Meinzen-Dick, R. and A. Knox. 2001. Collective Action, Property Rights, and Devolution of Natural Resource Management: A Conceptual Framework. In Collective Action, Property Rights and Devolution of Natural Resource Management — Exchange of Knowledge and Implications for Policy, Meinzen—Dick, R., Knox, A., and M. Di Gregorio. Feldafing, Germany: Deutsche Stifung fur Internationale Entwicklung.
MWLE. 2001. The Uganda Forest Policy. Kampala, Uganda: Ministry of Water, Lands and Environment.
———. 2001a. Forest Sector Review. Kampala, Uganda: Ministry of Water, Lands and Environment.
———. 2002. The National Forest Plan. Kampala, Uganda: Ministry of Water, Lands and Environment.
———. 2003b. Guidelines for Implementing Collaborative Forest Management in Uganda. Kampala, Uganda: Ministry of Water, Lands and Environment.
———. 2004a. Mapping the NFP Process: An Introduction to the Series. Uganda NFP Process Learning Series Note 1. Kampala: Ministry of Water, Lands and Environment (Forestry Inspection Division).
———. 2006. National Forestry Authority 2004/2005 Annual Report. Kampala, Uganda: Ministry of Water, Lands and Environment.
———. 2006. Reform of the Ministry of Water, Lands and Environment: Towards an Enabling Institutional Framework. Uganda NFP Process Learning Note 8. Kampala: Ministry of Water, Lands and Environment (Forestry Inspection Division).
Ndegwa, S. 2002. Decentralization in Africa: A Stocktaking Survey. Africa Regional Working Paper Series No. 40. Washington, DC: World Bank.
Nzita, R. and M. Miwampa. 1993. Peoples and Cultures of Uganda. Kampala, Uganda: Fountain Publishers.
Oyono, P.R. 2005. Profiling Local—level Outcomes of Environmental Decentralizations: The Case of Cameroon's Forests in the Congo Basin. Journal of Environment and Development 14 (2):1–21.
Palmer, C., and S. Engel. 2007. For Better or For Worse? Local Impacts of Decentralization of Indonesia's Forest Sector. World Development 35 (12):2131–2149.
Platteau, J. and A. Abraham. 2002. Participatory Development in the Presence of Endogenous Community Imperfections. The Journal of Development Studies 39 (2):104–136.
Ribot, J.C. 1999. Decentralization, Participation and Accountability in Sahelian Forestry: Legal Instruments of Political–Administrative Control. Africa 69 (1):23–65.
30
———. 2002. African Decentralization: Local Actors, Powers and Accountability. UNRISD Program on Democracy, Governance and Human Rights Paper No. 8. Geneva, Switzerland: United Nations Research Institute for Social Development.
———. 2003. Democratic Decentralization of Natural Resources: Institutionalizing Popular Participation. Public Administration and Development 23:53–65.
Ribot, J.C., and N.L. Peluso. 2003. A Theory of Access. Rural Sociology 68 (2): 153-181.
Shadish, W.R., T.D. Cook, and D.T. Campbell. 2002. Experimental and Quasi-Experimental Designs for Generalized Causal Inference. Boston, MA: Houghton Mifflen Company.
SIDA. 2007. Natural Resource Tenure. A Position Paper for SIDA. Stockholm, Sweden: Swedish International Development Cooperation Agency.
Sikor, T., and T.Q. Nguyen. 2007. Why May Forest Devolution Not Benefit the Rural Poor? Forest Entitlements in Vietnam's Central Highlands. World Development 35 (11):2010–2025.
UWA. 2004. Rwenzori Mountain National Park General Management Plan 2004–2014. Kampala, Uganda: Uganda Wildlife Authority.
Vedeld, T. 2003. Democratic Decentralisation and Poverty Reduction: Exploring the Linkages. Forum for Development Studies 2:159–203.
Wooldridge, J.M. 2002. Econometric Analysis of Cross Section and Panel Data. Boston, MA: MIT Press.
World Bank. 2008. Poverty and the Environment: Understanding Linkages at the Household Level. Washington, DC: World Bank.
WRI. 2003. World Resources 2002–2004 - Decisions for the Earth: Balance, Voice and Power. Washington, DC: World Resources Institute.
WRI. 2005. World Resources 2005: The Wealth of the Poor: Managing ecosystems to fight poverty. Washington, DC: World Resources Institute.
Wunsch, J.S. and D. Olowu. 1990. The Failure of the Centralized State. In The Failure of the Centralized State: Institutions and Self Governance in Africa, Wunsch, J. and D. Olowu, eds. Boulder, CO: Westview Press.
31
LIST OF CAPRi WORKING PAPERS
01 Property Rights, Collective Action and Technologies for Natural Resource Management: A Conceptual Framework, by Anna Knox, Ruth Meinzen—Dick, and Peter Hazell, October 1998.
02 Assessing the Relationships between Property Rights and Technology Adoption in Smallholder Agriculture: A Review of Issues and Empirical Methods, by Frank Place and Brent Swallow, April 2000.
03 Impact of Land Tenure and Socioeconomic Factors on Mountain Terrace Maintenance in Yemen, by A. Aw—Hassan, M. Alsanabani and A. Bamatraf, July 2000.
04 Land Tenurial Systems and the Adoption of a Mucuna Planted Fallow in the Derived Savannas of West Africa, by Victor M. Manyong and Victorin A. Houndékon, July 2000.
05 Collective Action in Space: Assessing How Collective Action Varies Across an African Landscape, by Brent M. Swallow, Justine Wangila, Woudyalew Mulatu, Onyango Okello, and Nancy McCarthy, July 2000.
06 Land Tenure and the Adoption of Agricultural Technology in Haiti, by Glenn R. Smucker, T. Anderson White, and Michael Bannister, October 2000.
07 Collective Action in Ant Control, by Helle Munk Ravnborg, Ana Milena de la Cruz, María Del Pilar Guerrero, and Olaf Westermann, October 2000.
08 CAPRi Technical Workshop on Watershed Management Institutions: A Summary Paper, by Anna Knox and Subodh Gupta, October 2000.
09 The Role of Tenure in the Management of Trees at the Community Level: Theoretical and Empirical Analyses from Uganda and Malawi, by Frank Place and Keijiro Otsuka November 2000.
10 Collective Action and the Intensification of Cattle-Feeding Techniques a Village Case Study in Kenya‘s Coast Province, by Kimberly Swallow, November 2000.
11 Collective Action, Property Rights, and Devolution of Natural Resource Management: Exchange of Knowledge and Implications for Policy, by Anna Knox and Ruth Meinzen-Dick, January 2001.
12 Land Dispute Resolution in Mozambique: Evidence and Institutions of Agroforestry Technology Adoption, by John Unruh, January 2001.
13 Between Market Failure, Policy Failure, and .Community Failure.: Property Rights, Crop-Livestock Conflicts and the Adoption of Sustainable Land Use Practices in the Dry Area of Sri Lanka, by Regina Birner and Hasantha Gunaweera, March 2001.
14 Land Inheritance and Schooling in Matrilineal Societies: Evidence from Sumatra, by Agnes Quisumbing and Keijuro Otsuka, May 2001.
15 Tribes, State, and Technology Adoption in Arid Land Management, Syria, by Rae, J, Arab, G., Nordblom, T., Jani, K., and Gintzburger, G., June 2001.
16 The Effects of Scales, Flows, and Filters on Property Rights and Collective Action in Watershed Management, by Brent M. Swallow, Dennis P. Garrity, and Meine van Noordwijk, July 2001.
17 Evaluating Watershed Management Projects, by John Kerr and Kimberly Chung, August 2001.
18 Rethinking Rehabilitation: Socio-Ecology of Tanks and Water Harvesting in Rajasthan, North-West India, by Tushaar Shah and K.V.Raju, September 2001.
19 User Participation in Watershed Management and Research, by Nancy Johnson, Helle Munk Ravnborg, Olaf Westermann, and Kirsten Probst, September 2001.
20 Collective Action for Water Harvesting Irrigation in the Lerman-Chapala Basin, Mexico, by Christopher A. Scott and Paul Silva-Ochoa, October 2001.
32
21 Land Redistribution, Tenure Insecurity, and Intensity of Production: A Study of Farm Households in Southern Ethiopia, by Stein Holden and Hailu Yohannes, October 2001.
22 Legal Pluralism and Dynamic Property Rights, by Ruth Meinzen-Dick and Rajendra Pradhan, January 2002.
23 International Conference on Policy and Institutional Options for the Management of Rangelands in Dry Areas, by Tidiane Ngaido, Nancy McCarthy, and Monica Di Gregorio, January 2002.
24 Climatic Variablity and Cooperation in Rangeland Management: A Case Study From Niger, by Nancy McCarthy and Jean-Paul Vanderlinden, September 2002.
25 Assessing the Factors Underlying the Differences in Group Performance: Methodological Issues and Empirical Findings from the Highlands of Central Kenya, by Frank Place, Gatarwa Kariuki, Justine Wangila, Patti Kristjanson, Adolf Makauki, and Jessica Ndubi, November 2002.
26 The Importance of Social Capital in Colombian Rural Agro-Enterprises, by Nancy Johnson, Ruth Suarez, and Mark Lundy, November 2002.
27 Cooperation, Collective Action and Natural Resources Management in Burkina Faso: A Methodological Note, by Nancy McCarthy, Céline Dutilly-Diané, and Boureima Drabo, December 2002.
28 Understanding, Measuring and Utilizing Social Capital: Clarifying Concepts and Presenting a Field Application from India, by Anirudh Krishna, January 2003.
29 In Pursuit Of Comparable Concepts and Data, about Collective Action, by Amy Poteete And Elinor Ostrom, March 2003.
30 Methods of Consensus Building for Community Based Fisheries Management in Bangladesh and the Mekong Delta, by Parvin Sultana and Paul Thompson, May 2003.
31 Formal and Informal Systems in Support of Farmer Management of Agrobiodiversity: Some Policy Challenges to Consolidate Lessons Learned, by Marie Byström, March 2004.
32 What Do People Bring Into the Game: Experiments in the Field About Cooperation in the Commons, by Juan-Camilo Cárdenas and Elinor Ostrom, June 2004.
33 Methods for Studying Collective Action in Rural Development, by Ruth Meinzen-Dick, Monica Di Gregorio, and Nancy McCarthy, July 2004.
34 The Relationship between Collective Action and Intensification of Livestock Production: The Case of Northeastern Burkina Faso, by Nancy McCarthy, August 2004.
35 The Transformation of Property Rights in Kenya‘s Maasailand: Triggers and Motivations by Esther Mwangi, January 2005.
36 Farmers‘ Rights and Protection of Traditional Agricultural Knowledge, by Stephen B. Brush, January 2005.
37 Between Conservationism, Eco-Populism and Developmentalism – Discourses in Biodiversity Policy in Thailand and Indonesia, by Heidi Wittmer and Regina Birner, January 2005.
38 Collective Action for the Conservation of On-Farm Genetic Diversity in a Center of Crop Diversity: An Assessment of the Role of Traditional Farmers‘ Networks, by Lone B. Badstue, Mauricio R. Bellon, Julien Berthaud, Alejandro Ramírez, Dagoberto Flores, Xóchitl Juárez, and Fabiola Ramírez, May 2005.
39 Institutional Innovations Towards Gender Equity in Agrobiodiversity Management: Collective Action in Kerala, South India,, by Martina Aruna Padmanabhan, June 2005.
40 The Voracious Appetites of Public versus Private Property: A View of Intellectual Property and Biodiversity from Legal Pluralism, by Melanie G. Wiber, July 2005.
41 Who Knows, Who Cares? Determinants of Enactment, Awareness and Compliance with Community Natural Resource Management Bylaws in Uganda, by Ephraim Nkonya, John Pender, Edward Kato, Samuel Mugarura, and James Muwonge, August 2005.
33
42 Localizing Demand and Supply of Environmental Services: Interactions with Property Rights, Collective Action and the Welfare of the Poor, by Brent Swallow, Ruth Meinzen-Dick, and Meine von Noordjwik, September 2005.
43 Initiatives for Rural Development through Collective Action: The Case of Household Participation in Group Activities in the Highlands of Central Kenya, By Gatarwa Kariuki and Frank Place, September 2005.
44 Are There Customary Rights to Plants? An Inquiry among the Baganda (Uganda), with Special Attention to Gender, by Patricia L. Howard and Gorettie Nabanoga, October 2005.
45 On Protecting Farmers‘ New Varieties: New Approaches to Rights on Collective Innovations in Plant Genetic Resources by Rene Salazar, Niels P. Louwaars, and Bert Visser, January 2006.
46 Subdividing the Commons: The Politics of Property Rights Transformation in Kenya‘s Maasailand, by Esther Mwangi, January 2006.
47 Biting the Bullet: How to Secure Access to Drylands Resources for Multiple Users, by Esther Mwangi and Stephan Dohrn, January 2006.
48 Property Rights and the Management of Animal Genetic Resources, by Simon Anderson and Roberta Centonze, February 2006.
49 From the Conservation of Genetic Diversity to the Promotion of Quality Foodstuff: Can the French Model of =Appellation d‘Origine Contrôlée‘ be Exported? by Valérie Boisvert, April 2006.
50 Facilitating Collective Action and Enhancing Local Knowledge: A Herbal Medicine Case Study in Talaandig Communities, Philippines, by Herlina Hartanto and Cecil Valmores, April 2006.
51 Water, Women and Local Social Organization in the Western Kenya Highlands, by Elizabeth Were, Brent Swallow, and Jessica Roy, July 2006.
52 The Many Meanings of Collective Action: Lessons on Enhancing Gender Inclusion and Equity in Watershed Management, by Laura German, Hailemichael Taye, Sarah Charamila, Tesema Tolera, and Joseph Tanui, July 2006.
53 Decentralization and Environmental Conservation: Gender Effects from Participation in Joint Forest Management, by Arun Agrawal, Gautam Yadama, Raul Andrade, and Ajoy Bhattacharya, July 2006.
54 Improving the Effectiveness of Collective Action: Sharing Experiences from Community Forestry in Nepal, by Krishna P. Achyara and Popular Gentle, July 2006.
55 Groups, Networks, and Social Capital in the Philippine Communities, by Marie Godquin and Agnes R. Quisumbing, October 2006.
56 Collective Action in Plant Genetic Resources Management: Gendered Rules of Reputation, Trust and Reciprocity in Kerala, India, by Martina Aruna Padmanabhan, October 2006.
57 Gender and Local Floodplain Management Institutions-A case study from Bangladesh, by Parvin Sultana and Paul Thompson, October 2006.
58 Gender Differences in Mobilization for Collective Action: Case Studies of Villages in Northern Nigeria, by Saratu Abdulwahid, October 2006.
59 Gender, Social Capital and Information Exchange in Rural Uganda, by Enid Katungi, Svetlana Edmeades, and Melinda Smale, October 2006.
60 Rural Institutions and Producer Organizations in Imperfect Markets: Experiences from Producer Marketing Groups in Semi-Arid Eastern Kenya, by Bekele Shiferaw, Gideon Obare and Geoffrey Muricho, November 2006.
61 Women‘s Collective Action and Sustainable Water Management: Case of SEWA‘s Water Campaign in Gujarat, India, by Smita Mishra Panda, October 2006.
34
62 Could Payments for Environmental Services Improve Rangeland Management in Central Asia, West Asia and North Africa? by Celine Dutilly-Diane, Nancy McCarthy, Francis Turkelboom, Adriana Bruggeman, James Tiedemann, Kenneth Street and Gianluca Serra, January 2007.
63 Empowerment through Technology: Gender Dimensions of Social Capital Build-Up in Maharashtra, India, by Ravula Padmaja and Cynthia Bantilan, February 2007.
64 Gender and Collective Action: A Conceptual Framework for Analysis, by Lauren Pandolfelli, Ruth Meinzen-Dick, and Stephan Dohrn, May 2007.
65 Gender, Wealth, and Participation in Community Groups in Meru Central District, Kenya, by Kristin E. Davis and Martha Negash, May 2007.
66 Beyond Group Ranch Subdivision: Collective Action for Livestock Mobility, Ecological Viability, and Livelihoods, by Shauna BurnSilver and Esther Mwangi, June 2007.
67 Farmer Organization, Collective Action and Market Access in Meso-America, by Jon Hellin, Mark Lundy, and Madelon Meijer, October 2007.
68 Collective Action for Innovation and Small Farmer Market Access: The Papa Andina Experience, by André Devaux, Claudio Velasco, Gastón López, Thomas Bernet, Miguel Ordinola, Hernán Pico, Graham Thiele, and Douglas Horton, October 2007.
69 Collective Action and Marketing of Underutilized Plant Species: The Case of Minor Millets in Kolli Hills, Tamil Nadu, India, by Guillaume P. Gruère, Latha Nagarajan, and E.D.I. Oliver King, M.S. Swaminathan Research Foundation, October 2007.
70 The Role of Public–Private Partnerships and Collective Action in Ensuring Smallholder Participation in High Value Fruit and Vegetable Supply Chains, by Clare Narrod, Devesh Roy, Julius Okello, Belem Avendaño, and Karl Rich, October 2007.
71 Collective Action for Small-Scale Producers of Agricultural Biodiversity Products, by Froukje Kruijssen, Menno Keizer, and Alessandra Giuliani, October, 2007.
72 Farmer Groups Enterprises and the Marketing of Staple Food Commodities in Africa, by Jonathan Coulter, October 2007.
73 Linking Collective Action to Non-Timber Forest Product Market for Improved Local Livelihoods: Challenges and Opportunities, by Heru Komarudin, Yuliana L. Siagian, and Ngakan Putu Oka, December, 2007.
74 Collective Action Initiatives to Improve Marketing Performance: Lessons from Farmer Groups in Tanzania, by James Barham and Clarence Chitemi, March 2008.
75 Sustaining Linkages to High Value Markets through Collective Action In Uganda: The Case of the Nyabyumba Potato Farmers, by Elly Kaganzi, Shaun Ferris, James Barham, Annet Abenakyo, Pascal Sanginga, and Jemimah Njuki, March 2008.
76 Fluctuating Fortunes of a Collective Enterprise: The Case of the Agroforestry Tree Seeds Association of Lantapan (ATSAL) in the Philippines, by Delia Catacutan, Manuel Bertomeu, Lyndon Arbes, Caroline Duque, and Novie Butra, May 2008.
77 Making Market Information Services Work Better for the Poor in Uganda, by Shaun Ferris, Patrick Engoru, and Elly Kaganzi, May 2008.
78 Implications of Bulk Water Transfer on Local Water Management Institutions: A Case Study of the Melamchi Water Supply Project in Nepal, by Dhruba Pant, Madhusudan Bhattarai, and Govinda Basnet, May 2008.
79 Bridging, Linking and Bonding Social Capital in Collective Action: The Case of Kalahan Forest Reserve in the Philippines, by Ganga Ram Dahal and Krishna Prasad Adhikari, May 2008.
80 Decentralization, Pro–poor Land Policies, and Democratic Governance, by Ruth Meinzen–Dick, Monica Di Gregorio, and Stephan Dohrn, June 2008.
35
81 Property Rights, Collective Action, and Poverty: The Role of Institutions for Poverty Reduction, by Monica Di Gregorio, Konrad Hagedorn, Michael Kirk, Benedikt Korf, Nancy McCarthy, Ruth Meinzen–Dick, and Brent Swallow, June 2008.
82 Collective Action and Property Rights for Poverty Reduction: A Review of Methods and Approaches, by Esther Mwangi and Helen Markelova, June 2008.
83 Collective action and vulnerability: Burial societies in rural Ethiopia, by Stefan Dercon, John Hoddinott, Pramila Krishnan, and Tassew Woldehanna, June 2008.
84 Collective Action and Vulnerability: Local and Migrant Networks in Bukidnon, Philippines, by Agnes Quisumbing, Scott McNiven, and Marie Godquin, June 2008.
85 Community Watershed Management in Semi–Arid India: The State of Collective Action and its Effects on Natural Resources and Rural Livelihoods, by Bekele Shiferaw, Tewodros Kebede, and V. Ratna Reddy, June 2008.
86 Enabling Equitable Collective Action and Policy Change for Poverty Reduction and Improved Natural Resource Management in the Eastern African Highlands, by Laura German, Waga Mazengia, Wilberforce Tirwomwe, Shenkut Ayele, Joseph Tanui, Simon Nyangas, Leulseged Begashaw, Hailemichael Taye, Zenebe Admassu, Mesfin Tsegaye, Francis Albino, Ashenafi Mekonnen, Kassahun Aberra, Awadh Chemangei, William Cheptegei, Tessema Tolera, Zewude Jote, and Kiflu Bedane, June 2008.
87 The Transformation of the Afar Commons in Ethiopia: State Coercion, Diversification, and Property Rights Change among Pastoralists, by Bekele Hundie and Martina Padmanabhan, June 2008.
88 Unmaking the Commons: Collective Action, Property Rights, and Resource Appropriation among (Agro–) Pastoralists in Eastern Ethiopia, by Fekadu Beyene and Benedikt Korf, June 2008.
89 Escaping Poverty Traps? Collective Action and Property Rights in Post–War Rural Cambodia, by Anne Weingart and Michael Kirk, June 2008.
90 Collective Action to Secure Property Rights for the Poor – A Case Study in Jambi Province, Indonesia, by Heru Komarudin, Yuliana Sigian, and Carol Colfer, June 2008.
91 Land Tenure in Ethiopia: Continuity and Change, Shifting Rulers, and the Quest For State Control by Wibke Crewett, Ayalneh Bogale, and Benedikt Korf. September 2008.