Embed Size (px)
Citation preview
Forest Health MonitoringProgram Overview
Borys M. TkaczNational Program Manager
Steven Kuzma
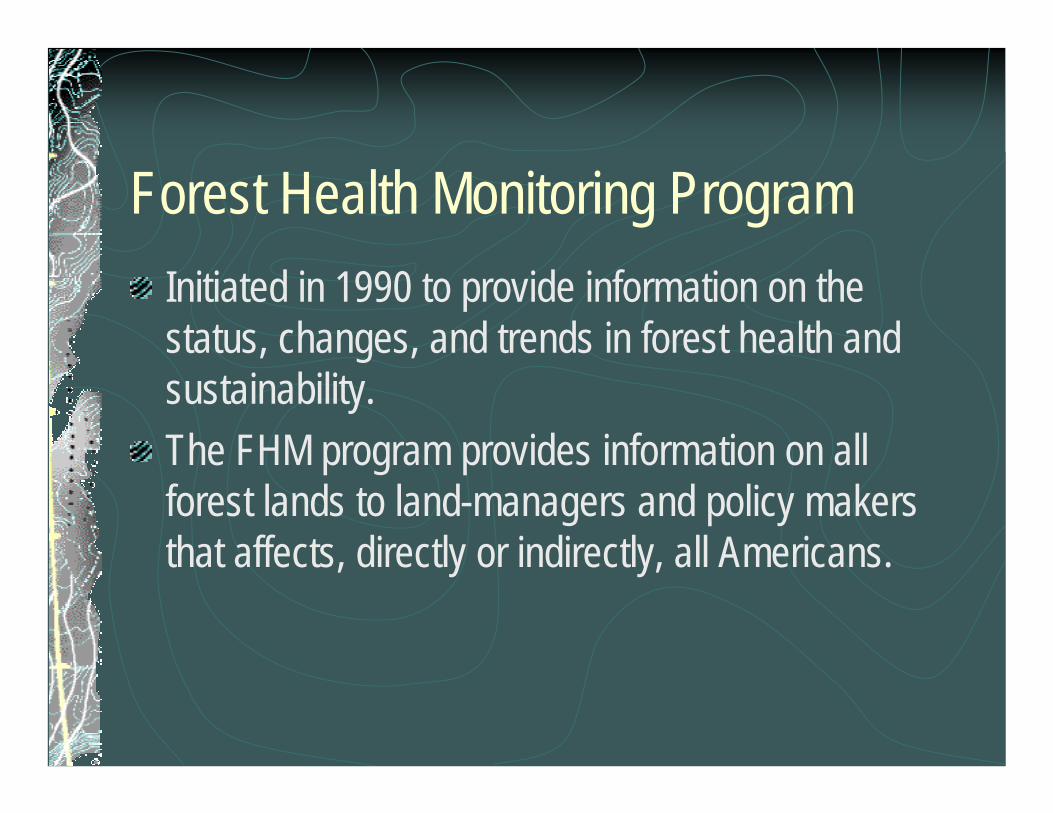
Forest Health Monitoring ProgramInitiated in 1990 to provide information on the status, changes, and trends in forest health and sustainability.The FHM program provides information on all forest lands to land-managers and policy makers that affects, directly or indirectly, all Americans.

Forest Health Monitoring(FHM)Objectives:
Establish a monitoring system throughout the forests of the United States to determine detrimental changes or improvements that occur over time.Provide baseline and health trend information that is statistically precise and accurate.Report annually on status and changes to forest health.
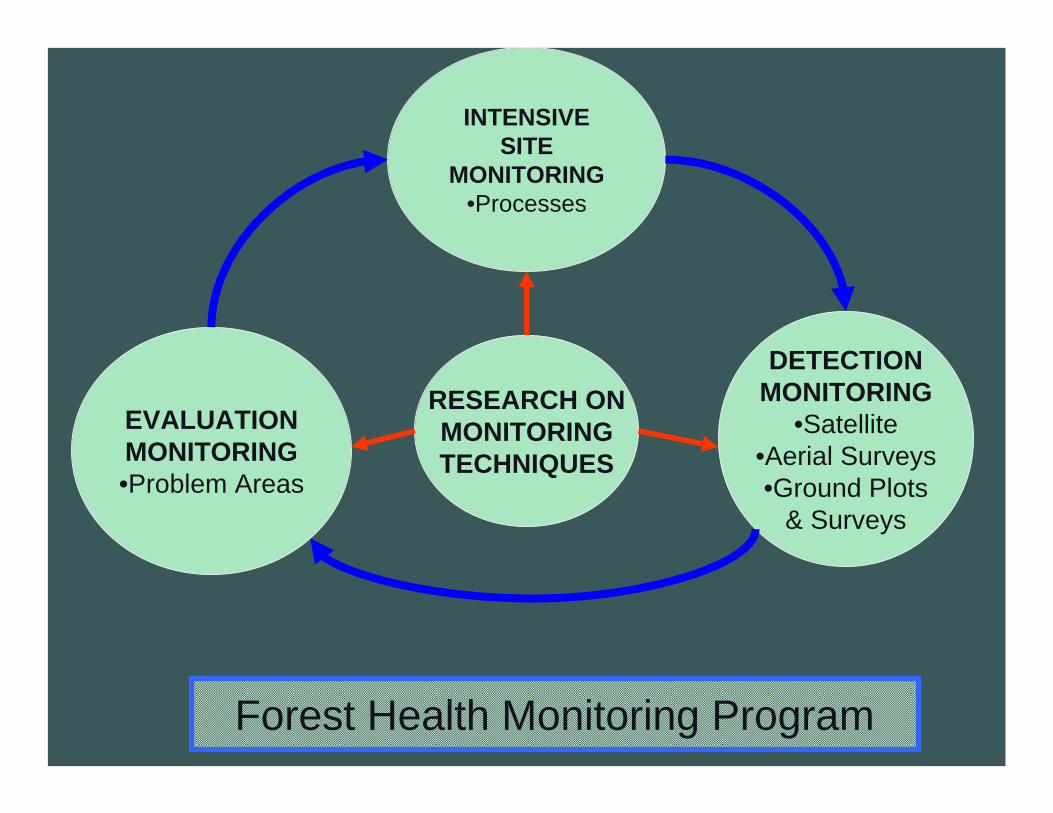
DETECTIONMONITORING
•Satellite•Aerial Surveys•Ground Plots
& Surveys
INTENSIVESITE
MONITORING•Processes
RESEARCH ONMONITORINGTECHNIQUES
EVALUATIONMONITORING•Problem Areas
Forest Health Monitoring Program
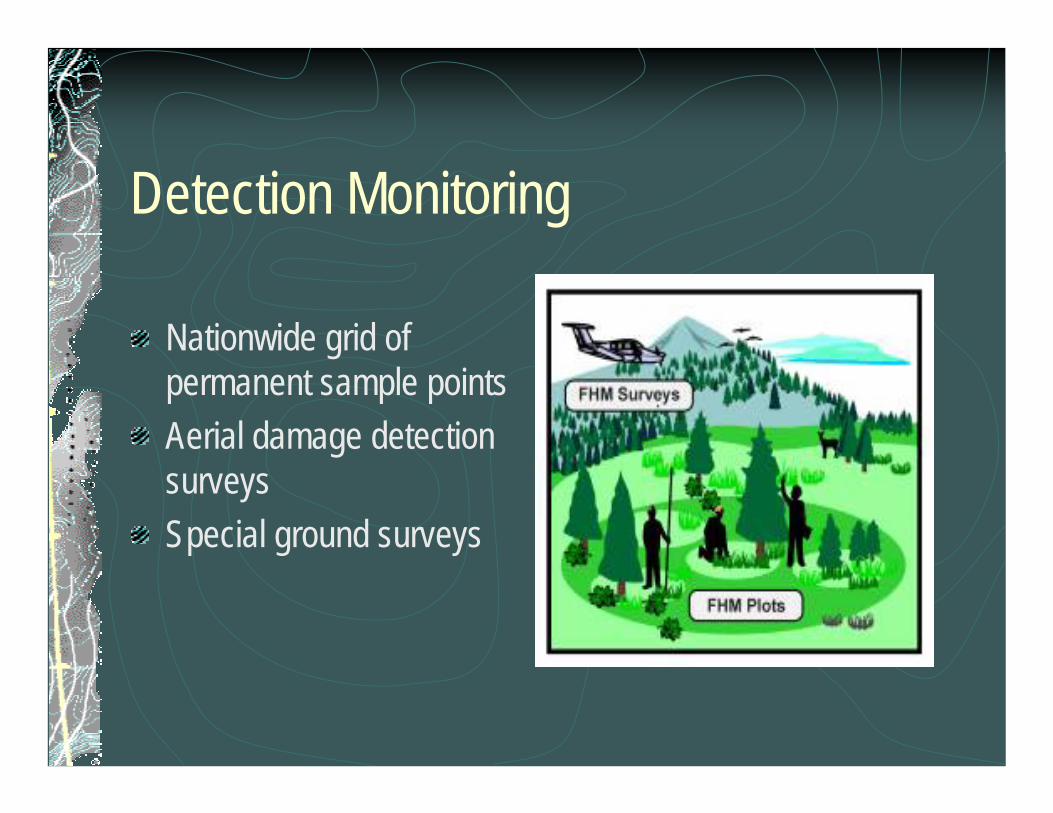
Detection Monitoring
Nationwide grid of permanent sample pointsAerial damage detection surveysSpecial ground surveys
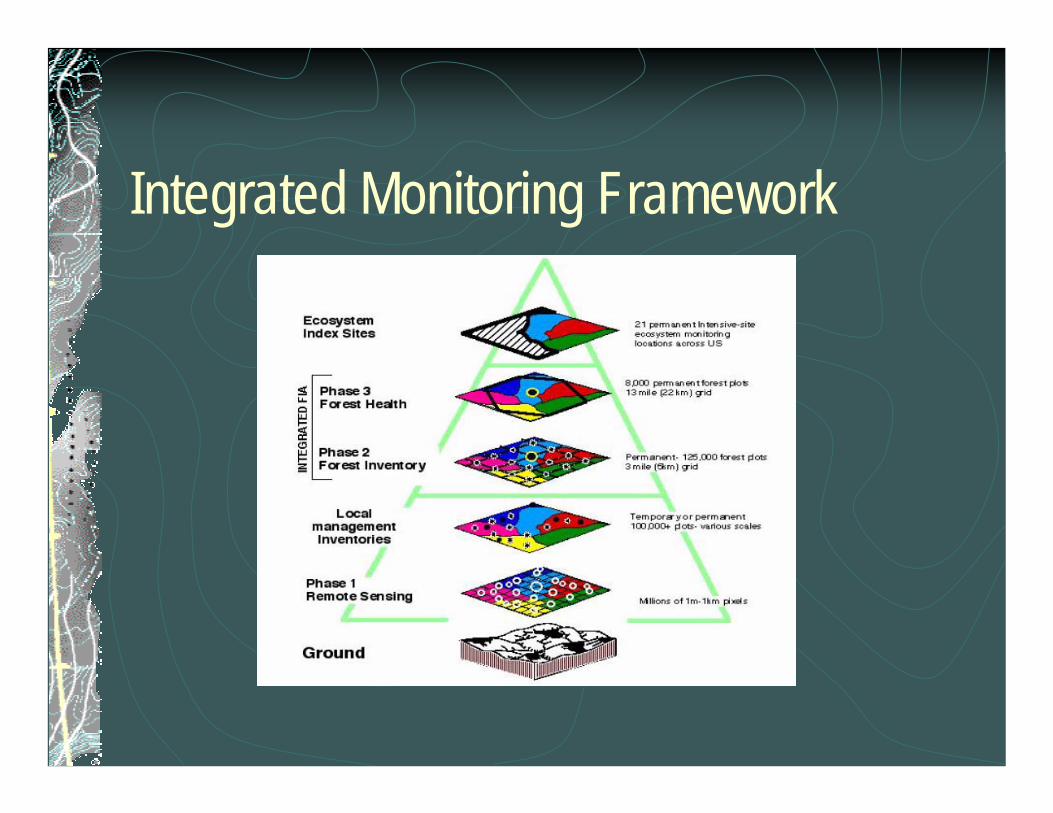
Integrated Monitoring Framework
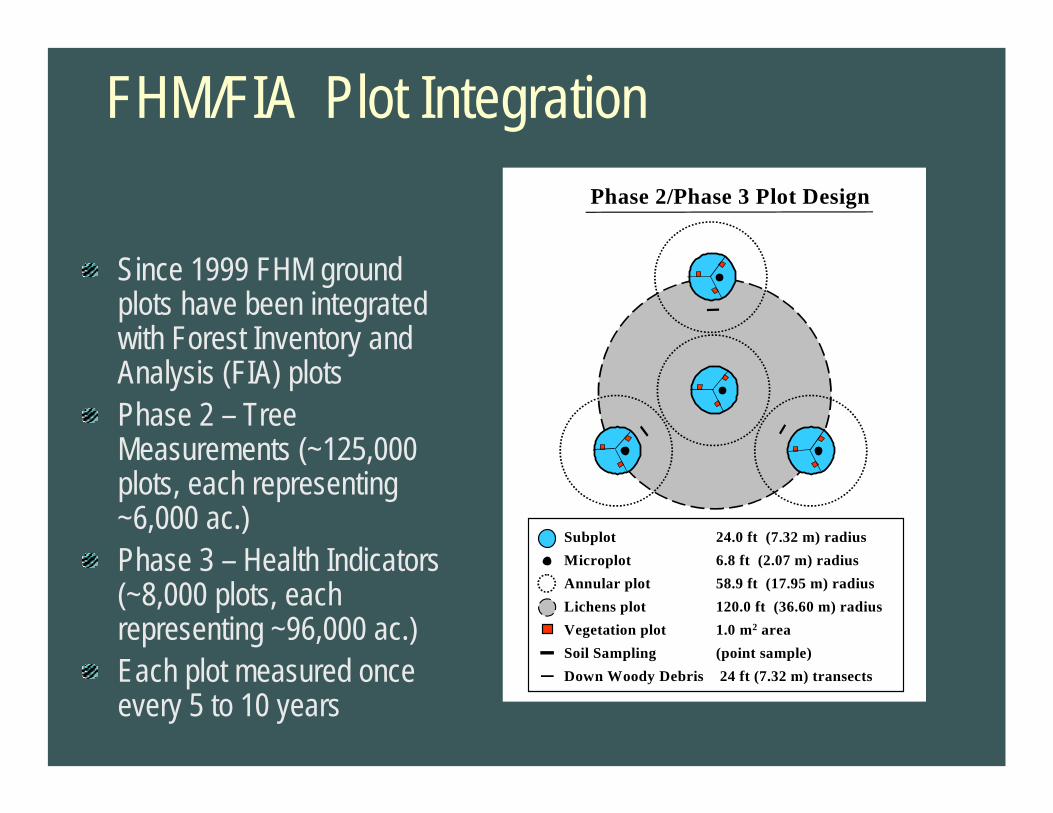
FHM/FIA Plot Integration
Since 1999 FHM ground plots have been integrated with Forest Inventory and Analysis (FIA) plotsPhase 2 – Tree Measurements (~125,000 plots, each representing ~6,000 ac.)Phase 3 – Health Indicators (~8,000 plots, each representing ~96,000 ac.)Each plot measured once every 5 to 10 years
Phase 2/Phase 3 Plot Design
Subplot 24.0 ft (7.32 m) radiusMicroplot 6.8 ft (2.07 m) radiusAnnular plot 58.9 ft (17.95 m) radiusLichens plot 120.0 ft (36.60 m) radiusVegetation plot 1.0 m2 areaSoil Sampling (point sample)Down Woody Debris 24 ft (7.32 m) transects

Rotating Panel Design
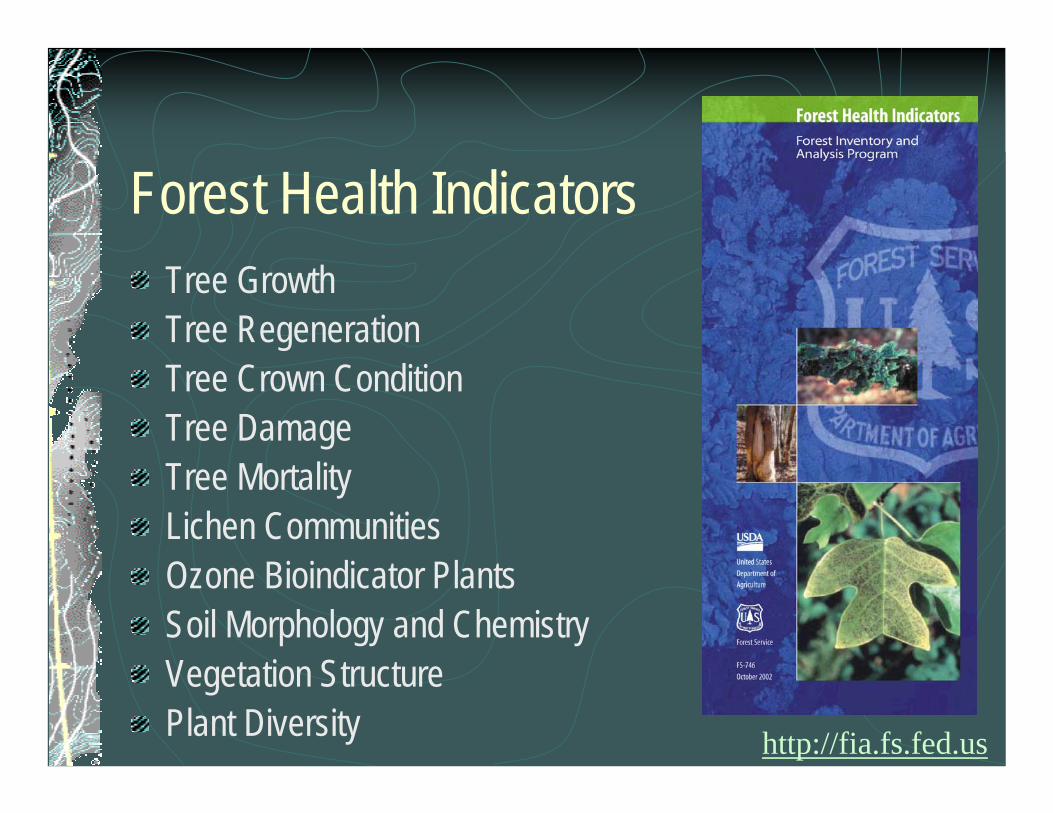
Forest Health IndicatorsTree GrowthTree Regeneration Tree Crown Condition Tree DamageTree MortalityLichen CommunitiesOzone Bioindicator PlantsSoil Morphology and ChemistryVegetation StructurePlant Diversity http://fia.fs.fed.us
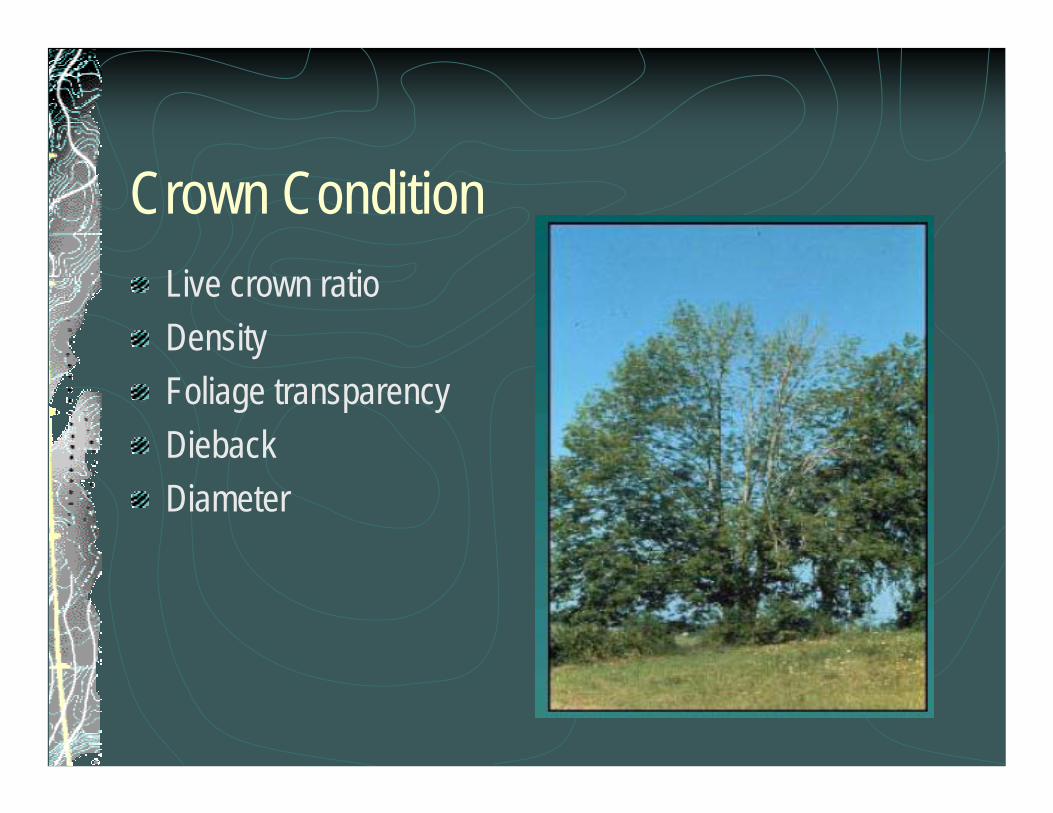
Crown ConditionLive crown ratioDensityFoliage transparencyDiebackDiameter

Lichen CommunitiesFungi that live in association with algaeSensitive to environmental stresses such as air pollution or climate changeIndicators of forest biodiversityBiotic indexes are developed based on pollution and climate gradients
Photo by Stephen Sharnoff
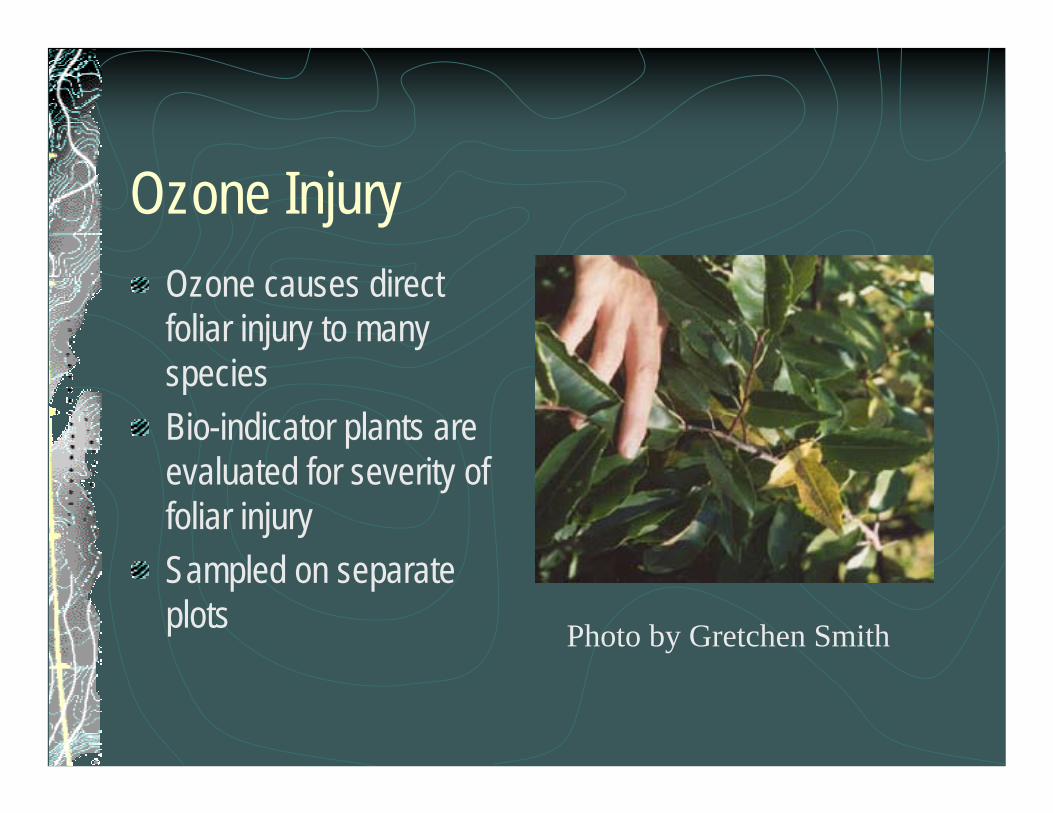
Ozone InjuryOzone causes direct foliar injury to many speciesBio-indicator plants are evaluated for severity of foliar injurySampled on separate plots Photo by Gretchen Smith
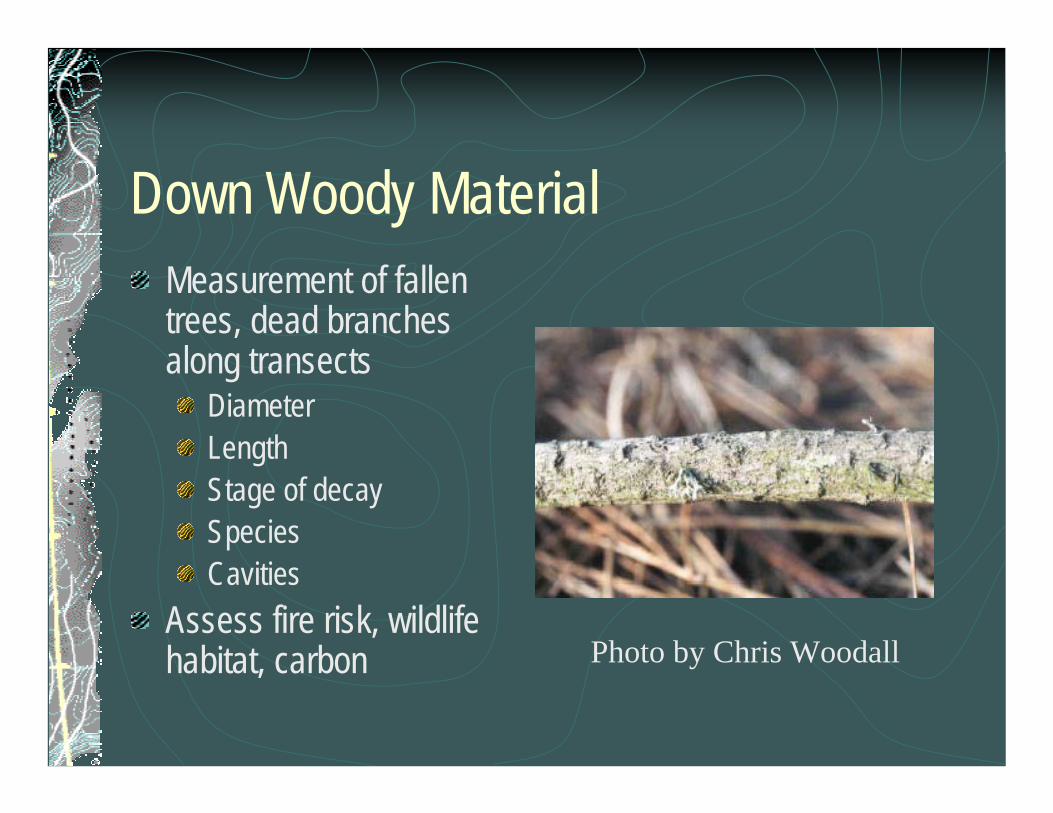
Down Woody MaterialMeasurement of fallen trees, dead branches along transects
DiameterLengthStage of decaySpeciesCavities
Assess fire risk, wildlife habitat, carbon Photo by Chris Woodall
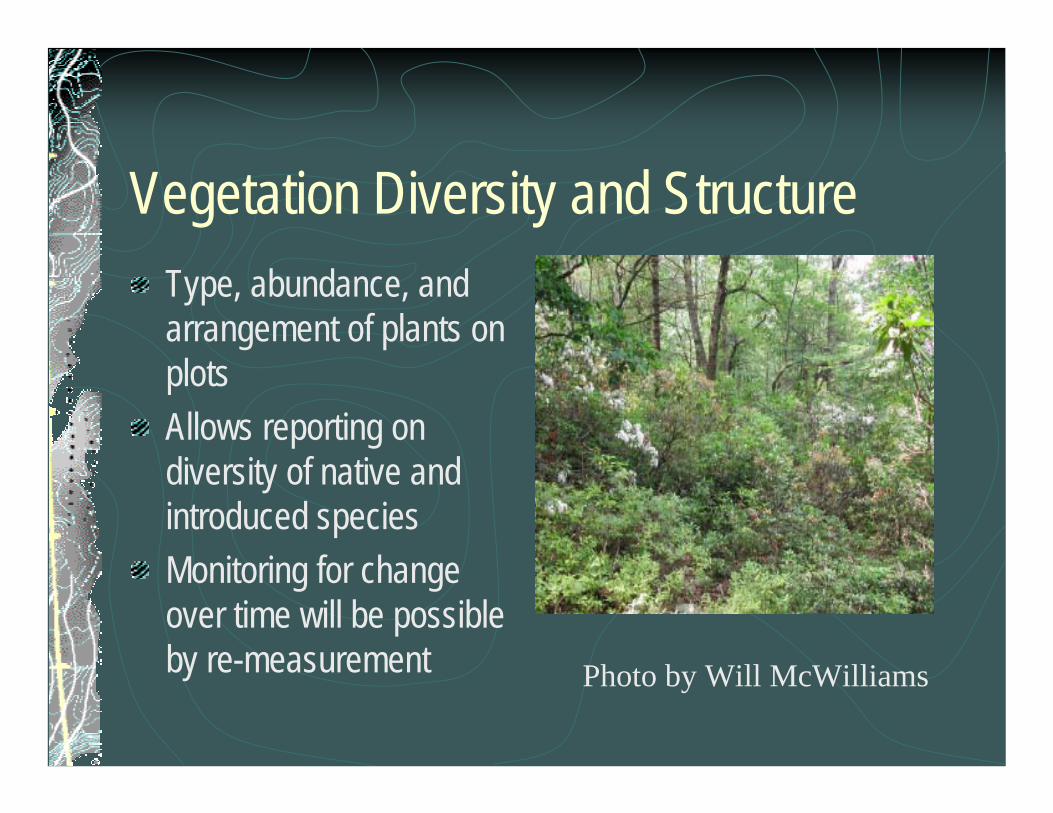
Vegetation Diversity and StructureType, abundance, and arrangement of plants on plotsAllows reporting on diversity of native and introduced speciesMonitoring for change over time will be possible by re-measurement Photo by Will McWilliams
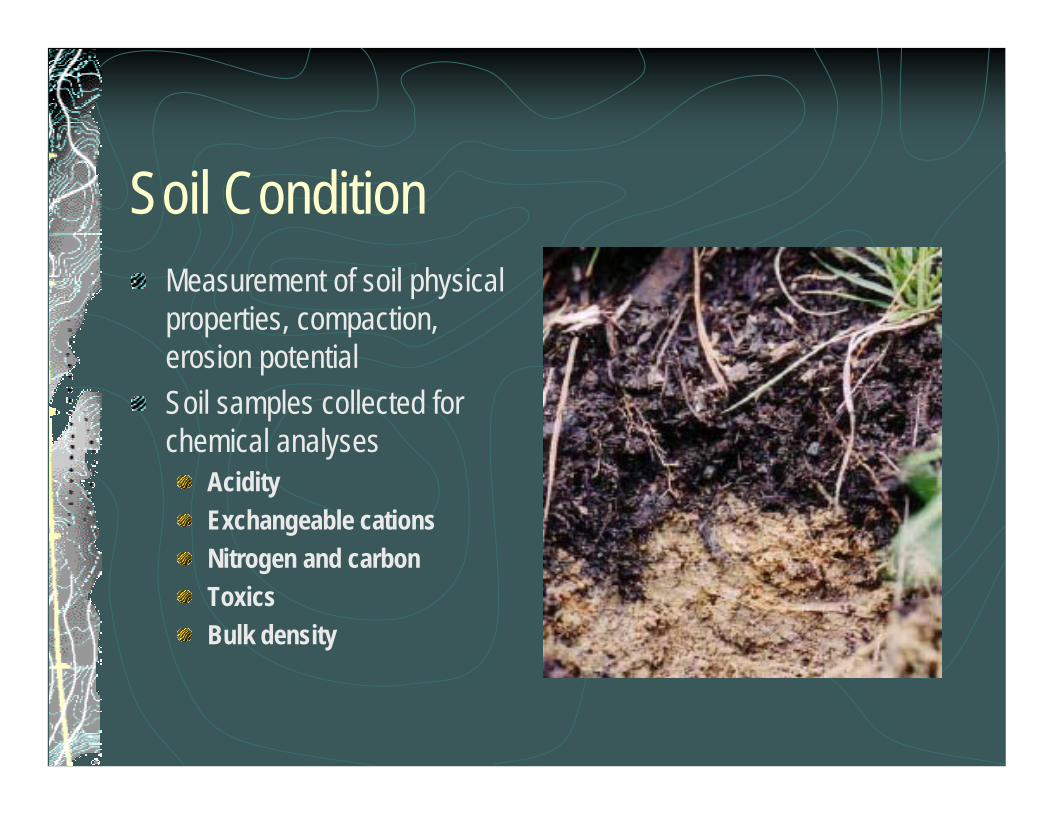
Soil ConditionMeasurement of soil physical properties, compaction, erosion potentialSoil samples collected for chemical analyses
AcidityExchangeable cationsNitrogen and carbonToxicsBulk density
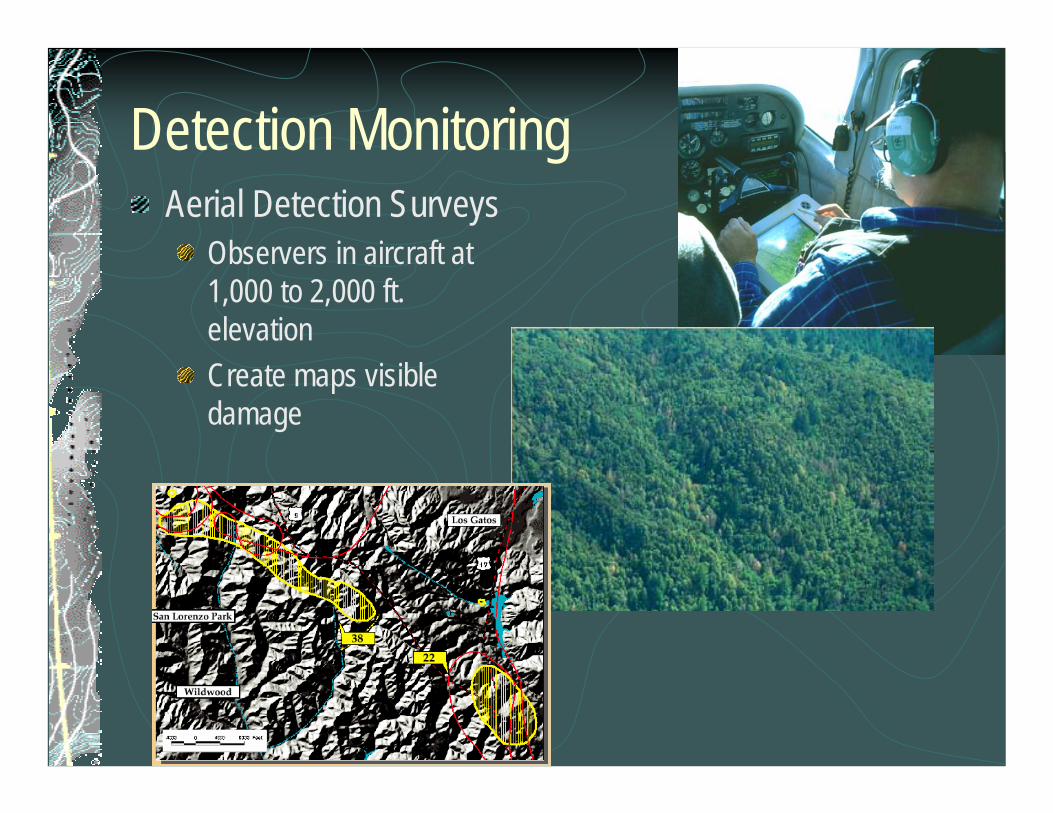
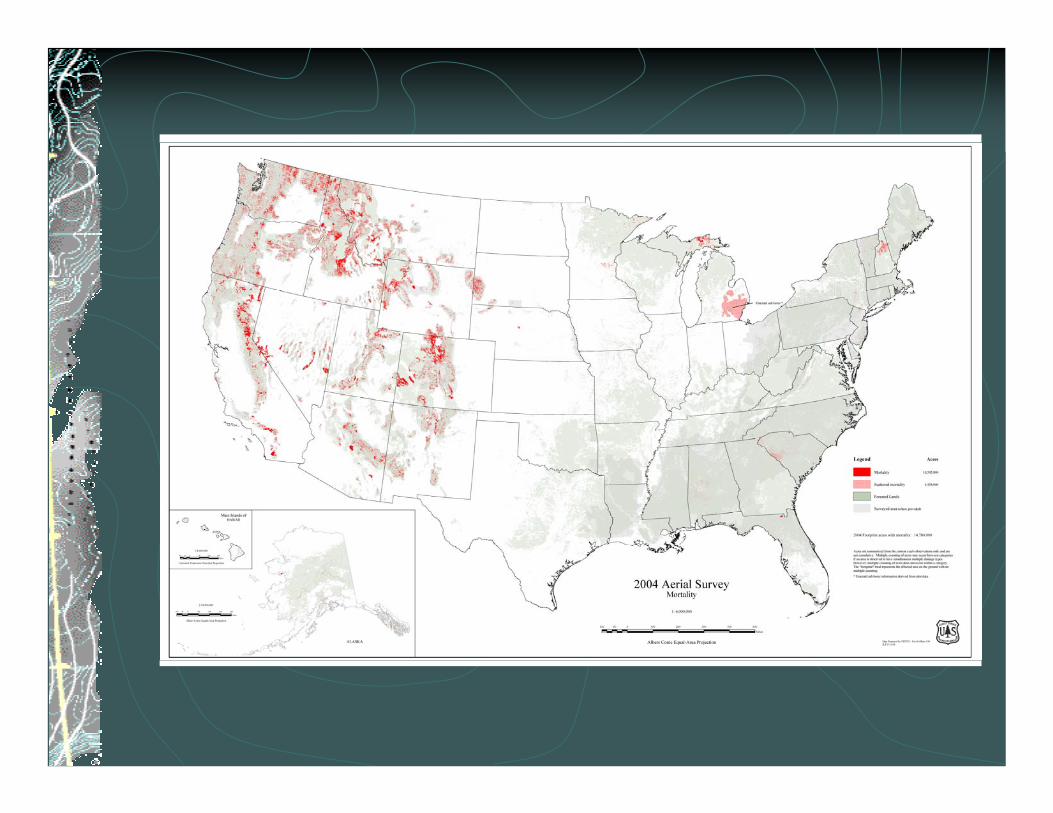
Detection Monitoring Aerial Detection Surveys
Observers in aircraft at 1,000 to 2,000 ft. elevationCreate maps visible damage
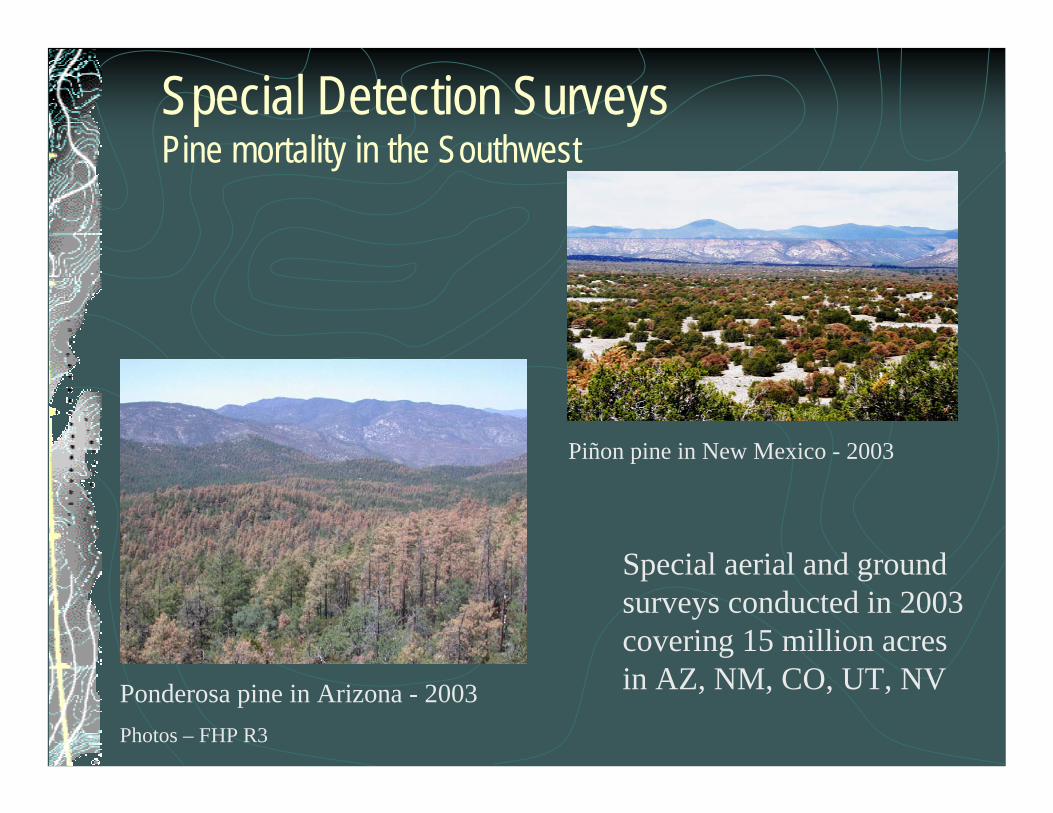
Special Detection SurveysPine mortality in the Southwest
Piñon pine in New Mexico - 2003
Ponderosa pine in Arizona - 2003
Special aerial and ground surveys conducted in 2003 covering 15 million acres in AZ, NM, CO, UT, NV
Photos – FHP R3
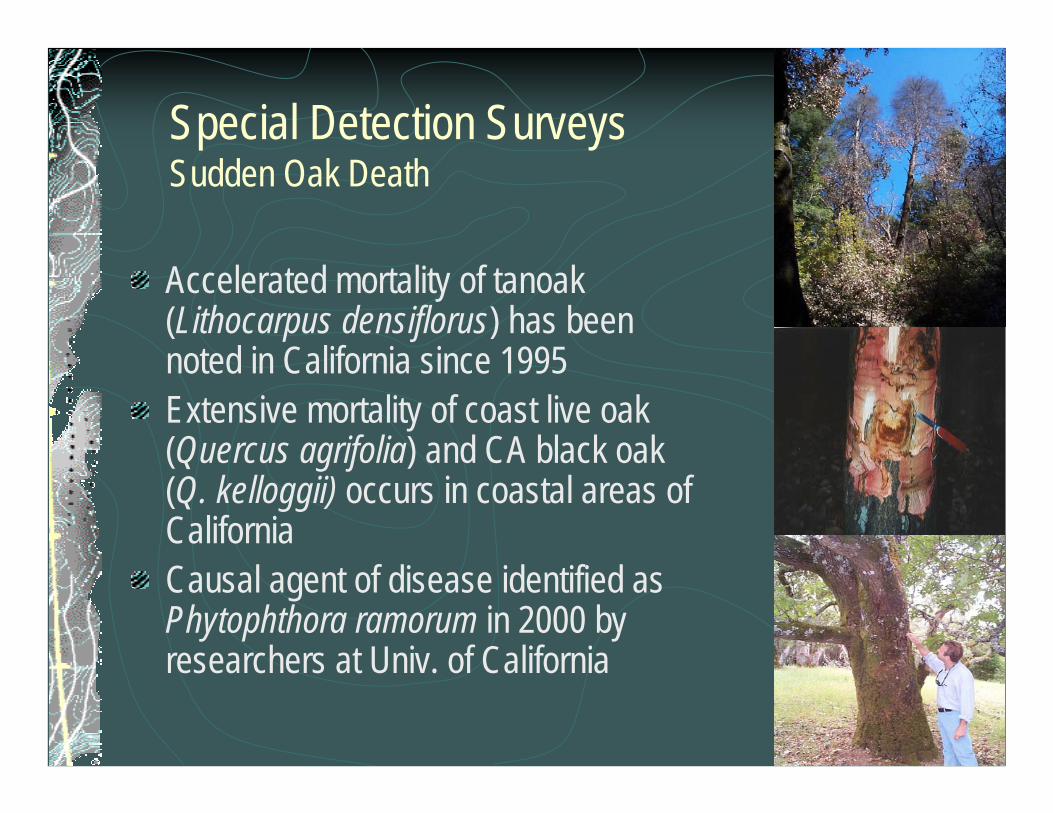
Special Detection SurveysSudden Oak Death
Accelerated mortality of tanoak (Lithocarpus densiflorus) has been noted in California since 1995 Extensive mortality of coast live oak (Quercus agrifolia) and CA black oak (Q. kelloggii) occurs in coastal areas of CaliforniaCausal agent of disease identified as Phytophthora ramorum in 2000 by researchers at Univ. of California
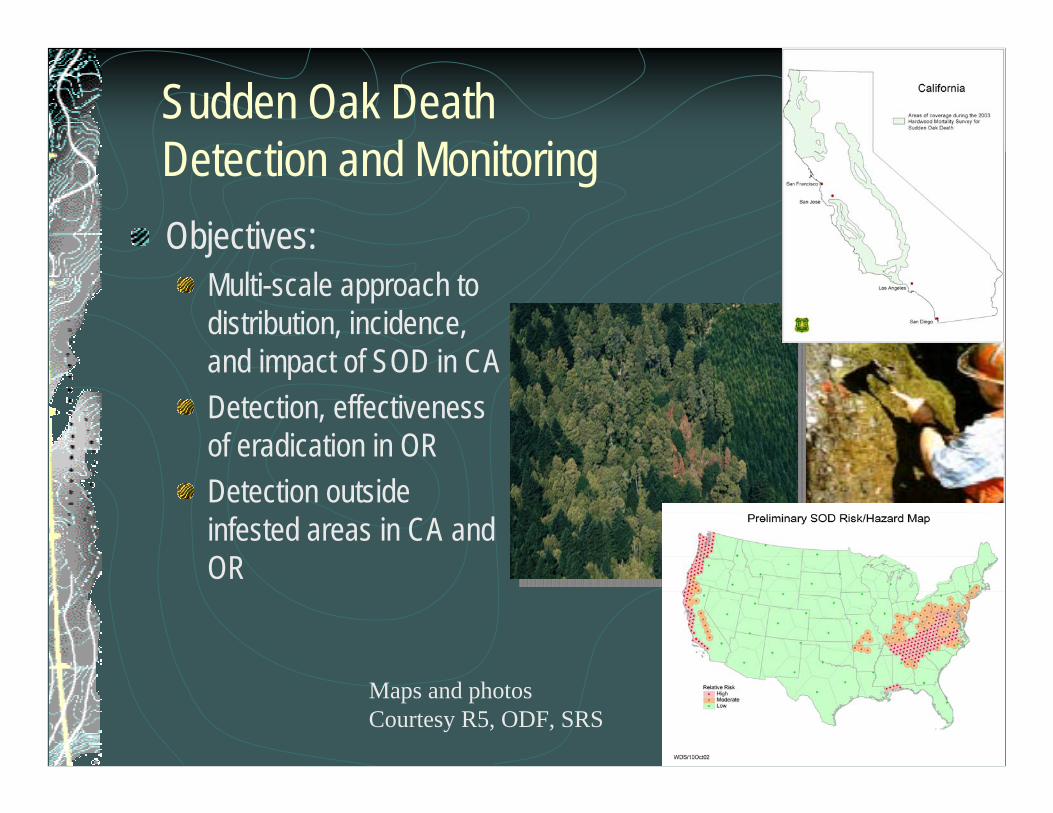
Sudden Oak DeathDetection and MonitoringObjectives:
Multi-scale approach to distribution, incidence, and impact of SOD in CADetection, effectiveness of eradication in OR Detection outside infested areas in CA and OR
Maps and photos Courtesy R5, ODF, SRS
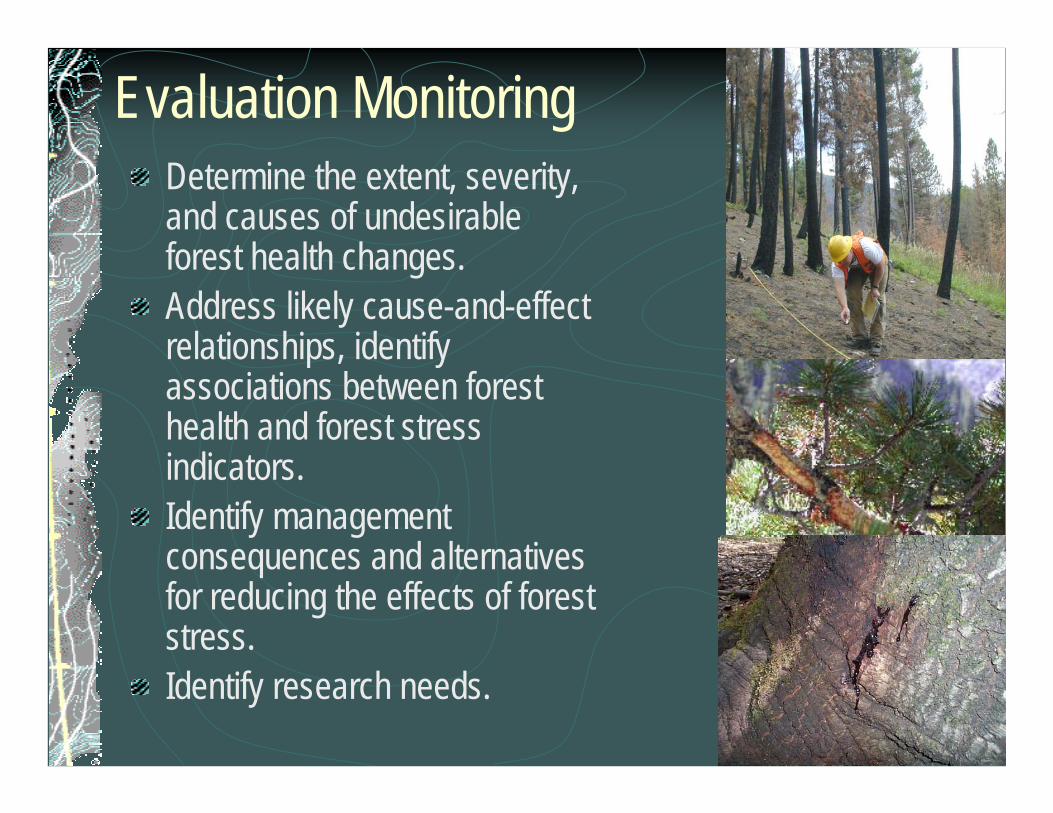
Evaluation MonitoringDetermine the extent, severity, and causes of undesirable forest health changes. Address likely cause-and-effect relationships, identify associations between forest health and forest stress indicators.Identify management consequences and alternatives for reducing the effects of forest stress.Identify research needs.
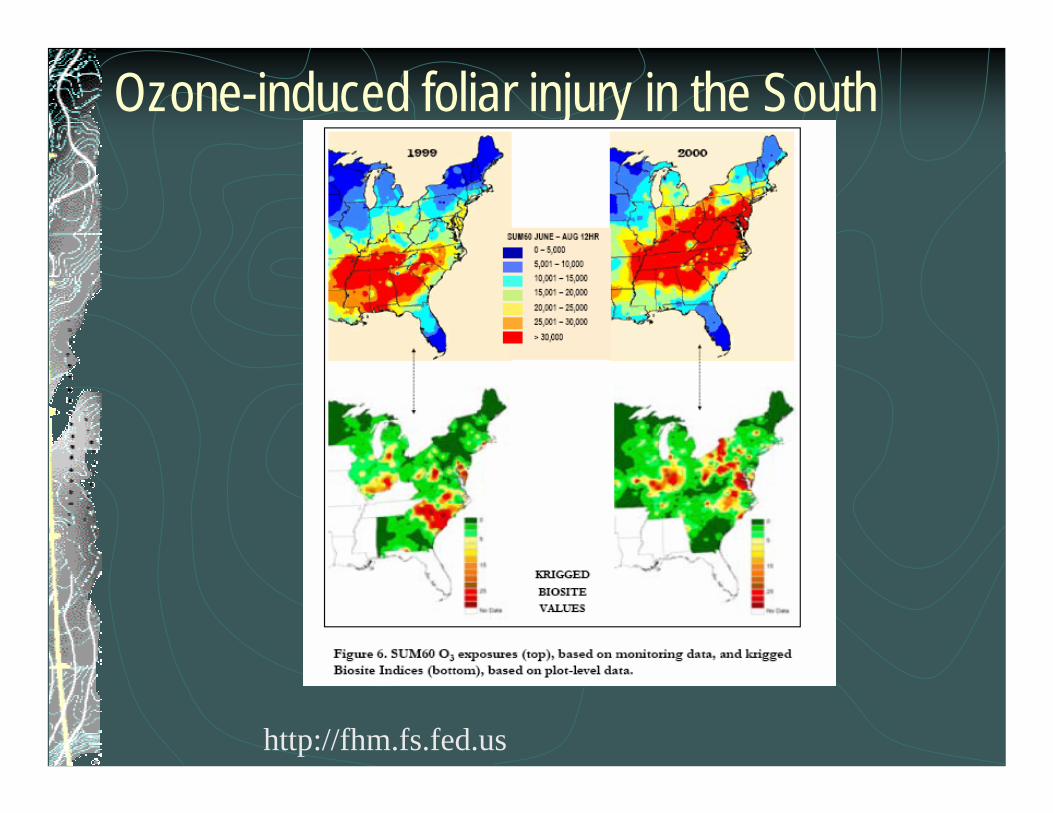
Ozone-induced foliar injury in the South
http://fhm.fs.fed.us
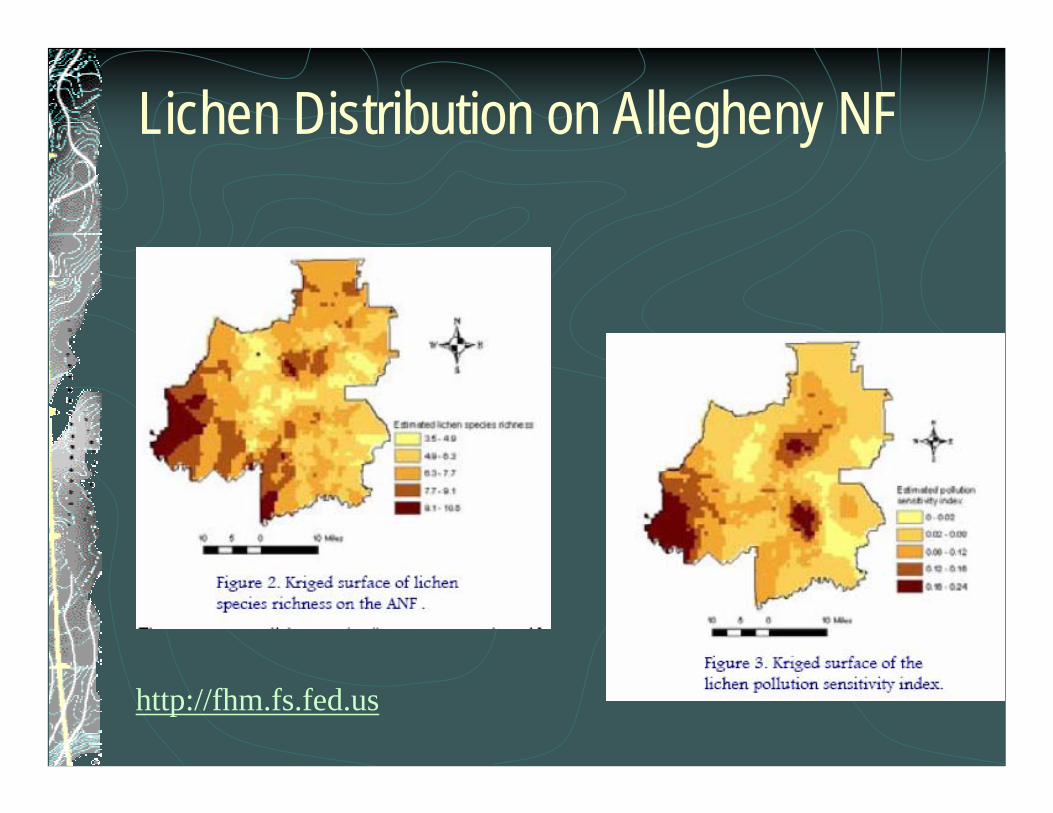
Lichen Distribution on Allegheny NF
http://fhm.fs.fed.us
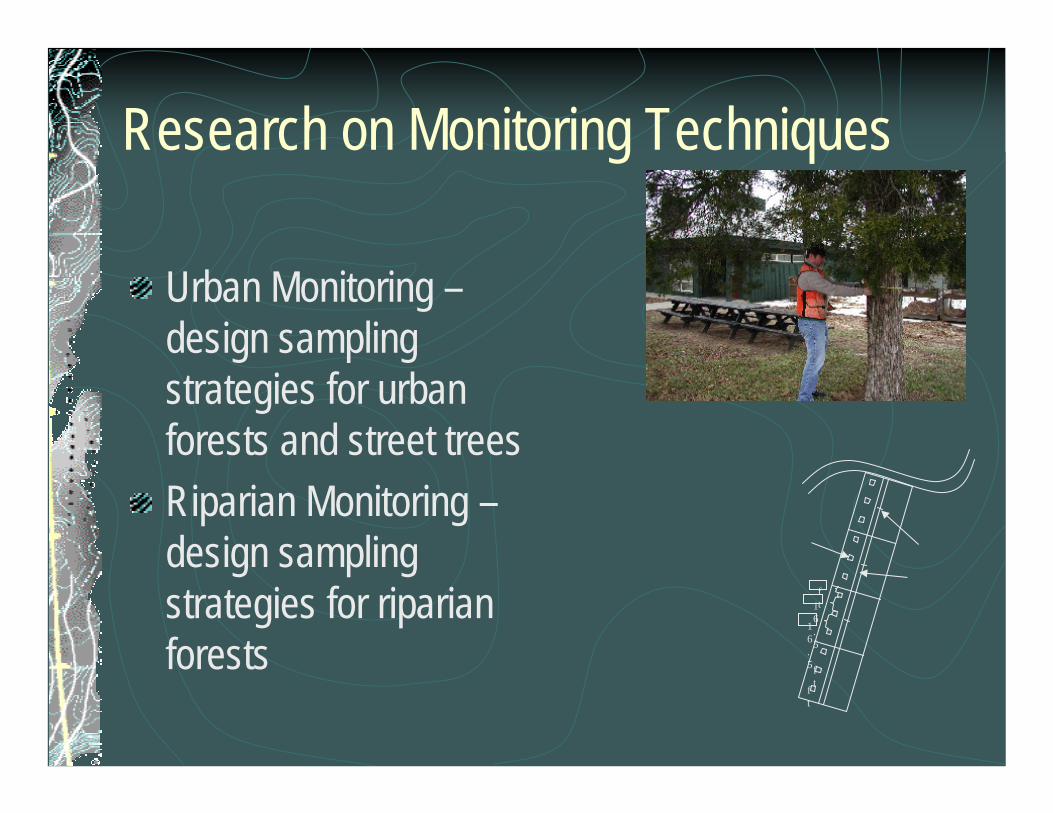
Research on Monitoring Techniques
Urban Monitoring –design sampling strategies for urban forests and street treesRiparian Monitoring –design sampling strategies for riparian forests
ft
16.5
ft
16.5
ft
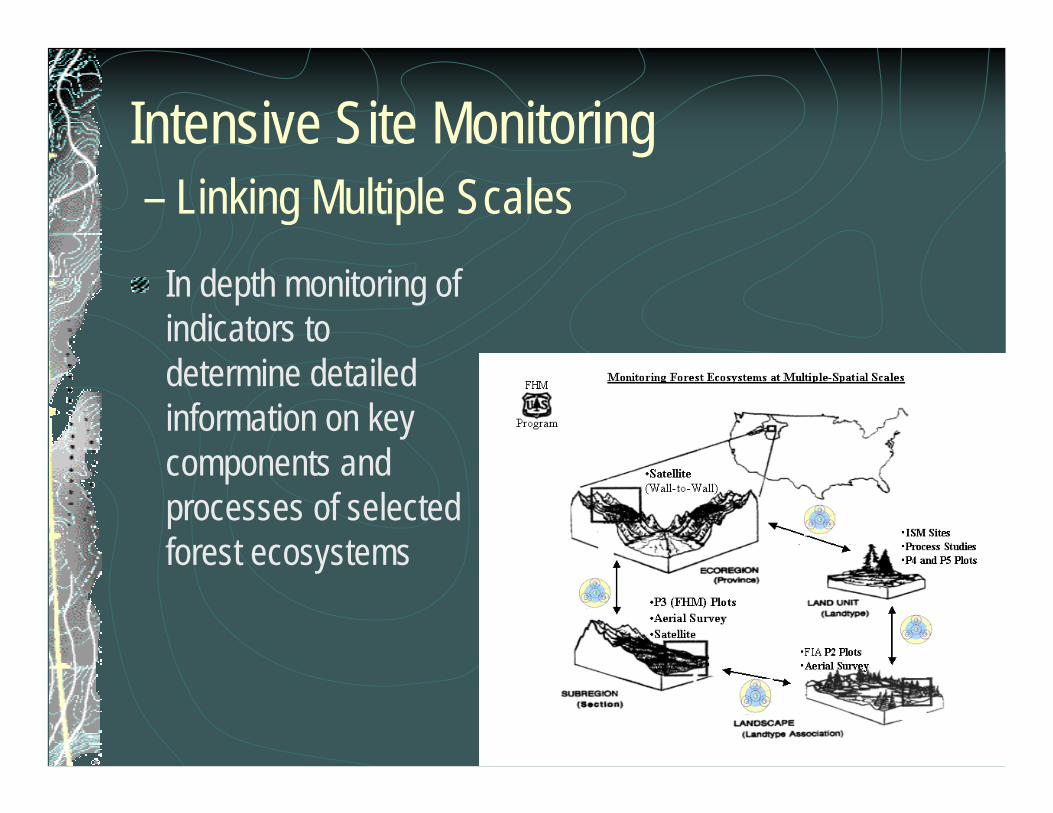
Intensive Site Monitoring– Linking Multiple Scales
In depth monitoring of indicators to determine detailed information on key components and processes of selected forest ecosystems
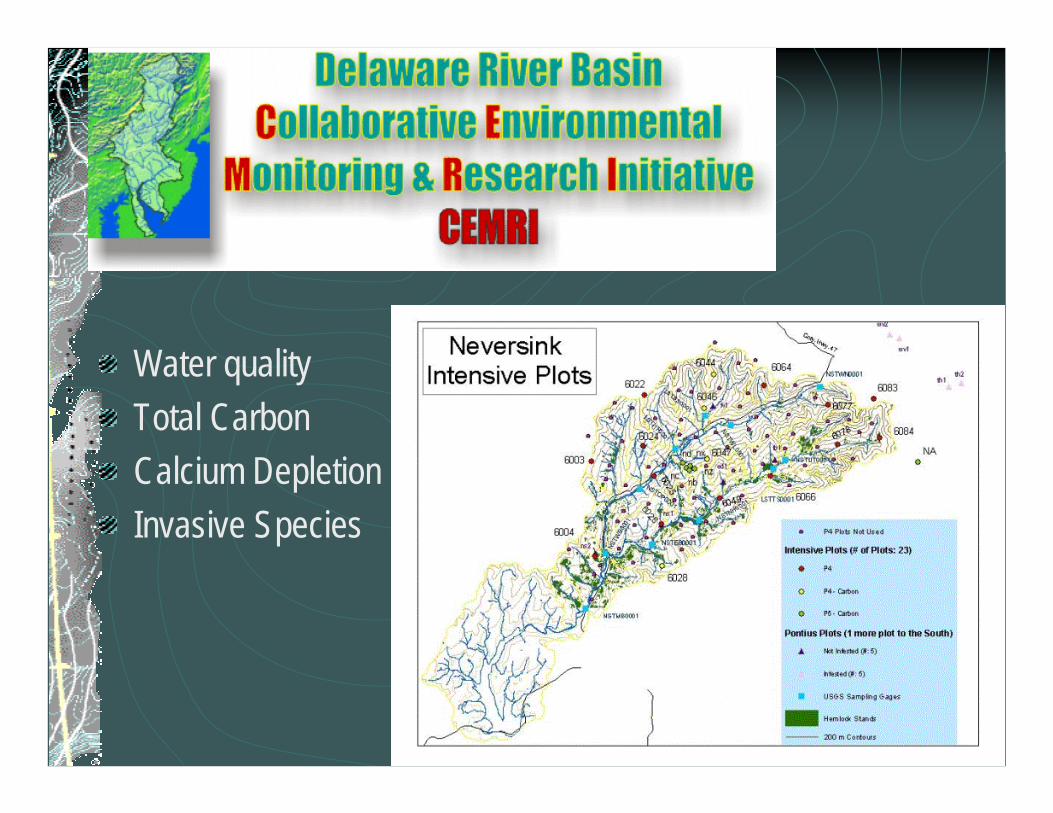
Water qualityTotal CarbonCalcium DepletionInvasive Species
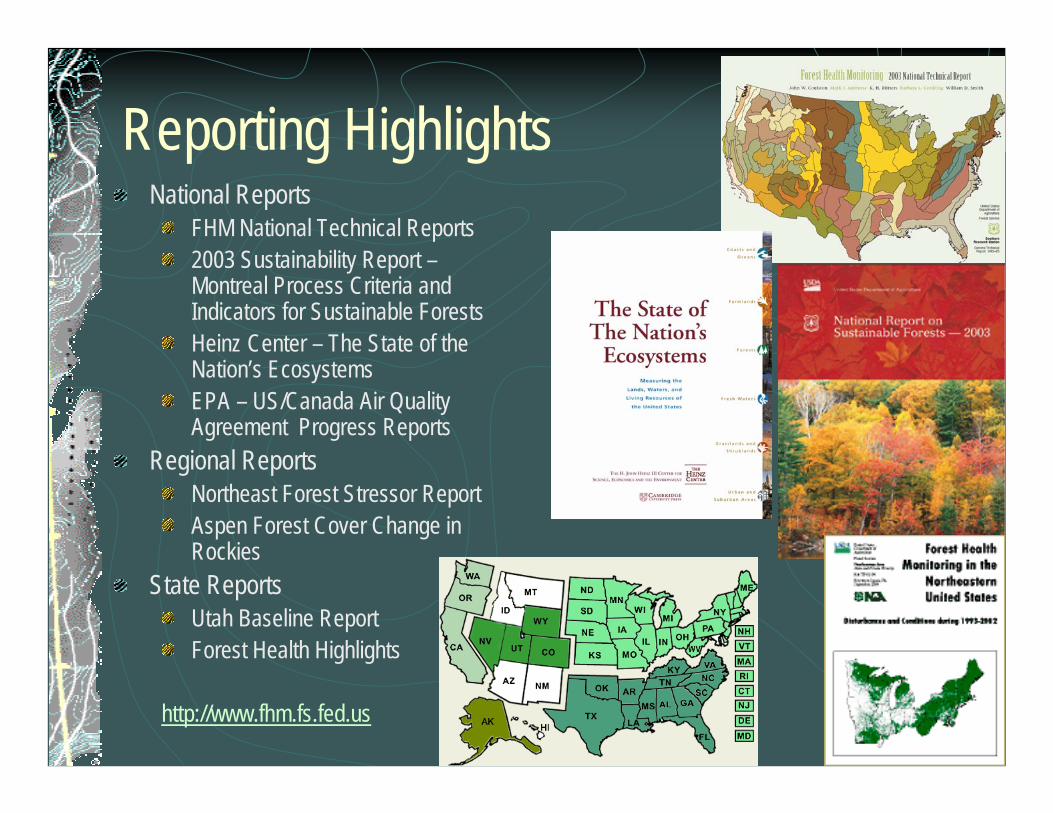
Reporting HighlightsNational Reports
FHM National Technical Reports 2003 Sustainability Report –Montreal Process Criteria and Indicators for Sustainable ForestsHeinz Center – The State of the Nation’s EcosystemsEPA – US/Canada Air Quality Agreement Progress Reports
Regional ReportsNortheast Forest Stressor ReportAspen Forest Cover Change in Rockies
State ReportsUtah Baseline ReportForest Health Highlights
http://www.fhm.fs.fed.us
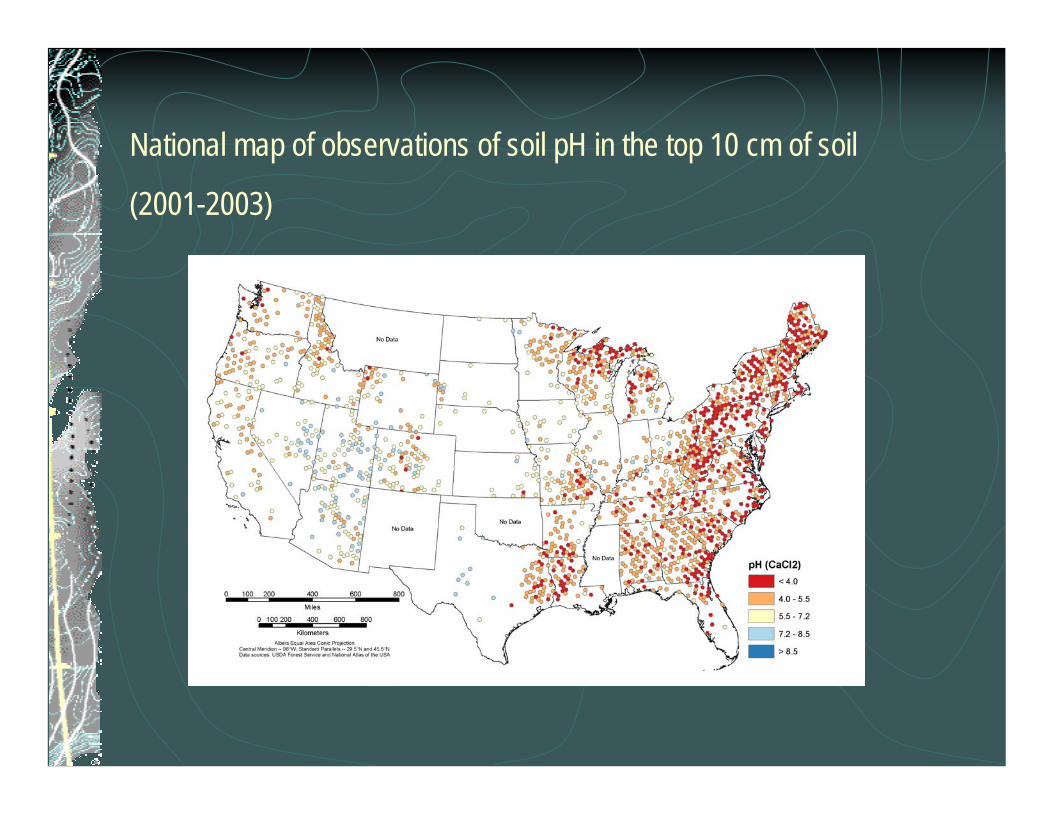
National map of observations of soil pH in the top 10 cm of soil
(2001-2003)
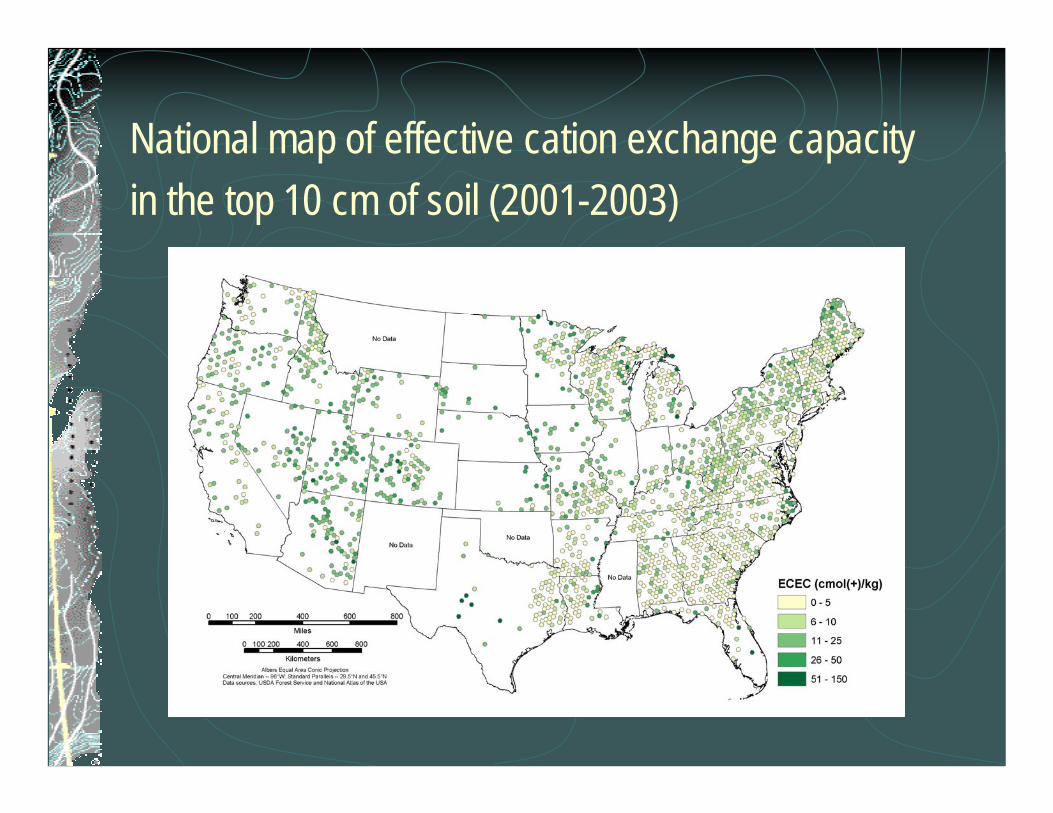
National map of effective cation exchange capacity in the top 10 cm of soil (2001-2003)
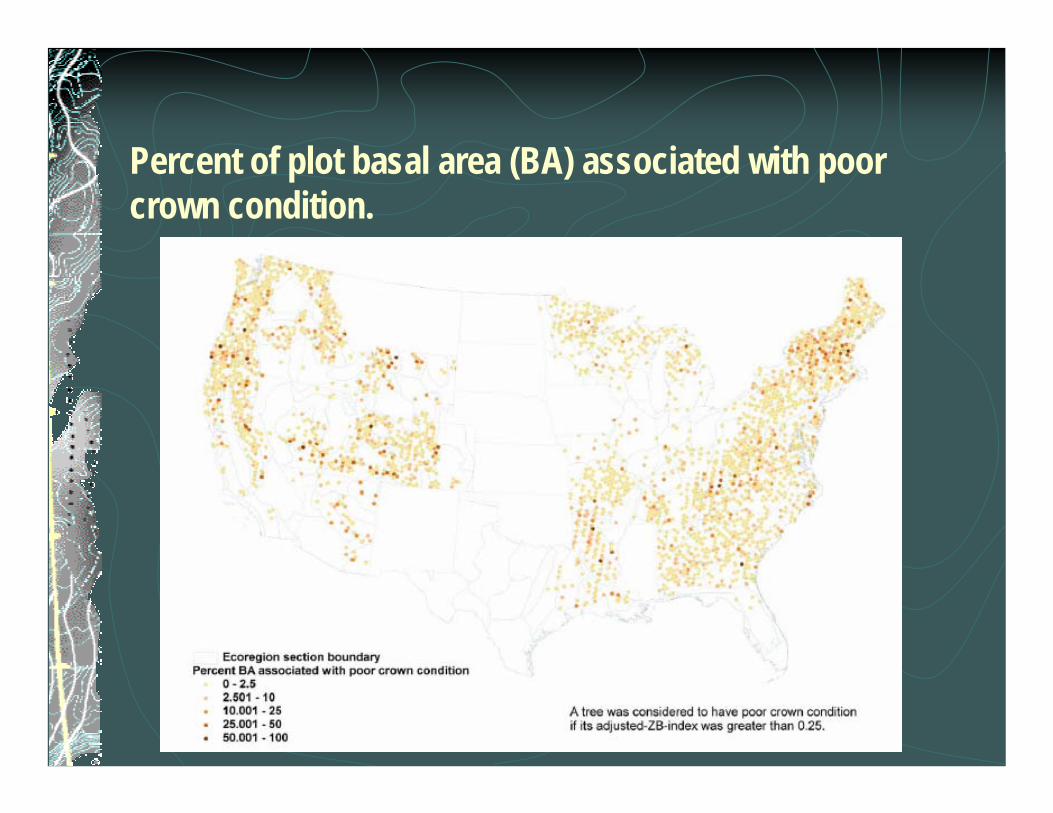
Percent of plot basal area (BA) associated with poor crown condition.
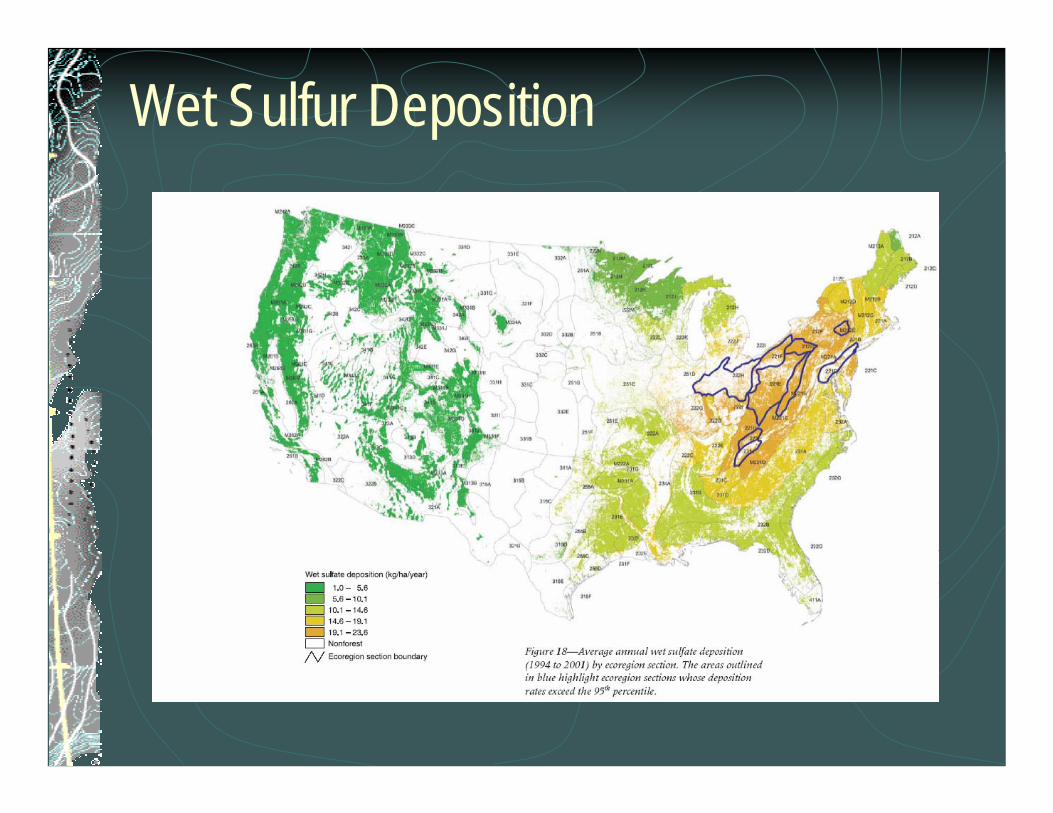
Wet Sulfur Deposition
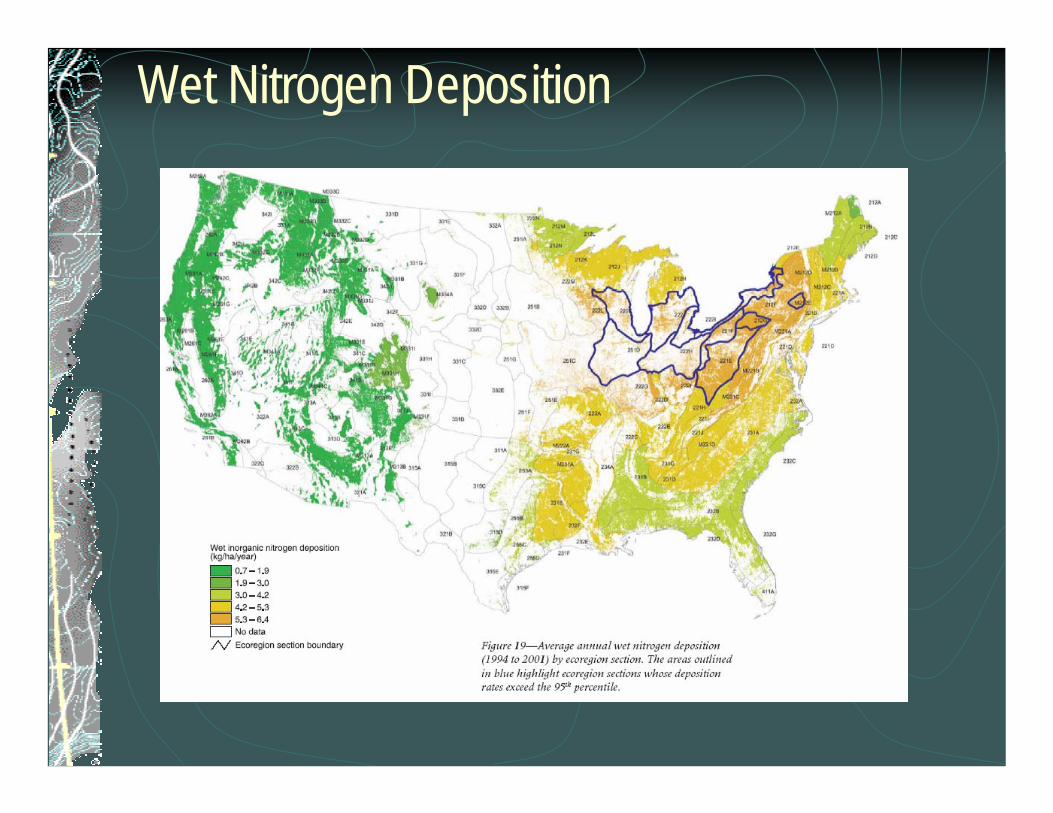
Wet Nitrogen Deposition
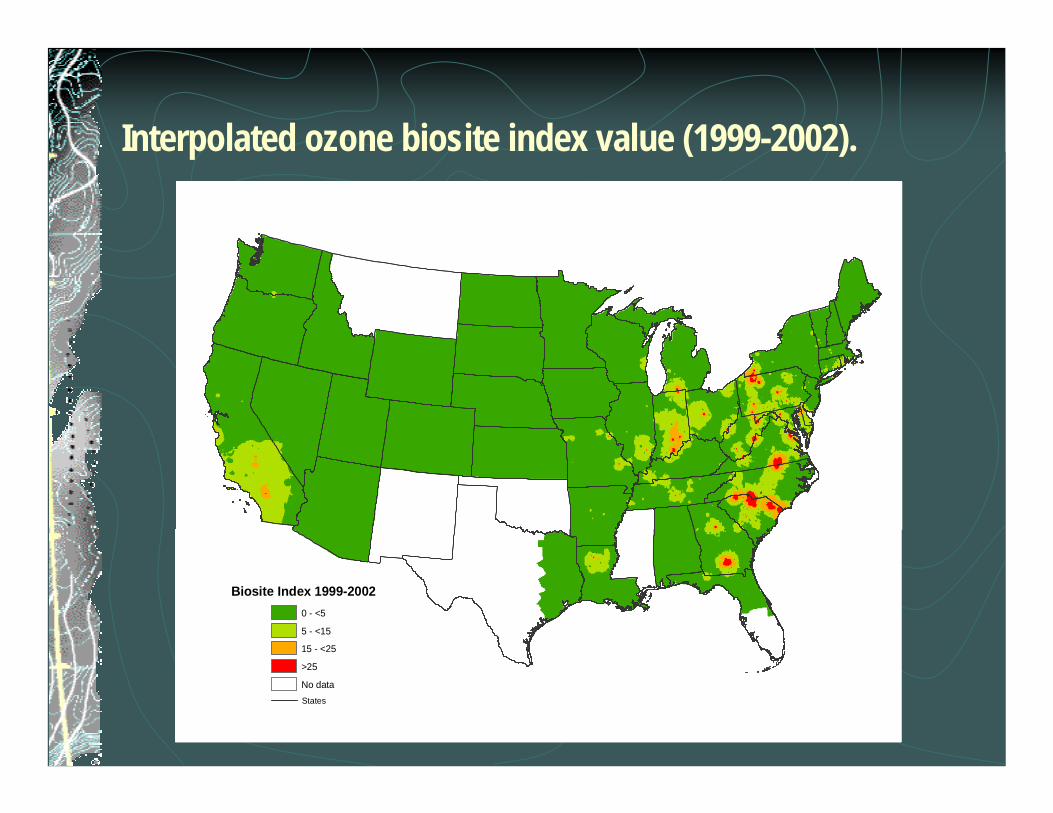
Interpolated ozone biosite index value (1999-2002).
Biosite Index 1999-20020 - <5
5 - <15
15 - <25
>25
No dataStates
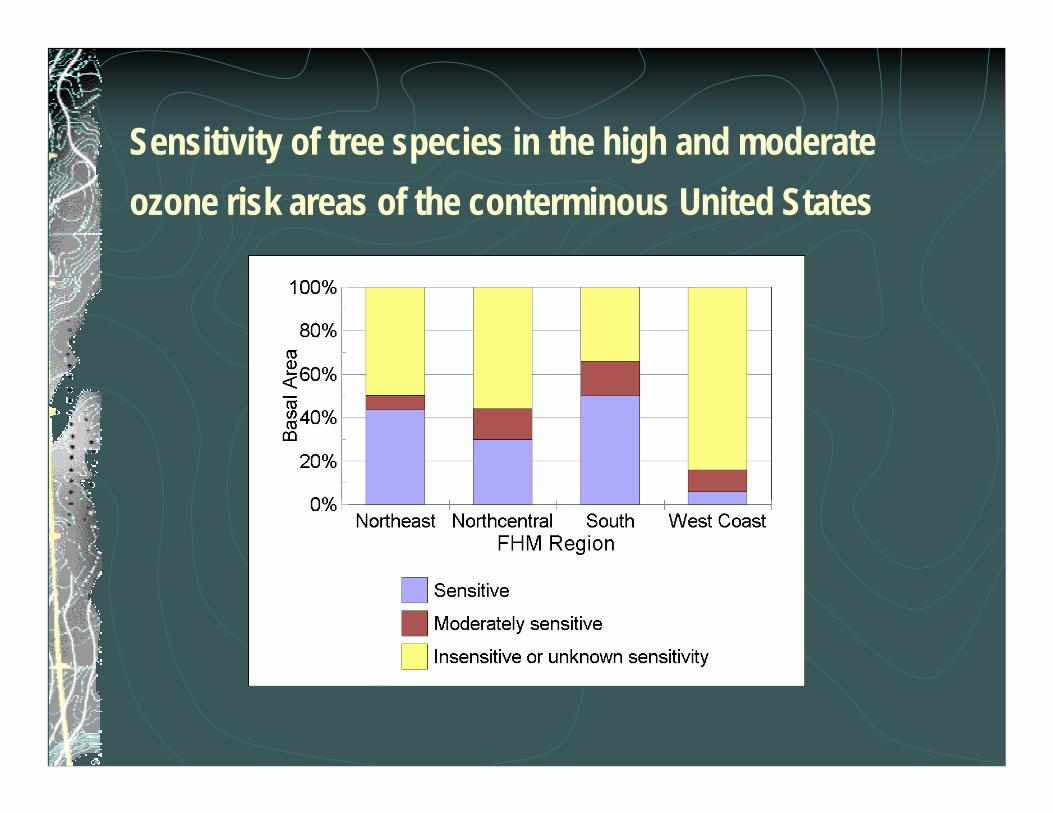
Sensitivity of tree species in the high and moderate ozone risk areas of the conterminous United States
Future ChallengesStress key strengths of FHM
Partnership-based Innovative ComprehensiveScience-based
Be “Real Time”Timely detection, analysis, and reporting of adverse changes in forest health to facilitate effective management response
Look Beyond the GridLook back – analyze trends, integrate diverse data sourcesLook forward – forecast future conditions, analyze risksDesign new approaches for detection of invasives