Embed Size (px)
Citation preview
Joint report of JRC and
Directorate-General
Environment
Forest Fires in Europe, Middle East and North Africa 2013
20 1 4
Report EUR 26791 EN
European Commission
Joint Research Centre
Institute for Environment and Sustainability
Contact information
Address: Joint Research Centre, Via Enrico Fermi 2749, TP 261, 21027 Ispra (VA), Italy
E-mail: [email protected]
Tel.: +39 0332 78 6138
Fax: +39 0332 78 5500
http://ies.jrc.ec.europa.eu/
http://www.jrc.ec.europa.eu/
This publication is a Technical Report by the Joint Research Centre of the European Commission.
Legal Notice
This publication is a Technical Report by the Joint Research Centre, the European Commission’s in-house
science service.
It aims to provide evidence-based scientific support to the European policy-making process. The scientific output
expressed does not imply a policy position of the European Commission. Neither the European Commission nor
any person acting on behalf of the Commission is responsible for the use which might be made of this publication.
JRC91373
EUR 26791 EN
ISBN 978-92-79-39628-1 (print)
ISBN 978-92-79-39627-4 (pdf)
ISSN 1018-5593 (print)
ISSN 1831-9424 (online)
doi:10.2788/99870 (online)
Luxembourg: Publications Office of the European Union, 2014
© European Union, 2014
Reproduction is authorised provided the source is acknowledged.
Printed in Italy
Forest Fires
in Europe,
Middle East and
North Africa
2013
Contacts:
JOINT RESEARCH CENTRE
Institute for Environment and Sustainability
Land Management and Natural Hazards Unit
Guido Schmuck [email protected]
Jesús San-Miguel-Ayanz [email protected]
Andrea Camia [email protected]
Tracy Durrant [email protected]
Roberto Boca [email protected]
Giorgio Libertá [email protected]
Thomas Petroliagkis [email protected]
Margherita Di Leo [email protected]
Dario Rodrigues [email protected]
Francesco Boccacci [email protected]
DIRECTORATE-GENERAL ENVIRONMENT
Directorate B: Natural Capital
Agriculture, Forests & Soil Unit
Ernst Schulte [email protected]
MEMBER STATES AND OTHER COUNTRIES
See list of contributors for country reports. Sources of data and comments are also given in the text.

LIST OF CONTRIBUTORS FOR THE COUNTRY REPORTS
Algeria Abdelhafid BENCHIKHA Direction Générale de la Protection Civile
Mohamed ABBAS Direction Générale des Forêts
Austria Franz HUMER The Austrian Federal Fire Brigade Association
Bulgaria Vladimir KONSTANTINOV Executive Forest Agency
Croatia
Neven SZABO
Directorate for Forestry, Hunting and Wood Industry, Ministry of Agriculture
National Protection and Rescue Directorate
Cyprus Kostas PAPAGEORGIOU Ministry of Agriculture, Natural Resources and Environment
Department of Forests
Estonia Veljo KÜTT The Estonian Environment Agency
Kadi KÕIV Ministry of the Environment
Finland Rami RUUSKA Ministry of Interior
Department for Rescue Services
FYROM Tatjana ANASTASOV
Protection and rescue Directorate
Department for analysis and research
France Philippe MICHAUT
Direction de la Défense et de la Sécurité Civiles
Philippe JOANNELLE Ministère de l'Agriculture, de l'Agroalimentaire et de la Forêt , DGPAAT
Germany Michaela LACHMANN Federal Agency for Agriculture and Food
Greece Eirini ALEXIOU Ministry of Environment, Energy, and Climatic Change; Special Secretariat of Forests;
Directorate General for Development and Protection of Forests and Natural Environment
Hungary Peter DEBRECENI
Dániel NAGY
Forestry Directorate, Forest Inspection and Protection Service Unit
Ireland Ciaran NUGENT Forest service
Department of Agriculture, Food and the Marine
Italy Mauro CAPONE
Fabrizio DI LIBERTO
Lorenza COLLETTI
Ministero delle Politiche Agricole Alimentari e Forestali
Italian Forest Corps
Latvia Edijs LEISAVNIEKS State Forest Service; Forest and Environmental Protection Department
Lebanon George MITRI University of Balamand
Lithuania Zbignev GLAZKO Ministry of Environment
Directorate General of State Forests
Morocco Fouad ASSALI
Hicham ALAOUI M'HARZI
Service de la protection des forêts
Haut-Commissariat aux Eaux et Forêts et à la Lutte Contre la Désertification)
Norway Dag BOTNEN Ministry of Foreign Affairs, Directorate for Civil Protection and Emergency Planning
Poland Joseph PIWNICKI
Forest Research Institute
Forest Fire Protection Department
Portugal Marta JANEIRA National Authority for Civil Protection (ANPC)
Alexandre BORGES
Romania Septimius MARA
Radu SBIRNEA
Ministry of Environment and Climatic Changes
Department for Waters, Forests and Fishery
Russian
Federation
Andrey ERITSOV Aerial Forest Fire Centre of Russian Federation
Slovak Rep. Valéria LONGAUEROVÁ National Forest Centre; Forest Research Institute
Slovenia Ministry of Agriculture and the Environment
Spain Elsa ENRIQUEZ Ministerio de Medio Ambiente y Medio Rural y Marino
Área de Defensa Contra Incendios Forestales
Sweden Leif SANDAHL Swedish Civil Contingencies Agency (MSB)
Risk & Vulnerability Reduction Department
Switzerland Michael REINHARD Federal Office for the Environment
Marco CONEDERA
Boris PEZZATTI
WSL Federal Research Institute
Turkey Ahmet KISA Antalya Metropolitan Municipality Fire Brigade Department
Table of Contents
1 PREFACE ......................................................................................................... 1
2 FOREST FIRES 2013 ......................................................................................... 2
2.1 Introduction to the 2013 fire season in Europe, Middle East and North Africa. ..... 2
2.2 European countries ..................................................................................... 4
2.2.1 Austria .................................................................................................4
2.2.2 Bulgaria ...............................................................................................5
2.2.3 Croatia .................................................................................................6
2.2.4 Cyprus .................................................................................................9
2.2.5 Estonia ............................................................................................... 11
2.2.6 Finland ............................................................................................... 12
2.2.7 France ............................................................................................... 13
2.2.8 FYROM ............................................................................................... 17
2.2.9 Germany ............................................................................................ 18
2.2.10 Greece ............................................................................................... 20
2.2.11 Hungary ............................................................................................. 22
2.2.12 Ireland ............................................................................................... 25
2.2.13 Italy .................................................................................................. 27
2.2.14 Latvia ................................................................................................ 30
2.2.15 Lithuania ............................................................................................ 32
2.2.16 Norway .............................................................................................. 33
2.2.17 Poland ............................................................................................... 35
2.2.18 Portugal ............................................................................................. 40
2.2.19 Romania ............................................................................................. 44
2.2.20 Russian Federation............................................................................... 47
2.2.21 Slovak Republic ................................................................................... 50
2.2.22 Slovenia ............................................................................................. 52
2.2.23 Spain ................................................................................................. 53
2.2.24 Sweden .............................................................................................. 57
2.2.25 Switzerland ......................................................................................... 59
2.2.26 Turkey ............................................................................................... 60
2.3 Comparison of Southern EU Countries with longer time series (1980 – 2013) .... 62
2.4 Middle East and North Africa Countries ........................................................ 65
2.4.1 Algeria ............................................................................................... 65
2.4.2 Lebanon ............................................................................................. 68
2.4.3 Morocco ............................................................................................. 71
3 THE EUROPEAN FOREST FIRE INFORMATION SYSTEM (EFFIS) .................................. 76
3.1 EFFIS Danger Forecast: 2013 results ........................................................... 77
3.2 EFFIS Rapid Damage Assessment: 2013 results ........................................... 87
Europe ........................................................................................................ 90
3.2.1 Albania............................................................................................... 90
3.2.2 Bosnia-Herzegovina ............................................................................. 90
3.2.3 Bulgaria ............................................................................................. 90
3.2.4 Croatia ............................................................................................... 90
3.2.5 Cyprus ............................................................................................... 91
3.2.6 Former Yugoslav Republic of Macedonia (FYROM) ..................................... 91
3.2.7 France ............................................................................................... 92
3.2.8 Germany ............................................................................................ 92
3.2.9 Greece ............................................................................................... 92
3.2.10 Hungary ............................................................................................. 92
3.2.11 Ireland ............................................................................................... 93
3.2.12 Italy .................................................................................................. 93
3.2.13 Kosovo (under UNSCR 1244) ................................................................. 94
3.2.14 Montenegro ........................................................................................ 94
3.2.15 Norway .............................................................................................. 94
3.2.16 Portugal ............................................................................................. 94
3.2.17 Romania ............................................................................................. 95
3.2.18 Serbia ................................................................................................ 95
3.2.19 Spain ................................................................................................. 95
3.2.20 Sweden .............................................................................................. 95
3.2.21 Turkey ............................................................................................... 96
3.2.22 United Kingdom ................................................................................... 96
Middle East and North Africa ....................................................................... 97
3.2.23 Algeria ............................................................................................... 97
3.2.24 Israel ................................................................................................. 97
3.2.25 Lebanon ............................................................................................. 97
3.2.26 Libya ................................................................................................. 98
3.2.27 Morocco ............................................................................................. 98
3.2.28 Syria .................................................................................................. 98
3.2.29 Tunisia ............................................................................................... 98
3.3 European Fire Database ............................................................................ 99
Background documentation ............................................................................. 102
ANNEX I – Summary Tables of Fire Statistics .................................................. 103

1
1 PREFACE The aim of the European Forest Fire Information System (EFFIS) is to provide harmonised
information on forest fires in the pan-European region. For this purpose collaboration with EU
Member States and neighbouring countries has been on-going since 1998. EFFIS provides an
ideal platform for countries to exchange good practices on fire prevention, firefighting,
restoration practices and other activities related to fire management.
In the last years the system has been extended to include countries in the Middle East and
North Africa (MENA). Since 2011, in collaboration with the FAO Silva Mediterranea (FAO) and
GIZ, Middle East and North African (MENA) countries have been participating in the EFFIS
activities and have been included as members of its Expert Group on Forest Fires (EGFF).
Currently, the EFFIS network is
constituted by 39 countries, including
25 EU Member States (Austria,
Belgium, Bulgaria, Croatia, Cyprus,
Czech Republic, Estonia, Finland,
France, Germany, Greece, Hungary,
Ireland, Italy, Latvia, Lithuania,
Poland, Portugal, Romania, Slovak
Republic, Slovenia, Spain, Sweden,
the Netherlands and the United
Kingdom), 10 European non-EU
countries (Albania, Bosnia &
Herzegovina, FYROM, Kosovo,
Montenegro, Norway, Russia, Serbia,
Switzerland and Turkey), and 4 MENA
countries (Algeria, Lebanon, Morocco
and Tunisia).
This is the 14th issue of the EFFIS annual report on forest fires, which is now consolidated as
highly appreciated documentation of the previous year's forest fires. In its different sections,
the report includes information on the evolution of fire danger in the European and
Mediterranean regions, the damage caused by fires and detailed description of the fire
conditions during the 2013 fire campaign in the majority of countries in the EFFIS network The
chapter on national reporting gives an overview of the efforts undertaken at national and
regional levels, and provides inspiration for countries exposed to forest fire risk.
Also this year we are confident that we will further improve cooperation with the members of
the EGFF especially with regard to fire prevention actions. Our common aim is to maintain and
protect our landscapes and natural heritage, to avoid loss of human lives and to minimise the
damage caused to property by uncontrolled forest fires.
2
2 FOREST FIRES 2013
2.1 Introduction to the 2013 fire season in Europe,
Middle East and North Africa.
Although variability exists on the length and
intensity of the fire season in the countries of
the EFFIS network, this is normally
considered as the period between March and
October. Overall, 2013 was a mild year in
terms of fire danger conditions and total
burnt area in the European Union countries.
However, as described in the next
paragraph, episodes of intense fire danger
and large fires occurred in August, especially
in Portugal and Spain.
The first part of the 2013 fire season was
fairly mild, due to relatively cool and wet
weather in southern Europe during spring
and early summer. Nevertheless, unusually
periods of high temperatures in the UK and
Ireland resulted in significant fire episodes in
these countries. These conditions persisted
in April due to a continuous drought period in
the UK that dangerously lowered the
moisture content of the vegetation at the
end of April.
Fire weather conditions in the Mediterranean
region were driven by warm and dry
anomalies in the region, resulting in a series
of large fires in Greece. However, during this
period (spring and early summer) a
considerable number of wet periods took
place, lowering fire danger conditions over
most of the European territory.
Significant fire activity in the Mediterranean
countries started only in July. A clear signal
of the beginning of 2013 fire season in July
was the series of large fires in Portugal
(15 015 ha burnt in Douro), Spain (2 090 ha
burned in Mallorca), Greece (4 227 ha in
Rhodes) and in Italy, where Sicily was hit by
a number of large fires.
However, during August moderately mild
conditions continued in most of Europe, with
the exception of Portugal (which was
severely affected by several fires larger than
1 000 ha, especially during the second half
of the month) and Spain (see Figure 1 and
Figure 2).
It is worth mentioning that during the 2013
fire campaign, a new set of EFFIS products
that relate to the long-range weather
forecast were introduced in the system.
These comprise (a) seasonal and (b) monthly
forecasts.
Seasonal forecast maps show temperature
and rainfall anomalies that are expected to
prevail over European and Mediterranean
areas during the next 2 months based on the
Seasonal Forecast System (S4) of ECMWF
(European Centre for Medium-Range
Weather Forecasts), while monthly forecast
maps show temperature and rainfall
anomalies during the next 2 weeks based on
the Monthly Forecast System (MFS) of
ECMWF.
MFS is based on an ensemble comprising 50
plus one (control) members with a forecast
horizon of 32 days.
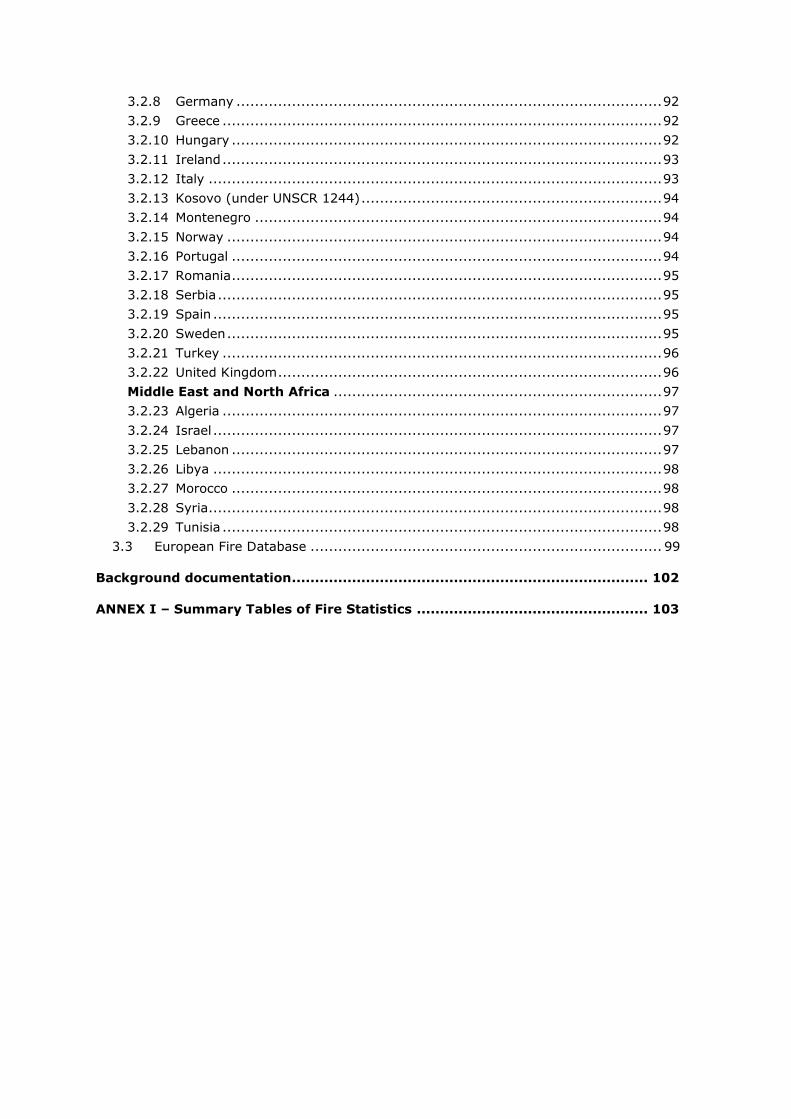
As an example of these products, Figure 1
and Figure 2 show the prevailing fire weather
conditions over Portugal during the intense
fire episode of the second part of August.
Figure 1 shows the forecast temperature
anomalies for the week starting from 12 and
ending on 18 August. The main characteristic
of this weekly forecast is the precision in
pointing out the area of north Portugal and
its capability to forecast this distinct
maximum of warm anomalies.
Figure 1. EFFIS (MFS) week 1 temperature anomaly forecast initiated on 12 August and valid for the time
interval between 12 to 18 August 2014.
35°N
40°N
45°N
50°N
55°N
60°N
65°N
35°N
40°N
45°N
50°N
55°N
60°N
65°N
0°E5°W10°W15°W 5°E 10°E 15°E 20°E 25°E 30°E 35°E
0°E5°W10°W15°W 5°E 10°E 15°E 20°E 25°E 30°E 35°E
Estimated deviation (anomaly) of the mean from model climate (in Celsius degrees)
based on ECMWF Monthly Forecast System initiated on 12 August 2013
Monthly Temperature Anomalies valid for [w1] week: 12 to 18 August 2013
-4.5 -4 -3.5 -3 -2.5 -2 -1.5 -1 -0.5 0.5 1 1.5 2 2.5 3 3.5 4 4.5
3
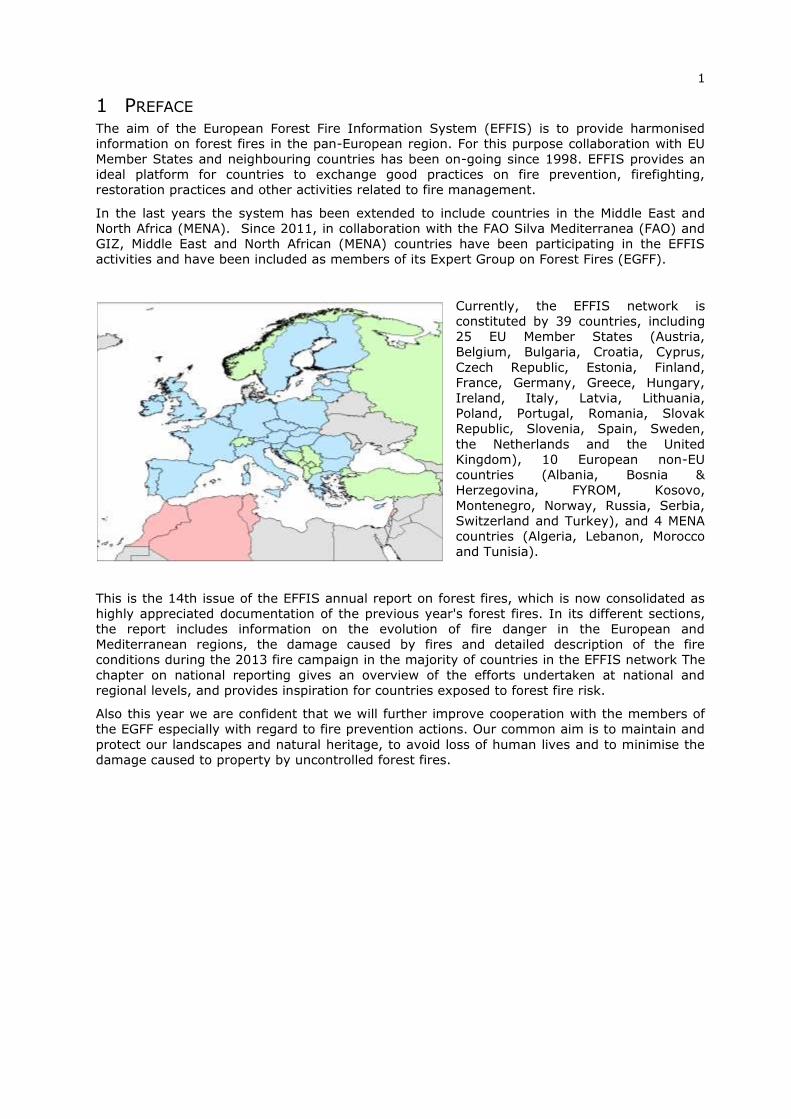
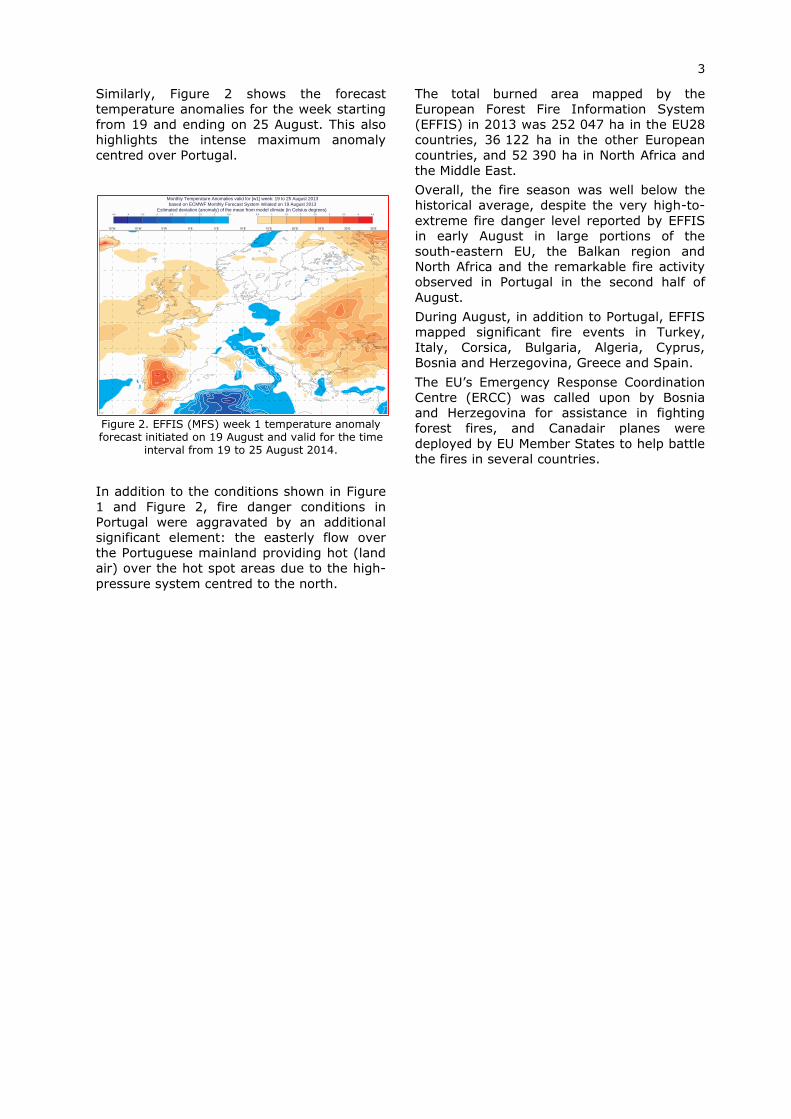
Similarly, Figure 2 shows the forecast
temperature anomalies for the week starting
from 19 and ending on 25 August. This also
highlights the intense maximum anomaly
centred over Portugal.
Figure 2. EFFIS (MFS) week 1 temperature anomaly forecast initiated on 19 August and valid for the time
interval from 19 to 25 August 2014.
In addition to the conditions shown in Figure
1 and Figure 2, fire danger conditions in
Portugal were aggravated by an additional
significant element: the easterly flow over
the Portuguese mainland providing hot (land
air) over the hot spot areas due to the high-
pressure system centred to the north.
The total burned area mapped by the
European Forest Fire Information System
(EFFIS) in 2013 was 252 047 ha in the EU28
countries, 36 122 ha in the other European
countries, and 52 390 ha in North Africa and
the Middle East.
Overall, the fire season was well below the
historical average, despite the very high-to-
extreme fire danger level reported by EFFIS
in early August in large portions of the
south-eastern EU, the Balkan region and
North Africa and the remarkable fire activity
observed in Portugal in the second half of
August.
During August, in addition to Portugal, EFFIS
mapped significant fire events in Turkey,
Italy, Corsica, Bulgaria, Algeria, Cyprus,
Bosnia and Herzegovina, Greece and Spain.
The EU’s Emergency Response Coordination
Centre (ERCC) was called upon by Bosnia
and Herzegovina for assistance in fighting
forest fires, and Canadair planes were
deployed by EU Member States to help battle
the fires in several countries.
35°N
40°N
45°N
50°N
55°N
60°N
65°N
35°N
40°N
45°N
50°N
55°N
60°N
65°N
0°E5°W10°W15°W 5°E 10°E 15°E 20°E 25°E 30°E 35°E
0°E5°W10°W15°W 5°E 10°E 15°E 20°E 25°E 30°E 35°E
Estimated deviation (anomaly) of the mean from model climate (in Celsius degrees)
based on ECMWF Monthly Forecast System initiated on 19 August 2013
Monthly Temperature Anomalies valid for [w1] week: 19 to 25 August 2013
-4.5 -4 -3.5 -3 -2.5 -2 -1.5 -1 -0.5 0.5 1 1.5 2 2.5 3 3.5 4 4.5
4
2.2 European countries
The following chapters contain the reports
from the contributing European countries.
The reports are arranged in alphabetical
order and comprise reports from 21 EU
Member States and 5 other non-EU members
of the EFFIS network.
2.2.1 Austria
Fire danger in the 2013 fire season
In 2013 Austria had a long season with a
high level of forest fire danger for the first
time. In particular, in the eastern part of
Austria (Lower Austria, flatland) there were
some big fires that burnt more than 100 ha.
There were also large fires in the mountains
of Upper Austria, Carinthia and Tyrol.
Fire occurrence and affected surfaces
The area of Austria is 83 858 km2 and it is
divided into 9 provinces, 15 towns with
separate charter, 84 administration districts,
and 2 350 municipalities. There are 4 567
voluntary fire brigades and 6 professional fire
brigades (Vienna, Graz, Linz, Salzburg,
Innsbruck, Klagenfurt). On average there are
2 fire brigades per municipality and a total of
around 290 000 fire-fighters. The response
time for action on the plains and near
villages (excluding mountain areas) is
between 10 and 15 minutes leading to a very
small burnt area per fire (e.g.: ~1 000 m2).
The largest burnt area was about 7 ha.
In Austria there are special courses for forest
fire fighting, in particular for actions in the
mountain areas, and some of them are
specialized for working with helicopters and
airplanes all over Austria. The education is
done in nine fire service colleges (provinces).
All the courses are only for firefighters in
cooperation with the army.
Table 1 shows the number of fires and burnt
area in Austria in 2013, calculated by the
Austrian federal fire brigade association
based on the reports of the different fire
brigades. 12 of the fires burned more than
5 ha.
Table 1. Number of fires and burned area in Austria in 2013
Fire type No. of Fires Burned area (ha)
Wildland fires 852 42
Forest fires 357 165
Total 1209 207
Fire fighting means and information
campaigns
An average of two fire departments per
community is standard. They have no special
equipment. In the districts there is special
equipment in store; for example
extinguishing containers for helicopters etc.
In the Alps and other mountains they will be
supported by helicopters from the army or
private companies.
Fire prevention activities
The risks for forest fires in Austria are not a
particularly sensitive topic for the Austrian
inhabitants. But in the last years there has
been a change in this topic.
The governments and the communities
write more regulations on forest fire
danger than they did in the past.
TV and radio reports on current forest fire
hazard in Austria. (for example based on
EFFIS database)
A working group of ÖBFV
(Österreichischer Bundesfeuerwehrverband)
worked intensively with the issue of forest
fire danger.
ÖBFV has installed an EU module for
forest fire fighting with helicopter support
and two for forest fire ground fire fighting.
Injuries and loss of human lives
In 2013 there were no deaths (either
firefighters or civilians) during forest fires.
(Source: The Austrian Federal Fire Brigade
Association, Austria)
5
2.2.2 Bulgaria
Activities for forest fire prevention are the
priority of the Ministry of Agriculture and
Foods and the Executive Forest Agency EFA.
Annually before the active fire season, all
regional authorities develop an annual plan
for forest fire protection of the forest areas
and an action plan for forest fire fighting.
Those documents are to be submitted
annually to the committee of representatives
from EFA and to the Directorate General for
Fire Safety and Protection of the Population.
Unfortunately, over the last few years in all
forest areas there has been an unfavourable
trend of a decreasing rate of fulfilment of
forest fire prevention events and planned
financial resources for their implementation.
In 2013 the number of fires and affected
forest areas were significantly less compared
to 2012. The EFA statistics for forest fires
occurring in the country during the year
recorded 408 fires with 3 313.9 ha affected.
The biggest fire affected 394 ha. The
average size of forest fires in 2013 was 8.4
ha. For comparison, in 2012, burned areas
were 12 730 ha and the number of fires was
876, which represents a halving in the
number of fires in 2013 and an almost
fourfold decrease in the burned areas.
Compared to the average for the period
2001-2012 (9 541 ha burnt and the average
number of fires 560), 2013 was a year with
good results for forests in the country.
According to the statistics reported in the
Regional Forest Directorate RFD, the regions
most affected by forest fires were RFD
Kardzhali with 58 fires and 796.3 ha burnt,
RFD Stara Zagora (18 and 513.8 ha), RFD
Sliven (14 and 417.5 ha) and RFD Sofia (57
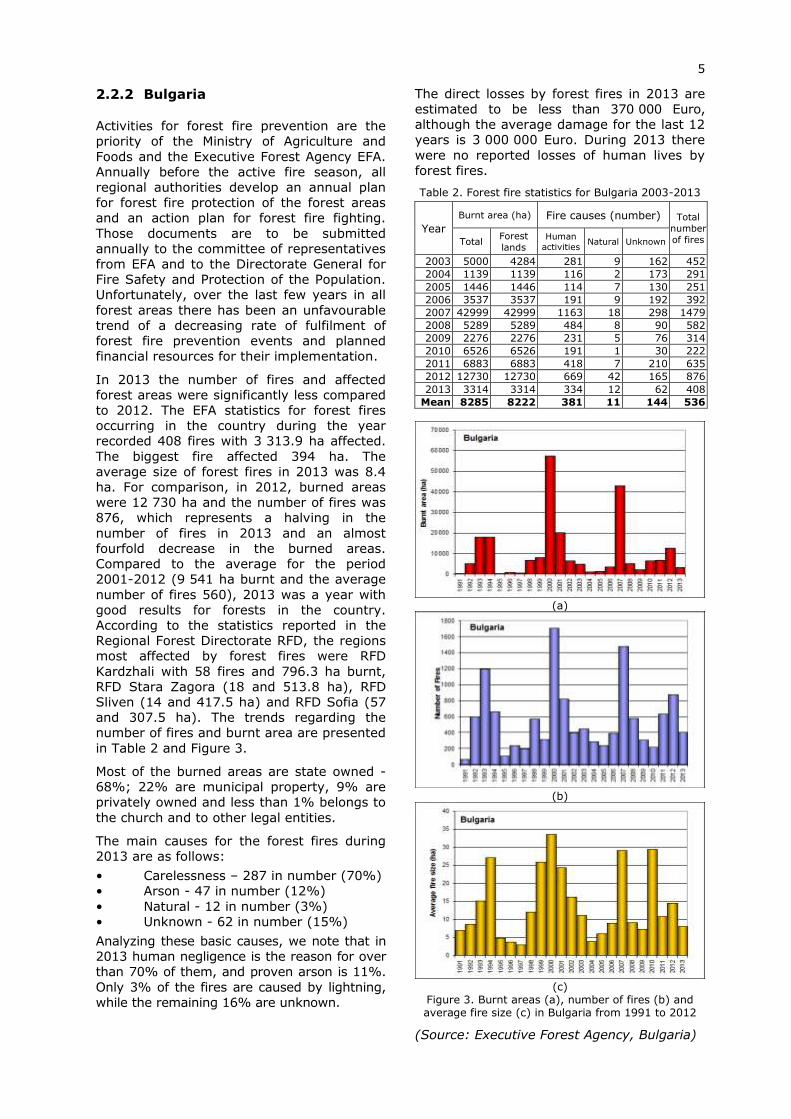
and 307.5 ha). The trends regarding the
number of fires and burnt area are presented
in Table 2 and Figure 3.
Most of the burned areas are state owned -
68%; 22% are municipal property, 9% are
privately owned and less than 1% belongs to
the church and to other legal entities.
The main causes for the forest fires during
2013 are as follows:
• Carelessness – 287 in number (70%)
• Arson - 47 in number (12%)
• Natural - 12 in number (3%)
• Unknown - 62 in number (15%)
Analyzing these basic causes, we note that in
2013 human negligence is the reason for over
than 70% of them, and proven arson is 11%.
Only 3% of the fires are caused by lightning,
while the remaining 16% are unknown.
The direct losses by forest fires in 2013 are
estimated to be less than 370 000 Euro,
although the average damage for the last 12
years is 3 000 000 Euro. During 2013 there
were no reported losses of human lives by
forest fires.
Table 2. Forest fire statistics for Bulgaria 2003-2013
Year
Burnt area (ha) Fire causes (number) Total
number
of fires Total Forest
lands Human
activities Natural Unknown
2003 5000 4284 281 9 162 452
2004 1139 1139 116 2 173 291
2005 1446 1446 114 7 130 251
2006 3537 3537 191 9 192 392
2007 42999 42999 1163 18 298 1479
2008 5289 5289 484 8 90 582
2009 2276 2276 231 5 76 314
2010 6526 6526 191 1 30 222
2011 6883 6883 418 7 210 635
2012 12730 12730 669 42 165 876
2013 3314 3314 334 12 62 408
Mean 8285 8222 381 11 144 536
(a)
(b)
(c)
Figure 3. Burnt areas (a), number of fires (b) and average fire size (c) in Bulgaria from 1991 to 2012
(Source: Executive Forest Agency, Bulgaria)
6
2.2.3 Croatia
Fire danger in the 2013 fire season
Climatological analysis of the Meteorological
and Hydrological Service indicates an
extremely rainy spring, in early June. Fire
Danger Rating was Very Low or rarely Low.
Between 15th and 22nd of June our country
was hit by a heat wave with maximum air
temperatures higher than 35°C. During this
period, Fire Danger Rating rose everywhere,
but due to a resurgence of moist and cooler
air it then decreased again. On the Adriatic
coast and in areas along the Adriatic, July
brought mostly dry and sunny weather.
Precipitation was rare and mostly weak and
due to such weather conditions, the Fire
Danger Rating was rising and by the end of
the month it was mostly in the category of
very high risk. Occasionally there were
penetrations of moist and unstable air, and
localized rainfall.
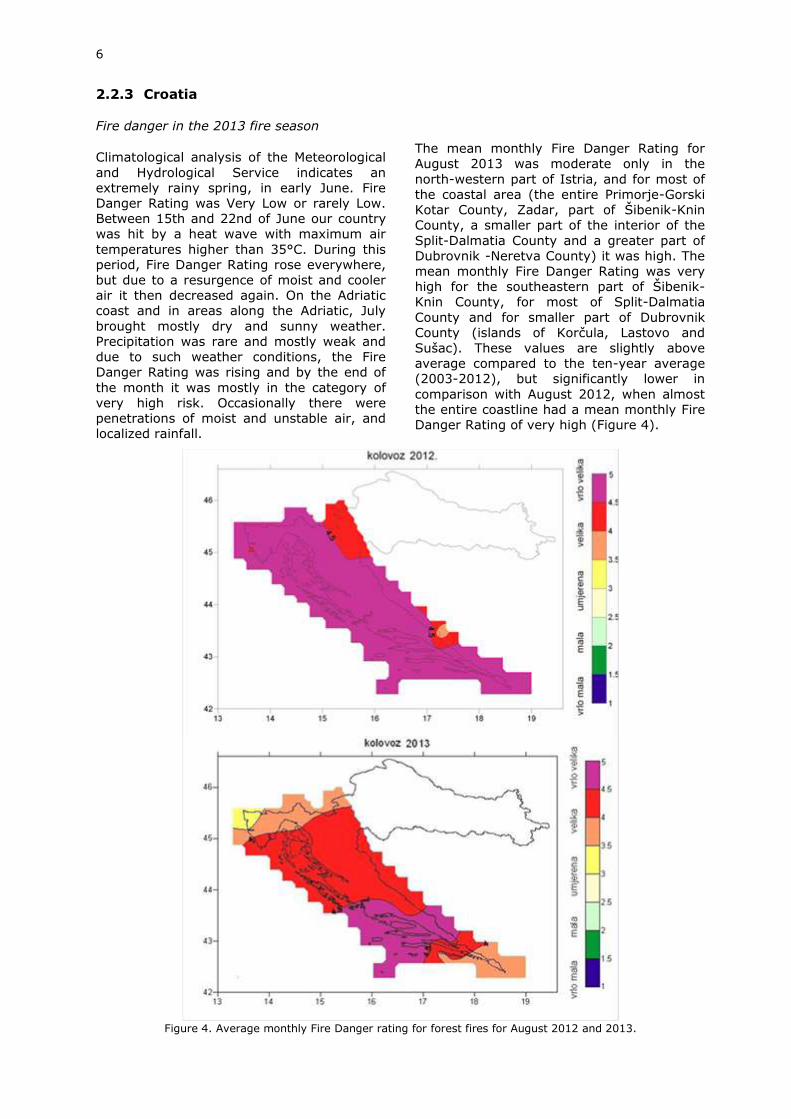
The mean monthly Fire Danger Rating for
August 2013 was moderate only in the
north-western part of Istria, and for most of
the coastal area (the entire Primorje-Gorski
Kotar County, Zadar, part of Šibenik-Knin
County, a smaller part of the interior of the
Split-Dalmatia County and a greater part of
Dubrovnik -Neretva County) it was high. The
mean monthly Fire Danger Rating was very
high for the southeastern part of Šibenik-
Knin County, for most of Split-Dalmatia
County and for smaller part of Dubrovnik
County (islands of Korčula, Lastovo and
Sušac). These values are slightly above
average compared to the ten-year average
(2003-2012), but significantly lower in
comparison with August 2012, when almost
the entire coastline had a mean monthly Fire
Danger Rating of very high (Figure 4).
Figure 4. Average monthly Fire Danger rating for forest fires for August 2012 and 2013.
7
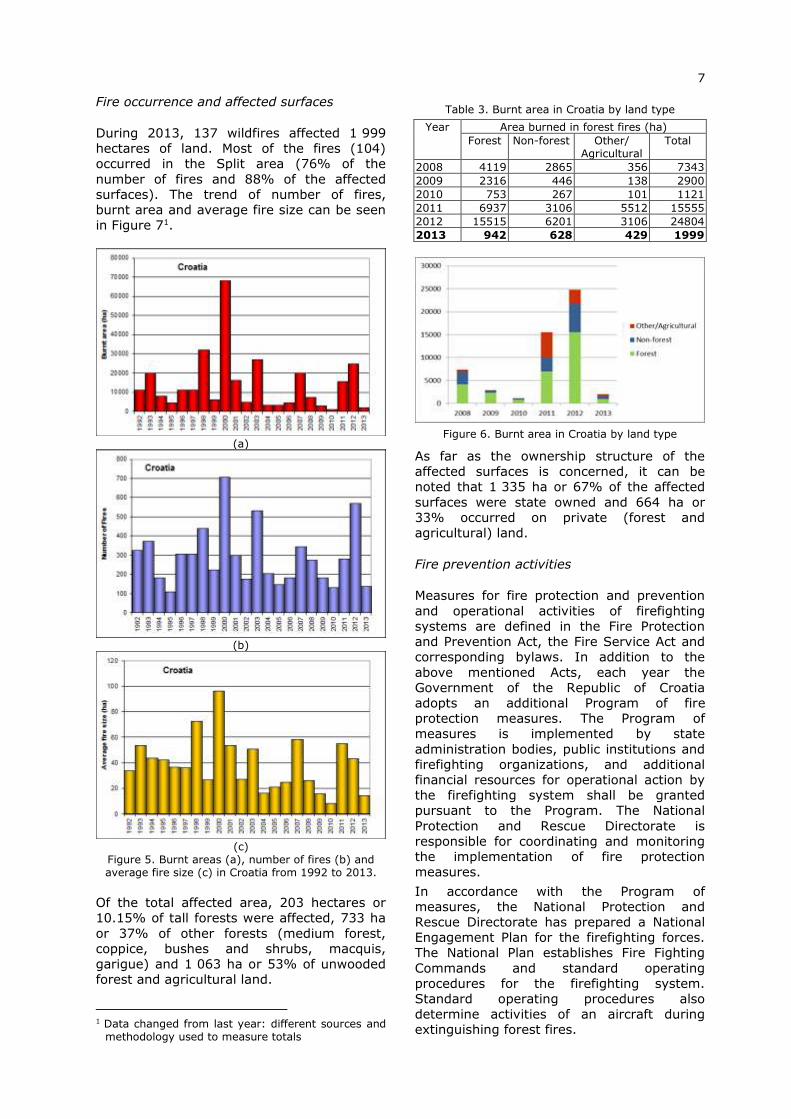
Fire occurrence and affected surfaces
During 2013, 137 wildfires affected 1 999
hectares of land. Most of the fires (104)
occurred in the Split area (76% of the
number of fires and 88% of the affected
surfaces). The trend of number of fires,
burnt area and average fire size can be seen
in Figure 71.
(a)
(b)
(c)
Figure 5. Burnt areas (a), number of fires (b) and average fire size (c) in Croatia from 1992 to 2013.
Of the total affected area, 203 hectares or
10.15% of tall forests were affected, 733 ha
or 37% of other forests (medium forest,
coppice, bushes and shrubs, macquis,
garigue) and 1 063 ha or 53% of unwooded
forest and agricultural land.
1 Data changed from last year: different sources and
methodology used to measure totals
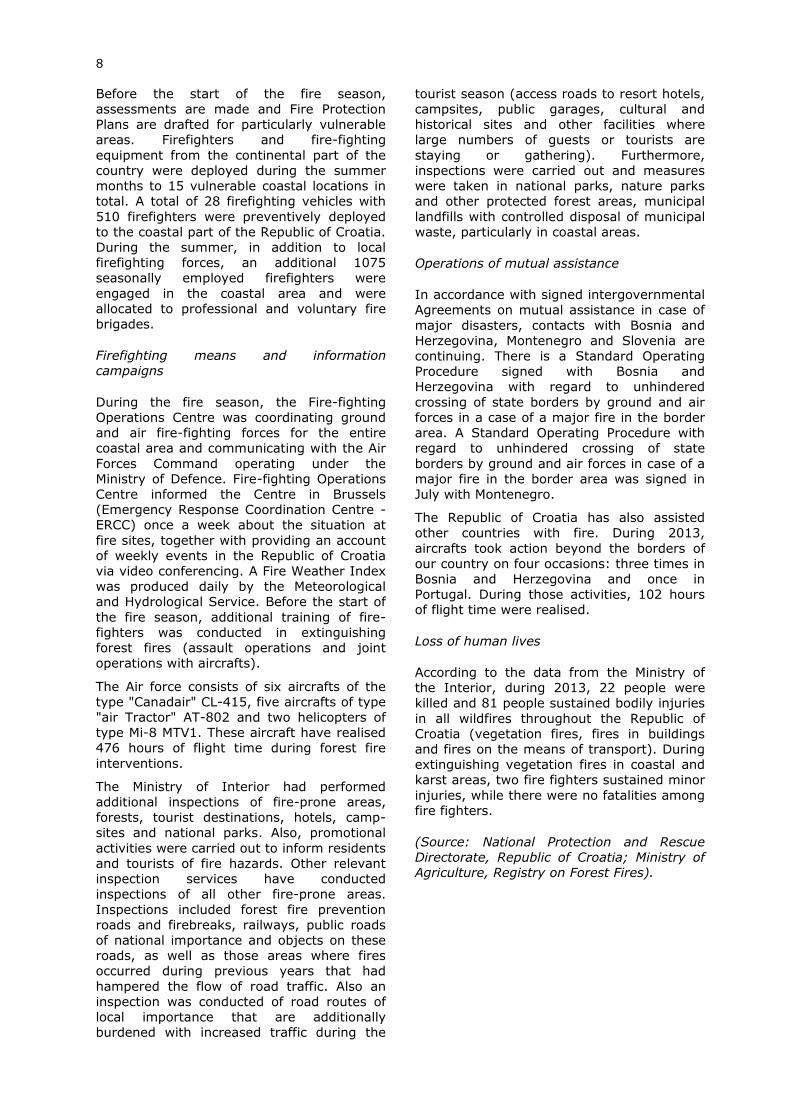
Table 3. Burnt area in Croatia by land type
Year Area burned in forest fires (ha)
Forest Non-forest Other/ Agricultural
Total
2008 4119 2865 356 7343
2009 2316 446 138 2900
2010 753 267 101 1121
2011 6937 3106 5512 15555
2012 15515 6201 3106 24804
2013 942 628 429 1999
Figure 6. Burnt area in Croatia by land type
As far as the ownership structure of the
affected surfaces is concerned, it can be
noted that 1 335 ha or 67% of the affected
surfaces were state owned and 664 ha or
33% occurred on private (forest and
agricultural) land.
Fire prevention activities
Measures for fire protection and prevention
and operational activities of firefighting
systems are defined in the Fire Protection
and Prevention Act, the Fire Service Act and
corresponding bylaws. In addition to the
above mentioned Acts, each year the
Government of the Republic of Croatia
adopts an additional Program of fire
protection measures. The Program of
measures is implemented by state
administration bodies, public institutions and
firefighting organizations, and additional
financial resources for operational action by
the firefighting system shall be granted
pursuant to the Program. The National
Protection and Rescue Directorate is
responsible for coordinating and monitoring
the implementation of fire protection
measures.
In accordance with the Program of
measures, the National Protection and
Rescue Directorate has prepared a National
Engagement Plan for the firefighting forces.
The National Plan establishes Fire Fighting
Commands and standard operating procedures for the firefighting system.
Standard operating procedures also
determine activities of an aircraft during
extinguishing forest fires.
8
Before the start of the fire season,
assessments are made and Fire Protection
Plans are drafted for particularly vulnerable
areas. Firefighters and fire-fighting
equipment from the continental part of the
country were deployed during the summer
months to 15 vulnerable coastal locations in
total. A total of 28 firefighting vehicles with
510 firefighters were preventively deployed
to the coastal part of the Republic of Croatia.
During the summer, in addition to local
firefighting forces, an additional 1075
seasonally employed firefighters were
engaged in the coastal area and were
allocated to professional and voluntary fire
brigades.
Firefighting means and information
campaigns
During the fire season, the Fire-fighting
Operations Centre was coordinating ground
and air fire-fighting forces for the entire
coastal area and communicating with the Air
Forces Command operating under the
Ministry of Defence. Fire-fighting Operations
Centre informed the Centre in Brussels
(Emergency Response Coordination Centre -
ERCC) once a week about the situation at
fire sites, together with providing an account
of weekly events in the Republic of Croatia
via video conferencing. A Fire Weather Index
was produced daily by the Meteorological
and Hydrological Service. Before the start of
the fire season, additional training of fire-
fighters was conducted in extinguishing
forest fires (assault operations and joint
operations with aircrafts).
The Air force consists of six aircrafts of the
type "Canadair" CL-415, five aircrafts of type
"air Tractor" AT-802 and two helicopters of
type Mi-8 MTV1. These aircraft have realised
476 hours of flight time during forest fire
interventions.
The Ministry of Interior had performed
additional inspections of fire-prone areas,
forests, tourist destinations, hotels, camp-
sites and national parks. Also, promotional
activities were carried out to inform residents
and tourists of fire hazards. Other relevant
inspection services have conducted
inspections of all other fire-prone areas.
Inspections included forest fire prevention
roads and firebreaks, railways, public roads
of national importance and objects on these
roads, as well as those areas where fires
occurred during previous years that had
hampered the flow of road traffic. Also an
inspection was conducted of road routes of
local importance that are additionally
burdened with increased traffic during the
tourist season (access roads to resort hotels,
campsites, public garages, cultural and
historical sites and other facilities where
large numbers of guests or tourists are
staying or gathering). Furthermore,
inspections were carried out and measures
were taken in national parks, nature parks
and other protected forest areas, municipal
landfills with controlled disposal of municipal
waste, particularly in coastal areas.
Operations of mutual assistance
In accordance with signed intergovernmental
Agreements on mutual assistance in case of
major disasters, contacts with Bosnia and
Herzegovina, Montenegro and Slovenia are
continuing. There is a Standard Operating
Procedure signed with Bosnia and
Herzegovina with regard to unhindered
crossing of state borders by ground and air
forces in a case of a major fire in the border
area. A Standard Operating Procedure with
regard to unhindered crossing of state
borders by ground and air forces in case of a
major fire in the border area was signed in
July with Montenegro.
The Republic of Croatia has also assisted
other countries with fire. During 2013,
aircrafts took action beyond the borders of
our country on four occasions: three times in
Bosnia and Herzegovina and once in
Portugal. During those activities, 102 hours
of flight time were realised.
Loss of human lives
According to the data from the Ministry of
the Interior, during 2013, 22 people were
killed and 81 people sustained bodily injuries
in all wildfires throughout the Republic of
Croatia (vegetation fires, fires in buildings
and fires on the means of transport). During
extinguishing vegetation fires in coastal and
karst areas, two fire fighters sustained minor
injuries, while there were no fatalities among
fire fighters.
(Source: National Protection and Rescue
Directorate, Republic of Croatia; Ministry of
Agriculture, Registry on Forest Fires).
9
2.2.4 Cyprus
Fire danger in the 2013 fire season
In May the weather was warm and relatively
wet with certain periods giving local rain and
isolated thundery showers. The mean air
temperature was 2.5 ºC above normal and
the average precipitation was 24.7mm
(126% of normal). In many occasions
maximum temperatures exceeded 28 ºC
inland and 20 ºC in the mountains, and the
highest temperatures recorded were 36.2 ºC
and 28.4 ºC respectively.
In June, the mean temperature was
approximately 1.0 ºC above normal and the
average precipitation was zero. Extremely
high temperatures were recorded during the
period 18-25 of the month, when maximum
temperatures were about 2 to 9 ºC above
normal. The highest temperature recorded
was 37.7 ºC inland and 30.4 ºC in the
mountains.
In July, the mean temperature was about
0.5 ºC above normal and the average
precipitation was well below normal (15% of
normal). Unstable weather conditions
prevailed during mid-July giving local rain
and isolated thunderstorms in some areas.
Maximum temperatures exceeded 37 ºC
inland and 28 ºC in mountainous areas.
Regarding extremes, the highest maximum
temperature was 38.4 ºC inland and
30.2 ºC in the mountains.
In August the weather was dry, with zero
precipitation. The mean air temperature was
0.9 ºC above normal and the mean daily
temperatures were around normal during
most of the month. The mean daily
maximum temperature was 38 ºC inland and
28 ºC in the mountains.
During September the weather was relatively
wet and the average precipitation was
7.0mm (156% of normal). Extremely high
temperatures were recorded during
mid-September when maximum and
minimum temperatures were 2 to 8 ºC above
normal, exceeding 34 ºC inland and 24 ºC in
the mountains. The highest maximum
temperature recorded was 39.2 ºC inland
and 32.6 ºC in mountainous areas.
In October the weather was dry. Unstable
weather conditions prevailed during certain
periods of the month, giving local showers
and isolated thunderstorms. The mean air
temperature was 1.0 ºC below normal and the average precipitation was 14.4mm (44%
of normal). Maximum temperatures
exceeded 28 ºC inland and 19 ºC in the
mountains, during most days of the month.
Fire occurrence and affected surfaces
During 2013, both the number of forest fires
as well as the total burnt area showed a
significant increase compared to the
respective figures of the previous years. In
2013, 135 fires occurred, burning a total
area of 2 835 hectares, of which 1 681 ha
was forest and other wooded land. The total
burnt area of almost half of these fires was
smaller than 1 ha. Also, 6 fires with burnt
area greater than 50 ha were recorded.
Major fires in 2013
Choirokitia, Larnaca District. On the 19th
of June 2013, a fire was set probably by
arsonists near Choirokitia village. Due to
the strong winds and the rugged terrain
the fire spread rapidly, burning 1 000
hectares of wild vegetation and
agricultural crops. As a result of this fire,
the nearby highway was closed for hours
due to the thick smoke in the area, and
the residents of the surrounding villages
were moved to safe locations.
Trachypedoula, Paphos District. On the
morning of 21 August 2013 at 02:00
hours, a fire was set probably by arsonists
near Trachypedoula community. The
constant changing of the direction of the
strong winds pushed the fire into areas
difficult to reach. The fire destroyed 812
hectares of other wooded land and
agricultural properties and threatened
homes and farms in the nearby villages.
Fire causes
Most of the forest fires of the year 2013 were
caused accidentally or by negligence, at a
percentage of 67%. Deliberate fires
corresponded to 19% and fires caused by
lightning (natural), corresponded to 4%.
Table 4. Number of forest fires and burnt areas in Cyprus from 2009 to 2013
Year Number of fires
Burned area (ha)
Total
Forest and other
wooded land
Agriculture and other artificial
land
2009 91 885 460 425
2010 133 2 000 1 559 441
2011 85 1 599 1 220 379
2012 78 2 531 2 330 201
2013 135 2 835 1 681 1 154
10
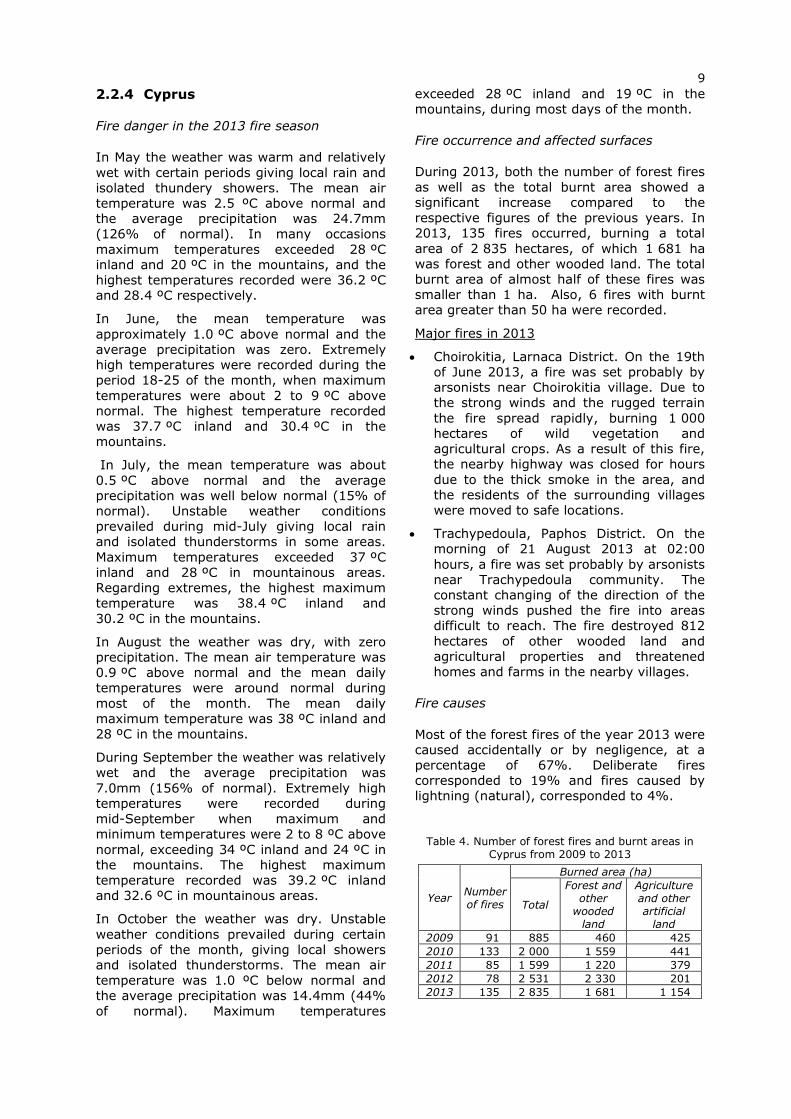
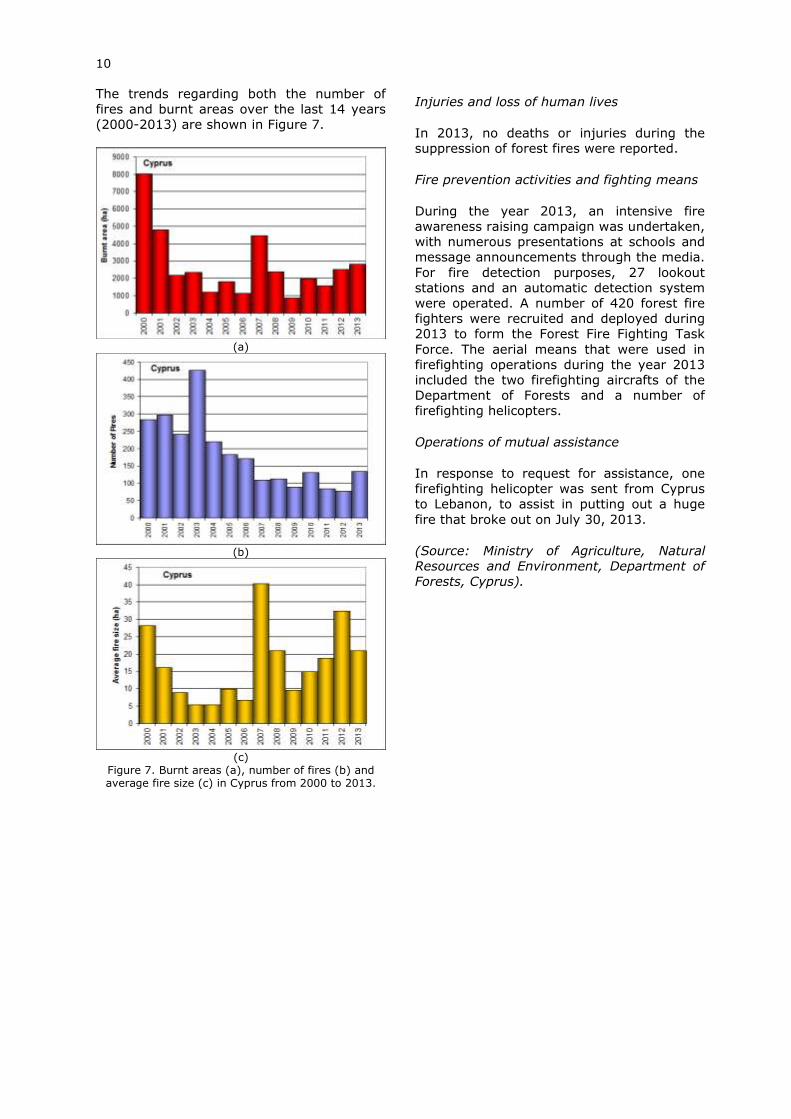
The trends regarding both the number of
fires and burnt areas over the last 14 years
(2000-2013) are shown in Figure 7.
(a)
(b)
(c)
Figure 7. Burnt areas (a), number of fires (b) and average fire size (c) in Cyprus from 2000 to 2013.
Injuries and loss of human lives
In 2013, no deaths or injuries during the
suppression of forest fires were reported.
Fire prevention activities and fighting means
During the year 2013, an intensive fire
awareness raising campaign was undertaken,
with numerous presentations at schools and
message announcements through the media.
For fire detection purposes, 27 lookout
stations and an automatic detection system
were operated. A number of 420 forest fire
fighters were recruited and deployed during
2013 to form the Forest Fire Fighting Task
Force. The aerial means that were used in
firefighting operations during the year 2013
included the two firefighting aircrafts of the
Department of Forests and a number of
firefighting helicopters.
Operations of mutual assistance
In response to request for assistance, one
firefighting helicopter was sent from Cyprus
to Lebanon, to assist in putting out a huge
fire that broke out on July 30, 2013.
(Source: Ministry of Agriculture, Natural
Resources and Environment, Department of
Forests, Cyprus).
11
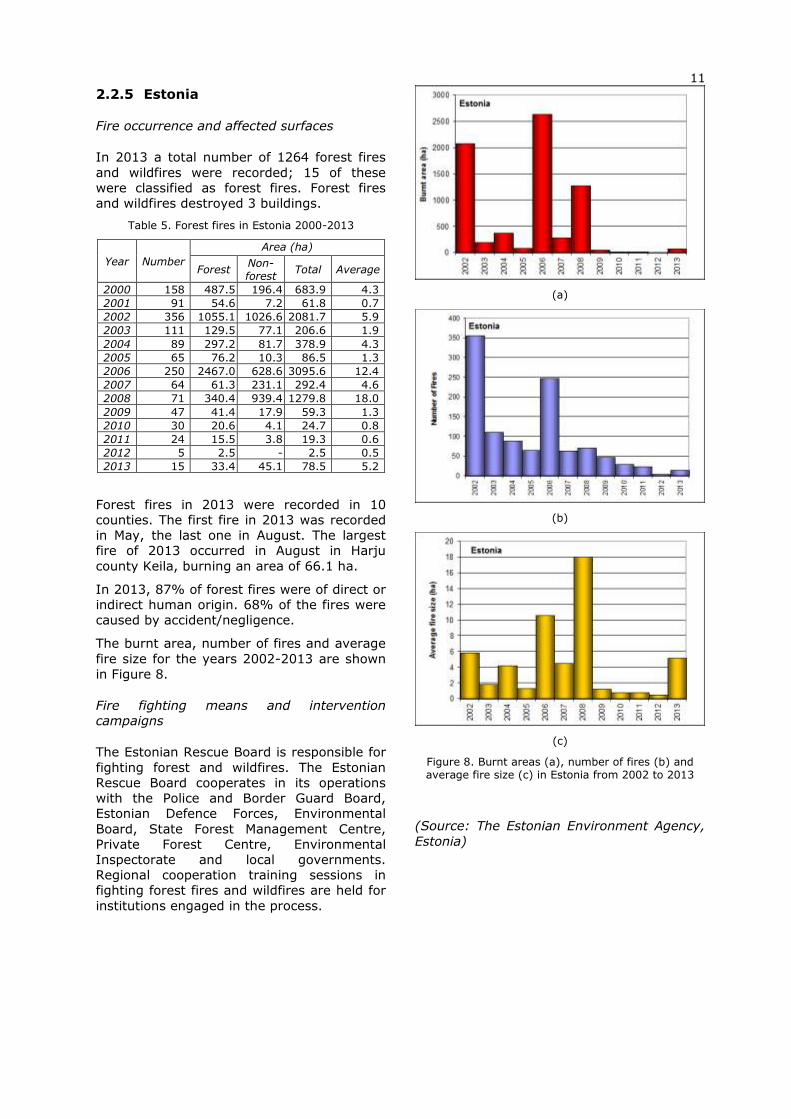
2.2.5 Estonia
Fire occurrence and affected surfaces
In 2013 a total number of 1264 forest fires
and wildfires were recorded; 15 of these
were classified as forest fires. Forest fires
and wildfires destroyed 3 buildings.
Table 5. Forest fires in Estonia 2000-2013
Year Number
Area (ha)
Forest Non-forest
Total Average
2000 158 487.5 196.4 683.9 4.3
2001 91 54.6 7.2 61.8 0.7
2002 356 1055.1 1026.6 2081.7 5.9
2003 111 129.5 77.1 206.6 1.9
2004 89 297.2 81.7 378.9 4.3
2005 65 76.2 10.3 86.5 1.3
2006 250 2467.0 628.6 3095.6 12.4
2007 64 61.3 231.1 292.4 4.6
2008 71 340.4 939.4 1279.8 18.0
2009 47 41.4 17.9 59.3 1.3
2010 30 20.6 4.1 24.7 0.8
2011 24 15.5 3.8 19.3 0.6
2012 5 2.5 - 2.5 0.5
2013 15 33.4 45.1 78.5 5.2
Forest fires in 2013 were recorded in 10
counties. The first fire in 2013 was recorded
in May, the last one in August. The largest
fire of 2013 occurred in August in Harju
county Keila, burning an area of 66.1 ha.
In 2013, 87% of forest fires were of direct or
indirect human origin. 68% of the fires were
caused by accident/negligence.
The burnt area, number of fires and average
fire size for the years 2002-2013 are shown
in Figure 8.
Fire fighting means and intervention
campaigns
The Estonian Rescue Board is responsible for
fighting forest and wildfires. The Estonian
Rescue Board cooperates in its operations
with the Police and Border Guard Board,
Estonian Defence Forces, Environmental
Board, State Forest Management Centre,
Private Forest Centre, Environmental
Inspectorate and local governments.
Regional cooperation training sessions in
fighting forest fires and wildfires are held for
institutions engaged in the process.
(a)
(b)
(c)
Figure 8. Burnt areas (a), number of fires (b) and average fire size (c) in Estonia from 2002 to 2013
(Source: The Estonian Environment Agency,
Estonia)
12
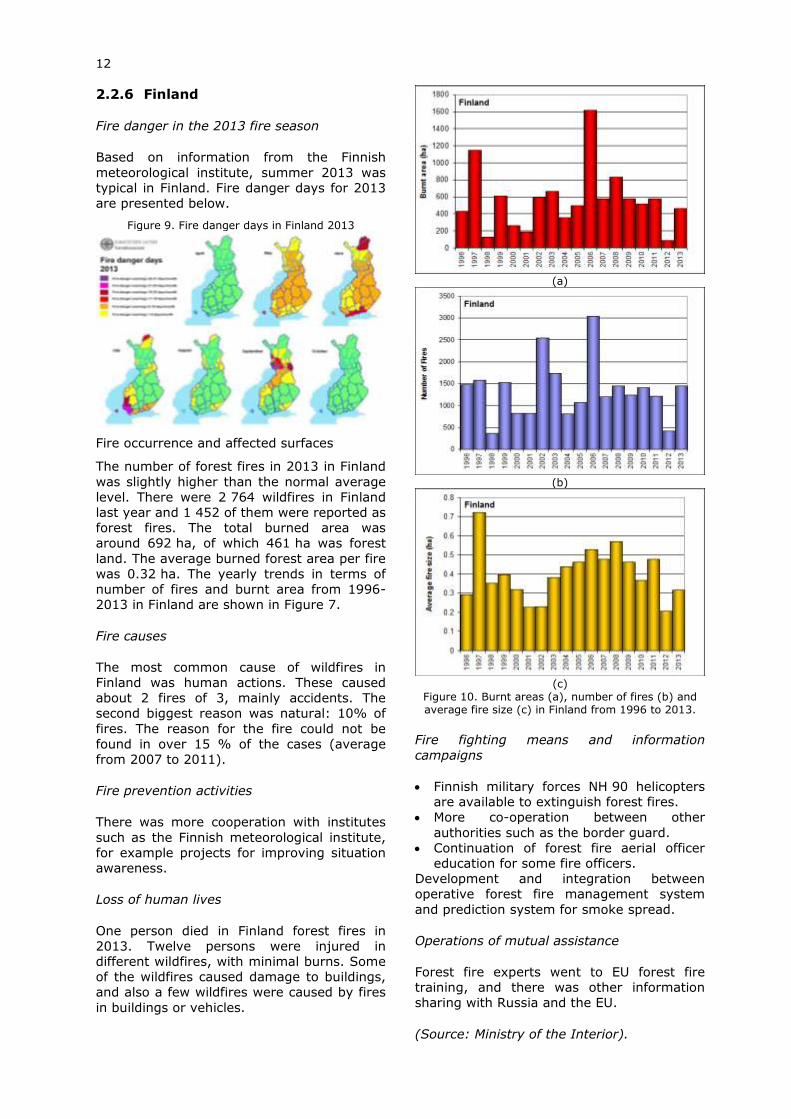
2.2.6 Finland
Fire danger in the 2013 fire season
Based on information from the Finnish
meteorological institute, summer 2013 was
typical in Finland. Fire danger days for 2013
are presented below.
Figure 9. Fire danger days in Finland 2013
Fire occurrence and affected surfaces
The number of forest fires in 2013 in Finland
was slightly higher than the normal average
level. There were 2 764 wildfires in Finland
last year and 1 452 of them were reported as
forest fires. The total burned area was
around 692 ha, of which 461 ha was forest
land. The average burned forest area per fire
was 0.32 ha. The yearly trends in terms of
number of fires and burnt area from 1996-
2013 in Finland are shown in Figure 7.
Fire causes
The most common cause of wildfires in
Finland was human actions. These caused
about 2 fires of 3, mainly accidents. The
second biggest reason was natural: 10% of
fires. The reason for the fire could not be
found in over 15 % of the cases (average
from 2007 to 2011).
Fire prevention activities
There was more cooperation with institutes
such as the Finnish meteorological institute,
for example projects for improving situation
awareness.
Loss of human lives
One person died in Finland forest fires in
2013. Twelve persons were injured in
different wildfires, with minimal burns. Some
of the wildfires caused damage to buildings, and also a few wildfires were caused by fires
in buildings or vehicles.
(a)
(b)
(c)
Figure 10. Burnt areas (a), number of fires (b) and average fire size (c) in Finland from 1996 to 2013.
Fire fighting means and information
campaigns
Finnish military forces NH 90 helicopters
are available to extinguish forest fires.
More co-operation between other
authorities such as the border guard.
Continuation of forest fire aerial officer
education for some fire officers.
Development and integration between
operative forest fire management system
and prediction system for smoke spread.
Operations of mutual assistance
Forest fire experts went to EU forest fire training, and there was other information
sharing with Russia and the EU.
(Source: Ministry of the Interior).
13
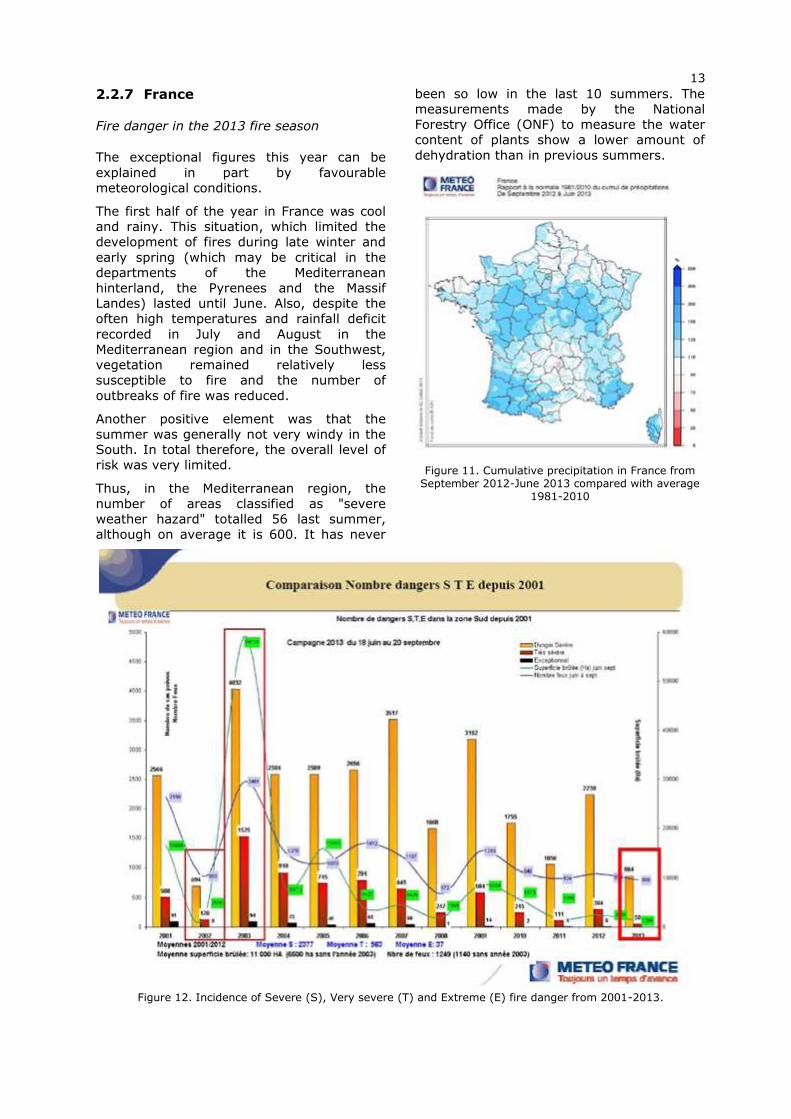
2.2.7 France
Fire danger in the 2013 fire season
The exceptional figures this year can be
explained in part by favourable
meteorological conditions.
The first half of the year in France was cool
and rainy. This situation, which limited the
development of fires during late winter and
early spring (which may be critical in the
departments of the Mediterranean
hinterland, the Pyrenees and the Massif
Landes) lasted until June. Also, despite the
often high temperatures and rainfall deficit
recorded in July and August in the
Mediterranean region and in the Southwest,
vegetation remained relatively less
susceptible to fire and the number of
outbreaks of fire was reduced.
Another positive element was that the
summer was generally not very windy in the
South. In total therefore, the overall level of
risk was very limited.
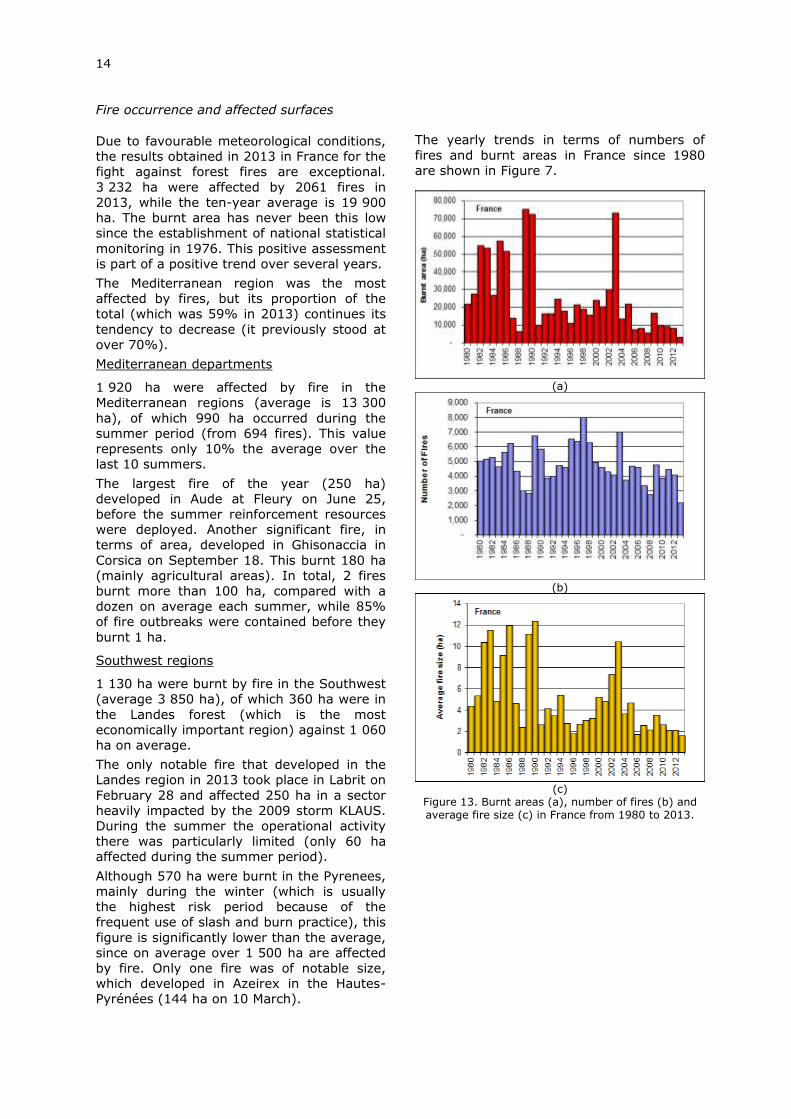
Thus, in the Mediterranean region, the
number of areas classified as "severe
weather hazard" totalled 56 last summer,
although on average it is 600. It has never
been so low in the last 10 summers. The
measurements made by the National
Forestry Office (ONF) to measure the water
content of plants show a lower amount of
dehydration than in previous summers.
Figure 11. Cumulative precipitation in France from September 2012-June 2013 compared with average
1981-2010
Figure 12. Incidence of Severe (S), Very severe (T) and Extreme (E) fire danger from 2001-2013.
14
Fire occurrence and affected surfaces
Due to favourable meteorological conditions,
the results obtained in 2013 in France for the
fight against forest fires are exceptional.
3 232 ha were affected by 2061 fires in
2013, while the ten-year average is 19 900
ha. The burnt area has never been this low
since the establishment of national statistical
monitoring in 1976. This positive assessment
is part of a positive trend over several years.
The Mediterranean region was the most
affected by fires, but its proportion of the
total (which was 59% in 2013) continues its
tendency to decrease (it previously stood at
over 70%).
Mediterranean departments
1 920 ha were affected by fire in the
Mediterranean regions (average is 13 300
ha), of which 990 ha occurred during the
summer period (from 694 fires). This value
represents only 10% the average over the
last 10 summers.
The largest fire of the year (250 ha)
developed in Aude at Fleury on June 25,
before the summer reinforcement resources
were deployed. Another significant fire, in
terms of area, developed in Ghisonaccia in
Corsica on September 18. This burnt 180 ha
(mainly agricultural areas). In total, 2 fires
burnt more than 100 ha, compared with a
dozen on average each summer, while 85%
of fire outbreaks were contained before they
burnt 1 ha.
Southwest regions
1 130 ha were burnt by fire in the Southwest
(average 3 850 ha), of which 360 ha were in
the Landes forest (which is the most
economically important region) against 1 060
ha on average.
The only notable fire that developed in the
Landes region in 2013 took place in Labrit on
February 28 and affected 250 ha in a sector
heavily impacted by the 2009 storm KLAUS.
During the summer the operational activity
there was particularly limited (only 60 ha
affected during the summer period).
Although 570 ha were burnt in the Pyrenees,
mainly during the winter (which is usually
the highest risk period because of the
frequent use of slash and burn practice), this
figure is significantly lower than the average,
since on average over 1 500 ha are affected
by fire. Only one fire was of notable size, which developed in Azeirex in the Hautes-
Pyrénées (144 ha on 10 March).
The yearly trends in terms of numbers of
fires and burnt areas in France since 1980
are shown in Figure 7.
(a)
(b)
(c)
Figure 13. Burnt areas (a), number of fires (b) and average fire size (c) in France from 1980 to 2013.
15
Actions carried out in Réunion (Indian
Ocean)
The Direction Générale de la Sécurité Civile
et de la Gestion des Crises (DGSCGC) also
mobilized reinforcements in the overseas
region of La Réunion, in the Indian Ocean.
After having sent air and ground
reinforcements to this area during major
fires in 2010 and 2011, it prepositioned a
Dash water bomber during the sensitive
period 2013 (October to December) as it did
in 2012.
Damage during the sensitive period in
Reunion was limited, and a total of 324 ha of
various vegetation was burned, including 63
ha of forests, although this year there was
an exceptional drought, prompting the
authorities to bring forward the positioning of
the Dash by a fortnight.
Once in place, the Dash was engaged in
reinforcing the local fire brigade in about
twenty fires.
Fire prevention activities
In addition to the continuation of activities in
2012, in 2013 there was a period of
reflection on the development of the state
strategy and policy for the prevention of
forest fires in the southern zone. This should
lead to a review of governance and a new
definition of priorities for fire prevention by
the end of 2014.
The first generation of plans for protection
of forests against fire (PPFCI) is reaching
expiry and these plans should be renewed.
The overall budget for prevention is
around 150 million euros in subsidies from
local authorities and state together.
In the southern area, the state contributes
about 20M€ of which 10.8M€ is for the
general interest role assigned to the ONF.
Of this, € 1.9 million was spent on patrols.
Maintenance operations involved:
597 water points
15 lookout posts
424 km of track maintenance DFCI
1092 ha maintenance of firebreaks
441 prescribed burns.
Out of the 6193 days of armed patrols, there
were 129 interventions on incipient fires.
In the order of a thousand forest and related
agent communities and the state are
deployed in preventive monitoring.
In terms of communication, the Délégation
à la Protection de la Forêt Méditerranéenne
(DPFM) has published a bimonthly
newsletter since April 2013.
Fire fighting means
To support firefighters funded by local
authorities (numbering 37 000 in the
Mediterranean departments, 7 700 in the
Landes massif), the Ministry of the Interior
deployed reinforcing means which included:
650 military personnel of instruction and
intervention of the civil protection units
(UIISC);
23 water bombers;
3 reconnaissance and coordination
aircraft, including one placed in
operational reserve, and 35 rescue and
command helicopters.
Finally, reserve firefighters from
departmental fire and rescue services
outside the Mediterranean area, strictly
respecting the qualifications and authority of
those personnel running these detachments,
were positioned in different areas of defence.
They could thus supplement the Centre
Oopérationnel de Gestion Interministérielle
des Crises (COGIC) of the Directorate
General of Civil Security and crisis
management, providing local resources in
areas especially threatened by the risk of
fire. A dozen columns were available to be
deployed, although they were not required,
given the conditions.
The effectiveness of the intervention
depends on its ability to act without delay by
applying a strategy of fast attack for
incipient fires based on the forecast
mobilization of resources to combat during
periods of high risk. Ongoing cooperation
with Météo France and the Office National
des Forêts (ONF) makes it possible to have
specifics on the level of foreseeable danger
to anticipate the danger and to be more
reactive in operational response in the event
of a fire.
Thus, in times of high risk, both national and
local resources are mobilized proactively
according to the hazard to act promptly while
the fire is still manageable: the elements of
UIISC are deployed in the most sensitive
forests alongside the local fire fighters, water
bombers provide aerial armed
reconnaissance missions, the military
resources made available under a protocol funded by the Ministry of the Interior provide
patrols alongside local actors (foresters,
16
firefighters, members of community
committees for forest fires).
The activity of the national means, compared
to previous years, was not limited either for
operational prevention (since the measures
within this framework are enabled, especially
with regard to air assets, when the risk is
high) or for supporting local resources
committed to reported fires.
Thus, in the Mediterranean region the
national means were only requested 140
times during the summer (all requests for
assistance having been met), or 20% of fire
starts, whereas they usually intervene in one
third of fires.
- The water bombers BASC spent 1 367
hours of flight operations forest fires (977
hours in control, 390 hours GAAR) whereas
the year average is 3 970 hours (2 570
hours fight, 1 400 hours GAAR);
- Military sections of the civil defence force
conducted 390 field monitoring operations
and intervened in 90 fires, mostly in Corsica;
- It was not necessary to mobilize the
reserve firefighters from other areas of
defence; only some very limited scale
operations were implemented at local level.
The resources set up to strengthen the
protection of Landes region during periods of
severe risks, by prepositioning civil security
air assets in Bordeaux in order to reduce
response time, was only occasionally
activated (9 days of implementation, 1 fire
dealt with by air assets).
Loss of human lives
The measures taken to prevent and fight
against forest fires were effective in
protecting the population, since there were
no casualties among its members, and
damage to infrastructure (residential
buildings...) was limited.
Operations of mutual assistance
The favourable conditions made it possible to
respond positively to the request for
assistance made by the Portuguese
authorities during the period of intense
activity that they faced at the end of August
and early September.
1 reconnaissance aircraft and 2 Canadair
(complemented by a third) were made
available from August 22 to September 4.
The water bombers conducted 259 hours of
flight during forty interventions, providing
more than 1100 drops, and the
reconnaissance aircraft allowed the local
national authorities to set priorities and
prepare missions with 34 hours of flight.
(Source: Ministère de l’Intérieur – DGSCGC /
SDPGC / BERR; Ministère de l'Agriculture et
de l'Agroalimentaire : DGPAAT / SFRC /
SDFB / BFTC, France).
17
2.2.8 FYROM
The Republic of Macedonia covers a total
area of 25 713 km2, with 997 000 ha of
forest land and 1 244 000 ha of agricultural
land. As a result of very specific natural and
geographical features there are two climatic
types that collide in Republic of Macedonia:
Mediterranean and Continental, which results
in cold and severe winters and hot and dry
summers. The annual average air
temperature is 11.3 degrees Celsius with
average precipitation of 983.7 mm/m2 and
average sunshine period of 2450 hours per
year.
Fire danger in the 2013 fire season
The fire danger in the 2013 season in
Macedonia was at a minimum level. The
majority of fires occurred in the late spring
and during the summer months.
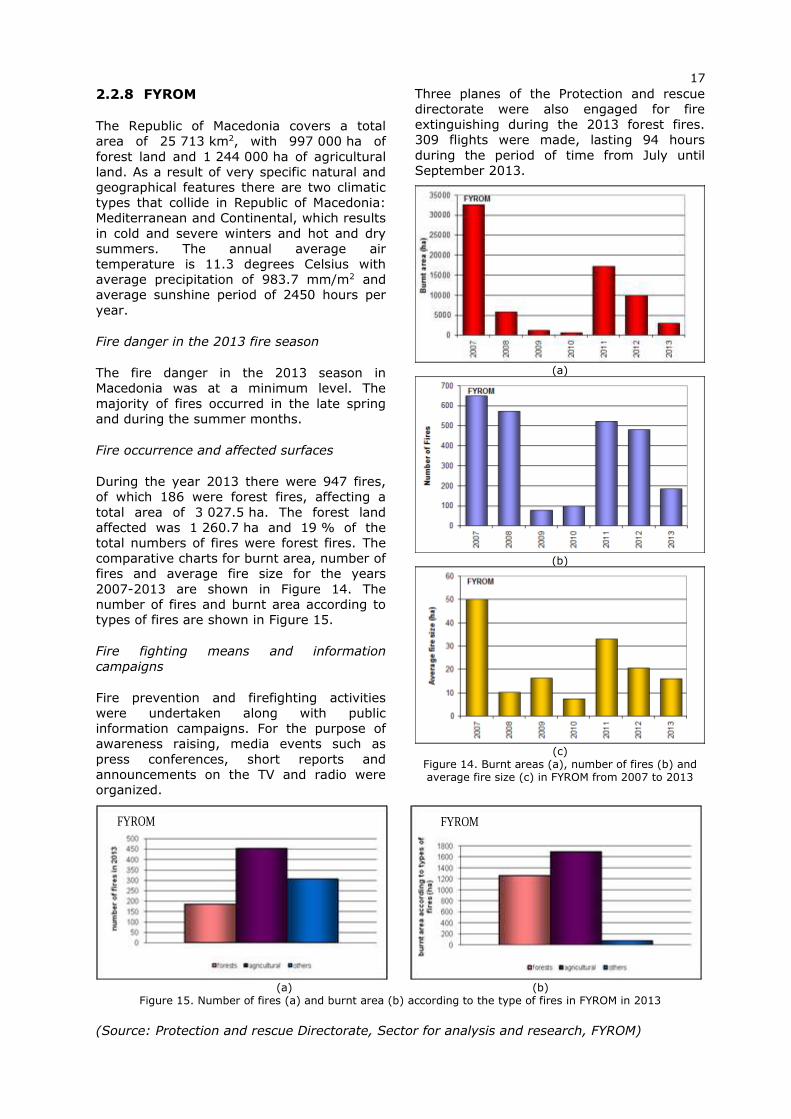
Fire occurrence and affected surfaces
During the year 2013 there were 947 fires,
of which 186 were forest fires, affecting a
total area of 3 027.5 ha. The forest land
affected was 1 260.7 ha and 19 % of the
total numbers of fires were forest fires. The
comparative charts for burnt area, number of
fires and average fire size for the years
2007-2013 are shown in Figure 14. The
number of fires and burnt area according to
types of fires are shown in Figure 15.
Fire fighting means and information
campaigns
Fire prevention and firefighting activities
were undertaken along with public
information campaigns. For the purpose of
awareness raising, media events such as
press conferences, short reports and
announcements on the TV and radio were
organized.
Three planes of the Protection and rescue
directorate were also engaged for fire
extinguishing during the 2013 forest fires.
309 flights were made, lasting 94 hours
during the period of time from July until
September 2013.
(a)
(b)
(c)
Figure 14. Burnt areas (a), number of fires (b) and average fire size (c) in FYROM from 2007 to 2013
(a) (b)
Figure 15. Number of fires (a) and burnt area (b) according to the type of fires in FYROM in 2013
(Source: Protection and rescue Directorate, Sector for analysis and research, FYROM)
FYROM FYROM
18
2.2.9 Germany
Fire occurrence and affected surfaces
A total of 515 forest fires were reported in
Germany in 2013, corresponding to a burnt
area of 198.7 ha (37.1 ha in deciduous
forests and 161.6 ha in coniferous forests).
This represents a fall in both the number of
fires and the burnt area as compared with
recent years.
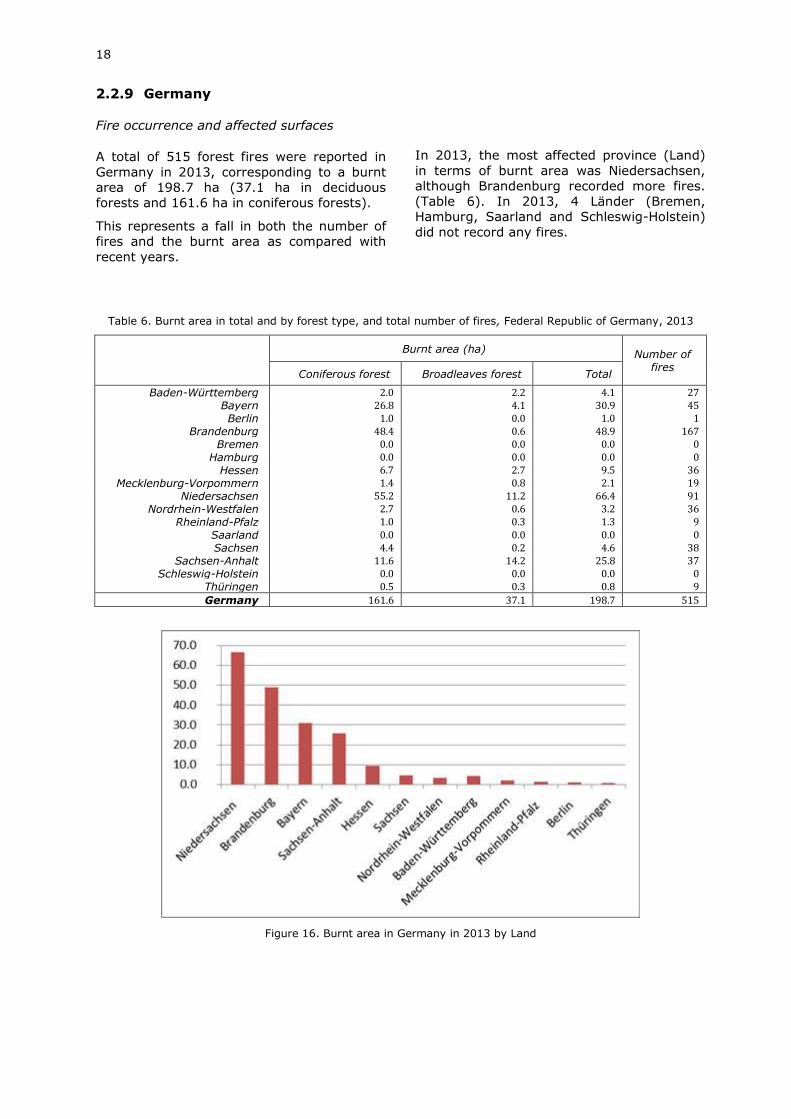
In 2013, the most affected province (Land)
in terms of burnt area was Niedersachsen,
although Brandenburg recorded more fires.
(Table 6). In 2013, 4 Länder (Bremen,
Hamburg, Saarland and Schleswig-Holstein)
did not record any fires.
Table 6. Burnt area in total and by forest type, and total number of fires, Federal Republic of Germany, 2013
Burnt area (ha)
Number of fires
Coniferous forest Broadleaves forest Total
Baden-Württemberg 2.0 2.2 4.1 27 Bayern 26.8 4.1 30.9 45 Berlin 1.0 0.0 1.0 1
Brandenburg 48.4 0.6 48.9 167 Bremen 0.0 0.0 0.0 0
Hamburg 0.0 0.0 0.0 0
Hessen 6.7 2.7 9.5 36
Mecklenburg-Vorpommern 1.4 0.8 2.1 19
Niedersachsen 55.2 11.2 66.4 91
Nordrhein-Westfalen 2.7 0.6 3.2 36
Rheinland-Pfalz 1.0 0.3 1.3 9
Saarland 0.0 0.0 0.0 0 Sachsen 4.4 0.2 4.6 38
Sachsen-Anhalt 11.6 14.2 25.8 37 Schleswig-Holstein 0.0 0.0 0.0 0
Thüringen 0.5 0.3 0.8 9
Germany 161.6 37.1 198.7 515
Figure 16. Burnt area in Germany in 2013 by Land
19
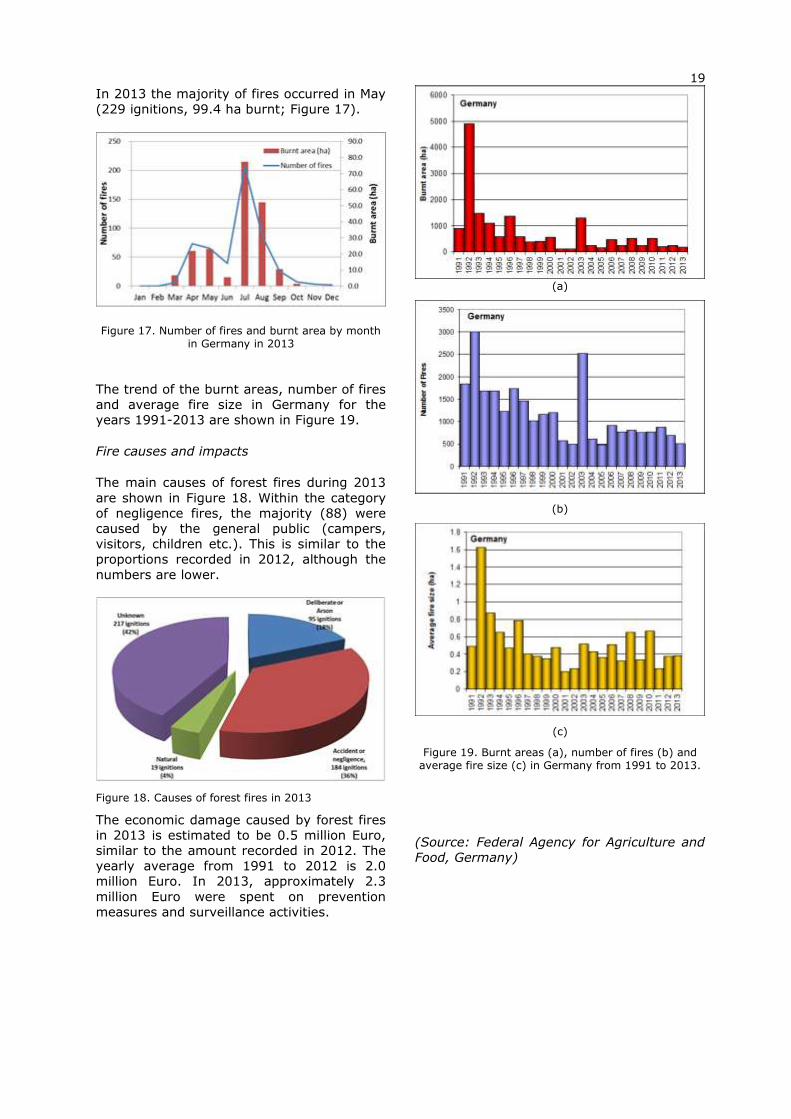
In 2013 the majority of fires occurred in May
(229 ignitions, 99.4 ha burnt; Figure 17).
Figure 17. Number of fires and burnt area by month in Germany in 2013
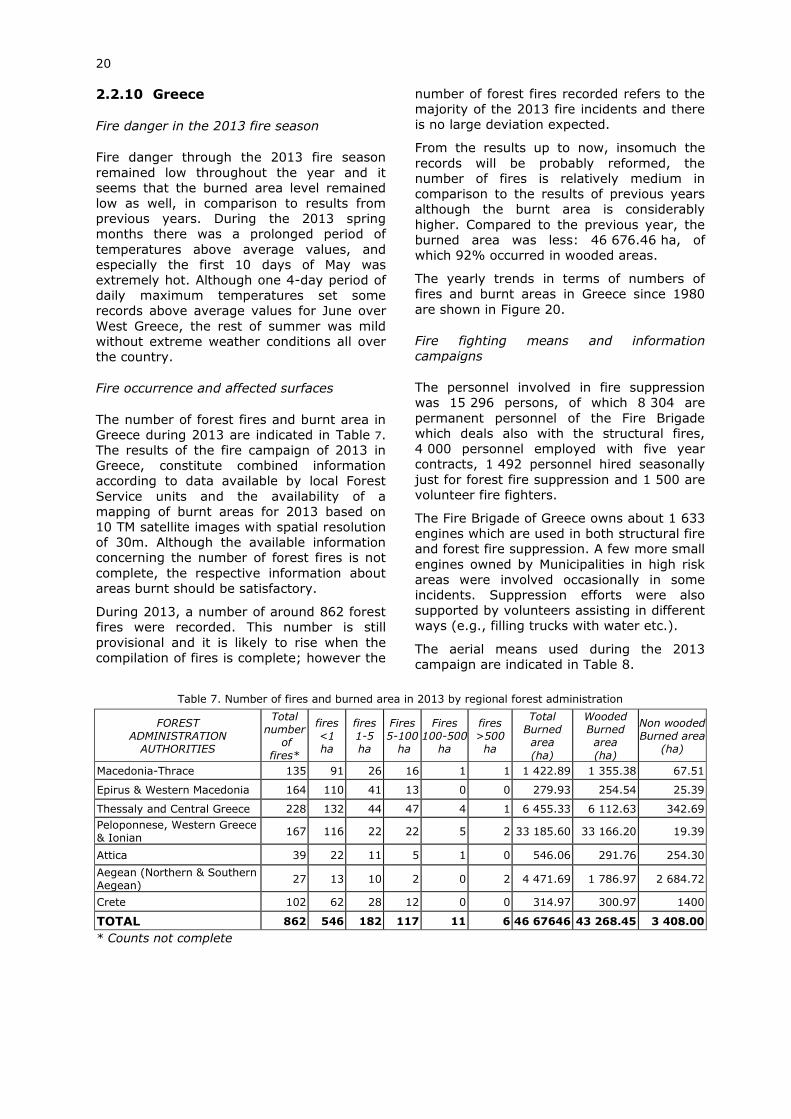
The trend of the burnt areas, number of fires
and average fire size in Germany for the
years 1991-2013 are shown in Figure 19.
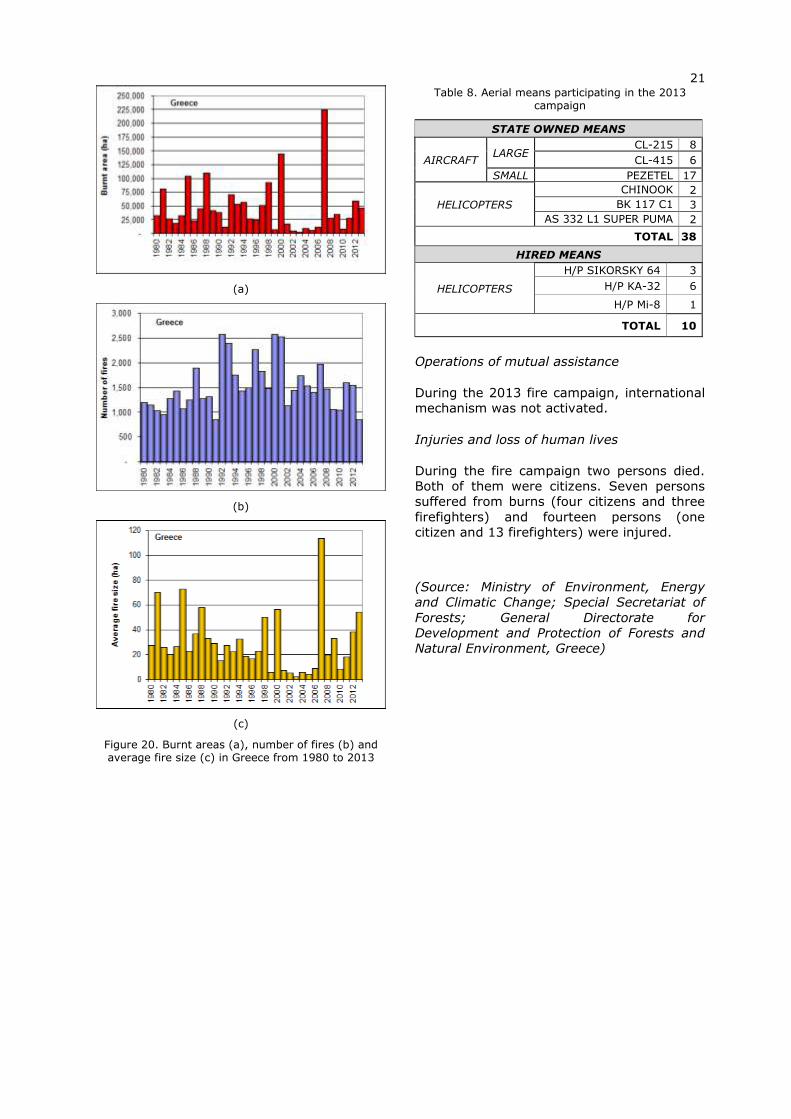
Fire causes and impacts
The main causes of forest fires during 2013
are shown in Figure 18. Within the category
of negligence fires, the majority (88) were
caused by the general public (campers,
visitors, children etc.). This is similar to the
proportions recorded in 2012, although the
numbers are lower.
Figure 18. Causes of forest fires in 2013
The economic damage caused by forest fires
in 2013 is estimated to be 0.5 million Euro,
similar to the amount recorded in 2012. The
yearly average from 1991 to 2012 is 2.0
million Euro. In 2013, approximately 2.3
million Euro were spent on prevention
measures and surveillance activities.
(a)
(b)
(c)
Figure 19. Burnt areas (a), number of fires (b) and average fire size (c) in Germany from 1991 to 2013.
(Source: Federal Agency for Agriculture and
Food, Germany)
20
2.2.10 Greece
Fire danger in the 2013 fire season
Fire danger through the 2013 fire season
remained low throughout the year and it
seems that the burned area level remained
low as well, in comparison to results from
previous years. During the 2013 spring
months there was a prolonged period of
temperatures above average values, and
especially the first 10 days of May was
extremely hot. Although one 4-day period of
daily maximum temperatures set some
records above average values for June over
West Greece, the rest of summer was mild
without extreme weather conditions all over
the country.
Fire occurrence and affected surfaces
The number of forest fires and burnt area in
Greece during 2013 are indicated in Table 7.
The results of the fire campaign of 2013 in
Greece, constitute combined information
according to data available by local Forest
Service units and the availability of a
mapping of burnt areas for 2013 based on
10 TM satellite images with spatial resolution
of 30m. Although the available information
concerning the number of forest fires is not
complete, the respective information about
areas burnt should be satisfactory.
During 2013, a number of around 862 forest
fires were recorded. This number is still
provisional and it is likely to rise when the
compilation of fires is complete; however the
number of forest fires recorded refers to the
majority of the 2013 fire incidents and there
is no large deviation expected.
From the results up to now, insomuch the
records will be probably reformed, the
number of fires is relatively medium in
comparison to the results of previous years
although the burnt area is considerably
higher. Compared to the previous year, the
burned area was less: 46 676.46 ha, of
which 92% occurred in wooded areas.
The yearly trends in terms of numbers of
fires and burnt areas in Greece since 1980
are shown in Figure 20.
Fire fighting means and information
campaigns
The personnel involved in fire suppression
was 15 296 persons, of which 8 304 are
permanent personnel of the Fire Brigade
which deals also with the structural fires,
4 000 personnel employed with five year
contracts, 1 492 personnel hired seasonally
just for forest fire suppression and 1 500 are
volunteer fire fighters.
The Fire Brigade of Greece owns about 1 633
engines which are used in both structural fire
and forest fire suppression. A few more small
engines owned by Municipalities in high risk
areas were involved occasionally in some
incidents. Suppression efforts were also
supported by volunteers assisting in different
ways (e.g., filling trucks with water etc.).
The aerial means used during the 2013
campaign are indicated in Table 8.
Table 7. Number of fires and burned area in 2013 by regional forest administration
FOREST ADMINISTRATION
AUTHORITIES
Total number
of
fires*
fires <1 ha
fires 1-5 ha
Fires 5-100 ha
Fires 100-500
ha
fires >500
ha
Total Burned area
(ha)
Wooded Burned area
(ha)
Non wooded Burned area
(ha)
Macedonia-Thrace 135 91 26 16 1 1 1 422.89 1 355.38 67.51
Epirus & Western Macedonia 164 110 41 13 0 0 279.93 254.54 25.39
Thessaly and Central Greece 228 132 44 47 4 1 6 455.33 6 112.63 342.69
Peloponnese, Western Greece & Ionian
167 116 22 22 5 2 33 185.60 33 166.20 19.39
Attica 39 22 11 5 1 0 546.06 291.76 254.30
Aegean (Northern & Southern Aegean)
27 13 10 2 0 2 4 471.69 1 786.97 2 684.72
Crete 102 62 28 12 0 0 314.97 300.97 1400
TOTAL 862 546 182 117 11 6 46 67646 43 268.45 3 408.00
* Counts not complete
21
(a)
(b)
(c)
Figure 20. Burnt areas (a), number of fires (b) and average fire size (c) in Greece from 1980 to 2013
Table 8. Aerial means participating in the 2013 campaign
STATE OWNED MEANS
AIRCRAFT LARGE
CL-215 8
CL-415 6
SMALL PEZETEL 17
HELICOPTERS
CHINOOK 2
BK 117 C1 3
AS 332 L1 SUPER PUMA 2
TOTAL 38
HIRED MEANS
HELICOPTERS
H/P SIKORSKY 64 3
H/P KA-32 6
H/P Mi-8 1
TOTAL 10
Operations of mutual assistance
During the 2013 fire campaign, international
mechanism was not activated.
Injuries and loss of human lives
During the fire campaign two persons died.
Both of them were citizens. Seven persons
suffered from burns (four citizens and three
firefighters) and fourteen persons (one
citizen and 13 firefighters) were injured.
(Source: Ministry of Environment, Energy
and Climatic Change; Special Secretariat of
Forests; General Directorate for
Development and Protection of Forests and
Natural Environment, Greece)
22
2.2.11 Hungary
Fire danger in the 2013 fire season
FWI derived data and values were reported
throughout the whole fire season by the
Forestry Directorate (FD). FD has been using
JRC’s data service to monitor the daily fire
danger situation.
Forest fire hazard strongly depends on
weather conditions. There were some
extreme weather situations in 2013. The first
five months of 2013 were characterised with
lots of rain. From June a drought period
started, which lasted throughout the summer
until the end of August. Both extreme
weather conditions influenced the whole fire
season and fire situation.
Fire danger started to rise in June but did not
reach the “very high" level last year. There
were some short periods (days) when the
FWI values reached the “extreme” level in
summer, so regional fire bans were ordered
nine times by the Forestry Directorates.
Fire occurrence and affected surfaces
Forest fire data are collected in cooperation
with the disaster management authority.
Data collected on the spot by fire fighters are
uploaded to the database weekly, and if
needed it can be done day-to-day. Forest fire
data are prepared and analysed with an
automated GIS method and checked on the
spot by the forest authority.
The gathered fire data are processed and
evaluated by size, date, cause, duration of
fires, and they are then compared with
traditions in forest management processes
and the behaviour of visitors and hikers in
the forest land area. Data from 2007 are
shown in Table 9.
Table 9. Number of fires and burnt areas
Year Total number
of wildfires
Forest fires Other land types
Number Burned area (ha)
Number
2007 6691 603 4636 6088
2008 6639 502 2404 6137
2009 8658 608 6463 8050
2010 3120 109 878 3011
2011* 8436 2021 8.055 6415
2012* 21581 2657 13978 18924
2013* 4602 761 1955 3841
*From 2011 Fire Database linking between Forestry Directorate and Fire Service
A total of 761 forest fires were reported with
a total burnt area of 1 955 ha in 2013. The
number of fires and the total burnt area were
lower compared to the previous two years,
can be seen in Table 9. The reasons can be
found in climate extremes, agricultural and
forest management methods and especially
socio-economic circumstances.
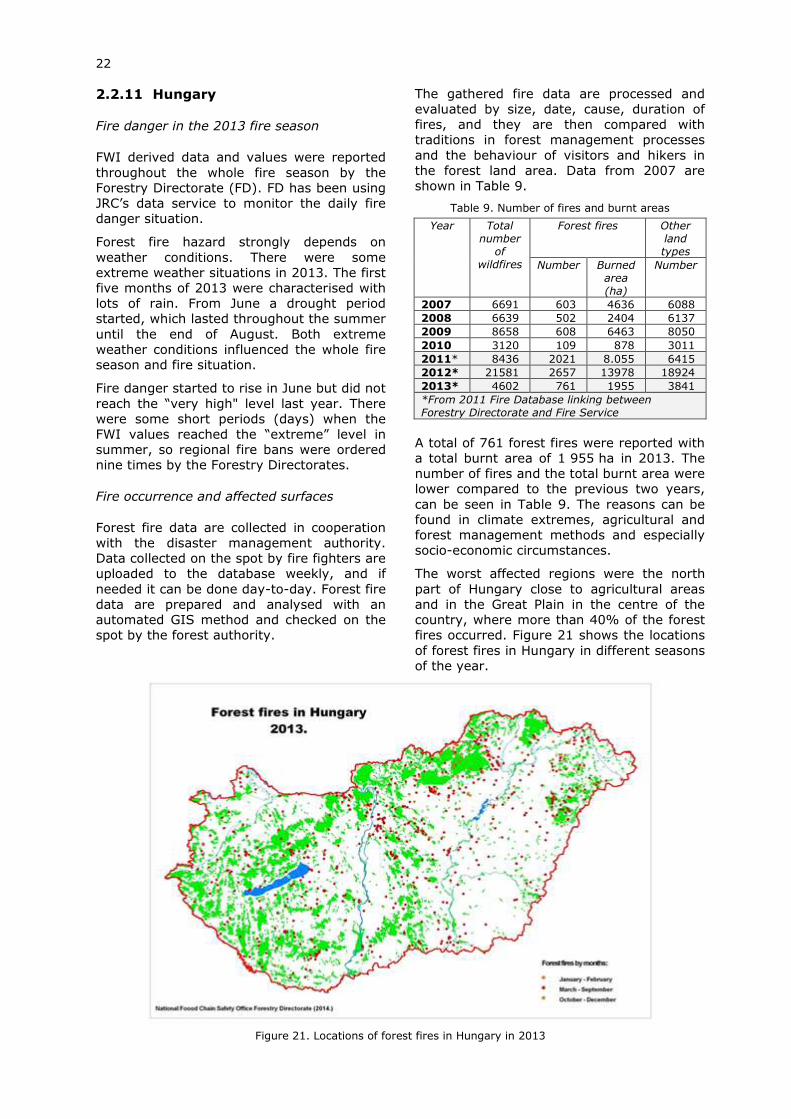
The worst affected regions were the north
part of Hungary close to agricultural areas
and in the Great Plain in the centre of the
country, where more than 40% of the forest
fires occurred. Figure 21 shows the locations
of forest fires in Hungary in different seasons
of the year.
Figure 21. Locations of forest fires in Hungary in 2013
23
98% of forest fires are surface fires, as
shown in Table 10. Surface fires, when
surface litter and other dead vegetal parts
and smaller shrubs burn, have been common
in Hungarian forests. They can develop at
any time over the whole fire season. Canopy
fires mostly develop in coniferous forests in
the summer period. Ground fires are not
significant in Hungary.
Table 10. Fires in Hungary 2013 by fire type
Type of forest fire
Number of fires
Total burnt area (ha)
Ground fires 10 3
Surface fires 748 1937
Crown fires 3 15
Total 761 1955
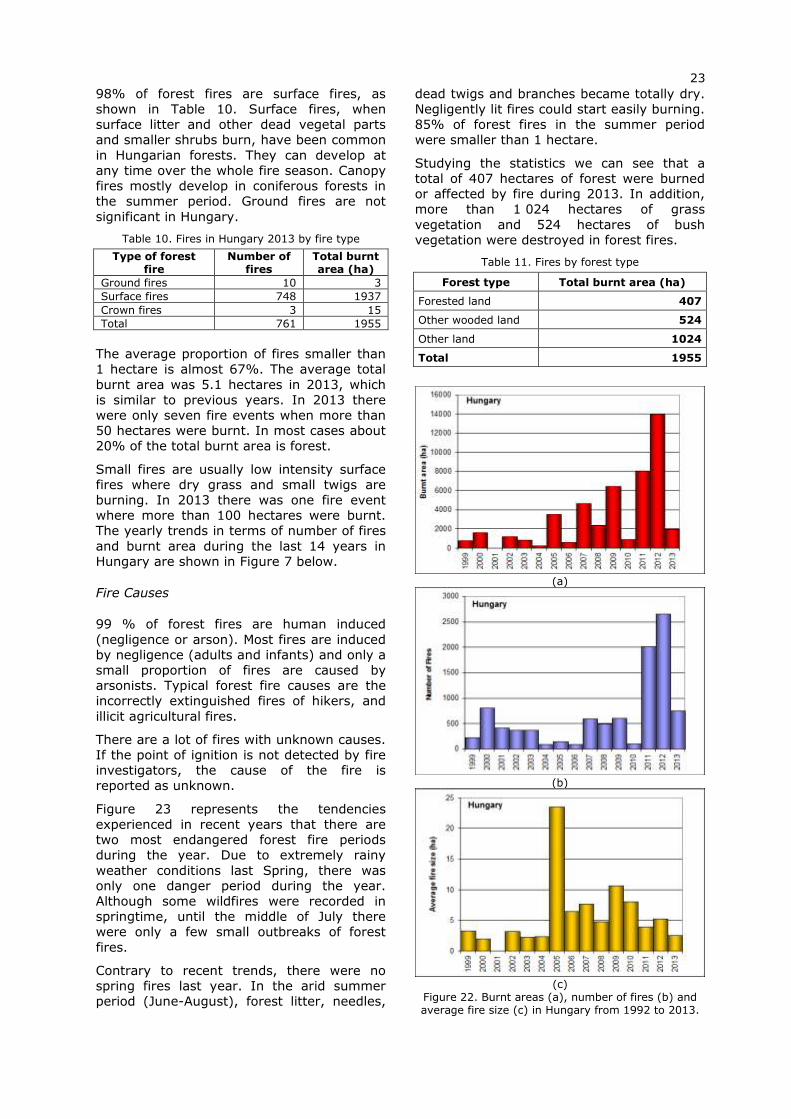
The average proportion of fires smaller than
1 hectare is almost 67%. The average total
burnt area was 5.1 hectares in 2013, which
is similar to previous years. In 2013 there
were only seven fire events when more than
50 hectares were burnt. In most cases about
20% of the total burnt area is forest.
Small fires are usually low intensity surface
fires where dry grass and small twigs are
burning. In 2013 there was one fire event
where more than 100 hectares were burnt.
The yearly trends in terms of number of fires
and burnt area during the last 14 years in
Hungary are shown in Figure 7 below.
Fire Causes
99 % of forest fires are human induced
(negligence or arson). Most fires are induced
by negligence (adults and infants) and only a
small proportion of fires are caused by
arsonists. Typical forest fire causes are the
incorrectly extinguished fires of hikers, and
illicit agricultural fires.
There are a lot of fires with unknown causes.
If the point of ignition is not detected by fire
investigators, the cause of the fire is
reported as unknown.
Figure 23 represents the tendencies
experienced in recent years that there are
two most endangered forest fire periods
during the year. Due to extremely rainy
weather conditions last Spring, there was
only one danger period during the year.
Although some wildfires were recorded in
springtime, until the middle of July there
were only a few small outbreaks of forest
fires.
Contrary to recent trends, there were no spring fires last year. In the arid summer
period (June-August), forest litter, needles,
dead twigs and branches became totally dry.
Negligently lit fires could start easily burning.
85% of forest fires in the summer period
were smaller than 1 hectare.
Studying the statistics we can see that a
total of 407 hectares of forest were burned
or affected by fire during 2013. In addition,
more than 1 024 hectares of grass
vegetation and 524 hectares of bush
vegetation were destroyed in forest fires.
Table 11. Fires by forest type
Forest type Total burnt area (ha)
Forested land 407
Other wooded land 524
Other land 1024
Total 1955
(a)
(b)
(c)
Figure 22. Burnt areas (a), number of fires (b) and average fire size (c) in Hungary from 1992 to 2013.
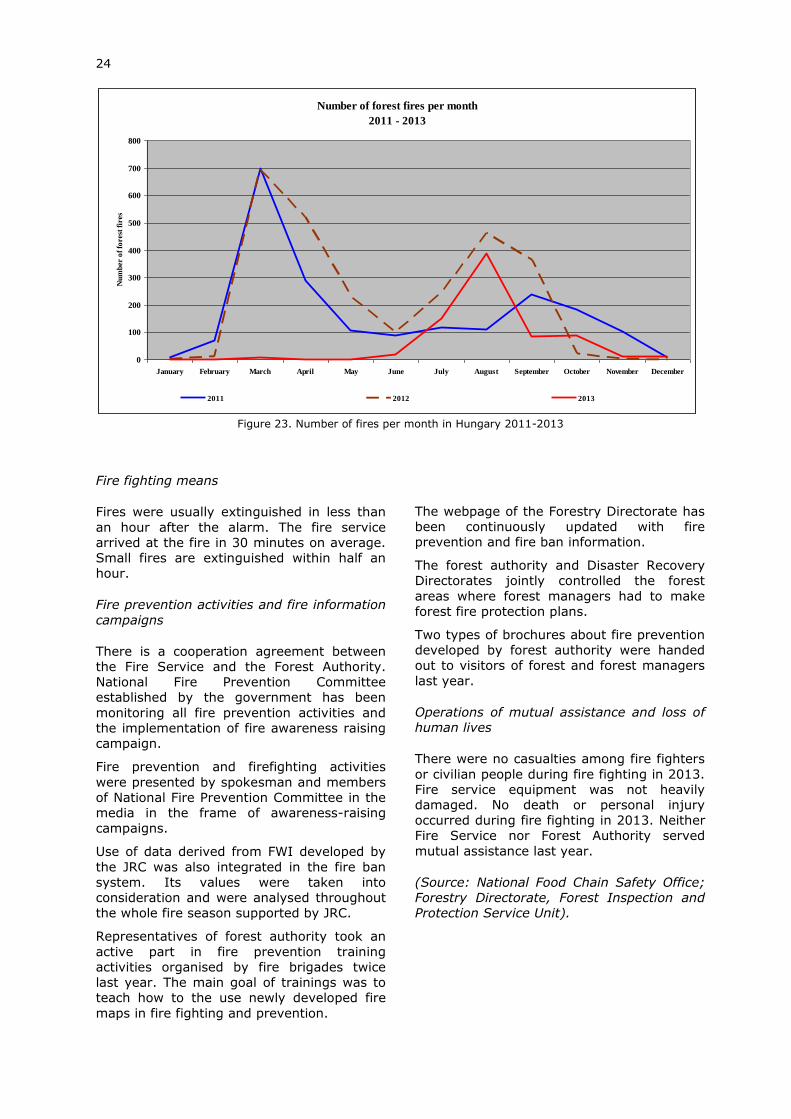
24
Figure 23. Number of fires per month in Hungary 2011-2013
Fire fighting means
Fires were usually extinguished in less than
an hour after the alarm. The fire service
arrived at the fire in 30 minutes on average.
Small fires are extinguished within half an
hour.
Fire prevention activities and fire information
campaigns
There is a cooperation agreement between
the Fire Service and the Forest Authority.
National Fire Prevention Committee
established by the government has been
monitoring all fire prevention activities and
the implementation of fire awareness raising
campaign.
Fire prevention and firefighting activities
were presented by spokesman and members
of National Fire Prevention Committee in the
media in the frame of awareness-raising
campaigns.
Use of data derived from FWI developed by
the JRC was also integrated in the fire ban
system. Its values were taken into
consideration and were analysed throughout
the whole fire season supported by JRC.
Representatives of forest authority took an
active part in fire prevention training
activities organised by fire brigades twice last year. The main goal of trainings was to
teach how to the use newly developed fire
maps in fire fighting and prevention.
The webpage of the Forestry Directorate has
been continuously updated with fire
prevention and fire ban information.
The forest authority and Disaster Recovery
Directorates jointly controlled the forest
areas where forest managers had to make
forest fire protection plans.
Two types of brochures about fire prevention
developed by forest authority were handed
out to visitors of forest and forest managers
last year.
Operations of mutual assistance and loss of
human lives
There were no casualties among fire fighters
or civilian people during fire fighting in 2013.
Fire service equipment was not heavily
damaged. No death or personal injury
occurred during fire fighting in 2013. Neither
Fire Service nor Forest Authority served
mutual assistance last year.
(Source: National Food Chain Safety Office;
Forestry Directorate, Forest Inspection and
Protection Service Unit).
Number of forest fires per month
2011 - 2013
0
100
200
300
400
500
600
700
800
January February March April May June July August September October November December
Nu
mb
er o
f fo
rest
fir
es
2011 2012 2013
25
2.2.12 Ireland
Introduction
Fire presents a significant threat to forest
resources in Ireland. While the recent focus
since 2010/2011 has been on destruction of
forest resources, there is now also a much
clearer understanding of the impact of
wildfire on other critical resources and
ecosystem services, most notably upland
habitats, water quality and carbon
management.
Fire incidence levels
During 2013, over 10 000ha of open land is
known to have been affected by fire.
8 900ha of burned land was detected by the
European Commission, using MODIS
imagery. Of this area, 75% was located
within Natura 2000 designated lands, mainly
in Co. Mayo, in the North-West of Ireland.
The area affected is predominantly Low-level
Atlantic blanket peat. Given the low level of
fire detection by MODIS in Ireland, it is
contended that the actual area affected by
fire is significantly greater than the area
detected, and may be as high as 15 000ha
for 2013, predominantly open non-forest
land.
Strong dry easterly conditions in early April
created Ideal conditions for fire development
and spread and problems with fire were
experienced in all western counties,
particularly Clare, Galway and Mayo. The
main fire danger period occurred during the
first week in April, and significant fire activity
was recorded in Western counties.
Two fires in Co. Mayo, at over 2 000ha each,
were among the largest fires detected in
Europe during 2013.
Financial losses attributable to fire
Financial costs of these fires are significant.
Coillte (State Forestry Board) losses are
known to be 215ha. Private Sector losses are
estimated to be in the region of 300ha, with
most losses reported in counties Clare and
Mayo. Total reconstitution costs for 515ha
would be in the region of €1.8 million. Fire
Service mobilisations were in the region of
2 400 units and at this level, fire suppression
costs, including Coillte/NPWS/BNM costs,
could be in the region of €3 million. Coillte
firefighting crews backed by aircraft generated significant costs that are borne by
the company.
What cannot be measured in financial terms
is the disruption to normal fire service
operation, and the diversion of emergency
services resources away from their main task
of saving lives in the community. A number
of homes were also threatened during the
incidents, and the fires featured on local and
national media.
Fire prevention activities
In terms of wildfire management, DAFM
Forest Service has been to the fore in
developing appropriate prevention and
mitigation responses and specialised
technical capacity in Ireland. DAFM Forest
Service personnel have been heavily
involved in the development of Wildfire
Interagency Groups and local level
partnerships in fire prone counties, with pilot
groups operating in Cork, Kerry, Clare and
Laois. These groups permit coordination and
the sharing of data and information for fire
prevention and mitigation activities at local
level, and to permit better targeted fire
prevention and enforcement measures on
the ground.
DAFM also coordinates fire prevention
planning and awareness measures, and
issues guidance to the relevant sectors
affected. During 2013 DAFM issued five Fire
warning circulars to the Forestry Sector.
These specify the level of risk projected and
the type of actions required by forest owners
and managers to mitigate this risk. Two
Ministerial press releases were also issued to
the general media during periods of very
high or extreme risk. Forest fire prevention
promotional materials and personnel were
also available at the Irish Forestry Show and
National Ploughing Championships, the
largest agricultural event of its type in
Europe. A significant advertising and editorial
campaign was also mounted within the
agricultural and forestry media sector.
Irish Fire Authories have been forging strong
links with authorities in the UK where similar
fire issues exist, and in the development of
technology transfer between UK and Irish
authorities. Officers from DAFM and Irish Fire
and Rescue Services attended the UK
Wildfire 2013 conference and exhibition in
Wales, UK in late 2013.This event provided
an ideal background for networking with organisations from the UK and further afield.
26
Major opportunities exist for future
cooperation and inter-regional funding of fire
mitigation programmes and for the adoption
and adaptation of UK land management
policy and practice guides relating to fire
management. The recently published
Scottish Government Wildfire Operational
Guidance is currently being evaluated and is
the de facto operational guidance for Irish
Fire Services dealing with wildfire incidents.
Fire fighting means
Fire suppression efforts are usually manual
and are generally carried out by county level
Fire and Rescue Services. Specialised wildfire
units do not exist. Some fire suppression
capabilities are retained by Coillte Teoranta
the Irish State Forestry Company and Bord
na Mona, the State Peatland management
company. Contract aviation resources and
expertise were used extensively by Coillte
and some larger private forestry interests
during 2013, with a high degree of success.
The state national Parks Service reportedly
also utilised helicopter resources at one
incident in Co. Mayo.
Given ongoing changes in land management
practice, demographics and climate change
projections, wildfire is likely to remain a
significant issue into the future in Ireland. A
major emphasis is therefore placed on the
land management aspects of wildfire
mitigation and policies and relevant new
agriculture support schemes in Ireland will
take account of these requirements.
Significant work remains in developing a
wildfire management culture in Ireland
appropriate to the scale and nature of the
problem.
The Department of Agriculture, Food and the
Marine would like to express thanks to the
EFFIS members, JRC teams, and other
European partners for assistance received
during 2013.
Injuries and loss of human lives
There were no known deaths or injuries
arising from wildfire activity In Ireland during
2013.
(Source: Forest Service, Department of
Agriculture, Food and the Marine, Ireland).
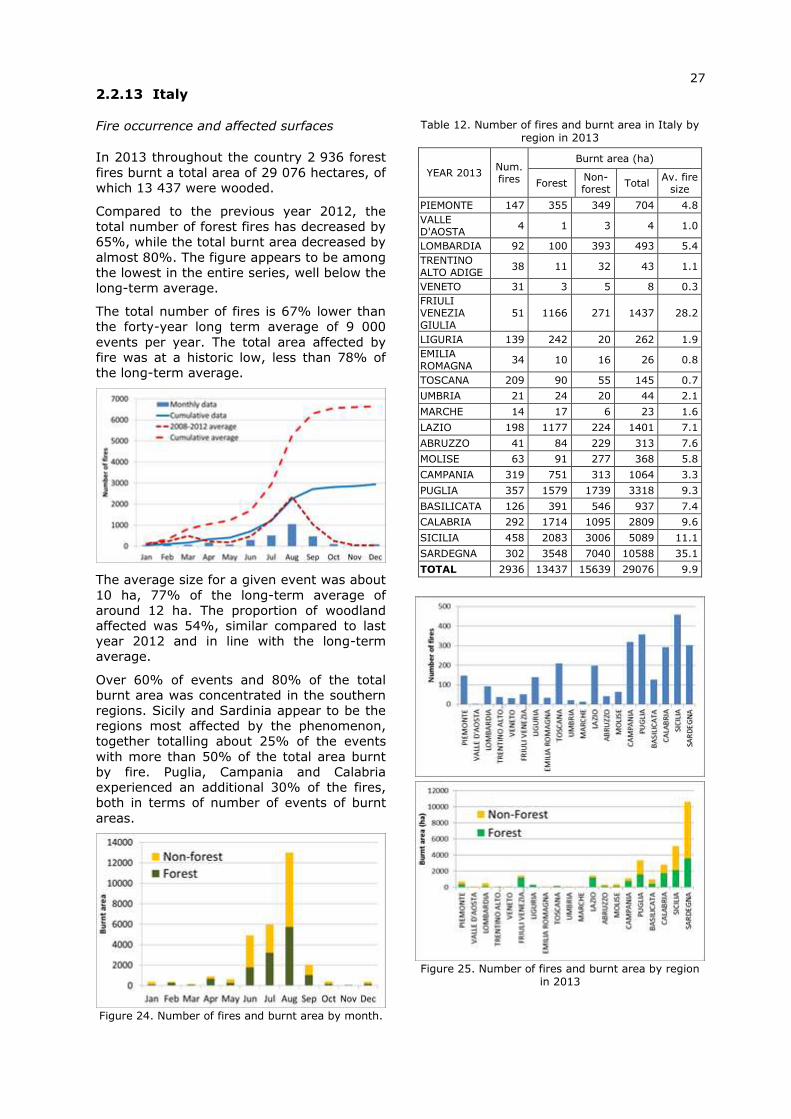
27
2.2.13 Italy
Fire occurrence and affected surfaces
In 2013 throughout the country 2 936 forest
fires burnt a total area of 29 076 hectares, of
which 13 437 were wooded.
Compared to the previous year 2012, the
total number of forest fires has decreased by
65%, while the total burnt area decreased by
almost 80%. The figure appears to be among
the lowest in the entire series, well below the
long-term average.
The total number of fires is 67% lower than
the forty-year long term average of 9 000
events per year. The total area affected by
fire was at a historic low, less than 78% of
the long-term average.
The average size for a given event was about
10 ha, 77% of the long-term average of
around 12 ha. The proportion of woodland
affected was 54%, similar compared to last
year 2012 and in line with the long-term
average.
Over 60% of events and 80% of the total
burnt area was concentrated in the southern
regions. Sicily and Sardinia appear to be the
regions most affected by the phenomenon,
together totalling about 25% of the events
with more than 50% of the total area burnt
by fire. Puglia, Campania and Calabria
experienced an additional 30% of the fires,
both in terms of number of events of burnt
areas.
Figure 24. Number of fires and burnt area by month.
Table 12. Number of fires and burnt area in Italy by region in 2013
YEAR 2013 Num. fires
Burnt area (ha)
Forest Non-forest
Total Av. fire
size
PIEMONTE 147 355 349 704 4.8
VALLE D'AOSTA
4 1 3 4 1.0
LOMBARDIA 92 100 393 493 5.4
TRENTINO ALTO ADIGE
38 11 32 43 1.1
VENETO 31 3 5 8 0.3
FRIULI VENEZIA GIULIA
51 1166 271 1437 28.2
LIGURIA 139 242 20 262 1.9
EMILIA ROMAGNA
34 10 16 26 0.8
TOSCANA 209 90 55 145 0.7
UMBRIA 21 24 20 44 2.1
MARCHE 14 17 6 23 1.6
LAZIO 198 1177 224 1401 7.1
ABRUZZO 41 84 229 313 7.6
MOLISE 63 91 277 368 5.8
CAMPANIA 319 751 313 1064 3.3
PUGLIA 357 1579 1739 3318 9.3
BASILICATA 126 391 546 937 7.4
CALABRIA 292 1714 1095 2809 9.6
SICILIA 458 2083 3006 5089 11.1
SARDEGNA 302 3548 7040 10588 35.1
TOTAL 2936 13437 15639 29076 9.9
Figure 25. Number of fires and burnt area by region
in 2013
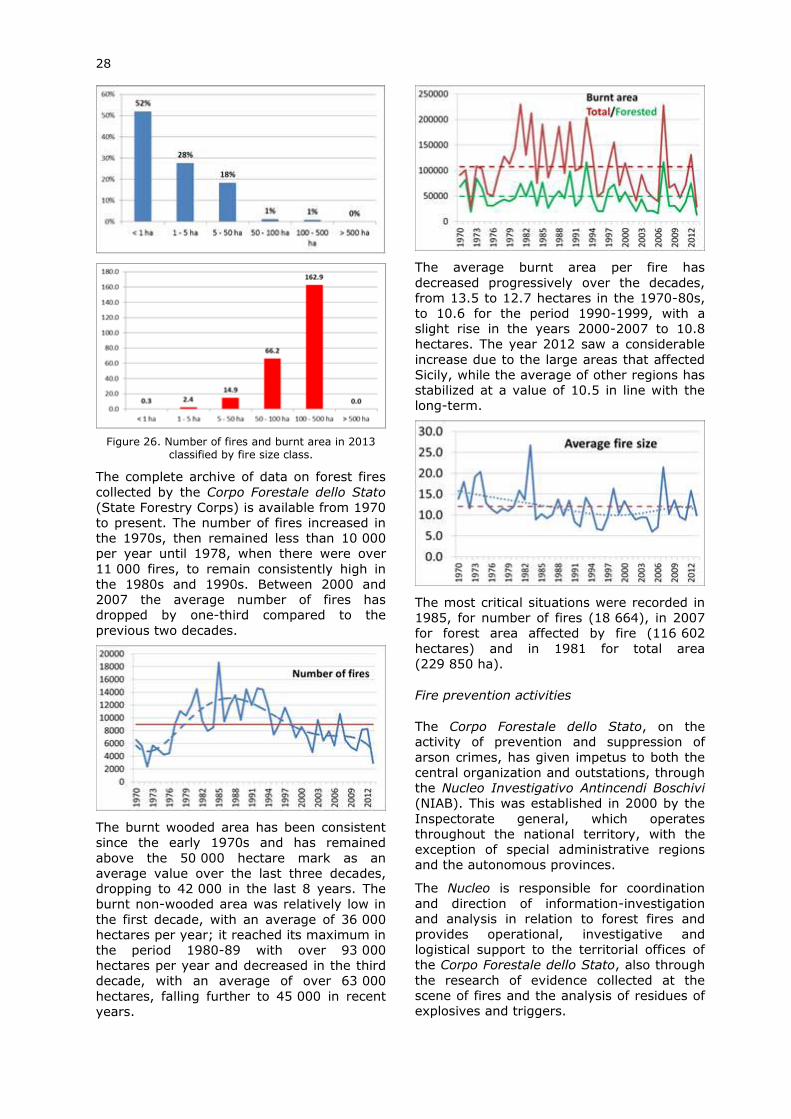
28
Figure 26. Number of fires and burnt area in 2013
classified by fire size class.
The complete archive of data on forest fires
collected by the Corpo Forestale dello Stato
(State Forestry Corps) is available from 1970
to present. The number of fires increased in
the 1970s, then remained less than 10 000
per year until 1978, when there were over
11 000 fires, to remain consistently high in
the 1980s and 1990s. Between 2000 and
2007 the average number of fires has
dropped by one-third compared to the
previous two decades.
The burnt wooded area has been consistent
since the early 1970s and has remained
above the 50 000 hectare mark as an
average value over the last three decades,
dropping to 42 000 in the last 8 years. The
burnt non-wooded area was relatively low in
the first decade, with an average of 36 000
hectares per year; it reached its maximum in
the period 1980-89 with over 93 000
hectares per year and decreased in the third
decade, with an average of over 63 000
hectares, falling further to 45 000 in recent
years.
The average burnt area per fire has
decreased progressively over the decades,
from 13.5 to 12.7 hectares in the 1970-80s,
to 10.6 for the period 1990-1999, with a
slight rise in the years 2000-2007 to 10.8
hectares. The year 2012 saw a considerable
increase due to the large areas that affected
Sicily, while the average of other regions has
stabilized at a value of 10.5 in line with the
long-term.
The most critical situations were recorded in
1985, for number of fires (18 664), in 2007
for forest area affected by fire (116 602
hectares) and in 1981 for total area
(229 850 ha).
Fire prevention activities
The Corpo Forestale dello Stato, on the
activity of prevention and suppression of
arson crimes, has given impetus to both the
central organization and outstations, through
the Nucleo Investigativo Antincendi Boschivi
(NIAB). This was established in 2000 by the
Inspectorate general, which operates
throughout the national territory, with the
exception of special administrative regions
and the autonomous provinces.
The Nucleo is responsible for coordination
and direction of information-investigation
and analysis in relation to forest fires and
provides operational, investigative and
logistical support to the territorial offices of
the Corpo Forestale dello Stato, also through
the research of evidence collected at the scene of fires and the analysis of residues of
explosives and triggers.
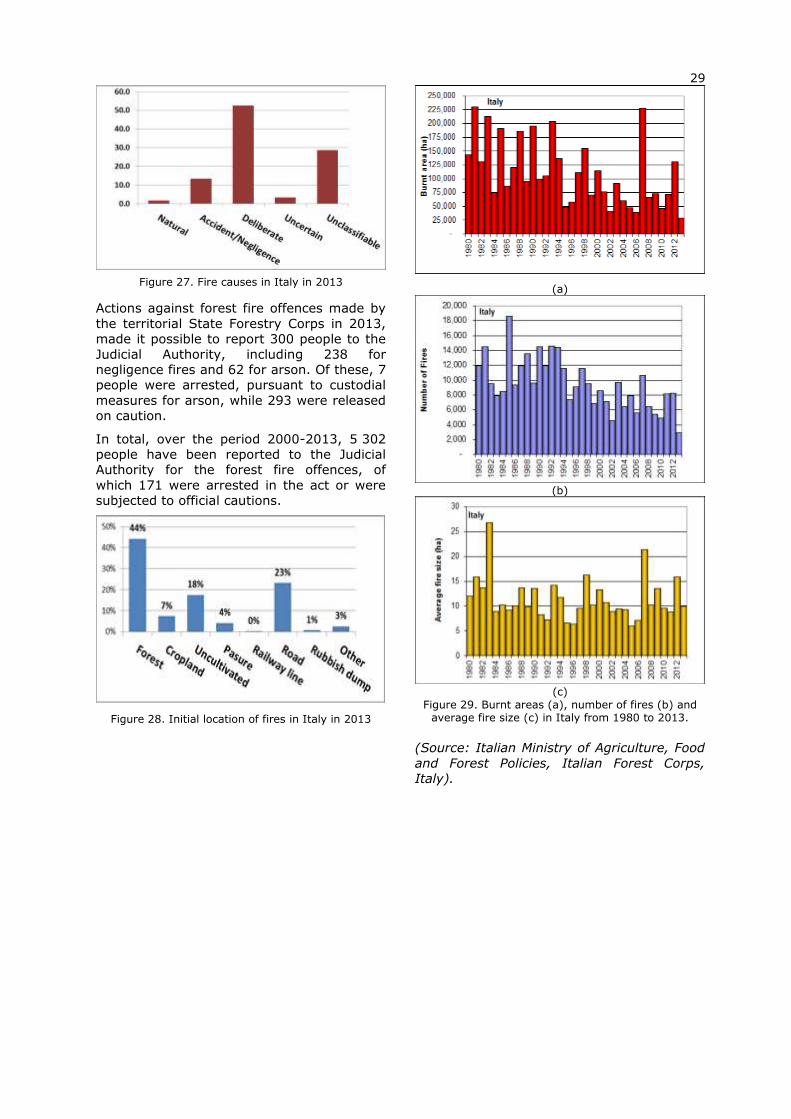
29
Figure 27. Fire causes in Italy in 2013
Actions against forest fire offences made by
the territorial State Forestry Corps in 2013,
made it possible to report 300 people to the
Judicial Authority, including 238 for
negligence fires and 62 for arson. Of these, 7
people were arrested, pursuant to custodial
measures for arson, while 293 were released
on caution.
In total, over the period 2000-2013, 5 302
people have been reported to the Judicial
Authority for the forest fire offences, of
which 171 were arrested in the act or were
subjected to official cautions.
Figure 28. Initial location of fires in Italy in 2013
(a)
(b)
(c)
Figure 29. Burnt areas (a), number of fires (b) and average fire size (c) in Italy from 1980 to 2013.
(Source: Italian Ministry of Agriculture, Food
and Forest Policies, Italian Forest Corps,
Italy).
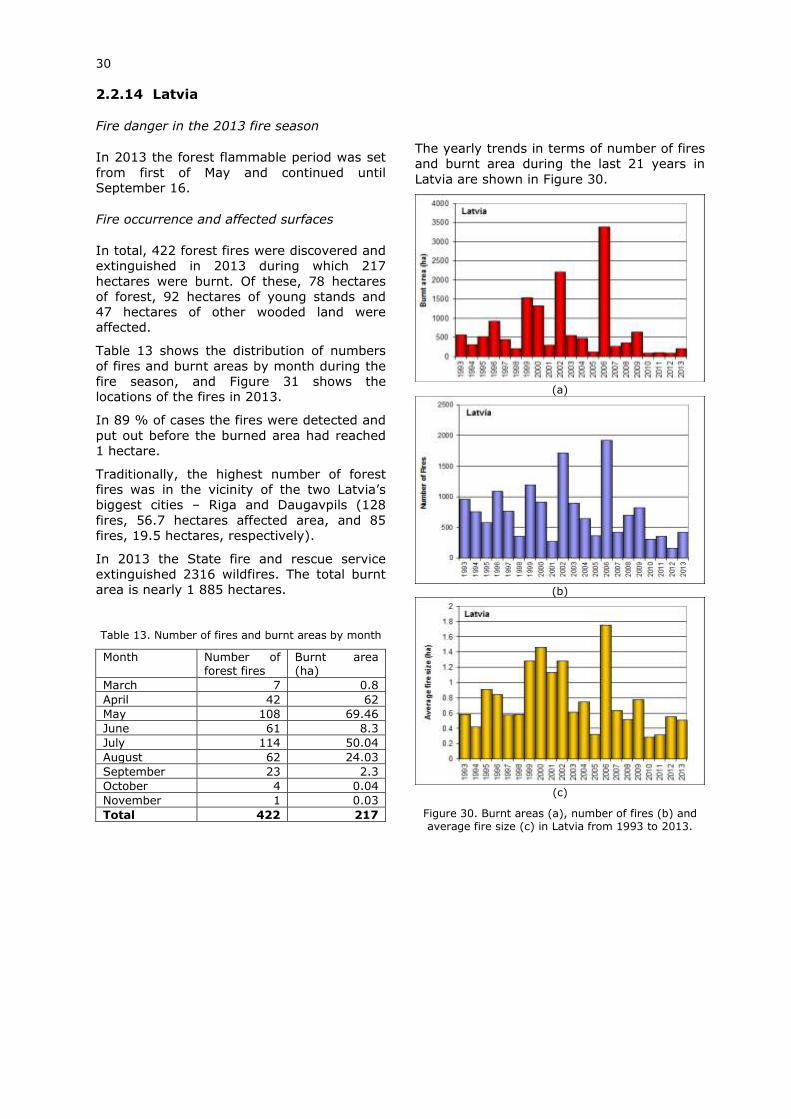
30
2.2.14 Latvia
Fire danger in the 2013 fire season
In 2013 the forest flammable period was set
from first of May and continued until
September 16.
Fire occurrence and affected surfaces
In total, 422 forest fires were discovered and
extinguished in 2013 during which 217
hectares were burnt. Of these, 78 hectares
of forest, 92 hectares of young stands and
47 hectares of other wooded land were
affected.
Table 13 shows the distribution of numbers
of fires and burnt areas by month during the
fire season, and Figure 31 shows the
locations of the fires in 2013.
In 89 % of cases the fires were detected and
put out before the burned area had reached
1 hectare.
Traditionally, the highest number of forest
fires was in the vicinity of the two Latvia’s
biggest cities – Riga and Daugavpils (128
fires, 56.7 hectares affected area, and 85
fires, 19.5 hectares, respectively).
In 2013 the State fire and rescue service
extinguished 2316 wildfires. The total burnt
area is nearly 1 885 hectares.
Table 13. Number of fires and burnt areas by month
Month Number of forest fires
Burnt area (ha)
March 7 0.8
April 42 62
May 108 69.46
June 61 8.3
July 114 50.04
August 62 24.03
September 23 2.3
October 4 0.04
November 1 0.03
Total 422 217
The yearly trends in terms of number of fires
and burnt area during the last 21 years in
Latvia are shown in Figure 30.
(a)
(b)
(c)
Figure 30. Burnt areas (a), number of fires (b) and average fire size (c) in Latvia from 1993 to 2013.
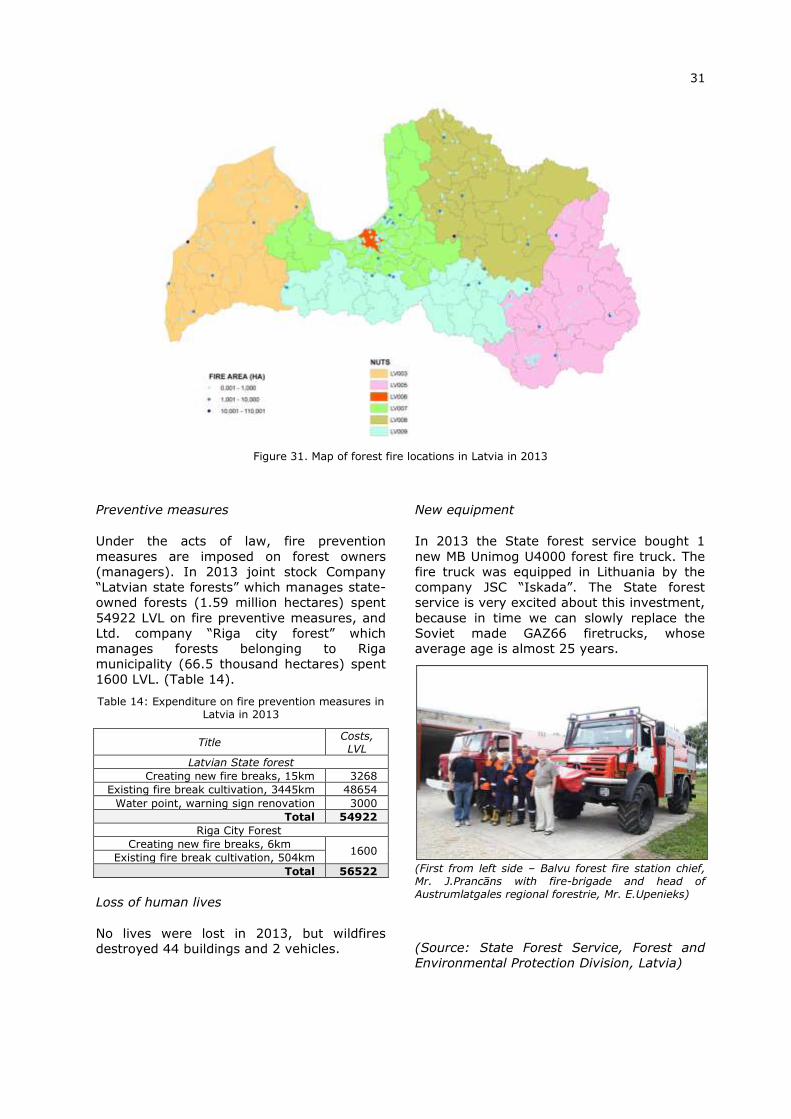
31
Figure 31. Map of forest fire locations in Latvia in 2013
Preventive measures
Under the acts of law, fire prevention
measures are imposed on forest owners
(managers). In 2013 joint stock Company
“Latvian state forests” which manages state-
owned forests (1.59 million hectares) spent
54922 LVL on fire preventive measures, and
Ltd. company “Riga city forest” which
manages forests belonging to Riga
municipality (66.5 thousand hectares) spent
1600 LVL. (Table 14).
Table 14: Expenditure on fire prevention measures in Latvia in 2013
Title Costs, LVL
Latvian State forest
Creating new fire breaks, 15km 3268
Existing fire break cultivation, 3445km 48654
Water point, warning sign renovation 3000
Total 54922
Riga City Forest
Creating new fire breaks, 6km 1600
Existing fire break cultivation, 504km
Total 56522
Loss of human lives
No lives were lost in 2013, but wildfires
destroyed 44 buildings and 2 vehicles.
New equipment
In 2013 the State forest service bought 1
new MB Unimog U4000 forest fire truck. The
fire truck was equipped in Lithuania by the
company JSC “Iskada”. The State forest
service is very excited about this investment,
because in time we can slowly replace the
Soviet made GAZ66 firetrucks, whose
average age is almost 25 years.
(First from left side – Balvu forest fire station chief, Mr. J.Prancāns with fire-brigade and head of Austrumlatgales regional forestrie, Mr. E.Upenieks)
(Source: State Forest Service, Forest and
Environmental Protection Division, Latvia)
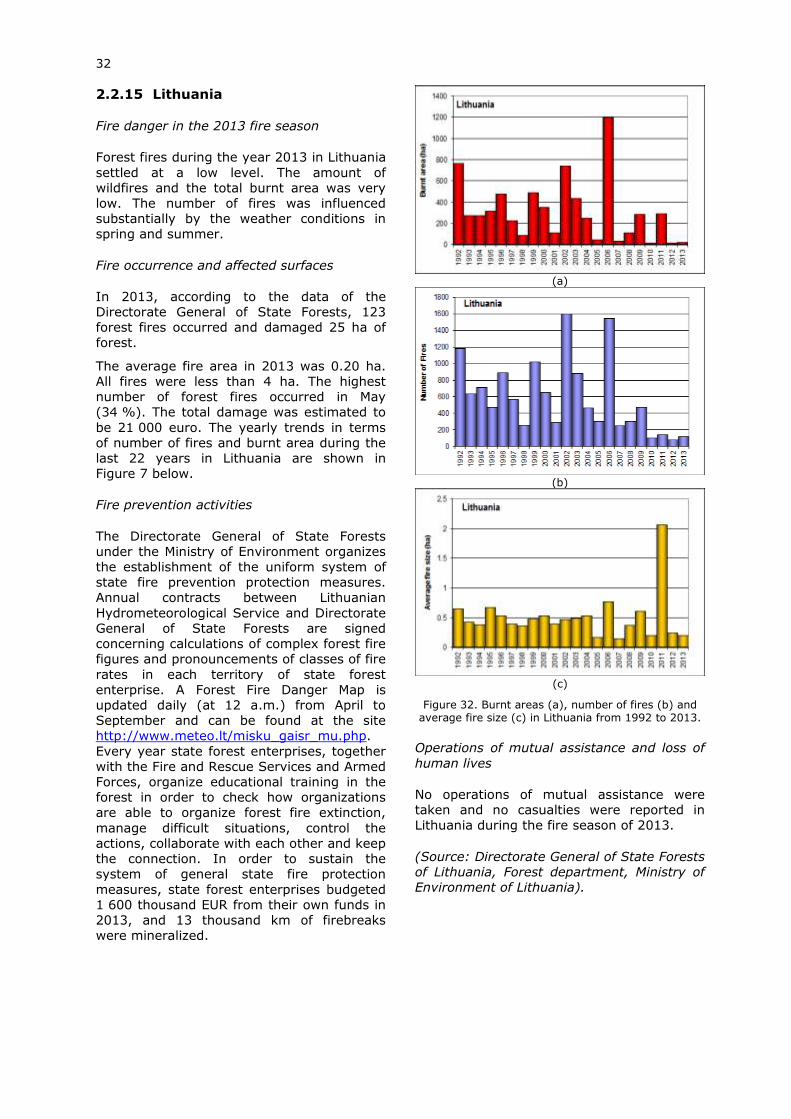
32
2.2.15 Lithuania
Fire danger in the 2013 fire season
Forest fires during the year 2013 in Lithuania
settled at a low level. The amount of
wildfires and the total burnt area was very
low. The number of fires was influenced
substantially by the weather conditions in
spring and summer.
Fire occurrence and affected surfaces
In 2013, according to the data of the
Directorate General of State Forests, 123
forest fires occurred and damaged 25 ha of
forest.
The average fire area in 2013 was 0.20 ha.
All fires were less than 4 ha. The highest
number of forest fires occurred in May
(34 %). The total damage was estimated to
be 21 000 euro. The yearly trends in terms
of number of fires and burnt area during the
last 22 years in Lithuania are shown in
Figure 7 below.
Fire prevention activities
The Directorate General of State Forests
under the Ministry of Environment organizes
the establishment of the uniform system of
state fire prevention protection measures.
Annual contracts between Lithuanian
Hydrometeorological Service and Directorate
General of State Forests are signed
concerning calculations of complex forest fire
figures and pronouncements of classes of fire
rates in each territory of state forest
enterprise. A Forest Fire Danger Map is
updated daily (at 12 a.m.) from April to
September and can be found at the site
http://www.meteo.lt/misku_gaisr_mu.php.
Every year state forest enterprises, together
with the Fire and Rescue Services and Armed
Forces, organize educational training in the
forest in order to check how organizations
are able to organize forest fire extinction,
manage difficult situations, control the
actions, collaborate with each other and keep
the connection. In order to sustain the
system of general state fire protection
measures, state forest enterprises budgeted
1 600 thousand EUR from their own funds in
2013, and 13 thousand km of firebreaks
were mineralized.
(a)
(b)
(c)
Figure 32. Burnt areas (a), number of fires (b) and average fire size (c) in Lithuania from 1992 to 2013.
Operations of mutual assistance and loss of
human lives
No operations of mutual assistance were
taken and no casualties were reported in
Lithuania during the fire season of 2013.
(Source: Directorate General of State Forests
of Lithuania, Forest department, Ministry of
Environment of Lithuania).
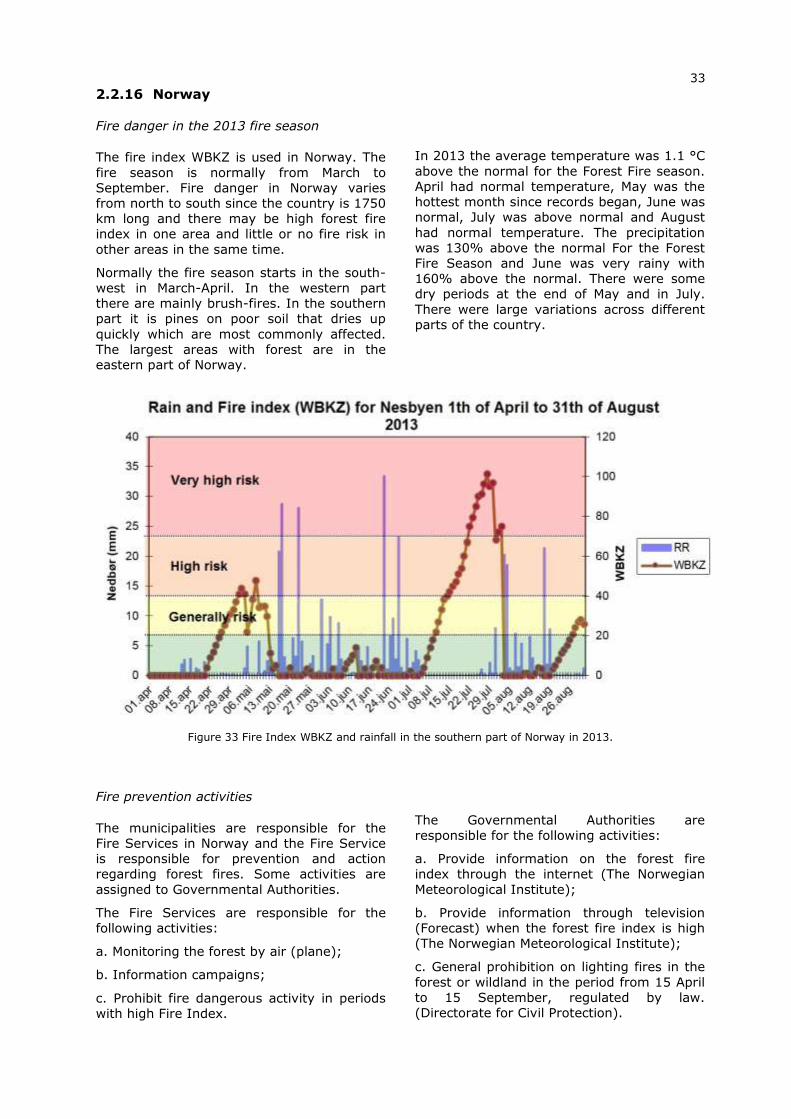
33
2.2.16 Norway
Fire danger in the 2013 fire season
The fire index WBKZ is used in Norway. The
fire season is normally from March to
September. Fire danger in Norway varies
from north to south since the country is 1750
km long and there may be high forest fire
index in one area and little or no fire risk in
other areas in the same time.
Normally the fire season starts in the south-
west in March-April. In the western part
there are mainly brush-fires. In the southern
part it is pines on poor soil that dries up
quickly which are most commonly affected.
The largest areas with forest are in the
eastern part of Norway.
In 2013 the average temperature was 1.1 °C
above the normal for the Forest Fire season.
April had normal temperature, May was the
hottest month since records began, June was
normal, July was above normal and August
had normal temperature. The precipitation
was 130% above the normal For the Forest
Fire Season and June was very rainy with
160% above the normal. There were some
dry periods at the end of May and in July.
There were large variations across different
parts of the country.
Figure 33 Fire Index WBKZ and rainfall in the southern part of Norway in 2013.
Fire prevention activities
The municipalities are responsible for the
Fire Services in Norway and the Fire Service
is responsible for prevention and action
regarding forest fires. Some activities are
assigned to Governmental Authorities.
The Fire Services are responsible for the
following activities:
a. Monitoring the forest by air (plane);
b. Information campaigns;
c. Prohibit fire dangerous activity in periods
with high Fire Index.
The Governmental Authorities are
responsible for the following activities:
a. Provide information on the forest fire
index through the internet (The Norwegian
Meteorological Institute);
b. Provide information through television
(Forecast) when the forest fire index is high
(The Norwegian Meteorological Institute);
c. General prohibition on lighting fires in the
forest or wildland in the period from 15 April
to 15 September, regulated by law.
(Directorate for Civil Protection).
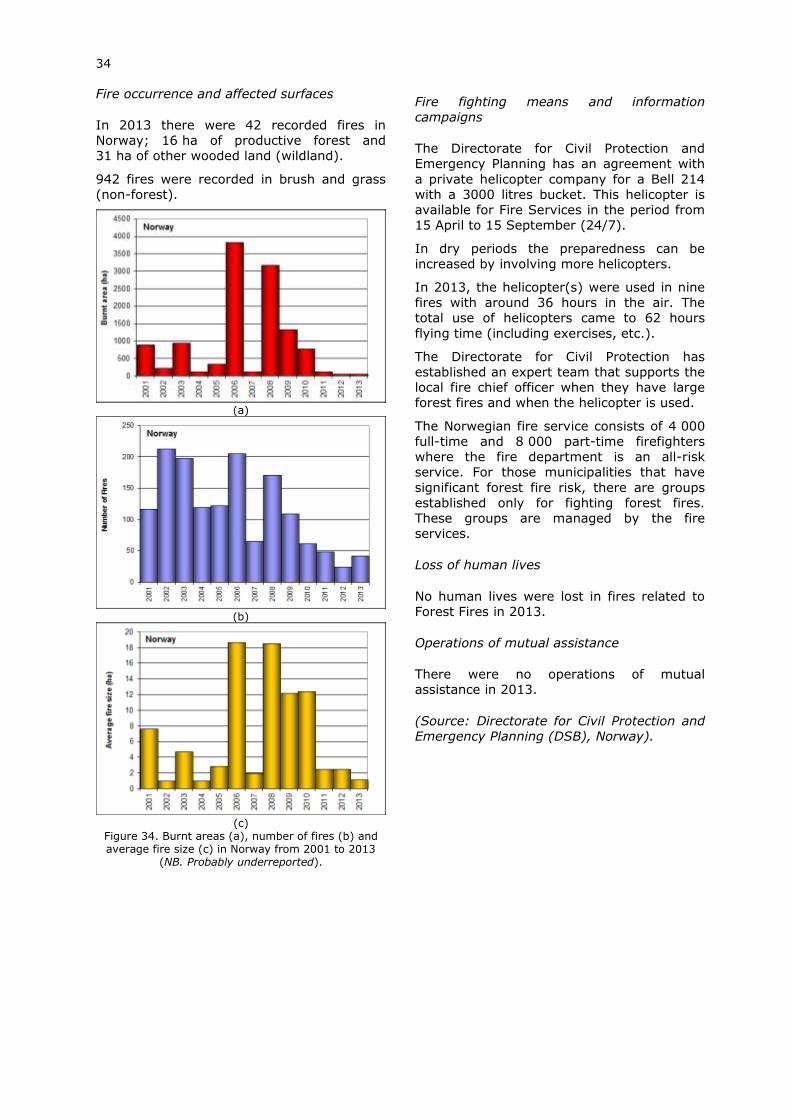
34
Fire occurrence and affected surfaces
In 2013 there were 42 recorded fires in
Norway; 16 ha of productive forest and
31 ha of other wooded land (wildland).
942 fires were recorded in brush and grass
(non-forest).
(a)
(b)
(c)
Figure 34. Burnt areas (a), number of fires (b) and average fire size (c) in Norway from 2001 to 2013
(NB. Probably underreported).
Fire fighting means and information
campaigns
The Directorate for Civil Protection and
Emergency Planning has an agreement with
a private helicopter company for a Bell 214
with a 3000 litres bucket. This helicopter is
available for Fire Services in the period from
15 April to 15 September (24/7).
In dry periods the preparedness can be
increased by involving more helicopters.
In 2013, the helicopter(s) were used in nine
fires with around 36 hours in the air. The
total use of helicopters came to 62 hours
flying time (including exercises, etc.).
The Directorate for Civil Protection has
established an expert team that supports the
local fire chief officer when they have large
forest fires and when the helicopter is used.
The Norwegian fire service consists of 4 000
full-time and 8 000 part-time firefighters
where the fire department is an all-risk
service. For those municipalities that have
significant forest fire risk, there are groups
established only for fighting forest fires.
These groups are managed by the fire
services.
Loss of human lives
No human lives were lost in fires related to
Forest Fires in 2013.
Operations of mutual assistance
There were no operations of mutual
assistance in 2013.
(Source: Directorate for Civil Protection and
Emergency Planning (DSB), Norway).
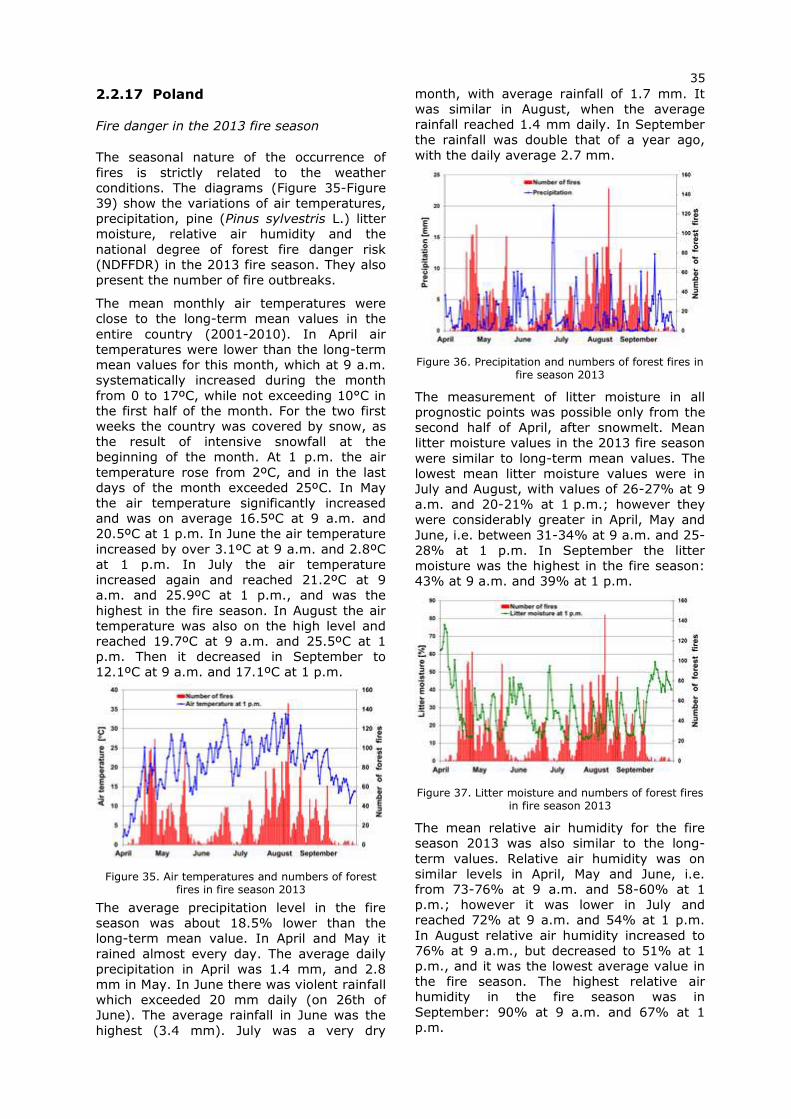
35
2.2.17 Poland
Fire danger in the 2013 fire season
The seasonal nature of the occurrence of
fires is strictly related to the weather
conditions. The diagrams (Figure 35-Figure
39) show the variations of air temperatures,
precipitation, pine (Pinus sylvestris L.) litter
moisture, relative air humidity and the
national degree of forest fire danger risk
(NDFFDR) in the 2013 fire season. They also
present the number of fire outbreaks.
The mean monthly air temperatures were
close to the long-term mean values in the
entire country (2001-2010). In April air
temperatures were lower than the long-term
mean values for this month, which at 9 a.m.
systematically increased during the month
from 0 to 17ºC, while not exceeding 10°C in
the first half of the month. For the two first
weeks the country was covered by snow, as
the result of intensive snowfall at the
beginning of the month. At 1 p.m. the air
temperature rose from 2ºC, and in the last
days of the month exceeded 25ºC. In May
the air temperature significantly increased
and was on average 16.5ºC at 9 a.m. and
20.5ºC at 1 p.m. In June the air temperature
increased by over 3.1ºC at 9 a.m. and 2.8ºC
at 1 p.m. In July the air temperature
increased again and reached 21.2ºC at 9
a.m. and 25.9ºC at 1 p.m., and was the
highest in the fire season. In August the air
temperature was also on the high level and
reached 19.7ºC at 9 a.m. and 25.5ºC at 1
p.m. Then it decreased in September to
12.1ºC at 9 a.m. and 17.1ºC at 1 p.m.
Figure 35. Air temperatures and numbers of forest fires in fire season 2013
The average precipitation level in the fire
season was about 18.5% lower than the
long-term mean value. In April and May it
rained almost every day. The average daily
precipitation in April was 1.4 mm, and 2.8 mm in May. In June there was violent rainfall
which exceeded 20 mm daily (on 26th of
June). The average rainfall in June was the
highest (3.4 mm). July was a very dry
month, with average rainfall of 1.7 mm. It
was similar in August, when the average
rainfall reached 1.4 mm daily. In September
the rainfall was double that of a year ago,
with the daily average 2.7 mm.
Figure 36. Precipitation and numbers of forest fires in fire season 2013
The measurement of litter moisture in all
prognostic points was possible only from the
second half of April, after snowmelt. Mean
litter moisture values in the 2013 fire season
were similar to long-term mean values. The
lowest mean litter moisture values were in
July and August, with values of 26-27% at 9
a.m. and 20-21% at 1 p.m.; however they
were considerably greater in April, May and
June, i.e. between 31-34% at 9 a.m. and 25-
28% at 1 p.m. In September the litter
moisture was the highest in the fire season:
43% at 9 a.m. and 39% at 1 p.m.
Figure 37. Litter moisture and numbers of forest fires in fire season 2013
The mean relative air humidity for the fire
season 2013 was also similar to the long-
term values. Relative air humidity was on
similar levels in April, May and June, i.e.
from 73-76% at 9 a.m. and 58-60% at 1
p.m.; however it was lower in July and
reached 72% at 9 a.m. and 54% at 1 p.m.
In August relative air humidity increased to
76% at 9 a.m., but decreased to 51% at 1
p.m., and it was the lowest average value in
the fire season. The highest relative air humidity in the fire season was in
September: 90% at 9 a.m. and 67% at 1
p.m.
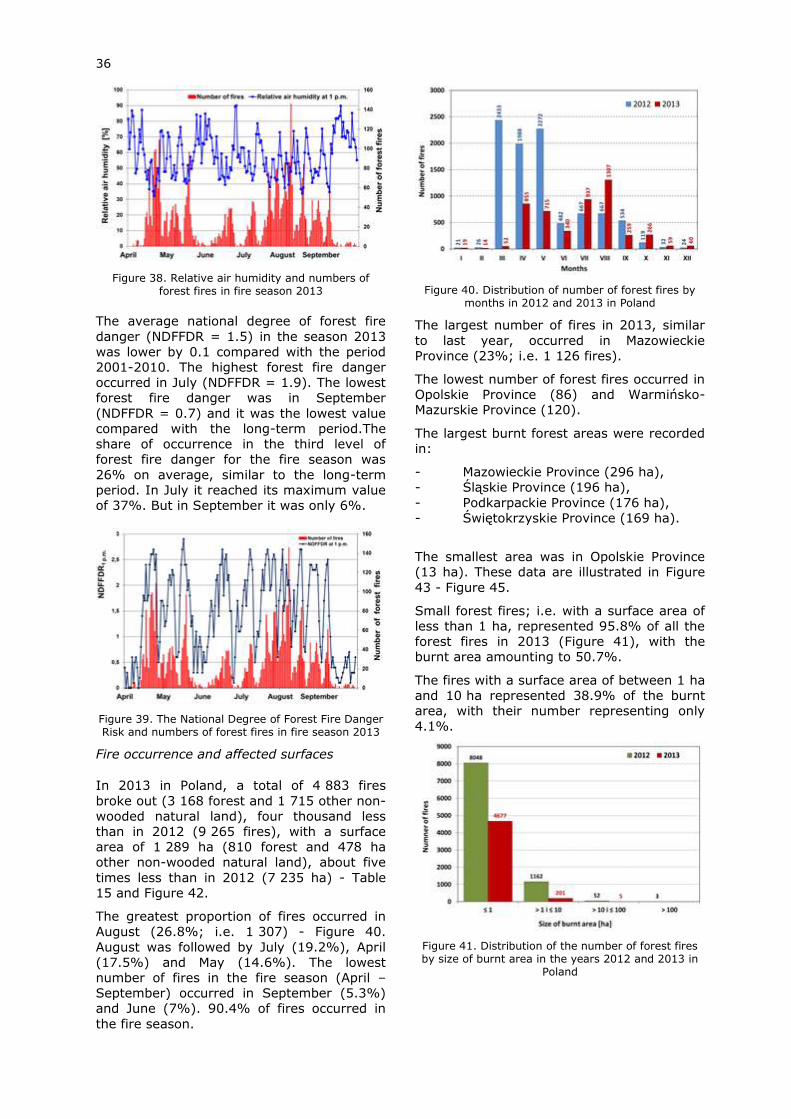
36
Figure 38. Relative air humidity and numbers of forest fires in fire season 2013
The average national degree of forest fire
danger (NDFFDR = 1.5) in the season 2013
was lower by 0.1 compared with the period
2001-2010. The highest forest fire danger
occurred in July (NDFFDR = 1.9). The lowest
forest fire danger was in September
(NDFFDR = 0.7) and it was the lowest value
compared with the long-term period.The
share of occurrence in the third level of
forest fire danger for the fire season was
26% on average, similar to the long-term
period. In July it reached its maximum value
of 37%. But in September it was only 6%.
Figure 39. The National Degree of Forest Fire Danger Risk and numbers of forest fires in fire season 2013
Fire occurrence and affected surfaces
In 2013 in Poland, a total of 4 883 fires
broke out (3 168 forest and 1 715 other non-
wooded natural land), four thousand less
than in 2012 (9 265 fires), with a surface
area of 1 289 ha (810 forest and 478 ha
other non-wooded natural land), about five
times less than in 2012 (7 235 ha) - Table
15 and Figure 42.
The greatest proportion of fires occurred in
August (26.8%; i.e. 1 307) - Figure 40.
August was followed by July (19.2%), April
(17.5%) and May (14.6%). The lowest
number of fires in the fire season (April – September) occurred in September (5.3%)
and June (7%). 90.4% of fires occurred in
the fire season.
Figure 40. Distribution of number of forest fires by months in 2012 and 2013 in Poland
The largest number of fires in 2013, similar
to last year, occurred in Mazowieckie
Province (23%; i.e. 1 126 fires).
The lowest number of forest fires occurred in
Opolskie Province (86) and Warmińsko-
Mazurskie Province (120).
The largest burnt forest areas were recorded
in:
- Mazowieckie Province (296 ha),
- Śląskie Province (196 ha),
- Podkarpackie Province (176 ha),
- Świętokrzyskie Province (169 ha).
The smallest area was in Opolskie Province
(13 ha). These data are illustrated in Figure
43 - Figure 45.
Small forest fires; i.e. with a surface area of
less than 1 ha, represented 95.8% of all the
forest fires in 2013 (Figure 41), with the
burnt area amounting to 50.7%.
The fires with a surface area of between 1 ha
and 10 ha represented 38.9% of the burnt
area, with their number representing only
4.1%.
Figure 41. Distribution of the number of forest fires by size of burnt area in the years 2012 and 2013 in
Poland
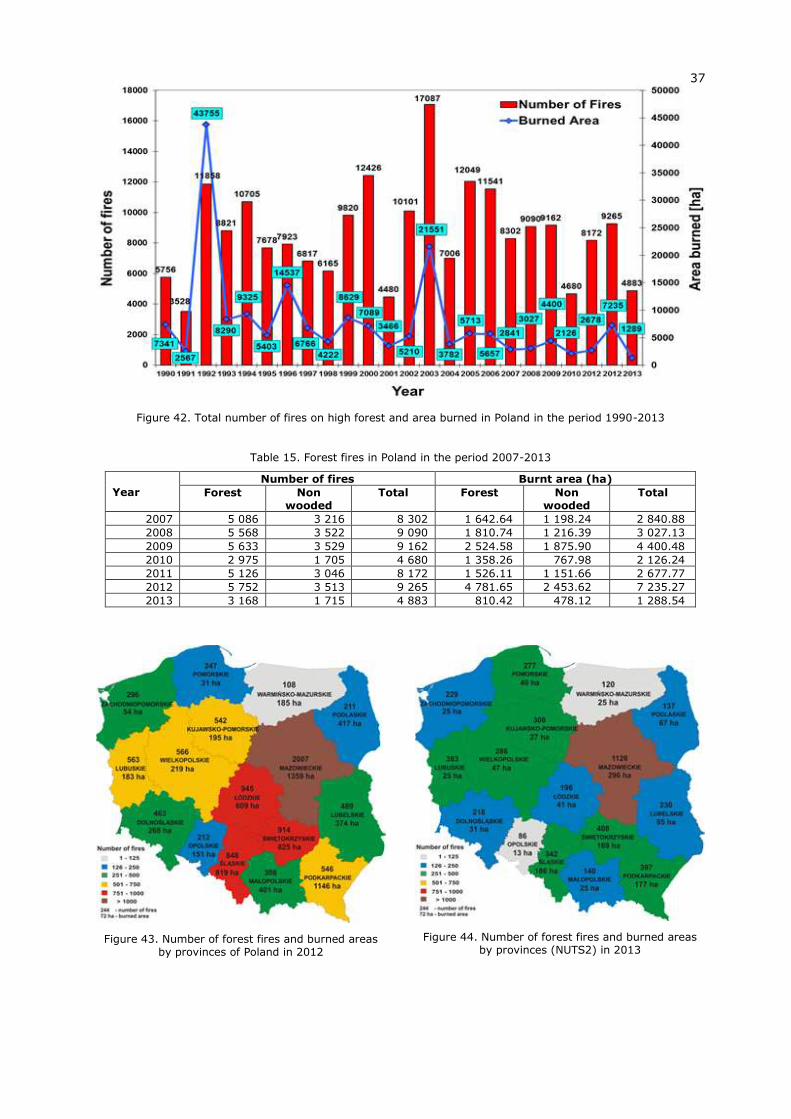
37
Figure 42. Total number of fires on high forest and area burned in Poland in the period 1990-2013
Table 15. Forest fires in Poland in the period 2007-2013
Year
Number of fires Burnt area (ha)
Forest Non wooded
Total Forest Non wooded
Total
2007 5 086 3 216 8 302 1 642.64 1 198.24 2 840.88
2008 5 568 3 522 9 090 1 810.74 1 216.39 3 027.13
2009 5 633 3 529 9 162 2 524.58 1 875.90 4 400.48
2010 2 975 1 705 4 680 1 358.26 767.98 2 126.24
2011 5 126 3 046 8 172 1 526.11 1 151.66 2 677.77
2012 5 752 3 513 9 265 4 781.65 2 453.62 7 235.27
2013 3 168 1 715 4 883 810.42 478.12 1 288.54
Figure 43. Number of forest fires and burned areas by provinces of Poland in 2012
Figure 44. Number of forest fires and burned areas by provinces (NUTS2) in 2013
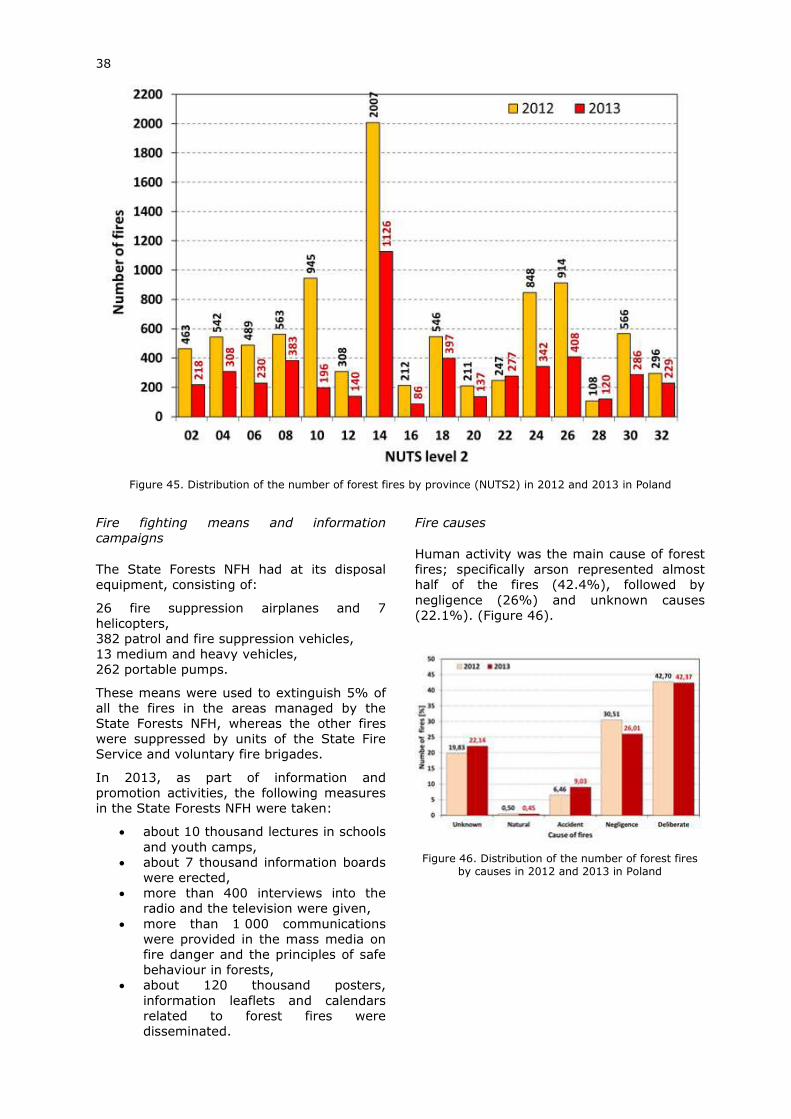
38
Figure 45. Distribution of the number of forest fires by province (NUTS2) in 2012 and 2013 in Poland
Fire fighting means and information
campaigns
The State Forests NFH had at its disposal
equipment, consisting of:
26 fire suppression airplanes and 7
helicopters,
382 patrol and fire suppression vehicles,
13 medium and heavy vehicles,
262 portable pumps.
These means were used to extinguish 5% of
all the fires in the areas managed by the
State Forests NFH, whereas the other fires
were suppressed by units of the State Fire
Service and voluntary fire brigades.
In 2013, as part of information and
promotion activities, the following measures
in the State Forests NFH were taken:
about 10 thousand lectures in schools
and youth camps,
about 7 thousand information boards
were erected,
more than 400 interviews into the
radio and the television were given,
more than 1 000 communications
were provided in the mass media on
fire danger and the principles of safe
behaviour in forests, about 120 thousand posters,
information leaflets and calendars
related to forest fires were
disseminated.
Fire causes
Human activity was the main cause of forest
fires; specifically arson represented almost
half of the fires (42.4%), followed by
negligence (26%) and unknown causes
(22.1%). (Figure 46).
Figure 46. Distribution of the number of forest fires by causes in 2012 and 2013 in Poland
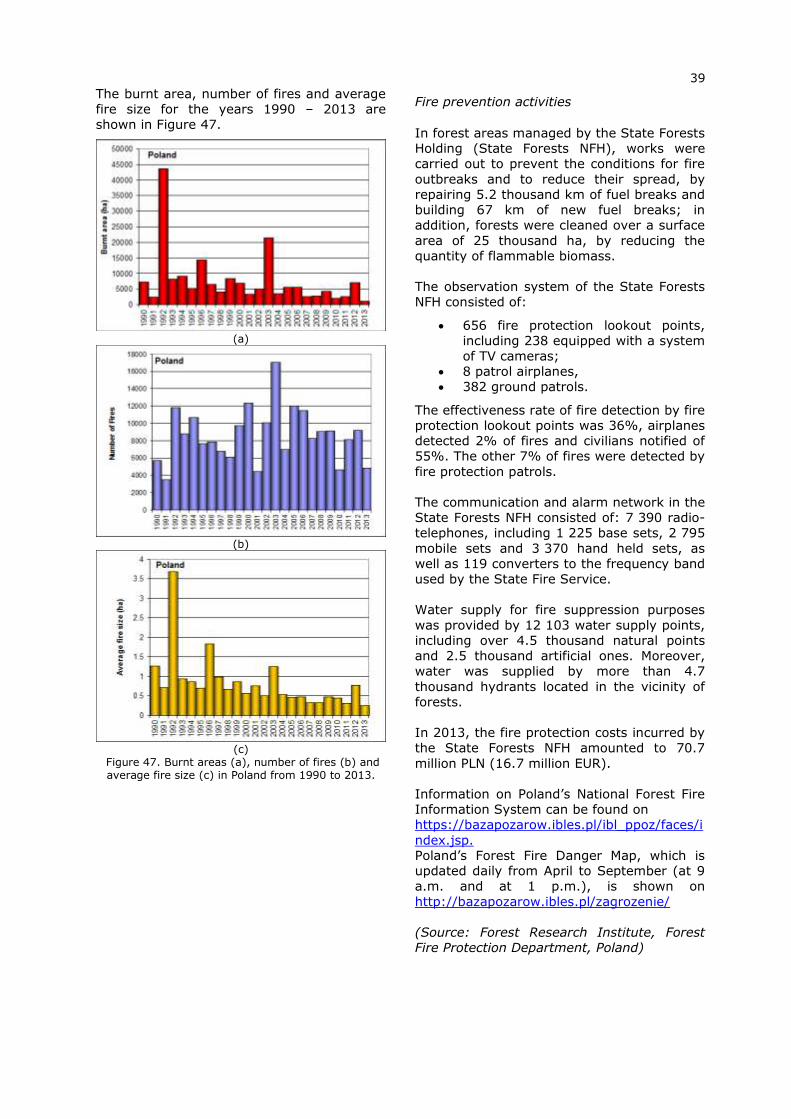
39
The burnt area, number of fires and average
fire size for the years 1990 – 2013 are
shown in Figure 47.
(a)
(b)
(c)
Figure 47. Burnt areas (a), number of fires (b) and average fire size (c) in Poland from 1990 to 2013.
Fire prevention activities
In forest areas managed by the State Forests
Holding (State Forests NFH), works were
carried out to prevent the conditions for fire
outbreaks and to reduce their spread, by
repairing 5.2 thousand km of fuel breaks and
building 67 km of new fuel breaks; in
addition, forests were cleaned over a surface
area of 25 thousand ha, by reducing the
quantity of flammable biomass.
The observation system of the State Forests
NFH consisted of:
656 fire protection lookout points,
including 238 equipped with a system
of TV cameras;
8 patrol airplanes,
382 ground patrols.
The effectiveness rate of fire detection by fire
protection lookout points was 36%, airplanes
detected 2% of fires and civilians notified of
55%. The other 7% of fires were detected by
fire protection patrols.
The communication and alarm network in the
State Forests NFH consisted of: 7 390 radio-
telephones, including 1 225 base sets, 2 795
mobile sets and 3 370 hand held sets, as
well as 119 converters to the frequency band
used by the State Fire Service.
Water supply for fire suppression purposes
was provided by 12 103 water supply points,
including over 4.5 thousand natural points
and 2.5 thousand artificial ones. Moreover,
water was supplied by more than 4.7
thousand hydrants located in the vicinity of
forests.
In 2013, the fire protection costs incurred by
the State Forests NFH amounted to 70.7
million PLN (16.7 million EUR).
Information on Poland’s National Forest Fire
Information System can be found on
https://bazapozarow.ibles.pl/ibl_ppoz/faces/i
ndex.jsp.
Poland’s Forest Fire Danger Map, which is
updated daily from April to September (at 9
a.m. and at 1 p.m.), is shown on
http://bazapozarow.ibles.pl/zagrozenie/
(Source: Forest Research Institute, Forest
Fire Protection Department, Poland)
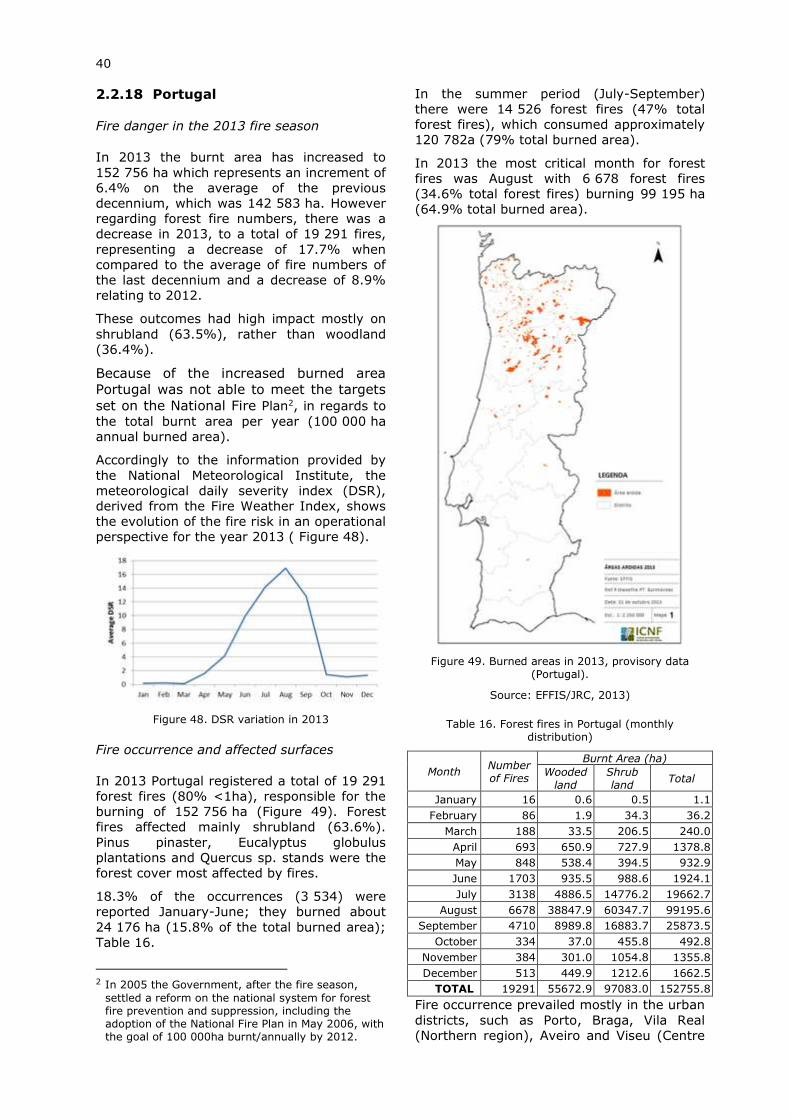
40
2.2.18 Portugal
Fire danger in the 2013 fire season
In 2013 the burnt area has increased to
152 756 ha which represents an increment of
6.4% on the average of the previous
decennium, which was 142 583 ha. However
regarding forest fire numbers, there was a
decrease in 2013, to a total of 19 291 fires,
representing a decrease of 17.7% when
compared to the average of fire numbers of
the last decennium and a decrease of 8.9%
relating to 2012.
These outcomes had high impact mostly on
shrubland (63.5%), rather than woodland
(36.4%).
Because of the increased burned area
Portugal was not able to meet the targets
set on the National Fire Plan2, in regards to
the total burnt area per year (100 000 ha
annual burned area).
Accordingly to the information provided by
the National Meteorological Institute, the
meteorological daily severity index (DSR),
derived from the Fire Weather Index, shows
the evolution of the fire risk in an operational
perspective for the year 2013 ( Figure 48).
Figure 48. DSR variation in 2013
Fire occurrence and affected surfaces
In 2013 Portugal registered a total of 19 291
forest fires (80% <1ha), responsible for the
burning of 152 756 ha (Figure 49). Forest
fires affected mainly shrubland (63.6%).
Pinus pinaster, Eucalyptus globulus
plantations and Quercus sp. stands were the
forest cover most affected by fires.
18.3% of the occurrences (3 534) were
reported January-June; they burned about
24 176 ha (15.8% of the total burned area);
Table 16.
2 In 2005 the Government, after the fire season,
settled a reform on the national system for forest fire prevention and suppression, including the adoption of the National Fire Plan in May 2006, with the goal of 100 000ha burnt/annually by 2012.
In the summer period (July-September)
there were 14 526 forest fires (47% total
forest fires), which consumed approximately
120 782a (79% total burned area).
In 2013 the most critical month for forest
fires was August with 6 678 forest fires
(34.6% total forest fires) burning 99 195 ha
(64.9% total burned area).
Figure 49. Burned areas in 2013, provisory data (Portugal).
Source: EFFIS/JRC, 2013)
Table 16. Forest fires in Portugal (monthly distribution)
Month Number of Fires
Burnt Area (ha)
Wooded land
Shrub land
Total
January 16 0.6 0.5 1.1
February 86 1.9 34.3 36.2
March 188 33.5 206.5 240.0
April 693 650.9 727.9 1378.8
May 848 538.4 394.5 932.9
June 1703 935.5 988.6 1924.1
July 3138 4886.5 14776.2 19662.7
August 6678 38847.9 60347.7 99195.6
September 4710 8989.8 16883.7 25873.5
October 334 37.0 455.8 492.8
November 384 301.0 1054.8 1355.8
December 513 449.9 1212.6 1662.5
TOTAL 19291 55672.9 97083.0 152755.8
Fire occurrence prevailed mostly in the urban
districts, such as Porto, Braga, Vila Real
(Northern region), Aveiro and Viseu (Centre
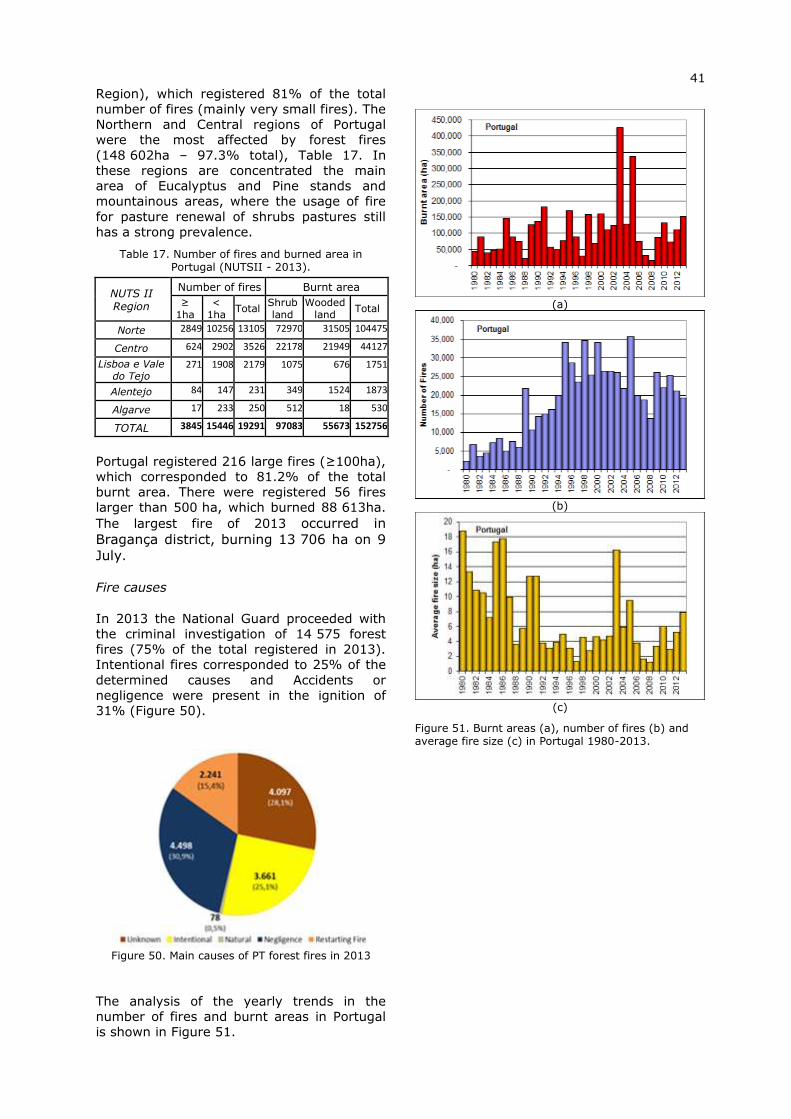
41
Region), which registered 81% of the total
number of fires (mainly very small fires). The
Northern and Central regions of Portugal
were the most affected by forest fires
(148 602ha – 97.3% total), Table 17. In
these regions are concentrated the main
area of Eucalyptus and Pine stands and
mountainous areas, where the usage of fire
for pasture renewal of shrubs pastures still
has a strong prevalence.
Table 17. Number of fires and burned area in Portugal (NUTSII - 2013).
NUTS II Region
Number of fires Burnt area
≥ 1ha
< 1ha
Total Shrub land
Wooded land
Total
Norte 2849 10256 13105 72970 31505 104475
Centro 624 2902 3526 22178 21949 44127
Lisboa e Vale do Tejo
271 1908 2179 1075 676 1751
Alentejo 84 147 231 349 1524 1873
Algarve 17 233 250 512 18 530
TOTAL 3845 15446 19291 97083 55673 152756
Portugal registered 216 large fires (≥100ha),
which corresponded to 81.2% of the total
burnt area. There were registered 56 fires
larger than 500 ha, which burned 88 613ha.
The largest fire of 2013 occurred in
Bragança district, burning 13 706 ha on 9
July.
Fire causes
In 2013 the National Guard proceeded with
the criminal investigation of 14 575 forest
fires (75% of the total registered in 2013).
Intentional fires corresponded to 25% of the
determined causes and Accidents or
negligence were present in the ignition of
31% (Figure 50).
Figure 50. Main causes of PT forest fires in 2013
The analysis of the yearly trends in the
number of fires and burnt areas in Portugal
is shown in Figure 51.
(a)
(b)
(c)
Figure 51. Burnt areas (a), number of fires (b) and average fire size (c) in Portugal 1980-2013.
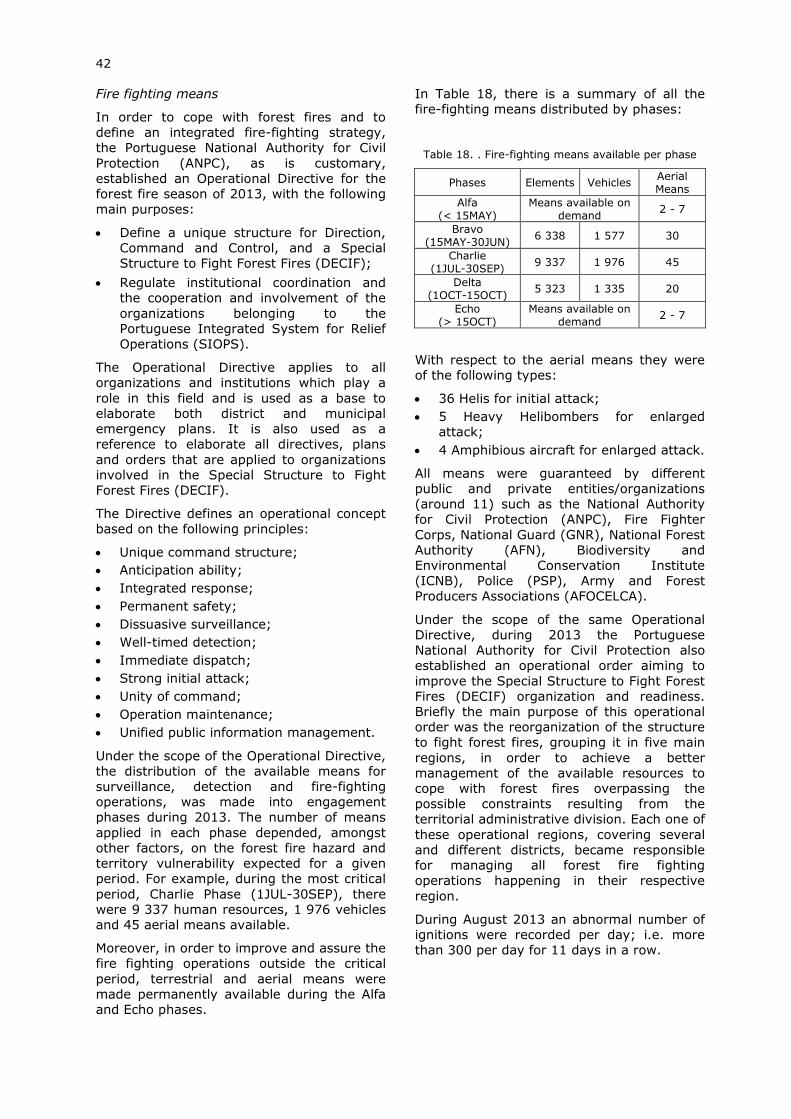
42
Fire fighting means
In order to cope with forest fires and to
define an integrated fire-fighting strategy,
the Portuguese National Authority for Civil
Protection (ANPC), as is customary,
established an Operational Directive for the
forest fire season of 2013, with the following
main purposes:
Define a unique structure for Direction,
Command and Control, and a Special
Structure to Fight Forest Fires (DECIF);
Regulate institutional coordination and
the cooperation and involvement of the
organizations belonging to the
Portuguese Integrated System for Relief
Operations (SIOPS).
The Operational Directive applies to all
organizations and institutions which play a
role in this field and is used as a base to
elaborate both district and municipal
emergency plans. It is also used as a
reference to elaborate all directives, plans
and orders that are applied to organizations
involved in the Special Structure to Fight
Forest Fires (DECIF).
The Directive defines an operational concept
based on the following principles:
Unique command structure;
Anticipation ability;
Integrated response;
Permanent safety;
Dissuasive surveillance;
Well-timed detection;
Immediate dispatch;
Strong initial attack;
Unity of command;
Operation maintenance;
Unified public information management.
Under the scope of the Operational Directive,
the distribution of the available means for
surveillance, detection and fire-fighting
operations, was made into engagement
phases during 2013. The number of means
applied in each phase depended, amongst
other factors, on the forest fire hazard and
territory vulnerability expected for a given
period. For example, during the most critical
period, Charlie Phase (1JUL-30SEP), there
were 9 337 human resources, 1 976 vehicles
and 45 aerial means available.
Moreover, in order to improve and assure the
fire fighting operations outside the critical
period, terrestrial and aerial means were made permanently available during the Alfa
and Echo phases.
In Table 18, there is a summary of all the
fire-fighting means distributed by phases:
Table 18. . Fire-fighting means available per phase
Phases Elements Vehicles Aerial Means
Alfa (< 15MAY)
Means available on demand
2 - 7
Bravo (15MAY-30JUN)
6 338 1 577 30
Charlie (1JUL-30SEP)
9 337 1 976 45
Delta (1OCT-15OCT)
5 323 1 335 20
Echo (> 15OCT)
Means available on demand
2 - 7
With respect to the aerial means they were
of the following types:
36 Helis for initial attack;
5 Heavy Helibombers for enlarged
attack;
4 Amphibious aircraft for enlarged attack.
All means were guaranteed by different
public and private entities/organizations
(around 11) such as the National Authority
for Civil Protection (ANPC), Fire Fighter
Corps, National Guard (GNR), National Forest
Authority (AFN), Biodiversity and
Environmental Conservation Institute
(ICNB), Police (PSP), Army and Forest
Producers Associations (AFOCELCA).
Under the scope of the same Operational
Directive, during 2013 the Portuguese
National Authority for Civil Protection also
established an operational order aiming to
improve the Special Structure to Fight Forest
Fires (DECIF) organization and readiness.
Briefly the main purpose of this operational
order was the reorganization of the structure
to fight forest fires, grouping it in five main
regions, in order to achieve a better
management of the available resources to
cope with forest fires overpassing the
possible constraints resulting from the
territorial administrative division. Each one of
these operational regions, covering several
and different districts, became responsible
for managing all forest fire fighting
operations happening in their respective
region.
During August 2013 an abnormal number of
ignitions were recorded per day; i.e. more
than 300 per day for 11 days in a row.
43
Forest fires planning
The Forestry and Nature Conservation
Institute (ICNF) kept its efforts in the forest
fire planning at the local, municipal and
regional (district) levels.
The municipal planning objective is pursued
by the technical support to the municipalities
forest offices, based in the Municipal Plans
for Forest Fire Prevention (5 years planning)
and the Municipal Operational Plans, which
are part of the previous plans and are
updated on a yearly basis.
The municipalities’ forest offices provide
technical support to the Municipal
Commission for forest defence. By the end
of 2013 there were 271 municipal forest
offices established and 272 Municipal Plans
for Forest Fire Prevention (236 under
review and 36 approved) and 245
Municipal Operational Plans approved.
The regional level planning is assured by 18
Regional Forest Plans (for the entire
continental land) and by regional maps of
fire pre-suppression, updated each summer
in cooperation with municipalities and District
Commands for Relief Operations, at the
district level.
Forest fuels management
Forest fuels management is one of the key-
actions in the forest fire prevention domain.
A total area of 26 264 ha was managed, of
which 1 127 ha were with prescribed
burning.
Policy measures
1.1 Legislation “Decreto-Lei” n.º 124/2006
from 28 of June, with the changes introduced
by the “Decreto-Lei” n.º 17/2009 from 14 of
January
In 2013 the publishing of Regulation no.
202/2013, established the period between
1st July and 30th September, as the critical
period, where special preventive measures
prevailed.
2. Bilateral Commission on Forest Fires
Prevention and Suppression
(Portugal/Spain).
There was no follow-up progress in the
Commission works.
Loss of human lives in the 2013 fire
campaign
During 2013, forest fires in Portugal caused
the death of 8 fire fighters and one civilian.
Some fire fighting vehicles were also
destroyed after being caught by forest fires.
Operations of mutual assistance
Requested assistance through the EU
Mechanism for Civil Protection on the
August 29th, for reinforcement of 2 aerial
means (CANADAIR).
Requested assistance by bilateral
agreement between Portugal/France for 3
aerial means operating on the August
22nd – 27th.
Requested assistance by bilateral
agreement between Portugal/Spain during
July to August, with 6 aerial means.
(Sources: Ministry of Agriculture, Rural
Development and Fisheries - National Forest
Authority and National Authority for Civil
Protection, Portugal)
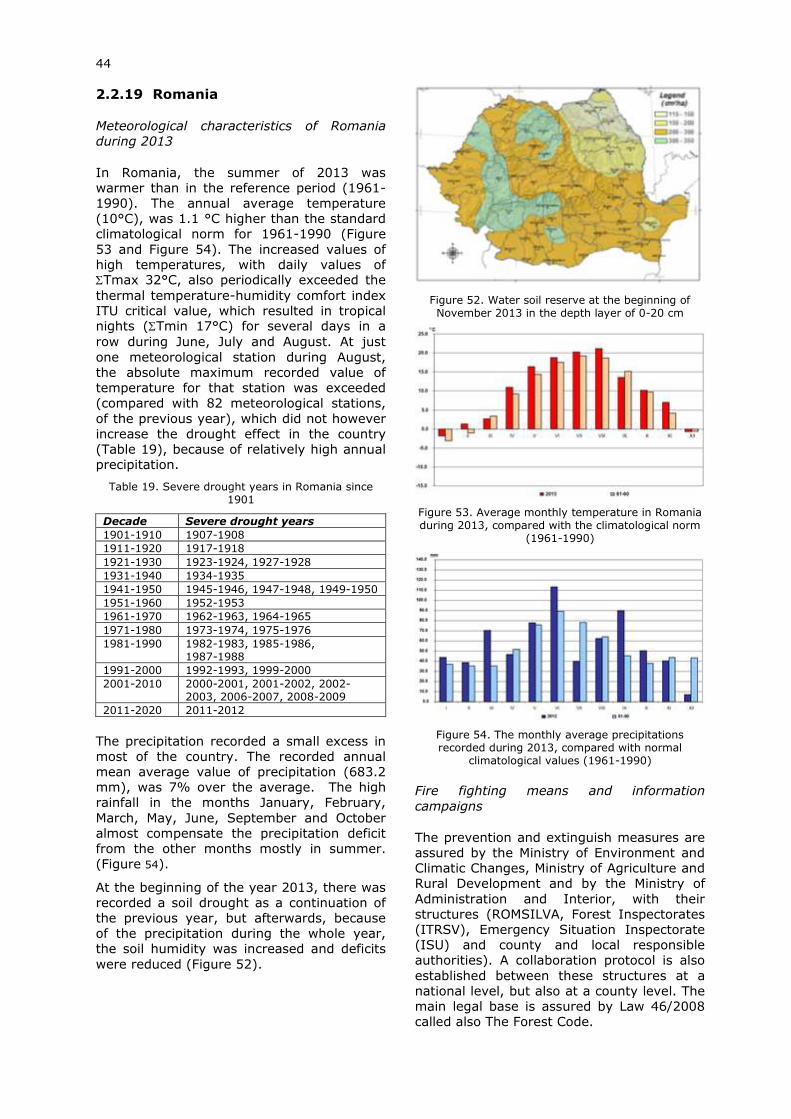
44
2.2.19 Romania
Meteorological characteristics of Romania
during 2013
In Romania, the summer of 2013 was
warmer than in the reference period (1961-
1990). The annual average temperature
(10°C), was 1.1 °C higher than the standard
climatological norm for 1961-1990 (Figure
53 and Figure 54). The increased values of
high temperatures, with daily values of Tmax 32°C, also periodically exceeded the
thermal temperature-humidity comfort index
ITU critical value, which resulted in tropical nights (Tmin 17°C) for several days in a
row during June, July and August. At just
one meteorological station during August,
the absolute maximum recorded value of
temperature for that station was exceeded
(compared with 82 meteorological stations,
of the previous year), which did not however
increase the drought effect in the country
(Table 19), because of relatively high annual
precipitation.
Table 19. Severe drought years in Romania since 1901
The precipitation recorded a small excess in
most of the country. The recorded annual
mean average value of precipitation (683.2
mm), was 7% over the average. The high
rainfall in the months January, February,
March, May, June, September and October
almost compensate the precipitation deficit
from the other months mostly in summer.
(Figure 54).
At the beginning of the year 2013, there was
recorded a soil drought as a continuation of
the previous year, but afterwards, because
of the precipitation during the whole year,
the soil humidity was increased and deficits
were reduced (Figure 52).
Figure 52. Water soil reserve at the beginning of November 2013 in the depth layer of 0-20 cm
Figure 53. Average monthly temperature in Romania during 2013, compared with the climatological norm
(1961-1990)
Figure 54. The monthly average precipitations recorded during 2013, compared with normal
climatological values (1961-1990)
Fire fighting means and information
campaigns
The prevention and extinguish measures are
assured by the Ministry of Environment and
Climatic Changes, Ministry of Agriculture and
Rural Development and by the Ministry of
Administration and Interior, with their
structures (ROMSILVA, Forest Inspectorates
(ITRSV), Emergency Situation Inspectorate
(ISU) and county and local responsible
authorities). A collaboration protocol is also
established between these structures at a national level, but also at a county level. The
main legal base is assured by Law 46/2008
called also The Forest Code.
Decade Severe drought years
1901-1910 1907-1908
1911-1920 1917-1918
1921-1930 1923-1924, 1927-1928
1931-1940 1934-1935
1941-1950 1945-1946, 1947-1948, 1949-1950
1951-1960 1952-1953
1961-1970 1962-1963, 1964-1965
1971-1980 1973-1974, 1975-1976
1981-1990 1982-1983, 1985-1986, 1987-1988
1991-2000 1992-1993, 1999-2000
2001-2010 2000-2001, 2001-2002, 2002- 2003, 2006-2007, 2008-2009
2011-2020 2011-2012
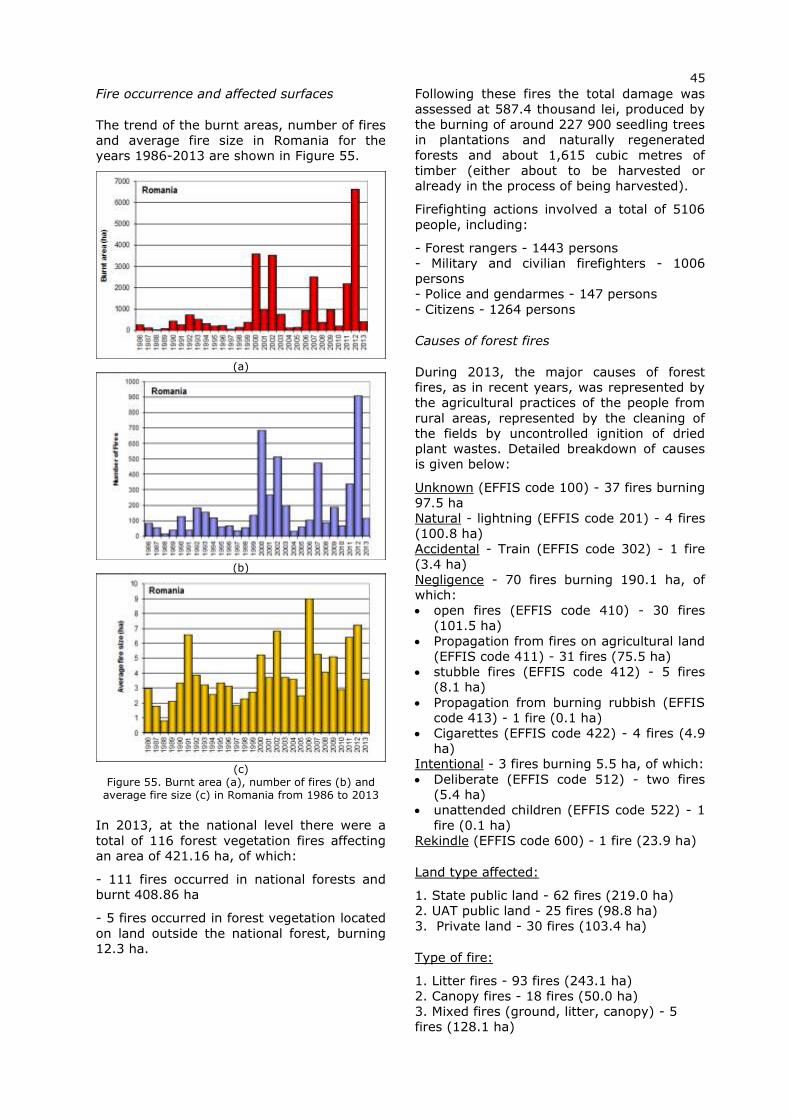
45
Fire occurrence and affected surfaces
The trend of the burnt areas, number of fires
and average fire size in Romania for the
years 1986-2013 are shown in Figure 55.
(a)
(b)
(c)
Figure 55. Burnt area (a), number of fires (b) and average fire size (c) in Romania from 1986 to 2013
In 2013, at the national level there were a
total of 116 forest vegetation fires affecting
an area of 421.16 ha, of which:
- 111 fires occurred in national forests and
burnt 408.86 ha
- 5 fires occurred in forest vegetation located
on land outside the national forest, burning
12.3 ha.
Following these fires the total damage was
assessed at 587.4 thousand lei, produced by
the burning of around 227 900 seedling trees
in plantations and naturally regenerated
forests and about 1,615 cubic metres of
timber (either about to be harvested or
already in the process of being harvested).
Firefighting actions involved a total of 5106
people, including:
- Forest rangers - 1443 persons
- Military and civilian firefighters - 1006
persons
- Police and gendarmes - 147 persons
- Citizens - 1264 persons
Causes of forest fires
During 2013, the major causes of forest
fires, as in recent years, was represented by
the agricultural practices of the people from
rural areas, represented by the cleaning of
the fields by uncontrolled ignition of dried
plant wastes. Detailed breakdown of causes
is given below:
Unknown (EFFIS code 100) - 37 fires burning
97.5 ha
Natural - lightning (EFFIS code 201) - 4 fires
(100.8 ha)
Accidental - Train (EFFIS code 302) - 1 fire
(3.4 ha)
Negligence - 70 fires burning 190.1 ha, of
which:
open fires (EFFIS code 410) - 30 fires
(101.5 ha)
Propagation from fires on agricultural land
(EFFIS code 411) - 31 fires (75.5 ha)
stubble fires (EFFIS code 412) - 5 fires
(8.1 ha)
Propagation from burning rubbish (EFFIS
code 413) - 1 fire (0.1 ha)
Cigarettes (EFFIS code 422) - 4 fires (4.9
ha)
Intentional - 3 fires burning 5.5 ha, of which:
Deliberate (EFFIS code 512) - two fires
(5.4 ha)
unattended children (EFFIS code 522) - 1
fire (0.1 ha)
Rekindle (EFFIS code 600) - 1 fire (23.9 ha)
Land type affected:
1. State public land - 62 fires (219.0 ha)
2. UAT public land - 25 fires (98.8 ha)
3. Private land - 30 fires (103.4 ha)
Type of fire:
1. Litter fires - 93 fires (243.1 ha) 2. Canopy fires - 18 fires (50.0 ha)
3. Mixed fires (ground, litter, canopy) - 5
fires (128.1 ha)
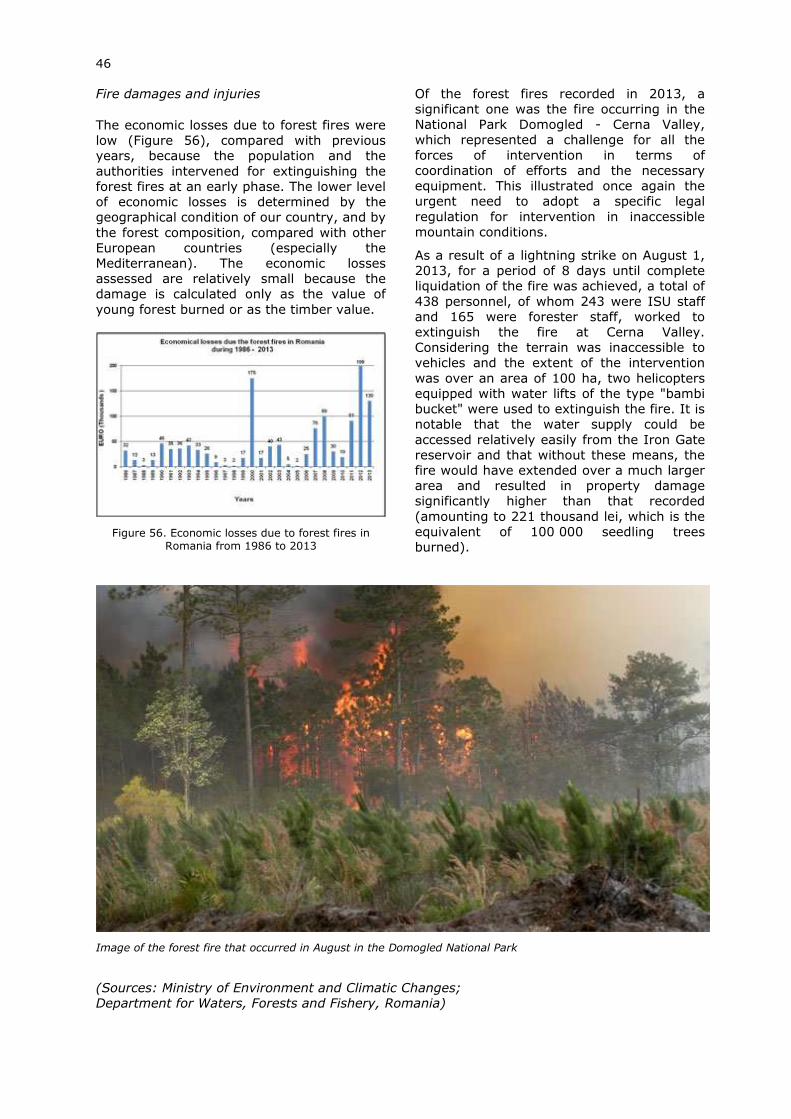
46
Fire damages and injuries
The economic losses due to forest fires were
low (Figure 56), compared with previous
years, because the population and the
authorities intervened for extinguishing the
forest fires at an early phase. The lower level
of economic losses is determined by the
geographical condition of our country, and by
the forest composition, compared with other
European countries (especially the
Mediterranean). The economic losses
assessed are relatively small because the
damage is calculated only as the value of
young forest burned or as the timber value.
Figure 56. Economic losses due to forest fires in Romania from 1986 to 2013
Of the forest fires recorded in 2013, a
significant one was the fire occurring in the
National Park Domogled - Cerna Valley,
which represented a challenge for all the
forces of intervention in terms of
coordination of efforts and the necessary
equipment. This illustrated once again the
urgent need to adopt a specific legal
regulation for intervention in inaccessible
mountain conditions.
As a result of a lightning strike on August 1,
2013, for a period of 8 days until complete
liquidation of the fire was achieved, a total of
438 personnel, of whom 243 were ISU staff
and 165 were forester staff, worked to
extinguish the fire at Cerna Valley.
Considering the terrain was inaccessible to
vehicles and the extent of the intervention
was over an area of 100 ha, two helicopters
equipped with water lifts of the type "bambi
bucket" were used to extinguish the fire. It is
notable that the water supply could be
accessed relatively easily from the Iron Gate
reservoir and that without these means, the
fire would have extended over a much larger
area and resulted in property damage
significantly higher than that recorded
(amounting to 221 thousand lei, which is the
equivalent of 100 000 seedling trees
burned).
Image of the forest fire that occurred in August in the Domogled National Park
(Sources: Ministry of Environment and Climatic Changes;
Department for Waters, Forests and Fishery, Romania)
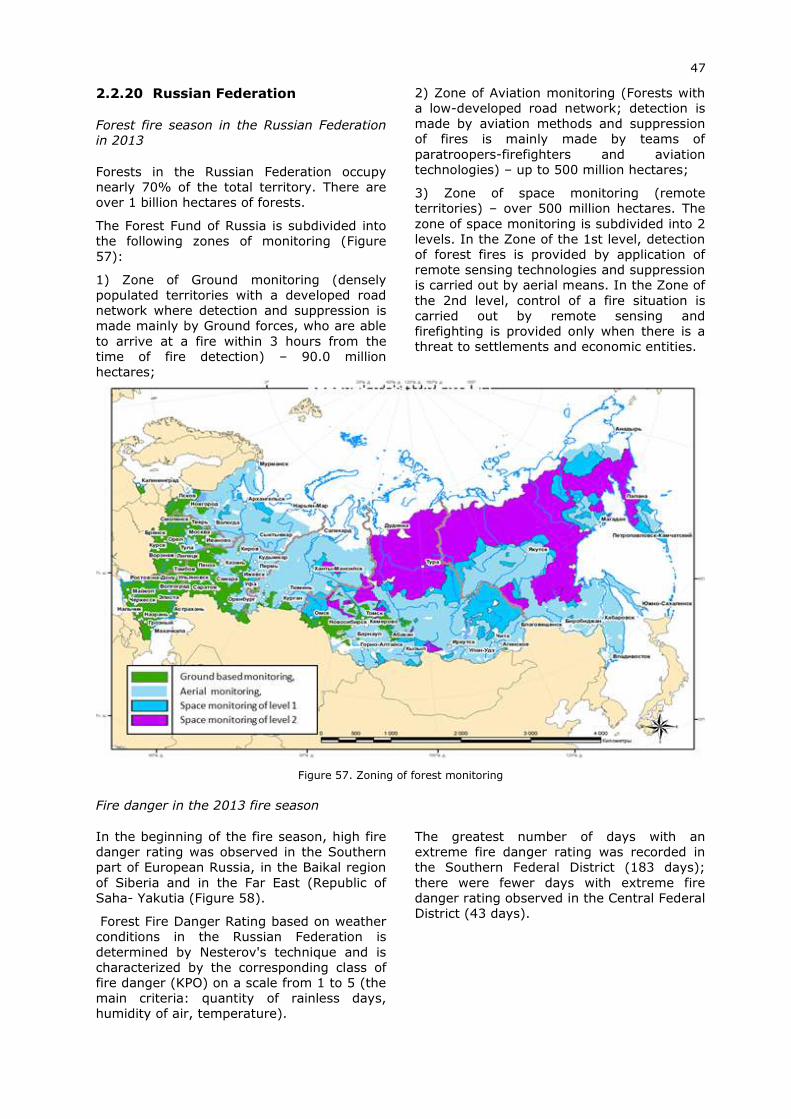
47
2.2.20 Russian Federation
Forest fire season in the Russian Federation
in 2013
Forests in the Russian Federation occupy
nearly 70% of the total territory. There are
over 1 billion hectares of forests.
The Forest Fund of Russia is subdivided into
the following zones of monitoring (Figure
57):
1) Zone of Ground monitoring (densely
populated territories with a developed road
network where detection and suppression is
made mainly by Ground forces, who are able
to arrive at a fire within 3 hours from the
time of fire detection) – 90.0 million
hectares;
2) Zone of Aviation monitoring (Forests with
a low-developed road network; detection is
made by aviation methods and suppression
of fires is mainly made by teams of
paratroopers-firefighters and aviation
technologies) – up to 500 million hectares;
3) Zone of space monitoring (remote
territories) – over 500 million hectares. The
zone of space monitoring is subdivided into 2
levels. In the Zone of the 1st level, detection
of forest fires is provided by application of
remote sensing technologies and suppression
is carried out by aerial means. In the Zone of
the 2nd level, control of a fire situation is
carried out by remote sensing and
firefighting is provided only when there is a
threat to settlements and economic entities.
Figure 57. Zoning of forest monitoring
Fire danger in the 2013 fire season
In the beginning of the fire season, high fire
danger rating was observed in the Southern
part of European Russia, in the Baikal region
of Siberia and in the Far East (Republic of
Saha- Yakutia (Figure 58).
Forest Fire Danger Rating based on weather
conditions in the Russian Federation is
determined by Nesterov's technique and is
characterized by the corresponding class of fire danger (KPO) on a scale from 1 to 5 (the
main criteria: quantity of rainless days,
humidity of air, temperature).
The greatest number of days with an
extreme fire danger rating was recorded in
the Southern Federal District (183 days);
there were fewer days with extreme fire
danger rating observed in the Central Federal
District (43 days).
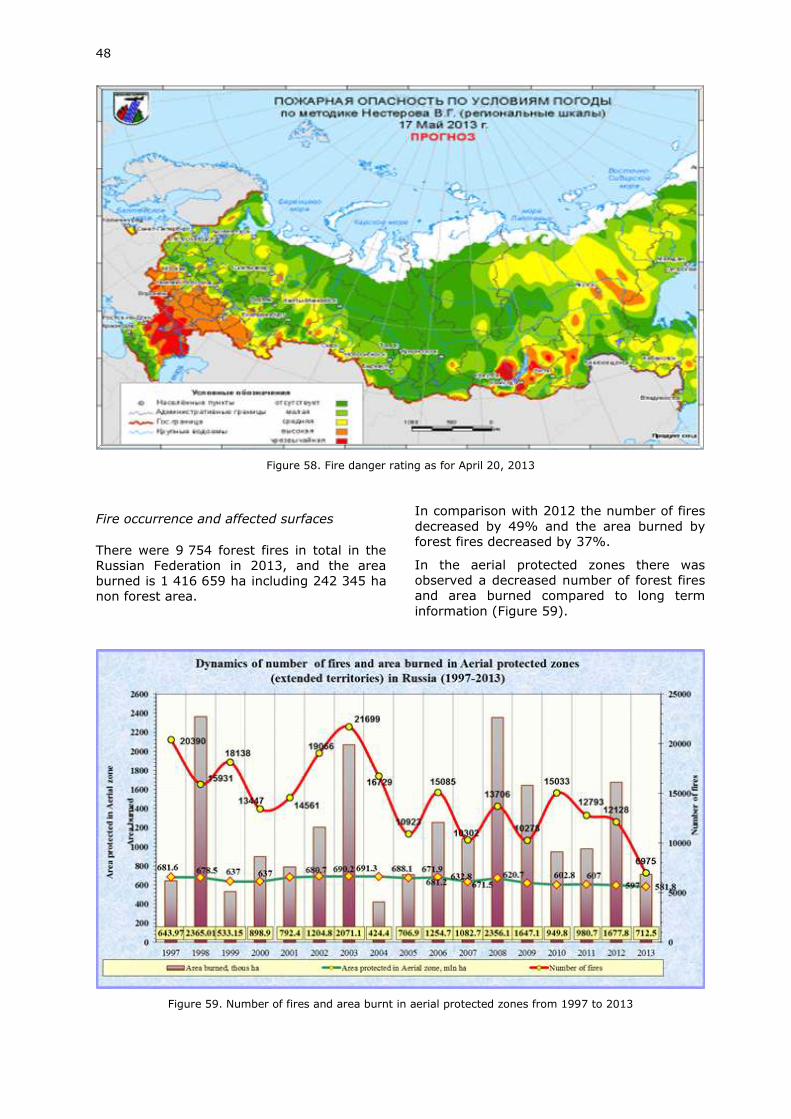
48
Figure 58. Fire danger rating as for April 20, 2013
Fire occurrence and affected surfaces
There were 9 754 forest fires in total in the
Russian Federation in 2013, and the area
burned is 1 416 659 ha including 242 345 ha
non forest area.
In comparison with 2012 the number of fires
decreased by 49% and the area burned by
forest fires decreased by 37%.
In the aerial protected zones there was
observed a decreased number of forest fires
and area burned compared to long term
information (Figure 59).
Figure 59. Number of fires and area burnt in aerial protected zones from 1997 to 2013
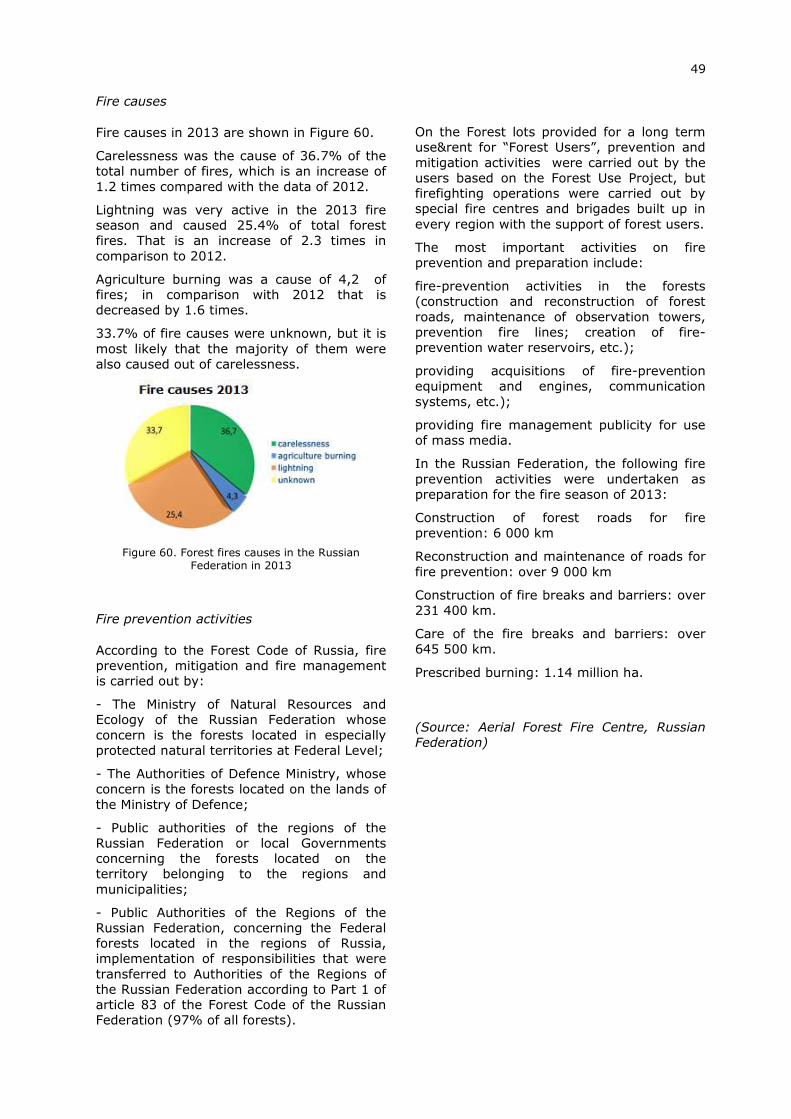
49
Fire causes
Fire causes in 2013 are shown in Figure 60.
Carelessness was the cause of 36.7% of the
total number of fires, which is an increase of
1.2 times compared with the data of 2012.
Lightning was very active in the 2013 fire
season and caused 25.4% of total forest
fires. That is an increase of 2.3 times in
comparison to 2012.
Agriculture burning was a cause of 4,2 of
fires; in comparison with 2012 that is
decreased by 1.6 times.
33.7% of fire causes were unknown, but it is
most likely that the majority of them were
also caused out of carelessness.
Figure 60. Forest fires causes in the Russian Federation in 2013
Fire prevention activities
According to the Forest Code of Russia, fire
prevention, mitigation and fire management
is carried out by:
- The Ministry of Natural Resources and
Ecology of the Russian Federation whose
concern is the forests located in especially
protected natural territories at Federal Level;
- The Authorities of Defence Ministry, whose
concern is the forests located on the lands of
the Ministry of Defence;
- Public authorities of the regions of the
Russian Federation or local Governments
concerning the forests located on the
territory belonging to the regions and
municipalities;
- Public Authorities of the Regions of the
Russian Federation, concerning the Federal
forests located in the regions of Russia,
implementation of responsibilities that were
transferred to Authorities of the Regions of
the Russian Federation according to Part 1 of
article 83 of the Forest Code of the Russian
Federation (97% of all forests).
On the Forest lots provided for a long term
use&rent for “Forest Users”, prevention and
mitigation activities were carried out by the
users based on the Forest Use Project, but
firefighting operations were carried out by
special fire centres and brigades built up in
every region with the support of forest users.
The most important activities on fire
prevention and preparation include:
fire-prevention activities in the forests
(construction and reconstruction of forest
roads, maintenance of observation towers,
prevention fire lines; creation of fire-
prevention water reservoirs, etc.);
providing acquisitions of fire-prevention
equipment and engines, communication
systems, etc.);
providing fire management publicity for use
of mass media.
In the Russian Federation, the following fire
prevention activities were undertaken as
preparation for the fire season of 2013:
Construction of forest roads for fire
prevention: 6 000 km
Reconstruction and maintenance of roads for
fire prevention: over 9 000 km
Construction of fire breaks and barriers: over
231 400 km.
Care of the fire breaks and barriers: over
645 500 km.
Prescribed burning: 1.14 million ha.
(Source: Aerial Forest Fire Centre, Russian
Federation)
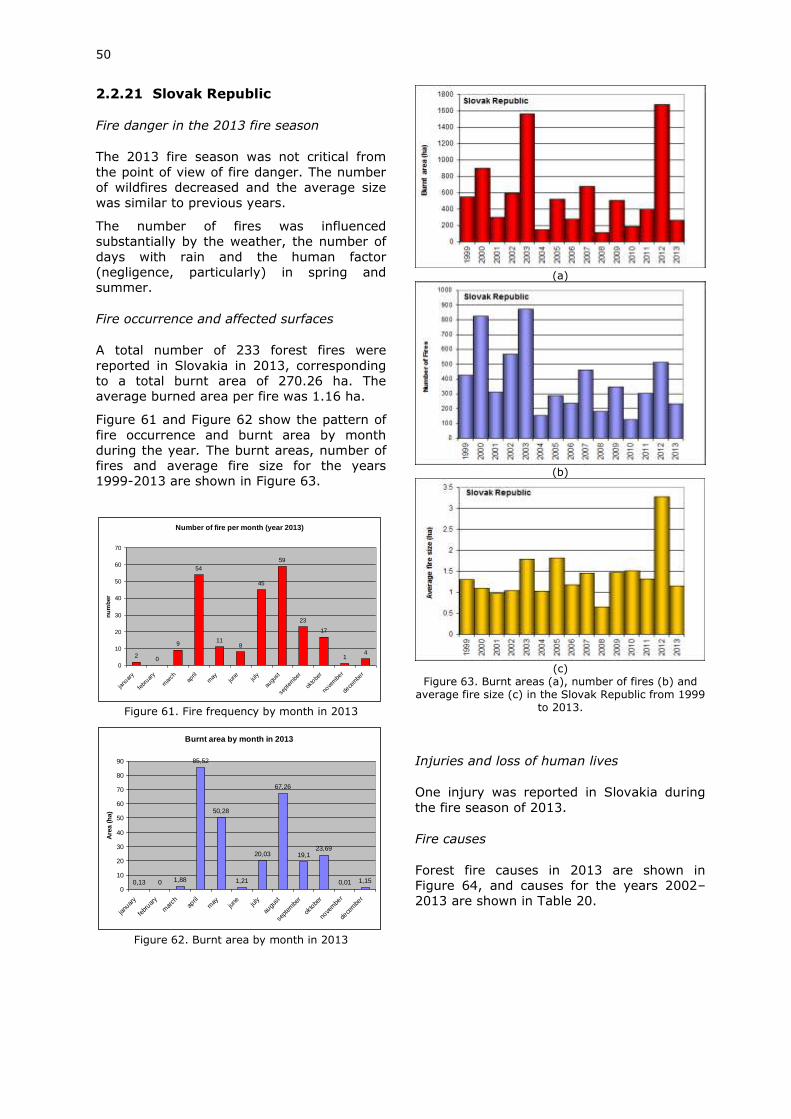
50
2.2.21 Slovak Republic
Fire danger in the 2013 fire season
The 2013 fire season was not critical from
the point of view of fire danger. The number
of wildfires decreased and the average size
was similar to previous years.
The number of fires was influenced
substantially by the weather, the number of
days with rain and the human factor
(negligence, particularly) in spring and
summer.
Fire occurrence and affected surfaces
A total number of 233 forest fires were
reported in Slovakia in 2013, corresponding
to a total burnt area of 270.26 ha. The
average burned area per fire was 1.16 ha.
Figure 61 and Figure 62 show the pattern of
fire occurrence and burnt area by month
during the year. The burnt areas, number of
fires and average fire size for the years
1999-2013 are shown in Figure 63.
Figure 61. Fire frequency by month in 2013
Figure 62. Burnt area by month in 2013
(a)
(b)
(c)
Figure 63. Burnt areas (a), number of fires (b) and average fire size (c) in the Slovak Republic from 1999
to 2013.
Injuries and loss of human lives
One injury was reported in Slovakia during
the fire season of 2013.
Fire causes
Forest fire causes in 2013 are shown in
Figure 64, and causes for the years 2002–
2013 are shown in Table 20.
Number of fire per month (year 2013)
20
9
54
118
45
59
23
17
14
0
10
20
30
40
50
60
70
janu
ary
febr
uary
mar
chap
ril
may
june ju
ly
augu
st
sept
embe
r
okto
ber
nove
mbe
r
dece
mbe
r
nu
mb
er
Burnt area by month in 2013
0,13 0 1,88
85,52
50,28
1,21
20,03
67,26
19,123,69
0,01 1,15
0
10
20
30
40
50
60
70
80
90
janu
ary
febr
uary
mar
chap
ril
may
june ju
ly
augu
st
sept
embe
r
okto
ber
nove
mbe
r
dece
mbe
r
Are
a (
ha)
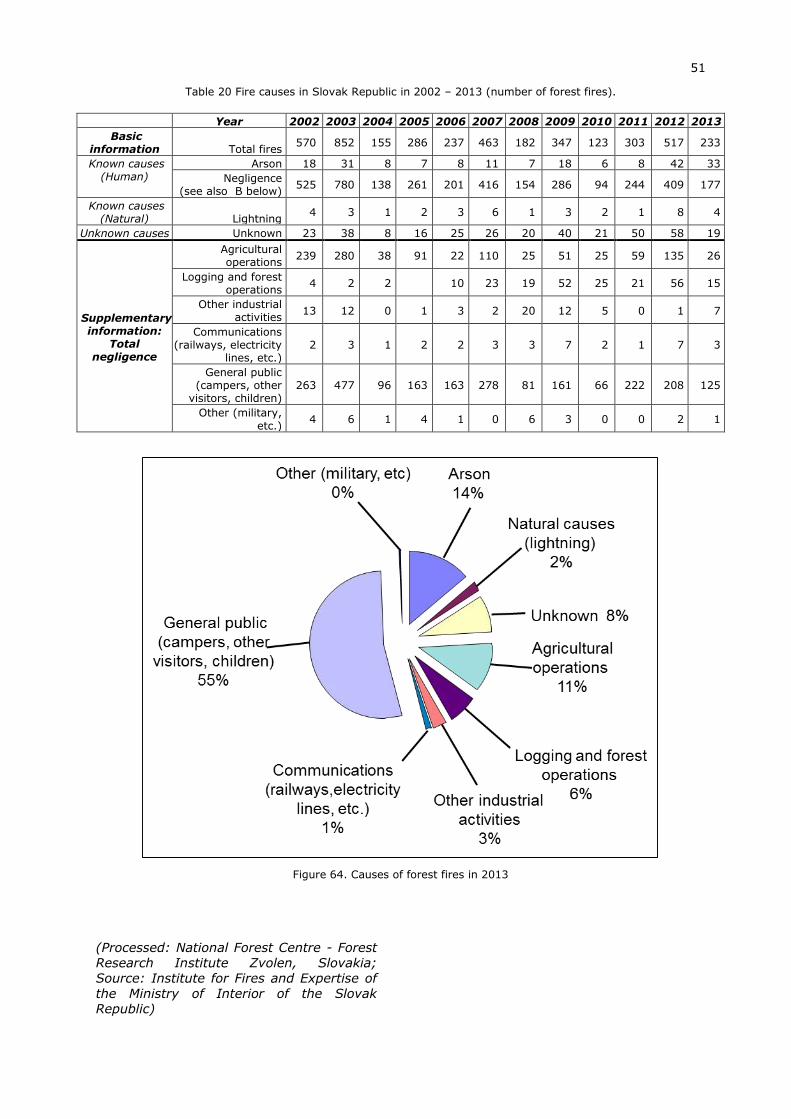
51
Table 20 Fire causes in Slovak Republic in 2002 – 2013 (number of forest fires).
Figure 64. Causes of forest fires in 2013
(Processed: National Forest Centre - Forest
Research Institute Zvolen, Slovakia;
Source: Institute for Fires and Expertise of the Ministry of Interior of the Slovak
Republic)
Year 2002 2003 2004 2005 2006 2007 2008 2009 2010 2011 2012 2013
Basic information Total fires
570 852 155 286 237 463 182 347 123 303 517 233
Known causes (Human)
Arson 18 31 8 7 8 11 7 18 6 8 42 33
Negligence (see also B below)
525 780 138 261 201 416 154 286 94 244 409 177
Known causes (Natural) Lightning
4 3 1 2 3 6 1 3 2 1 8 4
Unknown causes Unknown 23 38 8 16 25 26 20 40 21 50 58 19
Supplementary information:
Total negligence
Agricultural operations
239 280 38 91 22 110 25 51 25 59 135 26
Logging and forest operations
4 2 2 10 23 19 52 25 21 56 15
Other industrial activities
13 12 0 1 3 2 20 12 5 0 1 7
Communications (railways, electricity
lines, etc.) 2 3 1 2 2 3 3 7 2 1 7 3
General public (campers, other
visitors, children) 263 477 96 163 163 278 81 161 66 222 208 125
Other (military,
etc.) 4 6 1 4 1 0 6 3 0 0 2 1
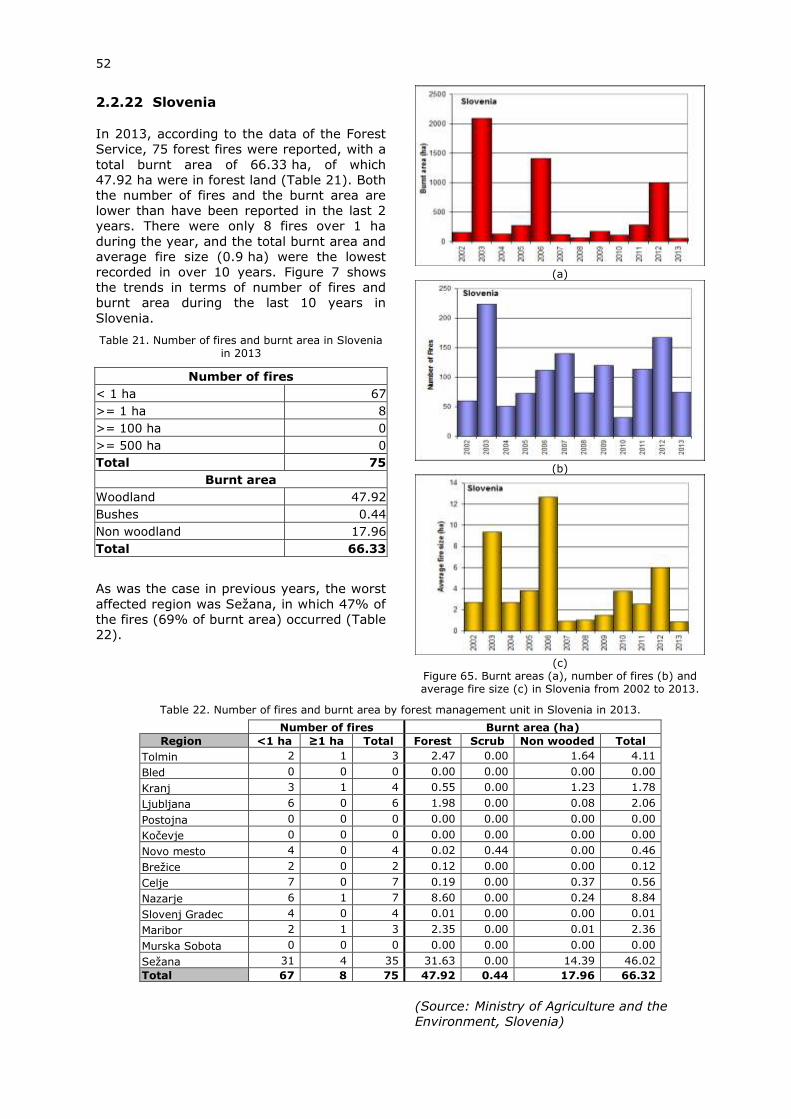
52
2.2.22 Slovenia
In 2013, according to the data of the Forest
Service, 75 forest fires were reported, with a
total burnt area of 66.33 ha, of which
47.92 ha were in forest land (Table 21). Both
the number of fires and the burnt area are
lower than have been reported in the last 2
years. There were only 8 fires over 1 ha
during the year, and the total burnt area and
average fire size (0.9 ha) were the lowest
recorded in over 10 years. Figure 7 shows
the trends in terms of number of fires and
burnt area during the last 10 years in
Slovenia.
Table 21. Number of fires and burnt area in Slovenia in 2013
Number of fires
< 1 ha 67
>= 1 ha 8
>= 100 ha 0
>= 500 ha 0
Total 75
Burnt area
Woodland 47.92
Bushes 0.44
Non woodland 17.96
Total 66.33
As was the case in previous years, the worst
affected region was Sežana, in which 47% of
the fires (69% of burnt area) occurred (Table
22).
(a)
(b)
(c)
Figure 65. Burnt areas (a), number of fires (b) and average fire size (c) in Slovenia from 2002 to 2013.
Table 22. Number of fires and burnt area by forest management unit in Slovenia in 2013.
Number of fires Burnt area (ha)
Region <1 ha ≥1 ha Total Forest Scrub Non wooded Total
Tolmin 2 1 3 2.47 0.00 1.64 4.11
Bled 0 0 0 0.00 0.00 0.00 0.00
Kranj 3 1 4 0.55 0.00 1.23 1.78
Ljubljana 6 0 6 1.98 0.00 0.08 2.06
Postojna 0 0 0 0.00 0.00 0.00 0.00
Kočevje 0 0 0 0.00 0.00 0.00 0.00
Novo mesto 4 0 4 0.02 0.44 0.00 0.46
Brežice 2 0 2 0.12 0.00 0.00 0.12
Celje 7 0 7 0.19 0.00 0.37 0.56
Nazarje 6 1 7 8.60 0.00 0.24 8.84
Slovenj Gradec 4 0 4 0.01 0.00 0.00 0.01
Maribor 2 1 3 2.35 0.00 0.01 2.36
Murska Sobota 0 0 0 0.00 0.00 0.00 0.00
Sežana 31 4 35 31.63 0.00 14.39 46.02
Total 67 8 75 47.92 0.44 17.96 66.32
(Source: Ministry of Agriculture and the
Environment, Slovenia)
53
2.2.23 Spain
Fire danger in the 2013 fire season
High rainfall in the first three months of the
year meant that the fire risk remained low,
even though temperatures were above
average in January. In March the rainfall was
three times the normal value.
In April the fire risk was variable depending
on the weather. Although rainfall was normal
(65 mm), there was dry weather during the
second and third week. Meanwhile,
temperatures were above normal, with an
average monthly temperature 0.5°C above
the average for this month.
Compared to other years, the month of May
was cooler and drier than normal. Fire risk
remained low throughout much of the month
except for the first week in the northern third
of the mainland, where high risk was
registered. On 14th May, the first major fire
of the season occurred, which took place in
Valdefresno (León).
June was also slightly cooler and drier than
normal, which allowed the fire risk to stay
low during most of the month. The risk
gradually increased to moderate or even
high levels during the last week of June, due
to rising temperatures, especially in the
western half of the peninsula.
In July it was very warm. Precipitation was at
normal levels. This month there were some
episodes of very heavy rainfall, the most
significant being on the 13th, which affected
areas of inland Catalonia.
The month of August was very warm in
Galicia, Navarra, Madrid, Extremadura,
Andalusia, Castilla la Mancha, Canarias and
eastern Catalonia. In the rest of Spain
temperatures were normal or slightly warmer
than normal. Precipitation distribution was
normal but uneven.
In September, temperatures were above
normal and there was no heavy widespread
rainfall until the end of the month (from 27th)
with the input of the first Atlantic front. This
weather situation raised fire danger in most
regions of the peninsular west, while in the
east of the peninsula there were
thunderstorms. In Galicia in particular, the
fire danger rose throughout the month due
to lack of rainfall and some episodes of
drying winds, especially in areas of the Rias
Baixas and the province of Orense.
Despite the high temperatures recorded
during the month of October, the risk of fire
remained generally low. Only during the
second half of the month and in certain
locations was this risk moderate or high,
mainly in the eastern third of the peninsula,
around Biscay and the Canary Islands, and
mainly caused by the prolonged absence of
rain and offshore winds.
The risk of forest fires in November was high
in the first two weeks and was limited
geographically to the Mediterranean area. In
the second half of the month the risk
virtually disappeared, remaining slightly
higher on 21-23 in areas of Murcia and
Valencia.
In December fire risk was generally low
throughout the month. Only on some days,
due to strong winds, the risk rose in localized
areas of Galicia, Valencia and Andalusia.
Number of fires and affected surfaces
In 2013, both the total number of fires and
the burnt area was well below the average
for the previous decade. The total number of
fires was 35% less than the decade average,
with small fires (≤1 ha) down by 28% and fires of >1 ha down by 50%.
Table 23. Number of fires in 2013 compared with 10 year average
Average 2003-2012
2013
Number of fires <1ha 10 772 7 744
Number of fires ≥1ha 5 800 2 882
Total 16 572 10 626
There was a 60% reduction in forest burnt
area and a 53% reduction in total burnt area
with respect to the mean.
Table 24. Burnt area in 2013 compared with the 10 year average
Average 2003-2012
2013
Burnt area forest (ha) 43 714.44 17 273.60
Total burnt area (ha) 126 600.21 58 985.02
The yearly trends in terms of numbers of
fires and burnt areas during the last 32 years
in Spain are shown in Figure 66.
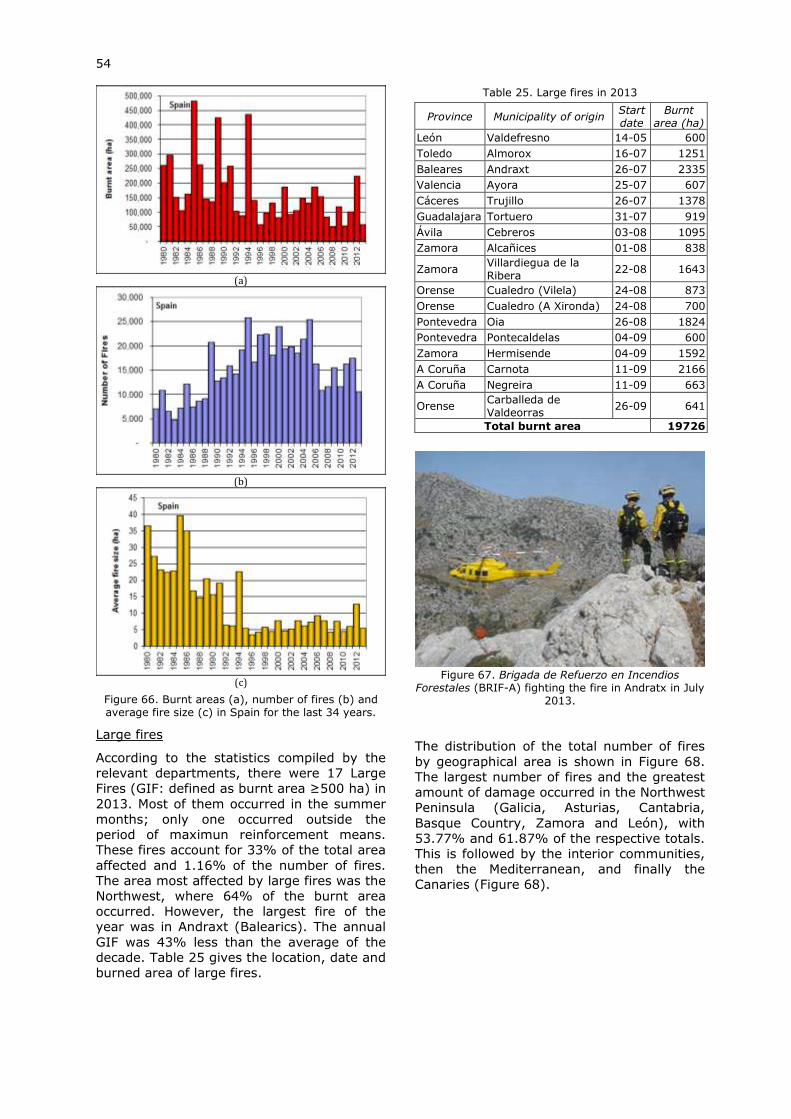
54
(a)
(b)
(c)
Figure 66. Burnt areas (a), number of fires (b) and average fire size (c) in Spain for the last 34 years.
Large fires
According to the statistics compiled by the
relevant departments, there were 17 Large
Fires (GIF: defined as burnt area ≥500 ha) in
2013. Most of them occurred in the summer
months; only one occurred outside the
period of maximun reinforcement means.
These fires account for 33% of the total area
affected and 1.16% of the number of fires.
The area most affected by large fires was the
Northwest, where 64% of the burnt area
occurred. However, the largest fire of the
year was in Andraxt (Balearics). The annual
GIF was 43% less than the average of the
decade. Table 25 gives the location, date and
burned area of large fires.
Table 25. Large fires in 2013
Province Municipality of origin Start date
Burnt area (ha)
León Valdefresno 14-05 600
Toledo Almorox 16-07 1251
Baleares Andraxt 26-07 2335
Valencia Ayora 25-07 607
Cáceres Trujillo 26-07 1378
Guadalajara Tortuero 31-07 919
Ávila Cebreros 03-08 1095
Zamora Alcañices 01-08 838
Zamora Villardiegua de la Ribera
22-08 1643
Orense Cualedro (Vilela) 24-08 873
Orense Cualedro (A Xironda) 24-08 700
Pontevedra Oia 26-08 1824
Pontevedra Pontecaldelas 04-09 600
Zamora Hermisende 04-09 1592
A Coruña Carnota 11-09 2166
A Coruña Negreira 11-09 663
Orense Carballeda de Valdeorras
26-09 641
Total burnt area 19726
Figure 67. Brigada de Refuerzo en Incendios
Forestales (BRIF-A) fighting the fire in Andratx in July 2013.
The distribution of the total number of fires
by geographical area is shown in Figure 68.
The largest number of fires and the greatest
amount of damage occurred in the Northwest
Peninsula (Galicia, Asturias, Cantabria,
Basque Country, Zamora and León), with
53.77% and 61.87% of the respective totals.
This is followed by the interior communities,
then the Mediterranean, and finally the
Canaries (Figure 68).
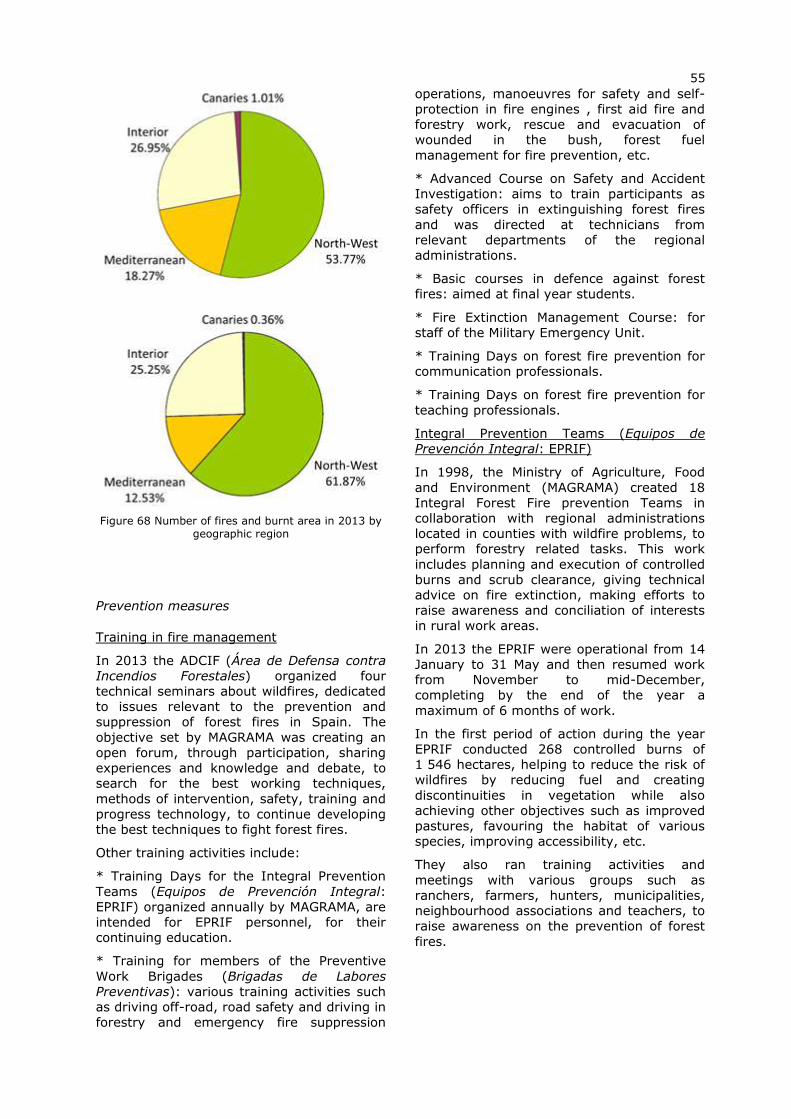
55
Figure 68 Number of fires and burnt area in 2013 by
geographic region
Prevention measures
Training in fire management
In 2013 the ADCIF (Área de Defensa contra
Incendios Forestales) organized four
technical seminars about wildfires, dedicated
to issues relevant to the prevention and
suppression of forest fires in Spain. The
objective set by MAGRAMA was creating an
open forum, through participation, sharing
experiences and knowledge and debate, to
search for the best working techniques,
methods of intervention, safety, training and
progress technology, to continue developing
the best techniques to fight forest fires.
Other training activities include:
* Training Days for the Integral Prevention
Teams (Equipos de Prevención Integral:
EPRIF) organized annually by MAGRAMA, are
intended for EPRIF personnel, for their
continuing education.
* Training for members of the Preventive
Work Brigades (Brigadas de Labores Preventivas): various training activities such
as driving off-road, road safety and driving in
forestry and emergency fire suppression
operations, manoeuvres for safety and self-
protection in fire engines , first aid fire and
forestry work, rescue and evacuation of
wounded in the bush, forest fuel
management for fire prevention, etc.
* Advanced Course on Safety and Accident
Investigation: aims to train participants as
safety officers in extinguishing forest fires
and was directed at technicians from
relevant departments of the regional
administrations.
* Basic courses in defence against forest
fires: aimed at final year students.
* Fire Extinction Management Course: for
staff of the Military Emergency Unit.
* Training Days on forest fire prevention for
communication professionals.
* Training Days on forest fire prevention for
teaching professionals.
Integral Prevention Teams (Equipos de
Prevención Integral: EPRIF)
In 1998, the Ministry of Agriculture, Food
and Environment (MAGRAMA) created 18
Integral Forest Fire prevention Teams in
collaboration with regional administrations
located in counties with wildfire problems, to
perform forestry related tasks. This work
includes planning and execution of controlled
burns and scrub clearance, giving technical
advice on fire extinction, making efforts to
raise awareness and conciliation of interests
in rural work areas.
In 2013 the EPRIF were operational from 14
January to 31 May and then resumed work
from November to mid-December,
completing by the end of the year a
maximum of 6 months of work.
In the first period of action during the year
EPRIF conducted 268 controlled burns of
1 546 hectares, helping to reduce the risk of
wildfires by reducing fuel and creating
discontinuities in vegetation while also
achieving other objectives such as improved
pastures, favouring the habitat of various
species, improving accessibility, etc.
They also ran training activities and
meetings with various groups such as
ranchers, farmers, hunters, municipalities,
neighbourhood associations and teachers, to
raise awareness on the prevention of forest
fires.
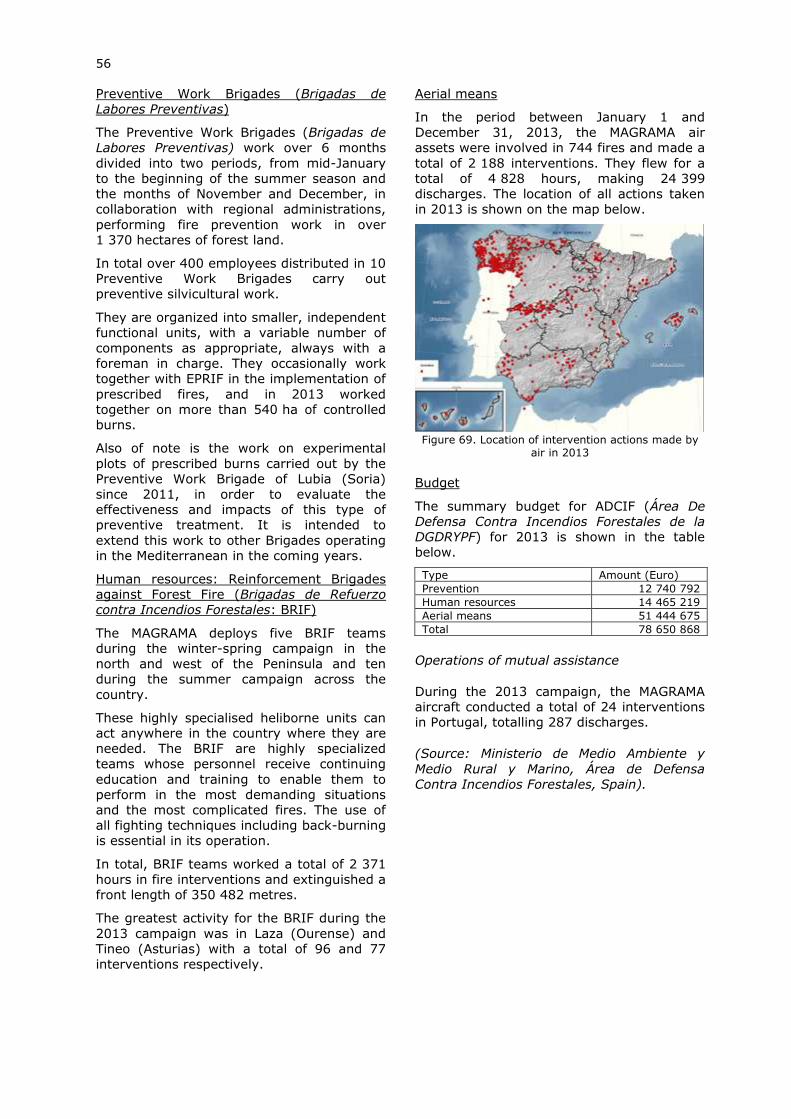
56
Preventive Work Brigades (Brigadas de
Labores Preventivas)
The Preventive Work Brigades (Brigadas de
Labores Preventivas) work over 6 months
divided into two periods, from mid-January
to the beginning of the summer season and
the months of November and December, in
collaboration with regional administrations,
performing fire prevention work in over
1 370 hectares of forest land.
In total over 400 employees distributed in 10
Preventive Work Brigades carry out
preventive silvicultural work.
They are organized into smaller, independent
functional units, with a variable number of
components as appropriate, always with a
foreman in charge. They occasionally work
together with EPRIF in the implementation of
prescribed fires, and in 2013 worked
together on more than 540 ha of controlled
burns.
Also of note is the work on experimental
plots of prescribed burns carried out by the
Preventive Work Brigade of Lubia (Soria)
since 2011, in order to evaluate the
effectiveness and impacts of this type of
preventive treatment. It is intended to
extend this work to other Brigades operating
in the Mediterranean in the coming years.
Human resources: Reinforcement Brigades
against Forest Fire (Brigadas de Refuerzo
contra Incendios Forestales: BRIF)
The MAGRAMA deploys five BRIF teams
during the winter-spring campaign in the
north and west of the Peninsula and ten
during the summer campaign across the
country.
These highly specialised heliborne units can
act anywhere in the country where they are
needed. The BRIF are highly specialized
teams whose personnel receive continuing
education and training to enable them to
perform in the most demanding situations
and the most complicated fires. The use of
all fighting techniques including back-burning
is essential in its operation.
In total, BRIF teams worked a total of 2 371
hours in fire interventions and extinguished a
front length of 350 482 metres.
The greatest activity for the BRIF during the
2013 campaign was in Laza (Ourense) and
Tineo (Asturias) with a total of 96 and 77
interventions respectively.
Aerial means
In the period between January 1 and
December 31, 2013, the MAGRAMA air
assets were involved in 744 fires and made a
total of 2 188 interventions. They flew for a
total of 4 828 hours, making 24 399
discharges. The location of all actions taken
in 2013 is shown on the map below.
Figure 69. Location of intervention actions made by
air in 2013
Budget
The summary budget for ADCIF (Área De
Defensa Contra Incendios Forestales de la
DGDRYPF) for 2013 is shown in the table
below.
Type Amount (Euro)
Prevention 12 740 792
Human resources 14 465 219
Aerial means 51 444 675
Total 78 650 868
Operations of mutual assistance
During the 2013 campaign, the MAGRAMA
aircraft conducted a total of 24 interventions
in Portugal, totalling 287 discharges.
(Source: Ministerio de Medio Ambiente y
Medio Rural y Marino, Área de Defensa
Contra Incendios Forestales, Spain).
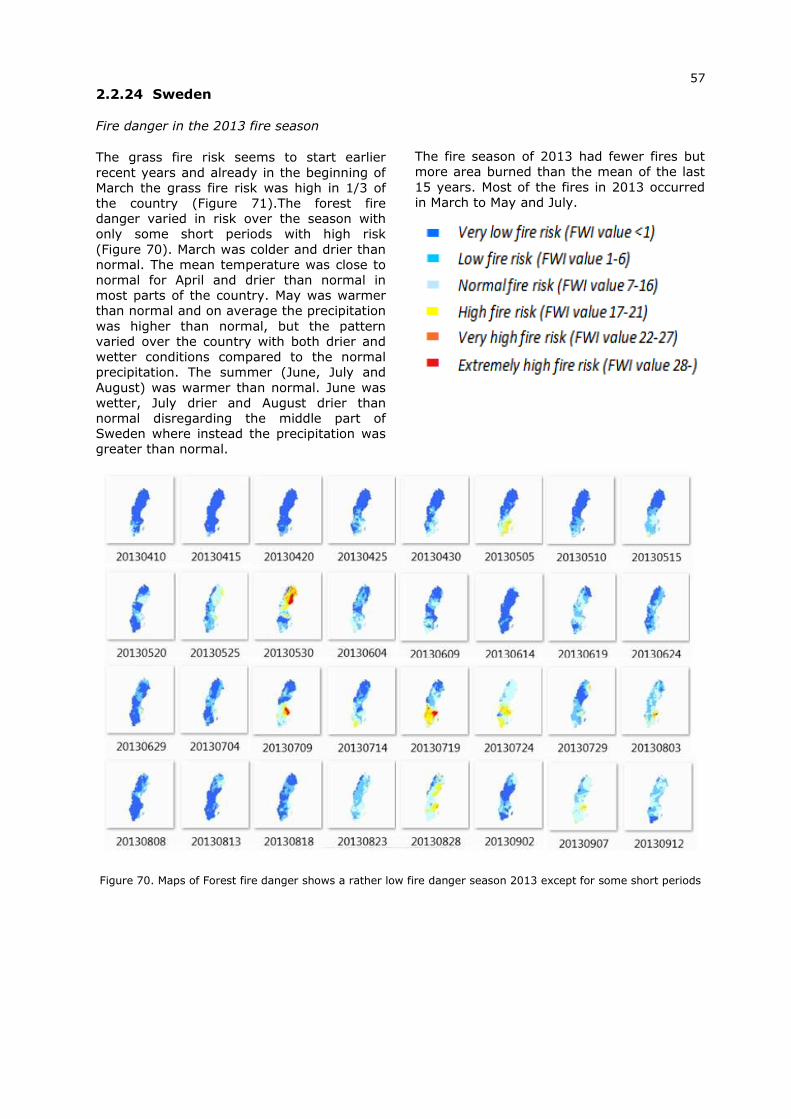
57
2.2.24 Sweden
Fire danger in the 2013 fire season
The grass fire risk seems to start earlier
recent years and already in the beginning of
March the grass fire risk was high in 1/3 of
the country (Figure 71).The forest fire
danger varied in risk over the season with
only some short periods with high risk
(Figure 70). March was colder and drier than
normal. The mean temperature was close to
normal for April and drier than normal in
most parts of the country. May was warmer
than normal and on average the precipitation
was higher than normal, but the pattern
varied over the country with both drier and
wetter conditions compared to the normal
precipitation. The summer (June, July and
August) was warmer than normal. June was
wetter, July drier and August drier than
normal disregarding the middle part of
Sweden where instead the precipitation was
greater than normal.
The fire season of 2013 had fewer fires but
more area burned than the mean of the last
15 years. Most of the fires in 2013 occurred
in March to May and July.
Figure 70. Maps of Forest fire danger shows a rather low fire danger season 2013 except for some short periods
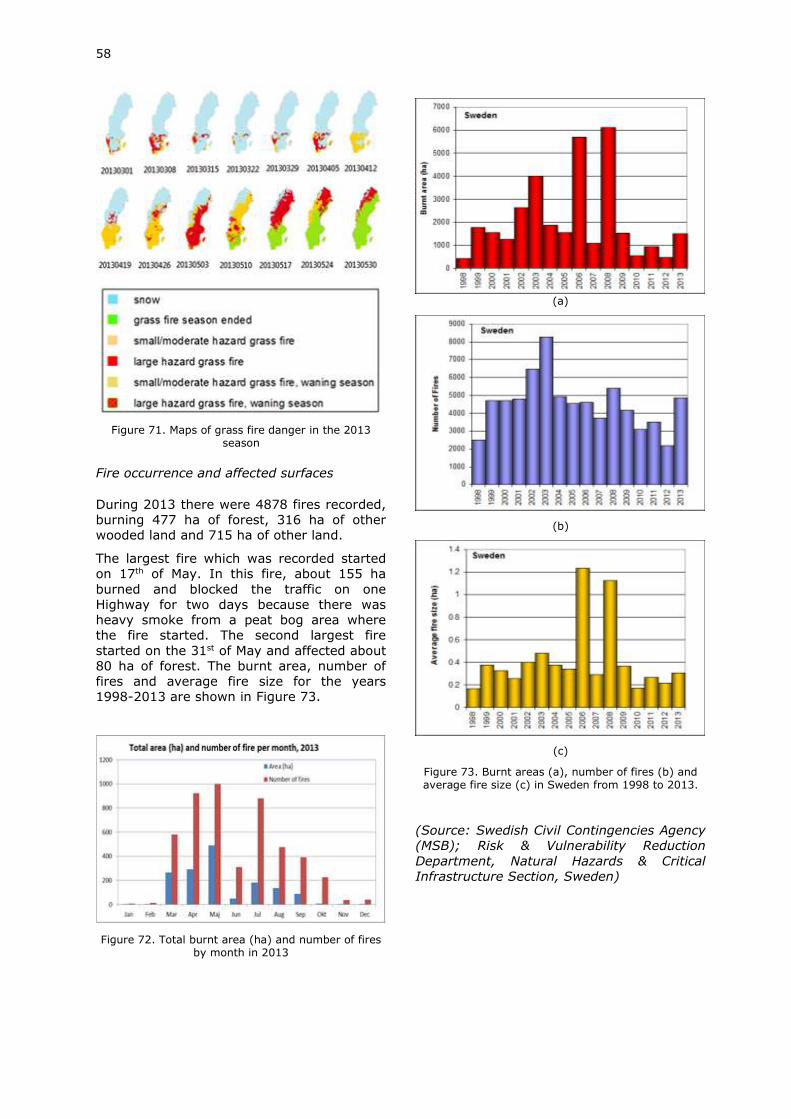
58
Figure 71. Maps of grass fire danger in the 2013 season
Fire occurrence and affected surfaces
During 2013 there were 4878 fires recorded,
burning 477 ha of forest, 316 ha of other
wooded land and 715 ha of other land.
The largest fire which was recorded started
on 17th of May. In this fire, about 155 ha
burned and blocked the traffic on one
Highway for two days because there was
heavy smoke from a peat bog area where
the fire started. The second largest fire
started on the 31st of May and affected about
80 ha of forest. The burnt area, number of
fires and average fire size for the years
1998-2013 are shown in Figure 73.
Figure 72. Total burnt area (ha) and number of fires by month in 2013
(a)
(b)
(c)
Figure 73. Burnt areas (a), number of fires (b) and average fire size (c) in Sweden from 1998 to 2013.
(Source: Swedish Civil Contingencies Agency
(MSB); Risk & Vulnerability Reduction
Department, Natural Hazards & Critical
Infrastructure Section, Sweden)
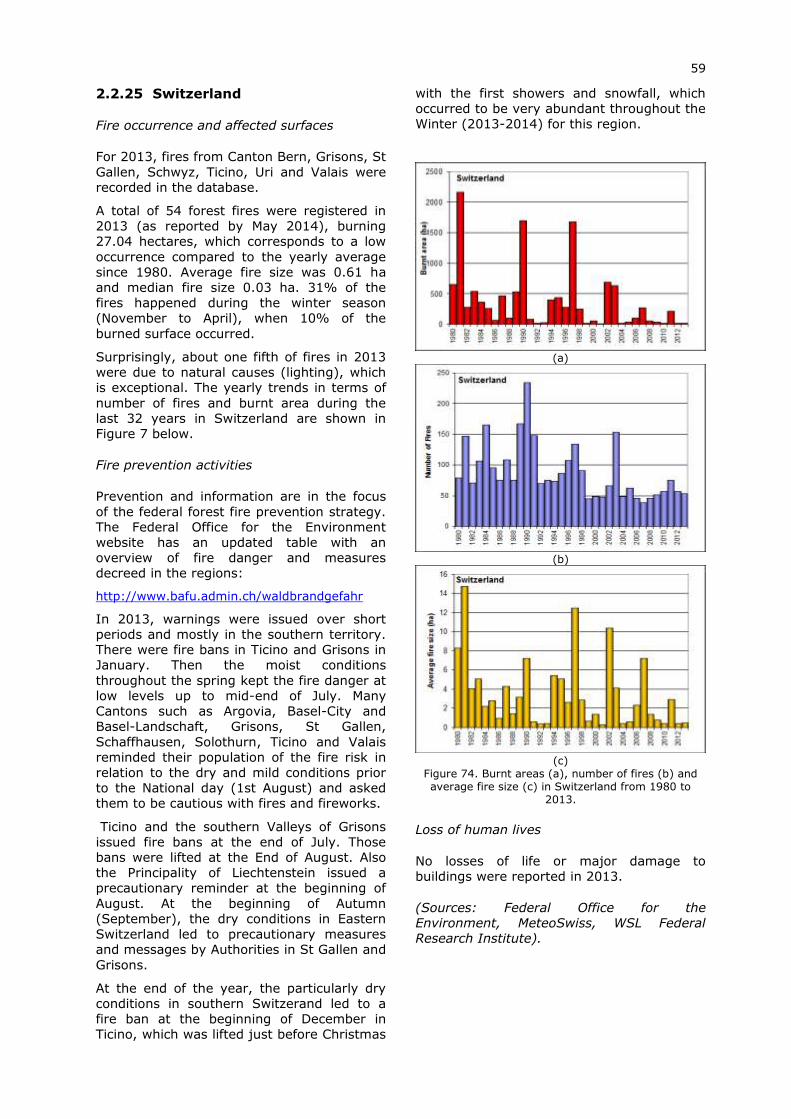
59
2.2.25 Switzerland
Fire occurrence and affected surfaces
For 2013, fires from Canton Bern, Grisons, St
Gallen, Schwyz, Ticino, Uri and Valais were
recorded in the database.
A total of 54 forest fires were registered in
2013 (as reported by May 2014), burning
27.04 hectares, which corresponds to a low
occurrence compared to the yearly average
since 1980. Average fire size was 0.61 ha
and median fire size 0.03 ha. 31% of the
fires happened during the winter season
(November to April), when 10% of the
burned surface occurred.
Surprisingly, about one fifth of fires in 2013
were due to natural causes (lighting), which
is exceptional. The yearly trends in terms of
number of fires and burnt area during the
last 32 years in Switzerland are shown in
Figure 7 below.
Fire prevention activities
Prevention and information are in the focus
of the federal forest fire prevention strategy.
The Federal Office for the Environment
website has an updated table with an
overview of fire danger and measures
decreed in the regions:
http://www.bafu.admin.ch/waldbrandgefahr
In 2013, warnings were issued over short
periods and mostly in the southern territory.
There were fire bans in Ticino and Grisons in
January. Then the moist conditions
throughout the spring kept the fire danger at
low levels up to mid-end of July. Many
Cantons such as Argovia, Basel-City and
Basel-Landschaft, Grisons, St Gallen,
Schaffhausen, Solothurn, Ticino and Valais
reminded their population of the fire risk in
relation to the dry and mild conditions prior
to the National day (1st August) and asked
them to be cautious with fires and fireworks.
Ticino and the southern Valleys of Grisons
issued fire bans at the end of July. Those
bans were lifted at the End of August. Also
the Principality of Liechtenstein issued a
precautionary reminder at the beginning of
August. At the beginning of Autumn
(September), the dry conditions in Eastern
Switzerland led to precautionary measures
and messages by Authorities in St Gallen and
Grisons.
At the end of the year, the particularly dry
conditions in southern Switzerand led to a
fire ban at the beginning of December in
Ticino, which was lifted just before Christmas
with the first showers and snowfall, which
occurred to be very abundant throughout the
Winter (2013-2014) for this region.
(a)
(b)
(c)
Figure 74. Burnt areas (a), number of fires (b) and average fire size (c) in Switzerland from 1980 to
2013.
Loss of human lives
No losses of life or major damage to
buildings were reported in 2013.
(Sources: Federal Office for the
Environment, MeteoSwiss, WSL Federal
Research Institute).
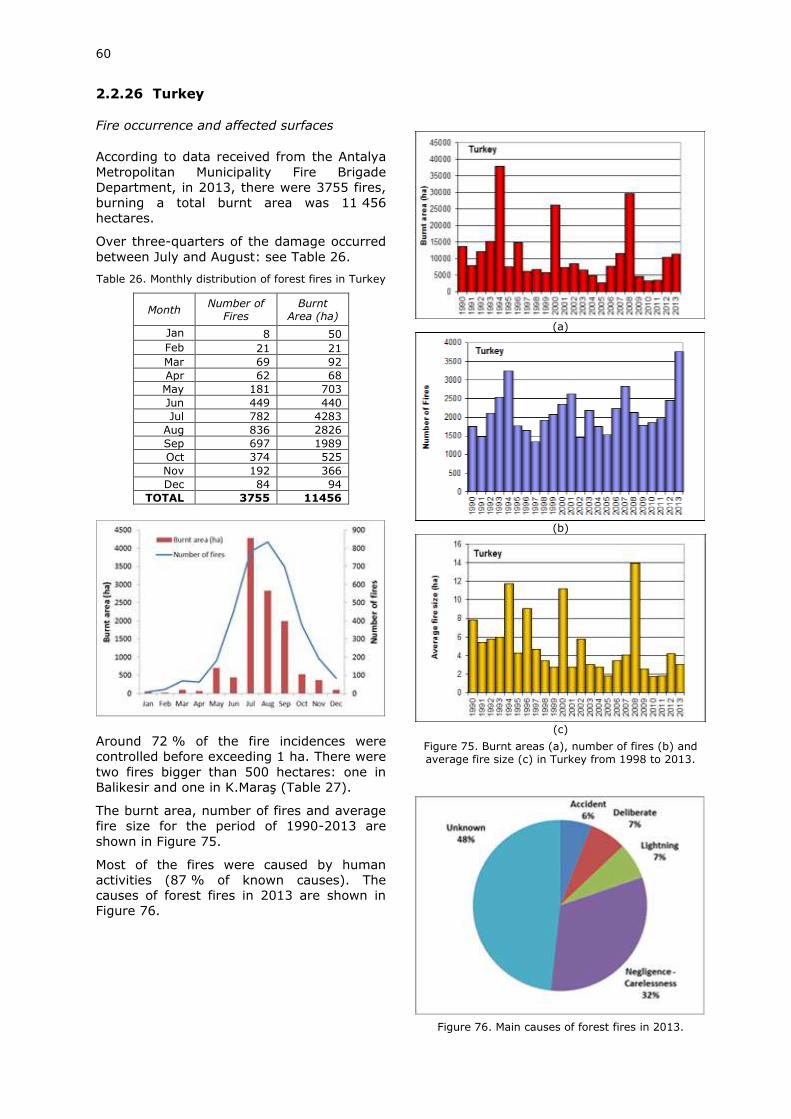
60
2.2.26 Turkey
Fire occurrence and affected surfaces
According to data received from the Antalya
Metropolitan Municipality Fire Brigade
Department, in 2013, there were 3755 fires,
burning a total burnt area was 11 456
hectares.
Over three-quarters of the damage occurred
between July and August: see Table 26.
Table 26. Monthly distribution of forest fires in Turkey
Month Number of
Fires Burnt
Area (ha)
Jan 8 50
Feb 21 21
Mar 69 92
Apr 62 68
May 181 703
Jun 449 440
Jul 782 4283
Aug 836 2826
Sep 697 1989
Oct 374 525
Nov 192 366
Dec 84 94
TOTAL 3755 11456
Around 72 % of the fire incidences were
controlled before exceeding 1 ha. There were
two fires bigger than 500 hectares: one in
Balikesir and one in K.Maraş (Table 27).
The burnt area, number of fires and average
fire size for the period of 1990-2013 are
shown in Figure 75.
Most of the fires were caused by human
activities (87 % of known causes). The
causes of forest fires in 2013 are shown in
Figure 76.
(a)
(b)
(c)
Figure 75. Burnt areas (a), number of fires (b) and average fire size (c) in Turkey from 1998 to 2013.
Figure 76. Main causes of forest fires in 2013.
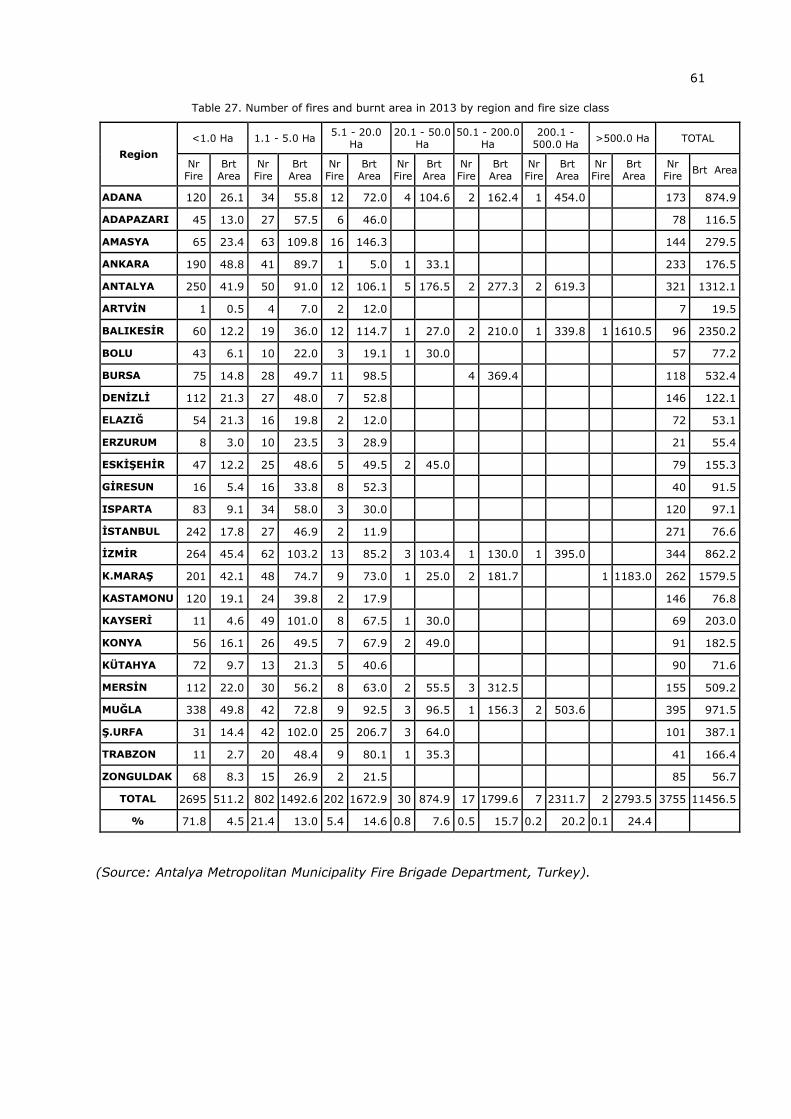
61
Table 27. Number of fires and burnt area in 2013 by region and fire size class
Region
<1.0 Ha 1.1 - 5.0 Ha 5.1 - 20.0
Ha 20.1 - 50.0
Ha 50.1 - 200.0
Ha 200.1 -
500.0 Ha >500.0 Ha TOTAL
Nr Fire
Brt Area
Nr Fire
Brt Area
Nr Fire
Brt Area
Nr Fire
Brt Area
Nr Fire
Brt Area
Nr Fire
Brt Area
Nr Fire
Brt Area
Nr Fire
Brt Area
ADANA 120 26.1 34 55.8 12 72.0 4 104.6 2 162.4 1 454.0
173 874.9
ADAPAZARI 45 13.0 27 57.5 6 46.0
78 116.5
AMASYA 65 23.4 63 109.8 16 146.3
144 279.5
ANKARA 190 48.8 41 89.7 1 5.0 1 33.1
233 176.5
ANTALYA 250 41.9 50 91.0 12 106.1 5 176.5 2 277.3 2 619.3
321 1312.1
ARTVİN 1 0.5 4 7.0 2 12.0
7 19.5
BALIKESİR 60 12.2 19 36.0 12 114.7 1 27.0 2 210.0 1 339.8 1 1610.5 96 2350.2
BOLU 43 6.1 10 22.0 3 19.1 1 30.0
57 77.2
BURSA 75 14.8 28 49.7 11 98.5
4 369.4
118 532.4
DENİZLİ 112 21.3 27 48.0 7 52.8
146 122.1
ELAZIĞ 54 21.3 16 19.8 2 12.0
72 53.1
ERZURUM 8 3.0 10 23.5 3 28.9
21 55.4
ESKİŞEHİR 47 12.2 25 48.6 5 49.5 2 45.0
79 155.3
GİRESUN 16 5.4 16 33.8 8 52.3
40 91.5
ISPARTA 83 9.1 34 58.0 3 30.0
120 97.1
İSTANBUL 242 17.8 27 46.9 2 11.9
271 76.6
İZMİR 264 45.4 62 103.2 13 85.2 3 103.4 1 130.0 1 395.0
344 862.2
K.MARAŞ 201 42.1 48 74.7 9 73.0 1 25.0 2 181.7
1 1183.0 262 1579.5
KASTAMONU 120 19.1 24 39.8 2 17.9
146 76.8
KAYSERİ 11 4.6 49 101.0 8 67.5 1 30.0
69 203.0
KONYA 56 16.1 26 49.5 7 67.9 2 49.0
91 182.5
KÜTAHYA 72 9.7 13 21.3 5 40.6
90 71.6
MERSİN 112 22.0 30 56.2 8 63.0 2 55.5 3 312.5
155 509.2
MUĞLA 338 49.8 42 72.8 9 92.5 3 96.5 1 156.3 2 503.6
395 971.5
Ş.URFA 31 14.4 42 102.0 25 206.7 3 64.0
101 387.1
TRABZON 11 2.7 20 48.4 9 80.1 1 35.3
41 166.4
ZONGULDAK 68 8.3 15 26.9 2 21.5
85 56.7
TOTAL 2695 511.2 802 1492.6 202 1672.9 30 874.9 17 1799.6 7 2311.7 2 2793.5 3755 11456.5
% 71.8 4.5 21.4 13.0 5.4 14.6 0.8 7.6 0.5 15.7 0.2 20.2 0.1 24.4
(Source: Antalya Metropolitan Municipality Fire Brigade Department, Turkey).
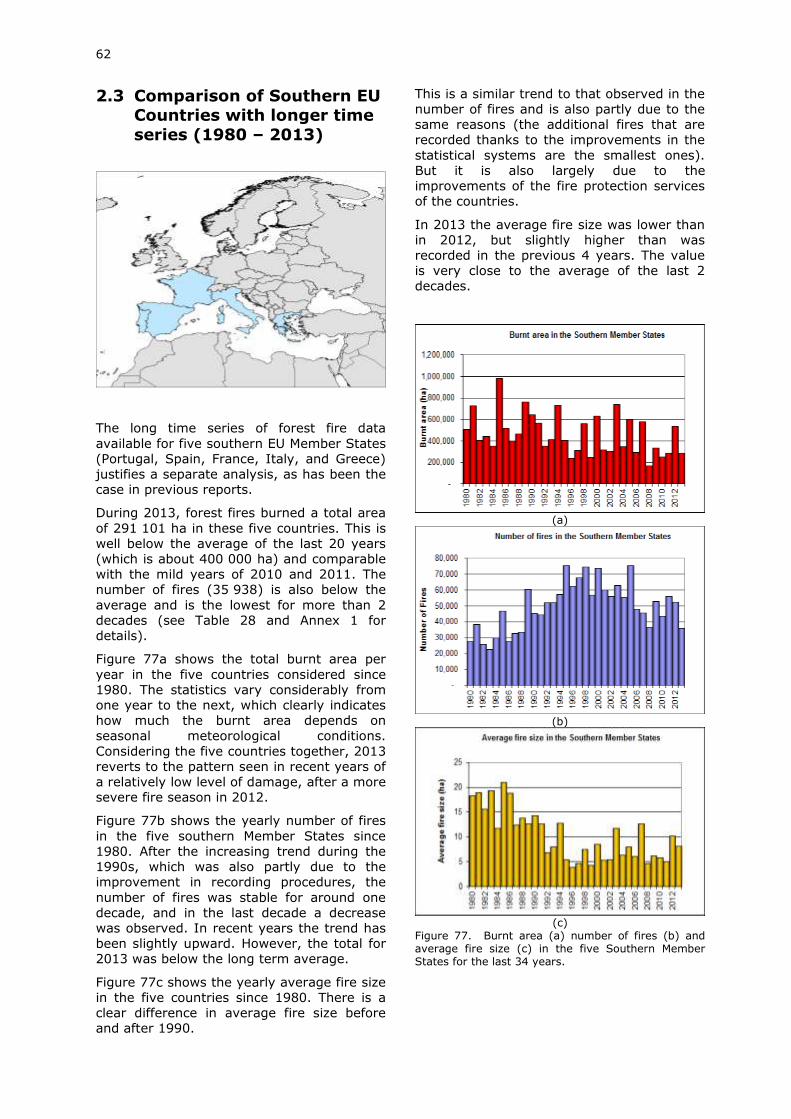
62
2.3 Comparison of Southern EU Countries with longer time
series (1980 – 2013)
The long time series of forest fire data
available for five southern EU Member States
(Portugal, Spain, France, Italy, and Greece)
justifies a separate analysis, as has been the
case in previous reports.
During 2013, forest fires burned a total area
of 291 101 ha in these five countries. This is
well below the average of the last 20 years
(which is about 400 000 ha) and comparable
with the mild years of 2010 and 2011. The
number of fires (35 938) is also below the
average and is the lowest for more than 2
decades (see Table 28 and Annex 1 for
details).
Figure 77a shows the total burnt area per
year in the five countries considered since
1980. The statistics vary considerably from
one year to the next, which clearly indicates
how much the burnt area depends on
seasonal meteorological conditions.
Considering the five countries together, 2013
reverts to the pattern seen in recent years of
a relatively low level of damage, after a more
severe fire season in 2012.
Figure 77b shows the yearly number of fires
in the five southern Member States since
1980. After the increasing trend during the
1990s, which was also partly due to the
improvement in recording procedures, the
number of fires was stable for around one
decade, and in the last decade a decrease
was observed. In recent years the trend has
been slightly upward. However, the total for
2013 was below the long term average.
Figure 77c shows the yearly average fire size
in the five countries since 1980. There is a
clear difference in average fire size before
and after 1990.
This is a similar trend to that observed in the
number of fires and is also partly due to the
same reasons (the additional fires that are
recorded thanks to the improvements in the
statistical systems are the smallest ones).
But it is also largely due to the
improvements of the fire protection services
of the countries.
In 2013 the average fire size was lower than
in 2012, but slightly higher than was
recorded in the previous 4 years. The value
is very close to the average of the last 2
decades.
(a)
(b)
(c)
Figure 77. Burnt area (a) number of fires (b) and average fire size (c) in the five Southern Member States for the last 34 years.
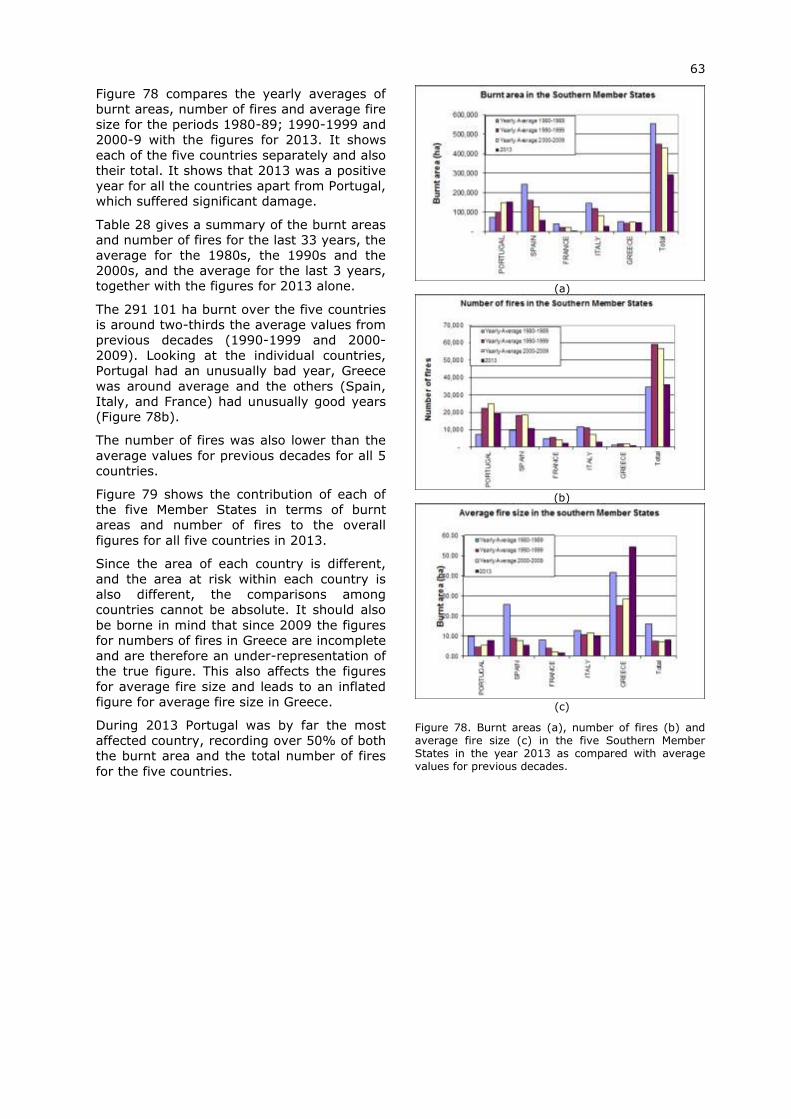
63
Figure 78 compares the yearly averages of
burnt areas, number of fires and average fire
size for the periods 1980-89; 1990-1999 and
2000-9 with the figures for 2013. It shows
each of the five countries separately and also
their total. It shows that 2013 was a positive
year for all the countries apart from Portugal,
which suffered significant damage.
Table 28 gives a summary of the burnt areas
and number of fires for the last 33 years, the
average for the 1980s, the 1990s and the
2000s, and the average for the last 3 years,
together with the figures for 2013 alone.
The 291 101 ha burnt over the five countries
is around two-thirds the average values from
previous decades (1990-1999 and 2000-
2009). Looking at the individual countries,
Portugal had an unusually bad year, Greece
was around average and the others (Spain,
Italy, and France) had unusually good years
(Figure 78b).
The number of fires was also lower than the
average values for previous decades for all 5
countries.
Figure 79 shows the contribution of each of
the five Member States in terms of burnt
areas and number of fires to the overall
figures for all five countries in 2013.
Since the area of each country is different,
and the area at risk within each country is
also different, the comparisons among
countries cannot be absolute. It should also
be borne in mind that since 2009 the figures
for numbers of fires in Greece are incomplete
and are therefore an under-representation of
the true figure. This also affects the figures
for average fire size and leads to an inflated
figure for average fire size in Greece.
During 2013 Portugal was by far the most
affected country, recording over 50% of both
the burnt area and the total number of fires
for the five countries.
(a)
(b)
(c)
Figure 78. Burnt areas (a), number of fires (b) and average fire size (c) in the five Southern Member States in the year 2013 as compared with average values for previous decades.
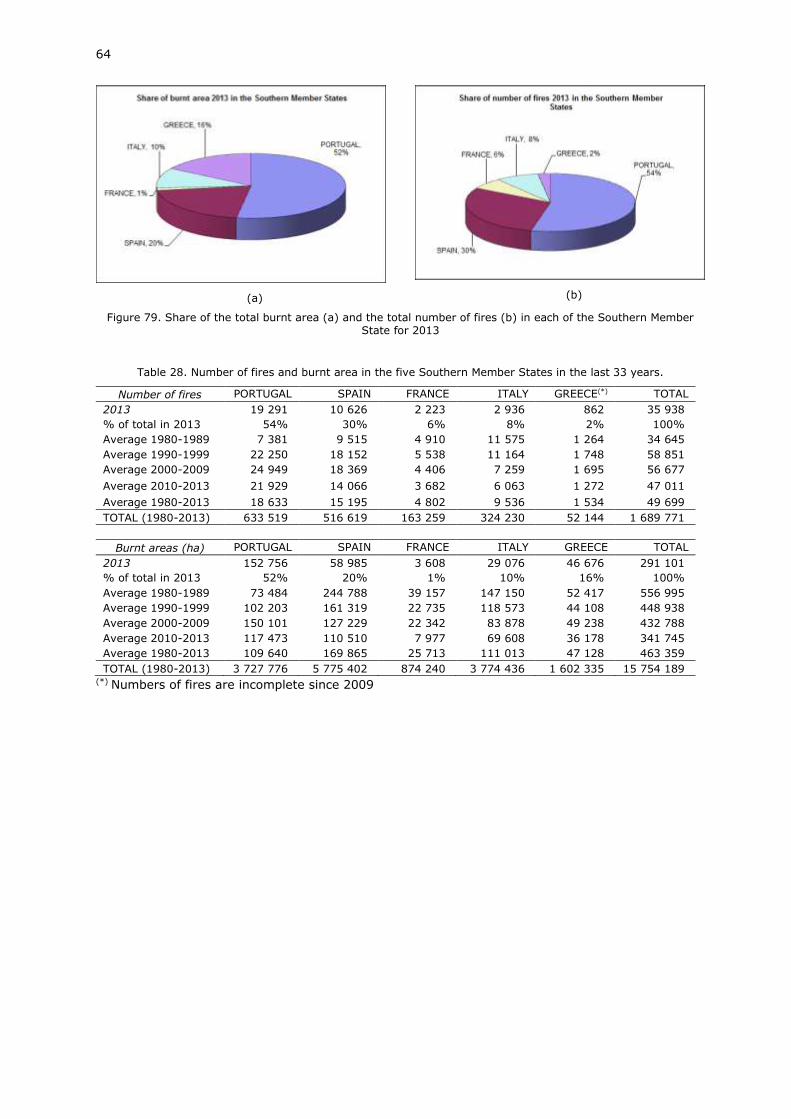
64
(a)
(b)
Figure 79. Share of the total burnt area (a) and the total number of fires (b) in each of the Southern Member State for 2013
Table 28. Number of fires and burnt area in the five Southern Member States in the last 33 years.
Number of fires PORTUGAL SPAIN FRANCE ITALY GREECE(*) TOTAL
2013 19 291 10 626 2 223 2 936 862 35 938
% of total in 2013 54% 30% 6% 8% 2% 100%
Average 1980-1989 7 381 9 515 4 910 11 575 1 264 34 645
Average 1990-1999 22 250 18 152 5 538 11 164 1 748 58 851
Average 2000-2009 24 949 18 369 4 406 7 259 1 695 56 677
Average 2010-2013 21 929 14 066 3 682 6 063 1 272 47 011
Average 1980-2013 18 633 15 195 4 802 9 536 1 534 49 699
TOTAL (1980-2013) 633 519 516 619 163 259 324 230 52 144 1 689 771
Burnt areas (ha) PORTUGAL SPAIN FRANCE ITALY GREECE TOTAL
2013 152 756 58 985 3 608 29 076 46 676 291 101
% of total in 2013 52% 20% 1% 10% 16% 100%
Average 1980-1989 73 484 244 788 39 157 147 150 52 417 556 995
Average 1990-1999 102 203 161 319 22 735 118 573 44 108 448 938
Average 2000-2009 150 101 127 229 22 342 83 878 49 238 432 788
Average 2010-2013 117 473 110 510 7 977 69 608 36 178 341 745
Average 1980-2013 109 640 169 865 25 713 111 013 47 128 463 359
TOTAL (1980-2013) 3 727 776 5 775 402 874 240 3 774 436 1 602 335 15 754 189 (*) Numbers of fires are incomplete since 2009
65
2.4 Middle East and North Africa Countries
2.4.1 Algeria
Introduction
In Algeria, the massifs of forest and maquis
cover about 4.1 million hectares, distributed
very differently in terms of forest coverage
over the forty provinces of the country. In
effect, the highest forest coverage is about
57.51% (in the wilaya of El Tarf), and the
lowest rate is 0.36% (wilaya Naama). Eight
provinces in the South are totally devoid of
forest formations. Regarding forest area, the
most forested wilaya (Batna) has an area of
314 565 ha, while the smallest area is about
5 000 ha (wilaya of Algiers). This distribution
is largely explained by the climate, because
the most humid north-east coastal massifs
are also the most forested regions.
Fire danger in the 2013 fire season
During the summer of 2013, Algeria did not
experience any major “Sirocco” heat waves
or strong warm currents from the Saharan
regions to the north of North Africa and
Western Europe. Temperatures generally did
not exceed the seasonal average and the risk
of forest fire only reached very high levels
during short periods in the month of August.
Accordingly, this stable weather situation
was unfavourable for the initiation and
propagation of forest fires. In addition the
campaign was well-prepared, with a wide
involvement of the sectors concerned, each
dealing with the phenomenon of forest fires
in their own sphere of activity.
Forest fire prevention
Several actions were carried out in
preparation for the forest fire campaign of
2013, particularly in the work of prevention,
public awareness and operational
organization. Below is a list of the main
actions carried out:
Preventive work
Prevention Actions Amount Maintenance of firewall trenches 1160 ha
New firewall trenches 190 ha
Maintenance of road verges 6536 km
Buffer zones around farms 7454 ha
Maintenance of clearings under high voltage lines
230 ha
Maintenance of railway verges 149 km
Maintenance of forest trails 2965 km
New forest trails 1408 km
Maintenance of water points 110 units
Construction of new water points 149 units
Silvicultural activities 20125 ha
Awareness campaigns
Awareness raising activity Number Promotion of conferences and debates
420
Organisation of exhibitions and open days
280
Television broadcasts 61
Radio broadcasts 954
Sermons and religious lectures 543
Organisation of local meetings 5250
Distribution of posters and leaflets 38150
Operational Organisation
Updated "Forest Fire" plans for the 40
wilayas affected by this risk: the plan lays
down procedures for the implementation
of preventive measures and the
mobilization of resources in the fight
against forest fires.
Enabling operational committees,
responsible for coordination of control
operations at national level, also at the
level of wilayas, daïras and communes.
Set up local committees composed of
farmers and citizens, which play an
important role in fire prevention and first
intervention in remote and isolated
communities.
Implementation of numerous simulation
exercises "fight against wildfire".
Organization of a cycle of continual
improvement of training on simulated forest fires for the benefit of civil
protection officers, in order to upgrade
their knowledge of command control
operations.
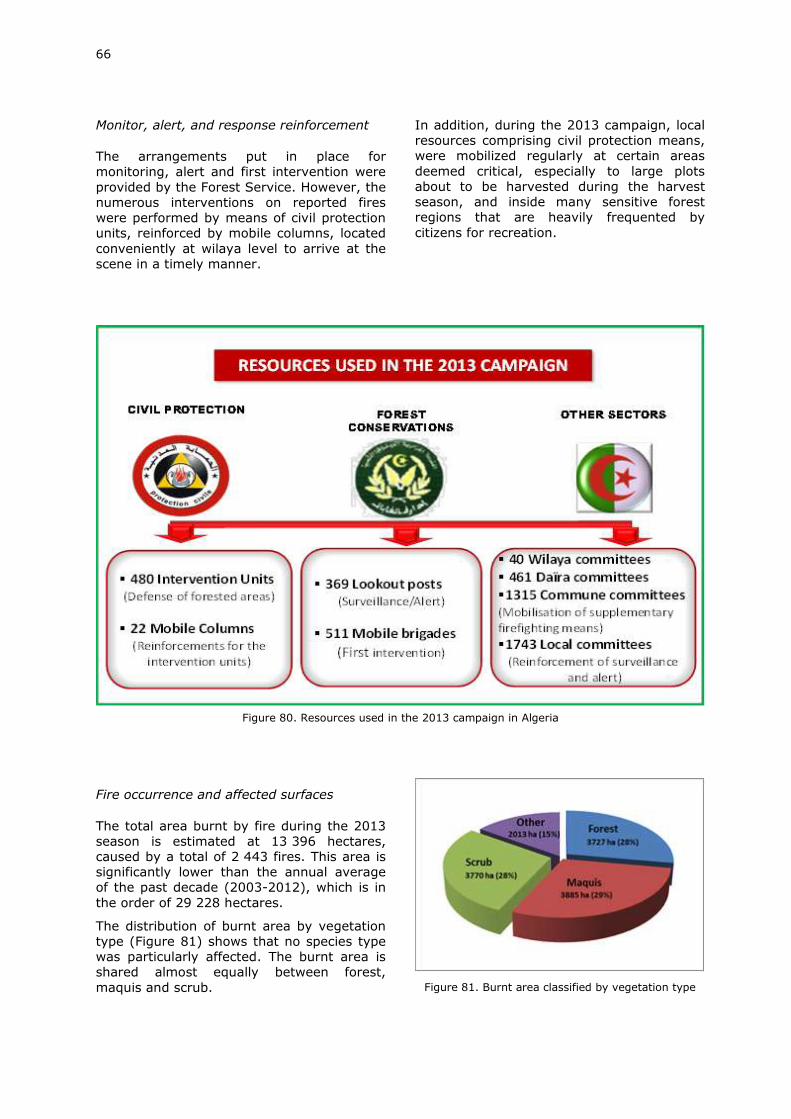
66
Monitor, alert, and response reinforcement
The arrangements put in place for
monitoring, alert and first intervention were
provided by the Forest Service. However, the
numerous interventions on reported fires
were performed by means of civil protection
units, reinforced by mobile columns, located
conveniently at wilaya level to arrive at the
scene in a timely manner.
In addition, during the 2013 campaign, local
resources comprising civil protection means,
were mobilized regularly at certain areas
deemed critical, especially to large plots
about to be harvested during the harvest
season, and inside many sensitive forest
regions that are heavily frequented by
citizens for recreation.
Figure 80. Resources used in the 2013 campaign in Algeria
Fire occurrence and affected surfaces
The total area burnt by fire during the 2013
season is estimated at 13 396 hectares,
caused by a total of 2 443 fires. This area is
significantly lower than the annual average
of the past decade (2003-2012), which is in
the order of 29 228 hectares.
The distribution of burnt area by vegetation
type (Figure 81) shows that no species type
was particularly affected. The burnt area is
shared almost equally between forest,
maquis and scrub.
Figure 81. Burnt area classified by vegetation type
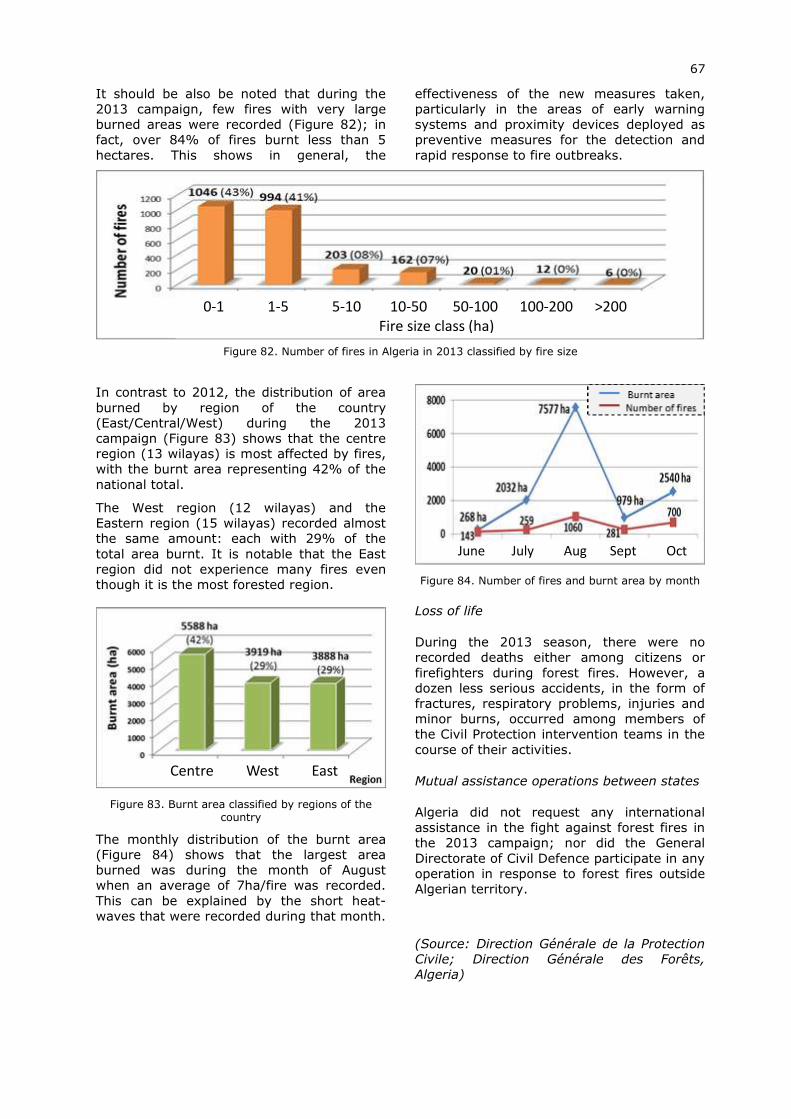
67
It should be also be noted that during the
2013 campaign, few fires with very large
burned areas were recorded (Figure 82); in
fact, over 84% of fires burnt less than 5
hectares. This shows in general, the
effectiveness of the new measures taken,
particularly in the areas of early warning
systems and proximity devices deployed as
preventive measures for the detection and
rapid response to fire outbreaks.
Figure 82. Number of fires in Algeria in 2013 classified by fire size
In contrast to 2012, the distribution of area
burned by region of the country
(East/Central/West) during the 2013
campaign (Figure 83) shows that the centre
region (13 wilayas) is most affected by fires,
with the burnt area representing 42% of the
national total.
The West region (12 wilayas) and the
Eastern region (15 wilayas) recorded almost
the same amount: each with 29% of the
total area burnt. It is notable that the East
region did not experience many fires even
though it is the most forested region.
Figure 83. Burnt area classified by regions of the country
The monthly distribution of the burnt area
(Figure 84) shows that the largest area
burned was during the month of August
when an average of 7ha/fire was recorded.
This can be explained by the short heat-
waves that were recorded during that month.
Figure 84. Number of fires and burnt area by month
Loss of life
During the 2013 season, there were no
recorded deaths either among citizens or
firefighters during forest fires. However, a
dozen less serious accidents, in the form of
fractures, respiratory problems, injuries and
minor burns, occurred among members of
the Civil Protection intervention teams in the
course of their activities.
Mutual assistance operations between states
Algeria did not request any international
assistance in the fight against forest fires in
the 2013 campaign; nor did the General
Directorate of Civil Defence participate in any
operation in response to forest fires outside
Algerian territory.
(Source: Direction Générale de la Protection
Civile; Direction Générale des Forêts,
Algeria)
0-1 1-5 5-10 10-50 50-100 100-200 >200
Fire size class (ha)
June July Aug Sept Oct
Centre West East
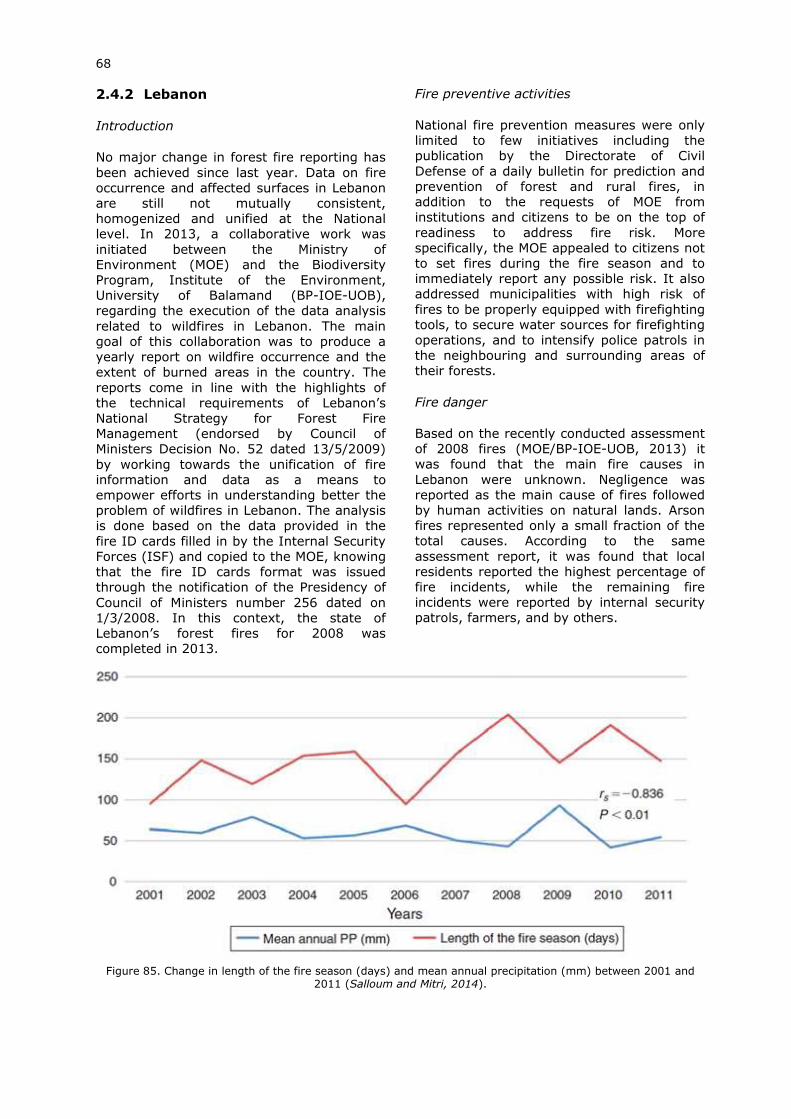
68
2.4.2 Lebanon
Introduction
No major change in forest fire reporting has
been achieved since last year. Data on fire
occurrence and affected surfaces in Lebanon
are still not mutually consistent,
homogenized and unified at the National
level. In 2013, a collaborative work was
initiated between the Ministry of
Environment (MOE) and the Biodiversity
Program, Institute of the Environment,
University of Balamand (BP-IOE-UOB),
regarding the execution of the data analysis
related to wildfires in Lebanon. The main
goal of this collaboration was to produce a
yearly report on wildfire occurrence and the
extent of burned areas in the country. The
reports come in line with the highlights of
the technical requirements of Lebanon’s
National Strategy for Forest Fire
Management (endorsed by Council of
Ministers Decision No. 52 dated 13/5/2009)
by working towards the unification of fire
information and data as a means to
empower efforts in understanding better the
problem of wildfires in Lebanon. The analysis
is done based on the data provided in the
fire ID cards filled in by the Internal Security
Forces (ISF) and copied to the MOE, knowing
that the fire ID cards format was issued
through the notification of the Presidency of
Council of Ministers number 256 dated on
1/3/2008. In this context, the state of
Lebanon’s forest fires for 2008 was
completed in 2013.
Fire preventive activities
National fire prevention measures were only
limited to few initiatives including the
publication by the Directorate of Civil
Defense of a daily bulletin for prediction and
prevention of forest and rural fires, in
addition to the requests of MOE from
institutions and citizens to be on the top of
readiness to address fire risk. More
specifically, the MOE appealed to citizens not
to set fires during the fire season and to
immediately report any possible risk. It also
addressed municipalities with high risk of
fires to be properly equipped with firefighting
tools, to secure water sources for firefighting
operations, and to intensify police patrols in
the neighbouring and surrounding areas of
their forests.
Fire danger
Based on the recently conducted assessment
of 2008 fires (MOE/BP-IOE-UOB, 2013) it
was found that the main fire causes in
Lebanon were unknown. Negligence was
reported as the main cause of fires followed
by human activities on natural lands. Arson
fires represented only a small fraction of the
total causes. According to the same
assessment report, it was found that local
residents reported the highest percentage of
fire incidents, while the remaining fire
incidents were reported by internal security
patrols, farmers, and by others.
Figure 85. Change in length of the fire season (days) and mean annual precipitation (mm) between 2001 and
2011 (Salloum and Mitri, 2014).
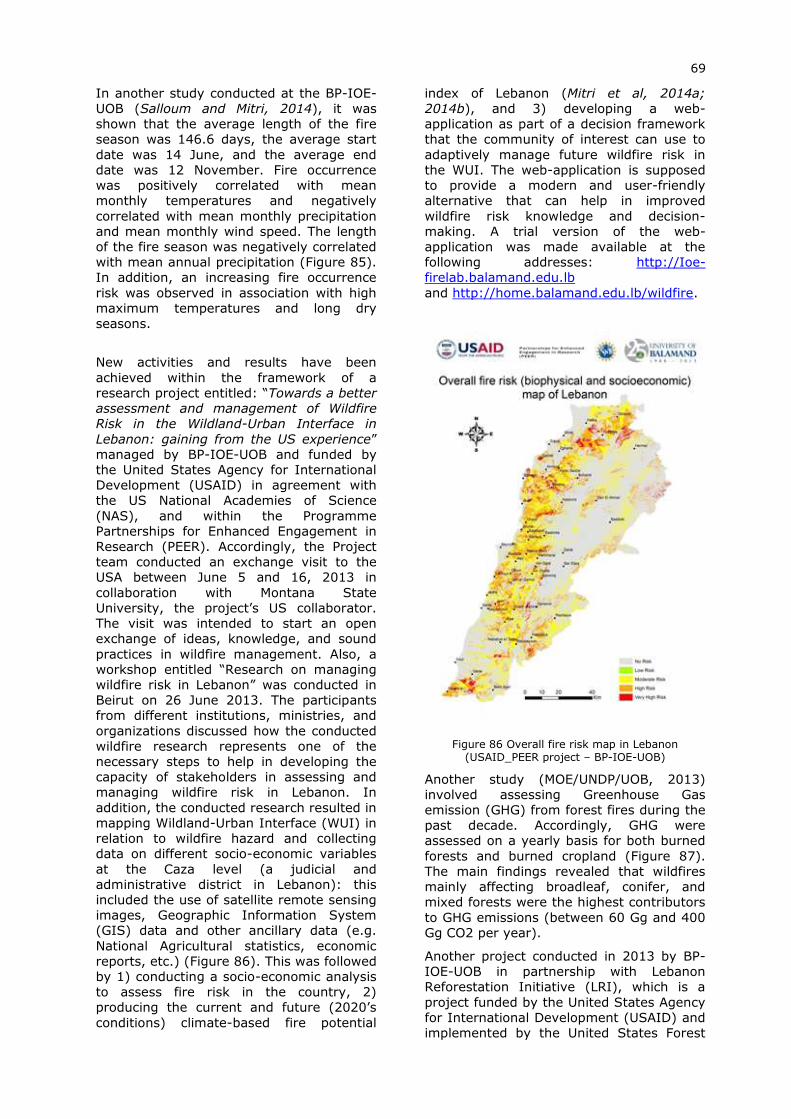
69
In another study conducted at the BP-IOE-
UOB (Salloum and Mitri, 2014), it was
shown that the average length of the fire
season was 146.6 days, the average start
date was 14 June, and the average end
date was 12 November. Fire occurrence
was positively correlated with mean
monthly temperatures and negatively
correlated with mean monthly precipitation
and mean monthly wind speed. The length
of the fire season was negatively correlated
with mean annual precipitation (Figure 85).
In addition, an increasing fire occurrence
risk was observed in association with high
maximum temperatures and long dry
seasons.
New activities and results have been
achieved within the framework of a
research project entitled: “Towards a better
assessment and management of Wildfire
Risk in the Wildland-Urban Interface in
Lebanon: gaining from the US experience”
managed by BP-IOE-UOB and funded by
the United States Agency for International
Development (USAID) in agreement with
the US National Academies of Science
(NAS), and within the Programme
Partnerships for Enhanced Engagement in
Research (PEER). Accordingly, the Project
team conducted an exchange visit to the
USA between June 5 and 16, 2013 in
collaboration with Montana State
University, the project’s US collaborator.
The visit was intended to start an open
exchange of ideas, knowledge, and sound
practices in wildfire management. Also, a
workshop entitled “Research on managing
wildfire risk in Lebanon” was conducted in
Beirut on 26 June 2013. The participants
from different institutions, ministries, and
organizations discussed how the conducted
wildfire research represents one of the
necessary steps to help in developing the
capacity of stakeholders in assessing and
managing wildfire risk in Lebanon. In
addition, the conducted research resulted in
mapping Wildland-Urban Interface (WUI) in
relation to wildfire hazard and collecting
data on different socio-economic variables
at the Caza level (a judicial and
administrative district in Lebanon): this
included the use of satellite remote sensing
images, Geographic Information System
(GIS) data and other ancillary data (e.g.
National Agricultural statistics, economic
reports, etc.) (Figure 86). This was followed
by 1) conducting a socio-economic analysis
to assess fire risk in the country, 2)
producing the current and future (2020’s
conditions) climate-based fire potential
index of Lebanon (Mitri et al, 2014a;
2014b), and 3) developing a web-
application as part of a decision framework
that the community of interest can use to
adaptively manage future wildfire risk in
the WUI. The web-application is supposed
to provide a modern and user-friendly
alternative that can help in improved
wildfire risk knowledge and decision-
making. A trial version of the web-
application was made available at the
following addresses: http://Ioe-
firelab.balamand.edu.lb
and http://home.balamand.edu.lb/wildfire.
Figure 86 Overall fire risk map in Lebanon (USAID_PEER project – BP-IOE-UOB)
Another study (MOE/UNDP/UOB, 2013)
involved assessing Greenhouse Gas
emission (GHG) from forest fires during the
past decade. Accordingly, GHG were
assessed on a yearly basis for both burned
forests and burned cropland (Figure 87).
The main findings revealed that wildfires
mainly affecting broadleaf, conifer, and
mixed forests were the highest contributors
to GHG emissions (between 60 Gg and 400
Gg CO2 per year).
Another project conducted in 2013 by BP-
IOE-UOB in partnership with Lebanon
Reforestation Initiative (LRI), which is a
project funded by the United States Agency
for International Development (USAID) and
implemented by the United States Forest
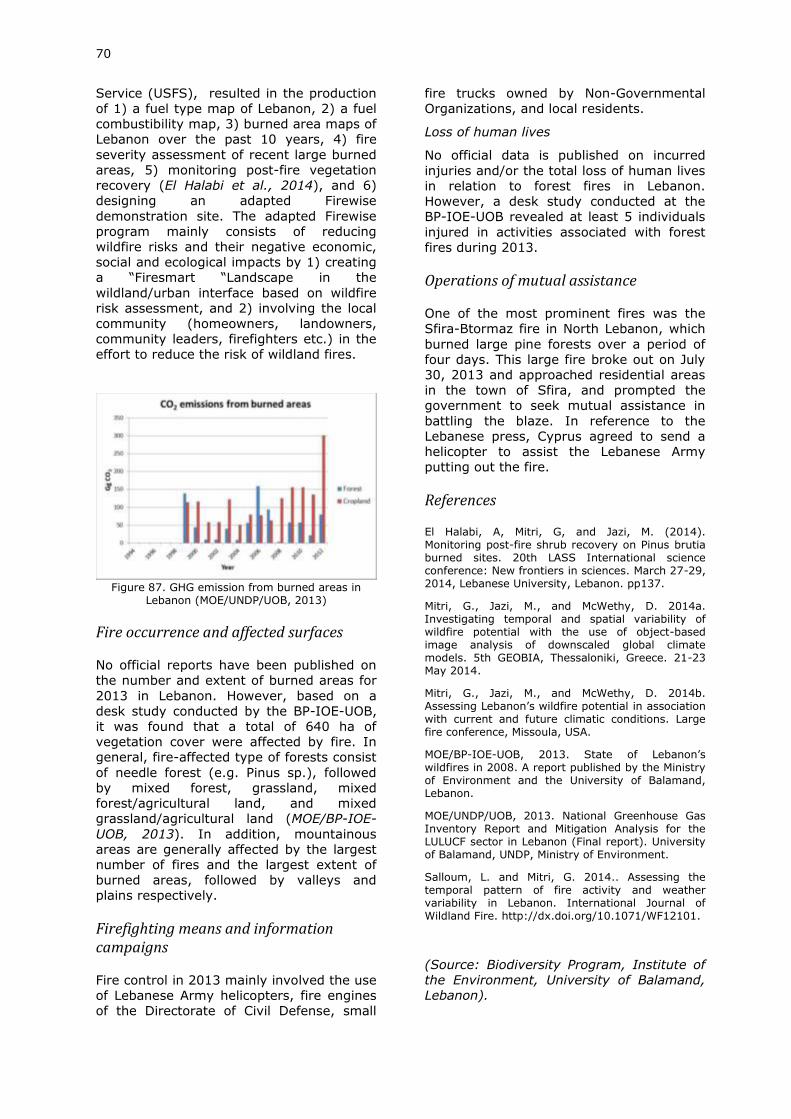
70
Service (USFS), resulted in the production
of 1) a fuel type map of Lebanon, 2) a fuel
combustibility map, 3) burned area maps of
Lebanon over the past 10 years, 4) fire
severity assessment of recent large burned
areas, 5) monitoring post-fire vegetation
recovery (El Halabi et al., 2014), and 6)
designing an adapted Firewise
demonstration site. The adapted Firewise
program mainly consists of reducing
wildfire risks and their negative economic,
social and ecological impacts by 1) creating
a “Firesmart “Landscape in the
wildland/urban interface based on wildfire
risk assessment, and 2) involving the local
community (homeowners, landowners,
community leaders, firefighters etc.) in the
effort to reduce the risk of wildland fires.
Figure 87. GHG emission from burned areas in
Lebanon (MOE/UNDP/UOB, 2013)
Fire occurrence and affected surfaces
No official reports have been published on
the number and extent of burned areas for
2013 in Lebanon. However, based on a
desk study conducted by the BP-IOE-UOB,
it was found that a total of 640 ha of
vegetation cover were affected by fire. In
general, fire-affected type of forests consist
of needle forest (e.g. Pinus sp.), followed
by mixed forest, grassland, mixed
forest/agricultural land, and mixed
grassland/agricultural land (MOE/BP-IOE-
UOB, 2013). In addition, mountainous
areas are generally affected by the largest
number of fires and the largest extent of
burned areas, followed by valleys and
plains respectively.
Firefighting means and information campaigns
Fire control in 2013 mainly involved the use
of Lebanese Army helicopters, fire engines
of the Directorate of Civil Defense, small
fire trucks owned by Non-Governmental
Organizations, and local residents.
Loss of human lives
No official data is published on incurred
injuries and/or the total loss of human lives
in relation to forest fires in Lebanon.
However, a desk study conducted at the
BP-IOE-UOB revealed at least 5 individuals
injured in activities associated with forest
fires during 2013.
Operations of mutual assistance
One of the most prominent fires was the
Sfira-Btormaz fire in North Lebanon, which
burned large pine forests over a period of
four days. This large fire broke out on July
30, 2013 and approached residential areas
in the town of Sfira, and prompted the
government to seek mutual assistance in
battling the blaze. In reference to the
Lebanese press, Cyprus agreed to send a
helicopter to assist the Lebanese Army
putting out the fire.
References
El Halabi, A, Mitri, G, and Jazi, M. (2014). Monitoring post-fire shrub recovery on Pinus brutia burned sites. 20th LASS International science conference: New frontiers in sciences. March 27-29, 2014, Lebanese University, Lebanon. pp137.
Mitri, G., Jazi, M., and McWethy, D. 2014a. Investigating temporal and spatial variability of wildfire potential with the use of object-based image analysis of downscaled global climate models. 5th GEOBIA, Thessaloniki, Greece. 21-23 May 2014.
Mitri, G., Jazi, M., and McWethy, D. 2014b. Assessing Lebanon’s wildfire potential in association with current and future climatic conditions. Large fire conference, Missoula, USA.
MOE/BP-IOE-UOB, 2013. State of Lebanon’s wildfires in 2008. A report published by the Ministry of Environment and the University of Balamand, Lebanon.
MOE/UNDP/UOB, 2013. National Greenhouse Gas Inventory Report and Mitigation Analysis for the LULUCF sector in Lebanon (Final report). University of Balamand, UNDP, Ministry of Environment.
Salloum, L. and Mitri, G. 2014.. Assessing the temporal pattern of fire activity and weather variability in Lebanon. International Journal of Wildland Fire. http://dx.doi.org/10.1071/WF12101.
(Source: Biodiversity Program, Institute of
the Environment, University of Balamand,
Lebanon).
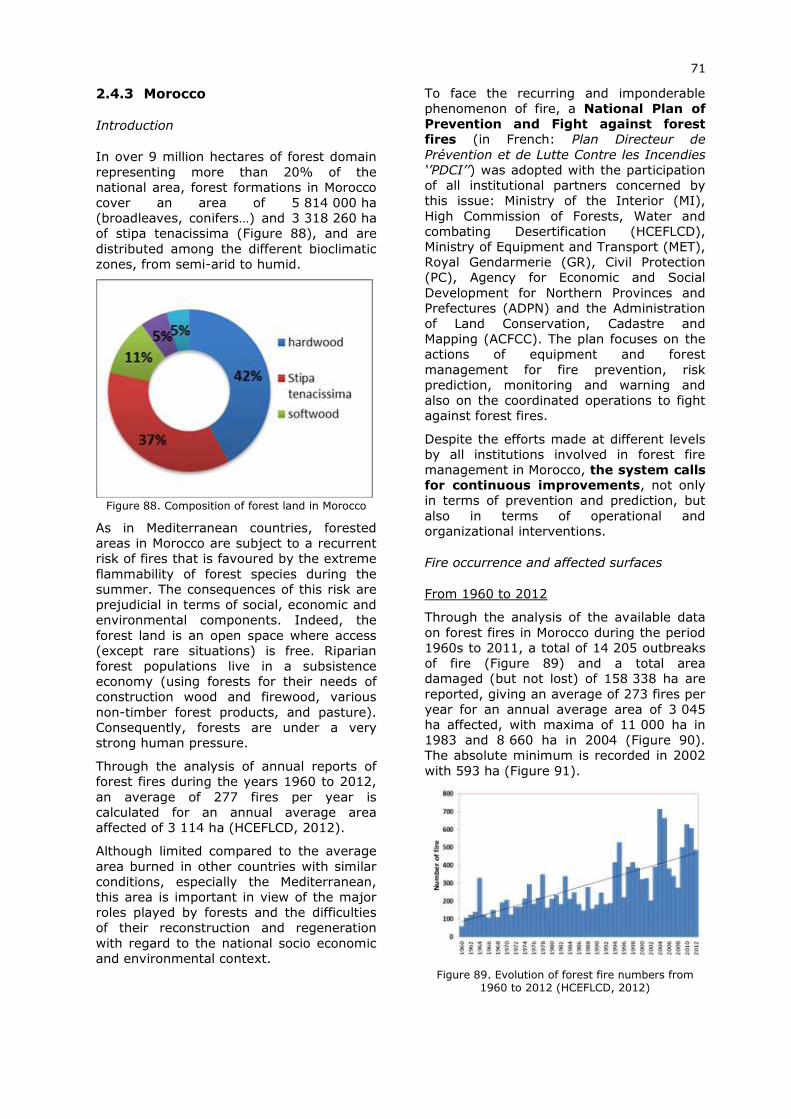
71
2.4.3 Morocco
Introduction
In over 9 million hectares of forest domain
representing more than 20% of the
national area, forest formations in Morocco
cover an area of 5 814 000 ha
(broadleaves, conifers…) and 3 318 260 ha
of stipa tenacissima (Figure 88), and are
distributed among the different bioclimatic
zones, from semi-arid to humid.
Figure 88. Composition of forest land in Morocco
As in Mediterranean countries, forested
areas in Morocco are subject to a recurrent
risk of fires that is favoured by the extreme
flammability of forest species during the
summer. The consequences of this risk are
prejudicial in terms of social, economic and
environmental components. Indeed, the
forest land is an open space where access
(except rare situations) is free. Riparian
forest populations live in a subsistence
economy (using forests for their needs of
construction wood and firewood, various
non-timber forest products, and pasture).
Consequently, forests are under a very
strong human pressure.
Through the analysis of annual reports of
forest fires during the years 1960 to 2012,
an average of 277 fires per year is
calculated for an annual average area
affected of 3 114 ha (HCEFLCD, 2012).
Although limited compared to the average
area burned in other countries with similar
conditions, especially the Mediterranean,
this area is important in view of the major
roles played by forests and the difficulties
of their reconstruction and regeneration
with regard to the national socio economic
and environmental context.
To face the recurring and imponderable
phenomenon of fire, a National Plan of
Prevention and Fight against forest
fires (in French: Plan Directeur de
Prévention et de Lutte Contre les Incendies
‘’PDCI’’) was adopted with the participation
of all institutional partners concerned by
this issue: Ministry of the Interior (MI),
High Commission of Forests, Water and
combating Desertification (HCEFLCD),
Ministry of Equipment and Transport (MET),
Royal Gendarmerie (GR), Civil Protection
(PC), Agency for Economic and Social
Development for Northern Provinces and
Prefectures (ADPN) and the Administration
of Land Conservation, Cadastre and
Mapping (ACFCC). The plan focuses on the
actions of equipment and forest
management for fire prevention, risk
prediction, monitoring and warning and
also on the coordinated operations to fight
against forest fires.
Despite the efforts made at different levels
by all institutions involved in forest fire
management in Morocco, the system calls
for continuous improvements, not only
in terms of prevention and prediction, but
also in terms of operational and
organizational interventions.
Fire occurrence and affected surfaces
From 1960 to 2012
Through the analysis of the available data
on forest fires in Morocco during the period
1960s to 2011, a total of 14 205 outbreaks
of fire (Figure 89) and a total area
damaged (but not lost) of 158 338 ha are
reported, giving an average of 273 fires per
year for an annual average area of 3 045
ha affected, with maxima of 11 000 ha in
1983 and 8 660 ha in 2004 (Figure 90).
The absolute minimum is recorded in 2002
with 593 ha (Figure 91).
Figure 89. Evolution of forest fire numbers from 1960 to 2012 (HCEFLCD, 2012)
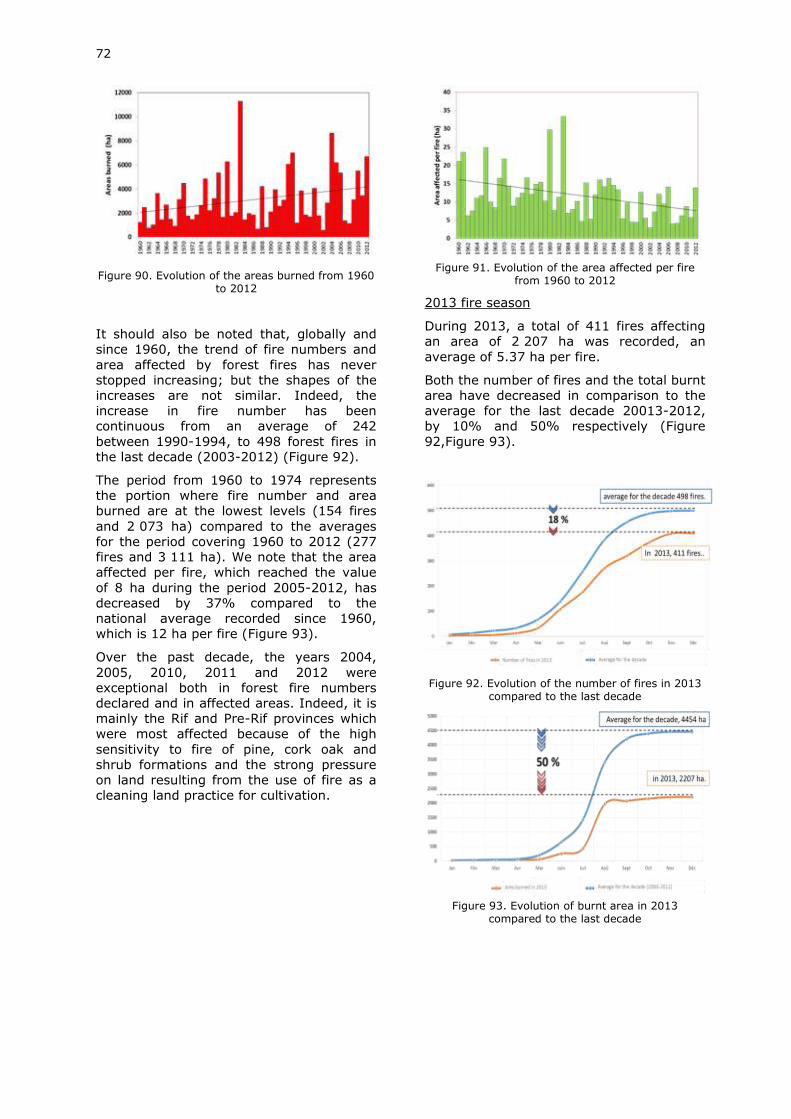
72
Figure 90. Evolution of the areas burned from 1960 to 2012
It should also be noted that, globally and
since 1960, the trend of fire numbers and
area affected by forest fires has never
stopped increasing; but the shapes of the
increases are not similar. Indeed, the
increase in fire number has been
continuous from an average of 242
between 1990-1994, to 498 forest fires in
the last decade (2003-2012) (Figure 92).
The period from 1960 to 1974 represents
the portion where fire number and area
burned are at the lowest levels (154 fires
and 2 073 ha) compared to the averages
for the period covering 1960 to 2012 (277
fires and 3 111 ha). We note that the area
affected per fire, which reached the value
of 8 ha during the period 2005-2012, has
decreased by 37% compared to the
national average recorded since 1960,
which is 12 ha per fire (Figure 93).
Over the past decade, the years 2004,
2005, 2010, 2011 and 2012 were
exceptional both in forest fire numbers
declared and in affected areas. Indeed, it is
mainly the Rif and Pre-Rif provinces which
were most affected because of the high
sensitivity to fire of pine, cork oak and
shrub formations and the strong pressure
on land resulting from the use of fire as a
cleaning land practice for cultivation.
Figure 91. Evolution of the area affected per fire
from 1960 to 2012
2013 fire season
During 2013, a total of 411 fires affecting
an area of 2 207 ha was recorded, an
average of 5.37 ha per fire.
Both the number of fires and the total burnt
area have decreased in comparison to the
average for the last decade 20013-2012,
by 10% and 50% respectively (Figure
92,Figure 93).
Figure 92. Evolution of the number of fires in 2013
compared to the last decade
Figure 93. Evolution of burnt area in 2013
compared to the last decade
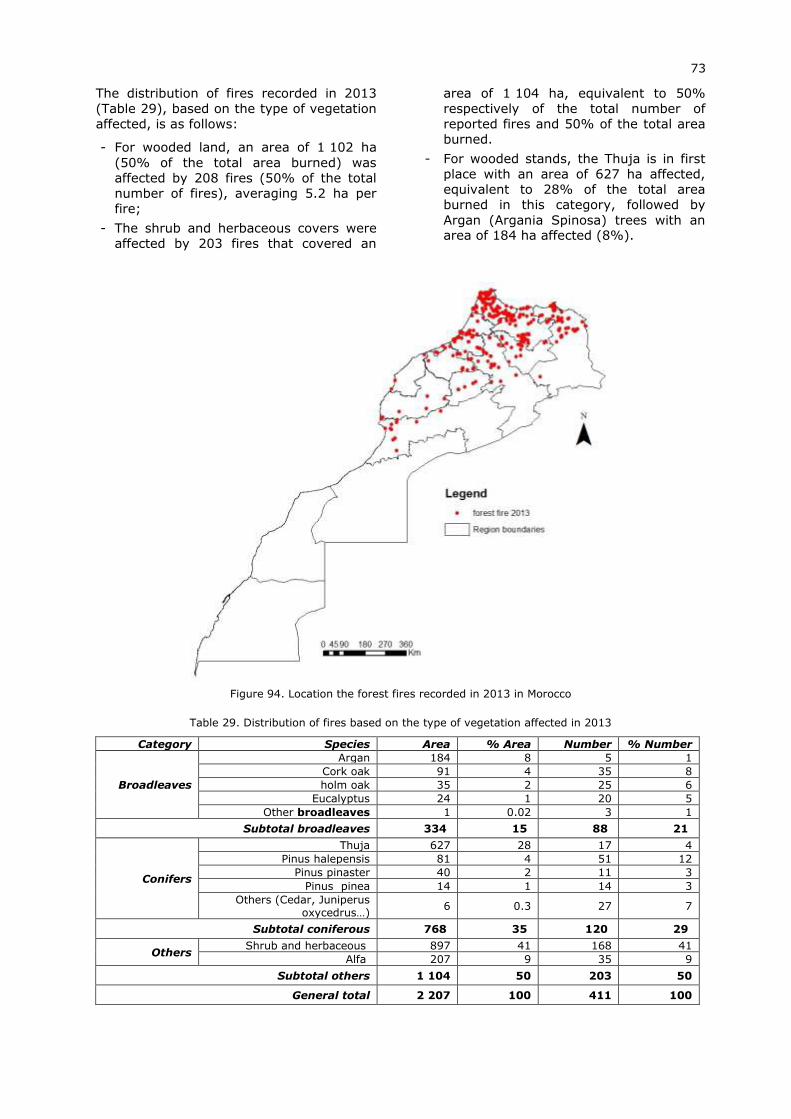
73
The distribution of fires recorded in 2013
(Table 29), based on the type of vegetation
affected, is as follows:
- For wooded land, an area of 1 102 ha
(50% of the total area burned) was
affected by 208 fires (50% of the total
number of fires), averaging 5.2 ha per
fire;
- The shrub and herbaceous covers were
affected by 203 fires that covered an
area of 1 104 ha, equivalent to 50%
respectively of the total number of
reported fires and 50% of the total area
burned.
- For wooded stands, the Thuja is in first
place with an area of 627 ha affected,
equivalent to 28% of the total area
burned in this category, followed by
Argan (Argania Spinosa) trees with an area of 184 ha affected (8%).
Figure 94. Location the forest fires recorded in 2013 in Morocco
Table 29. Distribution of fires based on the type of vegetation affected in 2013
Category Species Area % Area Number % Number
Broadleaves
Argan 184 8 5 1
Cork oak 91 4 35 8
holm oak 35 2 25 6
Eucalyptus 24 1 20 5
Other broadleaves 1 0.02 3 1
Subtotal broadleaves 334 15 88 21
Conifers
Thuja 627 28 17 4
Pinus halepensis 81 4 51 12
Pinus pinaster 40 2 11 3
Pinus pinea 14 1 14 3
Others (Cedar, Juniperus oxycedrus…)
6 0.3 27 7
Subtotal coniferous 768 35 120 29
Others Shrub and herbaceous 897 41 168 41
Alfa 207 9 35 9
Subtotal others 1 104 50 203 50
General total 2 207 100 411 100
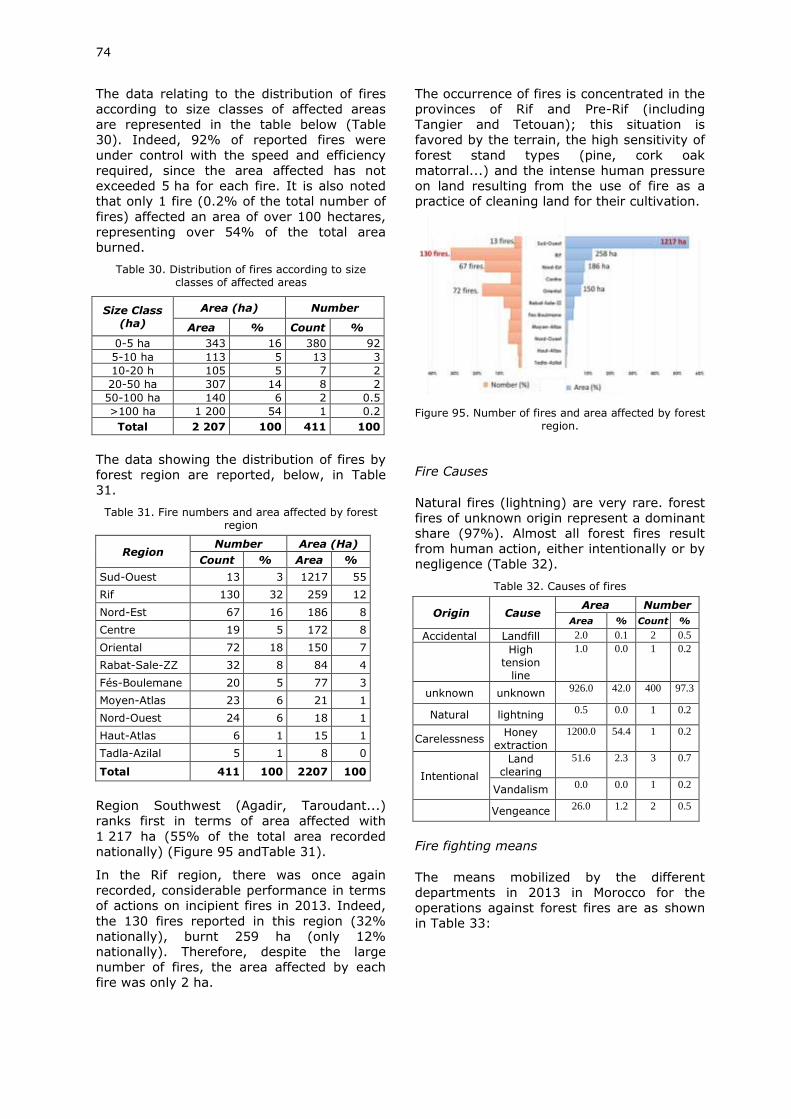
74
The data relating to the distribution of fires
according to size classes of affected areas
are represented in the table below (Table
30). Indeed, 92% of reported fires were
under control with the speed and efficiency
required, since the area affected has not
exceeded 5 ha for each fire. It is also noted
that only 1 fire (0.2% of the total number of
fires) affected an area of over 100 hectares,
representing over 54% of the total area
burned.
Table 30. Distribution of fires according to size classes of affected areas
Size Class (ha)
Area (ha) Number
Area % Count %
0-5 ha 343 16 380 92
5-10 ha 113 5 13 3
10-20 h 105 5 7 2
20-50 ha 307 14 8 2
50-100 ha 140 6 2 0.5
>100 ha 1 200 54 1 0.2
Total 2 207 100 411 100
The data showing the distribution of fires by
forest region are reported, below, in Table
31.
Table 31. Fire numbers and area affected by forest region
Region Number Area (Ha)
Count % Area %
Sud-Ouest 13 3 1217 55
Rif 130 32 259 12
Nord-Est 67 16 186 8
Centre 19 5 172 8
Oriental 72 18 150 7
Rabat-Sale-ZZ 32 8 84 4
Fés-Boulemane 20 5 77 3
Moyen-Atlas 23 6 21 1
Nord-Ouest 24 6 18 1
Haut-Atlas 6 1 15 1
Tadla-Azilal 5 1 8 0
Total 411 100 2207 100
Region Southwest (Agadir, Taroudant...)
ranks first in terms of area affected with
1 217 ha (55% of the total area recorded
nationally) (Figure 95 andTable 31).
In the Rif region, there was once again
recorded, considerable performance in terms
of actions on incipient fires in 2013. Indeed,
the 130 fires reported in this region (32%
nationally), burnt 259 ha (only 12%
nationally). Therefore, despite the large
number of fires, the area affected by each fire was only 2 ha.
The occurrence of fires is concentrated in the
provinces of Rif and Pre-Rif (including
Tangier and Tetouan); this situation is
favored by the terrain, the high sensitivity of
forest stand types (pine, cork oak
matorral...) and the intense human pressure
on land resulting from the use of fire as a
practice of cleaning land for their cultivation.
Figure 95. Number of fires and area affected by forest
region.
Fire Causes
Natural fires (lightning) are very rare. forest
fires of unknown origin represent a dominant
share (97%). Almost all forest fires result
from human action, either intentionally or by
negligence (Table 32).
Table 32. Causes of fires
Origin Cause Area Number
Area % Count %
Accidental Landfill 2.0 0.1 2 0.5
High
tension line
1.0 0.0 1 0.2
unknown unknown 926.0 42.0 400 97.3
Natural lightning 0.5 0.0 1 0.2
Carelessness Honey
extraction
1200.0 54.4 1 0.2
Intentional
Land clearing
51.6 2.3 3 0.7
Vandalism 0.0 0.0 1 0.2
Vengeance 26.0 1.2 2 0.5
Fire fighting means
The means mobilized by the different
departments in 2013 in Morocco for the
operations against forest fires are as shown
in Table 33:
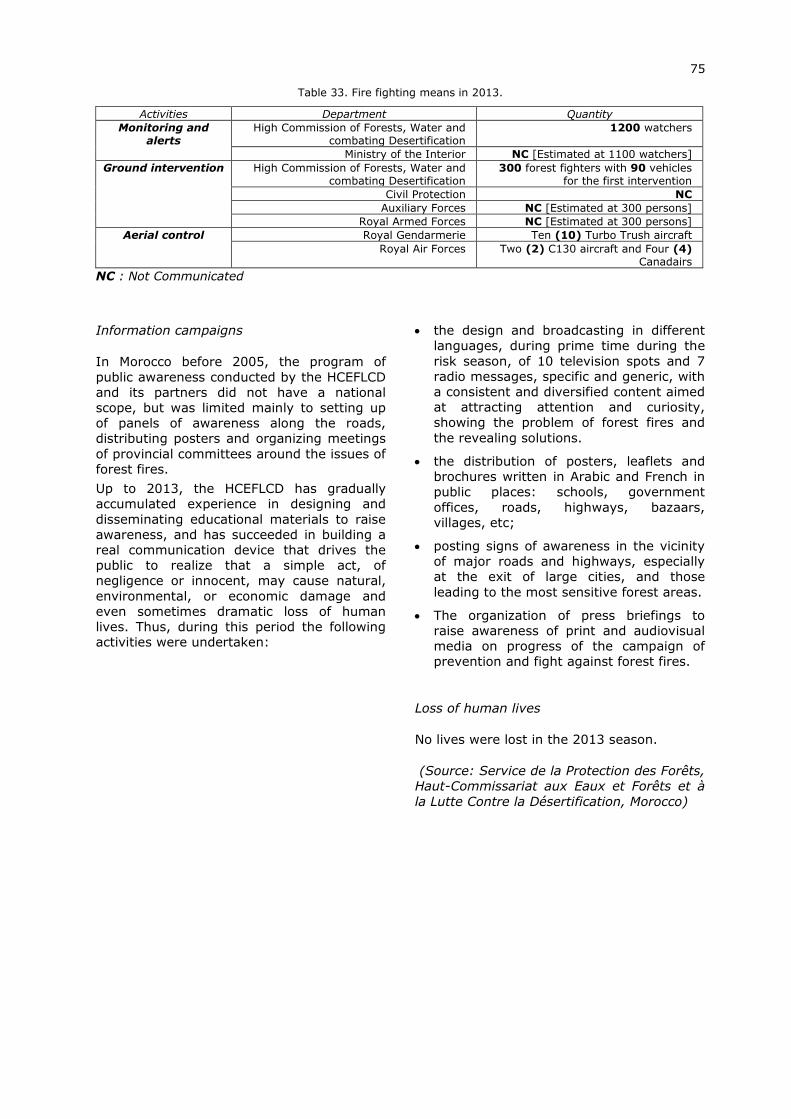
75
Table 33. Fire fighting means in 2013.
Activities Department Quantity
Monitoring and alerts
High Commission of Forests, Water and combating Desertification
1200 watchers
Ministry of the Interior NC [Estimated at 1100 watchers]
Ground intervention High Commission of Forests, Water and combating Desertification
300 forest fighters with 90 vehicles for the first intervention
Civil Protection NC
Auxiliary Forces NC [Estimated at 300 persons]
Royal Armed Forces NC [Estimated at 300 persons]
Aerial control Royal Gendarmerie Ten (10) Turbo Trush aircraft
Royal Air Forces Two (2) C130 aircraft and Four (4) Canadairs
NC : Not Communicated
Information campaigns
In Morocco before 2005, the program of
public awareness conducted by the HCEFLCD
and its partners did not have a national
scope, but was limited mainly to setting up
of panels of awareness along the roads,
distributing posters and organizing meetings
of provincial committees around the issues of
forest fires.
Up to 2013, the HCEFLCD has gradually
accumulated experience in designing and
disseminating educational materials to raise
awareness, and has succeeded in building a
real communication device that drives the
public to realize that a simple act, of
negligence or innocent, may cause natural,
environmental, or economic damage and
even sometimes dramatic loss of human
lives. Thus, during this period the following
activities were undertaken:
the design and broadcasting in different
languages, during prime time during the
risk season, of 10 television spots and 7
radio messages, specific and generic, with
a consistent and diversified content aimed
at attracting attention and curiosity,
showing the problem of forest fires and
the revealing solutions.
the distribution of posters, leaflets and
brochures written in Arabic and French in
public places: schools, government
offices, roads, highways, bazaars,
villages, etc;
posting signs of awareness in the vicinity
of major roads and highways, especially
at the exit of large cities, and those
leading to the most sensitive forest areas.
The organization of press briefings to
raise awareness of print and audiovisual
media on progress of the campaign of
prevention and fight against forest fires.
Loss of human lives
No lives were lost in the 2013 season.
(Source: Service de la Protection des Forêts,
Haut-Commissariat aux Eaux et Forêts et à
la Lutte Contre la Désertification, Morocco)
76
3 THE EUROPEAN FOREST FIRE
INFORMATION SYSTEM (EFFIS) The European Forest Fire Information
System (EFFIS) has been established jointly
by the European Commission services (DG
ENV and JRC) and the relevant fires services
in the EU Member States and European
countries (Forest Services and Civil
Protection services).
EFFIS is the EC focal point of information on
forest fires aiming to support the national
services in charge of the protection of forests
against fires in the EU and neighbouring
countries, and also to provide the EC
services such as the Emergency Response
Coordination Centre (ERCC), formerly
Monitoring and Information Centre (MIC), of
Civil Protection and the European Parliament
with up to date and harmonized information
on forest fires in Europe.
Research activities for the development of
the system initiated in 1998 and the first
EFFIS operations were in the year 2000. In
2003, EFFIS was officially established in the
context of Regulation (EC) No 2152/2003
(Forest Focus) of the European Council and
Parliament on monitoring of forests and
environmental interactions.
The purpose of EFFIS is to provide
information for the protection of forests
against fire in Europe addressing both pre-
fire and post-fire conditions. It also
centralises the national fire data that the
Member States collect through their national
forest fire programmes. A web mapping
interface has been set up on the EFFIS
website 1 which allows users to access EU
wide information about forest fires and other
related environmental data.
EFFIS monitors the fire situation in Europe
and the Mediterranean area, and regularly
sends updates to EC services during the
main fire season. The information about the
on-going fire season is daily updated on the
EFFIS web site, which can be interactively
queried2. EFFIS provides daily meteorological
fire danger maps and forecasts of fire danger
up to 6 days in advance, updated maps of
the latest hotspots (active fires) and fire
perimeters. The damage caused by forest
fires in the European and Mediterranean
region is also estimated from the burned
area maps of EFFIS.
The EFFIS module for the assessment of
meteorological forest fire danger is the EFFIS
Danger Forecast. This module forecasts
1 http://effis.jrc.ec.europa.eu 2 see http://effis.jrc.ec.europa.eu/current-situation
forest fire danger in Europe, part of North
Africa and the Middle East, on the basis of
the Canadian Fire Weather Index (FWI)
System, allowing a harmonized evaluation of
the forest fire danger situation throughout
Europe and neighbouring countries.
The damage caused by forest fires in Europe
and neighbouring countries is estimated
using the EFFIS Rapid Damage Assessment
module. Since 2000, cartography of the
burned areas is produced every year through
the processing of satellite imagery. In the
year 2003, due to the availability of daily
satellite imagery from the MODIS sensor on
board of the TERRA and AQUA satellites, the
RDA provided frequent updates of the total
burnt area in Europe. Since 2007 the RDA is
updated up to two times every day. Further
to the mapping of burnt areas, the analysis
of which types of land cover classes are
affected by fires is performed. This module
uses MODIS satellite imagery with a ground
spatial resolution of about 250 metres, which
permits the mapping of fires of 40 ha or
larger. The burned area mapped by EFFIS
corresponds, on average, to about 80% of
the total area burnt in Europe each year.
Other EFFIS modules have been developed
and are currently in a final validation stage.
Such modules are aimed to provide an
assessment of atmospheric emissions from
forest fires and of the socio-economic impact
of forest fires in Europe.
77
3.1 EFFIS Danger Forecast: 2013 results
The EFFIS Danger Forecast was developed to
support the Commission’s Directorate-
General for the Environment and the forest
fire-fighting services in the EU Member
States. From 2002, at the request of the
Member States, operation of the EFFIS
Danger Forecast was extended to six months
starting on 1 May and ending on 31 October,
and in 2006 to nine months, from 1 February
to 31 October.
In this chapter the fire danger trends
assessed by EFFIS in the different countries
during the 2013 fire season are presented,
comparing them with previous years.
The first part of the 2013 fire season was
relatively mild, due to relatively cool and wet
weather in southern Europe during spring
and early summer. Nevertheless, unusually
hot weather brought severe fire episodes to
the UK and Ireland in March-April, and some
relatively large fires were observed in Greece
in May. Significant fire activity in the
Mediterranean countries started only in July,
with some large fire episodes in Portugal,
Spain, Greece and Italy. During August and
the rest of the fire season moderately mild
conditions continued in most of the EU, with
the exception of Portugal, which was
severely affected by several major fires.
During August, in addition to Portugal,
critical fire episodes were monitored in
Turkey, Italy, Corsica, Bulgaria, Algeria,
Cyprus, Bosnia and Herzegovina, Greece and
Spain.
Overall, despite the very high-to-extreme
fire danger level reported in early August in
large portions of the south-eastern EU, the
Balkan region and North Africa, the 2013 fire
season was well below the historical average,
except for the remarkable fire activity
observed in Portugal especially during the
second part of the season.
Through the Danger Forecast module of
EFFIS the situation has been continuously
monitored and the risk level analysed and
mapped.
The following figures show fire danger
through 2013 as determined by the average
FWI values assessed during the fire season
in the individual countries.
The graphs show the weekly averages of FWI
over entire countries; therefore local peaks
might have been flattened, especially in
those countries such as France or Italy,
where there are strong differences in fire
danger level with changing latitudes;
nevertheless the general trend is depicted
providing relevant information about the fire
danger level and trends of the year.
To allow a better comparison with past
seasons, the curves of 2009-2012 are
presented in conjunction with 2013 for all
countries.
The countries analysed are those
participating in the EFFIS network and are
presented in alphabetic order within the two
groups (European countries and MENA
countries) in the graphs that follow.
NOTE: In order to make the graphs more
readable, 3 scales have been used to
present the FWI: 0-30 for the most
northern countries where fire danger
rarely reaches high levels; 0-50 for most
other countries including those in the
Mediterranean; and 0-70 for the MENA
countries and Turkey.
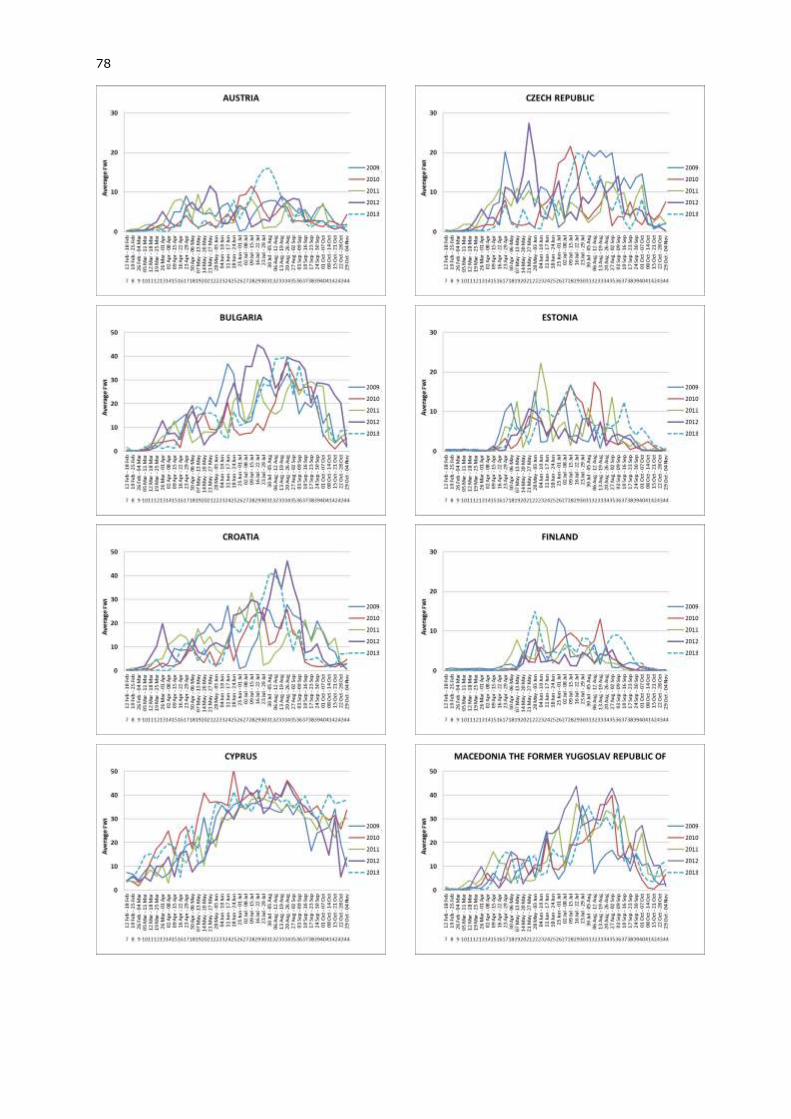
78
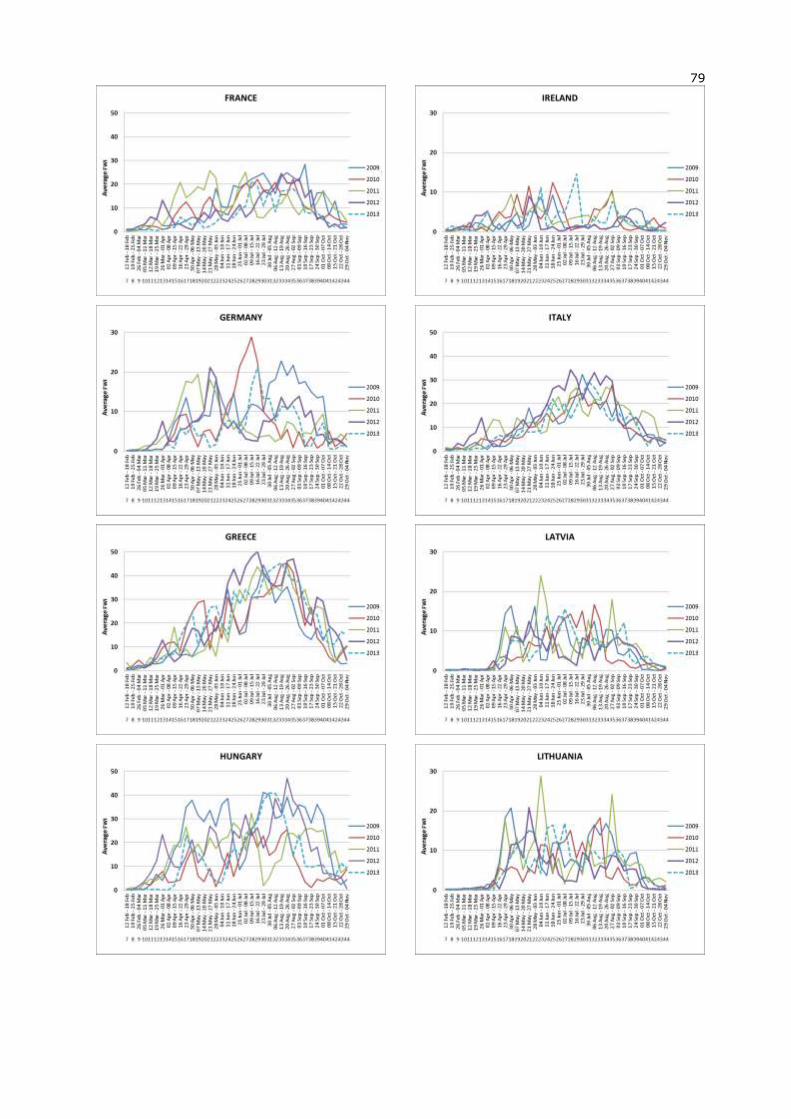
79
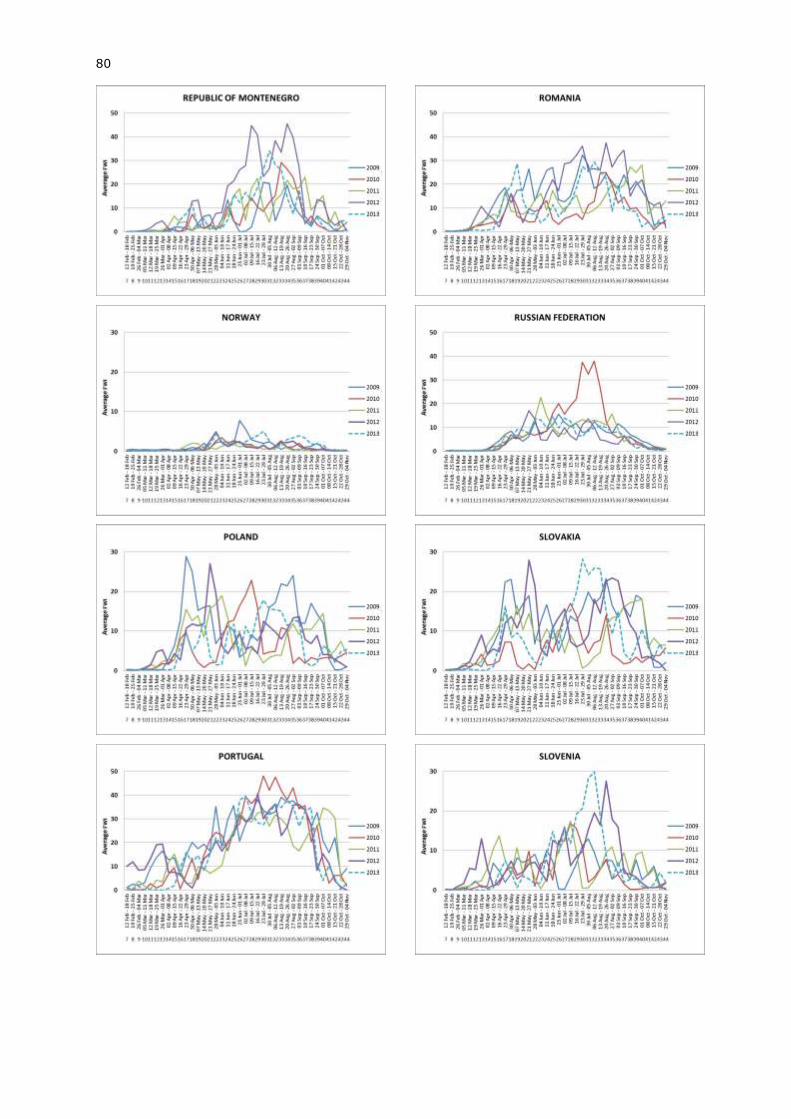
80
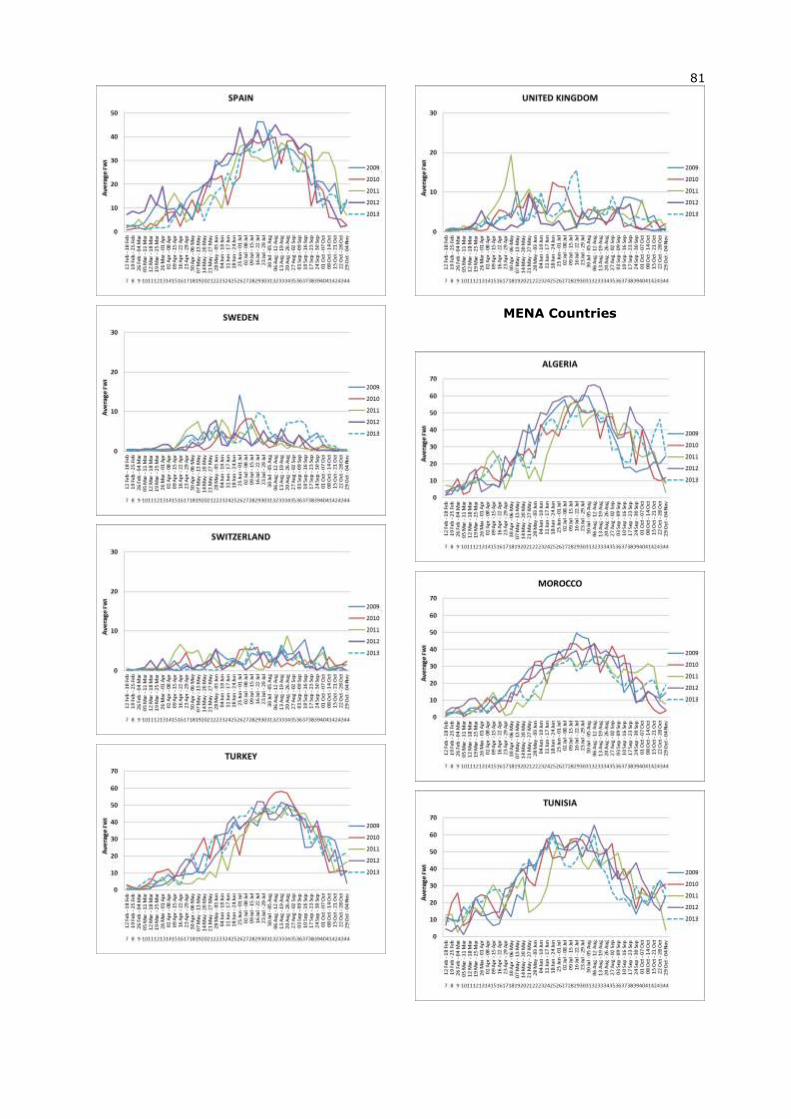
81
MENA Countries
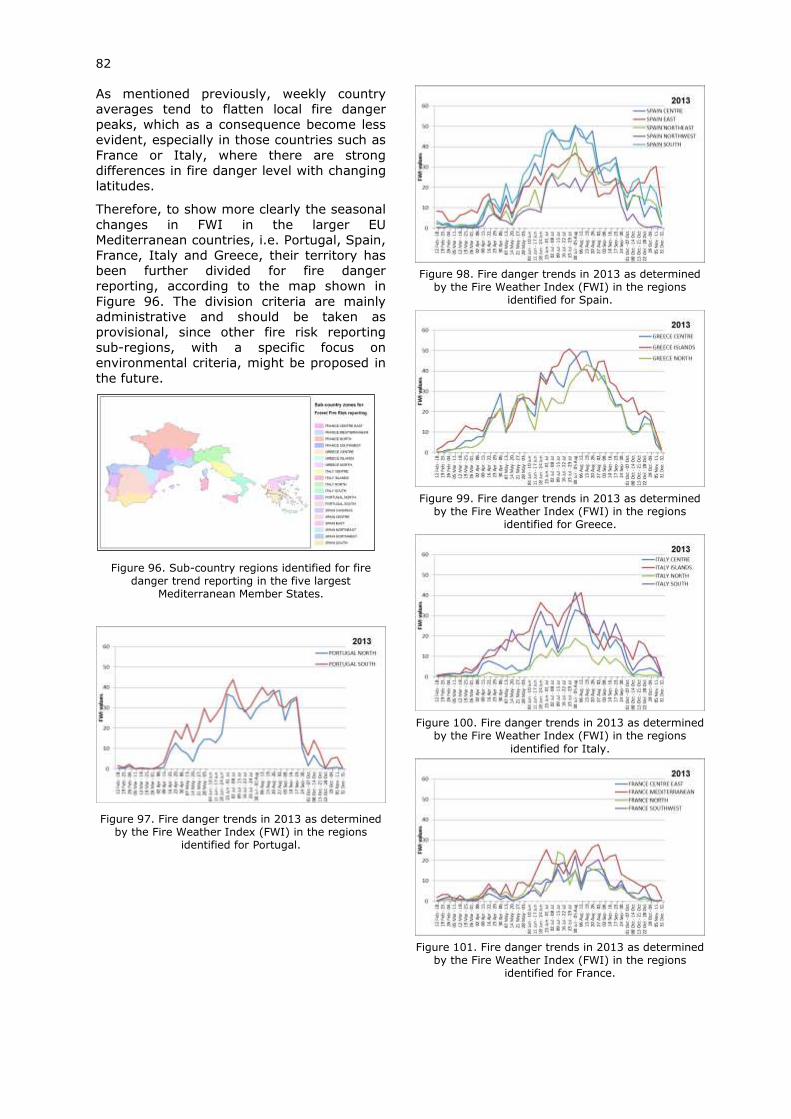
82
As mentioned previously, weekly country
averages tend to flatten local fire danger
peaks, which as a consequence become less
evident, especially in those countries such as
France or Italy, where there are strong
differences in fire danger level with changing
latitudes.
Therefore, to show more clearly the seasonal
changes in FWI in the larger EU
Mediterranean countries, i.e. Portugal, Spain,
France, Italy and Greece, their territory has
been further divided for fire danger
reporting, according to the map shown in
Figure 96. The division criteria are mainly
administrative and should be taken as
provisional, since other fire risk reporting
sub-regions, with a specific focus on
environmental criteria, might be proposed in
the future.
Figure 96. Sub-country regions identified for fire danger trend reporting in the five largest
Mediterranean Member States.
Figure 97. Fire danger trends in 2013 as determined by the Fire Weather Index (FWI) in the regions
identified for Portugal.
Figure 98. Fire danger trends in 2013 as determined
by the Fire Weather Index (FWI) in the regions identified for Spain.
Figure 99. Fire danger trends in 2013 as determined
by the Fire Weather Index (FWI) in the regions identified for Greece.
Figure 100. Fire danger trends in 2013 as determined
by the Fire Weather Index (FWI) in the regions
identified for Italy.
Figure 101. Fire danger trends in 2013 as determined
by the Fire Weather Index (FWI) in the regions identified for France.
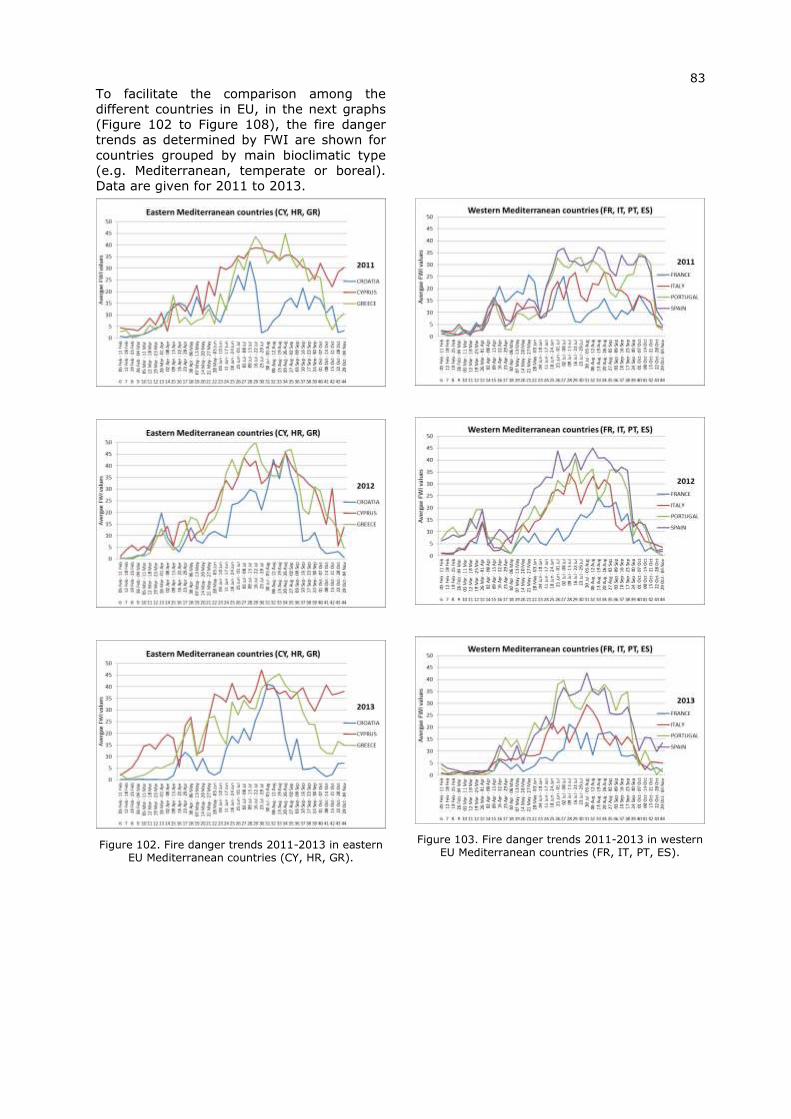
83
To facilitate the comparison among the
different countries in EU, in the next graphs
(Figure 102 to Figure 108), the fire danger
trends as determined by FWI are shown for
countries grouped by main bioclimatic type
(e.g. Mediterranean, temperate or boreal).
Data are given for 2011 to 2013.
Figure 102. Fire danger trends 2011-2013 in eastern EU Mediterranean countries (CY, HR, GR).
Figure 103. Fire danger trends 2011-2013 in western EU Mediterranean countries (FR, IT, PT, ES).
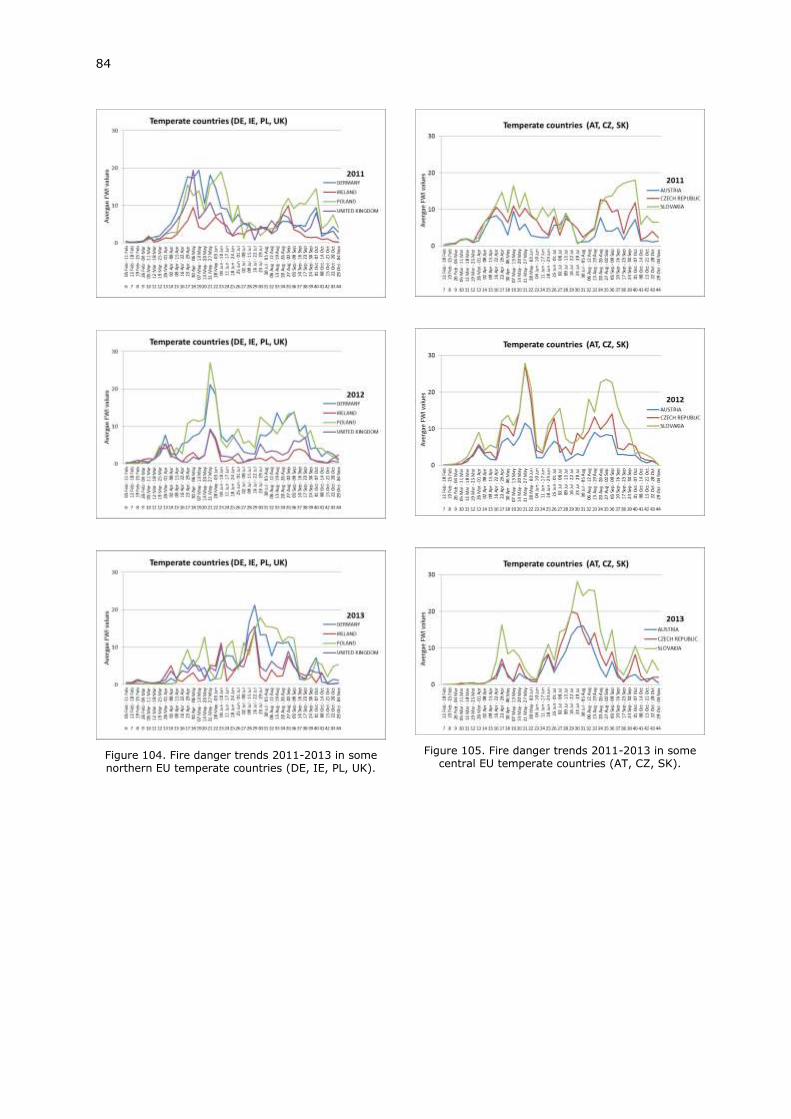
84
Figure 104. Fire danger trends 2011-2013 in some northern EU temperate countries (DE, IE, PL, UK).
Figure 105. Fire danger trends 2011-2013 in some central EU temperate countries (AT, CZ, SK).
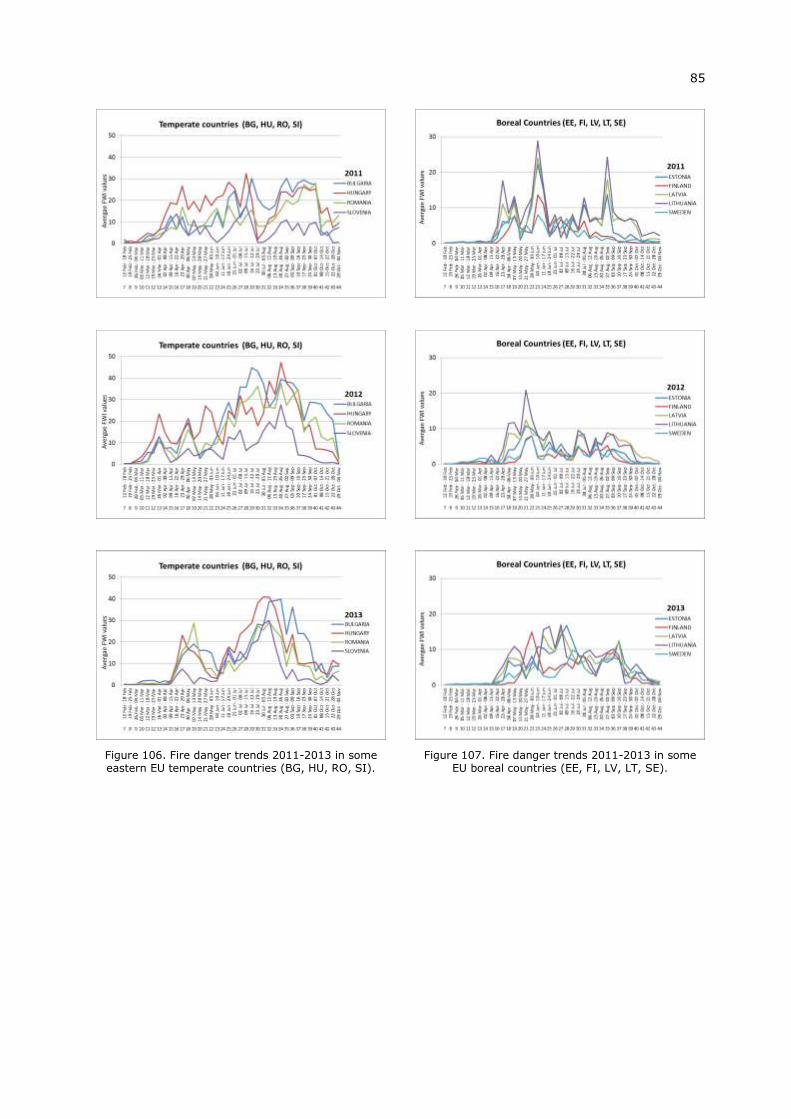
85
Figure 106. Fire danger trends 2011-2013 in some eastern EU temperate countries (BG, HU, RO, SI).
Figure 107. Fire danger trends 2011-2013 in some EU boreal countries (EE, FI, LV, LT, SE).
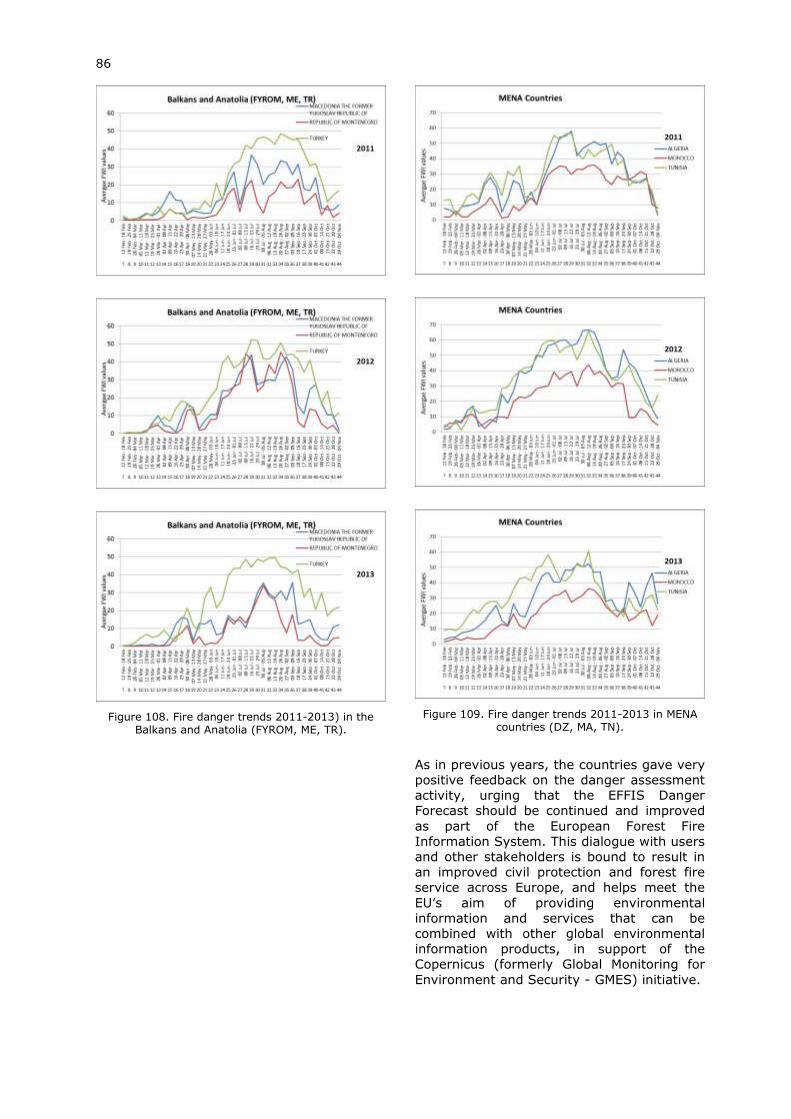
86
Figure 108. Fire danger trends 2011-2013) in the Balkans and Anatolia (FYROM, ME, TR).
Figure 109. Fire danger trends 2011-2013 in MENA countries (DZ, MA, TN).
As in previous years, the countries gave very
positive feedback on the danger assessment
activity, urging that the EFFIS Danger
Forecast should be continued and improved
as part of the European Forest Fire
Information System. This dialogue with users
and other stakeholders is bound to result in
an improved civil protection and forest fire
service across Europe, and helps meet the
EU’s aim of providing environmental
information and services that can be
combined with other global environmental
information products, in support of the
Copernicus (formerly Global Monitoring for
Environment and Security - GMES) initiative.
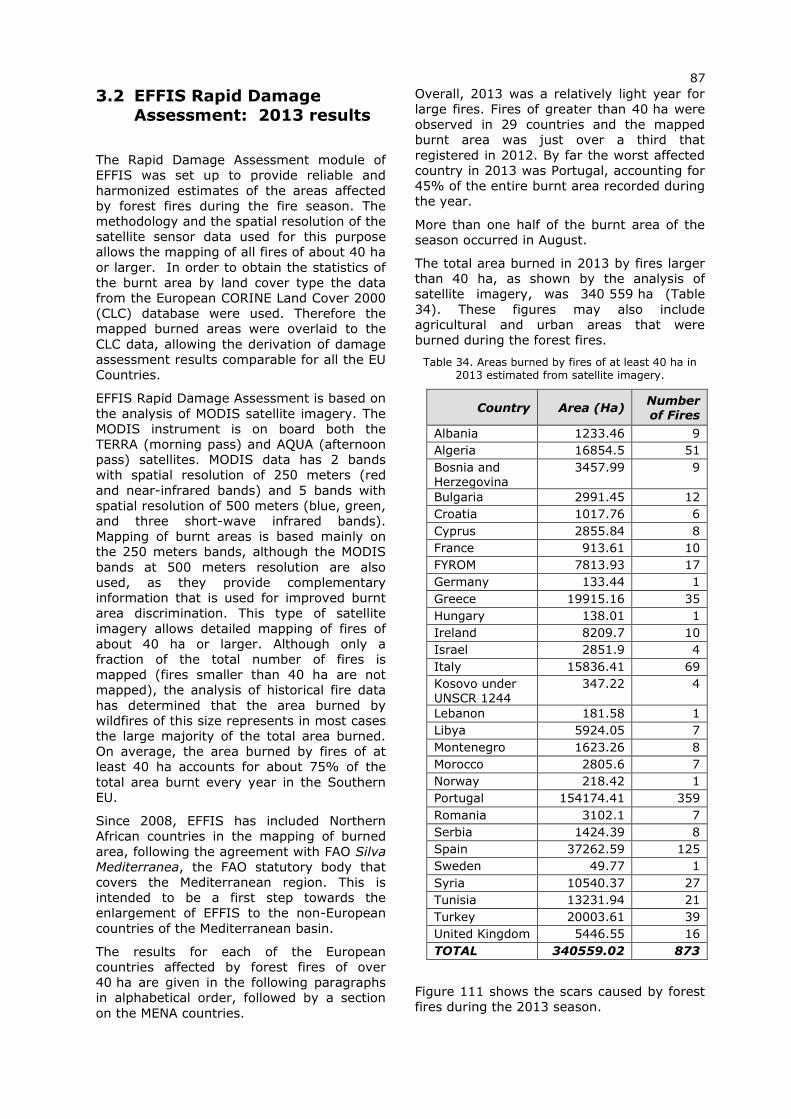
87
3.2 EFFIS Rapid Damage Assessment: 2013 results
The Rapid Damage Assessment module of
EFFIS was set up to provide reliable and
harmonized estimates of the areas affected
by forest fires during the fire season. The
methodology and the spatial resolution of the
satellite sensor data used for this purpose
allows the mapping of all fires of about 40 ha
or larger. In order to obtain the statistics of
the burnt area by land cover type the data
from the European CORINE Land Cover 2000
(CLC) database were used. Therefore the
mapped burned areas were overlaid to the
CLC data, allowing the derivation of damage
assessment results comparable for all the EU
Countries.
EFFIS Rapid Damage Assessment is based on
the analysis of MODIS satellite imagery. The
MODIS instrument is on board both the
TERRA (morning pass) and AQUA (afternoon
pass) satellites. MODIS data has 2 bands
with spatial resolution of 250 meters (red
and near-infrared bands) and 5 bands with
spatial resolution of 500 meters (blue, green,
and three short-wave infrared bands).
Mapping of burnt areas is based mainly on
the 250 meters bands, although the MODIS
bands at 500 meters resolution are also
used, as they provide complementary
information that is used for improved burnt
area discrimination. This type of satellite
imagery allows detailed mapping of fires of
about 40 ha or larger. Although only a
fraction of the total number of fires is
mapped (fires smaller than 40 ha are not
mapped), the analysis of historical fire data
has determined that the area burned by
wildfires of this size represents in most cases
the large majority of the total area burned.
On average, the area burned by fires of at
least 40 ha accounts for about 75% of the
total area burnt every year in the Southern
EU.
Since 2008, EFFIS has included Northern
African countries in the mapping of burned
area, following the agreement with FAO Silva
Mediterranea, the FAO statutory body that
covers the Mediterranean region. This is
intended to be a first step towards the
enlargement of EFFIS to the non-European
countries of the Mediterranean basin.
The results for each of the European
countries affected by forest fires of over 40 ha are given in the following paragraphs
in alphabetical order, followed by a section
on the MENA countries.
Overall, 2013 was a relatively light year for
large fires. Fires of greater than 40 ha were
observed in 29 countries and the mapped
burnt area was just over a third that
registered in 2012. By far the worst affected
country in 2013 was Portugal, accounting for
45% of the entire burnt area recorded during
the year.
More than one half of the burnt area of the
season occurred in August.
The total area burned in 2013 by fires larger
than 40 ha, as shown by the analysis of
satellite imagery, was 340 559 ha (Table
34). These figures may also include
agricultural and urban areas that were
burned during the forest fires.
Table 34. Areas burned by fires of at least 40 ha in 2013 estimated from satellite imagery.
Country Area (Ha) Number of Fires
Albania 1233.46 9
Algeria 16854.5 51
Bosnia and Herzegovina
3457.99 9
Bulgaria 2991.45 12
Croatia 1017.76 6
Cyprus 2855.84 8
France 913.61 10
FYROM 7813.93 17
Germany 133.44 1
Greece 19915.16 35
Hungary 138.01 1
Ireland 8209.7 10
Israel 2851.9 4
Italy 15836.41 69
Kosovo under UNSCR 1244
347.22 4
Lebanon 181.58 1
Libya 5924.05 7
Montenegro 1623.26 8
Morocco 2805.6 7
Norway 218.42 1
Portugal 154174.41 359
Romania 3102.1 7
Serbia 1424.39 8
Spain 37262.59 125
Sweden 49.77 1
Syria 10540.37 27
Tunisia 13231.94 21
Turkey 20003.61 39
United Kingdom 5446.55 16
TOTAL 340559.02 873
Figure 111 shows the scars caused by forest
fires during the 2013 season.
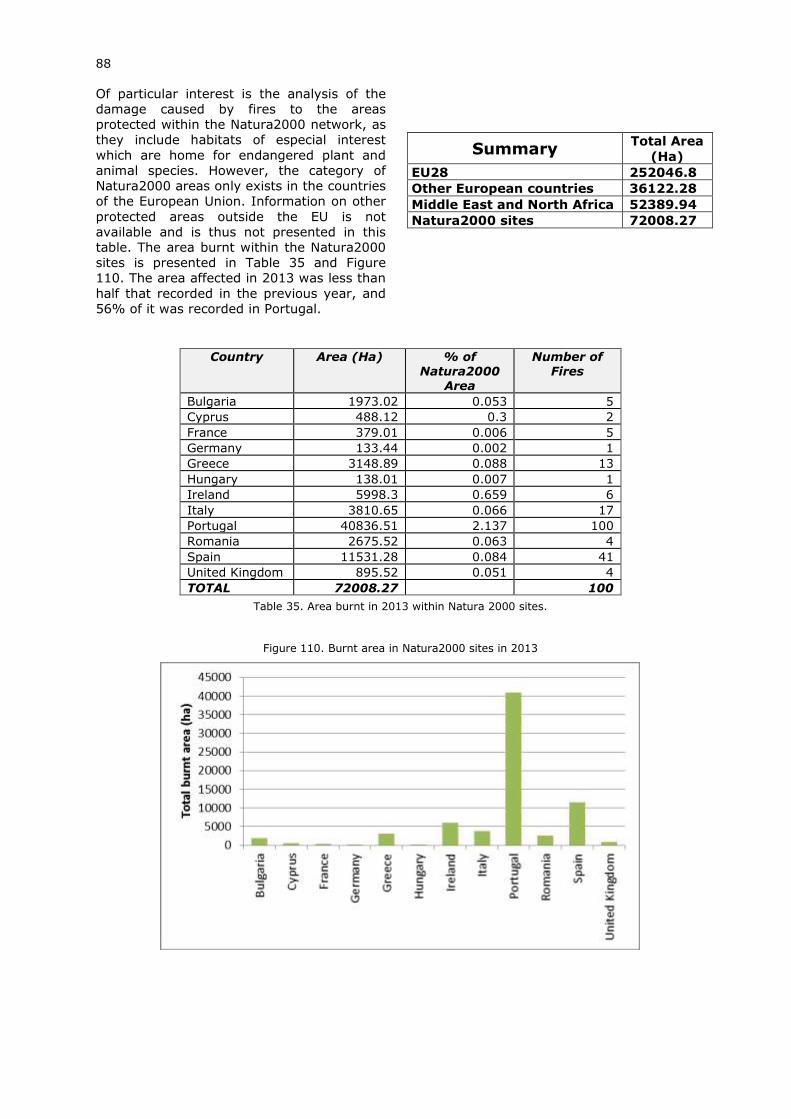
88
Of particular interest is the analysis of the
damage caused by fires to the areas
protected within the Natura2000 network, as
they include habitats of especial interest
which are home for endangered plant and
animal species. However, the category of
Natura2000 areas only exists in the countries
of the European Union. Information on other
protected areas outside the EU is not
available and is thus not presented in this
table. The area burnt within the Natura2000
sites is presented in Table 35 and Figure
110. The area affected in 2013 was less than
half that recorded in the previous year, and
56% of it was recorded in Portugal.
Summary Total Area
(Ha)
EU28 252046.8
Other European countries 36122.28
Middle East and North Africa 52389.94
Natura2000 sites 72008.27
Country Area (Ha) % of Natura2000
Area
Number of Fires
Bulgaria 1973.02 0.053 5
Cyprus 488.12 0.3 2
France 379.01 0.006 5
Germany 133.44 0.002 1
Greece 3148.89 0.088 13
Hungary 138.01 0.007 1
Ireland 5998.3 0.659 6
Italy 3810.65 0.066 17
Portugal 40836.51 2.137 100
Romania 2675.52 0.063 4
Spain 11531.28 0.084 41
United Kingdom 895.52 0.051 4
TOTAL 72008.27 100
Table 35. Area burnt in 2013 within Natura 2000 sites.
Figure 110. Burnt area in Natura2000 sites in 2013
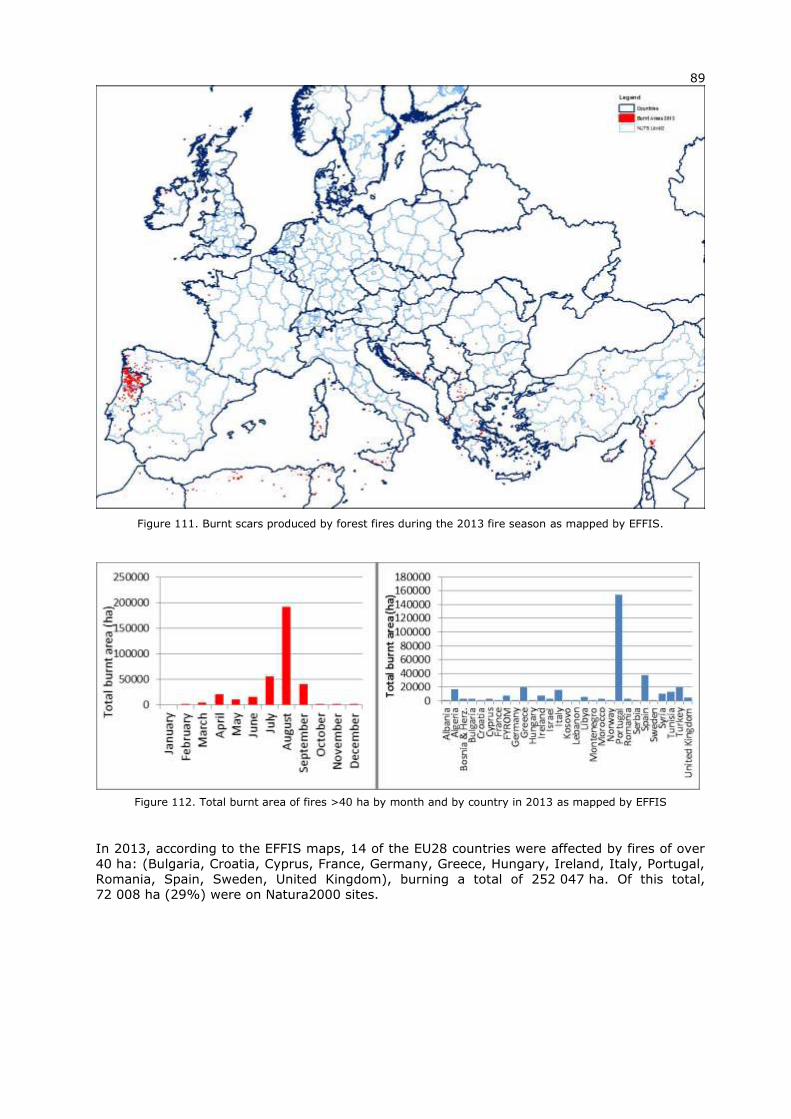
89
Figure 111. Burnt scars produced by forest fires during the 2013 fire season as mapped by EFFIS.
Figure 112. Total burnt area of fires >40 ha by month and by country in 2013 as mapped by EFFIS
In 2013, according to the EFFIS maps, 14 of the EU28 countries were affected by fires of over
40 ha: (Bulgaria, Croatia, Cyprus, France, Germany, Greece, Hungary, Ireland, Italy, Portugal,
Romania, Spain, Sweden, United Kingdom), burning a total of 252 047 ha. Of this total,
72 008 ha (29%) were on Natura2000 sites.
90
Europe
In most of Europe the worst part of the fire
season occurred in August. In general, with a
few notable exceptions, it was a quiet year
for forest fires.
3.2.1 Albania
The 2013 fire season in Albania was the
mildest for several years. 9 fires of over 50
ha burnt a total of 1 234 ha. These occurred
relatively late in the season (August-
October). Table 36 presents the distribution
of the mapped burned area by land cover
type using the CLC 2000 database. The burnt
area was spread more or less evenly
between forest/other wooded lands and
other natural lands. Figure 113 below shows
the damage caused by forest fires in Albania
(AL) and neighbouring countries.
Table 36. Distribution of burnt area (ha) in Albania by land cover types in 2013.
Land cover Area burned
(ha)
% of total
burned Forest/Other Wooded Land 583.91 47.34%
Other Natural Land 570.52 46.25%
Agriculture 76.29 6.18%
Artificial Surfaces 2.75 0.22%
Total: 1233.46 100%
3.2.2 Bosnia-Herzegovina
In common with most of the Balkans,
Bosnia-Herzegovina had a very light year for
forest fires. The annual total of 3 458 ha
was a fraction of last year’s total
(87 697 ha), and a significant portion of this
damage came from 3 fires over 500 ha. Fires
of over 40 ha were only recorded in 2
months (April and August). Table 37
presents the distribution of the mapped
burnt area by land cover type using the CLC
2000 database. Visible fire scars caused by
forest fires in Bosnia-Herzegovina (BA) can
be seen in Figure 113.
Table 37. Distribution of burnt area (ha) in Bosnia-Herzegovina by land cover types in 2013.
Land cover Area burned
(ha)
% of total
burned Forest /Other Wooded Land 2559.7 74.02%
Other Natural Land 608.27 17.59%
Agriculture 289.95 8.38%
Artificial Surfaces 0.07 0%
Total: 3457.99 100%
3.2.3 Bulgaria
The 2013 fire season in Bulgaria was the
mildest for some years. 12 fires of over
40 ha were recorded, including one of over
1000 ha which occurred in August in a
Natura2000 site. In total, 1 973 ha of the
year’s total of 2992 ha burnt Natura2000
land, representing 66% of the area burnt
and 0.05% of the Natura2000 areas in the
country. Table 38 presents the distribution of
the mapped burned area by land cover type
using the CLC 2000 database. Figure 113
shows the damage caused by forest fires in
Bulgaria (BG).
Table 38. Distribution of burned area (ha) in Bulgaria by land cover types in 2013.
Land cover Area burned
(ha)
% of total
burned Forest/Other Wooded Land 692.69 23.16
Other Natural Land 1182.55 39.53
Agriculture 1112.03 37.17
Artificial Surfaces 4.18 0.14
Total: 2991.45 100
3.2.4 Croatia
After two hard fire seasons in 2011-2012,
Croatia had an extremely light year in 2013,
and the damage recorded was only 3% of
that observed in 2012. There were 6 fires of
over 40 ha, burning a total of 1 018 ha. (As
a comparison, in 2012, 7 fires of over
1000 ha were recorded, from a total of
33 240 ha). None of the burnt area was
recorded in protected areas. Table 39
presents the distribution of the mapped
burnt area by land cover type using the CLC
2000 database. The visible scars left by fires
in the south of Croatia (HR) can be seen in
Figure 113 below.
Table 39. Distribution of burnt area (ha) in Croatia by land cover types in 2013.
Land cover Area burned
(ha)
% of total
burned Forest /Other Wooded Land 249.22 24.49%
Other Natural Land 600.06 58.96%
Agriculture 160.37 15.76%
Artificial Surfaces 8.1 0.8%
Total: 1017.76 100%
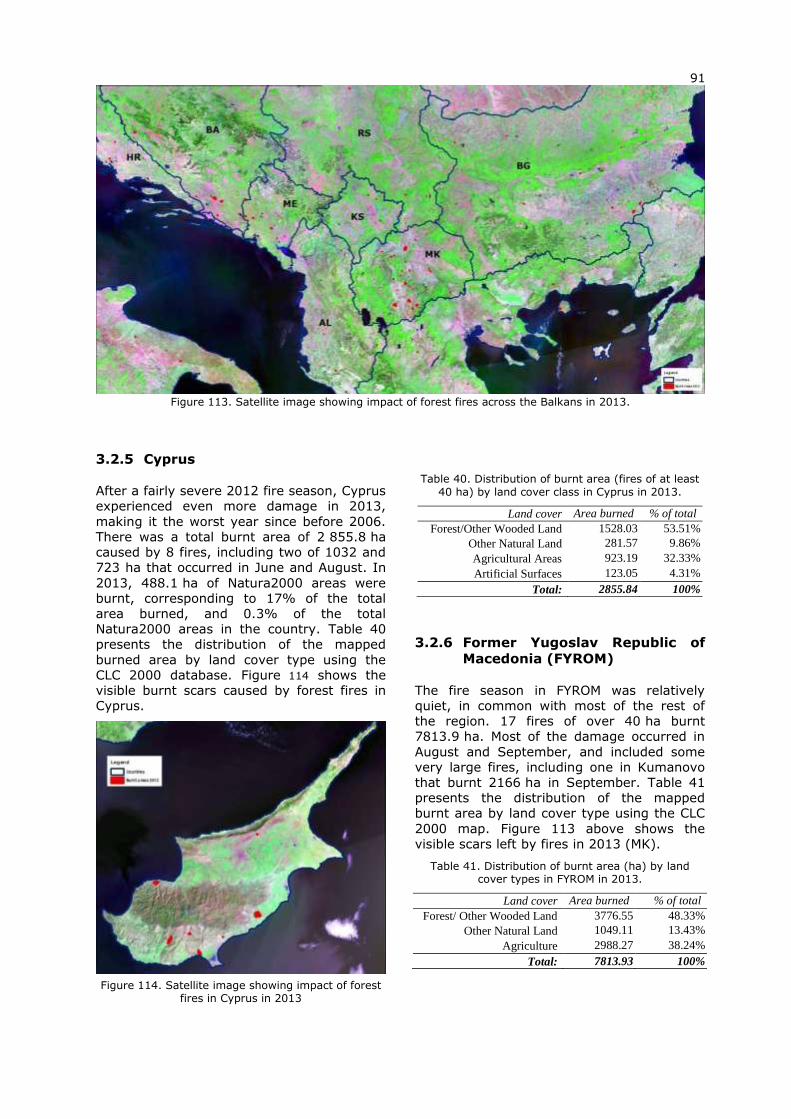
91
Figure 113. Satellite image showing impact of forest fires across the Balkans in 2013.
3.2.5 Cyprus
After a fairly severe 2012 fire season, Cyprus
experienced even more damage in 2013,
making it the worst year since before 2006.
There was a total burnt area of 2 855.8 ha
caused by 8 fires, including two of 1032 and
723 ha that occurred in June and August. In
2013, 488.1 ha of Natura2000 areas were
burnt, corresponding to 17% of the total
area burned, and 0.3% of the total
Natura2000 areas in the country. Table 40
presents the distribution of the mapped
burned area by land cover type using the
CLC 2000 database. Figure 114 shows the
visible burnt scars caused by forest fires in
Cyprus.
Figure 114. Satellite image showing impact of forest
fires in Cyprus in 2013
Table 40. Distribution of burnt area (fires of at least
40 ha) by land cover class in Cyprus in 2013.
Land cover Area burned
(ha)
% of total
burned Forest/Other Wooded Land 1528.03 53.51%
Other Natural Land 281.57 9.86%
Agricultural Areas 923.19 32.33%
Artificial Surfaces 123.05 4.31%
Total: 2855.84 100%
3.2.6 Former Yugoslav Republic of
Macedonia (FYROM)
The fire season in FYROM was relatively
quiet, in common with most of the rest of
the region. 17 fires of over 40 ha burnt
7813.9 ha. Most of the damage occurred in
August and September, and included some
very large fires, including one in Kumanovo
that burnt 2166 ha in September. Table 41
presents the distribution of the mapped
burnt area by land cover type using the CLC
2000 map. Figure 113 above shows the
visible scars left by fires in 2013 (MK).
Table 41. Distribution of burnt area (ha) by land cover types in FYROM in 2013.
Land cover Area burned
(ha)
% of total
burned Forest/ Other Wooded Land 3776.55 48.33%
Other Natural Land 1049.11 13.43%
Agriculture 2988.27 38.24%
Total: 7813.93 100%
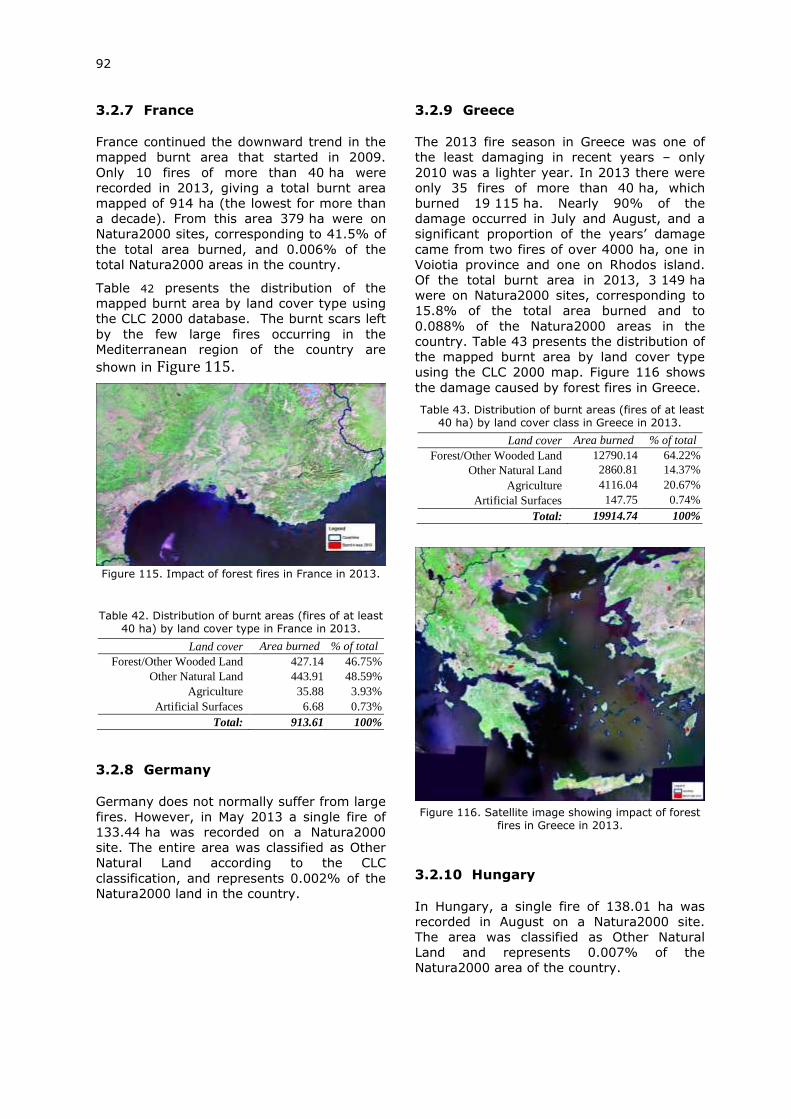
92
3.2.7 France
France continued the downward trend in the
mapped burnt area that started in 2009.
Only 10 fires of more than 40 ha were
recorded in 2013, giving a total burnt area
mapped of 914 ha (the lowest for more than
a decade). From this area 379 ha were on
Natura2000 sites, corresponding to 41.5% of
the total area burned, and 0.006% of the
total Natura2000 areas in the country.
Table 42 presents the distribution of the
mapped burnt area by land cover type using
the CLC 2000 database. The burnt scars left
by the few large fires occurring in the
Mediterranean region of the country are
shown in Figure 115.
Figure 115. Impact of forest fires in France in 2013.
Table 42. Distribution of burnt areas (fires of at least 40 ha) by land cover type in France in 2013.
Land cover Area burned
(ha)
% of total
burned Forest/Other Wooded Land 427.14 46.75%
Other Natural Land 443.91 48.59%
Agriculture 35.88 3.93%
Artificial Surfaces 6.68 0.73%
Total: 913.61 100%
3.2.8 Germany
Germany does not normally suffer from large
fires. However, in May 2013 a single fire of
133.44 ha was recorded on a Natura2000
site. The entire area was classified as Other
Natural Land according to the CLC
classification, and represents 0.002% of the
Natura2000 land in the country.
3.2.9 Greece
The 2013 fire season in Greece was one of
the least damaging in recent years – only
2010 was a lighter year. In 2013 there were
only 35 fires of more than 40 ha, which
burned 19 115 ha. Nearly 90% of the
damage occurred in July and August, and a
significant proportion of the years’ damage
came from two fires of over 4000 ha, one in
Voiotia province and one on Rhodos island.
Of the total burnt area in 2013, 3 149 ha
were on Natura2000 sites, corresponding to
15.8% of the total area burned and to
0.088% of the Natura2000 areas in the
country. Table 43 presents the distribution of
the mapped burnt area by land cover type
using the CLC 2000 map. Figure 116 shows
the damage caused by forest fires in Greece.
Table 43. Distribution of burnt areas (fires of at least 40 ha) by land cover class in Greece in 2013.
Land cover Area burned
(ha)
% of total
burned Forest/Other Wooded Land 12790.14 64.22%
Other Natural Land 2860.81 14.37%
Agriculture 4116.04 20.67%
Artificial Surfaces 147.75 0.74%
Total: 19914.74 100%
Figure 116. Satellite image showing impact of forest
fires in Greece in 2013.
3.2.10 Hungary
In Hungary, a single fire of 138.01 ha was
recorded in August on a Natura2000 site.
The area was classified as Other Natural
Land and represents 0.007% of the
Natura2000 area of the country.
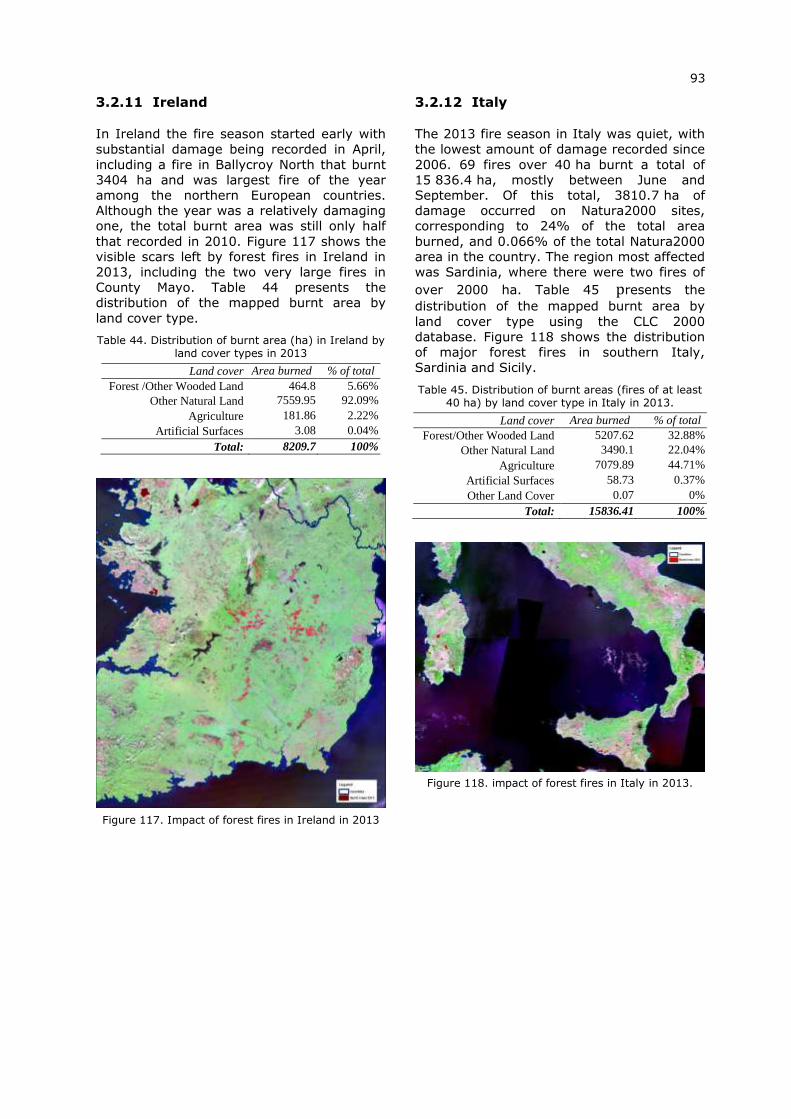
93
3.2.11 Ireland
In Ireland the fire season started early with
substantial damage being recorded in April,
including a fire in Ballycroy North that burnt
3404 ha and was largest fire of the year
among the northern European countries.
Although the year was a relatively damaging
one, the total burnt area was still only half
that recorded in 2010. Figure 117 shows the
visible scars left by forest fires in Ireland in
2013, including the two very large fires in
County Mayo. Table 44 presents the
distribution of the mapped burnt area by
land cover type.
Table 44. Distribution of burnt area (ha) in Ireland by land cover types in 2013
Land cover Area burned
(ha)
% of total
burned Forest /Other Wooded Land 464.8 5.66%
Other Natural Land 7559.95 92.09%
Agriculture 181.86 2.22%
Artificial Surfaces 3.08 0.04%
Total: 8209.7 100%
Figure 117. Impact of forest fires in Ireland in 2013
3.2.12 Italy
The 2013 fire season in Italy was quiet, with
the lowest amount of damage recorded since
2006. 69 fires over 40 ha burnt a total of
15 836.4 ha, mostly between June and
September. Of this total, 3810.7 ha of
damage occurred on Natura2000 sites,
corresponding to 24% of the total area
burned, and 0.066% of the total Natura2000
area in the country. The region most affected
was Sardinia, where there were two fires of
over 2000 ha. Table 45 presents the
distribution of the mapped burnt area by
land cover type using the CLC 2000
database. Figure 118 shows the distribution
of major forest fires in southern Italy,
Sardinia and Sicily.
Table 45. Distribution of burnt areas (fires of at least 40 ha) by land cover type in Italy in 2013.
Land cover Area burned
(ha)
% of total
burned Forest/Other Wooded Land 5207.62 32.88%
Other Natural Land 3490.1 22.04%
Agriculture 7079.89 44.71%
Artificial Surfaces 58.73 0.37%
Other Land Cover 0.07 0%
Total: 15836.41 100%
Figure 118. impact of forest fires in Italy in 2013.
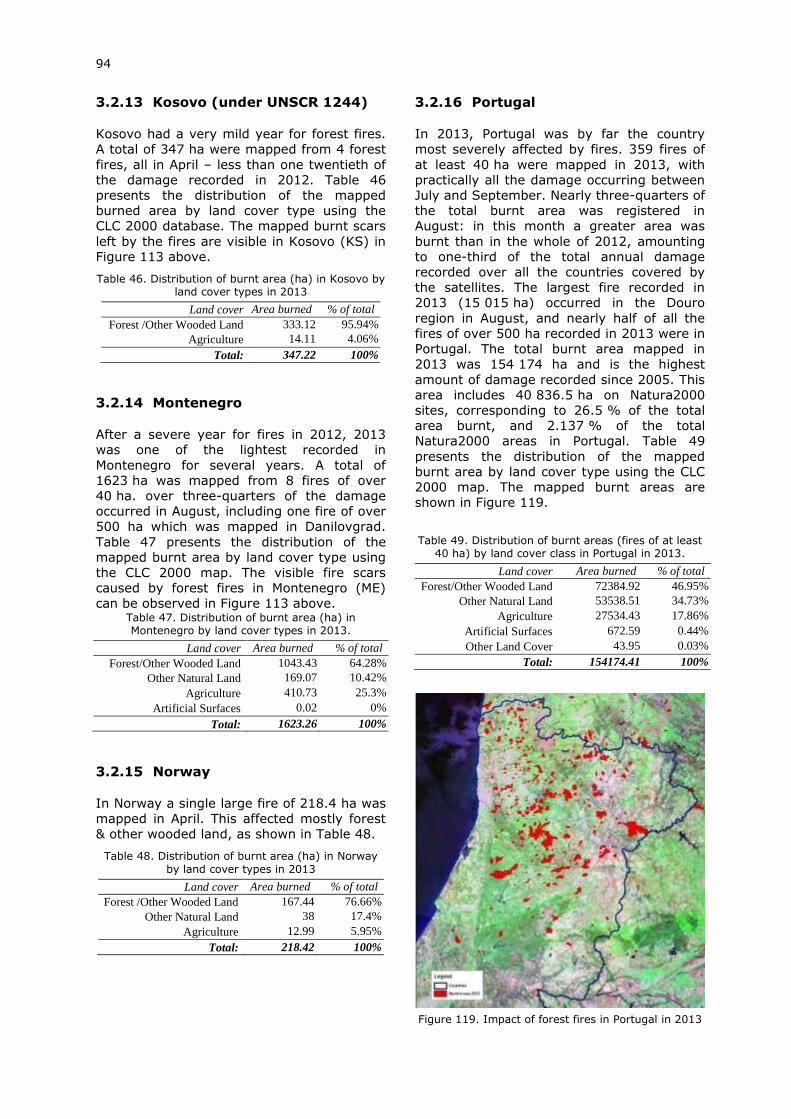
94
3.2.13 Kosovo (under UNSCR 1244)
Kosovo had a very mild year for forest fires.
A total of 347 ha were mapped from 4 forest
fires, all in April – less than one twentieth of
the damage recorded in 2012. Table 46
presents the distribution of the mapped
burned area by land cover type using the
CLC 2000 database. The mapped burnt scars
left by the fires are visible in Kosovo (KS) in
Figure 113 above.
Table 46. Distribution of burnt area (ha) in Kosovo by land cover types in 2013
Land cover Area burned
(ha)
% of total
burned Forest /Other Wooded Land 333.12 95.94%
Agriculture 14.11 4.06%
Total: 347.22 100%
3.2.14 Montenegro
After a severe year for fires in 2012, 2013
was one of the lightest recorded in
Montenegro for several years. A total of
1623 ha was mapped from 8 fires of over
40 ha. over three-quarters of the damage
occurred in August, including one fire of over
500 ha which was mapped in Danilovgrad.
Table 47 presents the distribution of the
mapped burnt area by land cover type using
the CLC 2000 map. The visible fire scars
caused by forest fires in Montenegro (ME)
can be observed in Figure 113 above. Table 47. Distribution of burnt area (ha) in Montenegro by land cover types in 2013.
Land cover Area burned
(ha)
% of total
burned Forest/Other Wooded Land 1043.43 64.28%
Other Natural Land 169.07 10.42%
Agriculture 410.73 25.3%
Artificial Surfaces 0.02 0%
Total: 1623.26 100%
3.2.15 Norway
In Norway a single large fire of 218.4 ha was
mapped in April. This affected mostly forest
& other wooded land, as shown in Table 48.
Table 48. Distribution of burnt area (ha) in Norway
by land cover types in 2013
Land cover Area burned
(ha)
% of total
burned Forest /Other Wooded Land 167.44 76.66%
Other Natural Land 38 17.4%
Agriculture 12.99 5.95%
Total: 218.42 100%
3.2.16 Portugal
In 2013, Portugal was by far the country
most severely affected by fires. 359 fires of
at least 40 ha were mapped in 2013, with
practically all the damage occurring between
July and September. Nearly three-quarters of
the total burnt area was registered in
August: in this month a greater area was
burnt than in the whole of 2012, amounting
to one-third of the total annual damage
recorded over all the countries covered by
the satellites. The largest fire recorded in
2013 (15 015 ha) occurred in the Douro
region in August, and nearly half of all the
fires of over 500 ha recorded in 2013 were in
Portugal. The total burnt area mapped in
2013 was 154 174 ha and is the highest
amount of damage recorded since 2005. This
area includes 40 836.5 ha on Natura2000
sites, corresponding to 26.5 % of the total
area burnt, and 2.137 % of the total
Natura2000 areas in Portugal. Table 49
presents the distribution of the mapped
burnt area by land cover type using the CLC
2000 map. The mapped burnt areas are
shown in Figure 119.
Table 49. Distribution of burnt areas (fires of at least 40 ha) by land cover class in Portugal in 2013.
Land cover Area burned
(ha)
% of total
burned Forest/Other Wooded Land 72384.92 46.95%
Other Natural Land 53538.51 34.73%
Agriculture 27534.43 17.86%
Artificial Surfaces 672.59 0.44%
Other Land Cover 43.95 0.03%
Total: 154174.41 100%
Figure 119. Impact of forest fires in Portugal in 2013
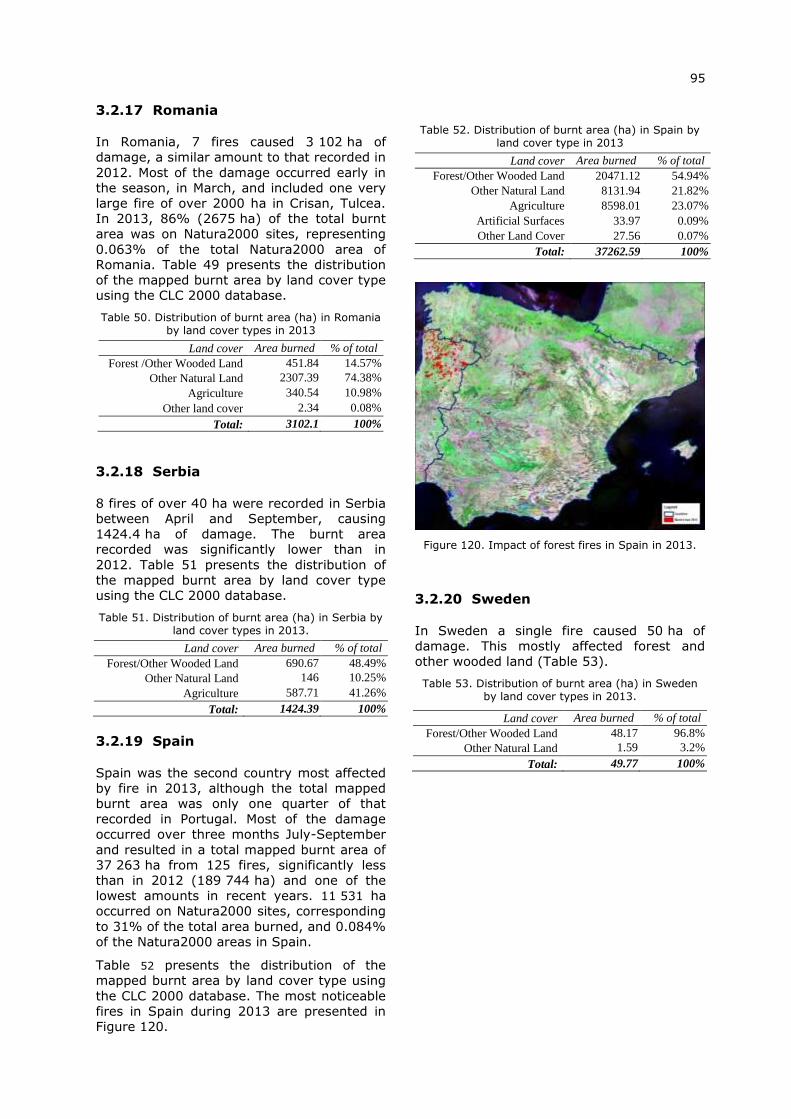
95
3.2.17 Romania
In Romania, 7 fires caused 3 102 ha of
damage, a similar amount to that recorded in
2012. Most of the damage occurred early in
the season, in March, and included one very
large fire of over 2000 ha in Crisan, Tulcea.
In 2013, 86% (2675 ha) of the total burnt
area was on Natura2000 sites, representing
0.063% of the total Natura2000 area of
Romania. Table 49 presents the distribution
of the mapped burnt area by land cover type
using the CLC 2000 database.
Table 50. Distribution of burnt area (ha) in Romania by land cover types in 2013
Land cover Area burned
(ha)
% of total
burned Forest /Other Wooded Land 451.84 14.57%
Other Natural Land 2307.39 74.38%
Agriculture 340.54 10.98%
Other land cover 2.34 0.08%
Total: 3102.1 100%
3.2.18 Serbia
8 fires of over 40 ha were recorded in Serbia
between April and September, causing
1424.4 ha of damage. The burnt area
recorded was significantly lower than in
2012. Table 51 presents the distribution of
the mapped burnt area by land cover type
using the CLC 2000 database.
Table 51. Distribution of burnt area (ha) in Serbia by land cover types in 2013.
Land cover Area burned
(ha)
% of total
burned Forest/Other Wooded Land 690.67 48.49%
Other Natural Land 146 10.25%
Agriculture 587.71 41.26%
Total: 1424.39 100%
3.2.19 Spain
Spain was the second country most affected
by fire in 2013, although the total mapped
burnt area was only one quarter of that
recorded in Portugal. Most of the damage
occurred over three months July-September
and resulted in a total mapped burnt area of
37 263 ha from 125 fires, significantly less
than in 2012 (189 744 ha) and one of the
lowest amounts in recent years. 11 531 ha
occurred on Natura2000 sites, corresponding
to 31% of the total area burned, and 0.084%
of the Natura2000 areas in Spain.
Table 52 presents the distribution of the
mapped burnt area by land cover type using
the CLC 2000 database. The most noticeable
fires in Spain during 2013 are presented in
Figure 120.
Table 52. Distribution of burnt area (ha) in Spain by
land cover type in 2013
Land cover Area burned
(ha)
% of total
burned Forest/Other Wooded Land 20471.12 54.94%
Other Natural Land 8131.94 21.82%
Agriculture 8598.01 23.07%
Artificial Surfaces 33.97 0.09%
Other Land Cover 27.56 0.07%
Total: 37262.59 100%
Figure 120. Impact of forest fires in Spain in 2013.
3.2.20 Sweden
In Sweden a single fire caused 50 ha of
damage. This mostly affected forest and
other wooded land (Table 53).
Table 53. Distribution of burnt area (ha) in Sweden by land cover types in 2013.
Land cover Area burned
(ha)
% of total
burned Forest/Other Wooded Land 48.17 96.8%
Other Natural Land 1.59 3.2%
Total: 49.77 100%
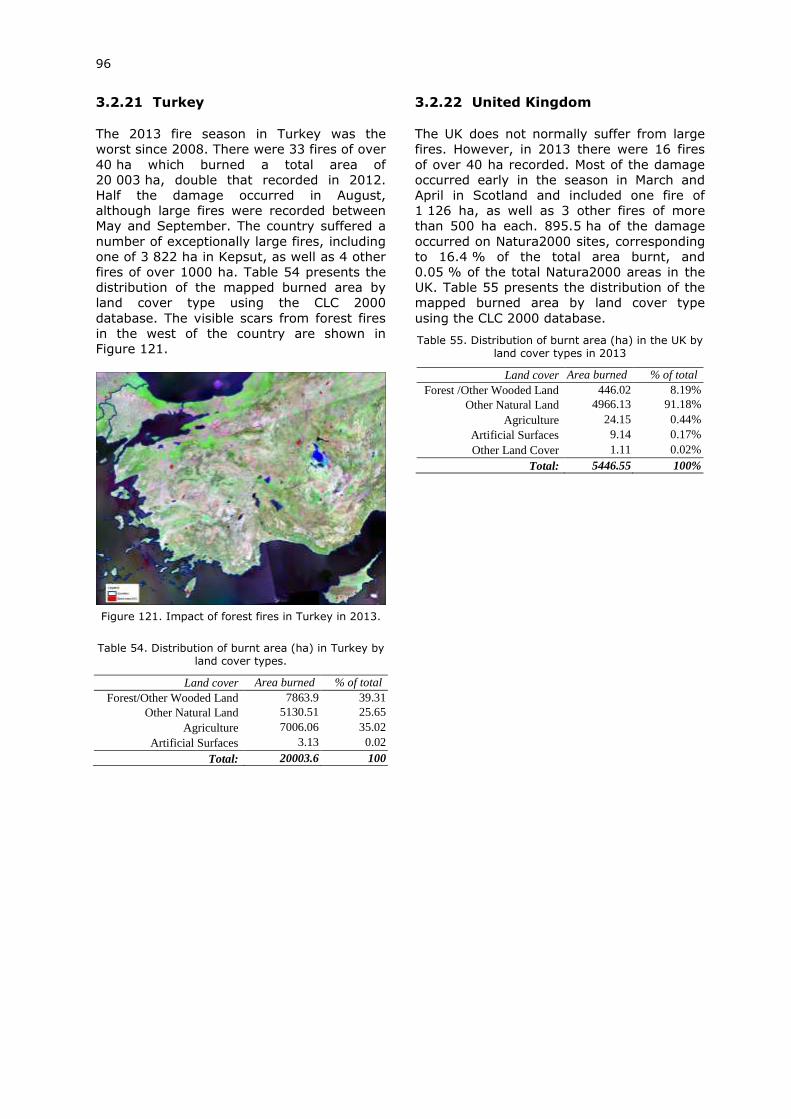
96
3.2.21 Turkey
The 2013 fire season in Turkey was the
worst since 2008. There were 33 fires of over
40 ha which burned a total area of
20 003 ha, double that recorded in 2012.
Half the damage occurred in August,
although large fires were recorded between
May and September. The country suffered a
number of exceptionally large fires, including
one of 3 822 ha in Kepsut, as well as 4 other
fires of over 1000 ha. Table 54 presents the
distribution of the mapped burned area by
land cover type using the CLC 2000
database. The visible scars from forest fires
in the west of the country are shown in
Figure 121.
Figure 121. Impact of forest fires in Turkey in 2013.
Table 54. Distribution of burnt area (ha) in Turkey by
land cover types.
Land cover Area burned
(ha)
% of total
burned Forest/Other Wooded Land 7863.9 39.31
Other Natural Land 5130.51 25.65
Agriculture 7006.06 35.02
Artificial Surfaces 3.13 0.02
Total: 20003.6 100
3.2.22 United Kingdom
The UK does not normally suffer from large
fires. However, in 2013 there were 16 fires
of over 40 ha recorded. Most of the damage
occurred early in the season in March and
April in Scotland and included one fire of
1 126 ha, as well as 3 other fires of more
than 500 ha each. 895.5 ha of the damage
occurred on Natura2000 sites, corresponding
to 16.4 % of the total area burnt, and
0.05 % of the total Natura2000 areas in the
UK. Table 55 presents the distribution of the
mapped burned area by land cover type
using the CLC 2000 database.
Table 55. Distribution of burnt area (ha) in the UK by land cover types in 2013
Land cover Area burned
(ha)
% of total
burned Forest /Other Wooded Land 446.02 8.19%
Other Natural Land 4966.13 91.18%
Agriculture 24.15 0.44%
Artificial Surfaces 9.14 0.17%
Other Land Cover 1.11 0.02%
Total: 5446.55 100%
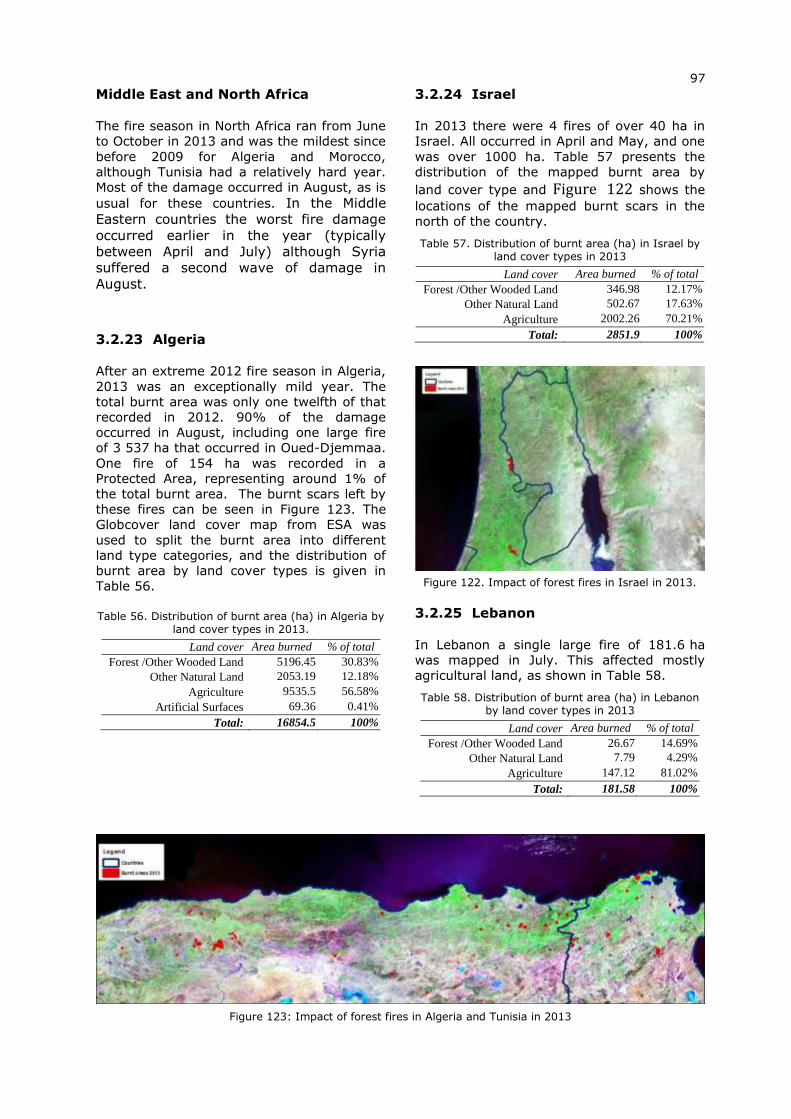
97
Middle East and North Africa
The fire season in North Africa ran from June
to October in 2013 and was the mildest since
before 2009 for Algeria and Morocco,
although Tunisia had a relatively hard year.
Most of the damage occurred in August, as is
usual for these countries. In the Middle
Eastern countries the worst fire damage
occurred earlier in the year (typically
between April and July) although Syria
suffered a second wave of damage in
August.
3.2.23 Algeria
After an extreme 2012 fire season in Algeria,
2013 was an exceptionally mild year. The
total burnt area was only one twelfth of that
recorded in 2012. 90% of the damage
occurred in August, including one large fire
of 3 537 ha that occurred in Oued-Djemmaa.
One fire of 154 ha was recorded in a
Protected Area, representing around 1% of
the total burnt area. The burnt scars left by
these fires can be seen in Figure 123. The
Globcover land cover map from ESA was
used to split the burnt area into different
land type categories, and the distribution of
burnt area by land cover types is given in
Table 56.
Table 56. Distribution of burnt area (ha) in Algeria by land cover types in 2013.
Land cover Area burned
(ha)
% of total
burned Forest /Other Wooded Land 5196.45 30.83%
Other Natural Land 2053.19 12.18%
Agriculture 9535.5 56.58%
Artificial Surfaces 69.36 0.41%
Total: 16854.5 100%
3.2.24 Israel
In 2013 there were 4 fires of over 40 ha in
Israel. All occurred in April and May, and one
was over 1000 ha. Table 57 presents the
distribution of the mapped burnt area by
land cover type and Figure 122 shows the
locations of the mapped burnt scars in the
north of the country.
Table 57. Distribution of burnt area (ha) in Israel by land cover types in 2013
Land cover Area burned
(ha)
% of total
burned Forest /Other Wooded Land 346.98 12.17%
Other Natural Land 502.67 17.63%
Agriculture 2002.26 70.21%
Total: 2851.9 100%
Figure 122. Impact of forest fires in Israel in 2013.
3.2.25 Lebanon
In Lebanon a single large fire of 181.6 ha
was mapped in July. This affected mostly
agricultural land, as shown in Table 58.
Table 58. Distribution of burnt area (ha) in Lebanon by land cover types in 2013
Land cover Area burned
(ha)
% of total
burned Forest /Other Wooded Land 26.67 14.69%
Other Natural Land 7.79 4.29%
Agriculture 147.12 81.02%
Total: 181.58 100%
Figure 123: Impact of forest fires in Algeria and Tunisia in 2013
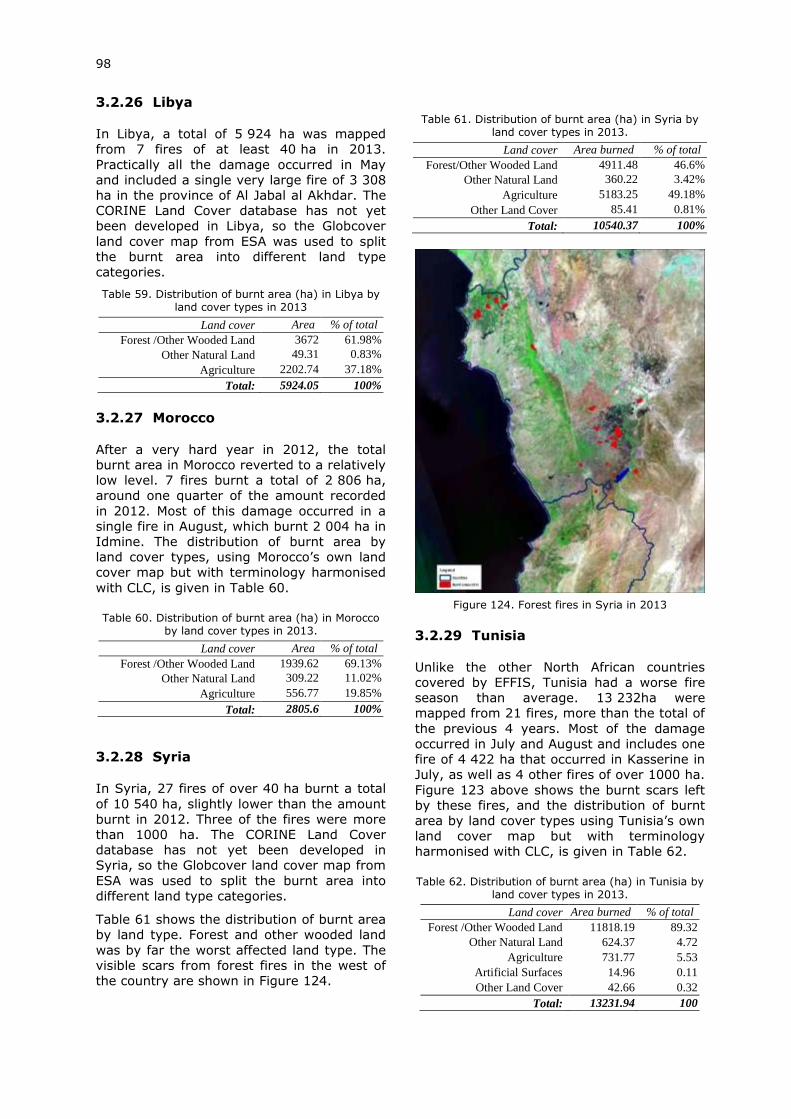
98
3.2.26 Libya
In Libya, a total of 5 924 ha was mapped
from 7 fires of at least 40 ha in 2013.
Practically all the damage occurred in May
and included a single very large fire of 3 308
ha in the province of Al Jabal al Akhdar. The
CORINE Land Cover database has not yet
been developed in Libya, so the Globcover
land cover map from ESA was used to split
the burnt area into different land type
categories.
Table 59. Distribution of burnt area (ha) in Libya by land cover types in 2013
Land cover Area
burned
(ha)
% of total
burned Forest /Other Wooded Land 3672 61.98%
Other Natural Land 49.31 0.83%
Agriculture 2202.74 37.18%
Total: 5924.05 100%
3.2.27 Morocco
After a very hard year in 2012, the total
burnt area in Morocco reverted to a relatively
low level. 7 fires burnt a total of 2 806 ha,
around one quarter of the amount recorded
in 2012. Most of this damage occurred in a
single fire in August, which burnt 2 004 ha in
Idmine. The distribution of burnt area by
land cover types, using Morocco’s own land
cover map but with terminology harmonised
with CLC, is given in Table 60.
Table 60. Distribution of burnt area (ha) in Morocco by land cover types in 2013.
Land cover Area
burned
(ha)
% of total
burned Forest /Other Wooded Land 1939.62 69.13%
Other Natural Land 309.22 11.02%
Agriculture 556.77 19.85%
Total: 2805.6 100%
3.2.28 Syria
In Syria, 27 fires of over 40 ha burnt a total
of 10 540 ha, slightly lower than the amount
burnt in 2012. Three of the fires were more
than 1000 ha. The CORINE Land Cover
database has not yet been developed in
Syria, so the Globcover land cover map from
ESA was used to split the burnt area into
different land type categories.
Table 61 shows the distribution of burnt area
by land type. Forest and other wooded land
was by far the worst affected land type. The
visible scars from forest fires in the west of
the country are shown in Figure 124.
Table 61. Distribution of burnt area (ha) in Syria by land cover types in 2013.
Land cover Area burned
(ha)
% of total
burned Forest/Other Wooded Land 4911.48 46.6%
Other Natural Land 360.22 3.42%
Agriculture 5183.25 49.18%
Other Land Cover 85.41 0.81%
Total: 10540.37 100%
Figure 124. Forest fires in Syria in 2013
3.2.29 Tunisia
Unlike the other North African countries
covered by EFFIS, Tunisia had a worse fire
season than average. 13 232ha were
mapped from 21 fires, more than the total of
the previous 4 years. Most of the damage
occurred in July and August and includes one
fire of 4 422 ha that occurred in Kasserine in
July, as well as 4 other fires of over 1000 ha.
Figure 123 above shows the burnt scars left
by these fires, and the distribution of burnt
area by land cover types using Tunisia’s own
land cover map but with terminology
harmonised with CLC, is given in Table 62.
Table 62. Distribution of burnt area (ha) in Tunisia by land cover types in 2013.
Land cover Area burned
(ha)
% of total
burned Forest /Other Wooded Land 11818.19 89.32
Other Natural Land 624.37 4.72
Agriculture 731.77 5.53
Artificial Surfaces 14.96 0.11
Other Land Cover 42.66 0.32
Total: 13231.94 100
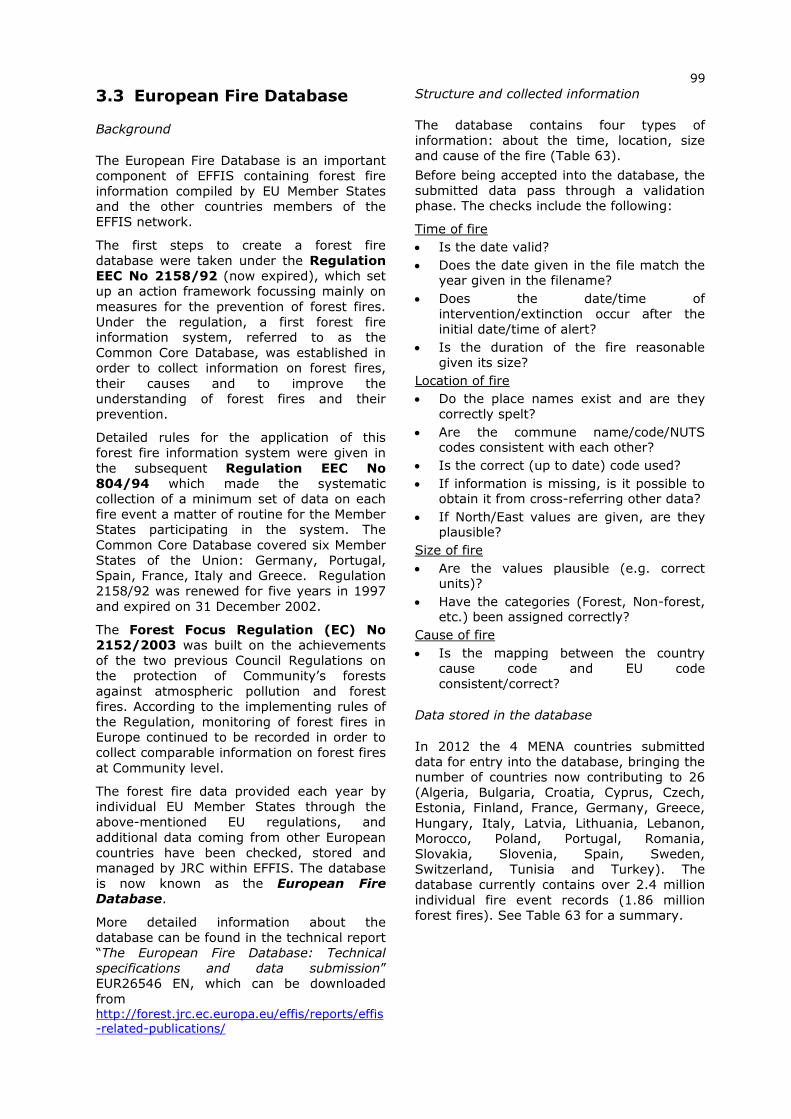
99
3.3 European Fire Database
Background
The European Fire Database is an important
component of EFFIS containing forest fire
information compiled by EU Member States
and the other countries members of the
EFFIS network.
The first steps to create a forest fire
database were taken under the Regulation
EEC No 2158/92 (now expired), which set
up an action framework focussing mainly on
measures for the prevention of forest fires.
Under the regulation, a first forest fire
information system, referred to as the
Common Core Database, was established in
order to collect information on forest fires,
their causes and to improve the
understanding of forest fires and their
prevention.
Detailed rules for the application of this
forest fire information system were given in
the subsequent Regulation EEC No
804/94 which made the systematic
collection of a minimum set of data on each
fire event a matter of routine for the Member
States participating in the system. The
Common Core Database covered six Member
States of the Union: Germany, Portugal,
Spain, France, Italy and Greece. Regulation
2158/92 was renewed for five years in 1997
and expired on 31 December 2002.
The Forest Focus Regulation (EC) No
2152/2003 was built on the achievements
of the two previous Council Regulations on
the protection of Community’s forests
against atmospheric pollution and forest
fires. According to the implementing rules of
the Regulation, monitoring of forest fires in
Europe continued to be recorded in order to
collect comparable information on forest fires
at Community level.
The forest fire data provided each year by
individual EU Member States through the
above-mentioned EU regulations, and
additional data coming from other European
countries have been checked, stored and
managed by JRC within EFFIS. The database
is now known as the European Fire
Database.
More detailed information about the
database can be found in the technical report
“The European Fire Database: Technical
specifications and data submission” EUR26546 EN, which can be downloaded
from http://forest.jrc.ec.europa.eu/effis/reports/effis-related-publications/
Structure and collected information
The database contains four types of
information: about the time, location, size
and cause of the fire (Table 63).
Before being accepted into the database, the
submitted data pass through a validation
phase. The checks include the following:
Time of fire
Is the date valid?
Does the date given in the file match the year given in the filename?
Does the date/time of
intervention/extinction occur after the
initial date/time of alert?
Is the duration of the fire reasonable
given its size?
Location of fire
Do the place names exist and are they
correctly spelt?
Are the commune name/code/NUTS codes consistent with each other?
Is the correct (up to date) code used?
If information is missing, is it possible to obtain it from cross-referring other data?
If North/East values are given, are they plausible?
Size of fire
Are the values plausible (e.g. correct units)?
Have the categories (Forest, Non-forest, etc.) been assigned correctly?
Cause of fire
Is the mapping between the country
cause code and EU code
consistent/correct?
Data stored in the database
In 2012 the 4 MENA countries submitted
data for entry into the database, bringing the
number of countries now contributing to 26
(Algeria, Bulgaria, Croatia, Cyprus, Czech,
Estonia, Finland, France, Germany, Greece,
Hungary, Italy, Latvia, Lithuania, Lebanon,
Morocco, Poland, Portugal, Romania,
Slovakia, Slovenia, Spain, Sweden,
Switzerland, Tunisia and Turkey). The
database currently contains over 2.4 million
individual fire event records (1.86 million
forest fires). See Table 63 for a summary.
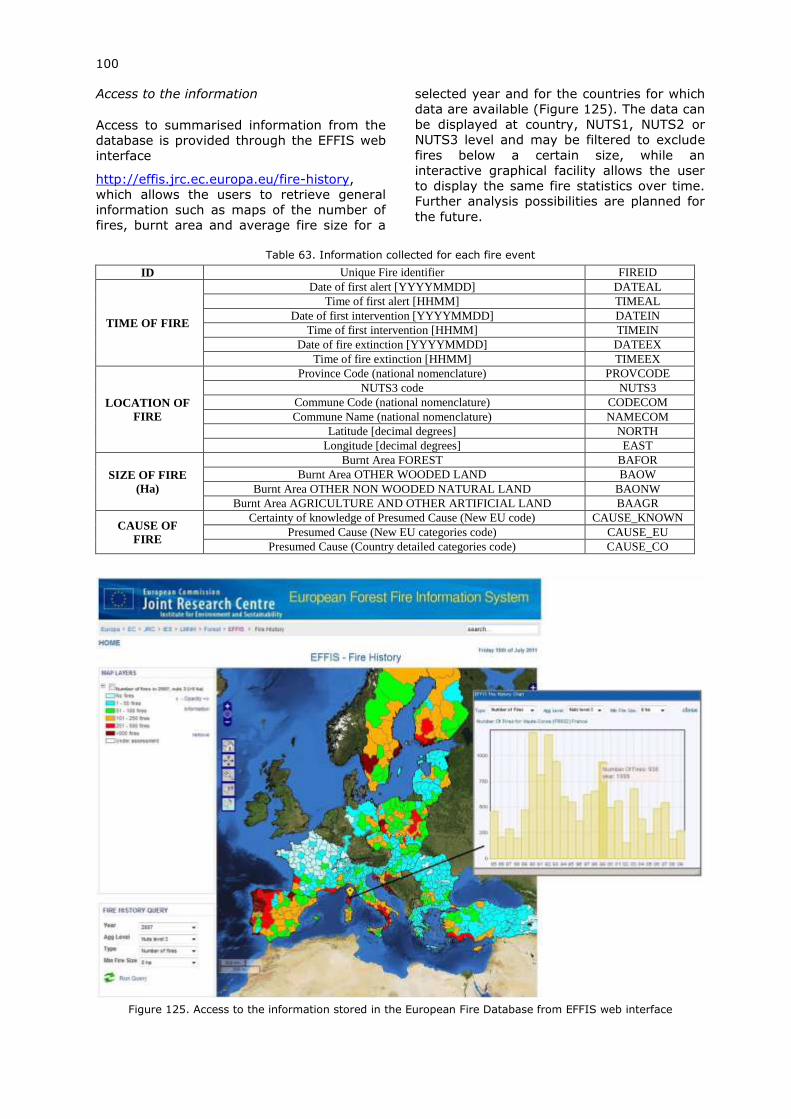
100
Access to the information
Access to summarised information from the
database is provided through the EFFIS web
interface
http://effis.jrc.ec.europa.eu/fire-history,
which allows the users to retrieve general
information such as maps of the number of
fires, burnt area and average fire size for a
selected year and for the countries for which
data are available (Figure 125). The data can
be displayed at country, NUTS1, NUTS2 or
NUTS3 level and may be filtered to exclude
fires below a certain size, while an
interactive graphical facility allows the user
to display the same fire statistics over time.
Further analysis possibilities are planned for
the future.
Table 63. Information collected for each fire event
ID Unique Fire identifier FIREID
TIME OF FIRE
Date of first alert [YYYYMMDD] DATEAL
Time of first alert [HHMM] TIMEAL
Date of first intervention [YYYYMMDD] DATEIN
Time of first intervention [HHMM] TIMEIN
Date of fire extinction [YYYYMMDD] DATEEX
Time of fire extinction [HHMM] TIMEEX
LOCATION OF
FIRE
Province Code (national nomenclature) PROVCODE
NUTS3 code NUTS3
Commune Code (national nomenclature) CODECOM
Commune Name (national nomenclature) NAMECOM
Latitude [decimal degrees] NORTH
Longitude [decimal degrees] EAST
SIZE OF FIRE
(Ha)
Burnt Area FOREST BAFOR
Burnt Area OTHER WOODED LAND BAOW
Burnt Area OTHER NON WOODED NATURAL LAND BAONW
Burnt Area AGRICULTURE AND OTHER ARTIFICIAL LAND BAAGR
CAUSE OF
FIRE
Certainty of knowledge of Presumed Cause (New EU code) CAUSE_KNOWN
Presumed Cause (New EU categories code) CAUSE_EU
Presumed Cause (Country detailed categories code) CAUSE_CO
Figure 125. Access to the information stored in the European Fire Database from EFFIS web interface
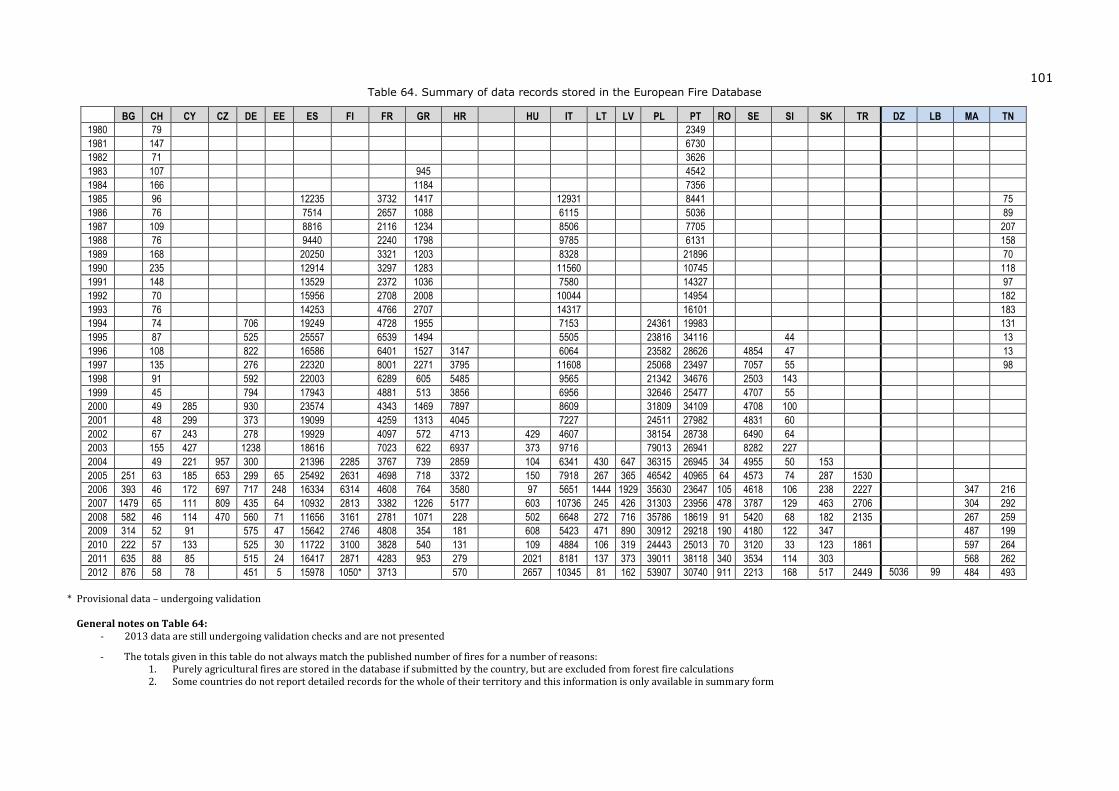
101
Table 64. Summary of data records stored in the European Fire Database
BG CH CY CZ DE EE ES FI FR GR HR HU IT LT LV PL PT RO SE SI SK TR DZ LB MA TN
1980
79
2349
1981
147
6730
1982
71
3626
1983
107
945
4542
1984
166
1184
7356
1985
96
12235
3732 1417
12931
8441
75
1986
76
7514
2657 1088
6115
5036
89
1987
109
8816
2116 1234
8506
7705
207
1988
76
9440
2240 1798
9785
6131
158
1989
168
20250
3321 1203
8328
21896
70
1990
235
12914
3297 1283
11560
10745
118
1991
148
13529
2372 1036
7580
14327
97
1992
70
15956
2708 2008
10044
14954
182
1993
76
14253
4766 2707
14317
16101
183
1994
74
706
19249
4728 1955
7153
24361 19983
131
1995
87
525
25557
6539 1494
5505
23816 34116
44
13
1996
108
822
16586
6401 1527 3147
6064
23582 28626
4854 47
13
1997
135
276
22320
8001 2271 3795
11608
25068 23497
7057 55
98
1998
91
592
22003
6289 605 5485
9565
21342 34676
2503 143
1999
45
794
17943
4881 513 3856
6956
32646 25477
4707 55
2000
49 285
930
23574
4343 1469 7897
8609
31809 34109
4708 100
2001
48 299
373
19099
4259 1313 4045
7227
24511 27982
4831 60
2002
67 243
278
19929
4097 572 4713 429 4607
38154 28738
6490 64
2003
155 427
1238
18616
7023 622 6937 373 9716
79013 26941
8282 227
2004
49 221 957 300
21396 2285 3767 739 2859 104 6341 430 647 36315 26945 34 4955 50 153
2005 251 63 185 653 299 65 25492 2631 4698 718 3372 150 7918 267 365 46542 40965 64 4573 74 287 1530
2006 393 46 172 697 717 248 16334 6314 4608 764 3580 97 5651 1444 1929 35630 23647 105 4618 106 238 2227 347 216
2007 1479 65 111 809 435 64 10932 2813 3382 1226 5177 603 10736 245 426 31303 23956 478 3787 129 463 2706 304 292
2008 582 46 114 470 560 71 11656 3161 2781 1071 228 502 6648 272 716 35786 18619 91 5420 68 182 2135 267 259
2009 314 52 91
575 47 15642 2746 4808 354 181 608 5423 471 890 30912 29218 190 4180 122 347
487 199
2010 222 57 133
525 30 11722 3100 3828 540 131 109 4884 106 319 24443 25013 70 3120 33 123 1861 597 264
2011 635 88 85
515 24 16417 2871 4283 953 279 2021 8181 137 373 39011 38118 340 3534 114 303
568 262
2012 876 58 78 451 5 15978 1050* 3713 570 2657 10345 81 162 53907 30740 911 2213 168 517 2449 5036 99 484 493
* Provisional data – undergoing validation
General notes on Table 64:
- 2013 data are still undergoing validation checks and are not presented
- The totals given in this table do not always match the published number of fires for a number of reasons: 1. Purely agricultural fires are stored in the database if submitted by the country, but are excluded from forest fire calculations 2. Some countries do not report detailed records for the whole of their territory and this information is only available in summary form
102
Background documentation European Commission, 2001, Forest Fires in Southern Europe: Bulletin of the 2000 fire
campaign, SPI 01.85, p. 8.
European Commission, 2001, Forest fires in Southern Europe: Report No. 1, July 2001, SPI
01.95, Office for Official Publications of the European Communities, Luxembourg. p. 40.
European Commission, 2002, Forest Fires in Europe: 2001 fire campaign, SPI.02.72, Office for
Official Publications of the European Communities, Luxembourg, p. 27.
European Commission, 2003, Forest Fires in Europe: 2002 fire campaign, SPI.03.83, Office for
Official Publications of the European Communities, Luxembourg. p. 35.
European Commission, 2004, Forest Fires in Europe: 2003 fire campaign, SPI.04.124, Office
for Official Publications of the European Communities, Luxembourg. p. 51.
European Commission, 2005, Forest Fires in Europe 2004, S.P.I.05.147, Office for Official
Publications of the European Communities, Luxembourg. p. 45.
European Commission, 2006, Forest Fires in Europe 2005, EUR 22312 EN, Office for Official
Publications of the European Communities, Luxembourg. p. 53.
European Commission, 2007, Forest Fires in Europe 2006, EUR 22931 EN, Office for Official
Publications of the European Communities, Luxembourg. p. 77.
European Commission, 2008, Forest Fires in Europe 2007, EUR 23492 EN, Office for Official
Publications of the European Communities, Luxembourg. p. 77.
European Commission, 2009, Forest Fires in Europe 2008, EUR 23971 EN, Office for Official
Publications of the European Communities, Luxembourg. p. 83.
European Commission, 2010, Forest Fires in Europe 2009, EUR 24502 EN, Publication Office of
the European Union, Luxembourg. p. 83.
European Commission, 2011, Forest Fires in Europe 2010, EUR 24910 EN, Publications Office
of the European Union, Luxembourg, p. 92.
European Commission, 2012, Forest Fires in Europe, Middle East and North Africa 2011, EUR
25483 EN, Publications Office of the European Union, Luxembourg, p. 108.
European Commission, 2013, Forest Fires in Europe, Middle East and North Africa 2012, EUR
26048 EN, Publications Office of the European Union, Luxembourg, p. 109.
103
ANNEX I – Summary Tables of Fire Statistics Table 65. Number of forest fires in five Southern Member States (1980-2013)
Table 66. Burnt area (hectares) in five Southern Member States (1980 – 2013)
Table 67. Number of forest fires in other European countries (1990-2013)
Table 68. Burnt area (hectares) in other European countries (1990 – 2013)
Statistics on burnt area divided into forest and non-forest area are supplied in the individual
country reports, where available.
NOTE
Every effort is made to ensure that the published figures are correct. However, at the time
of printing some data are provisional and may be changed in the future. Where there is a
discrepancy between figures published in different reports, the later report should be taken
as the definitive version.
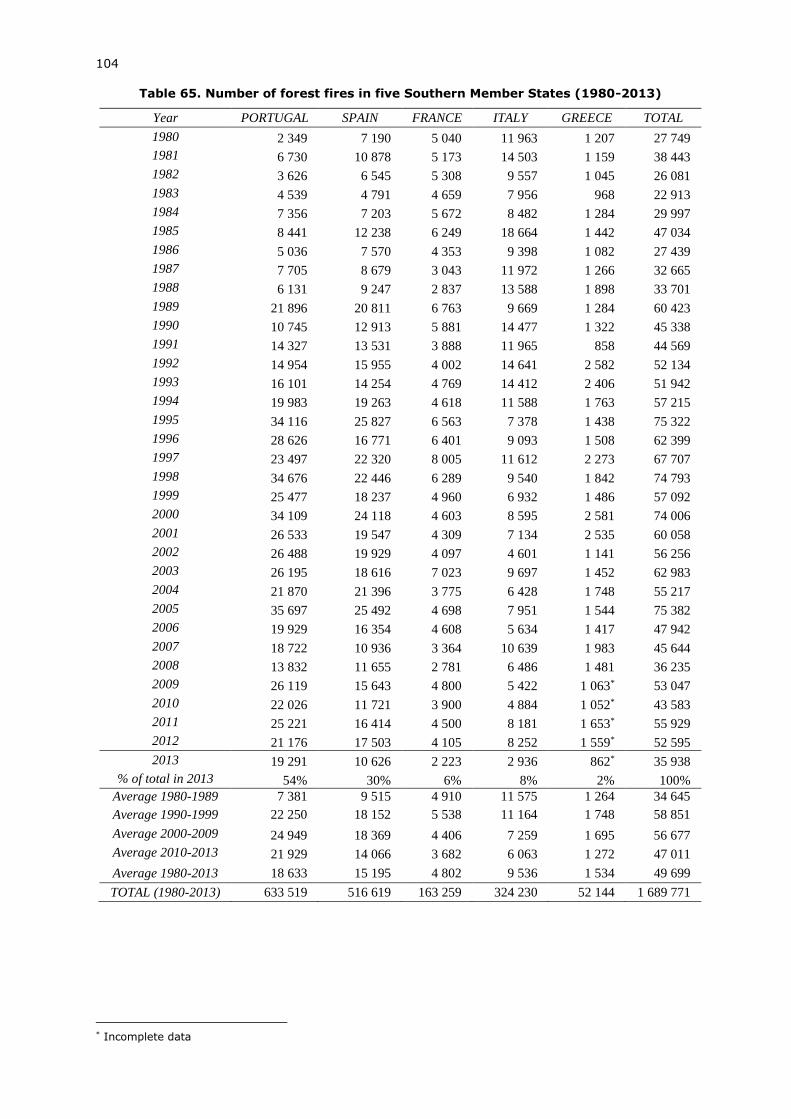
104
Table 65. Number of forest fires in five Southern Member States (1980-2013)
Year PORTUGAL SPAIN FRANCE ITALY GREECE TOTAL
1980 2 349 7 190 5 040 11 963 1 207 27 749
1981 6 730 10 878 5 173 14 503 1 159 38 443
1982 3 626 6 545 5 308 9 557 1 045 26 081
1983 4 539 4 791 4 659 7 956 968 22 913
1984 7 356 7 203 5 672 8 482 1 284 29 997
1985 8 441 12 238 6 249 18 664 1 442 47 034
1986 5 036 7 570 4 353 9 398 1 082 27 439
1987 7 705 8 679 3 043 11 972 1 266 32 665
1988 6 131 9 247 2 837 13 588 1 898 33 701
1989 21 896 20 811 6 763 9 669 1 284 60 423
1990 10 745 12 913 5 881 14 477 1 322 45 338
1991 14 327 13 531 3 888 11 965 858 44 569
1992 14 954 15 955 4 002 14 641 2 582 52 134
1993 16 101 14 254 4 769 14 412 2 406 51 942
1994 19 983 19 263 4 618 11 588 1 763 57 215
1995 34 116 25 827 6 563 7 378 1 438 75 322
1996 28 626 16 771 6 401 9 093 1 508 62 399
1997 23 497 22 320 8 005 11 612 2 273 67 707
1998 34 676 22 446 6 289 9 540 1 842 74 793
1999 25 477 18 237 4 960 6 932 1 486 57 092
2000 34 109 24 118 4 603 8 595 2 581 74 006
2001 26 533 19 547 4 309 7 134 2 535 60 058
2002 26 488 19 929 4 097 4 601 1 141 56 256
2003 26 195 18 616 7 023 9 697 1 452 62 983
2004 21 870 21 396 3 775 6 428 1 748 55 217
2005 35 697 25 492 4 698 7 951 1 544 75 382
2006 19 929 16 354 4 608 5 634 1 417 47 942
2007 18 722 10 936 3 364 10 639 1 983 45 644
2008 13 832 11 655 2 781 6 486 1 481 36 235
2009 26 119 15 643 4 800 5 422 1 063* 53 047
2010 22 026 11 721 3 900 4 884 1 052* 43 583
2011 25 221 16 414 4 500 8 181 1 653* 55 929
2012 21 176 17 503 4 105 8 252 1 559* 52 595
2013 19 291 10 626 2 223 2 936 862* 35 938
% of total in 2013 54% 30% 6% 8% 2% 100%
Average 1980-1989 7 381 9 515 4 910 11 575 1 264 34 645
Average 1990-1999 22 250 18 152 5 538 11 164 1 748 58 851
Average 2000-2009 24 949 18 369 4 406 7 259 1 695 56 677
Average 2010-2013 21 929 14 066 3 682 6 063 1 272 47 011
Average 1980-2013 18 633 15 195 4 802 9 536 1 534 49 699
TOTAL (1980-2013) 633 519 516 619 163 259 324 230 52 144 1 689 771
* Incomplete data
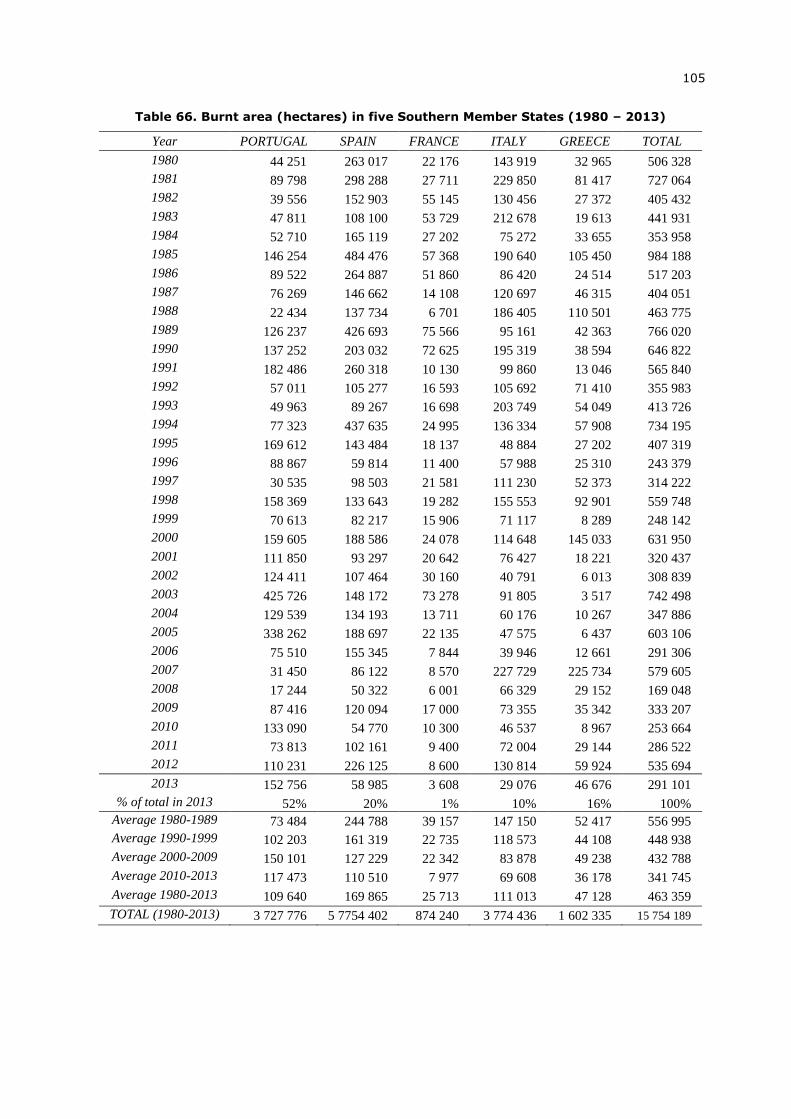
105
Table 66. Burnt area (hectares) in five Southern Member States (1980 – 2013)
Year PORTUGAL SPAIN FRANCE ITALY GREECE TOTAL
1980 44 251 263 017 22 176 143 919 32 965 506 328
1981 89 798 298 288 27 711 229 850 81 417 727 064
1982 39 556 152 903 55 145 130 456 27 372 405 432
1983 47 811 108 100 53 729 212 678 19 613 441 931
1984 52 710 165 119 27 202 75 272 33 655 353 958
1985 146 254 484 476 57 368 190 640 105 450 984 188
1986 89 522 264 887 51 860 86 420 24 514 517 203
1987 76 269 146 662 14 108 120 697 46 315 404 051
1988 22 434 137 734 6 701 186 405 110 501 463 775
1989 126 237 426 693 75 566 95 161 42 363 766 020
1990 137 252 203 032 72 625 195 319 38 594 646 822
1991 182 486 260 318 10 130 99 860 13 046 565 840
1992 57 011 105 277 16 593 105 692 71 410 355 983
1993 49 963 89 267 16 698 203 749 54 049 413 726
1994 77 323 437 635 24 995 136 334 57 908 734 195
1995 169 612 143 484 18 137 48 884 27 202 407 319
1996 88 867 59 814 11 400 57 988 25 310 243 379
1997 30 535 98 503 21 581 111 230 52 373 314 222
1998 158 369 133 643 19 282 155 553 92 901 559 748
1999 70 613 82 217 15 906 71 117 8 289 248 142
2000 159 605 188 586 24 078 114 648 145 033 631 950
2001 111 850 93 297 20 642 76 427 18 221 320 437
2002 124 411 107 464 30 160 40 791 6 013 308 839
2003 425 726 148 172 73 278 91 805 3 517 742 498
2004 129 539 134 193 13 711 60 176 10 267 347 886
2005 338 262 188 697 22 135 47 575 6 437 603 106
2006 75 510 155 345 7 844 39 946 12 661 291 306
2007 31 450 86 122 8 570 227 729 225 734 579 605
2008 17 244 50 322 6 001 66 329 29 152 169 048
2009 87 416 120 094 17 000 73 355 35 342 333 207
2010 133 090 54 770 10 300 46 537 8 967 253 664
2011 73 813 102 161 9 400 72 004 29 144 286 522
2012 110 231 226 125 8 600 130 814 59 924 535 694
2013 152 756 58 985 3 608 29 076 46 676 291 101
% of total in 2013 52% 20% 1% 10% 16% 100%
Average 1980-1989 73 484 244 788 39 157 147 150 52 417 556 995
Average 1990-1999 102 203 161 319 22 735 118 573 44 108 448 938
Average 2000-2009 150 101 127 229 22 342 83 878 49 238 432 788
Average 2010-2013 117 473 110 510 7 977 69 608 36 178 341 745
Average 1980-2013 109 640 169 865 25 713 111 013 47 128 463 359
TOTAL (1980-2013) 3 727 776 5 7754 402 874 240 3 774 436 1 602 335 15 754 189
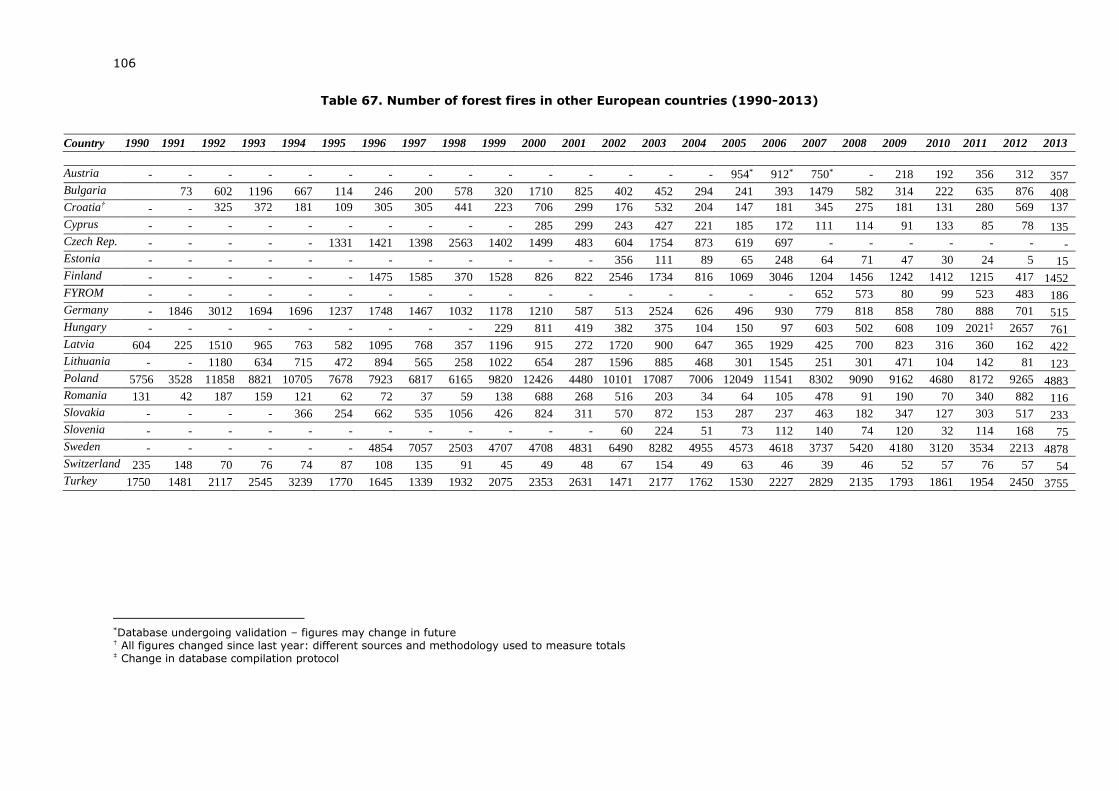
106
Table 67. Number of forest fires in other European countries (1990-2013)
Country 1990 1991 1992 1993 1994 1995 1996 1997 1998 1999 2000 2001 2002 2003 2004 2005 2006 2007 2008 2009 2010 2011 2012 2013
Austria - - - - - - - - - - - - - - - 954* 912* 750* - 218 192 356 312 357
Bulgaria 73 602 1196 667 114 246 200 578 320 1710 825 402 452 294 241 393 1479 582 314 222 635 876 408
Croatia† - - 325 372 181 109 305 305 441 223 706 299 176 532 204 147 181 345 275 181 131 280 569 137
Cyprus - - - - - - - - - - 285 299 243 427 221 185 172 111 114 91 133 85 78 135
Czech Rep. - - - - - 1331 1421 1398 2563 1402 1499 483 604 1754 873 619 697 - - - - - - -
Estonia - - - - - - - - - - - - 356 111 89 65 248 64 71 47 30 24 5 15
Finland - - - - - - 1475 1585 370 1528 826 822 2546 1734 816 1069 3046 1204 1456 1242 1412 1215 417 1452
FYROM - - - - - - - - - - - - - - - - - 652 573 80 99 523 483 186
Germany - 1846 3012 1694 1696 1237 1748 1467 1032 1178 1210 587 513 2524 626 496 930 779 818 858 780 888 701 515
Hungary - - - - - - - - - 229 811 419 382 375 104 150 97 603 502 608 109 2021‡ 2657 761
Latvia 604 225 1510 965 763 582 1095 768 357 1196 915 272 1720 900 647 365 1929 425 700 823 316 360 162 422
Lithuania - - 1180 634 715 472 894 565 258 1022 654 287 1596 885 468 301 1545 251 301 471 104 142 81 123
Poland 5756 3528 11858 8821 10705 7678 7923 6817 6165 9820 12426 4480 10101 17087 7006 12049 11541 8302 9090 9162 4680 8172 9265 4883
Romania 131 42 187 159 121 62 72 37 59 138 688 268 516 203 34 64 105 478 91 190 70 340 882 116
Slovakia - - - - 366 254 662 535 1056 426 824 311 570 872 153 287 237 463 182 347 127 303 517 233
Slovenia - - - - - - - - - - - - 60 224 51 73 112 140 74 120 32 114 168 75
Sweden - - - - - - 4854 7057 2503 4707 4708 4831 6490 8282 4955 4573 4618 3737 5420 4180 3120 3534 2213 4878
Switzerland 235 148 70 76 74 87 108 135 91 45 49 48 67 154 49 63 46 39 46 52 57 76 57 54
Turkey 1750 1481 2117 2545 3239 1770 1645 1339 1932 2075 2353 2631 1471 2177 1762 1530 2227 2829 2135 1793 1861 1954 2450 3755
*Database undergoing validation – figures may change in future † All figures changed since last year: different sources and methodology used to measure totals ‡ Change in database compilation protocol
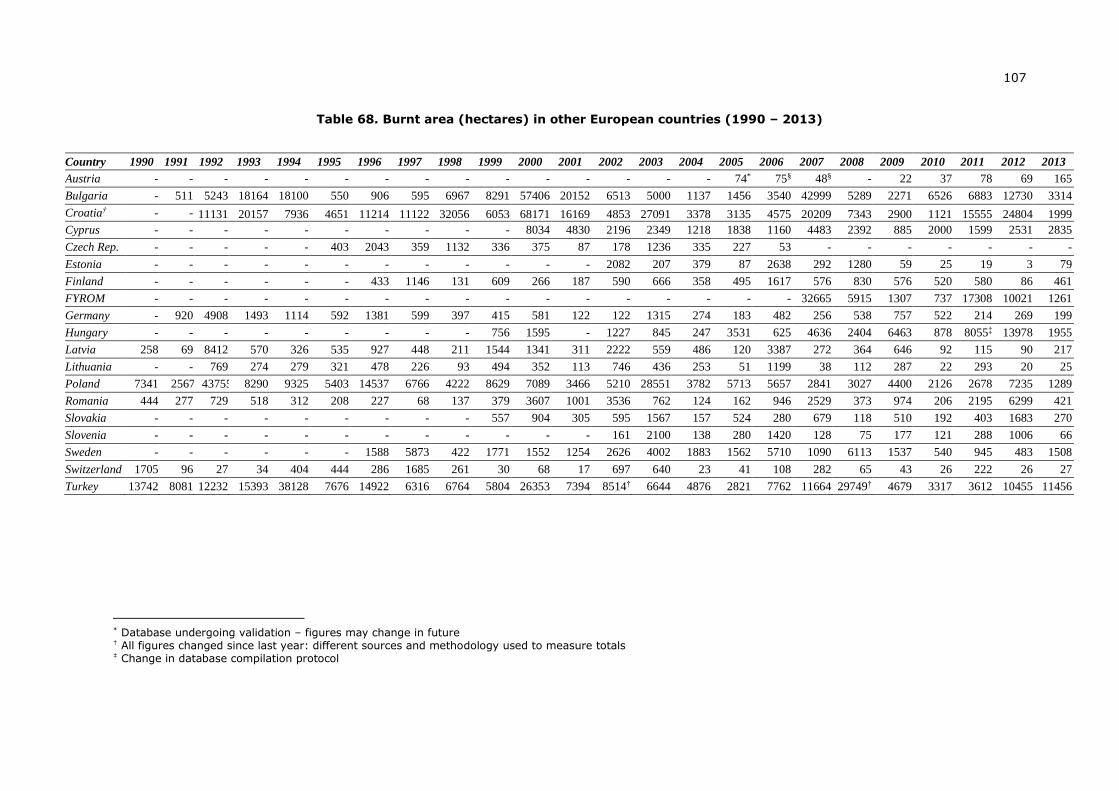
107
Table 68. Burnt area (hectares) in other European countries (1990 – 2013)
Country 1990 1991 1992 1993 1994 1995 1996 1997 1998 1999 2000 2001 2002 2003 2004 2005 2006 2007 2008 2009 2010 2011 2012 2013
Austria - - - - - - - - - - - - - - - 74* 75§ 48§ - 22 37 78 69 165
Bulgaria - 511 5243 18164 18100 550 906 595 6967 8291 57406 20152 6513 5000 1137 1456 3540 42999 5289 2271 6526 6883 12730 3314
Croatia† - - 11131 20157 7936 4651 11214 11122 32056 6053 68171 16169 4853 27091 3378 3135 4575 20209 7343 2900 1121 15555 24804 1999
Cyprus - - - - - - - - - - 8034 4830 2196 2349 1218 1838 1160 4483 2392 885 2000 1599 2531 2835
Czech Rep. - - - - - 403 2043 359 1132 336 375 87 178 1236 335 227 53 - - - - - - -
Estonia - - - - - - - - - - - - 2082 207 379 87 2638 292 1280 59 25 19 3 79
Finland - - - - - - 433 1146 131 609 266 187 590 666 358 495 1617 576 830 576 520 580 86 461
FYROM - - - - - - - - - - - - - - - - - 32665 5915 1307 737 17308 10021 1261
Germany - 920 4908 1493 1114 592 1381 599 397 415 581 122 122 1315 274 183 482 256 538 757 522 214 269 199
Hungary - - - - - - - - - 756 1595 - 1227 845 247 3531 625 4636 2404 6463 878 8055‡ 13978 1955
Latvia 258 69 8412 570 326 535 927 448 211 1544 1341 311 2222 559 486 120 3387 272 364 646 92 115 90 217
Lithuania - - 769 274 279 321 478 226 93 494 352 113 746 436 253 51 1199 38 112 287 22 293 20 25
Poland 7341 2567 43755 8290 9325 5403 14537 6766 4222 8629 7089 3466 5210 28551 3782 5713 5657 2841 3027 4400 2126 2678 7235 1289
Romania 444 277 729 518 312 208 227 68 137 379 3607 1001 3536 762 124 162 946 2529 373 974 206 2195 6299 421
Slovakia - - - - - - - - - 557 904 305 595 1567 157 524 280 679 118 510 192 403 1683 270
Slovenia - - - - - - - - - - - - 161 2100 138 280 1420 128 75 177 121 288 1006 66
Sweden - - - - - - 1588 5873 422 1771 1552 1254 2626 4002 1883 1562 5710 1090 6113 1537 540 945 483 1508
Switzerland 1705 96 27 34 404 444 286 1685 261 30 68 17 697 640 23 41 108 282 65 43 26 222 26 27
Turkey 13742 8081 12232 15393 38128 7676 14922 6316 6764 5804 26353 7394 8514† 6644 4876 2821 7762 11664 29749† 4679 3317 3612 10455 11456
* Database undergoing validation – figures may change in future † All figures changed since last year: different sources and methodology used to measure totals ‡ Change in database compilation protocol

Europe Direct is a service to help you find answers to your questions about the European Union
Freephone number (*): 00 800 6 7 8 9 10 11
(*) Certain mobile telephone operators do not allow access to 00 800 numbers or these calls may be billed.
A great deal of additional information on the European Union is available on the Internet.
It can be accessed through the Europa server http://europa.eu/.
How to obtain EU publications
Our priced publications are available from EU Bookshop (http://bookshop.europa.eu),
where you can place an order with the sales agent of your choice.
The Publications Office has a worldwide network of sales agents.
You can obtain their contact details by sending a fax to (352) 29 29-42758.
European Commission
EUR 26791 EN – Joint Research Centre – Institute for Environment and Sustainability
Title: Forest Fires in Europe Middle East and North Africa 2013
Author(s): Guido Schmuck, Jesús San-Miguel-Ayanz, Andrea Camia, Tracy Durrant, Roberto Boca, Giorgio Libertà, Thomas
Petroliagkis, Margherita Di Leo, Dario Rodrigues, Francesco Boccacci, Ernst Schulte
Luxembourg: Publications Office of the European Union
2014 – 107 pp. – 21.0 x 29.7 cm
EUR – Scientific and Technical Research series – ISSN 1018-5593 (print), ISSN 1831-9424 (online)
ISBN 978-92-79-39628-1 (print)
ISBN 978-92-79-39627-4 (pdf)
doi: 10.2788/99870 (online)
Abstract
This is the 14th Forest Fires in Europe report published by the European Commission. The report contains a summary of the 2013 fire
season in Europe, the Middle East and North Africa with official statistics on the number of fires and burnt areas compiled by the
contributing countries. In addition to country reports with a summary of the 2013 fire season provided by the countries, the report Forest
Fires in Europe, Middle East and North Africa informs about the latest developments in terms of forest fire prevention and initiatives of
the European Commission to support forest fires fire protection activities in the European Union. Furthermore it provides the results of
the European Forest Fire Information System (EFFIS) operating during the fire season, with special emphasis on the EFFIS Danger
Forecast, providing daily maps of meteorological fire danger forecast of Europe, and the EFFIS Rapid Damage Assessment, performing
the daily mapping and assessment of main land cover and Natura2000 areas affected by fires of at least 40 ha during the fire season.
doi:10.2788/99870
ISBN 978-92-79-39627-4
LB
-NA
-26791-E
N-N