Embed Size (px)
Citation preview
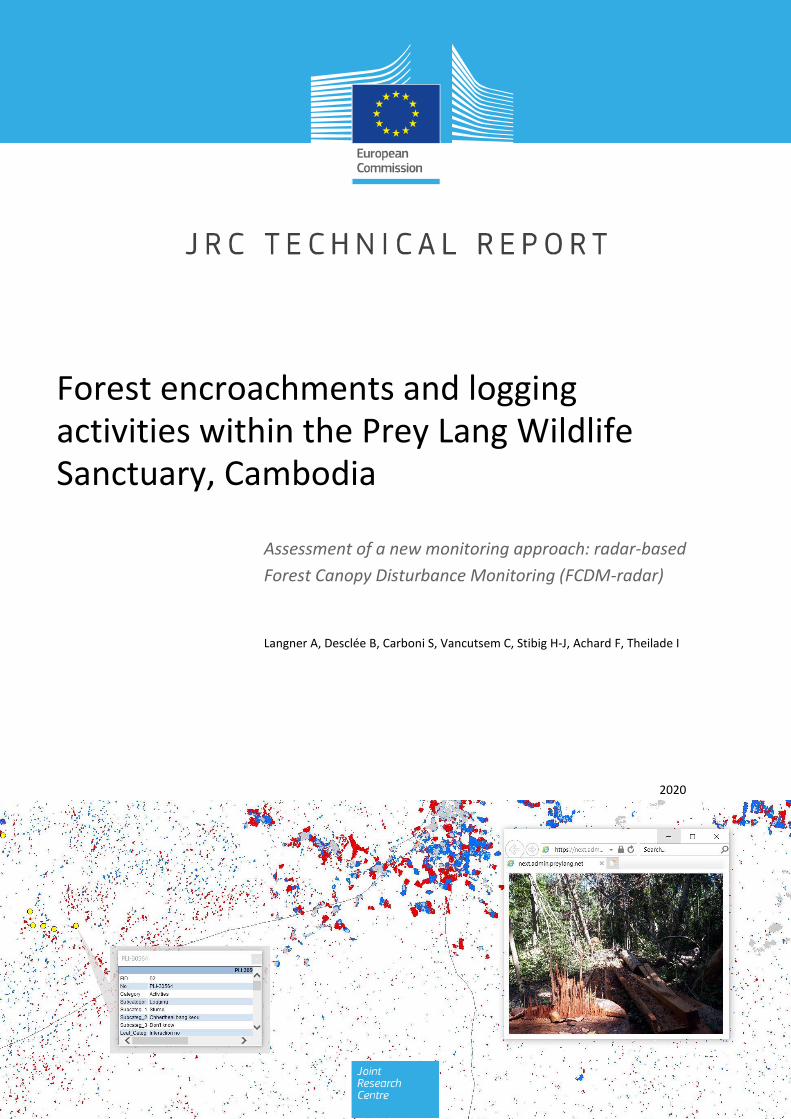
Forest encroachments and logging activities within the Prey Lang Wildlife Sanctuary, Cambodia
Assessment of a new monitoring approach: radar-based
Forest Canopy Disturbance Monitoring (FCDM-radar)
Langner A, Desclée B, Carboni S, Vancutsem C, Stibig H-J, Achard F, Theilade I
2020
This publication is a Technical report by the Joint Research Centre (JRC), the European Commission’s science and knowledge service. It aims
to provide evidence-based scientific support to the European policymaking process. The scientific output expressed does not imply a policy position of the European Commission. Neither the European Commission nor any person acting on behalf of the Commission is responsible for the use that might be made of this publication. For information on the methodology and quality underlying the data used in this
publication for which the source is neither Eurostat nor other Commission services, users should contact the referenced source. The designations employed and the presentation of material on the maps do not imply the expression of any opinion whatsoever on the part of the European Union concerning the legal status of any country, territory, city or area or of its authorities, or concerning the delimitation of
its frontiers or boundaries. Contact information
Name: Andreas Langner Address: Via E. Fermi 2749 - TP 262 Email: [email protected]
Tel.: +39 0332 783995 EU Science Hub
https://ec.europa.eu/jrc
JRC122187
Ispra: European Commission, 2020
© European Union, 2020
The reuse policy of the European Commission is implemented by the Commission Decision 2011/833/EU of 12 December 2011 on the reuse of Commission documents (OJ L 330, 14.12.2011, p. 39). Except otherwise noted, the reuse of this document is authorised under the
Creative Commons Attribution 4.0 International (CC BY 4.0) licence (https://creativecommons.org/licenses/by/4.0/). This means that reuse is allowed provided appropriate credit is given and any changes are indicated. For any use or reproduction of photos or other material that is not owned by the EU, permission must be sought directly from the copyright holders.
All content © European Union
How to cite this report: Langner A, Desclée B, Carboni S, Vancutsem C, Stibig H-J, Achard F, Theilade I, Forest encroachments and logging activities within the Prey Lang Wildlife Sanctuary, Cambodia - Assessment of a new monitoring approach: radar-based Forest Canopy Disturbance Monitoring (FCDM-radar), European Commission, Ispra, 2020, JRC122187.
i
Contents
1 Introduction .......................................................................................................................................................4
2 Study site ...........................................................................................................................................................5
3 Methodologies used in this report ....................................................................................................................9
3.1 Background of the long-term Tropical Moist Forest (TMF) product .........................................................9
3.2 Analysis of the impact of the establishment of the Prey Lang Wildlife Sanctuary .................................10
3.3 Background of the JRC FCDM tool with special focus on FCDM-radar ...................................................11
3.3.1 FCDM-optical approach ...............................................................................................................12
3.3.2 FCDM-radar approach .................................................................................................................12
3.4 Analysis of recent deforestation and forest disturbances in Prey Lang from the FCDM-radar approach .....................................................................................................................................13
3.5 Validation approach and accuracy results ..............................................................................................21
3.5.1 Stratified random accuracy assessment with reference plots visually interpreted from Sentinel-2 imagery ............................................................................................................................21
3.5.2 Use of field data for quality control .............................................................................................22
4 Conclusions and perspectives .........................................................................................................................24
References ............................................................................................................................................................25
List of figures .........................................................................................................................................................26
List of tables ..........................................................................................................................................................28
Supplementary Material .......................................................................................................................................29
2
Acknowledgements
The authors would like to thank the Prey Lang Community Network (PLCN), a civil society organization (CSO), which consists of about 400 active members from the communities of Prey Lang’s surrounding provinces and which protects the Prey Lang forests in collaboration with other stakeholders. PLCN members patrol the forest and collect data on forest resources, as well as illegal logging activities. Without their strong commitment and continuous efforts to protect their forests, the constant threat to these forests would remain unknown to the public. It is the field data collected during their frequent forest patrols, which provide the remote sensing side the necessary insights into the actual situation on the ground.
Furthermore, the authors would like to thank the EU Delegation in Cambodia for their valuable support.
Authors
Andreas Langner, Baudouin Desclée, Silvia Carboni, Christelle Vancutsem, Hans-Jürgen Stibig, Frédéric Achard (JRC, D1 unit),
Ida Theilade (University of Copenhagen, Denmark)
3
Abstract
Through a scientific cooperation within the CEEJA project (Citizens Engaged in Environmental Justice for All), a study was carried out to identify recent deforestation and forest degradation activities occurring within the Prey Lang Wildlife Sanctuary, Cambodia, using Copernicus satellite imagery. This report describes the status of forest cover in this Sanctuary at the end of February 2020, and shows that despite its legal protection various forest encroachments (agriculture and mining) as well as selective logging events were happening recently in this area.
Furthermore, a new radar-based monitoring approach using Copernicus Sentinel-1 data (FCDM-radar) is presented, that allows to produce reliable and accurate information (overall accuracy for evergreen and semi-evergreen forests within study area 96.3%) about ongoing deforestation and forest degradation activities at a spatial resolution of 10 m. This new forest monitoring approach can help producing more accurate forest activity data for reporting under REDD+ or monitoring under FLEGT, in particular for activities related to forest degradation.
4
1 Introduction
The Prey Lang Wildlife Sanctuary, situated in central Cambodia, is one of the last remaining larger lowland rain forest areas in continental Southeast Asia. Despite having the legal status of a Wildlife Sanctuary since May 2016 various forest encroachments (agriculture and mining) as well as by selective logging events are still threatening this area.
The objectives of this technical report are to provide the following information:
• Short background description of the vegetation cover of the Prey Lang Wildlife Sanctuary
• Description of existing JRC approaches for the monitoring of deforestation and forest degradation activities
• Analysis of historical and recent deforestation activities in the Prey Lang Wildlife Sanctuary using the Tropical Moist Forest (TMF) dataset
• Introduction to a new approach named “radar-based Forest Canopy Disturbance Monitoring tool” (FCDM-radar)
• Production of recent maps (for years 2018 and 2019) of forest disturbances (deforestation and forest degradation) in the Prey Lang Wildlife Sanctuary using the FCDM-radar tool with an accuracy assessment for the 2019 results
5
2 Study site
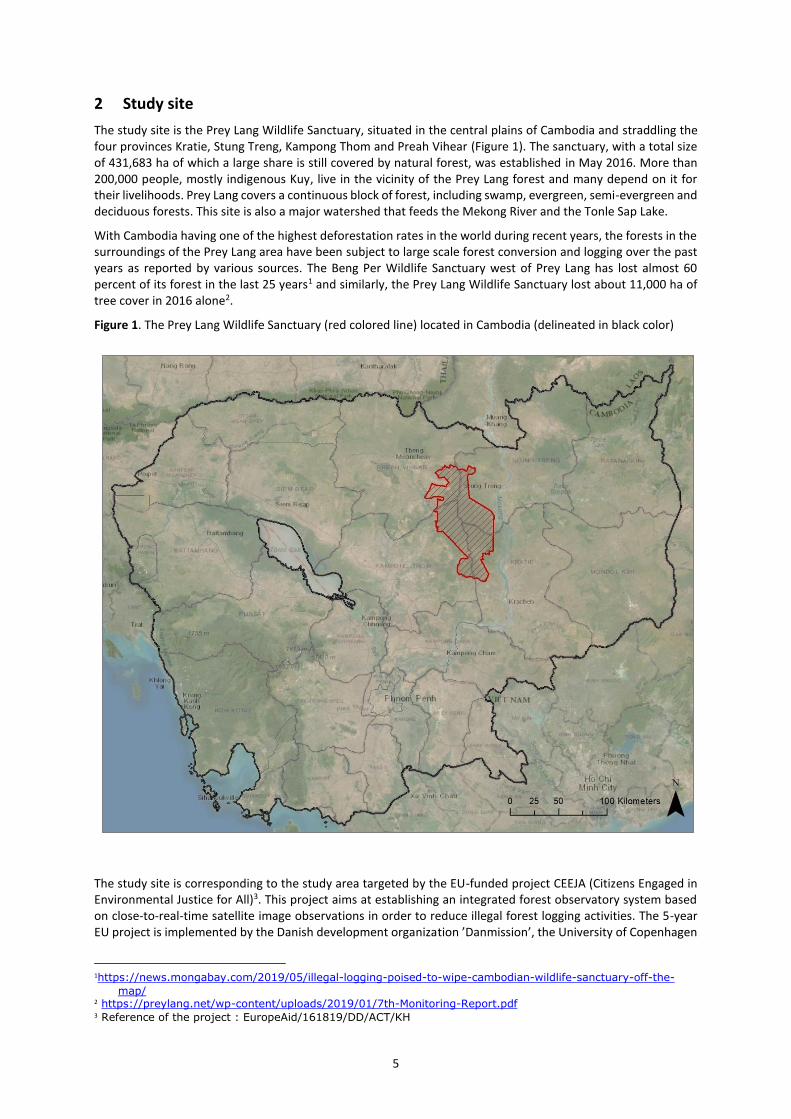
The study site is the Prey Lang Wildlife Sanctuary, situated in the central plains of Cambodia and straddling the four provinces Kratie, Stung Treng, Kampong Thom and Preah Vihear (Figure 1). The sanctuary, with a total size of 431,683 ha of which a large share is still covered by natural forest, was established in May 2016. More than 200,000 people, mostly indigenous Kuy, live in the vicinity of the Prey Lang forest and many depend on it for their livelihoods. Prey Lang covers a continuous block of forest, including swamp, evergreen, semi-evergreen and deciduous forests. This site is also a major watershed that feeds the Mekong River and the Tonle Sap Lake.
With Cambodia having one of the highest deforestation rates in the world during recent years, the forests in the surroundings of the Prey Lang area have been subject to large scale forest conversion and logging over the past years as reported by various sources. The Beng Per Wildlife Sanctuary west of Prey Lang has lost almost 60 percent of its forest in the last 25 years1 and similarly, the Prey Lang Wildlife Sanctuary lost about 11,000 ha of tree cover in 2016 alone2.
Figure 1. The Prey Lang Wildlife Sanctuary (red colored line) located in Cambodia (delineated in black color)
The study site is corresponding to the study area targeted by the EU-funded project CEEJA (Citizens Engaged in Environmental Justice for All)3. This project aims at establishing an integrated forest observatory system based on close-to-real-time satellite image observations in order to reduce illegal forest logging activities. The 5-year EU project is implemented by the Danish development organization ’Danmission’, the University of Copenhagen
1https://news.mongabay.com/2019/05/illegal-logging-poised-to-wipe-cambodian-wildlife-sanctuary-off-the-
map/ 2 https://preylang.net/wp-content/uploads/2019/01/7th-Monitoring-Report.pdf 3 Reference of the project : EuropeAid/161819/DD/ACT/KH
6
and several national and international organizations as well as several local forestry networks. One objective is the empowerment of citizens and civil society organizations (CSOs) to promote environmental justice with special focus on forest and biodiversity protection. The Prey Lang Community Network (PLCN), for example, is a CSO consisting of about 400 active members from the communities of Prey Lang’s surrounding provinces working together to protect the Prey Lang forests in collaboration with other stakeholders. PLCN members patrol the forest and collect data on forest resources, as well as illegal logging activities using a specially designed smartphone application (Prey Lang app). The collected data are analyzed in collaboration with the University of Copenhagen and published in reports, press releases and on social media4.
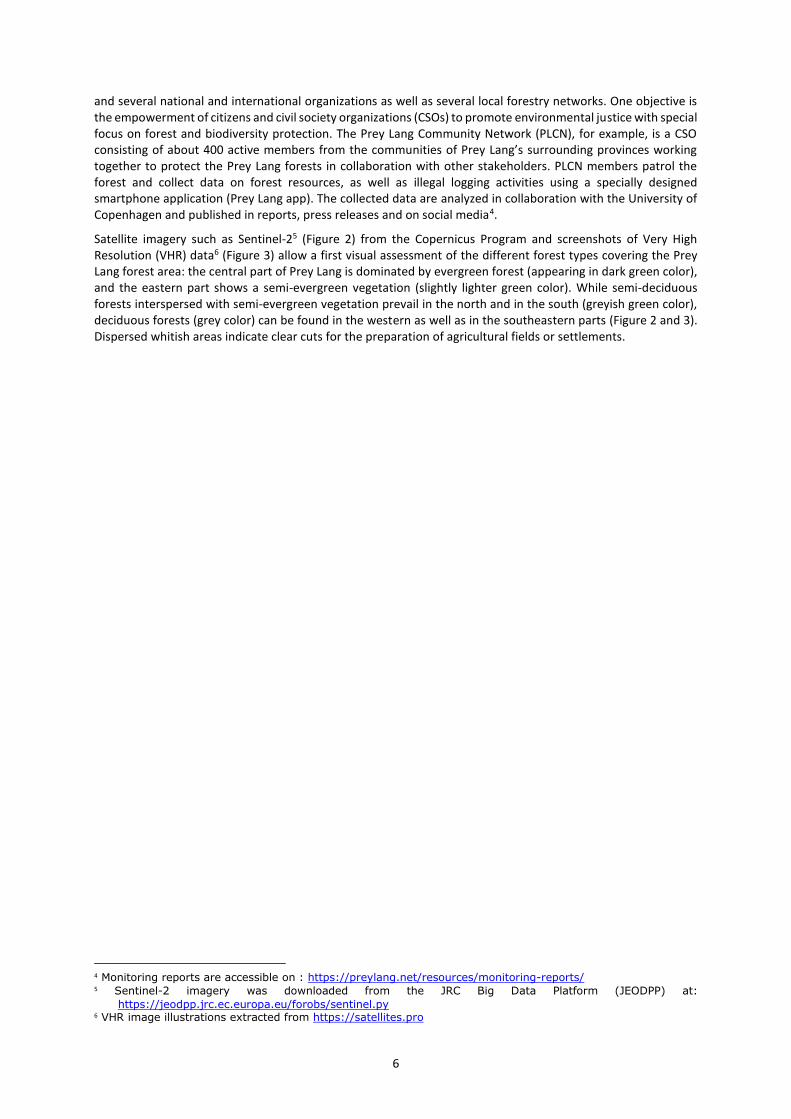
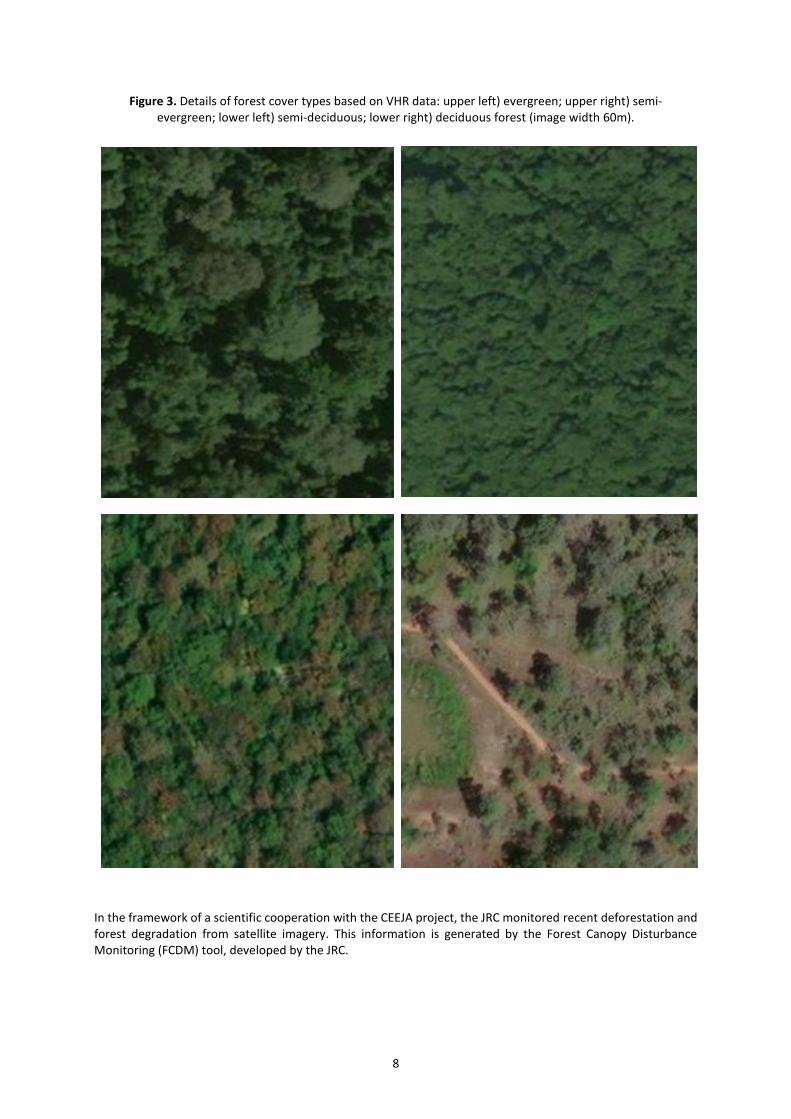
Satellite imagery such as Sentinel-25 (Figure 2) from the Copernicus Program and screenshots of Very High Resolution (VHR) data6 (Figure 3) allow a first visual assessment of the different forest types covering the Prey Lang forest area: the central part of Prey Lang is dominated by evergreen forest (appearing in dark green color), and the eastern part shows a semi-evergreen vegetation (slightly lighter green color). While semi-deciduous forests interspersed with semi-evergreen vegetation prevail in the north and in the south (greyish green color), deciduous forests (grey color) can be found in the western as well as in the southeastern parts (Figure 2 and 3). Dispersed whitish areas indicate clear cuts for the preparation of agricultural fields or settlements.
4 Monitoring reports are accessible on : https://preylang.net/resources/monitoring-reports/ 5 Sentinel-2 imagery was downloaded from the JRC Big Data Platform (JEODPP) at:
https://jeodpp.jrc.ec.europa.eu/forobs/sentinel.py 6 VHR image illustrations extracted from https://satellites.pro
7
Figure 2. Sentinel-2 image (Feb 15 2019) superimposed on the Prey Lang site showing different forest cover types (a) evergreen; (b) semi-evergreen; (c) semi-deciduous and (d) deciduous forest. (Details in Figure 3).
8
Figure 3. Details of forest cover types based on VHR data: upper left) evergreen; upper right) semi-evergreen; lower left) semi-deciduous; lower right) deciduous forest (image width 60m).
In the framework of a scientific cooperation with the CEEJA project, the JRC monitored recent deforestation and forest degradation from satellite imagery. This information is generated by the Forest Canopy Disturbance Monitoring (FCDM) tool, developed by the JRC.

9
3 Methodologies used in this report
This report makes use of two technical approaches for forest monitoring, developed in the context of the IFORCE (International Forest Resources and Carbon Emissions) project7 of the Bioeconomy Unit of the Joint Research Centre (JRC).
First, the historical deforestation within the Prey Lang sanctuary area was analyzed from the Tropical Moist Forest (TMF) dataset over a period of more than 3 decades. For this purpose deforestation at a spatial resolution of 30 m stemming from the analysis of a dataset of Landsat imagery initiating in the early 1980’s (Vancutsem et al., preprint) is compared before and after the year 2016 (date of establishment of the sanctuary). This allows assessing the effectiveness of the Sanctuary, i.e. to what extent the change of the legal status of that area has affected the deforestation rates.
Then, we used the Forest Canopy Disturbance Monitoring (FCDM) tool developed by the JRC to assess forest canopy disturbance at even finer spatial resolution (10 m) during the two most recent years 2018 and 2019. Forest canopy disturbances can result from single tree removal, felling damages or from logging trails, and are often happening at very small-scale. They lead to a qualitative and structural change of the forest cover without land use conversion (‘forest land remaining forest’), requiring therefore a monitoring approach that can catch small tree cover changes from high resolution imagery. The detection of such disturbances through the JRC FCDM tool8 can provide an indication of the forest degradation processes. The tool consists of two modules, the optical based Delta-rNBR approach (Delta self-referenced Normalized Burn Ratio; Langner et al., 20189), also called ‘FCDM-optical’ and the newly developed radar-based monitoring approach Delta-SPE (Delta Single Polarization Enhancement; Langner et al., in preparation), also called ‘FCDM-radar’. The results generated in this report stem from the FCDM-radar approach. An accuracy assessment is applied to support the results obtained for the year 2019.
Whilst the TMF dataset provides a very detailed analysis of historical deforestation as well as of major degradation activities, the FCDM tool is more sensitive towards very small-scale disturbances (degradation activities), also allowing the monitoring of recent disturbance activities. Both approaches complement each other, however, for this report they were used as individual components in order to obtain independent assessments of the situation in the Prey Lang Sanctuary.
3.1 Background of the long-term Tropical Moist Forest (TMF) product
The Tropical Moist Forest (TMF) product (Vancutsem et al., 2019) uses a dataset of Landsat imagery starting from 1982 (representing a total of about 1,250,000 Landsat scenes for the Tropical moist domain until year 2019) in order to assess the disturbances in the forest cover over the entire pan-tropical moist domain. This product maps the tropical evergreen forest cover dynamics, such as deforestation, forest degradation and regrowth at 30 m spatial resolution. This multi-temporal analysis allows obtaining globally consistent and locally relevant information on the TMF extent. Degraded forests and deforested land are discriminated based on the duration and the intensity of the observed disturbance events.
In the TMF database, deforested land is defined as a permanent conversion from moist forest cover to another land cover whereas a degraded forest is defined as a moist forest cover where disturbances were observed only over a short time period. Short-term disturbances refer to logging activities and fires. Degraded forests are separated from deforested land, based on the duration of the observed disturbance events, i.e. disturbance events for which the impacts were observed over more than 2.5 years (900 days) were considered as deforestation processes. For the disturbances that initiated during the last 3 years (2017-2019), specific rules are applied, i.e. a minimum duration of one year or a minimum of 10 disruptions for the last year (2019) to be considered as deforested land. However, the long-term conversion to a non-forest cover will be confirmed when a longer historical period of observation will be available, i.e. at least 3 years after the first year of change.
7 https://forobs.jrc.ec.europa.eu/ 8 Forest Canopy Disturbance Monitoring (FCDM) - A freely available tool to assess potential forest degradation:
https://forobs.jrc.ec.europa.eu/iforce/dNBR.php 9 https://www.mdpi.com/2072-4292/10/4/544
10
3.2 Analysis of the impact of the establishment of the Prey Lang Wildlife Sanctuary
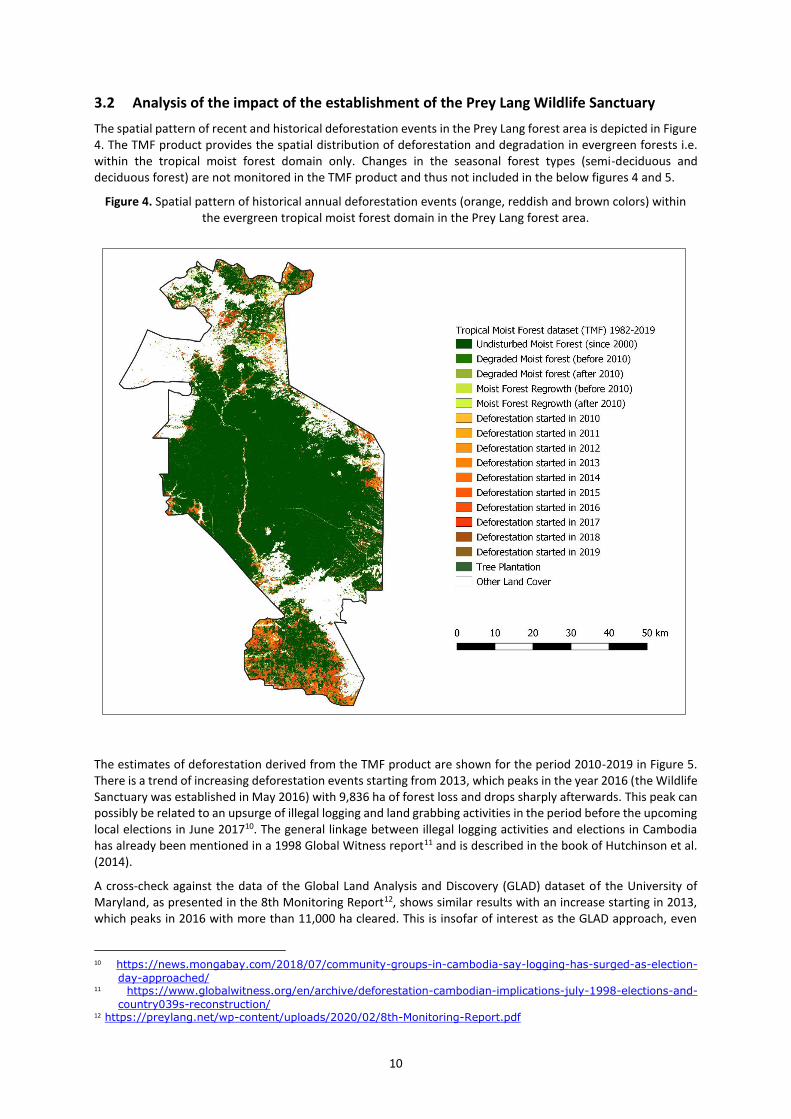
The spatial pattern of recent and historical deforestation events in the Prey Lang forest area is depicted in Figure 4. The TMF product provides the spatial distribution of deforestation and degradation in evergreen forests i.e. within the tropical moist forest domain only. Changes in the seasonal forest types (semi-deciduous and deciduous forest) are not monitored in the TMF product and thus not included in the below figures 4 and 5.
Figure 4. Spatial pattern of historical annual deforestation events (orange, reddish and brown colors) within the evergreen tropical moist forest domain in the Prey Lang forest area.
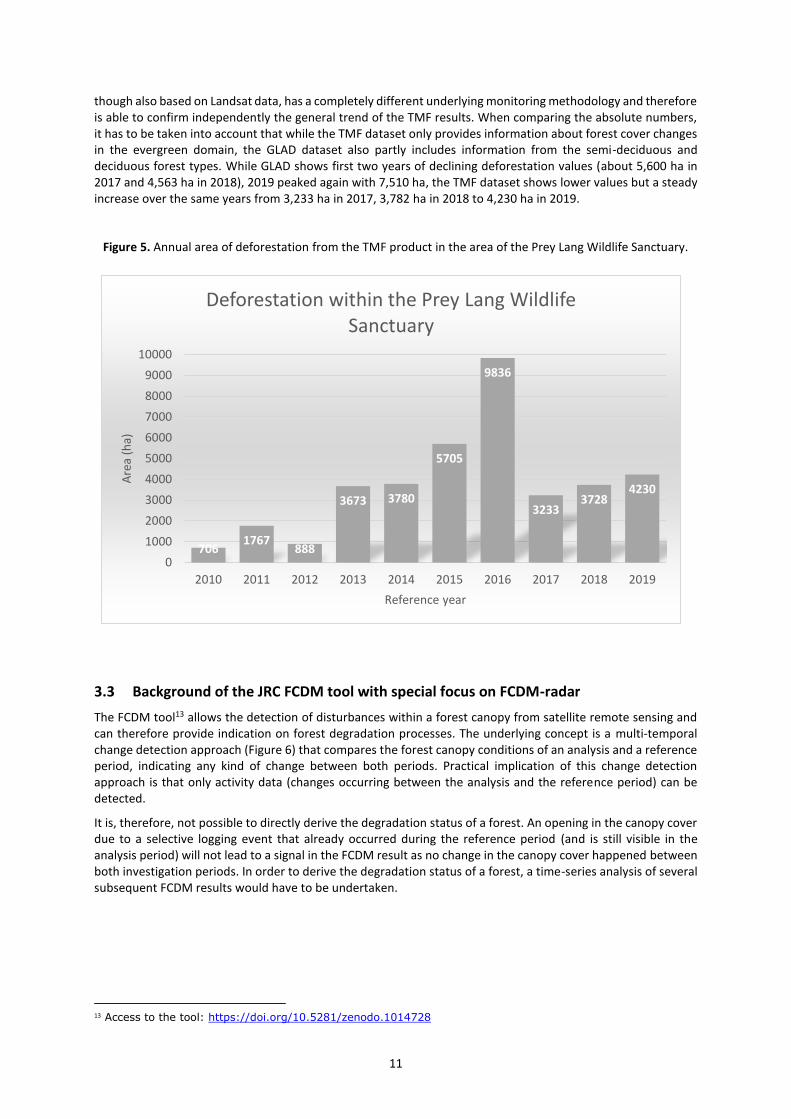
The estimates of deforestation derived from the TMF product are shown for the period 2010-2019 in Figure 5. There is a trend of increasing deforestation events starting from 2013, which peaks in the year 2016 (the Wildlife Sanctuary was established in May 2016) with 9,836 ha of forest loss and drops sharply afterwards. This peak can possibly be related to an upsurge of illegal logging and land grabbing activities in the period before the upcoming local elections in June 201710. The general linkage between illegal logging activities and elections in Cambodia has already been mentioned in a 1998 Global Witness report11 and is described in the book of Hutchinson et al. (2014).
A cross-check against the data of the Global Land Analysis and Discovery (GLAD) dataset of the University of Maryland, as presented in the 8th Monitoring Report12, shows similar results with an increase starting in 2013, which peaks in 2016 with more than 11,000 ha cleared. This is insofar of interest as the GLAD approach, even
10 https://news.mongabay.com/2018/07/community-groups-in-cambodia-say-logging-has-surged-as-election-
day-approached/ 11 https://www.globalwitness.org/en/archive/deforestation-cambodian-implications-july-1998-elections-and-
country039s-reconstruction/ 12 https://preylang.net/wp-content/uploads/2020/02/8th-Monitoring-Report.pdf
11
though also based on Landsat data, has a completely different underlying monitoring methodology and therefore is able to confirm independently the general trend of the TMF results. When comparing the absolute numbers, it has to be taken into account that while the TMF dataset only provides information about forest cover changes in the evergreen domain, the GLAD dataset also partly includes information from the semi-deciduous and deciduous forest types. While GLAD shows first two years of declining deforestation values (about 5,600 ha in 2017 and 4,563 ha in 2018), 2019 peaked again with 7,510 ha, the TMF dataset shows lower values but a steady increase over the same years from 3,233 ha in 2017, 3,782 ha in 2018 to 4,230 ha in 2019.
Figure 5. Annual area of deforestation from the TMF product in the area of the Prey Lang Wildlife Sanctuary.
3.3 Background of the JRC FCDM tool with special focus on FCDM-radar
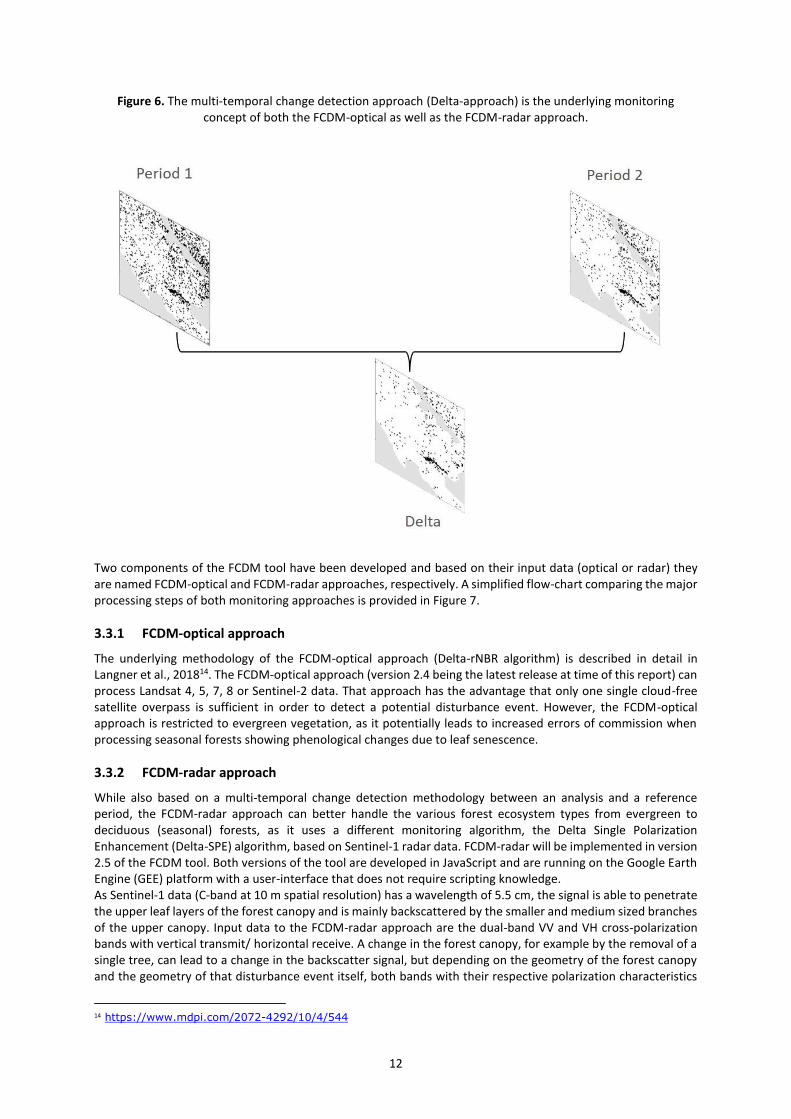
The FCDM tool13 allows the detection of disturbances within a forest canopy from satellite remote sensing and can therefore provide indication on forest degradation processes. The underlying concept is a multi-temporal change detection approach (Figure 6) that compares the forest canopy conditions of an analysis and a reference period, indicating any kind of change between both periods. Practical implication of this change detection approach is that only activity data (changes occurring between the analysis and the reference period) can be detected.
It is, therefore, not possible to directly derive the degradation status of a forest. An opening in the canopy cover due to a selective logging event that already occurred during the reference period (and is still visible in the analysis period) will not lead to a signal in the FCDM result as no change in the canopy cover happened between both investigation periods. In order to derive the degradation status of a forest, a time-series analysis of several subsequent FCDM results would have to be undertaken.
13 Access to the tool: https://doi.org/10.5281/zenodo.1014728
7061767
888
3673 3780
5705
9836
32333728
4230
0
1000
2000
3000
4000
5000
6000
7000
8000
9000
10000
2010 2011 2012 2013 2014 2015 2016 2017 2018 2019
Are
a (h
a)
Reference year
Deforestation within the Prey Lang Wildlife Sanctuary
12
Figure 6. The multi-temporal change detection approach (Delta-approach) is the underlying monitoring concept of both the FCDM-optical as well as the FCDM-radar approach.
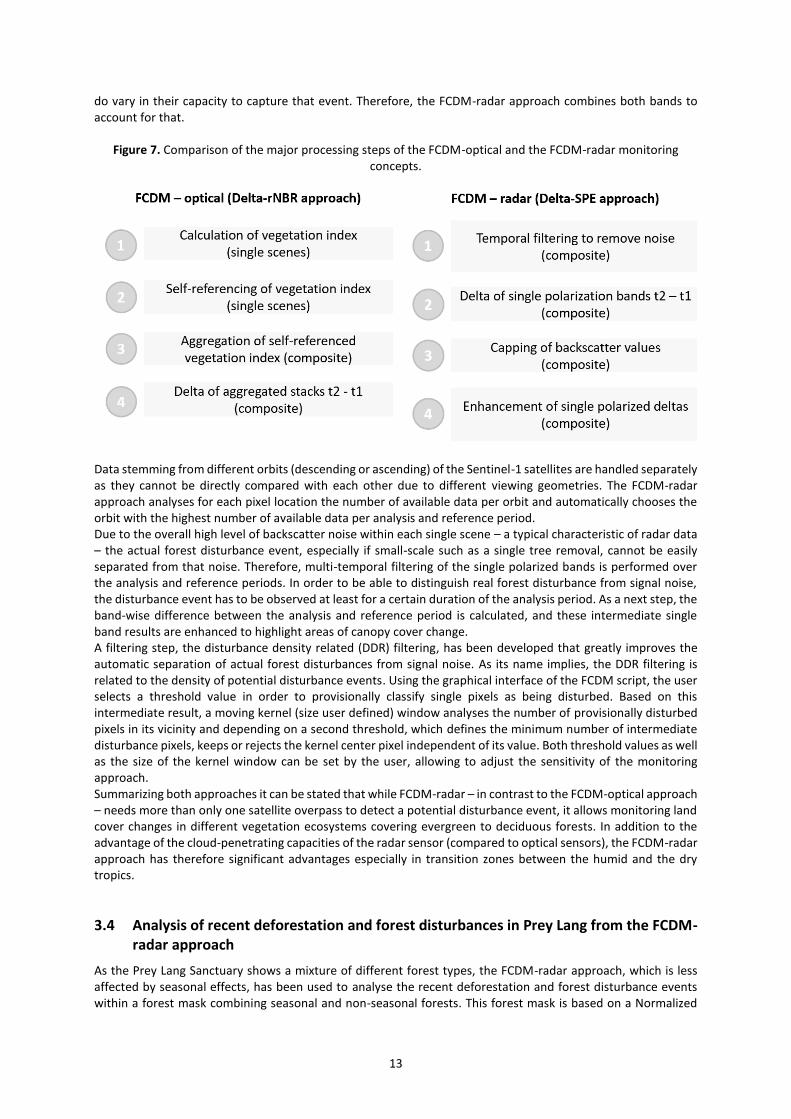
Two components of the FCDM tool have been developed and based on their input data (optical or radar) they are named FCDM-optical and FCDM-radar approaches, respectively. A simplified flow-chart comparing the major processing steps of both monitoring approaches is provided in Figure 7.
3.3.1 FCDM-optical approach
The underlying methodology of the FCDM-optical approach (Delta-rNBR algorithm) is described in detail in Langner et al., 201814. The FCDM-optical approach (version 2.4 being the latest release at time of this report) can process Landsat 4, 5, 7, 8 or Sentinel-2 data. That approach has the advantage that only one single cloud-free satellite overpass is sufficient in order to detect a potential disturbance event. However, the FCDM-optical approach is restricted to evergreen vegetation, as it potentially leads to increased errors of commission when processing seasonal forests showing phenological changes due to leaf senescence.
3.3.2 FCDM-radar approach
While also based on a multi-temporal change detection methodology between an analysis and a reference period, the FCDM-radar approach can better handle the various forest ecosystem types from evergreen to deciduous (seasonal) forests, as it uses a different monitoring algorithm, the Delta Single Polarization Enhancement (Delta-SPE) algorithm, based on Sentinel-1 radar data. FCDM-radar will be implemented in version 2.5 of the FCDM tool. Both versions of the tool are developed in JavaScript and are running on the Google Earth Engine (GEE) platform with a user-interface that does not require scripting knowledge. As Sentinel-1 data (C-band at 10 m spatial resolution) has a wavelength of 5.5 cm, the signal is able to penetrate the upper leaf layers of the forest canopy and is mainly backscattered by the smaller and medium sized branches of the upper canopy. Input data to the FCDM-radar approach are the dual-band VV and VH cross-polarization bands with vertical transmit/ horizontal receive. A change in the forest canopy, for example by the removal of a single tree, can lead to a change in the backscatter signal, but depending on the geometry of the forest canopy and the geometry of that disturbance event itself, both bands with their respective polarization characteristics
14 https://www.mdpi.com/2072-4292/10/4/544
13
do vary in their capacity to capture that event. Therefore, the FCDM-radar approach combines both bands to account for that.
Figure 7. Comparison of the major processing steps of the FCDM-optical and the FCDM-radar monitoring concepts.
Data stemming from different orbits (descending or ascending) of the Sentinel-1 satellites are handled separately as they cannot be directly compared with each other due to different viewing geometries. The FCDM-radar approach analyses for each pixel location the number of available data per orbit and automatically chooses the orbit with the highest number of available data per analysis and reference period. Due to the overall high level of backscatter noise within each single scene – a typical characteristic of radar data – the actual forest disturbance event, especially if small-scale such as a single tree removal, cannot be easily separated from that noise. Therefore, multi-temporal filtering of the single polarized bands is performed over the analysis and reference periods. In order to be able to distinguish real forest disturbance from signal noise, the disturbance event has to be observed at least for a certain duration of the analysis period. As a next step, the band-wise difference between the analysis and reference period is calculated, and these intermediate single band results are enhanced to highlight areas of canopy cover change. A filtering step, the disturbance density related (DDR) filtering, has been developed that greatly improves the automatic separation of actual forest disturbances from signal noise. As its name implies, the DDR filtering is related to the density of potential disturbance events. Using the graphical interface of the FCDM script, the user selects a threshold value in order to provisionally classify single pixels as being disturbed. Based on this intermediate result, a moving kernel (size user defined) window analyses the number of provisionally disturbed pixels in its vicinity and depending on a second threshold, which defines the minimum number of intermediate disturbance pixels, keeps or rejects the kernel center pixel independent of its value. Both threshold values as well as the size of the kernel window can be set by the user, allowing to adjust the sensitivity of the monitoring approach. Summarizing both approaches it can be stated that while FCDM-radar – in contrast to the FCDM-optical approach – needs more than only one satellite overpass to detect a potential disturbance event, it allows monitoring land cover changes in different vegetation ecosystems covering evergreen to deciduous forests. In addition to the advantage of the cloud-penetrating capacities of the radar sensor (compared to optical sensors), the FCDM-radar approach has therefore significant advantages especially in transition zones between the humid and the dry tropics.
3.4 Analysis of recent deforestation and forest disturbances in Prey Lang from the FCDM-radar approach
As the Prey Lang Sanctuary shows a mixture of different forest types, the FCDM-radar approach, which is less affected by seasonal effects, has been used to analyse the recent deforestation and forest disturbance events within a forest mask combining seasonal and non-seasonal forests. This forest mask is based on a Normalized
14
Difference Vegetation Index (NDVI) of a cloud-free Sentinel-2 scene from the beginning of the analysis period (February 15, 2019). Based on the NDVI of the same scene but using a more restrictive threshold, a second forest mask for validation purposes is derived, separating evergreen and semi-evergreen forests from semi-deciduous and deciduous forests. In a first step the disturbance maps are derived using the FCDM-radar tool keeping all default settings (Langner et al, in preparation). Analysis periods were set to monitor changes during the periods January 2019 – February 2020 (referred as the 2019 result) and January 2018 – February 2019 (referred as the 2018 result). In order to avoid double accounting, all signals recorded in the first two months of the 2019 result were removed from the 2019 result, thus shortening the actual analysis period of the 2019 results to March 2019 - February 2020 (see Figure 8 with adjusted legend). Both results are produced using the empirically derived value of 100 as minimum threshold to separate FCDM signal from noise.

15
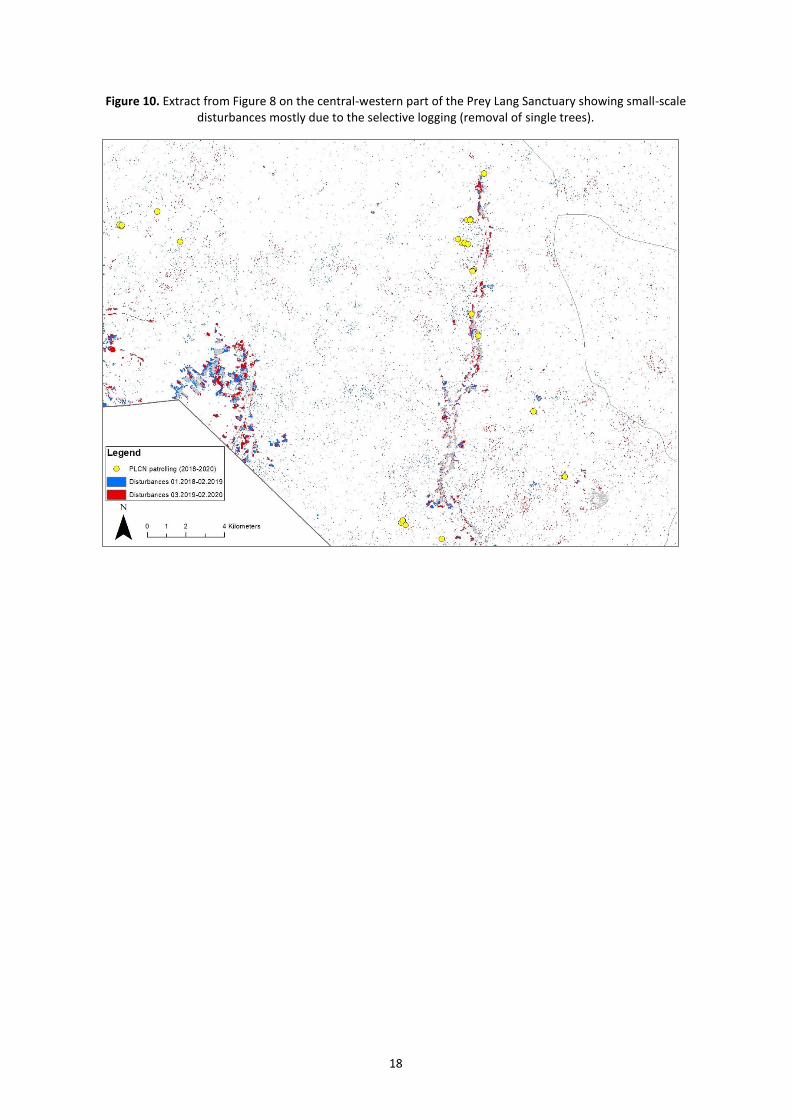
Figure 8. Canopy cover disturbances detected within the period January 2018 – February 2019 (in blue) and the period March 2019 – February 2020 (in red) over the whole Prey Lang Sanctuary. Yellow points refer to GPS markings obtained by PLCN members during forest patrols, referring to illegal logging activities on the
ground (e.g. tree stumps, logs and sawn timber). Specific areas (shown as rectangles or arrows) are shown in detail in the following figures.
In Figure 8 the canopy cover disturbances within all four forest types (evergreen, semi-evergreen, semi-deciduous and deciduous) are displayed, showing some general patterns for both observation periods: While in
Figure 13
Figure 14
Figure 12
Figure 9
Figure 10
Figure 11
16
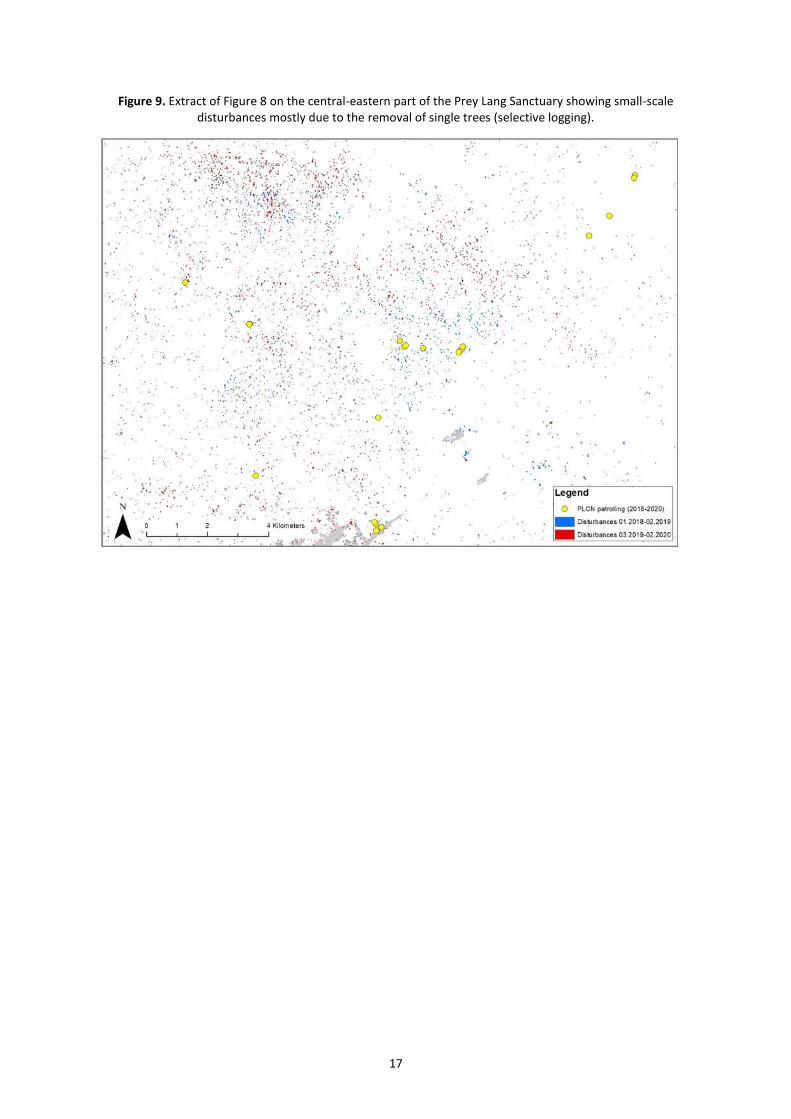
the north and especially in the south larger-scale deforestation patches are visible, with a stronger impact in 2019 as compared to 2018, the central part of the Sanctuary mainly shows small-scale disturbances stemming from both years, most probably caused by the selective removal of trees. The latter ones can be observed in particular within the three boxes indicated in figure 8 and shown in more details in Figures 9 to 11. Some specific locations are marked, which are shown in detail in the Figures 12 to 14, showcasing the FCDM-radar results as compared to 10 m Sentinel-2 reference data or georeferenced photos taken during forest patrols. Further figures of other geolocations can be found in the supplementary material. Due to the fact that a robust accuracy assessment could only be done for the 2019 result within the semi-evergreen and evergreen forest domain (details and reasoning given in the validation section), we only provide the estimates of disturbances for the year 2019 within these two forest types in this report. The FCDM-radar approach depicts an area of 9,384 ha showing forest canopy disturbances in 2019 within the evergreen and semi-evergreen forest domain. Compared to the TMF product at 30 m resolution which depicts 4,230 ha of deforestation for year 2019, the FCDM-radar map at 10 m resolution, which depicts large-scale deforestation as well as small-scale forest degradation events, is reporting more than double the area. Considering that the deforestation events are well detected in the TMF product the additional area of 5,154 ha detected from the FCDM-radar product are very likely related to the selective removal of single trees. However, it has to be noted that the investigation periods of the two products datasets are not exactly the same (shift of 2 months - the FCDM-radar product includes almost the first two months of 2020, but partly misses the first two months of 2019) that may explain part of these differences. Converting the raster map of forest canopy disturbances into a vector dataset allows to analyze the number of distinct disturbance events and to verify the dominant contribution of the selective removal of single trees. The total area of 9,384 ha splits into 51,863 distinct patches/polygons of forest disturbances recorded in 2019. The 736 largest polygons alone cover an area of 4,278 ha, which is close to the total disturbed area of the TMF product for year 2019 with 4,230 ha. These polygons mainly relate to large-scale forest encroachments (e.g. clear-cut areas) and their patch size ranges between 1.6 ha and 307.6 ha with an average area of 5.8 ha. The lion’s share are the remaining 51,127 smaller polygons that cover an area of 5,106 ha and mostly constitute small-scale disturbance events (e.g. selective tree removal) ranging between 0.03 ha and 1.6 ha with an average size of 0.1 ha.
17
Figure 9. Extract of Figure 8 on the central-eastern part of the Prey Lang Sanctuary showing small-scale disturbances mostly due to the removal of single trees (selective logging).
18
Figure 10. Extract from Figure 8 on the central-western part of the Prey Lang Sanctuary showing small-scale disturbances mostly due to the selective logging (removal of single trees).
19
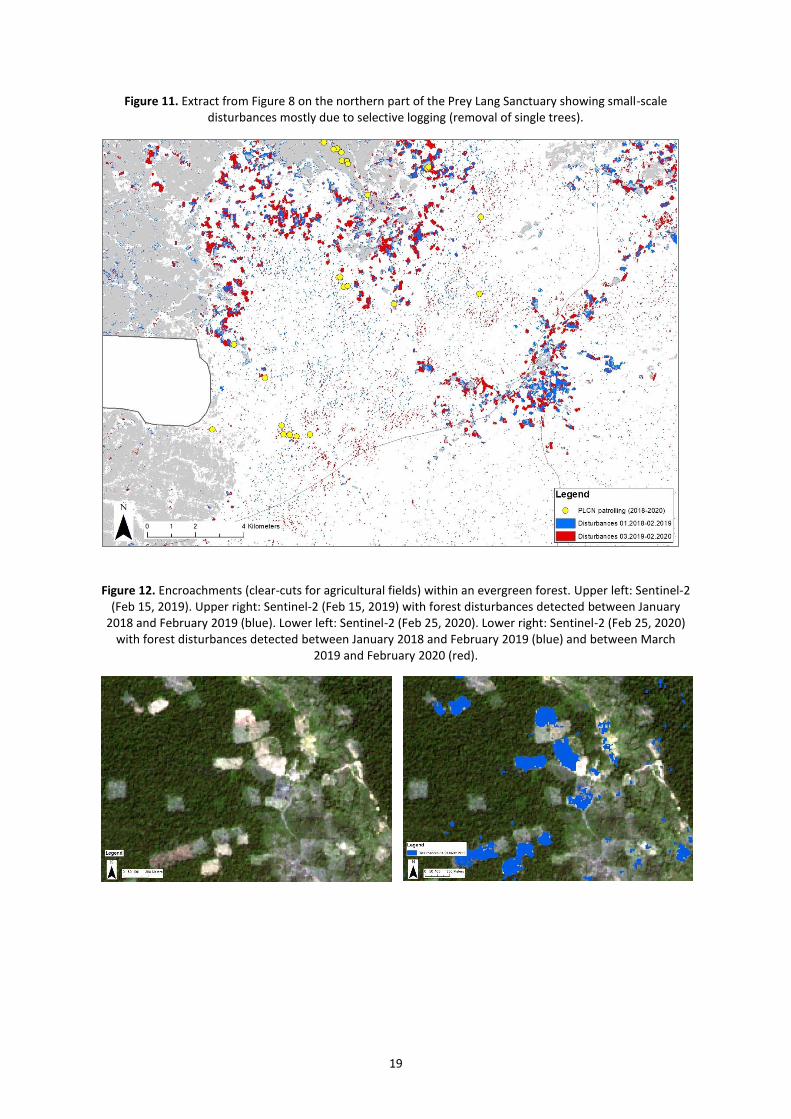
Figure 11. Extract from Figure 8 on the northern part of the Prey Lang Sanctuary showing small-scale disturbances mostly due to selective logging (removal of single trees).
Figure 12. Encroachments (clear-cuts for agricultural fields) within an evergreen forest. Upper left: Sentinel-2 (Feb 15, 2019). Upper right: Sentinel-2 (Feb 15, 2019) with forest disturbances detected between January
2018 and February 2019 (blue). Lower left: Sentinel-2 (Feb 25, 2020). Lower right: Sentinel-2 (Feb 25, 2020) with forest disturbances detected between January 2018 and February 2019 (blue) and between March
2019 and February 2020 (red).
20
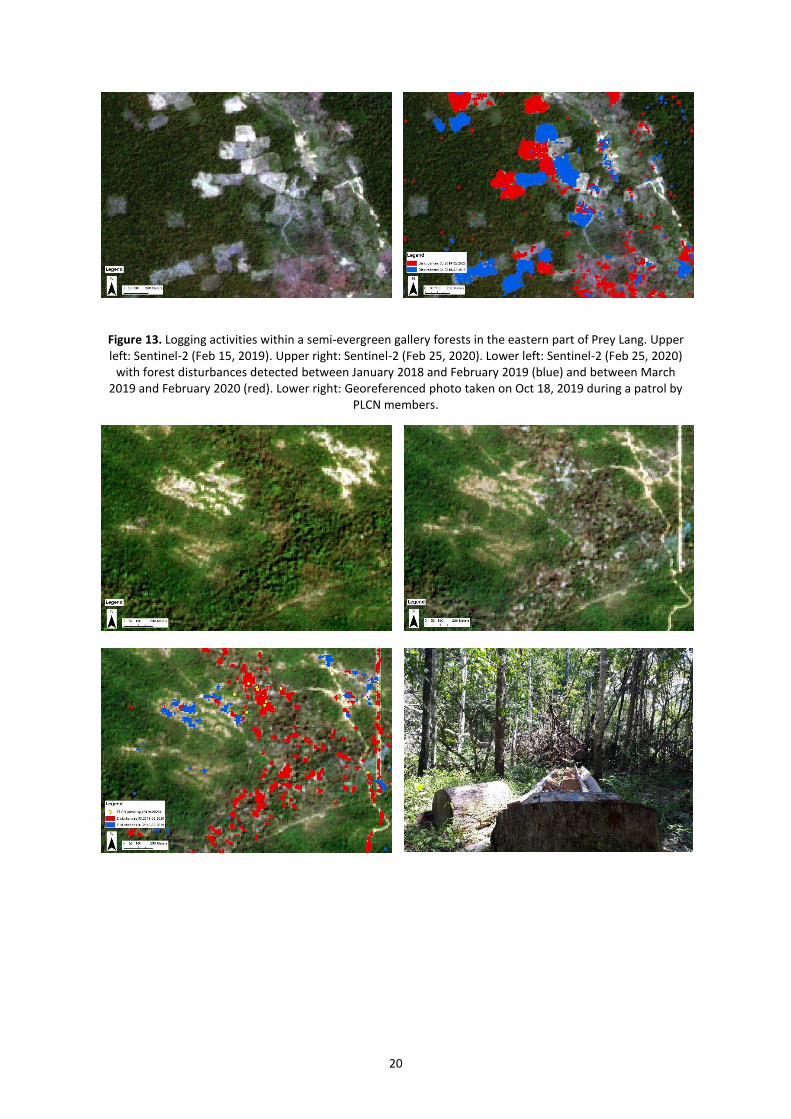
Figure 13. Logging activities within a semi-evergreen gallery forests in the eastern part of Prey Lang. Upper left: Sentinel-2 (Feb 15, 2019). Upper right: Sentinel-2 (Feb 25, 2020). Lower left: Sentinel-2 (Feb 25, 2020)
with forest disturbances detected between January 2018 and February 2019 (blue) and between March 2019 and February 2020 (red). Lower right: Georeferenced photo taken on Oct 18, 2019 during a patrol by
PLCN members.
21
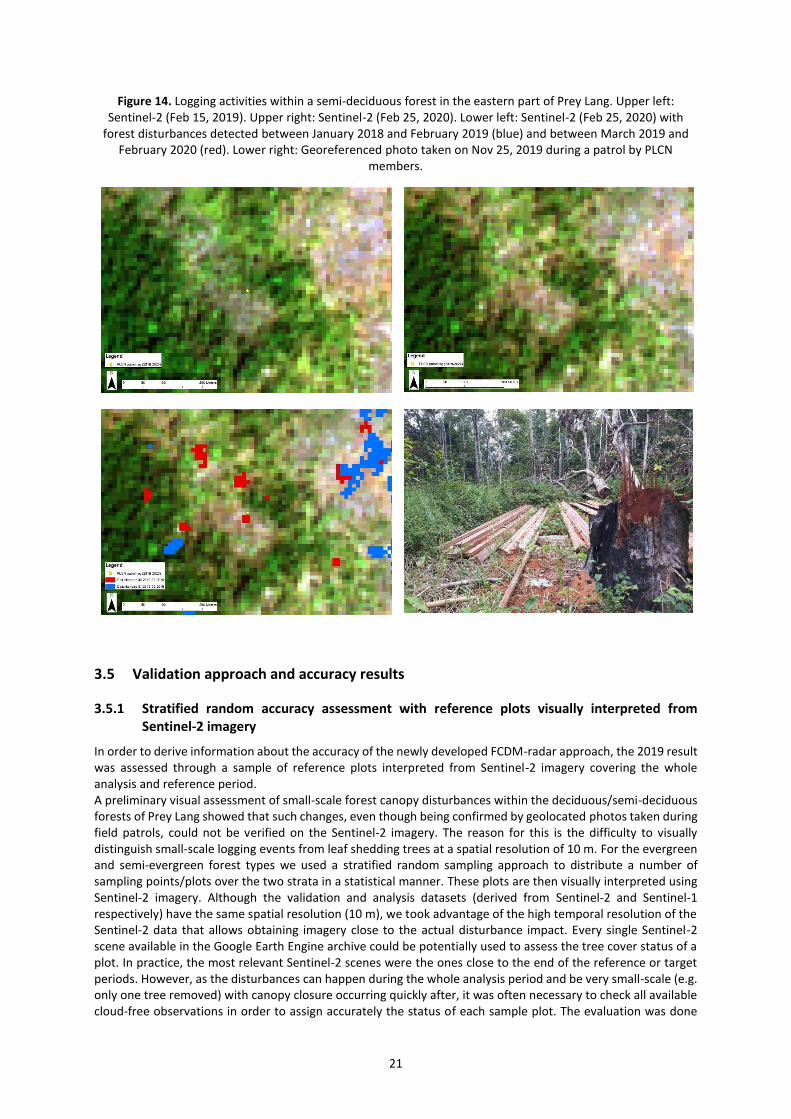
Figure 14. Logging activities within a semi-deciduous forest in the eastern part of Prey Lang. Upper left: Sentinel-2 (Feb 15, 2019). Upper right: Sentinel-2 (Feb 25, 2020). Lower left: Sentinel-2 (Feb 25, 2020) with
forest disturbances detected between January 2018 and February 2019 (blue) and between March 2019 and February 2020 (red). Lower right: Georeferenced photo taken on Nov 25, 2019 during a patrol by PLCN
members.
3.5 Validation approach and accuracy results
3.5.1 Stratified random accuracy assessment with reference plots visually interpreted from Sentinel-2 imagery
In order to derive information about the accuracy of the newly developed FCDM-radar approach, the 2019 result was assessed through a sample of reference plots interpreted from Sentinel-2 imagery covering the whole analysis and reference period. A preliminary visual assessment of small-scale forest canopy disturbances within the deciduous/semi-deciduous forests of Prey Lang showed that such changes, even though being confirmed by geolocated photos taken during field patrols, could not be verified on the Sentinel-2 imagery. The reason for this is the difficulty to visually distinguish small-scale logging events from leaf shedding trees at a spatial resolution of 10 m. For the evergreen and semi-evergreen forest types we used a stratified random sampling approach to distribute a number of sampling points/plots over the two strata in a statistical manner. These plots are then visually interpreted using Sentinel-2 imagery. Although the validation and analysis datasets (derived from Sentinel-2 and Sentinel-1 respectively) have the same spatial resolution (10 m), we took advantage of the high temporal resolution of the Sentinel-2 data that allows obtaining imagery close to the actual disturbance impact. Every single Sentinel-2 scene available in the Google Earth Engine archive could be potentially used to assess the tree cover status of a plot. In practice, the most relevant Sentinel-2 scenes were the ones close to the end of the reference or target periods. However, as the disturbances can happen during the whole analysis period and be very small-scale (e.g. only one tree removed) with canopy closure occurring quickly after, it was often necessary to check all available cloud-free observations in order to assign accurately the status of each sample plot. The evaluation was done
22
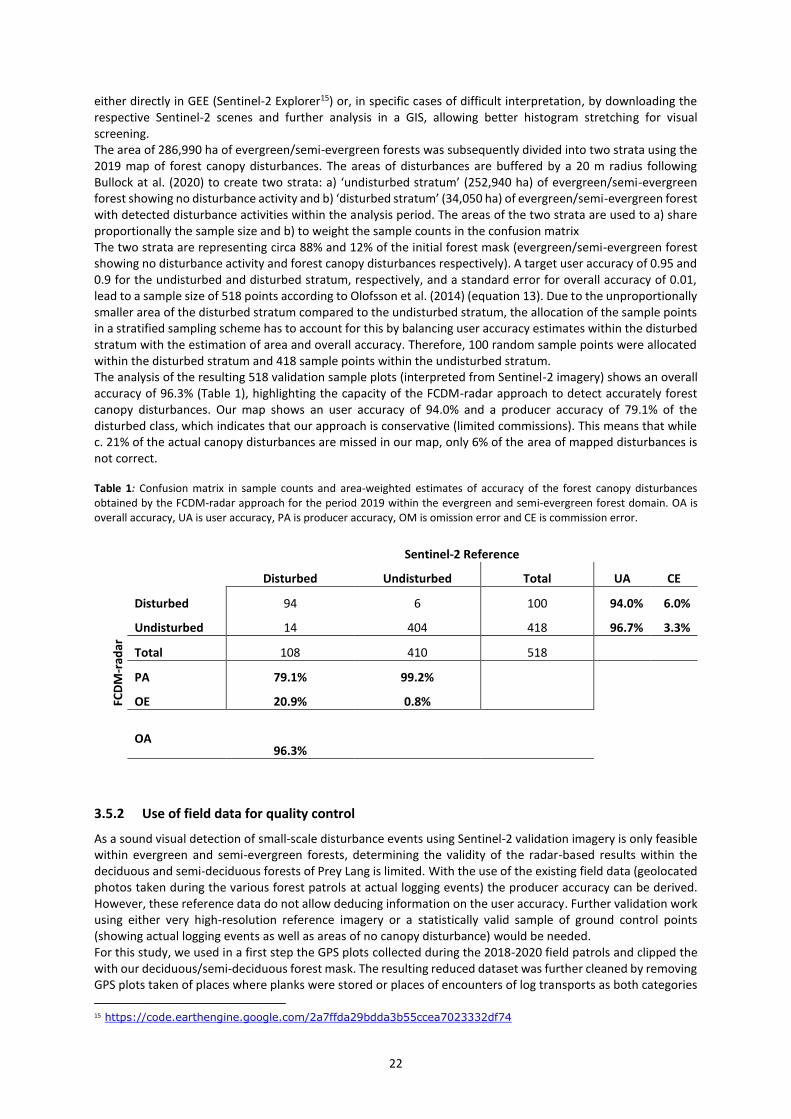
either directly in GEE (Sentinel-2 Explorer15) or, in specific cases of difficult interpretation, by downloading the respective Sentinel-2 scenes and further analysis in a GIS, allowing better histogram stretching for visual screening. The area of 286,990 ha of evergreen/semi-evergreen forests was subsequently divided into two strata using the 2019 map of forest canopy disturbances. The areas of disturbances are buffered by a 20 m radius following Bullock at al. (2020) to create two strata: a) ‘undisturbed stratum’ (252,940 ha) of evergreen/semi-evergreen forest showing no disturbance activity and b) ‘disturbed stratum’ (34,050 ha) of evergreen/semi-evergreen forest with detected disturbance activities within the analysis period. The areas of the two strata are used to a) share proportionally the sample size and b) to weight the sample counts in the confusion matrix The two strata are representing circa 88% and 12% of the initial forest mask (evergreen/semi-evergreen forest showing no disturbance activity and forest canopy disturbances respectively). A target user accuracy of 0.95 and 0.9 for the undisturbed and disturbed stratum, respectively, and a standard error for overall accuracy of 0.01, lead to a sample size of 518 points according to Olofsson et al. (2014) (equation 13). Due to the unproportionally smaller area of the disturbed stratum compared to the undisturbed stratum, the allocation of the sample points in a stratified sampling scheme has to account for this by balancing user accuracy estimates within the disturbed stratum with the estimation of area and overall accuracy. Therefore, 100 random sample points were allocated within the disturbed stratum and 418 sample points within the undisturbed stratum. The analysis of the resulting 518 validation sample plots (interpreted from Sentinel-2 imagery) shows an overall accuracy of 96.3% (Table 1), highlighting the capacity of the FCDM-radar approach to detect accurately forest canopy disturbances. Our map shows an user accuracy of 94.0% and a producer accuracy of 79.1% of the disturbed class, which indicates that our approach is conservative (limited commissions). This means that while c. 21% of the actual canopy disturbances are missed in our map, only 6% of the area of mapped disturbances is not correct. Table 1: Confusion matrix in sample counts and area-weighted estimates of accuracy of the forest canopy disturbances obtained by the FCDM-radar approach for the period 2019 within the evergreen and semi-evergreen forest domain. OA is overall accuracy, UA is user accuracy, PA is producer accuracy, OM is omission error and CE is commission error.
Sentinel-2 Reference
Disturbed Undisturbed Total UA CE
FCD
M-r
adar
Disturbed 94 6 100 94.0% 6.0%
Undisturbed 14 404 418 96.7% 3.3%
Total 108 410 518
PA 79.1% 99.2%
OE 20.9% 0.8%
OA
96.3%
3.5.2 Use of field data for quality control
As a sound visual detection of small-scale disturbance events using Sentinel-2 validation imagery is only feasible within evergreen and semi-evergreen forests, determining the validity of the radar-based results within the deciduous and semi-deciduous forests of Prey Lang is limited. With the use of the existing field data (geolocated photos taken during the various forest patrols at actual logging events) the producer accuracy can be derived. However, these reference data do not allow deducing information on the user accuracy. Further validation work using either very high-resolution reference imagery or a statistically valid sample of ground control points (showing actual logging events as well as areas of no canopy disturbance) would be needed. For this study, we used in a first step the GPS plots collected during the 2018-2020 field patrols and clipped the with our deciduous/semi-deciduous forest mask. The resulting reduced dataset was further cleaned by removing GPS plots taken of places where planks were stored or places of encounters of log transports as both categories
15 https://code.earthengine.google.com/2a7ffda29bdda3b55ccea7023332df74
23
do not provide any information about the actual geolocation of the actual logging event. The remaining dataset of 90 GPS field plots was further cleaned by removing 19 entries where the photos do not match the recorded data (e.g. record shows missing tree but photo shows standing tree) or fall out of the analysis period. In the latter category, 3 data plots were removed. The remaining 68 data plots were analysed if their records matched the 2018 as well as the 2019 FCDM datasets – also taking into account the temporal information (e.g. a GPS reading showing a deforestation event in 2018 that was detected only by the 2019 FCDM dataset would be recorded as an omission error). While 19 plots, indicating actual logging events on the ground, did not show any disturbance signal in the respective FCDM datasets, 37 plots showed a match between the ground information of a logging event and the FCDM signal. In addition, 12 GPS plots of actual logging impacts were close by (< 12 m) areas of respective FCDM signals and thus considered as correctly identified, anticipating a certain geolocation error of the smartphone devices used to collect this data as well as a possible relief displacement of the radar data. The analysis of these data shows a producer accuracy of 72.1% with an error of omission of 27.9% for the disturbance class when applying the newly developed FCDM-radar approach within the semi-deciduous and deciduous forests of Prey Lang. Compared to the results of the accuracy assessment for the evergreen and semi-evergreen forest domain, the preliminary assessment of the FCDM-radar approach within semi-deciduous and deciduous forest shows a higher uncertainty. However, it has to be considered that the latter assessment was done on a very small and non-statistically valid sample size. Future research (e.g. the analysis of GPS points following a stratified random sampling scheme) is expected to provide a better understanding of the performance of the FCDM-radar approach within more seasonal forest types.
24
4 Conclusions and perspectives
The results of our remote sensing based monitoring study supports the observations on the ground of ongoing logging activities within the Prey Lang study area. According to our results, two main drivers for the forest canopy disturbances can be identified: while the central parts of Prey Lang Wildlife Sanctuary are mainly affected by the selective removal of single trees, the conversion of larger forest patches of non-forested areas are mainly found in the northern and southern parts of the Sanctuary.
According to our Tropical Moist Forest product (TMF) at 30 m resolution there is a trend of increasing deforestation events starting from 2013, which peaks in the year 2016 with 9,836 ha of forest loss and drops sharply afterwards. This peak could be explained by illegal logging and land grabbing, which can be related to the run up to local elections in the following year (2017). A comparable trend is also observed using the GLAD dataset of the University of Maryland, emphasizing the trend observed in the TMF dataset.
To monitor very small-scale disturbances such as the removal of single trees in evergreen but also in seasonal forests a new approach (FCDM-radar) was developed and applied on Sentinel-1 imagery at 10 m resolution. This approach allows to detect structural changes within the forest canopy. In general, the spatial deforestation pattern from both TMF and FCDM-radar products could be visually well confirmed. For the period March 2019 - February 2020 we estimate that an area of 9,384 ha was affected by changes in the canopy structure (including small-scale disturbances and larger-scale deforestation). Compared to the TMF result, the FCDM-radar approach detects almost 122% more disturbance area – mainly due to very small-scale disturbances. In total we identify 51,863 distinct polygons of forest disturbances. While the 736 largest polygons (average size: 5.8 ha) cover an area similar to the 2019 TMF dataset, there are more than 51,000 small polygons (average size : 0.1 ha) that in most cases relate to selective tree removals.
The accuracy of the FCDM-radar map of forest disturbances within evergreen and semi-evergreen forests for year 2019 was assessed from a sample of 518 reference plots points. The FCDM-radar approach results in a high overall accuracy of 96.3% (user accuracy of 94.0% and producer accuracy of 79.1%). A preliminary validation assessment within deciduous and semi-deciduous forests from field data shows a producer accuracy of 72.1%, indicating that this new approach also allows to monitor forest disturbances within seasonal forests, which is considered to be a more challenging technical task compared to the evergreen forest domain. Based on these results, it is expected that this new FCDM-radar approach can help producing more accurate forest activity data – in particular for activities related to forest degradation – which is relevant for reporting under REDD+ or monitoring under FLEGT.
Future research has to provide a better understanding of the performance of the FCDM-radar approach within seasonal forest types as well as under various close-to-real time monitoring conditions. In this context, a combination of the FCDM-radar and the FCDM-optical monitoring approach will be assessed. One of the technical objectives within this project is to eventually integrate the best reliable information on canopy disturbances (i.e. stemming from logging activities) at high temporal and spatial resolution in the already existing Prey Lang smartphone app, thus allowing forest patrols to best use their resources and operate at highest efficiency to protect the natural heritage of Prey Lang.
25
References
Bullock, E.; Woodcock, C.E.; Souza Jr., C.; Olofsson, P., Satellite-based estimates reveal widespread forest degradation in the Amazon, Global Change Biology, Vol. 00, pp.1-14, DOI: 10.1111/gcb.15029, 2020.
Hutchinson, J., Hout, W., Hughes, C., Robison, R., Political Economy and the Aid Industry in Asia. London: Palgrave Macmillan. Page 24, Caroline Hughes, 2014.
Langner, A.; Miettinen, J.; Kukkonen, M.; Vancutsem, C.; Simonetti, D.; Vieilledent, G.; Verhegghen, A.; Gallego, J.; Stibig, H.-J., Towards Operational Monitoring of Forest Canopy Disturbance in Evergreen Rain Forests: A Test Case in Continental Southeast Asia, Remote Sensing, Vol. 10, 544, 2018.
Langner, A.; et al., Monitoring large- and small-scale changes in vegetation cover in the dry and humid domain using multi-temporal Sentinel-1 data; in preparation.
Olofsson, P.; Foody, G.M.; Herold, M.; Stehman, S.V.; Woodcock, C.E.; Wulder, M.A., Good practices for estimating area and assessing accuracy of land change, Remote Sensing of the Environment, Vol. 148, pp. 42–57, 2014.
Vancutsem, C.; Achard, F.; Pekel J. F.; Vieilledent G.; Carboni S.; Simonetti D.; Gallego J., High-resolution mapping of pan-tropical evergreen forest cover dynamics from 1982 to 2017, Living planet symposium, 13-17 May 2019, Milan, Italy.
Vancutsem, C.; Achard, F.; Pekel, J.-F.; Vieilledent, G.; Carboni, S.; Simonetti, D.; Gallego, J.; Aragao, L.; Nasi, R., Long-term (1990-2019) monitoring of tropical moist forests dynamics, on revision in Science Advances, preprint available at doi.org/10.1101/2020.09.17.295774.
26
List of figures
Figure 1. The Prey Lang Wildlife Sanctuary (red colored line) located in Cambodia (delineated in black color) 5 Figure 2. Sentinel-2 image (Feb 15 2019) superimposed on the Prey Lang site showing different forest cover
types (a) evergreen; (b) semi-evergreen; (c) semi-deciduous and (d) deciduous forest. (Details in Figure 3). 7
Figure 3. Details of forest cover types based on VHR data: upper left) evergreen; upper right) semi-evergreen; lower left) semi-deciduous; lower right) deciduous forest (image width 60m). 8
Figure 4. Spatial pattern of historical annual deforestation events (orange, reddish and brown colors) within the evergreen tropical moist forest domain in the Prey Lang forest area. 10
Figure 5. Annual area of deforestation from the TMF product in the area of the Prey Lang Wildlife Sanctuary. 11 Figure 6. The multi-temporal change detection approach (Delta-approach) is the underlying monitoring concept
of both the FCDM-optical as well as the FCDM-radar approach. 12 Figure 7. Comparison of the major processing steps of the FCDM-optical and the FCDM-radar monitoring
concepts. 13 Figure 8. Canopy cover disturbances detected within the period January 2018 – February 2019 (in blue) and the
period March 2019 – February 2020 (in red) over the whole Prey Lang Sanctuary. Yellow points refer to GPS markings obtained by PLCN members during forest patrols, referring to illegal logging activities on the ground (e.g. tree stumps, logs and sawn timber). Specific areas (shown as rectangles or arrows) are shown in detail in the following figures. 15
Figure 9. Extract of Figure 8 on the central-eastern part of the Prey Lang Sanctuary showing small-scale disturbances mostly due to the removal of single trees (selective logging). 17
Figure 10. Extract from Figure 8 on the central-western part of the Prey Lang Sanctuary showing small-scale disturbances mostly due to the selective logging (removal of single trees). 18
Figure 11. Extract from Figure 8 on the northern part of the Prey Lang Sanctuary showing small-scale disturbances mostly due to selective logging (removal of single trees). 19
Figure 12. Encroachments (clear-cuts for agricultural fields) within an evergreen forest. Upper left: Sentinel-2 (Feb 15, 2019). Upper right: Sentinel-2 (Feb 15, 2019) with forest disturbances detected between January 2018 and February 2019 (blue). Lower left: Sentinel-2 (Feb 25, 2020). Lower right: Sentinel-2 (Feb 25, 2020) with forest disturbances detected between January 2018 and February 2019 (blue) and between March 2019 and February 2020 (red). 19
Figure 13. Logging activities within a semi-evergreen gallery forests in the eastern part of Prey Lang. Upper left: Sentinel-2 (Feb 15, 2019). Upper right: Sentinel-2 (Feb 25, 2020). Lower left: Sentinel-2 (Feb 25, 2020) with forest disturbances detected between January 2018 and February 2019 (blue) and between March 2019 and February 2020 (red). Lower right: Georeferenced photo taken on Oct 18, 2019 during a patrol by PLCN members. 20
Figure 14. Logging activities within a semi-deciduous forest in the eastern part of Prey Lang. Upper left: Sentinel-2 (Feb 15, 2019). Upper right: Sentinel-2 (Feb 25, 2020). Lower left: Sentinel-2 (Feb 25, 2020) with forest disturbances detected between January 2018 and February 2019 (blue) and between March 2019 and February 2020 (red). Lower right: Georeferenced photo taken on Nov 25, 2019 during a patrol by PLCN members. 21
Table 1: Confusion matrix in sample counts and area-weighted estimates of accuracy of the forest canopy disturbances obtained by the FCDM-radar approach for the period 2019 within the evergreen and semi-evergreen forest domain. OA is overall accuracy, UA is user accuracy, PA is producer accuracy, OM is omission error and CE is commission error. 22
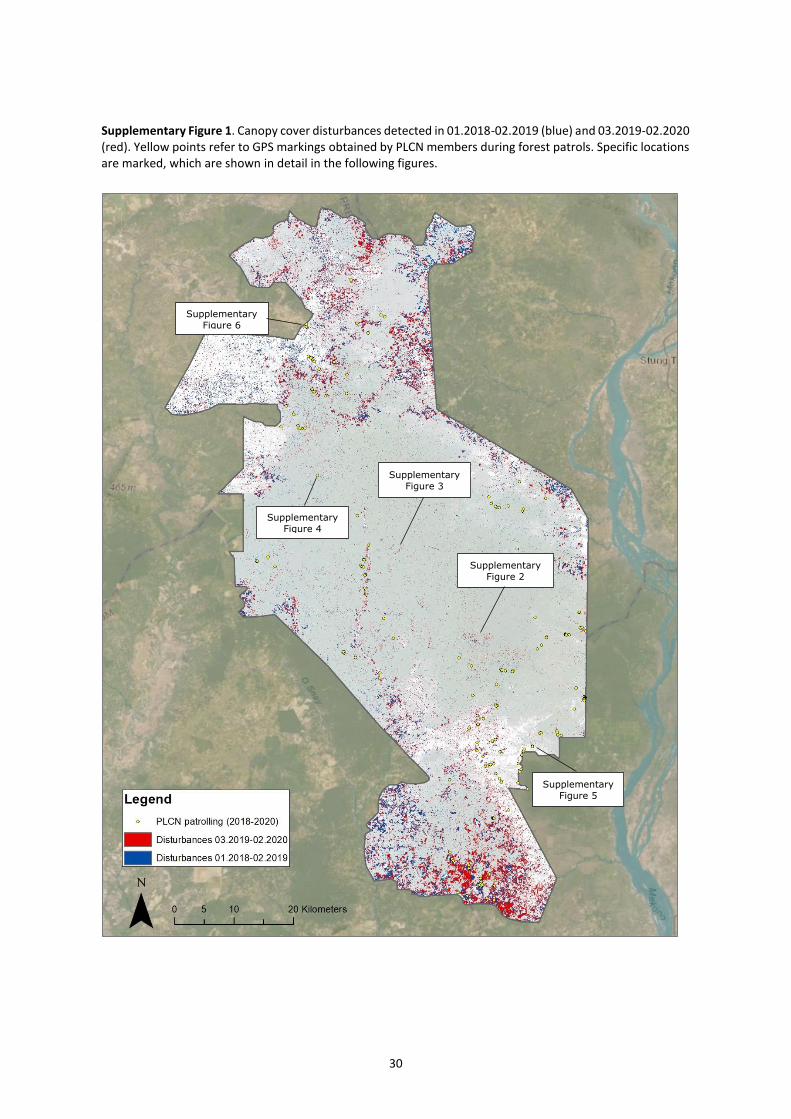
Supplementary Figure 1. Canopy cover disturbances detected in 01.2018-02.2019 (blue) and 03.2019-02.2020 (red). Yellow points refer to GPS markings obtained by PLCN members during forest patrols. Specific locations are marked, which are shown in detail in the following figures. 30
Supplementary Figure 2. Selective logging patterns within evergreen/semi-evergreen forests. Upper left: Sentinel-2 (2019-02-15). Upper right: Sentinel-2 (2019-02-15) with forest disturbances detected in 01.2018-02.2019 (blue). Lower left: Sentinel-2 (2020-02-25). Lower right: Sentinel-2 (2020-02-25) with forest disturbances detected in 03.2019-02.2020 (red). 31
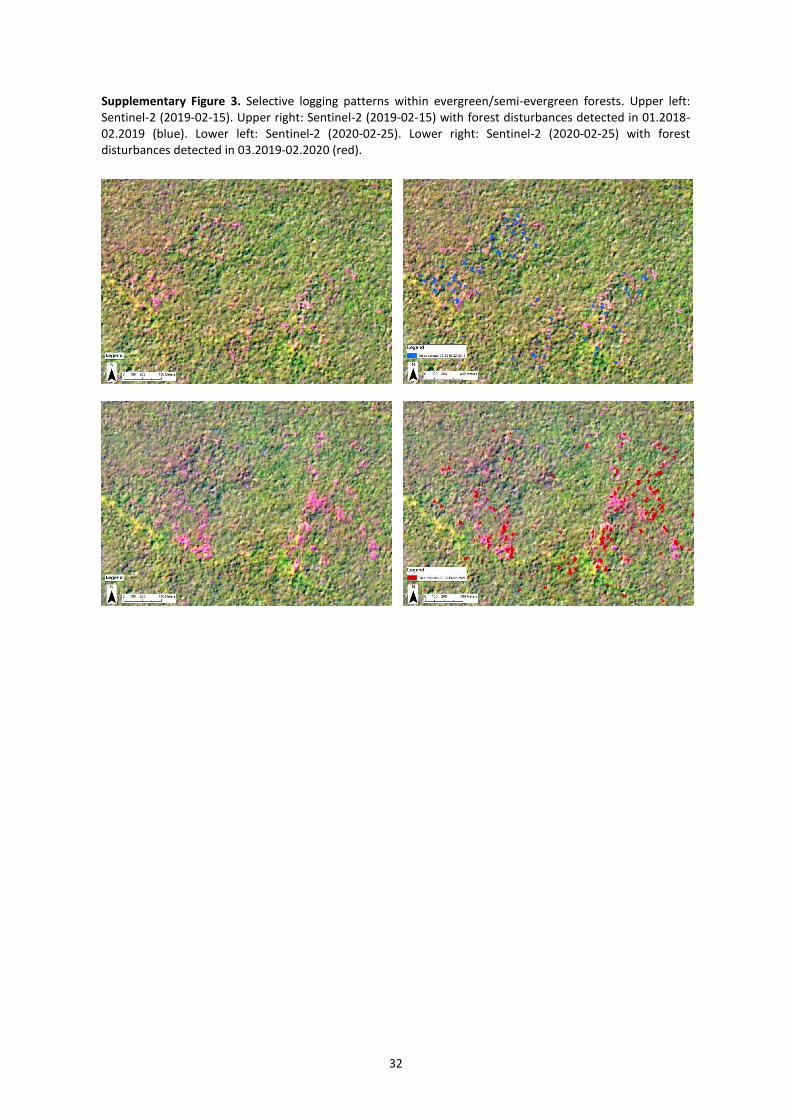
Supplementary Figure 3. Selective logging patterns within evergreen/semi-evergreen forests. Upper left: Sentinel-2 (2019-02-15). Upper right: Sentinel-2 (2019-02-15) with forest disturbances detected in 01.2018-02.2019 (blue). Lower left: Sentinel-2 (2020-02-25). Lower right: Sentinel-2 (2020-02-25) with forest disturbances detected in 03.2019-02.2020 (red). 32

27
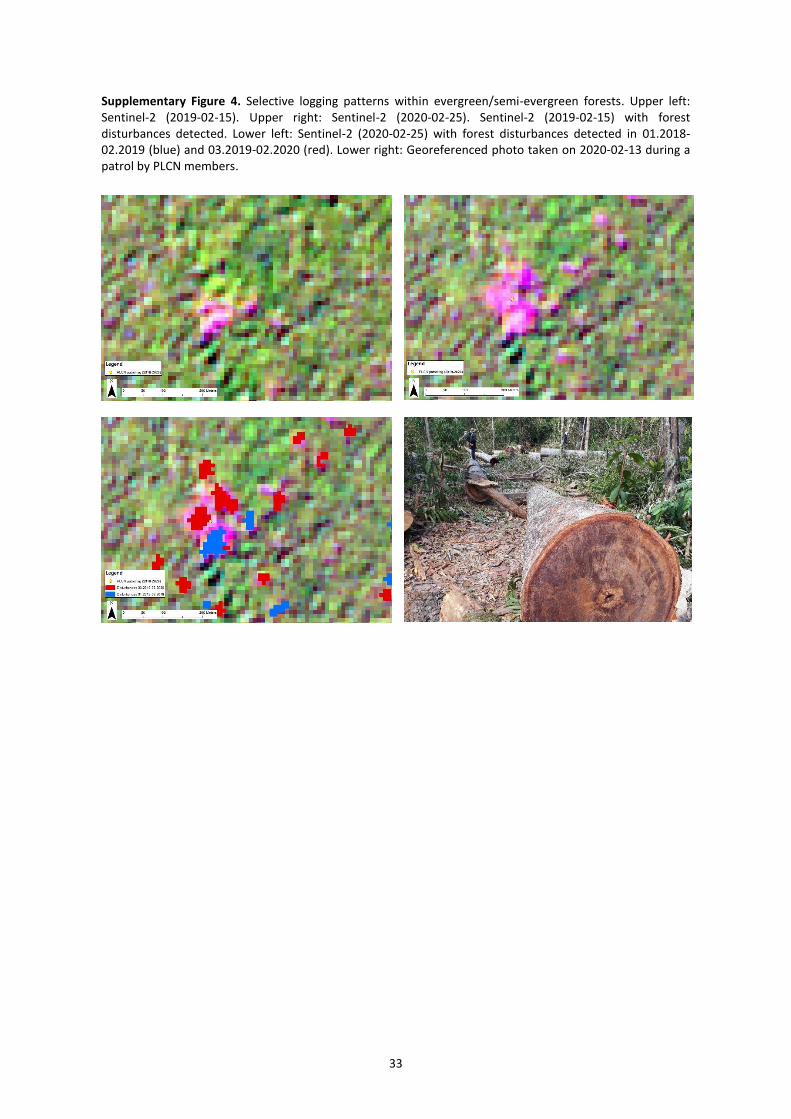
Supplementary Figure 4. Selective logging patterns within evergreen/semi-evergreen forests. Upper left: Sentinel-2 (2019-02-15). Upper right: Sentinel-2 (2020-02-25). Sentinel-2 (2019-02-15) with forest disturbances detected. Lower left: Sentinel-2 (2020-02-25) with forest disturbances detected in 01.2018-02.2019 (blue) and 03.2019-02.2020 (red). Lower right: Georeferenced photo taken on 2020-02-13 during a patrol by PLCN members. 33
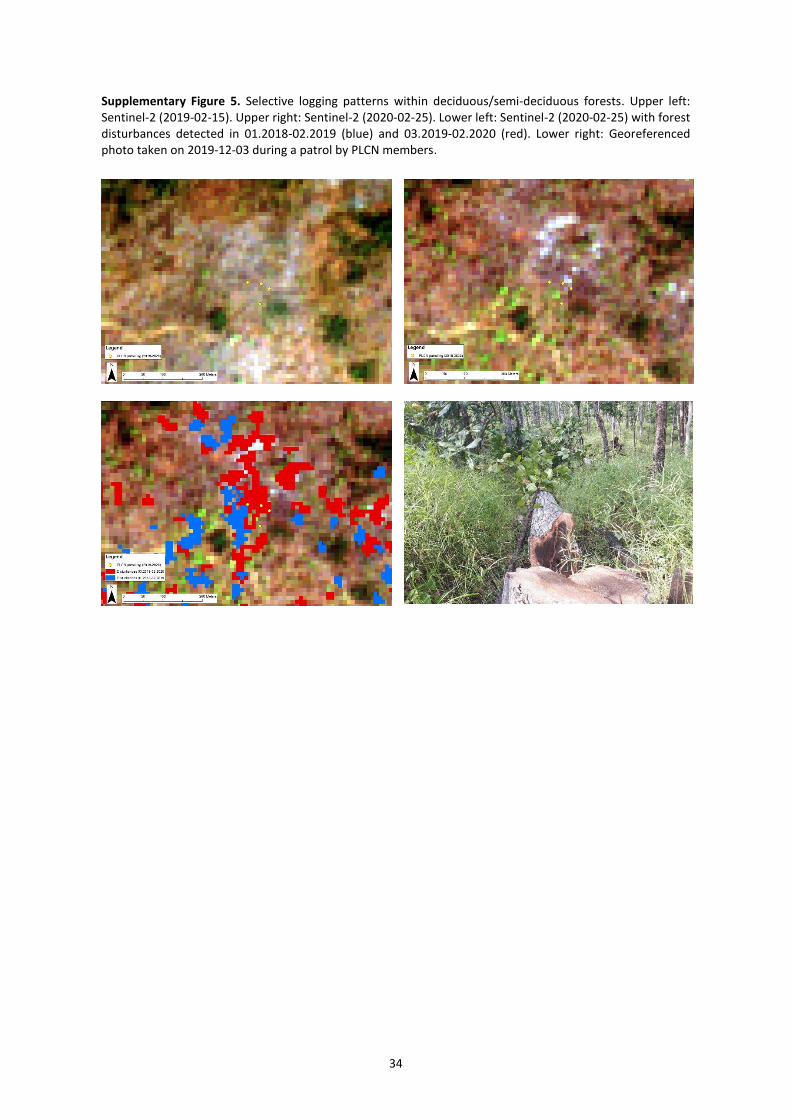
Supplementary Figure 5. Selective logging patterns within deciduous/semi-deciduous forests. Upper left: Sentinel-2 (2019-02-15). Upper right: Sentinel-2 (2020-02-25). Lower left: Sentinel-2 (2020-02-25) with forest disturbances detected in 01.2018-02.2019 (blue) and 03.2019-02.2020 (red). Lower right: Georeferenced photo taken on 2019-12-03 during a patrol by PLCN members. 34
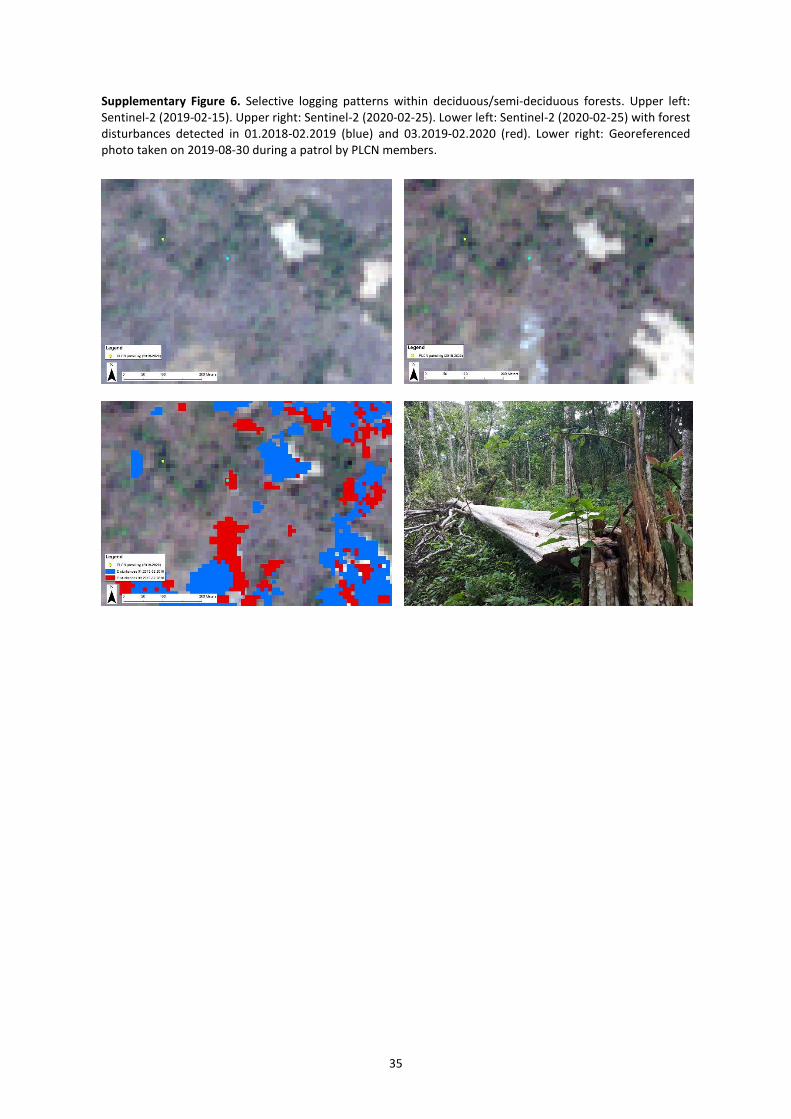
Supplementary Figure 6. Selective logging patterns within deciduous/semi-deciduous forests. Upper left: Sentinel-2 (2019-02-15). Upper right: Sentinel-2 (2020-02-25). Lower left: Sentinel-2 (2020-02-25) with forest disturbances detected in 01.2018-02.2019 (blue) and 03.2019-02.2020 (red). Lower right: Georeferenced photo taken on 2019-08-30 during a patrol by PLCN members. 35
28
List of tables
Table 1: Confusion matrix in sample counts and area-weighted estimates of accuracy of the forest canopy disturbances obtained by the FCDM-radar approach for the period 2019 within the evergreen and semi-evergreen forest domain. OA is overall accuracy, UA is user accuracy, PA is producer accuracy, OM is omission error and CE is commission error. 22
29
Supplementary Material
The supplementary material shows a collection of locations where the validity of the radar-based FCDM results is showcased by comparing to 10m Sentinel-2 data or georeferenced photos taken during forest patrols. This is to allow the reader to compare the spatial patterns visible in the satellite reference scenes and the FCDM results. For that purpose some figures display the satellite images in the visible bands (red, green, blue) and some in false color information (mid infrared, infrared, green) – depending on the forest type and the magnitude of the disturbance.
30
Supplementary Figure 1. Canopy cover disturbances detected in 01.2018-02.2019 (blue) and 03.2019-02.2020 (red). Yellow points refer to GPS markings obtained by PLCN members during forest patrols. Specific locations are marked, which are shown in detail in the following figures.
Supplementary
Figure 2
Supplementary
Figure 3
Supplementary
Figure 4
Supplementary
Figure 5
Supplementary
Figure 6

31
Supplementary Figure 2. Selective logging patterns within evergreen/semi-evergreen forests. Upper left: Sentinel-2 (2019-02-15). Upper right: Sentinel-2 (2019-02-15) with forest disturbances detected in 01.2018-02.2019 (blue). Lower left: Sentinel-2 (2020-02-25). Lower right: Sentinel-2 (2020-02-25) with forest disturbances detected in 03.2019-02.2020 (red).
32
Supplementary Figure 3. Selective logging patterns within evergreen/semi-evergreen forests. Upper left: Sentinel-2 (2019-02-15). Upper right: Sentinel-2 (2019-02-15) with forest disturbances detected in 01.2018-02.2019 (blue). Lower left: Sentinel-2 (2020-02-25). Lower right: Sentinel-2 (2020-02-25) with forest disturbances detected in 03.2019-02.2020 (red).
33
Supplementary Figure 4. Selective logging patterns within evergreen/semi-evergreen forests. Upper left: Sentinel-2 (2019-02-15). Upper right: Sentinel-2 (2020-02-25). Sentinel-2 (2019-02-15) with forest disturbances detected. Lower left: Sentinel-2 (2020-02-25) with forest disturbances detected in 01.2018-02.2019 (blue) and 03.2019-02.2020 (red). Lower right: Georeferenced photo taken on 2020-02-13 during a patrol by PLCN members.
34
Supplementary Figure 5. Selective logging patterns within deciduous/semi-deciduous forests. Upper left: Sentinel-2 (2019-02-15). Upper right: Sentinel-2 (2020-02-25). Lower left: Sentinel-2 (2020-02-25) with forest disturbances detected in 01.2018-02.2019 (blue) and 03.2019-02.2020 (red). Lower right: Georeferenced photo taken on 2019-12-03 during a patrol by PLCN members.
35
Supplementary Figure 6. Selective logging patterns within deciduous/semi-deciduous forests. Upper left: Sentinel-2 (2019-02-15). Upper right: Sentinel-2 (2020-02-25). Lower left: Sentinel-2 (2020-02-25) with forest disturbances detected in 01.2018-02.2019 (blue) and 03.2019-02.2020 (red). Lower right: Georeferenced photo taken on 2019-08-30 during a patrol by PLCN members.
GETTING IN TOUCH WITH THE EU
In person
All over the European Union there are hundreds of Europe Direct information centres. You can find the address of the centre nearest you at: https://europa.eu/european-union/contact_en
On the phone or by email
Europe Direct is a service that answers your questions about the European Union. You can contact this service:
- by freephone: 00 800 6 7 8 9 10 11 (certain operators may charge for these calls),
- at the following standard number: +32 22999696, or
- by electronic mail via: https://europa.eu/european-union/contact_en
FINDING INFORMATION ABOUT THE EU
Online
Information about the European Union in all the official languages of the EU is available on the Europa website at: https://europa.eu/european-union/index_en
EU publications
You can download or order free and priced EU publications from EU Bookshop at: https://publications.europa.eu/en/publications.
Multiple copies of free publications may be obtained by contacting Europe Direct or your local information centre (see https://europa.eu/european-union/contact_en).