Embed Size (px)
Citation preview

Received: 20 April 2017 Revised: 25 September 2017 Accepted: 13 December 2017
DOI: 10.1002/eco.1936
R E S E A R CH AR T I C L E
Forest composition effect on wildfire pattern and run‐offregime in a Mediterranean watershed
Noa Ohana‐Levi1 | Amir Givati2 | Tarin Paz‐Kagan1 | Arnon Karnieli1
1The Remote Sensing Laboratory, Jacob
Blaustein Institutes for Desert Research,
Ben‐Gurion University of the Negev, Sede
Boker Campus, Beersheba 84990, Israel
2 Israeli Hydrological Service, Israel Water
Authority, Jerusalem 91360, Israel
Correspondence
Arnon Karnieli, The Remote Sensing
Laboratory, Jacob Blaustein Institutes for
Desert Research, Ben‐Gurion University of the
Negev, Sede Boker Campus, Beersheba
84990, Israel.
Email: [email protected]
Funding information
European Union's Horizon 2020 Research and
Innovation Programme, Grant/Award Num-
bers: 654359 and 641762; Ministry of Science
and Technology via the Ramon Foundation,
Israel, Grant/Award Number: 3‐10673; IsraelWater Authority, Grant/Award Number:
4500686906
Ecohydrology. 2018;e1936.https://doi.org/10.1002/eco.1936
AbstractFire may alter land cover throughout the landscape and affect run‐off responses to rainfall events
in a burnt watershed. Therefore, the challenge is to understand the interactions between forest
composition and fire patterns in a karstic, Mediterranean watershed that affects the run‐off
regime. The aim of this research is to improve the understanding of the interactive effects of wild-
fire and land‐cover change on the rainfall–run‐off relationship in a first‐order watershed. To
achieve this goal, satellite imagery, official spatial data, and hydrological modelling were used to
study forest composition in relation to extreme fire and to simulate run‐off response for 2 rainfall
events. The results show that an extreme wildfire had a greater impact on planted forest, com-
posed mostly of pines, than on native species. Additionally, it was found that the land‐cover alter-
nation due to fire affected the run‐off regime and contributed to an increase in maximum
discharge and run‐off volume for the 2 rainfall events by ~39–47%. During the regeneration
period, the run‐off response for the 2 rainfall events decreased by ~7.7–9%.Wildfires may impact
the run‐off response more profoundly as the plantation of pine trees increases. A greater increase
in run‐off response may endanger infrastructure in terms of flooding and affect the population
well‐being. Watershed management in areas where afforestation is considered should focus on
planting native species that are less flammable rather than introducing combustible pines, thus
reducing the hydrologic impacts of land‐cover alteration due to wildfire, especially when climate
warms and wildfires become more frequent and intense.
KEYWORDS
forest fire, hydrological model, land‐cover change, remote sensing
1 | BACKGROUND
The number of forest fires in Mediterranean countries is constantly
growing as human activity increases and the climate changes (Jolly
et al., 2015; Wittenberg & Malkinson, 2009). These fires may change
watershed characteristics, for example, reducing vegetation cover and
increasing suspended sediment concentrations (Lane, Sheridan, &
Noske, 2006), resulting in altered hydrologic responses to a specific
precipitation regime (Moody & Martin, 2001). Land‐cover (LC) alter-
ation in a watershed, as a result of fire, may also lead to changes in
run‐off regime and amplify hydrological processes (Johansen,
Hakonson, & Breshears, 2001). In this regard, several mechanisms were
documented (Cydzik & Hogue, 2009; Moody & Martin, 2001; Soulis,
Dercas, & Valiantzas, 2012; Tessler, Wittenberg, Malkinson, &
Greenbaum, 2008; Wittenberg & Inbar, 2009; Woodsmith, Vache,
McDonnell, & Helvey, 2004), including (a) a decrease in canopy
wileyonlinelibrary.com/journal/eco
interception that increases the portion of rainfall available for run‐off;
(b) a decrease in the loss of water to evapotranspiration, causing an
increase in water availability for run‐off; and (c) an alteration of the
chemical and physical properties of the soil that are linked to water
repellency. The impacts of wildfire on the hydrological regime, due to
vegetation removal and regeneration of vegetation in Mediterranean
areas, may last 5 to 10 years after the fire (Bosch & Hewlett, 1982;
Wine & Cadol, 2016). The ecological recovery may also last several
years/decades (Haim & Izhaki, 1994; Ne'eman, Lahav, & Izhaki, 1995).
In addition to fire leading to reduction in the vegetative landscape,
other land‐cover changes (LCCs) can alter the hydrological response
within a watershed (Costa, Botta, & Cardille, 2003), such as urbaniza-
tion, afforestation, vegetation removal, and agricultural activities.
Representing spatial trends within burnt watersheds using
remotely sensed and geographic information system techniques has
been achieved in various ways, including expressing the spatial
Copyright © 2017 John Wiley & Sons, Ltd. 1 of 12

2 of 12 OHANA‐LEVI ET AL.
frequency, density, and intensity of fires (Tessler, 2012; Tessler et al.,
2011); focusing on fire scars and burnt versus unburnt areas (Fox
et al., 2016; Levin & Heimowitz, 2012); and using vegetation indices
(Leeuwen et al., 2010). However, the literature still lacks information
on postfire LCC interactions, including forest composition and species
distribution. Quantifications of the effects of fire‐induced LCC on rain-
fall–run‐off relations have been widely performed. Many studies used
local approaches, such as plots along slopes within the study sites, to
determine the effects of fire on run‐off (Lane et al., 2006; Wittenberg
& Inbar, 2009). Studies that considered the spatial patterns of the
watershed through classification of the landscape often used statisti-
cally based approaches to quantify the relations between spatial
changes due to fire and the affected run‐off (Soulis et al., 2012; Wine
& Cadol, 2016). Several studies used hydrological modelling tech-
niques but did not consider species composition and their distribution
throughout the landscape (Cydzik & Hogue, 2009). Despite these
efforts, very few studies used spatial representation and pattern anal-
ysis of the entire watershed, along with hydrological simulations, in
order to evaluate the run‐off response prefire, postfire, and during
the forest regeneration stages (Hallema et al., 2016; Rulli & Rosso,
2007). The current paper introduces an approach that includes both
a representation of the spatial pattern of forest composition and the
effect of the areal cover as a result of fire, as well as hydrological
modelling of the run‐off regime for three stages of the watershed: pre-
fire, postfire, and during regeneration.
Different hydrological models are used for quantifying the hydro-
logical effects of LCCs as a result of fire, such as Soil andWater Assess-
ment Tool (Goodrich et al., 2005), Regional Hydro‐Ecologic Simulation
System (Tague, Seaby, & Hope, 2009), and Hydrologic Engineering
Center's Hydrologic Modeling System (Papathanasiou, Alonistioti,
Kasella, Makropoulos, & Mimikou, 2012). All of them benefit from the
ability to input a wide range of parameters in order to simulate
hydrographs for a given surface. Similarly, the Weather Research and
Forecasting Hydro (WRF‐Hydro) model is a high‐resolution, event‐
based hydrological forecasting model that relies on forecasted or mea-
sured rainfall data as input to simulate the hydrological response to
the predicted weather. It was developed to facilitate the representation
of terrestrial hydrological processes related to the spatial redistribution
of surface, subsurface, and channel waters and to carry out the coupling
of hydrological models to atmospheric models. It has never been used
for simulating postfire effects on the run‐off regime. In the current
study, a local, uncoupled version of the WRF‐Hydro model (Givati,
Gochis, Rummler, & Kunstmann, 2016) was used to study the effect of
LCC and forest fire on run‐off response following a large rainfall event.
Mount Carmel, Israel, has experienced an increasing number of
wildfire events over the last three decades, resulting in hundreds of
small fire events and 10 fires that consumed areas of more than
100 ha, caused mainly by anthropogenic factors (Tessler et al., 2011).
An exceptional fire occurred on Mount Carmel, Israel, from December
2–6, 2010, covering an area of about 2,530 ha of natural forest and
shrubs, as well as planted pine forest. Its ignition was at the outskirts
of Carmel City along the higher elevations, caused by human activity,
and strong eastern winds extended the fire quickly (within an hour)
westwards, towards the forested slopes (Paz, Carmel, Jahashan, &
Shoshany, 2011). This fire was one of the largest fire events ever
recorded in Israel, causing the loss of 44 lives, along with infrastruc-
ture, and affecting ecological, biological, and hydrological processes
(Tessler, 2012). The current study focused on this wildfire's effects
on the run‐off response in the Oren Watershed, located within the
Carmel Forest. Approximately 38% of the forested landscape in this
watershed was burned during the fire (Tessler et al., 2011), constitut-
ing about 12% of the total watershed area. High run‐off discharge fol-
lowing fire events of this magnitude might affect the population
activities in the watershed, for example, agriculture, main roads, and
the quality of life of the few settlements throughout the watershed.
The hypotheses of the study were that with respect to the spread-
ing path of the fire, different forest compositions and species distribu-
tion patterns within the forest would respond differently to fire, having
an effect on the burning pattern and LCC within the watershed. Con-
sequently, the decrease in tree cover would lead to an increase in
run‐off response that would gradually return to the normal regime
after several years of the regeneration process. The aim was to
improve the understanding of the interactive effects of wildfire and
LCC on the rainfall–run‐off relationship in a first‐order watershed.
The specific objectives were (a) to assess changes in land cover
throughout the watershed by processing space‐borne images from
three key periods: before the wildfire occurred, shortly after the fire,
and after 2 years of the recovery process; (b) to analyse the patterns
and characteristics of the burnt area and assess their sensitivity to fire;
and (c) to simulate run‐off volume and discharge for different LC
statuses (prefire, postfire, and during the recovery process).
2 | METHODS
2.1 | Study area
Mount Carmel is located in northern Israel (Figure 1a) and was
declared by UNESCO as a biosphere reserve in 1996 (Frankenberg &
Cohen, 1996). The Carmel Forest covers an area of about 250 km2,
reaching an elevation of 546 m above mean sea level (Inbar, Tamir, &
Wittenberg, 1998). The lithology of the area is composed of carbonate
marine sedimentary rocks. The pedology includes terra rossa soils on
top of the hard limestone and dolomite rocks, whereas rendzina soils
cover the soft marl and chalk rocks (Tessler et al., 2008). The Carmel
area has a Mediterranean climate, with a long, dry summer season
and a rainy winter season between November and April. The mean
annual rainfall ranges between 550 mm along the coastal plain and
750 mm in the higher elevations (Inbar et al., 1998). The Oren Water-
shed is located in the Carmel Forest (Figure 1a), and its area is about
58 km2 (Figure 1b). A hydrometric station is located within the stream
and gauges a drainage area of about 25 km2 (Figure 1b). The dominant
flow regime in the Oren Watershed is flash floods, occurring during
heavy rainfall events. It has a steep topography and is drained by an
ephemeral mountain stream into the Mediterranean Sea. Mount
Carmel is a karstic environment, with substantial vertical losses during
rainfall events (Wittenberg, Kutiel, Greenbaum, & Inbar, 2007), depriv-
ing the stream network from consistent baseflow. The basin response
time, as well as total flow time, is short, and the specific peak dis-
charges are relatively low for a small Mediterranean watershed. This
is attributed to the landscape that is mostly composed of dense
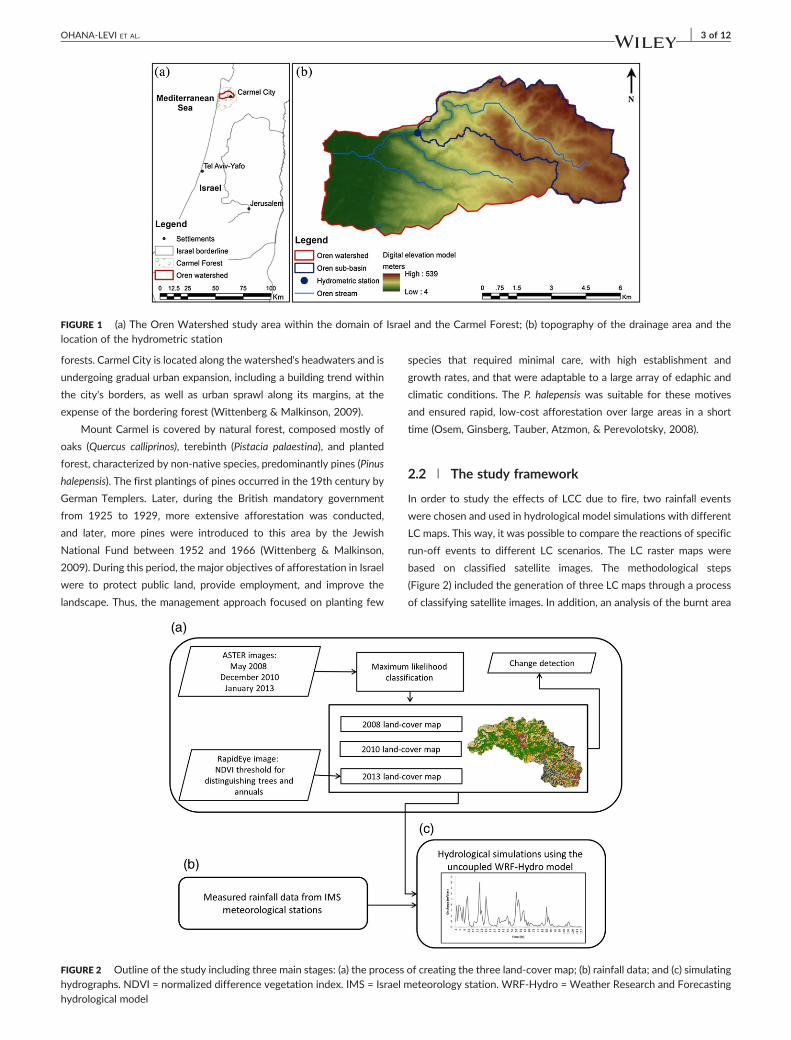
FIGURE 1 (a) The Oren Watershed study area within the domain of Israel and the Carmel Forest; (b) topography of the drainage area and thelocation of the hydrometric station
OHANA‐LEVI ET AL. 3 of 12
forests. Carmel City is located along the watershed's headwaters and is
undergoing gradual urban expansion, including a building trend within
the city's borders, as well as urban sprawl along its margins, at the
expense of the bordering forest (Wittenberg & Malkinson, 2009).
Mount Carmel is covered by natural forest, composed mostly of
oaks (Quercus calliprinos), terebinth (Pistacia palaestina), and planted
forest, characterized by non‐native species, predominantly pines (Pinus
halepensis). The first plantings of pines occurred in the 19th century by
German Templers. Later, during the British mandatory government
from 1925 to 1929, more extensive afforestation was conducted,
and later, more pines were introduced to this area by the Jewish
National Fund between 1952 and 1966 (Wittenberg & Malkinson,
2009). During this period, the major objectives of afforestation in Israel
were to protect public land, provide employment, and improve the
landscape. Thus, the management approach focused on planting few
FIGURE 2 Outline of the study including three main stages: (a) the processhydrographs. NDVI = normalized difference vegetation index. IMS = Israel mhydrological model
species that required minimal care, with high establishment and
growth rates, and that were adaptable to a large array of edaphic and
climatic conditions. The P. halepensis was suitable for these motives
and ensured rapid, low‐cost afforestation over large areas in a short
time (Osem, Ginsberg, Tauber, Atzmon, & Perevolotsky, 2008).
2.2 | The study framework
In order to study the effects of LCC due to fire, two rainfall events
were chosen and used in hydrological model simulations with different
LC maps. This way, it was possible to compare the reactions of specific
run‐off events to different LC scenarios. The LC raster maps were
based on classified satellite images. The methodological steps
(Figure 2) included the generation of three LC maps through a process
of classifying satellite images. In addition, an analysis of the burnt area
of creating the three land‐cover map; (b) rainfall data; and (c) simulatingeteorology station. WRF‐Hydro = Weather Research and Forecasting

4 of 12 OHANA‐LEVI ET AL.
in terms of LC types was conducted. The available rainfall data for the
hydrological year of 2012–2013 were analysed, and then, the hydro-
logical model was calibrated. Next, the model was simulated for two
selected rainfall events. The three LC maps were used as input layers
for the model run‐off simulations with each storm event, and the
run‐off simulations were analysed.
2.2.1 | LC maps
LC maps were derived through satellite imagery, acquired by the
Advanced Spaceborne Thermal Emission and Reflection Radiometer
(ASTER) sensor. The choice to use ASTER sensor images was based
on the sensor's high spatial resolution (15 m) while using nine visible
and near and shortwave infrared spectral bands (Abrams, Hook, &
Ramachandran, 2002). ASTER provided an image acquired on Decem-
ber 9, 2010, 3 days after the fire was extinguished, making it the best
option available. Two additional images were chosen to represent the
prefire and postfire stages from May 20, 2008 to January 15, 2013.
The three images went through atmospheric, topographic, and
radiometric corrections using the Atmospheric/Topographic Correc-
tion software (Richter, 2010) and followed by a geographic registra-
tion. An LC classification was applied, and each image was classified
into five different LC types, using a maximum likelihood supervised
classification technique (Ozesmi & Bauer, 2002), including built‐up
areas, forest, agricultural areas, annual vegetation, and bare soils. An
accuracy assessment procedure was performed, using the kappa coef-
ficient and an overall accuracy assessment (Foody, 2002). This proce-
dure was conducted using a manual comparison of 500 stratified
random points across each map to a 1‐m resolution orthophoto of
the area. The 2013 image posed a challenge. It was acquired 2 years
after the fire event and showed a large area covered with vegetation.
Because a 15‐m resolution is too coarse to distinguish between forest
and annual vegetation, a mosaic of RapidEye images, with a spatial res-
olution of 5 m, acquired on October 15 and 17, 2013, was created. The
normalized difference vegetation index (NDVI) was derived from the
red and near‐infrared reflectance ratio (Pettorelli et al., 2005) to mon-
itor the state of vegetative areas. The NDVI was applied to the
RapidEye mosaic and used a threshold of 0.42, based on other studies,
to distinguish between annual vegetation (0.42 < NDVI < 0.55) and
forest (NDVI > 0.55; Baldeck et al., 2014; Faroux et al., 2013; Leeuwen
et al., 2010). The area with an NDVI between 0.42 and 0.55 was con-
sidered to be covered by annual vegetation and was integrated into
the ASTER 2013 classified map. Finally, a basic analysis of LCC was
conducted by summing the number of pixels representing each of
the five classes for every image and comparing the three images to
analyse the LCCs.
2.2.2 | Cover types sensitive to fire
Survey of Israel and Israel Nature and Parks Authority maps were used
to assess the sensitivity of different vegetation categories to fire. First,
the burnt area was calculated by dividing the 2008 classification map by
the 2010 map to detect the pixels that underwent a change from forest
to the bare soil. Only the pixels that were located within the fire area
defined by Tessler et al. (2011) were considered as burnt area. Next,
the Survey of Israel land‐use map was used to calculate the percentage
of areal cover of each LC type within the Oren sub‐basin. The same cal-
culations were conducted only within the burnt area. This way, the rel-
ative areal cover of the different LC types in the whole sub‐basin with
the relative portion that these LC types occupied in the burnt area
could be compared. For the two most common vegetated LC types
(planted and natural forest), the density of the vegetation (high,
medium, low, and sparse) was analysed, using the Israel Nature and
Parks Authority's map of measured vegetation cover via remote sens-
ing. The areal cover percentage of the density categories of planted
and natural forest across the entire sub‐basin area was also compared.
2.2.3 | Rainfall events
The record shows that the winter season of 2012–2013, 2 years after
this fire, was characterized by both severe drought conditions prior to
the wet season and extreme flood events due to above normal precip-
itation. This was true in terms of the number of rain days, the rain inten-
sity, and the total rainfall amounts during several storm events, causing
unusually high discharge levels in most of the Carmel Forest's water-
sheds. The two rainfall events that were chosen for this study occurred
on December 20–21, 2012 and January 6–10, 2013. The first has a
recurrence time of almost every year; the second rainfall event has a
recurrence interval of 2.5% and is considered to be rare due to its dura-
tion of 5 days. Examining frequent and extreme rainfall events enabled
us to learn about the run‐off response to fire in both scenarios.
2.3 | Uncoupled WRF‐Hydro hydrological model
The uncoupled version of the WRF‐Hydro model was recently
adopted and calibrated by the Israel Water Authority (Givati et al.,
2016). It is a stand‐alone one‐way version of the original WRF‐Hydro
model designed by the National Center for Atmospheric Research.
The WRF‐Hydro extension package provides a framework for simulat-
ing surface run‐off, groundwater flow, and channel routing (Silver,
Karnieli, Ginat, Meiri, & Fredj, 2017). It allows for a multiscale repre-
sentation of terrestrial hydrological processes linked to the spatial
redistribution of surface, shallow subsurface, and channel water across
the terrain (Givati et al., 2016). The model provides multiple physics
options for surface overland flow, saturated subsurface flow, channel
routing, and baseflow dynamics. It relies on the Noah land surface
model for data such as topography, land cover, soil types with their rel-
evant soil moisture content, infiltration capacity excess, and hydraulic
conductivity (Yucel, Onen, Yilmaz, & Gochis, 2015). It is a flow model
that is aimed at simulating hydrographs for specific rainfall events. Ter-
rain routing and, subsequently, channel and reservoir routing functions
can be implemented into the one‐dimensional Noah land surface
model (Mitchell, 2005). Its design was motivated by the need to
account for increased complexity in land surface states and fluxes
and to provide stream channel discharge information for hydrometeo-
rological applications. The uncoupled WRF‐Hydro model that was
used in this study integrates the WRF meteorological model forecast-
ing technique or measured rainfall data from meteorological stations,
forcing these meteorological data into the hydro equations. Additional
spatial analyses were carried out using geographic information system
software (http://www.esri.com/products, 2016). The uncoupled

OHANA‐LEVI ET AL. 5 of 12
WRF‐Hydro model was designed to calculate both specific run‐off
values at locations along the watershed and a watershed hydrograph.
2.3.1 | The model structure and inputs
In this current study, the uncoupled WRF‐Hydro model based the cal-
culations on interpolation of the measured rainfall data. The following
input files are required: (a) a layer of the watershed(s) domain; (b) a soil‐
type raster map and an LC raster map, along with tabulated empirically
based run‐off coefficients for each soil type and LC type; (c) Manning
roughness coefficients and a hydraulic radius table, calculated for each
watershed; (d) slope, flow direction, and flow accumulation maps
derived from a digital elevation model (DEM); and (e) rain and soil
moisture, based on a calculation of soil moisture from accumulated
rainfall and slope values. Two major steps must be performed and
are specified in detail in Appendix A. The first step includes run‐off cal-
culation. The rainfall data, the run‐off coefficient table, the soil map,
the LC map, and the DEM products are used to derive a run‐off point
feature class and an accumulated rainfall point grid. During this step,
the outputs include a rainfall layer, in which each point is assigned rain-
fall and soil moisture values for each time step, as well as slope, LC, and
soil‐type values; the second product is a run‐off grid, in which dis-
charge values (m3/s) are assigned to every point in the grid for each
time step. The second step consists of hydrograph calculations. This
step accounts for the accumulated rainfall point grid, the Manning
roughness coefficients and the hydraulic radius table, and the DEM‐
derived files. The output is a velocity raster (see Appendix A for further
details). The velocity raster is then used to calculate the concentration
time to the outlet of the watershed. Together with the run‐off point
feature class, the watershed hydrograph is calculated.
2.3.2 | Uncoupled WRF‐Hydro calibration and simulation
The main parameters for calibrating the model include those for setting
the amount of surface water for a given volume of precipitation and
for determining the water movement from the slopes and channels
and consequently the hydrograph shape. The model allows a Manning
roughness coefficient to be set for each stream order in the domain.
The model's channel routing parameters are defined as functions of
stream order values. The routing parameters determine how fast water
moves across the terrain and into stream and river channels. The
rougher the surface, the longer it takes for water to reach the channels,
and slow water movement enables higher infiltration rates into the soil.
Eventually, the roughness parameter affects both the timing and the
amount of streamflow simulated by the model. Larger stream orders
towards the watershed outlet are characterized by lower Manning
roughness coefficients and increased water velocity and discharge in
the channels. The model contains a runoff coefficient table for over-
land flow as a function of various soils and land‐cover types.
Calibration of the model was conducted by comparing four simu-
lated storm events between 2012 and 2015 to measured run‐off dis-
charge and volume values. The percent difference between the
parameters (run‐off volume and peak discharge) of the in situ measured
run‐off against the simulated run‐off was calculated. If therewas a large
bias between the model results and the in situ measurements, a calibra-
tion procedure was performed by adjusting the run‐off coefficients.
Normalized root mean square errors (NRMSE) were also considered
for simulation performance evaluation (Ranatunga, Tong, & Yang,
2017). The Oren Hydrometric Station has been operational only since
2012; therefore, there was limited data available for calibration. The
January 2013 classification map was used for model calibration to rep-
resent the LC status at the time of the rainfall events used for calibra-
tion, and the measured rainfall data sets were used for the calibration
procedure. Because LCCs during this time period (after the fire event
and on) were rapid, and the landscape changed frequently, the calibra-
tion using the 2013 LC map could only be conducted with hydrological
events that occurred 2 years before or after 2013, so that the LC spatial
patterns were accounted for. The Oren Stream does not generate
medium–large flows very often, so for the time period that was deter-
mined for calibration considering the 2013 LC map, there were six rain-
fall events to rely on for calibration and validation. The uncoupled
WRF‐Hydro model was operated with two rainfall events from the
hydrological year of 2012–2013 (December 20–21, 2012 and January
6–10, 2013). Three different simulations were conducted for each rain-
fall event, each time using one of the three LC maps. This was
performed to understand how a certain rainfall event, together with
the three different LC stages of the watershed (prefire, postfire, and
regeneration), would affect the run‐off response. The hydrograph, peak
discharge, and run‐off volume results were then compared.
3 | RESULTS
3.1 | LC maps
The three LC maps that were derived from the ASTER satellite images
are presented in Figure 3. The largest changes between 2008 (Figure 3
a) and 2010 (Figure 3b) were a 24.1% increase in the rock and bare soil
class and a reduction of 25% in the forest LC. A slight increase in forest
areas (~5.8%) occurred between 2010 (Figure 3b) and 2013 (Figure 3
c). Moreover, in 2013, ~17% of the study area was covered by annual
vegetation. There was also a slight increase in the portion of urban area
out of the total area. In 2013, there was a larger portion of the area
covered by agricultural landscape, which was clustered in a specific
location (Figure 3c). This is due to the difference in seasonality
between the 2008 (acquired in May) image and the 2013 image
(acquired in January). Because no other satisfying data set was avail-
able from ASTER during wintertime between the years 2007 and
2009, this image was chosen, as it clearly represents the status of
the evergreen forest 2.5 years before the fire event. The accuracy
assessment results of the classification maps were satisfactory, with
~88–93% overall classification accuracy (Table 1).
3.2 | Burnt area analysis
The Oren sub‐basin covers an area of 24.17 km2, characterized mainly
by planted forest, mostly pines (43%; Figure 4). The LC type named “no
characteristic” is mostly composed of built‐up area and occupies 17%
of the sub‐basin area, as do the shrubs. Natural forest covers 9% of
the area, and the remaining LC types cover <6% (cultivated area, fallow
land, stony area, and orchards). The fire consumed an area mostly cov-
ered by continuous areas of planted forest, with patches of natural

FIGURE 3 The land‐cover maps for the three time periods that were studied: (a) May 2008, (b) December 2010, and (c) January 2013. Panel (d)qualitatively shows the relative areal cover of each land‐cover type in each year
TABLE 1 Accuracy assessment results for the three land‐cover maps
Land‐cover map Overall classification accuracy (%) Kappa statistic
2008 40.88 83.0
2010 58.89 84.0
2013 20.93 91.0
6 of 12 OHANA‐LEVI ET AL.
forest, shrubs, and cultivated land. The burnt area covered 5.93 km2,
which is 24.5% of the total sub‐basin. We calculated the areal cover
of the LC types that used to consume the area affected by the fire,
in order to determine the most sensitive LC cover types. The area
affected by the fire was also composed mostly of planted forest; this
LC type covered 80% of the burnt area before the fire. Shrubs occu-
pied 10% of the burnt area before the fire, and natural forest used to
FIGURE 4 Percent areal cover of differentland‐cover types. Light green bars representthe relative cover of the entire Oren sub‐basin, whereas dark green bars express theportion cover of the burnt area within the sub‐basin. The illustration on the upper‐left part ofthe figure shows the burnt area locationswithin the Oren sub‐basin

OHANA‐LEVI ET AL. 7 of 12
cover 6.9%. The other LC types each compose <1% of the burnt area.
Before the fire occurred, planted forest covered 43% of the total sub‐
basin but showed a very high sensitivity to fire with 80% of the burnt
area previously composed of planted forest. The “no characteristic” LC
(mostly urban area) covered 17% of the sub‐basin but showed a high
resistance to the fire event, constituting <1% of the burnt area. The
natural forest category showed lower flammability with 7% of this LC
type previously covering the burnt area, compared to 9% that covered
the entire sub‐basin area. The same goes for shrubs (10% of burnt area
vs. 17% of entire sub‐basin).
Medium density forest was the most sensitive to fire, in both
natural and planted forest, and occupied 56.85% and 47.44% of the
total burnt area, respectively; this is compared to 43.4% coverage of
medium density forest and shrubs in the entire sub‐basin area.
Medium‐high density planted forest was much more sensitive to fire
than medium‐high density natural forest, covering 42.07% (which is
above the cover percentage value of the entire sub‐basin: 34.71%)
and 16.24% of the total burnt area (about half the cover percentage
of the sub‐basin), respectively. In low‐medium density forest, natural
forest was more sensitive to fire, with 17.29% of the burnt area for this
category (and above the cover percentage value of the entire sub‐
basin: 12.97%), compared to only 7.04% of low‐medium density
planted forest burnt (below the sub‐basin's cover percentage). Com-
parison between the postfire and regeneration stages showed a large
increase in vegetation cover, mostly annuals (+17%) and forest cover
(+5.79%), and agricultural activity (+5.65%) attributed to the season
in which the satellite image was acquired.
3.3 | Hydrological modelling
The Oren Stream Hydrometric Station has been operational only since
2012; therefore, relatively few hydrological events were available for
calibration. Moreover, rainfall events with different rainfall (and run‐
off) magnitudes behave differently in terms of run‐off coefficients
and soil moisture, so a rough generalization was needed to comply
with all types of hydrological responses. Two run‐off events were used
for validation. For maximum discharge and run‐off volume, the average
errors were 34% and 22.5%, respectively. NRMSE varied between
0.77 and 1.44 m3/s, with more accurate hydrological simulations for
larger rainfall events than for smaller ones (Table 2).
Two rainfall events from the hydrological year of 2012–2013 were
chosen to simulate hydrographs that represent the effects ofwildfire on
the rainfall–run‐off relationship (Figure 5). They were simulated three
times using the uncoupled WRF‐Hydro model, and each simulation
TABLE 2 Rainfall events used for calibration and validation, along with thehydrometric station and NRMSE
Rainfall events bydates
Maximum discharge(m3/s)
Run‐o(10,00
Calibration December 20–21, 2012 12.28 2January 6–10, 2013 10.05 5January 30–31, 2013 2.5January 10–11, 2015 4.13
Validation December 12–14, 2013 1.7January 19–20, 2016 0.65
Note. NRSME = normalized root mean square error.
used a different LC map (Figure 3a–c). The measures of both peak dis-
charge and run‐off volume showed a large increase between the results
of the simulation using the 2008 LC image and the 2010 image
(between 39% and 47%). For the 2013 image simulations, the results
showed a decrease in both peak discharge and run‐off volume values
(between 7.7% and 9%). The large increase in the 2010 LC image is a
direct result of the wildfire event of December 2010 and the transition
of large portions of the watershed from forested to exposed rock and
bare soil (Figure 3). There was a moderate decrease in the discharge
and run‐off volume (Figure 5) for the 2013 LC image simulation. In terms
of run‐off magnitude, both run‐off events responded quite similarly to
the wildfire event. The December 20–21, 2012 event (recurrence time
of almost 1 year) showed larger increases in both maximum discharge
and run‐off volume values after the fire took place than did the extreme
event of January 6–10, 2013. Therewas also a greater decrease in these
values 2 years after the fire event (Figure 5).
4 | DISCUSSION
The effects of forest composition and species distribution on wildfire
were studied, as well as the impact of fire on LCC and rainfall–run‐
off relations during large rainfall events. The results show that during
the postfire stage, about 24% of forest cover was lost due to the
December 2010 fire in Mount Carmel, Israel. The main forest loss
occurred in areas covered by planted forest, specifically pines, which
composed 80% of the burnt area. More than half of the burnt area
was composed of medium density forest, making it the most sensitive
to fire. In addition, we studied the effect of wildfire on the run‐off
regime and found that during the postfire stage, maximum discharge
and run‐off volume values increased by 39–47% compared to prefire.
These results imply that prefire management practices had a significant
impact on postfire hydrological processes. As the annuals and forest
regenerated, the peak discharge decreased by up to 9%. Hydrological
responses to larger postfire rainfall events that last several days (in this
study, 5 days) generate fewer differences compared to prefire, possibly
because the variability of soil moisture is lower during most of the
hydrological event. Common events are more likely to have a greater
response to LCC due to fire.
In addition to causing LCC, wildfires are greatly affected by LC
spatial patterns and are usually the result of human disturbance and cli-
mate conditions (Paz et al., 2011; Wittenberg & Inbar, 2009). Their
effects on the watershed landscape are mostly immediate (Moody &
Martin, 2001). Uncontrolled wildfires may consume large areas,
ir run‐off volume and maximum discharge values, as measured by the
ff volume0 m3)
Maximum dischargepercent difference
Run‐off volumepercent difference NRMSE
9.26 −42.09 −43.77 0.783.82 −29.78 −19.93 1.017.49 58.13 31.22 1.264.11 3 76.6 1.03
7.97 −15.02 16.24 1.250.75 −52.94 −28.77 1.44

FIGURE 5 Simulated hydrographs for the two rainfall events: (a) December 20–21, 2012 and (b) January 6–10, 2013. The bar graphs on the rightshow the changes in peak discharge and run‐off volume between the studied time periods. lc = land‐cover
8 of 12 OHANA‐LEVI ET AL.
causing dramatic alterations in LC within hours/days. In the current
study, the LC maps demonstrate that about 24% of the research area
shifted from a forested landscape to bare soil due to the fire. Between
2008 and 2010, the peak discharge increased by 39–47% and the run‐
off volume by 39–44%. Forest fires continue to be a recurring phe-
nomenon in the Mediterranean basin and specifically in Israel. The
return interval of large fires (500 ha) in Mount Carmel is 17 years. Small
fires (5–10 ha) occur every year with a probability of 87% (Tessler,
2012). The December 2010 fire covered >2,500 ha in Mount Carmel
and caused the loss of 38% of the Oren Watershed's forest cover
(Tessler et al., 2011). These trends are expected to accelerate and have
a consequent effect on forest fires in terms of burnt areas and fre-
quency of events. Soulis et al. (2012) found that a watershed in which
90% of its area was burned experienced an increase of about 850% in
maximum peak flow in a postfire rainfall event. In a study conducted in
one of the Carmel Forest streams, located near the Oren Watershed,
Wittenberg and Inbar, (2009) reported an increase of two orders of
magnitude in run‐off yields in the first year after a fire (1989), followed
by winters in which decreasing amounts of run‐off were measured. A
study in California (Kinoshita & Hogue, 2015) demonstrated a sharp
increase in postfire discharge, and low flow seasons showed an ele-
vated run‐off ratio for up to 10 years following the fire.
On Mount Carmel, extensive afforestation processes and changes
in the landscape and forest composition during the past 100 years
have led to a large amount of planted trees within the forest, 50% of
which are P. halepensis. This species is presumed to have been rare in
the native communities in the past (Volcani, Karnieli, & Svoray, 2005;
Wittenberg & Malkinson, 2009). A study by Bosch and Hewlett
(1982) found that a reduction in coniferous cover was correlated to a
streamflow increase of about 40 mm in annual water yield per 10%
change in forest cover, making it the vegetation cover type causing
the greatest increase with its removal. Specifically on Mount Carmel,
it was reported that the planted Pinus forest was more susceptible to
fire, and fire severity was higher there (Tessler et al., 2011). These data
support the findings of higher sensitivity to fire in planted forest with
P. halepensis. Natural forest and shrubs were found to be more resis-
tant to fire. The Oren sub‐basin was covered by a large area of planted
forest before the December 2010 fire, turning these areas into a fire‐
sensitive environment. In addition, the results suggest that a medium
density forest is the most sensitive to fire. A medium‐high density
planted forest is far more flammable than a medium‐high density nat-
ural forest. However, in a low‐medium density forest, the natural for-
est was more sensitive to fire than the planted forest. The loss of
vegetation cover (planted and native) significantly altered the water-
shed conditions and run‐off response (Githui, Mutua, & Bauwens,
2010; White & Greer, 2006). The findings have important implications
for forest management and fire control in the Mediterranean region,
specifically regarding decision‐making processes related to the
types of trees that are being planted in light of afforestation policies
and objectives.
The study results show that the burnt area was composed mostly
of planted forest, primarily comprising P. halepensis, which is a fire‐sen-
sitive species, although its seeds are resistant to fire. In broad‐leaf spe-
cies, such as oaks and pistachio, the seeds are sensitive, but the burnt
trees easily regenerate from subsurface buds (Keesstra et al., 2017).
These differences in species traits will affect the forest recovery after

OHANA‐LEVI ET AL. 9 of 12
fire, as well as the forest structure and composition. In general, Medi-
terranean vegetation is fire‐adapted and is therefore highly resilient.
However, studies have shown that the relatively high fire frequency
on Mount Carmel has gradually shaped the landscape towards homo-
geneity in which shrubs are the dominant vegetation form (Tessler,
Wittenberg, & Greenbaum, 2016). Understanding such mechanisms
that affect LCC is essential for better predicting future fire regime
and vegetation patterns in fire‐sensitive areas, in order to adopt effi-
cient practices and means to mitigate future wildfire consequences in
similar Mediterranean regions.
The uncoupled WRF‐Hydro model can be used for operative ad
hoc forecasting and simulation, providing valuable information for
watershed management purposes. It is, therefore, a useful tool for
decision‐making processes in relevant time scales, as well as for
research purposes, such as those discussed in this paper. The calibra-
tion process was conducted with a small amount of rainfall events,
because the hydrometric station has been operational only since
2012. This is a major limitation in the study, and the model simulations
could have reached higher accuracy with a larger data set for calibra-
tion. Smaller and shorter rainfall events resulted in higher NRMSE
scores that express lower accuracy than for larger events.
Wittenberg and Malkinson (2009) proposed that the fire regime in
the Carmel region is a result of increasing human activities, including
afforestation and the introduction of non‐native trees to the area.
Increased numbers of the more flammable pine trees set the stage
for large‐scale fires. Large fire events may alter the hydrological regime
of the watershed within days and have a long‐term effect on the run‐
off regime in the watershed. In the case of the Oren Watershed, the
areas downstream are not densely populated and are mostly agricul-
tural. However, under similar events in more urbanized watersheds,
fire risk assessments should be considered during the planning
process, and afforestation methods, such as species type and forest
density, should be selected with an eye towards preventing severe
impacts on settlements and their well‐being (Paz et al., 2011). Major
forest fires in Mediterranean environments occur periodically, with
complex effects on hydrological, geomorphological, and ecological pro-
cesses, due to the complexity of the landscape structure and to differ-
ent responses of such systems to various LC types. Expected trends of
longer drought periods will increase the risk of fire, and the ongoing
trend of more extreme rainfall events creates the need to simulate
and evaluate the effects of LCC on the hydrological regime. Integrated
approaches that include forest composition, species distribution, and
hydrological processes in the landscape scale can improve manage-
ment and fire control in this Mediterranean region.
5 | SUMMARY AND CONCLUSIONS
The current study demonstrates the differences in the fire sensitivity
of planted and natural forest trees and the effects that one severe fire
had on the run‐off response on a watershed scale. An unusual season
of rainfall events during 2012–2013 provided the opportunity to
study the impacts of both a dramatic LCC caused by wildfire and a
rare rainfall event on the hydrological processes. It was found that
LC has changed dramatically due to the wildfire, leaving about 24%
of the areas that were covered by forest, bare and exposed. A planted
forest composed of pines is highly sensitive to fire, especially when its
density is medium or medium‐high. The LCCs led to a large alteration
in the run‐off response, with a peak discharge increase of ~39–47%
and a run‐off volume increase of ~39–44%. The vulnerability of this
area, along with increasing periods of dry spells and droughts in the
Mediterranean region, suggests that there is an expected increase in
future wildfires that may cause effects similar to the ones found in
this study. The results show that the first 2 years of regeneration
resulted in a decrease in maximum discharge (7.7–9%) and run‐off
volume (7.9–8.7%). As the forest goes through its succession process
of postfire recovery, it is expected that the rainfall–run‐off response
will continue to decrease, unless recurring fire events introduce addi-
tional disturbances to the ecosystem. High intensity rainfall events,
following the large impact of fire, may endanger both the well‐being
of the population and the infrastructure, as well as create an addi-
tional disturbance to the ecosystem in the form of high sediment
yields and nutrient loss.
ACKNOWLEDGEMENTS
This research was partly supported by the Israel Water Authority
(study number 4500686906); by the Ministry of Science and Technol-
ogy via the Ramon Foundation, Israel (contract 3‐10673); and by the
European Union's Horizon 2020 Research and Innovation Programme
under grant agreements 641762 (Ecopotential) and 654359 (eLTER).
We also would like to acknowledge the Jewish National Fund for their
support and contribution to this study. A special thanks to Natalya
Panov for her assistance and advice and to Dror Paz for his profes-
sional support regarding the WRF‐Hydro model.
ORCID
Noa Ohana‐Levi http://orcid.org/0000-0002-6909-7934
Arnon Karnieli http://orcid.org/0000-0001-8065-9793
REFERENCES
Abrams, M., Hook, S., & Ramachandran, B. (2002). ASTER user handbook,version 2: Advanced spaceborne thermal emission and reflection radi-ometer. Jet Propulsion Laboratory/California Institute of Technology.
Baldeck, C. A., Colgan, M. S., Feret, J. B., Levick, S. R., Martin, R. E., & Asner,G. P. (2014). Landscape‐scale variation in plant community compositionof an African savanna from airborne species. Ecological Applications,24(1), 84–93.
Bosch, J. M., & Hewlett, J. D. (1982). A review of catchment experiments todetermine the effect of vegetation changes on water yield and evapo-transpiration. Journal of Hydrology, 55, 3–23.
Costa, M. H., Botta, A., & Cardille, J. A. (2003). Effects of large‐scalechanges in land cover on the discharge of the Tocantins River, South-eastern Amazonia. Journal of Hydrology, 283(1–4), 206–217. https://doi.org/10.1016/S0022‐1694(03)00267‐1.
Cydzik, K., & Hogue, T. (2009). Modeling postfire response and recoveryusing the hydrologic engineering center hydrologic modeling system(HEC‐HMS). Journal of the American Water Resources Association,45(3), 702–714. https://doi.org/10.1111/j.1752‐1688.2009.00317.x.
Faroux, S., Tchuente, A. T. K., Roujean, J. L., Masson, V., Martin, E., &Moigne, P. L. (2013). ECOCLIMAP‐II/Europe: A twofold database ofecosystems and surface parameters at 1 km resolution based on satel-lite information for use in land surface, meteorological and climate

10 of 12 OHANA‐LEVI ET AL.
models. Geoscience Model Development, 6, 563–582. https://doi.org/10.5194/gmd‐6‐563‐2013.
Foody, G. M. (2002). Status of land cover classification accuracy assess-ment. Remote Sensing of Environment, 80(1), 185–201. https://doi.org/10.1016/S0034‐4257(01)00295‐4.
Fox, D. M., Laaroussi, Y., Malkinson, D., Maselli, F., Andrieu, J., Bottai, L., &Wittenberg, L. (2016). POSTFIRE: A model to map forest fire burn scarsand estimate runoff and soil erosion. Remote Sensing Applicaitons: Soci-ety and Environment, 4, 83–91.
Frankenberg, E., & Cohen, Y. (1996). The Carmel project: Declaring of theCarmel as a biosphere reserve. Ecology and Environment, 3, 121–126(in Hebrew).
Githui, F., Mutua, F., & Bauwens, W. (2010). Estimating the impacts of land‐cover change on runoff using the soil and water assessment tool(SWAT): Case study of Nzoia catchment, Kenya. Hydrological SciencesJournal, 54(5), 899–908. https://doi.org/10.1623/hysj.54.5.899.
Givati, A., Gochis, D. J., Rummler, T., & Kunstmann, H. (2016). Comparingone‐way and two‐way coupled hydrometeorological forecasting sys-tems for flood forecasting in the Mediterranean region. Hydrology,3(19). https://doi.org/10.3390/hydrology3020019.
Goodrich, D. C., Canfield, H. E., Burns, S., Semmens, D. J., Miller, S. N.,Hernandez, M., … Kepner, W. G. Rapid post‐fire hydrologic watershedassessment using the AGWA GIS‐based hydrologic modeling tool. InAmerican Society of Civil Engineers Watershed Management Confer-ence, Williamsburg, VA, USA, July 19–22, 2005 2005: AmericanSociety of Civil Engineers (ASCE)
Green, J. I., & Nelson, E. J. (2002). Calculation of time of concentration forhydrologic design and analysis using geographic information systemvector objects. Journal of Hydroinformatics, 4(2), 75–81.
Haim, A., & Izhaki, I. (1994). Changes in rodent community during recoveryfrom fire: Relevance to conservation. Biodiversity and Conservation, 3,573–585.
Hallema, D. W., Sun, G., Caldwell, P. V., Norman, S. P., Cohen, E. C., Liu, Y.,…McNulty, S. G. (2016). Assessment of wildland fire impacts on water-shed annual water yield: Analytical framework and case studies in theUnited States. Ecohydrology, 10. https://doi.org/10.1002/eco.1794.
http://www.esri.com/products (2016).
Inbar, M., Tamir, M., & Wittenberg, L. (1998). Runoff and erosion processesafter a forest fire in Mount Carmel, a Mediterranean area. Geomorphol-ogy, 24(1), 17–33. https://doi.org/10.1016/S0169‐555X(97)00098‐6.
Johansen, M. P., Hakonson, T. E., & Breshears, D. D. (2001). Post‐fire runoffand erosion from rainfall simulation: Contrasting forests withshrublands and grasslands. Hydrological Processes, 15(15), 2953–2965.https://doi.org/10.1002/hyp.384.
Jolly, W. M., Cochrane, M. A., Freeborn, P. H., Holden, Z. A., Brown, T. J.,Williamson, G. J., & Bowman, D. M. J. S. (2015). Climate‐induced varia-tions in global wildfire danger from 1979 to 2013. NatureCommunications, 6, 7537 (2015), doi:https://doi.org/10.1038/ncomms8537.
Keesstra, S., Wittenberg, L., Maroulis, j., Sambalino, F., Malkinson, D.,Cerda, A., & Pereira, P. (2017). The influence of fire history, plant spe-cies and post‐fire management on soil water repellency in aMediterranean catchment: The Mount Carmel range, Israel. Catena,149, 857–866. https://doi.org/10.1016/j.catena.2016.04.006.
Kinoshita, A. M., & Hogue, T. (2015). Increased dry season water yield inburned watersheds in Southern California. Environmental Research Let-ters, 10, 014003. https://doi.org/10.1088/1748‐9326/10/1/014003.
Lane, P. N. J., Sheridan, G. J., & Noske, P. J. (2006). Changes in sedimentloads and discharge from small mountain catchments following wildfirein south eastern Australia. Journal of Hydrology, 331, 495–510.
Leeuwen, W. J. D. v., Casady, G. M., Neary, D. G., Bautista, S., Alloza, J. A.,Carmel, Y., … Orr, B. J. (2010). Monitoring post‐wildfire vegetationresponse with remotely sensed time‐series data in Spain, USA andIsrael. International Journal of Wildland Fire, 19, 75–93.
Levin, N., & Heimowitz, A. (2012). Mapping spatial and temporal patterns ofMediterranean wildfires from MODIS. Remote Sensing of Environment,126, 12–26.
Mitchell, K. (2005). The community Noah land‐surface model (LSM): User'sguide public release version 2.7.1. Washington, D.C.: National Centerfor Environmental Prediction.
Moody, J. A., & Martin, D. A. (2001). Post‐fire, rainfall intensity‐peak dis-charge relations for three mountainous watersheds in the westernUSA. Hydrological Processes, 15, 2981–2993. https://doi.org/10.1002/hyp.386.
Ne'eman, G., Lahav, H., & Izhaki, I. (1995). Recovery of vegetation in a nat-ural east Mediterranean pine forest on Mount Carmel, Israel as affectedby management strategies. Forest Ecology and Management, 75, 17–26.
Osem, Y., Ginsberg, P., Tauber, I., Atzmon, N., & Perevolotsky, A. (2008).Sustainable management of Mediterranean planted coniferous forests:An Israeli definition. International Forestry, 106(1), 38–46.
Ozesmi, S. L., & Bauer, M. E. (2002). Satellite remote sensing of wetlands.Wetlands Ecology and Management, 10, 381–402. https://doi.org/10.1023/A:1020908432489.
Papathanasiou, C., Alonistioti, D., Kasella, A., Makropoulos, C., & Mimikou,M. (2012). The impact of forest fires on the vulnerability of peri‐urbancatchments to flood events (the case of the Eastern Attica region).Global Nest, 14(3), 294–302.
Paz, S., Carmel, Y., Jahashan, F., & Shoshany, M. (2011). Post‐fire analysis ofpre‐fire mapping of fire‐risk: A recent case study from Mt. Carmel(Israel). Forest Ecology and Management, 262, 1184–1188. https://doi.org/10.1016/j.foreco.2011.06.011.
Pettorelli, N., Vik, J. O., Mysterud, A., Gaillard, J.‐M., Tucker, J., & Stenseth,N. C. (2005). Using the satellite‐derived NDVI to assess ecologicalresponses to environmental change. Trends in Ecology & Evolution,20(9), 503–510. https://doi.org/10.1016/j.tree.2005.05.011.
Ranatunga, T., Tong, S. T. Y., & Yang, Y. J. (2017). An approach to measureparameter sensitivity in watershed hydrological modelling. HydrologicalSciences Journal 62(1) 76–92.
Richter, R. (2010). Atmospheric/topographic correction for satellite imagery,ATCOR‐2/3 user guide, version 1.7. Wessling, Germany: DLR‐GermanAerospace Center, remote sensing data center.
Rulli, M. C., & Rosso, R. (2007). Hydrologic response of upland catchmentsto wildfires. Advances in Water Resources, 30, 2072–2086. https://doi.org/10.1016/j.advwatres.2006.10.012.
Silver, M., Karnieli, A., Ginat, H., Meiri, E., & Fredj, E. (2017). An innovativemethod for determining hydrological calibration parameters for theWRF‐Hydro model in arid regions. Environmental Modelling & Software,91, 47–69.
Soulis, K. X., Dercas, N., & Valiantzas, J. D. (2012). Wildfires impact onhydrological response—The case of Lykorrema experimental water-shed. Global NEST Journal, 14(3), 303–310.
Tague, C., Seaby, L., & Hope, A. (2009). Modeling the eco‐hydrologicalresponse of a Mediterranean type ecosystem to the combined impactsof projected climate change and altered fire frequencies. ClimateChange, 93, 137–155.
Tessler, N. (2012). Documentation and analysis of wildfire regimes onMount Carmel and the Jerusalem hills. Themes in Israeli Geography (Spe-cial Issue of Horizons in Geography), 79‐80, 184–193.
Tessler, N., Elbaz, N., Kaplan, D., Shkedy, Y., Rosenberg, B., Cohen, E., …Greenbaum, N. (2011). Post fire management program after theDecember 2010 fire Mt. Carmel Forest, Israel.
Tessler, N., Wittenberg, L., & Greenbaum, N. (2016). Vegetation cover andspecies richness after recurrent forest fires in the Eastern Mediterra-nean ecosystem of Mount Carmel, Israel. Science of the TotalEnvironment, In press, doi:https://doi.org/10.1016/j.scitotenv.2016.02.113.
Tessler, N., Wittenberg, L., Malkinson, D., & Greenbaum, N. (2008). Fireeffects and short‐term changes in soil water repellency—Mt. Carmel,

OHANA‐LEVI ET AL. 11 of 12
Israel. Catena, 74, 185–191. https://doi.org/10.1016/j.catena.2008.03.002.
Volcani, A., Karnieli, A., & Svoray, T. (2005). The use of remote sensing andGIS for spatio‐temporal analysis of the physiological state of a semi‐aridforest with respect to drought years. Forest Ecology and Management,215(1), 239–250. https://doi.org/10.1016/j.foreco.2005.05.063.
White, M. D., & Greer, K. A. (2006). The effects of watershed urbanizationon the stream hydrology and riparian vegetation of Los PenasquitosCreek, California. Landscape and Urban Planning, 74(2), 125–138.https://doi.org/10.1016/j.landurbplan.2004.11.015.
Wine, M. L., & Cadol, D. (2016). Hydrologic effects of large southwesternUSA wildfires significantly increase regional water supply: Fact or fic-tion? Environmental Research Letters, 11(8), 085006.
Wittenberg, L., & Inbar, M. (2009). The role of fire disturbance on runoffand erosion processes—A long‐term approach, Mt. Carmel case study,Israel. Geographical Research, 41(1), 46–56. https://doi.org/10.1111/j.1745‐5871.2008.00554.x.
Wittenberg, L., Kutiel, H., Greenbaum, N., & Inbar, M. (2007). Short‐termchanges in the magnitude, frequency and temporal distribution offloods in the Eastern Mediterranean region during the last 45 years—Nahal Oren, Mt. Carmel, Israel. Geomorphology, 84, 181–191. https://doi.org/10.1016/j.geomorph.2006.01.046.
Wittenberg, L., & Malkinson, D. (2009). Spatio‐temporal perspectives offorest fires regimes in a maturing Mediterranean mixed pine landscape.European Journal of Forest Research, 128(297), 297–304. https://doi.org/10.1007/s10342‐009‐0265‐7.
Woodsmith, R. D., Vache, K. B., McDonnell, J. J., & Helvey, J. D. (2004).Entiat experimental forest: Catchment‐scale runoff data before andafter a 1970 wildfire. Water Resources Research, 40(11). https://doi.org/10.1029/2004WR003296.
Yucel, I., Onen, A., Yilmaz, K. K., & Gochis, D. J. (2015). Calibration and eval-uation of a flood forecasting system: Utility of numerical weatherprediction model, data assimilation and satellite‐based rainfall. Journalof Hydrology, 523, 49–66.
How to cite this article: Ohana‐Levi N, Givati A, Paz‐KaganT,
Karnieli A. Forest composition effect on wildfire pattern and
run‐off regime in a Mediterranean watershed. Ecohydrology.
2018;e1936. https://doi.org/10.1002/eco.1936
TABLE A1 Example of run‐off coefficient table
SG LU MCLOW MCUP RCLOW RCMID RCUP
A 2 0.25 0.3 0.02 0.05 0.1
A 1 0.25 0.3 0.05 0.08 0.12
A 7 0.25 0.3 0.05 0.08 0.12
A 5 0.25 0.3 0.02 0.04 0.07
A 6 0.25 0.3 0.02 0.04 0.07
A 8 0.25 0.3 0.06 0.1 0.2
A 4 0.25 0.3 0.03 0.08 0.11
A 9 0.25 0.3 0.06 0.1 0.2
B 2 0.25 0.3 0.05 0.08 0.12
B 1 0.25 0.3 0.05 0.1 0.15
B 7 0.25 0.3 0.05 0.1 0.15
B 5 0.25 0.3 0.05 0.06 0.07
Note. LU = land‐cover type; MCLOW = minimal value of soil moisture;MCUP = maximal value of soil moisture; RCLOW = minimal value of run‐off; RCMID = value between maximal and minimal run‐off values;RCUP = maximal value of run‐off; SG = soil type.
APPENDIX A
UNCOUPLED WEATHER RESEARCH ANDFORECASTING HYDRO EQUATIONS
A.1 | Inputs for model simulations (run‐off amounts androuting):
• a polygon shapefile of the watershed domain;
• slopes raster (%);
• flow direction raster;
• flow accumulation raster;
• soil‐type shapefile;
• land‐cover shapefile;
• a table of run‐off coefficients for specific soils and land‐cover
types;
• a table of Manning coefficients and hydraulic radius for different
parts of the watershed.
A.2 | Run‐off calculations
A.2.1 | Run‐off volume calculation—for run‐off volume
created in time step i in location j:
Flowij ¼ Rij*Cij
� �0:87*A; (1)
where
• Rij is the rainfall during time step i in location j (as provided in the
input file);
• Cij is the run‐off coefficient in time step i in location j (calculated);
• A is the pixel area in the raster.
A.2.2 | Determining the run‐off coefficient:
Cij ¼ f ∑ii¼1toi Rij; Sj;Mij
� �; (2)
where
• Mij is soil moisture in time step i in location j (input file);
• Sj is the soil type in location j (input file).
Run‐off coefficient is calculated during each time step and is
dynamic throughout the storm (Table A1).
A1.3 | Hydrograph calculations
A.3.1 | Flow velocity and concentration time
To calculate the hydrograph, first, the velocity should be calculated
(Green & Nelson, 2002). According to the velocity, concentration time
(the time it takes for water to flow from a certain location in the water-
shed to its outlet) is then calculated.

TABLE A2 Roughness coefficients and hydraulic radius for flow inslopes
ML MP HRL HRP
0.15 0.12 0.002 0.005
Note. HRL = hydraulic radius for accumulated rainfall of up to 30 mm;HRP = hydraulic radius for accumulated rainfall of over 30 mm; ML = Man-ning coefficient for accumulated rainfall of up to 30 mm; MP = Manningcoefficient for accumulated rainfall of over 30 mm.
TABLE A3 Calculations of hydraulic radius and manning coefficientaccording to slope and rainfall accumulation
BasID M_up M_down HRL HRM HRP
64 0.045 0.04 0.15 0.7 1.4
2 0.045 0.035 0.1 0.3 0.5
3 0.035 0.055 0.1 0.3 0.5
4 0.045 0.03 0.1 0.6 1
5 0.045 0.035 0.1 0.5 1.2
169 0.045 0.03 0.2 0.7 1.4
8 0.04 0.03 0.1 0.5 1.2
183 0.05 0.035 0.1 0.4 1
12 of 12 OHANA‐LEVI ET AL.
V ¼ R0:66*S0:5
n; (3)
where
• V is water velocity (m/s);
• R is the hydraulic radium (m);
• S is slope;
• n is Manning coefficient (surface roughness).
Flow velocity is calculated separately for slopes and channels:
T ¼ L3;600*V
; (4)
where
• T is concentration time (hr);
• L is the length of flow path (m), extracted from the flow direction
input raster.
11 0.045 0.035 0.1 0.5 0.8Note. BasID = watershed's ID number; HRL = hydraulic radius (R) for accu-mulated rainfall of up to 30 mm; HRM = hydraulic radius (R) for accumu-lated rainfall between 30 and 50 mm; HRP = hydraulic radius (R) foraccumulated rainfall of over 50 mm; M_up = Manning coefficient (n) forslopes >2%; M_down = Manning coefficient (n) for slopes <2%.
A.3.2 | Flow velocity calculations for slopes and channels
For slopes, the calculation is based on general and uniform parameters
for the area of Israel, and for channel calculations, the parameters are
unique for each watershed.
• Flow velocity calculation for slopes:
Manning coefficients and hydraulic radius are divided according to
Table A2.
• Flow velocity calculation for channels:
Once run‐off reaches the channels, the calculations will be accord-
ing to Equations 3 and 4, where R and n will change according to slope
and rainfall accumulation, as specified in Table A3.
A.3.3 | Hydrograph calculations
Time calculation: The total time of channel flow will be the sum of time
intervals calculated according to Equation 3 in the slopes and channels.
For each location in the watershed, a time grid is calculated and states
the hours it takes for water to flow to the pour point of the watershed.
Volume calculation: According to the time grid calculations, the
area that flows during each hour is known. This area multiplied by
the run‐off (mm) will provide the hourly volume. The division of the
volume by time will provide the discharge (m3/s) and the accumulated
volume (m3).