Embed Size (px)
Citation preview

-Forest Basics- U.S. Forest Trends
Adapted from the on-line Teachers Guide http://mff.dsisd.net
1

2

U.S. FOREST FACTS AND HISTORICAL TRENDS Introduction The 2000 Renewable Resources Planning Act Assessment (2000 RPA Assessment) is the fourth assessment prepared in response to the mandate in the Forest and Rangeland Renewable Resources Planning Act of 1974, P.L. 93-378, 88 Stat. 475, as amended (RPA). The 2000 RPA Assessment consists of a summary report and supporting documents. Renewable resources in this assessment include outdoor recreation, fish and wildlife, wilderness, timber, water, range, and minerals. In addition, and for the first time, there is an assessment of the urban forest resource. Data presented in this brochure highlight the findings of the 2000 RPA assessment regarding forest resource statistics: reserved forest land, timber land, forest landownership, forest composition, mortality, growth and removals, tree planting, products made from timber, and urban influences on forest land area. Regional data are reported geographically as North, South, and West. Forest Inventory Various attributes of the forest resource are inventoried by the U.S. Department of Agriculture Forest Service (USDA Forest Service) Forest Inventory and Analysis (FIA) Program and reported in the RPA Assessment and various supporting documents. To provide timely, scientifically reliable estimates of the status, condition, and trends of the Nation’s forests, the FIA has conducted field inventories for more than 70 years using state-of-the-art technology. These inventories have provided critical information in the development and implementation of policies and practices that support sustainable forestry in the United States. Seven national reports based on FIA data have been produced since 1953. Extensive field measurement from FIA inventories include over: • 4.5 million remote sensing plots interpreted for land use • 125,000 permanent field plots systematically located across all forest lands in the
United States
1
• 100 characteristics measured at each plot location • 1.5 million trees measured to evaluate volume, condition, and vigor • Additional information about FIA may be found at
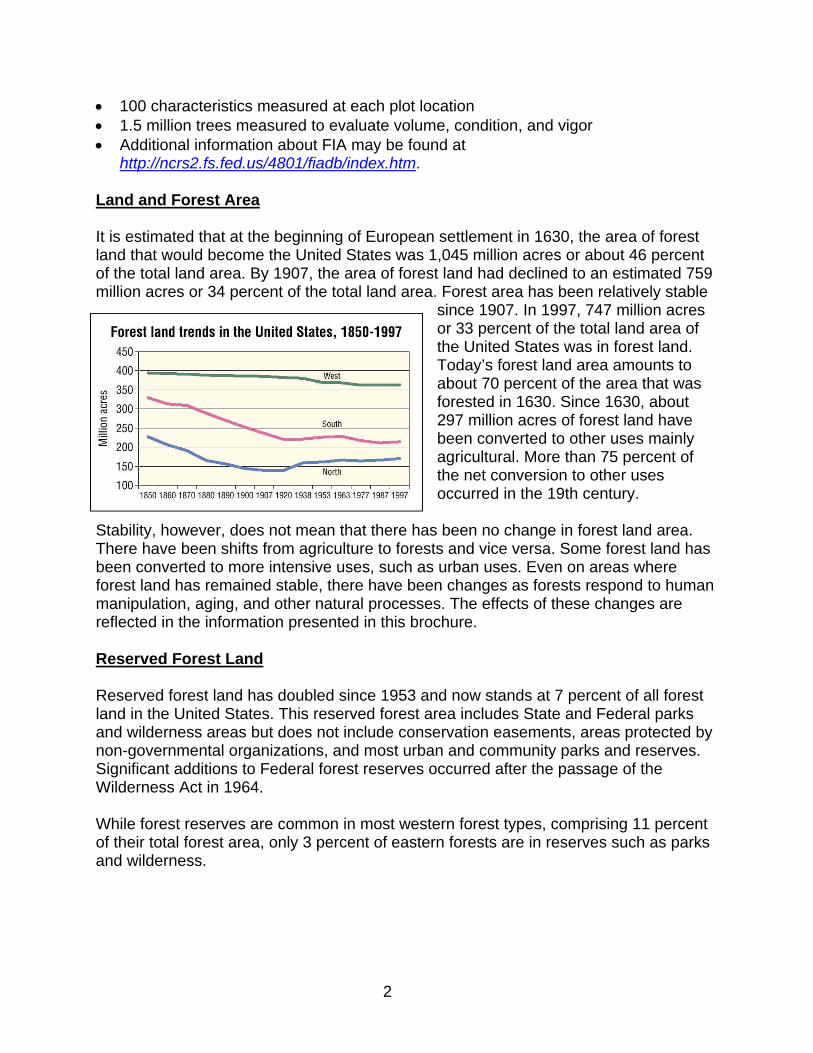
http://ncrs2.fs.fed.us/4801/fiadb/index.htm. Land and Forest Area It is estimated that at the beginning of European settlement in 1630, the area of forest land that would become the United States was 1,045 million acres or about 46 percent of the total land area. By 1907, the area of forest land had declined to an estimated 759 million acres or 34 percent of the total land area. Forest area has been relatively stable
since 1907. In 1997, 747 million acres or 33 percent of the total land area of the United States was in forest land. Today’s forest land area amounts to about 70 percent of the area that was forested in 1630. Since 1630, about 297 million acres of forest land have been converted to other uses mainly agricultural. More than 75 percent of the net conversion to other uses occurred in the 19th century.
Stability, however, does not mean that there has been no change in forest land area. There have been shifts from agriculture to forests and vice versa. Some forest land has been converted to more intensive uses, such as urban uses. Even on areas where forest land has remained stable, there have been changes as forests respond to human manipulation, aging, and other natural processes. The effects of these changes are reflected in the information presented in this brochure. Reserved Forest Land Reserved forest land has doubled since 1953 and now stands at 7 percent of all forest land in the United States. This reserved forest area includes State and Federal parks and wilderness areas but does not include conservation easements, areas protected by non-governmental organizations, and most urban and community parks and reserves. Significant additions to Federal forest reserves occurred after the passage of the Wilderness Act in 1964. While forest reserves are common in most western forest types, comprising 11 percent of their total forest area, only 3 percent of eastern forests are in reserves such as parks and wilderness.
2
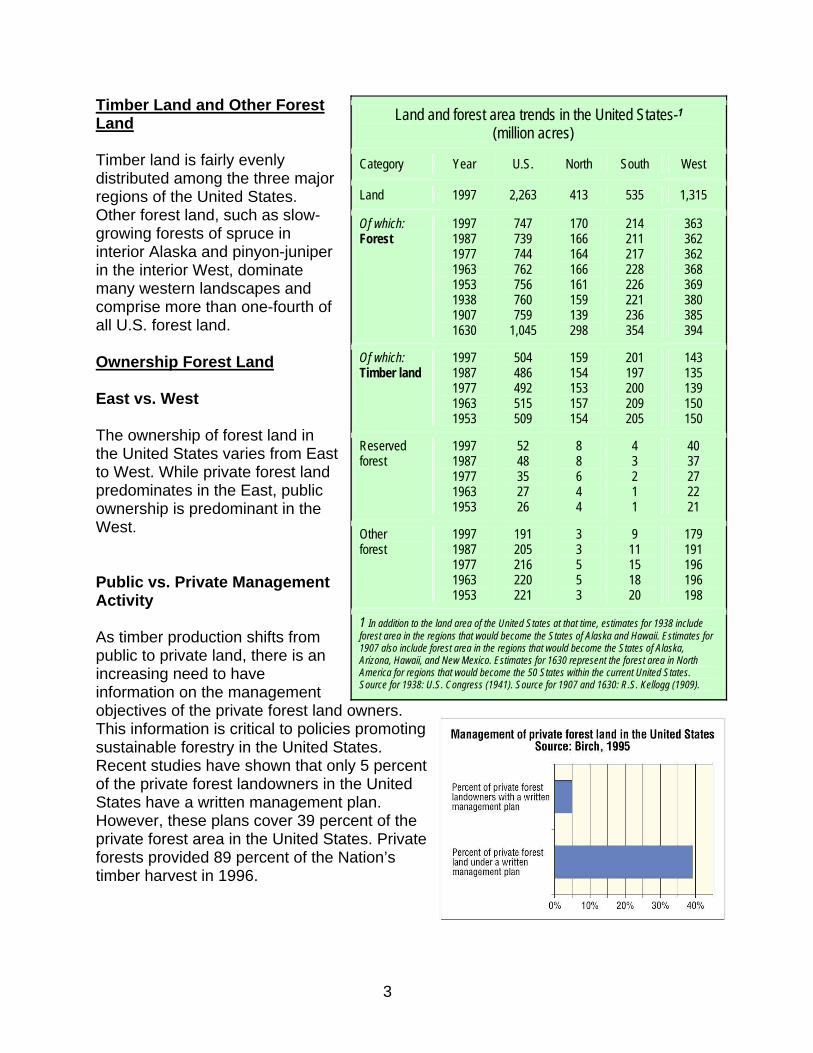
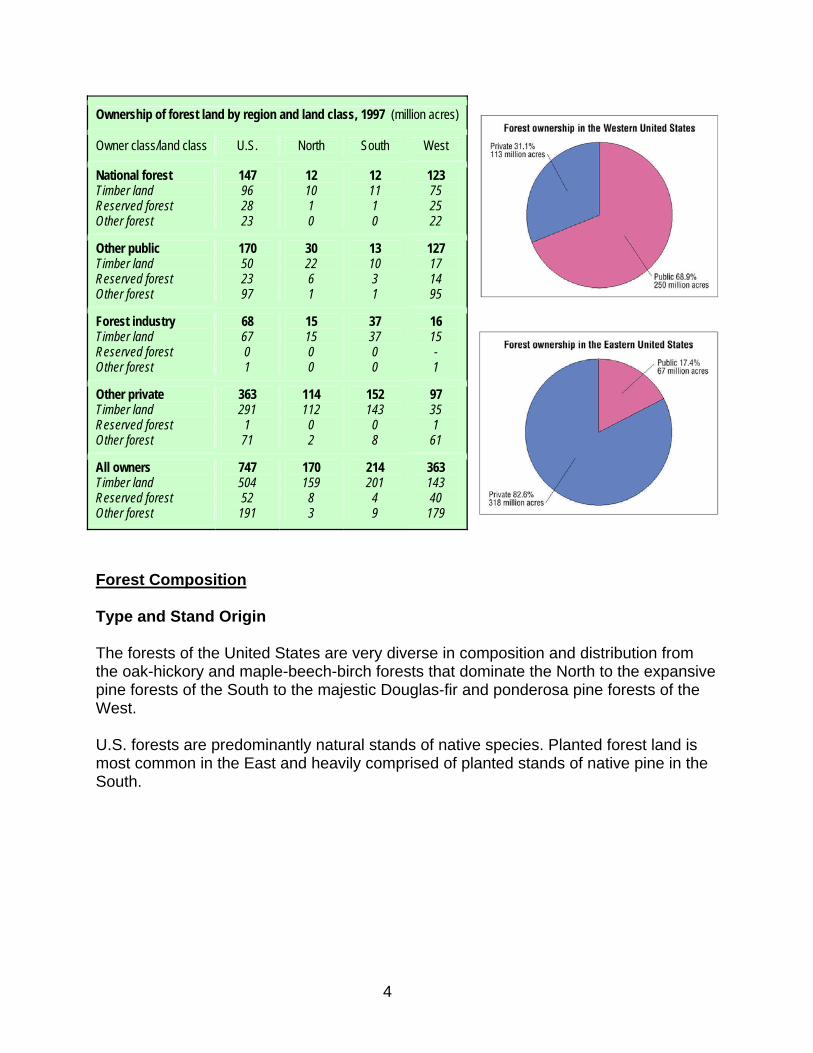
Timber Land and Other Forest Land Timber land is fairly evenly distributed among the three major regions of the United States. Other forest land, such as slow-growing forests of spruce in interior Alaska and pinyon-juniper in the interior West, dominate many western landscapes and comprise more than one-fourth of all U.S. forest land. Ownership Forest Land East vs. West The ownership of forest land in the United States varies from East to West. While private forest land predominates in the East, public ownership is predominant in the West. Public vs. Private Management Activity As timber production shifts from public to private land, there is an increasing need to have information on the management objectives of the private forest land owners. This information is critical to policies promoting sustainable forestry in the United States. Recent studies have shown that only 5 pof the private forest landowners in the United States have a written management plan. However, these plans cover 39 percent of the private forest area in the United States. Privateforests provided 89 percent of the Nation’stimber harvest in 1996.
Land and forest area trends in the United States-1 (million acres)
Category Year U.S. North South West
Land 1997 2,263 413 535 1,315
Of which: Forest
1997 1987 1977 1963 1953 1938 1907 1630
747 739 744 762 756 760 759
1,045
170 166 164 166 161 159 139 298
214 211 217 228 226 221 236 354
363 362 362 368 369 380 385 394
Of which: Timber land
1997 1987 1977 1963 1953
504 486 492 515 509
159 154 153 157 154
201 197 200 209 205
143 135 139 150 150
Reserved forest
1997 1987 1977 1963 1953
52 48 35 27 26
8 8 6 4 4
4 3 2 1 1
40 37 27 22 21
Other forest
1997 1987 1977 1963 1953
191 205 216 220 221
3 3 5 5 3
9 11 15 18 20
179 191 196 196 198
1 In addition to the land area of the United States at that time, estimates for 1938 include forest area in the regions that would become the States of Alaska and Hawaii. Estimates for 1907 also include forest area in the regions that would become the States of Alaska, Arizona, Hawaii, and New Mexico. Estimates for 1630 represent the forest area in North America for regions that would become the 50 States within the current United States. Source for 1938: U.S. Congress (1941). Source for 1907 and 1630: R.S. Kellogg (1909).
ercent
3
orest Composition
Ownership of forest land by region and land class, 1997 (million acres)
Owner class/land class U.S. North South West
National forest Timber land Reserved forest Other forest
147 96 28 23
12 10 1 0
12 11 1 0
123 75 25 22
Other public Timber land Reserved forest Other forest
170 50 23 97
30 22 6 1
13 10 3 1
127 17 14 95
Forest industry Timber land Reserved forest Other forest
68 67 0 1
15 15 0 0
37 37 0 0
16 15 - 1
Other private Timber land Reserved forest Other forest
363 291 1 71
114 112 0 2
152 143 0 8
97 35 1 61
All owners Timber land Reserved forest Other forest
747 504 52 191
170 159 8 3
214 201 4 9
363 143 40 179
F
ype and Stand Origin
he forests of the United States are very diverse in composition and distribution from e
.S. forests are predominantly natural stands of native species. Planted forest land is
T Tthe oak-hickory and maple-beech-birch forests that dominate the North to the expansivpine forests of the South to the majestic Douglas-fir and ponderosa pine forests of the West. Umost common in the East and heavily comprised of planted stands of native pine in theSouth.
4
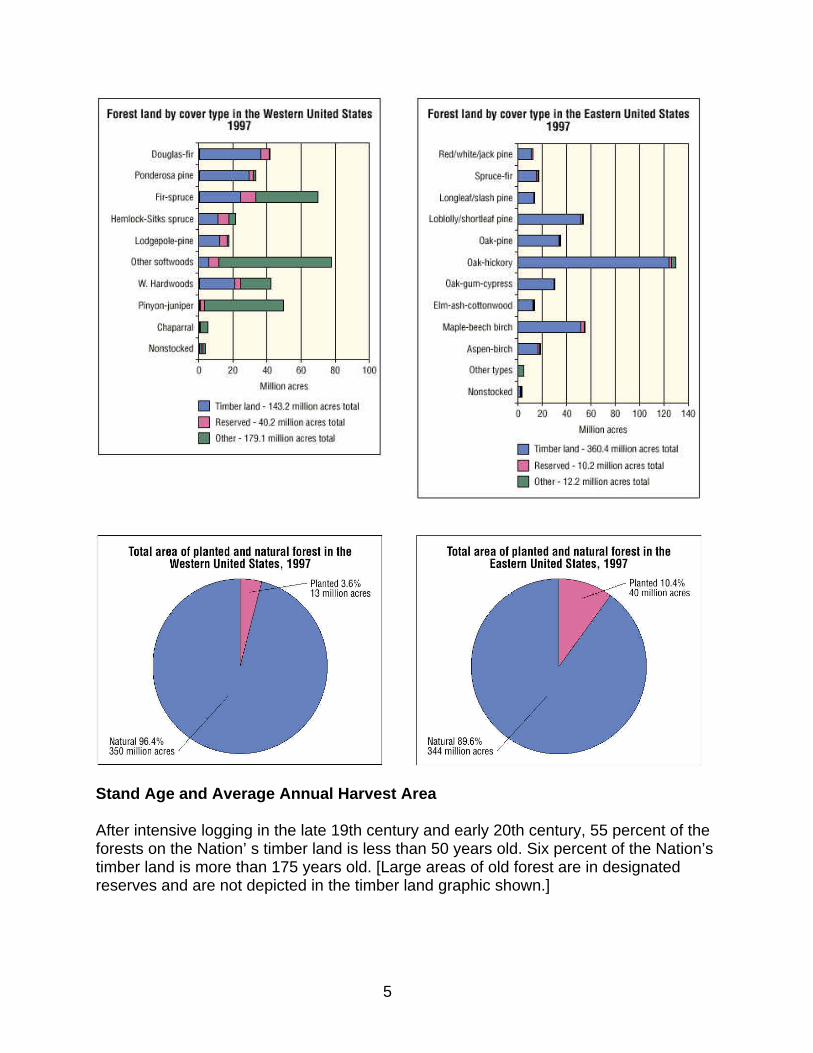
Stand Age and Average Annual Harvest Area After intensive logging in the late 19th century and early 20th century, 55 percent of the forests on the Nation’ s timber land is less than 50 years old. Six percent of the Nation’s timber land is more than 175 years old. [Large areas of old forest are in designated reserves and are not depicted in the timber land graphic shown.]
5
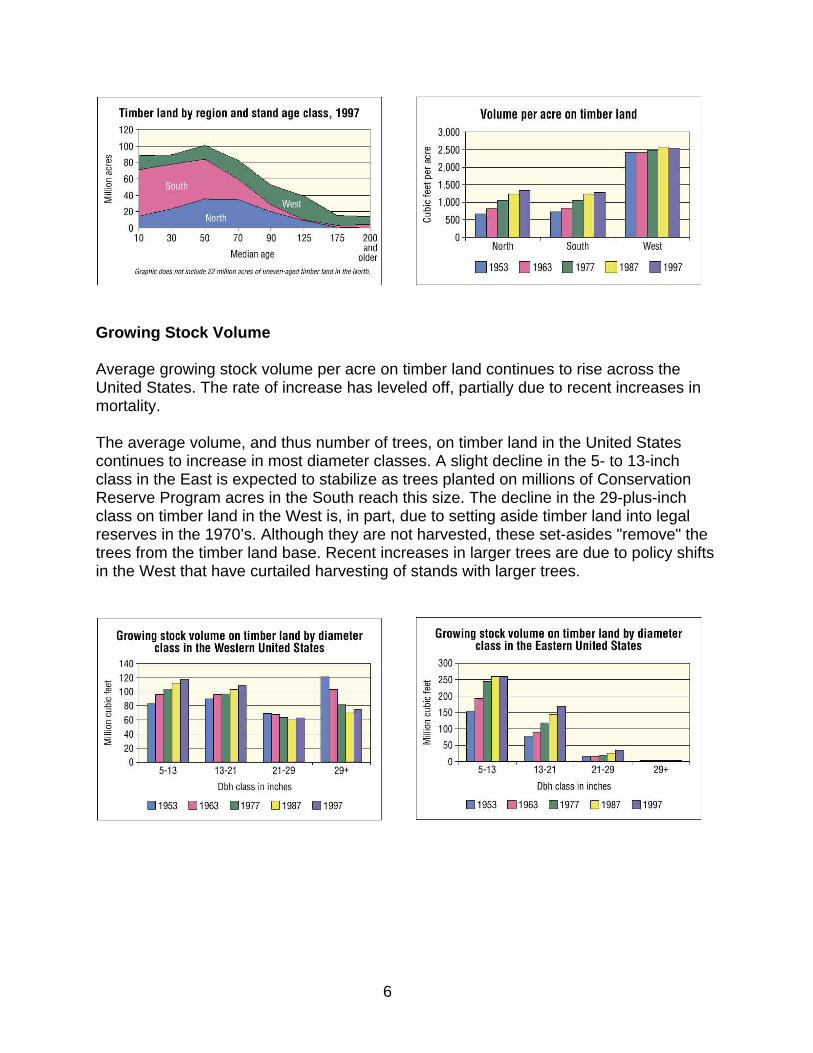
Growing Stock Volume Average growing stock volume per acre on timber land continues to rise across the United States. The rate of increase has leveled off, partially due to recent increases in mortality. The average volume, and thus number of trees, on timber land in the United States continues to increase in most diameter classes. A slight decline in the 5- to 13-inch class in the East is expected to stabilize as trees planted on millions of Conservation Reserve Program acres in the South reach this size. The decline in the 29-plus-inch class on timber land in the West is, in part, due to setting aside timber land into legal reserves in the 1970’s. Although they are not harvested, these set-asides "remove" the trees from the timber land base. Recent increases in larger trees are due to policy shifts in the West that have curtailed harvesting of stands with larger trees.
6
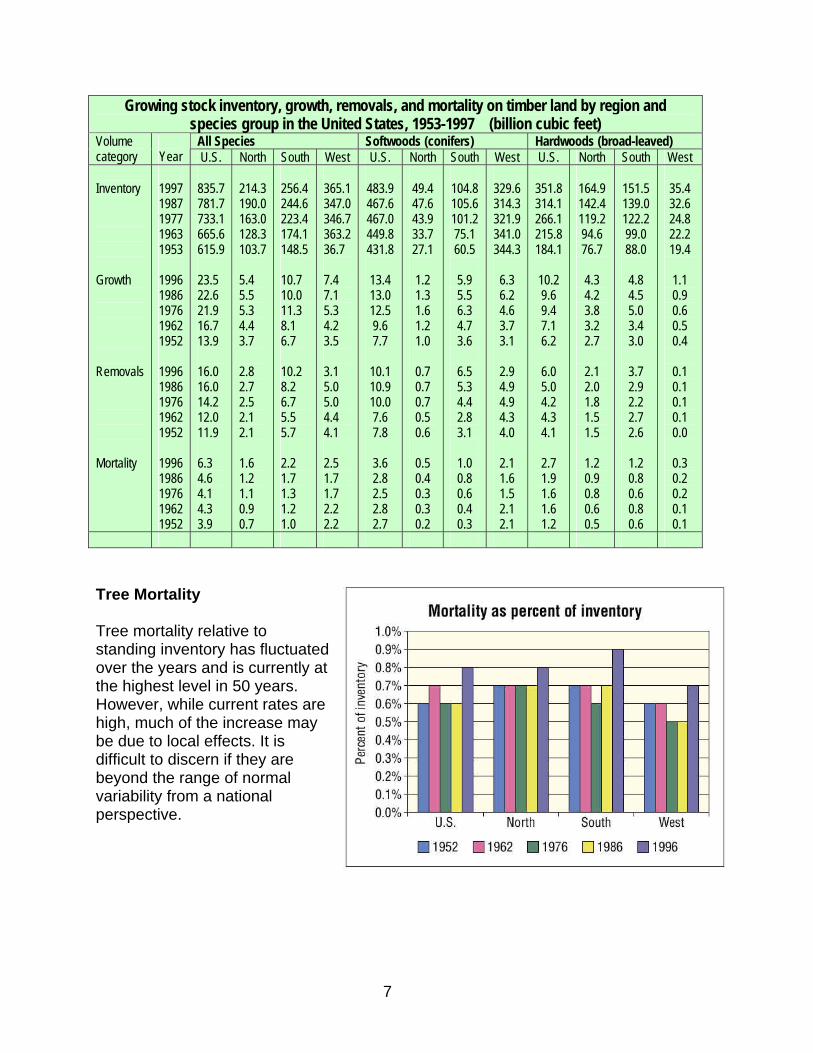
Growing stock inventory, growth, removals, and mortality on timber land by region and species group in the United States, 1953-1997 (billion cubic feet)
All Species Softwoods (conifers) Hardwoods (broad-leaved) Volume category
Year U.S. North South West U.S. North South West U.S. North South West
Inventory Growth Removals Mortality
1997 1987 1977 1963 1953 1996 1986 1976 1962 1952 1996 1986 1976 1962 1952 1996 1986 1976 1962 1952
835.7 781.7 733.1 665.6 615.9 23.5 22.6 21.9 16.7 13.9 16.0 16.0 14.2 12.0 11.9 6.3 4.6 4.1 4.3 3.9
214.3 190.0 163.0 128.3 103.7 5.4 5.5 5.3 4.4 3.7 2.8 2.7 2.5 2.1 2.1 1.6 1.2 1.1 0.9 0.7
256.4 244.6 223.4 174.1 148.5 10.7 10.0 11.3 8.1 6.7 10.2 8.2 6.7 5.5 5.7 2.2 1.7 1.3 1.2 1.0
365.1 347.0 346.7 363.2 36.7 7.4 7.1 5.3 4.2 3.5 3.1 5.0 5.0 4.4 4.1 2.5 1.7 1.7 2.2 2.2
483.9 467.6 467.0 449.8 431.8
13.4 13.0 12.5 9.6 7.7
10.1 10.9 10.0 7.6 7.8
3.6 2.8 2.5 2.8 2.7
49.4 47.6 43.9 33.7 27.1
1.2 1.3 1.6 1.2 1.0
0.7 0.7 0.7 0.5 0.6
0.5 0.4 0.3 0.3 0.2
104.8 105.6 101.2 75.1 60.5
5.9 5.5 6.3 4.7 3.6
6.5 5.3 4.4 2.8 3.1
1.0 0.8 0.6 0.4 0.3
329.6 314.3 321.9 341.0 344.3
6.3 6.2 4.6 3.7 3.1
2.9 4.9 4.9 4.3 4.0
2.1 1.6 1.5 2.1 2.1
351.8 314.1 266.1 215.8 184.1
10.2 9.6 9.4 7.1 6.2
6.0 5.0 4.2 4.3 4.1
2.7 1.9 1.6 1.6 1.2
164.9 142.4 119.2 94.6 76.7
4.3 4.2 3.8 3.2 2.7
2.1 2.0 1.8 1.5 1.5
1.2 0.9 0.8 0.6 0.5
151.5 139.0 122.2 99.0 88.0
4.8 4.5 5.0 3.4 3.0
3.7 2.9 2.2 2.7 2.6
1.2 0.8 0.6 0.8 0.6
35.4 32.6 24.8 22.2 19.4
1.1 0.9 0.6 0.5 0.4
0.1 0.1 0.1 0.1 0.0
0.3 0.2 0.2 0.1 0.1
Tree Mortality Tree mortality relative to standing inventory has fluctuated over the years and is currently at the highest level in 50 years. However, while current rates are high, much of the increase may be due to local effects. It is difficult to discern if they are beyond the range of normal variability from a national perspective.
7
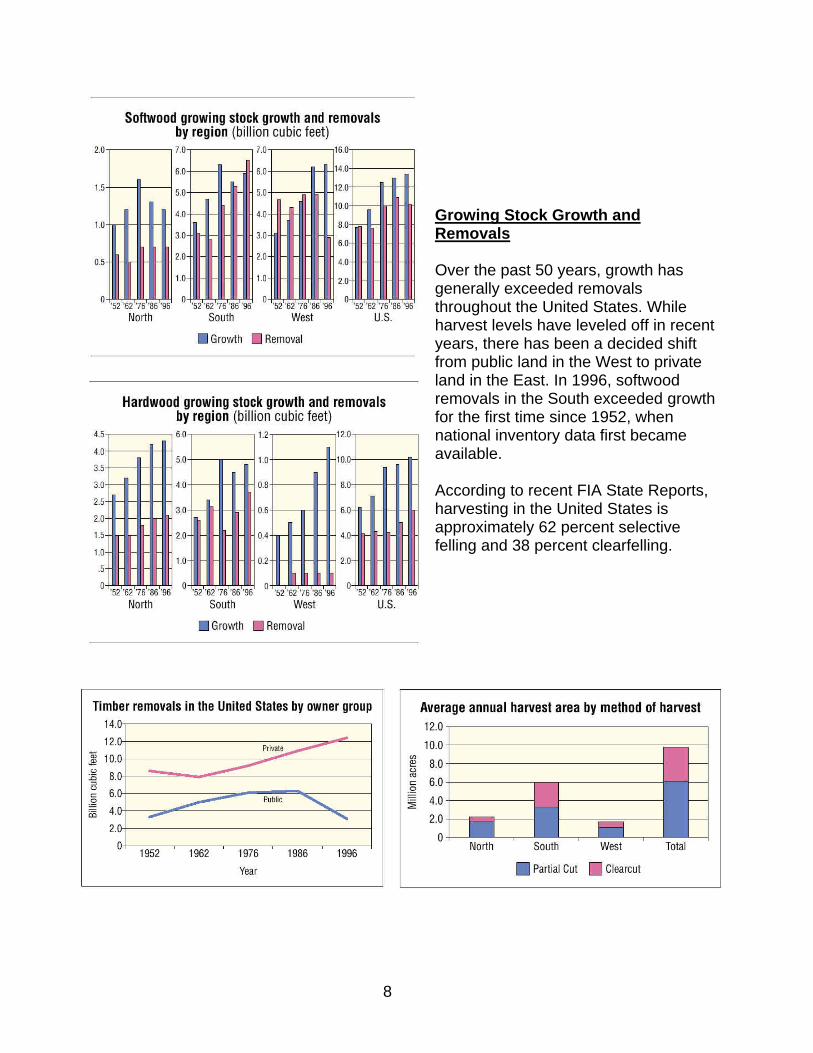
Growing Stock Growth and Removals Over the past 50 years, growth has generally exceeded removals throughout the United States. While harvest levels have leveled off in recent years, there has been a decided shift from public land in the West to private land in the East. In 1996, softwood removals in the South exceeded growth for the first time since 1952, when national inventory data first became available. According to recent FIA State Reports, harvesting in the United States is approximately 62 percent selective felling and 38 percent clearfelling.
8
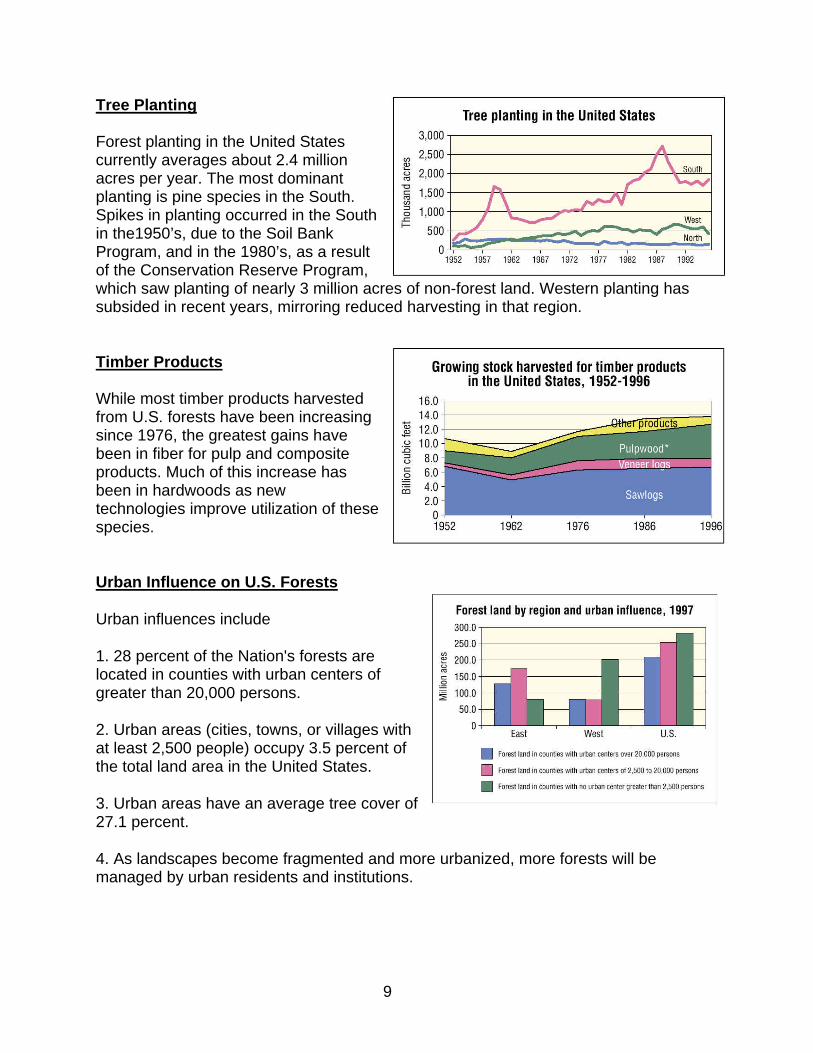
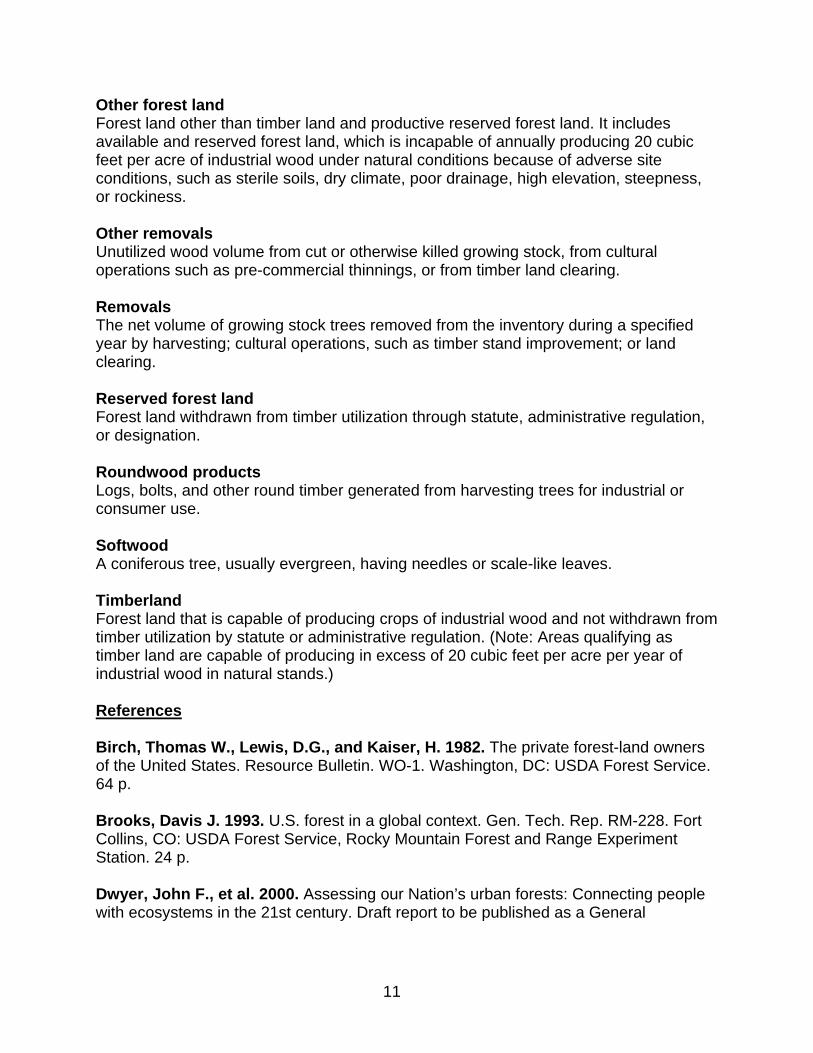
Tree Planting Forest planting in the United States currently averages about 2.4 million acres per year. The most dominant planting is pine species in the South. Spikes in planting occurred in the South in the1950’s, due to the Soil Bank Program, and in the 1980’s, as a result of the Conservation Reserve Program, which saw planting of nearly 3 million acres of non-forest land. Western planting has subsided in recent years, mirroring reduced harvesting in that region. Timber Products While most timber products harvested from U.S. forests have been increasing since 1976, the greatest gains have been in fiber for pulp and composite products. Much of this increase has been in hardwoods as new technologies improve utilization of tspecies.
hese
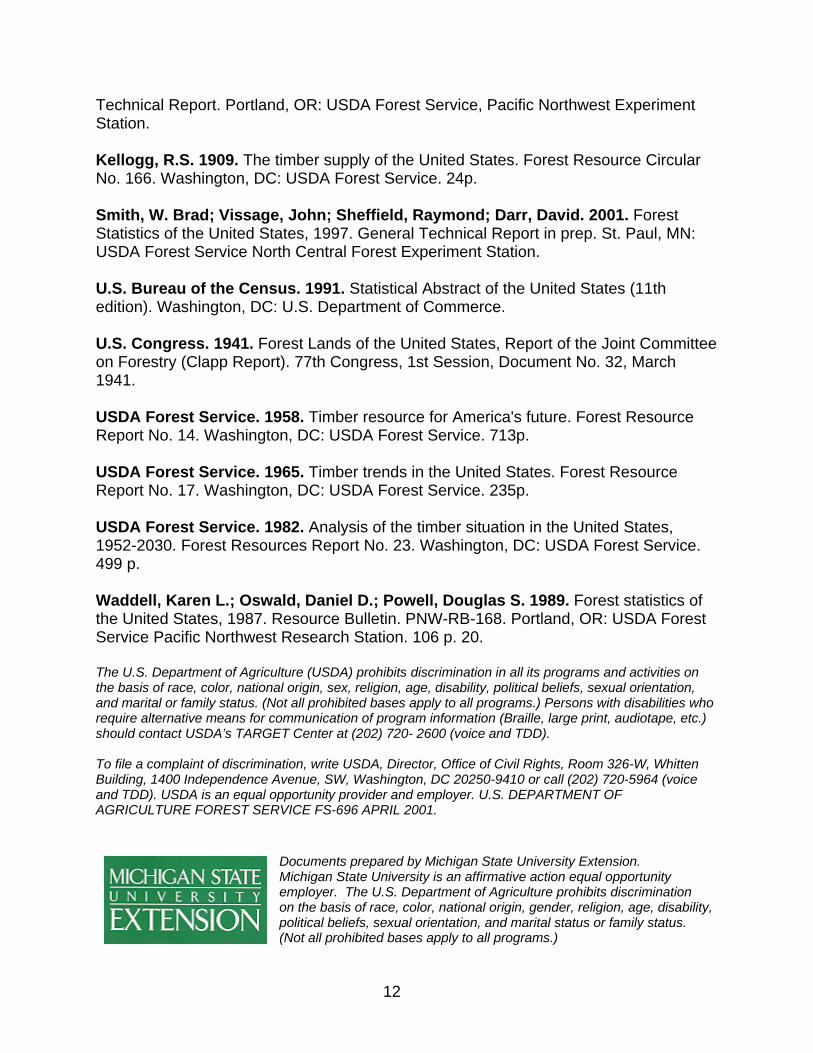
Urban Influence on U.S. Forests
Urban influences include
1. 28 percent of the Nation's forests are located in counties with urban centers of greater than 20,000 persons.
2. Urban areas (cities, towns, or villages with at least 2,500 people) occupy 3.5 percent of the total land area in the United States.
3. Urban areas have an average tree cover of 27.1 percent.
4. As landscapes become fragmented and more urbanized, more forests will be managed by urban residents and institutions.
9

Conclusion This brochure presents some trends and highlights regarding the forest resource of the United States. The supporting document for this brochure, "Forest Statistics of the United States, 1997," is available at http://fia.fs.fed.us. U.S. Forest Service Inventory Terms Forest land Land that is at least 10 percent stocked by forest trees of any size, including land that formerly had tree cover and that will be naturally or artificially regenerated. The minimum area for classification of forest land is 1 acre. Growing stock volume Live trees of commercial species meeting specified standards of quality and vigor. Cull trees are excluded. Includes only trees 5 inches in diameter or larger at 4.5 feet above ground. Growth (Net Annual) The net increase in the volume of growing stock trees during a specified year. Components include the increment in net volume of trees at the beginning of the specific year that survive to the end of the year, plus the net volume of trees reaching the minimum size class during the year, minus the volume of trees that died during the year, and minus the net volume of trees that became cull trees during the year. Hardwood A dicotyledonous tree, usually broad-leaved and deciduous. Logging residues The unused portions of growing-stock trees cut or killed by logging and left in the woods. Mortality The volume of sound wood in growing stock trees that died from natural causes during a specified year. National forest An ownership class of Federal lands, designated by Executive Order or statute as a national forest or purchase unit, under the administration of the Forest Service. Other Federal An ownership class of Federal lands other than those administered by the Forest Service. Primarily lands owned by the Bureau of Land Management, National Park Service, U.S. Fish and Wildlife Service, and the Departments of Energy and Defense.
10
Other forest land Forest land other than timber land and productive reserved forest land. It includes available and reserved forest land, which is incapable of annually producing 20 cubic feet per acre of industrial wood under natural conditions because of adverse site conditions, such as sterile soils, dry climate, poor drainage, high elevation, steepness, or rockiness. Other removals Unutilized wood volume from cut or otherwise killed growing stock, from cultural operations such as pre-commercial thinnings, or from timber land clearing. Removals The net volume of growing stock trees removed from the inventory during a specified year by harvesting; cultural operations, such as timber stand improvement; or land clearing. Reserved forest land Forest land withdrawn from timber utilization through statute, administrative regulation, or designation. Roundwood products Logs, bolts, and other round timber generated from harvesting trees for industrial or consumer use. Softwood A coniferous tree, usually evergreen, having needles or scale-like leaves. Timberland Forest land that is capable of producing crops of industrial wood and not withdrawn from timber utilization by statute or administrative regulation. (Note: Areas qualifying as timber land are capable of producing in excess of 20 cubic feet per acre per year of industrial wood in natural stands.) References Birch, Thomas W., Lewis, D.G., and Kaiser, H. 1982. The private forest-land owners of the United States. Resource Bulletin. WO-1. Washington, DC: USDA Forest Service. 64 p. Brooks, Davis J. 1993. U.S. forest in a global context. Gen. Tech. Rep. RM-228. Fort Collins, CO: USDA Forest Service, Rocky Mountain Forest and Range Experiment Station. 24 p. Dwyer, John F., et al. 2000. Assessing our Nation’s urban forests: Connecting people with ecosystems in the 21st century. Draft report to be published as a General
11
Technical Report. Portland, OR: USDA Forest Service, Pacific Northwest Experiment Station. Kellogg, R.S. 1909. The timber supply of the United States. Forest Resource Circular No. 166. Washington, DC: USDA Forest Service. 24p. Smith, W. Brad; Vissage, John; Sheffield, Raymond; Darr, David. 2001. Forest Statistics of the United States, 1997. General Technical Report in prep. St. Paul, MN: USDA Forest Service North Central Forest Experiment Station. U.S. Bureau of the Census. 1991. Statistical Abstract of the United States (11th edition). Washington, DC: U.S. Department of Commerce. U.S. Congress. 1941. Forest Lands of the United States, Report of the Joint Committee on Forestry (Clapp Report). 77th Congress, 1st Session, Document No. 32, March 1941. USDA Forest Service. 1958. Timber resource for America's future. Forest Resource Report No. 14. Washington, DC: USDA Forest Service. 713p. USDA Forest Service. 1965. Timber trends in the United States. Forest Resource Report No. 17. Washington, DC: USDA Forest Service. 235p. USDA Forest Service. 1982. Analysis of the timber situation in the United States, 1952-2030. Forest Resources Report No. 23. Washington, DC: USDA Forest Service. 499 p. Waddell, Karen L.; Oswald, Daniel D.; Powell, Douglas S. 1989. Forest statistics of the United States, 1987. Resource Bulletin. PNW-RB-168. Portland, OR: USDA Forest Service Pacific Northwest Research Station. 106 p. 20. The U.S. Department of Agriculture (USDA) prohibits discrimination in all its programs and activities on the basis of race, color, national origin, sex, religion, age, disability, political beliefs, sexual orientation, and marital or family status. (Not all prohibited bases apply to all programs.) Persons with disabilities who require alternative means for communication of program information (Braille, large print, audiotape, etc.) should contact USDA’s TARGET Center at (202) 720- 2600 (voice and TDD). To file a complaint of discrimination, write USDA, Director, Office of Civil Rights, Room 326-W, Whitten Building, 1400 Independence Avenue, SW, Washington, DC 20250-9410 or call (202) 720-5964 (voice and TDD). USDA is an equal opportunity provider and employer. U.S. DEPARTMENT OF AGRICULTURE FOREST SERVICE FS-696 APRIL 2001. Documents prepared by Michigan State University Extension.
Michigan State University is an affirmative action equal opportunity employer. The U.S. Department of Agriculture prohibits discrimination on the basis of race, color, national origin, gender, religion, age, disability, political beliefs, sexual orientation, and marital status or family status. (Not all prohibited bases apply to all programs.)
12