Embed Size (px)
Citation preview

UNIVERSIDADE FEDERAL DE SANTA MARIA CENTRO DE CIÊNCIAS NATURAIS E EXATAS
PROGRAMA DE PÓS-GRADUAÇÃO EM BIODIVERSIDADE ANIMAL
FOREST AMOUNT INFLUENCES ON CARNIVORE MAMMAL OCCURRENCE WITHIN BRAZILIAN
ATLANTIC FOREST
DISSERTAÇÃO DE MESTRADO
André Luis Regolin
Santa Maria, RS, Brasil
2016

FOREST AMOUNT INFLUENCES ON CARNIVORE MAMMAL OCCURRENCE WITHIN BRAZILIAN ATLANTIC
FOREST
André Luis Regolin
Dissertação apresentada ao Curso de Mestrado do Programa de Pós-Graduação em Biodiversidade Animal, da Universidade Federal de Santa Maria (UFSM,
RS), como requisito parcial para obtenção do grau de Mestre em Ciências Biológicas.
Orientador: Prof. Dr. Nilton Carlos Cáceres Co-orientador: Prof. Dr. Milton Cezar Ribeiro
Santa Maria, RS, Brasil
2016

Ficha catalográfica elaborada através do Programa de Geração Automática da Biblioteca Central da UFSM, com os dados fornecidos pelo(a) autor(a).
Regolin, André Luis Forest amount influences on carnivore mammaloccurrence within Brazilian Atlantic Forest / André LuisRegolin.-2016. 53 p.; 30cm
Orientador: Nilton Carlos Cáceres Coorientador: Milton Cezar Ribeiro Dissertação (mestrado) - Universidade Federal de SantaMaria, Centro de Ciências Naturais e Exatas, Programa dePós-Graduação em Biodiversidade Animal, RS, 2016
1. habitat fragmentation 2. conservation biology 3.landscape ecology 4. carnive mammal 5. camera trap I.Cáceres, Nilton Carlos II. Ribeiro, Milton Cezar III.Título.

Universidade Federal de Santa Maria Centro de Ciências Naturais e Exatas
Programa de Pós-Graduação em Biodiversidade Animal
A Comissão Examinadora, abaixo assinada, aprova a Dissertação de Mestrado
FOREST AMOUNT INFLUENCES ON CARNIVORE MAMMAL OCCURRENCE WITHIN BRAZILIAN ATLANTIC FOREST
elaborada por André Luis Regolin
como requisito parcial para obtenção do grau de Mestre em Ciências Biológicas
COMISSÃO EXAMINADORA:
Nilton Carlos Cáceres, Dr. (Presidente/Orientador)
Milton Cezar Ribeiro, Dr. (UNESP Rio Claro) (Membro-extra/Orientador)
Carlos Benhur Kasper, Dr. (UNIPAMPA)
Caroline Leuchtenberger, Dra. (IF Farroupilha)
Santa Maria, 18 de fevereiro de 2016.

DEDICATÓRIA
Fonte: Diogo Costa. Título: Roda entre os amigos do Regional da Cobra Coral. Fotógrafo: Diogo Costa. Data: 20 de novembro de 2013. Local: EREB Sul – Vidal Ramos/SC. Personagens: da esquerda para a direita, Alysson Marques, Ricardo Cristofolini Vicente (Lagartixa), Andre Luis Regolin, Bruno Barros Gomes (In memoriam) e Rafael Rodriguez (Chong). Comentário: "Naquela mesa tá faltando ele e a saudade dele tá doendo em mim..." Nelson Gonçalves

AGRADECIMENTOS
Aos meus pais, Elisa e Zé, pelo amor e apoio incondicional.
Aos padrinhos, Raquel e Ayres, que, apesar da distância física, buscaram sempre estar
presentes.
Ao Miltinho por abrir as portas do LEEC e por transmitir confiança e tranquilidade para
superar os desafios impostos. O mundo precisa de mais pessoas como você!
Ao pessoal do LEEC, a grande família, pela amizade, pelas várias contribuições para o
desenvolvimento do trabalho e pelas cervejas no Sujinhos: Miltinho, Rê, Ju Assis, Ju Oshima,
Flávia, Mau, Paty, John, Ju Silveira, Rodrigo, Felipe Xexênia, Fer Tigrinho, Stefano, Fábio,
Dani, Pantaneiro, Biz, Honda, Nat, Mi, Giordano, Gabi, Iha, Victor, Kalinka, Ber, Calebe,
mestre Kanda, Hugo, Magioli, Paula, Pavito, Exú, Cotia, Camilinha, Mitra, Saidera, Urucum,
Smurf, Kauâ, Keila, Camilo e Nicolas!
Ao Nilton pela oportunidade e confiança.
Ao Maurício Graipel pela ajuda fundamental para o ingresso no mestrado. Obrigado pela
confiança, paciência, troca de ideias e incentivo!
Ao Jorge Cherem pela amizade e por ser um exemplo de conduta profissional. Parceiro
incrível de trabalho, de café (espresso por favor!) e de cerveja!
Ao Mauro Galetti pelas críticas e sugestões no momento de crise.
Aos professores Tadeu e Antônio pelas "aulas" sobre ciência na copa da Ecologia.
Ao Sidnei pela paciência e por uma mãezona para os alunos do PPG.
Ao Felipe Cerezer pela amizade. Excelente companheiro de laboratório.
Aos colaboradores que disponibilizaram dados e fizeram críticas e sugestões: Juliano,
Maurício, Jorge, Luiz Gustavo, Marcos, Felipe, Micheli, Fernando, Pedro, Jonas e Geruza.
Ao Bellé pela excelente recepção em Santa Maria! Como eram boas as noites movidas a
polenta, vinho, cachaça, chimarrão, churrasco e muita prosa.

Aos amigos do Engole o Choro e do Samba dos Pampas que tornaram as noites gaúchas mais
divertidas: Gabriel, Luis, João e Guto.
Ao Beto pela amizade e pela ajuda essencial nos primeiros passos com SIG e na ecologia de
paisagens. Obrigado pelo: "Qual é a tua pergunta, cara?!". Espero que goste deste trabalho.
Ao casal Geronas (Geruza e Jonas) pela amizade e ajuda fundamental para a evolução na vida
acadêmica.
Aos amigos Edvaldo Pezão, Bruno Parasita e Alan Esquilo pelo papo furado. Vocês não
valem a água da salsicha.
Ao Salvador pela amizade e pelo incentivo em seguir percorrendo esse mundão. E cadê a
nossa viagem de bike?
Ao pessoal do Curso de Campo da UMFG pela maravilhosa "simulação de voo" na ciência.
As professoras Sílvia e Tatiana pelas sugestões para o desenvolvimento do projeto e por terem
feito a "ponte" com o Miltinho.
Aos amigos/irmãos companheiros de lar por tornarem o dia a dia em Rio Claro tão gostoso:
Pedrão, Pulga e Julinha.
A todos aqueles que de alguma maneira contribuíram para a conclusão dessa etapa.
Muito obrigado!

EPÍGRAFE
"Todo mundo deveria ter um pandeiro..."
Antônio Nóbrega

RESUMO
Dissertação de Mestrado Programa de Pós-Graduação em Biodiversidade Animal
Universidade Federal de Santa Maria
INFLUÊNCIA DA QUANTIDADE DE FLORESTA SOBRE A OCORRÊNCIA DE MAMÍFEROS CARNÍVOROS NA MATA
ATLÂNTICA BRASILEIRA ORIENTADOR: NILTON CARLOS CÁCERES
CO-ORIENTAROR: MILTON CÉZAR RIBEIRO Local da Defesa: Santa Maria, 18 de fevereiro de 2016.
O processo de fragmentação de habitat é a principal ameaça à conservação de mamíferos
terrestres em nível global. Apesar da importância da compreensão do grau de sensibilidade
das espécies aos efeitos do processo de fragmentação do habitat, existem poucos trabalhos
que buscam avaliar a relação da fragmentação de florestas tropicais com a ocorrência de
mamíferos carnívoros. Nós investigamos como as métricas de estrutura da paisagem -
quantidade de floresta, densidade de manchas, quantidade de borda, relação perímetro-área e
heterogeneidade espacial - afetam a diversidade de mamíferos em múltiplas extensões em 22
paisagens da Mata Atlântica. Nos orientamos pelas seguintes hipóteses: a) a riqueza de
carnívoros é relacionada positivamente com a quantidade de floresta; b) a ocorrência das
espécies varia de acordo com a sua sensibilidade à perda de floresta e à preferência por
florestas ou áreas abertas. Riqueza e composição de espécies foram relacionadas com várias
métricas da paisagem. Devido a alta correlação entre as métricas, adotamos a quantidade de
floresta como principal variável preditora. Utilizando o método de seleção de modelos
(AICc), verificamos que a quantidade de floresta influencia positivamente a riqueza e que as
respostas a estrutura da paisagem diferem entre espécies, possivelmente devido as diferenças
no uso de habitat. Reiteramos a importância da proteção de remanescentes florestais para a
manutenção da alta quantidade de floresta no Neotrópico, particularmente onde as paisagens
eram cobertas por florestas.

Palavras-chave: armadilha fotográfica, Cerdocyon thous, conservation, Eira barbara,
Galictis cuja, fragmentação de habitat, Leopardus spp., Nasua nasua, Puma spp., Procyon
cancrivorus.

ABSTRACT
Master Course Dissertation Animal Biodiversity Postgrad Program Universidade Federal de Santa Maria
FOREST AMOUNT INFLUENCES ON CARNIVORE MAMMALS
OCCURRENCE WITHIN BRAZILIAN ATLANTIC FOREST AUTHOR: ANDRÉ LUIS REGOLIN
ADVISER: NILTON CARLOS CÁCERES CO-ADVISER: MILTON CÉZAR RIBEIRO
Defense Place and Date: Santa Maria, January 18nd, 2016.
Habitat fragmentation process is the main threat to the conservation of terrestrial mammals at
the global level. Despite the importance of understanding the degree which species are
sensitive to the effects of habitat fragmentation, there are few studies that assess the
relationship between tropical forest fragmentation and the occurrence of carnivore mammals.
We investigated how landscape structure — forest amount, patch density, edge
amount,perimeter-area ratio and spatial heterogeneity — affects the diversity of carnivore
mammals at multiple extents within 22 Atlantic Forest landscapes. We hypothesized that (a)
carnivore richness is positively related to forest amount;and (b) the occurrence of species will
vary according to its sensitivity to forest loss and its preference for forest or open areas.
Species richness and composition were correlated with several landscape structure metrics.
Due to a high correlation among the metrics, we adopted forest amount as the principal
predictor variable. Using the model selection method (AICc), we confirmed that forest amount
positively influenced species richness, and we verified that the responses to landscape
structure differed among species, possibly due to the differences in their habitat use. Our
results reiterate the importance of protecting forest remnants to maintain the high quantity of
forest within Neotropics, particularly where originally landscapes was covered by forests.

Key words: camera trap, Cerdocyon thous, conservation, Eirabarbara, Galictis cuja, habitat
fragmentation, Leopardus spp., Nasua nasua, Puma spp., Procyon cancrivorus.
SUMÁRIO
INTRODUÇÃO .......................................................................................................... ARTIGO CIENTÍFICO - "Forest amount influences on carnivore mammal occurrence within Brazilian Atlantic Forest".........................................................
Introduction............................................................................................................. Material and Methods............................................................................................. Results........................................................................................................................ Discussion.................................................................................................................. Acknowledgements.................................................................................................. Literature cited.......................................................................................................... Supporting Information...........................................................................................
CONCLUSÃO............................................................................................................... REFERÊNCIAS .........................................................................................................
14
15 17 22 26 32 37 37 44 51 52

14
INTRODUÇÃO
Busco compreender nesta dissertação a influência de características da paisagem sobre a
diversidade de mamíferos carnívoros neotropicais em um gradiente de cobertura florestal e
em múltiplas extensões de análise da paisagem. Adotei este tema pelo fato da perda de habitat
ser a principal ameaçada a mamíferos terrestres (Schipper et al. 2008). A dissertação é
composta por um artigo científico intitulado "Forest amount influences on carnivore mammal
occurrence within Brazilian Atlantic Forest", o qual está formatado para submissão ao
periódico Journal of Mammalogy (ISSN 0022-2372).
Para esta finalidade, utilizei dados de armadilhamento fotográfico coletados por mim e por
colaboradores em unidades de conservação e áreas sujeitas a implantação de
empreendimentos dos setores energético e portuário em Santa Catarina e Rio Grande do Sul,
no sul da Mata Atlântica brasileira. Apesar das limitações metodológicas impostas pela
diferença do desenho amostral entre as áreas de estudo, os dados reunidos contém
informações apuradas sobre a ocorrência de espécies de mamíferos carnívoros de médio e
grande porte em um conjunto de paisagens que representa um gradiente de perda de cobertura
florestal nativa. Busquei analisar a paisagem adotando as métricas que refletem os principais
efeitos da perda de habitat (Fahrig 2003, 2013) sobre mamíferos (Virgós et al. 2002; Lyra-
Jorge et al. 2010; Brady et al. 2011; Brodie et al. 2015) e considerando a importância das
múltiplas extensões espaciais (Boscolo & Metzger 2009; Lyra-Jorge et al. 2010; Jackson &
Fahrig 2012, 2014).
Selecionei os carnívoros em virtude de sua importância para o funcionamento dos
ecossistemas (Crooks & Soulé 1999; Roemer tal. 2009; Jorge et al. 2013), pela efetividade da
fotografia remota em levantar dados sobre espécies deste grupo em ambientes florestais
(Tobler et al. 2008; Mccallum 2013) e pelo fato de as respostas dessas espécies quanto às
modificações da paisagem ao longo de suas distribuições permanecem pouco exploradas.

15
ARTIGO CIENTÍFICO 1
2
Running heading: Forest amount influences carnivore mammal 3
4
Forest amount influences on carnivore mammal occurrence within Brazilian Atlantic 5
Forest 6
7
André Luis Regolin*, Jorge José Cherem, Maurício Eduardo Graipel, Juliano André Bogoni, 8
John Wesley Ribeiro, Maurício Humberto Vancine, Marcos Adriano Tortato, Luiz Gustavo 9
Oliveira-Santos, Felipe Moreli Fantacini, Micheli Ribeiro Luiz, Pedro Volkmer de Castilho, 10
Milton Cezar Ribeiro, Nilton Carlos Cáceres 11
12
PPG Biodiversidade Animal, Universidade Federal de Santa Maria (UFSM), Santa Maria, 13
RS, Brasil (ALR) 14
Laboratório de Ecologia Espacial e Conservação (LEEC), Departamento de Ecologia, 15
Universidade Estadual Paulista “Julio de Mesquita Filho” (UNESP), Rio Claro, SP, Brasil 16
(ALR, JWR, MHV, MCR) 17
Caipora Cooperativa para a Conservação da Natureza, Florianópolis, SC, Brasil (JCC, 18
MEG, MAT) 19
Departamento de Ecologia e Zoologia, Universidade Federal de Santa Catarina, 20
Florianópolis (UFSC), SC, Brasil (MEG) 21
PPG Ecologia e Conservação, Universidade Federal do Mato Grosso do Sul (UFMS), 22
Campo Grande, MS, Brasil (MAT) 23
Departamento de Ecologia, Universidade Federal do Mato Grosso do Sul (UFMS), Campo 24
Grande, MS, Brasil (LGOS) 25

16
International Master in Applied Ecology, University of East Anglia, Norwich, UK (FMF) 26
Instituto Ambiental Brüderthal, Brusque, SC, Brasil (FMF) 27
Instituto Felinos do Aguaí, Criciúma, SC, Brasil (MRL) 28
PPG Engenharia Florestal, Universidade do Estado de Santa Catarina (UDESC), Lages, 29
Santa Catarina (PVC) 30
Departamento de Ecologia e Evolução, Universidade Federal de Santa Maria (UFSM), Santa 31
Maria, RS, Brasil (NCC) 32
33
Key words: camera trap, Cerdocyon thous, conservation, Eira barbara, Galictis cuja, habitat 34
loss, Leopardus spp., Nasua nasua, Puma spp., Procyon cancrivorus. 35
36
* Corresponding author: [email protected] 37
38
Abstract 39
Habitat fragmentation process is the main threat to the conservation of terrestrial mammals at 40
the global level. Despite the importance of understanding the degree which species are 41
sensitive to the effects of habitat fragmentation, there are few studies that assess the 42
relationship between tropical forest fragmentation and the occurrence of carnivore mammals. 43
We investigated how landscape structure — forest amount, patch density, edge 44
amount,perimeter-area ratio and spatial heterogeneity — affects the diversity of carnivore 45
mammals at multiple extents within 22 Atlantic Forest landscapes. We hypothesized that (a) 46
carnivore richness is positively related to forest amount;and (b) the occurrence of species will 47
vary according to its sensitivity to forest loss and its preference for forest or open areas. 48
Species richness and composition were correlated with several landscape structure metrics. 49
Due to a high correlation among the metrics, we adopted forest amount as the principal 50

17
predictor variable. Using the model selection method (AICc), we confirmed that forest amount 51
positively influenced species richness, and we verified that the responses to landscape 52
structure differed among species, possibly due to the differences in their habitat use. Our 53
results reiterate the importance of protecting forest remnants to maintain the high quantity of 54
forest within Neotropics, particularly where originally landscapes was covered by forests. 55
56
Introduction 57
Habitat fragmentation process is the main threat to the conservation of terrestrial mammals at 58
the global level (Schipper et al. 2008). The process modifies the landscape through the loss 59
and subdivision of habitat, reducing the quantity of available habitat and increasing the 60
isolation of the patches, the area under edge effect (Fahrig 2003), and the heterogeneity of the 61
habitat mosaic (Brady et al. 2011). The effects of fragmentation can cause changes in the 62
richness, composition, abundance, distribution, and genetic diversity of species; these changes 63
affect a variety of ecological processes (Fahrig 2003; Valiente-Banuet et al. 2015). An 64
understanding of the degree to which species are sensitive to the effects of habitat 65
fragmentation is necessary to guide strategies for the conservation of biodiversity and 66
ecosystem services. Nonetheless, there are few studies that have assessed the relationship 67
between tropical forest fragmentation and the diversity of carnivorous mammals. 68
For decades, the island biogeography model (MacArthur and Wilson 1967) was adopted to 69
explain the population and community patterns in remnants of natural areas in terrestrial 70
ecosystems, which supports the definition of conservation actions such as the planning of 71
protected areas (Fahrig 2013). In this context, an exaggerated importance was attributed to the 72
size of, and distance between , patches to explain the patterns of richness, abundance and 73
occurrence of mammal species (Chiarello 1999; Virgós et al. 2002; Michalski and Peres 2005, 74
2007; Silva-Jr and Pontes 2008). However, animals are not isolated in habitat patches; rather, 75

18
they can move through the mosaic of landscape units and can obtain resources in the matrix 76
(Umetsu et al. 2008; Brady et al. 2011; Magioli et al. 2014). Therefore, the patch must not be 77
used as the natural unit of measurement (Fahrig 2013). The analysis of the effects of 78
fragmentation must occur at the landscape level. A landscape can be defined as the area 79
delimited by distances that are biologically relevant to the sampling point (spatial extents), 80
and it encompasses areas of different types and proportions, of different habitats (Fahrig 81
2003, 2013; Jackson and Fahrig 2014). 82
One of the challenges of landscape-level studies is to determine the best spatial extent to be 83
considered in the analysis (Boscolo and Metzger 2009). Following Jackson and Fahrig (2014), 84
the spatial extent at which the metrics are measured is fundamental to the correct evaluation 85
of the relationship between species and landscape. Although the scale of effect — the spatial 86
extent of analysis at which the relationship is strongest — is theoretically associated with the 87
biological characteristics of a species, there is still little empirical evidence of this (Jackson 88
and Fahrig 2012). To deal with this issue, landscape analysis can occur at multiple spatial 89
extents to define the scale of effect a posteriori (Jackson and Fahrig 2012, 2014; Fahrig 90
2013). 91
In addition to assessing the quantity and disposition of the habitat patches at multiple extents 92
of the landscape, studies on the effects of habitat fragmentation need to consider the 93
heterogeneity of altered habitats in the matrix, which generally contains a high proportion of 94
landscapes dominated by human use (Umetsu et al. 2008). For example, Brady et al. (2011) 95
verified that attributes of the matrix are more important than patch and landscape variables for 96
explaining mammal richness in the subtropical southeast of Queensland, Australia. These 97
authors proposed that, under the evaluated conditions, the matrix should be the primary 98
measure of isolation because it functions as a filter for dispersion, a source of disturbances by 99
feral animals and humans, and a supplementary source of resources. 100

19
Responses to the fragmentation process can vary among species due to the differences in their 101
use of habitat, in their acquisition of resources, and in their capacity for movement through 102
the landscape (Virgós et al. 2002). For example, Lyra-Jorge et al. (2010) observed that the 103
best explanatory models for the frequency of occurrence differed among three carnivore 104
species in southeastern Brazil. The authors reported that the ocelot (Leopardus pardalis) 105
occurrence was better explained by the quantity of Cerrado woodland ("cerradão") formations 106
at a narrow extent (250 m). Conversely, they found that the models of edge amount at a wide 107
extent (2000 m) best explained the occurrences of the mountain lion (Puma concolor) and the 108
maned wolf (Chrysocyon brachyurus). Brodie et al. (2015) also ascertained the differences in 109
mammal responses to the fragmentation of tropical forests in Borneo. In that area, the clouded 110
leopard Neofelis diardi, the Malay civet Viverra tangalunga, and the leopard cat Prionailurus 111
bengalensis composed the group most negatively affected by landscape modifications, as they 112
were much more abundant in primary forests, where their responses to edge effect differed. 113
Given that the species’ responses can differ according to the structure and composition of the 114
landscape (Virgós et al. 2002; Lyra-Jorge et al. 2010, Brodie et al. 2015), it is important that 115
studies on the effect of habitat fragmentation include species-specific approaches. 116
We used carnivore mammals as the study object because this group includes species that are 117
affected by landscape changes and that perform essential ecosystem functions (Crooks and 118
Soulé 1999; Roemer et al. 2009; Oliveira et al. 2010; Jorge et al. 2013). Furthermore, 119
carnivores can be monitored by camera trap, which is an efficient tool to generate data about 120
species occurrence in forest environments, including those that are elusive and have low 121
population density (Tobler et al. 2008; Mccallum 2013). Methodological advances that 122
reduced the cost of camera traps have led to an increase in the number of studies about 123
carnivore ecology (Mccallum 2013). However, there are gaps of information about the 124

20
ecology of carnivores in many regions, and the responses of these species to the modification 125
of the landscape throughout their distributions remain scarcely explored. 126
Although the Atlantic Forest is a hotspot for the conservation of biodiversity (Myers et al. 127
2000), it has been intensely degraded and currently reduced to 12% of its original vegetation 128
cover, which is generally distributed in small, isolated remnants (<50 hectares) that are 129
commonly not protected as Units of Conservation (Ribeiro et al. 2009). Therefore, the 130
objective of this study was to assess the effects of the process of forest habitat fragmentation 131
on richness, composition, and occurrence of carnivores in the Atlantic Forest at multiple 132
extents of landscape analysis. We hypothesized that (a) carnivore richness are positively 133
correlated to forest amount; and (b) the occurrence of species will vary according to its 134
sensitivity to forest loss and its preference for forest or open areas. To organize and facilitate 135
the analyses, we gathered the species into three groups according to expected patterns of 136
response to forest fragmentation: i) habitat generalist species, ii) forest-preferring species; and 137
iii) forest species tolerant of habitat degradation. These expected patterns are based on the 138
knowledge of the species’ natural history, available in the scientific literature, and are 139
presented Table 1. 140

21
Table 1. — Working predictions for carnivore mammals’ occurrence and richness by forest amount in 22 landscapes within the southern part of 141
the Brazilian Atlantic Forest. 142
Response variables References for expected responses Expected responses Visual representation Species richness Chiarello (1999), Silva-Jr. and Pontes
(2008) Species richness is positively related to forest amount.
Occurrence of habitat generalist species (group 1)
Cerdocyon thous (Linnaeus, 1766) Berta (1982), Michalski et al. (2006), Di Bitetti et al. (2009)
The occurrences of these species have no relation to the forest amount. Puma yagouaroundi (Geoffroy,
1803) Oliveira (1998a), Michalski et al. (2006), Giordano (2015)
Occurrence of forest-preferring species (group 2)
Leopardus guttulus (Hensel, 1872) Goulart et al. (2009) The probability of occurrence of these species is positively related to forest amount.
Leopardus wiedii (Schinz, 1821) Oliveira et al. (1998b) Eira barbara (Linnaeus, 1758) Presley (2000) Leopardus pardalis (Linnaeus, 1758) Murray and Gardner (1997), Harveson et
al. (2004), Goulart et al. (2009) Puma concolor (Linnaeus, 1771) Mazzolli (1993) Occurrence of forest species tolerant of habitat degradation (group 3)
Galictis cuja (Molina, 1782) Yensen and Tarifa (2003) The probability of occurrence of these species is negatively related to forest amount.
Nasua nasua (Linnaeus, 1766) Gompper and Decker (1998), Beisiegel and Mantovani (2006)
Procyon cancrivorus (Cuvier, 1798) Emmons and Feer (1997), Cáceres et al. (2007)

22
Material and Methods 143
Study landscapes 144
The present study took place in 22 landscapes in the states of Santa Catarina and Rio Grande 145
do Sul, southern Brazil (Figure 1). The study landscapes are situated in the Atlantic Forest 146
biome (IBGE 2004) and present different degrees of anthropogenic intervention. The amount 147
of forest cover varies from 19% to 98% among the landscapes, with an average of 61%. Their 148
vegetation includes remnants of Seasonal Deciduous Forest, Mixed Ombrophilous Forest, 149
Dense Ombrophilous Forest, and small portions in transition with Natural Fields (Vibrans et 150
al. 2012; see Supporting Information S1). By virtue of a sampling system with multiple 151
collection stations in each landscape (see text below), the size of the landscapes varies from 152
1,256.6 ha to 4,074.4 ha. However, we do not consider this as compromising our analyses, 153
because the landscape metrics are not influenced by the landscape extents; furthermore, we 154
explored the effect of the sampling effort on the estimation of species occurrences (see text 155
below). 156
157
Sampling of the mammals 158
Sampling of the mammals in all landscapes was accomplished through remote photography. 159
The samplings occurred in different periods between 2005 and 2012. Camera traps were 160
installed within forest fragments, positioned on trails and paths used naturally by carnivore 161
mammals, and affixed to tree trunks at a height of 30–40 cm to maximize the chance of 162
recording the local fauna. The traps remained operative for 24 hours per day and were 163
serviced to download the photos and to perform maintenance when necessary. The sampling 164
effort totaled 10,544 trap-nights, varying between 180 and 910 trap-nights per landscape (see 165
Supporting Information S2). We verified graphically whether the difference in the sampling 166
effort between landscapes affected the results of the species occurrence analyzes. 167

23
168
169
Figure 1. — Location of 22 study landscapes and the land use and occupation maps of the 170
areas where carnivore occurrences were recorded, within the southern part of Brazilian 171
Atlantic Forest. Legend: 1) Turvo State Park; 2) Araucárias State Park; 3) Quebra Queixo 172
Hydropower plant; 4, 5, and 6) Foz do Chapecó Hydropower plant; 7) Arvoredo Small 173
Hydropower; 8) Plano Alto Small Hydropower; 9) Alto Irani Small Hydropower; 10) 174
Ipumirim; 11) Passos Maia Small Hydropower; 12) Salto Góes Small Hydropower; 13) 175
Private Natural Reserve (RPPN) Chácara Edith; 14, 15 and 16) RPPN Caraguatá; 17) RPPN 176
Rio das Furnas; 18) RPPN Leão da Montanha; 19 and 20) Serra do Tabuleiro State Park; 21) 177
Aguaí State Biological Reserve; 22) Itapoá Port. 178
179

24
Landscape metrics at multiple spatial extents 180
First, we inserted the geographic coordinates of the sample points into a geographic 181
information system (GIS), using the UTM projection, Zone 22S, Datum WGS 84. Next, we 182
generated buffers of different sizes around these points to represent the various extents of 183
analysis. The buffer sizes were 250 m, 500 m, 1000 m, 1500 m and 2000 m, and they 184
corresponded to similar values that have been used in a previous study that also assessed the 185
relationship between the landscape variables and the occurrence of medium- and large-size 186
carnivores (Lyra-Jorge et al. 2010). 187
To calculate the landscape metrics, we performed a photo-interpretation from high-resolution 188
images available in the applications "Online World Imagery" in the software ArcGIS 10.2.1 189
(ESRI 2011) and "Google Earth" in the "Open Layer plug-in" in the software QGIS 1.8.0 190
(QGIS Development Team 2014). We mapped the area of each landscape on a 1:2,500 scale, 191
covering the largest extent of the analysis, the 2000 m buffer. The source of the images for 192
each landscape was selected based on the quality and the date of the images. We mapped the 193
vegetation cover, land use and land occupation according to the following classes: (i) water 194
bodies; (ii) urban and construction areas; (iii) silviculture; (iv) field, pasture, agriculture and 195
exposed soil; (v) mangrove forest; (vi) forest in initial stage; (vii) forest in medium, advanced 196
or primary stage. We converted the entry maps into the matrix format before calculating the 197
metrics. We calculated the landscape metrics at multiple spatial extents, using the software 198
GRASS 6.4.3 (GRASS Development Team 2014) and some functions in ArcGIS 10.2.1 199
(ESRI 2011); in both cases, we used scripts in the Python language. For each landscape and 200
spatial extent, we calculated the following metrics: forest amount (area of forest in medium, 201
advanced or primary stage, in ha, divided by the landscape area); edge amount (area of edge, 202
in ha, considering a depth of 50 m, divided by the landscape area); patch density (relationship 203
between the number of patches and the area of the landscape); perimeter-area ratio 204

25
(relationship between the perimeter of the forest edge and the relative area of forest); and the 205
Simpson diversity index for landscape. 206
207
Data analysis 208
First, we checked for spatial autocorrelation between our data through the Mantel test (Dale 209
and Fortin 2005). The results (r=0.068; P=0.17) showed no spatial autocorrelation between 210
the occurrence of mammals and the spatial location of the centroids of our 22 landscapes. 211
Next, we checked for multicollinearity of the predictor variables through the Pearson’s 212
correlation test, finding a high correlation between the five extents for all of the landscape 213
metrics (see Supporting Information S3, S4, S5, S6 and S7). We then selected from each 214
metric the extent that best represented a gradient (the extent with the most homogeneous 215
frequency distribution): 500 m for heterogeneity; 1000 m for the relative amount of forest; 216
2000 m for the relative area of edge; 2000 m for the perimeter-area ratio; and 2000 m for 217
patch density. We used the Pearson’s correlation analysis to assess the correlation between 218
these five metrics in their respective spatial extents. We found a high correlation among them 219
(see Supporting Information S8),and based on Fahrig (2013), we selected the ‘forest amount’ 220
metric as the principal measure of the forest habitat fragmentation process. 221
Subsequently, we adopted a redundancy analysis (RDA) to check whether the species 222
composition is explained by the landscape variables (Borcard et al. 2011; Legendre and 223
Legendre 2012). 224
Finally, we used generalized linear models (GLM) to relate the carnivore species richness and 225
the occurrence of each species to the relative amount of forest in the landscape. We adopted a 226
normal distribution for richness and a binomial distribution for occurrence (Zuur et al. 2009). 227
For each response variables (species richness or occurrence of each species), we contrasted 228
the model Y~ forest amount (%) against the null model (representing the absence of effect). 229

26
Corrected Akaike Information Criterion (AICc) values were used to select the best models. 230
We considered all models with ∆AIC < 2 to be equally plausible (Burnham and Anderson 231
2002). We reported the AICc weights (wAICc) for both the ‘forest amount’ and the null 232
models. We used the software R version 3.1.1 for the analyses (R Development Team 2014). 233
234
Results 235
Species richness and forest amount 236
The results partially corroborate our predictions (Table 2). We recorded 10 terrestrial 237
carnivore mammal species associated with forest formations in the 22 studied Atlantic Forest 238
landscapes. We did not analyze the jaguar [Panthera onca (Linnaeus, 1758)] records, because 239
it was detected only in the Turvo State Park landscape. We confirmed that the carnivore 240
species richness is positively related to the forest amount of the 22 studied landscapes (Table 241
3, Figure 2). 242
243
Table 2. — Comparison between expected responses and responses obtained from the 244
analyzes to explain the species richness and the carnivore occurrence in 22 landscapeswithin 245
the southern part of the Brazilian Atlantic Forest. 246
Response variables Expected responses Obtained responses
Species richness positive positive
Species occurrence
Habitat generalist species (group 1)
Cerdocyon thous (Linnaeus, 1766) null null
Puma yagouaroundi (Geoffroy, 1803) null null
Forest-preferring species (group 2)
Leopardus guttulus (Hensel, 1872) positive null
Leopardus wiedii (Schinz, 1821) positive null
Eira barbara (Linnaeus, 1758) positive null
Leopardus pardalis (Linnaeus, 1758) positive positive
27
Response variables Expected responses Obtained responses
Puma concolor (Linnaeus, 1771) positive positive
Forest species tolerant to habitat degradation (group 3)
Galictis cuja (Molina, 1782) negative negative
Nasua nasua (Linnaeus, 1766) negative null
Procyon cancrivorus (Cuvier, 1798) negative null
247
Table 3. — Eleven pairs of concurrent models analyzed to explain the species richness and 248
the carnivore occurrence in 22 landscapeswithin the southern part of the Brazilian Atlantic 249
Forest. 250
Response variables Model* AICc** ∆AICc DF*** wAICc**** Richness Forest amount 80.1 0.0 3 0.82
Null 83.2 3.1 2 0.18 Cerdocyon thous Null 19.7 0.0 1 0.72 (Linnaeus, 1766) Forest amount 21.7 1.9 2 0.28
Puma yagouaroundi Null 25.8 0.0 1 0.77 (Geoffroy, 1803) Forest amount 28.2 2.4 2 0.23
Leopardus guttulus Null 23.1 0.0 1 0.77 (Hensel, 1872) Forest amount 25.4 2.4 2 0.23
Leopardus wiedii Null 25.8 0.0 1 0.59 (Schinz, 1821) Forest amount 26.5 0.7 2 0.41 Eira barbara Forest amount 29.5 0.0 2 0.68
(Linnaeus, 1758) Null 31.0 1.5 1 0.32 Leopardus pardalis Forest amount 12.8 0.0 2 1.00
(Linnaeus, 1758) Null 25.8 12.9 1 0.00 Puma concolor Forest amount 23.0 0.0 2 0.80
(Linnaeus, 1771) Null 25.8 2.8 1 0.20 Galictis cuja Forest amount 28.1 0.0 2 0.90
(Molina, 1782) Null 32.5 4.4 1 0.10 Nasua nasua Null 23.1 0.0 1 0.69
(Linnaeus, 1766) Forest amount 24.7 1.6 2 0.31 Procyon cancrivorus Null 25.8 0.0 1 0.76
(Cuvier, 1798) Forest amount 28.1 2.3 2 0.24 *Null model –relates the species occurrence or species richness with a random value. Forest 251
amount–relates the species occurrence or species richness with the relative amount of forest in 252
the landscape. 253

28
**Corrected Akaike Information Criterion 254
***Degrees of freedom 255
***AICc weight 256
257
258
Figure 2. — Linear relation between carnivore species richness and a gradient of forest 259
amount (%) at the1 km extent for 22 landscapes in the southern part of the Brazilian Atlantic 260
Forest. 261
262
Carnivores species composition and landscape metrics 263
The RDA demonstrated a relationship between species composition and the landscape 264
structure metrics (R2 = 0.34; P< 0.001). The relationships observed in the RDA (Figure 3) are 265
explained mainly by the RDA 1 axis (39.9%), which represents the amount of forest on the 266
landscapes. The RDA 2 axis, with a lower contribution (28.0%), is best explained by the 267
landscape heterogeneity. 268

29
The analysis of the first axis (RDA 1) indicates a strong relationship of Leopardus pardalis 269
(Linnaeus, 1758) and Puma concolor (Linnaeus, 1771) to highly forested landscapes. 270
Leopardus wiedii (Schinz, 1821) was slightly associated to forest amount. On the other hand, 271
Galictis cuja (Molina, 1782) mainly occupies fragmented landscapes. 272
The analysis of the second axis (RDA 2) suggests that Puma yagouaroundi (Geoffroy, 1803) 273
tends to occur in heterogeneous landscapes while Procyon cancrivorus (Cuvier, 1798) and 274
Leopardus guttulus (Hensel, 1872) are associated with landscape with lower heterogeneity, as 275
also observed to P. concolor. Finally, the RDA 2 reveals that Nasua nasua (Linnaeus, 1766), 276
Eira barbara (Linnaeus, 1758), and Cerdocyon thous (Linnaeus, 1766) is very weakly related 277
to both axes and, therefore, does not present an strong association with the landscape 278
variables. 279
280
281
Figure 3. — Redundancy analysis diagram of carnivore occurrence and landscape metrics. 282
Legends to species: Ct — Cerdocyon thous, Py — Puma yagouaroundi, Pco — Puma 283

30
concolor, Lg — Leopardus guttulus, Lw — Leopardus wiedii, Lp — Leopardus pardalis, Eb 284
— Eira barbara, Gc — Galictis cuja, Nn — Nasua nasua, and Pca — Procyon cancrivorus. 285
Legends to landscape metrics: He — Simpson Heterogeneity Index, P-a — Perimeter-area 286
ratio, Pd — Patch density, Ed — Edge amount, and Fo — Forest amount. 287
288
Occurrence of carnivore species and forest amount 289
The pattern of occurrence as a function of the forest amount on the landscape differed among 290
the 10 analyzed species, as verified by the GLM. As predicted, we found that forest amount 291
did not contributed to the occurrence of the habitat generalist species (group 1), C. thous and 292
P. yagouaroundi (Table 3, Figure 4). 293
With respect to the forest-preffering species (group 2), we determined that the occurrences of 294
the small felines, L. guttulus and L. wiedii, and of the tayra, E. barbara, are explained as 295
much by the ‘forest amount’ model as by the null model (Table 3, Figure 4), which suggests 296
that the occurrence of these species is independent of the amount of forest on the studied 297
landscapes. On the other hand, the large felines, L. pardalis and P. concolor, mainly occupied 298
landscapes with a high percentage of forest cover (Table 3, Figure 4). 299
With reference to forest species that are tolerant of habitat degradation (group 3), we 300
ascertained that the occurrence of G. cuja is negatively related to the forest amount (Table 3, 301
Figure 4). Finally, both of the Procyonidae, N. nasua and P. cancrivorus, demonstrate an 302
occurrence that is unrelated to the forest amount on the landscape (Table 3, Figure 4), ‘forest 303
amount’ models and the null models being equally plausible to explain the patterns. 304
305

31
306
Figure 4. — Logistic regression plots of ten carnivore species’ occurrences across a gradient 307
of forest amount (%) at the 1 km extent for 22 landscapes in the southern part of the Brazilian 308
Atlantic Forest. 309

32
310
Discussion 311
Species richness and forest amount 312
We observed a positive influence of the forest amount on the richness of carnivore species in 313
the Atlantic Forest, which reinforces the "Habitat amount hypothesis" proposed by Fahrig 314
(2013). According with Fahrig (2003, 2013), the analysis of the effect of fragmentation must 315
occur at the landscape-level, avoiding the use of the patch as the natural unit of measure and 316
thus weakening the power of patch size to explain species richness on medium- and large-size 317
mammals (as seen in Chiarello 1999; Virgós et al. 2002; Michalski and Peres 2005, 2007; 318
Silva-Jr and Pontes 2008). Recent landscape-level studies have revealed the important 319
influence of other landscape elements on the richness of medium- and large-size mammal 320
species. For example, Lyra-Jorge et al. (2010) showed that species richness is affected mainly 321
by the area of the landscape under the influence of edge effects in areas of Cerrado in 322
southeastern Brazil. Brady et al. (2011) revealed the relevance of matrix attributes to explain 323
the richness of mammal species in the subtropical southeast of Queensland, Australia. 324
325
Occurrence of carnivore species and forest amount 326
In agreement with our predictions, the occurrences of C. thous and P. yagouaroundi (group 1 327
— habitat generalist species) are not related to the amount of forest on the landscape. This is 328
due to the fact that both species are generalists in terms of their use of habitat (Berta 1982; 329
Oliveira 1998a; Michalski et al. 2006; Di Bitetti et al. 2009). 330
The GLM did not reveal a relationship between the occurrences of L. guttulus and L. wiedii 331
(group 2 — forest-preferring species) and the forest amount, contrary to our predictions. 332
Although L. guttulus can occur in areas of predominantly open vegetation such as restinga 333
(Tortato and Oliveira 2005), Goulart et al. (2009) suggested that this species is associated 334

33
with dense forest vegetation. For L. wiedii, we expected greater dependence on forest cover, 335
given that it is considered essentially a forest species, though not exclusively (Oliveira 336
1998b). Nonetheless, our results corroborates a study demonstrating that L. guttulus and L. 337
wiedii forage in agricultural matrices (corn and/or soybean crops) of Atlantic Forest 338
landscapes (Rinaldi et al. 2015). When examining the diets of these species, the authors found 339
the occurrence of synanthropic prey in 44% of the fecal samples of L. guttulus and in 32% of 340
those for L. wiedii. These findings by Rinaldi et al. (2015), together with our results show the 341
necessity of investigating the natural history of these small felines, particularly with respect to 342
habitat use. 343
Contradicting our predictions, E. barbara (group 2 — forest-preferring species) showed a 344
tolerance for forest fragmentation. Despite the proposal by Presley (2000) that E. barbara is 345
rarely found outside of forest environments, Michalski et al. (2006) reported that a tayra 346
monitored by radio-tracking did not show a preference for any habitat type available within its 347
home range in southeastern Brazil. This species was also observed in highly disturbed and 348
fragmented forest landscapes of southern and eastern Brazilian Amazonia (Michalski and 349
Peres 2005). The pattern found by the last authors possibly explains the results we found in 350
this study for E. barbara. 351
The occurrence of L. pardalis (group 2 — forest-preferring species) is limited to landscapes 352
with a high percentage of forest cover. This result corroborates our prediction for the 353
occurrence of this species, which mainly occupies densely forested areas (Murray and 354
Gardner 1997, Goulart et al. 2009). Patterns similar to those we identified in the Atlantic 355
Forest were found through radio telemetry in Texas, where L. pardalis almost exclusively 356
chose areas with high forest cover (>95%) (Harveson et al. 2004). Lyra-Jorge et al. (2010) 357
found that the frequency of L. pardalisis explained by the amount of "cerradão" woodland in 358

34
southeastern Brazil. Thus, we verified that L. pardalis is highly sensitive to the loss of forest 359
cover in the Atlantic Forest. 360
Regarding P. concolor (group 2 — forest-preferring species), despite the indication of low 361
habitat selectivity (Lyra-Jorge et al. 2010; Magioli et al. 2014), we observed that its 362
occurrence is strongly associated with forest cover in the Atlantic Forest landscapes of 363
southern Brazil, as previously determined by Mazzolli (1993). This is possibly due to the 364
pressure of illegal hunting on the species in non-protected areas (with lower percentage of 365
forest cover) by ranchers who seek to minimize the damages this species causes to livestock 366
production (Mazzolli et al. 2000). 367
Galictis cuja´s (group 3 — forest species tolerant of habitat degradation) occurrence in 368
relation to forest fragmentation is in agreement with our prediction. As a species that can 369
inhabit open areas (Yensen and Tarifa 2003) and the edges of forest formations, the 370
probability of its occurrence diminishes as a function of the increment of forest on the 371
landscape. 372
The patterns of occurrence observed for N. nasua and P. cancrivorus (group 3 — forest 373
species tolerant of habitat degradation) contradict our predictions, since the GLM reveals an 374
absence of relationship between these species’ occurrences and the amount of forest on the 375
landscape. Although N. nasua is a species that occupies mainly forested areas (Gompper and 376
Decker 1998) and that forages predominantly in the canopy (Beisiegel and Mantovani 2006), 377
it can also obtain resources in cultivated, degraded and urbanized areas surrounding forest 378
fragments, which likely explains the pattern that we found. The relationship between the 379
occurrence of P. cancrivorus and forest patch density is justified by its selectivity in terms of 380
habitat use—its occurrence is commonly associated with water courses, where they catch 381
their prey—and it rarely occupies the deep forest interior (Emmons and Feer 1997). The 382

35
forest patches where we recorded P.cancrivorus were associated with water courses and 383
represent the ideal conditions for its occupation. 384
It is important to mention that the sampled landscapes consisted of more than 19% forest 385
cover. Consequently, for cases where we found an absence of relationship between species 386
occurrence and forest amount (i.e. when the null model is more or equally plausible compared 387
to the model Y ~ forest amount), minimum limit of 19% forest cover may be above the 388
fragmentation threshold for the analyzed species. 389
390
Landscape changes, carnivore species composition and ecological consequences 391
Except for Turvo State Park, all of the studied landscapes are possible subject to the effects of 392
trophic cascade caused by the absence of the primary apex predator of the Atlantic Forest, the 393
jaguar (P. onca), as proposed by Jorge et al. (2013). The condition of apex predator absence is 394
aggravated by the fact that P. concolor and L. pardalis — second and third largest predators, 395
respectively, in terms of biomass (Paglia et al. 2012) — are absent from a majority of the 396
studied landscapes. Under these conditions, we can expect an increase in the abundance of 397
herbivores and a consequent increase in the rate of herbivory, which affects plant 398
communities (Roemer et al. 2009). For example, Chiarello (1999) found an elevated 399
abundance of herbivores in landscapes with low forest cover in southeastern Brazil. The 400
negative consequences of the increase in herbivore abundance can be even more grievous in 401
the case of invasive exotic species, the main ones in the region being the wild boar (Sus scrofa 402
Linnaeus, 1758) and the hare (Lepus europaeus Pallas, 1778). In addition to herbivory, 403
invasive exotic species can negatively affect native animal species through competition and 404
the transmission of diseases and parasites (Mack et al. 2000). 405
Furthermore, we determined that seven mesocarnivore species (C. thous, P. yagouaroundi, L. 406
guttulus, L. wiedii, E. barbara, N. nasua and P. cancrivorus) occur in landscapes with varying 407

36
degrees of fragmentation and, therefore, occupy the majority of landscapes free from the 408
direct and/or indirect influence of apex and/or top predators. Under these conditions, it is 409
expected that mesocarnivores compound the potential negative effects of increased herbivore 410
abundance, as they exert a strong influence on the dynamics and structure of the communities 411
of their main prey (Crooks and Soulé 1999, Oliveira et al. 2010), which includes small 412
mammals, birds and reptiles. The impacts on these prey may cause the local extinction of 413
species and the loss of their ecological functions (Roemer et al. 2009). 414
415
Conclusion 416
We verified that (a) carnivore species richness is positively related to forest amount and 417
negatively associated to fragmentation, (b) landscape configuration is important for explain 418
carnivore species composition, and (c) forest amount can explain some carnivore species 419
occurrence. Our results reiterate the importance of protecting forest remnants to maintain the 420
high quantity of forest within Neotropics, particularly where originally landscapes was 421
covered by forests. This action is fundamental for the conservation of carnivore species, 422
ecosystems, and the ecological processes in which they participate. We also recognize the 423
importance of complementary actions, such as the restoration of degraded areas and livestock 424
management aimed at reducing hutting as retaliation for livestock predation (e.g. Mazzolli et 425
al. 2000). 426
Additionally we suggest that future researches could analyze landscape in larger spatial 427
extensions for better understand the scale effect. Furthermore, they could include landscapes 428
with very small percentage of forest cover (i.e. <20%), aiming to explore all gradient of forest 429
loss. In respect of the animal database, its import for upcoming works to adopt a standardized 430
sample design, and to analyze data through models that incorporate the imperfect detection, 431
e.g. MacKenzie et al. (2002). Finally, is necessary more details about habitat use by the 432

37
species to assessment the consequences of fragmentation on biodiversity, ecological processes 433
and ecosystem services. 434
435
Acknowledgements 436
We thank Coordenação de Aperfeiçoamento de Pessoal do Ensino Superior (CAPES) for the 437
research fellowships granted to ALR and JAB. Thanks are also extended to Fundação do 438
MeioAmbiente (FATMA) and all reserve owners for areas access authorization, and to the 439
companies ETS and Maurique for data use permission. This research was partially sponsored 440
by FUNPESQUISA/UFSC. MCR received a research grant from CNPq (process 441
312045/2013-1) and is continually supported by FAPESP (process 2013/50421-2). NCC is a 442
CNPq Ecology research fellow in Brazil. We thank M. King, a native English speaker from 443
Canada, for editing the manuscript. 444
445
Literature cited 446
Beisiegel, B. M. and W. Mantovani. 2006. Habitat use, home range and foraging preferences 447
of the coati Nasua nasua in a pluvial tropical Atlantic forest area. Journal of Zoology 269:77–448
87. 449
Berta, A. 1982. Cerdocyon thous. Mammalian Species 186:1–4. 450
Borcard, D., Gillet, F. and P. Legendre. 2011. Numerical Ecology with R. Springer-Verlag. 451
New York, United States of America. 452
Boscolo, D. and J. P. Metzger. 2009. Is bird incidence in Atlantic forest fragments influenced 453
by landscape pattners at multiple scales? Landscape Ecology 24:907-918. 454
Brady, M. J., McAlpine, C. A., Possingham, H. P., Miller, C. J. and G. S. Baxter. 2011. 455
Matrix is important for mammals in landscapes with small amounts of native forest habitat. 456
Landscape Ecology 26:617-628. 457

38
Brodie, J. D., Giordano, A. J. and L. Ambu. 2015. Differential responses of large mammals to 458
logging and edge effects. Mammalian Biology 80: 7-13. 459
Burnham, K. P. and D. R. Anderson. 2002. Model selection and multimodel inference: a 460
practical information-theoretic approach. Springer. New York, United States of America. 461
Chiarello, A. G. 1999. Effects of fragmentation of the Atlantic forest on mammal 462
communities in south-eastern Brazil. Biological Conservation 89:71–82. 463
Crooks, K. and M. Soulé. 1999. Mesopredator release and avifaunal extinctions in a 464
fragmented system. Nature 400:563–566. 465
Di Bitetti, M. S., Di Blanco, Y. E.,Pereira, J. A.,Paviolo, A. and I. J. Pérez. 2009. Time 466
partitioning favors the coexistence of sympatric crab-eating foxes (Cerdocyon thous) and 467
Pampas foxes (Lycalopex gymnocercus). Journal of Mammalogy 90:479–490. 468
Emmons, L. H. and F. Feer. 1997. Neotropical rainforest mammals: a field guide. University 469
of Chicago Press, Chicago, United States of America and London, United Kingdom. 470
ESRI .2011. ArcGIS Desktop: Release 10. Redlands, CA: Environmental Systems Research 471
Institute. 472
Fahrig, L. 2003. Effects of Habitat Fragmentation on Biodiversity. Annual Review of 473
Ecology, Evolution, and Systematics 34:487–515. 474
Fahrig, L. 2013. Rethinking patch size and isolation effects: The habitat amount hypothesis. 475
Journal of Biogeography 40:1649–1663. 476
Fortin, M. J. and M. R. T. Dale. 2005. Spatial analysis: a guide for ecologists. Cambridge 477
University Press. Cambridge, United Kingdom. 478
Giordano, A. J. 2015. Ecology and status of the jaguarundi Puma yagouaroundi: a synthesis 479
of existing knowledge. Mammal Review doi:10.1111/mam.12051. 480
Gompper, M. E. and D. M. Decker. 1998. Nasua nasua. Mammalian Species 580:1–9. 481

39
Goulart, F. V. B., Cáceres, N. C., Graipel, M. E., Tortato, M. A., Ghizoni, I. R. and L. G. R. 482
Oliveira-Santos. 2009. Habitat selection by large mammals in a southern Brazilian Atlantic 483
Forest. Mammalian Biology 74:182–190. 484
GRASS Development Team. 2014. Geographic Resources Analysis Support System 485
(GRASS) Software, Version 6.4.3. Open Source Geospatial Foundation. 486
Harvenson, P. M., Tewes, M. E., Anderson, G. L. and L. L. Laack. 2004. Habitat use by 487
ocelots in south Texas: Implications for restoration. Wildlife Society Bulletin 32:948–954. 488
IBGE - Instituto Brasileiro de Geografia e Estatística. 2004. Mapa da vegetação do Brasil. 489
www.ibge.gov.br. Accessed 20 November 2015. 490
Jackson, H. B. and L. Fahrig. 2012. What size is a biologically relevant landscape? Landscape 491
Ecology 27: 929-941. 492
Jackson, H. B. and L. Fahrig. 2014. Are ecologists conducting research at the optimal scale? 493
Global Ecology and Biogeography 24:52–63. 494
Jorge, L. S. P., Galetti, M., Ribeiro, M. C. and K. M. P. M. B. Ferraz. 2013. Mammal 495
defaunation as surrogate of trophic cascades in a biodiversity hotspot. Biological 496
Conservation 163:49–57. 497
Legendre, P. and L. Legendre (Eds.). 2012. Numerical Ecology. 3 ed. Elsevier Science. 498
Amsterdam, The Netherlands. 499
Lyra-Jorge, M. C., Ribeiro, M. C., Ciocheti, G., Tambosi, L. R. and V. R. Pivello. 2010. 500
Influence of multi-scale landscape structure on the occurrence of carnivorous mammals in a 501
human-modified savanna, Brazil. European Journal of Wildlife Research 56:359–368. 502
MacArthur, R. and E. Wilson. 1967. The Theory of Biogeography. Princeton University 503
Press, New Jersey. 504

40
Mack, R. N., Simberloff, D., Londsdale, W. M., Evans, H., Clout, M. and F. A. Bazzaz. 2000. 505
Biotic invasions: causes, epidemiology, global consequences, and control. Ecological 506
Applications 10(3): 689-710. 507
MacKenzie, D. I., Nichols, J. D., Lachman, G. B., Droege, S., Royle, A. and C. A. Langtimm. 508
2002. Estimating site occupancy rates when detection probabilities are less than one. Ecology 509
83(8): 2248-2255. 510
Magioli, M., Moreira, M. Z., Ferraz, K. M. B., Miotto, R. A., Camargo, P. B., Rodrigues, M. 511
G., Canhoto, M. C. S. and E. F. Setz. 2014. Stable Isotope Evidence of Puma concolor 512
(Felidae) Feeding Patterns in Agricultural Landscapes in Southeastern Brazil. Biotropica 513
46:451–460. 514
Magioli, M., Ribeiro, M. C., Ferraz,K. M. P. M. B. and M. G. Rodrigues. 2015. Thresholds in 515
the relationship between functional diversity and patch size for mammals in the Brazilian 516
Atlantic Forest. Animal Conservation: doi:10.1111/acv.12201. 517
Mazzolli, M. 1993. Ocorrência de Puma concolor (Linnaeus)(Felidae, Carnivora) em áreas de 518
vegetação remanescente de Santa Catarina, Brasil. Revista Brasileira de Zoologia 10:581-587. 519
Mazzolli, M., Graipel, M. E. and N. Dunstone. 2000. Mountain lion depredation incidents in 520
southern Brazil. Biological Conservation 105:43–51. 521
Mccallum, J. 2013. Changing use of camera traps in mammalian field research: Habitats, taxa 522
and study types. Mammal Review 43:196–206. 523
Michalski, F. and C. Peres. 2005. Anthropogenic determinants of primate and carnivore local 524
extinctions in a fragmented forest landscape of southern Amazonia. Biological Conservation 525
124: 383-396. 526
Michalski, F., Crawshaw, P. G., Oliveira,T. G. and M. E. Fabián. 2006. Notes on home range 527
and habitat use of three small carnivore species in a disturbed vegetation mosaic of 528
southeastern Brazil. Mammalia:52–57. 529

41
Michalski, F. and C. Peres. 2007. Disturbance-mediated mammal persistence and abundance-530
area relationships in Amazonian forest fragments. Conservation Biology 21(6): 1626-1640. 531
MMA - Ministério do MeioAmbiente. 2014. Portaria No 444, de 17 de dezembro de 2014. 532
Lista Nacional Oficial de Espécies da Fauna Ameaçadas de Extinção. Brasília: Instituto Chico 533
Mendes para Conservação da Biodiversidade- ICMBio. 534
Murray, J. L. and G. L. Gardner. 1997. Leopardus pardalis. Mammalian Species 548:1–10. 535
Myers, N., Mittermeier, R. A., Mittermeier, C. G., Fonseca,G. A. B. and J. Kent. 2000. 536
Biodiversity hotspots for conservation priorities. Nature 403:853–8. 537
Oliveira, T. G. 1998. Herpailurus yagouaroundi. Mammalian Species 578:1–6. 538
Oliveira, T. G. 1998. Leopardus wiedii. Mammalian Species 579:1–6. 539
Oliveira, T. G., Tortato, M. A., Silveira, L., Kasper, C. B., Mazim, F. D., Lucherini, M., 540
Jácomo, A. T., Soares, J. B. G., Marques, R. V. and M. Sunquist. 2010. Ocelot ecology and its 541
effect on the small-felid guild in the lowland Neotropics. In: Macdonald, D.W. and A. 542
Loveridge (Org.). Biology and Conservation of Wild Felids. Oxford University Press. Oxford, 543
United Kingdom. 544
Paglia, A. P., Fonseca, G. A. B., Rylands, A. B., Herrmann, G., Aguiar, L. M. S., Chiarello, 545
A. G., Leite, Y. L. R., Costa, L. P., Siciliano, S., Kierulff, M. C. M., Mendes, S. L., Tavares, 546
V. C., Mittermeier, R. A. and Patton, J. L. 2012. Lista anotada dos mamíferos do Brasil. 547
Occasional Papers in Conservation Biology 4:1–38. 548
Presley, S. J. 2000. Eira barbara. Mammalian Species 636:1–6. 549
QGIS Development Team. 2014. QGIS Geographic Information System. Open Source 550
Geospatial Foundation Project. 551
R Core Team 2014. R: A language and environment for statistical computing: Vienna, 552
Austria: R Foundation for Statistical Computing. 553

42
Ribeiro, M. C., Metgzer, J. P., Martensen, A. C., Ponzoni, F. J. and M. M. Hirota. 2009. The 554
Brazilian Atlantic Forest: How much is left, and how is the remaining forest distributed? 555
Implications for conservation. Biological Conservation 142:1141–1153. 556
Rinaldi, A. R., Rodriguez, F. H., Carvalho, A. L. and F. C. Passos. 2015. Feeding of small 557
Neotropical felids (Felidae: Carnivora) and trophic niche overlap in anthropized mosaic 558
landscape of South Brazil. Biotemas 28:155–168. 559
Roemer, G. W., Gompper,M. E. and B. Van Valkenburgh. 2009. The Ecological Role of the 560
Mammalian Mesocarnivore. BioScience 59:165–173. 561
Schipper, J. et al. 2008. The Status of the World’s Land. Science 322:225–230. 562
Silva-Jr, A. P. and A. R. M. Pontes. 2008. The effect of a mega-fragmentation process on 563
large mammal assemblages in the highly-threatened Pernambuco Endemism Centre, north-564
eastern Brazil. Biodiversity and Conservation 17:1455–1464. 565
Tobler, M. W., Carrillo-Percastegui, S. E., Leite Pitman, R., Mares, R. and G. Powell. 2008. 566
An evaluation of camera traps for inventorying large- and medium-sized terrestrial rainforest 567
mammals. Animal Conservation 11:169–178. 568
Tortato, M. A. and T. G. Oliveira. 2005. Ecology of the Oncilla (Leopardus tigrinus) at Serra 569
do Tabuleiro State Park, Southern Brazil. Cat News 42:28–30. 570
Umetsu, F., Metzger, J. P. and R. Pardini. 2008. Importance of estimating matrix quality for 571
modeling species distribution in complex tropical landscapes: a test with Atlantic forest small 572
mammals. Ecography 31: 359-370. 573
Valiente-Banuet, A., Aizen, M. A., Alcántara, J. M., Arroyo, J., Cocucci, A., Galetti, M. 574
García, M. B., García, D., Gómez, J. M., Jordano, P., Medel, R., Navarro, L., Obeso, J. R., 575
Oviedo, R., Ramírez, N., Rey, P. J., Traveset, A., Verdú, M. and R. Zamora. 2015. Beyond 576
species loss: the extinction of ecological interactions in a changing world. Functional Ecology 577
29:299–307. 578
43
Vibrans, A. C., Sevegnani, L., Gasper, A. L., Lingner, D. V. (eds.) 2012. Inventário Florístico 579
Florestal de Santa Catarina. Volume I. Diversidade e Conservação dos Remanescentes 580
Florestais. Edifurb Press. Blumenau, Brasil. 581
Virgós, E., Tellería, J. L. and T. Santos. 2002. A comparison on the response to forest 582
fragmentation by medium-sized Iberian carnivores in central Spain. Biodiversity and 583
Conservation 11: 1063-1079. 584
Yensen, E. and T. Tarifa. 2003. Galictis cuja. Mammalian Species 728:1–8. 585
Zuur, A.F., Ieno, E.N., Walker, N.J., Saveliev, A.A., and G. M. Smith. 2009. Mixed Effects 586
Models and Extensions in Ecology with R. Springer Ed. New York, United States of America. 587

44
Supporting Information 588
Supporting Information S1. — Vegetation type, centroid geographic coordinates (UTM Zone 22S, datum WGS84), and landscape metrics of 589
the study areas. Legend: 1) TurvoState Park; 2) AraucáriasState Park; 3) QuebraQueixo Hydropower plant; 4, 5, and 6) Foz do Chapecó 590
Hydropower plant; 7) Arvoredo Small Hydropower; 8) Plano Alto Small Hydropower; 9) Alto Irani Small Hydropower; 10) Ipumirim; 11) 591
Passos Maia Small Hydropower; 12) Salto Góes Small Hydropower; 13) Private Natural Reserve (RPPN) Chácara Edith; 14, 15and 16) RPPN 592
Caraguatá; 17) RPPN Rio das Furnas; 18) RPPN Leão da Montanha; 19 and 20) Serra do TabuleiroState Park; 21) AguaíState Biological 593
Reserve;22) Itapoá Port. DF - Deciduous Forest; MOF - Mixed Ombrophilous Forest, DOF - Dense Ombrophilous Forest; NF - Natural Fields. 594
Code Area Longitude Latitude Vegetation
type
Landscapearea
(ha)
Forest
amount
Edge
amount
Patch
density
Perimeter-
area ratio Heterogeneity
1 PET 204632 6984513 DF 3235.4 0.988 0.39 4.60E-07 0.004 0.499
2 PEA 342891 7071760 DF/MOF 2473.4 0.598 4.38 2.97E-06 0.077 0.499
3 QQ 345870 7050390 DF/MOF 1977.3 0.200 10.02 9.11E-06 0.443 0.696
4 FZ3 305248 6985635 DF/MOF 1771.4 0.308 10.57 7.25E-06 0.460 0.674
5 FZ2 324093 6992101 DF/MOF 1438.3 0.480 8.15 9.84E-06 0.171 0.652
6 FZ1 342830 6986312 DF/MOF 1919.8 0.523 9.23 7.63E-06 0.192 0.616
7 ARV 354587 7007473 DF/MOF 2078.3 0.189 9.09 1.46E-05 0.559 0.655
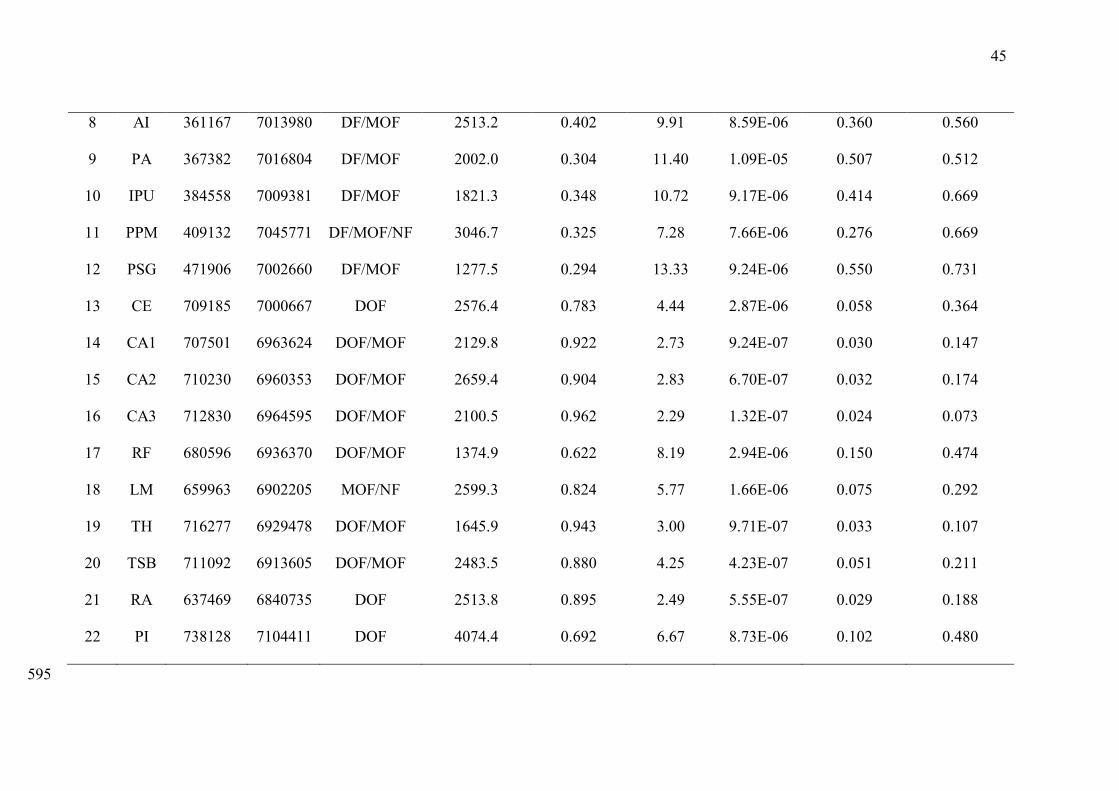
45
8 AI 361167 7013980 DF/MOF 2513.2 0.402 9.91 8.59E-06 0.360 0.560
9 PA 367382 7016804 DF/MOF 2002.0 0.304 11.40 1.09E-05 0.507 0.512
10 IPU 384558 7009381 DF/MOF 1821.3 0.348 10.72 9.17E-06 0.414 0.669
11 PPM 409132 7045771 DF/MOF/NF 3046.7 0.325 7.28 7.66E-06 0.276 0.669
12 PSG 471906 7002660 DF/MOF 1277.5 0.294 13.33 9.24E-06 0.550 0.731
13 CE 709185 7000667 DOF 2576.4 0.783 4.44 2.87E-06 0.058 0.364
14 CA1 707501 6963624 DOF/MOF 2129.8 0.922 2.73 9.24E-07 0.030 0.147
15 CA2 710230 6960353 DOF/MOF 2659.4 0.904 2.83 6.70E-07 0.032 0.174
16 CA3 712830 6964595 DOF/MOF 2100.5 0.962 2.29 1.32E-07 0.024 0.073
17 RF 680596 6936370 DOF/MOF 1374.9 0.622 8.19 2.94E-06 0.150 0.474
18 LM 659963 6902205 MOF/NF 2599.3 0.824 5.77 1.66E-06 0.075 0.292
19 TH 716277 6929478 DOF/MOF 1645.9 0.943 3.00 9.71E-07 0.033 0.107
20 TSB 711092 6913605 DOF/MOF 2483.5 0.880 4.25 4.23E-07 0.051 0.211
21 RA 637469 6840735 DOF 2513.8 0.895 2.49 5.55E-07 0.029 0.188
22 PI 738128 7104411 DOF 4074.4 0.692 6.67 8.73E-06 0.102 0.480
595
46
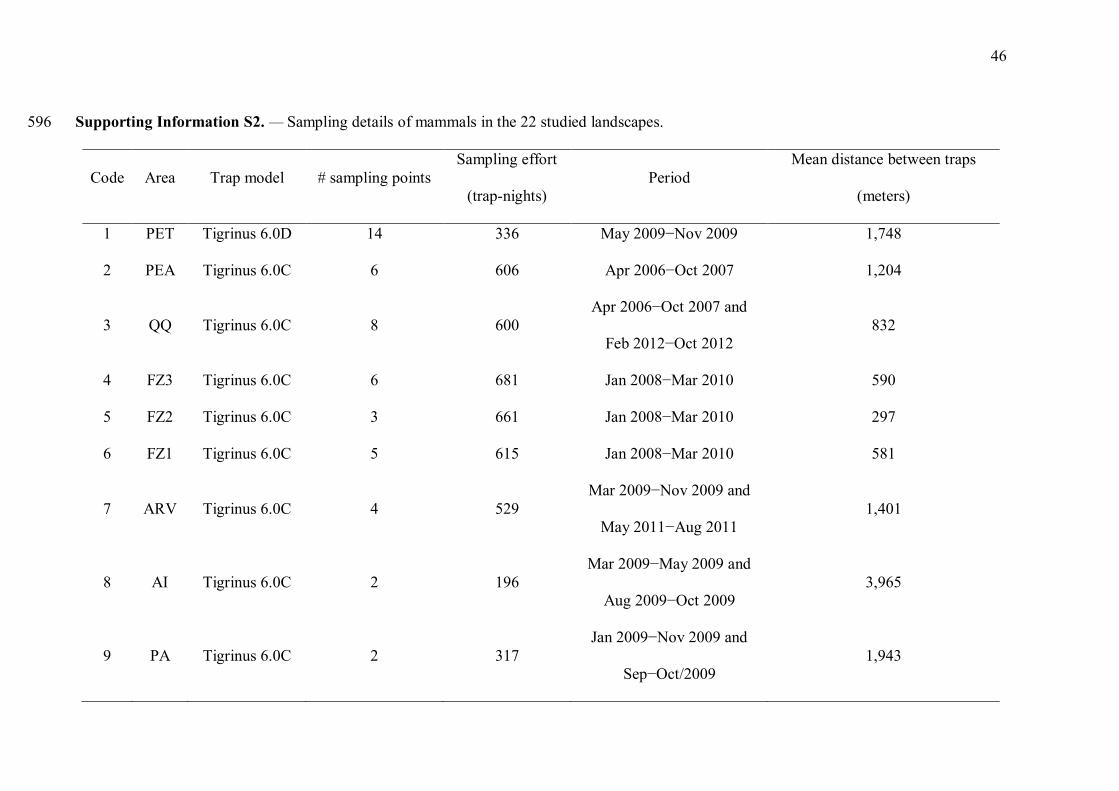
Supporting Information S2. — Sampling details of mammals in the 22 studied landscapes. 596
Code Area Trap model # sampling points Sampling effort
(trap-nights) Period
Mean distance between traps
(meters)
1 PET Tigrinus 6.0D 14 336 May 2009−Nov 2009 1,748
2 PEA Tigrinus 6.0C 6 606 Apr 2006−Oct 2007 1,204
3 QQ Tigrinus 6.0C 8 600 Apr 2006−Oct 2007 and
Feb 2012−Oct 2012 832
4 FZ3 Tigrinus 6.0C 6 681 Jan 2008−Mar 2010 590
5 FZ2 Tigrinus 6.0C 3 661 Jan 2008−Mar 2010 297
6 FZ1 Tigrinus 6.0C 5 615 Jan 2008−Mar 2010 581
7 ARV Tigrinus 6.0C 4 529 Mar 2009−Nov 2009 and
May 2011−Aug 2011 1,401
8 AI Tigrinus 6.0C 2 196 Mar 2009−May 2009 and
Aug 2009−Oct 2009 3,965
9 PA Tigrinus 6.0C 2 317 Jan 2009−Nov 2009 and
Sep−Oct/2009 1,943

47
10 IPU Tigrinus 6.0D 11 180 Oct 2010−Jul 2011 618
11 PPM Tigrinus 6.0C 6 345 Jun 2010−Feb 2012 1,804
12 PSG Tigrinus 6.0C 3 333 Sep 2010−Nov 2012 266
13 CE Tigrinus 6.0C 16 862 Aug 2008−Jun 2010 1,008
14 CA1 Tigrinus 6.0C 5 467 Aug2005−Dec 2006 966
15 CA2 Tigrinus 6.0C 5 444 Aug 2005−Dec 2006 1,533
16 CA3 Tigrinus 6.0C 4 523 Aug 2005−Dec 2006 1,130
17 RF Bushnell HD 11 455 May 2011−Jul 2013 116
18 LM Bushnell HD 13 910 Sep 2006−Oct2007 1,088
10 TH Tigrinus 6.0C 7 401 Nov 2005−Jul 2006 362
20 TSB Tigrinus 6.0C 9 495 Jan 2005−Nov 2006 1,150
21 RA Tigrinus 6.0D 6 200 Mar 2007−Apr 2008 1,468
22 PI Bushnell HD 35 298 Dec 2010−Aug 2011 2,390
597
598

48
Supporting Information S3. — Scatter plot matrices of the correlation of Simpson landscape 599
heterogeneity index among five extents. 600
601
602
Supporting Information S4. — Scatter plot matrices of the correlation of forest amount 603
among five extents. 604
605
606

49
Supporting Information S5. — Scatter plot matrices of the correlation of relative edge 607
amount among five extents. 608
609
610
Supporting Information S6. — Scatter plot matrices of the correlation of perimeter-area 611
ratio among five extents. 612
613
614

50
Supporting Information S7. — Scatter plot matrices of the correlation of patch density 615
among five extents. 616
617
618
Supporting Information S8. — Scatter plot matrices of the correlation of Simpson landscape 619
heterogeneity index (at 500 m extent), relative forest amount (at 1000 m extent), relative edge 620
area (at 2000 m extent), perimeter-area ratio (at 2000 m extent), and patch density (at 2000 m 621
extent). 622
623

51
CONCLUSÃO 624
625
Verifiquei neste trabalho a importância de características da paisagem sobre a diversidade de 626
mamíferos carnívoros na Mata Atlântica utilizando armadilhamento fotográfico e sistemas de 627
informações geográficas. Observei que a riqueza de carnívoros está relacionada 628
positivamente com a quantidade de floresta e é negativamente afetada por outras métricas da 629
paisagem. Além disso, verifiquei que a ocorrência das espécies varia de acordo com a sua 630
sensibilidade à perda de floresta, possivelmente devido ao uso de habitat. Deste modo, nossos 631
resultados corroboram a Hipótese da Quantidade de Habitat (Fahrig 2013). 632
Ainda, os resultados reiteram a importância de proteção de remanescentes florestais para a 633
manutenção da alta quantidade de floresta em paisagens da Mata Atlântica. Esta ação é 634
fundamental para a conservação de espécies de carnívoros, ecossistemas e processos 635
ecológicos nos quais elas estão envolvidas. 636
Apesar do contínuo aumento da quantidade de dados levantados em campo sobre as espécies, 637
principalmente para estudos de avaliação de impacto ambiental, poucos esforços tem sido 638
investidos na integração das informações. Verifiquei que, apesar das diferenças nos métodos 639
de amostragem, integrar informações podem auxiliar na compreensão das respostas dos 640
animais a alterações na paisagem e contribuir para o conhecimento sobre a ecologia de 641
espécies pouco estudadas. 642
643

52
REFERÊNCIAS Boscolo, D. and J. P. Metzger. 2009. Is bird incidence in Atlantic forest fragments influenced
by landscape pattners at multiple scales? Landscape Ecology 24:907-918.
Brady, M. J., McAlpine, C. A., Possingham, H. P., Miller, C. J. and G. S. Baxter. 2011.
Matrix is important for mammals in landscapes with small amounts of native forest habitat.
Landscape Ecology 26:617-628.
Brodie, J. D., Giordano, A. J. and L. Ambu. 2015. Differential responses of large mammals to
logging and edge effects. Mammalian Biology 80:7-13.
Crooks, K. and M. Soulé. 1999. Mesopredator release and avifaunal extinctions in a
fragmented system. Nature 400:563–566.
Fahrig, L. 2003. Effects of Habitat Fragmentation on Biodiversity. Annual Review of
Ecology, Evolution, and Systematics 34:487–515.
Fahrig, L. 2013. Rethinking patch size and isolation effects: The habitat amount hypothesis.
Journal of Biogeography 40:1649–1663.
Jackson, H. B. and L. Fahrig. 2012. What size is a biologically relevant landscape? Landscape
Ecology 27: 929-941.
Jackson, H. B. and L. Fahrig. 2014. Are ecologists conducting research at the optimal scale?
Global Ecology and Biogeography 24:52–63.
Jorge, L. S. P., Galetti, M., Ribeiro, M. C. and K. M. P. M. B. Ferraz. 2013. Mammal
defaunation as surrogate of trophic cascades in a biodiversity hotspot. Biological
Conservation 163:49–57.
Lyra-Jorge, M. C., Ribeiro, M. C., Ciocheti, G., Tambosi, L. R. and V. R. Pivello. 2010.
Influence of multi-scale landscape structure on the occurrence of carnivorous mammals in a
human-modified savanna, Brazil. European Journal of Wildlife Research 56:359–368.

53
Mccallum, J. 2013. Changing use of camera traps in mammalian field research: Habitats, taxa
and study types. Mammal Review 43:196–206.
Roemer, G. W., Gompper, M. E. and B. Van Valkenburgh. 2009. The Ecological Role of the
Mammalian Mesocarnivore. BioScience 59:165–173.
Schipper, J. et al. 2008. The Status of the World’s Land. Science 322:225–230.
Tobler, M. W., Carrillo-Percastegui, S. E., Leite Pitman, R., Mares, R. and G. Powell. 2008.
An evaluation of camera traps for inventorying large- and medium-sized terrestrial rainforest
mammals. Animal Conservation 11:169–178.
Virgós, E., Tellería, J. L. and T. Santos. 2002. A comparison on the response to forest
fragmentation by medium-sized Iberian carnivores in central Spain. Biodiversity and
Conservation 11:1063-1079.