Embed Size (px)
Citation preview
Foreshadowing the tracks of tropical depressions and cyclonic storms and
understanding their thermodynamical structure over Bay of Bengal and Arabian sea
using TOVS and ATOVS data
R. Suresh,India Meteorological Department,
Chennai, India 600 [email protected]; [email protected]
Conventional vis-à-vis Satellite soundingsDeficiencies in Conventional soundings• Radio sonde data has inherent errors (both instrumental
and radiation related).• Different types of Radio Sonde instruments are used
throughout the world (inter-comparison is difficult).• Irregular coverage of the earth’s surface and practically
no data over oceanic and inaccessible areas optimum interpolation/ objective analysis needed for use in NWP.
Advantages of Satellite soundings• Cover land and ocean alike.• Frequent observation / measurement through satellites are
possible in comparison to twice a day Radio sonde observations.
• Spatial accuracy is far better than the conventional soundings.
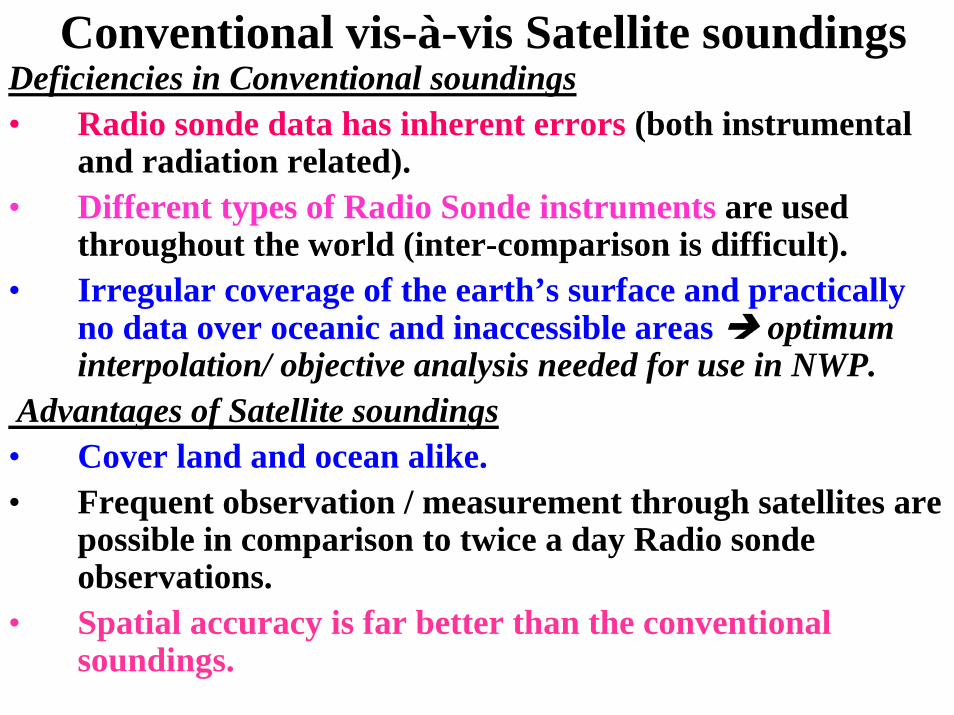
TOVS validation at IMD, ChennaiHRPT Direct Readout Ground Station at IMD, Chennai used one step physical retrieval to solve the Radiative Transfer Equation (RTE) during 1996-1998.Initial guess has been obtained from (i) climatology(ii) regression estimates using stratospheric level HIRS channels and MSU channels which are mostly unaffected by clouds.Validation of upper air temperature, dew point, was carried out as a matter of routine with collocated ( ± 100km , ± 2 hours between soundings) Indian RS / RW stations for 00 and 12UTC. Temperature between 700 and 400 hPa agrees well with RS/RW within a root mean squared bias of 2.5 oC and g.p.m less than 100m during 1996-’98.
Mean temperature bias (Satellite – RadioSonde)
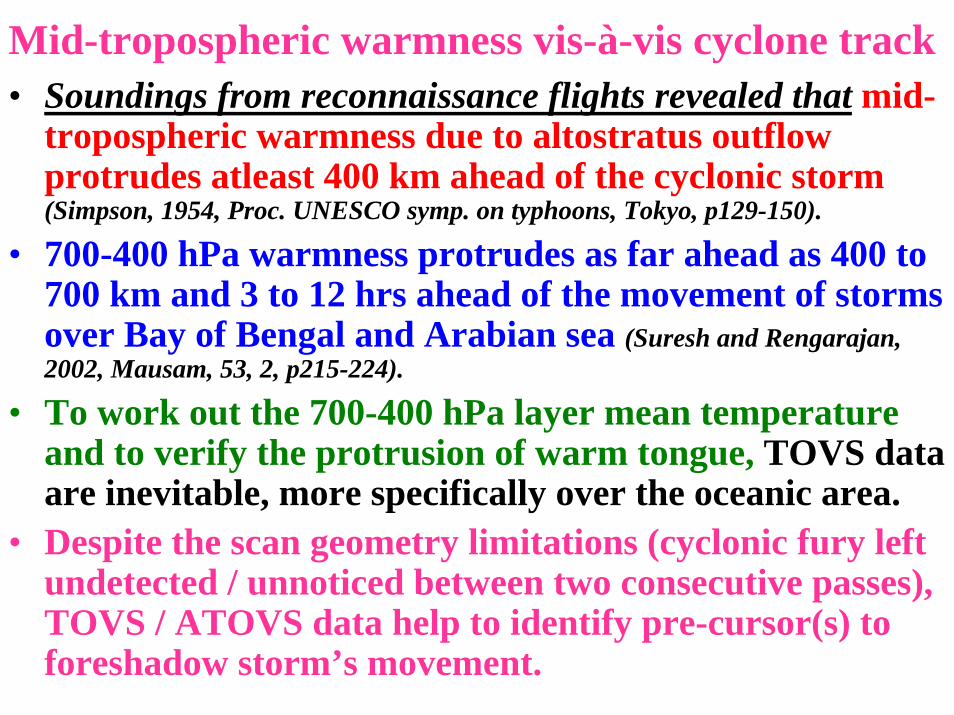
Mid-tropospheric warmness vis-à-vis cyclone track• Soundings from reconnaissance flights revealed that mid-
tropospheric warmness due to altostratus outflow protrudes atleast 400 km ahead of the cyclonic storm(Simpson, 1954, Proc. UNESCO symp. on typhoons, Tokyo, p129-150).
• 700-400 hPa warmness protrudes as far ahead as 400 to 700 km and 3 to 12 hrs ahead of the movement of storms over Bay of Bengal and Arabian sea (Suresh and Rengarajan, 2002, Mausam, 53, 2, p215-224).
• To work out the 700-400 hPa layer mean temperature and to verify the protrusion of warm tongue, TOVS data are inevitable, more specifically over the oceanic area.
• Despite the scan geometry limitations (cyclonic fury left undetected / unnoticed between two consecutive passes), TOVS / ATOVS data help to identify pre-cursor(s) to foreshadow storm’s movement.
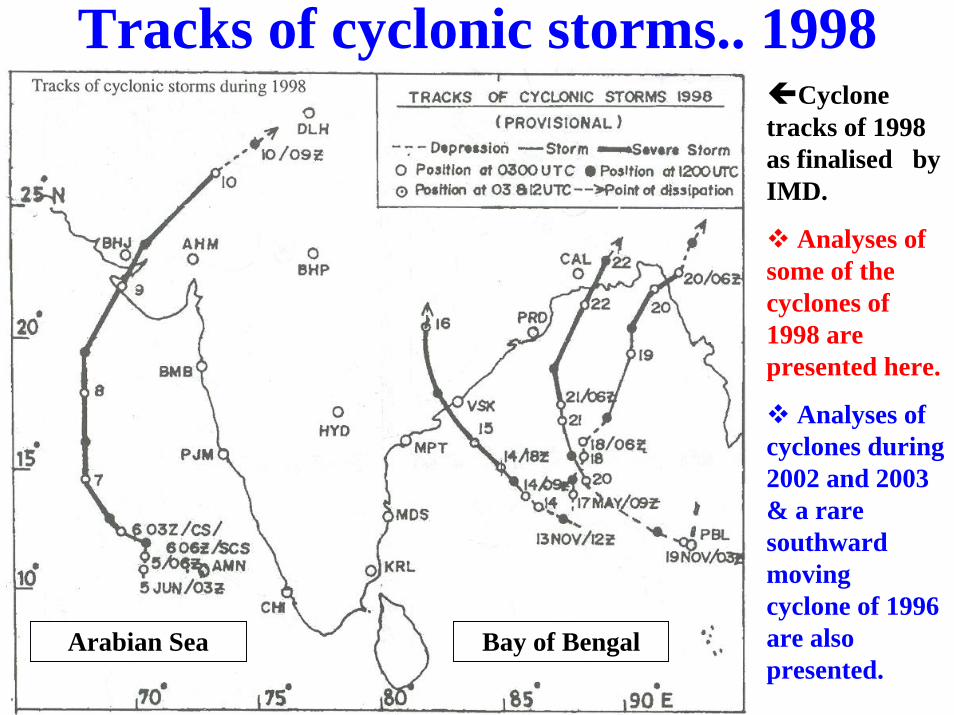
Tracks of cyclonic storms.. 1998Cyclone
tracks of 1998 as finalised by IMD.
Analyses of some of the cyclones of 1998 are presented here.
Analyses of cyclones during 2002 and 2003 & a rare southward moving cyclone of 1996 are also presented.
Bay of BengalArabian Sea
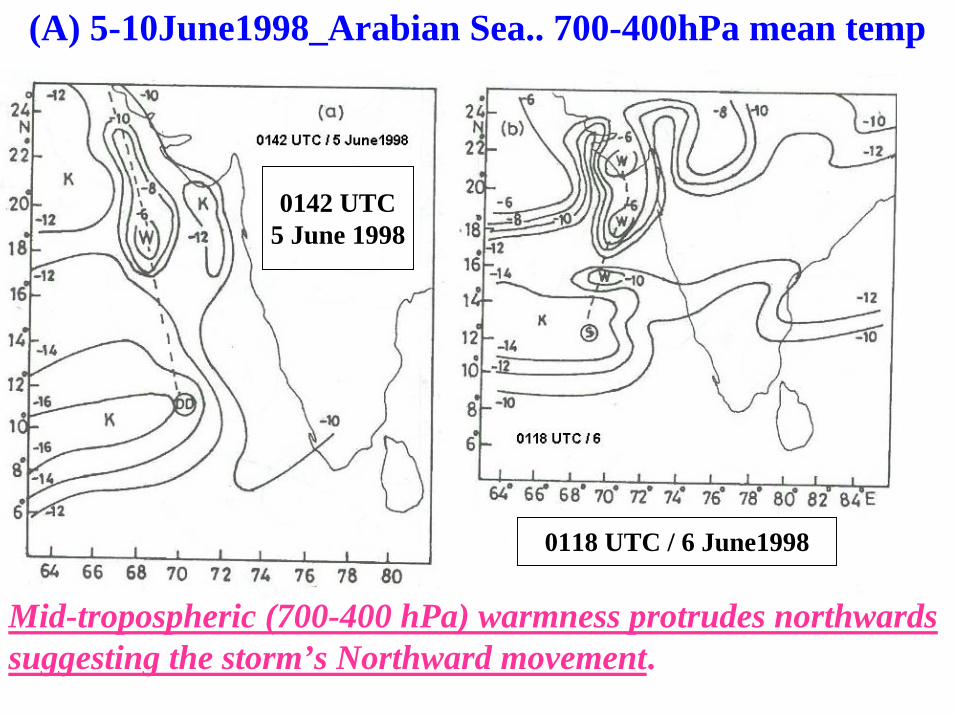
(A) 5-10June1998_Arabian Sea.. 700-400hPa mean temp
Mid-tropospheric (700-400 hPa) warmness protrudes northwards suggesting the storm’s Northward movement.
0118 UTC / 6 June1998
0142 UTC5 June 1998
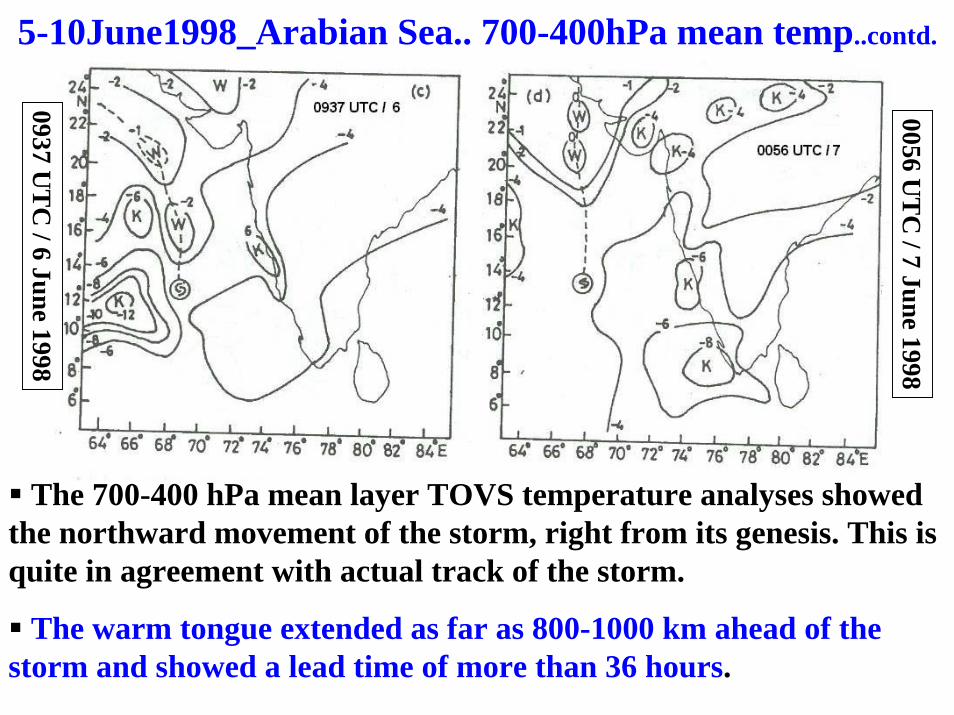
5-10June1998_Arabian Sea.. 700-400hPa mean temp..contd.
The 700-400 hPa mean layer TOVS temperature analyses showed the northward movement of the storm, right from its genesis. This is quite in agreement with actual track of the storm.
The warm tongue extended as far as 800-1000 km ahead of the storm and showed a lead time of more than 36 hours.
0937 UT
C / 6 June 1998
0056 UT
C / 7 June 1998
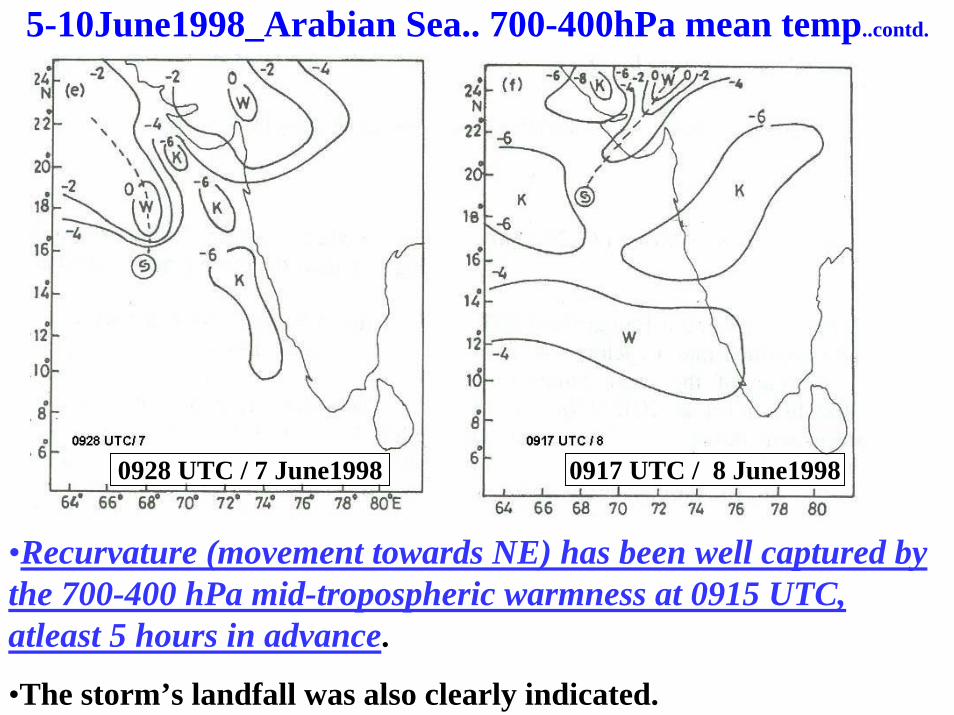
5-10June1998_Arabian Sea.. 700-400hPa mean temp..contd.
0928 UTC / 7 June1998 0917 UTC / 8 June1998
•Recurvature (movement towards NE) has been well captured by the 700-400 hPa mid-tropospheric warmness at 0915 UTC,atleast 5 hours in advance.
•The storm’s landfall was also clearly indicated.
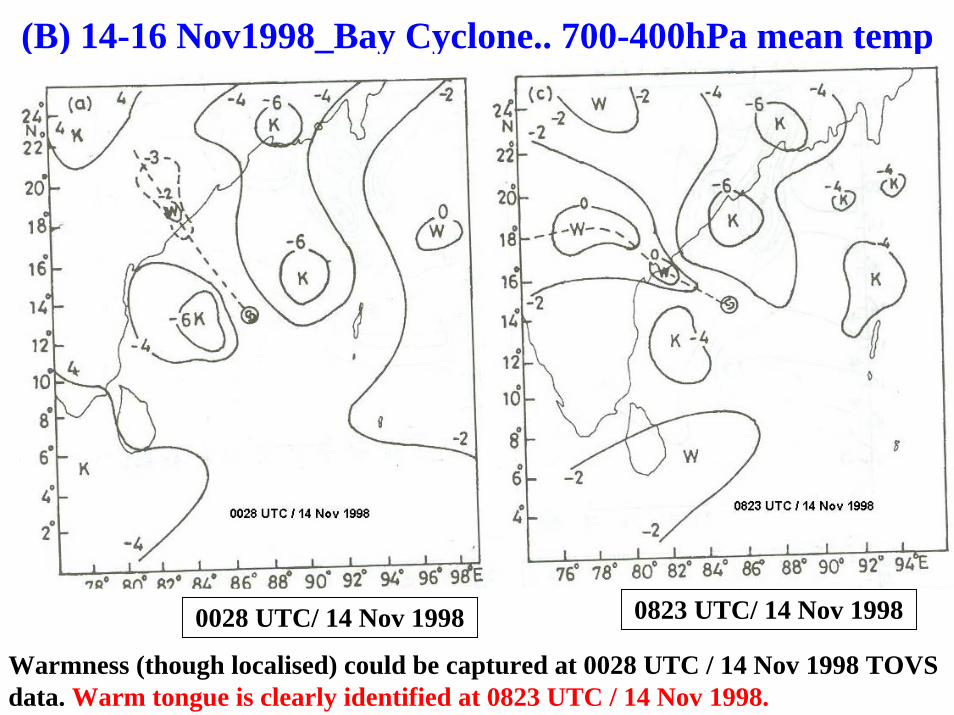
(B) 14-16 Nov1998_Bay Cyclone.. 700-400hPa mean temp
0028 UTC/ 14 Nov 1998 0823 UTC/ 14 Nov 1998
Warmness (though localised) could be captured at 0028 UTC / 14 Nov 1998 TOVS data. Warm tongue is clearly identified at 0823 UTC / 14 Nov 1998.
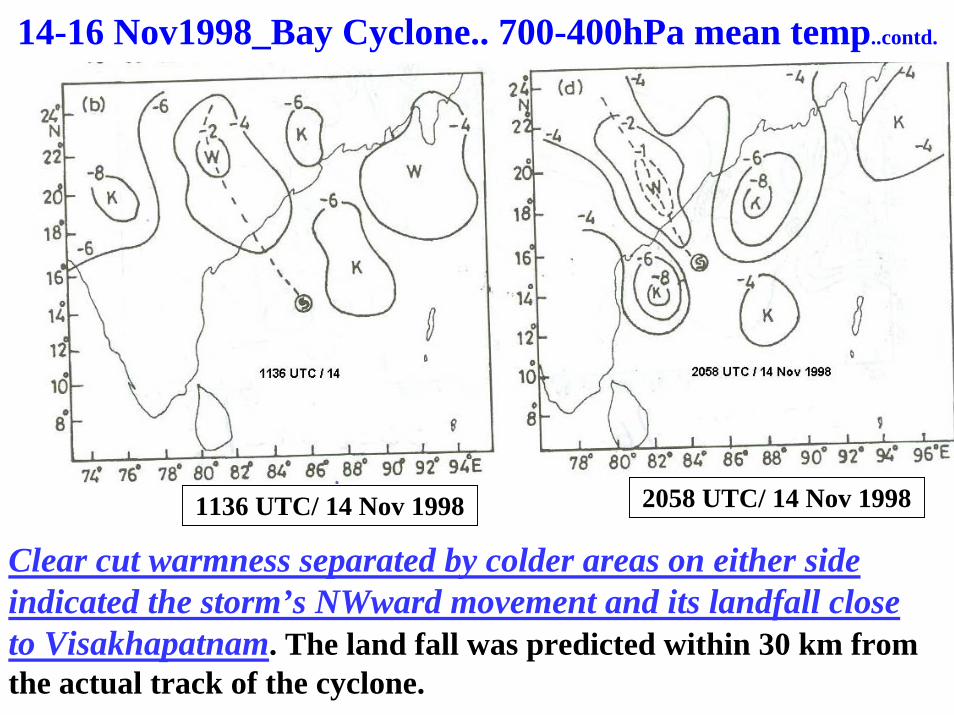
14-16 Nov1998_Bay Cyclone.. 700-400hPa mean temp..contd.
1136 UTC/ 14 Nov 1998 2058 UTC/ 14 Nov 1998
Clear cut warmness separated by colder areas on either side indicated the storm’s NWward movement and its landfall close to Visakhapatnam. The land fall was predicted within 30 km from the actual track of the cyclone.
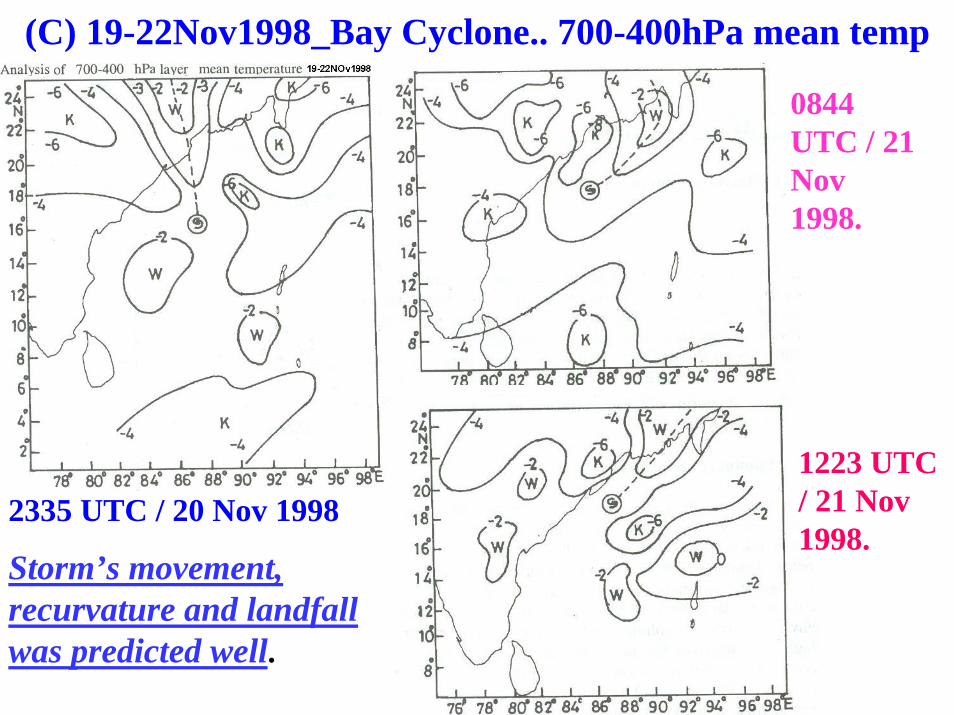
(C) 19-22Nov1998_Bay Cyclone.. 700-400hPa mean temp
2335 UTC / 20 Nov 19981223 UTC / 21 Nov 1998.
0844 UTC / 21 Nov 1998.
Storm’s movement, recurvature and landfall was predicted well.
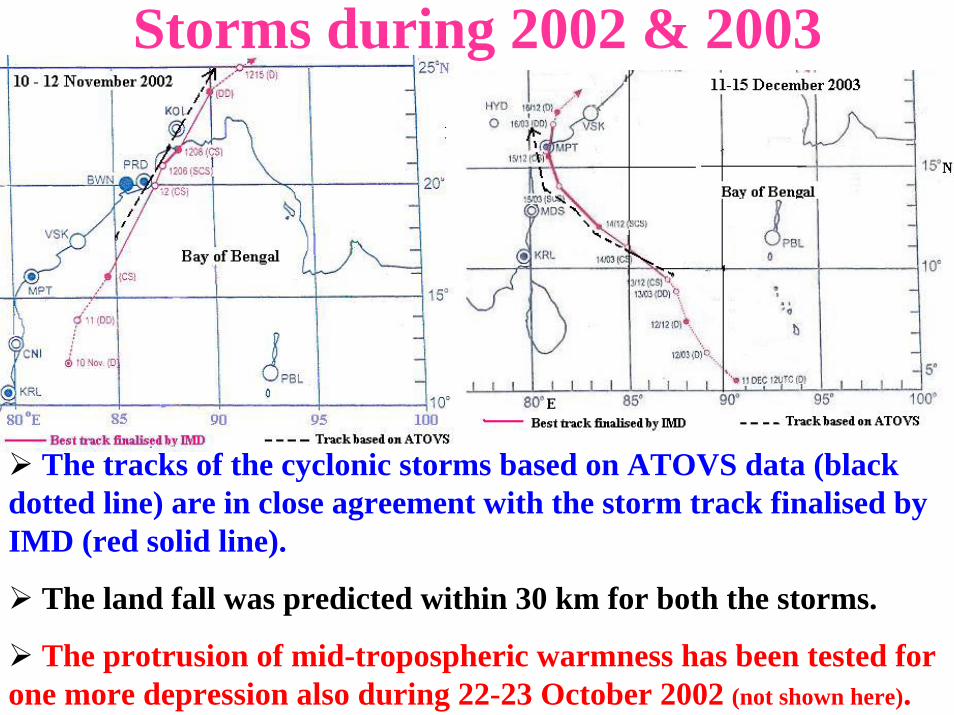
Storms during 2002 & 2003
The tracks of the cyclonic storms based on ATOVS data (black dotted line) are in close agreement with the storm track finalised by IMD (red solid line).
The land fall was predicted within 30 km for both the storms.
The protrusion of mid-tropospheric warmness has been tested for one more depression also during 22-23 October 2002 (not shown here).
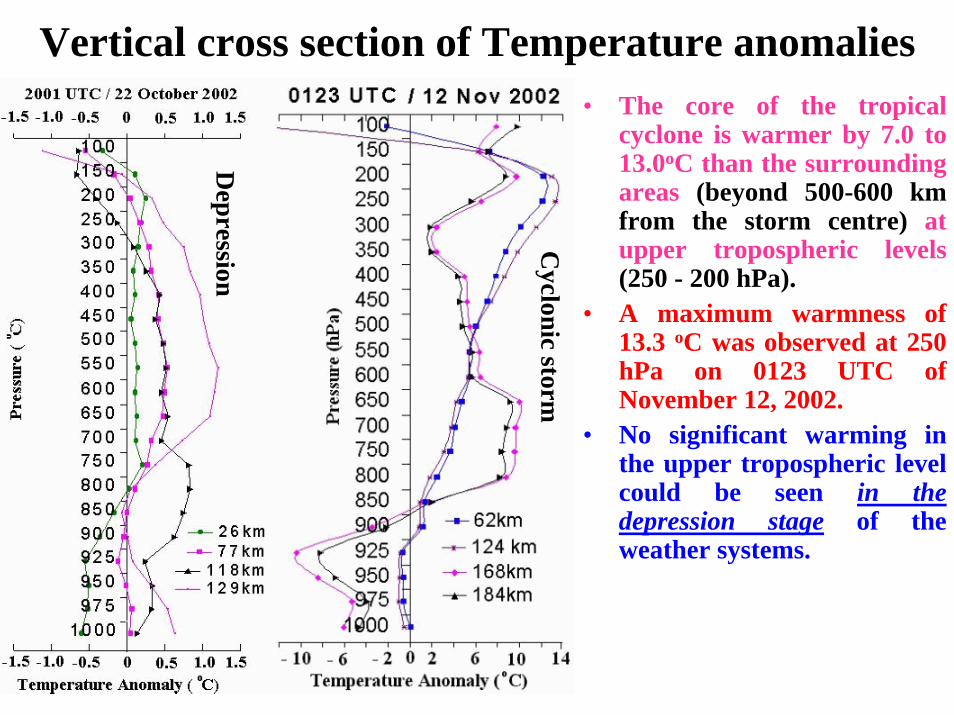
Vertical cross section of Temperature anomalies• The core of the tropical
cyclone is warmer by 7.0 to 13.0oC than the surrounding areas (beyond 500-600 km from the storm centre) at upper tropospheric levels(250 - 200 hPa).
• A maximum warmness of 13.3 oC was observed at 250 hPa on 0123 UTC of November 12, 2002.
• No significant warming in the upper tropospheric level could be seen in the depression stage of the weather systems.
Depression
Cyclonic storm
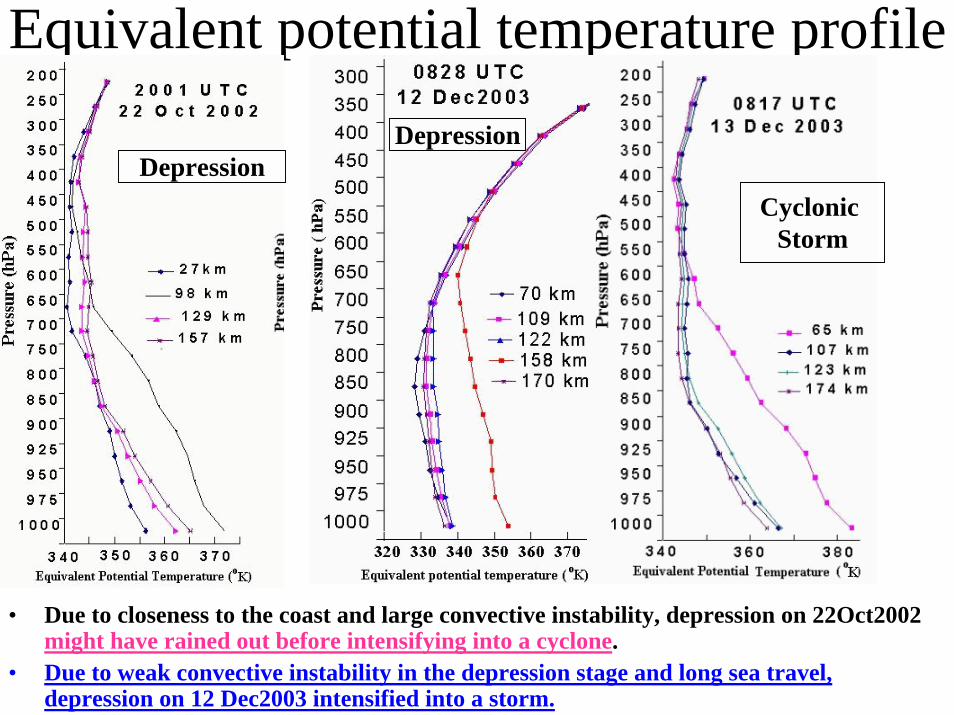
Equivalent potential temperature profile
DepressionDepression
Cyclonic Storm
• Due to closeness to the coast and large convective instability, depression on 22Oct2002 might have rained out before intensifying into a cyclone.
• Due to weak convective instability in the depression stage and long sea travel, depression on 12 Dec2003 intensified into a storm.
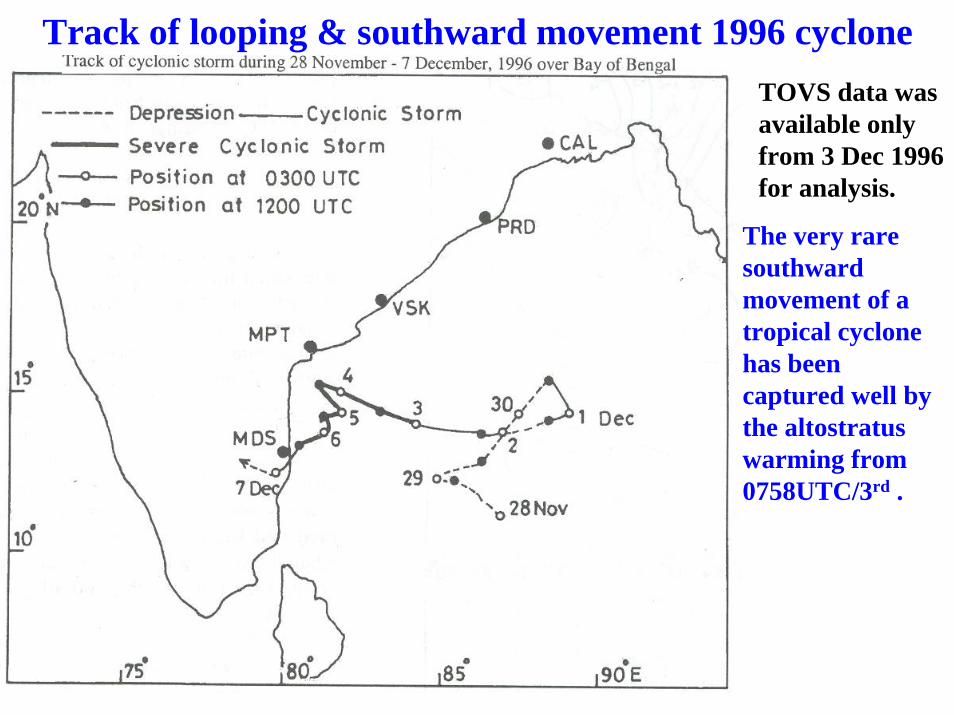
Track of looping & southward movement 1996 cycloneTOVS data was available only from 3 Dec 1996 for analysis.
The very rare southward movement of a tropical cyclone has been captured well by the altostratus warming from 0758UTC/3rd .
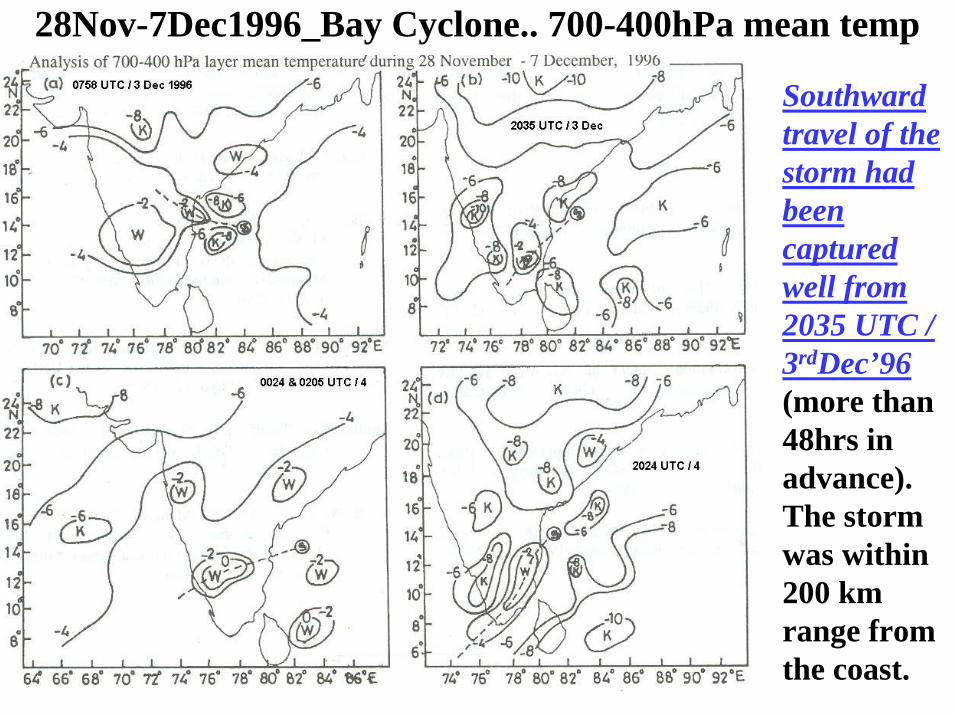
28Nov-7Dec1996_Bay Cyclone.. 700-400hPa mean temp
Southward travel of the storm had been captured well from 2035 UTC / 3rdDec’96(more than 48hrs in advance). The storm was within 200 km range from the coast.
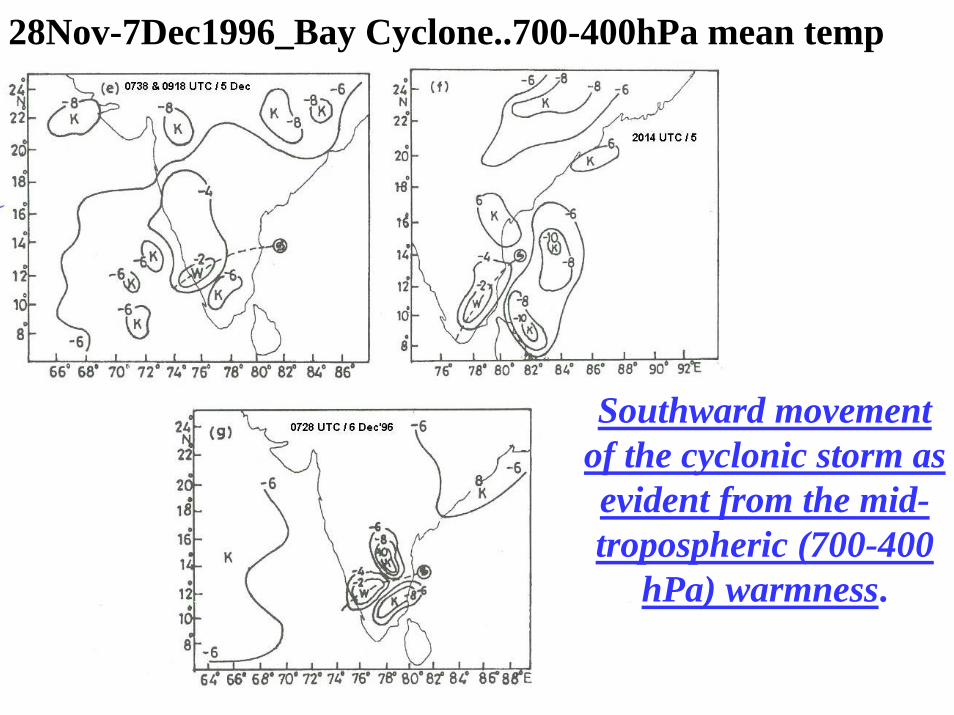
28Nov-7Dec1996_Bay Cyclone..700-400hPa mean temp
Southward movement of the cyclonic storm as evident from the mid-tropospheric (700-400
hPa) warmness.
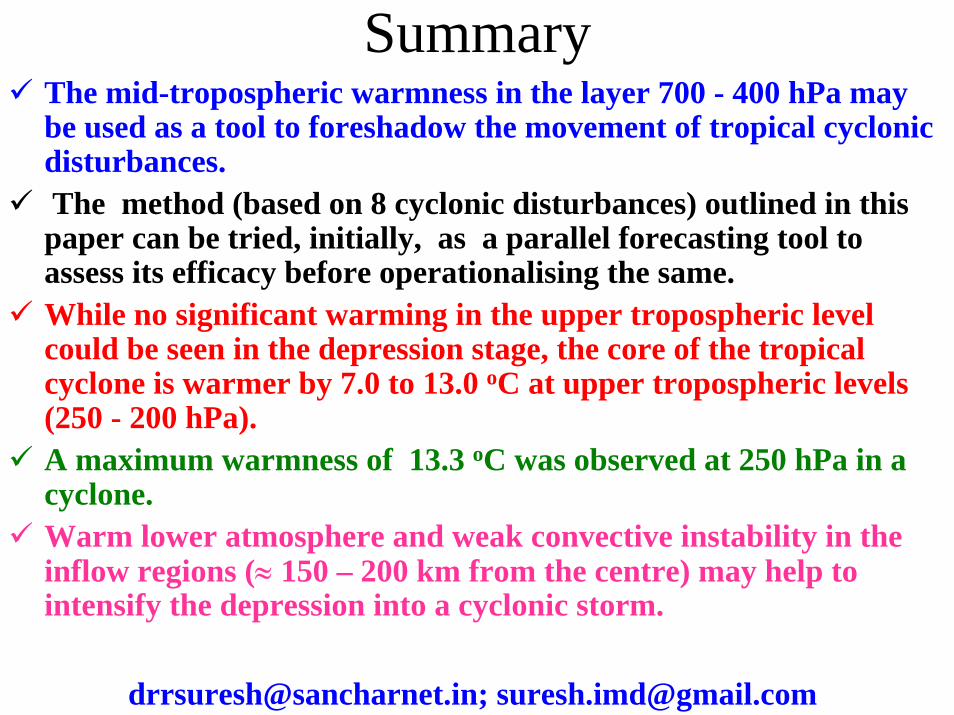
SummaryThe mid-tropospheric warmness in the layer 700 - 400 hPa may be used as a tool to foreshadow the movement of tropical cyclonic disturbances.The method (based on 8 cyclonic disturbances) outlined in this paper can be tried, initially, as a parallel forecasting tool to assess its efficacy before operationalising the same.While no significant warming in the upper tropospheric level could be seen in the depression stage, the core of the tropical cyclone is warmer by 7.0 to 13.0 oC at upper tropospheric levels(250 - 200 hPa). A maximum warmness of 13.3 oC was observed at 250 hPa in a cyclone.Warm lower atmosphere and weak convective instability in the inflow regions (≈ 150 – 200 km from the centre) may help to intensify the depression into a cyclonic storm.