Embed Size (px)
Citation preview

ANRV374-EA37-10 ARI 27 March 2009 14:57
Forensic Seismologyand the ComprehensiveNuclear-Test-Ban TreatyDavid Bowers and Neil D. SelbyAWE Blacknest, Brimpton, Reading RG7 4RS, United Kingdom;email: [email protected], [email protected]
Annu. Rev. Earth Planet. Sci. 2009. 37:209–36
First published online as a Review in Advance onJanuary 20, 2009
The Annual Review of Earth and Planetary Sciences isonline at earth.annualreviews.org
This article’s doi:10.1146/annurev.earth.36.031207.124143
Copyright c! 2009 by Annual Reviews.All rights reserved
0084-6597/09/0530-0209$20.00
Key Wordsglobal seismology, International Monitoring System, seismicdiscrimination methods, underground explosion source, earthquake source
AbstractOne application of forensic seismology is to help verify compliance withthe Comprehensive Nuclear-Test-Ban Treaty. One of the challenges facingthe forensic seismologist is to discriminate between the many thousands ofearthquakes of potential interest each year and potential Treaty violations(underground explosions). There are four main methods: (a) ratio of body-to surface-wave magnitudes, (b) ratio of high-frequency P to S energy,(c) model-based methods, and (d ) source depth. Methods (a) and (b) have anempirical basis. The weakness of methods (a)–(c) is the lack of an equivalentelastic source for an underground explosion fired in the range of geologicalmedia found around the world. Reliable routine source-depth determinationhas proved difficult. However, experience gained in the past decade at iden-tifying suspicious seismic sources suggests that although no single methodworks all of the time, intelligent and original application of complementarymethods is usually sufficient to satisfactorily identify the source in question.
209
Ann
u. R
ev. E
arth
Pla
net.
Sci.
2009
.37:
209-
236.
Dow
nloa
ded
from
arjo
urna
ls.an
nual
revi
ews.o
rgby
Uni
vers
ity o
f Brit
ish C
olum
bia
Libr
ary
on 1
2/29
/09.
For
per
sona
l use
onl
y.

ANRV374-EA37-10 ARI 27 March 2009 14:57
CTBT:ComprehensiveNuclear-Test-BanTreaty
IMS: InternationalMonitoring System
OSI: On-SiteInspection
IDC: InternationalData Center
INTRODUCTIONGlobal seismology is the study of elastic (seismic) waves to investigate a seismic source and thestructure and processes within Earth. Usually, the seismic waves studied are caused by earthquakes,but seismic waves are also generated by nuclear explosions. It was recognized by experts, meetingin Geneva in 1958, that seismology could be the only way to detect and identify undergroundexplosions, and thus could be used to help verify a treaty banning nuclear-test explosions.
Seismology and the Comprehensive Nuclear-Test-Ban TreatyThe Comprehensive Nuclear-Test-Ban Treaty (CTBT) took more than 40 years to achieve and isconsidered to be the Holy Grail by arms control advocates (Marshall et al. 2001). The verificationsystem for the CTBT has four pillars: the International Monitoring System (IMS), Consultationand Clarification, On-Site Inspection (OSI), and Confidence Building Measures. The IMS willconsist of a global network of more than 300 stations sending data to the International Data Center(IDC) in Vienna, Austria.
The technical discussions on whether a CTBT could be adequately verified, which spannedthe period from 1958 to the final negotiation of the Treaty in 1996, have been extensively re-viewed elsewhere (Blandford 1977; Douglas 1981, 2007)—the main technical difficulty was thedevelopment of adequate seismological methods of identifying underground explosions (potentialTreaty violations) from the many thousands of earthquakes that occur each year. The relative im-portance of seismology for Treaty verification is reflected by the fact that more than half (170 outof 321) of the IMS stations will be seismic stations. However, seismology alone cannot distinguishbetween single nuclear and chemical underground explosions—for this, diagnostic radionuclidesare required. To detect and attribute the diagnostic radionuclides, the IMS network will comprise80 radionuclide stations, and the Treaty has provisions for OSI.
Here, we use the term forensic seismology to describe seismology applied to CTBT verificationusing data mainly from global networks of seismic stations. The search for aftershocks from asuspected underground nuclear explosion as part of an OSI (Takano & Krioutchenkov 2001) couldalso be considered forensic seismology—examples of other applications of forensic seismology arebriefly described in the sidebar Other Applications of Forensic Seismology. [The use of the termforensic comes from its definition as “pertaining to courts of justice.” Forensic seismology is thusthe application of seismological science to the elucidation of doubtful questions in such a court(Douglas 2007).]
The IMS and SeismologyThe IMS network of stations will comprise 50 primary seismic stations providing continuous dataand will be supported by 120 auxiliary seismic stations that provide data on request (Barrientoset al. 2001), 11 hydroacoustic stations (Lawrence et al. 2001), 60 infrasound stations (Christie et al.2001), and 80 radionuclide stations (with particulate and noble gas sensors) (Matthews & Schulze2001). The radionuclide part of the IMS will also be supported by 16 radionuclide laboratories(Karhu & Clawson 2001). The IDC receives data from the IMS network of stations and distributesthese data and derived products (e.g., bulletins of seismic events) to states that are party to theTreaty (Bratt 2001).
At the IDC, the continuous waveform data (primary seismic, hydroacoustic, and infrasound)are searched for signals from a potential Treaty violation, and lists of detections are formed. Thesedetections are then associated with events, and the event location, depth, and origin time (andother associated parameters, such as magnitude) are estimated (Bratt 2001). In general, the seismicsignals are searched for signals from an underground explosion, the hydroacoustic for an explosion
210 Bowers · Selby
Ann
u. R
ev. E
arth
Pla
net.
Sci.
2009
.37:
209-
236.
Dow
nloa
ded
from
arjo
urna
ls.an
nual
revi
ews.o
rgby
Uni
vers
ity o
f Brit
ish C
olum
bia
Libr
ary
on 1
2/29
/09.
For
per
sona
l use
onl
y.

ANRV374-EA37-10 ARI 27 March 2009 14:57
OTHER APPLICATIONS OF FORENSIC SEISMOLOGY
The rapid expansion of seismometer observatories around the world has resulted in a growing number of examplesof how seismic observations have been used to provide evidence to support investigations that are potentially judicial.
1. Seismic and acoustic signals (both recorded by a seismometer) from aircraft crashes can provide independentestimates of impact time and location, for example, the impacts from Pan Am Flight 103 at Lockerbie, Scotlandin 1988 (crash site approximately 25 km southwest of the Eskdalemuir seismometer array), the impacts from SwissAir passenger aircraft in shallow water at Peggy’s Cove near Halifax, Canada, in 1998 (McCormack 2003), and theaircraft impacts into (and subsequent collapse of ) the twin towers of the World Trade Center on September 11,2001 (Kim et al. 2001).
2. Seismic and acoustic signals can provide independent estimates of the detonation time of terrorist explosions,such as from the Oklahoma City bombing in 1993 (Holzer et al. 1996) and from the truck bomb attack on the USEmbassy in Nairobi, Kenya, in 1998 (Koper et al. 1999).
3. The amplitude of seismic and acoustic signals can be used to place constraints on the explosive yield (and coupling)of potentially judicial explosive sources (Koper et al. 1999). Experiments using controlled truck-bomb sources haverefined initial estimates of the yield of the Nairobi bomb (equivalent to 2 to 6 tons of TNT) and resulted in initialscaling laws that could be used in future investigations (Koper et al. 2002).
in the ocean and the infrasound for an explosion in the atmosphere. However, it is becoming clearthat there are many synergies between the waveform technologies that may be effectively exploitedin the future. The IDC is also required by the Treaty to routinely screen-out events consideredto be consistent with natural phenomena or non nuclear, man-made phenomena.
As noted above, analysis of the data from the waveform technologies alone does not uniquelyidentify a source as nuclear. The smoking gun may come from data provided by the radionuclidestations, an OSI, or even from National Technical Means, should a state choose to share suchmeans to help verify a Treaty violation.
In this article, we focus on the methods available to the forensic seismologist for sourceidentification. We discuss examples of special analysis of the so-called seismic problem events(Figure 1), which some consider inevitable under a CTBT (Sykes 2002). We also discuss an-nounced underground nuclear tests that have occurred since the Treaty was opened for signaturein 1996, including that by the Democratic People’s Republic of Korea (DPRK) on October 9,2006 (and preceding false alarms).
We show that, in practice, the forensic seismologist often utilizes not only data from the IMSnetwork of stations and products from the IDC (Douglas et al. 1999, Bowers et al. 2001), but alsodata from non-IMS networks of stations (Richards & Kim 1997, Hartse 1998, Bowers 2002, Kim& Richards 2007). Non-IMS networks may be other international, regional, and national seis-mometer networks originally deployed for non-CTBT verification purposes, such as earthquakehazard assessment, or for basic seismological research (van der Vink & Park 1994, Richards & Kim1997, Kim & Richards 2007). There is now wide access to data from numerous seismic stationsvia the Internet (Kradolfer 2000).
SOURCE IDENTIFICATION METHODSThere have been several substantial reviews of research into the problem of discriminating be-tween earthquakes and underground explosions (Blandford 1977; Douglas 1981, 2007). Early
www.annualreviews.org • Forensic Seismology and the CTBT 211
Ann
u. R
ev. E
arth
Pla
net.
Sci.
2009
.37:
209-
236.
Dow
nloa
ded
from
arjo
urna
ls.an
nual
revi
ews.o
rgby
Uni
vers
ity o
f Brit
ish C
olum
bia
Libr
ary
on 1
2/29
/09.
For
per
sona
l use
onl
y.

ANRV374-EA37-10 ARI 27 March 2009 14:57
0°! 30°E 60°E 90°E 120°E 150°E0°
30°N
60°N
KurskAugust 12, 2008
IndiaMay 1998
March 13, 2003
PakistanMay 1998
Lop Nor
North KoreaOctober 9, 2006
Figure 1Locations of some seismic disturbances that have been of interest to forensic seismologists over the pastdecade.
UNE: undergroundnuclear explosion
mb: body-wavemagnitude (based onthe P wave amplitudeand period)
Ms: surface-wavemagnitude (based onthe Rayleigh waveamplitude and period)
work concentrated on seismic methods using signals recorded at regional distances in the westernUnited States, defined as distances <1700 km (National Academy of Sciences 2002). Initial resultswere not encouraging. However, clear P signals were seen by an experimental seismometer arraydeployed in Wyoming, United States, from presumed underground nuclear explosions (UNEs)in Kazakhstan and Algeria, leading to the realization that signals detected at large distances, i.e.,3000–10,000 km, from the source (known as teleseismic signals) could be used for discrimina-tion (Richards & Zavales 1996, Douglas 2007). The main teleseismic discriminants that emergedfrom subsequent research are source depth, P complexity (simplicity), and the ratio of body- tosurface-wave magnitude (mb:Ms).
For teleseismic discriminants, the identification threshold is usually taken as approximatelyhalf a magnitude unit above the event-detection threshold. The threshold for detection by atleast three stations in the IMS primary seismic network is <3.5 mb for the vast majority of thecontinental land mass 90% of the time (National Academy of Sciences 2002).
Since the late 1970s, there has been concerted research into discriminants that are effectiveusing signals recorded at regional distances, especially by the United States (Blandford 1981).Research has shown that discriminants based on the spectral amplitude ratio of a single regionalphase can be ineffective (Blandford 1981, 1996), but that at high frequencies (>2 Hz) P/S amplituderatios are a promising discriminant (Blandford 1996).
The shift from teleseismic back to regional discrimination appears to have been driven by therequirement to detect seismic signals from, and identify, UNEs with mb < 4. Signals from at leastthree stations are usually required to be associated to form an event and estimate its location. Giventhe distribution of seismic stations in the IMS network, it is likely that, for a source located on thecontinental land mass, at least one station at regional distances will have clear signals. Thus, it hasbeen argued that there may be little difference in the event-detection and -identification thresholds
212 Bowers · Selby
Ann
u. R
ev. E
arth
Pla
net.
Sci.
2009
.37:
209-
236.
Dow
nloa
ded
from
arjo
urna
ls.an
nual
revi
ews.o
rgby
Uni
vers
ity o
f Brit
ish C
olum
bia
Libr
ary
on 1
2/29
/09.
For
per
sona
l use
onl
y.

ANRV374-EA37-10 ARI 27 March 2009 14:57
REB: Reviewed EventBulletin
TNT: trinitrotoluene
for regional discriminants (National Academy of Sciences 2002), providing discriminants appliedat a single station at regional distances can be considered reliable.
Further, non-IMS seismic networks allow the event-detection threshold to be lowered below3 mb for many parts of the world (National Academy of Sciences 2002) and increase the chanceof applying regional discriminants averaged over more than one station. It is estimated that,globally, on average, there are more than 60,000 earthquakes a year with mb ! 3, compared withapproximately 7000 with mb ! 4. Lowering the detection threshold brings additional challenges,not only caused by the significant increase in natural earthquakes that need to be considered, butalso because it is estimated that there are a few hundred mining explosions a year with mb ! 3(National Academy of Sciences 2002).
In addition to earthquakes and large mining explosions, mine tremors appear explosion-likeon many traditional discriminants (Blandford 1996). Research suggests that such problem eventsmay be resolved using a combination of the first motion of teleseismic P (Bowers & Douglas1997), combined body- and surface-wave modeling (Bowers & Walter 2002), and regional P/Lg
amplitude ratios (Bennett & McLaughlin 1997).The IDC currently operates an experimental event screening process (identification of events
considered consistent with natural phenomena or nonnuclear, man-made phenomena) for allevents in the analyst Reviewed Event Bulletin (REB) with network-averaged mb ! 3.5 (Fisket al. 2002). The REB is produced by interactive analyst review of an automated event bulletin.The experimental process has provisional criteria for screening using mb:Ms, depth, location(onshore/offshore, with a minimum water depth constraint and nonobservation of unblocked un-derwater explosion-like hydroacoustic signals), and regional high-frequency P/S amplitude ratios.There are more than 20,000 earthquakes each year with mb ! 3.5, so the global event screeningprocess adopted at the IDC will probably need to be highly automated to be cost-effective.
A key challenge for effective routine event screening is to define the explosion population undera CTBT. The vast majority of presumed UNEs conducted have been fired at a depth sufficientfor containment of radioactivity, with little consideration of whether there is a permanent surfaceexpression or seismic waves are detected; detection via seismic signals or surface disturbance islikely to be considered by a potential violator of the CTBT. Even for the well-instrumented tests,it is not fully understood how underground explosions generate seismic waves (Douglas 2007).Further, as Douglas (2007) states,
[t]he lack of understanding of the explosion source adds to the difficulty of setting screening criteria.The available recordings from explosions are not some random sample from a population of possiblesignals. Most of the explosions have been fired at a small number of test sites, so statistical comparisonsof earthquake and explosion signals may be unreliable.
However, it may be that not only do large tamped chemical and equivalent-yield UNEs pro-duce similar seismic signals, but they also appear to follow similar scaling laws (Denny & Johnson1991). Thus, experiments using small chemical explosions [a few tons equivalent or less of trini-trotoluene (TNT)] may help inform us about how larger-yield UNEs generate seismic waves.One disadvantage of small-scale experiments is that gravity does not scale, so containment rules(overburden pressure is usually assumed to be proportional to the cube-root of yield) and spalleffects will not necessarily be accurately reproduced.
For the forensic seismologist, an attractive alternate to the event screening strategy is to rou-tinely attempt to detect statistical outliers to the earthquake population using promising discrimi-nants (Fisk et al. 1996). Resources can then be targeted at identifying outliers in regions of interestthrough special studies. Regularized discrimination analysis can be applied to combine candidate
www.annualreviews.org • Forensic Seismology and the CTBT 213
Ann
u. R
ev. E
arth
Pla
net.
Sci.
2009
.37:
209-
236.
Dow
nloa
ded
from
arjo
urna
ls.an
nual
revi
ews.o
rgby
Uni
vers
ity o
f Brit
ish C
olum
bia
Libr
ary
on 1
2/29
/09.
For
per
sona
l use
onl
y.

ANRV374-EA37-10 ARI 27 March 2009 14:57
discriminants, allowing for the level of explosion calibration information available, i.e., the tran-sition from outlier detection to classical discrimination (Anderson & Taylor 2002, Anderson et al.2007).
Some recent advances and remaining challenges for three of the experimental screening criteriaand candidate outlier detection discriminants are described below. The basic concepts and physicson which these criteria are based have been used, along with waveform modeling and inversiontechniques, to resolve many problem events in special studies. The remainder of this articlegives examples of special studies to demonstrate the variety of methods available to the forensicseismologist helping to verify compliance with the CTBT.
DepthThe depth criterion is based on the idea that there is a physical limit to the depth at which a potentialviolator could place a nuclear explosive device. For example, if the estimated source depth is>10 km with 95% certainty, then the source is likely to be natural (Blandford 1977).
For depth estimates using only teleseismic P onset times, the estimated depth tends to trade offwith the origin time. When times from regional distance stations are available, the depth estimatesare also typically unreliable for depths less than 50 km and tend to have large uncertainty (Fisket al. 2002).
Approximately 15% of REB events are screened out using the experimental depth screeningcriterion (Fisk et al. 2002). The experimental depth criterion is nominally a one-sided test that thedepth is >10 km at the 97.5% confidence interval. The current implementation has a constantfactor (to account for model uncertainty, e.g., +20 km), which is expected to reduce over time asbetter models are developed (Fisk et al. 2002).
Depth phases, such as free-surface reflections pP and sP, should provide precise and reliabledepth estimates. However, reliable routine identification has turned out to be harder than expected.Nonetheless, when candidate depth phases can be identified at three or more teleseismic stations,then the amplitude ratios pP/P and sP/P have been widely used to assess whether these are consistentwith an earthquake model (double couple source) at a given depth (Pearce 1980, Douglas et al.1999).
If the amplitude ratios are consistent with the earthquake model, then further confidence canbe gained in this interpretation by forward modeling (Douglas et al. 1972, Douglas 2007). Caremust be taken to ensure that an appropriate source-region model is used. The growing availabilityof reliable geophysical models can further increase confidence in the modeling results (Bowerset al. 2000). The most promising advances probably lie in the development of semiautomatedtools to help guide the analyst to routinely pick candidate depth phases (Murphy & Barker 2006,Heyburn & Bowers 2008), the consistency of which can be assessed by the application of a set ofvalidation rules using regional models (Heyburn & Bowers 2008).
Observations of the near-regional phase Rg at frequencies approximately 0.5–1.0 Hz are di-agnostic of a shallow source (depth less than approximately 3 km) (Bowers 1997, Myers et al.1999, Kim & Richards 2007). However, 0.5 Hz Rg tends to be highly attenuated by scattering andnonelastic attenuation, and is rarely observed at distances greater than 150 km. Indeed, there issome evidence that Rg scattering close to the source is part of the explanation of Lg generation byunderground explosions (Blandford 1996, Myers et al. 1999).
The amplitude spectra of long-period surface waves (0.01–0.14 Hz) recorded at regional (andteleseismic) distances can have significant depth resolution if the earthquake mechanism and depthresults in a notch in the Rayleigh spectrum (Douglas et al. 1971b, Patton 1998). Further research isrequired to investigate the origin of Rayleigh spectral notches from underground explosions before
214 Bowers · Selby
Ann
u. R
ev. E
arth
Pla
net.
Sci.
2009
.37:
209-
236.
Dow
nloa
ded
from
arjo
urna
ls.an
nual
revi
ews.o
rgby
Uni
vers
ity o
f Brit
ish C
olum
bia
Libr
ary
on 1
2/29
/09.
For
per
sona
l use
onl
y.

ANRV374-EA37-10 ARI 27 March 2009 14:57
P wave: primaryseismic body-wave
NEIC: NationalEarthquakeInformation Center
consideration as a routine screening method. However, analysis of surface-wave amplitude spectrafrom a network of regional stations with good azimuthal coverage can increase confidence in theresolution of problem events such as the March 13, 2003 Lop Nor disturbance (see EarthquakeNear Lop Nor, March 13, 2003, below).
mb:Ms
It became clear from observations made in the 1960s that for a given distance-corrected short-period ("1 s) P wave amplitude (mb), the distance-corrected long-period ("20 s) Rayleigh-waveamplitude (Ms) from presumed UNEs is generally smaller than from earthquakes. These obser-vations formed the basis of the mb:Ms discriminant, although it was recognized early on that thereare some earthquakes that generate weak Rayleigh waves and so appear anomalous, or explosion-like, on mb:Ms (Douglas 1981). Network-averaged mb and Ms for discrimination and screeningneed to be calculated assuming a shallow source (applying the amplitude-distance curves for zerodepth), as mb and Ms are source-depth dependent. The network-averaged mb and Ms also need tobe corrected for network data censoring effects. This can be achieved using maximum-likelihoodtechniques (Lilwall 1987, Zaslavsky-Paltiel & Steinberg 2008).
Station and path corrections can be determined and applied to station mb and Ms to re-duce individual magnitude bias and uncertainty in the network average (Marshall et al. 1979).However, when deriving corrections to station magnitudes, care must again be taken to account fordata censoring (Lilwall 1987, Zaslavsky-Paltiel & Steinberg 2008) and identify possible trade-offsbetween static corrections and the effects of nonisotropic radiation, especially if using earthquakesfor calibration (Bowers & Douglas 1998).
During development of the mb:Ms experimental screening criterion, it was recognized that thereis potential bias between the automatically measured network-averaged mb and Ms at the IDC,and the respective magnitudes measured by an analyst from short- and long-period seismogramsas reported in global seismic event bulletins such as that by the National Earthquake InformationCenter (NEIC). An initial study of magnitudes from earthquakes showed that the IDC network-averaged mb and Ms was, on average, 0.4 and 0.1 units, respectively, less than those reported by theNEIC (Fisk et al. 2002). Because the NEIC has mb and Ms observations from a large number ofpresumed UNEs, the average NEIC/IDC magnitude biases from earthquakes were used to inferthe equivalent IDC explosion mb:Ms and hence define the experimental screening line (Fisk et al.2002).
However, subsequent studies have shown that there is negligible difference between NEICand IDC network-averaged mb from presumed UNEs (Granville et al. 2002, Bowers et al. 2002).The offset in NEIC and IDC network-averaged mb from earthquakes with NEIC mb ! 5 canbe explained by the different procedures used by the respective centers and the tendency for thedepth assigned to a common event by the NEIC to be greater than that assigned by the IDC(Granville et al. 2005).
There is also a clear magnitude dependence to the IDC/NEIC network-averaged mb and Ms
bias. This can be attributed, at least in part, to data censoring effects of the different IDC and NEICstation networks (Stevens & McLaughlin 2001, Zaslavsky-Paltiel & Steinberg 2008). Simulationcan provide insight into the network-dependent threshold above which data censoring can beconsidered negligible. Preliminary results from simulation of network-averaged mb, suggest thatthe threshold is approximately 4.5 mb and 5.5 mb for the (incomplete) IMS primary and NEIC-typenetworks, respectively.
Ms for discrimination was originally defined based on Rayleigh amplitudes at periods around20 s (Douglas 2007). Ms at the IDC is defined in a similar way (Rezapour & Pearce 1998) and
www.annualreviews.org • Forensic Seismology and the CTBT 215
Ann
u. R
ev. E
arth
Pla
net.
Sci.
2009
.37:
209-
236.
Dow
nloa
ded
from
arjo
urna
ls.an
nual
revi
ews.o
rgby
Uni
vers
ity o
f Brit
ish C
olum
bia
Libr
ary
on 1
2/29
/09.
For
per
sona
l use
onl
y.

ANRV374-EA37-10 ARI 27 March 2009 14:57
NTS: Nevada TestSite
is utilized in the experimental screening process (Stevens & McLaughlin 2001, Fisk et al. 2002).Rayleigh waves from small underground explosions (with mb " 4.5) are weak and are likely togo undetected unless stations are at regional distances (the IMS auxiliary network and non-IMSnetworks have proved to be valuable for detecting surface waves from problem events, as wedemonstrate later).
For continental propagation at regional distances, the largest amplitude is often the Airy phase,with a dominant period significantly less than 20 s. To allow analysts to report Ms from seismogramsfrom small disturbances recorded at regional and teleseismic distances, and from more dispersedwaveforms following oceanic and mixed paths, a variable-period path correction was developed(Marshall & Basham 1972).
Recently, a variable-period Ms measurement has been proposed based on bandpass Butterworthfilters applied in the time domain (Russell 2006, Bonner et al. 2006). Such a method appears to beeasily operationally implemented and can be regionalized (Russell 2006). A preliminary inversionof global Ms measurements reported in the REB, for empirical station terms and two-dimensional(2D) path corrections, shows a strong correlation between the path correction and distinct knowntectonic regions (Selby et al. 2003).
One of the challenges of Ms measurement is that surface waves from large earthquakes canhave durations of many hours and can potentially obscure surface waves from seismic disturbancesof interest (Douglas 2007). For example, the surface waves from the Pakistani announced UNE ofMay 30, 1998 were obscured by those from an earthquake in Afghanistan approximately 30 minearlier (Barker et al. 1998). Another problem is association, especially if the surface wave processingis automated, as in the experimental IDC process. Robust methods of measuring Rayleigh waveback azimuth have been shown to increase confidence in association (Selby 2001).
A problem that may fundamentally limit the usefulness of mb:Ms for event screening is thatthe explosion and earthquake populations may converge for mb # 4.5. This convergence hasbeen observed (Douglas 1981) and modeled (Stevens & Day 1985). However, there are work-ers who observe divergence for the earthquake and explosion populations in the Nevada TestSite (NTS) region (Bonner et al. 2006). New data from the DPRK underground explosion pre-sented later in this article may help throw some more light on this subject for the Eurasianregion.
Teleseismic P amplitudes are highly sensitive to attenuation in the mantle (Marshall et al. 1979),and signals with small amplitudes often show complex P wave forms (Douglas 2007). However, thescaling of observations of network-averaged mb with yield from announced UNEs are explainedto the first order by the Mueller-Murphy model of the UNE seismic source function (Mueller &Murphy 1971, Murphy 1996). The coupling in the Mueller-Murphy model is dependent on thesource medium and depth (unlikely to be well known to the investigating forensic seismologist).Furthermore, a regression analysis of data from underground explosions concluded that onlythe low-frequency level and corner frequency of the underground explosion source amplitudespectrum could be constrained (Denny & Johnson 1991). So it seems the underground explosionsource function for seismic waves is not yet well understood (Douglas 2007).
A further concern is the effect on mb:Ms of what is commonly referred to as tectonic release—observations of long-period horizontally polarized S and surface waves not predicted by simpleelastic underground explosion models (Toksoz & Kehrer 1972). These anomalous observationsinclude Love waves and Rayleigh waves with polarity reversed relative to that expected from anunderground point elastic–explosion source (Toksoz & Kehrer 1972, Rygg 1979). The anomalousobservations are often interpreted by assuming a point elastic explosion with an additional double-couple source (Ekstrom & Richards 1994). However, this interpretation is nonunique (Stevens &Murphy 2002).
216 Bowers · Selby
Ann
u. R
ev. E
arth
Pla
net.
Sci.
2009
.37:
209-
236.
Dow
nloa
ded
from
arjo
urna
ls.an
nual
revi
ews.o
rgby
Uni
vers
ity o
f Brit
ish C
olum
bia
Libr
ary
on 1
2/29
/09.
For
per
sona
l use
onl
y.

ANRV374-EA37-10 ARI 27 March 2009 14:57
Empirically, presumed UNEs that show anomalous surface waves that have been studied(Toksoz & Kehrer 1972, Ekstrom & Richards 1994, Fisk et al. 2002) do separate from the earth-quake population on mb:Ms. However, the modeling study by Stevens & Day (1985), suggestingconvergence of the explosion and earthquake mb:Ms populations around mb " 4.5, does not includetectonic release in the explosion source model.
Physical mechanisms proposed to explain the anomalous surface wave observations from pre-sumed UNEs are mainly related to nonlinear effects in the zone immediately surrounding theexplosion. Such mechanisms include (a) nonspherical effects due to heterogeneous and anisotropicmaterial, (b) cracking and block movement along preexisting lines of weakness, and (c) tectonicrelease by the relaxation of preexisting stresses in the nonelastic zone surrounding the explosion(Patton 1991). Triggering of earthquakes on faults in the vicinity of the explosion has also beenproposed.
It may be that at least some of the differences reported in the mb:Ms explosion populations forEurasia and NTS (Marshall & Basham 1972, Bonner et al. 2006) may be explained by differencesin the physical causes of the observations often attributed to tectonic release. Until the explosionsource model and physical causes of anomalous surface waves are understood and quantified, thetheoretical basis of mb:Ms for underground explosions remains unresolved. In later sections, weshow anomalous surface waves from the announced UNEs detonated in India and Pakistan onMay 11 and 28, 1998, respectively.
Regional P/S Amplitude RatiosThe spatial distribution of IMS and non-IMS seismic stations means it is likely that, for a sourcelocated on the continental land mass, at least one station at regional distances will have clearsignals. If the aim is to identify UNEs with mb < 3.5, then methods utilizing seismic signalsrecorded at regional distances provide a valuable tool for the forensic seismologist. The mostpromising methods utilize P/S amplitude ratios.
Empirical observations. Research since the early 1980s suggests that the regional P/S amplituderatio at high frequencies ( f > 2 Hz) shows promise as a discriminant (Walter et al. 1995, Blandford1996, Fisk 2006) but is highly region-dependent (due to crustal and upper mantle structure).Usually the amplitude ratio is measured from P and S recorded on the vertical component only,although some studies have shown that three-component amplitude measurements can improvediscrimination (Kim et al. 1997). If there is strong scattering, then it is unlikely to matter fromwhich component the amplitude is measured, and the P/S ratio is stable (Blandford 1996) as theP and S source-radiation patterns are obscured (Zhang et al. 2002). However, if there is weakscattering, then three-component measurements may be able to exploit differences in the P andpolarized-S radiation patterns from earthquake and explosion sources (Lilwall 1988, Bowers et al.2001, Bowers 2002).
There appears to be some variation in the definition of regional distance, !. For example,the National Academy of Sciences (2002) prefers ! # 15!, whereas the experimental regionalscreening process at the IDC uses P and S recorded at stations with 3! # ! # 17! (Bottone et al.2002).
Studies show that there can be large variations in the amplitudes observed at sensors separatedby less than 100 km. At source-receiver distances of approximately 20!, P amplitudes in the1–3 Hz passband, from a presumed UNE and an earthquake, vary by a factor of up to eightacross the NORSAR array in Norway, whereas S amplitudes appear to vary little (Ringdal et al.2001). At a source-receiver distance of approximately 10!, P amplitudes in the 0.2–8.0 Hz passband
www.annualreviews.org • Forensic Seismology and the CTBT 217
Ann
u. R
ev. E
arth
Pla
net.
Sci.
2009
.37:
209-
236.
Dow
nloa
ded
from
arjo
urna
ls.an
nual
revi
ews.o
rgby
Uni
vers
ity o
f Brit
ish C
olum
bia
Libr
ary
on 1
2/29
/09.
For
per
sona
l use
onl
y.

ANRV374-EA37-10 ARI 27 March 2009 14:57
recorded by the Kyrgyzstan network vary by a factor of 20 (Xie & Patton 1999). Both observationsof variations in P amplitudes have been attributed to strong three-dimensional (3D) structure in thevicinity of the recording network. Possible variations in P and S amplitudes need to be consideredif data from surrogate stations are used to help calibrate new IMS stations. For example, theseismic station MAKZ in east Kazakhstan (calibrated by Bottone et al. 2002) is 24 km from theIMS station MKAR used by the IDC experimental regional screening process.
Path corrections and transportability. To account for the regional variations in propagationof P and S, various schemes have been proposed to determine empirical distance-dependentcorrections. It was found that using optimal spatial prediction [often referred to as kriging (Schultzet al. 1998)] based on the observed P/S ratios in common fixed passbands significantly improveddiscrimination (Rodgers et al. 1999b)
The experimental regional screening process at the IDC uses a fixed passband 6–8 Hz andPn/Smax ratios, where Smax is either Sn or Lg, with a minimum signal-to-noise criterion for eachphase (Bottone et al. 2002). The kriging algorithm used to derive the station-specific 2D correctionsurfaces for Pn/Sn and Pn/Lg ratios used by the IDC process converges to the global mean value (forearthquakes) when no calibration data are available and to the local mean when there are sufficientcalibration data. Intermediate values depend on an exponential distance-damping function definedby a correlation length estimated to be 5–7! from the data by semivariogram modeling (Bottoneet al. 2002).
The associated uncertainty surfaces are based on a calibration variance and the variance fromthe earthquake data residuals, both estimated by semivariogram modeling (Bottone et al. 2002).To calculate the experimental screening score (criterion), the explosion P/S variance also needsto be set. This can be estimated from an UNE dataset by semivariogram modeling, but we mustconsider the possibility that the available presumed UNE dataset may not be drawn from the samepopulation as UNEs under a CTBT. If P/S is available from more than one station, then the scorescan be averaged (Bottone et al. 2002).
Alternatively, various P/S ratios can be formed from the regional P phases Pn, Pg, and Sphases Sn, Lg, either in common or different (cross-spectral) passbands for P and S. It may bethat for a particular region a certain combination offers the most promising discriminant (Walteret al. 1995, Fan et al. 2002, Rodgers & Walter 2002), or a number of combinations are to beconsidered as part of an outlier detection strategy (Fisk et al. 1996).
A model-based approach with source (earthquake model) and distance (path) frequency-dependent corrections has been developed for each regional phase, Pn, Pg, Sn, and Lg (Tayloret al. 2002, Walter & Taylor 2001), for a single station. This approach allows the whole spectrumof the source and path effects to be modeled for each regional phase, allowing flexibility. Themodel constrains the regional mean, upon which the calibration data can be kriged. Further, themodel-based approach allows the mean of the path effects for each phase to be predicted fromgeophysical experience in poorly or uncalibrated regions (Taylor et al. 2002). This predictive po-tential is attractive, as initially poor and uncalibrated regions are likely to be the norm for globalmonitoring under a CTBT. Over time, models should improve (e.g., resolving the trade-off be-tween geometrical spreading and nonelastic attenuation), and the number of calibration eventscould increase, either through confidence-building measures or through serendipity.
Several workers have reported improved discrimination if the P/S ratios are averaged over anetwork (Walter et al. 1995, Blandford 1996, Xie & Patton 1999). It has also been shown thatnetwork-averaged Pn, Sn, and Lg relative spectra from pairs of nearby explosions and earthquakes(so path effects cancel) at Lop Nor, China, with different magnitudes, are easier to interpret than ata single station (Fisk 2006). Network-averaged P/S ratios might be preferred given the potential
218 Bowers · Selby
Ann
u. R
ev. E
arth
Pla
net.
Sci.
2009
.37:
209-
236.
Dow
nloa
ded
from
arjo
urna
ls.an
nual
revi
ews.o
rgby
Uni
vers
ity o
f Brit
ish C
olum
bia
Libr
ary
on 1
2/29
/09.
For
per
sona
l use
onl
y.

ANRV374-EA37-10 ARI 27 March 2009 14:57
S wave: secondary orshear seismicbody-wave
variation in P amplitude described above. Significant P amplitude variation may confound thescreening, discrimination, or outlier strategies if not represented by the correction and uncertaintysurfaces.
Another challenge is to correctly associate P and S phases with the event under consideration.There is at least one example of an automated process resulting in misassociation of P and Swith the May 28, 1998, Pakistani announced UNE and apparent subsequent failure of the P/Sdiscriminant ( Jenkins & Sereno 2001, Bowers et al. 2002).
Research into how explosions generate S waves. Over the past decade or so there has been aconcerted effort, especially by United States researchers, to attempt to understand how explosionsgenerate high-frequency S waves. The main candidate mechanisms proposed are:
1. interaction of curved P wavefronts with the free-surface above the source (Lilwall 1988)and regional phase propagation in realistic 3D earth structure with topography (Myerset al. 2003);
2. scattering from Rg-to-S. This may be significant in the 1–5 Hz passband and depends onthe explosion source depth (Myers et al. 1999);
3. significant deviations from a point explosion source in an elastic medium with a free surface,such as the effect of spall (Blandford 1996, Stevens et al. 2006);
4. cracking in some volume surrounding the detonation point (Blandford 1996).
There are an increasing number of studies that suggest the corner frequency of regional Sn andLg from underground explosions is significantly less than the corresponding P corner frequency(Xie & Patton 1999, Fisk 2006, 2007). Differing P and S corner frequencies would suggest thatP-to-S conversion is not the dominant mechanism for S generation from underground explosions,as such a mechanism would be expected to produce S spectra with the same corner frequency asP (Fisk 2006). Further, recent observations and modeling suggest Rg-to-S scattering may be lessimportant than previously thought (Stevens et al. 2006).
Fisk (2006) conjectured that the S-wave spectrum from underground explosions in hard rockcan be represented by the Mueller-Murphy explosion P wave source spectrum (Mueller & Murphy1971), with S-wave corner frequency lower than P by the ratio of P to S wave speeds in thematerial around the source. Combining the Fisk conjecture for the explosion source with standardearthquake source models seems to explain why P/S discriminants perform well at frequenciesabove approximately 2 Hz but not at lower frequencies (Fisk 2006).
One implication of the Fisk conjecture is that the S waves are generated either at or in theimmediate vicinity of the source (Fisk 2006). The conjecture also predicts that P/S criteria shouldonly be reliable at frequencies around and above the P corner frequency, i.e., a magnitude andexplosion source-depth dependence. Yet another consequence of the conjecture is that such scalingof S corner frequencies from explosions is unlikely to be consistent with nonlinear spall effects,given the scaling appears to hold for differing emplacement media (e.g., tunnel versus shaft) andfiring depths (Fisk 2006).
The physical cause of S waves from underground explosions remains poorly understood.Current research efforts seem to be concentrating on the following:
1. attempting to quantify the uncertainty in and resolving the trade-off between parametersdescribing the path and station effects (required to estimate the explosion source function);
2. confirming the observations that suggest the underground explosion S corner frequency isless than and proportional to that of P;
3. explaining the observations of high-frequency S, Lg, and surface waves (often showingevidence of tectonic release) from presumed UNEs.
www.annualreviews.org • Forensic Seismology and the CTBT 219
Ann
u. R
ev. E
arth
Pla
net.
Sci.
2009
.37:
209-
236.
Dow
nloa
ded
from
arjo
urna
ls.an
nual
revi
ews.o
rgby
Uni
vers
ity o
f Brit
ish C
olum
bia
Libr
ary
on 1
2/29
/09.
For
per
sona
l use
onl
y.

ANRV374-EA37-10 ARI 27 March 2009 14:57
UTC: UniversalCoordinated Time
kt: equivalent energyreleased by a kiloton ofTNT ("4.2 $ 1012 J)
INDIAN UNDERGROUND TEST OF MAY 11, 1998A seismic disturbance, located at 27.081!N, 71.738!E with origin time 10:13:44.2 UTC (subse-quently referred to as IND 980511), is directly associated with the announcement by India ofthe simultaneous detonation of three devices with nuclear yields of 43, 12, and <1 kilotons (kt)(Barker et al. 1998).
High frequency P/S ratios (>2 Hz) for IND 980511 indicate that the disturbance is an outlierto the earthquake population defined by common regional phase-ratio discriminants, such asPn/Lg and Pn/Sn. Interestingly, these discriminants also seem effective at frequencies as low as 0.5–2.0 Hz (Rodgers & Walter 2002).
Surface waves generated by IND 980511 were observed at many stations across Eurasia. Un-fortunately, Rayleigh waves reported in the NEIC bulletin were subsequently shown to be mis-associated (i.e., they originated from a different seismic disturbance); this misled some authors(Evernden 1998, Sikka et al. 2001). Using carefully associated Rayleigh waves, the network-averaged Ms for IND 980511 is 3.32 (Douglas et al. 2002).
The prototype IDC REB reported a network-averaged mb of 5.0, but did not report anyassociated Ms measurements. Using a network-averaged Ms = 3.3, IND 980511 is an outlierto the earthquake population on an mb:Ms plot (Figure 2) and is not screened out using theexperimental mb:Ms criteria (Fisk et al. 2002). Thus, the seismic waves generated by IND 980511are consistent with an explosion source. However, modeling of the surface waves recorded at non-IMS stations NIL (Pakistan) and HYB (India) showed that the Rayleigh waves observed had theopposite polarity from that expected from a simple elastic explosion source (Rodgers et al. 1999a).Subsequent work demonstrated that Rayleigh waves were reversed at all stations where they wereobserved (Selby et al. 2004), with the best-fit model having reversals at all azimuths.
The reversed polarity of Rayleigh waves from presumed UNEs was briefly described in thesection entitled mb:Ms, and it has been observed at NTS (Toksoz & Kehrer 1972) and at theShagan River test site, eastern Kazakhstan (Rygg 1979, Herrin & Goforth 1986). The reversalsare believed to be due to the interference of the Rayleigh waves from the explosion source, withthe Rayleigh waves due to the accompanying tectonic release usually modeled as a double couple.Ekstrom & Richards (1994) calculate Rayleigh and Love radiation patterns from 71 presumedUNEs at Shagan River. Only four of these explosions show Rayleigh reversal at all azimuths(the smallest having 5.29 mb); a further three have a Rayleigh radiation pattern dominated byreversals.
If Rayleigh waves generated by tectonic release can be larger than those from the point explosionsource, it is not clear why the mb:Ms criterion should work for explosions of any size. Toksoz &Kehrer (1972) consider this issue and conclude that tectonic release does not affect the network-averaged Ms if good azimuthal coverage is available. However, Toksoz & Kehrer (1972) constraintectonic release at NTS to be a strike-slip mechanism, and their argument does not appear toapply where the tectonic release is not believed to be strike-slip—e.g., Shagan River (Ekstrom& Richards 1994) and IND 980511. To conclude, the study of long-period waveforms fromIND 980511 confirms that the mechanism for the generation of surface waves by undergroundexplosions is not understood, and that this has implications for the applicability of the mb:Ms
criterion.
PAKISTANI UNDERGROUND TEST OF MAY 28, 1998Pakistan announced that it had conducted an underground nuclear test involving five explosivedevices on May 28, 1998 (subsequently referred to as PAK 980528). The location is reported as
220 Bowers · Selby
Ann
u. R
ev. E
arth
Pla
net.
Sci.
2009
.37:
209-
236.
Dow
nloa
ded
from
arjo
urna
ls.an
nual
revi
ews.o
rgby
Uni
vers
ity o
f Brit
ish C
olum
bia
Libr
ary
on 1
2/29
/09.
For
per
sona
l use
onl
y.

ANRV374-EA37-10 ARI 27 March 2009 14:57
2
3
4
5
6
7
Surf
ace
wav
e m
agni
tude
(Ms)
2 3 4 5 6 7Body wave magnitude (mb)
REB Eurasian events 2006
DPRK 061009
India 980511
Pakistan 980528
Lop Nor 030313
China 960729
China 960608
China 950817
IDC ex
perim
enta
l scre
ening lin
e
Presumed earthquakes
Presumed explosions
M s = 1.25m b –
2.2
Figure 2mb:Ms for recent Eurasian underground explosions and earthquakes. Magnitudes for earthquakes shown are from the Reviewed EventBulletin (REB) except for Lop Nor 030313 (Selby et al. 2005). Magnitudes for the explosion in North Korea (DPRK 061009) are fromSelby & Bowers (2007), and for the explosions in India 980511 and Pakistan 980528 are from Bowers et al. (2002), except Ms for India980511, which is from Douglas et al. (2002). For the Chinese explosions, mb is from the REB and Ms is from Bonner et al. (2006).
28.792!N, 64.948!E from satellite imagery (Albright et al. 1999), with an origin time of 10:16:17.0UTC estimated from seismic signals (Barker et al. 1998). The prototype IDC REB reportednetwork-averaged mb and Ms of 4.9 and 3.6, respectively. PAK 980528 was not screened out usingthe experimental mb:Ms criteria (Fisk et al. 2002) and was not considered for the experimental P/Sscreening (Bottone et al. 2002), presumably because data from NIL were not available. Nonethe-less, PAK 980528 appears to be more earthquake-like than the vast majority of presumed UNEsconsidered when the experimental mb:Ms screening criteria was developed.
As briefly mentioned earlier, Jenkins & Sereno (2001) failed to identify PAK 980528 as anexplosion using regional high-frequency P/S amplitude ratios. The apparent failure of the high-frequency P/S criteria seems to be due to the misassociation of P from a near-regional earthquaketo S from PAK 980528 (Bowers et al. 2002).
Bowers et al. (2002) estimated a network-averaged Ms equal to 3.44 from carefully associatedRayleigh waves using a variable-period method with path-corrections (Marshall & Basham 1972),noting that PAK 980528 falls between the historical presumed UNE and earthquake populationsfor Eurasia (Figure 2). Thus, PAK 980528 may arouse suspicion using the mb:Ms criteria, but itis also consistent with deep-lithospheric Eurasian earthquakes.
www.annualreviews.org • Forensic Seismology and the CTBT 221
Ann
u. R
ev. E
arth
Pla
net.
Sci.
2009
.37:
209-
236.
Dow
nloa
ded
from
arjo
urna
ls.an
nual
revi
ews.o
rgby
Uni
vers
ity o
f Brit
ish C
olum
bia
Libr
ary
on 1
2/29
/09.
For
per
sona
l use
onl
y.

ANRV374-EA37-10 ARI 27 March 2009 14:57
100
50
0
–50
–100
100
50
0
–50
–100100
50
0
–50
–100
100
50
0
0 500 1000Time after 10:16:17 (s)
1500
–50
–100
Dis
plac
emen
t (nm
)
RAYN Rayleigh
RAYN Love
CMAR Rayleigh
CMAR Love 3.5
3.5
3.5
3.5
Figure 3Surface-wave seismograms from the underground explosion in Pakistan on May 28, 1998 recorded atstations RAYN (Saudi Arabia) and CMAR (Thailand). Seismograms are filtered in the passband 0.025–0.045 Hz. At both stations, the Love waves (red ) are larger than the Rayleigh waves (blue). The vertical lineindicates the time of arrival for a group wave speed of 3.5 km/s.
Although P onset times from 63 stations were reported in the prototype IDC REB for PAK980528, the vast majority of the teleseismic P waves recorded from PAK 980528 are unusuallycomplex compared with those typically observed from underground explosions. Further, there arestrong Love waves recorded at the non-IMS station in Saudi Arabia (RAYN) and an IMS stationin Thailand (CMAR) (Figure 3), indicating that there was significant tectonic release. However,simple P seismograms were recorded by at least three IMS stations (in Australia, Antarctica, andthe United States). Bowers et al. (2002) showed that these three simple P seismograms are incon-sistent with an earthquake source at a depth of at least 5 km, implying that the source is shallowand thus should arouse suspicion using the mb:Ms criteria.
KURSK SUBMARINE DISASTER, AUGUST 12, 2000Seismologists at the NORSAR group in Norway reported two nearly colocated seismic distur-bances on August 12, 2000, with epicenters in the Barents Sea (Ringdal et al. 2000). Seismicdisturbances in the Barents and Kara Sea regions (Figure 1), which have a low level of naturalseismicity, are of interest due to the proximity of the Russian nuclear test site at Novaya Zemlya(Koper et al. 2001). The first and second seismic disturbances have local magnitudes of 1.5 and
222 Bowers · Selby
Ann
u. R
ev. E
arth
Pla
net.
Sci.
2009
.37:
209-
236.
Dow
nloa
ded
from
arjo
urna
ls.an
nual
revi
ews.o
rgby
Uni
vers
ity o
f Brit
ish C
olum
bia
Libr
ary
on 1
2/29
/09.
For
per
sona
l use
onl
y.

ANRV374-EA37-10 ARI 27 March 2009 14:57
Mean ARCES amplitude spectra: Disturbance 2
Nor
mal
ized
spec
tral
am
plitu
de
Frequency (Hz)0 2 4 6 8 10 12 14
10–3
10–2
10–1
100
101 PLgLg codaNoise
Figure 4Array-averaged amplitude spectra from time windows corresponding to P, Lg, and Lg coda from the seconddisturbance associated with the sinking of the Kursk submarine on August 12, 2000. The amplitudespectrum of the noise preceding the P onset of the signal from the second disturbance (i.e., the coda from thefirst disturbance) is also shown.
3.5 respectively (Ringdal et al. 2000). P signals from the larger second disturbance were detectedas far away as Alaska and reported in the REB.
Seismic signals from the two disturbances were clearly recorded by the IMS seismometer array(25 sensors) in northern Norway (ARCES). ARCES is approximately 470 km from the reportedlocation of the tragic sinking of the Kursk submarine at 69.6166!N, 37.5708!E (Schweitzer 2002).The epicenter of the second disturbance estimated by NORSAR is within 6 km of the reportedlocation, and hence the seismic signals observed were associated with the sinking of the Kursk(Ringdal et al. 2000).
The origin time of the second disturbance is estimated as 07:30:42.4 UTC; relative timesmeasured using cross-correlation show the first disturbance occurred 135.8 s earlier, located withina few hundred meters of the second. Further, the relatively high cross-correlation coefficients forP and S at ARCES have been interpreted as indicating similar, but not identical, source andpropagation characteristics (Schweitzer 2002).
Figure 4 shows the array-averaged amplitude spectra from signals recorded at ARCES fromthe second disturbance. The P, Lg, and Lg coda show a common modulation with a regu-lar interval frequency of approximately 1.45 Hz, and clear spectral notches at approximately 6and 12 Hz. Given the very different propagation paths, the similarity of the modulation and
www.annualreviews.org • Forensic Seismology and the CTBT 223
Ann
u. R
ev. E
arth
Pla
net.
Sci.
2009
.37:
209-
236.
Dow
nloa
ded
from
arjo
urna
ls.an
nual
revi
ews.o
rgby
Uni
vers
ity o
f Brit
ish C
olum
bia
Libr
ary
on 1
2/29
/09.
For
per
sona
l use
onl
y.

ANRV374-EA37-10 ARI 27 March 2009 14:57
notches in the regional phase amplitude spectra suggests that these are related to the seismicsource.
The 1.45 Hz modulation frequency is diagnostic of the bubble pulse from an underwaterexplosion (Koper et al. 2001, Sebe et al. 2005). Many decades of experience with underwaterchemical explosions suggest the yield can be estimated from the bubble-pulse frequency if thesource depth is known. It turns out that the notches in the ARCES amplitude spectra (Figure 4)constrain the source depth.
Figure 5 shows notches in synthetic far-field amplitude spectra that are dependent on thesource depth in a water layer over a solid half-space. We can see that for a water layer 120 mthick, synthetic spectral notches at approximately 6 and 12 Hz are seen if the source is on the seafloor. Similar observations and modeling lead to the conclusion that the second Kursk explosionoccurred on the sea floor (Koper et al. 2001, Schweitzer 2002, Sebe et al. 2005). The depth/bubble-pulse frequency and seismic magnitude give a yield estimate roughly equivalent to approximatelyfive tons of TNT (in the range of two to eight tons).
Similar analysis of the regional phase amplitude spectra of signals recorded at ARCES from thefirst disturbance is not possible due to the poor signal-to-noise ratio. However, the similarity of thesignals from the first and second disturbances suggests that the source of the first disturbance is alsoan explosion. Semblance analysis of the beamformed regional phases suggests the beamformed Pamplitude spectrum is reliable over the passband 2–10 Hz. The beamformed P spectrum showsno evidence of a bubble pulse, or of a notch at approximately 6 Hz, which is consistent with thefirst explosion occurring at a depth of approximately 80 m or less (Figure 5) and being completelycontained by the hull of the submarine. The estimate of the yield from seismic magnitude of thefirst explosion is in the range of 2 to 80 kg of TNT. However, decoupling experiments underwatershow signals are muffled by a factor of between 5 and 10 (Khristoforov 1996). If the potentialmuffling effect of the submarine’s hull is considered, the yield estimate of the first explosion isrevised to the range of 10 to 800 kg of TNT.
Several authors have referred to observations of negative first-motion of P from the sec-ond Kursk disturbance, which is more consistent with an implosion than an explosion source(Koper et al. 2001, Schweitzer 2002). Schweitzer (2002) compares filtered (passband 1.5–8.0 Hz)beamformed P onsets at IMS seismometer arrays ARCES and FINES (Finland) from the secondKursk disturbance, with those from a local-magnitude 2.5 underwater explosion conducted by theRussian navy. The P onsets on the filtered seismograms from the explosion are clearly impul-sive with positive first motion, whereas those from the second Kursk disturbance are apparentlynegative (Schweitzer 2002).
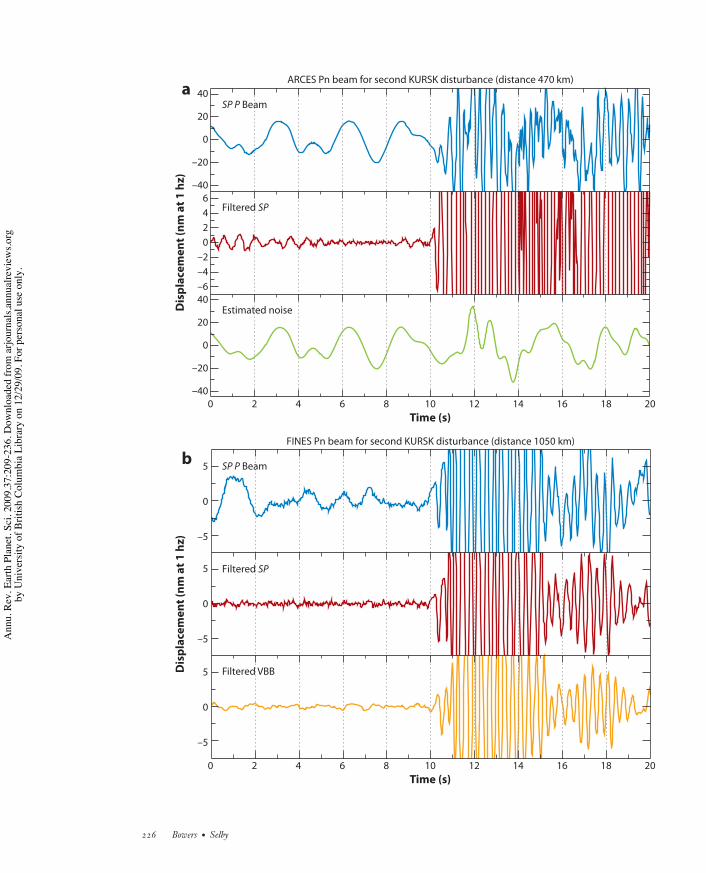
Figure 6 shows the beamformed ARCES and FINES seismograms from the second Kurskdisturbance, both unfiltered and optimally filtered to suppress sinusoidal noise (Douglas 1997).It seems clear that the first motions are positive, and hence consistent with an explosive source.Figure 6 also shows the FINES seismogram filtered to simulate a wide-band velocity seismo-graph. It becomes clear that the rise-time of the P-pulse is comparatively slow relative to animpulsive onset, resulting in weak first motion in the short-period seismograph passband. Theforensic seismologist should be aware of the potential pitfalls of attempting to read first mo-tion from bandpass filtered seismograms, or narrow-band seismograph systems (Douglas et al.1997).
It has been known for decades that underwater explosions are remarkably efficient at generatingseismic signals at long range—a 10-ton chemical explosion fired in the North Sea in July 1971generated teleseismic P waves detected in Brazil and Australia ( Jacob & Willmore 1972). Thus,the data from the IMS seismic network can be used to detect and identify small explosions firedunderwater in areas where paths to the hydroacoustic network are blocked.
224 Bowers · Selby
Ann
u. R
ev. E
arth
Pla
net.
Sci.
2009
.37:
209-
236.
Dow
nloa
ded
from
arjo
urna
ls.an
nual
revi
ews.o
rgby
Uni
vers
ity o
f Brit
ish C
olum
bia
Libr
ary
on 1
2/29
/09.
For
per
sona
l use
onl
y.

ANRV374-EA37-10 ARI 27 March 2009 14:57
0 5 10 15
h 120m
h 100m
h 80m
h 60m
h 40m
h 20m
h 0m
Frequency (Hz)
Log(
ampl
itude
)
0.0 0.5 1.0 1.5 2.0 2.5 3.0Time (s)
Thickness = 120 m
Depth 80 m
Model seismogram
Free surface
PnwPpnwP
a
b
VP = 1500 m s–1
VP = 8000 m s–1
Figure 5(a) Amplitude spectra for varying source depths in the model below. (b) Model and example synthetic seismogram for an impulsiveseismic source (at a depth of 80 m) in a water layer (120 m thick) over a half-space.
www.annualreviews.org • Forensic Seismology and the CTBT 225
Ann
u. R
ev. E
arth
Pla
net.
Sci.
2009
.37:
209-
236.
Dow
nloa
ded
from
arjo
urna
ls.an
nual
revi
ews.o
rgby
Uni
vers
ity o
f Brit
ish C
olum
bia
Libr
ary
on 1
2/29
/09.
For
per
sona
l use
onl
y.
ANRV374-EA37-10 ARI 27 March 2009 14:57
SP P Beam
Filtered SP
SP P Beam
Filtered SP
Filtered VBB
Estimated noise
FINES Pn beam for second KURSK disturbance (distance 1050 km)
ARCES Pn beam for second KURSK disturbance (distance 470 km)40
20
0
–20
–40
5
0
–5
5
0
–5
5
0
–5
0 2 4 6 8 10Time (s)
12 14 16 18 20
0 2 4 6 8 10Time (s)
12 14 16 18 20
40
20
0
–20
–40
Dis
plac
emen
t (nm
at 1
hz)
Dis
plac
emen
t (nm
at 1
hz)
6420
–2–4–6
a
b
226 Bowers · Selby
Ann
u. R
ev. E
arth
Pla
net.
Sci.
2009
.37:
209-
236.
Dow
nloa
ded
from
arjo
urna
ls.an
nual
revi
ews.o
rgby
Uni
vers
ity o
f Brit
ish C
olum
bia
Libr
ary
on 1
2/29
/09.
For
per
sona
l use
onl
y.

ANRV374-EA37-10 ARI 27 March 2009 14:57
EARTHQUAKE NEAR LOP NOR, MARCH 13, 2003The REB reported a seismic disturbance on March 13, 2003 near the Chinese nuclear test siteat Lop Nor (epicenter 41.776!N, 89.078!E, origin time 15:07:08.3 UTC, 4.3 mb), subsequentlyreferred to as Lop Nor 030313. The REB associated P waves from 21 IMS stations, but noMs was reported. The location of this seismic disturbance and the remarkably simple short-period teleseismic P waves, all with upward first motion (i.e., explosion-like), warranted furtherinvestigation.
Selby et al. (2005) identify Lop Nor 030313 as an earthquake with mb:Ms (Figure 2) usingthe variable-period Ms measurement, with path corrections (Marshall & Basham 1972). Ms wasmeasured from Rayleigh waves recorded by 12 stations, with network-averaged Ms of 3.63 (Selbyet al. 2005). Selby et al. (2005) were able to obtain data from 16 stations within 30! of the Lop Nor030313 epicenter. Although most of these 16 stations are not IMS stations, they can be consideredsubstitutes for the completed IMS seismic network in the region (Selby et al. 2005). Modeling thesurface-wave (especially Rayleigh) amplitude spectra from these 16 stations, Selby et al. (2005)demonstrate that Lop Nor 030313 is an earthquake with a 40! reverse-dip-slip mechanism ata depth of approximately 6 km. This result is further supported by full waveform modeling ofthree-component data from a non-IMS station WMQ, at a distance of approximately 250 km(Selby et al. 2005).
Historically, mb:Ms has been a robust discriminant for disturbances with mb > 4.5 (althoughperhaps not at smaller magnitudes). The cause of differences between the mb:Ms ratio for earth-quakes and explosions has been discussed in several papers (Douglas et al. 1972, Stevens & Day1985, Douglas 2007). Douglas et al. (1972) demonstrate that shallow earthquakes with near-45!
reverse-dip-slip mechanisms might be expected to be anomalous on the mb:Ms criteria because(a) P waves will show upward first motion at all teleseismic stations (as will P waves from UNEs),(b) for source depths less than approximately 10 km, it is difficult to clearly identify the depthphase pP (and for very shallow sources pP will constructively interfere with P, increasing mb),(c) Rayleigh wave amplitude spectra for this type of focal mechanism have a zero or null at a perioddependent on the source depth and azimuth to the recording station (Tsai & Aki 1970; Douglaset al. 1971a,b), and this may reduce Ms.
The modeling of Rayleigh wave amplitude spectra has successfully been used to estimate thefocal mechanisms and depths of several earthquakes (in addition to Lop Nor 030313) in northwestChina (Fox et al. 2005). It appears that the method is especially applicable to shallow continentaldip-slip earthquakes, which may be difficult to identify using the mb:Ms criterion.
NORTH KOREA 2004–2006Concerns about the development of nuclear weapons by North Korea (DPRK) were heightenedby its withdrawal from the Nuclear Non-Proliferation Treaty in April 2003. The possibility thatthe DPRK might test a nuclear weapon led to increased interest in seismic monitoring of the
%&&&&&&&&&&&&&&&&&&&&&&&&&&&&&&&&&&&&&&&&&&&&&&&&&&&&&&&&&&&&&&&&&&&&&&&
Figure 6P onsets from the second disturbance associated with the sinking of the Kursk submarine on August 12,2000. (a) Comparison of the unfiltered short-period array beam at ARCES with the same trace filtered toestimate the signal assuming the noise is a sinusoid (Douglas 1997), and the estimated noise. (b) Comparisonof the unfiltered short-period array beam at FINES with the signal estimated using the method of Douglas(1997). The bottom trace is the filtered beam-signal estimate converted to an instrument response that isproportional to velocity.
www.annualreviews.org • Forensic Seismology and the CTBT 227
Ann
u. R
ev. E
arth
Pla
net.
Sci.
2009
.37:
209-
236.
Dow
nloa
ded
from
arjo
urna
ls.an
nual
revi
ews.o
rgby
Uni
vers
ity o
f Brit
ish C
olum
bia
Libr
ary
on 1
2/29
/09.
For
per
sona
l use
onl
y.

ANRV374-EA37-10 ARI 27 March 2009 14:57
124°E! 126°E! 128°E! 130°E!
38°N!
40°N!
42°N!
44°N!
0 50 100
km
–4500
–3000
–1500
0
1500
3000
Elevation (m)
China
North Korea
South Korea
Nuclear testOctober 9, 2006 01:35:27.6 UT41.253N 129.048E
EarthquakeSeptember 8, 2004 14:24:20.5 UT41.984N 128.146E
REB eventApril 22, 2004 03:19:11.3 UT39.819N 124.413E
"Mushroom cloud"September 9, 2004 02:00 UT
Hydroelectric projectSeptember 16, 2004
MDJ
INCN KS31
Figure 7Locations of what turned out to be seismic nonevents and genuine seismic events of interest to the forensic seismologist in the NorthKorean region over the past five years.
region. During 2004, two events occurred for which the application of forensic seismologicaltechniques was able to help clarify confusing press reports.
On April 22, 2004, a large explosion occurred near the railway station at Ryongchon in north-western North Korea (see Figure 7). Little is known about the explosion, although the NorthKorean news agency KCNA reported that it was an accident caused by an electrical contact duringthe shunting of wagons loaded with ammonium nitrate fertilizer (KCNA 2004, BBC 2004a). Press
228 Bowers · Selby
Ann
u. R
ev. E
arth
Pla
net.
Sci.
2009
.37:
209-
236.
Dow
nloa
ded
from
arjo
urna
ls.an
nual
revi
ews.o
rgby
Uni
vers
ity o
f Brit
ish C
olum
bia
Libr
ary
on 1
2/29
/09.
For
per
sona
l use
onl
y.
ANRV374-EA37-10 ARI 27 March 2009 14:57
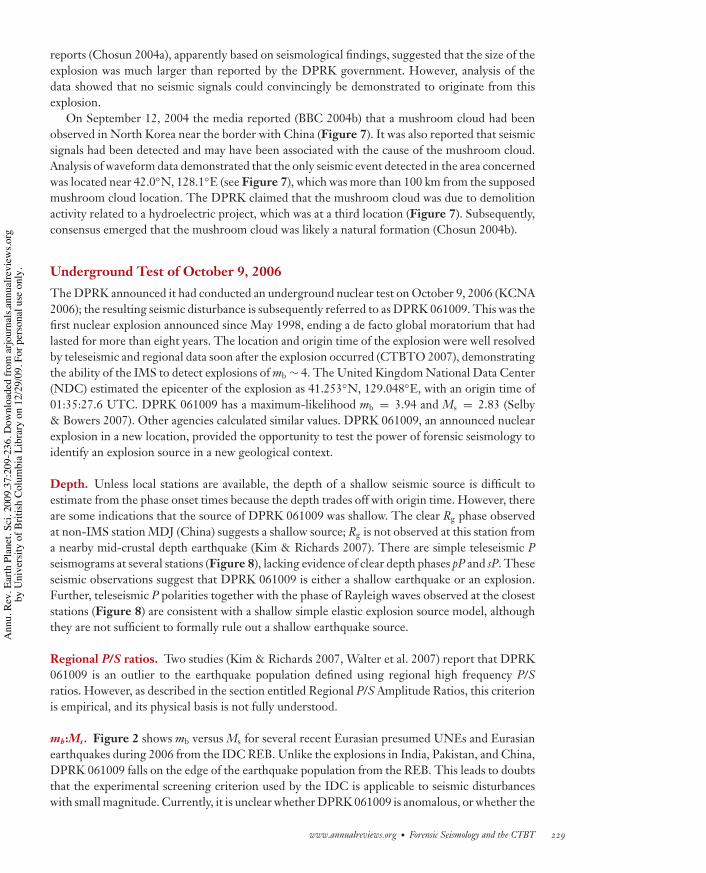
reports (Chosun 2004a), apparently based on seismological findings, suggested that the size of theexplosion was much larger than reported by the DPRK government. However, analysis of thedata showed that no seismic signals could convincingly be demonstrated to originate from thisexplosion.
On September 12, 2004 the media reported (BBC 2004b) that a mushroom cloud had beenobserved in North Korea near the border with China (Figure 7). It was also reported that seismicsignals had been detected and may have been associated with the cause of the mushroom cloud.Analysis of waveform data demonstrated that the only seismic event detected in the area concernedwas located near 42.0!N, 128.1!E (see Figure 7), which was more than 100 km from the supposedmushroom cloud location. The DPRK claimed that the mushroom cloud was due to demolitionactivity related to a hydroelectric project, which was at a third location (Figure 7). Subsequently,consensus emerged that the mushroom cloud was likely a natural formation (Chosun 2004b).
Underground Test of October 9, 2006The DPRK announced it had conducted an underground nuclear test on October 9, 2006 (KCNA2006); the resulting seismic disturbance is subsequently referred to as DPRK 061009. This was thefirst nuclear explosion announced since May 1998, ending a de facto global moratorium that hadlasted for more than eight years. The location and origin time of the explosion were well resolvedby teleseismic and regional data soon after the explosion occurred (CTBTO 2007), demonstratingthe ability of the IMS to detect explosions of mb " 4. The United Kingdom National Data Center(NDC) estimated the epicenter of the explosion as 41.253!N, 129.048!E, with an origin time of01:35:27.6 UTC. DPRK 061009 has a maximum-likelihood mb = 3.94 and Ms = 2.83 (Selby& Bowers 2007). Other agencies calculated similar values. DPRK 061009, an announced nuclearexplosion in a new location, provided the opportunity to test the power of forensic seismology toidentify an explosion source in a new geological context.
Depth. Unless local stations are available, the depth of a shallow seismic source is difficult toestimate from the phase onset times because the depth trades off with origin time. However, thereare some indications that the source of DPRK 061009 was shallow. The clear Rg phase observedat non-IMS station MDJ (China) suggests a shallow source; Rg is not observed at this station froma nearby mid-crustal depth earthquake (Kim & Richards 2007). There are simple teleseismic Pseismograms at several stations (Figure 8), lacking evidence of clear depth phases pP and sP. Theseseismic observations suggest that DPRK 061009 is either a shallow earthquake or an explosion.Further, teleseismic P polarities together with the phase of Rayleigh waves observed at the closeststations (Figure 8) are consistent with a shallow simple elastic explosion source model, althoughthey are not sufficient to formally rule out a shallow earthquake source.
Regional P/S ratios. Two studies (Kim & Richards 2007, Walter et al. 2007) report that DPRK061009 is an outlier to the earthquake population defined using regional high frequency P/Sratios. However, as described in the section entitled Regional P/S Amplitude Ratios, this criterionis empirical, and its physical basis is not fully understood.
mb:Ms. Figure 2 shows mb versus Ms for several recent Eurasian presumed UNEs and Eurasianearthquakes during 2006 from the IDC REB. Unlike the explosions in India, Pakistan, and China,DPRK 061009 falls on the edge of the earthquake population from the REB. This leads to doubtsthat the experimental screening criterion used by the IDC is applicable to seismic disturbanceswith small magnitude. Currently, it is unclear whether DPRK 061009 is anomalous, or whether the
www.annualreviews.org • Forensic Seismology and the CTBT 229
Ann
u. R
ev. E
arth
Pla
net.
Sci.
2009
.37:
209-
236.
Dow
nloa
ded
from
arjo
urna
ls.an
nual
revi
ews.o
rgby
Uni
vers
ity o
f Brit
ish C
olum
bia
Libr
ary
on 1
2/29
/09.
For
per
sona
l use
onl
y.

ANRV374-EA37-10 ARI 27 March 2009 14:57
a b
Vertical component 0.03–0.05 Hz
nm a
t 1 H
z
Dis
plac
emen
t (nm
)
5
0
–5
40
0
–40
Time (s)
Time (s)0 5 10 15 20
0 100 200 300PDAR
NVAR
GERES
AKASG
ASAR
WRA
ILAR
ABKAR
MDJ
INCN
KS31
Figure 8(a) Observed teleseismic P waves (blue) recorded globally, and (b) regional distance Rayleigh waves from DPRK 061009 (blue). The redtraces on the right are the synthetic seismograms for a point explosion source with a scalar moment of 2.0 $ 1014 Newton-meters.
mb:Ms ratio is as expected for an explosion with small magnitude. The IDC experimental screeningline (shown in Figure 2) was devised under the assumption that mb and Ms scale differently withyield, whereas an explosion model (Mueller & Murphy 1971) suggests that they should scale inthe same way. The inconsistency results from a failure to understand the overall relationship ofMs to yield. Clearly, the theoretical basis of the mb:Ms criterion is not understood.
SUMMARY POINTS
1. The IMS is an important part of the CTBT verification regime. On completion, the IMSnetwork will comprise 337 facilities, 170 of which will be seismic stations.
2. The application of the analysis of seismic data to support verification of the Treaty hasbeen called forensic seismology and its main application is the identification of under-ground explosions from the thousands of earthquakes of potential interest that occureach year.
3. There are four main tasks for the forensic seismologist: (a) signal detection, (b) associationof signals, (c) source location, and (d ) source identification.
230 Bowers · Selby
Ann
u. R
ev. E
arth
Pla
net.
Sci.
2009
.37:
209-
236.
Dow
nloa
ded
from
arjo
urna
ls.an
nual
revi
ews.o
rgby
Uni
vers
ity o
f Brit
ish C
olum
bia
Libr
ary
on 1
2/29
/09.
For
per
sona
l use
onl
y.

ANRV374-EA37-10 ARI 27 March 2009 14:57
4. There are four main complementary methods for source identification: (a) source depth,(b) ratio of mb to Ms, (c) ratio of high-frequency (>2 Hz) P to S energy, and (d ) model-based methods.
5. The mb:Ms and high-frequency P/S criteria are empirically based on observations ofsignals from presumed UNEs and earthquakes. Whereas models of the earthquake sourceexplain the observations reasonably well, current equivalent-elastic models of the UNEdo not.
6. Source-depth estimation is often difficult and unreliable, and model-based methods arealso subject to large uncertainties in the appropriate equivalent-elastic model for UNEsfired in the diverse geological environments around the world.
7. Experience gained by forensic seismologists in the past decade at identifying suspiciousseismic sources using data from IMS and non-IMS stations suggests that although nosingle method works all of the time, intelligent and original application of the comple-mentary methods available is usually sufficient to satisfactorily identify the seismic sourcein question.
8. Identifying a single underground explosion as nuclear or chemical is not possible usingseismology; diagnostic radionuclides must be detected. The IMS has a network of 80radionuclide stations for this purpose, and there is provision for on-site inspection toconfirm violations of the Treaty.
FUTURE ISSUES
1. Development of equivalent-elastic models for UNEs in diverse geological media thatexplain how explosions generate high-frequency P and S waves and long-period Rayleighand Love waves is necessary.
2. Development of realistic 3D models of the Earth (recent developments on resolv-ing upper-mantle and crustal structure are described in this volume by M. Ritzwollerin the review, “Earth Structure from Seismic Noise”) and the generation of syn-thetic seismograms from realistic earthquake and UNE sources in 3D models arenecessary.
3. It is important to identify the seismic source by solving the inverse problem using multipledatasets (e.g., high-frequency P and S and long-period Rayleigh and Love waves), which,if inverted, individually currently give contradictory solutions, presumably because themodels and/or parameters used are inappropriate.
DISCLOSURE STATEMENTAWE Blacknest operates the National Data Center, on behalf of the United Kingdom NationalAuthority to the CTBT Organization, under contract with the Ministry of Defence (MoD). Theviews expressed in this article are those of the authors and are not necessarily those of AWE, MoD,or the United Kingdom government.
www.annualreviews.org • Forensic Seismology and the CTBT 231
Ann
u. R
ev. E
arth
Pla
net.
Sci.
2009
.37:
209-
236.
Dow
nloa
ded
from
arjo
urna
ls.an
nual
revi
ews.o
rgby
Uni
vers
ity o
f Brit
ish C
olum
bia
Libr
ary
on 1
2/29
/09.
For
per
sona
l use
onl
y.

ANRV374-EA37-10 ARI 27 March 2009 14:57
LITERATURE CITED
Albright D, Gay C, Pabian F. 1999. New details emerge on Pakistan’s first nuclear test site. Earth Obs. Mag.Jan. 7:No. 12
Anderson DN, Fagan DK, Tinker MA, Kraft GD, Hutchenson KD. 2007. A mathematical statistics formula-tion of the teleseismic explosion identification problem with multiple discriminants. Bull. Seism. Soc. Am.97:1730–41
Anderson DN, Taylor SR. 2002. Application of regularized discrimination analysis to regional seismic eventidentification. Bull. Seism. Soc. Am. 92:1078–90
Barker B, Clark M, Davis P, Fisk M, Hedlin M, et al. 1998. Monitoring nuclear tests. Science 281:1967–68Barrientos S, Haslinger F, Astiz L, Bereza S, Given H, et al. 2001. Seismological monitoring of the Compre-
hensive Nuclear-Test-Ban Treaty. Kerntechnik 66:82–89BBC. 2004a. Rumours linger over N Korea blast. http://news.bbc.co.uk/1/hi/world/asia-pacific/3652157.stm
(Accessed October 25, 2008)BBC. 2004b. UK demands N Korea explain blast. http://news.bbc.co.uk/1/hi/uk politics/3648988.stm
(Accessed October 25, 2008)Bennett TJ, McLaughlin KL. 1997. Seismic characteristics and mechanisms of rockbursts for use in seismic
discrimination. See Gibowicz & Lasocki 1997, pp. 61–66Blandford RR. 1977. Discrimination between earthquakes and underground explosions. Annu. Rev. Earth
Planet. Sci. 5:111–22Blandford RR. 1981. Seismic discrimination problems at regional distances. See Husebye & Mykkeltveit 1981,
pp. 695–740Blandford RR. 1996. Regional seismic event discrimination. See Husebye & Dainty 1996, pp. 689–719Bonner JL, Russell DR, Harkrider DG, Reiter DT, Herrmann RB. 2006. Development of a time-domain,
variable-period surface-wave magnitude measurement procedure for application at regional and teleseis-mic distances, Part II: application and Ms – mb performance. Bull. Seism. Soc. Am. 96:678–96
Bottone S, Fisk MD, McCartor GD. 2002. Regional seismic-event characterization using a Bayesian formu-lation of simple kriging. Bull. Seism. Soc. Am. 92:2277–96
Bowers D. 1997. The October 30, 1994 seismic disturbance in South Africa: earthquake or large rock burst?J. Geophys. Res. 102:9843–57
Bowers D. 2002. Was the 16 August 1997 seismic disturbance near Novaya Zemlya an earthquake? Bull. Seism.Soc. Am. 92:2400–9
Bowers D, Douglas A. 1997. Characterisation of large mine tremors using P observed at teleseismic distances.See Gibowicz & Lasocki 1997, pp. 55–60
Bowers D, Douglas A. 1998. The effect of the earthquake radiation pattern on mb—a study using aftershocksin the 1976 Gazli sequence. Bull. Seism. Soc. Am. 88:523–30
Bowers D, Douglas A, Selby ND, Marshall PD, Porter D, et al. 2002. Seismological identification of the 1998May 28 Pakistan nuclear test. Geophys. J. Int.150:153–61
Bowers D, Marshall PD, Douglas A. 2001. The level of deterrence provided by data from the SPITS seismome-ter array to possible violations of the Comprehensive Test Ban in the Novaya Zemlya region. Geophys. J.Int.146:425–38
Bowers D, Pearce RG, Douglas A. 2000. Using regional geophysical databases to facilitate the identificationof surface reflections on P-seismograms. Geophys. J. Int. 142:915–24
Bowers D, Walter WR. 2002. Discriminating between large mine collapses and explosions using teleseismicP waves. Pure Appl. Geophys. 159:803–30
Bratt SR. 2001. The International Data Centre of the Comprehensive Nuclear-Test-Ban Treaty: vision andprogress. Kerntechnik 66:134–42
Chosun. 2004a. Ryongchon explosion eight times as great as North claims. http://english.chosun.com/w21data/html/news/200405/200405160017.html (Accessed October 25, 2008)
Chosun. 2004b. Signs indicate no explosion occurred in N. Korea’s Kim Hyong-jik County. http://english.chosun.com/w21data/html/news/200409/200409170025.html (Accessed October 25, 2008)
Christie DR, Vivas Veloso JA, Campus P, Bell M, Hoffmann T, et al. 2001. Detection of atmospheric nuclearexplosions: the infrasound component of the International Monitoring System. Kerntechnik 66:96–101
232 Bowers · Selby
Ann
u. R
ev. E
arth
Pla
net.
Sci.
2009
.37:
209-
236.
Dow
nloa
ded
from
arjo
urna
ls.an
nual
revi
ews.o
rgby
Uni
vers
ity o
f Brit
ish C
olum
bia
Libr
ary
on 1
2/29
/09.
For
per
sona
l use
onl
y.
ANRV374-EA37-10 ARI 27 March 2009 14:57
CTBTO Prep. Comm. 2007. North Korea: a real test for the CTBT verification system? CTBTO Spectr. 9:24,28
Denny MD, Johnson LR. 1991. The explosion seismic source function: Models and scaling laws reviewed.See Taylor et al. 1991, pp. 1–24
Douglas A. 1981. Seismic source identification: a review of past and present research efforts. See Husebye &Mykkeltveit 1981, pp. 1–48
Douglas A. 1997. Bandpass filtering to reduce noise on seismograms: Is there a better way? Bull. Seism. Soc.Am. 87:770–77
Douglas A. 2007. Forensic seismology revisited. Surv. Geophys. 28:1–31Douglas A, Bowers D, Marshall PD, Young JB, Porter D, et al. 1999. Putting nuclear-test monitoring to the
test. Nature 398:474–75Douglas A, Bowers D, Young JB. 1997. On the onset of P seismograms. Geophys. J. Int. 129:681–90Douglas A, Hudson JA, Blamey C. 1972. A quantitative evaluation of seismic signals at teleseismic distances—
III. Computed P and Rayleigh wave seismograms. Geophys. J. R. Astron. Soc. 28:385–410Douglas A, Hudson JA, Kembhavi VK. 1971a. The analysis of surface wave spectra using a reciprocity theorem
for surface waves. Geophys J. R. Astron. Soc. 23:207–23Douglas A, Hudson JA, Kembhavi VK. 1971b. The relative excitation of seismic surface and body waves by
point sources. Geophys. J. R. Astron. Soc. 23:451–60Douglas A, Selby ND, Bowers D. 2002. Seismic magnitude and yield for the Indian nuclear test of 11 May
1998. Curr. Sci. 83:989–92Ekstrom G, Richards PG. 1994. Empirical measurements of tectonic moment release in nuclear explosions
from teleseismic surface waves and body waves. Geophys. J. Int. 117:120–40Evernden JF. 1998. Estimation of yields of underground explosions with emphasis on recent Indian and
Pakistani explosions. Phys. Soc. 27:10–11Fan G-W, Lay T, Bottone S. 2002. Path corrections for source discriminants: a case study at two International
Monitoring System stations. Pure Appl. Geophys. 159:651–78Fisk MD. 2006. Source spectral modeling of regional P/S discriminants at nuclear test sites in China and the
former Soviet Union. Bull. Seism. Soc. Am. 96:2348–67Fisk MD. 2007. Corner frequency scaling of regional seismic phases for underground nuclear explosions at
the Nevada Test Site. Bull. Seism. Soc. Am. 97:977–88Fisk MD, Gray HL, McCartor GD. 1996. Regional discrimination without transporting thresholds. Bull.
Seism. Soc. Am. 86:1545–58Fisk MD, Jepsen D, Murphy JR. 2002. Experimental seismic event-screening criteria at the Prototype Inter-
national Data Centre. Pure Appl. Geophys. 159:865–88Fox BD, Woodhouse JH, Selby ND. 2005. Source depth determination in China using intermediate-period
fundamental mode surface waves. EOS Trans. AGU Fall Meet. Suppl. 86(52) (Abstr. S51B-1011)Gibowicz SJ, Lasocki S, eds. 1997. Rockbursts and Seismicity in Mines. Rotterdam: Balkema. 437 pp.Granville JP, Kim W-Y, Richards PG. 2002. An assessment of seismic body-wave magnitudes published by
the prototype International Data Centre. Seism. Res. Lett. 73:893–906Granville JP, Richards PG, Kim W-Y, Sykes LR. 2005. Understanding the differences between three teleseis-
mic mb scales. Bull. Seism. Soc. Am. 95:1809–24Hartse HE. 1998. The 16 August 1997 Novaya Zemlya seismic event as viewed from GSN stations KEV and
KBS. Seism. Res. Lett. 69:206–15Herrin E, Goforth T. 1986. Phase analysis of Rayleigh waves from the Shagan River test site in the USSR.
Bull. Seism. Soc. Am. 76:1739–54Heyburn R, Bowers D. 2008. Earthquake depth estimation using the F trace and associated probability.
Geophys. J. Int. 98:18–35Holzer TL, Fletcher JB, Fuis GS, Ryberg T, Brocher TM, Dietel CM. 1996. Seismograms offer insight into
Oklahoma City bombing. EOS Trans. Am. Geophys. Union 77:393, 398–99Husebye ES, Dainty AM, eds. 1996. Monitoring a Comprehensive Test Ban Treaty. London: Kluwer. 836 pp.Husebye ES, Mykkeltveit S, eds. 1981. Identification of Seismic Sources—Earthquake or Underground Explosion.
Holland: Reidel. 876 pp.
www.annualreviews.org • Forensic Seismology and the CTBT 233
Ann
u. R
ev. E
arth
Pla
net.
Sci.
2009
.37:
209-
236.
Dow
nloa
ded
from
arjo
urna
ls.an
nual
revi
ews.o
rgby
Uni
vers
ity o
f Brit
ish C
olum
bia
Libr
ary
on 1
2/29
/09.
For
per
sona
l use
onl
y.

ANRV374-EA37-10 ARI 27 March 2009 14:57
Jacob AWB, Willmore PL. 1972. Teleseismic P waves from a 10 ton explosion. Nature 236:305–6Jenkins RD, Sereno TJ. 2001. Calibration of regional S/P amplitude-ratio discriminants. Pure Appl. Geophys.
158:1279–300Karhu P, Clawson R. 2001. Radionuclide laboratories supporting the network of radionuclide stations in
verification of the Comprehensive Nuclear-Test-Ban Treaty. Kerntechnik 66:126–28KCNA. 2004. Report on explosion at Ryongchon railway station. http://www.kcna.co.jp/item/2004/200404/
news04/24.htm#1 (Accessed October 25, 2008)KCNA. 2006. DPRK successfully conducts underground nuclear test. http://www.kcna.co.jp/item/2006/200610/
news10/10.htm#1 (Accessed October 25, 2008)Khristoforov B. 1996. About the control of the underwater and above water nuclear explosions by hydroacoustic
methods. Tech. Rep. SPC-95-4049. Russ. Acad. Sci., MoscowKim W-Y, Aharonian V, Lerner-Lam L, Richards PG. 1997. Discrimination of earthquakes and explosions
in Southern Russia using regional high-frequency three-component data from the IRIS/JSP Caucasusnetwork. Bull. Seism. Soc. Am. 87:569–88
Kim W-Y, Richards PG. 2007. North Korean nuclear test: seismic discrimination at low yield. EOS Trans.Am. Geophys. Union 88:158, 161
Kim W-Y, Sykes LR, Armitage JH, Xie JK, Jacob KH, et al. 2001. Seismic waves generated by aircraft impactsand building collapses at World Trade Center, New York City. EOS Trans. Am. Geophys. Union 82:565,570–71
Koper KD, Wallace TC, Hollnack D. 1999. Seismic analysis of the 7 August 1998 truck bomb blast at theAmerican embassy in Nairobi, Kenya. Seism. Res. Lett. 70:512–21
Koper KD, Wallace TC, Reinke RE, Leverette JA. 2002. Empirical scaling laws for truck bomb explosionsbased on seismic and acoustic data. Bull. Seism. Soc. Am. 92:527–42
Koper KD, Wallace TC, Taylor SR, Hartse HE. 2001. Forensic seismology and the sinking of the Kursk.EOS Trans. Am. Geophys. Union 82:37, 45–46
Kradolfer U. 2000. Waves4U: waveform availability through AutoDRM’s. Seism. Res. Lett. 71:79–82Lawrence M, Galindo M, Grenard P, Newton J. 2001. Hydroacoustic monitoring system for the Compre-
hensive Nuclear-Test-Ban Treaty. Kerntechnik 66:90–95Lilwall RC. 1987. Station threshold bias in short-period amplitude distance and station terms used to compute
body-wave magnitudes mb. Geophys. J. R. Astron. Soc. 91:1127–33Lilwall RC. 1988. Regional mb:Ms, Lg/Pg amplitude ratios and Lg spectral ratios as criteria for distinguishing
between earthquakes and explosions: a theoretical study. Geophys. J. 93:137–47Marshall PD, Basham PW. 1972. Discrimination between earthquakes and underground explosions employing
an improved Ms scale. Geophys. J. R. Astron. Soc. 28:431–58Marshall PD, Rozgonova D, Weiss W. 2001. Testing times: the road to a Comprehensive Nuclear-Test-Ban
Treaty. Kerntechnik 66:80–81Marshall PD, Springer DL, Rodean HC. 1979. Magnitude corrections for attenuation in the upper mantle.
Geophys. J. R. Astron. Soc. 57:609–38Matthews M, Schulze J. 2001. The radionuclide monitoring system of the Comprehensive Nuclear-Test-Ban
Treaty Organisation: from sample to product. Kerntechnik 66:102–11McCormack DA. 2003. Using seismic data in air crash investigations. CTBTO Spectr. 2:1, 16Mueller RA, Murphy JR. 1971. Seismic characterization of underground nuclear detonations. Part I. Seismic
scaling law of underground nuclear detonations. Bull. Seism. Soc. Am. 61:1675–92Murphy JR. 1996. Types of seismic event and their source descriptions. See Husebye & Dainty 1996,
pp. 225–45Murphy JR, Barker BW. 2006. Improved focal-depth determination through automated identification of the
seismic depth phases pP and sP. Bull. Seism. Soc. Am. 96:1213–29Myers SC, Wagoner J, Larsen S, Rodgers A, Mayeda K, et al. 2003. Simulation of regional explosion S-
phases (SiRES) project. Proc. 2003 Seism. Res. Rev., Tucson, AZ, Tech. Rep. UCRL-JC-153604. pp. 117–24.Livermore, CA: Lawrence Livermore Natl. Lab.
Myers SC, Walter WR, Mayeda K, Glenn L. 1999. Observations in support of Rg scattering as a source forexplosion S waves: regional and local recordings of the 1997 Kazakhstan depth of burial experiment.Bull. Seism. Soc. Am. 89:544–49
234 Bowers · Selby
Ann
u. R
ev. E
arth
Pla
net.
Sci.
2009
.37:
209-
236.
Dow
nloa
ded
from
arjo
urna
ls.an
nual
revi
ews.o
rgby
Uni
vers
ity o
f Brit
ish C
olum
bia
Libr
ary
on 1
2/29
/09.
For
per
sona
l use
onl
y.

ANRV374-EA37-10 ARI 27 March 2009 14:57
Natl. Acad. Sci. 2002. Technical issues related to the Comprehensive Nuclear Test Ban Treaty. Washington,DC: Natl. Acad. Press. 84 pp.
Patton HJ. 1991. Seismic moment estimation and the scaling of the long-period explosion source spectrum.See Taylor et al. 1991, pp. 171–83
Patton HJ. 1998. Bias in the centroid moment tensor for central Asian earthquakes: evidence from regionalsurface wave data. J. Geophys. Res. 103:26963–74
Pearce RG. 1980. Fault plane solutions using relative amplitudes of P and surface reflections: further studies.Geophys. J. R. Astron. Soc. 60:459–87
Rezapour M, Pearce RG. 1998. Bias in surface wave magnitude Ms due to inadequate distance corrections.Bull. Seism. Soc. Am. 88:43–61
Richards PG, Kim W-Y. 1997. Testing the nuclear test-ban treaty. Nature 389:781–82Richards PG, Zavales J. 1996. Seismological methods for monitoring a CTBT: the technical issues arising in
early negotiations. See Husebye & Dainty 1996, pp. 53–81Ringdal F, Kremenetskaya E, Asming V. 2001. Observed characteristics of regional seismic phases and impli-
cations for P/S discrimination in the European Arctic. Pure Appl. Geophys. 159:701–19Ringdal F, Kværna T, Paulsen B. 2000. Seismic events in the Barents Sea at and near the site of the Kursk
submarine accident on 12 August 2000. NORSAR Sci. Rep. 1-2000/1002, Norway, pp. 77–88Rodgers AJ, Walter WR. 2002. Seismic discrimination of the May 11, 1998 Indian nuclear test with short-
period regional data from station NIL (Nilore, Pakistan). Pure Appl. Geophys. 159:679–700Rodgers AJ, Walter WR, Bredbeck TM. 1999a. Complete regional waveform modelling to estimate seismic
velocity structure and source parameters for CTBT monitoring. Proc. 21st Seism. Res. Symp., Las Vegas,NV, Tech. Rep. LA-UR-99-4700. pp. 226–33. Los Alamos, NM: Los Alamos Natl. Lab.
Rodgers AJ, Walter WR, Schultz CA, Myers SC, Lay T. 1999b. A comparison of methodologies for repre-senting path effects on regional P/S discriminants. Bull. Seism. Soc. Am. 89:394–408
Russell D. 2006. Development of a time-domain, variable-period surface wave magnitude measurement pro-cedure for application at regional and teleseismic distances, part I: theory. Bull. Seism. Soc. Am. 96:665–77
Rygg E. 1979. Anomalous surface waves from underground explosions. Bull. Seism. Soc. Am. 69:1995–2002Schultz CA, Myers SC, Hipp J, Young CJ. 1998. Nonstationary Bayesian kriging: a predictive technique
to generate spatial corrections for seismic detection, location, and identification. Bull. Seism. Soc. Am.88:1275–88
Schweitzer J. 2002. Some results derived from the seismic signals of the accident of the Russian submarineKursk. NORSAR Sci. Rep. 1-2002, Norway, pp. 115–21
Sebe O, Bard P-Y, Guilbert J. 2005. Single station estimation of seismic source time function from coda waves:The Kursk disaster. Geophys. Res. Lett. 32:L14308
Selby ND. 2001. Association of Rayleigh waves using back-azimuth measurements: application to test banverification. Bull. Seism. Soc. Am. 91:580–93
Selby ND, Bowers D. 2007. Implications of the 9 October 2006 North Korean nuclear test for event screening.Seism. Res. Lett. 78:253
Selby ND, Bowers D, Douglas A, Heyburn R, Porter D. 2005. Seismic discrimination in Southern Xinjiang:The 13 March 2003 Lop Nor earthquake. Bull. Seism. Soc. Am. 95:197–211
Selby ND, Bowers D, Marshall PD, Douglas A. 2003. Empirical path and station corrections for surface-wavemagnitude, Ms, using a global network. Geophys. J. Int. 155:379–90
Selby ND, Walter WR, Bowers D. 2004. Tectonic release triggered by the 11 May 1998 Indian nuclear tests.Seism. Res. Lett. 74:252
Sikka SK, Roy F, Nair GJ. 2001. Yield estimation of Indian nuclear tests of 1998. Curr. Sci. 81:885–87Stevens JL, Baker GE, Xu H. 2006. The physical basis of the explosion source and generation of regional
seismic phases. Proc. 28th Seism. Res. Rev., Orlando, Fla., Tech. Rep. LA-UR-06-5471. pp. 681–92. LosAlamos, NM: Los Alamos Natl. Lab.
Stevens JL, Day SM. 1985. The physical basis of mb:Ms and variable frequency magnitude methods forearthquake/explosion discrimination. J. Geophys. Res. 90:3009–20
Stevens JL, McLaughlin KL. 2001. Optimization of surface wave identification and measurement. Pure Appl.Geophys. 158:1547–82
www.annualreviews.org • Forensic Seismology and the CTBT 235
Ann
u. R
ev. E
arth
Pla
net.
Sci.
2009
.37:
209-
236.
Dow
nloa
ded
from
arjo
urna
ls.an
nual
revi
ews.o
rgby
Uni
vers
ity o
f Brit
ish C
olum
bia
Libr
ary
on 1
2/29
/09.
For
per
sona
l use
onl
y.

ANRV374-EA37-10 ARI 27 March 2009 14:57
Stevens JL, Murphy JR. 2002. Yield estimation from surface-wave amplitudes. Pure Appl. Geophys. 158:2227–51Sykes L. 2002. Four decades of progress in seismic identification help verify the CTBT. EOS Trans. Am.
Geophys. Union 83:497, 500Takano M, Krioutchenkov V. 2001. Technical methods employed for the On-Site Inspection. Kerntechnik
66:143–46Taylor SR, Patton HJ, Richards PG, eds. 1991. Explosion Source Phenomenology. Geophys. Monogr. 65.
Washington, DC: Ser. Am. Geophys. Union. 268 pp.Taylor SR, Velasco AA, Hartse HE, Phillips WS, Walter WR, et al. 2002. Amplitude corrections for regional
seismic discriminants. Pure Appl. Geophys. 159:623–50Toksoz MN, Kehrer HH. 1972. Tectonic release by underground nuclear explosions and its effect on seismic
discrimination. Geophys. J. R. Astron. Soc. 31:141–61Tsai Y-B, Aki K. 1970. Precise focal depth determination from amplitude spectra of surface waves. J. Geophys.
Res. 75:5729–43van der Vink GE, Park J. 1994. Nuclear test ban monitoring: new requirements, new resources. Science
263:634–35Walter WR, Matzel E, Pasyanos ME, Harris DB, Gok R, et al. 2007. Empirical observations of earthquake-
explosion discrimination using P/S ratios and implications for the sources of explosion S-waves. Proc. 29thMonit. Res. Rev., Denver, Colo., Tech. Rep. LA-UR-07-5613. pp. 684–93. Los Alamos, NM: Los Alamos Natl.Lab.
Walter WR, Mayeda KM, Patton HJ. 1995. Phase and spectral ratio discrimination between NTS earthquakesand explosions. Part I: empirical observations. Bull. Seism. Soc. Am. 85:1050–67
Walter WR, Taylor SR. 2001. A revised magnitude and distance amplitude correction (MDAC2) procedurefor regional seismic discriminants: Theory and testing at NTS. Tech. Rep. UCRL-ID-146882. LawrenceLivermore Natl. Lab., Livermore, CA
Xie J, Patton HJ. 1999. Regional phase excitation and propagation in the Lop Nor region of central Asia andimplications for P/Lg discriminants. J. Geophys. Res. 104:941–54
Zaslavsky-Paltiel I, Steinberg DM. 2008. Comparison of methods for estimating station magnitude correctionsfor improved seismologic monitoring of the Comprehensive Nuclear-Test-Ban Treaty. Bull. Seism. Soc.Am. 97:1–17
Zhang J, Lay T, Zaslow J, Walter WR. 2002. Source effects on regional seismic discriminant measurements.Bull. Seism. Soc. Am. 91:2926–45
RELATED RESOURCEShttp://www.ctbto.org. CTBT Organisation Web sitehttp://www.iss.niiit.ru/ksenia/catal nt/index.htm. Catalog of worldwide nuclear testing
236 Bowers · Selby
Ann
u. R
ev. E
arth
Pla
net.
Sci.
2009
.37:
209-
236.
Dow
nloa
ded
from
arjo
urna
ls.an
nual
revi
ews.o
rgby
Uni
vers
ity o
f Brit
ish C
olum
bia
Libr
ary
on 1
2/29
/09.
For
per
sona
l use
onl
y.

AR374-FM ARI 27 March 2009 18:4
Annual Reviewof Earth andPlanetary Sciences
Volume 37, 2009Contents
Where Are You From? Why Are You Here? An African Perspectiveon Global WarmingS. George Philander ! ! ! ! ! ! ! ! ! ! ! ! ! ! ! ! ! ! ! ! ! ! ! ! ! ! ! ! ! ! ! ! ! ! ! ! ! ! ! ! ! ! ! ! ! ! ! ! ! ! ! ! ! ! ! ! ! ! ! ! ! ! ! ! ! ! ! ! ! ! ! ! ! ! ! ! 1
Stagnant Slab: A ReviewYoshio Fukao, Masayuki Obayashi, Tomoeki Nakakuki,and the Deep Slab Project Group ! ! ! ! ! ! ! ! ! ! ! ! ! ! ! ! ! ! ! ! ! ! ! ! ! ! ! ! ! ! ! ! ! ! ! ! ! ! ! ! ! ! ! ! ! ! ! ! ! ! ! ! ! ! ! ! ! ! ! ! !19
Radiocarbon and Soil Carbon DynamicsSusan Trumbore ! ! ! ! ! ! ! ! ! ! ! ! ! ! ! ! ! ! ! ! ! ! ! ! ! ! ! ! ! ! ! ! ! ! ! ! ! ! ! ! ! ! ! ! ! ! ! ! ! ! ! ! ! ! ! ! ! ! ! ! ! ! ! ! ! ! ! ! ! ! ! ! ! ! ! ! ! ! !47
Evolution of the Genus HomoIan Tattersall and Jeffrey H. Schwartz ! ! ! ! ! ! ! ! ! ! ! ! ! ! ! ! ! ! ! ! ! ! ! ! ! ! ! ! ! ! ! ! ! ! ! ! ! ! ! ! ! ! ! ! ! ! ! ! ! ! ! ! ! !67
Feedbacks, Timescales, and Seeing RedGerard Roe ! ! ! ! ! ! ! ! ! ! ! ! ! ! ! ! ! ! ! ! ! ! ! ! ! ! ! ! ! ! ! ! ! ! ! ! ! ! ! ! ! ! ! ! ! ! ! ! ! ! ! ! ! ! ! ! ! ! ! ! ! ! ! ! ! ! ! ! ! ! ! ! ! ! ! ! ! ! ! ! ! ! ! ! !93
Atmospheric Lifetime of Fossil Fuel Carbon DioxideDavid Archer, Michael Eby, Victor Brovkin, Andy Ridgwell, Long Cao,Uwe Mikolajewicz, Ken Caldeira, Katsumi Matsumoto, Guy Munhoven,Alvaro Montenegro, and Kathy Tokos ! ! ! ! ! ! ! ! ! ! ! ! ! ! ! ! ! ! ! ! ! ! ! ! ! ! ! ! ! ! ! ! ! ! ! ! ! ! ! ! ! ! ! ! ! ! ! ! ! ! ! ! ! ! 117
Evolution of Life Cycles in Early AmphibiansRainer R. Schoch ! ! ! ! ! ! ! ! ! ! ! ! ! ! ! ! ! ! ! ! ! ! ! ! ! ! ! ! ! ! ! ! ! ! ! ! ! ! ! ! ! ! ! ! ! ! ! ! ! ! ! ! ! ! ! ! ! ! ! ! ! ! ! ! ! ! ! ! ! ! ! ! ! ! ! ! ! 135
The Fin to Limb Transition: New Data, Interpretations, andHypotheses from Paleontology and Developmental BiologyJennifer A. Clack ! ! ! ! ! ! ! ! ! ! ! ! ! ! ! ! ! ! ! ! ! ! ! ! ! ! ! ! ! ! ! ! ! ! ! ! ! ! ! ! ! ! ! ! ! ! ! ! ! ! ! ! ! ! ! ! ! ! ! ! ! ! ! ! ! ! ! ! ! ! ! ! ! ! ! ! 163
Mammalian Response to Cenozoic Climatic ChangeJessica L. Blois and Elizabeth A. Hadly ! ! ! ! ! ! ! ! ! ! ! ! ! ! ! ! ! ! ! ! ! ! ! ! ! ! ! ! ! ! ! ! ! ! ! ! ! ! ! ! ! ! ! ! ! ! ! ! ! ! ! ! 181
Forensic Seismology and the Comprehensive Nuclear-Test-Ban TreatyDavid Bowers and Neil D. Selby ! ! ! ! ! ! ! ! ! ! ! ! ! ! ! ! ! ! ! ! ! ! ! ! ! ! ! ! ! ! ! ! ! ! ! ! ! ! ! ! ! ! ! ! ! ! ! ! ! ! ! ! ! ! ! ! ! ! ! 209
How the Continents Deform: The Evidence from Tectonic GeodesyWayne Thatcher ! ! ! ! ! ! ! ! ! ! ! ! ! ! ! ! ! ! ! ! ! ! ! ! ! ! ! ! ! ! ! ! ! ! ! ! ! ! ! ! ! ! ! ! ! ! ! ! ! ! ! ! ! ! ! ! ! ! ! ! ! ! ! ! ! ! ! ! ! ! ! ! ! ! ! ! ! 237
The Tropics in PaleoclimateJohn C.H. Chiang ! ! ! ! ! ! ! ! ! ! ! ! ! ! ! ! ! ! ! ! ! ! ! ! ! ! ! ! ! ! ! ! ! ! ! ! ! ! ! ! ! ! ! ! ! ! ! ! ! ! ! ! ! ! ! ! ! ! ! ! ! ! ! ! ! ! ! ! ! ! ! ! ! ! ! 263
vii
Ann
u. R
ev. E
arth
Pla
net.
Sci.
2009
.37:
209-
236.
Dow
nloa
ded
from
arjo
urna
ls.an
nual
revi
ews.o
rgby
Uni
vers
ity o
f Brit
ish C
olum
bia
Libr
ary
on 1
2/29
/09.
For
per
sona
l use
onl
y.

AR374-FM ARI 27 March 2009 18:4
Rivers, Lakes, Dunes, and Rain: Crustal Processes in Titan’sMethane CycleJonathan I. Lunine and Ralph D. Lorenz ! ! ! ! ! ! ! ! ! ! ! ! ! ! ! ! ! ! ! ! ! ! ! ! ! ! ! ! ! ! ! ! ! ! ! ! ! ! ! ! ! ! ! ! ! ! ! ! ! 299
Planetary Migration: What Does it Mean for Planet Formation?John E. Chambers ! ! ! ! ! ! ! ! ! ! ! ! ! ! ! ! ! ! ! ! ! ! ! ! ! ! ! ! ! ! ! ! ! ! ! ! ! ! ! ! ! ! ! ! ! ! ! ! ! ! ! ! ! ! ! ! ! ! ! ! ! ! ! ! ! ! ! ! ! ! ! ! ! ! ! 321
The Tectonic Framework of the Sumatran Subduction ZoneRobert McCaffrey ! ! ! ! ! ! ! ! ! ! ! ! ! ! ! ! ! ! ! ! ! ! ! ! ! ! ! ! ! ! ! ! ! ! ! ! ! ! ! ! ! ! ! ! ! ! ! ! ! ! ! ! ! ! ! ! ! ! ! ! ! ! ! ! ! ! ! ! ! ! ! ! ! ! ! ! 345
Microbial Transformations of Minerals and Metals: Recent Advancesin Geomicrobiology Derived from Synchrotron-Based X-RaySpectroscopy and X-Ray MicroscopyAlexis Templeton and Emily Knowles ! ! ! ! ! ! ! ! ! ! ! ! ! ! ! ! ! ! ! ! ! ! ! ! ! ! ! ! ! ! ! ! ! ! ! ! ! ! ! ! ! ! ! ! ! ! ! ! ! ! ! ! ! ! ! 367
The Channeled Scabland: A RetrospectiveVictor R. Baker ! ! ! ! ! ! ! ! ! ! ! ! ! ! ! ! ! ! ! ! ! ! ! ! ! ! ! ! ! ! ! ! ! ! ! ! ! ! ! ! ! ! ! ! ! ! ! ! ! ! ! ! ! ! ! ! ! ! ! ! ! ! ! ! ! ! ! ! ! ! ! ! ! ! ! ! ! ! 393
Growth and Evolution of AsteroidsErik Asphaug ! ! ! ! ! ! ! ! ! ! ! ! ! ! ! ! ! ! ! ! ! ! ! ! ! ! ! ! ! ! ! ! ! ! ! ! ! ! ! ! ! ! ! ! ! ! ! ! ! ! ! ! ! ! ! ! ! ! ! ! ! ! ! ! ! ! ! ! ! ! ! ! ! ! ! ! ! ! ! ! 413
Thermodynamics and Mass Transport in Multicomponent, MultiphaseH2O Systems of Planetary InterestXinli Lu and Susan W. Kieffer ! ! ! ! ! ! ! ! ! ! ! ! ! ! ! ! ! ! ! ! ! ! ! ! ! ! ! ! ! ! ! ! ! ! ! ! ! ! ! ! ! ! ! ! ! ! ! ! ! ! ! ! ! ! ! ! ! ! ! ! ! 449
The Hadean Crust: Evidence from >4 Ga ZirconsT. Mark Harrison ! ! ! ! ! ! ! ! ! ! ! ! ! ! ! ! ! ! ! ! ! ! ! ! ! ! ! ! ! ! ! ! ! ! ! ! ! ! ! ! ! ! ! ! ! ! ! ! ! ! ! ! ! ! ! ! ! ! ! ! ! ! ! ! ! ! ! ! ! ! ! ! ! ! ! 479
Tracking Euxinia in the Ancient Ocean: A Multiproxy Perspectiveand Proterozoic Case StudyTimothy W. Lyons, Ariel D. Anbar, Silke Severmann, Clint Scott,and Benjamin C. Gill ! ! ! ! ! ! ! ! ! ! ! ! ! ! ! ! ! ! ! ! ! ! ! ! ! ! ! ! ! ! ! ! ! ! ! ! ! ! ! ! ! ! ! ! ! ! ! ! ! ! ! ! ! ! ! ! ! ! ! ! ! ! ! ! ! ! ! ! ! ! ! 507
The Polar Deposits of MarsShane Byrne ! ! ! ! ! ! ! ! ! ! ! ! ! ! ! ! ! ! ! ! ! ! ! ! ! ! ! ! ! ! ! ! ! ! ! ! ! ! ! ! ! ! ! ! ! ! ! ! ! ! ! ! ! ! ! ! ! ! ! ! ! ! ! ! ! ! ! ! ! ! ! ! ! ! ! ! ! ! ! ! ! 535
Shearing Melt Out of the Earth: An Experimentalist’s Perspective onthe Influence of Deformation on Melt ExtractionDavid L. Kohlstedt and Benjamin K. Holtzman ! ! ! ! ! ! ! ! ! ! ! ! ! ! ! ! ! ! ! ! ! ! ! ! ! ! ! ! ! ! ! ! ! ! ! ! ! ! ! ! ! ! 561
Indexes
Cumulative Index of Contributing Authors, Volumes 27–37 ! ! ! ! ! ! ! ! ! ! ! ! ! ! ! ! ! ! ! ! ! ! ! ! ! ! ! 595
Cumulative Index of Chapter Titles, Volumes 27–37 ! ! ! ! ! ! ! ! ! ! ! ! ! ! ! ! ! ! ! ! ! ! ! ! ! ! ! ! ! ! ! ! ! ! ! ! 599
Errata
An online log of corrections to Annual Review of Earth and Planetary Sciences articlesmay be found at http://earth.annualreviews.org
viii Contents
Ann
u. R
ev. E
arth
Pla
net.
Sci.
2009
.37:
209-
236.
Dow
nloa
ded
from
arjo
urna
ls.an
nual
revi
ews.o
rgby
Uni
vers
ity o
f Brit
ish C
olum
bia
Libr
ary
on 1
2/29
/09.
For
per
sona
l use
onl
y.