Embed Size (px)
Citation preview

Foreign Direct Investments Distribution in the Russian Federation: Do Spatial Effects Matter?
Tullio Buccellato1 and Francesco Santangelo2
Abstract
In this paper we explore the hypothesis of spatial effects in the distribution of Foreign Direct Investments (FDI) across Russian regions. We make use of a model, which describes FDI inflows as resulting from an agglomeration effect (the level of FDI in a given region depends positively on the level of FDI received by the regions in its neighbourhood) and remoteness effect (the distance of each Russian regions from the most important outflows countries). Considering a panel of 68 Russian regions over the period 2000-2004 we find that the two effects play a significant role in determining FDI inflows towards Russia. The two effects are also robust to the inclusion of other widely used explanatory variables impacting the level of FDI towards countries or regions (e.g. surrounding market potential, infrastructures, investment climate).
1 University of Rome “Tor Vergata” e-mail: [email protected]. 2 University of Rome “Sapienza”; e-mail: [email protected].
1
Discussion Paper 94
Centre for Financial and Management Studies

1. Introduction
Global flows of foreign direct investment (FDI) have grown rapidly ever since the late 1980s. However, the cross-country distribution of FDI has remained highly skewed, with mature economies which are both, largest recipient and source countries. Even more striking is the disparity within the group of emerging economies, with China standing out as the largest recipient3. It has been widely recognised that Russia attracts a low level of inward FDI if compared with other former communist countries. With respect to other emerging markets Russia has attracted a modest amount of FDI, which in 2004 accounted for 16.9% of the GDP, against the 25% of Poland and Brazil. FDI attractiveness of Russian Federation seems quite low also with regards to the country’s potential. Russia enjoys indeed a huge domestic market, an impressive natural resources endowments and the presence of a skilled and relatively cheap labour force. However a broadly recognized refrain for foreign investors is the institutional environment, which has been characterized by the fragility of property rights, the arbitrariness of fiscal policy and the unpredictability of the trade policies. There are at least three arguments for which Russia should seek to increase its share of inward FDI. The first is based on the standard arguments applying to transition economies, for which inward investment boosts employment, output and lead to innovation in production and management processes. Second, improved inward investment is an indicator of openness and integration in the international economic environment, which have been both proved to be beneficial to economic growth. Third, Russia is in constant need for renewing its infrastructure to improve the efficiency of the obsolete extractive industry inherited from the Soviet era. In general, the importance of foreign fresh capital for Russia has been largely recognized both in political recommendations by international institutions and in the economic literature as witnessed by a number of research papers and books published on this subject4. FDI distribution in Russia is particularly skewed. As pointed out by Broadman and Recanatini (2001) during the period between 1995 and 1999, 62% of the foreign investments concentrated in four regions: Moscow (44.2%), Moscow Oblast (9.8%), St. Petersburg (5.3%) and Leningrad Oblast (2.7%). However, these four regions account for 22% of the Russian national product and for 13% of Russia’s population. With the exception of Sakhalin Oblast (7.4%) and Krasnodar Krai (4%), the remaining regions account for no more than 2.5% of foreign investments. Also in the following years the FDI distribution has remained persistently skewed across Russian regions. The top five regions have received 69,7% and 69,5% of the whole cross-border investment toward Russian Federation in 2000 and 2001 respectively; in 2002 the top five share has continued to increase (76,5%) until reaching more than 80% in 2003 and 2004. As for the previous period, Moscow remains the major recipient, but Sakhalin Oblast increased
3 For a comparison between Chinese and Russian path of economic development and their consequences, also in terms of FDI, see Buck et al., 2000. 4 See Iwasaki & Suganuma (2005), pp. 169 for some references.
2
Foreign Direct Investments Distribution in the Russian Federation: Do Spatial Effects Matter?
SOAS | University of London

considerably its relative attractiveness and in 2004 and 2005 it received the largest amount of foreign investments (see Table 2). Russia does not seem to show a clear spatial FDI distribution for which costal and border regions tend to exhibit higher flows of FDI, especially when compared with China, India and other CEE countries. Russia is a natural resource based economy and this tends to induce spatial effects in the regional patterns of growth (see Buccellato 2007) and in the distribution of wealth between regions (Buccellato and Mickiewicz 2008). We argue that the pervasive role of hydrocarbons in the Russian economy could represent also a major determinant in the spatial allocation of foreign investments across Russian regions. Previous studies on the FDI distribution in the Russian Federation have provided mixed evidence concerning the possible presence of spatial effects. Iwasagi and Suganuma (2005), for example, have advocated the absence of any spatial pattern. Opposite results have been found by others, who have established both evidence for gravity effects and for agglomeration effects (Ledyayeva and Linden, 2006b; Ledyayeva, 2007). In this paper we investigate whether and to what extent spatial effects matter for FDI distribution in Russian Federation. In doing so we also control for the distance from the source countries, which would otherwise bias the analysis of the within country spatial effects. Building up on previous studies which considered spatial and gravity effects separately, we build up a model which allows controls for the two effects simultaneously. The remaining of the paper is organized as follows. In the next section we provide an overview of the spatial features of FDI location and refer to some empirical studies based on different geographic areas. In section 3 we summarize major findings of previous empirical studies on FDI distribution in the Russian Federation. Section 4 presents our model to control simultaneously for the two kinds of spatial effects examined, i.e. the agglomeration effect and distance from the source countries. Section 5 discusses other control variables and section 6 describes the data. Section 7 reports results and section 8 concludes.
2. Spatial interdependence in foreign direct investments
From both, empirical and theoretical economic literature, it is possible to advocate that spatial interdependence is likely to play a role in FDI location. In order to point out the influence and consequences of spatial interdependence in FDI distribution, we provide a brief review of theoretical contributions on the nature and motivation of FDI and then we illustrate some findings from previous empirical studies. The development of a formal theory concerning cross-border investment decisions stems from Markusen (1984) and Helpman (1984). Markusen (1984) provides a model where FDI is designed to enter local markets in order to substitute for export flows: FDI driven by such a motivation is denominated “horizontal” FDI. Helpman (1984) develops a general-equilibrium model where FDI is due to the fragmentation of production across different hosts, which is motivated by taking advantage of differences in production costs: these are known as “vertical” FDI. More recently, it has been relaxed the assumption of two-country model with the inclusion of a third market. This leads to two further motivations for multinational
3
Discussion Paper 94
Centre for Financial and Management Studies

enterprises (MNEs) activities other than the above mentioned – horizontal and vertical. First, the “export platform” frame in which FDI takes place in order to realize a production which is largely sold in third markets. This implies that the recipient country is used as platform to serve other markets through exports (Yeaple, 2003; Ekholm et al., 2003; Bergstrand and Egger, 2004). Second, the “vertical-complex” frame in which production is fragmented across multiple locations in order to exploit the comparative advantages of various regions. Blonigen et al. (2007), proposed two spatial effects which can affect FDI location in a given area. The first is related to the fact that the presence of foreign firms in a region can be affected by FDI inflows in its neighbourhood. The second source of spatial interdependence is represented by the so called “surrounding market potential” and it is associated to the market size of other geographically-proximate regions. The authors also discuss how the economic theory on FDI can be adapted to allow for the presence of spatial effects. Theory suggests that according to the “pure horizontal” FDI hypothesis, there would be no spatial relationship between FDI into the host market and FDI into the surrounding regions, because foreign investors are expected to take independent decisions about a given regional market. Also surrounding market potential is expected to have no influence since horizontal FDI are motivated by access to a certain region, without taking into account the opportunity to export in close regions (indeed, in this case it would occur export-platform FDI). Vertical FDI would predict a negative coefficient for the spatially lagged FDI because the FDI going into a certain region is at the expense of that going into surrounding regions. Market potential is expected not to be significant because the output of foreign affiliates would be exported in the home country. The export-platform hypothesis would imply a negative impact on the amount of FDI inflows towards the neighbours of the regions where foreign investors locate their production activity. In other words, the destination market represents a substitute for investment towards alternative destination markets. Instead it would predict a positive coefficient for surrounding market potential as the presence of large and relatively close regional markets, should make more profitable to invest in a region. Finally, complex vertical FDI would predict positive coefficients for both spatial effects. When a multinational firm splits the production process in different regions, the presence of foreign investors in proximate regions is a clear incentive in undertaking an investment activity. In other word in this frame it enters an agglomeration effect by which the accessibility of supplier networks in the neighbouring regions is likely to increase FDI in a given location. However, the four mentioned effects are virtually impossible to be disentangled. This implies that mixed evidence in support of one motivation over the others indicates just a relative prevalence of one over the others. Furthermore, some effects that theoretically appear to be working in opposite directions, in practice tend to be found together reinforcing each others. For example in the case of vertical fragmentation the surrounding market potential per se should not matter. In actual facts industrial production and market
4
Foreign Direct Investments Distribution in the Russian Federation: Do Spatial Effects Matter?
SOAS | University of London

size are often highly correlated and an improved industrial production level in neighbouring regions would constitute also an incentive for vertical fragmentation. Empirical studies relating to FDI, which relax the assumption of randomly distributed boundaries have recently experienced a considerable increase. The availability of more precise and timely regional dataset from emerging economies has represented one of the most important factors contributing to the development of this research stream. In this section we report some of the latest contributions briefly summarizing their main results. Coughlin and Segev (2000) use a spatial error model to analyze US cross-border investments across 29 Chinese provinces. They find that an increase of FDI flows towards one province has positive effects on FDI in nearby provinces (i.e. a positive spatial-lag coefficient in the error term). Hong et al, (2007) analyse foreign investments for 29 Chinese provinces over the period of 1990-2002. They use a spatial dynamic panel data model to explain the FDI location, including a spatial lag dependent variable and a market potential variable. They find evidence of spatial interdependence as expressed by the fact that recipient province FDI responds positively to FDI received by neighbouring provinces but negatively to GDP of these neighbours. Baltagi et al. (2004) analyse US outbound FDI for seven manufacturing industries. They include spatially weighted explanatory variables making use of a spatial error model. Their results find substantial evidence of spatial interactions. Blonigen et al. (2007) include a spatial lag dependent variable and spatially weighted market potential variable into a gravity paradigm. Using a panel of annual data on US outbound FDI to the top forty recipient countries over the period 1983-1998, they find that the estimated relationships of traditional determinants of FDI are robust to the inclusion of spatial effects. Only very recently spatial econometric approaches have been used with reference to the Russian Federation. Buccellato (2007) conducts a study on spatial lag and spatial error models to study the process of absolute and conditional convergence across 77 Russian regions. FDI in this case are considered among the regressors and are found to play a significant and positive role in enhancing divergence in GDP per capita in the regional panel considered.
3. Previous studies on FDI distribution across Russian regions
In order to provide a solid background to our empirical analysis and to highlight some of the most important determinants of foreign investment flows towards Russia, we devote this section to review some relevant literature concerning FDI in the Russian Federation. Ahrend (2000) conducted a questionnaire survey based on 50 European companies that have been engaging activities in various Russian regions in order to find those factors that European investors considered as major determinants of investment decision. According to this investigation there are four major factors affecting the distribution of FDI across Russian regions: the presence of a large market; the existence of previous investments made by other entrepreneurs; the presence of a partner company necessary for business development; the endowment of row materials or other production factors in the target region.
5
Discussion Paper 94
Centre for Financial and Management Studies

Bradshaw (2002) groups Russian regions in five broad categories with respect to their attractiveness for foreign investors: first, the Moscow region (Moscow region and the city of Moscow) as the control centre for the national economy; second, regions that are relevant as industrial and financial centres (e.g. the city of St. Petersburg and the Leningrad and Samara regions); third, regions that have major port or gateway function such as the city of St. Petersburg; fourth, regions with substantial mineral wealth (as Sakhalin region); and fifth, regions which have benefited from substitutes for the previous imports due to dramatic depreciation of the rouble after the August 1998 financial crisis. Brock (1998) has produced econometric evidence for some determinants of the FDI distribution across Russian regions. In his analysis he considered eight variables - market size, crime rate, work force education, private sector’s development, level of local taxation, infrastructures, property rights protection and risk ranking. He found that the two leading factors which have been proved to be significant in attracting FDI are the market size and the crime rate5. Manaenkov (2000) has analysed the determinants of the choice of the region and industry by a foreign entrant using a firm-level panel-data approach. His research suggests that economic reform progress is an important explanatory variable of FDI inflow into the Russian economy. Improved level of institutions efficiency represents a precondition for the implementation of economic reforms, which in turn embodies a key aspect to boost the FDI. Another interesting finding is that foreign investors are attracted by more protected and monopolized industries which are more difficult to be served by export. Finally, he also found that gravity variables does not succeed in describing FDI pattern in the Russian Federation, once that Moscow is excluded. Broadman and Recanatini (2001) insist again in the weight of the political and institutional environment in explaining FDI inflow differentials across Russian regions. Using data for the period 1995-1999, the econometric analysis is based on two models, which consider alternatively the FDI as stock and as flow. Four variables are indicated to play a significant role – GRP, kilometres of paved Road, domestic Investment and investment Rating interacted with Domestic Investment – and to account for 80% of regional differentials in cumulative FDI. For what concerns the flows, it is found that a structural break in foreign investors attitudes occurred in correspondence of the August 1998 financial crisis6. Iwasaki & Suganuma (2005) assume the absence of any geographical pattern in the Russian FDI regional distribution. Consequently they conduct an analysis on eight variables not allowing for the presence of spatial interactions among spatial observations. The survey includes variables such as climate, natural resources, market size, industrial production, urban population. The empirical part also includes dummy variables to categorize regions according to political measures implemented to favour FDI inflows
5 He has also found that education play a role in attracting FDI, even if with less relevance if compared with market size and crime rate (p. 354). 6 Also Iwasaki and Suganuma (2005) and Ledyaeva (2007) investigated about the presence of a structural break in foreign investors’ behaviour after 1998 crisis. Iwasaki and Suganuma (2005) found no evidence of a structural break meanwhile Ledyaeva (2007) found some evidence of a structural break, confirming the earlier findings of Broadman and Recanatini (2001). Anyway we will not deal with this issue in our work.
6
Foreign Direct Investments Distribution in the Russian Federation: Do Spatial Effects Matter?
SOAS | University of London

(regional foreign investment law, taking part to a free economic zone or applying the product-sharing law7). Using data for 69 regions from 1996 to 20038, they obtain two main results. First, it is established the key role of natural resources endowments, market size and socio-economic development9 (also the climate, less relevant but still significant). Second, using the three above mentioned dummy variables, they show that foreign investment law and free economic zones have some positive effects on foreign investment, but the influence of the latter tends to decrease over time. Product-sharing law is not found significant10. Ledyaeva and Linden (2006) test whether a gravity model can explain FDI distribution across Russian regions. They make use of a gravity model based on the usual variables: market size of both, recipient region and source country, and the distance between source country and recipient region. To the core gravity model they also add some control variables: a proxy for agglomeration11, one for skilled labour, endowments of natural resources and some dummy variables for Moscow and Russian speaker countries. The main finding of the paper is that the gravitational paradigm seems to adapt well to FDI distribution across Russian regions. Ledyaeva (2007) analyses the determinants of FDI since 1995 to 2000. She has tested the relevance of two spatial effects introduced by Blonigen et al. (2007). First, a spatial lag dependent variable characterizing the contemporaneous correlation between FDI of one region and FDI of proximate regions. Second, a market potential variable, which characterizes the contemporaneous correlation between a FDI and the market sizes of neighbours. In order to evaluate their relevance, she run a first regression without spatial effects and a second with the inclusion of both spatial effects. As explanatory variables she also consideres the market size, infrastructures (number of ports in the region), the level of industrialization (a dummy variable for those regions that includes at least one of Russia’s 13 cities that exceed 1 million habitants), legislative risk (rating from magazine “Ekspert”), political risk (rating from “Ekspert”), natural resources and a dummy variable for Sakhalin. She found that the most important determinants in FDI are market size, level of industrialization and Sakhalin region’s production sharing agreements in the oil industry. Comparing the results with and without the inclusion of spatial effects, she found that the inclusion of spatial effects, even when significant, does not affect general results12. To sum up, previous empirical studies found that the most important determinants in explaining FDI allocation in Russian regions are market size, infrastructures, natural resources and various indicator of socio-economic development and institutions’ quality; Table 1 summarizes main findings of these studies. Little evidence was found for spatial effects.
7 See Iwasaki & Suganuma (2005, p. 162) for the regions which undertook these measures. 8 They did two estimations: panel and cross-section (for each year); anyway both lead to same results. 9 That is represented, in their work, by industrialization and urbanization. 10 The effective sign (negative) is not the expected one and they commented that it shows that “PS law was a desperate measure introduced under pressure to attract foreign capital to the notably underdeveloped regions of Russia” (p. 164). 11 The proxy for agglomeration is the ratio between gross regional product and the square of each region’s territory. 12 She did a comparison between different period in order to test whether or not financial crisis produced some changes in foreign investors’ strategies: see Ledyaeva (2007), p. 32-33.
7
Discussion Paper 94
Centre for Financial and Management Studies

4. The core specification with spatial effects
Main purpose of our empirical analysis is to highlight the impact of spatial effects on the distribution of FDI across Russian regions. We assign to distance a twofold importance. We indeed consider both, distances across Russian regions and distances of each region with respect to the main source countries investing in the Russian Federation. The contemporaneous use of these two variables represents a necessary requirement in order to precisely assess the net impact of each of the two variables themselves. In other words, our aim is to disentangle possible effects of agglomeration in FDI between Russian regions from effects of remoteness induced by prohibitive distance from the main foreign investors. We end up by modelling the level of FDI going into the recipient region i at time t as resulting from a combined effect of agglomeration, inverse distance from the most relevant foreign investors and other control variables which have been found to play an important role in attracting foreign investments. We consider the following Cobb Douglas function to provide a synthetic baseline framework:
)1()_()tan()( ,,,,,γβα
titjititi FactorsOtherceDisionAgglomeratFDI = Equation (1) can be easily rewritten in a logarithmic form, which includes an error term and a constant allowing for the estimation of the parameters through regression analysis,
, , , , , ,log_ (log_ ) (log_ ) (log_ _ ) (2)i t i t i j t i t i tFDI k Ag Dis Other Facα β γ ε= + + + + The degree of agglomeration is well captured by the inclusion of a spatial lag of FDI. If agglomeration takes place, then the level of FDI towards a given recipient region should be positively affected by the amount of FDI going towards its closer neighbours. For what concerns the distance from the foreign investors, we make use of the inverse of the distance between any given recipient regions and the principal investor countries multiplied by the ratio of FDI originated by a given country to the total amount of FDI towards the Russian Federation. This particular weighting system is introduced to have a manageable dimension of the matrices and requires an assumption of a priori homogeneous distribution of FDI across Russian regions. Among the Other Factors we include some specific regional characteristics that have been found significant in the economic literature. The inclusion of such variables is crucial to our extent in order to show that the effect of agglomeration does not appear significant for the omission of other variables which might induce an artificial spatial autocorrelation in FDI across regions. The other factors can be categorized in three main blocks. First, we include the group of variables classified as important in characterizing the host regions; second, we include a proxy for the surrounding market effect; third and last we add some variables which mainly refer to the Russian context. A detailed discussion of all these variables is postponed to next section. We can now rewrite the model as follows,
,, 1 , 2 , ,log_ log( * ) log( * ) (log_ _ ) (3)j t
i t i t i t i tt
FDIFDI k W FDI W Other Fac
FDIα β γ ε= + + + +
8
Foreign Direct Investments Distribution in the Russian Federation: Do Spatial Effects Matter?
SOAS | University of London

where is a 77x77 row standardized inverse distance spatial matrix with all zeroes on the diagonal. has also been defined the spatial lag weighting matrix and its associated coefficient
1W
1Wα captures the magnitude effect, the significance and sign of the
autoregressive term . is a 77x7 matrix containing the inverse of the distance between each of the 77 Russian regions and each of the 7 countries which over the period considered are constantly investing in the Russian Federation.
tiFDIW ,1 * 2W
Table 4 shows the distribution of FDI inflows by major contributors. The seven countries we considered for our analysis are, in alphabetical order: Cyprus13, France, Germany, Japan, Netherlands, United Kingdom and United States. The remaining term
)_(log_ ,tiFactorsOtherγ contains the other control variables briefly introduced above and systematically presented in the next section. γ represents the vector of associated coefficients to the other factors. The model as depicted in (3) cannot be estimated using a simple OLS. The spatial lag is indeed a stochastic regressor always correlated with ε through the spatial multiplier, which makes OLS an inconsistent estimator (see Anselin 1998). The best way to address this problem is to instrument the right-hand-side variables with their lagged values. This procedure has been first implemented through a GMM estimator by Arellano and Bond (1991), which has been recently readapted to allow for the presence of spatial effects (see Mutl 2006). Furthermore, we have to address the high persistency of FDI over time. The issue of possible persistence in the dependent variable that leads to a downwards bias in Arellano-Bond estimator has been highlighted in the economic literature (see for instance Hayakawa, 2007). Hence, we end up by choosing the System GMM methodology as introduced by Arellano and Bover (1995) and Blundell and Bond (1998; 2000). Making use of a wider set of instruments with respect to the Arellano and Bond (1991), this method has been proven to result in greater precision for the estimates of autoregressive parameters. It indeed combines the differenced estimator and the level estimator of Arellano-Bover (1995), for which corresponding biases work in opposite directions (downwards in the former, upwards in the latter) and the weights adjust the final estimation for the relative difference of the magnitudes of the biases. This is particularly important in the presence of persistent series, especially when the time span of the data is small as it is in our case. In addition, with System GMM, we also apply the robust standard errors, implying a further improvement in the quality of our diagnostics.
13 About Cyprus it has to be pointed out that many investments from Cyprus might be ascribed to Russian entrepreneurs which choose to establish abroad their headquarter.
9
Discussion Paper 94
Centre for Financial and Management Studies

5. The Control Variables
The control explanatory variables we consider in addition to our core model are part of the widely used set of variables impacting the level of FDI towards countries or regions and environmental variables which adapt well to the Russian context. In this section we present and briefly discuss these variables and provide all the relevant information to interpret our results. As usual in the literature, all the variables are considered in natural logarithms, therefore coefficients can be interpreted as partial elasticises.
Market size
The Market size of the recipient region would have a positive impact on FDI inflow because it meets the motivation of MNEs to look for potential new markets and to maximize the expected revenue of the investment. We use natural logarithm of the regional GDP expressed in million roubles as provided by Goskomstat to capture the market size effect.
Distance
Distance as to be indented as geographical distance between source and recipient country. It is included in order to represent the influence of various frictions that are likely to affect incoming FDI. From a theoretical viewpoint, the expected sign is negative14 as physical distance is assumed to increase several costs (transport, information, monitoring). Although new technologies (both in communication and transport) are changing distance’s relative importance, this variable is still a fundamental in empirical investigation on FDI determinants15.
Skilled labour
Skilled labour represents the quality of labour force and it can be important in attracting those foreign investors which search for competitive advantages or seek to establish activities that requires high level of human capital. Access to skilled labour is usually an important determinant of foreign investors’ strategies and we could expect that it is particularly valid for an economy as Russian Federation, which is characterized by a well educated and relatively cheap labour force. Empirical evidence suggests that in transition economies there is a positive relationship between education level of employees and FDI inflow (Carstensen and Toubal, 2004; Hong et al., 2007). In our analysis we use school release of qualified workers at the end of year, out of thousand people, as provided by Goskomstat.
14 We considerer the inverse for the distance and hence the expected sign would be positive. 15 As Grosse and Trevino (1996, p.153) point out: “ [A]lthough we theorized that geographic distance should be an impediment to foreign direct investment, it could be that the decreased cost of international telecommunications and travel argues for a diminished role for geographic distance as an explanatory factor of FDI. However, it is precisely these changes in the global competitive environment that justify the testing of this variable today.”
10
Foreign Direct Investments Distribution in the Russian Federation: Do Spatial Effects Matter?
SOAS | University of London

Infrastructures
Another important factor that has to be taken into account is the transport system as a proxy for infrastructures quality. Well-developed infrastructures, and particularly superior transportation options, can improve the effectiveness of MNEs operations in the host region and reduce transport costs. Presence of good infrastructures can be considered a determinant of FDI incoming since an adequate infrastructures system is a fundamental service for firms’ activities and because it is expected to reduce the distribution costs. Infrastructures quantity is generally assumed as representative of both, quality and quantity, of infrastructures system16. As a proxy for transports, we assume density of railways at the end of the year (kilometres of ways out of 10,000 square kilometres of territory) as provided by Goskomstat.
Market Potential
For surrounding market potential we assume regional GDP weighted by the spatial matrix constituted by inverse distances among regions constructed exactly in the same way as the one for the spatial lag of FDI. This variable represents a third source of spatial interdependence and its associated coefficient captures the extent to which the FDI in a given region is affected by the market sizes of close regions. This variable represents a more appropriate measure for market size than the sole Gross Regional Domestic Product (RGDP), since the latter takes into account only regional market considered as isolated, as opposed to the surrounding market potential, which takes into account also the market potential of proximate regions.
Natural resources
We also include natural resources, which are arguably a strong motivation for MNEs to invest in a recipient region and, moreover, relative abundance of natural resources strongly characterizes the economy and industrial production in certain Russian regions. To include natural resources in our empirical analysis, we use tonnes of oil and gas extracted in the region weighted by the regional population as provided by Goskomstat.
Openness
We then consider a measure of integration of each region in international economic context. Indeed, a number of theoretical and empirical studies have suggested that the degree of openness is positively associated with the level of foreign investments (Singh and Jun, 1995; Caves, 1996), suggesting that foreign investors prefer countries with a liberal trade regime. The degree of openness of Russian regions is included using as a proxy the regional exports at current prices in million US dollars as provided by Goskomstat.
16 Another difficulty in dealing with this variable is that infrastructures have a multidimensional nature because it is constituted by road, rail, port and airport. It has to be also pointed out that in present analysis we are including only transport infrastructures but not communication infrastructures (e.g. phone lines and broadband internet) and basic infrastructures (e.g. electricity and waterways).
11
Discussion Paper 94
Centre for Financial and Management Studies

Investment risk
Finally, we include a measure of investment risk. The underlying hypothesis is that quality of public institutions and investment climate are very likely to affect FDI incoming and, therefore, firms would be adverse to invest in relatively less stable economies. The quality of institutions is likely to be an important determinant of FDI activity, particularly for transition economies, for a variety of reasons: poor legal protection of assets increases the chance of expropriation of a firm’s assets; poor quality of institutions and/or corruption affects markets efficiency and increases costs of doing business; finally, poor institutions often lead to poor infrastructure (i.e., public goods). However, estimating investment risk’s influence in an empirical analysis presents some problems. First, inclusion of qualitative and multidimensional concept in a quantitative analysis is difficult and not always meaningful. Second, these measures often present little changes over time being, therefore, not so informative in a dynamic panel data setting. Third, these investment risk indexes are usually composite measures and in some cases their components are the same or similar to other regressors, thus generating multicollinearity (for instance, there might be an investment climate composite index including GDP, usually included in the analysis as market size measures). As previous studies on FDI across Russian regions, we make use of the index provided by the rating agency of “Ekspert” magazine. “Ekspert” is a well known Russian language magazine17 created in 1995; from 1996 it publishes a synthetic index that rank Russian regions investment attractiveness. “Ekspert” publishes two indeces: investment risk and investment potential. The first is composed by seven different risks: legislative, political, economic, financial, social, criminal and ecological; the latter is a weighted average of eight dimensions: labour, consumption, production, financial, institutional, innovative, infrastructural, natural resources. In our empirical analysis we consider the investment risk. Higher values of the index indicate worse investment environment.
6. The data
The Russian Federation is characterized by a very complex administrative organization. The first major administrative division includes seven federal districts (Central Federal District, North West Federal District, South Federal District, Volga Federal District, Ural Federal District, Siberian Federal District, Far Eastern Federal District). Each federal district is sub-divided into a series of entities that can take one of three different forms: oblast (region, province), kraj (territory) and republic. Some regions are further sub-divided into entities classified as autonomous regions (Avtonomnje Okrugi). The only reliable dataset for the Russian Federation is the one collected by Goskomstat providing data for 88 regions. This source however suffers from several limitations. Data are either completely missing or sporadically available for ten of the regions, which are, therefore, to be excluded from this analysis. Indeed, data for the Chechen Republic are entirely missing for all the variables included in the analysis18. FDI data are not available for ten autonomous regions – Nenetsia, Parma, Yamalo-Nenetskiy, Khanty-Mansiyskiy, Taymyr, Evenkia, Ust-Ord Buriatia, Aghin Buriatia and Koryakia – yet it must be pointed
17 For the data, see www.gateway2russia.com. 18 The reason in this case is straightforward, as this region has been land of war since 1994.
12
Foreign Direct Investments Distribution in the Russian Federation: Do Spatial Effects Matter?
SOAS | University of London

out that the majority of these are treated as parts of other Russian regions and, as a result, are included in the study, albeit at a more general level of aggregation. Not considering the breakdown of the regions in their autonomous parts represent undoubtedly a remarkable loss of information. However, from en econometric point of view it prevents to incur the problem of double counting which is implicit in the Goskomstat dataset. To avoid double counting, where both regional level data and sub-regional level data (like autonomous regions) are reported, we use aggregate obtained as the sum of the reported lower level units and the higher level regional units (for example, we use the sum of the figures for Chanty-Mansijskij Autounomous Okrug, Jamalo Nenetskij Autonomous Okrug and the proper Tyumen region, when referring to the latter). Overall we end up by including in our analysis a panel of 77 (the number of regions reduces to 70 when including the variable for transport) Russian regions for the period 2000-2004. A discussion a part deserves the data for FDI. International investments towards Russia are categorized into three different types: foreign direct investment, portfolio investment and others (these latter includes mainly bank deposit and trade credits). Generally speaking, FDI data suffer of general restrictions19. The most common problem of FDI data which is also present in the Russian Federation, is the bias deriving by the fact that most companies have their headquarters in capital cities, even if they operate elsewhere (with a consequent overstatement of FDI inflows in Moscow) and the level of aggregation of data. Indeed, firm level data are preferable to regional level data. As reported by Iwasaki & Suganuma (2005, p. 169-170), a legal definition of FDI in Russia can be found in Article II of the Law on Foreign Investment in the Russian Federation (9 July 1999), which states that “FDI is defined as (1) a 10% or higher investment by a foreign investor in share capital, (2) fixed capital investment in an affiliate of a foreign company established in Russia, (3) a lease by a foreign investor of an article classified in the list of external transaction goods between CIS states, which exceeds 100 million roubles”20. Table 2 summarizes the distribution of FDI across the top 25 recipients regions21, Table 4 the distribution of the most important source countries investing in Russia and Table 5 all the synthetic explanation of all the variables included in the different specifications of the model.
7. Results
In this section we illustrate our results obtained through the use of a system GMM estimator à la Blundell and Bond (1998). Table 6 displays results for 5 different specifications of our baseline model. We start presenting results for a simple spatial lag 19 For further discussion on FDI data restriction and pitfalls, see Stephan and Pfaffmann (2001). 20 This definition s to be in line with the general international definition, as it comes from IMF Balance of Payment Handbook. 21 Foreign capital flow in Russia are monitored by Goskomstat and by Central Bank of Russia. The two methods are different: Goskomstat relies on custom statistics and on questionnaires and its methods are sometimes changing; Central Bank uses its own system for monitoring capital inflow and adheres to international standard for FDI data collection as indicated by international Monetary Fund. Due to different computation methods, the two sources may differ but, as Broadman and Recanatini (2001) point out, generally they have the same magnitude. In the present work we rely on Goskomstat data.
13
Discussion Paper 94
Centre for Financial and Management Studies

estimation in which we include both the time and the space lag of the level of FDI. the two variables turn out to be very significant and confirm the hypothesis of a high persistency of FDI both over time and across space (column 1). The spatial dimension of the analysis is completed with the inclusion of our variable which accounts for the distance from the main source countries. This last appears also to be very significant and with the expected sign (the sign is positive because we are considering as weights the inverse of the distances). Remarkable is also the effect on the spatial lag, which remains significant and with same sign but rescaled in magnitude (column 2). This confirms the importance of considering the two spatial effects simultaneously. To our core specification we then add other control variables to account for important factors affecting FDI as highlighted in the literature and some control variables which have been found relevant for the Russian context. Column 3 displays results for the market size, skilled labour, transport and export (as a proxy for openness). The market size and the skilled labour are both not significant. Transport and export are instead found to be strongly significant with the expect positive signs. This would confirm the hypothesis of the export platform as a driving force to attract FDI. Such a result is confirmed by the fourth column of Table 6, where also the surrounding market potential is found very significant and with the expected sign. We conclude the analysis by including the production of hydrocarbons (Oil & Gas) and the indicator for investment risk (Column 5). Quite striking is the insignificant negative sign relating oil and gas, which are pervasive in all the aspects of the Russian economy. This could be explained by the high level of capture that the state has been implementing with respect to the natural resource sector, preventing the penetration of foreign investors. The investment risk is instead found to play significantly a negative role in reducing the attractiveness of Russian regions as a possible location for foreign investors. It is worth to remark that when adding the effect of the investment risk, the effect of the distance from the source countries becomes insignificant, suggesting that the more a region is remote from the principal international investor, the more it is exposed to a qualitatively and institutionally poor investment environment. Referring to the Bloningen framework as synthesized in Table 7, our econometric analysis suggests that in Russia the main driving force attracting foreign investor is a vertical specialisation with agglomeration (as expressed by the always positive significant coefficient associated to the special lag) coupled with a market potential in the surroundings of the recipient region. The lower part of Table 6 reports all the diagnostics which are necessary to assess the quality of the estimates through a dynamic GMM estimator. It should be first noticed that the number of observations decrease as we add new variables due to the missing values reported for some of them. Second, it is important to be noticed that all the tests provide satisfactory results for the estimates: autocorrelation of the first order is always present as it should be by construction; second order autocorrelation always absent; and the model is not over-identified.
14
Foreign Direct Investments Distribution in the Russian Federation: Do Spatial Effects Matter?
SOAS | University of London

8. Concluding remarks
In this paper we conducted an analysis of the determinants of FDI towards the Russian Federation. We started providing a background for our analysis highlighting main findings of both the economic literature concerning FDI and the literature pertaining to the FDI in the Russian context. We then introduced our methodology, which encompasses simultaneously two spatial effects, distances among the 77 Russian regions and distance of the recipient regions from to the source countries. Our results suggest that in the Russian context FDI are mainly driven by vertical specialization with agglomeration motivation. In addition, more remote (with respect to source countries) regions tend to be also less legally prepared to attract foreign investors. This raises a possible strand of research for further work in the field, in order to assess how the presence of foreign investors is beneficial to the institutional environment of Russian regions. Strikingly we have not found evidence of a positive correlation between FDI and the regional endowment of hydrocarbons and market size.
15
Discussion Paper 94
Centre for Financial and Management Studies

References
Ahrend R., (2000) “Foreign Direct Investment into Russia: Pain Without Gain?”, in Russian Economic Trends.
Aizenman J., (2003) “Volatility, employment and the patterns of FDI in emerging markets”, Journal of Development Economics, vol. 72, p. 585-601.
Anderson J., E., (1979) “A Theoretical Foundation for the Gravity Equation”, American Economic Review, vol. 69, p. 106-116.
Anselin L., (1988), “Spatial Econometrics: Methods and Models”, Dordrecht, Kluwer Academic Publishers.
Anselin L., Bera A., (1998) “Spatial Dependence in Linear Regression Models with an application to Spatial Econometrics” in A. Ullah and D.E.A. Giles (Eds.), “Handbook of Applied Economics Statistics”, Springer Verlag, Berlin.
Anselin L., Griffith D., (1988), “Do spatial effects really matter in regression analysis?”, Papers in Regional Science, vol. 65, p. 11-34.
Arellano M., Bond S., (1991) “Some tests of specification for panel data: MonteCarlo Evidence and an Application to employment equations”, Review of Economics Studies, vol. 58, p. 227-297.
Arellano M., Bover O., (1995) “Another Look at the Instrumental Variable Estimator of Error-Components Models”, Journal of Econometrics, vol. 68, p. 29-52.
Baltagi B. H., Egger P., Pfaffermayr M., (2005) “Estimating models of complex FDI: are there third-country effects?”, Centre for Policy Research Working Paper, no. 73.
Bergstrand J. H., (1985) “The Gravity Equation in International Trade: Come microeconomic Foundations and Empirical Evidence”, The Review of Economics and Statistics, vol. 67, p. 474-481.
Bevan B., Estrin S., Meyer K., (2004) “The Determinants of Foreign Direct Investment in Transition Economies,” International Business Review, vol. 13, p. 43-64.
Blonigen B. A., Davies R. B., Waddell G. R., Naughton H. T., (2007) “FDI in space: Spatial autoregressive relationships in foreign direct investment”, European Economic Review, vol. 51, p. 1303-1325.
Blundell R., Bond S., (1998) “Initial Conditions and Moment Restrictions in Dynamic Panel Data Models”, Journal of Econometrics, vol. 87, p. 115-143.
Blundell R., Bond S., (2000) “GMM estimation with persistent panel data: an application to production functions”, Econometric Reviews, vol. 19, p. 321-340.
Bradshaw M., (1995) “Regional Patterns of Foreign Investment in Russia”, Royal Institute of International Affairs, London.
Bradshaw M., (2002) “The Changing Geography of Foreign Investment in the Russian Federation”, Russian Economic Trends, vol. 11, pp. 33-41.
Bradshaw M., Swain A., (2003) “Foreign Investment and Regional Development”, in Bradshaw M., Stenning A., (eds.), “East Central Europe and the Former Soviet Union: The Post-Socialist States”, Harlow, Pearson.
16
Foreign Direct Investments Distribution in the Russian Federation: Do Spatial Effects Matter?
SOAS | University of London

Broadman H. G., Recanatini F., (2001) “Where Does All the Foreign Direct Investment Go In Russia?”, World Bank Policy Research Working Paper, World Bank, Washington DC.
Brock G., (1998) “Foreign Direct Investment in Russia’s Regions 1993-95. Why So Little and Where Has it Gone?” Economics of Transition, vol. 4, p. 349-360.
Buccellato T., (2007) “Convergence across Russian Regions: A Spatial Econometrics Approach,” DeFiMS Discussion Papers, no 70.
Buccellato T., Mickievicz T., (2008) “Oil and Gas: a Blessing for Few Hydrocarbons and Within-Region Inequality in Russia”, SSEES Working Paper Series, UCL.
Buck T., Filatochev I., Nolan P., Wright M., (2000) “Different paths to economic reform in Russia and China: causes and consequences”, Journal of World Business, vol. 35, p. 379-400.
Carstensen K., Toubal F., (2004) “Foreign direct investment in Central and Eastern European countries: a dynamic panel analysis,” Journal of Comparative Economics, vol. 32, p. 3-22.
Caves R. E., (1996) “Multinational Enterprise and Economic Analysis”, (second edition), Cambridge University Press, London.
Chakrabarti A., (2003) “A theory of the spatial distribution of foreign direct investment, International Review of Economics and Finance, vol. 12, p. 149-169.
Cheng L., Kwan Y., (2000) “What are the Determinants of the Location of Foreign Direct Investment? The Chinese Experience,” Journal of International Economics, vol. 51, p.379-400.
Coughlin C., Segev E., (1999) “Foreign direct investment in China: a spatial econometric study”, Working Papers 1999-2001, Federal Reserve Bank of St. Louis.
Deichmann J., (2001) “Distribution of Foreign Direct Investment among Transition Economies in Central and Eastern Europe”, Post-Soviet Geography and Economics, vol. 42, p. 142-152.
Disdier A., Mayer T., (2004) “How Different is Eastern Europe? Structure and Determinants of Location Choices by French Firms in Eastern and Western Europe”, Journal of Comparative Economics, vol. 32, p. 280-296.
Dunning J. H., (1980) “Toward an eclectic theory of international production: some empirical tests”, Journal of International Business Studies, vol. 11, p. 9-31.
Ekspert magazine: http://www.raexpprt.ru (various issues).
Fabry N., Zeghni S. (2002) “Foreign direct investment in Russia: how the investment climate matters”, Communist and Post-Communist Studies, vol. 35, p. 289-303.
Frenkel M., Funke K., Stadtmann G., (2004) “A panel analysis of bilateral FDI flows to emerging economies”, Economic systems, vol. 28, p 281-300.
Globerman S., Shapiro D., Tang Y., (2006) “Foreign direct investment in emerging and transition European countries,” International Finance Review, vol. 6, p. 431-459.
Hanson G., (2001) “Should Countries Promote Foreign Direct Investment?”, G-24 discussion Paper, no. 9, UNCTAD.
17
Discussion Paper 94
Centre for Financial and Management Studies

Hayakawa K., (2007) “Small Sample Bias Properties of the System GMM Estimator in Dynamic Panel Data Models”, Economic Letters, vol. 95, p. 32-38.
Head K, Ries J., Swenson D., (1995) “Agglomeration Benefits and Location Choice: Evidence from Japanese Manufacturing Investment in the United States,” Journal of International Economics, vol. 38, p 223-247.
Hines J., (1996) “Altered States: Taxes and the Location of Foreign Direct Investment in America”, American Economic Review, vol. 86, p. 1076-1094.
Hong E., Li T., Sun L., (2007) “Location of Foreign Direct Investment in China: A Spatial Dynamic Panel Data Analysis by Country of Origin”, DeFiMS Discussion Paper.
Hosseini H., (2005) “An economic theory of FDI: A behavioural economics and historical approach”, The Journal of Socio-Economics, vol. 34, p. 528-541.
Iwasaki I., (2004) “Foreign Direct Investment and Corporate reconstructing in Hungary”, Hitotsubashi Journal of Economics, vol. 45, p. 93-118.
Iwasaki I., Suganuma K., (2005) “Regional Distribution of Foreign Direct Investment in Russia”, Post-Communist Economies, vol. 17, p. 153-172.
Ledyaeva S., (2007) “Spatial econometric analysis of determinants and strategies of FDI in Russian regions in pre and post-1998 financial crisis periods”, BOFIT Discussion Papers, no. 15.
Ledyaeva S., Linden M., (2006a) “Foreign direct investment and economic growth: Empirical evidence from Russian regions”, BOFIT Discussion Papers, no. 17.
Ledyaeva S., Linden M., (2006b) “Testing for FDI gravity model in Russian regions”, Working paper no 32/06, Department of Business and Economics, University of Joensuu.
Levin M., Satarov G., (2000) “Corruption and institutions in Russia. European Journal of Political Economy, vol. 16, p. 113-132.
Linz S. J., (2001) “Restructuring with what success? A case study of Russian firms”, Comparative Economic Studies, vol. 43, p. 75–99.
Liuhto K, Pelto E., Lipponen K., (2004) “Where to Do Business in Russia? A Report on Russian Regions, Firms, Foreign Trade and Investment Flows”, Pan European Institute, http://www.tukkk.fi/pei/e/.
Markusen J. R., (1990) “First Mover Advantage, Blockaded Entry and the Economics of Uneven Development,” NBER Working Paper, no. 3284.
Markusen J. R., (1995) “The Boundaries of Multinational Enterprise and the Theory of International Trade”, Journal of Economic Perspectives, vol. 9.
Markusen J. R., Ekholm K., Forslid R., (2003) “Export-platform Foreign Direct Investment”, NBER Working Paper, no. 9517.
Markusen J. R., Maskus K. E., (2001) “General-equilibrium approaches to the multinational firm: a review of theory and evidence”, NBER Working Paper, no. 8334.
Markusen J. R., Venables A. J., (1998) “Multinational Firms and the New Trade Theory”, Journal of International Economics, vol. 46, p. 183-203.
Markusen J. R., Venables A. J., (1999). “Foreign direct investment as a catalyst for industrial Development”, European Economic Review, vol. 43, p. 335-356.
18
Foreign Direct Investments Distribution in the Russian Federation: Do Spatial Effects Matter?
SOAS | University of London

Markusen J. R., Venables A. J., (2000) “The theory of endowment, intra-industry and multinational trade”, Journal of International Economics, vol. 52, p. 209-234.
Moers L., (2000) “Determinants of enterprise restructuring in transition: description of a survey in Russian industry”, Post-Communist Economies, vol. 12, p. 307-335.
Mutl J., (2006) “Dynamic Panel Data Models With Spatially Correlated Disturbances”, Dissertation submitted to the Faculty of the Graduate School of the University of Maryland, College Park in partial fulfilment of the requirements for the degree of Doctor of Philosophy.
OECD, (2001) “The Investment Environment in the Russian Federation. Laws, Policies and Institutions”, OECD, Paris.
Ögütçü M., (2002) “Attracting Foreign Direct Investment for Russia’s Modernization: Battling Against the Odds”, OECD Russia Investment Roundtable, June 2002, Saint Petersburg.
Popov V., (2001) “Reform Strategies and Economic Performance of Russia’s Regions”, World Development, vol. 29, p. 865-886.
Singh H., Jun K. W., (1995) “Some New Evidence on Determinants of Foreign Direct Investment in Developing Countries”, The World Bank Policy Research Working Paper, World Bank, Washington DC.
Stephan M., Pfaffmann E., (2001) “Detecting the pitfalls of data on foreign direct investment: scope and limits of FDI data”, Management International Review, vol. 41, p. 189-218.
Valiullin K., (2007) “Russia’s Economic Space: Currencies, Oil, Investment”, Studies on Russian Economic Development, vol. 18, p. 141-152.
Vernon R., (1966) “International Investment and International Trade in the Product Cycle”, Quarterly Journal of Economics, vol. 80.
Yeaple S. R., (2003) “The complex integration strategies of multinationals and cross country dependencies in the structure of foreign direct investment”, Journal of International Economics, vol. 60, p. 293-314.
Yudaeva K., Kozlov K., Melentieva N., Ponomareva N., (2001) "Does Foreign Ownership Matter? Russian Experience”, New Economic School Working Paper, p. 1-42, Moscow.
Zsuzsa L., (2003) “Attraction versus Repulsion – Foreign Direct Investment in Russia”, Development and Finance, vol. 1, p. 51-62.
19
Discussion Paper 94
Centre for Financial and Management Studies

20
Table 1: Main findings of previous studies on FDI distribution in Russian regions
AUTHOR VARIABLE PROXY SIGN MAIN FINDINGS
Market size Gross Regional Product +
Crime Number of registered crimes per 100.000
inhabitants - Brock
(1998)
Education Employed work force with higher education +
Market size and crime are the most important determinants in the
regional distribution of foreign capital in Russia
Market size Gross Regional Product + Infrastructures development Paved roads +
Broadman and
Recanatini (2001) Investment
climate Investment rating x
Domestic investment +
Market size, infrastructure development, and policy framework
factors (interaction variable of domestic investment and investment rating) explain much of the variation
of FDI across Russian regions Market size PCA +
Climate Temperature in January +
Natural resources Rating by Ekspert magazine +
Degree of urbanisation
Ratio of urban population to total population +
Iwasagi and Suganuma
(2005)
Degree of industrialisation
Ratio of industrial production to GRP +
The most important factors for FDI location are natural resources, market
size and socio-economic development factors
(industrialisation and urbanisation). Climate and some of the favourable
regionally discriminatory FDI measures may display a certain
effect. Market size Gross Regional Product +
Distance Distance -
Agglomeration Ratio of GRP on region's surface (square km.) +
Ledyaeva and Linden
(2006) Natural resources Ratio of graduated in
total population +
The most important factors in explaining the number of foreign
firms in a particular Russian region are: gross products of host regions
and source countries, agglomeration effect and an abundance of skilled
labour. Market size PCA +
Presence of port No. of sea ports in a region +
Presence of big cities
Dummy variable of 13 biggest cities in Russia +
Natural resources Oil and gas index +
Ledyaeva (2007)
Political risk Rating by Ekspert magazine -
The most important determinants of FDI inflows into Russian regions are:
market size, presence of big cities, presence of sea ports, natural resources and political risk.
Foreign Direct Investments Distribution in the Russian Federation: Do Spatial Effects Matter?
SOAS | University of London

Table 2 (continue): Distribution of Foreign Direct Investments across the top 25 recipient regions (2000-2005, thousands US Dollars)
REGION FDI 2000 % REGION FDI 2001 % REGION FDI 2002 %
G. Moskva 1.472.807 33,25% G. Moskva 1.154.657 29,01% G. Moskva 1.508.680 37,70% Krasnodarskij kpaj 958.892 21,65% Krasnodarskij kpaj 686.311 17,24% Sachalinskaja Oblast 679.771 16,99% Sachalinskaja Oblast 246.131 5,56% Sachalinskaja Oblast 374.597 9,41% Moskovskaja Oblast 589.146 14,72% Leningradskaja Oblast 205.462 4,64% Moskovskaja Oblast 312.663 7,86% Tjumenskaja Oblast 168.733 4,22% Moskovskaja Oblast 204.938 4,63% Leningradskaja Oblast 238.193 5,98% Leningradskaja Oblast 115.352 2,88% Novosibirskaja Oblast 151.782 3,43% Samarskaja Oblast 117.611 2,96% Sverdlovskaja Oblast 99.719 2,49% Tjumenskaja Oblast 147.996 3,34% G. Sankt-Peterburg 114.081 2,87% Samarskaja Oblast 97.721 2,44% G. Sankt-Peterburg 146.681 3,31% Tjumenskaja Oblast 110.284 2,77% Apchangelskaja Oblast 96.452 2,41% Volgogradskaja Oblast 76.943 1,74% Sverdlovskaja Oblast 101.606 2,55% Krasnodarskij kpaj 90.003 2,25% Kalužskaja Oblast 74.241 1,68% Novosibirskaja Oblast 89.077 2,24% G. Sankt-Peterburg 84.082 2,10% Sverdlovskaja Oblast 73.550 1,66% Orenburgskaja Oblast 82.517 2,07% Rostovskaja Oblast 52.650 1,32% Samarskaja Oblast 59.630 1,35% Primorskij kraj 65.812 1,65% Kalužskaja Oblast 35.412 0,88% Respublika Tatarstan 53.655 1,21% Permskaja Oblast 60.916 1,53% Stavropolskij kpaj 33.933 0,85% Orenburgskaja Oblast 51.157 1,16% Respublika Karelija 34.311 0,86% Astrachanskaja Oblast 31.367 0,78% Rostovskaja Oblast 40.819 0,92% Respublica Komi 34.142 0,86% Penzenskaja Oblast 27.448 0,69% Orlovskaja Oblast 40.346 0,91% Volgogradskaja Oblast 31.853 0,80% Primorskij kraj 25.834 0,65% Permskaja Oblast 37.109 0,84% Kalužskaja Oblast 31.472 0,79% Kirovskaja Oblast 25.705 0,64% Primorskij kraj 30.488 0,69% Novgorodskaja Oblast 23.839 0,60% Vladimirskaja Oblast 18.854 0,47% Murmanskaja Oblast 29.250 0,66% Rostovskaja Oblast 20.292 0,51% Irkutskaja oblast 18.142 0,45% Nižegorodskaja Oblast 27.513 0,62% Nižegorodskaja Oblast 19.828 0,50% Tomskaia Oblast 16.279 0,41% Celjabinskaja Oblast 27.069 0,61% Tverskaja Oblast 19.398 0,49% Nižegorodskaja Oblast 15.101 0,38% Respublica Komi 23.226 0,52% Respublika Baškortostan 19.360 0,49% Kostromskaja Oblast 13.102 0,33% Stavropolskij kpaj 21.753 0,49% Cuvašskaja Respublika 18.169 0,46% Novgorodskaja Oblast 12.085 0,30% Tulskaja Oblast 20.467 0,46% Orlovskaja Oblast 17.972 0,45% Tulskaja Oblast 11.775 0,29% Novgorodskaja Oblast 19.699 0,44% Stavropolskij kpaj 17.577 0,44% Lipeckaja Oblast 10.494 0,26% OTHER REGIONS 187.396 4,23% OTHER REGIONS 183.462 4,61% OTHER REGIONS 124.160 3,10% TOTAL RUSSIAN FEDERATION 4.429.000 TOTAL RUSSIAN
FEDERATION 3.980.000 TOTAL RUSSIAN FEDERATION 4.002.000
21
Discussion Paper 94
Centre for Financial and Management Studies

Table 2 (end): Distribution of Foreign Direct Investments across the top 25 recipient regions (2000-2005, thousands US Dollars)
REGION FDI 2003 % REGION FDI 2004 % REGION FDI 2005 %
G. Moskva 2.482.963 36,62% Sachalinskaja Oblast 3.272.077 34,74% Sachalinskaja Oblast 3.800.751 Sachalinskaja Oblast 2.007.726 29,61% G. Moskva 1.857.211 19,72% Omskaia Oblast 3.081.021 Moskovskaja Oblast 706.769 10,42% Lipeckaja Oblast 1.077.771 11,44% G. Moskva 2.060.419 Tjumenskaja Oblast 178.340 2,63% Tjumenskaja Oblast 776.637 8,24% Moskovskaja Oblast 1.098.218 Krasnodarskij kpaj 143.911 2,12% Moskovskaja Oblast 762.905 8,10% Tjumenskaja Oblast 734.690 Leningradskaja Oblast 118.156 1,74% Samarskaja Oblast 159.864 1,70% Krasnodarskij kpaj 298.032 Apchangelskaja Oblast 105.895 1,56% Kostromskaja Oblast 144.136 1,53% G. Sankt-Peterburg 249.439 Novgorodskaja Oblast 101.085 1,49% Leningradskaja Oblast 132.575 1,41% Leningradskaja Oblast 222.290 Respublika Tatarstan 77.054 1,14% G. Sankt-Peterburg 111.909 1,19% Novgorodskaja Oblast 178.733 Sverdlovskaja Oblast 75.599 1,11% Celjabinskaja Oblast 104.259 1,11% Vladimirskaja Oblast 137.319 Samarskaja Oblast 72.077 1,06% Respublika Baškortostan 89.005 0,94% Kostromskaja Oblast 136.389 G. Sankt-Peterburg 70.283 1,04% Respublika Tatarstan 79.225 0,84% Apchangelskaja Oblast 99.533 Astrachanskaja Oblast 54.767 0,81% Novgorodskaja Oblast 71.154 0,76% Kemerovskaja Oblast 98.696 Omskaia Oblast 44.270 0,65% Krasnodarskij kpaj 62.692 0,67% Amurskaja Oblast 95.330 Primorskij kraj 42.406 0,63% Sverdlovskaja Oblast 62.579 0,66% Rostovskaja Oblast 60.185 Vladimirskaja Oblast 42.257 0,62% Primorskij kraj 60.814 0,65% Respublika Tatarstan 54.520 Nižegorodskaja Oblast 41.469 0,61% Citinskaja Oblast 50.574 0,54% Respublika Baškortostan 51.465 Kostromskaja Oblast 39.472 0,58% Vladimirskaja Oblast 50.058 0,53% Stavropolskij kpaj 48.039 Tomskaia Oblast 38.860 0,57% Nižegorodskaja Oblast 42.719 0,45% Tomskaia Oblast 47.068 Rostovskaja Oblast 30.801 0,45% Amurskaja Oblast 42.569 0,45% Nižegorodskaja Oblast 39.705 Irkutskaja oblast 26.122 0,39% Jaroslavskaja Oblast 34.322 0,36% Samarskaja Oblast 38.336 Respublika Sacha (Jakutija) 22.894 0,34% Kurskaja Oblast 26.828 0,28% Respublika Mordovija 34.124 Vologodskaja Oblast 18.860 0,28% Rostovskaja Oblast 26.206 0,28% Respublica Komi 32.444 Celjabinskaja Oblast 17.684 0,26% Kpasnojarskji kraj 25.682 0,27% Lipeckaja Oblast 27.655 Respublika Mordovija 15.788 0,23% Tulskaja Oblast 23.158 0,25% Tulskaja Oblast 25.599 OTHER REGIONS 205.492 3,03% OTHER REGIONS 273.071 2,90% OTHER REGIONS n.a. TOTAL RUSSIAN FEDERATION 6.781.000 TOTAL RUSSIAN
FEDERATION 9.420.000 TOTAL RUSSIAN FEDERATION n.a.
Source: Russian Federal Statistic Service – Goskomstat
22
Foreign Direct Investments Distribution in the Russian Federation: Do Spatial Effects Matter?
SOAS | University of London

Year 2000 Year 2003 Variable Obs Mean Std. Dev. Min Max Variable Obs Mean Std. Dev. Min Max FDI 77 57437.69 201420.2 0 1472807 FDI 77 87883.57 366861.8 0 2482963 Regional DGP 77 80398.35 163972.7 3638.7 1308901 Regional DGP 77 149590.5 309834.6 4852.3 2458483 Transport 70 160.9429 106.1669 9 583 Transport 70 160.5143 104.3386 9 574 Skilled Labour 77 9.818182 6.858297 0.6 33.8 Skilled Labour 77 9.238961 6.226728 0.9 29 Oil&Gas 75 1.609397 7.758213 0 66.00773 Oil&Gas 77 2.019075 9.99894 0 86.0696 Investment Risk 77 1.076221 0.254891 0.759 2.359 Investment Risk 77 1.076221 0.254891 0.759 2.359
Year 2001 Year 2004 Variable Obs Mean Std. Dev. Min Max Variable Obs Mean Std. Dev. Min Max FDI 77 51646.23 161207.5 0 1154657 FDI 77 122049.5 451444.8 0 3272077 Regional DGP 77 99992 198577.9 4624.4 1551179 Regional DGP 77 187979.1 377651 6022.2 2759101 Transport 70 160.6 105.4383 9 574 Transport 70 160.3429 104.3074 9 574 Skilled Labour 77 9.750649 6.739546 0.7 31.6 Skilled Labour 77 9.074026 6.009782 1 28.7 Oil&Gas 77 1.693115 8.259307 0 71.13288 Oil&Gas 77 2.188427 10.89377 0 93.71281 Investment Risk 77 1.076221 0.254891 0.759 2.359 Investment Risk 77 1.156117 0.245385 0.861 2.493
Year 2002 Year 2005 Variable Obs Mean Std. Dev. Min Max Variable Obs Mean Std. Dev. Min Max FDI 77 51904.29 197824 0 1508680 FDI 77 169523.5 607406.2 0 3800751 Regional DGP 77 121520.4 248480.6 3704.4 1975649 Regional DGP 0 --- --- --- --- Transport 70 159.8571 105.0668 9 575 Transport 70 160.1 103.6256 9 574 Skilled Labour 77 9.551948 6.456486 1 31.1 Skilled Labour 77 8.975325 5.904908 1 27.8 Oil&Gas 77 1.830219 9.023225 0 77.7263 Oil&Gas 77 2.213418 11.1555 0 96.36985 Investment Risk 77 1.076221 0.254891 0.759 2.359 Investment Risk 77 1.156117 0.245385 0.861 2.493
Table 3: Summary statistics for the variables included in the analysis by year
23
Source: Russian Federal Statistic Service – Goskomstat
Discussion Paper 94
Centre for Financial and Management Studies

Table 4: FDI Inflows in the Russian Federation by major contributors (1995, 200-2004)
COUNTRY FDI (MILLION US$)
% SHARE COUNTRY FDI
(MILLION US$) %
SHARE1995 2000
All 2020 0.73713 All 4429 0.84218USA 638 0.31584 USA 1241 0.2802
Switzerland 202 0.1 Cyprus 678 0.15308Germany 200 0.09901 Netherlands 610 0.13773France 106 0.05248 Germany 341 0.07699
Belgium 88 0.04356 Great Britain 262 0.05916Great Britain 77 0.03812 Sweden 257 0.05803
Austria 60 0.0297 Switzerland 115 0.02597Sweaden 52 0.02574 Japan 107 0.02416
Netherlands 48 0.02376 France 97 0.0219 Japan 18 0.00891 Austria 22 0.00497
2001 2002
All 3980 0.83518 All 4002 0.7961 USA 1084 0.27236 USA 603 0.15067
Netherlands 575 0.14447 Cyprus 571 0.14268Cyprus 512 0.12864 Netherlands 504 0.12594
Germany 495 0.12437 Germany 410 0.10245Great Britain 273 0.06859 Great Britain 327 0.08171
Japan 184 0.04623 Japan 260 0.06497British Virgin Islands 63 0.01583 Finland 151 0.03773
France 51 0.01281 British Virgin Islands 137 0.03423Switzerland 51 0.01281 Luxemburg 107 0.02674
Austria 36 0.00905 Switzerland 67 0.01674 France 49 0.01224
2003 2004
All 6781 0.78971 All 9420 0.86847Cyprus 977 0.14408 Netherlands 3479 0.36932Japan 828 0.12211 Cyprus 2688 0.28535
Netherlands 818 0.12063 Germany 428 0.04544Great Britain 747 0.11016 USA 419 0.04448
Germany 687 0.10131 British Virgin Islands 375 0.03981USA 632 0.0932 Switzerland 341 0.0362
Switzerland 292 0.04306 Great Britain 192 0.02038British Virgin Islands 278 0.041 France 157 0.01667
France 75 0.01106 Austria 62 0.00658Luxemburg 21 0.0031 Luxemburg 40 0.00425
Source: Russian Federal Statistic Service – Goskomstat
24
Foreign Direct Investments Distribution in the Russian Federation: Do Spatial Effects Matter?
SOAS | University of London
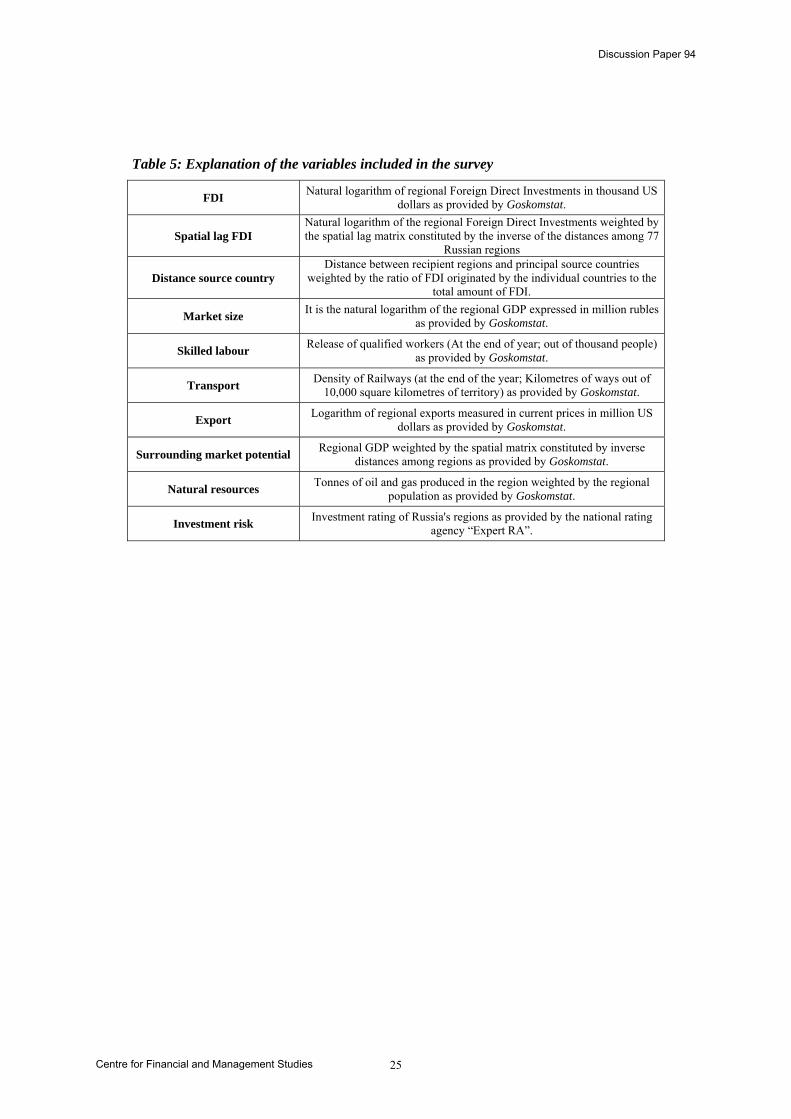
Table 5: Explanation of the variables included in the survey
FDI Natural logarithm of regional Foreign Direct Investments in thousand US dollars as provided by Goskomstat.
Spatial lag FDI Natural logarithm of the regional Foreign Direct Investments weighted by the spatial lag matrix constituted by the inverse of the distances among 77
Russian regions
Distance source country Distance between recipient regions and principal source countries
weighted by the ratio of FDI originated by the individual countries to the total amount of FDI.
Market size It is the natural logarithm of the regional GDP expressed in million rubles as provided by Goskomstat.
Skilled labour Release of qualified workers (At the end of year; out of thousand people) as provided by Goskomstat.
Transport Density of Railways (at the end of the year; Kilometres of ways out of 10,000 square kilometres of territory) as provided by Goskomstat.
Export Logarithm of regional exports measured in current prices in million US dollars as provided by Goskomstat.
Surrounding market potential Regional GDP weighted by the spatial matrix constituted by inverse distances among regions as provided by Goskomstat.
Natural resources Tonnes of oil and gas produced in the region weighted by the regional population as provided by Goskomstat.
Investment risk Investment rating of Russia's regions as provided by the national rating agency “Expert RA”.
25
Discussion Paper 94
Centre for Financial and Management Studies

Table 6: Determinants of FDI across 77 Russian regions over the period 2000-2004
(1) (2) (3) (4) (5) l_fdi l_fdi l_fdi l_fdi l_fdi
Lag Dependent Variable 0.113 0.119 0.082 0.072 -0.021 (0.020)*** (0.017)*** (0.021)*** (0.023)*** (0.019) Spatial Lag 3.03 2.784 2.288 2.147 1.391 (0.102)*** (0.089)*** (0.098)*** (0.152)*** (0.227)***Distance Source Countries 97.707 69.463 45.534 -7.666 (4.618)*** (20.095)*** (24.683)* (16.37) Market Size -0.168 -0.144 -0.345 (0.147) (0.152) (0.113)***Skilled Labour 0.269 0.27 0.181 (0.011)*** (0.010)*** (0.014)***Transport 0.004 0.005 0.006 (0.001)*** (0.002)*** (0.002)***log Export 0.174 0.157 0.304 (0.062)*** (0.067)** (0.071)***Surrounding Market 1.18 1.007 (0.377)*** (0.281)***Oil & Gas -0.021 (0.013) Investment Risk -5.669 (0.281)***Constant -26.218 -25.615 -21.841 -33.442 -13.324 (1.144)*** (1.029)*** (1.337)*** (3.028)*** (1.705)***Observations 340 340 315 315 313 Number of Years 5 5 5 5 5 Number of Instruments 313 323 315 315 313
Diagnostic Tests
Arellano-Bond test for AR(1) in first differences: z = -2.22 -2.22 -2.17 -2.17 -2.12
Pr > z = 0.027 0.026 0.03 0.03 0.034Arellano-Bond test for AR(2) in first differences:
z = 1.01 0.23 -1.56 -1.46 -1.12Pr > z = 0.311 0.818 0.119 0.143 0.263
Hansen test of over-identifying restrictions: chi2(22) 4.61 4.5 0 0 0
Prob > chi2 1 1 1 1 1Robust standard errors in parentheses: * significant at 10%; ** significant at 5%; *** significant at 1%
26
Foreign Direct Investments Distribution in the Russian Federation: Do Spatial Effects Matter?
SOAS | University of London

Table 7: Summary of hypothesized spatial lag coefficient and market potential effect for various forms of FDI
FDI MOTIVATION Sign of spatial lag Sign of market potential
Pure Horizontal 0 0
Export-platform - +
Pure Vertical - 0
Vertical Specialization with Agglomeration +*** +***
*** significant at a 1% level in our analysis
Source: Blonigen et al., 2007
27
Discussion Paper 94
Centre for Financial and Management Studies


![Foreign Investments in India[1]](https://img.pdfslide.us/doc/110x75/577cc39a1a28aba7119688a7/foreign-investments-in-india1.jpg)