Embed Size (px)
Citation preview

________ Z7
POLICY RESEARCH WORKING PAPER 1527
Foreign Direct Investment, The more liberal acontrysforeign exchange system, the
Other Capital Flows more foreign direct
and Current Account investment is likely to beindependent of current
Deficits account and other capitalflows
What Causes What?
MaxwellJ. Fry
Stijn Claessens
Peter Burridge
Marie-Christine Blanchet
The World Bank
International Economics Department
Debt and International Finance Division
October 1995
Poi F A RESEARCH W(ORKING PAI'I K 15 27
Summary findings
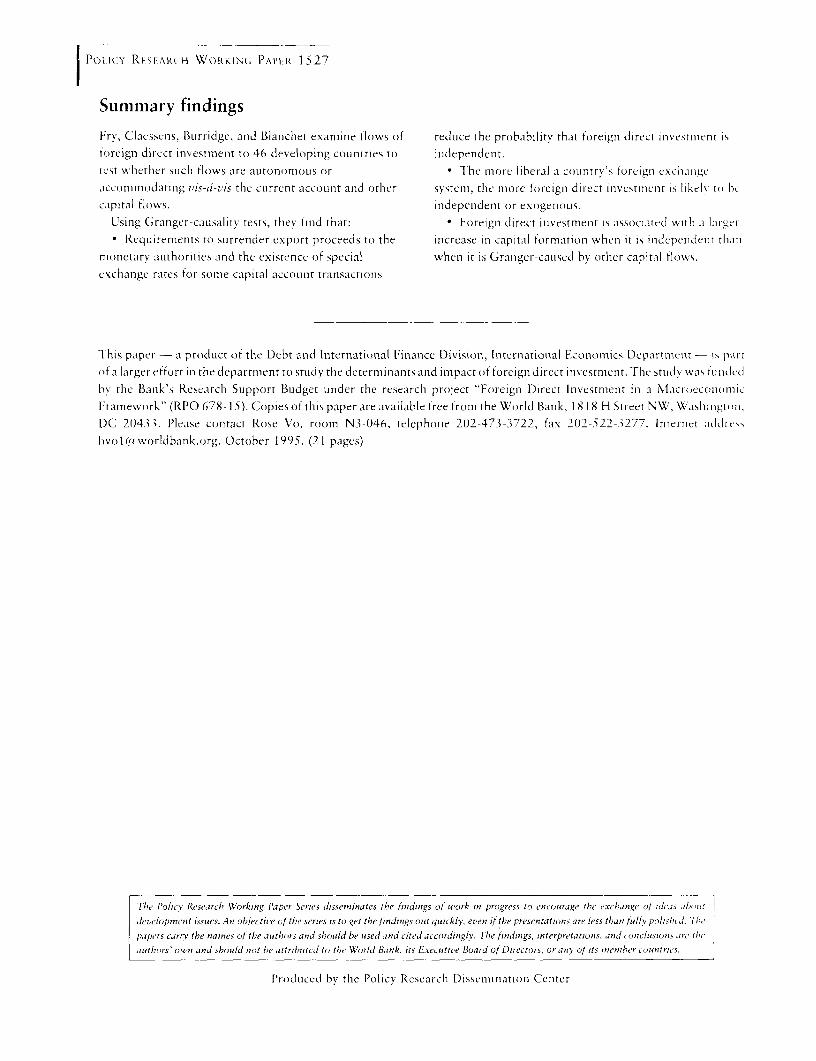
FrvC Claessens, Burridge, and Blanchet examine flows of reducc the probability that foreign direct investmient is
foreign direct investilicim t to 46 developing countries to indepenidenr.
test whethler SucIh flows are aLutollonOtLIs or * The more liberal a countrv's forteigo exchangeaccomimillodating uis-di-vis the current account and othetr ssten, the more foreigni direct investmiienit is likely to bhcapital flows, independenit or exogenious.
sinig Granger-causality tests, they find that: Foreign direct investimient is associated witrh a larger
Requiremlients to surrender export proceeds to the increase in capital formation wvhen it is independenit thanmonetarv authlorities and the existence of special when it is Granger-caused bv other capital flows.
exchanige rates for some capital accouLnt transactions
This paper -a product of the Debt and International Finance Division, Internationial Economics Departiielt - is part
of a larger effort in the department to study thEt determinanitsand impact of foreign direct investnment. The studyv wvas fundedby the Bank's Researchi Support Budget under the researclh project "Foreign Direct Investment in a MlacroeconomiciFramework" (RPO 678-15). Copies of this paper are available free fromi the World Bank, 1818 H StreetrNWV Washington,
DC 20433. Please contact Rose Vo, room N3-046, telephone 202-473-3722, fax 202-522-3277, Internet addreFx
hvo l (t aworldbank.org. October 1995. (21 pages)
1hc 'olicv Research Wo( Vrking Paper Series disseminates the firndings )f fwork in progress to encourage the exchange of/ ideas aib,aiii|devLelo pmi')t issules. Anohsibectiu'e of the series is to get the findings out quiclGkly, even/ if the presentaltion(s are less thano hfully p, d5ishe. 1 /'t
papers earn' the names of the authors and should be tIsed and cited accordingly. The findings, interpretations, and coniclusitits ale' thoe
authors own antd should niot bIe attributed to the World Bank, its Executive Board of Dir ctors, or anPly of its iember be ,,tunct tes.
Jiroduicedj by the Policy kRsearclh Disseminiation Center
Foreign Direct Investment, Other Capital Flows
and Current Account Deficits:
What Causes What?
MAXWELL J. FRY, STIJN A. CLAESSENS,
PETER BURRIDGE, AND MARIE-CHRISTINE BLANCHET*
University of Birmingham, World Bank,
University of Birmingham, University of Birmingham
JEL Classifications: F21, F32, 05.
Key words: foreign direct investment, current account deficits.
'This paper was written for the International Economics Department of the World Bank under the World
Bank's Research Support Budget RPO-678-15. The views expressed in this paper do not necessarily reflect
those of the World Bank, its Board of Directors, its management, or any of its member countries. EViews,
version 1.0, and MicroTSP, version 7.0, were used for all the regressions presented in this paper.

I
1
1 Introduction
Foreign capital inflows to developing countries constitute part of the world's saving. Over
the past two decades, world saving as a proportion of world income has fallen. As world
saving has shrunk, so the real interest rate measured in terms of U.S. dollar interest and
inflation rates has risen from 0.8 per cent during the period 1971-1978 to 4.8 per cent in
the period 1981-1991 (International Financial Statistics, CD-ROM, September 1994).' It
is against this background that foreign direct investment (FDI) has appeared increasingly
attractive to developing countries facing declining domestic investment and higher costs of
foreign borrowing. Foreign direct investment seems an attractive form of capital inflow
because it involves a risk-sharing relationship with the suppliers of this type of foreign capital.
This kind of risk sharing does not exist in the formal contractual arrangements for foreign
loans. Furthermore, as the World Bank (1993, 3) claims, there may be dynamic benefits:
"Foreign direct investment is a large and growing source of finance that may help developing
countries close the technology gap with high-income countries, upgrade managerial skills,
and develop their export markets."
Globally, FDI has increased dramatically over.the past decade. However, most of this
increase has occurred in the industrial countries. In the developing countries, FDI has been
heavily concentrated among a small number of countries; over 90 per cent of FDI inflows to
developing countries in 1990 was received by only 18 countries. Half of this total flowed to
eight Pacific Basin developing market economies (Hong Kong, Indonesia, Korea, Malaysia,
Philippines, Singapore, Taiwan, and Thailand). Given that neither Korea nor Taiwan has
shown strong interest in attracting FDI, it may seem surprising that these economies feature
in this group of developing countries. Their appearance in this list may support the view
that explicit incentive packages are not the key determinants of FDI flows.
In undertaking any analysis of FDI, one must recognize that FDI data record financial
flows which may or may not correspond to changes in capital formation. Whether or not
they do depends on (a) the extent of substitutability of this type of financial flow for other
types of financial flows and (b) the extent to which FDI crowds out domestically financed
'The real interest rate is proxied here by the London interbank offered rate on U.S. dollar deposits adjusted for
the percentage change in the U.S. GDP deflator. During the period 1992-1995, this real interest rate averaged
only 1.5 percent, but has been rising rapidly since 1993 (World Economic Outlook, May 1994, 177):
2
investment. In some of the literature, the view prevails that FDI can serve two purposes,
namely, raise investment and relieve foreign exchange shortages.2 Unless FDI. affects national
saving, however, it can raise domestic investment or provide additional financing for a preex-
isting current account deficit or achieve some combination of the two, but these two effects
must always sum to one. In other words, if $100 FDI increases capital formation by only $75,
it would provide $25 for additional current-account financing. If it simply substitutes for an
alternative type of capital inflow, however, FDI neither raises capital formation nor does it
provide additional current-account financing.
This study examines the question of whether FDI to a sample of developing countries
substitutes for other capital flows, increases capital formation, or provides additional foreign
exchange for balance-of-payments support. Using James Meade's (1951) distinction between
autonomous and accommodating capital flows, Philip Turner (1991, 91-95) addresses the
question of whether or not net FDI flows are accommodating and hence constitute additional
balance-of-payments financing by regressing components of the capital account on the current
account financing requirement (both in first differences) for some OECD countries.
Turner's estimated equation takes the form:
AKFi = ao + a, AKFR, (1)
where AKFi is the year-on-year change in the net capital flow item expressed as a percentage
of GNP and AKFR is the year-on-year change in the current account minus changes in official
reserves also expressed as a percentage of GNP (both in current prices). Turner (1991, 92)
finds that short-term bank flows are significantly correlated with the current account financing
requirement with coefficients ranging from 0.27 (United Kingdom) to 0.88 (Canada) for seven
of the 10 OECD countries. In the case of FDI, however, Turner concludes that this flow is
much closer to being autonomous than accommodating; the coefficient is significant only in
the case of France with a value of only 0.13.
Using Turner's. methodology with annual data on net capital flows from International
Financial Statistics CD-ROM for a sample of 16 developing countries3 for the period 1975-
2For example, Laurence Cockcroft and Roger Riddell (1991, 3) note: "Two of the principal factors inhibiting
higher levels of economic growth in Sub-Saharan Africa in the 1990s are low levels of investment and foreign
exchange shortages. The first attraction of foreign investment lies in its potential to address both these
constraints."3 Argentina, Brazil, Chile, Egypt, India, Indonesia, Korea, Malaysia, Mexico, Nigeria, Pakistan, the Philip-
3
1990, Fry (1993, 13). finds a rather different response pattern in developing countries. In
contrast to the OECD countries, other long-term capital flows appear to be just as sensitive
to current account financing requirements as short-term flows in this sample of developing
countries. For these countries, therefore, one might rank portfolio investment as the most
autonomous, FDI or capital inflows to the public sector next, and both long- and short-term
bank loans as the most accommodative type of capital flow.
All but one of the estimated coefficients for FDI are less than 0.1. Even in the case
where FDI is most accommodative (Malaysia), the coefficient is still only 0.14. On the basis
of these estimates, therefore, FDI appears to be autonomous on Turner's criterion. The
negative coefficients of FDI in India and Korea (Fry 1993, 13), and in the United Kingdom
(Turner 1991, 92) may reflect the deterrent effect of increasing current account deficits on FDI
inflows, since large current account deficits can worsen a country's investment climate. This
would also support the view that FDI inflows are largely unrelated to balance-of-payments
financing requirements. However, it does suggest that FDI should be treated as endogenous
to a country's saving-investment process.
Unfortunately, Turner's technique is seriously flawed. First, with enough substitutability
between alternative types of capital inflows, there may be no bivariate correlation between'
any of the components and the overall current account financing requirement. Indeed, Fry's
(1993, 13) results indicate that this is the case for Egypt, Nigeria, and. the Philippines. Out of
80 regressions, only 12 yield significant coefficients at the 95 per cent confidence level. Fry's
findings support Michael Dooley's (1990, 75) assertion that financial flow variables such as
FDI have far too high degrees of substitutability to provide any useful analytical informa-
tion. Second, the bivariate regressions fail to establish causality. To explore these issues,
this paper presents Granger-causality tests to examine not only the direction of causation
between current and capital account imbalances but also between current account and three
components of the capital account, FDI, portfolio investment (Pi), and other capital flows
(OKF). Whether or not substitutability and fungibility are so high that FDI flows provide no
relevant economic information at all is an empirical question.
pines, Sri Lanka, Thailand, Turkey, and Venezuela.
4
2 Granger-Causality in the Balance of Payments
Our first question is whether current account-imbalances Granger-cause capital account im-
balances or vice versa. To answer this question, we use an error-correction model (ECM) with
one lag. For the long-run analysis conducted here, we ignore errors and omissions in the
balance-of-payments accounts and assume that the desired level of international reserves is
zero. Hence, the balance of payments on current account is equal and opposite to the balance
of payments on capital account. Since changes in international reserves are a disequilibrium
phenomenon, we use them as an error-correction term.
So that all countries can be treated in a uniform manner, we assume that international
reserves are stationary with a constant long-run equilibrium ratio to GNP. Hence, the previous
period's reserve balance can be treated as the disequilibrium term in an ECM of the form:
m n
ACAt = a + b.(CAt- + KAt_.) + ciACAt_, + E djAKAt_j + u, (2)i=1 j=1
where CA is the current account and KA is the capital account. The term CAt.. + KAt-1, the
lagged change in official reserves, is the error-correction mechanism. The rationale is that, if
there are co-movements in CA and KA, they should be equilibrating in the long run.4 This
leads to a causality test based on the significance of either the coefficient b or the coefficients
dj. When KA is substituted for CA as the dependent variable, the relevant coefficients are b
and ci.
We faced a choice between examining quarterly data for a small sample or annual data for
a larger sample of developing countries. From a total of 115 developing countries for which
some balance-of-payments data were available, we selected an initial sample of 75 developing
countries that had experienced FDI inflows of at least half a percent of GNP for at least five
years over the period 1970-1992. Data deficiencies reduced this sample to 46 countries with
annual data and only 14 countries with quarterly data. We chose the larger country sample,
4 Peter Montiel (1994, 329) makes a similar point about the relationship between national saving, domestic
investment, and the current account: "The current account provides the resources with which a country repays
its external creditors. Solvency thus imposes a constraint that prevents deviations between national saving
and investment from becoming permanent. Because gaps between saving and investment must eventually
be reversed for the country to remain solvent, sufficient observations should show these two series to be
cointegrated." In this case, the lagged current account is the error-correction mechanism that equilibrates
saving and investment in the long run.
5
Table 1: Granger-Causality Tests for Current (CA) and Capital (KA) Accounts, 1970-1992.
KA Causes CA CA Causes KA NeitherCAUSKC CAUSCK CAUSN
Algeria Algeria Bolivia
Argentina Honduras Barbados
Brazil Indonesia Chile
Costa Rica Korea C6te d'Ivoire
Greece Malta Colombia
Kenya Mexico Ecuador
Malta Panama Egypt
Mauritius Portugal El Salvador
Paraguay Rwanda Guatemala
Peru Singapore Jamaica
Philippines Turkey Malawi
Rwanda Uruguay Malaysia
Singapore Niger
Swaziland Nigeria
Thailand Saudi Arabia
Tunisia Sierra Leone
Venezuela South Africa
Suriname
Togo.
Trinidad and Tobago
Zambia
which meant that a wider search for possible ECM forms was not feasible. For the same
reason, we use only one lag for n ciACAt-. and Ej1_1 diAKAt-j. In other words, we set
both i and j equal to one.
Table 1 shows the results of the initial Granger-causality tests between the current and
capital account over the period 1970-1992. Both variables are expressed as proportions of
GNP. The capital account Granger-causes current account imbalances in 13 countries and
6
we detect the opposite direction of causation in eight countries. In four countries Granger-
causation goes both ways, while no causality is detected in the remaining 21 countries.
The second question we address here is whether disaggregated capital flows are inter-
dependent or independent. Interdependence means that one or more other capital flows
Granger-cause this particular capital flow. Independence means that neither of the other
capital flows exerts any causal influence. If the capital account Granger-causes the current
account, all three capital flows may be independent and hence could Granger-cause the cur-
rent account imbalance. However, it is also possible that high substitutability ensures that
all three capital flows are interdependent and that no individual capital flow Granger-causes
the current account imbalance. There are six additional possibilities: any one of the three
capital flows may be independent or two capital flows in any of the three combinations may
be independent. Hence, eight different Granger-causality results can occur among the com-
ponents if the capital account Granger-causes the current account. If the current account
Granger-causes the capital account, the same eight results are possible. The current account
imbalance may influence all. three flows, two flows, one flow, or no individual flow at all
because of high substitutability. In other words, all capital flows or no capital flow can be
independent.
In testing for causality within and between components of CA and KA, there is no natural
measure of disequilibrium. Hence, we adopt a forrm of the procedure advocated by Cheng
Hsiao (1979), and elaborated by Mitsuhiro Odaki (1986) and Edward Chartey (1993). Using
the finding by Jean-Pierre Urbairi (1989) that the Schwartz information criterion performs
relatively. well in small samples, we use it to determine lag length in the Hsiao procedure
described below.
First, we test all component series for unit roots. If either y or x were found to be
nonstationary, we employ the Hsiao procedure using the appropriate level of differencing.
The Hsiao procedure starts by assuming a maximum possible order Pmax for the unrestricted
VAR linking the variables under investigation; we chose P,,,a, = 4. Univariate AR(p) models,
p= 1, ... , Pmax are then fitted to y; the lag length pY that minimizes the chosen information
criterion is selected. This minimized value is denoted SBCy(py,O). Now lags p2 of the
variable x that could be causal are added in sequence up to lag py. If the minimum of the
corresponding SBCyr(pI,px) lies below SBCy(py,0), we conclude that x causes y since the
optimum model for predicting y contains pY lags of y and pX > 0 lags of x.
7
This procedure can be generalized to more than two variables to control for covariates as
advocated by Ghartey (1993). However, constraints on degrees of freedom prevent us from
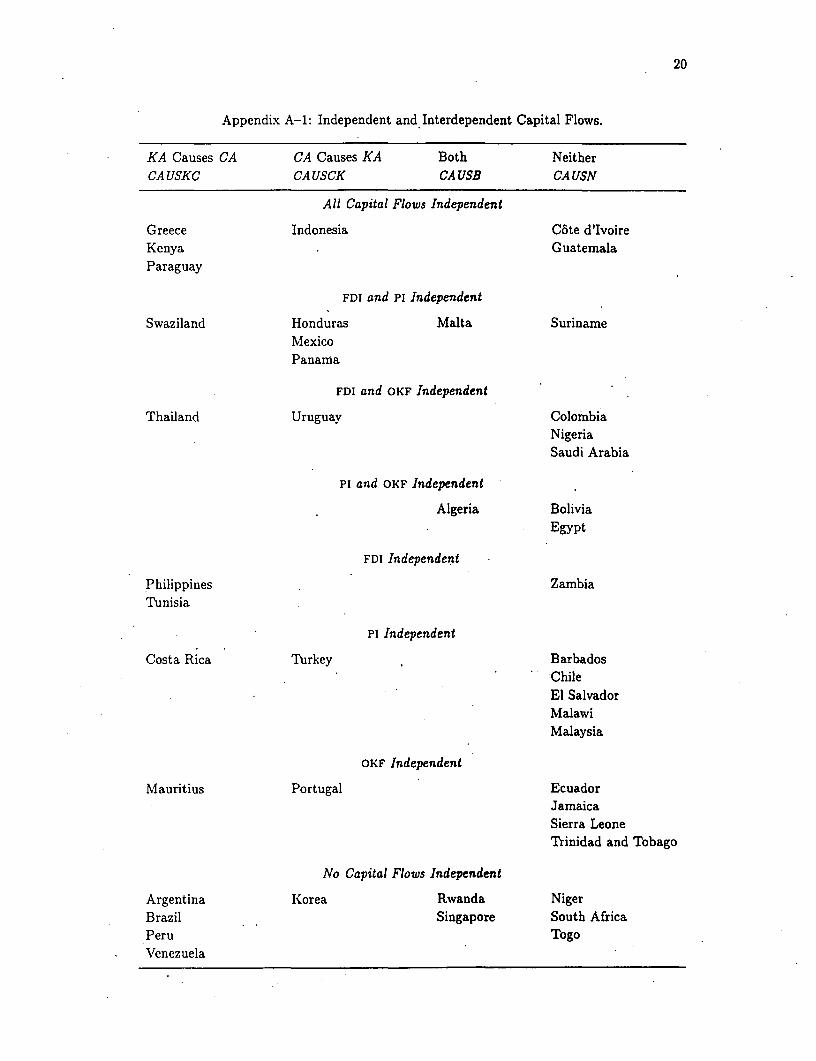
testing a multivariate model. Hence, the results reported below in Table 2 and Appendix
A-1 and A-2 are based on bivariate equations only.
Table 2 shows the key part of the second-stage estimation results concerning FDI; the
full results are presented in Appendix A-1. Even where the capital account Granger-causes
the current account, all three capital flows are interdependent in four countries (Argentina,
Brazil, Peru, and Venezuela). Conversely, all three capital flows are independent in Indonesia,
where the current account Granger-causes the capital account. Of central relevance to this
study is the finding that FDI iS independent of other capital flows in 20 of the 46 countries.
The third question is whether or not there is any Granger-causality between one of the
disaggregated capital flows-FDI, Pi, and OKF-and the current account or vice versa. Coun-
tries with no Granger-causation between current and capital accounts are excluded. For
countries with Granger-causation running from the capital account to the current account,
we test Granger-causality from each capital flow to the current account. For countries with
Granger-causation running from the current account to the capital account, we test Granger-
causality from the current account to each capital flow. Finally, for countries with bidirec-
tional Granger-causality, we run combined tests of Granger-causality from and to each capital
flow to and from the current account. The full results are presented in Appendix A-2. They
show that FDI Granger-causes the current account in seven countries (Algeria, Brazil, Costa
Rica, Peru, Rwanda, Singapore, and Venezuela) and is Granger-caused by the current account
in four countries (Algeria, Malta, Panama,. and Rwanda).
3 Explaining Causality Results
The results reported in Tables 1 and 2 display no evident patterns or country groupings. A
cursory inspection indicates that these classifications bear no relation to either location or
per capita income. However, there may be some feature or features of a country's economy,
specifically of its balance-of-payments regime, that are associated with particular causal
patterns. To investigate such possibilities, we ran logit and probit regressions to explain
the causal variables. The four dependent variables we examine are CA USKC for the capital
account Granger-causing the current account, CAUSCK for the current account Granger-
causing the capital account, CA USN for no Granger-causation between the capital and current
8
Table 2: Independent and Interdependent Foreign Direct Investment.
FDI Independent FDI Interdependent
Colombia Algeria
C6te d'Ivoire Argentina
Greece Barbados
Guatemala Bolivia
Honduras Brazil
Indonesia Chile
Kenya Costa Rica
Malta ' Ecuador
Mexico Egypt
Nigeria El Salvador
Panama Jamaica
Paraguay Korea
Philippines Malawi
Saudi Arabia Malaysia
Suriname Mauritius
Swaziland . Niger
Thailand Peru'
Tunisia Portugal
Uruguay .Rwanda
Zambia, Sierra Leone
Singapore
South Africa
Togo
Trinidad and Tobago
Turkey
Venezuela
9
Table 3: Potential Explanatory Variables for Direction of Balance-of-Payments Causation.
RESC - Article XIV status
RESD - Special rates for some or all capital transactions and/or some or all invisibles
RESE - More than one exchange rate for imports
RESF - More than one exchange rate for exports
RESG - Restrictions on current account payments
RESH - Restrictions on capital account payments
RESI - Import surcharges
RESJ - Advance import deposits
RESK - Surrender of export proceeds required
PCY - Natural logarithm of per capita income in U.S. dollars
YG - Rate of growth in real GNP
INF - Inflation (continuously compounded rate of change in GNP deflator)
OPEN - Exports plus imports as a proportion of GNP
FLY - Cumulated current account deficit as proportion of GNP
DETY - Foreign debt as a proportion of GNP
GBLY - Government deficit (-) as a proportion of GNP
DCGR - Net domestic credit to the government as a proportion of total domestic
credit
DCGY - Net domestic credit to the government as a proportion of GNP
BLA - Black market exchange rate premium
RR - Square of real interest rate
DCPY - Domestic credit to the private sector as a proportion of GNP
account, and FDIX for FDI being independent or exogenous. These variables take a value of
1 when a country exhibits the particular Granger-causation specified and 0 when it does not.
Since there were only four countries with bidirectional Granger-causation, these were treated
as positive for both CAUSKC and CAUSCK.
The potential explanatory variables are listed in Table 3. The first set of explanatory
variables consist of balance-of-payments restriction variables reported annually at the back
of the International Monetary Fund's Balance of Payments Yearbook. The variables RESC
10
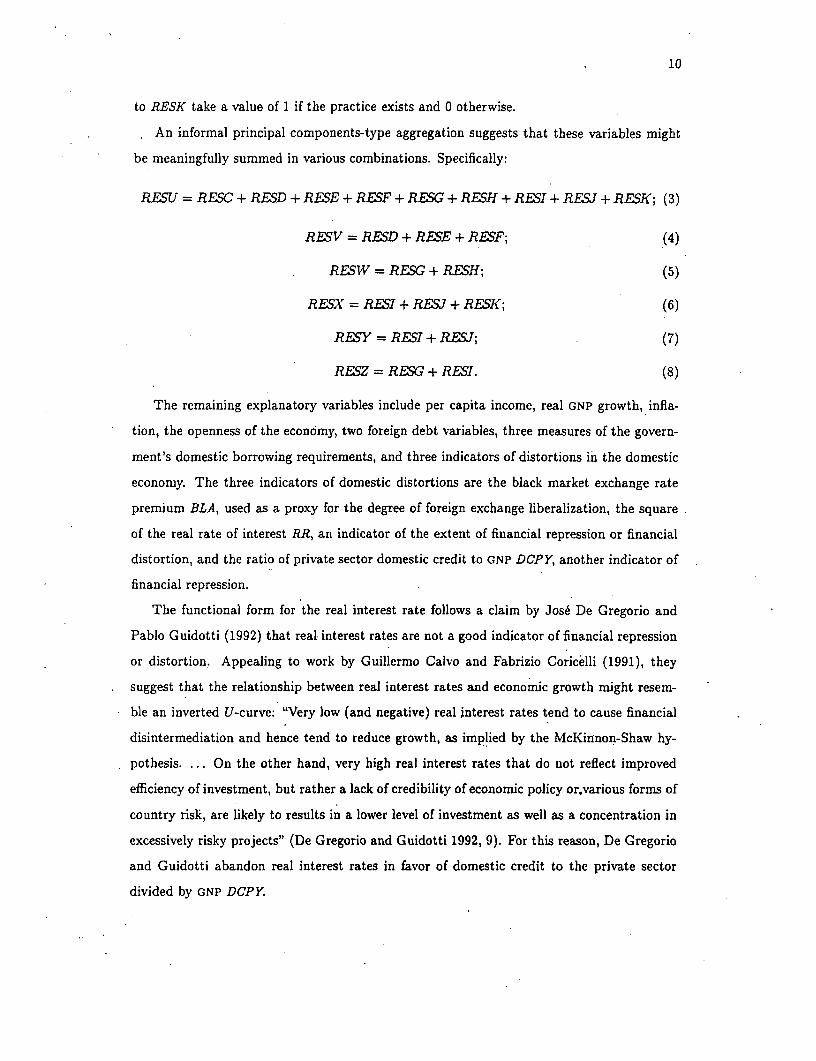
to RESK take a value of 1 if the practice exists and 0 otherwise.
An informal principal components-type aggregation suggests that these variables might
be meaningfully summed in various combinations. Specifically:
RESU RESC + RFSD + RESE + RES + RSG + RESH + RESI + REV + RFK; (3)
RESV =RED + RESE + RESF; (4)
RESW=RESG+RFSH; (5)
RESX = RESI + RES + RESK; (6)
RFSY=RESI+RESJ; (7)
RFSZ=RESG+RE5I. (8)
The remaining explanatory variables include per capita income, real GNP growth, infla-
tion, the openness of the economy, two foreign debt variables, three measures of the govern-
ment's domestic borrowing requirements, and three indicators of distortions in the domestic
economy. The three indicators of domestic distortions are the black market exchange rate
premium BLA, used as a proxy for the degree of foreign exchange liberalization, the square
of the real rate of interest RR, an indicator of the extent of financial repression or financial
distortion, and the ratio of private sector domestic credit to GNP DCPY, another indicator of
financial repression.
The functional form for the real interest rate follows a claim by Jose De Gregorio and
Pablo Guidotti (1992) that real interest rates are not a good indicator of financial repression
or distortion. Appealing to work by Guillermo Calvo and Fabrizio Coricelli (1991), they
suggest that the relationship between real interest rates and economic growth might resem-
ble an inverted U-curve: "Very low (and negative) real interest rates tend to cause financial
disintermediation and hence tend to reduce growth, as implied by the McKinnon-Shaw hy-
pothesis.... On the other hand, very high real interest rates that do not reflect improved
efficiency of investment, but rather a lack of credibility of economic policy or,various forms of
country risk, are likely to results in a lower level of investment as well as a concentration in
excessively risky projects" (De Gregorio and Guidotti 1992, 9). For this reason, De Gregorio
and Guidotti abandon real interest rates in favor of domestic credit to the private sector
divided by GNP DCPY.

11
Since there are 46 observations for each Granger-causation variable in Tables I and 2, we
chose for each country two alternative values for each variable listed in Table 3. The first
is the value in 1970 at the start of the observation period, the second is the average value
throughout the period 1970-1992. As no variable measured at its 1970 value provided any
predictive power, we report only estimates using average:values.
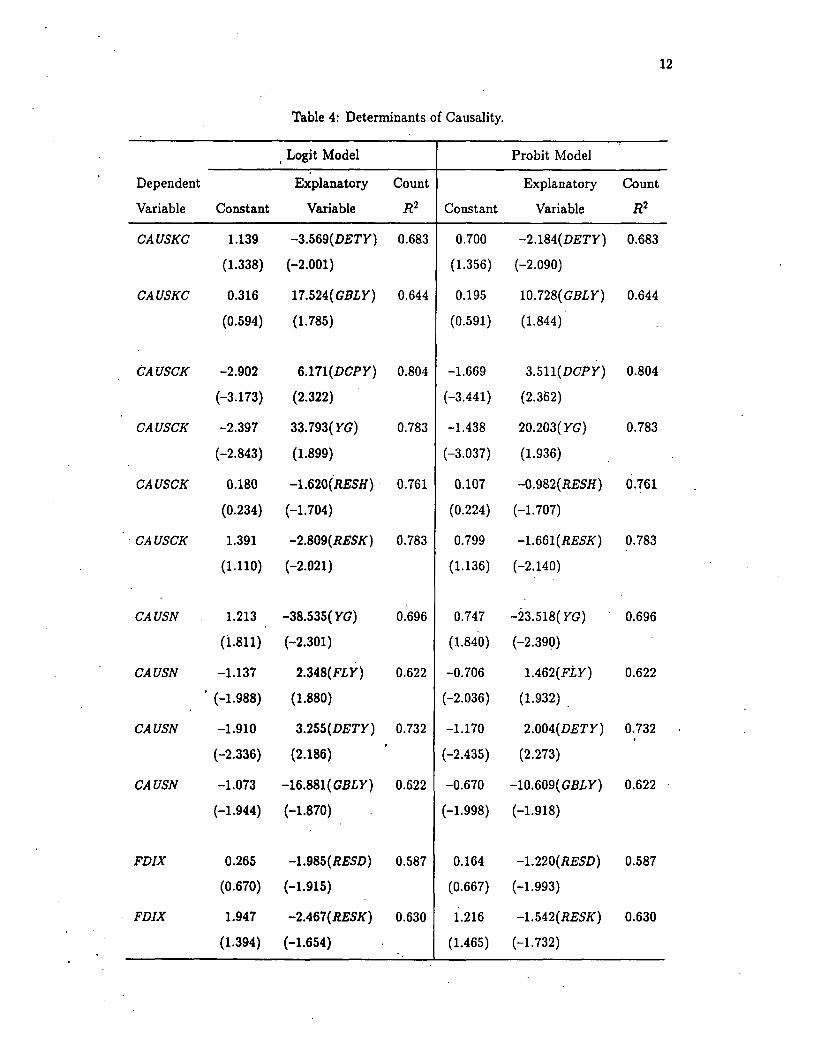
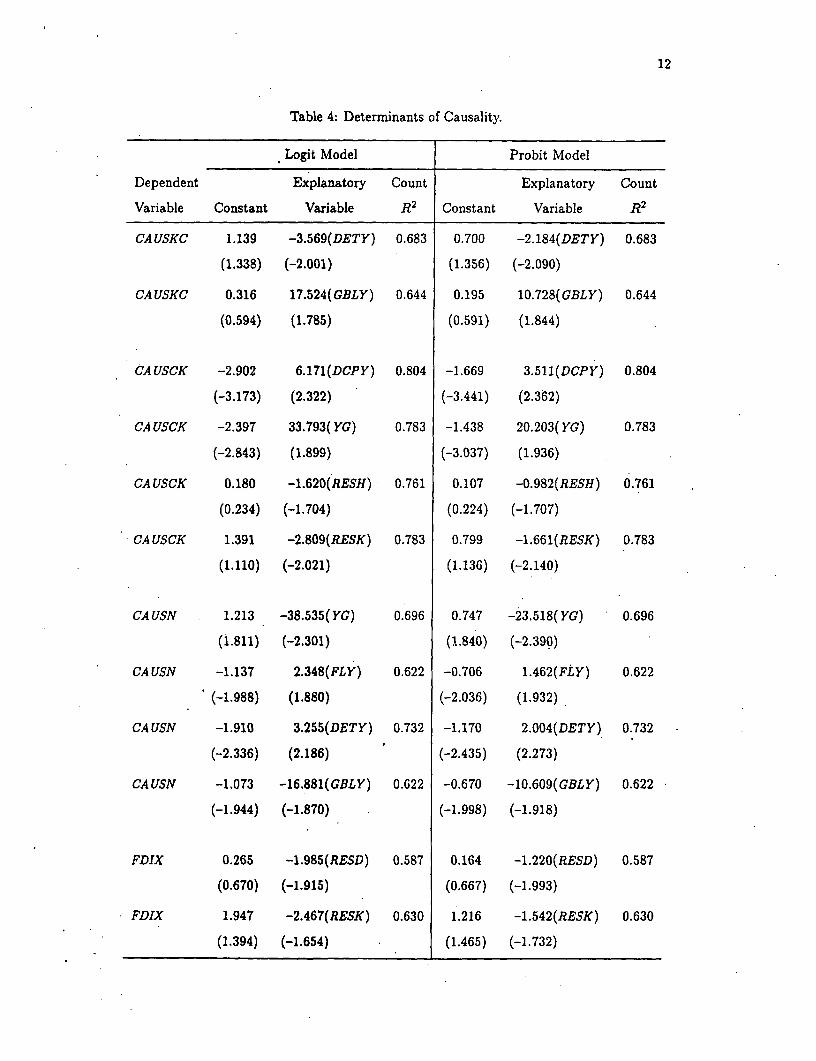
The significant bivariate associations using these measures are shown in Table 4.5 On the
one hand, higher levels of both foreign and domestic indebtedness reduce the probability of
causation running from capital to current accounts and increase the probability that there is
no causation. On the other hand, a high rate of economic growth increases the probability of
causation running from current to capital account, while reducing the probability that there
is no causation. A higher ratio of private sector credit to GNP also increases the probability
of causation running from current to capital account.
The existence of restrictions on capital account payments reduces the probability of cau-
sation running from current to capital accounts. The existence of special exchange rates for
some capital account transactions reduces the probability that FDI is independent. Finally,
the probabilities of causation running from current to capital accounts and of FDI being in-
dependent of the current account are reduced in countries where export proceeds must be
surrendered to the monetary authorities. Table 4 suggests that the more liberal is a country's
foreign exchange system, the more likely is FDI to be exogenous or independent.
4 Foreign Direct Investment and Capital Formation
Where FDI is not independent but Granger-caused by other capital inflows, one might rea-
sonably assume that FDI inflows would be less likely to increase capital formation than in
the case where FDI is independent. Hence we now estimate the impact of FDI on domes-
tic investment for countries in which FDI is independent and for countries in which FDI is
interdependent.
The investment function specified here in terms of the ratio of investment to GNP is
based on the flexible accelerator model. Mario Blejer and Mohsin Khan (1984, pp. 382-383)
describe some of the difficulties of estimating neoclassical investment functions for developing
5Multivariate estimates produced similar results, but multicoUinearity considerably reduced coefficient
precision.
12
Table 4: Determinants of Causality.
Logit Model Probit Model
Dependent Explanatory Count Explanatory Count
Variable Constant Variable R2 Constant Variable R2
CAUSKC 1.139 -3.569(DETY) 0.683 0.700 -2.184(DETY) 0.683
(1.338) (-2.001) (1.356) (-2.090)
CAUSKC 0.316 17.524(GBLY) 0.644 0.195 10.728(GBLY) 0.644
(0.594) (1.785) (0.591) (1.844)
CAUSCK -2.902 6.171(DCPY) 0.804 -1.669 3.511(DCPY) 0.804
(-3.173) (2.322) (-3.441) (2.362)
CA USCK -2.397 33.793(YG) 0.783 -1.438 20.203(YG) 0.783
(-2.843) (1.899) (-3.037) (1.936)
CA USCK 0.180 -1.620(RESH) 0.761 0.107 -0.982(RESH) 0.761
(0.234) (-1.704) (0.224) (-1.707)
CA USCK 1.391 -2.809(RESK) 0.783 0.799 -1.661(RESK) 0.783
(1.110) (-2.021) (1.136) (-2.140)
CA USN 1.213 -38.535(YG) 0.696 0.747 -23.518(YG) 0.696
(1.811) (-2.301) (1.840) (-2.390)
CA USN -1.137 2.348(FLY) 0.622 -0.706 1.462(FLY) 0.622
(-1.988) (1.880) (-2.036) (1.932)
CA USN -1.910 3.255(DETY) 0.732 -1.170 2.004(DETY) 0.732
(-2.336) (2.186) (-2.435) (2.273)
CAUSN -1.073 -16.881(GBLY) 0.622 -0.670 -10.609(GBLY) 0.622
(-1.944) (-1.870) (-1.998) (-1.918)
FDIX 0.265 -1.985(RESD) 0.587 0.164 -1.220(RESD) 0.587
(0.670) (-1.915) (0.667) (-1.993)
FDIX 1.947 -2.467(RESK) 0.630 1.216 -1.542(RESK) 0.630
(1.394) (-1.654) (1.465) (-1.732)
13
countries. Without data on the capital stock and the return to capital, there is little choice
in practice but to use some version of the accelerator model.
The accelerator model has the desired capital stock Kg proportional to real output y:
= cy. (9)
This can be expressed in terms of a desired ratio of net investment to output (I/Y)*:
(I/Y)* = ya,. (10)
where -y is the rate of growth in output denoted YG in the regression equation.
The partial adjustment mechanism specified for the investment ratio is somewhat more
complicated than the equivalent mechanism for the level of investment. Specifically, there
could be a lag in achieving the same investment ratio this year as last year if output rose
rapidly last year; this year's desired investment level will be higher than last year's, despite
a constant desired ratio of investment to output. To incorporate this adjustment lag, last
year's growth rate yt-I can be included as an explanatory variable. In this case, however,
the coefficient of a-l was insignificant; hence, At-i is omitted from the estimate.
The remaining adjustment mechanism allows the actual investment ratio to adjust par-
tially in any one period to the difference between the desired investment ratio and the in-
vestment ratio in the previous period:
or
I/Y = A(I/Y)* + (l-A)(I/Y)t_ 1, (12)
where A is the coefficient of adjustment.
The flexible accelerator model allows economic conditions to influence the adjustment
coefficient A. Specifically,
A = + [#1 1+ 02Z2 + 0353+ +- (13)
where zi are the variables that affect A. Since one of these variables can be an intercept term
for the depreciation rate, the flexible accelerator model can be estimated for the gross rather
than the net investment ratio.
A simple specification search suggests that, for the 46 developing countries analyzed here,
the speed of adjustment is determined by the ratio of FDI inflows to GNP FDIY, the lagged
14
real exchange rate index expressed in natural logarithms REXL,i1,6 the lagged cumulated
net foreign liabilities converted into domestic currency and divided by lagged GNP FLYt..,
and credit availability as measured by the change in domestic credit divided by GNP DDCY.
The price of intermediate imports may affect the profitability of investment projects in
these developing countries. Hence, the real exchange rate expressed in natural logarithms
REXL is included as a proxy for the price of nontradable goods in relation to import prices.
We measure the real exchange rate REX as (domestic GNP deflator/U.S. wholesale price
index)/domestic currency per U.S. dollar. Therefore, a higher value of REXL implies a
lower relative price of imports. By appreciating the real exchange rate, capital inflows may
stimulate investment. On the other hand, an appreciation in the real exchange rate prices
exports out of world markets and may worsen the investment climate. Hence, its effect on
investment is ambiguous.
Effective domestic costs of borrowing are extraordinarily difficult to measure in almost
all developing countries because of selective credit policies and disequilibrium institutional
interest rates; hence the quantity rather than the price of credit is used here. The availability
of institutional credit can be an important determinant of the investment ratio, for the reasons
discussed by Alan Blinder and Joseph Stiglitz (1983), Fry (1980) and Peter Keller (1980).
Banks specialize in acquiring information on default risk. Such information is highly specific
to each client and difficult to sell. Hence, the market for bank loans is a customer market,
in which borrowers and lenders are very imperfect substitutes. A credit squeeze rations out
*some bank borrowers who may be unable to find loans elsewhere and so be unable to finance
their investment projects (Blinder and Stiglitz 1983, p. 300). Here, therefore, the investment
ratio is influenced by the change in total domestic credit scaled by GNP DDCY.
The variable FLYt_. .is included as a proxy for the effective domestic real interest rate. If
a buildup of foreign indebtedness makes foreign lenders more reluctant to lend, the effective
domestic real interest rate rises and so deters investment (Fry 1993).
The regression method used here is iterative three-stage least squares which is, asymptot-
ically, full-information maximum likelihood (Johnston 1984, pp. 486-492). We estimate the
46 individual country investment equations as two systems of equations with cross-equation
equality restrictions on all coefficients except the intercept. Hence, the estimates apply to a
representative member of these samples of developing countries. The estimation technique
*The variable REXL is divided by 10 for scaling purposes in the regression estimates.
15
corrects for heteroscedasticity across country equations and exploits contemporaneously cor-
related disturbances. The instruments are the exogenous explanatory variables plus the
lagged FDI ratio, lagged domestic credit expansion divided by GNP, the lagged terms-of-trade
index in natural logarithms, lagged growth, the public sector borrowing requirement divided
by GNP, the world real interest rate, oil price inflation, and the rate of growth (continu-
ously compounded) in OECD output. The estimation period is 1970-1991 and the dependent
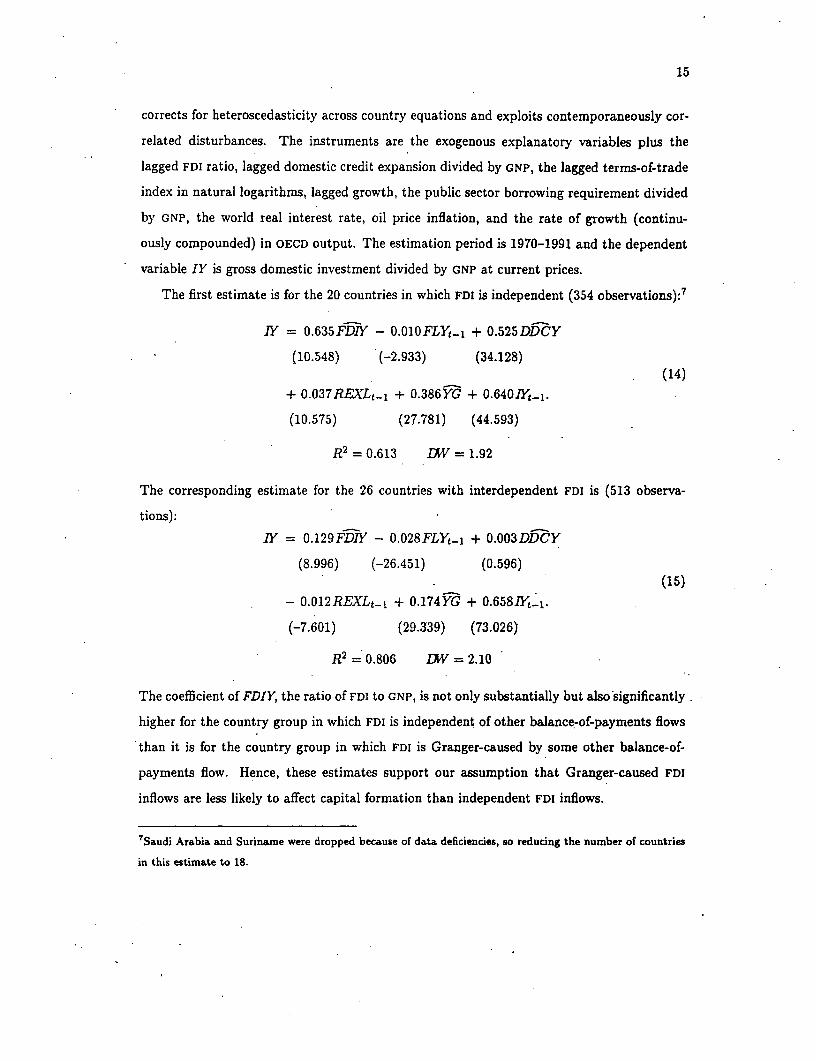
variable IY is gross domestic investment divided by GNP at current prices.
The first estimate is for the 20 countries in which FDI is independent (354 observations):7
IY = 0.635FD1Y - 0.Ol0FLY,-l + 0.525DDCY
(10.548) (-2.933) (34.128)(14)
+ 0.037REXLE._ + 0.386YG + 0.6401Y,_1.
(10.575) (27.781) (44.593)
-= 0.613 DW = 1.92
The corresponding estimate for the 26 countries with interdependent FDI is (513 observa-
tions):
1Y= 0.129FDIY - 0.028FLY,-, + 0.003DDCY
(8.996) (-26.451) (0.596)(15)
- 0.012REXLt-. + 0.174YG + 0.658]Yt-1.
(-7.601) (29.339) (73.026)
-2 0.806 DW =2.10
The coefficient of FDIY, the ratio of FDI to GNP, is not only substantially but also significantly
higher for the country group in which FDI is independent of other balance-of-payments flows
than it is for the country group in which FDI is Granger-caused by some other balance-of-
payments flow. Hence, these estimates support our assumption that Granger-caused FDI
inflows are less likely to affect capital formation than independent FDI inflows.
7Saudi Arabia and Suriname were dropped because of data deficiencies, so reducing the number of countries
in this estimate to 18.
16
5 Conclusion
In this paper, we have examined the question of whether capital flows, particularly inflows
of foreign direct investment, Granger-cause current account deficits or vice versa. The initial
results produce considerable diversity. While Granger-causality runs from capital to current
accounts in some countries, it runs from current to capital accounts in others. We detect
bidirectional Granger-causality in some countries and no causality at all in others. Within
the capital account, three types of capital flows are Granger-caused by other flows in some
countries, while all three are independent of movements in other capital and current-account
flows in others. The six other possible combinations of Granger-causality among the three
types of capital flows are all detected. There are no signs of any predominant tendencies
among this sample of 46 developing countries.
Nevertheless, we are able to find variables that can predict the direction of Granger-
causality. High levels of both foreign and domestic indebtedness reduce the likelihood that
the capital account Granger-causes the current account and increase the likelihood of no
causality. Conversely, a high rate of economic growth raises the likelihood that the current
account Granger-causes the capital account and reduces the likelihood of no causality. A
higher ratio of private sector credit to GNP also increases the probability of causation running
from current to capital account.
The existence of restrictions on capital account payments reduces the probability of cau-
sation running from current to capital accounts. The existence of special exchange rates for
some capital account transactions reduces the probability that FDI is independent. Finally,
the probabilities of causation running from current to capital accounts and of FDI being in-
dependent of the current account are reduced in countries where export proceeds must be
surrendered to the monetary authorities. The empirical results suggest that the more liberal
is a country's foreign exchange system the more likely is FDI to be exogenous or independent.
Finally, we find that when FDI is independent of other balance-of-payments flows it in-
creases capital formation in the host country by considerably more than it does when FDI is
Granger-caused by some other balance-of-payments flow. This finding is consistent with our
interpretation of the Granger-causality tests. Although FDl could still crowd out domestically
financed investment even if it were independent, we find that the majority of independent
FDI increases capital formation; for each $100 in FDI capital formation is increased by $64.
On the other hand, endogenous or interdependent FDI raises capital formation by only $13

17
for every $100 FDI inflow.

18
References
Blejer, Mario I. and Mohsin S. Khan (1984), "Government Policy and Private Investment
in Developing Countries," International Monetary Fund Staff Papers, 31(2), June 1984,
379-403.
Blinder, Alan S. and Joseph E. Stiglitz (1983), "Money, Credit Constraints, and Economic
Activity," American Economic Review, 73(2), May 1983, 297-302.
Calvo, Guillermo A. and Fabrizio Coricelli (1992), "Stagflationary Effects of Stabilization
Programs in Reforming Socialist Countries: Enterprise-Side vs. Household-Side Factors,"
World Bank Economic Review, 6(1), January 1992, 71-90.
Cockcroft, Laurence and Roger C. Riddell (1991), "Foreign Direct Investment in Sub-Saharan
Africa" (Washington, D.C., International Economics Department, WPS 619: World Bank,
March 1991).
De Gregorio, Jose, and Pablo E. Guidotti (1993), "Financial Development and Economic
Growth" (Washington D.C.: International Monetary Fund, July 1993).
Dooley, Michael P. (1990), "Comment" in Taxation in the Global Economy edited by Assaf
Razin and Joel Slemrod (Chicago: University of Chicago Press for the National Bureau
of Economic Research, 1990), 74-78.
Fry, Maxwell J. (1980), "Money, Interest, Inflation and Growth in Ibrkey," Journal of Mon-
etary Economics, 6(4), October 1980, 535-545.
Fry, Maxwell J. (1993), Foreign Direct Investment in Southeast Asia: Differential Impacts
(Singapore: Institute of Southeast Asian Studies, 1993).
Ghartey, Edward E. (1993), "Causal Relationship between Exports and Economic Growth:
Some Empirical Evidence in Taiwan, Japan and the U.S.," Applied Economics, 25(9),
September 1993, 1145-1152.
Hsiao, Cheng (1979), "Autoregressive Modeling of Canadian Money and Income Data," Jour-
nal of American Statistical Association, 74(367), September 1979, 553-560.
Johnston, John (1984), Econometric Methods, third edition (New York: McGraw-Hill, 1984).
Keller, Peter M. (1980), "Implications of Credit Policies for Output and the Balance of
Payments," International Monetary Fund Staff Papers, 27(3), September 1980, 451-477.
19
Meade, James E. (1951), The Theory of International Economic Policy. Volume 1: The
Balance of Payments (Oxford: Oxford University Press, 1951).
Montiel, Peter J. (1994), "Capital Mobility in Developing Countries: Some Measurement
Issues and Empirical Estimates," World Bank Economic Review, 8(3), September 1994,
311-350.
Odaki, Mitsuhiro (1986), "Tests of Granger Causality by the Selection of the Orders of a
Bivariate Autoregressive Model," Economics Letters, 22(2-3), 1986, 223-227.
Turner, Philip (1991), Capital Flows in the 1980s: A Survey of Major Trends (Basel: Bank
for International Settlements, Monetary and Economic Department, BIS Economic Papers
No. 30, 1991).
Urbain, Jean-Pierre (1989), "Model Selection Criteria and Granger Tests: An Empirical
Note," Economics Letters, 29(4), 1989, 317-320.
World Bank (1993), "Global Economic Prospects and the Developing Countries" (Washing-
ton, D.C.: World Bank, 1993).
20
Appendix A-1: Independent and Interdependent Capital Flows.
KA Causes CA CA Causes KA Both NeitherCA USKC CA USCK CA USE CA USN
All Capital Flows Independent
Greece Indonesia C6te d'IvoireKenya GuatemalaParaguay
FDI and Pi Independent
Swaziland Honduras Malta SurinameMexicoPanama
FDI and OKF Independent
Thailand Uruguay ColombiaNigeriaSaudi Arabia
Pi and OKF Independent
Algeria BoliviaEgypt
FDI Independent
Philippines ZambiaTlunisia
Pi Independent
Costa Rica Turkey BarbadosChileEl SalvadorMalawiMalaysia
OKF Independent
Mauritius Portugal EcuadorJamaicaSierra LeoneTrinidad and Tobago
No Capital Flows Independent
Argentina Korea Rwanda NigerBrazil Singapore South AfricaPeru TogoVenezuela
21
Appendix A-2: Causality Tests for Current and Capital Accounts Components.
KA Causes CA CA Causes KA Bidirectional Causation
Capital Flow CA CausesCauses CA Capital Flow
FDI
Brazil Panama Algeria AlgeriaCosta Rica Rwanda Malta
Peru Singapore RwandaVenezuela
Pi
Brazil Uruguay Malta RwandaCosta Rica Rwanda SingaporeMauritius SingaporeTunisia
OKF
Argentina Korea Malta AlgeriaCosta Rica Portugal Singapore Malta
Philippines Turkey RwandaThailand Uruguay
Policy Research Working Paper Series
ContactTitle Author Date for paper
WNPS1503 Africa's Growth Tragedy: A William Easterly August 1995 R MartinRetrospective, 1960-89 Ross Levine 39120
WPS1504 Savings and Education: A Life-Cycle Jacques Morisset August 1995 N. CuellarModel Applied to a Panel of 74 Cesar Revoredo 37892Countries
WPS1505 The Cross-Section of Stock Returns: Stijn Claessens September 1995 M_ DavisEvidence from Emerging Markets Susmita Dasgupta 39620
Jack Glen
WPS1506 Restructuring Regulation of the Rail loannis N. Kessides September 1995 J. DytangIndustry for the Public Interest Robert D. Willig 37161
WPS1507 Coping with Too Much of a Good Morris Goldstein September 1995 R. VoThing: Policy Responses for Large 31047Capital Inflows in Developing Countries
VWPS 1508 Small and Medium-Size Enterprises Sidney G. Winter September 1995 D. Evansin Economic Development: Possibilities 38526for Research and Policy
WPS1509 Saving in Transition Economies: Patrick Conway September 1995 C. BondarevThe Summary Report 33974
WPS1510 Hungary's Bankruptcy Experience, Cheryl Gray September 1995 G Evans1992-93 Sabine Schlorke 37013
Miklos Szanyi
WPS 151 1 Default Risk and the Effective David F. Babbel September 1995 S CocaDuration of Bonds Craig Merrill 37474
William Panning
WPS1512 The World Bank Primer on Donald A. Mclsaac September 1995 P. InfanteReinsurance David F. Babbel 37642
WPS1513 The World Trade Organization, Bernard Hoekman September 1995 F. Hatabthe European Union, and the 35835Arab World: Trade Policy Prioritiesand Pitfalls
WPS1514 The Impact of Minimum Wages in Linda A. Bell September 1995 S. FallonMexico and Colombia 38009
'A/PS1515 Indonesia: Labor Market Policies Nisha Agrawal September 1995 WDRand International Competitiveness 31393
WPS1516 Contractual Savings for Housing: Michael J. Lea September 1995 R. GarnerHow Suitable Are They for Bertrand Renaud 37670Transitional Economies?
Policy Research Working Paper Series
ContactTitle Author Date for paper
WPS1517 Inflation Crises and Long-Run Michael Bruno September 1995 R. MartinGrowth William Easterly 39120
WPS1518 Sustainability of Private Capital Leonardo Hernandez October 1995 R. VoFlows to Developing Countries: Heinz Rudolph 31047Is a Generalized Reversal Likely?
WPS1519 Payment Systems in Latin America: Robert Listfield October 1995 S. CocaA Tale of Two Countries - Colombia Fernando Montes-Negret 37664and El Salvador
WPS1520 Regulating Telecommunications in Ahmed Galal October 1995 P. Sintim-AboagyeDeveloping Countries: Outcomes, Bharat Nauriyal 38526Incentives. and Commitment
WPS1521 Political Regimes, Trade, and Arup Banerji October 1995 H. GhanemLabor Policies Hafez Ghanem 85557
WPS1522 Divergence, Big Time Lant Pritchett October 1995 S. Fallon38009
WPS1523 Does More for the Poor Mean Less Jonah B. Gelbach October 1995 S. Fallonfor the Poor? The Politics of Tagging Lant H. Pritchett 38009
WPS1524 Employment and Wage Effects of Ana Revenga October 1995 A. RevengaTrade Liberalization: The Case of 85556Mexican Manufacturing
WPS1525 Is Ethiopia's Debt Sustainable? Ejaz Ghani October 1995 A. NokhostinHyoungsoo Zang 34150
WPS1526 Do We Face a Global "Capital Zia Oureshi October 1995 V. BarretoShortage"? 87216
WPS1527 Foreign Direct Investment, Other Maxwell J. Fry October 1995 R. VoCapital Flows, and Current Account Stijn Claessens 33722Deficits: What Causes What? Peter Burridge
Marie-Christine Blanchet
_____ps__S_ t7
POLICY RESEARCH WORKING PAPER 1527
Foreign Direct Investment, The more liberal acountryforeign exchange system, the
Other Capital Flows, more foreign direct
and Current Account investment is likely to beindependent of current
Deficits account and other capitalflows.
What Causes What?
Alaxwell J. Fry
Stijn Claessens
Peter Burridge
Marie-Christine Blanchet
The World Bank
International Economics Department
Debt and International Finance Division
October 1995
P(>LItYa Rti` S:A((H W\ORKIN( PAI"iH 1 527
Summary findingsFry, Claessens, B3urricige, and Blanichet exanmine flows of reduce the probability that foreign direct investment isftoreign direct investinenit to 46 developing countries to independent.
test w hether such flows are autoioniomous or The niore liberal a country's fore ign exchange
accommlilodatinig i's-d-Vis the current accounit and other systeim, the more foreign direct investment is likely to be
capital flows. independent or exogenous.
Using Granger-caU.salits tests, thev find that: Foreign direct inlvestmenit is associated with a larger
Requirenients ro surrender export proceeds to the increase in capital formation wheni it is independetit thin
monietary authorities and rhe existetnce of special when it is Granger-caused by othter capital flows.
exchange rates for somile capital accoulit transactions
T-his paper - a product of the Debt and International Finance Division, Internationial Economics Department - is palt
of a larger efforr in the department ro study the determninants and impact of foreign direct investment. The study was fu ide d
by the Banik's Research Support Budget under the researcil project "Foreign Direct Investmenit in a Mactoeconomnic
Frameworkl" (RPO 678-15). Copies of this paper are availab le free from the World Bank, 18 18 H Str-et NW, Washiilngton,
1)C 204.33. Please contact Rose Vo, room N3-(J46, telephone 202-473-3722, fax p02-522-3277. InrnerICt addit-s
hvo 1 @It worldbank.org. October 1 995. (21 pages)
[The 'olicy Research W`orkrin Paper Series dissemninates the findings ot work in progress tO encourage the exchange of iJl,as ib ulS
dei.celopnicnt issues. Ani obiet tive oft tfe series is to get the findings out quiick/v. even if the presentations are less than fzillv polished. Ibi
papers carry the tiamnes of the authobrs and sh?ould be used and Lited according/y. The findings, interpretations, and contclusiojn5sar i( tb
authors' ouw and should not be attributed to t't World Bank. its Exec utive B,oard of Direc tors, or any of its mroember c ountries.
P'roduced bv thc Policv Researclh Disseiminationi Ceniter
Foreign Direct Investment, Other Capital Flows
and Current Account Deficits:
What Causes What?
MAXWELL J. FRY, STIJN A. CLAESSENS,
PETER BURRIDGE, AND MARIE-CHRISTINE BLANCHET*
University of Birmingham, World Bank,
University of Birmingham, University of Birmingham
JEL Classifications: F21, F32, 05.
Key words: foreign direct investment, current account deficits.
'This paper was written for the International Economics Department of the World Bank under the World
Bank's Research Support Budget RPO-678-15. The views expressed in this paper do not necessarily reflect
those of the World Bank, its Board of Directors, its management, or any of its member countries. EViews,
version 1.0, and MicroTSP, version 7.0, were used for all the regressions presented in this paper.

I
1
1 Introduction
Foreign capital inflows to developing countries constitute part of the world's saving. Over
the past two decades, world saving as a proportion of world income has fallen. As world
saving has shrunk, so the real interest rate measured in terms of U.S. dollar interest and
inflation rates has risen from 0.8 per cent during the period 1971-1978 to 4.8 per cent in
the period 1981-1991 (International Financial Statistics, CD-ROM, September 1994).1 It
is against this background that foreign direct investment (FDI) has appeared increasingly
attractive to developing countries facing declining domestic investment and higher costs of
foreign borrowing. Foreign direct investment seems an attractive form of capital inflow
because it involves a risk-sharing relationship with the suppliers of this type of foreign capital.
This kind of risk sharing does not exist in the formal contractual arrangements for foreign
loans. Furthermore, as the World Bank (1993, 3) claims, there may be dynamic benefits:
"Foreign direct investment is a large and growing source of finance that may help developing
countries close the technology gap with high-income countries, upgrade managerial skills,
and develop their export markets."
Globally, FDI has increased dramatically over.the past decade. However, most of this
increase has occurred in the industrial countries. In the developing countries, FDI has been
heavily concentrated among a small number of countries; over 90 per cent of FDI inflows to
developing countries in 1990 was received by only 18 countries. Half of this total flowed to
eight Pacific Basin developing market economies (Hong Kong, Indonesia, Korea, Malaysia,
Philippines, Singapore, Taiwan, and Thailand). Given that neither Korea nor Taiwan has
shown strong interest in attracting FDI, it may seem surprising that these economies feature
in this group of developing countries. Their appearance in this list may support the view
that explicit incentive packages are not the key determinants of FDI flows.
In undertaking any analysis of FDI, one must recognize that FDI data record financial
flows which may or may not correspond to changes in capital formation. Whether or not
they do depends on (a) the extent of substitutability of this type of financial flow for other
types of financial flows and (b) the extent to which FDI crowds out domestically financed
'The real interest rate is proxied here by the London interbank offered rate on U.S. dollar deposits adjusted for
the percentage change in the U.S. GDP deflator. During the period 1992-1995, this real interest rate averaged
only 1.5 percent, but has been rising rapidly since 1993 (World Economic Outlook, May 1994, 177).
2
investment. In some of the literature, the view prevails that FDI can serve two purposes,
namely, raise investment and relieve foreign exchange shortages.2 Unless FDI affects national
saving, however, it can raise domestic investment or provide additional financing for a preex-
isting current account deficit or achieve some combination of the two, but these two effects
must always sum to one. In other words, if $100 FDI increases capital formation by only $75,
it would provide $25 for additional current-account financing. If it simply substitutes for an
alternative type of capital inflow, however, FDI neither raises capital formation nor does it
provide additional current-account financing.
This study examines the question of whether FDI to a sample of developing countries
substitutes for other capital flows, increases capital formation, or provides additional foreign
exchange for balance-of-payments support. Using James Meade's (1951) distinction between
autonomous and accommodating capital flows, Philip Turner (1991, 91-95) addresses the
question of whether or not net FDI flows are accommodating and hence constitute additional
balance-of-payments financing by regressing components of the capital account on the current
account financing requirement (both in first differences) for some OECD countries.
Iurner's estimated equation takes the form:
AKFi = ao + a, AKFR, (1)
where AKFi is the year-on-year change in the net capital flow item expressed as a percentage
of GNP and AKFR is the year-on-year change in the current account minus changes in official
reserves also expressed as a percentage of GNP (both in current prices). Turner (1991, 92)
finds that short-term bank flows are significantly correlated with the current account financing
requirement with coefficients ranging from 0.27 (United Kingdom) to 0.88 (Canada) for seven
of the 10 OECD countries. In the case of FDI, however, Turner concludes that this flow is
much closer to being autonomous than accommodating; the coefficient is significant only in
the case of France with a value of only 0.13.
Using Turner's. methodology with annual data on net capital flows from International
Financial Statistics CD-ROM for a sample of 16 developing countries3 for the period 1975-
2For example, Laurence Cockcroft and Roger Riddell (1991, 3) note: "Two of the principal factors inhibiting
higher levels of economic growth in Sub-Saharan Africa in the 1990s are low levels of investment and foreign
exchange shortages. The first attraction of foreign investment lies in its potential to address both these
constraints."3Argentina, Brazil, Chile, Egypt, India, Indonesia, Korea, Malaysia, Mexico, Nigeria, Pakistan, the Philip-
3
1990, Fry (1993, 13). finds a rather different response pattern in developing countries. In
contrast to the OECD countries, other long-term capital flows appear to be just as sensitive
to current account financing requirements as short-term flows in this sample of developing
countries. For these countries, therefore, one might rank portfolio investment as the most
autonomous, FDI or capital inflows to the public sector next, and both long- and short-term
bank loans as the most accommodative type of capital flow.
All but one of the estimated coefficients for FDI are less than 0.1. Even in the case
where FDI is most accommodative (Malaysia), the coefficient is still only 0.14. On the basis
of these estimates, therefore, FDI appears to be autonomous on Turner's criterion. The
negative coefficients of FDI in India and Korea (Fry 1993, 13), and in the United Kingdom
(Turner 1991, 92) may reflect the deterrent effect of increasing current account deficits on FDI
inflows, since large current account deficits can worsen a country's investment climate. This
would also support the view that FDI inflows are largely unrelated to balance-of-payments
financing requirements. However, it does 'suggest that FDI should be treated as endogenous
to a country's saving-investment process.
Unfortunately, Turner's technique is seriously flawed. First, with enough substitutability
between alternative types of capital inflows, there may be no bivariate correlation between'
any of the components and the overall current account financing requirement. Indeed, Fry's
(1993, 13) results indicate that this is the case for Egypt, Nigeria, and. the Philippines. Out of
80 regressions, only 12 yield significant coefficients at the 95 per cent confidence level. Fry's
findings support Michael Dooley's (1990, 75) assertion that financial flow variables such as
FDI have far too high degrees of substitutability to provide any useful analytical informa-
tion. Second, the bivariate regressions fail to establish causality. To explore these issues,
this paper presents Granger-causality tests to examine not only the direction of causation
between current and capital account imbalances but also between current account and three
components of the capital account, FDI, portfolio investment (pi), and other capital flows
(OKF). Whether or not substitutability and fungibility are so high that FDI flows provide no
relevant economic information at all is an empirical question.
pines, Sri Lanka, Thailand, Turkey, and Venezuela.

4
2 Granger-Causality in the Balance of Payments
Our first question is whether current account imbalances Granger-cause capital account im-
balances or vice versa. To answer this question, we use an error-correction model (ECM) with
one lag. For the long-run analysis conducted here, we ignore errors and omissions in the
balance-of-payments accounts and assume that the desired level of international reserves is
zero. Hence, the balance of payments on current account is equal and opposite to the balance
of payments on capital account. Since changes in international reserves are a disequilibrium
phenomenon, we use them as an error-correction term.
So that all countries can be treated in a uniform manner, we assume that international
reserves are stationary with a constant long-run equilibrium ratio to GNP. Hence, the previous
period's reserve balance can be treated as the disequilibrium term in an ECM of the form:
m n
ACAt = a + b.(CAt-I + KAt- 1 ) + c,ACAt- + E djAKAt_j + u, (2)'=1 3=1
where CA is the current account and KA is the capital account. The term CAt- + KAt-1, the
lagged change in official reserves, is the error-correction mechanism. The rationale is that, if
there are co-movements in CA and KA, they should be equilibrating in the long run.4 This
leads to a causality test based on the significance of either the coefficient b or the coefficients
dj. When KA is substituted for CA as the dependent variable, the relevant coefficients are b
and ci.
We faced a choice between examining quarterly data for a small sample or annual data for
a larger sample of developing countries. From a total of 115 developing countries for which
some balance-of-payments data were available, we selected an initial sample of 75 developing
countries that had experienced FDI inflows of at least half a percent of GNP for at least five
years over the period 1970-1992. Data deficiencies reduced this sample to 46 countries with
annual data and only 14 countries with quarterly data. We chose the larger country sample,
'Peter Montiel (1994, 329) makes a similar point about the relationship between national saving, domestic
investment, and the current account: "The current account provides the resources with which a country repays
its external creditors. Solvency thus imposes a constraint that prevents deviations between national saving
and investment from becoming permanent. Because gaps between saving and investment must eventually
be reversed for the country to remain solvent, sufficient observations should show these two series to be
cointegrated." In this case, the lagged current account is the error-correction mechanism that equilibrates
saving and investment in the long run.
5
Table 1: Granger-Causality Tests for Current (CA) and Capital (KA) Accounts, 1970-1992.
KA Causes CA CA Causes KA NeitherCA USKC CA USCK CA USN
Algeria Algeria Bolivia
Argentina Honduras Barbados
Brazil Indonesia Chile
Costa Rica Korea C6te d'Ivoire
Greece Malta Colombia
Kenya Mexico Ecuador
Malta Panama Egypt
Mauritius Portugal El Salvador
Paraguay Rwanda Guatemala
Peru Singapore Jamaica
Philippines Turkey Malawi
Rwanda Uruguay Malaysia
Singapore Niger
Swaziland Nigeria
Thailand Saudi Arabia
Tunisia Sierra Leone
Venezuela South Africa
Suriname
Togo.
Trinidad and Tobago
Zambia
which meant that a wider search for possible ECM forms was not feasible. For the same
reason, we use only one lag for l ciACAt-. and Ej'=l djAKAt-j. In other words, we set
both i and j equal to one.
Table 1 shows the results of the initial Granger-causality tests between the current and
capital account over the period 1970-1992. Both variables are expressed as proportions of
GNP. The capital account Granger-causes current account imbalances in 13 countries and
6
we detect the opposite direction of causation in eight countries. In four countries Granger-
causation goes both ways, while no causality is detected in the remaining 21 countries.
The second question we address here is whether disaggregated capital flows are inter-
dependent or independent. Interdependence means that one or more other capital flows
Granger-cause this particular capital flow. Independence means that neither of the other
capital flows exerts any causal influence. If the capital account Granger-causes the current
account, all three capital flows may be independent and hence could Granger-cause the cur-
rent account imbalance. However, it is also possible that high substitutability ensures that
all three capital flows are interdependent and that no individual capital flow Granger-causes
the current account imbalance. There are six additional possibilities: any one of the three
capital flows may be independent or two capital flows in any of the three combinations may
be independent. Hence, eight different Granger-causality results can occur among the com-
ponents if the capital account Granger-causes the current account. If the current account
Granger-causes the capital account, the same eight results are possible. The current account
imbalance may influence all. three flows, two flows, one flow, or no individual flow at all
because of high substitutability. In other words, all capital flows or no capital flow can be
independent.
In testing for causality within and between components of CA and KA, there is no natural
measure of disequilibrium. Hence, we adopt a forrm of the procedure advocated by Cheng
Hsiao (1979), and elaborated by Mitsuhiro Odaki (1986) and Edward Ghartey (1993). Using
the finding by Jean-Pierre Urbain (1989) that the Schwartz information criterion performs
relatively, well in small samples, we use it to determine lag length in the Hsiao procedure
described below.
First, we test all component series for unit roots. If either y or x were found to be
nonstationary, we employ the Hsiao procedure using the appropriate level of differencing.
The Hsiao procedure starts by assuming a maximum possible order Pmax for the unrestricted
VAR linking the variables under investigation; we chose Pmax = 4. Univariate AR(p) models,
p p 1 J Pmax are then fitted to y; the lag length py that minimizes the chosen information
criterion is selected. This minimized value is denoted SBCy(pY,O). Now lags pZ of the
variable x that could be causal are added in sequence up to lag py. If the minimum of the
corresponding SBCy.(p1I,p) lies below SBCy(p,O), we conclude that x causes y since the
optimum model for predicting y contains pY lags of y and pX > 0 lags of x.

7
This procedure can be generalized to more than two variables to control for covariates as
advocated by Ghartey (1993). However, constraints on degrees of freedom prevent us from
testing a multivariate model. Hence, the results reported below in Table 2 and Appendix
A-1 and A-2 are based on bivariate equations only.
Table 2 shows the key part of the second-stage estimation results concerning FDI; the
full results are presented in Appendix A-1. Even where the capital account Granger-causes
the current account, all three capital flows are interdependent in four countries (Argentina,
Brazil, Peru, and Venezuela). Conversely, all three capital flows are independent in Indonesia,
where the current account Granger-causes the capital account. Of central relevance to this
study is the finding that FDI is independent of other capital flows in 20 of the 46 countries.
The third question is whether or not there is any Granger-causality between one of the
disaggregated capital flows-FDI, Pi, and OKF-and the current account or vice versa. Coun-
tries with no Granger-causation between current and capital accounts are excluded. For
countries with Granger-causation running from the capital account to the current account,
we test Granger-causality from each capital flow to the current account. For countries with
Granger-causation running from the current account to the capital account, we test Granger-
causality from the current account to each capital flow. Finally, for countries with bidirec-
tional Granger-causality, we run combined tests of Granger-causality from and to each capital
flow to and from the current account. The full results are presented in Appendix A-2. They
show that FDI Granger-causes the current account in seven countries (Algeria, Brazil, Costa
Rica, Peru, Rwanda, Singapore, and Venezuela) and is Granger-caused by the current account
in four countries (Algeria, Malta, Panama,. and Rwanda).
3 Explaining Causality Results
The results reported in Tables 1 and 2 display no evident patterns or country groupings. A
cursory inspection indicates that these classifications bear no relation to either location or
per capita income. However, there may be some feature or features of a country's economy,
specifically of its balance-of-payments regime, that are associated with particular causal
patterns. To investigate such possibilities, we ran logit and probit regressions to explain
the causal variables. The four dependent variables we examine are CA USKC for the capital
account Granger-causing the current account, CAUSCK for the current account Granger-
causing the capital account, CA USN for no Granger-causation between the capital and current

8
Table 2: Independent and Interdependent Foreign Direct Investment.
FDI Independent FDI Interdependent
Colombia Algeria
C6te d'Ivoire Argentina
Greece Barbados
Guatemala Bolivia-
Honduras Brazil
Indonesia Chile
Kenya Costa Rica
Malta Ecuador
Mexico Egypt
Nigeria El Salvador
Panama Jamaica
Paraguay Korea
Philippines Malawi
Saudi Arabia Malaysia
Suriname Mauritius
Swaziland Niger
Thailand Peru
Tunisia Portugal
Uruguay .Rwanda
Zambia Sierra Leone
Singapore
South Africa
Togo
Trinidad and Tobago
Turkey
Venezuela
9
Table 3: Potential Explanatory Variables for Direction of Balance-of-Payments Causation.
RESC - Article XIV status
RESD - Special rates for some or all capital transactions and/or some or all invisibles
RESE - More than one exchange rate for imports
RESF - More than one exchange rate for exports
RESG - Restrictions on current account payments
RESH - Restrictions on capital account payments
RESI - Import surcharges
RESJ - Advance import deposits
RESK - Surrender of export proceeds required
PCY - Natural logarithm of per capita income in U.S. dollars
YG - Rate of growth in real GNP
INF - Inflation (continuously compounded rate of change in GNP deflator)
OPEN - Exports plus imports as a proportion of GNP
FLY - Cumulated current account deficit as proportion of GNP
DETY - Foreign debt as a proportion of GNP
GBLY - Government deficit (-) as a proportion of GNP
DCGR - Net domestic credit to the government as a proportion of total domestic
credit
DCGY - Net domestic credit to the government as a proportion of GNP
BLA - Black market exchange rate premium
RR - Square of real interest rate
DCPY - Domestic credit to the private sector as a proportion of GNP
account, and FDIX for FDI being independent or exogenous. These variables take a value of
1 when a country exhibits the particular Granger-causation specified and 0 when it does not.
Since there were only four countries with bidirectional Granger-causation, these were treated
as positive for both CAUSKC and CAUSCK.
The potential explanatory variables are listed in Table 3. The first set of explanatory
variables consist of balance-of-payments restriction variables reported annually at the back
of the International Monetary Fund's Balance of Payments Yearbook. The variables RESC
10
to RESK take a value of 1 if the practice exists and 0 otherwise.
An informal principal components-type aggregation suggests that these variables might
be meaningfully summed in various combinations. Specifically:
RESU =RESC + RFSD + RFSE + RES + RES + RESH + RESI + RES + REK; (3)
RESV = RESD + RESE + RESF; (4)
RESW = RESG + RES; (5)
RESX = RSI + RESJ + RESK; (6)
RESY = RESI + RESJ; (7)
RESZ =RESG + RESI. (8)
The remaining explanatory variables include per capita income, real GNP growth, infla-
tion, the openness of the economy, two foreign debt variables, three measures of the govern-
ment's domestic borrowing requirements, and three indicators of distortions iin the domestic
economy. The three indicators of domestic distortions are the black market exchange rate
premium BLA, used as a proxy for the degree of foreign exchange liberalization, the square
of the real rate of interest RR, an indicator of the extent of financial repression or financial
distortion, and the ratio of private sector domestic credit to GNP DCPY, another indicator of
financial repression.
The functional form for the real interest rate follows a claim by Jos6 De Gregorio and
Pablo Guidotti (1992) that real interest rates are not a good indicator of financial repression
or distortion. Appealing to work by Guillermo Calvo and Fabrizio Coricelli (1991), they
suggest that the relationship between real interest rates and economic growth might resem-
ble an inverted U-curve: "Very low (and negative) real interest rates tend to cause financial
disintermediation and hence tend to reduce growth, as implied by the McKinnon-Shaw hy-
pothesis.... On the other hand, very high real interest rates that do not reflect improved
efficiency of investment, but rather a lack of credibility of economic policy or,various forms of
country risk, are likely to results in a lower level of investment as well as a concentration in
excessively risky projects" (De Gregorio and Guidotti 1992, 9). For this reason, De Gregorio
and Guidotti abandon real interest rates in favor of domestic credit to the private sector
divided by GNP DCPY.
11
Since there are 46 observations for each Granger-causation variable in Tables 1 and 2, we
chose for each country two alternative values for each variable listed in Table 3. The first
is the value in 1970 at the start of the observation period, the second is the average value
throughout the period 1970-1992. As no variable measured at its 1970 value provided any
predictive power, we report only estimates using average-:values.
The significant bivariate associations using these measures are shown in Table 4.5 On the
one hand, higher levels of both foreign and domestic indebtedness reduce the probability of
causation running from capital to current accounts and increase the probability that there is
no causation. On the other hand, a high rate of economic growth increases the probability of
causation running from current to capital account, while reducing the probability that there
is no causation. A higher ratio of private sector credit to GNP also increases the probability
of causation running from current to capital account.
The existence of restrictions on capital account payments reduces the probability of cau-
sation running from current to capital accounts. The existence of special exchange rates for
some capital account transactions reduces the probability that FDI is independent. Finally,
the probabilities of causation running from current to capital accounts and of FDI being in-
dependent of the current account are reduced in countries where export proceeds must be
surrendered to the monetary authorities. Table 4 suggests that the more liberal is a country's
foreign exchange system, the more likely is FDI to be exogenous or independent.
.4 Foreign Direct Investment and Capital Formation
Where FDI is not independent but Granger-caused by other capital inflows, one might rea-
sonably assume that FDI inflows would be less likely to increase capital formation than in
the case where FDI is independent. Hence we now estimate the impact of FDI on domes-
tic investment for countries in which FDI is independent and for countries in which FDI is
interdependent.
The investment function specified here in terms of the ratio of investment to GNP is
based on the flexible accelerator model. Mario Blejer and Mohsin Khan (1984, pp. 382-383)
describe some of the difficulties of estimating neoclassical investment functions for developing
5Multivariate estimates produced similar results, but multicollinearity considerably reduced coefficient
precision.
12
Table 4: Determinants of Causality.
Logit Model Probit Model
Dependent Explanatory Count Explanatory Count
Variable Constant Variable R2 Constant Variable R2
CAUSKC 1.139 -3.569(DETY) 0.683 0.700 -2.184(DETY) 0.683
(1.338) (-2.001) (1.356) (-2.090)
CAUSKC 0.316 17.524(GBLY) 0.644 0.195 10.728(GBLY) 0.644
(0.594) (1.785) (0.591) (1.844)
CAUSCK -2.902 6.171(DCPY) 0.804 -1.669 3.511(DCPY) 0.804
(-3.173) (2.322) (-3.441) (2.362)
CA USCK -2.397 33.793(YG) 0.783 -1.438 20.203(YG) 0.783
(-2.843) (1.899) (-3.037) (1.936)
CA USCK 0.180 -1.620(RESH) 0.761 0.107 -0.982(RESH) 0.761
(0.234) (-1.704) (0.224) (-1.707)
CA USCK 1.391 -2.809(RESK) 0.783 0.799 -1.661(RESK) 0.783
(1.110) (-2.021) (1.136) (-2.140)
CA USN 1.213 -38.535(YG) 0.696 0.747 -23.518(YG) 0.696
(1.811) (-2.301) (1.840) (-2.390)
CA USN -1.137 2.348(FLY) 0.622 -0.706 1.462(FLY) 0.622
(-1.988) (1.880) (-2.036) (1.932)
CAUSN -1.910 3.255(DETY) 0.732 -1.170 2.004(DETY) 0.732
(-2.336) (2.186) (-2.435) (2.273)
CAUSN -1.073 -16.881(GBLY) 0.622 -0.670 -10.609(GBLY) 0.622
(-1.944) (-1.870) (-1.998) (-1.918)
FDIX 0.265 -1.985(RESD) 0.587 0.164 -1.220(RESD) 0.587
(0.670) (-1.915) (0.667) (-1.993)
FDIX 1.947 -2.467(RESK) 0.630 1.216 -1.542(RESK) 0.630
(1.394) (-1.654) (1.465) (-1.732)
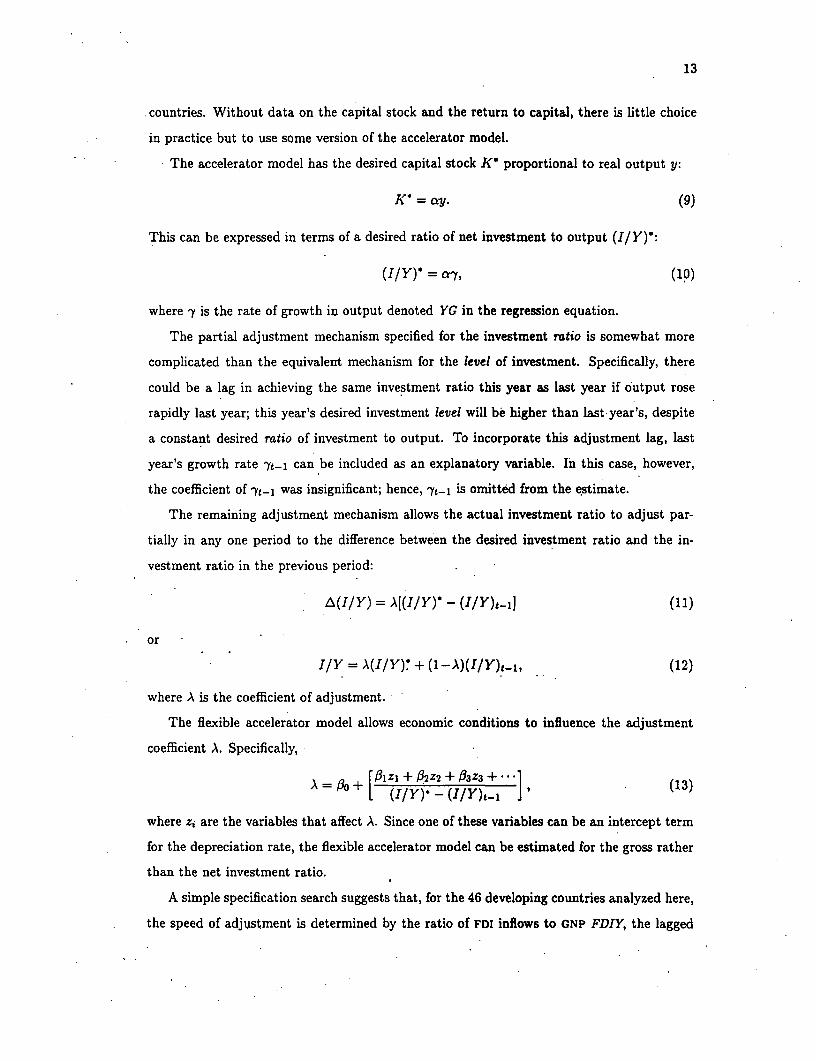
13
countries. Without data on the capital stock and the return to capital, there is little choice
in practice but to use some version of the accelerator model.
The accelerator model has the desired capital stock K' proportional to real output y:
K' = ay. (9)
This can be expressed in terms of a desired ratio of net investment to output (I/Y)':
(I/Y) = cr7, (10)
where y is the rate of growth in output denoted YG in the regression equation.
The partial adjustment mechanism specified for the investment ratio is somewhat more
complicated than the equivalent mechanism for the level of investment. Specifically, there
could be a lag in achieving the same investment ratio this year as last year if output rose
rapidly last year; this year's desired investment level will be higher than last year's, despite
a constant desired ratio of investment to output. To incorporate this adjustment lag, last
year's growth rate yt-1 can be included as an explanatory variable. In this case, however,
the coefficient of t-, was insignificant; hence, yt1 is omitted from the estimate.
The remaining adjustmeat mechanism allows the actual investment ratio to adjust par-
tially in any one period to the difference between the desired investment ratio and the in-
vestment ratio in the previous period:
A(I/Y) A >(I/Y)* - (IIY)_,- (11
or
I/Y = A(I/Y)* + (1-A)(I/Y)t.I, (12)
where A is the coefficient of adjustment.
The flexible accelerator model allows economic conditions to influence the adjustment
coefficient A. Specifically,
A = Po + jIzI + 02Z2 + f 3 Z3 +* ] (13)(I/Y)* - (/)-
where zi are the variables that affect A. Since one of these variables can be an intercept term
for the depreciation rate, the flexible accelerator model can be estimated for the gross rather
than the net investment ratio.
A simple specification search suggests that, for the 46 developing countries analyzed here,
the speed of adjustment is determined by the ratio of FDI inflows to GNP FDIY, the lagged
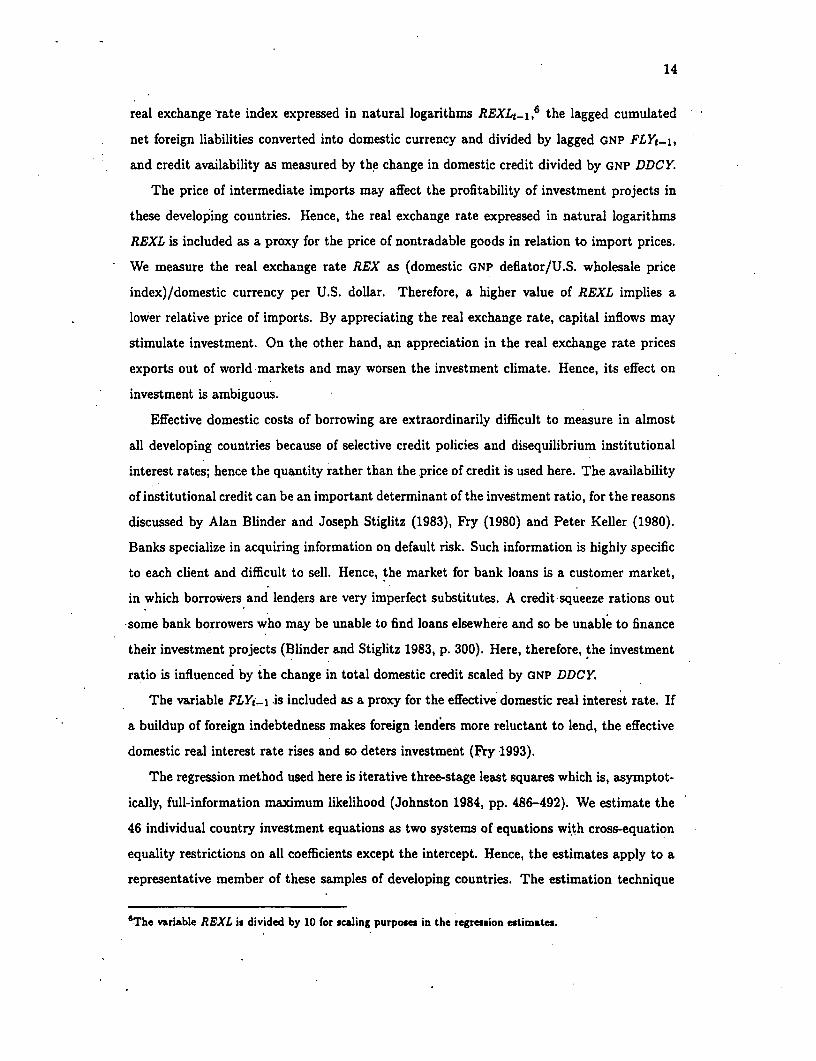
14
real exchange -rate index expressed in natural logarithms REXLt.1,6 the lagged cumulated
net foreign liabilities converted into domestic currency and divided by lagged GNP FLYt-1,
and credit availability as measured by the change in domestic credit divided by GNP DDCY.
The price of intermediate imports may affect the profitability of investment projects in
these developing countries. Hence, the real exchange rate expressed in natural logarithms
REXL is included as a proxy for the price of nontradable goods in relation to import prices.
We measure the real exchange rate REX as (domestic GNP deflator/U.S. wholesale price
index)/domestic currency per U.S. dollar. Therefore, a higher value of REXL implies a
lower relative price of imports. By appreciating the real exchange rate, capital inflows may
stimulate investment. On the other hand, an appreciation in the real exchange rate prices
exports out of world markets and may worsen the investment climate. Hence, its effect on
investment is ambiguous.
Effective domestic costs of borrowing are extraordinarily difficult to measure in almost
all developing countries because of selective credit policies and disequilibrium institutional
interest rates; hence the quantity rather than the price of credit is used here. The availability
of institutional credit can be an important determinant of the investment ratio, for the reasons
discussed by Alan Blinder and Joseph Stiglitz (1983), Fry (1980) and Peter Keller (1980).
Banks specialize in acquiring information on default risk. Such information is highly specific
to each client and difficult to sell. Hence, the market for bank loans is a customer market,
in which borrowers and lenders are very imperfect substitutes. A credit squeeze rations out
*some bank borrowers who may be unable to find loans elsewhere and so be unable to finance
their investment projects (Blinder and Stiglitz 1983, p. 300). Here, therefore, the investment
ratio is influenced by the change in total domestic credit scaled by GNP DDCY.
The variable FLYi-I .is included as a proxy for the effective domestic real interest rate. If
a buildup of foreign indebtedness makes foreign lenders more reluctant to lend, the effective
domestic real interest rate rises and so deters investment (Fry 1993).
The regression method used here is iterative three-stage least squares which is, asymptot-
ically, full-information maximum likelihood (Johnston 1984, pp. 486-492). We estimate the
46 individual country investment equations as two systems of equations with cross-equation
equality restrictions on all coefficients except the intercept. Hence, the estimates apply to a
representative member of these samples of developing countries. The estimation technique
6 The variable REXL is divided by 10 for scaling purposes in the regression estimates.
15
corrects for heteroscedasticity across country equations and exploits contemporaneously cor-
related disturbances. The instruments are the exogenous explanatory variables plus the
lagged FDI ratio, lagged domestic credit expansion divided by GNP, the lagged terms-of-trade
index in natural logarithms, lagged growth, the public sector borrowing requirement divided
by GNP, the world real interest rate, oil price inflation, and the rate of growth (continu-
ously compounded) in OECD output. The estimation period is 1970-1991 and the dependent
variable IY is gross domestic investment divided by GNP at current prices.
The first estimate is for the 20 countries in which FDI is independent (354 observations):7
1Y = 0.635FD1Y - 0.010FLY,_1 + 0.525DDCY
(10.548) (-2.933) (34.128)(14)
+ 0.037REXL t-1 + 0.386YG + 0.6401Yi_l.
(10.575) (27.781) (44.593)
R2 = 0.613 DW = 1.92
The corresponding estimate for the 26 countries with interdependent FDI is (513 observa-
tions):
1Y = 0.129FD1Y - 0.028FLY,_, + 0.003DDCY
(8.996) (-26.451) (0.596)* ~~~~~~~~~~~~~~(15)
- 0.012REXLt-1 + 0.174YG + 0.6581Y_I.
(-7.601) (29.339) (73.026)
R-0.806 DW = 2.10
The coefficient of FDIY, the ratio of FDI to GNP, is not only substantially but also significantly
higher for the country group in which FDI is independent of other balance-of-payments flows
than it is for the country group in which FDI is Granger-caused by some other balance-of-
payments flow. Hence, these estimates support our assumption that Granger-caused FDI
inflows are less likely to affect capital formation than independent FDI inflows.
7Saudi Arabia and Suriname were dropped because of data deficiencies, so reducing the number of countries
in this estimate to 18.
16
5 Conclusion
In this paper, we have examined the question of whether capital flows, particularly inflows
of foreign direct investment, Granger-cause current account deficits or vice versa. The initial
results produce considerable diversity. While Granger-causality runs from capital to current
accounts in some countries, it runs from current to capital accounts in others. We detect
bidirectional Granger-causality in some countries and no causality at all in others. Within
the capital account, three types of capital flows are Granger-caused by other flows in some
countries, while all three are independent of movements in other capital and current-account
flows in others. The six other possible combinations of Granger-causality among the three
types of capital flows are all detected. There are no signs of any predominant tendencies
among this sample of 46 developing countries.
Nevertheless, we are able to find variables that can predict the direction of Granger-
causality. High levels of both foreign and domestic indebtedness reduce the likelihood that
the capital account Granger-causes the current account and increase the likelihood of no
causality. Conversely, a high rate of economic growth raises the likelihood that the current
account Granger-causes the capital account and reduces the likelihood of no causality. A
higher ratio of private sector credit to GNP also increases the probability of causation running
from current to capital account.
The existence of restrictions on capital account payments reduces the probability of cau-
sation running from current to capital accounts. The existence of special exchange- rates for
some capital account transactions reduces the probability that FDI is independent. Finally,
the probabilities of causation running from current to capital accounts and of FDI being in-
dependent of the current account are reduced in countries where export proceeds must be
surrendered to the monetary authorities. The empirical results suggest that the more liberal
is a country's foreign exchange system the more likely is FDI to be exogenous or independent.
Finally, we find that when FDI is independent of other balance-of-payments flows it in-
creases capital formation in the host country by considerably more than it does when FDI is
Granger-caused by some other balance-of-payments flow. This finding is consistent with our
interpretation of the Granger-causality tests. Although FDI could still crowd out domestically
financed investment even if it were independent, we find that the majority of independent
FDI increases capital formation; for each $100 in FDI capital formation is increased by $64.
On the other hand, endogenous or interdependent FDI raises capital formation by only $13

17
for every $100 FDI inflow.

18
References
Blejer, Mario I. and Mohsin S. Khan (1984), "Government Policy and Private Investment
in Developing Countries," International Monetary Fund Staff Papers, 31(2), June 1984,
379-403.
Blinder, Alan S. and Joseph E. Stiglitz (1983), "Money, Credit Constraints, and Economic
Activity," American Economic Review, 73(2), May 1983, 297-302.
Calvo, Guillermo A. and Fabrizio Coricelli (1992), "Stagflationary Effects of Stabilization
Programs in Reforming Socialist Countries: Enterprise-Side vs. Household-Side Factors,"
World Bank Economic Review, 6(1), January 1992, 71-90.
Cockcroft, Laurence and Roger C. Riddell (1991), "Foreign Direct Investment in Sub-Saharan
Africa" (Washington, D.C., International Economics Department, WPS 619: World Bank,
March 1991).
De Gregorio, Jose, and Pablo E. Guidotti (1993), "Financial Development and Economic
Growth" (Washington D.C.: International Monetary Fund, July 1993).
Dooley, Michael P. (1990), "Comment" in Taxation in the Global Economy edited by Assaf
Razin and Joel Slemrod (Chicago: University of Chicago Press for the National Bureau
of Economic Research, 1990), 74-78.
Fry, Maxwell J. (1980), "Money, Interest, Inflation and Growth in Turkey," Journal of Mon-
etary Economics, 6(4), October 1980, 535-545.
Fry, Maxwell J. (1993), Foreign Direct Investment in Southeast Asia: Differential Impacts
(Singapore: Institute of Southeast Asian Studies, 1993).
Ghartey, Edward E. (1993), "Causal Relationship between Exports and Economic Growth:
Some Empirical Evidence in Taiwan, Japan and the U.S.," Applied Economics, 25(9),
September 1993, 1145-1152.
Hsiao, Cheng (1979), "Autoregressive Modeling of Canadian Money and Income Data," Jour-
nal of American Statistical Association, 74(367), September 1979, 553-560.
Johnston, John (1984), Econometric Methods, third edition (New York: McGraw-Hill, 1984).
Keller, Peter M. (1980), "Implications of Credit Policies for Output and the Balance of
Payments," International Monetary Fund Staff Papers, 27(3), September 1980, 451-477.
19
Meade, James E. (1951), The Theory of International Economic Policy. Volume 1: The
Balance of Payments (Oxford: Oxford University Press, 1951).
Montiel, Peter J. (1994),' "Capital Mobility in Developing Countries: Some Measurement
Issues and Empirical Estimates," World Bank Economic Review, 8(3), September 1994,
311-350.
Odaki, Mitsuhiro (1986), "Tests of Granger Causality by the Selection of the Orders of a
Bivariate Autoregressive Model," Economics Letters, 22(2-3), 1986, 223-227.
Turner, Philip (1991), Capital Flows in the 1980s: A Survey of Major Trends (Basel: Bank
for International Settlements, Monetary and Economic Department, BIS Economic Papers
No. 30, 1991).
Urbain, Jean-Pierre (1989), "Model Selection Criteria and Granger Tests: An Empirical
Note," Economics Letters, 29(4), 1989, 317-320.
World Bank (1993), "Global Economic Prospects and the Developing Countries" (Washing-
ton, D.C.: World Bank, 1993).
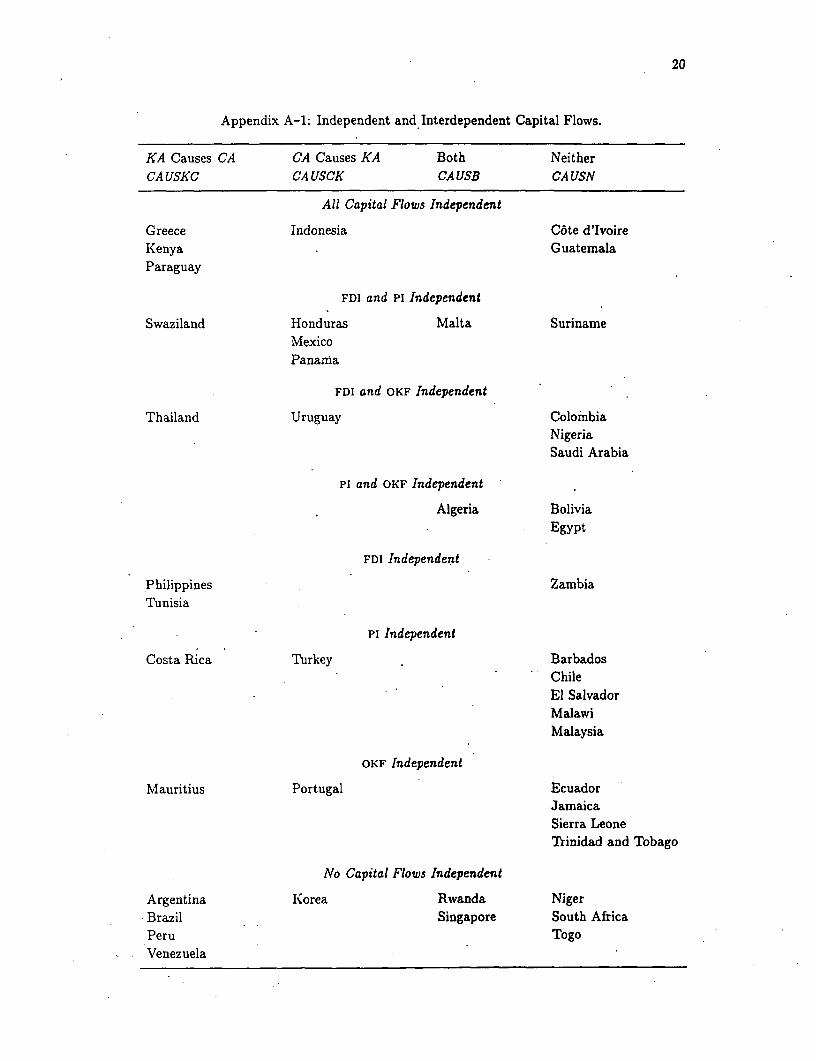
20
Appendix A-1: Independent and Interdependent Capital Flows.
KA Causes CA CA Causes KA Both NeitherCA USKC CA USCK CA USB CA USN
All Capital Flows Independent
Greece Indonesia C6te d'IvoireKenya GuatemalaParaguay
FDI and Pi Independent
Swaziland Honduras Malta SurinameMexicoPanama
FDI and OKF Independent
Thailand Uruguay ColombiaNigeriaSaudi Arabia
Pi and OKF Independent
Algeria BoliviaEgypt
FDI Independent
Philippines ZambiaTunisia
PI Independent
Costa Rica Turkey BarbadosChileEl SalvadorMalawiMalaysia
OKF Independent
Mauritius Portugal EcuadorJamaicaSierra LeoneTrinidad and Tobago
No Capital Flows Independent
Argentina Korea Rwanda NigerBrazil Singapore South AfricaPeru TogoVenezuela
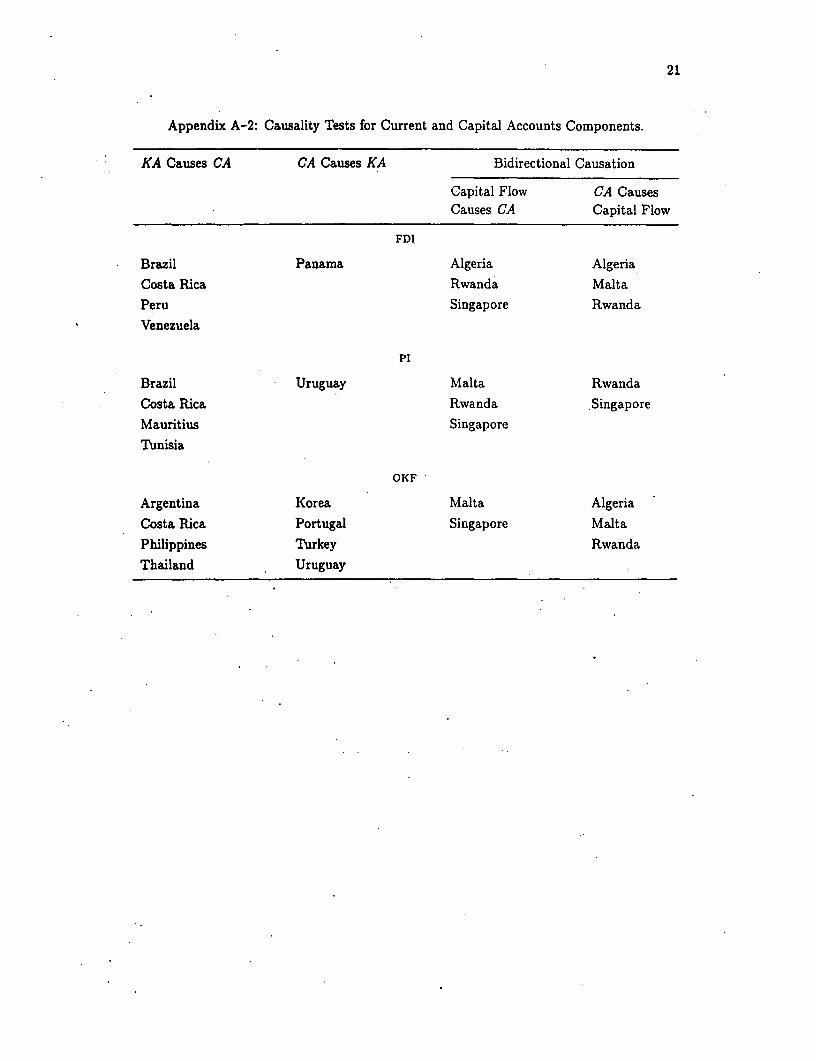
21
Appendix A-2: Causality Tests for Current and Capital Accounts Components.
KA Causes CA CA Causes KA Bidirectional Causation
Capital Flow CA CausesCauses CA Capital Flow
FDI
Brazil Panama Algeria Algeria
Costa Rica Rwanda MaltaPeru Singapore Rwanda
Venezuela
Pi
Brazil Uruguay Malta Rwanda
Costa Rica Rwanda SingaporeMauritius Singapore
Tunisia
OKF
Argentina Korea Malta Algeria
Costa Rica Portugal Singapore Malta
Philippines Turkey Rwanda
Thailand Uruguay
Policy Research Working Paper Series
ContactTitle Author Date for paper
WPS1503 Africa's Growth Tragedy: A William Easterly August 1995 R MartinRetrospective, 1960-89 Ross Levine 39120
WPS1504 Savings and Education: A Life-Cycle Jacques Morisset August 1995 N. CuellarModel Applied to a Panel of 74 Cesar Revoredo 37892Countries
WPS1505 The Cross-Section of Stock Returns: Stijn Claessens September 1995 M_ DavisEvidence from Emerging Markets Susmita Dasgupta 39620
Jack Glen
WPS1506 Restructuring Regulation of the Rail loannis N. Kessides September 1995 J. DytangIndustry for the Public Interest Robert D_ Willig 37161
WPS1507 Coping with Too Much of a Good Morris Goldstein September 1995 R.VoThing: Policy Responses for Large 31047Capital Inflows in Developing Countries
WPS1508 Small and Medium-Size Enterprises Sidney G. Winter September 1995 D. Evansin Economic Development: Possibilities 38526for Research and Policy
WPS1509 Saving in Transition Economies: Patrick Conway September 1995 C. BondarevThe Summary Report 33974
WPS1510 Hungary's Bankruptcy Experience. Cheryl Gray September 1995 G. Evans1992-93 Sabine Schlorke 37013
Miklos Szanyi
WPS151 1 Default Risk and the Effective David F. Babbel September 1995 S. CocaDuration of Bonds Craig Merrill 37474
William Panning
WPS1512 The World Bank Primer on Donald A. Mclsaac September 1995 P. lnfanteReinsurance David F. Babbel 37642
WPS1513 The World Trade Organization, Bernard Hoekman September 1995 F. Hatabthe European Union. and the 35835Arab World: Trade Policy Prioritiesand Pitfalls
WPS1514 The Impact of Minimum Wages in Linda A. Bell September 1995 S. FallonMexico and Colombia 38009
WPS1515 Indonesia: Labor Market Policies NishaAgrawal September 1995 WDRand International Competitiveness 31393
WPS1516 Contractual Savings for Housing: Michael J. Lea September 1995 R GarnerHow Suitable Are They for Bertrand Renaud 37670Transitional Economies?

Policy Research Working Paper Series
ContactTitle Author Date for paper
WPS1517 Inflation Crises and Long-Run Michael Bruno September 1995 R. MartinGrowth William Easterly 39120
WPS1518 Sustainability of Private Capital Leonardo Hernandez October 1995 R. VoFlows to Developing Countries: Heinz Rudolph 31047Is a Generalized Reversal Likely?
WPS1519 Payment Systems in Latin America: Robert Listlield October 1995 S. CocaA Tale of Two Countries - Colombia Fernando Montes-Negret 37664and El Salvador
WPS1520 Regulating Telecommunications in Ahmed Galal October 1995 P. Sintim-AboagyeDeveloping Countries: Outcomes, Bharat Nauriyal 38526Incentives. and Commitment
WPS1521 Political Regimes, Trade, and Arup Banerji October 1995 H. GhanemLabor Policies Hafez Ghanem 85557
WPS1522 Divergence, Big Time Lant Pritchett October 1995 S. Fallon38009
WPS1523 Does More for the Poor Mean Less Jonah B. Gelbach October 1995 S. Fallonfor the Poor? The Politics of Tagging Lant H. Pritchett 38009
WPS1524 Employment and Wage Effects of Ana Revenga October 1995 A. RevengaTrade Liberalization: The Case of 85556Mexican Manufacturing
WPS1525 Is Ethiopia's Debt Sustainable? Ejaz Ghani October 1995 A. NokhostinHyoungsoo Zang 34150
WPS1526 Do We Face a Global "Capital Zia Qureshi October 1995 V. BarretoShortage"? 87216
WPS1527 Foreign Direct Investment, Other Maxwell J. Fry October 1995 R. VoCapital Flows, and Current Account Stijn Claessens 33722Deficits: What Causes What? Peter Burridge
Marie-Christine Blanchet