Embed Size (px)
Citation preview

55
Section I
Foreign Direct Investment Policies in India since
Independence
India has introduced many policy reforms to attract FDI. Restrictive investment regimes
have been liberalized. In addition, various types of incentives are being offered to attract
foreign direct investment. Greater attention is being paid to make the macro-economic
environment more conducive to foreign investors. Provision of infrastructure and other
support services are being targeted, financial sector reforms are being undertaken to
facilitate financial flows in various forms.
Changes in policy frameworks in India dealing with FDI inflows could be studied in four
phases viz.
(i) "Cautions Welcome Policy" from independence to the emergence of crisis in the
late sixties (1948-66).
(ii) "Selective and Restrictive Policy" from 1967 till the second oil crises in 1979.
(iii) "Partial Liberalization Policy" from 1980 to 1990 with progressive attenuation of
regulations; and
(iv) "Liberalization and open door policy" since 1991 onwards signifying liberal
investment environment.
Each policy swing in some sense reflects the government's particular type of responses to
the foreign exchange crisis in the respective periods, though many factors may have been
at work causing the policy swings. The point of emphasis is that, the undercurrent of
balance of payments crisis plays important role in shaping the country's attitude and
policy towards foreign investments.
To illustrate, the initial caution on foreign investment began to loose its rigidity with the
onset of foreign exchange crisis of 1957-58 and the government began to relax its stance
towards foreign direct investment. Thus, there was an increase in the number of foreign
collaboration approvals.
As the foreign exchange situation assumed drastic proportions in the late sixties and there
were increased outflows on account of foreign collaborations, the government began to
take a restrictive stance on foreign collaboration. In particular, the enactment of Foreign

56
Exchange Regulation Act (FERA), 1973 became the key to guiding and controlling FDI
inflows. Thus, came into being the phase of light regulation and selective policy in the
seventies. A highly restrictive and selective policy implemented by an administrative
system based on discretionary power prevailed through the seventies.
In the wake of the second oils crisis and India's failure to boost its manufactured exports,
the foreign exchange position began to deteriorate by the early eighties. The government
adopted a multi-pronged strategy for promotion of exports, including encouraging TNCs
to undertake export oriented manufacturing. The eighties thus, witnessed selective efforts
to attract FDI especially, in high technology areas and exports. Many restrictions on large
houses and FERA companies were removed signalling a less restrictive policy
environment for private investment including foreign investment. The eighties were in a
way, the forerunners of the liberalization policy of the nineties.
As the economy slipped into serious external crisis at the beginning of the nineties, the
response of the government was to go in for comprehensive macro-economic and
structural adjustment with economic reforms and globalization as the key elements, since
July 1991. This phase in India foreign collaboration policy is characterized by
transparency and openness and is intended to increase foreign direct investment. The
degree of openness is seen in terms of the entire policy on (i) sectors open to FDI, (ii)
level of foreign equity participation, (iii) transparency in approval procedures.
Phase - I 1948 to 1966: The period of "Cautions Welcome Policy"
India lacked a policy of its own on foreign capital before independence 'because' it
derived its faith in total laissez faire from the British Government. Resultantly, foreign
enterprises found it convenient to export products to India and were justified by local
circumstances to set-up branches or wholly owned subsidiaries.
Local entrepreneurs, which did not have many prospects for obtaining foreign
collaboration, set up industrial units without foreign collaborators as in the case of cotton
textiles, cement and paper or obtained the services of foreign consultants as in the case of
steel (Tata Iron and Steel Company).
The advent of independence brought into focus the various issues involved in the import
of foreign capital and expertise into the country and the need for defining a policy with
respect to foreign investment. The new independent government had specific views on

57
industrialization and role of foreign capital. This was reflected in the first policy
document, Industrial Policy Resolution of 1948.
The Industrial Policy Resolution of 1948 recognized that participation of foreign capital
and enterprise, particularly as regards industrial techniques and knowledge would be of
value for the rapid industrialization of the country. However, it was necessary that the
conditions under which foreign capital could participate in Indian industry should be
carefully regulated in national interest. As a rule, the major interest in ownership and
effective control would normally be in Indian hands though, provision was made for
special cases in a manner calculated to serve the national interest.
It was stated by the Prime Minister Sh. Jawahar Lal Nehru in April, 1949 that once
foreign investment is allowed in our country, it would be given non-discriminatory
treatment. Firms with foreign investment would be treated at par with Indian firms. There
was assurance for free remittance of profits, dividends, and interest as well as repatriation
of capital. In case of nationalization, fair and equitable compensation was to be given to
foreign investors.
In the mid 1950's when industrialization got underway foreign capital ventured into India
primarily with technical collaboration. However, the foreign exchange crisis of 1958
marked a change in foreign collaboration in India in two ways (i) foreign enterprise
began to take equity participation more frequently, (ii) more of technical collaborations
started to accept equity participation in lieu of royalties and fees. After 1958, Indian
entrepreneurs were given provisional license required to secure part or all of the foreign
exchange by way of foreign investment. The government extended the AID investment
Guarantee Program to cover American private investment in India. It gave a number of
tax concessions to foreign enterprises. The licensing procedure was streamlined to avoid
delays in approvals of foreign collaboration. Double taxation avoidance agreements with
Finland, France, USA, Pakistan, Ceylon, Sweden, Norway, Denmark, Japan and West
Germany were signed.
In 1963-64 the Government of India decided to give ‘letters of intent’ to foreign
companies to proceed with their capital projects, instead of making the foreign company
find an Indian partner and then give the 'letter of intent' to the Indian partner. It was also

58
decided to make the services of IDBI available for rupee finance required by such
undertakings.
The Finance Act, 1965 made provision for certain additional tax concessions. The interest
accruing in a Non Resident Account on money transferred from abroad through
recognized banking channels and deposited in any bank in India was exempted from tax.
Also the tax exemption limit of 5 years allowed in respect of salaries of foreign
technicians was extended to 7 years. Tax rates on income assessable in India of non
residents were brought down at par with those applicable to income of residents. The rate
of deduction of tax at source from non resident income was also lowered. The act further
provided for the refund of capital gains tax arising from the transfer of shares held by non
resident in an Indian Company, provided the sale proceeds were invested in India.
In May 1966, the government decided that investments by NRIs would be allowed
without any limit in public limited industrial concerns in India. In private limited
industrial concerns with a minimum issued and paid up capital of Rs. 10 lacs, their share
would be allowed upto 49 percent. In special cases, it would be increased to 51 per cent
or even more, provided resident Indian participation would go up to 49 percent within a
period of, say 5 years. But they would not be allowed to invest in proprietorship /
partnership and dividends would not be allowed to be repatriated.
Phase - II - 1967-79: The Period of Selective and Restrict Policy
Under the new industrial licensing policy announced in February, 1970 the larger
industrial houses and foreign enterprises were permitted to set up industries in the 'core'
and the 'heavy investment' sectors except industries reserved for the Public Sector. By
notification dated July 25, 1970, they established undertakings and expanded production
in industries and other sectors, provided they undertook specific export commitments.
However, in order to prevent a serious draft on their reserves, the remittance facilities in
respect of dividends declared by 100 percent foreign owned companies were subjected to
some terms.
In 1972-73, though the Government Policy towards foreign investment continued to
attract foreign investment in India, the policy became highly selective. Foreign Exchange
Regulation Act (FERA) was amended in 1973, to regulate the entry of foreign capital in
the form of branches, non-resident Indian investment and employment of foreigners in

59
India. As per the amended rules all branches of foreign companies in India and Indian
Joint Stock Companies in which non resident interest was more than 40 percent were
expected to bring down their non resident share holdings to 40 percent within a period of
2 years.
However, basic and core industries, export oriented industry or industries engaged in
manufacturing activities needing sophisticated technology or tea plantation industry were
allowed to carry on business with non resident interest with permission from RBI
provided they did not exceed the licensed capacity and undertook no expansion or
diversification of activities. Foreign shipping companies were given permission to carry
on business in India in October, 1974.
With a view to encourage investment by non resident Indians, in October 1975, the
government decided to permit non resident Indians and persons of Indian origin to invest
in the equity capital of permitted industries up to a maximum of 20 percent of new issues
of capital of new Industries. Such investments were made by remittances from abroad
through approved banking channels or out of funds held in Non Resident (external)
Account. The investment could be in addition to any foreign equity investment that could
be permitted by the government in the company concerned.
In October 1976, the scheme under which non-resident Indians were allowed to start
industrial units in India by bringing in imported machinery was liberalized to permit
equity investment up to 74 percent without any minimum limit in a number of priority
sector industries. The permission was also granted for investment in other industries
provided the investor undertook to export 60 percent of the output (75 percent in case of
industries reserved for small scale sector). The scheme was applicable only to new units
and to existing industrial undertaking seeking expansion and diversification. Capital
invested under the scheme was eligible for repatriation after the unit had gone into
commercial production subject to adherence to export obligation.
A statement on industrial policy was presented by the Government to Parliament on
December 23, 1977. Under this statement, foreign investment acquisition of technology
necessary for India’s industrial development could be allowed where they were in
national interest and on terms determined by the government. As a rule of majority
interest in ownership and effective control could be in Indian hands except in highly

60
export oriented and sophisticated technology areas and 100 percent export oriented areas.
Where foreign investment had been approved, there could be complete freedom of
remittance of profits, royalties, dividends and repatriation of capital subjected to the usual
regulations. The government had made it clear that while it would strictly enforce the
provisions of FERA, the companies who diluted their non resident holdings to less than
40 percent would be treated at par with Indian Companies, except in cases specifically
notified. Their future expansion would be guided by the same principles as those
applicable to Indian companies.
In terms of the said policy the government prepared a revised illustrative list of industries
where no foreign collaboration, technical or financial was considered necessary due to
development of indigenous technology.
Phase - III - 1980-90: The Period of 'Partial Liberalization'
In order to tap the resources from Oil Exporting Developing Countries, the government
revised the foreign investment policy in October 1980 so that investment proposals from
these countries need not be associated with transfer of technology and that such
investment could be of a portfolio nature. However, a ban was imposed by the
government on financial and technical collaboration in 22 categories of industries such as
cement, paper, consumer goods and others sufficiently developed within the country.
In the 1982-83, the government liberalized facilities with regard to bank deposits and
investments in equity shares of the corporate sector. These facilities were further
liberalized in July-August, 1982 to cover preference shares and debentures issued by
Indian Companies. The Reserve Bank of India also simplified the exchange control
procedural formalities to facilitate such investments. The government also decided to
borrow from international capital markets to the extent that the availability of the low
cost unilateral and bilateral resources fell short of the requirement of external resources.
In line with this policy, Indian enterprises both public and private companies had been
selectively permitted to raise funds aboard. However, the facilities available for deposits
in non resident account and in shares of Indian companies were confined to non resident
individuals of Indian nationality or origin. Liberalized facilities were extended to
overseas companies, partnership firms, trusts, societies and other corporate bodies in

61
which at least 60 percent of the ownership/ beneficial interest were vested in non-resident
individuals of Indian nationality or origin.
It was specified that in case of investment, with reparability, by non residents Indians and
overseas corporate bodies can make portfolio investment through stock exchanges in
India in equity/ preference shares and convertible/ non-convertible debentures without
any limit on the quantum or value. They could also invest in the new issues of public or
private limited companies in any business activity (except real estate business) up to 100
percent of the issued capital without any obligation to associate resident Indian
participation in the equity capital at any time. Payment for purchases, either through
stock exchanges or for direct investment in new issues could be made by the eligible
investor either (a) by fresh remittances from aboard or (b) out of the funds held in non-
resident external accounts designated in rupees or in foreign currencies and ordinary non-
resident accounts.
In 1983-84 the government provided the incentives in the form of:
(i) Taxation of investment income derived by a non resident of Indian nationality or
Indian origin from the specified investments and long term capital gains arising
out of transfer of these assets at a flat rate of 20 percent, plus surcharge of 12.50
percent of such income tax,
(ii) Exemption of long term capital gains arising from the transfer of any foreign
exchange assets,
(iii) Exemption from wealth tax of the value of foreign exchange assets acquired and
held by non resident Indian.
(iv) Exemption from gift tax of gifts of foreign exchange assets by non residents
Indian’s to their relatives in India.
(v) Additional interest of 1 percent on investments by NRIs in the 6 year NSCs would
be paid provided subscription for these certificates were received in foreign
currency.
In May, 1983 relaxations granted to NRIs investment were subjected to a specific limit.
An overall ceiling of: (a) 5 percent of the value of the total paid up equity of the
company concerned, (b) 5 percent of the total paid up value of each series of convertible

62
debentures was fixed on purchases of equity stock exchanges on repatriation and non
repatriation basis together.
In 1985-86, the government abolished the Estate Duty, which was considered as one of
the major hurdles in the way of inward remittances to India by non residents of Indian
nationality or origin. The surcharge on income tax was also abolished bringing down
effective rate of tax on NRI income form 22.5 percent to 20 percent.
During 1986-87, the government permitted NRIs to subscribe to the Memorandum and
Articles of Association of a new company and take up their share up to the face value of
Rs. 10,000 for the purpose of its incorporation. It also permitted Indian companies with
more than 40 percent non resident interest to acquire immovable properties in India.
Further, NRIs were allowed to invest: (i) upto 100 percent of the equity capital in sick
industrial units (ii) in new issues of Indian shipping companies under the 40 percent
scheme, and (iii) in diagnostic centres in India under 40 percent or 74 percent scheme.
The government also decided to remove the quantitative ceiling of Rs. 40 lacs for making
investment in India by NRIs in private limited companies under the 40 percent scheme.
With a view to augmenting the inflows, the Foreign Currency (NR) Account Scheme was
extended to cover DM and yen and a differential interest rate scheme was introduced with
effect from August 1, 1988.
Phase - IV - 1991 and onwards: The Period of "Liberalization and Open Door
Policy"
As a part of the structural adjustment policies introduced in the Indian economy by the
Government of India (GOI) since July 1991, policies relating to foreign financial
participation in Indian companies and those relating to foreign technology agreements
had also undergone a radical change. Three tiers for approving proposals for foreign
direct investment in the country were introduced:
(i) The Reserve Bank's automatic approval system.
(ii) Secretariat for industrial approvals for considering proposals within the general.
(iii) Foreign Investment Promotion Board specially created to invite, negotiate and
facilitate substantial investment by international companies that would provide
access to high technology and world markets.

63
In case of investment with benefits of repatriation of capital and income, NRIs and OCBs
were permitted to make investment in shares and debentures through stock exchange upto
1 percent of the paid up value of equity/ preferences and convertible debentures of the
company. No limit either on quantum or value was stipulated with regard to purchases of
non convertible debentures. With the benefit of repatriation, investment in new capital
increased with repatriation benefit. They could also invest in the capital raised other than
through prospectus upto 40 percent of the new issues of non-convertible debenture were
allowed without any monetary limit. However, in case of new issue of shares and
convertible debenture through prospectuses, they could invest upto 40 percent of the new
issue of shares or convertible debentures of any company (public or private), subject to a
quantitative ceiling of Rs. 40 lacs. The liberalized facility of direct investment by NRIs
was confined only to capital raised by Indian companies for setting up new industrial
projects or for expansion / diversification of existing industrial undertaking. However,
with the abolition of the list of industries which were not open for direct investment by
non residents and with the addition of the hotel industry, the scope for investment by
NRIs had been widened.
NRIs and OCBs had also been permitted to invest in 12 percent, 6 year NSCs and it was
exempted from wealth, income and gift taxes. The Government of India (GOI) permitted
equity share holding of foreign investors to be maintained at a level of 51 percent or
below. It was the same level of foreign equity, which the foreign majority companies had
been allowed under the FERA, even when there was a likelihood of its reduction as a
result of exercise of convertibility clause option.
As per the new policy, fully owned foreign enterprises were allowed to set up giant
power projects without the requirement to balance dividend payments with export
earnings. FERA companies (those having more than 40 percent foreign equity) were
treated at par with Indian companies. FERA companies were also given the facility of 51
percent equity. Companies could use foreign brand names and trademarks on goods for
sale within the country. Except for 22 industries in the consumer goods sector, the earlier
stipulation of that dividend remittances of companies receiving approval under the
foreign equity upto 51 percent scheme must be balanced by export earnings over a period
of 7 years, was scrapped in respect to all foreign direct investment including NRIs and

64
OCBs. The foreign private equity in oil refineries was limited at 26 percent. Foreign
Institutional Investors (FIIs) were permitted to invest in all the securities traded on
primary and secondary markets. Portfolio investments in primary and secondary markets
were subjected to a ceiling of 24 percent of the issued share capital for the total holdings
of all registered FIIs, in any company. The holding of a single FII in any company was
subjected to a ceiling of 5 percent of total issued capital. NRIs/OCBs could invest with
full repatriation benefits upto 100 percent in high priority industries and export-oriented
industries and sick units and power generation. In the context of such revisions, the
earlier 74 percent scheme has been discontinued.
During 1993-94 the tax rate on short term capital gains were reduced from 75 percent to
30 percent. An Electronic Hardware Technology Park (EHTP) scheme was set- upto
allow 100 percent equity participation, duty free import of capital goods and a tax
holiday. The ceiling on foreign equity participation in Indian companies engaged in
mining activity was hiked to 50 percent. Disinvestment by foreign investors was
permitted on a near automatic basis in stock exchanges in India through a registered
merchant banker or a stock broker or on private basis. NRIs (but not OCBs) were allowed
to invest upto 100 percent on non repatriation basis in any partnership / sole
proprietorship or in private / pubic limited companies (except in agricultural or plantation
activities) without RBI's approval.
In 1994-95, the Reserve Bank of India decided to allow NRIs/ OCBs and also Flls, to
invest in all activities except agriculture and plantation activities on a repatriation basis.
The aggregate allocation of shares / convertible debentures qualifying for repatriation
benefits to such non residing investors could not exceed 24 percent of the new issue.
However, FIIs were not eligible to make investment in unlisted/ private limited
companies under the scheme. The funds for such investment could be received by way of
remittance from abroad through normal banking channels or by debit to NRI/ FCNR
account of the non resident investor. A general permission was also granted to NRIs/
OCBs to purchase the shares on repatriation basis of Public Sector Enterprises (PSEs)
disinvested by Central Government subject to 1 percent of the paid up capital of the PSE
concerned.

65
With effect from May 24, 1995 the permission was given to Euro issuing companies to
retain the Euro issue proceeds a foreign currency deposits with the Bank's and Public
Financial Institutions in India, which could be converted into Indian rupee only as and
when expenditure for the approved end used were incurred. With effect from November
25, 1995 companies were permitted to remit funds into India in anticipation of the use of
funds for approved end uses. Moreover the existing ceiling for the use of issue proceeds
for general corporate restructuring, including working capital requirements were raised
from 15 percent to 25 percent of the GDR issues.
During 1996-97, Flls were allowed to invest upto 100 percent of their funds in debt
instruments of Indian companies effectively from January 15, 1997. With effect from
March 8, 1997, Flls were allowed to invest in Government of India (GOI) dated securities
upto 30 percent. Under the automatic route, the ceiling for lump sum payment of
technical know-how fee had been increased from Rs. 1 crore to US $ 2 million with
effect from November 5, 1996.
During 1997-98 foreign direct investment was allowed into sixteen non - banking
financial services through the Foreign Investment Promotion Board. Expanding the scope
of 'automatic route' for foreign direct investment, the Government of India approved 13
additional categories of Industries/ items 51 percent of the equity. There were 3 items
relating to mining activities upto 50 percent foreign equity participation and 9 categories
of industries/ activities upto 74 percent foreign participation.1
As a part of the liberalized policy the RBI had decided to permit foreign banks operating
in India to remit their profits or surplus to their head offices without the approval of the
Reserve Bank. The Reserve Bank also allowed branches of foreign companies operating
in India to remit profits to their head offices without the prior approval of Reserve Bank.
Also the Authorized Dealers were permitted to provide forward cover to Flls in respect of
their fresh investment in equity in India as well as to cover the appreciation in the marked
value of their existing investments in India w.e.f. June 12, 1998. The Authorized Dealers
were given the option of extending the cover fund wise or FII - wise according to their
operational feasibility. The same facility was extended to NRIs/ OCBs for their portfolio
investments w.e.f. June 16, 1998.

66
As per the 1997-98 guidelines the individual and aggregate portfolio investment ceiling
for NRIs/ OCBs/ PIOs could be exclusive of the individual portfolio investment ceiling
of 10 percent and aggregate portfolio investment ceiling of 30 percent of the paid up
capital for Flls. The aggregate investment ceiling for NRIs/ OCBs/ PIOs could be 10
percent of the paid up capital of companies listed on stock exchanges. The ceiling could
be raised to 24 percent of the paid up capital by passing a General Body Resolution to
that effect. The investment limit by a single NRI/ OCB/ PIO in the shares of a company
under the portfolio investment scheme could continue to be 5 percent of the paid up
capital. As per the Reserve Bank of India guidelines, Indian Companies did not require
the Bank's permission for the purpose of receiving inward remittance and issue of shares
to NRI/ OCB investors under the 100 percent scheme.
In August 1999, a Foreign Investment Implementation Authority (FllA) was established
within the Ministry of Industry in order to ensure that approvals for foreign investments
(including NRI investments) were quickly translated into actual investment inflows and
that proposals fructify into projects. In particular, in cases where FlPB clearance was
needed, approval time was reduced to 30 days.
With a view to expand the Flls category, the government had permitted foreign corporate
and high net worth individuals to invest through SEBI registered Flls. Such investments
were subjected to a sub limit, for Fll portfolio investments, of 24 percent in a single
company. The government also permitted SEBI registered domestic fund managers to
manage foreign funds for investment in the Indian capital market through the portfolio
investment route provided the funds were channelled through internationally reorganized
financial institutions and subject to the reporting requirements as applicable to Flls.
In March 1999, the RBI issued a notification granting general permission to Mutual
Funds for issuing units to NRIs/ PIOs/ OCBs subject to certain specified norms, thereby
dispensing with the existing procedure of obtaining prior permission. In addition, the RBI
simplified the approval in respect of NRI/ PIOs/ OCBs by granting them general
permission in lieu of a case by case approval procedure in a large number of areas. This
included acceptance of deposits from Indian companies, investment in Air Taxi
Operations, sale of shares in stock exchanges, transfer of shares / bonds / debentures and
immovable property to charitable trusts / organizations in India as gift, rising of loans by

67
resident individuals / proprietorship concerns on non-repatriable basis, issue of
commercial papers by Indian companies to NRIs, etc.
Foreign owned Indian holding companies were hitherto required to obtain prior approval
of the FlPB for downstream investment. They had been permitted to make such
investments within permissible equity limits through the automatic route provided such
holding companies bring in the requisite funds from abroad. Also, the need to obtain prior
approval of the FlPB for increasing foreign equity within already approved limit had been
dispensed with in all cases where the original project cost was up to Rs. 600 crore.
Considering the enhanced opportunities for Indian software companies to expand
globally, operational norms governing their overseas investments and mode of financing
acquisition of overseas software companies which are listed in foreign exchanges and has
already floated ADR/ GDR issues, to acquire foreign software companies and issue
ADRs/ GDRs, need not to refer to the Government of India or the Reserve Bank of India
upto the value limit of US $ 100 million. For acquisitions beyond US $ 100 million,
proposals would require examination by a Special Composite Committee in the RBI.
With a view to further liberalize the operational guidelines for ADR/ GDR issues, it was
decided to dispense with the track record scrutiny process for ADR/ GDR issues and the
two stage approval by the Ministry of Finance. Indian companies would henceforth be
free to access to ADR/ GDR markets through an automatic route without the prior
approval of the Ministry of Finance subject to the specified norms and post issue
reporting requirement. As ADR/ GDR are reckoned as part of FDI, such issues would
need to conform to the existing FDI policy and permissible only in areas where FDI is
permissible. Such ADR/ GDR issues would however, be governed by the mandatory
approval requirements under the FDI policy.
An Insurance Regulatory and Development Act (IRDA) was passed by Parliament in
December, 1999. The Act, which seeks to promote private sector participation in the
insurance sector permits foreign equity state in domestic private insurance companies
upto a maximum 26 percent of the total paid up capital.2
In February 2000, the government took a major decision to place all items under the
automatic route for FDI/ NRI/ OCB investment except for a small negative list. The
negative list included the following: (i) items requiring on industrial license under the

68
industries (Development and Regulation) Act, 1951 (ii) foreign investment being more
than 24 percent in the equity capital of units manufacturing items reserved for small scale
industries; (iii) all items requiring industrial license in terms of the locational policy
notified under the new industry policy of 1991; (iv) proposals falling outside notified
sectoral policy/ caps or under sectors in which FDI is not permitted and/or applications
chosen to be submitted through FIPB rather than automatic route by the investors. This is
an important step to dispense with case by case approval procedure and to impart greater
transparency in the process of foreign investment.3
Furthermore, subject to sectoral policies and sectoral caps the automate route that would
be available to all foreign and NRI investors with the facility to bring in 100 percent FDI/
NRI/ OCB investment. All proposals for investments in public sector units, as also for
EOU/ EPZ/ EHTP/ STP units would qualify for automatic approval subject to the
aforesaid parameters.
ECB guidelines in 1999-2000 where further liberalized and procedures streamlined to
facilitate better access to international financial markets, keep maturates long, costs low
and encourage infrastructure and export sector financing.
In the monetory and credit policy measures announced by the RBI for the second half of
1999-2000, the minimum maturity of FCNR (A) deposits has been raised to one year
from six months to minimize the country's short term external borrowing liabilities. At
the same time, the requirement by banks to maintain an incremental CRR of 10 percent
on increase in liabilities over the level as on April 11, 1997 has been withdrawn.
During the year 2000-2001, FDI upto 100 percent has been permitted in e-commerce,
subject to specific conditions. The dividend balancing condition for FDI in twenty two
consumer goods industries has been removed. The upper limit of Rs. 1500 crores for FDI
in project involving electricity generation, transmission and distribution has been
dispensed with. The ceiling for FDI under the automatic route in oil refining has been
liberalized to 100 percent from 49 percent. The limit has been raised to 100 percent for
all manufacturing activities in Special Economic Zones also. Foreign equity participation
upto 26 percent has been allowed in the insurance sector subject to the issue of necessary
license by the Insurance Regulatory and Development Authority. 100 percent FDI has
also been allowed in the telecommunications sector for internet service providers (ISPs)

69
not providing gateways, infrastructure providers providing dark fiber, electronic mail and
voice mail.4
FDI upto 100 percent is permitted in airports with FDI above 74 percent requiring prior
approval of the Government. The defence industry sector is also opened upto 100 percent
for Indian Private sector participation with FDI permitted upto 26 percent, both subject to
licensing. FDI upto 100 percent is permitted with prior approval of the Government in
courier services. FDI upto 100 percent is permitted on the automatic route for Mass
Rapid Transport System in all metropolitan cities, including associated commercial
development of real estate. FDI upto 100 percent is placed on the automatic route in drug
and pharmaceuticals. Institutions like International Finance Corporation, Common
Wealth Development Corporation, German Investment and Development Company., etc.
are allowed to invest in domestic companies through the automatic route subject to SEBI/
RBI guidelines and sector specific caps on FDI.5
Significant changes made during 2001-2002 include allowing payment of royalty upto 20
percent on exports and 1 percent on domestic sales under automatic route on use of
trademarks and brand name of the foreign collaborator without technology transfer.
Payment of royalty upto 8 percent on exports and 5 percent on domestic sales by wholly
owned subsidiaries to off share parent companies is allowed under the automatic route
without any restriction on duration or royalty payments. The radical recommendations
have been made by the N. K. Singh committee6 on foreign direct investment on
September 7, 2002. The committee has also given recommendations for empowering the
foreign investment promotion board and foreign investment implementation and
Overseas Corporate Bodies (OCBs). FDI upto 100 percent is permitted in printing,
scientific and technical magazines, periodicals and journals subject to compliance with
legal framework and with prior approval of the Government. FDI upto 100 percent is
permitted through automatic route for petroleum product marketing.
In pursuance of Government's commitment to further facilitate Indian industry, during
2003-04, guidelines had been issued on equity cap on FDI, including investment by NRIs
automatic route including investment by Flls. The aggregate foreign investment in a
private bank from all sources will be a maximum of 74 percent of the paid up capital of
the bank and at all times, at least 26 percent of the paid up capital held by residents

70
except with regard to a wholly owned subsidiary of a private bank. Further, the foreign
banks will be permitted to either have branches or subsidiaries, not both. Foreign banks
regulated by a banking supervisory authority in the home country and meeting Reserve
Bank’s license criteria will be allowed to hold 100 percent paid up capital to enable them
to set up wholly owned subsidiary in India. FDI ceiling in telecom sector in certain
services (such as basic, public mobile radio trucked services (PMRTS), global mobile
personal communication service (GMPCs) and other value added services), has been
increased from 49 percent to 74 percent, in February, 2005. The total composite foreign
holding including but not limited to investment by Flls, NRI/ OCB, FCCB, ADRs,
GDRs, convertible preference shares, proportionate foreign investment in Indian
promoters/ investment companies including their holding companies etc., will not exceed
74 percent. The reforms are still ongoing in the area of foreign investment.7
During the year 2004-05, the FDI limits in "Air Transport Services (Domestic Airlines)"
were increased upto 49 percent through automatic route and upto 100 percent by non
resident Indians (NRIs) through automatic routes (No direct or indirect equity
participation by foreign airlines is allowed). Foreign investment in the banking sector has
been further liberalized by raising FDI limit in private sector banks to 74 percent under
the authority of expedite the process of administrative and policy approvals. This
committee has also suggested that Special Economic Zones should be developed as the
most competitive destinations for export-related FDI simplifying laws, rules
administrative procedures and reducing red tape to the levels found in China.
In year 2005-06, Government has decided to allow FDI in the up-linking of TV channels
as under: (i) FDI upto 49% would be permitted with prior approval of the government for
setting up – linking HUB/ teleport: (ii) FDI upto 100 % would be allowed with prior
approval of the Government for up linking a non news & current affairs TV channel. FDI
upto 100% was already allowed under the automatic route in the hotel and tourism
sector.8
FDI has been allowed upto 100 percent on the automatic route in power trading and
processing and warehousing of coffee and rubber. FDI has also been allowed upto 51
percent for (single brand) product retailing which requires prior approval of government.
Specific guidelines have been issued for governing FDI for ‘single brand’ product

71
retailing. On the expected line of foreign investors, the congress (i) led UPA government
in New Delhi has introduced the Insurance Law (Amendment) bill 2008 in the upper
house of Indian Parliament on December 22, 2008, that seek to raise the Foreign Direct
Investment(FDI) cap in the insurance sector from existing 26 percent to 49 percent. This
move is seen as the UPA government’s most significant and biggest reform measure in
the financial sector since the then Finance Minister P. Chidambaram in his Budget speech
announced plan to hike FDI in insurance to 49 percent.9
Concluding Remarks
India lacked a policy of its own on foreign capital before independence 'because' it
derived its faith in total laissez faire from the British Government. Resultantly, foreign
enterprises found it convenient to export products to India and were justified by local
circumstances to set-up branches or wholly owned subsidiaries. The Industrial Policy
Resolution of 1948 recognized that participation of foreign capital and enterprise,
particularly as regards industrial techniques and knowledge would be of value for the
rapid industrialization of the country. However, it was necessary that the conditions under
which foreign capital could participate in Indian industry should be carefully regulated in
national interest. As a rule, the major interest in ownership and effective control would
normally be in Indian hands though, provision was made for special cases in a manner
calculated to serve the national interest. This phase is cautions welcome policy.
In May 1966, the government decided that investments by NRIs would be allowed
without any limit in public limited industrial concerns in India. In private limited
industrial concerns with a minimum issued and paid up capital of Rs. 10 lacs, their share
would be allowed upto 49 percent. In special cases, it would be increased to 51 per cent
or even more, provided resident Indian participation would go upto 49 percent within a
period of, say 5 years. But they would not be allowed to invest in proprietorship /
partnership and dividends would not be allowed to be repatriated. Under the new
industrial licensing policy announced in February, 1970 the larger industrial houses and
foreign enterprises were permitted to setup industries in the 'core' and the 'heavy
investment' sectors except industries reserved for the Public Sector.
In October 1976, the scheme under which non-resident Indians were allowed to start
industrial units in India by bringing in imported machinery was liberalized to permit

72
equity investment up to 74 percent without any minimum limit in a number of priority
sector industries.
In terms of the said policy the government prepared a revised illustrative list of industries
where no foreign collaboration, technical or financial was considered necessary due to
development of indigenous technology.
Liberalized facilities were extended to overseas companies, partnership firms, trusts,
societies and other corporate bodies in which at least 60 percent of the ownership/
beneficial interest were vested in non-resident individuals of Indian nationality or origin.
During 1986-87, the government permitted NRIs to subscribe to the Memorandum and
Articles of Association of a new company and take up their share up to the face value of
Rs. 10,000 for the purpose of its incorporation. It also permitted Indian companies with
more than 40 percent non resident interest to acquire immovable properties in India.
Further, NRIs were allowed to invest: (i) upto 100 percent of the equity capital in sick
industrial units (ii) in new issues of Indian shipping companies under the 40 percent
scheme, and (iii) in diagnostic centres in India under 40 percent or 74 percent scheme.
As a part of the structural adjustment policies introduced in the Indian economy by the
Government of India (GOI) since July 1991, policies relating to foreign financial
participation in Indian companies and those relating to foreign technology agreements
had also undergone a radical change. Three tiers for approving proposals for foreign
direct investment in the country were introduced: the Reserve Bank's automatic approval
system, secretariat for industrial approvals for considering proposals within the general
and Foreign Investment Promotion Board specially created to invite, negotiate and
facilitate substantial investment by international companies that would provide access to
high technology and world markets. In this phase FDI is allowed almost in all areas
except multi-brand retail sector, gambling and lottery business.

73
References
1. Ministry of Commerce & Industry (1998), "Guidelines – Non-Banking Financial
Companies (NBFCs)", DIPP (FC Section), Press Note No. 16.
2. Ministry of Commerce & Industry (1999), "Increase in Foreign Equity", DIPP
(FC Section), Press Note No. 7.
3. Ministry of Commerce & Industry (2000), "Expansion of List of Activities for
Automatic Route", DIPP (FC Section), Press Note No. 2.
4. Ministry of Commerce & Industry (2000), "Sectoral Policy and Sectoral Equity
Cap Review (SEZ)", DIPP (FC Section), Press Note No. 9.
5. Ministry of Commerce & Industry (2001), "Sectoral Policy and Sectoral Equity
Cap Review", DIPP (FC Section), Press Note No. 4.
6. India Today, September 30, 2002.
7. Ministry of Commerce & Industry (2004), "Sectoral Guidelines and Equity Cap
Review", DIPP (FC Section), Press Note No. 1.
8. Ministry of Commerce & Industry (2006), "FDI in Up-linking of TV Channels",
DIPP (FC Section), Press Note No. 1.
9. The Financial Express, December 23, 2008, p. 5.

74
Section - II
Trends and Patterns of FDI in India: An Analysis
Across the world, Foreign Direct Investment (FDI) has been increasing dramatically
since the beginning of the nineties. Most of the countries in the world have recognized
the role and relevance of foreign capital for rapid economic and industrial development.
Foreign capital contributes in many important ways to the process of economic growth
and industrialization. It can act as a catalyst for domestic industrial development and
further helps in speeding up of economic activity and brings with it other scarce
productive factors, such as technical know how and managerial experience, which are
equally essential for economic development. Foreign Direct Investment plays an
important role in the development process of the country. Potentially contributes to the
development through the transfer of financial resources, technology and innovative and
improved management techniques. Inflows of foreign investment in the country could
raise the productivity. Developing countries like India needs substantial foreign inflows
to achieve the required investment, to accelerate economic growth and overall
development. Investment in a country by individuals and organizations from other
countries is an important aspect of international finance. This flow of international
finance may take the form of portfolio investment (acquisition of securities) or Foreign
Direct Investment (Creation of productive facilities). The foreign investment is
considered not only as a stock of capital but as something that provides modern
technology, modern management practices, employment opportunities and a new market
for products produced in India. Moreover, it is essential that we have a gap between our
savings and investment rates. This gap can only be filled by FDI. MNCs offer the capital
access to international markets and technology that India as a strong and rapidly growing
economy requires. Keeping in view the pivotal role played by FDI inflows, the
Government of India opened the Indian economy for foreign players in 1991 when the
economic reforms process was initiated. The last eighteen years have seen a market
increase in foreign capital inflows into India both in foreign direct investment and in
portfolio investment. The present section aims at analyzing the trends and aggregate
75
inflow, approval and actual inflows of FDI analysis, sector-wise inflows of FDI, state-
wise inflow of FDI, country-wise inflow of FDI and India’s position in Asian countries in
relation to FDI.
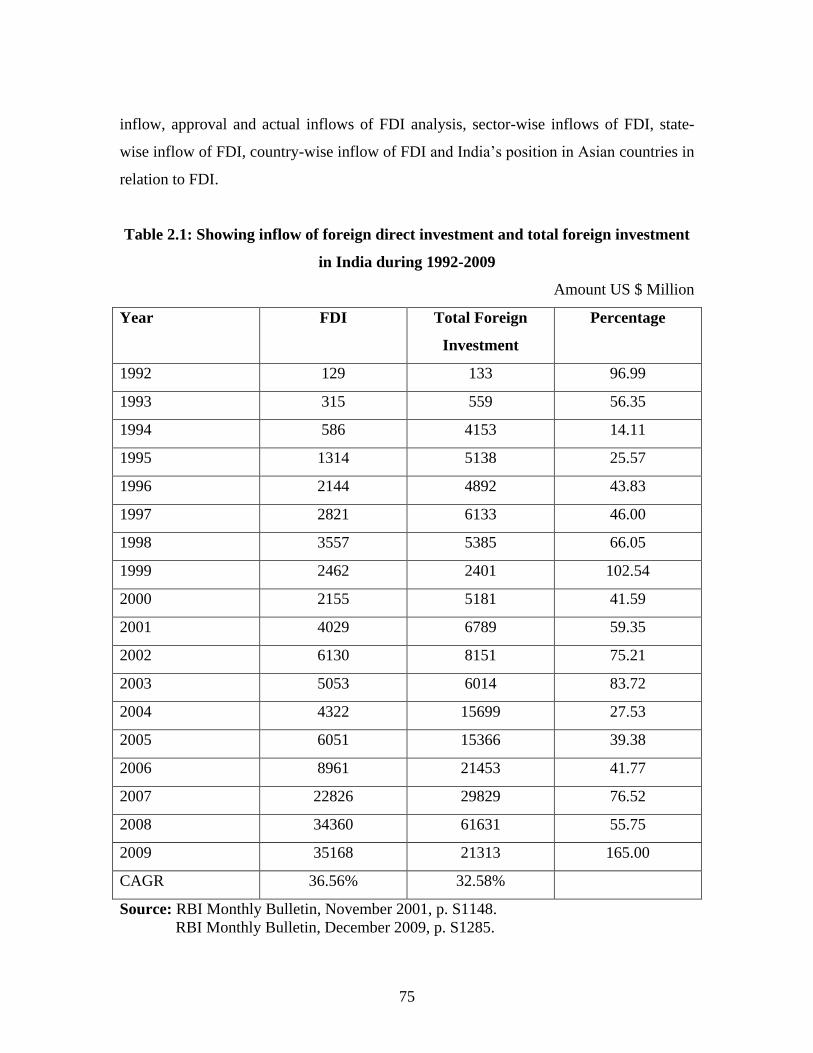
Table 2.1: Showing inflow of foreign direct investment and total foreign investment
in India during 1992-2009
Amount US $ Million
Year FDI Total Foreign
Investment
Percentage
1992 129 133 96.99
1993 315 559 56.35
1994 586 4153 14.11
1995 1314 5138 25.57
1996 2144 4892 43.83
1997 2821 6133 46.00
1998 3557 5385 66.05
1999 2462 2401 102.54
2000 2155 5181 41.59
2001 4029 6789 59.35
2002 6130 8151 75.21
2003 5053 6014 83.72
2004 4322 15699 27.53
2005 6051 15366 39.38
2006 8961 21453 41.77
2007 22826 29829 76.52
2008 34360 61631 55.75
2009 35168 21313 165.00
CAGR 36.56% 32.58%
Source: RBI Monthly Bulletin, November 2001, p. S1148.
RBI Monthly Bulletin, December 2009, p. S1285.

76
Diagram 2.1: Showing inflow of foreign direct investment and total foreign
investment in India during 1992-2009
0
10000
20000
30000
40000
50000
60000
70000
1992 1993 1994 1995 1996 1997 1998 1999 2000 2001 2002 2003 2004 2005 2006 2007 2008 2009
Year
Am
ou
nt
US
$ M
illio
n
FDI
Total Foreign Investment
This table 2.1 clearly explains that the percentage share of foreign direct investments
inflow is found more than 27.00 percent of total foreign investment throughout the study
period, except the year 1994 and 1995. Table further shows that the total foreign direct
investment of US $129 million in 1992 to inflow of US $35168 million in 2009 is a long
journey of 18 years and represents a whopping increase of 272.62 times. In 1997 inflow
of FDI increased by 21 times touching the figure of US $2821 million, just within its
existence of six years, representing 46 percent of total foreign investment of this year. In
the year 2000 FDI inflow declined to US $2155 millions due to slow FDI inflows in
India. Within a period of next six years its FDI reached the figure of US $5053 million in
the year 2003 which was nearly seven times increase. After this inflow of FDI increased
year after year except the year 2004, touching the figure of US $22826 million in the year
2007 representing 76.52 percent of its total foreign investment. During the period of five
(1999 to 2004) years inflows of FDI started declining, fluctuating, in different years and
ultimately touching the low amount of US $2135 million representing the 41.59 percent
of its total foreign investment. From the year 2005, inflow of FDI again started increasing
and touched the figure of US $35168 million in 2009. The CAGR of FDI is 36.56

77
percent. In the case of foreign investment the CAGR is 32.58 percent. In 2005
government announced the SEZ Act, SEZs scheme was launched with the specific intent
of providing an internationally competitive and hassle free environment for exports. SEZs
are being increasingly perceived as a major source of attracting FDI across the globe. In
the year 1999 and 2009 inflow of FDI has increased to the level of US $2462 million and
US $35168 million and its percentage is 102.54 and 165.00 of total foreign investment
respectively. In these years indirect foreign investment has moved in negative direction
because the total foreign investment was found less than foreign direct investment.
Trends in Aggregate Inflow of FDI in India
The yearly aggregate inflow of FDI has been computed on the basis of balances
appearing on the last day of financial year (31 March) in India. The total inflow of FDI
accepted by the various channels under study can be reviewed with the help of the table.
The data has been divided into three equal time periods. The scheme of data period has
been categorized as follows 1992-1997, 1998-2003 and 2004-2009.
Table 2.2: Showing inflow of FDI in India during 1992-1997
Amount US $ million
Year Amount Index No. Growth Rate
1992 129 100 -
1993 315 244.19 144.19
1994 586 454.26 177.13
1995 1314 1018.60 306.20
1996 2144 1662.01 390.50
1997 2821 2186.82 417.36
Source: RBI Monthly Bulletin, November 2001, p. S1148.

78
Table 2.2 A: Showing inflow of FDI in India during 1998-2003
Amount US $ million
Year Amount Index No. Growth Rate
1998 3557 100 -
1999 2462 69.22 (30.78)
2000 2155 60.58 (19.71)
2001 4029 113.27 4.42
2002 6130 172.34 18.09
2003 5035 141.55 8.31
Source: RBI Monthly Bulletin, November 2001, p. S1148.
RBI Monthly Bulletin, December 2009, p. S1285.
Table 2.2 B: Showing inflow of FDI in India during 2004-2009
Amount US $ million
Year Amount Index No. Growth Rate
2004 4322 100 -
2005 6051 140.00 40.00
2006 8961 207.33 53.67
2007 22826 528.14 142.71
2008 34360 795.00 173.75
2009 35168 813.70 142.74
Source: RBI Monthly Bulletin, December 2009, p. S1285.
Table 2.2 shows that the aggregate inflow of FDI which stood at US $129 million in the
year 1992 increased to US $2821 million in the year 1997. This means a net increase of
2186.82 percent in 1997 over the base year 1992. India accepted highest amount of total
FDI of US $2821 million at the end of the year 1997 during the six years period. The
index number rose to the level of 2186.82 in 1997 as compared to the base year 1992.
The table under reference is further showing an increasing trend in the growth rate of the
total inflow of FDI. Inflow of FDI increased at a high growth rate of 417.36 in the year
1997 over the base year 1992. After analysing the behaviour of aggregate inflow of FDI it

79
is concluded that the inflow of FDI has increased with a high growth rate within this
time.
Inflow of FDI in India, as tabulated in table 2.2A shows that they have gone up to US
$5035 million in the year 2003 as against US $3557 million in the year 1998. The net
increase within six years period has been worked out at US $1478 million, which
contributes to an increase of 42 percent approximately. Inflow of FDI decreased in the
year 1999 and 2000 in comparison to the year 1998. But after the year 2000, it has been
increasing consistently till the year 2003. The index number of the inflow of FDI varied
between 60.58 to 172.34 during this period. The growth rate of this inflow of FDI was
-30.78 and -19.71 in the year 1999 and 2000.
Table 2.2B depicts that the inflow of FDI increased upto US $ 35168 million in the year
2009 as compared to US $ 4322 million in the year 2004 with net increase of US $ 30848
million. The under number which stood at 140.00 for the year 2004 rose to 813.70 in the
year 2009 over the base year 2004. The growth rate of these inflows has continuously
been increasing during the period of six years.
Approval and Actual FDI Inflows Analysis
In response to the liberalized policy measures introduced by the Government since 1991,
foreign direct investment in India has increased progressively in the post reform period,
both in terms of approvals and actual inflows. Table shows the trends in approvals of FDI
proposals vis-à-vis inflows and examines the actual inflows of FDI as percentage to the
total approvals from the period 1992 to 2009.
Table 2.3: Showing FDI in India: Approval and Actual Inflow During 1992-2009
Amount US $ Million
Year Approval Growth rate* Actual Growth rate* Realization
1992 527 - 129 - 24.48
1993 1976 274.95 315 144.19 15.94
1994 2428 22.87 586 86.03 24.14
1995 3178 30.89 1314 124.23 41.55
1996 11439 259.94 2144 63.17 18.74
1997 11484 0.39 2821 31.58 24.56
1998 10984 (4.35) 3557 26.09 32.38

80
1999 7532 (31.43) 2462 (30.78) 32.69
2000 4266 (43.36) 2155 (12.47) 50.32
2001 5754 (34.88) 4029 89.96 70.02
2002 3160 (45.08) 6130 52.15 193.99
2003 1654 (47.66) 5053 (17.57) 305.50
2004 1354 (18.14) 4322 (14.47) 319.20
2005 4231 212.48 6051 40.00 143.02
2006 6204 46.63 8961 48.09 144.44
2007 27809 348.24 22826 154.73 82.08
2008 24579 (11.61) 34360 50.53 139.79
2009 19791 (19.48) 35168 2.35 177.70
Total 148350 - 142383 - 95.98
CAGR 22.32 - 36.56 - -
Source: www.dipp.nic.in/fdi_statistics/india_fdi_index.htm.
* Annual growth rate over the previous year figure in bracket indicates negative growth
Diagram 2.2: Showing FDI in India: Approval and Actual Inflow During 1992-2009
0
5000
10000
15000
20000
25000
30000
35000
40000
1992
1993
1994
1995
1996
1997
1998
1999
2000
2001
2002
2003
2004
2005
2006
2007
2008
2009
Year
Am
ou
nt
in U
S $
mil
lio
n
Approval
Actual

81
Analysis of the data in the table 2.3 discloses that the approvals of foreign investment
increased from US $ 527 millions in 1992 to US $ 19791 millions in 2009. These have
increased significantly from 1993 onwards, the second year of economic reforms and
reached to US $ 1976 million which amounts for 274.95 percent increase over 1992. This
aggregated to a total of US $ 148350 million during the study period. The growth rate of
these approvals was -4.35, -31.43, -43.36, -45.08, -47.66, -18.14, -11.61 and -19.48 in the
year 1998, 1999, 2000, 2002, 2003, 2004, 2008 and 2009 respectively. Compound
average growth rate (CAGR) of approvals is found 22.32 percent during the above said
period. A close observation of actual inflows of Foreign Direct Investment reveals that
they increased from US $ 129 million in the year 1992 to US $ 35168 million in the year
2009. Cumulative inflows during this period amounted to Rs. 142383 millions. The
growth rate of these actual inflows was -30.78, -12.47, -17.57 and -14.47 in the year
1999, 2000, 2003 and 2004 respectively. Compound average growth rate of actual
inflows is found to be 36.56 percent in the above said period.
However, by comparing the actual inflows of FDI to that of the approved amount, we
find a significant increase in the ratio at 24.48 percent in the year 1992 due to
implementation of reforms in foreign investment. A notable feature is that the inflows as
percentage of total approvals has declined in the subsequent year i.e. 1993. Further, an
interesting aspect is that, there was an increasing trend in the ratio of inflows to approvals
from the year 1997, which is found to be at 193.99 percent in 2002. As the coverage of
FDI revised by the government during 2001 on par with the international best practices
by including re-investment earnings and other capital flows. 305.50 and 319.50
percentage of approved FDI was realized in 2003 and 2004. Similarly a steep increase in
the ratio at 177.70 percentage of actual inflows of approvals was observed during the
study period. This is significant, for after a steady rise per three consecutive years up to
2003, the actual inflow of FDI had declined in 2004. The reversal of the trend now will
not only raise industrial investment, but will also indicate a revival of the confidence of
foreign investors in Indian industry.
The data of the table clearly indicates that the post reform period has witnessed a rapid
increase in FDI approvals, where as, the actual inflows have been much less. FDI
approvals amounted to US $ 148350 million, while actual FDI inflow as only US $

82
142383 million. Thus, the aggregated actual FDI inflows were 95.98 percent of FDI
approvals during the period under study.
Analysis:
To analyse the approvals and actual inflows of FDI correlation analysis has been used.
Correlation co-efficient is a measure of degree of covariability between approvals and
actuals during the period 1992-2009 is presented below:
r = 0.83
r2 = 0.69
P.E.1 = 0.049
The analysis shows that the correlation coefficient between the selected variables, i.e.
FDI approvals and actual inflows is 0.83, indicates positive high significant correlation
and its coefficient of determination is 0.69 which indicates that the independent variable
(FDI approvals) shall influence the dependent variable (FDI actual inflows) to the extent
of 69 percent. Added to this, the analysis has been done with the help of probable error.
Since the coefficient of correlation is found more than six times of probable error, so that
it can be regarded as significant.
FDI Inflows: Route wise Analysis
FDI is the most important source of foreign investment inflows in developing countries
like India. Before 1991, the inflows of FDI in India were not at all satisfactory. But after
the announcement of new industrial policy in July 1991, India has experienced
acceleration in the inflows of FDI into the country.
Table 2.4:Showing statement of route wise inflow of FDI during the period 1992 to 2009 Amount US $ million
Year FIPB % RBI % Other % Total
1992 66 51.2 - - 63 48.8 129
1993 222 70.5 42 13.3 51 16.2 315
1994 280 47.8 89 15.2 217 37.0 586
1995 701 53.4 171 13.0 442 33.6 1314
1
21. 0.6745r
rP E
N
=
.6745 1 .69
18
=
.6745 .310.049
4.24
.
If r > 6 PE then r is significant .049 x 6 = .294

83
1996 1249 58.3 169 7.8 726 33.9 2144
1997 1922 68.1 135 4.8 764 27.1 2821
1998 2754 77.4 202 5.7 601 16.9 3557
1999 1821 73.9 179 7.3 462 18.8 2462
2000 1410 65.4 171 7.9 574 26.7 2155
2001 1456 60.7 454 18.9 490 20.4 2400
2002 2221 54.2 767 18.8 1107 27.0 4095
2003 919 33.2 739 26.8 1106 40.0 2764
2004 928 41.6 534 24.0 767 34.4 2229
2005 1062 28.1 1258 33.3 1458 38.6 3778
2006 1126 18.8 2233 37.4 2616 43.8 5975
2007 2156 13.1 7151 43.4 7174 43.5 16481
2008 2298 8.5 17127 63.8 7440 27.7 26865
2009 4699 16.8 17998 64.3 5298 18.9 27995
Total 27290 25.3 49419 45.7 31356 29.0 108065
Source: RBI Monthly Bulletin, November 2001, p. S1148.
RBI Monthly Bulletin, December 2009, p. S1285.
Diagram 2.3: Showing statement of route wise inflow of FDI during the period 1992
to 2009

84
Table 2.4 presents the route wise inflows of Foreign Direct Investment (FDI) from the
period 1992 to 2009. This data shows the amount of Foreign Direct Investment received
through various agencies / routes such as government’s approval (FIPB / SIA routes);
RBI’s automatic approval and other routes.
The table 2.4 further shows that the total amount of actual inflows of FDI during 1992-
2009 accounted for US $108065 million. Out of which inflow of RBI’s automatic route
had a significant share of 45.70 percent; government’s FIPB/SIA approval accounted for
25.3 percent and remaining 29.00 percent shared by other route. Government (SIA/FIPB)
route has gained a lot of significance for inflow of FDI. Since it has accounted for 16.8
percent to 77.4 percent of the total inflow of FDI from 1992 to 2009. RBI (automatic)
route has attracted for 4.8 percent to 64.8 percent of the total inflows of FDI during the
study period. The share of FDI inflows through other route has been in the decreasing
order-starting at peak 48.80 percent in 1992. This route attracted more than 16 percent
each year of the total FDI inflows to India during the above said period.
At the overall level, RBI automatic route is found contributing the maximum share of
45.7 percent to the total FDI inflows followed with a gap by government’s FIPB route
(25.30 percent) and other route (29.00 percent). Hence RBI’s automatic route is the most
popular route till date.
Testing of Hypothesis
H0 : It is hypothesized that there is no significant difference in route-wise FDI inflows
in India.
H1 : It is hypothesized that there is significant difference in route-wise FDI inflows in
India.
Table 2.5: Showing Chi-square Test Results
Amount US $ Billion
I II Total
FIPB / SIA 10.4 16.9 27.3
RBI 1.2 48.3 49.5
Other routes 3.9 27.3 31.2
Total 15.5 92.5 108.0

85
The chi-square test was conducted to test the hypothesis.
Calculated value of chi-square (2) : 18.39
Table value : 5.99 / 9.21
Degree of freedom (d.f.) : 2
Level of significance : 5 percent / 1 percent
Result: To study the degree of association among the aforesaid variables the chi-square
test has been used both at 5 percent and 1 percent level of significance. Since the
calculated value is much greater than the table value. Hence, the hypothesis does not hold
good and we, therefore, conclude that the routes of FDI are significantly high difference,
which means all the routes i.e. FIPB / SIA, RBI, others route FDI inflows have not been
equally considered.
Statewise inflow of FDI
The statewise trends in FDI show that the RBI’s regional offices during 2000 to 2009.
The data relevant to the analysis is presented in table.
Table 2.6: Showing inflow of FDI during 2000-09 RBI’s regionwise.
Amount in US $ million
Regional
offices of RBI
States covered Amount Share in total
FDI inflows
Mumbai Maharashtra, Dadra & Nagar Haveli,
Daman & Diu
30700.4 36
New Delhi Delhi, Part of Uttar Pradesh and
Haryana
12716.9 15
Bangalore Karnataka 5867.9 7
Ahmedabad Gujarat 5624.8 7
Chennai Tamil Nadu, Pondichery 4725.0 6
Hyderabad Andhra Pradesh 3495.4 4
Kolkata West Bengal, Sikkim, Andaman &
Nicobar Island
1277.6 1.5
Jaipur Rajasthan 438.3 0.5
Chandigarh Chandigarh, Punjab, Haryana,
Himachal Pradesh
384.2 0.5

86
Panaji Goa 252.9 0.3
Kochi Kerala, Lakshadweep 203.1 0.2
Bhopal Madhya Pradesh, Chhattisgarh 148.7 0.2
Bhuvneshwar Orissa 97.4 0.1
Guwahati Assam, Arunachal Pradesh, Maipur,
Meghalaya, Mizoram, Nagaland,
Tripura
53.2 0.1
Kanpur Uttar Pradesh, Uttarakhand 16.4 0.0
Patna Bihar, Jharkhand .04 0.0
Region not
indicated
- 18431.2 21.6
Total - 84433.6 100
Source: www.dipp.nic.in/fdi_statistics/India_fdi_index.htm.
Diagram 2.4: Showing inflow of FDI during 2000-09 RBI’s regionwise
36%
15%7%7%
6%
4%
25%Mumbai
New Delhi
Bangalore
Ahmedabad
Chennai
Hyderabad
Others
Table 2.6 shows that the Mumbai region has attracted largest amount of foreign direct
investment of US $ 30700.4 million that is the 36 percent of the total foreign direct
investment flows during the period 2000-09. New Delhi region has attracted the total of

87
US $ 12716.9 million which is the 15 percent of the total foreign direct investment in
flows during the same period. Bangalore region and Ahmedabad region have received
foreign direct investment of US $ 5867.9 million and US $ 5624.8 million which are the
7 percent and 7 percent of the total inflows of foreign direct investment. While
regionwise, this percentage in Mumbai, New Delhi, Bangalore, Ahmedabad, Chennai,
Hyderabad, Kolkata, Jaipur, Chandigarh, Panaji, Kochi, Bhopal, Bhunveshwar and
Guwahati turns out to be 36, 15, 7, 7, 6, 4, 1.5, 0.5, 0.5, 0.3, 0.2, 0.2, 0.1 and 0.1 percent
respectively during the above said period.
Sectorwise Analysis of FDI
The sector wise break-up of foreign direct investment provides a wide list of items in
which India is attracting foreign direct investment as a part of its reform policies. The top
ten sectors which have received the larger amount of foreign direct investment during the
study period includes services sector, computer software and hardware,
telecommunication, construction activities, housing and real estates, automobile industry,
power, chemicals, metallurgical industries and drugs and pharmaceuticals. In the present
study time period has been divided into two parts i.e. 1992-2000 and 2001-2009.
Table 2.7: Showing sector wise inflows of FDI in India during 1992 to 2009
Amount in US $ million
Sector 1992 to
2000
2001 to
2009
1992 to
2009
Percentage Growth
rate in
times
Services sector 1361.02 19173.76 20534.78 19.42 14.08
Computer software and
hardware
2799.34 8953.83 11753.17 11.12 3.20
Telecommunication 1427.58 6399.92 7827.50 7.40 4.48
Construction activities 1912.31 5191.01 7103.32 6.72 2.71
Housing and real estate 1124.37 5512.49 6636.86 6.27 4.90
Automobile 2160.73 3388.37 5549.10 5.25 1.57
Power 1611.53 3190.15 4801.68 4.54 1.98
Chemical 1190.15 2133.95 3324.10 3.14 1.79

88
Metallurgical 276.55 2723.26 2999.81 2.84 9.84
Drug and
pharmaceutical
268.45 1457.91 1726.35 1.63 5.43
Other 7166.69 26306.94 33475.64 31.67 -
Total 21298.72 84433.39 105732.31 100.00 -
Source: www.dipp.nic.in/fdi_statistics/india_fdi_index.htm.
Diagram 2.5: Showing sector wise inflows of FDI in India during 1992 to 2009
0
5000
10000
15000
20000
25000
30000
35000
40000
Ser
vice
s se
ctor
Com
pute
r sof
twar
e an
d ha
rdwar
e
Telec
omm
unicat
ion
Con
stru
ctio
n ac
tivities
Hou
sing
and
real e
stat
e
Aut
omob
ile
Pow
er
Che
mical
Met
allu
rgical
Dru
g an
d ph
arm
aceu
tical
Oth
er
Sector
Am
ou
nt
US
$ M
illio
n
1992 to 2000
2001 to 2009
1992 to 2009
Growth rate in times = Amount of Phase II
Amount of Phase I
Table 3.7 shows that the services sector has attracted largest amount of foreign direct
investment which has increased from US $1361.02 million to US $19173.76 million
during the study phase. In the entire period of 1992-2009 this sector has attracted the
foreign direct investment of US $20534.78 million that is the 19.42 percent of the total
foreign direct investment flows. It is followed by computer software and hardware sector
as their share has been increased from US $2799.34 million to US $8953.83 million
during the same period. This sector has attracted a total of US $11753.17 million which is
the 11.12 percent of the total foreign direct investment flows. The telecommunication

89
sector has received foreign direct investment of US $7827.50 million which is the 7.40
percent of the total flows of foreign direct investment. While sector wise, this growth rate
in services sector, computer software, telecommunication, construction activities, housing
real estates, automobile industry, power, chemicals, metallurgical industries and drugs
and pharmaceuticals turns out to be 14.08, 3.20, 4.48, 2.71, 4.90, 1.57, 1.98, 1.79, 9.84
and 5.43 times respectively during the study period.
Countrywise inflow of FDI in India
It is proposed to analyze the country wise inflow of Foreign Direct Investment in India
during 1992 to 2009. The data relevant to the analysis is presented in table 2.7.
Table 2.8: Showing inflow of FDI during 1992-2009
Top 10 investors in India
Amount in US $ Million
Country Amount Percentage Rank
Mauritius 40214.81 38.03 1
USA 8709.21 8.24 2
Singapore 8146.99 7.71 3
UK 5865.78 5.55 4
Netherland 4199.24 3.97 5
Japan 3314.60 3.13 6
Germany 2795.76 2.64 7
Cyprus 2774.04 2.62 8
France 1507.24 1.43 9
Switzerland 1403.64 1.33 10
Other country 26801.78 25.35 -
Total 105732.31 100.00 -
Source: www.dipp.nic.in/fdi_statistics/india_fdi_index.htm.

90
Diagram 2.6: Showing inflow of FDI during 1992-2009 top 10 investors in India
38%
8%
8%
6%
4%
3%
3%
3%
1%
1%
25%
Mauritius
USA
Singapore
UK
Metherland
Japan
Germany
Cyprus
France
Switzerland
Other country
Table 2.8 indicates the inflow of FDI in India during 1992 to 2009 which states that total
amount of US $105.73 billion were received from various countries. Among all the
countries Mauritius has been the largest direct investor in India. Firms based in Mauritius
invested over US $40 billions in India between 1992 to 2009 or over two fifth
approximately of total FDI inflows during this period. Mauritius has low rates of taxation
and an agreement with India on double tax avoidance regime. To take advantage of that
situation, many companies have set up dummy companies in Mauritius before investing
to India. The United States of America (USA) is the second largest investor in India. The
total capital flows from the USA was around US $8 billion, which accounted for 8.24
percent of the FDI inflows. The Singapore and United Kingdom are India’s third and
fourth largest FDI inflows. Netherland, Japan, Germany, Cyprus, France, and Switzerland
keep the fifth, sixth, seventh, eight, ninth and tenth positions with share figures 3.97,
3.13, 2.64, 2.62, 1.43 and 1.33 percent respectively under the study.

91
India’s Position in Asian Country in Relation to FDI
Table 2.9: Showing the year wise inflow of FDI in Asian Countries during 1992 to
2000
Amount in US $ million
Year China Hongkong Singapore India South Korea Malaysia
Amt % R Amt % R Amt % R Amt % R Amt % R Amt % R
1992 11156 45.80 1 2051 8.40 5 2204 9.05 3 233 0.96 8 727 2.99 6 5183 21.28 2
1993 27515 63.19 1 1667 3.83 5 4686 10.76 3 574 1.32 8 588 1.35 7 5006 11.49 2
1994 33787 65.95 1 2000 3.90 4 5480 10.70 2 1314 2.56 7 809 1.58 8 4342 8.48 3
1995 35849 63.02 1 2100 3.69 4 6912 12.16 2 1929 3.39 6 1776 3.12 7 4132 7.26 3
1996 40180 52.99 1 10460 13.79 2 8608 11.35 3 2525 3.33 5 2325 3.07 6 7296 9.62 4
1997 44237 52.80 1 11368 13.57 2 10746 12.83 3 3619 4.32 5 2844 3.39 7 6324 7.55 4
1998 43751 56.17 1 14770 18.96 2 6389 8.2 3 2168 2.78 6 5412 6.95 4 2714 3.48 5
1999 40319 41.78 1 24596 25.49 2 11803 12.33 3 2319 2.40 7 9333 9.67 4 3895 4.04 5
2000 40772 31.24 2 61938 47.48 1 5407 4.14 4 2633 2.02 7 9283 7.11 3 3788 2.90 6
Average 52.55 15.46 10.16 2.56 4.36 4.36
CAGR 15.49 46.03 10.49 30.92 32.71 -3.42
Rank 1 2 3 7 5 4
Year Philippines Thailand Srilanka Pakistan Total
Amt % R Amt % R Amt % R Amt % R Amt %
1992 228 0.94 9 2114 8.68 4 123 .53 10 335 1.37 7 24354 100
1993 1238 2.84 6 1730 3.97 4 195 .45 10 347 .80 9 43546 100 1994 1591 3.11 5 1322 2.58 6 166 .32 10 419 .82 9 51230 100 1995 1478 2.61 8 2003 3.52 5 63 .11 10 639 1.12 9 56881 100 1996 1520 2.00 8 1864 2.46 7 133 .18 10 918 1.21 9 75829 100 1997 1249 1.49 8 2248 2.68 6 433 .52 10 713 .85 9 83781 100 1998 1752 2.26 7 222 0.29 9 206 .26 10 507 .65 8 77891 100 1999 578 0.60 8 2926 3.03 6 201 .21 10 530 .55 9 96500 100 2000 1241 0.95 8 4928 3.79 5 178 .14 10 305 .23 9 130473 100 Average 1.87 3.44 .30 .84
CAGR 20.17 9.86 4.19 1.04 20.50
Rank 8 6 10 9
Source: www.unctad.org/fdistatistics.
*Average – Based on percentage.
(a) CAGR –Compound Annual Growth Rate.
(H) Rank – Overall Rank.
Note:- Highest inflow figure has been assigned rank 1 and relatively lower figures were given ascending ranks

92
Table 2.9A: Showing the year wise inflow of FDI in Asian Countries during 2001 to
2009
Amount in US $ million
Year China Hongkong Singapore India South Korea Malaysia
Amt % R Amt % R Amt % R Amt % R Amt % R Amt % R
2001 46846 50.47 1 22834 24.85 2 8609 9.37 3 3403 3.70 5 3198 3.48 6 554 .60 8
2002 52743 64.61 1 9682 11.86 2 5822 7.13 3 3449 4.23 4 2975 3.64 6 3203 3.92 5
2003 53505 59.42 1 13624 15.13 2 9331 10.36 3 4269 4.74 4 3785 4.20 5 2473 2.75 6
2004 60630 46.25 1 34035 25.96 2 16060 12.25 3 5335 4.07 5 7687 5.86 4 4624 3.53 6
2005 72406 47.96 1 33618 22.27 2 13930 9.23 3 7606 5.04 5 7055 4.67 6 3967 2.63 7
2006 72715 37.51 1 45054 23.24 2 27680 14.28 3 20336 10.49 4 4881 2.52 7 6060 3.13 6
2007 83521 36.97 1 54365 24.06 2 31550 13.96 3 25127 11.12 4 2628 1.16 9 8401 3.72 6
2008 108312 40.26 1 63003 23.42 2 22725 8.45 4 41534 15.44 3 7603 2.83 7 8053 2.91 6
2009 123212 40.99 1 72012 23.96 2 24195 8.05 4 36229 12.05 3 11603 3.86 6 9053 3.01 7
Average 47.22 21.64 10.34 7.88 3.58 2.92
CAGR 11.34 13.64 12.17 30.06 15.40 36.40
Rank 1 2 3 4 5 7
Year Philippines Thailand Srilanka Pakistan Total
Amt % R Amt % R Amt % R Amt % R Amt %
2001 1792 1.95 7 4109 4.47 4 172 .19 10 385 .42 9 91902 100
2002 1792 2.20 7 947 1.16 8 197 .24 10 823 1.01 9 81633 100
2003 347 .39 9 1952 2.17 7 229 .25 10 534 .59 8 90049 100
2004 469 .36 9 1064 .81 7 233 .18 10 952 .73 8 131089 100
2005 1854 1.23 9 8048 5.33 4 272 .18 10 2201 1.46 8 150957 100
2006 2921 1.51 9 9460 4.88 5 480 .25 10 4273 2.19 8 193860 100
2007 2916 1.29 8 11238 4.97 5 603 .28 10 5590 2.47 7 225939 100
2008 1520 .56 9 10091 3.75 5 752 .28 10 5438 2.02 8 269051 100
2009 2539 .84 9 13205 4.39 5 921 .31 10 7625 2.50 8 300594 100
Average 1.15 3.55 .24 1.49
CAGR 3.95 13.85 20.50 39.34 14.07
Rank 9 6 10 8
Source: www.unctad.org/fdistatistics.
*Average – Based on percentage.
(a) CAGR –Compound Annual Growth Rate.
(H) Rank – Overall Rank.
Note:- Highest inflow figure has been assigned rank 1 and relatively lower figures were given ascending ranks.

93
Table 2.9 depicts that this region in aggregate accounted for US $24354 million in 1992
and figure escalated to US $ 130473 million in 2000. The Asian countries experienced
20.50 percent average compound growth rate during this period of nine years. The
highest growth of FDI inflows with CAGR of 46.03 percent is found in case of
Hongkong. South Korea and India have also experienced a significant growth of FDI
inflows of 32.71 percent and 30.92 percent CAGR during this period. Negative growth
has been detected in case of Malaysia and Pakistan i.e. -3.42 percent and -1.04 percent.
Further, examination of table has furnished the fact that it is China, who has emerged as
the highest share holding country in total FDI inflows to Asian countries except the year
2000, in this year Hongkong maintained its first rank in the percentage of FDI inflows.
Average percent share in total FDI inflows to Asian countries has been detected highest
i.e. 52.55 percent in case of China. Hongkong, Singapore and India hold the second, third
and seventh position with 15.46, 10.16 and 2.56 percent share figures respectively. As far
as growth of FDI inflows to Asian countries are concerned, the table 2.9A shows that this
region in aggregate accounted for US $91902 million in 2001 and the amount escalated to
US $300594 million in 2009. These Asian countries experienced 14.07 percent CAGR
during the period of 2001 to 2009. Pakistan has attracted highest growth of FDI inflows
with CAGR of the order of 39.84 percent. Malaysia and India both have also experienced
significant growth of the order of 36.40 percent and 30.06 percent respectively. China has
been found with 11.34 percent CAGR during this period. Least growth has been detected
in case of Philippines i.e. 3.95 percent. Further examination of table has revealed the fact,
that it is China who has emerged as the highest share holder. Average percent share in
total FDI inflows to Asian countries has been detected highest i.e. 47.22 percent in case
of China. Hongkong, Singapore and India hold the second, third and fourth position with
26.08, 10.34 and 7.88 percent share figures respectively as for as average percent share in
Asian countries are concerned.
Concluding Remarks
It emerges from the foregone analysis that overall inflow of foreign direct investment in
India witnessed an increasing trends during the study period. Compound Annual Growth
Rate (CAGR) of foreign direct investment inflow and foreign investment are 36.56

94
percent and 32.58 percent respectively during the whole period under study. RBI
automatic route is found contributing the maximum share (i.e. 45.7 percent) of the total
FDI inflows, followed by government FIPB route and other routes during the above said
period. Compound Annual Growth Rate (CAGR) of approval and actual inflows is found
at 22.32 percent 36.56 percent respectively during the reference period. The country
analysis found that Mauritius has been the largest direct investor in India. Mauritius has
low rates of taxation and an agreement with India on double tax avoidance regime. The
United States of America (USA) is the second largest investor in India. To take
advantage of double tax avoidance regime. Many companies have set up dummy
companies in Mauritius before investing to India. Sector wise analysis shows that the
services sector has attracted largest amount of foreign direct investment inflows with in
19.42 percent of total FDI during the period 1992 to 2009. Policy of the Indian
Government related to SEZ is mainly responsible for the FDI inflows. It is because
government announced the SEZ Act, SEZs scheme was launched with the specific intend
of providing an internationally competitive and hassle free environment for exports. SEZs
are being increasingly perceived as a major sources of attracting FDI across the global
markets.
The statewise trends in FDI shows that the RBI’s regional offices at Maharashtra, New
Delhi, Karnataka, Tamil Nadu and Gujarat have been the largest recipients of FDI. These
states are either known for their strong industrial base or as software hubs. The key
sectors attracting FDI to the Mumbai-Maharashtra region are energy, transportation
services, telecommunications and electrical equipment. Delhi attracts FDI inflows in
sectors like telecommunications, transportation, electrical equipment and services. The
states of Uttar Pradesh and Haryana have also performed really well in recent years due
to its abundance of natural resources, Uttar Pradesh attracts FDI in chemical,
pharmaceuticals and minerals whereas Haryana attracts FDI in the electrical equipment,
transportation and food processing sectors. Tamil Nadu has done well in sectors related to
automotive and auto components. Andhra Pradesh and Karnataka have attracted FDI
mainly in areas associated with software and to a lesser extent, hardware for computer
and telecommunication.