Embed Size (px)
Citation preview
8530
ISSN 2286-4822
www.euacademic.org
EUROPEAN ACADEMIC RESEARCH
Vol. II, Issue 6/ September 2014
Impact Factor: 3.1 (UIF)
DRJI Value: 5.9 (B+)
Foreign Direct Investment in India: An Econometric
Analysis
Dr. RUCHITA VERMA Assistant Professor
Department of Commerce
Central University of Rajasthan
India
SADASHIV BAIDHANATHAN M.Sc/MA. Student
Department of Statistics
Central University of Rajasthan
Abstract:
Introduction and Purpose: The examination of FDI and its
relationship with the economic growth is one of the controversial issues
even after the liberalisation. But at the same time it is well recognized
fact that the FDI is one of the key economic growth engines that help in
fixing the numerous economic problems. Keeping into consideration a
significant role played by FDI in economic development, the present
study is conducted with a view to have econometric analysis of FDI in
India.
Data Base and Research Methodology: The study covered a
period of 34 years from 1980 to 2013 and is based on the use of
secondary data, which is collected from various published sources. The
collected data is analyzed with the help of SPSS and E-Views. The
independent sample t-test, multiple regression and ARIMA model are
used.
Findings and Suggestions: The significant difference exist
in the FDI inflows during the pre and post-liberalization era, which
Ruchita Verma, Sadashiv Baidhanathan- Foreign Direct Investment in India: An
Econometric Analysis
EUROPEAN ACADEMIC RESEARCH - Vol. II, Issue 6 / September 2014
8531
can be attributable to the change in policies adopted by the
Government of India (GOI). The study provided with the relationship
of diverse variables with FDI inflows which can be considered by GOI
while determining the quantum and type of FDI inflows. The
projection of FDI inflows for the upcoming 5 years has shown
increasing trends. Hence, the timely and effective action can be taken
by the GOI to ensure its effective utilization.
Key words: Foreign Direct Investment, Economic Growth, Auto
Regressive Integrated Moving Average Model, Pre and Post-
Liberalization.
Introduction
Economic development of a country to a large extent depends
upon the flow of capital. The capital can be domestic capital or
foreign capital. Domestic capital refers to the flow of capital
from within the country, whereas foreign capital refers to flow
of capital from outside the country. Further, the foreign capital
may take several forms like Foreign Direct Investment (FDI)
and Foreign Institutional Investment (FII). Foreign Direct
Investment (FDI) refers to an investment made by a company
or entity based in one country into a company or entity based in
another country. An American company takes the majority
stake in a company in China or a Canadian company setting up
a joint venture to develop a mineral deposit in India are
examples of FDI. According to OECD, FDI is defined as
“An investment by a resident entity in one economy that
reflects the objective of obtaining a lasting interest in an
enterprise resident in another economy. The lasting interest
implies the existence of a long-term relationship between the
direct investor and the enterprise and a significant degree of
influence by the direct investor on the management of the
enterprise. The ownership of at least 10% of the voting power,
representing the influence by the investor, is the basic
criterion used.” (http://www.oecd-ilibrary.org assessed as on
13 May, 2014).
Ruchita Verma, Sadashiv Baidhanathan- Foreign Direct Investment in India: An
Econometric Analysis
EUROPEAN ACADEMIC RESEARCH - Vol. II, Issue 6 / September 2014
8532
The examination of FDI and its relationship with the economic
development of India is one of the most controversial issues
even after the liberalisation. This is largely because it is the
area where there is greatest disconnection between economic
theory and actual events in the real world. India has been the
most preferred destination for FDI in terms of financial
attraction, skill availability, and business environment. At the
same time, strong macro-economic fundamentals, growing size
of the economy and improving investment climate served as
strong force for the global corporation to invest in India.
Because of all these, India attracts large amount of FDI. At the
outset, it is well recognized and accepted fact that the FDI is
one of the key economic growth engines that help in fixing
various economic problems. In other words, FDI is perhaps the
key source that can mitigate any developing nation currency
valuation. Keeping into consideration a significant role played
by FDI in economic development, the present study is
conducted with a view to have econometric analysis of FDI in
India which includes the analysis of inflows of FDI in India
during the pre and post liberalization era; to examine the
determinants of FDI inflows as well as projection of FDI inflows
in India.
Review of Literature
Sahoo and Mathiyazhagn (2003) examined the long-term
relationship of FDI with the Gross Output (GO), Export (EX)
and Labour Productivity (LP) in the Indian economy at the
sector level by using the annual data from 1991-91 to 2001-10.
The study use the panel co- integration (PCONT) test and
revealed that there is no significant co-integrating relationship
among the variable like FDI, GO, EX and LP. Chatterjee
(2009) hypothesized that the FDI is an important factor in the
globalization process and also investigated the different aspects
of FDI at the macroeconomic level. The result provided the
Ruchita Verma, Sadashiv Baidhanathan- Foreign Direct Investment in India: An
Econometric Analysis
EUROPEAN ACADEMIC RESEARCH - Vol. II, Issue 6 / September 2014
8533
knowledge about the nature of FDI is very important and that
may help policy makers of both home and host country to take
appropriate decisions. Sahni (2012) examined the
determinants of FDI in India by taking time series data for the
period 1992-93 to 2008-09 and provided that that GDP,
inflation and Trade Openness are important factors in
attracting FDI inflows in India during post-reform period
whereas Foreign Exchange Reserves are not important factors
in explaining FDI inflows in India. Juma (2012) explored the
effect of FDI on economy growth in Sub-Saharan Africa region
using data from 43 countries over the period 1980-2009. The
ordinary least squares regressions using real GDP growth as
the dependent variable and gross FDI inflation as the
percentage of GDP as the key explanatory or independent
variable. The result provided that FDI is the associated with
higher growth in sub-Saharan Africa. Devajit (2012)
investigated the impact of FDI on the Indian economy and
provided that it is a strategic component is needed for sustained
economic growth and development of India. Therefore, further
opening up of the Indian economy is advisable to open up the
export oriented sectors and accordingly higher growth of the
economy could be achieved. Gola et. al. (2013) investigated the
impact of FDI and provided that more than 50 per cent of total
FDI inflows received came from Mauritius, Singapore and the
USA. The main reason for higher levels of investment from
Mauritius lies in the fact that India entered into a Double
Taxation Avoidance Agreement (DTAA) by which the Mauritius
is protected from taxation in India. Among the different sectors,
the service sector had received the larger proportion followed by
computer software and hardware and telecommunication
sector.
From the literature review it is evident that there is
huge importance of FDI in economic development of any nation
and by seeking such importance of FDI in economic growth, the
Ruchita Verma, Sadashiv Baidhanathan- Foreign Direct Investment in India: An
Econometric Analysis
EUROPEAN ACADEMIC RESEARCH - Vol. II, Issue 6 / September 2014
8534
present study is conducted to contribute towards the existing
literature with new, fruitful and comprehensive findings.
Objectives and Hypotheses of the Study
1. To analyze the flow of Foreign Direct Investment (FDI) in
India with reference to pre and post-liberalization period.
2. To examine the various determinants of FDI Inflows in India.
3. To forecast of the inflows of Foreign Direct Investment (FDI)
in India.
Further, the following hypotheses are constructed:
H01: There is no significant difference in the FDI inflows during
pre and post-liberalization era.
H11: There is significant difference in the FDI inflows during
pre and post-liberalization era.
H02: There is no significant relationship of independent
variables (GDP, AGGDP, EX, TB, TO, INFL, ELEC, COAL and
WPI) with FDI Inflows in India.
H12: There is significant relationship of independent variables
(GDP, AGGDP, EX, TB, TO, INFL, ELEC, COAL and WPI)
with FDI Inflows in India.
Data Base and Research Methodology
The magnitude of FDI inflows is analyzed during the pre and
post-liberalization period. Accordingly, the study covered a
period of 34 years from 1980 to 2013, which includes 1980-1991
duration as pre-liberalization and 1992-2013 as post-
liberalization. The study is based on the use of secondary data,
which is collected from the following published sources: World
Bank Statistics, Central Statistical Organization (CSO),
Secretariat of Industrial Assistance (SIA), Economic Survey of
Government of India, Department of Industrial Policy and
Promotion (DIPP) and Handbook of Statistics on the Indian
Ruchita Verma, Sadashiv Baidhanathan- Foreign Direct Investment in India: An
Econometric Analysis
EUROPEAN ACADEMIC RESEARCH - Vol. II, Issue 6 / September 2014
8535
Economy, RBI (various issues). The independent sample T-test
is used to examine whether significant variation exist or not in
the FDI inflows during pre and post-liberalization era. The
multiple regression is used to examine the various
determinants of FDI inflows in India. Beside this,
Autoregressive Integrated Moving Average (ARIMA) model is
used for the projection of FDI inflows into India. The collected
data is analyzed with the help of SPSS and E-Views.
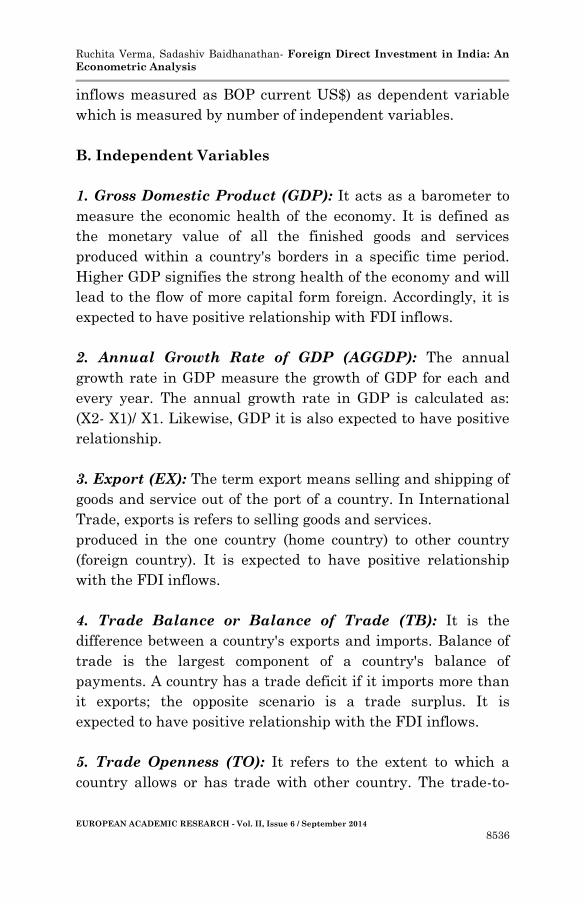
Variables Selection
The macroeconomic indicators of an economy are considered as
the major factors which affect the FDI. The analysis of existing
literatures provided a base in choosing the right combination of
variables that explain the flow of FDI in a country. In order to
choose the best variable, firstly, the major factors which
influence the flow of FDI into country are considered and
thereafter the appropriate proxy variables representing the
factors are selected for the purpose of analysis and are shown in
table 1.
Table 1 Proxy Variables Representing Factors Affecting FDI Inflows
S.N
o. Factors Proxy Variables
1 Market Size Gross Domestic Product (GDP) &
Annual Growth Gross Domestic Product (AGGDP)
2 Availability of
Natural Resource Coal Production
3 Infrastructure Electricity
4 Economy Stability Inflation, WPI
5 Government policy Trade Openness, Trade Balance, Export
A. Dependent Variable
Foreign Direct Investment (FDI) Inflows: For the
econometric analysis of FDI in India, we have taken FDI (net
Ruchita Verma, Sadashiv Baidhanathan- Foreign Direct Investment in India: An
Econometric Analysis
EUROPEAN ACADEMIC RESEARCH - Vol. II, Issue 6 / September 2014
8536
inflows measured as BOP current US$) as dependent variable
which is measured by number of independent variables.
B. Independent Variables
1. Gross Domestic Product (GDP): It acts as a barometer to
measure the economic health of the economy. It is defined as
the monetary value of all the finished goods and services
produced within a country's borders in a specific time period.
Higher GDP signifies the strong health of the economy and will
lead to the flow of more capital form foreign. Accordingly, it is
expected to have positive relationship with FDI inflows.
2. Annual Growth Rate of GDP (AGGDP): The annual
growth rate in GDP measure the growth of GDP for each and
every year. The annual growth rate in GDP is calculated as:
(X2- X1)/ X1. Likewise, GDP it is also expected to have positive
relationship.
3. Export (EX): The term export means selling and shipping of
goods and service out of the port of a country. In International
Trade, exports is refers to selling goods and services.
produced in the one country (home country) to other country
(foreign country). It is expected to have positive relationship
with the FDI inflows.
4. Trade Balance or Balance of Trade (TB): It is the
difference between a country's exports and imports. Balance of
trade is the largest component of a country's balance of
payments. A country has a trade deficit if it imports more than
it exports; the opposite scenario is a trade surplus. It is
expected to have positive relationship with the FDI inflows.
5. Trade Openness (TO): It refers to the extent to which a
country allows or has trade with other country. The trade-to-
Ruchita Verma, Sadashiv Baidhanathan- Foreign Direct Investment in India: An
Econometric Analysis
EUROPEAN ACADEMIC RESEARCH - Vol. II, Issue 6 / September 2014
8537
GDP ratio indicator is used to examine the trade openness and
it is calculated as the simple average (i.e. the mean) of total
trade (i.e. the sum of exports and imports of goods and services)
relative to GDP. This ratio is often called the trade openness
ratio and is expected to have positive relationship with FDI
inflows.
6. Inflation (INFL): It is defined as the continuous rise in the
price of goods and services and fall in the purchasing power of
money. High rate of inflation in any economy signifies the lack
of stability in economy and inability of government or central
bank to control the supply of money in the economy.
Accordingly, it is expected to have negative relation with the
FDI.
7. Infrastructure: Electricity (ELEC): The highly developed
infrastructure is one of the requirements for establishment of
industry, which include roads, rails, electricity and
communication system etc. Out of these factors, we have taken
electricity generation as variable and it is expected to have
positive relationship with the FDI inflows.
8. Natural Resource: Coal (COAL): Availability of natural
resources is one of the determinants of FDI inflows. It exhibit
that for the manufacturing, the natural resources are required
and countries in which natural resources are available the
inflows of FDI will be more.
9. Wholesale Price Index (WPI): WPI is the price of a
representative basket of wholesale goods. Some country use
WPI change as central measure of inflation and it is expected to
have negative relationship with the FDI.
Ruchita Verma, Sadashiv Baidhanathan- Foreign Direct Investment in India: An
Econometric Analysis
EUROPEAN ACADEMIC RESEARCH - Vol. II, Issue 6 / September 2014
8538
Model Description
In the present study, FDI inflows in India are assumed as the
function of GDP, AGGDP, EX, TB, TO, INFL, ELEC, COAL and
WPI. Rewriting, it in the form of an equation will give us the
following:
FDIIt =α +β1GDPt + β2AGGDPt + β3EXt + β4TBt+ β5TOt - β6INFLt +
β7ELECt + β8COALt - β9WPIt +εt
Where,
FDII = Foreign Direct Investment Inflows measured as net inflows as BOP
current US$
GDP = Gross Domestic product at constant price (amount in Rs. Billion)
AGGDP = Annual Growth Rate of Gross Domestic Product
EX = Exports (Amount in Rs. Billion)
TB = Trade Balance i.e., total Exports (Amount in Rs. Billion) – total Imports
(Amount in Rs. Billion)
TO = Trade Openness i.e., sum of Exports + Imports divided by GDP
{(Ex+Im)/GDP}
INFL = Inflation measured in term of percentages of consumer price (annual
percentage)
ELEC = Electricity generated in billion Kwh
COAL = Coal production measured in million tonnes
WPI = Wholesale price index annual average, and
t = time frame
Analysis and Interpretation
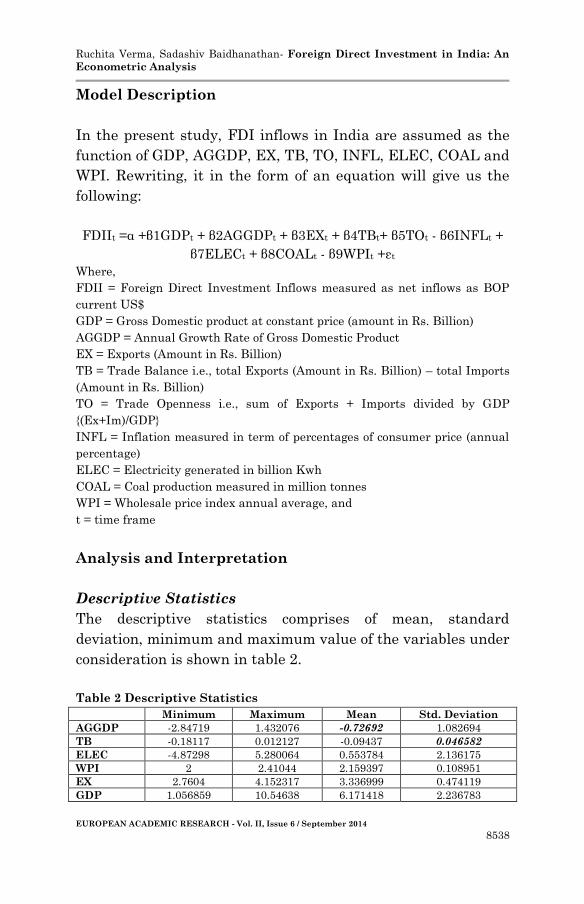
Descriptive Statistics
The descriptive statistics comprises of mean, standard
deviation, minimum and maximum value of the variables under
consideration is shown in table 2.
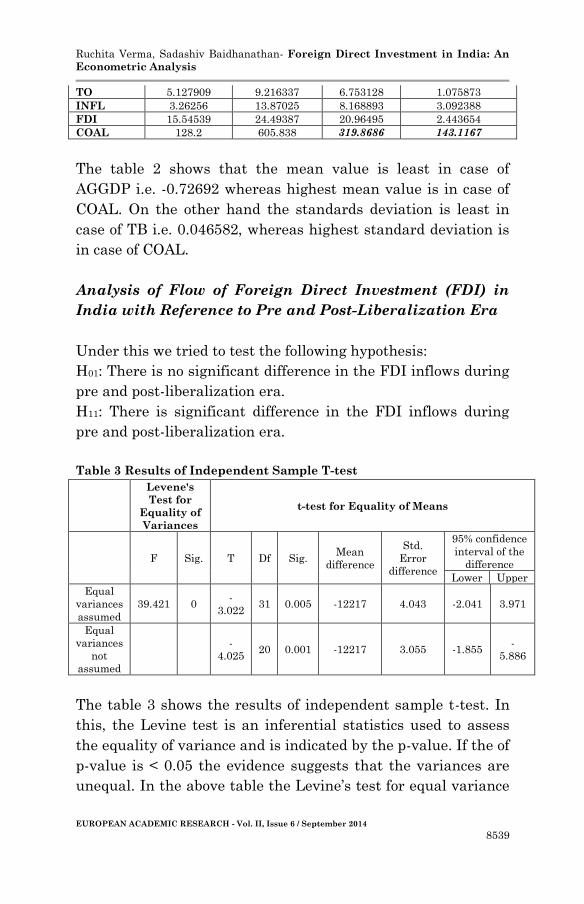
Table 2 Descriptive Statistics
Minimum Maximum Mean Std. Deviation
AGGDP -2.84719 1.432076 -0.72692 1.082694
TB -0.18117 0.012127 -0.09437 0.046582
ELEC -4.87298 5.280064 0.553784 2.136175
WPI 2 2.41044 2.159397 0.108951
EX 2.7604 4.152317 3.336999 0.474119
GDP 1.056859 10.54638 6.171418 2.236783
Ruchita Verma, Sadashiv Baidhanathan- Foreign Direct Investment in India: An
Econometric Analysis
EUROPEAN ACADEMIC RESEARCH - Vol. II, Issue 6 / September 2014
8539
TO 5.127909 9.216337 6.753128 1.075873
INFL 3.26256 13.87025 8.168893 3.092388
FDI 15.54539 24.49387 20.96495 2.443654
COAL 128.2 605.838 319.8686 143.1167
The table 2 shows that the mean value is least in case of
AGGDP i.e. -0.72692 whereas highest mean value is in case of
COAL. On the other hand the standards deviation is least in
case of TB i.e. 0.046582, whereas highest standard deviation is
in case of COAL.
Analysis of Flow of Foreign Direct Investment (FDI) in
India with Reference to Pre and Post-Liberalization Era
Under this we tried to test the following hypothesis:
H01: There is no significant difference in the FDI inflows during
pre and post-liberalization era.
H11: There is significant difference in the FDI inflows during
pre and post-liberalization era.
Table 3 Results of Independent Sample T-test
Levene's
Test for
Equality of
Variances
t-test for Equality of Means
F Sig. T Df Sig.
Mean
difference
Std.
Error
difference
95% confidence
interval of the
difference
Lower Upper
Equal
variances
assumed
39.421 0 -
3.022 31 0.005 -12217 4.043 -2.041 3.971
Equal
variances
not
assumed
-
4.025 20 0.001 -12217 3.055 -1.855
-
5.886
The table 3 shows the results of independent sample t-test. In
this, the Levine test is an inferential statistics used to assess
the equality of variance and is indicated by the p-value. If the of
p-value is < 0.05 the evidence suggests that the variances are
unequal. In the above table the Levine’s test for equal variance
Ruchita Verma, Sadashiv Baidhanathan- Foreign Direct Investment in India: An
Econometric Analysis
EUROPEAN ACADEMIC RESEARCH - Vol. II, Issue 6 / September 2014
8540
yield the p-value is .000 which is less than 0.05 meaning that
the variance are assumed to be unequal. The p-value in case of
unequal variance is .001 which is less than .05, hence our the
null hypothesis that there is no significant difference in the FDI
inflows during pre and post liberalization era is rejected at 5%
level of significant. In other words, there is significant
difference between FDI inflows during the pre and post
liberalization era.
Analysis of Various Determinants of FDI Inflows in India
Under this section the various determinants of FDI inflows in
India analyzed and we tried to test the following hypothesis:
H02: There is no significant relationship of independent
variables (GDP, AGGDP, EX, TB, TO, INFL, ELEC, COAL, and
WPI) with FDI Inflows in India.
H12 : There is significant relationship of independent variables
(GDP, AGGDP, EX, TB, TO, INFL, ELEC, COAL, and WPI)
with FDI Inflows in India.
In order to analyze the various determinants of FDI
Inflows in India, multiple regression is applied and results
obtained are discussed are followings headings and tables.
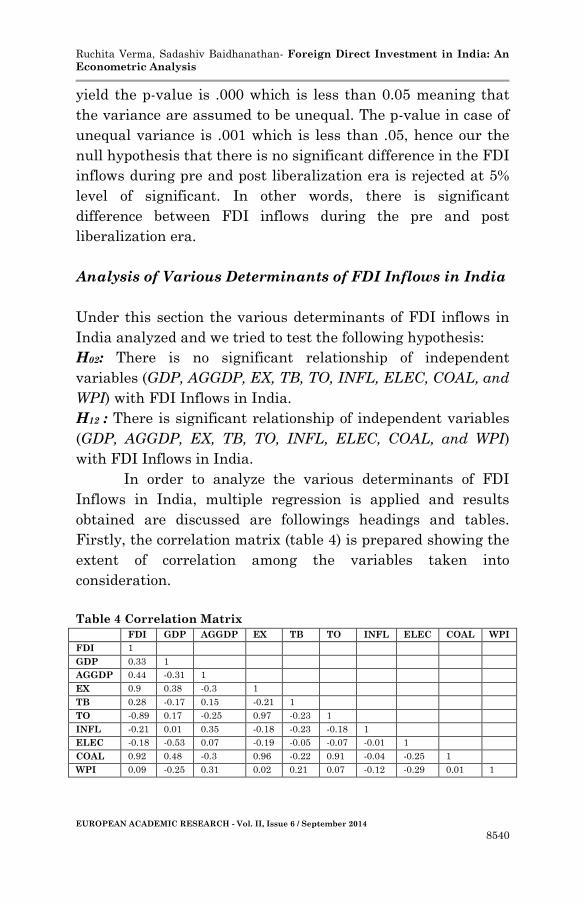
Firstly, the correlation matrix (table 4) is prepared showing the
extent of correlation among the variables taken into
consideration.
Table 4 Correlation Matrix
FDI GDP AGGDP EX TB TO INFL ELEC COAL WPI
FDI 1
GDP 0.33 1
AGGDP 0.44 -0.31 1
EX 0.9 0.38 -0.3 1
TB 0.28 -0.17 0.15 -0.21 1
TO -0.89 0.17 -0.25 0.97 -0.23 1
INFL -0.21 0.01 0.35 -0.18 -0.23 -0.18 1
ELEC -0.18 -0.53 0.07 -0.19 -0.05 -0.07 -0.01 1
COAL 0.92 0.48 -0.3 0.96 -0.22 0.91 -0.04 -0.25 1
WPI 0.09 -0.25 0.31 0.02 0.21 0.07 -0.12 -0.29 0.01 1
Ruchita Verma, Sadashiv Baidhanathan- Foreign Direct Investment in India: An
Econometric Analysis
EUROPEAN ACADEMIC RESEARCH - Vol. II, Issue 6 / September 2014
8541
The table 4 shows that the GDP, AGGDP, EX, TB, COAL and
WPI has positive relationship with FDI, whereas TO, INFL,
ELEC has negative relationship with FDI. The AGGDP, TB,
ELEC, WPI has negative relationship with GDP, whereas EX,
TO, INFL, COAL has positive relation with GDP.
Table 5 Results of Multiple Regression
Unstandardized Coefficients
T Sig. Model B Std. Error Beta
Constant 3.771 2.491
1.514 .143
GDP 1.198 6.508 .217 1.841 .048*
AGGDP 3.770 5.046 .064 .747 .462
EX 2.349 1.463 .798 1.605 .122
TB 4.954 2.279 .580 2.173 .040*
TO -1.785 1.384 -.295 -1.290 .209
INFL -.165 .092 -.228 -1.808 .130
ELEC -6.461 3.758 -.374 -1.719 .098
COAL 9.540 3.981 1.108 2.396 .025*
WPI 5.525 2.273 .181 2.431 .023*
R Square= .0965 F= 15.827 p-value=.004
*Significant at 5% Level
The table 5 shows that the value of R Square is .965, which
indicates that 96.5% of the variation in FDI is due to
independents variables taken into consideration. The P-value
helps us to accept or reject the null hypothesis. Here, the p-
value is .004 which is more than .05. Hence, our null hypothesis
which states that there is no significant relationship of
independent variables (GDP, AGGDP, EX, TB, TO, INFL,
ELEC, COAL and WPI) with FDI Inflows in India is rejected. In
other words, there is significant relationship of independent
variables with FDI inflows.
FDIIt= 3.771+1.198GDPt+3.770AGGDPt +2.349EXt+4.954TBt –
1.785TOt –.165INFLt –.6.461ELECt +9.540COALt +5.525WPIt
Ruchita Verma, Sadashiv Baidhanathan- Foreign Direct Investment in India: An
Econometric Analysis
EUROPEAN ACADEMIC RESEARCH - Vol. II, Issue 6 / September 2014
8542
Projection of FDI inflows in India for 5 years (2014 to
2018)
ARIMA Methodology is used in order to predict the value of FDI
inflows in India. The projection of FDI Inflows in India involves
various stages as: Firstly, the time series are tested for
stationarity. Secondly, based on BOX –Jenkins methodology
appropriate models are constructed to estimate the FDI
Inflows. Finally, forecasting performance of the various type of
ARIMA models are compared by computing various statistics.
Test for the Stationarity of the Series
In ARIMA model, first of all we test the stationary of the series
using Augmented Dickey-Fuller (ADF) test.
Null Hypothesis: The Series is not stationary
Alternate Hypothesis: The Series is stationary.
Table 6 Results of Augmented Dickey-Fuller Test
The table 6 shows the results of ADF test at level, first
difference and second difference. Here, in order to meet the
assumption we require rejection the null hypothesis which
states that series is non stationary. If p-value is less than .05
then we will reject the null hypothesis. Accordingly the null
hypothesis is rejected in case of GDP, AGGDP, INFL, ELEC
and WPI at level. On the other hand FDI, EX, TO series become
Variables P-Value Achievement of Stationary
FDI 0.0000 At First Difference
GDP 0.0004 At Level
AGGDP 0.0000 At Level
EX 0.0006 At First Difference
TB 0.0000 At Second Difference
TO 0.0001 At First Difference
INFL 0.0092 At Level
ELEC 0.0047 At Level
COAL 0.0000 At Second Difference
WPI 0.0014 At Level
Ruchita Verma, Sadashiv Baidhanathan- Foreign Direct Investment in India: An
Econometric Analysis
EUROPEAN ACADEMIC RESEARCH - Vol. II, Issue 6 / September 2014
8543
stationary at first differencing, whereas TB and COAL series
become stationary after second level differencing.
Determination of ARIMA (p, d, q) Model
After getting the stationary in all the series, the next step is to
determine the ARIMA (p, d, and q) order. The ACF and PACF
plots are constructed in order to determine the ARIMA order.
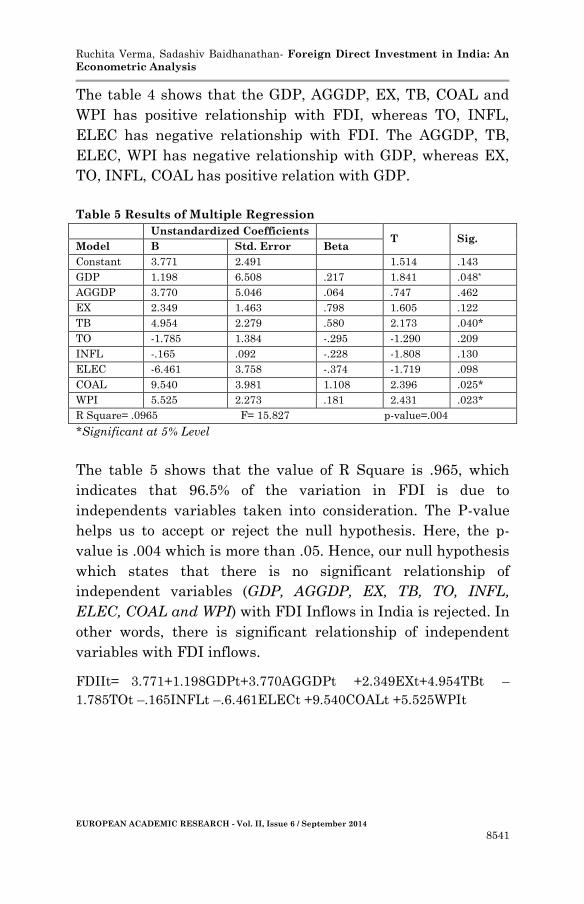
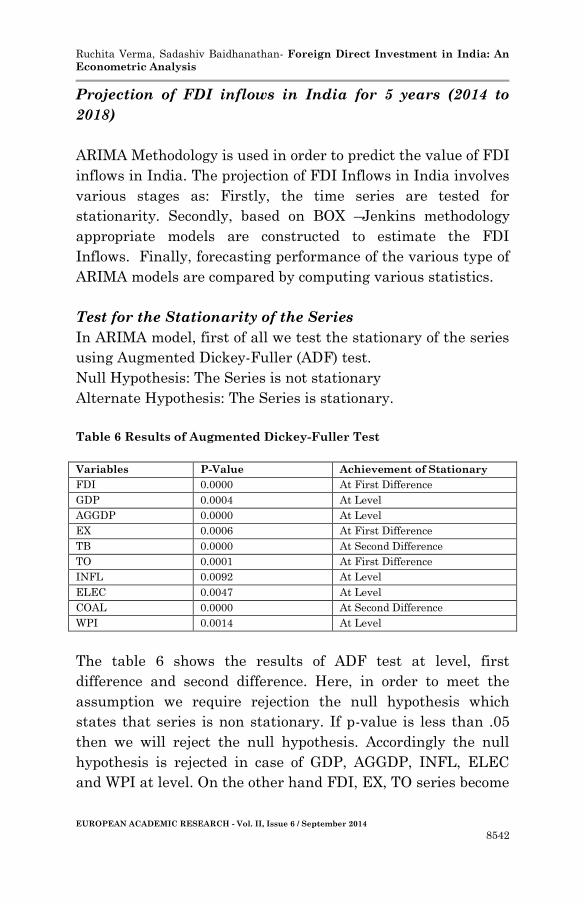
The ACF and PACF plots are shown for FDI series in before
log/lag transformation and after log/lag transformation in
figure 1 and 2.
Figure 1 ACF and PACF before log/lag of FDI series
Ruchita Verma, Sadashiv Baidhanathan- Foreign Direct Investment in India: An
Econometric Analysis
EUROPEAN ACADEMIC RESEARCH - Vol. II, Issue 6 / September 2014
8544
Figure 2 ACF and PACF after log/lag of FDI series
On the basis of results of figure 1 and 2 and also by hit and trail
the following orders to ARIMA model are selected: ARIMA
(0,1,0); ARIMA (1,1,0); ARIMA (1,0,0) and ARIMA (1,1,1)
Results for Different ARIMA Models
In the view of above, various order of ARIMA are selected and
time series ARIMA model applied using SPSS. The results
obtained are shown in table 7.
Table 7 Results for Different ARIMA Model
(ARIMA
0,1,0)
(ARIMA
1,1,0)
ARIMA
(1,0,0)
ARIMA
(1,1,1)
R-Squared .781 .782 .783 .723
RMSE 5.83 5.89 5.82 5.84
MAPE 353.922 327.862 126.591 332.439
MAE 3.079 3.063 3.048 3.853
MaxAPE 6.718 6.215 1.881 6.488
MaxMAE 1.787 1.745 2.035 1.884
Normalized BIC 45.177 45.208 45.119 45.296
The table 7 shows the value of R-Squared, RMSE, MAPE, MAE,
MaxAPE, MaxMAE, and Normalized BIC. For the selection of
appropriate model four criterions namely, Normalized
Bayessian Information Criteria (BIC), the R-Square, Root Mean
Square Error (RMSE) and the Mean Absolute Percentage error
(MAPE) are used. The high value of R-Square and lower value
of BIC, MAPE, RMSE are preferable. From the above table the
Ruchita Verma, Sadashiv Baidhanathan- Foreign Direct Investment in India: An
Econometric Analysis
EUROPEAN ACADEMIC RESEARCH - Vol. II, Issue 6 / September 2014
8545
set criteria is found in ARIMA (1,0,0), accordingly it assumed as
best model and used to predict value of FDI inflows in future.
Checking of Statistical Significance or Model Estimation
This is concerned with the checking of statistical significance of
the model selected above. For this the Ljung-Box Statistics are
considered which is a diagnostic tool used to test the lack of fit
of a time series model. The Ljung-Box Statistics, which shows
that model is not significantly different from 0, with value of
6.28 for 17 DF and associated p-value of 0.992, thus failing to
reject the null hypothesis of no remaining significant AR in the
residual of the model. Beside this the R-squared is .783 which is
high and desirable at the same time RSMS is minimum.
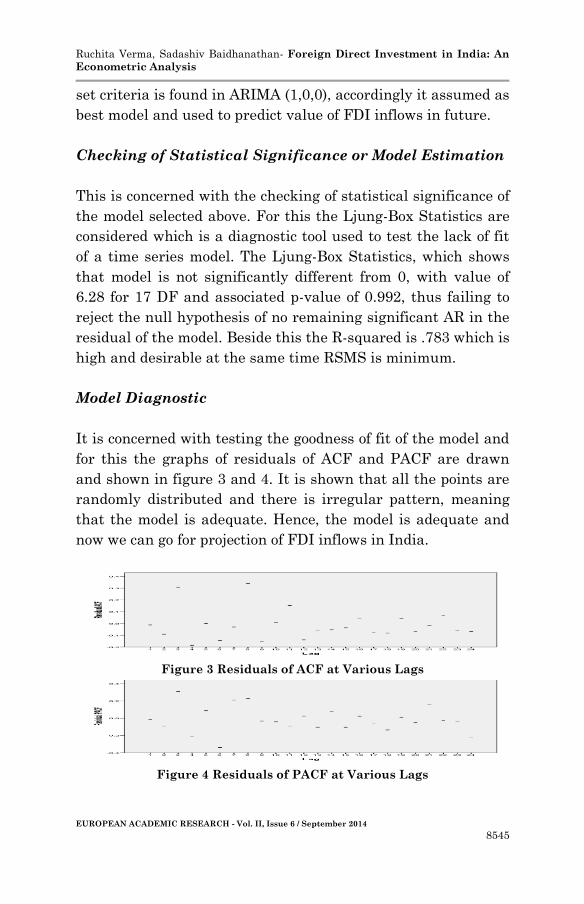
Model Diagnostic
It is concerned with testing the goodness of fit of the model and
for this the graphs of residuals of ACF and PACF are drawn
and shown in figure 3 and 4. It is shown that all the points are
randomly distributed and there is irregular pattern, meaning
that the model is adequate. Hence, the model is adequate and
now we can go for projection of FDI inflows in India.
Figure 3 Residuals of ACF at Various Lags
Figure 4 Residuals of PACF at Various Lags
Ruchita Verma, Sadashiv Baidhanathan- Foreign Direct Investment in India: An
Econometric Analysis
EUROPEAN ACADEMIC RESEARCH - Vol. II, Issue 6 / September 2014
8546
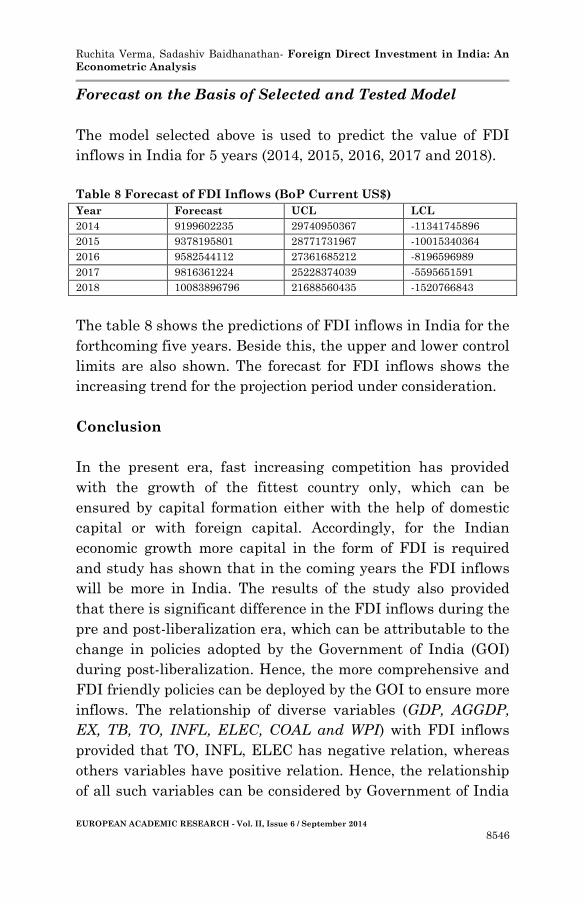
Forecast on the Basis of Selected and Tested Model
The model selected above is used to predict the value of FDI
inflows in India for 5 years (2014, 2015, 2016, 2017 and 2018).
Table 8 Forecast of FDI Inflows (BoP Current US$)
Year Forecast UCL LCL
2014 9199602235 29740950367 -11341745896
2015 9378195801 28771731967 -10015340364
2016 9582544112 27361685212 -8196596989
2017 9816361224 25228374039 -5595651591
2018 10083896796 21688560435 -1520766843
The table 8 shows the predictions of FDI inflows in India for the
forthcoming five years. Beside this, the upper and lower control
limits are also shown. The forecast for FDI inflows shows the
increasing trend for the projection period under consideration.
Conclusion
In the present era, fast increasing competition has provided
with the growth of the fittest country only, which can be
ensured by capital formation either with the help of domestic
capital or with foreign capital. Accordingly, for the Indian
economic growth more capital in the form of FDI is required
and study has shown that in the coming years the FDI inflows
will be more in India. The results of the study also provided
that there is significant difference in the FDI inflows during the
pre and post-liberalization era, which can be attributable to the
change in policies adopted by the Government of India (GOI)
during post-liberalization. Hence, the more comprehensive and
FDI friendly policies can be deployed by the GOI to ensure more
inflows. The relationship of diverse variables (GDP, AGGDP,
EX, TB, TO, INFL, ELEC, COAL and WPI) with FDI inflows
provided that TO, INFL, ELEC has negative relation, whereas
others variables have positive relation. Hence, the relationship
of all such variables can be considered by Government of India
Ruchita Verma, Sadashiv Baidhanathan- Foreign Direct Investment in India: An
Econometric Analysis
EUROPEAN ACADEMIC RESEARCH - Vol. II, Issue 6 / September 2014
8547
(GOI) while determining the quantum and type of FDI inflows.
The projection of FDI inflows for the upcoming 5 years has
shown increasing trends. Accordingly, a timely and effective
action can be taken by the Government of India to ensure more
inflows in the productive areas or where there is actual
requirement of capital.
REFERENCES
Chatterjee, D. FDI and FII. 2007. Business Today
Devajit, Mahanta. “Impact of Foreign Direct Investment on
Indian Economy.” Research Journal of Management
Science 1, no. 2 (September 2012): 29-31.
Gola, Kali R, Mridul Dharwal, and Ankur Agarwal. “Role of
Foreingn Direct Investment in the Development of
Indian Economy.” GYANPRATHA- ACCMAN Journal of
Management 5, no. 1 (2013).
Hamilton, James D. Time Series Analsyis. Princeton University
Press, 1994.
_______. Time Series Analysis. Princeton University Press,
1994.
Juma, Mary Ann. The Effect of Foreign Direct Investment on
Growth in Sub-Saharan Africa. 3 May 2012.
Sahni, Priyanka. “Trends and Determinnats of Foreign Direct
Investment in India: An Empirical Investigation.”
International Journal of Marketing and Technology 2,
no. 8 (August 2012): 144-161.
Sahoo, Dukhabandhu, and Maathai K Mathiyazhagn.
“Economic Growth in India: Does Foreign Direct
Investment Inflow Matter?” singapore Economic Review
48, no. 2 (2003).
http://www.oecd-ilibrary.org
http://rbidocs.rbi.org.in/rdocs/Publications/PDFs/FHB16091
3FLS.pdf

Ruchita Verma, Sadashiv Baidhanathan- Foreign Direct Investment in India: An
Econometric Analysis
EUROPEAN ACADEMIC RESEARCH - Vol. II, Issue 6 / September 2014
8548
www.docs.is.ed.ac.uk/skills/documents/3663/SPSSForecastin
g17.0.pd
http://dipp.nic.in/English/default.aspx
http://indiabudget.nic.in/survey.asp
http://www.cso-yemen.org/?lng=english&
http://data.worldbank.org/