Embed Size (px)
Citation preview
Produced July 2009
A Report for the
Indiana Economic Development Corporation
Foreign Direct Investment in Indiana

Prepared by the Indiana Business Research Center at Indiana University’s Kelley School of BusinessMatt Kinghorn ....................................... Economic Analyst
Timothy Slaper, Ph.D. ... Director of Economic Analysis
Jerry Conover, Ph.D. ..............................................Director
Carol O. Rogers ........................................ Deputy Director
Rachel Justis .............................................. Managing Editor
Molly Manns ............................................ Graphic Designer
Flora Lewis ................................................ Quality Control
Carol Stewart ............................................ Quality Control
Support comes from• Indiana Economic Development Corporation
• Indiana University Center for International Business
Education and Research
Online Access to the ReportAccess the report electronically at www.stats.indiana.
edu/topic/exports.asp. Direct questions to the Indiana
Business Research Center at [email protected] or
812-855-5507.
Printing Provided byDuke Energy Economic Development
TM
TABLE OF CONTENTSForeign Direct Investment in Indiana: July 2009
TABLE OF CONTENTS . . . . . . . . . . . . . . . . . . . . . . . . . . . . . . . . . . . . . . . . . . . . . III
EXECUTIVE SUMMARY . . . . . . . . . . . . . . . . . . . . . . . . . . . . . . . . . . . . . . . . . . . . . 1Indiana Highlights . . . . . . . . . . . . . . . . . . . . . . . . . . . . . . . . . . . . . . . . . . . . . . . . . . . . . . . . . . . . 2Indiana FDI Announcements, 2006 to 2008 . . . . . . . . . . . . . . . . . . . . . . . . . . . . . . . . . . . . . . . . 2Notes . . . . . . . . . . . . . . . . . . . . . . . . . . . . . . . . . . . . . . . . . . . . . . . . . . . . . . . . . . . . . . . . . . . . . . 2
THE GLOBAL FDI ENVIRONMENT . . . . . . . . . . . . . . . . . . . . . . . . . . . . . . . . . . . . . 4World FDI Inflows and Outflows . . . . . . . . . . . . . . . . . . . . . . . . . . . . . . . . . . . . . . . . . . . . . . . . . 4Mergers and Acquisitions . . . . . . . . . . . . . . . . . . . . . . . . . . . . . . . . . . . . . . . . . . . . . . . . . . . . . . . 5Exporters of FDI . . . . . . . . . . . . . . . . . . . . . . . . . . . . . . . . . . . . . . . . . . . . . . . . . . . . . . . . . . . . . . 7U.S. FDI Inflows and Outflows . . . . . . . . . . . . . . . . . . . . . . . . . . . . . . . . . . . . . . . . . . . . . . . . . . 8Notes . . . . . . . . . . . . . . . . . . . . . . . . . . . . . . . . . . . . . . . . . . . . . . . . . . . . . . . . . . . . . . . . . . . . . . 8
OECD COUNTRIES AND FDI . . . . . . . . . . . . . . . . . . . . . . . . . . . . . . . . . . . . . . . . 9FDI Inflows and Outflows . . . . . . . . . . . . . . . . . . . . . . . . . . . . . . . . . . . . . . . . . . . . . . . . . . . . . . 9Relationship of Inflows and Outflows . . . . . . . . . . . . . . . . . . . . . . . . . . . . . . . . . . . . . . . . . . . . 10Notes . . . . . . . . . . . . . . . . . . . . . . . . . . . . . . . . . . . . . . . . . . . . . . . . . . . . . . . . . . . . . . . . . . . . . 10
FDI IN THE UNITED STATES AND INDIANA . . . . . . . . . . . . . . . . . . . . . . . . . . . . . . . .11FDI-Related Employment . . . . . . . . . . . . . . . . . . . . . . . . . . . . . . . . . . . . . . . . . . . . . . . . . . . . . . 11Manufacturing Employment . . . . . . . . . . . . . . . . . . . . . . . . . . . . . . . . . . . . . . . . . . . . . . . . . . . . 12Investment . . . . . . . . . . . . . . . . . . . . . . . . . . . . . . . . . . . . . . . . . . . . . . . . . . . . . . . . . . . . . . . . . 15FDI by Industry . . . . . . . . . . . . . . . . . . . . . . . . . . . . . . . . . . . . . . . . . . . . . . . . . . . . . . . . . . . . . 17The Origin of FDI . . . . . . . . . . . . . . . . . . . . . . . . . . . . . . . . . . . . . . . . . . . . . . . . . . . . . . . . . . . 19Notes . . . . . . . . . . . . . . . . . . . . . . . . . . . . . . . . . . . . . . . . . . . . . . . . . . . . . . . . . . . . . . . . . . . . . 21
FDI ANNOUNCEMENTS, 2006 TO 2008 . . . . . . . . . . . . . . . . . . . . . . . . . . . . . . . . 22FDI Announcements by Industry . . . . . . . . . . . . . . . . . . . . . . . . . . . . . . . . . . . . . . . . . . . . . . . . 23FDI Announcements by Business Activity . . . . . . . . . . . . . . . . . . . . . . . . . . . . . . . . . . . . . . . . . 24FDI Announcements by Source Country . . . . . . . . . . . . . . . . . . . . . . . . . . . . . . . . . . . . . . . . . . 26Conclusion . . . . . . . . . . . . . . . . . . . . . . . . . . . . . . . . . . . . . . . . . . . . . . . . . . . . . . . . . . . . . . . . . 26Notes . . . . . . . . . . . . . . . . . . . . . . . . . . . . . . . . . . . . . . . . . . . . . . . . . . . . . . . . . . . . . . . . . . . . . 26
APPENDIX . . . . . . . . . . . . . . . . . . . . . . . . . . . . . . . . . . . . . . . . . . . . . . . . . . . . 27International Investment Commitments in Indiana, 2005 to 2008. . . . . . . . . . . . . . . . . . . . . . . 27International Investment Commitments in Indiana, 2005 to 2008. . . . . . . . . . . . . . . . . . . . . . . 30New Job Commitments by International Businesses in Indiana, 2005 to 2008 . . . . . . . . . . . . . 31New International Investment Commitments in Indiana, 2005 to 2008 . . . . . . . . . . . . . . . . . . 32
Despite possible warning signs in fi nancial
and credit markets in 2007, global foreign
direct investment (FDI) hit a record high
of $1.8 trillion, according to the United Nations.
Many observers, however, expect the global economic
crisis will undercut the growth of FDI in 2008 and 2009.
United Nations Conference on Trade and Development
(UNCTAD), in its 2008 World Investment Report,
estimates that global FDI fl ows for 2008 will drop to $1.6
trillion, a 10 percent decrease from the 2007 mark. Th e
Organisation for Economic Co-operation and Development
(OECD) predicts that FDI infl ows to its 29 member nations
will decline by 13 percent from 2007
to 2008 while FDI outfl ows from
these same countries are expected to
drop 6 percent. Th e OECD expects
even sharper declines in 2009.1
Th ere are some bright spots
for the FDI forecast, however.
UNCTAD’s annual World
Investment Prospects Survey, 2008–2010 reports that
many transnational corporations (TNCs), while certainly
reigning in expectations, remain generally optimistic about
near-term FDI activity.2 A survey of 226 TNCs conducted
in the second quarter of 2008 fi nds that 68 percent of
companies intend to increase investment in the 2008 to
2010 period. Th e United States ranked as the third-largest
likely destination of FDI over this period, behind China
and India. Th e survey respondents list the size of the
local market, the quality of infrastructure and the skilled
labor force as prime reasons investing in the United States
remains attractive. Economic conditions have deteriorated
considerably since the second quarter of 2008 and, as a
result, the next survey may not refl ect similar optimism.
No single data source for FDI presents a complete picture.
UNCTAD and the OECD are rich sources of information
at the international level, but are not granular enough to
report FDI activity in Indiana or other states. Th e U.S.
Bureau of Economic Analysis reports offi cial FDI trends
at the state level, but the information is not timely; 2006
is the most recent year available. Th e Indiana Economic
Development Corporation and the investment monitoring
service FDI Markets3 track Greenfi eld and expansion
investment announcements almost in real time. Th ese
announcements of expected investments provide a more
timely sense of FDI activity.4 Each of these data sources use
diff erent concepts and data collection methods. Each has its
strengths and weaknesses. As a result, this report uses these
data sources collectively in order to present as complete a
picture as possible.
Th e largest recipients of FDI in 2007 were the United
States ($233 billion) and the United Kingdom ($223
billion), which together accounted for one-quarter of global
infl ows for the year. Other top recipients were France ($158
billion), Canada ($109 billion) and the Netherlands ($99
billion). Increased FDI fl ows were not limited to North
America and Western Europe. Developing economies as a
group saw a 21 percent increase in FDI infl ows from 2006
to 2007. Transition economies (former Soviet republics and
the countries of Southeast Europe) experienced a 50 percent
increase.
Th e top sources of FDI were the United States ($314
billion), the United Kingdom ($266 billion) and France
($225 billion). Th e United States was a net-exporter of FDI
in 2007, with outfl ows exceeding infl ows by $81 billion. Th e
2007 net FDI is contrary to the longer term trend for the
United States. Between 1997 and 2007, the United States
has been a cumulative net-importer of FDI.
According to UNCTAD, the growth in global FDI was
due largely to continued consolidation through mergers
and acquisitions (M&As). Th e value of M&A deals in 2007
totaled $1.6 trillion, which was up 46 percent over the
previous year and was 21 percent higher than the previous
high watermark registered in 2000. Fift y-nine percent of
the value of M&A transactions occurred in the service
sector. M&A deals in manufacturing accounted for another
35 percent of the total. Th e uptick in FDI was also fueled
by strong economic growth and corporate performance
in many parts of the world through 2007. UNCTAD
cautioned, however, that the high dollar values of FDI were
partially infl ated by the depreciation of the dollar measured
against other currencies.
EXECUTIVE SUMMARY
The largest recipients of FDI in 2007 were the
United States and the United Kingdom.”
1 Indiana’s Foreign Direct Investment July 2009
Employment in majority-owned U.S. affi liates grew by
129,000 from 2005 to 2006, totaling 5.3 million. Th is rise
in employment was accompanied by a 7.7 percent increase
in expenditures for property, plant and equipment by U.S.
affi liates over the same period.5
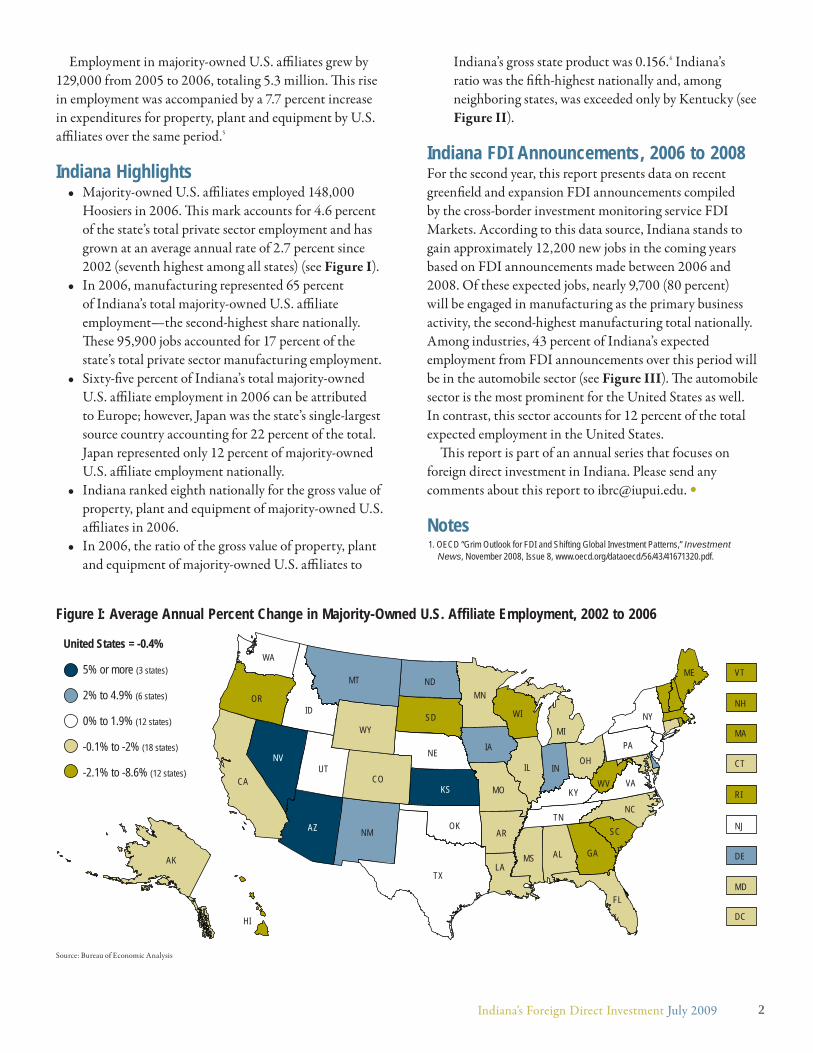
Indiana Highlights• Majority-owned U.S. affi liates employed 148,000
Hoosiers in 2006. Th is mark accounts for 4.6 percent
of the state’s total private sector employment and has
grown at an average annual rate of 2.7 percent since
2002 (seventh highest among all states) (see Figure I).
• In 2006, manufacturing represented 65 percent
of Indiana’s total majority-owned U.S. affi liate
employment—the second-highest share nationally.
Th ese 95,900 jobs accounted for 17 percent of the
state’s total private sector manufacturing employment.
• Sixty-fi ve percent of Indiana’s total majority-owned
U.S. affi liate employment in 2006 can be attributed
to Europe; however, Japan was the state’s single-largest
source country accounting for 22 percent of the total.
Japan represented only 12 percent of majority-owned
U.S. affi liate employment nationally.
• Indiana ranked eighth nationally for the gross value of
property, plant and equipment of majority-owned U.S.
affi liates in 2006.
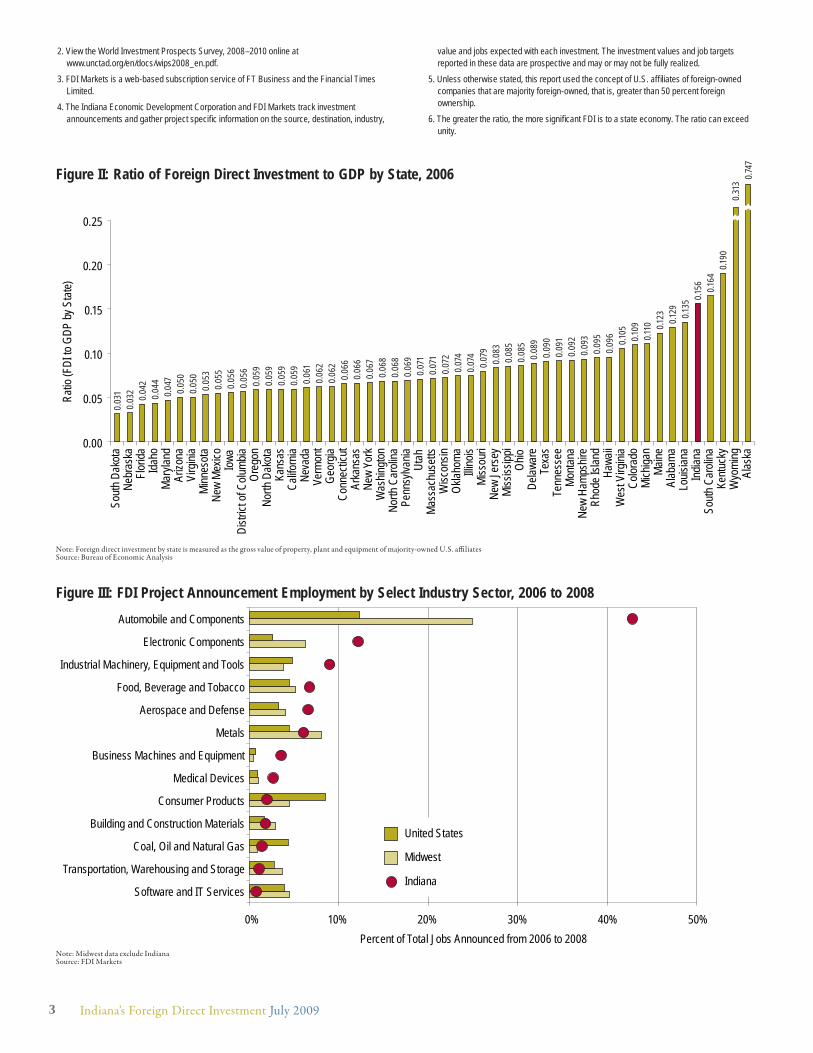
• In 2006, the ratio of the gross value of property, plant
and equipment of majority-owned U.S. affi liates to
Indiana’s gross state product was 0.156.6 Indiana’s
ratio was the fi ft h-highest nationally and, among
neighboring states, was exceeded only by Kentucky (see
Figure II).
Indiana FDI Announcements, 2006 to 2008For the second year, this report presents data on recent
greenfi eld and expansion FDI announcements compiled
by the cross-border investment monitoring service FDI
Markets. According to this data source, Indiana stands to
gain approximately 12,200 new jobs in the coming years
based on FDI announcements made between 2006 and
2008. Of these expected jobs, nearly 9,700 (80 percent)
will be engaged in manufacturing as the primary business
activity, the second-highest manufacturing total nationally.
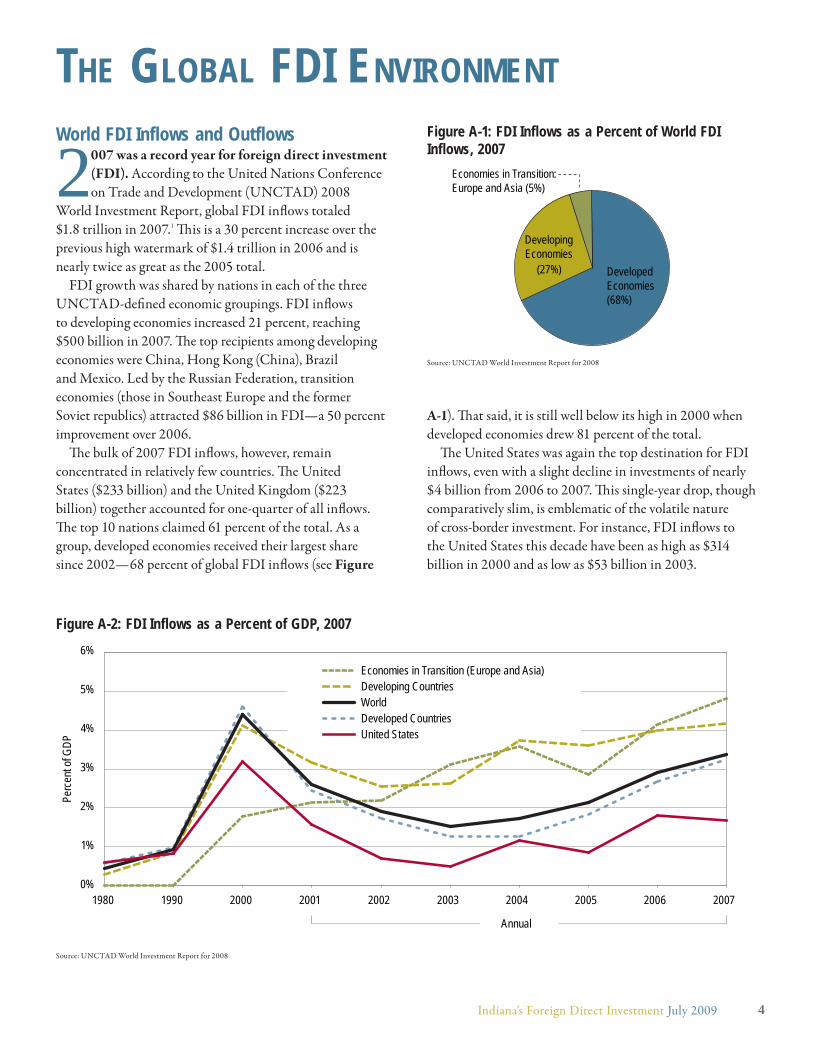
Among industries, 43 percent of Indiana’s expected
employment from FDI announcements over this period will
be in the automobile sector (see Figure III). Th e automobile
sector is the most prominent for the United States as well.
In contrast, this sector accounts for 12 percent of the total
expected employment in the United States.
Th is report is part of an annual series that focuses on
foreign direct investment in Indiana. Please send any
comments about this report to [email protected]. •
Notes1. OECD “Grim Outlook for FDI and Shifting Global Investment Patterns,” Investment
News, November 2008, Issue 8, www.oecd.org/dataoecd/56/43/41671320.pdf.
Figure I: Average Annual Percent Change in Majority-Owned U.S. Affiliate Employment, 2002 to 2006
Source: Bureau of Economic Analysis
5% or more (3 states)
United States = -0.4%
2% to 4.9% (6 states)
0% to 1.9% (12 states)
-0.1% to -2% (18 states)
-2.1% to -8.6% (12 states)
WA
MTME
ND
SDWY
WIID
VT
MNOR NH
IAMA
NE
NY
PA
CT
RI
NJ
INNV
UTCA
OHIL
DC
DE
WV
MD
COKYKS VA
MO
AZ OK
NCTN
TX
NM
ALMS GA
SCAR
LA
FL
HI
AK
MI
2Indiana’s Foreign Direct Investment July 2009
2. View the World Investment Prospects Survey, 2008–2010 online at www.unctad.org/en/docs/wips2008_en.pdf.
3. FDI Markets is a web-based subscription service of FT Business and the Financial Times Limited.
4. The Indiana Economic Development Corporation and FDI Markets track investment announcements and gather project specifi c information on the source, destination, industry,
value and jobs expected with each investment. The investment values and job targets reported in these data are prospective and may or may not be fully realized.
5. Unless otherwise stated, this report used the concept of U.S. affi liates of foreign-owned companies that are majority foreign-owned, that is, greater than 50 percent foreign ownership.
6. The greater the ratio, the more signifi cant FDI is to a state economy. The ratio can exceed unity.
Figure II: Ratio of Foreign Direct Investment to GDP by State, 2006
Note: Foreign direct investment by state is measured as the gross value of property, plant and equipment of majority-owned U.S. affi liatesSource: Bureau of Economic Analysis
0.03
10.
032 0.04
20.
044
0.04
70.
050
0.05
00.
053
0.05
50.
056
0.05
60.
059
0.05
90.
059
0.05
90.
061
0.06
20.
062
0.06
60.
066
0.06
70.
068
0.06
80.
069
0.07
10.
071
0.07
20.
074
0.07
40.
079
0.08
30.
085
0.08
50.
089
0.09
00.
091
0.09
20.
093
0.09
50.
096
0.105
0.109
0.110 0.1
23 0.129 0.1
350.1
56 0.164
0.190
0.31
30.7
47
0.00
0.05
0.10
0.15
0.20
0.25
Sout
h Dak
ota
Nebr
aska
Florid
aId
aho
Mar
yland
Arizo
naVi
rgini
aMi
nnes
ota
New
Mexic
oIo
waDi
strict
of C
olumb
iaOr
egon
North
Dak
ota
Kans
asCa
liforn
iaNe
vada
Verm
ont
Geor
giaCo
nnec
ticut
Arka
nsas
New
York
Was
hingto
nNo
rth C
aroli
naPe
nnsy
lvania
Utah
Mass
achu
setts
Wisc
onsin
Oklah
oma
Illino
isMi
ssou
riNe
w Je
rsey
Miss
issipp
iOh
ioDe
lawar
eTe
xas
Tenn
esse
eM
onta
naNe
w Ha
mpsh
ireRh
ode I
sland
Hawa
iiW
est V
irgini
aCo
lorad
oMi
chiga
nM
aine
Alab
ama
Louis
iana
Indian
aSo
uth C
aroli
naKe
ntuck
yW
yomi
ngAl
aska
Ratio
(FDI
to G
DP by
Sta
te)
0% 10% 20% 30% 40% 50%
United States
Midwest
IndianaSoftware and IT Services
Transportation, Warehousing and Storage
Coal, Oil and Natural Gas
Building and Construction Materials
Consumer Products
Medical Devices
Business Machines and Equipment
Metals
Aerospace and Defense
Food, Beverage and Tobacco
Industrial Machinery, Equipment and Tools
Electronic Components
Automobile and Components
Percent of Total Jobs Announced from 2006 to 2008
Figure III: FDI Project Announcement Employment by Select Industry Sector, 2006 to 2008
Note: Midwest data exclude IndianaSource: FDI Markets
3 Indiana’s Foreign Direct Investment July 2009
World FDI Inflows and Outflows
2007 was a record year for foreign direct investment
(FDI). According to the United Nations Conference
on Trade and Development (UNCTAD) 2008
World Investment Report, global FDI infl ows totaled
$1.8 trillion in 2007.1 Th is is a 30 percent increase over the
previous high watermark of $1.4 trillion in 2006 and is
nearly twice as great as the 2005 total.
FDI growth was shared by nations in each of the three
UNCTAD-defi ned economic groupings. FDI infl ows
to developing economies increased 21 percent, reaching
$500 billion in 2007. Th e top recipients among developing
economies were China, Hong Kong (China), Brazil
and Mexico. Led by the Russian Federation, transition
economies (those in Southeast Europe and the former
Soviet republics) attracted $86 billion in FDI—a 50 percent
improvement over 2006.
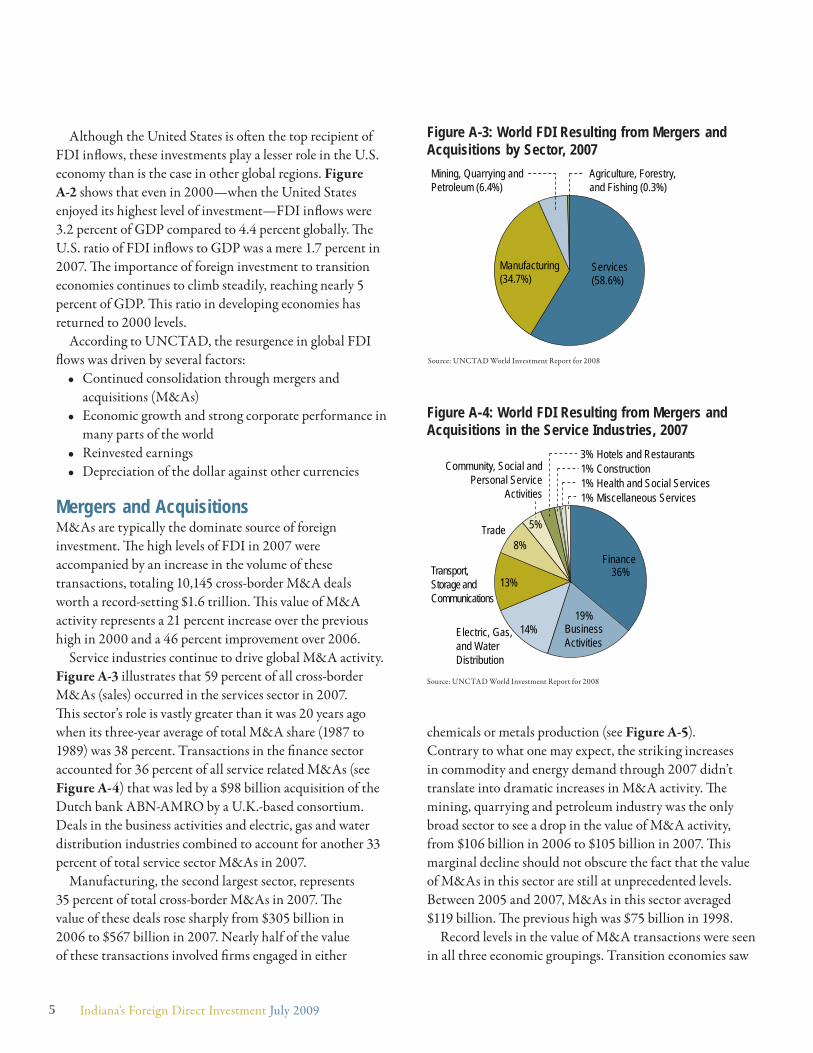
Th e bulk of 2007 FDI infl ows, however, remain
concentrated in relatively few countries. Th e United
States ($233 billion) and the United Kingdom ($223
billion) together accounted for one-quarter of all infl ows.
Th e top 10 nations claimed 61 percent of the total. As a
group, developed economies received their largest share
since 2002—68 percent of global FDI infl ows (see Figure
A-1). Th at said, it is still well below its high in 2000 when
developed economies drew 81 percent of the total.
Th e United States was again the top destination for FDI
infl ows, even with a slight decline in investments of nearly
$4 billion from 2006 to 2007. Th is single-year drop, though
comparatively slim, is emblematic of the volatile nature
of cross-border investment. For instance, FDI infl ows to
the United States this decade have been as high as $314
billion in 2000 and as low as $53 billion in 2003.
THE GLOBAL FDI ENVIRONMENT
Source: UNCTAD World Investment Report for 2008
Source: UNCTAD World Investment Report for 2008
Figure A-1: FDI Inflows as a Percent of World FDI Inflows, 2007
Figure A-2: FDI Inflows as a Percent of GDP, 2007
Developed Economies(68%)
DevelopingEconomies
Economies in Transition: Europe and Asia (5%)
(27%)
0%
1%
2%
3%
4%
5%
6%
1980 1990 2000 2001 2002 2003 2004 2005 2006 2007
Perc
ent o
f GDP
Economies in Transition (Europe and Asia)Developing Countries
Developed CountriesWorld
United States
Annual
4Indiana’s Foreign Direct Investment July 2009
Although the United States is oft en the top recipient of
FDI infl ows, these investments play a lesser role in the U.S.
economy than is the case in other global regions. Figure
A-2 shows that even in 2000—when the United States
enjoyed its highest level of investment—FDI infl ows were
3.2 percent of GDP compared to 4.4 percent globally. Th e
U.S. ratio of FDI infl ows to GDP was a mere 1.7 percent in
2007. Th e importance of foreign investment to transition
economies continues to climb steadily, reaching nearly 5
percent of GDP. Th is ratio in developing economies has
returned to 2000 levels.
According to UNCTAD, the resurgence in global FDI
fl ows was driven by several factors:
• Continued consolidation through mergers and
acquisitions (M&As)
• Economic growth and strong corporate performance in
many parts of the world
• Reinvested earnings
• Depreciation of the dollar against other currencies
Mergers and AcquisitionsM&As are typically the dominate source of foreign
investment. Th e high levels of FDI in 2007 were
accompanied by an increase in the volume of these
transactions, totaling 10,145 cross-border M&A deals
worth a record-setting $1.6 trillion. Th is value of M&A
activity represents a 21 percent increase over the previous
high in 2000 and a 46 percent improvement over 2006.
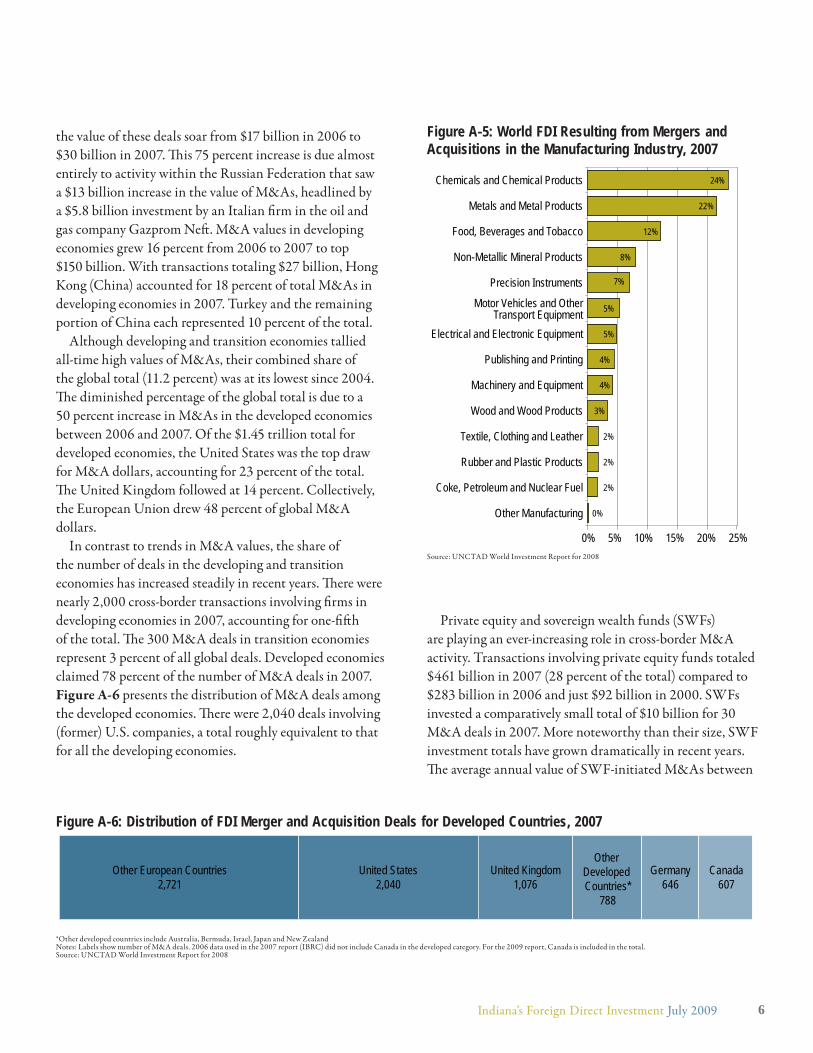
Service industries continue to drive global M&A activity.
Figure A-3 illustrates that 59 percent of all cross-border
M&As (sales) occurred in the services sector in 2007.
Th is sector’s role is vastly greater than it was 20 years ago
when its three-year average of total M&A share (1987 to
1989) was 38 percent. Transactions in the fi nance sector
accounted for 36 percent of all service related M&As (see
Figure A-4) that was led by a $98 billion acquisition of the
Dutch bank ABN-AMRO by a U.K.-based consortium.
Deals in the business activities and electric, gas and water
distribution industries combined to account for another 33
percent of total service sector M&As in 2007.
Manufacturing, the second largest sector, represents
35 percent of total cross-border M&As in 2007. Th e
value of these deals rose sharply from $305 billion in
2006 to $567 billion in 2007. Nearly half of the value
of these transactions involved fi rms engaged in either
chemicals or metals production (see Figure A-5).
Contrary to what one may expect, the striking increases
in commodity and energy demand through 2007 didn’t
translate into dramatic increases in M&A activity. Th e
mining, quarrying and petroleum industry was the only
broad sector to see a drop in the value of M&A activity,
from $106 billion in 2006 to $105 billion in 2007. Th is
marginal decline should not obscure the fact that the value
of M&As in this sector are still at unprecedented levels.
Between 2005 and 2007, M&As in this sector averaged
$119 billion. Th e previous high was $75 billion in 1998.
Record levels in the value of M&A transactions were seen
in all three economic groupings. Transition economies saw
Source: UNCTAD World Investment Report for 2008
Source: UNCTAD World Investment Report for 2008
Figure A-3: World FDI Resulting from Mergers and Acquisitions by Sector, 2007
Figure A-4: World FDI Resulting from Mergers and Acquisitions in the Service Industries, 2007
36%
19%14%
13%
8%
5%
3%1%1%1%
Finance
BusinessActivities
Electric, Gas, and Water Distribution
Transport, Storage and Communications
Trade
Community, Social andPersonal Service
Activities
Hotels and RestaurantsConstructionHealth and Social ServicesMiscellaneous Services
Services(58.6%)
Manufacturing(34.7%)
Mining, Quarrying and Petroleum (6.4%)
Agriculture, Forestry, and Fishing (0.3%)
5 Indiana’s Foreign Direct Investment July 2009
the value of these deals soar from $17 billion in 2006 to
$30 billion in 2007. Th is 75 percent increase is due almost
entirely to activity within the Russian Federation that saw
a $13 billion increase in the value of M&As, headlined by
a $5.8 billion investment by an Italian fi rm in the oil and
gas company Gazprom Neft . M&A values in developing
economies grew 16 percent from 2006 to 2007 to top
$150 billion. With transactions totaling $27 billion, Hong
Kong (China) accounted for 18 percent of total M&As in
developing economies in 2007. Turkey and the remaining
portion of China each represented 10 percent of the total.
Although developing and transition economies tallied
all-time high values of M&As, their combined share of
the global total (11.2 percent) was at its lowest since 2004.
Th e diminished percentage of the global total is due to a
50 percent increase in M&As in the developed economies
between 2006 and 2007. Of the $1.45 trillion total for
developed economies, the United States was the top draw
for M&A dollars, accounting for 23 percent of the total.
Th e United Kingdom followed at 14 percent. Collectively,
the European Union drew 48 percent of global M&A
dollars.
In contrast to trends in M&A values, the share of
the number of deals in the developing and transition
economies has increased steadily in recent years. Th ere were
nearly 2,000 cross-border transactions involving fi rms in
developing economies in 2007, accounting for one-fi ft h
of the total. Th e 300 M&A deals in transition economies
represent 3 percent of all global deals. Developed economies
claimed 78 percent of the number of M&A deals in 2007.
Figure A-6 presents the distribution of M&A deals among
the developed economies. Th ere were 2,040 deals involving
(former) U.S. companies, a total roughly equivalent to that
for all the developing economies.
Private equity and sovereign wealth funds (SWFs)
are playing an ever-increasing role in cross-border M&A
activity. Transactions involving private equity funds totaled
$461 billion in 2007 (28 percent of the total) compared to
$283 billion in 2006 and just $92 billion in 2000. SWFs
invested a comparatively small total of $10 billion for 30
M&A deals in 2007. More noteworthy than their size, SWF
investment totals have grown dramatically in recent years.
Th e average annual value of SWF-initiated M&As between
*Other developed countries include Australia, Bermuda, Israel, Japan and New ZealandNotes: Labels show number of M&A deals. 2006 data used in the 2007 report (IBRC) did not include Canada in the developed category. For the 2009 report, Canada is included in the total.Source: UNCTAD World Investment Report for 2008
Figure A-6: Distribution of FDI Merger and Acquisition Deals for Developed Countries, 2007
Other European Countries2,721
United States2,040
Germany646
Canada607
United Kingdom1,076
Other Developed Countries*
788
Source: UNCTAD World Investment Report for 2008
Figure A-5: World FDI Resulting from Mergers and Acquisitions in the Manufacturing Industry, 2007
24%
22%
12%
8%
5%
5%
4%
4%
3%
2%
2%
2%
0%
7%
0% 5% 10% 15% 20% 25%
Chemicals and Chemical Products
Metals and Metal Products
Food, Beverages and Tobacco
Non-Metallic Mineral Products
Precision Instruments
Motor Vehicles and OtherTransport Equipment
Electrical and Electronic Equipment
Publishing and Printing
Machinery and Equipment
Wood and Wood Products
Textile, Clothing and Leather
Rubber and Plastic Products
Coke, Petroleum and Nuclear Fuel
Other Manufacturing
6Indiana’s Foreign Direct Investment July 2009
1996 and 2004 was $478 million, compared to an average
of $10 billion between 2005 and 2007. As of 2007, the
largest SWFs were in the United Arab Emirates, Norway,
Singapore and Saudi Arabia.
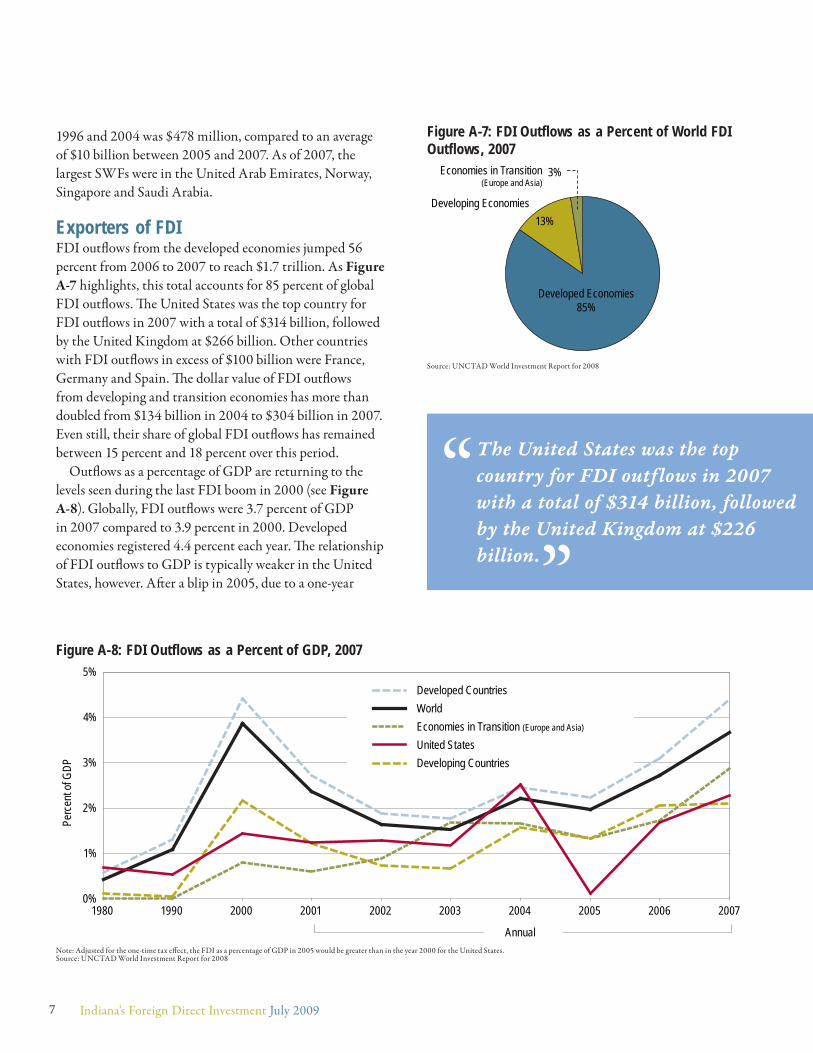
Exporters of FDIFDI outfl ows from the developed economies jumped 56
percent from 2006 to 2007 to reach $1.7 trillion. As Figure
A-7 highlights, this total accounts for 85 percent of global
FDI outfl ows. Th e United States was the top country for
FDI outfl ows in 2007 with a total of $314 billion, followed
by the United Kingdom at $266 billion. Other countries
with FDI outfl ows in excess of $100 billion were France,
Germany and Spain. Th e dollar value of FDI outfl ows
from developing and transition economies has more than
doubled from $134 billion in 2004 to $304 billion in 2007.
Even still, their share of global FDI outfl ows has remained
between 15 percent and 18 percent over this period.
Outfl ows as a percentage of GDP are returning to the
levels seen during the last FDI boom in 2000 (see Figure
A-8). Globally, FDI outfl ows were 3.7 percent of GDP
in 2007 compared to 3.9 percent in 2000. Developed
economies registered 4.4 percent each year. Th e relationship
of FDI outfl ows to GDP is typically weaker in the United
States, however. Aft er a blip in 2005, due to a one-year
Source: UNCTAD World Investment Report for 2008
Figure A-7: FDI Outflows as a Percent of World FDI Outflows, 2007
Developed Economies85%
Developing Economies
Economies in Transition(Europe and Asia)
3%
13%
Note: Adjusted for the one-time tax eff ect, the FDI as a percentage of GDP in 2005 would be greater than in the year 2000 for the United States.Source: UNCTAD World Investment Report for 2008
Figure A-8: FDI Outflows as a Percent of GDP, 2007
0%
1%
2%
3%
4%
5%
1980 1990 2000 2001 2002 2003 2004 2005 2006 2007
Perc
ent o
f GDP
Economies in Transition (Europe and Asia)
Developing Countries
Developed CountriesWorld
United States
Annual
The United States was the top
country for FDI outflows in 2007
with a total of $314 billion, followed
by the United Kingdom at $226
billion.”
7 Indiana’s Foreign Direct Investment July 2009
change in the tax code, U.S. FDI outfl ows to GDP was
2.3 percent in 2007. Th e highest percentage of U.S. FDI
outfows to GDP was 2.5 percent in 2004.
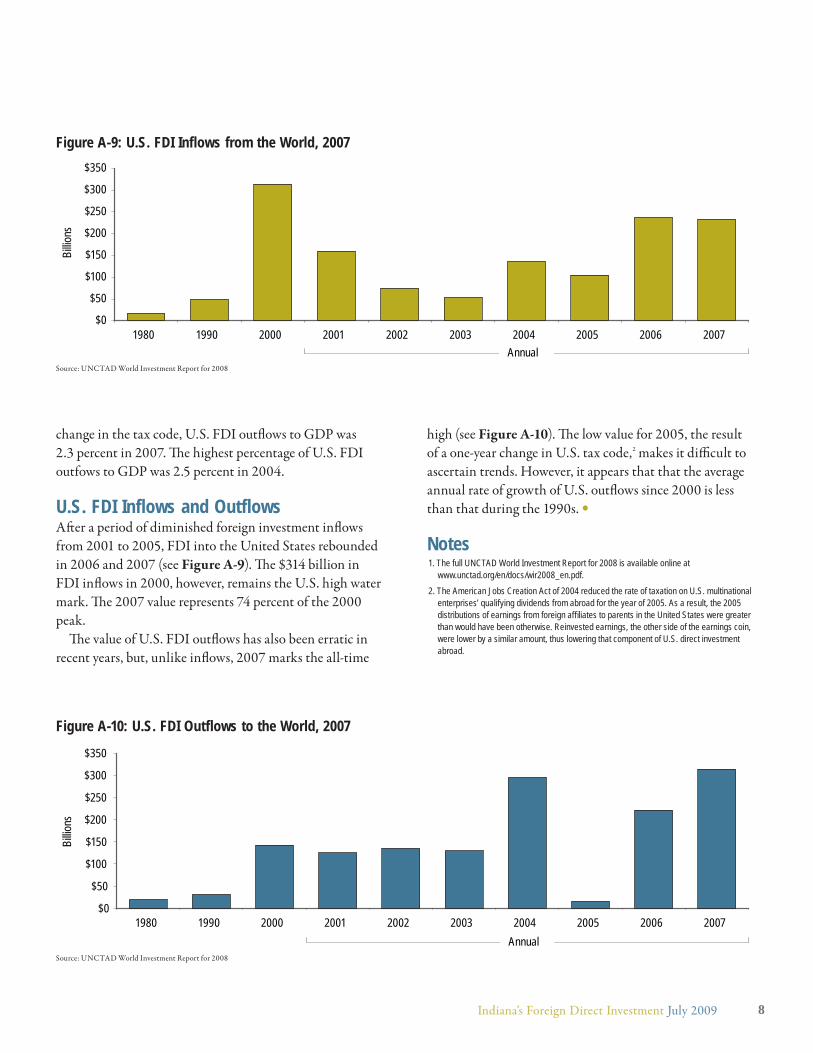
U.S. FDI Inflows and OutflowsAft er a period of diminished foreign investment infl ows
from 2001 to 2005, FDI into the United States rebounded
in 2006 and 2007 (see Figure A-9). Th e $314 billion in
FDI infl ows in 2000, however, remains the U.S. high water
mark. Th e 2007 value represents 74 percent of the 2000
peak.
Th e value of U.S. FDI outfl ows has also been erratic in
recent years, but, unlike infl ows, 2007 marks the all-time
high (see Figure A-10). Th e low value for 2005, the result
of a one-year change in U.S. tax code,2 makes it diffi cult to
ascertain trends. However, it appears that that the average
annual rate of growth of U.S. outfl ows since 2000 is less
than that during the 1990s. •
Notes1. The full UNCTAD World Investment Report for 2008 is available online at
www.unctad.org/en/docs/wir2008_en.pdf.2. The American Jobs Creation Act of 2004 reduced the rate of taxation on U.S. multinational
enterprises’ qualifying dividends from abroad for the year of 2005. As a result, the 2005 distributions of earnings from foreign affi liates to parents in the United States were greater than would have been otherwise. Reinvested earnings, the other side of the earnings coin, were lower by a similar amount, thus lowering that component of U.S. direct investment abroad.
Source: UNCTAD World Investment Report for 2008
Figure A-10: U.S. FDI Outflows to the World, 2007
Source: UNCTAD World Investment Report for 2008
Figure A-9: U.S. FDI Inflows from the World, 2007
$0
$50
$100
$150
$200
$250
$300
$350
1980 1990 2000 2001 2002 2003 2004 2005 2006 2007
Billio
ns
Annual
$0
$50
$100
$150
$200
$250
$300
$350
1980 1990 2000 2001 2002 2003 2004 2005 2006 2007
Billio
ns
Annual
8Indiana’s Foreign Direct Investment July 2009
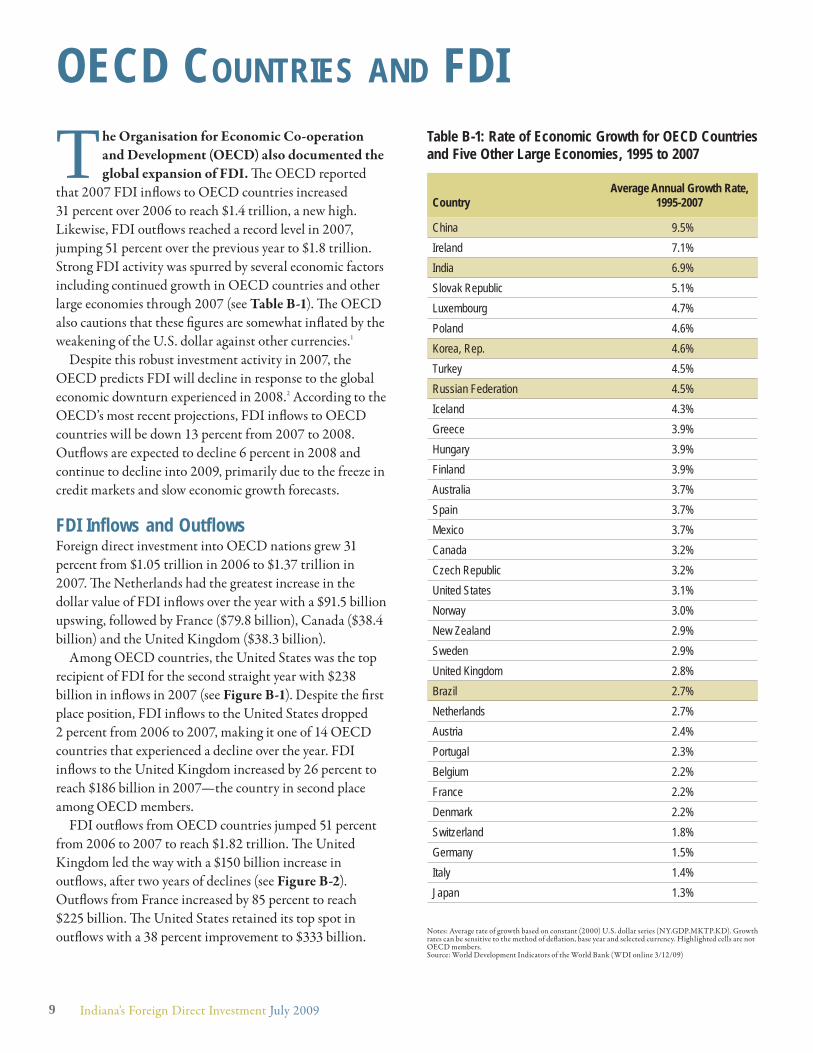
The Organisation for Economic Co-operation
and Development (OECD) also documented the
global expansion of FDI. Th e OECD reported
that 2007 FDI infl ows to OECD countries increased
31 percent over 2006 to reach $1.4 trillion, a new high.
Likewise, FDI outfl ows reached a record level in 2007,
jumping 51 percent over the previous year to $1.8 trillion.
Strong FDI activity was spurred by several economic factors
including continued growth in OECD countries and other
large economies through 2007 (see Table B-1). Th e OECD
also cautions that these fi gures are somewhat infl ated by the
weakening of the U.S. dollar against other currencies.1
Despite this robust investment activity in 2007, the
OECD predicts FDI will decline in response to the global
economic downturn experienced in 2008.2 According to the
OECD’s most recent projections, FDI infl ows to OECD
countries will be down 13 percent from 2007 to 2008.
Outfl ows are expected to decline 6 percent in 2008 and
continue to decline into 2009, primarily due to the freeze in
credit markets and slow economic growth forecasts.
FDI Inflows and OutflowsForeign direct investment into OECD nations grew 31
percent from $1.05 trillion in 2006 to $1.37 trillion in
2007. Th e Netherlands had the greatest increase in the
dollar value of FDI infl ows over the year with a $91.5 billion
upswing, followed by France ($79.8 billion), Canada ($38.4
billion) and the United Kingdom ($38.3 billion).
Among OECD countries, the United States was the top
recipient of FDI for the second straight year with $238
billion in infl ows in 2007 (see Figure B-1). Despite the fi rst
place position, FDI infl ows to the United States dropped
2 percent from 2006 to 2007, making it one of 14 OECD
countries that experienced a decline over the year. FDI
infl ows to the United Kingdom increased by 26 percent to
reach $186 billion in 2007—the country in second place
among OECD members.
FDI outfl ows from OECD countries jumped 51 percent
from 2006 to 2007 to reach $1.82 trillion. Th e United
Kingdom led the way with a $150 billion increase in
outfl ows, aft er two years of declines (see Figure B-2).
Outfl ows from France increased by 85 percent to reach
$225 billion. Th e United States retained its top spot in
outfl ows with a 38 percent improvement to $333 billion.
OECD COUNTRIES AND FDITable B-1: Rate of Economic Growth for OECD Countries and Five Other Large Economies, 1995 to 2007
Notes: Average rate of growth based on constant (2000) U.S. dollar series (NY.GDP.MKTP.KD). Growth rates can be sensitive to the method of defl ation, base year and selected currency. Highlighted cells are not OECD members.Source: World Development Indicators of the World Bank (WDI online 3/12/09)
CountryAverage Annual Growth Rate,
1995-2007
China 9.5%Ireland 7.1%India 6.9%Slovak Republic 5.1%Luxembourg 4.7%Poland 4.6%Korea, Rep. 4.6%Turkey 4.5%Russian Federation 4.5%Iceland 4.3%Greece 3.9%Hungary 3.9%Finland 3.9%Australia 3.7%Spain 3.7%Mexico 3.7%Canada 3.2%Czech Republic 3.2%United States 3.1%Norway 3.0%New Zealand 2.9%Sweden 2.9%United Kingdom 2.8%Brazil 2.7%Netherlands 2.7%Austria 2.4%Portugal 2.3%Belgium 2.2%France 2.2%Denmark 2.2%Switzerland 1.8%Germany 1.5%Italy 1.4%Japan 1.3%
9 Indiana’s Foreign Direct Investment July 2009
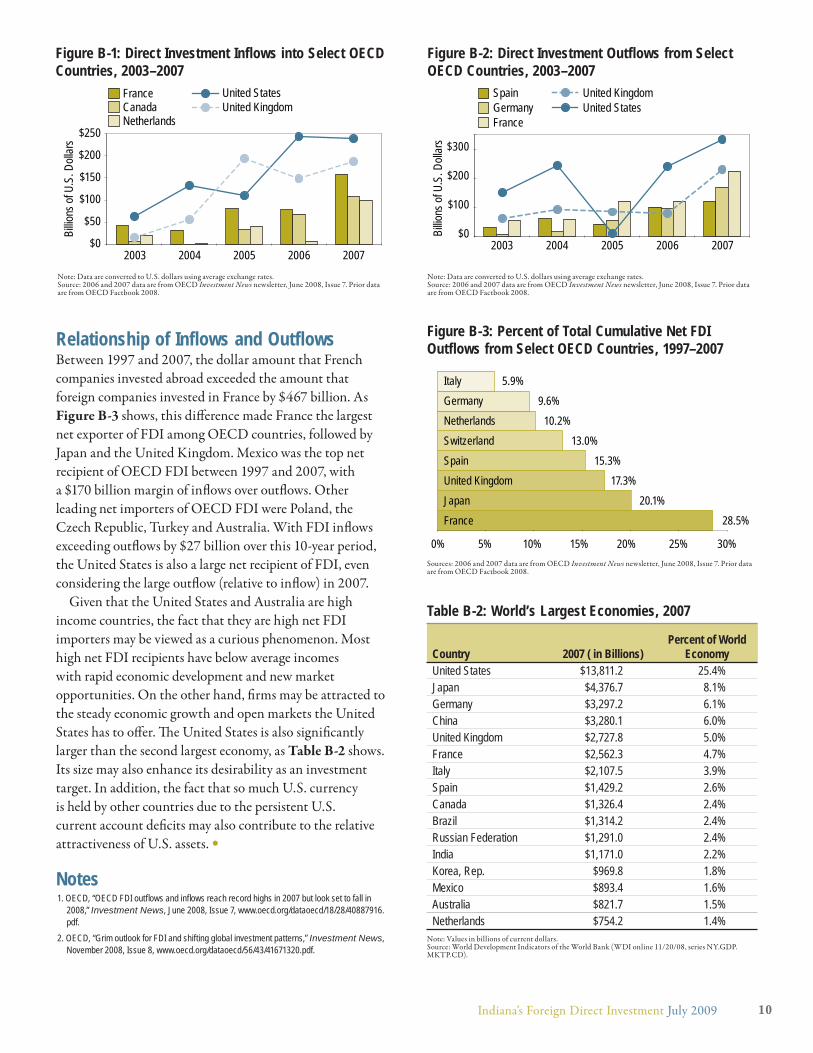
Relationship of Inflows and OutflowsBetween 1997 and 2007, the dollar amount that French
companies invested abroad exceeded the amount that
foreign companies invested in France by $467 billion. As
Figure B-3 shows, this diff erence made France the largest
net exporter of FDI among OECD countries, followed by
Japan and the United Kingdom. Mexico was the top net
recipient of OECD FDI between 1997 and 2007, with
a $170 billion margin of infl ows over outfl ows. Other
leading net importers of OECD FDI were Poland, the
Czech Republic, Turkey and Australia. With FDI infl ows
exceeding outfl ows by $27 billion over this 10-year period,
the United States is also a large net recipient of FDI, even
considering the large outfl ow (relative to infl ow) in 2007.
Given that the United States and Australia are high
income countries, the fact that they are high net FDI
importers may be viewed as a curious phenomenon. Most
high net FDI recipients have below average incomes
with rapid economic development and new market
opportunities. On the other hand, fi rms may be attracted to
the steady economic growth and open markets the United
States has to off er. Th e United States is also signifi cantly
larger than the second largest economy, as Table B-2 shows.
Its size may also enhance its desirability as an investment
target. In addition, the fact that so much U.S. currency
is held by other countries due to the persistent U.S.
current account defi cits may also contribute to the relative
attractiveness of U.S. assets. •
Notes1. OECD, “OECD FDI outfl ows and infl ows reach record highs in 2007 but look set to fall in
2008,” Investment News, June 2008, Issue 7, www.oecd.org/dataoecd/18/28/40887916.pdf.
2. OECD, “Grim outlook for FDI and shifting global investment patterns,” Investment News, November 2008, Issue 8, www.oecd.org/dataoecd/56/43/41671320.pdf.
Figure B-1: Direct Investment Inflows into Select OECD Countries, 2003–2007
Note: Data are converted to U.S. dollars using average exchange rates.Source: 2006 and 2007 data are from OECD Investment News newsletter, June 2008, Issue 7. Prior data are from OECD Factbook 2008.
Figure B-2: Direct Investment Outflows from Select OECD Countries, 2003–2007
$0
$50
$100
$150
$200
$250
2003 2004 2005 2006 2007
Billio
ns of
U.S
. Doll
ars
FranceCanadaNetherlands
United StatesUnited Kingdom
$0
$100
$200
$300
2003 2004 2005 2006 2007
Billio
ns of
U.S
. Doll
ars
SpainGermanyFrance
United KingdomUnited States
Note: Data are converted to U.S. dollars using average exchange rates.Source: 2006 and 2007 data are from OECD Investment News newsletter, June 2008, Issue 7. Prior data are from OECD Factbook 2008.
Figure B-3: Percent of Total Cumulative Net FDI Outflows from Select OECD Countries, 1997–2007
Sources: 2006 and 2007 data are from OECD Investment News newsletter, June 2008, Issue 7. Prior data are from OECD Factbook 2008.
Table B-2: World’s Largest Economies, 2007
Note: Values in billions of current dollars.Source: World Development Indicators of the World Bank (WDI online 11/20/08, series NY.GDP.MKTP.CD).
FranceJapanUnited KingdomSpainSwitzerlandNetherlandsGermany 9.6%Italy 5.9%
0% 5% 10% 15% 20% 25% 30%
10.2%13.0%
15.3%17.3%
20.1%28.5%
Country 2007 ( in Billions)Percent of World
EconomyUnited States $13,811.2 25.4%Japan $4,376.7 8.1%Germany $3,297.2 6.1%China $3,280.1 6.0%United Kingdom $2,727.8 5.0%France $2,562.3 4.7%Italy $2,107.5 3.9%Spain $1,429.2 2.6%Canada $1,326.4 2.4%Brazil $1,314.2 2.4%Russian Federation $1,291.0 2.4%India $1,171.0 2.2%Korea, Rep. $969.8 1.8%Mexico $893.4 1.6%Australia $821.7 1.5%Netherlands $754.2 1.4%
10Indiana’s Foreign Direct Investment July 2009
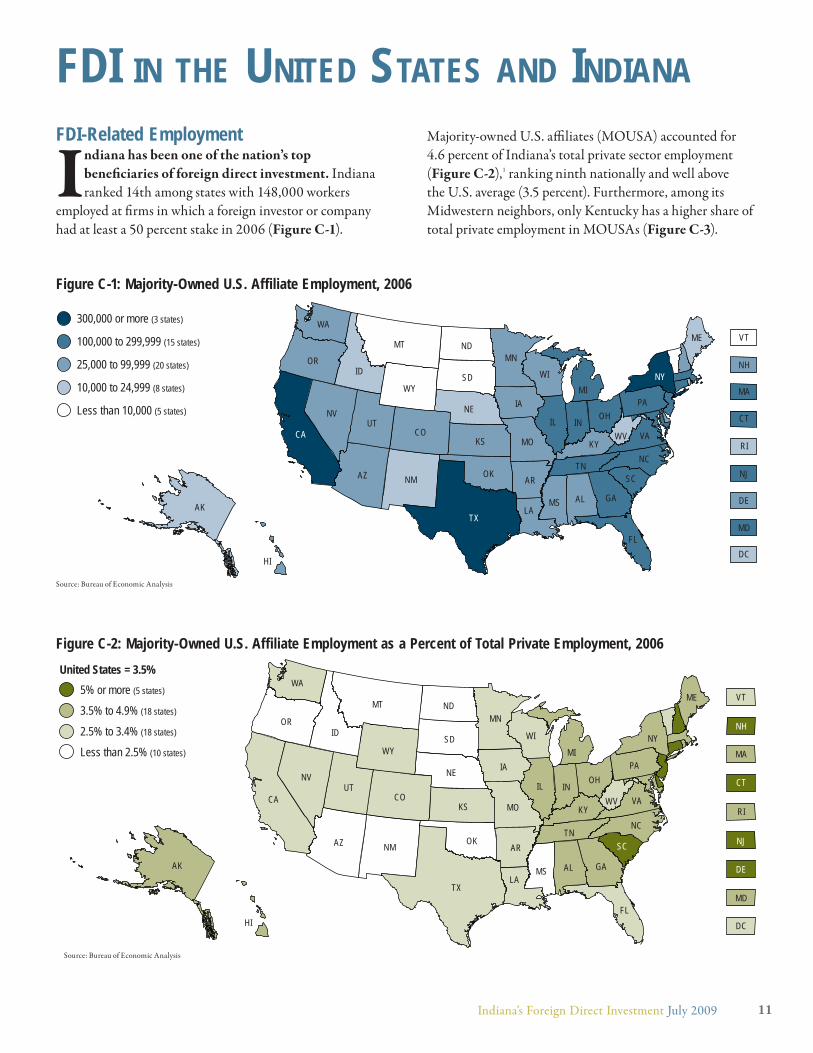
FDI-Related Employment
Indiana has been one of the nation’s top
benefi ciaries of foreign direct investment. Indiana
ranked 14th among states with 148,000 workers
employed at fi rms in which a foreign investor or company
had at least a 50 percent stake in 2006 (Figure C-1).
Majority-owned U.S. affi liates (MOUSA) accounted for
4.6 percent of Indiana’s total private sector employment
(Figure C-2),1 ranking ninth nationally and well above
the U.S. average (3.5 percent). Furthermore, among its
Midwestern neighbors, only Kentucky has a higher share of
total private employment in MOUSAs (Figure C-3).
FDI IN THE UNITED STATES AND INDIANA
Figure C-1: Majority-Owned U.S. Affiliate Employment, 2006
Figure C-2: Majority-Owned U.S. Affiliate Employment as a Percent of Total Private Employment, 2006
Source: Bureau of Economic Analysis
Source: Bureau of Economic Analysis
300,000 or more (3 states)
100,000 to 299,999 (15 states)
25,000 to 99,999 (20 states)
10,000 to 24,999 (8 states)
Less than 10,000 (5 states)
WA
MTME
ND
SDWY
WIID
VT
MNOR NH
IAMA
NE
NY
PACT
RI
NJ
INNV
UTCA
OHIL
DC
DE
WV
MD
COKYKS VAMO
AZ OKNC
TN
TX
NM
ALMS GA
SCAR
LA
FL
HI
AK
MI
5% or more (5 states)
United States = 3.5%
3.5% to 4.9% (18 states)
2.5% to 3.4% (18 states)
Less than 2.5% (10 states)
WA
MTME
ND
SDWY
WIID
VT
MNOR NH
IAMA
NE
NY
PA
CT
RI
NJ
INNV
UTCA
OHIL
DC
DE
WV
MD
COKYKS VA
MO
AZ OKNC
TN
TX
NM
ALMS GA
SCAR
LA
FLHI
AK
MI
11Indiana’s Foreign Direct Investment July 2009
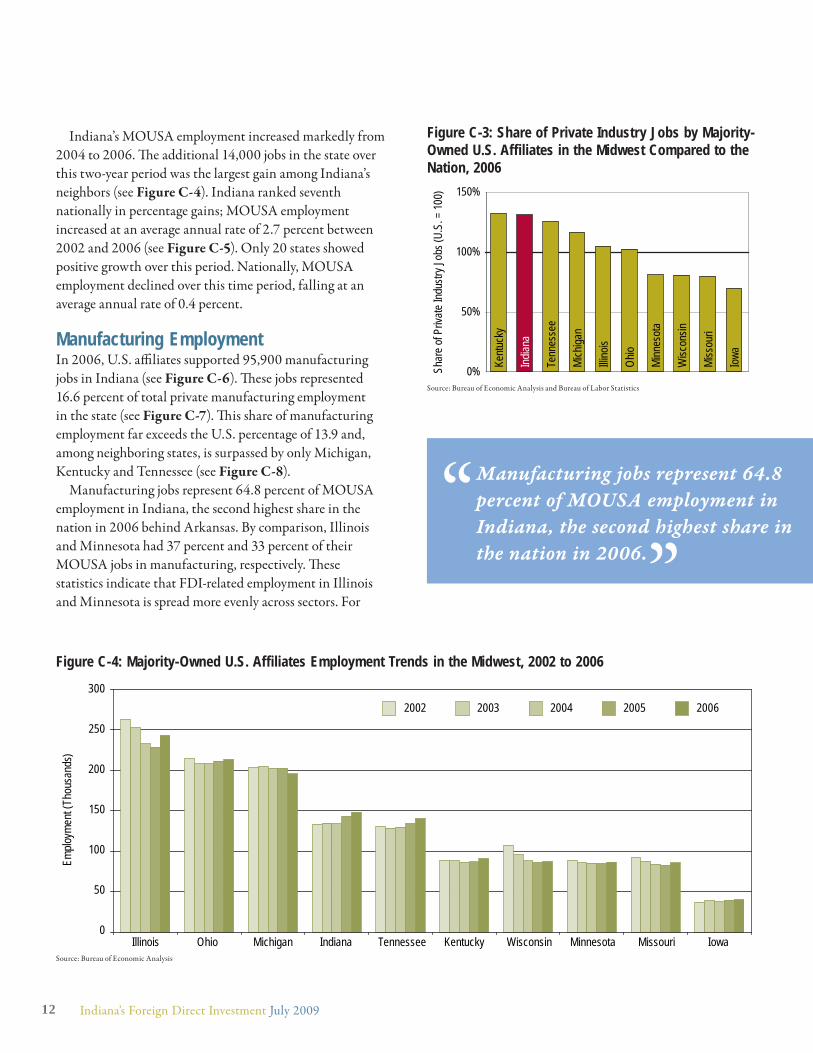
Indiana’s MOUSA employment increased markedly from
2004 to 2006. Th e additional 14,000 jobs in the state over
this two-year period was the largest gain among Indiana’s
neighbors (see Figure C-4). Indiana ranked seventh
nationally in percentage gains; MOUSA employment
increased at an average annual rate of 2.7 percent between
2002 and 2006 (see Figure C-5). Only 20 states showed
positive growth over this period. Nationally, MOUSA
employment declined over this time period, falling at an
average annual rate of 0.4 percent.
Manufacturing EmploymentIn 2006, U.S. affi liates supported 95,900 manufacturing
jobs in Indiana (see Figure C-6). Th ese jobs represented
16.6 percent of total private manufacturing employment
in the state (see Figure C-7). Th is share of manufacturing
employment far exceeds the U.S. percentage of 13.9 and,
among neighboring states, is surpassed by only Michigan,
Kentucky and Tennessee (see Figure C-8).
Manufacturing jobs represent 64.8 percent of MOUSA
employment in Indiana, the second highest share in the
nation in 2006 behind Arkansas. By comparison, Illinois
and Minnesota had 37 percent and 33 percent of their
MOUSA jobs in manufacturing, respectively. Th ese
statistics indicate that FDI-related employment in Illinois
and Minnesota is spread more evenly across sectors. For
Figure C-3: Share of Private Industry Jobs by Majority-Owned U.S. Affiliates in the Midwest Compared to the Nation, 2006
Source: Bureau of Economic Analysis and Bureau of Labor Statistics
Figure C-4: Majority-Owned U.S. Affiliates Employment Trends in the Midwest, 2002 to 2006
Source: Bureau of Economic Analysis
0%
50%
100%
150%
Kentu
cky
Indian
a
Tenn
esse
e
Mich
igan
Illino
is
Ohio
Minn
esot
a
Wisc
onsin
Miss
ouri
Iowa
Shar
e of P
rivate
Indu
stry J
obs (
U.S.
= 10
0)
0
50
100
150
200
250
300
Illinois Ohio Michigan Indiana Tennessee Kentucky Wisconsin Minnesota Missouri Iowa
Emplo
ymen
t (Th
ousa
nds)
2002 2003 2004 2005 2006
Manufacturing jobs represent 64.8
percent of MOUSA employment in
Indiana, the second highest share in
the nation in 2006.”
12 Indiana’s Foreign Direct Investment July 2009
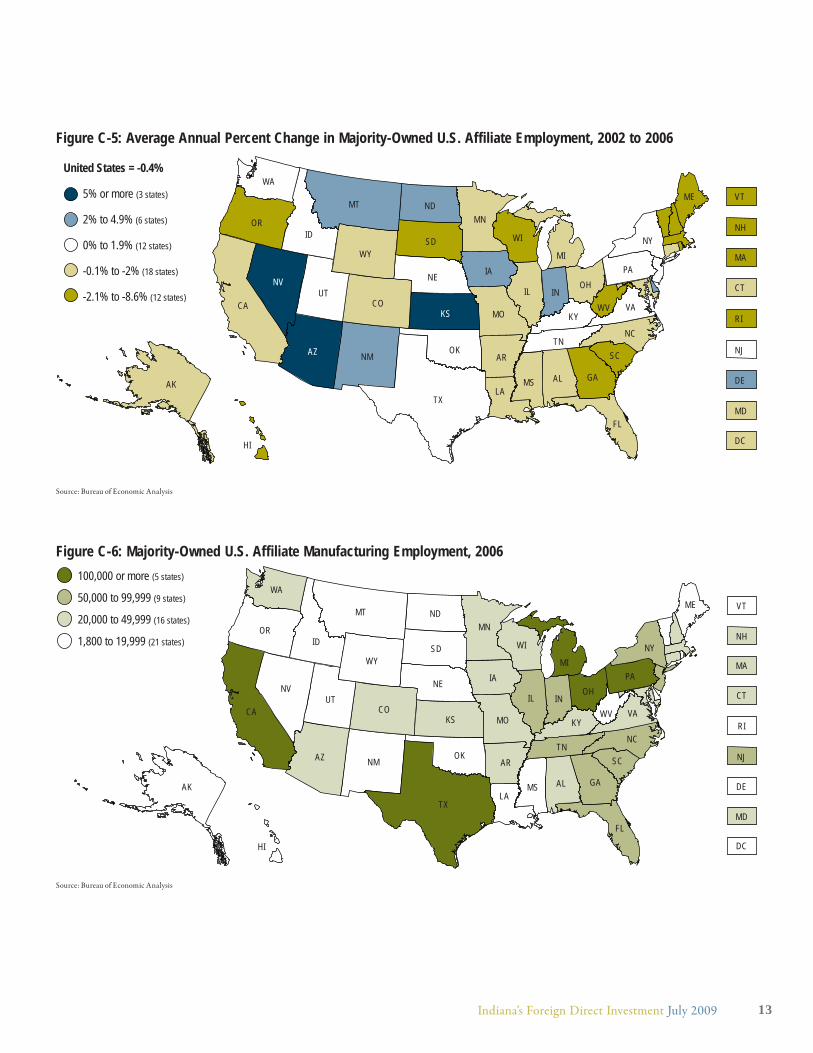
Figure C-6: Majority-Owned U.S. Affiliate Manufacturing Employment, 2006
Source: Bureau of Economic Analysis
Figure C-5: Average Annual Percent Change in Majority-Owned U.S. Affiliate Employment, 2002 to 2006
Source: Bureau of Economic Analysis
5% or more (3 states)
United States = -0.4%
2% to 4.9% (6 states)
0% to 1.9% (12 states)
-0.1% to -2% (18 states)
-2.1% to -8.6% (12 states)
WA
MTME
ND
SDWY
WIID
VT
MNOR NH
IAMA
NE
NY
PA
CT
RI
NJ
INNV
UTCA
OHIL
DC
DE
WV
MD
COKYKS VA
MO
AZ OK
NCTN
TX
NM
ALMS GA
SCAR
LA
FL
HI
AK
MI
100,000 or more (5 states)
50,000 to 99,999 (9 states)
20,000 to 49,999 (16 states)
1,800 to 19,999 (21 states)
WA
MTME
ND
SDWY
WIID
VT
MNOR NH
IAMA
NE
NY
PA
CT
RI
NJ
INNV
UTCA
OHIL
DC
DE
WV
MD
COKYKS VA
MO
AZ OK
NCTN
TX
NM
ALMS GA
SCAR
LA
FL
HI
AK
MI
13Indiana’s Foreign Direct Investment July 2009
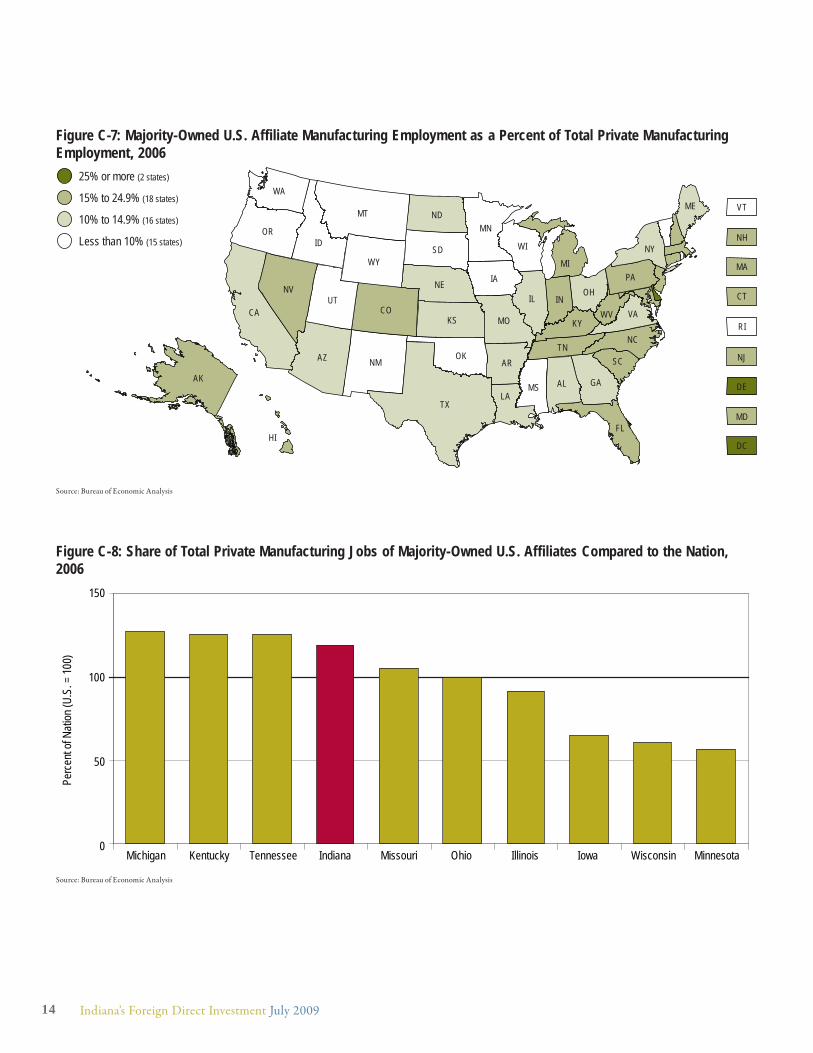
Figure C-7: Majority-Owned U.S. Affiliate Manufacturing Employment as a Percent of Total Private Manufacturing Employment, 2006
Source: Bureau of Economic Analysis
Figure C-8: Share of Total Private Manufacturing Jobs of Majority-Owned U.S. Affiliates Compared to the Nation, 2006
Source: Bureau of Economic Analysis
25% or more (2 states)
15% to 24.9% (18 states)
10% to 14.9% (16 states)
Less than 10% (15 states)
WA
MTME
ND
SDWY
WIID
VT
MNOR NH
IAMA
NE
NY
PA
CT
RI
NJ
INNV
UTCA
OHIL
DC
DE
WV
MD
COKYKS VA
MO
AZ OK
NCTN
TX
NM
ALMS GA
SCAR
LA
FLHI
AK
MI
Perc
ent o
f Nati
on (U
.S. =
100)
0
50
100
150
Michigan Kentucky Tennessee Indiana Missouri Ohio Illinois Iowa Wisconsin Minnesota
14 Indiana’s Foreign Direct Investment July 2009
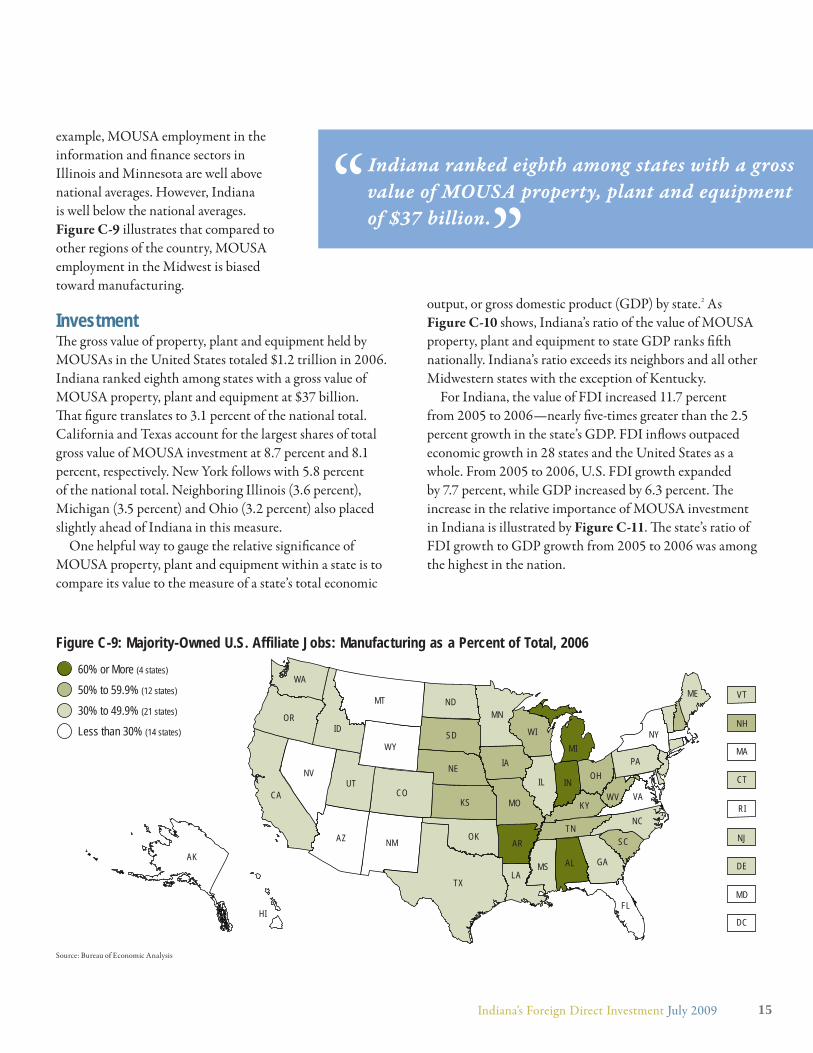
example, MOUSA employment in the
information and fi nance sectors in
Illinois and Minnesota are well above
national averages. However, Indiana
is well below the national averages.
Figure C-9 illustrates that compared to
other regions of the country, MOUSA
employment in the Midwest is biased
toward manufacturing.
InvestmentTh e gross value of property, plant and equipment held by
MOUSAs in the United States totaled $1.2 trillion in 2006.
Indiana ranked eighth among states with a gross value of
MOUSA property, plant and equipment at $37 billion.
Th at fi gure translates to 3.1 percent of the national total.
California and Texas account for the largest shares of total
gross value of MOUSA investment at 8.7 percent and 8.1
percent, respectively. New York follows with 5.8 percent
of the national total. Neighboring Illinois (3.6 percent),
Michigan (3.5 percent) and Ohio (3.2 percent) also placed
slightly ahead of Indiana in this measure.
One helpful way to gauge the relative signifi cance of
MOUSA property, plant and equipment within a state is to
compare its value to the measure of a state’s total economic
output, or gross domestic product (GDP) by state.2 As
Figure C-10 shows, Indiana’s ratio of the value of MOUSA
property, plant and equipment to state GDP ranks fi ft h
nationally. Indiana’s ratio exceeds its neighbors and all other
Midwestern states with the exception of Kentucky.
For Indiana, the value of FDI increased 11.7 percent
from 2005 to 2006—nearly fi ve-times greater than the 2.5
percent growth in the state’s GDP. FDI infl ows outpaced
economic growth in 28 states and the United States as a
whole. From 2005 to 2006, U.S. FDI growth expanded
by 7.7 percent, while GDP increased by 6.3 percent. Th e
increase in the relative importance of MOUSA investment
in Indiana is illustrated by Figure C-11. Th e state’s ratio of
FDI growth to GDP growth from 2005 to 2006 was among
the highest in the nation.
Figure C-9: Majority-Owned U.S. Affiliate Jobs: Manufacturing as a Percent of Total, 2006
Source: Bureau of Economic Analysis
60% or More (4 states)
50% to 59.9% (12 states)
30% to 49.9% (21 states)
Less than 30% (14 states)
WA
MTME
ND
SDWY
WIID
VT
MNOR NH
IAMA
NE
NY
PA
CT
RI
NJ
INNV
UTCA
OHIL
DC
DE
WV
MD
COKYKS VA
MO
AZ OKNC
TN
TX
NM
ALMS GA
SCAR
LA
FLHI
AK
MI
Indiana ranked eighth among states with a gross
value of MOUSA property, plant and equipment
of $37 billion.”
15Indiana’s Foreign Direct Investment July 2009
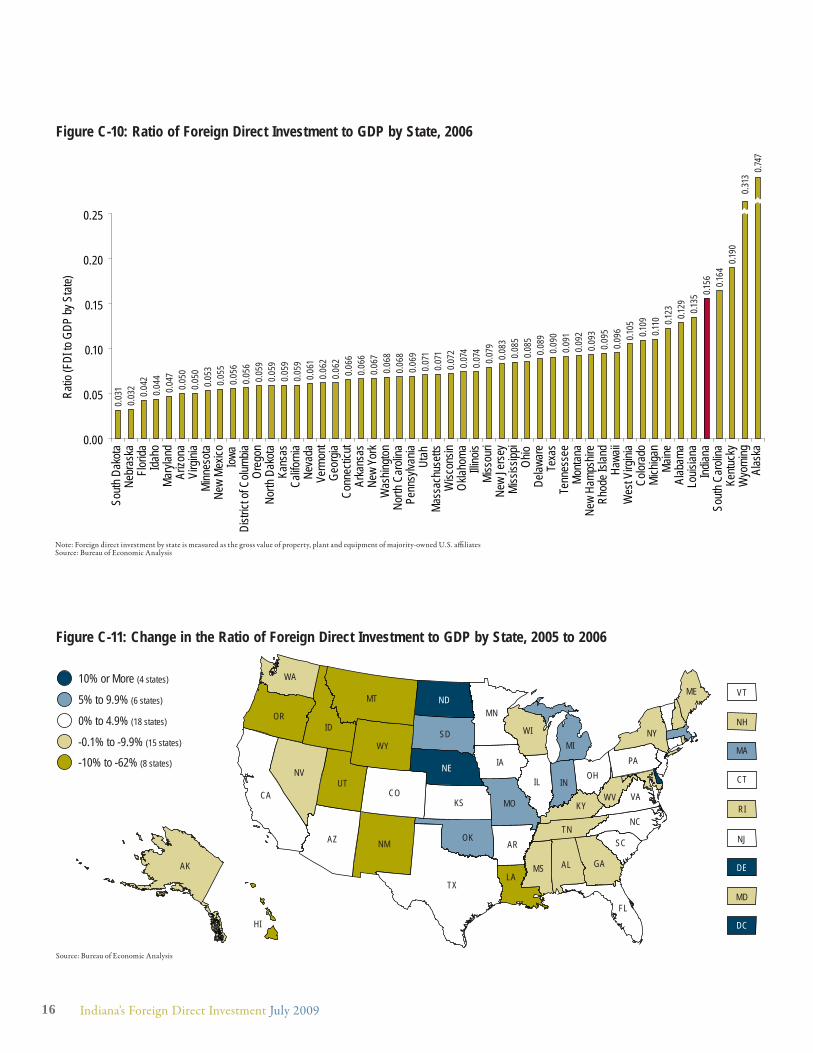
Figure C-11: Change in the Ratio of Foreign Direct Investment to GDP by State, 2005 to 2006
Source: Bureau of Economic Analysis
Figure C-10: Ratio of Foreign Direct Investment to GDP by State, 20060.
031
0.03
2 0.04
20.
044
0.04
70.
050
0.05
00.
053
0.05
50.
056
0.05
60.
059
0.05
90.
059
0.05
90.
061
0.06
20.
062
0.06
60.
066
0.06
70.
068
0.06
80.
069
0.07
10.
071
0.07
20.
074
0.07
40.
079
0.08
30.
085
0.08
50.
089
0.09
00.
091
0.09
20.
093
0.09
50.
096
0.105
0.109
0.110 0.1
23 0.129 0.1
350.1
56 0.164
0.190
0.31
30.7
47
0.00
0.05
0.10
0.15
0.20
0.25
Sout
h Dak
ota
Nebr
aska
Florid
aId
aho
Mar
yland
Arizo
naVi
rgini
aMi
nnes
ota
New
Mexic
oIo
waDi
strict
of C
olumb
iaOr
egon
North
Dak
ota
Kans
asCa
liforn
iaNe
vada
Verm
ont
Geor
giaCo
nnec
ticut
Arka
nsas
New
York
Was
hingto
nNo
rth C
aroli
naPe
nnsy
lvania
Utah
Mass
achu
setts
Wisc
onsin
Oklah
oma
Illino
isMi
ssou
riNe
w Je
rsey
Miss
issipp
iOh
ioDe
lawar
eTe
xas
Tenn
esse
eM
onta
naNe
w Ha
mpsh
ireRh
ode I
sland
Hawa
iiW
est V
irgini
aCo
lorad
oMi
chiga
nM
aine
Alab
ama
Louis
iana
Indian
aSo
uth C
aroli
naKe
ntuck
yW
yomi
ngAl
aska
Ratio
(FDI
to G
DP by
Sta
te)
10% or More (4 states)
5% to 9.9% (6 states)
0% to 4.9% (18 states)
-0.1% to -9.9% (15 states)
-10% to -62% (8 states)
WA
MTME
ND
SDWY
WIID
VT
MNOR NH
IAMA
NE
NY
PA
CT
RI
NJ
INNV
UTCA
OHIL
DC
DE
WV
MD
COKYKS VA
MO
AZ OKNC
TN
TX
NM
ALMS GA
SCAR
LA
FLHI
AK
MI
Note: Foreign direct investment by state is measured as the gross value of property, plant and equipment of majority-owned U.S. affi liatesSource: Bureau of Economic Analysis
16 Indiana’s Foreign Direct Investment July 2009
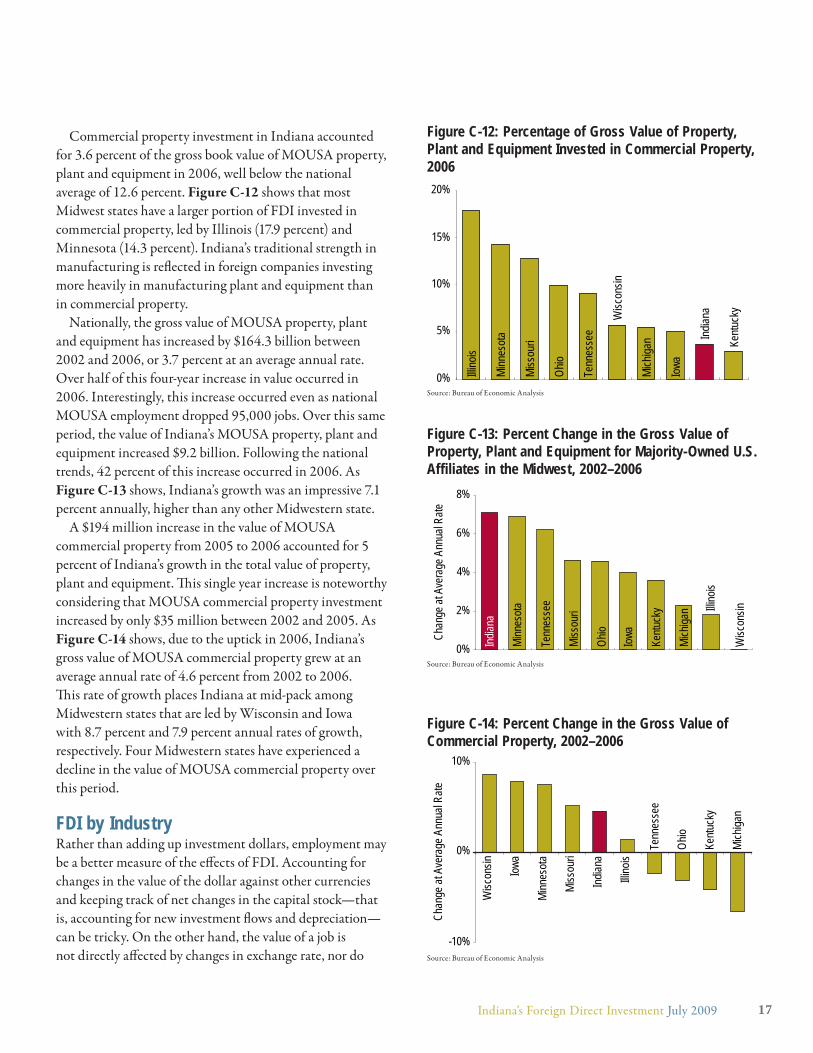
Commercial property investment in Indiana accounted
for 3.6 percent of the gross book value of MOUSA property,
plant and equipment in 2006, well below the national
average of 12.6 percent. Figure C-12 shows that most
Midwest states have a larger portion of FDI invested in
commercial property, led by Illinois (17.9 percent) and
Minnesota (14.3 percent). Indiana’s traditional strength in
manufacturing is refl ected in foreign companies investing
more heavily in manufacturing plant and equipment than
in commercial property.
Nationally, the gross value of MOUSA property, plant
and equipment has increased by $164.3 billion between
2002 and 2006, or 3.7 percent at an average annual rate.
Over half of this four-year increase in value occurred in
2006. Interestingly, this increase occurred even as national
MOUSA employment dropped 95,000 jobs. Over this same
period, the value of Indiana’s MOUSA property, plant and
equipment increased $9.2 billion. Following the national
trends, 42 percent of this increase occurred in 2006. As
Figure C-13 shows, Indiana’s growth was an impressive 7.1
percent annually, higher than any other Midwestern state.
A $194 million increase in the value of MOUSA
commercial property from 2005 to 2006 accounted for 5
percent of Indiana’s growth in the total value of property,
plant and equipment. Th is single year increase is noteworthy
considering that MOUSA commercial property investment
increased by only $35 million between 2002 and 2005. As
Figure C-14 shows, due to the uptick in 2006, Indiana’s
gross value of MOUSA commercial property grew at an
average annual rate of 4.6 percent from 2002 to 2006.
Th is rate of growth places Indiana at mid-pack among
Midwestern states that are led by Wisconsin and Iowa
with 8.7 percent and 7.9 percent annual rates of growth,
respectively. Four Midwestern states have experienced a
decline in the value of MOUSA commercial property over
this period.
FDI by IndustryRather than adding up investment dollars, employment may
be a better measure of the eff ects of FDI. Accounting for
changes in the value of the dollar against other currencies
and keeping track of net changes in the capital stock—that
is, accounting for new investment fl ows and depreciation—
can be tricky. On the other hand, the value of a job is
not directly aff ected by changes in exchange rate, nor do
Figure C-12: Percentage of Gross Value of Property, Plant and Equipment Invested in Commercial Property, 2006
Source: Bureau of Economic Analysis
Figure C-13: Percent Change in the Gross Value of Property, Plant and Equipment for Majority-Owned U.S. Affiliates in the Midwest, 2002–2006
Source: Bureau of Economic Analysis
Figure C-14: Percent Change in the Gross Value of Commercial Property, 2002–2006
Source: Bureau of Economic Analysis
0%
10%
15%
5%
20%
Illino
is
Minn
esot
a
Miss
ouri
Ohio
Tenn
esse
e
Wisc
onsin
Mich
igan
Iowa
Indian
a
Kentu
cky
0%
2%
4%
6%
8%Ind
iana
Minn
esota
Tenn
esse
e
Miss
ouri
Ohio
Iowa
Kentu
cky
Mich
igan Illi
nois
Wisc
onsin
Chan
ge at
Ave
rage
Ann
ual R
ate
-10%
0%
10%
Wisc
onsin Iowa
Minn
esot
a
Miss
ouri
Indian
a
Illino
is
Tenn
esse
e
Ohio
Kentu
cky
Mich
igan
Chan
ge at
Ave
rage
Ann
ual R
ate
17Indiana’s Foreign Direct Investment July 2009
most jobs “depreciate” or suff er a reduction in wages. For
this reason, this section reports the structure of MOUSA
employment by industry.
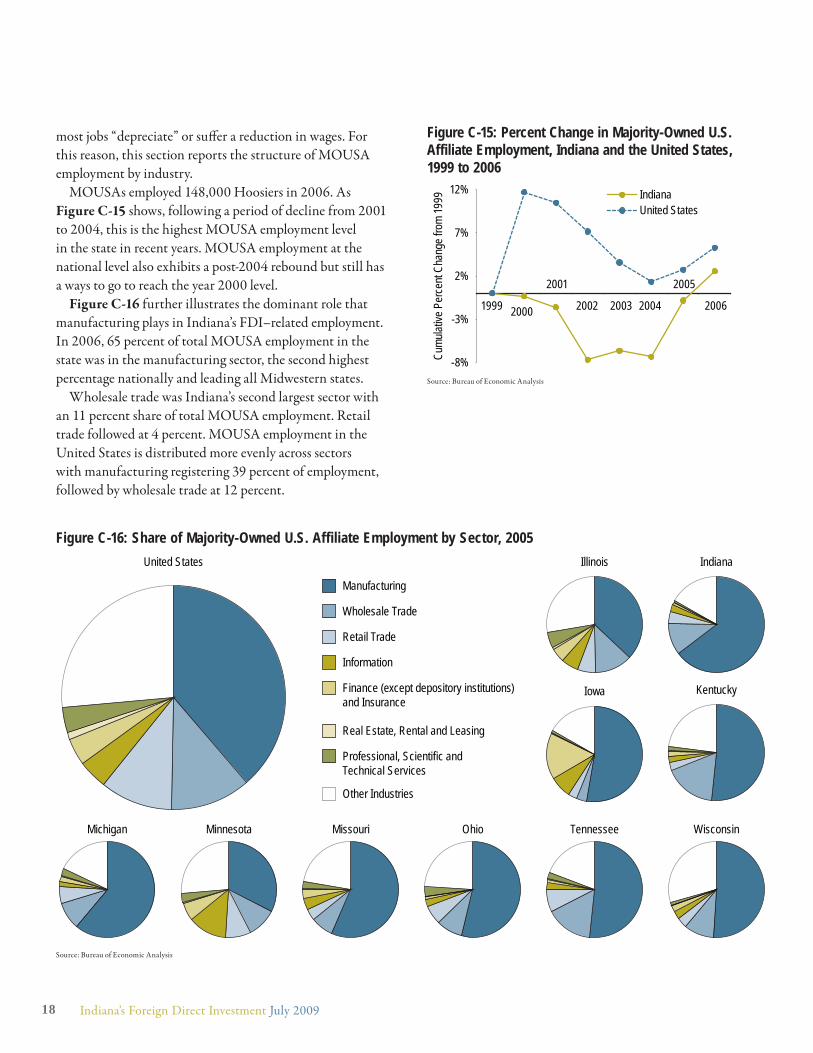
MOUSAs employed 148,000 Hoosiers in 2006. As
Figure C-15 shows, following a period of decline from 2001
to 2004, this is the highest MOUSA employment level
in the state in recent years. MOUSA employment at the
national level also exhibits a post-2004 rebound but still has
a ways to go to reach the year 2000 level.
Figure C-16 further illustrates the dominant role that
manufacturing plays in Indiana’s FDI–related employment.
In 2006, 65 percent of total MOUSA employment in the
state was in the manufacturing sector, the second highest
percentage nationally and leading all Midwestern states.
Wholesale trade was Indiana’s second largest sector with
an 11 percent share of total MOUSA employment. Retail
trade followed at 4 percent. MOUSA employment in the
United States is distributed more evenly across sectors
with manufacturing registering 39 percent of employment,
followed by wholesale trade at 12 percent.
Figure C-15: Percent Change in Majority-Owned U.S. Affiliate Employment, Indiana and the United States, 1999 to 2006
Source: Bureau of Economic Analysis
-8%
-3%
2%
7%
12%
1999 2000
2001
2002 2003 2004
2005
2006
Cumu
lative
Per
cent
Chan
ge fr
om 19
99 Indiana United States
Figure C-16: Share of Majority-Owned U.S. Affiliate Employment by Sector, 2005
Source: Bureau of Economic Analysis
Michigan
Illinois
Iowa
TennesseeMinnesota Missouri Ohio Wisconsin
Kentucky
IndianaUnited States
Manufacturing
Wholesale Trade
Retail Trade
Information
Finance (except depository institutions) and Insurance
Real Estate, Rental and Leasing
Professional, Scientific and Technical Services
Other Industries
18 Indiana’s Foreign Direct Investment July 2009
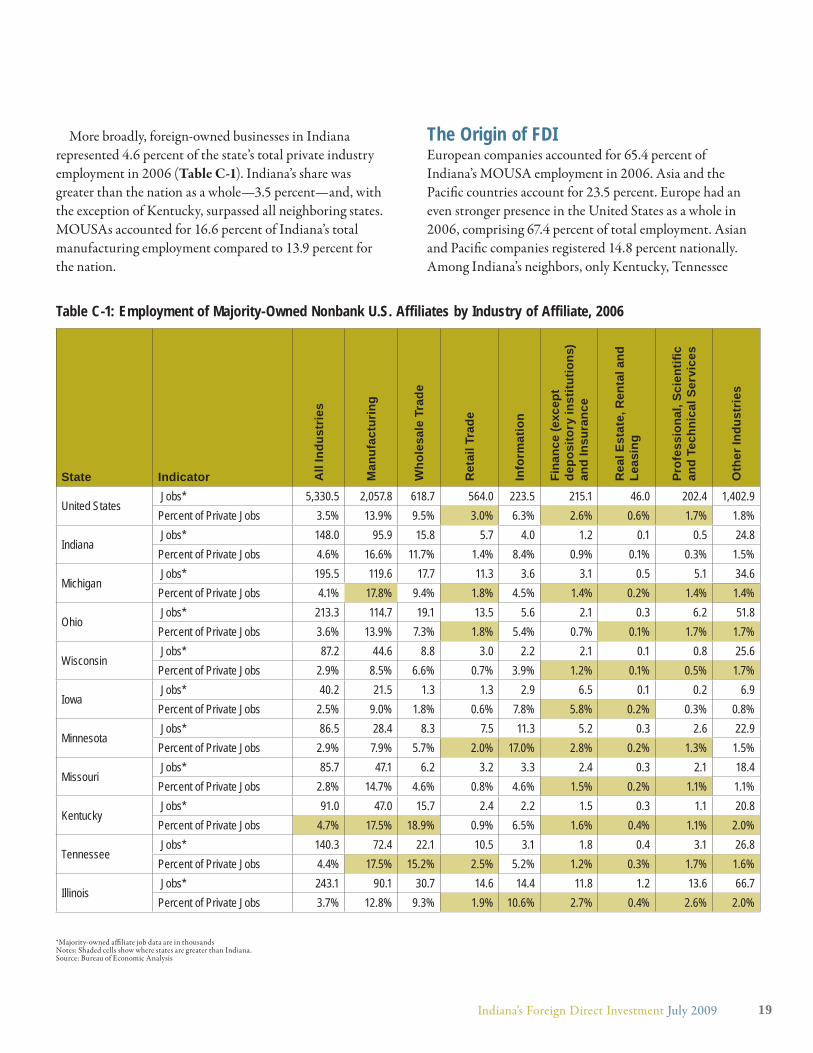
More broadly, foreign-owned businesses in Indiana
represented 4.6 percent of the state’s total private industry
employment in 2006 (Table C-1). Indiana’s share was
greater than the nation as a whole—3.5 percent—and, with
the exception of Kentucky, surpassed all neighboring states.
MOUSAs accounted for 16.6 percent of Indiana’s total
manufacturing employment compared to 13.9 percent for
the nation.
The Origin of FDIEuropean companies accounted for 65.4 percent of
Indiana’s MOUSA employment in 2006. Asia and the
Pacifi c countries account for 23.5 percent. Europe had an
even stronger presence in the United States as a whole in
2006, comprising 67.4 percent of total employment. Asian
and Pacifi c companies registered 14.8 percent nationally.
Among Indiana’s neighbors, only Kentucky, Tennessee
*Majority-owned affi liate job data are in thousandsNotes: Shaded cells show where states are greater than Indiana.Source: Bureau of Economic Analysis
Table C-1: Employment of Majority-Owned Nonbank U.S. Affiliates by Industry of Affiliate, 2006
State Indicator All
Indu
stri
es
Man
ufac
turi
ng
Who
lesa
le T
rade
Ret
ail T
rade
Info
rmat
ion
Fina
nce
(exc
ept
depo
sito
ry in
stitu
tions
) an
d In
sura
nce
Rea
l Est
ate,
Ren
tal a
nd
Leas
ing
Prof
essi
onal
, Sci
entifi
c
and
Tech
nica
l Ser
vice
s
Oth
er In
dust
ries
United States Jobs* 5,330.5 2,057.8 618.7 564.0 223.5 215.1 46.0 202.4 1,402.9Percent of Private Jobs 3.5% 13.9% 9.5% 3.0% 6.3% 2.6% 0.6% 1.7% 1.8%
Indiana Jobs* 148.0 95.9 15.8 5.7 4.0 1.2 0.1 0.5 24.8Percent of Private Jobs 4.6% 16.6% 11.7% 1.4% 8.4% 0.9% 0.1% 0.3% 1.5%
Michigan Jobs* 195.5 119.6 17.7 11.3 3.6 3.1 0.5 5.1 34.6Percent of Private Jobs 4.1% 17.8% 9.4% 1.8% 4.5% 1.4% 0.2% 1.4% 1.4%
Ohio Jobs* 213.3 114.7 19.1 13.5 5.6 2.1 0.3 6.2 51.8Percent of Private Jobs 3.6% 13.9% 7.3% 1.8% 5.4% 0.7% 0.1% 1.7% 1.7%
Wisconsin Jobs* 87.2 44.6 8.8 3.0 2.2 2.1 0.1 0.8 25.6Percent of Private Jobs 2.9% 8.5% 6.6% 0.7% 3.9% 1.2% 0.1% 0.5% 1.7%
Iowa Jobs* 40.2 21.5 1.3 1.3 2.9 6.5 0.1 0.2 6.9Percent of Private Jobs 2.5% 9.0% 1.8% 0.6% 7.8% 5.8% 0.2% 0.3% 0.8%
Minnesota Jobs* 86.5 28.4 8.3 7.5 11.3 5.2 0.3 2.6 22.9Percent of Private Jobs 2.9% 7.9% 5.7% 2.0% 17.0% 2.8% 0.2% 1.3% 1.5%
Missouri Jobs* 85.7 47.1 6.2 3.2 3.3 2.4 0.3 2.1 18.4Percent of Private Jobs 2.8% 14.7% 4.6% 0.8% 4.6% 1.5% 0.2% 1.1% 1.1%
Kentucky Jobs* 91.0 47.0 15.7 2.4 2.2 1.5 0.3 1.1 20.8Percent of Private Jobs 4.7% 17.5% 18.9% 0.9% 6.5% 1.6% 0.4% 1.1% 2.0%
Tennessee Jobs* 140.3 72.4 22.1 10.5 3.1 1.8 0.4 3.1 26.8Percent of Private Jobs 4.4% 17.5% 15.2% 2.5% 5.2% 1.2% 0.3% 1.7% 1.6%
Illinois Jobs* 243.1 90.1 30.7 14.6 14.4 11.8 1.2 13.6 66.7Percent of Private Jobs 3.7% 12.8% 9.3% 1.9% 10.6% 2.7% 0.4% 2.6% 2.0%
19Indiana’s Foreign Direct Investment July 2009
and Ohio had a higher share of MOUSA employment
originating from the Asia/Pacifi c region in 2006 (Figure
C-17).
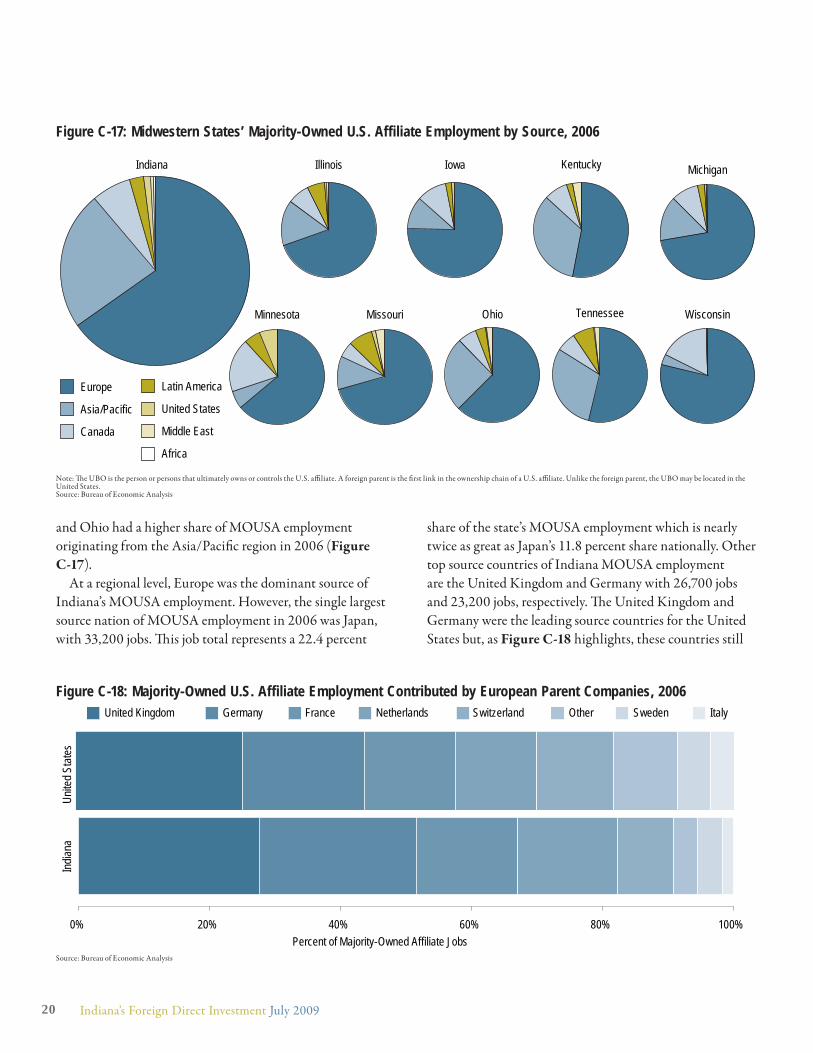
At a regional level, Europe was the dominant source of
Indiana’s MOUSA employment. However, the single largest
source nation of MOUSA employment in 2006 was Japan,
with 33,200 jobs. Th is job total represents a 22.4 percent
share of the state’s MOUSA employment which is nearly
twice as great as Japan’s 11.8 percent share nationally. Other
top source countries of Indiana MOUSA employment
are the United Kingdom and Germany with 26,700 jobs
and 23,200 jobs, respectively. Th e United Kingdom and
Germany were the leading source countries for the United
States but, as Figure C-18 highlights, these countries still
Figure C-17: Midwestern States’ Majority-Owned U.S. Affiliate Employment by Source, 2006
Note: Th e UBO is the person or persons that ultimately owns or controls the U.S. affi liate. A foreign parent is the fi rst link in the ownership chain of a U.S. affi liate. Unlike the foreign parent, the UBO may be located in the United States.Source: Bureau of Economic Analysis
Europe
Asia/Pacific
Canada
Latin America
United States
Middle East
Africa
Indiana
WisconsinMissouri
KentuckyIllinois
Ohio
Michigan
Minnesota
Iowa
Tennessee
Figure C-18: Majority-Owned U.S. Affiliate Employment Contributed by European Parent Companies, 2006
Source: Bureau of Economic Analysis
Unite
d Sta
tes
United Kingdom Germany France Netherlands Switzerland Other Sweden Italy
0% 20% 40% 60% 80% 100%
Indian
a
Percent of Majority-Owned Affiliate Jobs
20 Indiana’s Foreign Direct Investment July 2009
represented a larger share of total MOUSA employment in
Indiana than they did nationally.
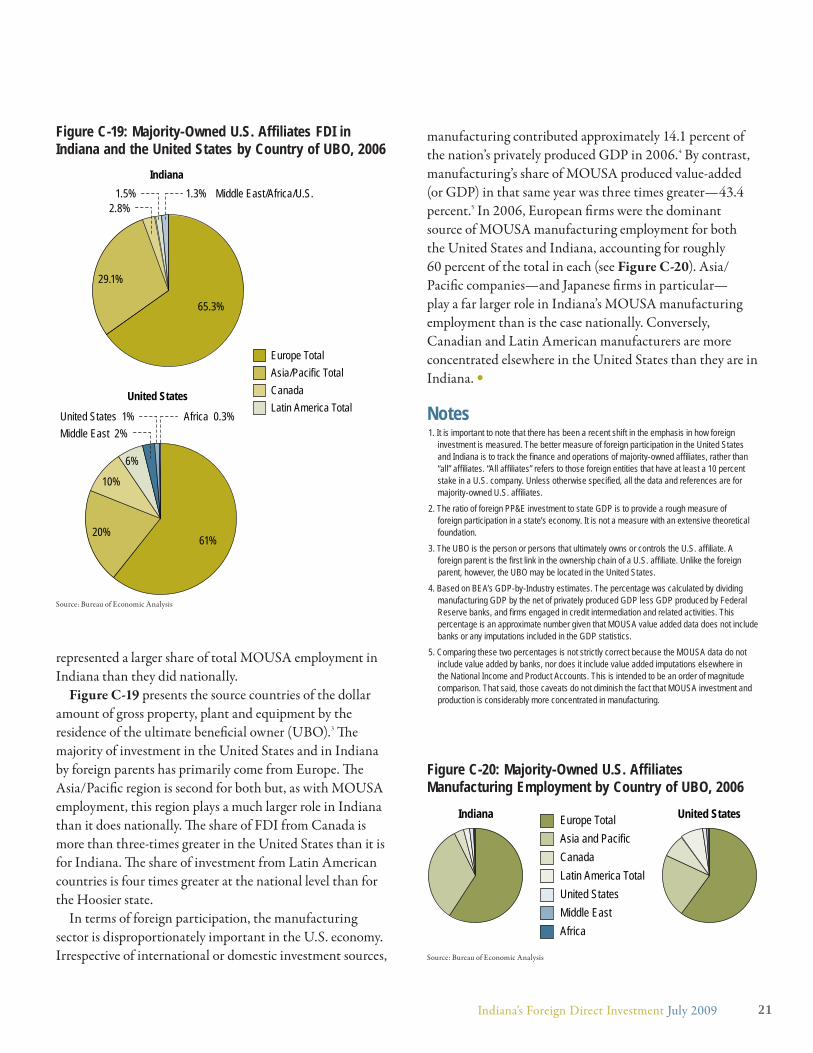
Figure C-19 presents the source countries of the dollar
amount of gross property, plant and equipment by the
residence of the ultimate benefi cial owner (UBO).3 Th e
majority of investment in the United States and in Indiana
by foreign parents has primarily come from Europe. Th e
Asia/Pacifi c region is second for both but, as with MOUSA
employment, this region plays a much larger role in Indiana
than it does nationally. Th e share of FDI from Canada is
more than three-times greater in the United States than it is
for Indiana. Th e share of investment from Latin American
countries is four times greater at the national level than for
the Hoosier state.
In terms of foreign participation, the manufacturing
sector is disproportionately important in the U.S. economy.
Irrespective of international or domestic investment sources,
manufacturing contributed approximately 14.1 percent of
the nation’s privately produced GDP in 2006.4 By contrast,
manufacturing’s share of MOUSA produced value-added
(or GDP) in that same year was three times greater—43.4
percent.5 In 2006, European fi rms were the dominant
source of MOUSA manufacturing employment for both
the United States and Indiana, accounting for roughly
60 percent of the total in each (see Figure C-20). Asia/
Pacifi c companies—and Japanese fi rms in particular—
play a far larger role in Indiana’s MOUSA manufacturing
employment than is the case nationally. Conversely,
Canadian and Latin American manufacturers are more
concentrated elsewhere in the United States than they are in
Indiana. •
Notes1. It is important to note that there has been a recent shift in the emphasis in how foreign
investment is measured. The better measure of foreign participation in the United States and Indiana is to track the fi nance and operations of majority-owned affi liates, rather than “all” affi liates. “All affi liates” refers to those foreign entities that have at least a 10 percent stake in a U.S. company. Unless otherwise specifi ed, all the data and references are for majority-owned U.S. affi liates.
2. The ratio of foreign PP&E investment to state GDP is to provide a rough measure of foreign participation in a state’s economy. It is not a measure with an extensive theoretical foundation.
3. The UBO is the person or persons that ultimately owns or controls the U.S. affi liate. A foreign parent is the fi rst link in the ownership chain of a U.S. affi liate. Unlike the foreign parent, however, the UBO may be located in the United States.
4. Based on BEA’s GDP-by-Industry estimates. The percentage was calculated by dividing manufacturing GDP by the net of privately produced GDP less GDP produced by Federal Reserve banks, and fi rms engaged in credit intermediation and related activities. This percentage is an approximate number given that MOUSA value added data does not include banks or any imputations included in the GDP statistics.
5. Comparing these two percentages is not strictly correct because the MOUSA data do not include value added by banks, nor does it include value added imputations elsewhere in the National Income and Product Accounts. This is intended to be an order of magnitude comparison. That said, those caveats do not diminish the fact that MOUSA investment and production is considerably more concentrated in manufacturing.
Figure C-19: Majority-Owned U.S. Affiliates FDI in Indiana and the United States by Country of UBO, 2006
Source: Bureau of Economic Analysis
Indiana
65.3%
29.1%
2.8%1.5% 1.3% Middle East/Africa/U.S.
United States
61%20%
10%
6%
Europe TotalAsia/Pacific TotalCanadaLatin America Total
Middle East 2%United States 1% Africa 0.3%
Figure C-20: Majority-Owned U.S. Affiliates Manufacturing Employment by Country of UBO, 2006
United StatesEurope TotalAsia and PacificCanadaLatin America TotalUnited StatesMiddle EastAfrica
Indiana
Source: Bureau of Economic Analysis
21Indiana’s Foreign Direct Investment July 2009
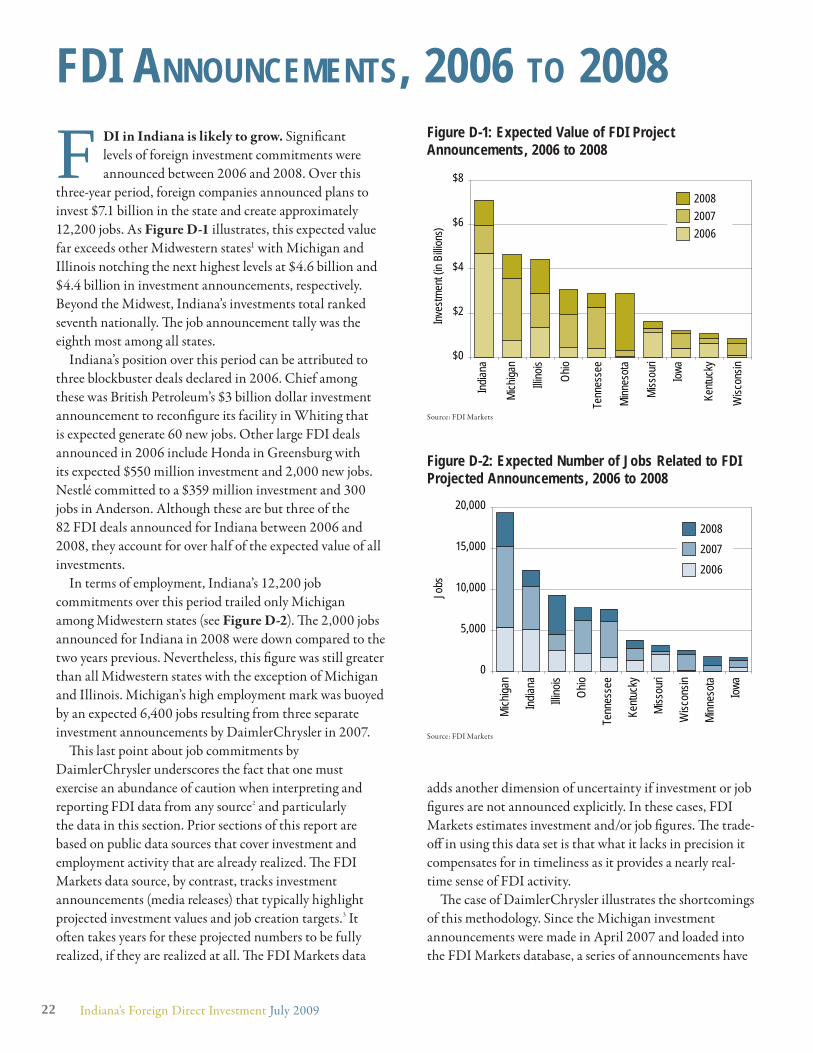
FDI in Indiana is likely to grow. Signifi cant
levels of foreign investment commitments were
announced between 2006 and 2008. Over this
three-year period, foreign companies announced plans to
invest $7.1 billion in the state and create approximately
12,200 jobs. As Figure D-1 illustrates, this expected value
far exceeds other Midwestern states1 with Michigan and
Illinois notching the next highest levels at $4.6 billion and
$4.4 billion in investment announcements, respectively.
Beyond the Midwest, Indiana’s investments total ranked
seventh nationally. Th e job announcement tally was the
eighth most among all states.
Indiana’s position over this period can be attributed to
three blockbuster deals declared in 2006. Chief among
these was British Petroleum’s $3 billion dollar investment
announcement to reconfi gure its facility in Whiting that
is expected generate 60 new jobs. Other large FDI deals
announced in 2006 include Honda in Greensburg with
its expected $550 million investment and 2,000 new jobs.
Nestlé committed to a $359 million investment and 300
jobs in Anderson. Although these are but three of the
82 FDI deals announced for Indiana between 2006 and
2008, they account for over half of the expected value of all
investments.
In terms of employment, Indiana’s 12,200 job
commitments over this period trailed only Michigan
among Midwestern states (see Figure D-2). Th e 2,000 jobs
announced for Indiana in 2008 were down compared to the
two years previous. Nevertheless, this fi gure was still greater
than all Midwestern states with the exception of Michigan
and Illinois. Michigan’s high employment mark was buoyed
by an expected 6,400 jobs resulting from three separate
investment announcements by DaimlerChrysler in 2007.
Th is last point about job commitments by
DaimlerChrysler underscores the fact that one must
exercise an abundance of caution when interpreting and
reporting FDI data from any source2 and particularly
the data in this section. Prior sections of this report are
based on public data sources that cover investment and
employment activity that are already realized. Th e FDI
Markets data source, by contrast, tracks investment
announcements (media releases) that typically highlight
projected investment values and job creation targets.3 It
oft en takes years for these projected numbers to be fully
realized, if they are realized at all. Th e FDI Markets data
adds another dimension of uncertainty if investment or job
fi gures are not announced explicitly. In these cases, FDI
Markets estimates investment and/or job fi gures. Th e trade-
off in using this data set is that what it lacks in precision it
compensates for in timeliness as it provides a nearly real-
time sense of FDI activity.
Th e case of DaimlerChrysler illustrates the shortcomings
of this methodology. Since the Michigan investment
announcements were made in April 2007 and loaded into
the FDI Markets database, a series of announcements have
FDI ANNOUNCEMENTS, 2006 TO 2008Figure D-1: Expected Value of FDI Project Announcements, 2006 to 2008
Source: FDI Markets
$0
$2
$4
$6
$8
Indian
a
Mich
igan
Illino
is
Ohio
Tenn
esse
e
Minn
esot
a
Miss
ouri
Iowa
Kentu
cky
Wisc
onsin
Inves
tmen
t (in
Billio
ns) 2006
20072008
Figure D-2: Expected Number of Jobs Related to FDI Projected Announcements, 2006 to 2008
Source: FDI Markets
0
5,000
10,000
15,000
20,000Mi
chiga
n
Indian
a
Illino
is
Ohio
Tenn
esse
e
Kentu
cky
Miss
ouri
Wisc
onsin
Minn
esot
a
Iowa
Jobs
200620072008
22 Indiana’s Foreign Direct Investment July 2009
altered the nature of these deals. First, DaimlerChrysler
split. Chrysler was purchased by a domestic private equity
fi rm; these announced investments are no longer FDI.
Next, the employment targets estimated by FDI Markets
are signifi cantly larger than those presented by Chrysler in
subsequent announcements. On this point, consider the
April 2007 announcement for a new Chrysler axle plant in
Marysville, Michigan. FDI Markets estimated 3,000 new
jobs for this facility yet more recent media releases place
the number at 350 jobs, many of which will be transferred
from an existing Chrysler facility.4 Despite these inherent
shortcomings, FDI Markets is our best source for near real-
time FDI activity.
FDI Announcements by IndustryBased solely on two investments announced by British
Petroleum in 2006, the coal, oil and natural gas industry
accounted for more than 40 percent of the total expected
value of FDI announced in Indiana between 2006 and
2008. However, with only 179 new jobs anticipated, the
investments in this capital intensive industry comprise just
1 percent of the total employment expected from FDI deals.
Th e automotive industry ranked second, representing 23
percent of expected foreign investment followed by beverage
production at 9 percent.
Th e automotive industry continues to dominate Indiana’s
FDI-related employment. Th e state can expect 5,200 new
auto-related jobs resulting from the 18 FDI deals announced
in this industry sector between 2006 and 2008. Th irty-
eight percent of these auto-related jobs will be attributed to
the new Honda production facility in Greensburg, which
was the single largest FDI job announcement in the state
over this period. In total, the auto industry accounted for
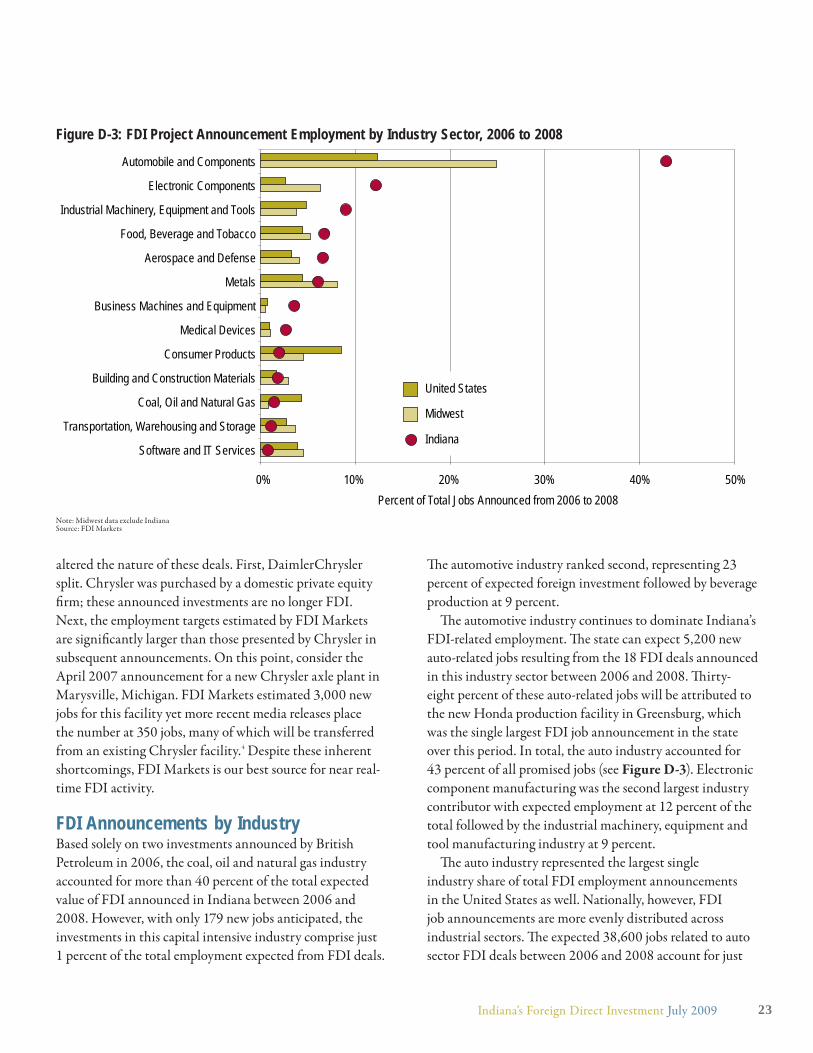
43 percent of all promised jobs (see Figure D-3). Electronic
component manufacturing was the second largest industry
contributor with expected employment at 12 percent of the
total followed by the industrial machinery, equipment and
tool manufacturing industry at 9 percent.
Th e auto industry represented the largest single
industry share of total FDI employment announcements
in the United States as well. Nationally, however, FDI
job announcements are more evenly distributed across
industrial sectors. Th e expected 38,600 jobs related to auto
sector FDI deals between 2006 and 2008 account for just
0% 10% 20% 30% 40% 50%
United States
Midwest
IndianaSoftware and IT Services
Transportation, Warehousing and Storage
Coal, Oil and Natural Gas
Building and Construction Materials
Consumer Products
Medical Devices
Business Machines and Equipment
Metals
Aerospace and Defense
Food, Beverage and Tobacco
Industrial Machinery, Equipment and Tools
Electronic Components
Automobile and Components
Percent of Total Jobs Announced from 2006 to 2008
Figure D-3: FDI Project Announcement Employment by Industry Sector, 2006 to 2008
Note: Midwest data exclude IndianaSource: FDI Markets
23Indiana’s Foreign Direct Investment July 2009
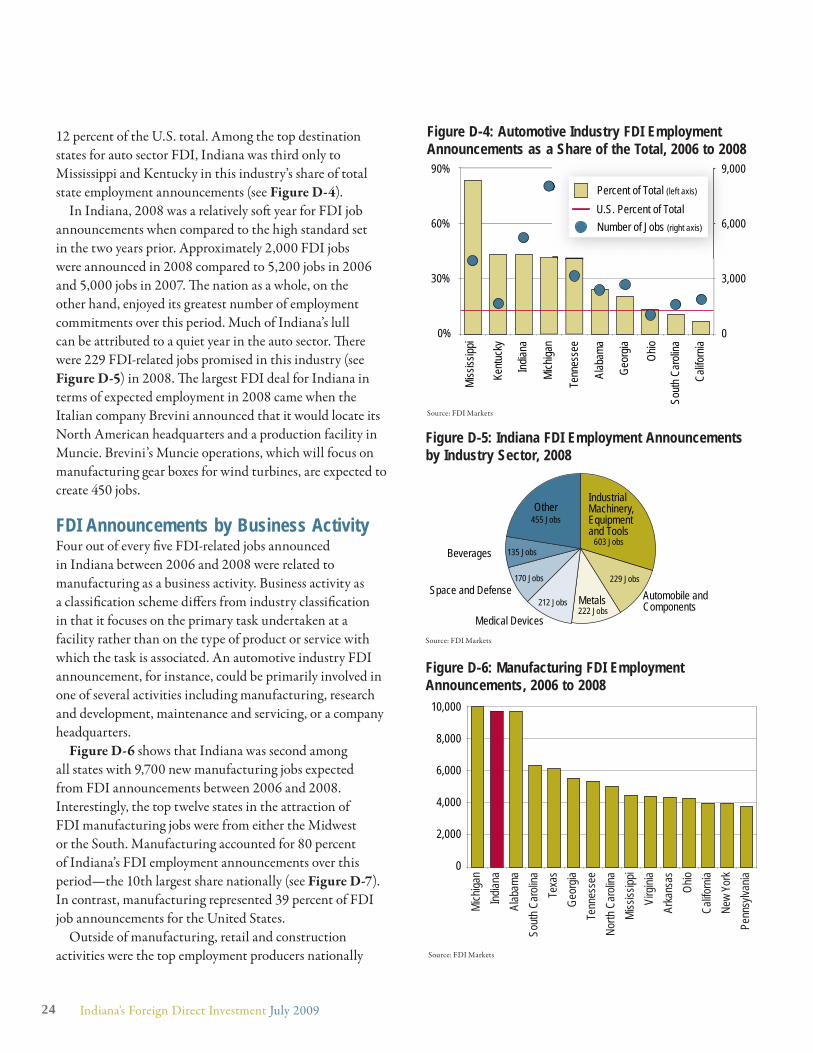
12 percent of the U.S. total. Among the top destination
states for auto sector FDI, Indiana was third only to
Mississippi and Kentucky in this industry’s share of total
state employment announcements (see Figure D-4).
In Indiana, 2008 was a relatively soft year for FDI job
announcements when compared to the high standard set
in the two years prior. Approximately 2,000 FDI jobs
were announced in 2008 compared to 5,200 jobs in 2006
and 5,000 jobs in 2007. Th e nation as a whole, on the
other hand, enjoyed its greatest number of employment
commitments over this period. Much of Indiana’s lull
can be attributed to a quiet year in the auto sector. Th ere
were 229 FDI-related jobs promised in this industry (see
Figure D-5) in 2008. Th e largest FDI deal for Indiana in
terms of expected employment in 2008 came when the
Italian company Brevini announced that it would locate its
North American headquarters and a production facility in
Muncie. Brevini’s Muncie operations, which will focus on
manufacturing gear boxes for wind turbines, are expected to
create 450 jobs.
FDI Announcements by Business ActivityFour out of every fi ve FDI-related jobs announced
in Indiana between 2006 and 2008 were related to
manufacturing as a business activity. Business activity as
a classifi cation scheme diff ers from industry classifi cation
in that it focuses on the primary task undertaken at a
facility rather than on the type of product or service with
which the task is associated. An automotive industry FDI
announcement, for instance, could be primarily involved in
one of several activities including manufacturing, research
and development, maintenance and servicing, or a company
headquarters.
Figure D-6 shows that Indiana was second among
all states with 9,700 new manufacturing jobs expected
from FDI announcements between 2006 and 2008.
Interestingly, the top twelve states in the attraction of
FDI manufacturing jobs were from either the Midwest
or the South. Manufacturing accounted for 80 percent
of Indiana’s FDI employment announcements over this
period—the 10th largest share nationally (see Figure D-7).
In contrast, manufacturing represented 39 percent of FDI
job announcements for the United States.
Outside of manufacturing, retail and construction
activities were the top employment producers nationally
Figure D-4: Automotive Industry FDI Employment Announcements as a Share of the Total, 2006 to 2008
Source: FDI Markets
0%
30%
60%
90%
Miss
issipp
i
Kentu
cky
Indian
a
Mich
igan
Tenn
esse
e
Alab
ama
Geor
gia
Ohio
Sout
h Car
olina
Califo
rnia
0
3,000
6,000
9,000
6,
9,
U.S. Percent of TotalPercent of Total (left axis)
Number of Jobs (right axis)
Industrial Machinery,Equipment and Tools
Automobile and ComponentsMetals
Medical Devices
Space and Defense
Beverages
Other455 Jobs
603 Jobs
229 Jobs
222 Jobs212 Jobs
170 Jobs
135 Jobs
Figure D-5: Indiana FDI Employment Announcements by Industry Sector, 2008
Source: FDI Markets
Figure D-6: Manufacturing FDI Employment Announcements, 2006 to 2008
0
2,000
4,000
6,000
8,000
10,000
Mich
igan
Indian
a Al
abam
a So
uth C
aroli
na
Texa
s Ge
orgia
Te
nnes
see
North
Car
olina
Mi
ssiss
ippi
Virg
inia
Arka
nsas
Oh
io Ca
liforn
ia Ne
w Yo
rk
Penn
sylva
nia
Source: FDI Markets
24 Indiana’s Foreign Direct Investment July 2009
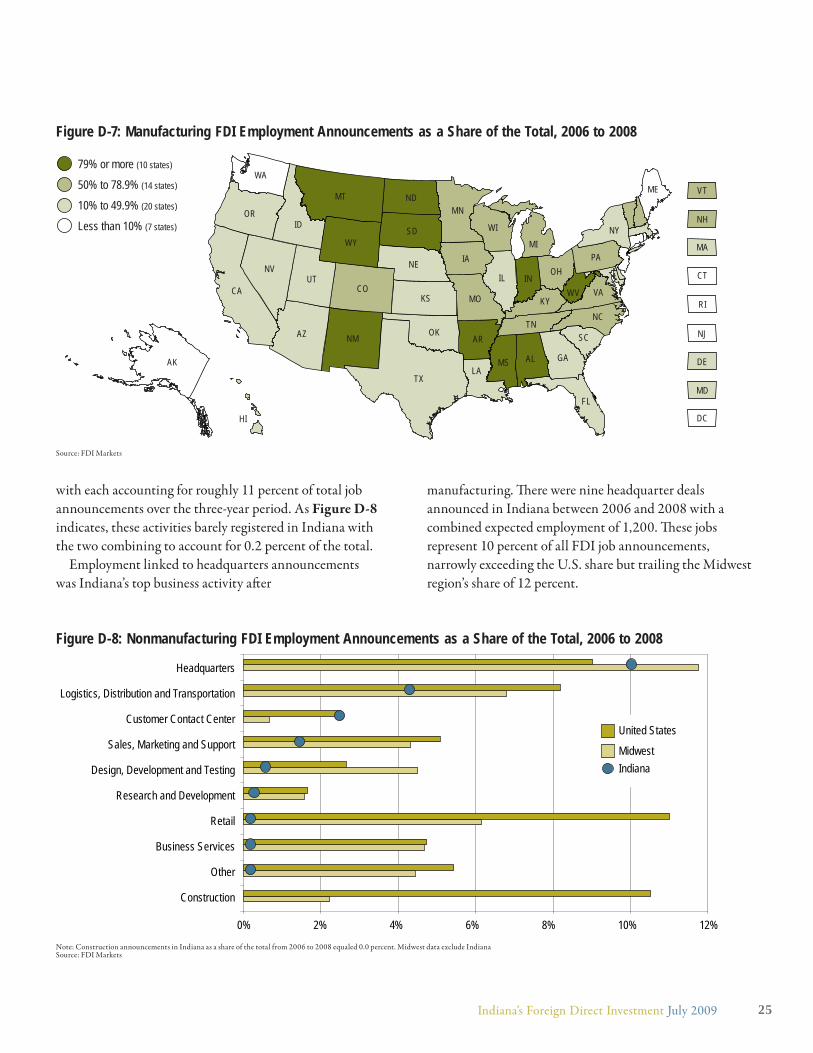
with each accounting for roughly 11 percent of total job
announcements over the three-year period. As Figure D-8
indicates, these activities barely registered in Indiana with
the two combining to account for 0.2 percent of the total.
Employment linked to headquarters announcements
was Indiana’s top business activity aft er
manufacturing. Th ere were nine headquarter deals
announced in Indiana between 2006 and 2008 with a
combined expected employment of 1,200. Th ese jobs
represent 10 percent of all FDI job announcements,
narrowly exceeding the U.S. share but trailing the Midwest
region’s share of 12 percent.
79% or more (10 states)
50% to 78.9% (14 states)
10% to 49.9% (20 states)
Less than 10% (7 states)
WA
MTME
ND
SDWY
WIID
VT
MNOR NH
IAMA
NE
NY
PA
CT
RI
NJ
INNV
UTCA
OHIL
DC
DE
WV
MD
COKYKS VA
MO
AZ OKNC
TN
TX
NM
ALMS GA
SCAR
LA
FL
HI
AK
MI
Figure D-7: Manufacturing FDI Employment Announcements as a Share of the Total, 2006 to 2008
Source: FDI Markets
Figure D-8: Nonmanufacturing FDI Employment Announcements as a Share of the Total, 2006 to 2008
Note: Construction announcements in Indiana as a share of the total from 2006 to 2008 equaled 0.0 percent. Midwest data exclude IndianaSource: FDI Markets
0% 2% 4% 6% 8% 10% 12%
Other
Research and Development
Customer Contact Center
Design, Development and Testing
Business Services
Sales, Marketing and Support
Logistics, Distribution and Transportation
Headquarters
Construction
Retail
United States
MidwestIndiana
25Indiana’s Foreign Direct Investment July 2009
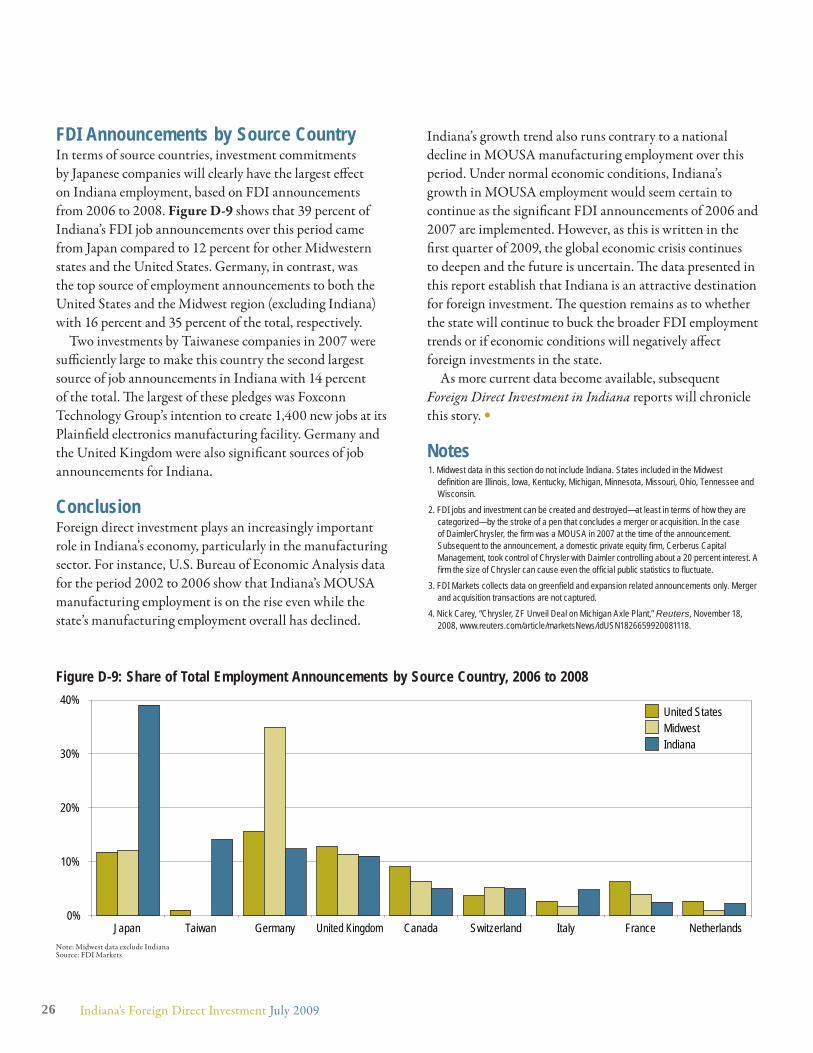
FDI Announcements by Source CountryIn terms of source countries, investment commitments
by Japanese companies will clearly have the largest eff ect
on Indiana employment, based on FDI announcements
from 2006 to 2008. Figure D-9 shows that 39 percent of
Indiana’s FDI job announcements over this period came
from Japan compared to 12 percent for other Midwestern
states and the United States. Germany, in contrast, was
the top source of employment announcements to both the
United States and the Midwest region (excluding Indiana)
with 16 percent and 35 percent of the total, respectively.
Two investments by Taiwanese companies in 2007 were
suffi ciently large to make this country the second largest
source of job announcements in Indiana with 14 percent
of the total. Th e largest of these pledges was Foxconn
Technology Group’s intention to create 1,400 new jobs at its
Plainfi eld electronics manufacturing facility. Germany and
the United Kingdom were also signifi cant sources of job
announcements for Indiana.
ConclusionForeign direct investment plays an increasingly important
role in Indiana’s economy, particularly in the manufacturing
sector. For instance, U.S. Bureau of Economic Analysis data
for the period 2002 to 2006 show that Indiana’s MOUSA
manufacturing employment is on the rise even while the
state’s manufacturing employment overall has declined.
Indiana’s growth trend also runs contrary to a national
decline in MOUSA manufacturing employment over this
period. Under normal economic conditions, Indiana’s
growth in MOUSA employment would seem certain to
continue as the signifi cant FDI announcements of 2006 and
2007 are implemented. However, as this is written in the
fi rst quarter of 2009, the global economic crisis continues
to deepen and the future is uncertain. Th e data presented in
this report establish that Indiana is an attractive destination
for foreign investment. Th e question remains as to whether
the state will continue to buck the broader FDI employment
trends or if economic conditions will negatively aff ect
foreign investments in the state.
As more current data become available, subsequent
Foreign Direct Investment in Indiana reports will chronicle
this story. •
Notes1. Midwest data in this section do not include Indiana. States included in the Midwest
defi nition are Illinois, Iowa, Kentucky, Michigan, Minnesota, Missouri, Ohio, Tennessee and Wisconsin.
2. FDI jobs and investment can be created and destroyed—at least in terms of how they are categorized—by the stroke of a pen that concludes a merger or acquisition. In the case of DaimlerChrysler, the fi rm was a MOUSA in 2007 at the time of the announcement. Subsequent to the announcement, a domestic private equity fi rm, Cerberus Capital Management, took control of Chrysler with Daimler controlling about a 20 percent interest. A fi rm the size of Chrysler can cause even the offi cial public statistics to fl uctuate.
3. FDI Markets collects data on greenfi eld and expansion related announcements only. Merger and acquisition transactions are not captured.
4. Nick Carey, “Chrysler, ZF Unveil Deal on Michigan Axle Plant,” Reuters, November 18, 2008, www.reuters.com/article/marketsNews/idUSN1826659920081118.
0%
10%
20%
30%
40%
Japan Taiwan Germany United Kingdom Canada Switzerland Italy France Netherlands
United StatesMidwestIndiana
Figure D-9: Share of Total Employment Announcements by Source Country, 2006 to 2008
Note: Midwest data exclude IndianaSource: FDI Markets
26 Indiana’s Foreign Direct Investment July 2009
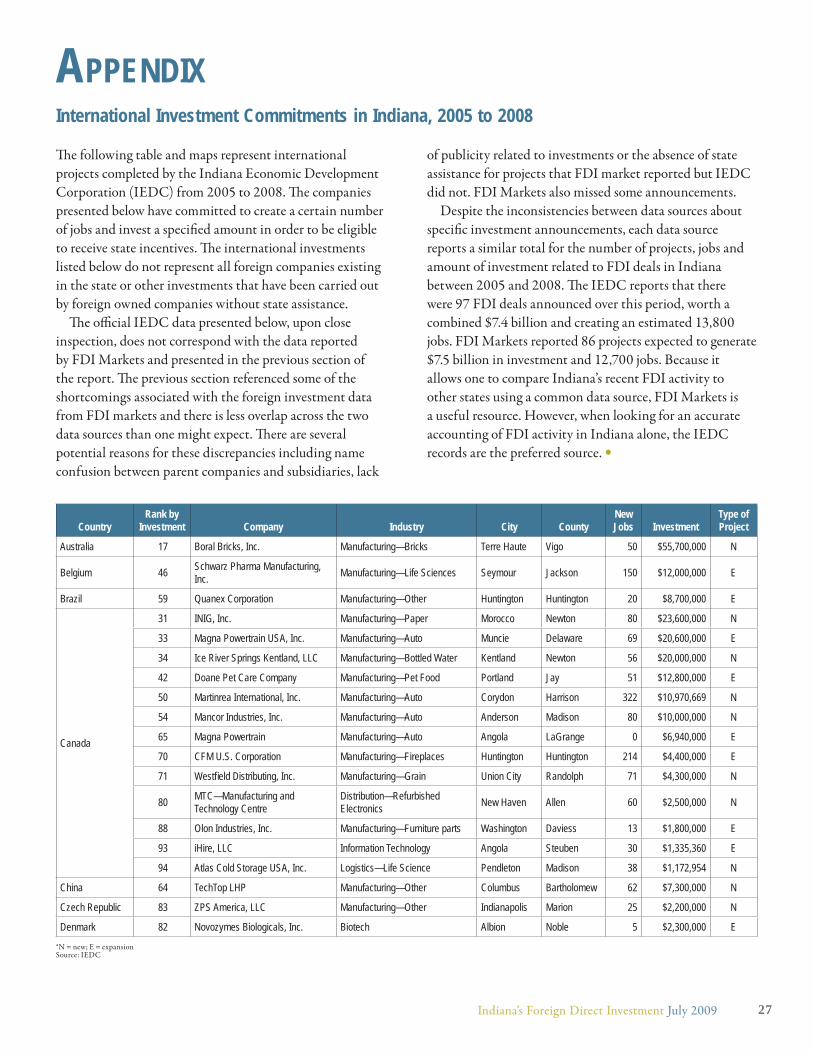
Th e following table and maps represent international
projects completed by the Indiana Economic Development
Corporation (IEDC) from 2005 to 2008. Th e companies
presented below have committed to create a certain number
of jobs and invest a specifi ed amount in order to be eligible
to receive state incentives. Th e international investments
listed below do not represent all foreign companies existing
in the state or other investments that have been carried out
by foreign owned companies without state assistance.
Th e offi cial IEDC data presented below, upon close
inspection, does not correspond with the data reported
by FDI Markets and presented in the previous section of
the report. Th e previous section referenced some of the
shortcomings associated with the foreign investment data
from FDI markets and there is less overlap across the two
data sources than one might expect. Th ere are several
potential reasons for these discrepancies including name
confusion between parent companies and subsidiaries, lack
of publicity related to investments or the absence of state
assistance for projects that FDI market reported but IEDC
did not. FDI Markets also missed some announcements.
Despite the inconsistencies between data sources about
specifi c investment announcements, each data source
reports a similar total for the number of projects, jobs and
amount of investment related to FDI deals in Indiana
between 2005 and 2008. Th e IEDC reports that there
were 97 FDI deals announced over this period, worth a
combined $7.4 billion and creating an estimated 13,800
jobs. FDI Markets reported 86 projects expected to generate
$7.5 billion in investment and 12,700 jobs. Because it
allows one to compare Indiana’s recent FDI activity to
other states using a common data source, FDI Markets is
a useful resource. However, when looking for an accurate
accounting of FDI activity in Indiana alone, the IEDC
records are the preferred source. •
APPENDIXInternational Investment Commitments in Indiana, 2005 to 2008
*N = new; E = expansionSource: IEDC
CountryRank by
Investment Company Industry City CountyNew Jobs Investment
Type of Project
Australia 17 Boral Bricks, Inc. Manufacturing—Bricks Terre Haute Vigo 50 $55,700,000 N
Belgium 46 Schwarz Pharma Manufacturing, Inc. Manufacturing—Life Sciences Seymour Jackson 150 $12,000,000 E
Brazil 59 Quanex Corporation Manufacturing—Other Huntington Huntington 20 $8,700,000 E
Canada
31 INIG, Inc. Manufacturing—Paper Morocco Newton 80 $23,600,000 N
33 Magna Powertrain USA, Inc. Manufacturing—Auto Muncie Delaware 69 $20,600,000 E
34 Ice River Springs Kentland, LLC Manufacturing—Bottled Water Kentland Newton 56 $20,000,000 N
42 Doane Pet Care Company Manufacturing—Pet Food Portland Jay 51 $12,800,000 E
50 Martinrea International, Inc. Manufacturing—Auto Corydon Harrison 322 $10,970,669 N
54 Mancor Industries, Inc. Manufacturing—Auto Anderson Madison 80 $10,000,000 N
65 Magna Powertrain Manufacturing—Auto Angola LaGrange 0 $6,940,000 E
70 CFM U.S. Corporation Manufacturing—Fireplaces Huntington Huntington 214 $4,400,000 E
71 Westfi eld Distributing, Inc. Manufacturing—Grain Union City Randolph 71 $4,300,000 N
80 MTC—Manufacturing and Technology Centre
Distribution—Refurbished Electronics New Haven Allen 60 $2,500,000 N
88 Olon Industries, Inc. Manufacturing—Furniture parts Washington Daviess 13 $1,800,000 E
93 iHire, LLC Information Technology Angola Steuben 30 $1,335,360 E
94 Atlas Cold Storage USA, Inc. Logistics—Life Science Pendleton Madison 38 $1,172,954 N
China 64 TechTop LHP Manufacturing—Other Columbus Bartholomew 62 $7,300,000 N
Czech Republic 83 ZPS America, LLC Manufacturing—Other Indianapolis Marion 25 $2,200,000 N
Denmark 82 Novozymes Biologicals, Inc. Biotech Albion Noble 5 $2,300,000 E
27Indiana’s Foreign Direct Investment July 2009
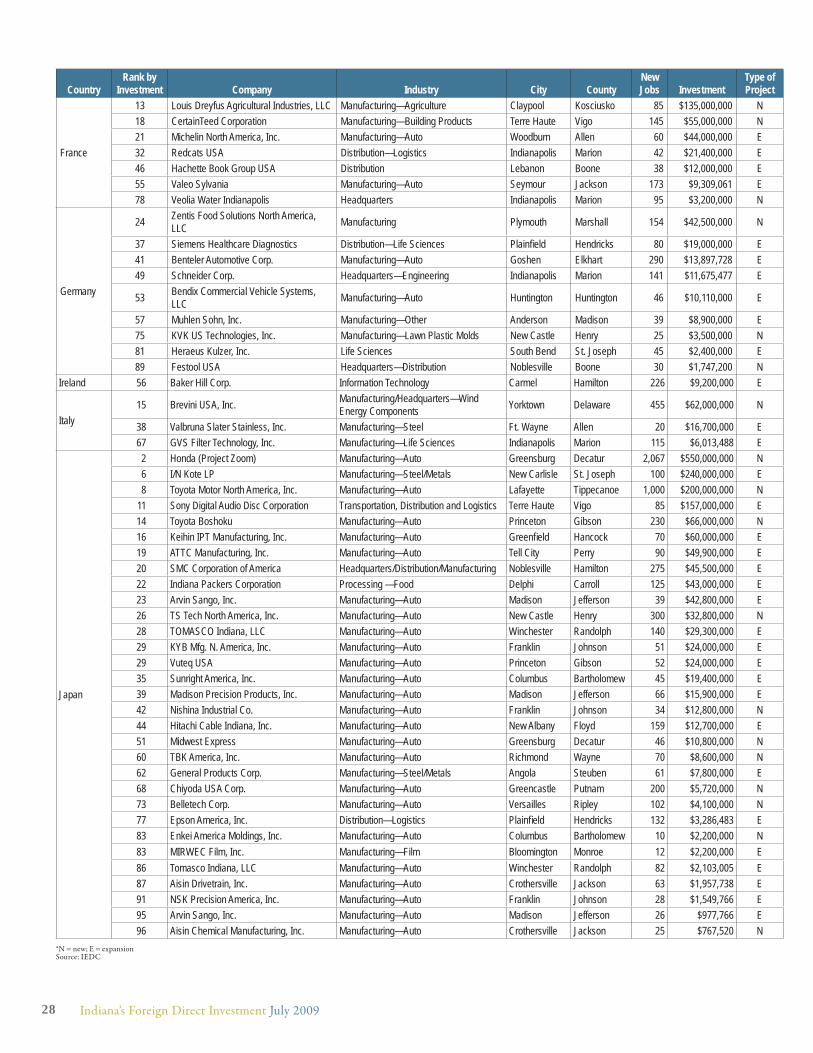
*N = new; E = expansionSource: IEDC
CountryRank by
Investment Company Industry City CountyNew Jobs Investment
Type of Project
France
13 Louis Dreyfus Agricultural Industries, LLC Manufacturing—Agriculture Claypool Kosciusko 85 $135,000,000 N18 CertainTeed Corporation Manufacturing—Building Products Terre Haute Vigo 145 $55,000,000 N21 Michelin North America, Inc. Manufacturing—Auto Woodburn Allen 60 $44,000,000 E32 Redcats USA Distribution—Logistics Indianapolis Marion 42 $21,400,000 E46 Hachette Book Group USA Distribution Lebanon Boone 38 $12,000,000 E55 Valeo Sylvania Manufacturing—Auto Seymour Jackson 173 $9,309,061 E78 Veolia Water Indianapolis Headquarters Indianapolis Marion 95 $3,200,000 N
Germany
24 Zentis Food Solutions North America, LLC Manufacturing Plymouth Marshall 154 $42,500,000 N
37 Siemens Healthcare Diagnostics Distribution—Life Sciences Plainfi eld Hendricks 80 $19,000,000 E41 Benteler Automotive Corp. Manufacturing—Auto Goshen Elkhart 290 $13,897,728 E49 Schneider Corp. Headquarters—Engineering Indianapolis Marion 141 $11,675,477 E
53 Bendix Commercial Vehicle Systems, LLC Manufacturing—Auto Huntington Huntington 46 $10,110,000 E
57 Muhlen Sohn, Inc. Manufacturing—Other Anderson Madison 39 $8,900,000 E75 KVK US Technologies, Inc. Manufacturing—Lawn Plastic Molds New Castle Henry 25 $3,500,000 N81 Heraeus Kulzer, Inc. Life Sciences South Bend St. Joseph 45 $2,400,000 E89 Festool USA Headquarters—Distribution Noblesville Boone 30 $1,747,200 N
Ireland 56 Baker Hill Corp. Information Technology Carmel Hamilton 226 $9,200,000 E
Italy15 Brevini USA, Inc. Manufacturing/Headquarters—Wind
Energy Components Yorktown Delaware 455 $62,000,000 N
38 Valbruna Slater Stainless, Inc. Manufacturing—Steel Ft. Wayne Allen 20 $16,700,000 E67 GVS Filter Technology, Inc. Manufacturing—Life Sciences Indianapolis Marion 115 $6,013,488 E
Japan
2 Honda (Project Zoom) Manufacturing—Auto Greensburg Decatur 2,067 $550,000,000 N6 I/N Kote LP Manufacturing—Steel/Metals New Carlisle St. Joseph 100 $240,000,000 E8 Toyota Motor North America, Inc. Manufacturing—Auto Lafayette Tippecanoe 1,000 $200,000,000 N
11 Sony Digital Audio Disc Corporation Transportation, Distribution and Logistics Terre Haute Vigo 85 $157,000,000 E14 Toyota Boshoku Manufacturing—Auto Princeton Gibson 230 $66,000,000 N16 Keihin IPT Manufacturing, Inc. Manufacturing—Auto Greenfi eld Hancock 70 $60,000,000 E19 ATTC Manufacturing, Inc. Manufacturing—Auto Tell City Perry 90 $49,900,000 E20 SMC Corporation of America Headquarters/Distribution/Manufacturing Noblesville Hamilton 275 $45,500,000 E22 Indiana Packers Corporation Processing —Food Delphi Carroll 125 $43,000,000 E23 Arvin Sango, Inc. Manufacturing—Auto Madison Jefferson 39 $42,800,000 E26 TS Tech North America, Inc. Manufacturing—Auto New Castle Henry 300 $32,800,000 N28 TOMASCO Indiana, LLC Manufacturing—Auto Winchester Randolph 140 $29,300,000 E29 KYB Mfg. N. America, Inc. Manufacturing—Auto Franklin Johnson 51 $24,000,000 E29 Vuteq USA Manufacturing—Auto Princeton Gibson 52 $24,000,000 E35 Sunright America, Inc. Manufacturing—Auto Columbus Bartholomew 45 $19,400,000 E39 Madison Precision Products, Inc. Manufacturing—Auto Madison Jefferson 66 $15,900,000 E42 Nishina Industrial Co. Manufacturing—Auto Franklin Johnson 34 $12,800,000 N44 Hitachi Cable Indiana, Inc. Manufacturing—Auto New Albany Floyd 159 $12,700,000 E51 Midwest Express Manufacturing—Auto Greensburg Decatur 46 $10,800,000 N60 TBK America, Inc. Manufacturing—Auto Richmond Wayne 70 $8,600,000 N62 General Products Corp. Manufacturing—Steel/Metals Angola Steuben 61 $7,800,000 E68 Chiyoda USA Corp. Manufacturing—Auto Greencastle Putnam 200 $5,720,000 N73 Belletech Corp. Manufacturing—Auto Versailles Ripley 102 $4,100,000 N77 Epson America, Inc. Distribution—Logistics Plainfi eld Hendricks 132 $3,286,483 E83 Enkei America Moldings, Inc. Manufacturing—Auto Columbus Bartholomew 10 $2,200,000 N83 MIRWEC Film, Inc. Manufacturing—Film Bloomington Monroe 12 $2,200,000 E86 Tomasco Indiana, LLC Manufacturing—Auto Winchester Randolph 82 $2,103,005 E87 Aisin Drivetrain, Inc. Manufacturing—Auto Crothersville Jackson 63 $1,957,738 E91 NSK Precision America, Inc. Manufacturing—Auto Franklin Johnson 28 $1,549,766 E95 Arvin Sango, Inc. Manufacturing—Auto Madison Jefferson 26 $977,766 E96 Aisin Chemical Manufacturing, Inc. Manufacturing—Auto Crothersville Jackson 25 $767,520 N
28 Indiana’s Foreign Direct Investment July 2009
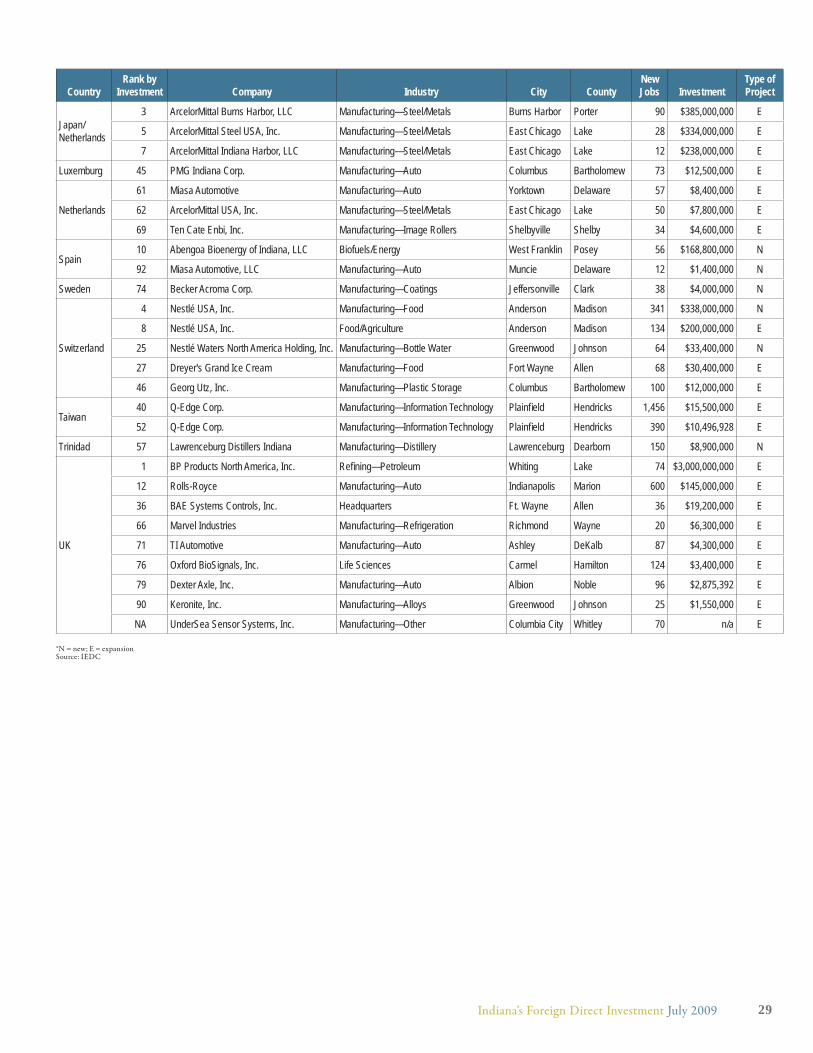
CountryRank by
Investment Company Industry City CountyNew Jobs Investment
Type of Project
Japan/Netherlands
3 ArcelorMittal Burns Harbor, LLC Manufacturing—Steel/Metals Burns Harbor Porter 90 $385,000,000 E
5 ArcelorMittal Steel USA, Inc. Manufacturing—Steel/Metals East Chicago Lake 28 $334,000,000 E
7 ArcelorMittal Indiana Harbor, LLC Manufacturing—Steel/Metals East Chicago Lake 12 $238,000,000 E
Luxemburg 45 PMG Indiana Corp. Manufacturing—Auto Columbus Bartholomew 73 $12,500,000 E
Netherlands
61 Miasa Automotive Manufacturing—Auto Yorktown Delaware 57 $8,400,000 E
62 ArcelorMittal USA, Inc. Manufacturing—Steel/Metals East Chicago Lake 50 $7,800,000 E
69 Ten Cate Enbi, Inc. Manufacturing—Image Rollers Shelbyville Shelby 34 $4,600,000 E
Spain10 Abengoa Bioenergy of Indiana, LLC Biofuels/Energy West Franklin Posey 56 $168,800,000 N
92 Miasa Automotive, LLC Manufacturing—Auto Muncie Delaware 12 $1,400,000 N
Sweden 74 Becker Acroma Corp. Manufacturing—Coatings Jeffersonville Clark 38 $4,000,000 N
Switzerland
4 Nestlé USA, Inc. Manufacturing—Food Anderson Madison 341 $338,000,000 N
8 Nestlé USA, Inc. Food/Agriculture Anderson Madison 134 $200,000,000 E
25 Nestlé Waters North America Holding, Inc. Manufacturing—Bottle Water Greenwood Johnson 64 $33,400,000 N
27 Dreyer's Grand Ice Cream Manufacturing—Food Fort Wayne Allen 68 $30,400,000 E
46 Georg Utz, Inc. Manufacturing—Plastic Storage Columbus Bartholomew 100 $12,000,000 E
Taiwan40 Q-Edge Corp. Manufacturing—Information Technology Plainfi eld Hendricks 1,456 $15,500,000 E
52 Q-Edge Corp. Manufacturing—Information Technology Plainfi eld Hendricks 390 $10,496,928 E
Trinidad 57 Lawrenceburg Distillers Indiana Manufacturing—Distillery Lawrenceburg Dearborn 150 $8,900,000 N
UK
1 BP Products North America, Inc. Refi ning—Petroleum Whiting Lake 74 $3,000,000,000 E
12 Rolls-Royce Manufacturing—Auto Indianapolis Marion 600 $145,000,000 E
36 BAE Systems Controls, Inc. Headquarters Ft. Wayne Allen 36 $19,200,000 E
66 Marvel Industries Manufacturing—Refrigeration Richmond Wayne 20 $6,300,000 E
71 TI Automotive Manufacturing—Auto Ashley DeKalb 87 $4,300,000 E
76 Oxford BioSignals, Inc. Life Sciences Carmel Hamilton 124 $3,400,000 E
79 Dexter Axle, Inc. Manufacturing—Auto Albion Noble 96 $2,875,392 E
90 Keronite, Inc. Manufacturing—Alloys Greenwood Johnson 25 $1,550,000 E
NA UnderSea Sensor Systems, Inc. Manufacturing—Other Columbia City Whitley 70 n/a E
*N = new; E = expansionSource: IEDC
29Indiana’s Foreign Direct Investment July 2009
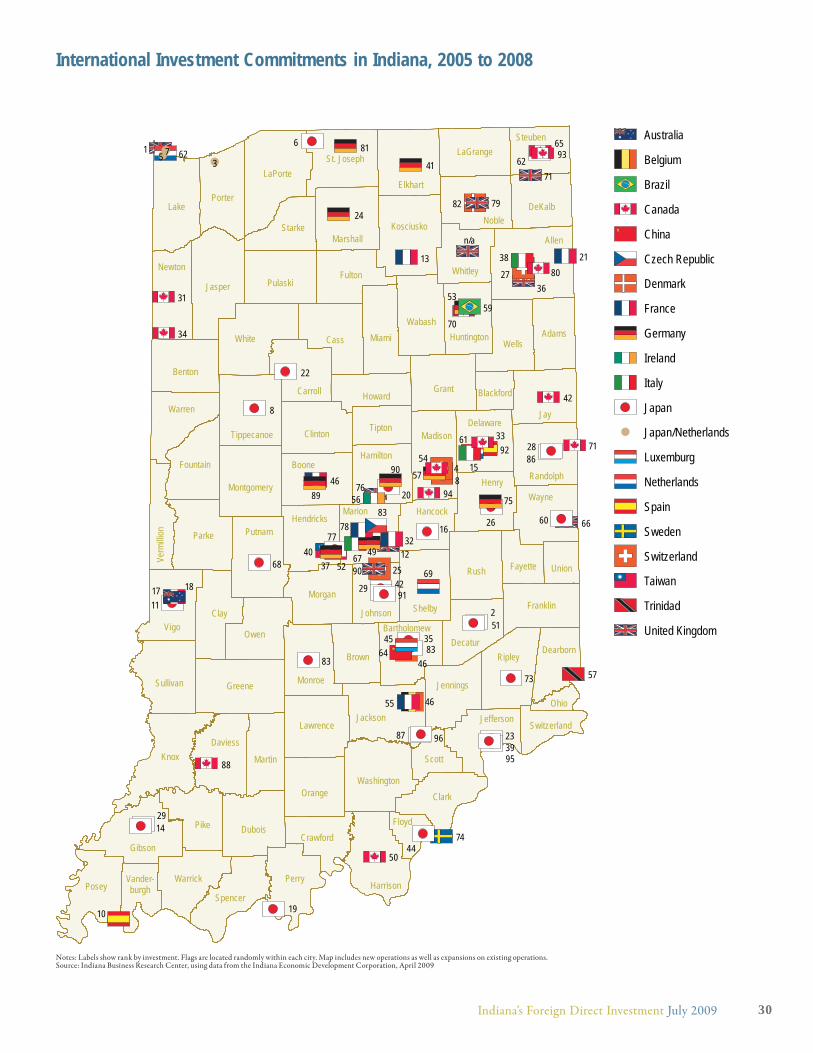
International Investment Commitments in Indiana, 2005 to 2008
Notes: Labels show rank by investment. Flags are located randomly within each city. Map includes new operations as well as expansions on existing operations.Source: Indiana Business Research Center, using data from the Indiana Economic Development Corporation, April 2009
Allen
Jay
Lake
Knox
Vigo
White
Jasper
Cass
Clay
Pike
Rush
LaPorte
Parke
Grant
Greene
Perry
Ripley
Clark
Noble
Gibson
Porter
Wells
Posey
Elkhart
Owen
Henry
Boone
Miami
Jackson
Putnam
Dubois
Shelby
PulaskiFulton
MarionWayne
Clinton
Sullivan
Harrison
Benton
Carroll
Daviess
Martin
Orange
Kosciusko
Monroe
Morgan
Madison
Marshall
Newton
Warrick
Wabash
Warren
Brown
DeKalb
Franklin
Adams
Starke
Spencer
Decatur
Randolph
Lawrence
Whitley
FountainHamilton
Washington
St. Joseph
TippecanoeTipton
Jennings
Delaware
Hendricks
Montgomery
Jefferson
LaGrangeSteuben
Howard
Johnson
Scott
Huntington
Hancock
Crawford
Dearborn
Bartholomew
Fayette Union
Floyd
Blackford
Verm
illion
Switzerland
Ohio
Vander-burgh
n/a
1
84
75 3
8
6
2
90
79
76
71
66
36
12
57
5240
46
27
25
74
92
10
69
62
61
45
96
95
91
87
86
8383
77
73
68
62
60
51
44
42
39
35
29
29
28
26
23
22
20
19
16
14
11
67
38
15
56
90
81
75
57
53
49
41
37
24
78
55
46
32
21
18
13
82
83
64
94
93
88
80
71
70
65
54
50
42
34
33
3159
46
17
89
Australia
Belgium
Brazil
Canada
China
Czech Republic
Denmark
France
Germany
Ireland
Italy
Japan
Japan/Netherlands
Luxemburg
Netherlands
Spain
Sweden
Switzerland
Taiwan
Trinidad
United Kingdom
30Indiana’s Foreign Direct Investment July 2009
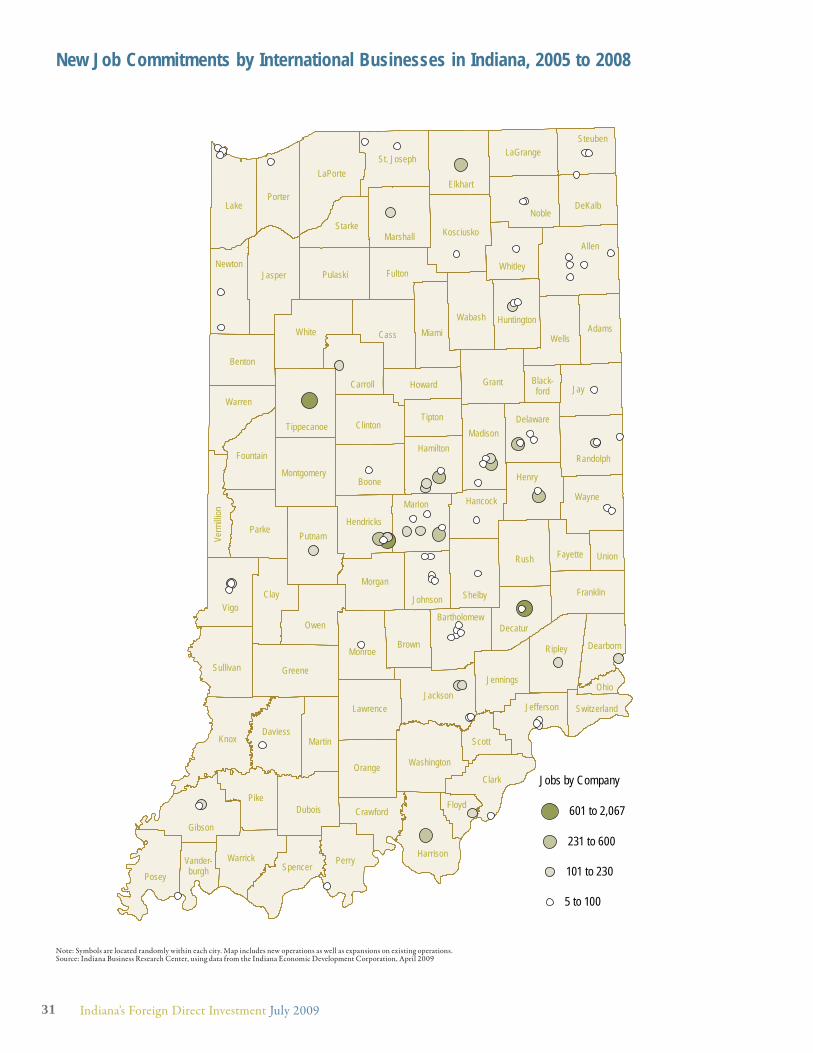
New Job Commitments by International Businesses in Indiana, 2005 to 2008
Note: Symbols are located randomly within each city. Map includes new operations as well as expansions on existing operations.Source: Indiana Business Research Center, using data from the Indiana Economic Development Corporation, April 2009
Allen
Jay
Lake
Knox
Vigo
White
Jasper
Cass
Clay
Pike
Rush
LaPorte
Parke
Grant
Greene
Perry
Ripley
Clark
Noble
Gibson
Porter
Wells
Posey
Elkhart
Owen
HenryBoone
Miami
Jackson
Putnam
Dubois
Shelby
Pulaski Fulton
MarionWayne
Clinton
Sullivan
Harrison
Benton
Carroll
DaviessMartin
Orange
Kosciusko
Monroe
Morgan
Madison
Marshall
Newton
Warrick
Wabash
Warren
Brown
DeKalb
Franklin
Adams
Starke
Spencer
Decatur
Randolph
Lawrence
Whitley
FountainHamilton
Washington
St. Joseph
TippecanoeTipton
Jennings
Delaware
Hendricks
Montgomery
Jefferson
LaGrangeSteuben
Howard
Johnson
Scott
Huntington
Hancock
Crawford
Dearborn
Bartholomew
Fayette Union
Floyd
Black-ford
Verm
illion
Switzerland
Ohio
Vander-burgh
Jobs by Company
5 to 100
101 to 230
231 to 600
601 to 2,067
31 Indiana’s Foreign Direct Investment July 2009
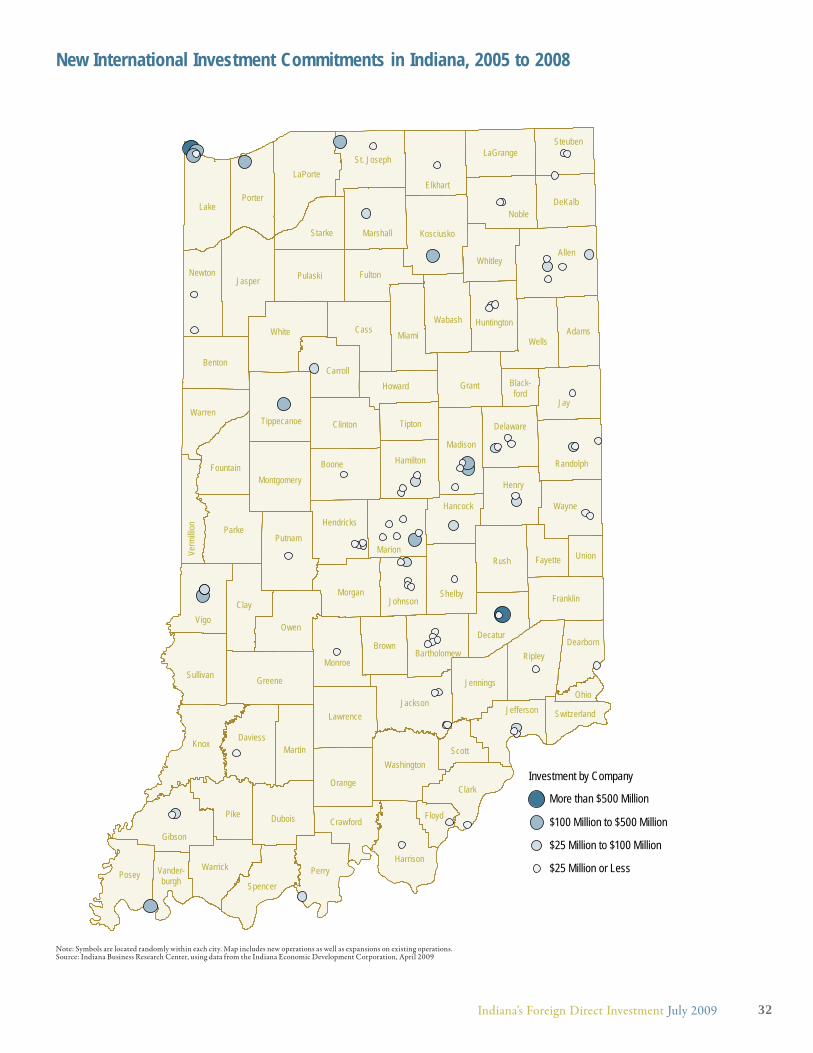
New International Investment Commitments in Indiana, 2005 to 2008
Note: Symbols are located randomly within each city. Map includes new operations as well as expansions on existing operations.Source: Indiana Business Research Center, using data from the Indiana Economic Development Corporation, April 2009
Allen
Jay
Lake
Knox
Vigo
White
Jasper
Cass
Clay
Pike
Rush
LaPorte
Parke
Grant
Greene
Perry
Ripley
Clark
Noble
Gibson
Porter
Wells
Posey
Elkhart
Owen
Henry
Boone
Miami
Jackson
Putnam
Dubois
Shelby
Pulaski Fulton
Marion
Wayne
Clinton
Sullivan
Harrison
BentonCarroll
DaviessMartin
Orange
Kosciusko
Monroe
Morgan
Madison
Marshall
Newton
Warrick
Wabash
Warren
Brown
DeKalb
Franklin
Adams
Starke
Spencer
Decatur
Randolph
Lawrence
Whitley
FountainHamilton
Washington
St. Joseph
Tippecanoe Tipton
Jennings
Delaware
Hendricks
Montgomery
Jefferson
LaGrangeSteuben
Howard
Johnson
Scott
Huntington
Hancock
Crawford
DearbornBartholomew
Fayette Union
Floyd
Black-ford
Verm
illion
Switzerland
Ohio
Vander-burgh
Investment by Company
$25 Million or Less
$25 Million to $100 Million
$100 Million to $500 Million
More than $500 Million
32Indiana’s Foreign Direct Investment July 2009