Embed Size (px)
Citation preview

This PDF is a selection from an out-of-print volume from the National Bureauof Economic Research
Volume Title: Financial Deregulation and Integration in East Asia, NBER-EASEVolume 5
Volume Author/Editor: Takatoshi Ito and Anne O. Krueger, Editors
Volume Publisher: University of Chicago Press
Volume ISBN: 0-226-38671-6
Volume URL: http://www.nber.org/books/ito_96-1
Conference Date: June 15, 1994
Publication Date: January 1996
Chapter Title: Foreign Direct Investment in China: Sources and Consequences
Chapter Author: Shang-Jin Wei
Chapter URL: http://www.nber.org/chapters/c8559
Chapter pages in book: (p. 77 - 105)

3 Foreign Direct Investment in China: Sources and Consequences Shang- Jin Wei
Whether it is a white cat or a black cat, it is a good one if it catches mice.
Deng Xiaoping
3.1 Introduction
China used to be one of the most closed economies in terms of policy toward foreign investment and external debt. Starting from virtually no foreign-owned firms on Chinese soil before 1979, China has now become one of the largest developing host countries for foreign investment with the flow of foreign direct investment (FDI) reaching $26 billion (U.S.) in 1993 (China State Statistics Bureau 1994). This dramatic change is part of the overall Chinese effort that began about 15 years ago to reform the economic system and open up to the outside world. The credo of Deng Xiaoping (and his comrades) is measured pragmatism, as the epigraph indicates. Foreign investors may have greed as their motive, but they are welcome in China nevertheless, as long as their pres- ence helps China to grow.
This paper has two objectives. First, it seeks to examine FDI in China from an international perspective. In particular, it asks whether China has received “enough” FDI from major source countries after controlling for key economic characteristics. Second, the paper studies several consequences of FDI in China, particularly FDI’s contribution to China’s rapid growth, its exports, and its reform effort.
The paper is organized as follows: In section 3.2, I provide an overview of foreign-invested firms in China. In section 3.3, I attempt to put China’s hosting of FDI in an international perspective. Using data on outward investment from the five largest source countries, I estimate the average amount of FDI in a host country as a function of several economic characteristics. China’s actual re- ceipt of investment from these countries is compared with the model predic-
Shang-Jin Wei is assistant professor of public policy at the Kennedy School of Government, Harvard University, and a faculty research fellow of the National Bureau of Economic Research.
The author thanks Chen Huaxuen, Esther Drill, and especially Jungshik Kim for efficient re- search and editorial assistance. The author also thanks Jeffrey Frankel, Pakorn Vichyanond, Wing Thye Woo, and seminar participants for thoughtful comments. The author alone is responsible for any errors that remain.
77

78 Shang-Jin Wei
tion. In section 3.4, I examine several economic consequences of FDI in the Chinese economy. A data set covering 434 cities over 1988-90 is employed to quantify these effects. Section 3.5 concludes the paper.
3.2 General Features of Foreign Investment in China
Before 1979, virtually no foreign-owned firms operated in China, nor did China have many external loans. Chinese leaders used to take pride in this fact. Indeed, even foreign aid volunteered by foreign governments or international organizations was viewed with suspicion. For example, after the great 1976 earthquake in Tangshang (which registered about 8 on the Richter scale and caused millions of deaths), the Chinese government refused an aid offer from the International Red Cross. This attitude toward foreign money took a dra- matic turn in 1979 when Deng Xiaoping introduced economic reform and initi- ated the “open door policy.”
Several factors contributed to this change. Two primary ones are (1) the disastrous economic performance under rigid central planning before 1979 and (2) the glittering examples of Japan and the four Asian “tigers,” particularly Hong Kong and Taiwan.
Foreign capital going into China mainly takes the form of loans. In 1991, the value of FDI was slightly more than 60 percent of that of loans. Over the period 1990-91, the single fastest growing item in non-FDI foreign capital inflow was, in fact, portfolio investment (Chinese bonds and equities pur- chased by foreigners). The growth rate was 3,55 l .5 percent. This is probably not as astonishing as it may sound because China started from an extremely low position. Even with that exponential growth, the total amount of bonds and equities issued in 1991 was only $108.45 million.
This paper focuses on the sources and economic consequences of direct investment. Two types of data on direct investment are typically reported in Chinese statistics: contractual value and realized amount. “Contractual value” is supposedly the amount foreign investors plan or intend to invest in China (over a period of time) at the time the investment application is approved by the Chinese government. The actual investment is not bound by this contractual amount and is typically much smaller. Indeed, the reported contractual amount may even inflate the planned or intended investment because local government officials may have an incentive to announce (or to lure foreign investors to agree on) a large number. For all practical purposes, only the realized amount, or what is sometimes called “actual utilization,” is economically meaningful. All data on foreign investment below will be realized values unless noted otherwise.
The growth of FDI in China truly has been exponential (table 3.1). During 1979-8 1, the average annual inflow of FDI (excluding “compensation trade” and export processing) was less than $0.25 billion (Kueh 1992, table 2b). By 1991, the total amount of realized FDI in China was already $4.37 billion. And the realized foreign capital in 1992 and 1993 reached $19.2 billion and $36.7

79 Foreign Direct Investment in China: Sources and Consequences
Table 3.1 Realized FDI in China, 1983-93 (billion U.S. dollars)
All Developing Year China Countries
1983 0.64 1984 1.26 1985 1.66 1986 1.88 1987 2.3 1 1988 3.19 1989 3.39 1990 3.49 1991 4.37 I992 11.20 1993 25.16
16.29 16.13 12.25 13.24 18.33 25.33 31.13 28.65
Sources: Data for 1983-90 are from Amirahmadi and Wu (1994, table 2); the original source that the authors cite is Balance of Payment Staristics Yearbook (Washington, D.C.: International Monetary Fund, 1990 and 1991). Data for 1991-93 are from China State Statistics Bureau (1994).
billion, respectively; the one-year growth rate was 91.5 percent. The realized FDI in these two years was $1 1.2 billion and $25.76 billion, respectively, with a growth rate of 130 percent. By the end of 1993, the total number of registered foreign-investedmanaged firms reached 167,500, of which 83,100 (or 49.6 percent of the total) were newly established in 1993 (China State Statistics Bureau 1994).
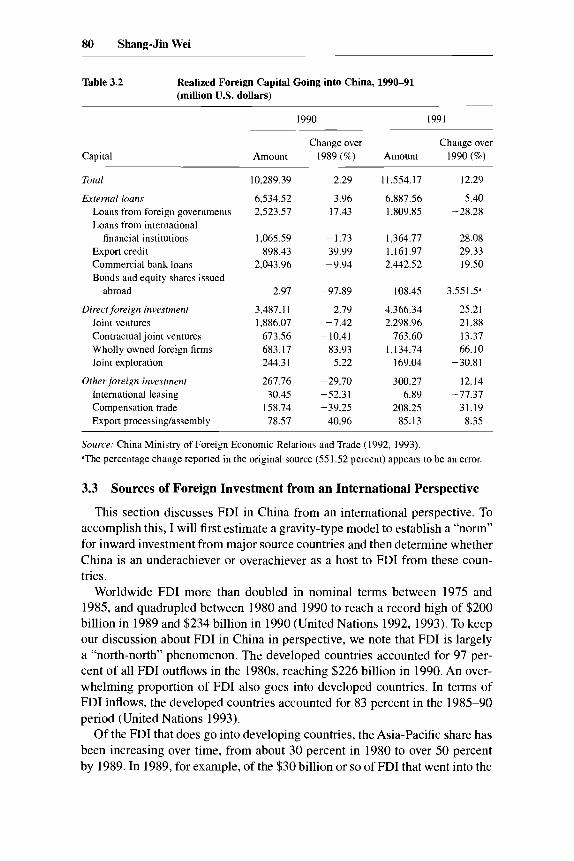
Foreign direct investment takes one of the following four forms: equity joint ventures, contractual joint ventures, wholly owned foreign firms, and joint ex- ploration (mainly for offshore oil). The values of the four forms of FDI during 1990-91 are reported in table 3.2. In terms of percentage shares of total value in 1991, joint ventures and wholly owned foreign firms accounted for the lion’s shares of FDI (52.7 and 26.0 percent, respectively). The wholly owned foreign firm has been the fastest growing form of FDI in recent years. In 1991, it had grown 66.10 percent over the 1990 value, after having a growth rate of 83.93 percent in 1990 over 1989.
In Chinese statistics, there is a third category of foreign capital aside from loans and FDI. The third category, called “other foreign investment” in official statistics, has three subcategories: leasing, compensation trade, and export pro- cessing/assembly. The values of these categories in 199 1 were $6.89 million, $208.25 million, and $85.13 million, respectively. Altogether, other foreign investment is about 7 percent (300.27/4,366.34) as large as FDI. The biggest subcategory of the three, compensation trade, in which foreign firms provide machines or product designs to Chinese firms and obtain part of the output as payment, is no longer as popular as it was at the beginning of the open door policy reform.’
1. See Kueh (1992) for an analysis of the evolution of FDI in China up to 1990, and particularly for his summary of the role of foreign investment in the development of Chinese coastal areas.
80 Shang-Jin Wei
Table 3.2 Realized Foreign Capital Going into China, 1990-91 (million U.S. dollars)
1990 1991
Change over Change over Capital Amount 1989 (7’0) Amount 1990 (96)
Total
External louns Loans from foreign governments Loans from international
financial institutions Export credit Commercial bank loans Bonds and equity shares issued
abroad
Direct foreign investment Joint ventures Contractual joint ventnres Wholly owned foreign firms Joint exploration
Other foreign investment International leasing Compensation trade Export processinghssembly
10,289.39
6,534.52 2,523.57
1,065.59 898.43
2,043.96
2.97
3,487.11 1,886.07
673.56 683.17 244.31
267.76 30.45
158.74 78.57
2.29
3.96 17.43
-1.73 39.99
-9.94
-97.89
2.79 -7.42 - 10.41
83.93 5.22
-29.70 -52.31 -39.25
40.96
11,554.17
6,887.56 1.809.85
1,364.77 1,161.97 2,442.52
108.45
4,366.34 2,298.96
763.60 1,134.74
169.04
300.27 6.89
208.25 85.13
12.29
5.40 -28.28
28.08 29.33 19.50
3.55 1 .5“
25.21 21.88 13.37 66.10
-30.81
12.14 -77.37
31.19 8.35
Source: China Ministry of Foreign Economic Relations and Trade (1992, 1993). ”The percentage change reported in the original source (551.52 percent) appears to he an error.
3.3 Sources of Foreign Investment from an International Perspective
This section discusses FDI in China from an international perspective. To accomplish this, I will first estimate a gravity-type model to establish a “norm” for inward investment from major source countries and then determine whether China is an underachiever or overachiever as a host to FDI from these coun- tries.
Worldwide FDI more than doubled in nominal terms between 1975 and 1985, and quadrupled between 1980 and 1990 to reach a record high of $200 billion in 1989 and $234 billion in 1990 (United Nations 1992, 1993). To keep our discussion about FDI in China in perspective, we note that FDI is largely a “north-north” phenomenon. The developed countries accounted for 97 per- cent of all FDI outflows in the 1980s, reaching $226 billion in 1990. An over- whelming proportion of FDI also goes into developed countries. In terms of FDI inflows, the developed countries accounted for 83 percent in the 1985-90 period (United Nations 1993).
Of the FDI that does go into developing countries, the Asia-Pacific share has been increasing over time, from about 30 percent in 1980 to over 50 percent by 1989. In 1989, for example, of the $30 billion or so of FDI that went into the

81 Foreign Direct Investment in China: Sources and Consequences
developing world, about $17 billion went into the Asia-Pacific region. Between 1980-82 and 1986-88, FDI had increased by a factor of three in the newly industrializing economies in the region and the ASEAN nations, and by a fac- tor of 13 in China (United Nations 1992). The rapid increase in the case of China certainly reflects its originally low base.
The distribution of FDI in China in terms of major source countries for 1990-91 is summarized in table 3.3. In 1991, Hong Kong was the dominant supplier. Of the total FDI of $4.4 billion, Hong Kong contributed $2.4 billion, or about 55 percent. This is a typical pattern. Hong Kong’s share in total FDI in China has been above 50 percent for all but one year since the beginning of the open door policy in 1979. One should note, however, that part of the re- ported Hong Kong investment is actually Taiwanese investment in disguise (to avoid political inconvenience with the Taiwanese government). Another (small) part of the reported Hong Kong investment is really mainland Chinese capital in disguise (to take advantage of the preferential treatment accorded to foreign capital by the mainland).
Japan is the second largest source country. With an investment of $532.50 million in 1991, it accounted for 12.2 percent of the total. The next two major
Table 3.3 Source Country Distribution of FDI in China: Flow Data (million U.S. dollars)
Country 1991 1990
Total
Hong Kong Japan United States Germany Macao Singapore Britain Italy Thailand Australia Switzerland Canada France Bermuda Netherlands Norway Philippines Panama Ireland Indonesia Malaysia
4,366.34
2,405.25 532.50 323.20 161.12 81.62 58.21 35.39 28.21 19.62 14.91 12.31 10.76 9.88 8.00 6.67 6.05 5.85 3.56 2.50 2.18 1.96
3,487.11
1,880.00 503.38 455.99
64.25 33.42 50.43 13.33 4.10 6.72
24.87 1.48 8.04
2 1.06
15.98 2.23 1.67 6.76
1 .oo 0.64
-
Source: China Ministry of Foreign Economic Relations and Trade (1993).

82 Shang-Jin Wei
suppliers are the United States and Germany, accounting for 7.4 and 3.7 per- cent, respectively. It is worth noting that other East Asian economies, particu- larly those with a large Chinese diaspora, such as Macao, Singapore, Thailand, and Indonesia, have also supplied a significant amount of direct investment to China.
The primitive and imperfect legal regime in China is one important reason for the lopsided distribution of the supply of FDI. On the one hand, investors from the United States and other large home countries of multinational corpo- rations are wary about the security and stability of their investment in China. On the other hand, the overseas Chinese (particularly those residing in Hong Kong) can use their cultural and linguistic links to help reduce information and contractual costs. To contribute to the skewed source country distribution, some regions in China offer explicit or implicit preferential policies to overseas Chinese who trace their ancestry to those regions.
There is another distinct characteristic of investment from overseas Chinese that may be worth noting. The average size of investment from an overseas Chinese investor is much smaller than that from non-ethnic Chinese. One ex- planation is simply that overseas Chinese tend to have small or medium-sized firms (either for cultural reasons or because the industries they typically oper- ate in have small optimal scales). The other explanation, which I find at least as plausible as the first, is a transaction cost story associated with China’s prim- itive legal system. Other things equal, imperfect legal protection implies a high transaction cost for firms in China because learning ill-defined customs and vague operating rules is costly. Overseas Chinese can largely circumvent this problem by using their linguistic and cultural advantage or personal connec- tions. Hence, non-ethnic Chinese investors may perceive a higher transaction cost than overseas Chinese. Suppose this transaction cost is basically fixed (i.e., does not depend on the size of investment), then small projects may not be worth enough to overcome this cost and are never implemented. The minimum amount of investment for non-ethnic Chinese is thus larger than for overseas Chinese.2
3.3.1 Toward an Empirical Model of FDI Distribution
A norm for bilateral investment is notoriously difficult to establish because FDI is likely to be influenced by a long list of factors, many of which are difficult to measure or observe. I consider a reduced-form specification for bilateral investment (flow or stock). Let I , be direct investment from country i to country j . We have
I will explain the three categories of determinants in turn. We take X, to be a vector of variables that influence the measured size of the overall magnitude
2. 1 thank Chongen Bai for suggesting this interpretation.

83 Foreign Direct Investment in China: Sources and Consequences
of outward investment from country i ; it includes legal restrictions on or incen- tives for capital outflow, including country i’s corporate tax schedule and the treatment of foreign affiliate tax payment to host country governments. The key feature of variables in this vector is that they are common to all outward investments of country i, irrespective of destination. (In our sample, most countries’ outward direct investment is realized investment, but some countries such as Japan report only government approval data. Our X vector should in- clude an indicator for the deviation of country i’s measurement method from the “normal” definition of FDI in the sample.) Our statistical specification in the later part of the paper allows us to be less specific about this vector.
is a vector of variables related to the overall attractiveness of countryj to FDI. I will divide the factors into two subcategories. The first group includes macroeconomic characteristics of the host country, such as size (measured by GNP), level of development, and level of human capital.3 The second subcategory includes all restrictions on and incentives for inward for- eign investment. Many countries grant tax holidays or reduced taxes on foreign companies’ profits. This provides incentives for certain source countries to di- rect their outward-going capital to such host countries.
Finally, Z,, is a vector of variables that are specific to the i j pair and that influence the incentives or disincentives for investment going from country i to country j. One principal variable in this vector is a bilateral treaty between countries i and j that includes offering country i’s investors a more favorable tax treatment in country j relative to investors from other c o ~ n t r i e s . ~ The other important variable in this vector is ethnic, linguistic, or historical ties that serve to reduce information costs for business transactions taking place between na- tionals of countries i and j. This variable is not easy to measure. As a proxy, geographic distance is used. In particular, this paper computes the “great circle distance” between major cities (usually the capitals) of a given pair of coun- tries.
To implement the FDI function, I assume a linear specification of the follow- ing form:
The quantity
GNP log FDIv = ct8 + p, log GNP, + p, log
POP,
+ p, log Distancev + p, Literacy, + p,.
3.3.2 Data
The basic data set for this part of the paper is outward FDI from the five largest source countries in the 1987-90 period. The source is United Nations
3. Recent work on “new” growth theory implies that human capital in the host country plays an
4. See Hines and Wilard (1992) for an interesting analysis of the determinants in reaching bilat- important role in FDI decisions (see Lucas 1990).
eral tax treaties.

84 Shang-Jin Wei
(1992). I will also make use of GNP, per capita GNP, and literacy data from World Bank (1992).
The five largest source countries for direct investment over the period 1987-90 were Japan, the United Kingdom, the United States, France, and Ger- many (United Nations 1992). Their annual average outflows of investment dur- ing the period were $36.5, $30.5, $23.9, $19.5, and $17.1 billion, respectively. The total investment outflow from the five accounted for about 70.5 percent of all outward investment from the developed countries.
3.3.3 Basic Results
Table 3.4 reports the basic regression results for the flow of FDI. Column (1) reports the result of a fixed-effects regression assuming source- country-specific intercepts. The coefficient for the GNP variable is positive and significant as expected. A 1 percent increase in the size of a host country is associated with a 0.53 percentage point increase in FDI. A 1 percent increase in per capita GNP is associated with a 0.42 percentage point increase in FDI flow. Furthermore, geography matters: a 1 percent increase in distance is asso- ciated with a 0.39 percentage point reduction in FDI. This confirms our casual impression that outward foreign investment is highly regionali~ed.~ Investment is, to some extent, a neighborhood event. It is worth pointing out that, in spite of a less rigorous microfoundation for the specification, the adjusted R2 of over 0.50 is reasonably large for a cross-country regression.
A competing specification for the panel data set is what is called the random-effects model. In such a model, the source-country-specific intercept is assumed to be a random draw from a common distribution that is uncorre- lated with the error term of the regression (Hsiao 1986). Strictly speaking, since the five source countries are not randomly drawn from the pool of all source countries, but rather are chosen deliberately because they are the largest source countries, the fixed-effects model is the appropriate model to use. On the other hand, because a random-effects model can often result in drastically different coefficient estimates (Hsiao 1986,41-42), it is performed here purely as a robustness check of our fixed-effects model. The result is reported in col- umn (2). Luckily, for our data set, the random-effects specification produces essentially the same estimates as the fixed-effects model.
It may be useful to comment a bit more on the positive sign of the coefficient of the per capita GNP term. One often hears the hypothesis that direct invest- ment seeks countries with low labor costs. Since wage level should be highly correlated with per capita GNP, one would expect a negative sign for the per capita GNP term. Why do we obtain a statistically significant positive sign? One explanation is that per capita GNP is positively correlated with a country’s
5 . Hufbauer, Lakdawalla, and Malani (1994) have estimated a gravity-type model for outward investment from the United States, Japan, and Germany and reported, among other things, a geo- graphic bias in FDI.

85 Foreign Direct Investment in China: Sources and Consequences
Table 3.4 Norm of Inward FDI: Flow
Variable
Random Fixed Effect Random Effect" Fixed Effect Effectb
(1 ) (2) (3) (4)
Constant
log GNP,
log PCGNP,
log Distance,,
Literacy,
N Standard error of regression R2
Adjusted R2
0.53** (0.06) 0.42**
(0.09) -0.38** (0.11)
237 1.59 0.50 0.49
- 1.61 (1.41) 0.53**
(0.06) 0.43**
(0.09) -0.37** (0.11)
237 1.61 0.52 0.5 1
0.49** (0.07) 0.31*
(0.12) -0.40** (0.11) 1.57#
(0.86)
204 1.51 0.53 0.51
- I .40 ( I .45) 0.49**
(0.07) 0.33**
(0.12) -0.39** (0.11) 1.54x
(0.87)
204 1.53 0.54 0.53
Equarion: log FDI-flow,, = (Y, + p, log GNP, + p, log PCGNP, + p, log Distancee + f3, Litera-
Note: Numbers in parentheses are standard errors. aVariance of I*.,, = 2.5574, variance of 01 = 0.30320, implied differencing factor = 0.1 1808. Variance of p,, = 2.3180, variance of (Y = 0.34868, implied differencing factor = 0.10962. "Significant at the 10 percent level. *Significant at the 5 percent level. **Significant at the 1 percent level.
cy, + l%,.
level of human capital. Recent theories of economic growth that emphasize the importance of human capital accumulation (e.g., Lucas 1990) predict that inward foreign investment is positively correlated with the stock of human cap- ital in the host country. Hence, per capita GNP can be positively correlated with inward investment.
To investigate this possibility, I adopt the adult literacy ratio as a crude mea- sure of average human capitaL6 (In the sample, the simple correlation between per capita GNP and adult literacy is 0.56.) Columns ( 3 ) and (4) of table 3.4 report the results with the literacy variable as an additional regressor. The point estimate for the variable is positive and statistically significant at the 10 percent level. According to the estimate in the fixed-effects regression, a 1 percent increase in the literacy ratio is associated with a 1.57 percentage point higher inward FDI. The qualitative features of the estimates for the other variables do
6. The data are converted from adult illiteracy ratios from World Bank (1992, table I). No data are reported for high-income economies. But they are noted in the table as having less than 5 percent illiteracy according to Unesco. Hence, a value of 2.5 percent illiteracy is assigned for all high-income economies.

86 Shang-Jin Wei
not change (the point estimates for the GNP and per capita GNP terms become somewhat smaller).
The flow data on FDI may reflect the peculiarity of year-to-year fluctuation in the spatial distribution of foreign investment. For example, during 1989-90, FDI going into China was greatly reduced as a result of the international reac- tion to the Tiananmen Square Incident. In addition, the stock of FDI is more important than the flow variable for many calculations, including the contribu- tion of foreign investment to host country production capacity. For these rea- sons, I also look at the spatial distribution of the stock of FDI.
Table 3.5 reports the basic regression results for the FDI stock data. The crucial result is the estimates of the fixed-effects model. The coefficient on the GNP variable is 0.74 (somewhat larger than the flow regression) and signifi- cant at the 1 percent level. It suggests that larger economies tend to host more foreign investment, although the increment in foreign investment is less than proportional to the increase in the size of the host country. The coefficient on per capita GNP is 0.29 and significant. Again, the stock of foreign investment tends to be distributed among rich countries. As with the flow data, part of the reason for this may be that the average level of human capital is an important
Table 3.5 Norm of Inward FDI: Stock
Variable Fixed Effect Random Effectd Fixed Effect Random Effect’
(1) (2) ( 3 ) (4)
Constant
log GNP,
log PCGNP,
log Distance,>
Literacy,
N Standard error of regression R? Adjusted R
0.74** (0.06) 0.29**
(0.08) -0.38** (0.12)
323 1.77 0.5 1 0.50
- 1.40 ( 1.40) 0.74**
(0.06) 0.29**
(0.08) -0.36** (0.12)
323 1.78 0.52 0.5 1
0.72** (0.06) 0.18’
(0.10) - 0.43* * (0.10) 1.57*
(0.67)
272 1.48 0.60 0.59
-0.93 ( I .29) 0.72**
(0.06) 0.18
(0.10)# -0.42** (0.10) 1.56*
(0.68)
272 1.49 0.61 0.60
Equarion: log FDI-stock,, = a, + p, log GNP, + p L log PCGNP, + p, log Distance,, + p, Litera-
Noret Numbers in parentheses are standard errors. ‘Variance of I”,, = 3.1747, variance of CY = 0.24515, implied differencing factor = 0.13496. ’Variance of p,, = 2.2200, variance of a = 0.35987, implied differencing factor = 0.8439OE-01. #Significant at the 10 percent level. *Significant at the 5 percent level. **Significant at the 1 percent level.
cy, + I”,.

87 Foreign Direct Investment in China: Sources and Consequences
determinant of the marginal value of physical capital and the former is corre- lated with per capita GNP.
In columns (3) and (4), the adult literacy variable is again added to the re- gressions as a measure of average human capital. The coefficient for the new variable is positive and significant at the 1 percent level. A 1 percent rise in the adult literacy level is associated with a 1.57 percentage point increase in the stock of foreign investment. As expected, the point estimate on the per capita GNP variable is reduced (to 0.18), although it remains positive and significant.
3.3.4 Comparing China and Asia to the “Norm”
The statistical model in the last section has effectively established a “norm” for inward foreign investment (from the five largest source countries) as a func- tion of a host country’s size, level of development, level of human capital, and geographic location. Against this empirical norm, we can then investigate whether China, or any other country, has attracted “enough” foreign capital.
I will examine the difference between actual foreign investment and the model predictions for China, India, and the four Asian newly industrialized economies (NIEs). The basic economic characteristics of the six economies are summarized in table 3.6. The computed differences of inward investment relative to the norm are reported in table 3.7. Column (1) refers to FDI flow, and column (2) to FDI stock.
Despite the fact that China was one of the largest developing host countries for FDI by the end of the 1980s, it may still not be hosting enough FDI after one adjusts its FDI volume by its size and other characteristics. This appears to be the case. In terms of flow of FDI in 1989-90, China does not seem to have attracted enough investment from four of the major source countries (the United States, Germany, France, and the United Kingdom).’ For example, it received 88 percent less investment from Germany than it should have based on its economic characteristics (exp(-2.145) - 1). The FDI that China hosts from Japan is an exception to this pattern. The actual Japanese investment go- ing into China in 1990 was actually 25 percent more than the model prediction (exp(0.229) - 1). The Japanese investment in China will probably stay high. As was revealed in two surveys of Japanese firms conducted by Japan’s Export- Import Bank in 1992 and 1993, China was believed to be the most promising destination for Japanese FDI in the medium-term (i.e., three years following the survey years; Kinoshita 1994).
Chinese underachievement in attracting FDI in 1990 could partly be due to source country reaction to the Tiananmen Square Incident. But the stock of FDI should be less affected by this. The discrepancy between actual and pre- dicted values of the FDI stock is given in column (2). As expected, the extent of underachievement is less than for the flow data in all cases. Nevertheless, China has attracted less than normal investment from four of the five major
7. A blank entry in table 3.7 means that the recorded actual investment is zero.

88 Shang-Jin Wei
Table 3.6 Country Indicators, 1990
GNP per Capita GNP Country ($1 (million $) Literacy Rate
China 370 419,469 0.73 Hong Kong 1 1,490 66,642 0.77 India 350 297,325 0.48 Korea 5,400 231,120 0.975 Singapore 11,160 33,480 0.88 Taiwan 7,284 147,384 0.932
Source: World Bank (1992).
source countries even according to the stock data. For example, the U.S. invest- ment that China hosts falls short of its potential by almost 89 percent (exp(-2.20) - 1).
Part of the reason for China’s underachievement is its late entry into the game. The open door policy was only a decade old in 1990. The more im- portant reason for the underachievement is the imperfect legal protection that China still offers to foreign investors. Luckily, overseas Chinese appear less concerned about the legal environment and have made stakes in the country in large numbers. The investment from overseas Chinese perhaps makes up for much of the shares lost from the major source countries in the world.
We should note that the GNP and per capita GNP variables may have sub- stantially underestimated China’s true size and level of development. After ad- justing for purchasing power, the World Bank and International Monetary Fund found that China’s per capita GNP was likely to be on the order of $2,000 rather than $370 as reported in table 3.6. A more conservative measure by Lardy (1994) put the estimate at $1,000. This would still increase the magni- tude of China’s GNP and per capita GNP by a factor of 1.7 relative to the exchange-rate-based measure. If PPP-adjusted values were used in estimating the FDI model, one would expect even greater underachievement by China in attracting FDI from the major source countries.
(On the other hand, the reported literacy rate may overestimate the average level of human capital. If secondary school enrollment or other variables were used as a measure of human capital, the magnitude of Chinese underachieve- ment would become somewhat smaller.)
India has many similarities with China, in terms of size, level of develop- ment, as well as history of policy toward FDI. In terms of stock of FDI, India has hosted too little FDI from all major source countries except Britain. (Being a former British colony helps in this case.) But in terms of recent flow of FDI, India is catching up fast, particularly with FDI from the United States.*
The four Asian NIEs are all well known to be very open in terms of their
8. See Reddy (1994) for a more detailed discussion

89 Foreign Direct Investment in China: Sources and Consequences
Table 3.7 Actual - Predicted FDI
Flow Stock Host Country and Source Country (1) (11)
China France Germany Japan United States
Hong Kong France Germany United Kingdom Japan United States
India Germany United Kingdom Japan United States
Korea Germany United Kingdom Japan United States
Singapore France Germany United Kingdom Japan United States
Taiwan Germany United Kingdom Japan United States
-
-2.14538 0.229325
-
-0.919753075 -
-
1,749702215 1.09845972 1
- 1.32010806 0.303903848
0.56333 1068 - 1.23 166192
-0.123430409 - 1.47 1476436 - 1.155 126452
0.0 16230347
-0.07105872 1.35087 1801 2.427260 I6 1.418084502 2.023788452
-0.685266376 -0.4546798 17 -0.266864061 -0.2650433 18
-0.027536154 - 1.339597464
0.483750194 -2.200443029
0.407244235 1.134640694 2.188 19952 2.524893761 1,643532038
-0.04662088 0.158203423
- I .OX397329 -0.69884843
-0.937957704 -2.741689682
0.2 1098 I429 -0.660793841
0.916713536 1.719693422 2.614859104 2.717613697 1 S59094071
- 1.07056284 -
0.354950696 -0.181 538507
Spe-czjicution of models I, log FDI-flowr = a, + p, log GNP, + p, log PCGNP, + p, log Dis- tance,, + p, Literacy, + p,,, 11, log FDI-stock,, = a, + p, log GNP, + p2 log PCGNP, + p, log Distance, + p, Literacy, + p,,
trade policies. However, their policies toward FDI differ markedly. On one extreme, Singapore and Hong Kong are very open to foreign investment. Both have hosted a substantially greater stock of FDI than an average economy in the world with similar economic and geographic characteristics. On the other extreme, Taiwan and Korea are much more cautious toward foreign-invested firms on their territories. Both host less than average direct investment from the four major source countries (the United States, Germany, France, and the United Kingdom).

90 Shang-Jin Wei
To summarize, in contrast to its reception of vast investment from overseas Chinese, China so far has not attracted enough direct investment from the United States and European source countries. However, this is not drastically different from the situations in Taiwan and Korea.
3.4 Economic Consequences of Foreign Capital in China
In the second half of the paper, I will discuss several consequences of for- eign investment in China. Specifically, I will concentrate on three aspects of foreign investment: (1) its contribution to overall rapid growth, ( 2 ) its contribu- tion to the rapid growth of China's exports, and (3) its contribution to the expansion of the nonstate sector in China. Much of my evidence is derived from a statistical analysis of a city-level data set covering the period 1988-90.'
In an earlier paper (Wei 1995), I reviewed the evolution of China's open door policy and discussed the contribution of export activity and foreign in- vestment to China's rapid growth. The following discussion differs from the earlier paper in several important aspects. First, new questions are asked, par- ticularly in terms of the connection between foreign investment and the expan- sion of the nonstate sector. Second, the treatment of foreign investment is more refined. In the previous paper, only the flow of FDI was used in the statistical analysis, whereas here the stock of foreign capital is computed and analyzed. Furthermore, a measure of the stock of aggregate city-level physical capital is added so that the statistical specification corresponds better with the eco- nomic theory.
I will first sketch a theoretical model that will be the basis of my statistical investigation. After an explanation of the data set, I will present the main statis- tical results and draw economic inferences.
3.4.1 A Minimalist Model
To guide later statistical analyses, a parsimonious specification will be suf- ficient. Let city j operate with the following production function:
= AJLpKPH;
where L, K, and Hare the city's labor force, stock of physical capital, and stock of human capital, respectively, and A is a productivity shift parameter.
The productivity shift parameter can be conceptually decomposed into na- tional and city-specific components. For simplicity, assume that
9. For recent analyses of the relationship between FDI and home economies and of other issues, see Feldstein (1995), Lipsey (1995). and Froot (1993).

91 Foreign Direct Investment in China: Sources and Consequences
where S, and S, are the national and city-specific components of the productiv- ity shift parameter.
Use g to denote any growth rate. The above specification can be translated into growth terms.
g, = gs” + g,, + “&, + Ps, + YgH;
The central focus for the second half of the paper is on the impact of foreign investment. Foreign investment in city j could affect the city’s output in three ways. First, it may raise growth of the city’s overall capital stock, g Second, it may increase city j’s overall productivity growth, g, . Third, if beneficial ef- fects spill over to other cities in the country, it may raise the growth of the national productivity level, gsn.
Foreign investment can raise productivity through a number of channels. First, many foreign firms bring new technology (“software,” such as product design, as well as “hardware,” such as machinery) to the host country. Second, and perhaps more important in the Chinese context, foreign firms bring mod- em management concepts, marketing techniques, and work discipline. Third, even domestic firms that do not directly receive foreign investment may benefit from it by learning and mimicking the management, marketing, or production techniques of foreign-owned firms. This spillover effect from foreign-owned to domestic firms stems from the fact that learning is greatly helped by physical proximity and human interactions.
If foreign investment in city j raises the growth of national productivity, gSn, through cross-city spillover, it will merely enlarge the intercept term in a
cross-city regression. Hence, our identification of the contribution of the for- eign investment falls on g, . In actual implementation, I will assume that g is a linear function of the stock of FDI in city j and that the functional form is the same for all cities.
3.4.2 Data
The data set employed here covers 434 cities over the period 1988-90 (China State Statistics Bureau 1989, 1991). The 434 cities constituted the en- tire universe of cities in China in 1988. Moreover, the data cover areas sur- rounding each city (greater city area) rather than just the metropolitan area. This helps to avoid certain sample selection biases, such as uncovering a rela- tionship that is peculiar to the coastal areas or the special economic zones.
A few general features of the data set should be noted to put the subsequent regression results in perspective. During 1988-90, the average growth rate of gross industrial output across the cities was 39.8 percent (and the output- weighted average was close to this as well). Note also that these two years were a relatively slow growing period in a fast-growing decade.
It may be interesting to note the growth rate of foreign-invested firms rela-
5’ J
I SJ

92 Shang-Jin Wei
tive to other types of firms. Table 3.8 reports the (nominal) growth rates by ownership type. lo The first three types, individual-owned firms (INDs), town- ship and village enterprises (TVEs), and foreign-invested firms (FORs) consti- tute over half of the nonstate sector in China.” All three categories grew faster than the average growth rate of total output. But the foreign-invested firms grew the fastest. The two-year growth rate was, an astonishing 119.4 percent. (The combined two-year inflation rate during the period was about 18 percent. So the real two-year growth rate for the foreign-invested firms was about 100 percent.)
Although foreign-invested firms were growing quickly, they were tiny in terms of their share in total industrial output (table 3.9). In 1988, foreign- invested firms accounted for less than 1 percent of total output. The share al- most doubled to l .7 l percent by the end of 1990. In contrast, the state sector shrank rapidly in relative terms. The state sector lost almost 5 percentage points in share of total output over a two-year period. Most of this lost ground was gained by the TVEs.
What makes the subsequent regression analysis interesting is the tremen- dous variation across the cities. For example, the share of foreign-invested firms in total output ranges from 0 to 62.1 percent in 1988. (About 115 cities in 1988 had a positive stock of foreign investment.) The growth rates of foreign- invested firms also vary tremendously, from -92 percent (exp(-2.821) - 1) to 11,050 percent (exp(4.714) - I)!
3.4.3 Foreign Investment and Total Output Growth
We start our analysis with the contribution of foreign investment to China’s overall industrial growth. The benchmark results are reported in table 3.10. The dependent variable in all four regressions is the city’s growth rate in gross industrial output.
In the first regression, the growth rates of capital stock and labor force are the only two regressors other than the intercept. Both variables are statistically significant at the 10 percent level. The point estimates for capital growth and labor growth are 0.17 and 0.25, respectively. The apparent decreasing returns to scale could reflect the technical inefficiency of many Chinese firms, espe- cially the state-owned firms.
I introduce foreign investment into the regression in two ways. First, I use the beginning-of-sample (i.e., 1988) share of the stock of foreign capital in the city’s total capital. Second, I use the beginning-of-sample share of foreign- invested firm output in the city’s total output.
There are two variations in the first approach depending on the assumption
10. For simplicity. I will refer to wholly foreign-owned, equity or contractual joint ventures, and joint explorations as “foreign-invested firms.”
I I . The other category within the nonstate sector is “urban collectives,’’ which I do not have data on. For a detailed discussion of the four categories of the nonstate sector, see Wei and Lian (1993).

Table 3.8 Two-Year Growth Rates of Gross Industrial Output, 1988-90 (434 Chinese cities)
IND TVE FOR “State” Total
Simple average 1.137 0.492 1.194 0.305 0.398 Minimum -0.993 -0.730 -2.821 -2.505 -0.304 Maximum 38.366 12.383 4.714 3.442 7.739 N 343 348 115 334 363
Table 3.9 Share in Industrial Output by Type of Firms, 1988-90 (434 Chinese cities)
IND TVE FOR “State”
1988 Simple average Minimum Maximum N
1990 Simple average Minimum Maximum N
1.10 0.01
29.70 35 1
1.18 0.01
22.30 408
20.20 0.45
66.40 348
25.20 0.11
85.23 422
0.99 0.00
62.10 34 1
1.71 0.00
65.90 398
78.1 26.4 99.3
340
73.30 8.98
99.80 398
Table 3.10 Foreign Investment and City’s Total Output Growth, 1988-90 (434 Chinese cities)
GPop
GCap
FDI88dCap88
FDI88ndCap88
YFor88N88
N SEE Adjusted R2
.168# .168# (.098) (.098) .25 1 * .248*
(.041) (.043) ,072
(.062)
355 347 ,132 ,128 ,197 .217
,167‘ (.098) .247*
.06Y (.043)
347 ,128 ,219
,114 (.118) .249*
(.043)
.317* (.122)
337 ,125 ,225
Notes: Dependent variable is growth rate of gross industrial output during 1988-90. See the ap- pendix for definitions of independent variables. Numbers in parentheses are heteroskedasticity- consistent standard errors. All regressions have an intercept which is not reported. “Significant at the 15 percent level. #Significant at the 10 percent level. *Significant at the 5 percent level.

94 Shang-Jin Wei
of the depreciation of foreign capital. In the first variation, a 10 percent depre- ciation rate is assumed when accumulating the annual flow of FDI into a stock measure. (The official exchange rate in 1988 of 3.72 yuaddollar is used to convert the dollar value of FDI stock into Chinese yuan.) The result is reported in column (2). We observe that the foreign capital share variable has a positive coefficient (0.072), which would be consistent with the hypothesis that foreign investment raises city-specific productivity. Unfortunately, it is not statistically significant at the 10 percent level.
Because the annual flows of FDI are in nominal U.S. dollar terms, a 10 percent nominal depreciation rate implies a greater real depreciation rate (10 percent plus the annual inflation rate). Furthermore, the reported city capital stock is likely to assign an insufficient depreciation rate to capital stock in Chinese firms. This could further underestimate the true ratio of foreign capital to the city’s total capital stock. Partly as a correction to this problem, I also use the second variation, in which a zero nominal rate of depreciation is assumed for FDI (i.e., the real rate of depreciation is approximately equal to the U.S. inflation rate). This assumption gives the regression result in column (3). This time, the estimate is statistically significant at the 15 percent level. A 1 percent increase in the share of foreign capital in the city’s capital stock in 1988 is associated with a 0.065 higher growth rate of industrial output in the subse- quent two-year period. Although the positive sign is consistent with a produc- tivity-lifting role for FDI, the point estimate is not terribly big.
The uncertainty about the depreciation rate (and, to a lesser extent, the ex- change rate used to convert FDI from dollar values into yuan values) means that the foreign capital share variable probably has serious measurement prob- lems. The measurement error could introduce a downward bias into the mea- sured estimate of the contribution of FDI stock to overall growth.
An alternative measure of the significance of foreign capital is the share of foreign-invested firm output in a city’s total output. This variable is much easier to measure and should circumvent the difficulties in properly measuring the stock of FDI. The regression result with this variable is in column (4) of table 3.10. This share variable is positive and statistically significant at the 5 percent level. Holding the growth of inputs constant, a I percent increase in the share of foreign-invested firms in output in 1988 is associated with a 0.32 percent higher growth rate in output during 1988-90. This is a more significant num- ber. In table 3.9, we found that the difference between the cities with the high- est and those with an average share of foreign firms in output was 61 percent. This could produce an almost 20 (61*0.32) percentage point difference in the growth rate of output.
3.4.4 Introducing Human Capital and Coastal Areas
One omission from the regressions in section 3.4.3 is a measure of the stock of human capital. Human capital plays a central role in (one branch of) the new growth theory. I will add to the basic regression the share of skilled labor

95 Foreign Direct Investment in China: Sources and Consequences
in a city’s labor force as a measure of the average level of a city’s human capital. Table 3.11 replicates the key regressions in table 3.10 with the additional
variable, GHumCap, the growth of the average human capital level. The added variable is not significant for the first two regressions but is significant (at the 10 percent level) for the regression that includes the share of foreign firm out- put in total output. The feature to notice, however, is that the qualitative charac- teristics of FDI remain the same as before. In particular, in columns (2) and ( 3 ) , FDI exhibits a positive and statistically significant association with growth in total output.
One may think that one important impetus for rapid growth in certain parts of China is a favorable policy environment. A priori, a combination of the following three things could together explain the observed pattern: (1) Local- ized reform experiments promote growth. (2) Foreign investment does not con- tribute to growth beyond contribution to the capital stock. (3) Foreign invest- ment happens to be concentrated in cities with many localized reform experiments. In other words, the apparent positive association between foreign investment and high growth could be a spurious result of not having a measure of localized reform experiments in the regression.
To investigate this possibility, I will identify subsets of cities that may have had intensive reform experiments. The “special economic zones” (SEZs) are
Table 3.11 Foreign Investment, Human Capital, and City’s Total Output Growth, 198190 (434 Chinese cities)
GPop
GCap
FDI88dCap88
FDI88ndCap88
YFor88N88
GHumCap
N SEE Adjusted R’
.171* (.099) .242*
(.042) ,076
(.059)
,026 (.021)
,128 .220
346
,170’ (.099) .241*
(.042)
,026 (.021)
.128 ,221
346
,110 (.117) .243*
(.042)
.310* (.128) .034#
(.020)
,125 .23 1
336
Notes: Dependent variable is growth rate of gross industrial output during 1988-90. See the ap- pendix for definitions of independent variables. Numbers in parentheses are heteroskedasticity- consistent standard errors. All regressions have an intercept which is not reported. ?3ignificant at the 15 percent level. “Significant at the 10 percent level. *Significant at the 5 percent level.
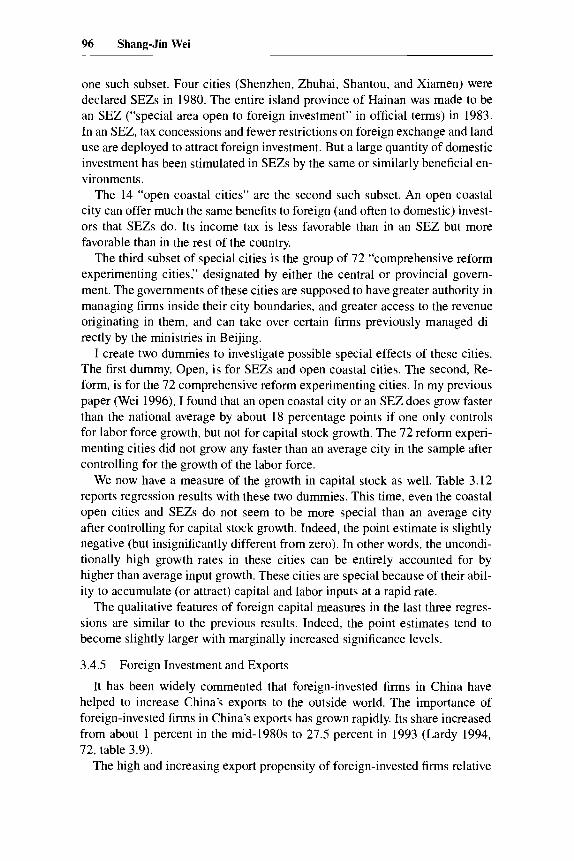
96 Shang-Jin Wei
one such subset. Four cities (Shenzhen, Zhuhai, Shantou, and Xiamen) were declared SEZs in 1980. The entire island province of Hainan was made to be an SEZ (“special area open to foreign investment” in official terms) in 1983. In an SEZ, tax concessions and fewer restrictions on foreign exchange and land use are deployed to attract foreign investment. But a large quantity of domestic investment has been stimulated in SEZs by the same or similarly beneficial en- vironments.
The 14 “open coastal cities” are the second such subset. An open coastal city can offer much the same benefits to foreign (and often to domestic) invest- ors that SEZs do. Its income tax is less favorable than in an SEZ but more favorable than in the rest of the country.
The third subset of special cities is the group of 72 “comprehensive reform experimenting cities,.’ designated by either the central or provincial govem- ment. The governments of these cities are supposed to have greater authority in managing firms inside their city boundaries, and greater access to the revenue originating in them, and can take over certain firms previously managed di- rectly by the ministries in Beijing.
I create two dummies to investigate possible special effects of these cities. The first dummy, Open, is for SEZs and open coastal cities. The second, Re- form, is for the 72 comprehensive reform experimenting cities. In my previous paper (Wei 1996), I found that an open coastal city or an SEZ does grow faster than the national average by about 18 percentage points if one only controls for labor force growth, but not for capital stock growth. The 72 reform experi- menting cities did not grow any faster than an average city in the sample after controlling for the growth of the labor force.
We now have a measure of the growth in capital stock as well. Table 3.12 reports regression results with these two dummies. This time, even the coastal open cities and SEZs do not seem to be more special than an average city after controlling for capital stock growth. Indeed, the point estimate is slightly negative (but insignificantly different from zero). In other words, the uncondi- tionally high growth rates in these cities can be entirely accounted for by higher than average input growth. These cities are special because of their abil- ity to accumulate (or attract) capital and labor inputs at a rapid rate.
The qualitative features of foreign capital measures in the last three regres- sions are similar to the previous results. Indeed, the point estimates tend to become slightly larger with marginally increased significance levels.
3.4.5 Foreign Investment and Exports
It has been widely commented that foreign-invested firms in China have helped to increase China’s exports to the outside world. The importance of foreign-invested firms in China’s exports has grown rapidly. Its share increased from about 1 percent in the mid-1980s to 27.5 percent in 1993 (Lardy 1994, 72, table 3.9).
The high and increasing export propensity of foreign-invested firms relative

97 Foreign Direct Investment in China: Sources and Consequences
Table 3.12 Foreign Investment, Coastal Cities, and Growth, 1988-90 (434 Chinese cities)
Variable (1) (2) ( 3 ) (4)
GPop
GCap
FD188dKap88
YForWY88
Reform
Open
N SEE Adjusted R'
,162" (.098) .252*
(.041)
-.014 (.015)
-.014 (.038)
355 ,132 ,195
.155# (.loo) .248*
(.043) .107#
(.057)
-.010 (.014) - ,040 (.038)
347 .I28 ,218
,153' (.101) ,248' (.043)
.094* (.039)
-.010 (.014) - ,042 (.039)
347 ,128 ,219
,095 (.122) .253*
(.OM)
.415* (.143)
(.014)
(.039)
- ,007
- ,047
337 ,125 ,226
Nores: Dependent variable is growth rate of gross industrial output during 1988-90. See appendix for definitions of independent variables. Numbers in parentheses are heteroskedasticity-consistent standard errors. All regressions have an intercept which is not reported. "Significant at the 15 percent level. #Significant at the 10 percent level. *Significant at the 5 percent level.
to Chinese firms has much to do with the export performance criteria that the Chinese government imposes on them. But before we conclude that China's overall export level has been raised by the presence of foreign-invested firms, we must entertain some other possibilities.
Foreign-invested firms could displace exports by Chinese firms. This may happen if foreign-invested firms compete head to head with Chinese firms and possibly drive them out of export-related activities. Depending on how much Chinese exports are displaced by foreign-invested firms, overall Chinese ex- ports could be lower than without foreign firms. Alternatively, foreign-invested firms could promote export activities among Chinese firms. This may happen, for example, when the foreign-invested firms pass on, intentionally or not, mar- keting know-how to Chinese firms which otherwise may not be able to sell in the world market. If this happens, overall Chinese exports can be raised by more than the exports of the foreign-invested firms.
The point is that the net effect of foreign investment on China's exports depends on the way the foreign investment and the export activities of Chinese firms interact. With city-level data on exports by state trading corporations (the bulk of non-foreign-firm exports), I can investigate this interaction.
In various regressions, I find that the cross-city differences in export activity
98 Shang-Jin Wei
are not statistically related to either the difference in the growth of FDI or the difference in the initial stock of foreign capital. (The results are not reported to save space.) Thus, I conclude that foreign-invested firm exports do not displace Chinese firm exports. They may help to promote Chinese exports if enough marketing know-how is spilled over to other cities in the country (and thus not related to city-level exports).
3.4.6 Foreign Investment and the Expansion of the TVE Sector
The rapid growth of the Chinese economy and the success of Chinese eco- nomic reform is largely due to the rapid expansion of the nonstate sector, in- cluding foreign-invested firms. Here I would like to examine the interaction between foreign investment and other parts of the nonstate sector, in particular, the TVEs.
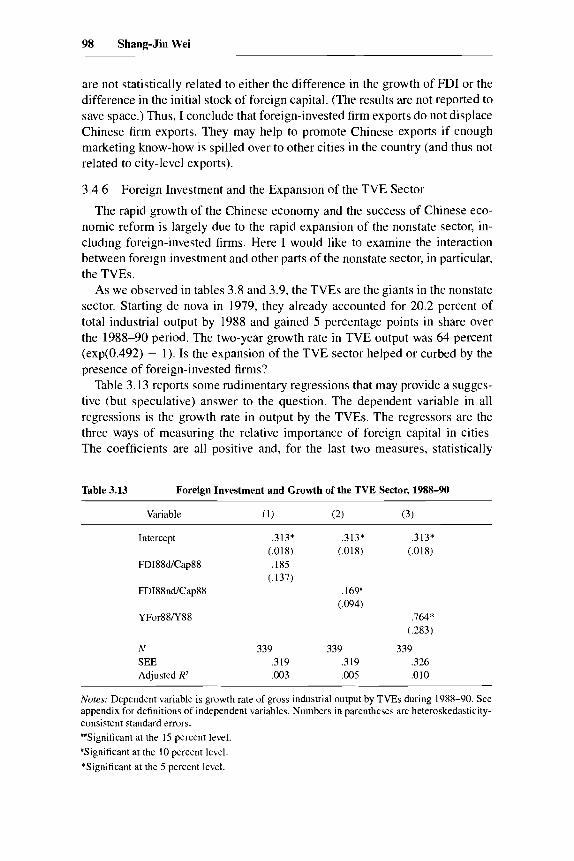
As we observed in tables 3.8 and 3.9, the TVEs are the giants in the nonstate sector. Starting de nova in 1979, they already accounted for 20.2 percent of total industrial output by 1988 and gained 5 percentage points in share over the 1988-90 period. The two-year growth rate in TVE output was 64 percent (exp(0.492) - 1). Is the expansion of the TVE sector helped or curbed by the presence of foreign-invested firms?
Table 3.13 reports some rudimentary regressions that may provide a sugges- tive (but speculative) answer to the question. The dependent variable in all regressions is the growth rate in output by the TVEs. The regressors are the three ways of measuring the relative importance of foreign capital in cities. The coefficients are all positive and, for the last two measures, statistically
Table 3.13 Foreign Investment and Growth of the TVE Sector, 1988-90
Intercept .313* (.018)
FDI88UCap88 . 18.5
FDI88nUCap88 (.137)
N 339 SEE ,319 Adjusted R’ ,003
.313* .313* (.018) (.018)
.169’ i.094)
.764* (.283)
339 339 ,319 .326 .005 ,010
Notes: Dependent variable is growth rate of gross industrial output by TVEs during 1988-90. See appendix for definitions of independent variables. Numbers in parentheses are heteroskedasticity- consistent standard errors. #*Significant at the 1.5 percent level. “Significant at the 10 percent level. *Significant at the 5 percent level.

99 Foreign Direct Investment in China: Sources and Consequences
significant at the 10 percent level. For example, a city with a 1 percent higher share of foreign firm output in total output in 1988 is likely to have a 0.76 percentage point higher growth rate for its TVE sector.
This positive association could come from the additional competition that the presence of foreign-invested firms provides for TVEs. But I think that it more likely results from certain positive externalities from the foreign firms to domestic TVEs. One important externality is technological spillover. The other, possibly more important one, is modern management techniques, mar- keting, and work discipline that foreign-invested firms exhibit to the TVEs. Whatever the channels, the presence of foreign-invested firms appears to be helpful to the further expansion of the nonstate sector.
3.5 Concluding Remarks
Foreign investment in China comes disproportionately from overseas Chi- nese, particularly those residing in Hong Kong. An empirical norm of inward FDI is established as a function of the host country’s size, development level, literacy, and geographic location and source country characteristics based on data about geographic distribution of the outward FDI of the five largest source countries. Relative to an “average” host country, China appears to host too little foreign investment from all the major source countries (the United States, Germany, France, and the United Kingdom) except Japan.
The paper also attempts to assess several economic consequences of FDI in China. Based on city-level data, it finds statistically significant evidence that FDI is positively associated with cross-city differences in growth rates, after taking into account the growth of labor, physical, and human capital. Foreign- invested firms have higher export propensity than average Chinese firms. The paper tests and concludes that foreign-invested firms do not displace exports by Chinese firms. Hence, their contribution to overall Chinese exports is at least the amount of their direct exports. Finally, the paper examines the interac- tion of FDI and the nonstate sector in China. There is some tentative evidence supporting the hypothesis that foreign-invested firms contribute positively to the rapid expansion of the township and village enterprises.
Appendix Variable Acronyms in the Statistical Tables
GPop-growth rate of nonagricultural population. GCap-growth rate of the net value of capital (“fixed asset”). FD188dCap88-ratio of the stock of foreign capital to net value of capital in 1988, where a 10 percent depreciation rate is assumed for foreign capital and

100 Shang-Jin Wei
the official exchange rate in 1990 (3.72 yuaddollar) is used to convert the dollar value of FDI into the renminbi (RMB) value. FD188nd/Cap88--ratio of the stock of foreign capital to net value of capital in 1988, where zero depreciation is assumed for foreign capital and the official exchange rate in 1990 (3.72 Yuaddollar) is used to convert the dollar value of FDI into the RMB value. YFor88/Y88-share of foreign-investedmanaged firms in total city output in 1988. GHumCap-growth rate of the average level of human capital, where average human capital is measured as share of skilled labor in the total nonagricultural labor force. Reform-dummy for the 72 “comprehensive reform experimenting cities.” Open-dummy for either 14 “coastal open cities” or 4 “special economic zones.”
References
Amirahmadi, Hooshang, and Weiping Wu. 1994. Foreign direct investment in devel- oping countries. Journal of Developing Areas 28: 167-90.
China Ministry of Foreign Economic Relations and Trade. 1992, 1993. Almanac of China S foreign economic relations and trade 1992/93. Beijing: China Ministry of Foreign Economic Relations and Trade.
China State Statistics Bureau. 1989, 199 1. Chinese urban statistics yearbook. Beijing: China State Statistics Bureau.
. 1994. Statistical report on national economy and social development in 1993. People’s Daily (overseas edition), March 2 .
Feldstein, Martin. 1995. The effects of outbound foreign direct investment on the do- mestic capital stock. In The effects of taxation on multinational corporations, ed. M. Feldstein, J. Hines, and R. G. Hubbard, 43-63. Chicago: University of Chicago Press.
Froot, Kenneth A. 1993. Foreign direct investment. Chicago: University of Chicago Press.
Hines, James, Jr., and Kristen L. Wilard. 1992. Trick or treaty? Bargains and surprises in international tax agreements. Harvard University and Princeton University.
Hsiao, Cheng. 1986. Analysis of panel data. Econometrics Society Monograph no. 11. Cambridge: Cambridge University Press.
Hufbauer, Gary, Darius Lakdawalla, and Anup Malani. 1994. Determinants of direct foreign investment and its connection to trade. Manuscript.
Kinoshita, Toshihiko. 1994. Japan’s foreign direct investment in East and Southeast Asia: The current situation and the prospect for the future. Report. Tokyo: Research Institute for International Investment and Development, Export-Import Bank of Japan.
Kueh, Y. Y. 1992. Foreign investment and economic change in China. China Quar- terly 13 1:637-90.
Lardy, Nicholas R. 1994. China in the world economy. Washington, D.C.: Institute for International Economics.
Lipsey, Robert E. 1995. Outward direct investment and the U.S. economy. In The effects

101 Foreign Direct Investment in China: Sources and Consequences
of taxation on multinational corporations, ed. M. Feldstein, J. Hines, and R. G. Hub- bard, 7-33. Chicago: University of Chicago Press.
Lucas, Robert. 1990. Why doesn’t capital flow from rich to poor countries? American Economic Review: Papers and Proceedings 80:92-96.
Reddy, J. Mahender. 1994. United States investment in India. Paper presented at sixth biennial conference on U.S .-Asia Economic Relations, sponsored by American Com- mittee on Asian Economic Studies and Asia Pacific Center of Brandeis University, Brandeis University, June 16-18.
United Nations. 1992. World investment directoiy 1992. Vol. 1, Asia and the Pacijc. New York: United Nations.
. 1993. World investment directoiy 1992. Vol. 3, Developed countries. New York: United Nations.
Wei, Shang-Jin. 1995. The open-door policy and China’s rapid growth: Evidence from city-level data. In Growth theories in light ofthe East Asian experience, ed. Takatoshi Ito and Anne 0. Krueger. Chicago: University of Chicago Press.
Wei, Shang-Jin, and Peng Lian. 1993. Love and hate: State and nonstate firms in transi- tion economies. Kennedy School of Government Faculty Research Working Paper Series, R93-40. Cambridge: Harvard University, November.
World Bank. 1988. China: External trade and capital. Washington, D.C.: World Bank. . 1992. World development report 1992: Development and the environment.
. 1994. China: Foreign trade reform. Washington, D.C.: World Bank. New York: Oxford University Press.
Comment Pakorn Vichyanond
On sources of foreign direct investment (FDI), I have three observations. First, in the equations explaining stocks and flows of FDI, it is notable that labor cost is left out. This factor is crucial as it strongly influenced numerous Japanese corporations to relocate their production plants to China, Vietnam, and South- east Asia. Instead, the included variable is literacy, which is definitely less sig- nificant than relative wages as a determinant of FDI.
Second, another important variable that was neglected is exchange rate fluc- tuation. This particular factor was very meaningful in inducing Japanese FDI in Thailand because exchange rate levels and volatility affect not only the costs but also the revenue or profits of private corporations. Therefore, exchange rate should be included as another prominent explanatory variable.
Third, investment privileges given to tap FDI, such as tax exemptions or allowances, constitute another important determinant of FDI so they should be specifically treated.
On consequences of FDI, my worries concern the host country or recipient of FDI, not cross-city differences. Thus, the following questions are raised concerning the impact of FDI in a national context.
First, it is usually unquestionable that FDI spurs economic growth in host
Pakorn Vichyanond is a senior research fellow at the Thailand Development Research Institute.

102 Shang-Jin Wei
countries. The robust Thai economy in 1988-90, for instance, was strongly stimulated by investment, of which FDI constituted a growing portion. What deserves to be asked is, How sustainable is it to rely on FDI as a means to accelerate economic growth? Over time, labor cost grows higher and exchange rates vary; consequently, the attractions to FDI subside, so do the sizes of the markets of or in host countries.
Second, the favorable impact of FDI on exports of host countries is similar to the impact on economic growth. What should be investigated is how long export promotion can be achieved via FDI (e.g., privileges given to FDI with a prerequisite of a minimum level of exports within certain years) because most export promotion measures are now deemed to be trade distortions. The GATT conclusions reached in Morocco, for instance, were distinctly against agricultural subsidies, and those subsidies are to be terminated or reduced markedly within a specific time frame.
Third, some negative repercussions of FDI should be recognized and ad- dressed. Examples of such adverse effects are transfer pricing and environmen- tal degradation. The drug industry in Thailand suffered severely from the prob- lem of transfer pricing in the past.
Finally, the merits of FDI may be questioned in several respects. For in- stance, historically FDI deserves attention or privileges because it naturally brings with it supporting capital funds, accommodating markets for commodi- ties to be produced, and technology from abroad. But in the current scenario where globalism prevails in most regards, those merits of FDI may not be deemed valuable anymore. Capital funds can be tapped worldwide. Accommo- dating markets can be found in newly opened countries, for example, China, Eastern Europe, and Indochina. And technology transfer has become more available on a commercial basis, or not necessarily tied to FDI. Therefore, it is not surprising that at present several developing countries have changed their viewpoints on FDI from the conventional perspective. In other words, FDI is not always heaven anymore. It is formidably challenged by numerous alterna- tives that do not have the adverse effects of FDI.
Comment Wing Thye WOO
In this brilliant paper, Wei presents three propositions: (1) FDI has positive effects on growth; ( 2 ) FDI promotes growth of the nonstate sector; and ( 3 ) FDI has come disproportionately from the Chinese diaspora.
Wing Thye Woo is professor of economics and head of the Pacific Studies Program at the Insti- tute of Governmental Affairs at the University of California, Davis.

103 Foreign Direct Investment in China: Sources and Consequences
FDI Promotes Economic Growth
Wei’s proof comes from estimating
(1) Y = F (K, L, FDI)
across cities and finding that FDI is significantly positive for two of the three proxies used. A quick inspection of tables 3.10 and 3.1 1 reveals two troubling features. First, equation (1) is a serious misspecification of the production function because the dependent variable is gross industrial output and interme- diate input is not included as a regressor. Second, we have the anomalous situa- tion in which the theoretically preferred proxy (FDISSd/CapSS) is insignificant but the theoretically flawed proxy (FDISSndCapSS) is significant. The former assumes a 10 percent depreciation of the foreign-owned capital stock, while the latter assumes zero depreciation.
I do not doubt that FDI promotes growth, but I think that Wei’s empirical procedures are likely to have greatly overstated its contribution. My reserva- tions are based on the position that the fundamental reason for Chinese eco- nomic growth is the liberalization and hence marketization of the command economy. We must be sensitive to the fact that FDI has occurred most in the cities where FDI has been legally allowed to occur, that is, the 5 special eco- nomic zones (SEZs), the 14 open coastal cities (OCCs), and the 72 comprehen- sive reform experimenting cities (CRECs). However, being allowed to liberal- ize and actually implementing liberalization are two different matters. Because not all local leaders are equally enthusiastic about introducing capitalist-style measures to boost economic development, local leaders differ considerably in their receptivity to FDI. My conjecture is that the regional distribution of FDI reflects to a considerable extent the degree of liberalization actually imple- mented across the various cities. This means that one major reason why FDI has an output effect beyond its expansion of the capital stock is that in general FDI occurred in the cities that have liberalized the most and hence have raised their growth potential the most. In short, FDI is correlated with total factor productivity (TFP) growth because FDI is a good proxy for the degree of eco- nomic liberalization and the greater the liberalization, the higher TFP growth.
Hereby, we also have the explanation for why the Reform and Open dum- mies (used to differentiate the SEZs, the OCCs, and the CRECs from the cities legally unfriendly to FDI) are statistically insignificant when they are added to equation (1). These dummies represent the formal granting of liberalization authority to certain cities, whereas FDI represents the actual implementation of liberalization in the cities that have permission to do so. Since the continuous distribution of FDI is a better proxy of the regional degree of economic liberal- ization than the 0/1 dummies, the insignificance of the Reform and Open dum- mies only shows that the inclusion of FDI has robbed these dummies of their statistical function.
104 Shang-Jin Wei
It is likely that the statistical significance of FDI is also due to its also being a proxy for favored access to intermediate inputs. Price liberalization is most advanced in the cities where FDI is most concentrated, and since prices of intermediate inputs are the highest in these cities, they suffer no shortage of intermediate inputs. Simply put, FDI is more likely to flow to cities with no power shortages than to cities with chronic power shortages.
FDI Promotes Growth of the Nonstate Sector
Wei’s proof of this proposition consists of regressing
( 2 ) Y of TVEs = f(FD1)
and finding that two of the three proxies for FDI are statistically significant (see table 3.13). We note that equation (2) is a greater misspecification of the production function than equation ( I ) because it has no input variables as re- gressors.
We also note that since FDI is a proxy for the degree of economic liberaliza- tion, it should be natural that it is positively correlated with the output growth of the nonstate sector, another by-product of economic liberalization. It is therefore somewhat surprising that one of the FDI proxies failed to be signifi- cant in such a favorable setting. Perhaps, gross misspecification has a role in the unexpected result.
How Big Is FDI’s Contribution to Growth?
The facts are: Poland is more marketized than China, China has more FDI than Poland, and China has grown faster than Poland. These facts, however, do not show that FDI is a better promoter of growth than marketization, just as the Chinese experience does not show that gradual reform is superior to Polish- style rapid and comprehensive reforms.
The high growth of China, the great amount of FDI in China, and the explo- sive growth of the town and village enterprise (TVE) sector are all products of the marketization of a labor-surplus peasant economy (see Sachs and Woo 1994). In 1978, over three-quarters of the Chinese labor force were engaged in subsistence farming, the peasants were kept down on the farms by the House- hold Registration System, and the official estimate was that one-third of the farm labor force was surplus labor. The high aggregate growth rate and the growth of TVE output are the results of the absorption of surplus agricultural labor and the absence of the need to reduce the state industrial sector to release labor for the growth of the TVEs. The inflow of FDI to China is the natural response to the low wages of the surplus labor economy.
FDI doubtlessly increases TFP directly by technological transfers and indi- rectly by providing an efficient management style to be emulated by the Chi- nese enterprises. However, Wei’s estimated contribution of FDI to TFP growth is an overstatement of these direct and indirect effects because of the close correlation between FDI and the degree of economic liberalization.

105 Foreign Direct Investment in China: Sources and Consequences
A Disproportionate Amount of FDI Is from the Chinese Diaspora
The bulk of the empirical work in the paper involves estimating an interna- tional norm of investment (see tables 3.3-3.7). This may seem a somewhat puzzling exercise. What is the policy implication of finding that Western Eu- rope and the United States are underinvesting in China unless China can impe- riously demand that the laggards double their FDI efforts? One is therefore left wondering about the role and importance of section 3.3 in this excellent paper.
I think that section 3.3 implies a very important hypothesis that should not be overlooked (and that should be tested by the author in a future paper)-a point more important to Eastern Europe and Russia than to China. As most FDI in China has been from the Chinese diaspora, this means that the other transition economies (except for Vietnam) that do not have large diasporas are unlikely to experience significant income growth from FDI.
Reference
Sachs, Jeffrey, and Wing Thye Woo. 1994. Structural factors in the economic reforms of China, Eastern Europe, and the Former Soviet Union. Economic Policy 18:lOl-45.